Embed Size (px)
Citation preview

New Mexico
School Grading Technical Guide
Calculation and Business Rules
School Year 2014-2015
Hanna Skandera
Secretary, New Mexico Public Education Department
Assessment, Accountability, and Evaluation Division

School Grading Technical Guide 2015 Page i
Preface
School grading was mandated by New Mexico state lawmakers in 2011 where basic requirements were
established for schools to achieve an A, B, C, D, or F for annual accountability [§22-2-1, §22-2-2, and
§22-2E-1 to §22-2E-4] [6.19.8.1 NMAC – N, 12-15-11]. This School Grading Technical Guide provides
detailed decision rules for each indicator, statistical treatment of data, and calculation parameters.
These business rules apply to New Mexico public and charter schools and do not apply to private,
Bureau of Indian Education (BIE), home schools, or other schools that are not within the jurisdiction of
the New Mexico Public Education Department (PED).
New Mexico’s school grading model was approved in 2012 by the U.S. Department of Education (USDE)
to serve as the state’s Elementary and Secondary Education Act (ESEA) accountability method for future
years, replacing Adequate Yearly Progress (AYP). The state’s ESEA Flexibility Request is available on the
website at http://www.ped.state.nm.us/waiver/index.html and outlines the underlying framework for
the system, in particular that schools will be monitored on three general factors: current performance;
growth; and other academic factors considered important for student learning.
In the inaugural year of school grading, 2011, preliminary grades supplemented but did not replace AYP.
In 2012 when school grading was authorized as the state’s accountability system, the USDE mandated
certain modifications, which are detailed in Revision History. For longitudinal comparisons, users should
appraise school grades within the context of the altered rules that governed the initial year. The version
of this technical document that detailed the preliminary rules is available upon request.
In 2010 New Mexico adopted the New Mexico Common Core State Standards and participates in the
Partnership for Assessment of Readiness for College and Careers (PARCC) program. With the
implementation of PARCC in 2015, specific features of the school grading system required change (e.g.,
using additional grades in high school to calculate Student Growth). The underlying framework,
however, remains the same.
Please submit questions or requests for revision and clarification to
Cindy Gregory, PhD
Chief Statistician, Public Education Department
300 Don Gaspar
Santa Fe, New Mexico 87501-2786

School Grading Technical Guide 2015 Page ii
Revision History
Date Description of Major Changes Reference Author
July 2012 Current Standing VAM eliminates student demographics VI. A. 4. Gregory
July 2012 All indicators normalized to 2011 V. VAM Gregory
July 2012 School Growth VAM eliminates student demographics VI. B. Gregory
July 2012 Opportunity to includes student survey VI. D. Classroom Survey Gregory
July 2012 Current Standing includes 10th
grade students VI. A. 3. Gregory
July 2012 Graduation adds 6-year rate; denominator to 100% VI. E. 3. Gregory
July 2012 Graduation growth uses 3+1 year model VI. E. Gregory
July 2012 College Career Readiness (CCR) uses Shared Accountability system VI. F. 3. Gregory
July 2012 CCR added additional indicators VI. F. 5. Gregory
July 2012 “No Cohort” option for qualifying schools VI. E. 2. Gregory
July 2012 Supplemental Accountability Model (SAM) for qualifying schools VI. I. Gregory
July 2012 Participation requirement added VI. Gregory
July 2012 Bonus Points added VI. G. Gregory
July 2012 Feeder School method alterations VI. H. Gregory
February 2014 Participation uses different denominator VII. Gregory
February 2014 SAM CCR rates include Shared Accountability VI.I. Gregory
February 2014 Revised growth to recognize HS 10th
grade VI. Gregory
February 2014 Clarification and examples added Throughout Gregory
December 2015 Aligned growth calculation with teacher evaluation model VI. Hall

School Grading Technical Guide 2015 Page 1
I. Definitions and Abbreviations
Terms used in this document and their meaning to school grading follow:
Accountable school denotes the location where the student’s scores are assigned for accountability.
The assignment follows this hierarchy:
If Full Academic Year (FAY)=Yes, the accountable school is the FAY school; or
IF FAY=No, the accountable school is the location where the student was tested.
Aggregate describes high-level data that is composed from a multitude or combination of other more
individual data.
AMOs (Annual Measurable Objectives) were targets for achievement under AYP. This accountability
model was replaced by school grading in 2012, and AMOs were replaced by School Growth Targets
(SGTs).
Bonus Points are extra points awarded to schools that exhibit exceptional aptitude for involving
students and parents in education, reducing truancy, and promoting extracurricular activities. Points
are submitted by dossier, which is independently rated by three educational veterans for points utilizing
a formalized consensus model. The rubric for this evaluation is available on the PED’s website at
http://webapp2.ped.state.nm.us/SchoolData/SchoolGrading.aspx. These points are added to a school’s
total points prior to determining the school’s overall grade.
CDF (Cumulative Density Function) is the probability (from 0 to 1.0) that an observation will be found at
a value less than or equal to the value of that observation. In other words, it represents the sum of the
area to the left of a density curve for a given value. To illustrate, the graph below left shows several
examples of familiar probability distributions. These could be distributions of scores, points, or rates.
Note that three of the distributions center around zero, and one (green) has a mean of -2. The gold, red,
and blue distributions have been standardized to a mean of zero, but they could just as easily be means
of 55 on a test that totals 100 points.
School Grading Technical Guide 2015 Page 2
The CDF graph on the right shows each of the probability distributions on the left graphed in cumulative
(additive) fashion, that is, the values to the left of any given point on the x-axis are accumulated until the
entire group of probabilities sums to 1.0 (or 100%). Where the distributions are peaked (blue), the slope
near the mean changes quite rapidly, and where the distributions are flatter (gold), the slope changes
slowly along a broader range of values.
Typically, the CDF distribution is used to convert scores on the horizontal x-axis to points on the vertical
y-axis such as value added model (VAM) score to Current Standing points. One can see that a small gain
in the x-axis will result in a large gain in points on the y-axis when the score is near the middle of the
distribution. The conversion tables were established and set from the first operational year of school
grading in 2012. Now that they are fixed, scores from future years can be judged on a stable framework
that allows all schools to progress to a higher letter grade.
Current Standing is a two-part measure of the status of a school in the current year. It is composed of
two parts, the percentage of students who are proficient and on value-added conditioning.
DIBELS (Dynamic Indicators of Basic Early Literacy Skills) is an assessment of reading for students in
grades kindergarten through second grade. While the assessment is not universally administered in all
schools, when possible the scores are used to augment school grading. DIBELS is the sole source of
achievement data applied to feeder schools.
Duplicate refers to two test records that have the same student identification (ID). Duplicates may
occur when the same student was tested twice, such as once in English and again in Spanish, or when a
student moves during the test window and is retested at a different school. More commonly, different
students are mistakenly identified as being the same, which happens with the accidental mislabeling of a
test or with an incorrectly bubbled ID. Duplicates also occur when two students within the state are
unknowingly sharing the same ID. All of these conditions must be reconciled during data review. Each
student can contribute only one test score for each content area. Where duplicates cannot be resolved,
both scores are removed from the accountability file.
FAY (Full Academic Year) indicates whether a student has been enrolled at a single location for one
year. The school or local education agency (LEA) where the student was enrolled is accountable for the
student’s instructional legacy, since the student was present for one year’s worth of growth and
learning. FAY is also used as a measure of student educational stability and risk. The portion of a
school’s population that is not FAY (mobile) is used to adjust value added modeling.
Feeder Schools are schools that are limited to grades that are not assessed by the regular assessment.
Since the regular assessment begins in the third grade, elementary schools that are capped at any grade
kindergarten through second grade are considered feeder schools.
HED (Higher Education Department) is a separate cabinet-level agency in New Mexico that governs
state institutions of higher education. PED limits accountability to only K-12 institutions but works
closely with the HED for the reporting of some post-secondary measures.

School Grading Technical Guide 2015 Page 3
LEA (Local Educational Agency) traditionally refers to the 89 school districts that manage more than 800
schools in New Mexico. More recently, the term also applies to a growing number of state-authorized
charter schools that operate independently of any district.
Model determines the school’s points and framework for receiving a letter grade, and each school is
assigned either High School (HS) or Elementary/Middle School (EL) based on the grade span of the
school. Where the grade configuration does not clearly dictate a model, the available indicators for
each model are examined to maximize the data available for the school’s grade. For example, in 2013,
two high schools that also had middle school grades were reassigned to the EL model because they did
not have cohort measures and growth for their high school grades.
NMAPA (New Mexico Alternate Performance Assessment) is the assessment in science and social
studies that was administered in 2014-2015 for students with profound cognitive disabilities.
NCSC (National Center and State Collaborative) is the assessment in English language arts and
mathematics that was administered in 2014-2015 for students with profound cognitive disabilities.
Normalized refers to the statistical treatment of a distribution of scores to standardize the values to
align with a normal bell curve. Once the scores have been normalized, they can be considered on a
common scale that allows comparisons between different groups or assessments. Typical examples of
normalized scores are z scores, where the mean of the distribution is zero and variation in the positive
and negative direction is described in standard deviation units (see CDF).
One-Percent Rule relates to the assessment of students with the most severe cognitive disabilities.
Generally, these students represent approximately 1% of all students in the state. Set by the USDE, the
one-percent rule requires that the percentage of students scoring Proficient or higher on an alternate
assessment cannot exceed one percent of the total number of assessed students in the LEA. If the LEA
violates this rule, a random selection of students equal to the excess above 1%, who took the alternate
assessment and scored Proficient or higher must be converted to not proficient. This rule is applied only
to multi-school LEA accountability.
Opportunity to Learn (OTL) represents the environment schools provide for learning. It is determined
from student attendance and scores on a student survey administered to students annually during
standardized testing. The survey measures the extent to which classroom teachers demonstrate
instructional practices known to facilitate student learning.
PARCC (Partnership for Assessment of Readiness for College and Careers) is the regular assessment of
English language arts and mathematics for students in grades 3-11. It is aligned to Common Core State
Standards, and was administered for the first time in New Mexico in 2015. The PARCC assessment
includes new end-of-course assessments in high school mathematics (i.e. geometry) and adds the 9th
grade to school accountability.
Proficiency refers to the rank students earn on various criterion-based assessments. For example, the
PARCC scores classify students in one of five levels, with levels 4 and 5 considered college and career

School Grading Technical Guide 2015 Page 4
ready. The standards for these ranks were determined by national school officials, subject matter
experts, and certified teachers in the inaugural years of the assessments, and the standards are revisited
every three to five years for possible re-calibration.
Q refers to the student’s quartile status for school grading. Every student is classified as being a
member of either the Q1 (the bottom quartile) or Q3 (the top three quartiles) subgroup. By separating
students into higher and lower performing groups, schools can see if their practices are benefitting both
groups. New Mexico law requires that accountability highlight the lowest performing 25% of the
student population.
SAM (Supplemental Accountability Model) schools are a subset of graded schools that serve high-risk
populations. Schools qualify by having a high proportion of returning adults or a high proportion of
students with disabilities, and by publically declaring the school mission and goals for these students.
School grading rules are moderated slightly for SAM schools, and mission-specific measurements are
incorporated into the determination of the school’s letter grade.
SBA (Standards Based Assessment) is the regular assessment of science for students in grades 4, 7, and
11 and of Spanish language arts for students in grades 3-8 and 10-11.
School Growth represents the change in performance of successive cohorts of students over time. This
growth is based on different students each year and is estimated using linear regression.
School Growth Targets (SGTs) are the new targets set under New Mexico’s ESEA Flexibility Waiver
granted in 2012. These targets are similar to AMOs in that they increase every year and are
standardized for all subgroups. The targets will be renegotiated in 2016 and will be available in the
revised waiver document on the PED website.
Snapshots are the fixed dates required for all districts to submit data to the PED data warehouse called
STARS (Student Teacher Accountability Reporting System). These dates are fixed at the following:
Second Wednesday of October (known as 40th day; abbreviated as 40D)
December 1 (known as 80th day; abbreviated as 80D)
Second Wednesday of February (known as 120th day; abbreviated as 120D)
End of Year, variable but principally in June (known as EOY)
Additionally, a specialized snapshot occurs during the last week of testing (known as the
Accountability Snapshot, or 4/20); timing is variable but generally occurs in March or April.
Standard Setting refers to the process of setting cut scores. The A-F grading framework was set using
student data from 2011 and 2012. At that time the PED normed each indicator, anchoring the grade of
“C” at the average for all schools statewide. For example, a school that achieves a “C” in College and
Career Readiness has scored very similarly to all other schools in the state. A school that rises to the “A”
or “B” level in any indicator shows unusual deviation from other schools. Since the time of the standard
setting, the scale has not changed.

School Grading Technical Guide 2015 Page 5
Status refers to schools in some form of improvement or reward. The four status categories from
lowest to highest performing follow:
Priority (5% of schools)
Focus (10% of schools, not in Priority status)
Strategic (10% of schools, not in Priority or Focus status)
Reward (5%)
Student Growth represents the average of individual student achievement growth over three years
(current and two prior years). Student growth is estimated using a multilevel mixed effects regression
model.
Subgroups are the student groups aggregated for accountability reporting, as required by ESEA. A single
student can contribute to several subgroups. While subgroup data are reported, only the student
characteristics of FAY and Q1/Q3 are used in school grading calculations.
All students (reported as “All Students”)
Caucasian/White-Non Hispanic (reported as “Caucasian” or “White”)
Black-Non Hispanic (reported as “African-American” or “Afr Amer”)
Hispanic (reported as “Hispanic” or “Hisp”)
Asian/Pacific Islander (reported as “Asian”)
Native American (reported as “American Indian” or “Am Indian”)
English Language Learners (reported as “English Language Learners”; abbreviated as “ELL” or “EL”)
Special Ed, Not Gifted (reported as “Students with Disabilities” or “SWD”)
FRL, free or reduced price lunch program (reported as “Economically Disadvantaged” or “ED”)
Gender (reported as “F” or “M”)
Migrant (Title 1C) (reported as “Migrant”)
FAY (reported as “Y” or “N”)
Q1, quartile 1, lowest performing 25% of students
Q3, higher three quartiles, remaining students who are not Q1
School Grading Technical Guide 2015 Page 6
Valid Test refers to a test that can be successfully scored. Tests are invalidated for a number of reasons
(see Conditioning of Data, Test Completion Code), and these invalid tests adversely affect the school’s
participation rate.
VAM (Value-Added Modeling) statistically isolates the school’s contributions to student performance
from factors outside the school’s control that are known to affect student test performance. Sometimes
referred to as conditioning, VAM results in a truer picture of the school’s impact (value added) on
student achievement.
II. Data Sources
School Attributes. The school file lists all open public and charter schools in New Mexico with enrolled
students in any grades K through 12. The purpose of this file is to finalize the list of schools that receive
a rating and their characteristics that impact calculations. Occasionally, schools merge, change
configuration, change name, or are considered a “program” rather than a school (and vice versa). Such
changes are finalized prior to school grading. Each location is classified as:
1. Public school. If students take the test at a school or program where they are enrolled for only part
of the day, their parent school must be identified and their scores attributed to that school. Scores
of students in transient programs (i.e., programs at different schools in which the student is enrolled
for several weeks or months) may also be assigned to their parent school, after approval by PED.
2. Locally authorized charter school. If the authorizer is one of the 89 recognized districts, the school is
under the jurisdiction of the authorizer.
3. State-authorized charter school. If the authorizer is the Public Education Commission, the school is
considered independent from a district and is under the jurisdiction of the state authority.
4. Off-site program. Students in off-site programs (i.e., correctional facilities, treatment centers,
homebound, or hospitalized) are generally excluded from school-level calculations and included at
the LEA level for rating. However, if the student qualified as FAY at a school prior to entering the
program and testing, his or her test will count at the FAY school. Off-site programs are not rated.
5. State-supported school. State-supported schools receive funding from multiple sources and may
not be fully under the jurisdiction of the PED. Examples are Juvenile Justice schools, the School for
the Blind and Visually Impaired, and the School for the Deaf. The New Mexico Military Institute
receives private funding, operates a junior college, and is exempted from rating by statute.
Additionally, schools are characterized by
6. Title I status (S=Schoolwide, T=Targeted, N=Not receiving Title I funds)
7. SAM school (Y/N)
8. Level (elementary/middle or high school)
9. SIG receiving federal School Improvement Grant funding

School Grading Technical Guide 2015 Page 7
10. New or Reorganized (impacts inheritance, FAY, and other calculations)
11. Attendance is extracted from the data submissions by districts at 40D, 80D, and 120D snapshots of
the current year. A rate is computed for every subgroup and includes all grades K-12 that are served
by the school. Feeder schools must be included.
12. Graduation is computed annually by the Accountability, Assessment, and Evaluation Division at PED.
The file lists rates and counts by subgroup, school, and LEA for 4-year, 5-year, and 6-year cohorts.
Schools with any high school grade (9, 10, 11, or 12) will receive a rate. Details of the calculation are
fully covered in the PED’s Graduation Technical Manual.
13. Historic data are provided by the Accountability, Assessment, and Evaluation Division from prior
years and include figures that are required for the current year’s calculations.
Student Attributes. The student file lists all students assessed in the current year, their demographics,
historic data, and relevant accomplishments. The purpose of the student file is to calculate the
parameters used to grade the student’s current school.
1. Mathematics and reading proficiency scores are supplied by the vendors that administer the
assessments used in School grading.
2. Subgroup membership is assigned from the data submitted by districts to STARS snapshots. Where
students are missing from the 4/20 snapshot, the nearest snapshot date where the student is found
is used.
3. Student survey item responses are supplied by the vendor that administers the survey during
standardized testing. In 2015 schools were allowed to substitute the student survey administered
for educator effectiveness. Both surveys consist of 10 items with six step scales and questions are
very similar.
4. Student/Parent Engagement does not have a specific data file associated. This information arrives
through a dossier submitted to PED by the LEA.
5. ACT student level data are submitted by LEAs through STARS regular submissions throughout the
year.
6. SAT student level data are submitted by LEAs through STARS regular submissions throughout the
year.
7. PSAT student level data are submitted by LEAs through STARS regular submissions throughout the
year.
8. AP (Advanced Placement) student level data are submitted by LEAs through STARS regular
submissions throughout the year.
9. Dual Credit data are supplied by a cooperative agreement between PED and HED. The data are
limited to students who have enrolled and earned credit in post-secondary institutions governed by
HED.

School Grading Technical Guide 2015 Page 8
10. Career Technical Education is partly determined by course enrollment and course grades extracted
from data submissions by districts at 40D, 80D, and 120D snapshots of the current and prior years.
Definitions established for Carl Perkins Grant funding then classify students as “Concentrators” or
“Completers.” When completers graduate with a regular diploma, a student meets the success
benchmark.
11. Accuplacer student level data are submitted by LEAs through STARS regular submissions throughout
the year.
12. COMPASS student level data are submitted by LEAs through STARS regular submissions throughout
the year.
13. Aspire (formerly PLAN) student level data are submitted by LEAs through STARS regular submissions
throughout the year.
14. IB (International Baccalaureate) student level data are submitted by LEAs through STARS regular
submissions throughout the year.
15. Standardized Subject Tests (SATSUB) data are supplied by LEA’s during annual data exchange
16. ACT Aspire data are supplied by LEA’s during annual data exchange
17. TABE data are supplied by LEA’s for SAM schools during annual data exchange
18. Work Keys data are supplied by LEA’s for SAM schools during annual data exchange
19. ASVAB data are supplied by LEA’s for SAM schools during annual data exchange
III. Data Validation
Verification of preliminary files insures consistency with prior years and completeness. Discrepancies
are presented to suppliers of the data source for resolution. Data checks include but are not limited to
the following:
1. Correct grade ranges for all schools
2. Schools to be rated
3. New or reorganized schools with inherited grading histories or FAY anomalies
4. Notable variation in the size of any subgroup over the prior year
5. Any variation in student subgroup membership among 120D, Accountability, and EOY snapshots
6. Verification of prior year’s ratings
7. Verification of the appropriate assignment and completeness of graduation and attendance
8. Verification of level (elementary/middle, or high school)
9. Verification that all rated schools are represented in the vendor test files
10. Verification that all students tested are represented in school rating and reports

School Grading Technical Guide 2015 Page 9
IV. Conditioning of Data
Assessment Scores. A subset of records in the test data file (valid tests) and content within records
(reading, mathematics) is used for school rating. Results for Spanish, English, and Braille administrations
are included, as are the alternate assessments. The following guidelines apply to the selection and
cleaning of those records:
1. Remove records where Exclude from Summaries=Yes. These tests belong to students from non-PED
schools, such as home-schooled students who were permitted to test at the discretion of the LEA or
BIE students who are not held to PED accountability.
2. Reconcile Test Completion Code (TC), Scaled Score (SS), and Proficiency Level (PL). The TC is a field
marked by the testing administrator at the time of testing to indicate whether the test was
successfully administered. Often it is bubbled incorrectly, overridden by scoring (student fails the
Attemptedness Rule), or overridden by a sanction imposed by PED for a testing irregularity. Because
TC is used for various counts, it must match the results of scoring, i.e., SS and PL. This reconciliation
is performed by the Accountability Assessment and Evaluation Division and details can be supplied
upon request. Test Completion codes have these meanings:
TC=0 Tested all sessions and received a valid score
TC=1 Withdrew before testing; excused
TC=2 Received a non-allowed modification; invalidate test (SS=99)
TC=3 Exempt from ELA/reading assessment because of language exception; excused
TC=4 Medical emergency exemption; excused
TC=5 Parental refusal; invalidate test; (SS=99)
TC=6 Incomplete testing; invalidate test; (SS=99)
TC=7 Testing irregularity; invalidate test; (SS=99)
TC=8 Absent; invalidate test; (SS=99)
3. A single student can have a valid mathematics test (TC=0) and an invalid ELA/reading test (TC=5).
This split testing impacts participation rates for each content area.
Filtering, Student Identification, and Assignment of Accountable School. These rules are required to
define the Accountability dataset that is unique to school grading and general reporting.
1. Reassign tests to the location where a student is FAY=Yes. For a small number of students who
move during the test window, the location of the assessment does not match the location where the
students were fully enrolled the prior year (FAY). These students are reassigned to the FAY school
for accountability.

School Grading Technical Guide 2015 Page 10
A student can take the test in more than one school (e.g., mathematics in school N, and ELA in
school P). Special rules apply and are explained in V. Calculations.
2. Limit records to students in eligible grades 3 through 11 and also to students in later grades in high
school who have never been tested for accountability. Occasionally students in other grades are
tested because assessments are also used in high school graduation, and these students are
removed from the accountability determinations and calculations.
3. Use enrollment data to manually update missing values in student characteristics (i.e., ethnicity).
4. Determine the treatment of duplicate records. This process utilizes a complex set of rules performed
by the Accountability Assessment and Evaluation Division, together with district officers and test
vendors. Where duplicates cannot be resolved, both duplicate pairs are removed from the
accountability dataset.
5. Determine the treatment of invalid student IDs. A small number of tests are unidentified each year
with either a missing or invalid ID. After all attempts to identify these students manually have failed,
the tests will be included with the location where they were submitted, with a dummy id assigned
by the PED.
6. Assign subgroup membership and demographics from snapshot data.
FAY is determined entirely from enrollment submissions. For verification, an LEA may run reports in
STARS that show a student’s snapshot history. FAY is determined secondarily by the grade configuration
of the accountable school.
1. FAY=Yes if a student is enrolled at the 120th day of the prior school year and the 40th, 80th, and
120th day of the current school year. There are exceptions to this rule:
A. Students in transition grades (the lowest grade in the school’s grade span) are FAY=Yes provided
they meet the following conditions:
1) Enrolled 40D, 80D, 120D of the current year AND
2) Enrolled 120D of the prior year in the same LEA as the transition school. This rule applies to
locally authorized charter schools but not to state-authorized charter schools.
B. Students in reorganized schools in the current year are FAY=Yes under the same provision as
transition grades provided they are in a lower grade that is new to the school. For example, if a
school that previously served grades 7-8 adds a 6th grade, both 6th grade and 7th grade
students must meet conditions A.1) and A.2) to be considered FAY=Yes.
C. Students in new schools are FAY=Yes under the same provisions as transition grades. (See A
above.) For example, a new school that serves grades 6, 7, and 8 requires only that students
meet conditions A.1) and A.2) to be considered FAY=Yes.
D. State-authorized charter schools follow the same options above but without the requirement
for LEA membership in the prior year.

School Grading Technical Guide 2015 Page 11
2. FAY=No when a student misses any single snapshot in the series. Mobile students are not dismissed
from school grading proficiencies as they were in AYP. Instead the school’s expected outcome is
adjusted slightly using VAM to account for uncontrolled student mobility.
Student matching. A longitudinally linked data file includes every student’s scaled score and proficiency
level for the current year and the scaled scores that they received in reading and mathematics for the
two most recent prior years within the last three years. Thus, students who are missing a prior year of
data as a result of a prior grade level being untested (such as 9th grade prior to 2015) will not be
penalized. Students with ambiguous student IDs or who are identified in an unresolved duplicate pair
(see Data Conditioning, Duplicates) are not be included in the linked dataset. Missing data are
estimated using the average prior scores for each student’s grade level and school.
Determine Q1 or Q3. Students are assigned as either Q1 or Q3 in the current test year. This
determination comes from the following decision rules:
1. All students in the test file for the current year are aggregated at the school level. This aggregate
includes all students who took PARCC, SBA, NMAPA, and NCSC and disregards a student’s grade
level. For example, it is possible to have more 4th graders than 3rd graders in the Q1 group for a
single school.
2. All of the school’s scaled scores are ranked from highest to lowest. A cut score is established for
each school that divides the bottom 25% (Q1) from the remaining students (Q3) in mathematics and
in reading separately. These cut scores are unique to each school and are recomputed each year.
3. After the cut score for each school is established, each student is then classified as either Q1 (below
the cut) or Q3 (above the cut) for the current school year. Every student fits into either Q1 or Q3
groups and no student is excused.
Categorize students into Q1 or Q3 Subgroups. All of a student’s prior three years of assessment scores
and Q1/Q3 statuses are merged. The student’s Q status is determined separately for reading and for
mathematics, so it is possible for a student to be Q1 in mathematics and Q3 in reading at the same time.
The student’s assignment for the current year’s accountability is derived from the following decision
rules:
1. The student is matched to his or her prior scores regardless of school or grade level. Matching
occurs for the current and prior two years, yielding up to three data points per student.
2. The student’s assignment to either the Q1 or Q3 subgroup is determined by their first in the series
of the matched scores.

School Grading Technical Guide 2015 Page 12
The student’s accountable school is used as the school of record for school grading, representing the
final year of growth and achievement. In the example, it is evident that Javier’s school will receive
considerable credit for his dramatic growth from 0 to 33 scaled score points, which will be manifested in
Student Growth Lowest Quartile (Q1) since he belonged to that subgroup.
To summarize, for longitudinal comparisons every student’s scores from up to two prior years are used.
Their Q1 Q3 membership is determined by the first score in any progression.
If the student has three years of test scores, their quartile membership is determined from year 1.
If they have only 2 years, it is determined by the prior year.
If they are new to PED schools, then membership comes from their current year. The current year
counts as year 3 of the three-year progression.
A new set of students will enter the progression every year, in every school. Likewise, the years of
progression will move up for every student, so that a student who had scores from grades 3, 4, and 5
last year will now be using their scores from grades 4, 5, and 6 this year, which will redefine their
membership in Q1 and Q3.
A school’s quartile memberships shift yearly as well as bringing on new students, but in general, the
school should see some stability in their overall impact on Student Growth. If the school is consistently
growing the achievement of their lower performing (Q1) students, it will show each year even though
some students leave and new students enter.
To illustrate, Jack’s assignment would come from his score of 55 in 2014, Alicia’s from the
current year, and Tom’s and Javier’s from 2 years ago in 2013.
MATHEMATICS
(2 Years Ago)
2013
(1 Year Ago)
2014
(Current Year)
2015
Subgroup
Assignment
Jack (no test) 55 (Q3) 62 (Q3) Q3
Alicia (no test) (no test) 33 (Q3) Q3
Tom 13 (Q1) 25 (Q3) 26 (Q3) Q1
Javier 0 (Q1) (no test) 33 (Q3) Q1
In the subsequent year (2016), this three-year window shifts, with the 2013 scores dropping
off and the 2014 scores becoming the first in the series. In this example, all 4 students would
be assigned to the Q3 subgroup in 2016.

School Grading Technical Guide 2015 Page 13
V. Calculation Parameters
Software. Calculations are performed with IBM SPSS© Version 23 available at: http://www-
01.ibm.com/software/analytics/spss/. Additional calculations utilize R© (the R Foundation for Statistical
Computing) available at: https://cran.r-project.org. Instruction manuals are copyrighted materials that
are available with a license from the above websites.
Rounding. No rounding occurs until final points and rates are computed. All computations prior to
reporting utilize unrounded figures out to 12 decimal places. Final rounding occurs to the second
decimal place (e.g., 92.27%) unless otherwise indicated. The terminal digit of 5 is rounded up.
Points. Points for the School grading model are achieved by one of two methods:
1. Comparison to a pre-existing standard or
2. Relative to the performance of other New Mexico schools.
Point distributions and cut scores were fixed from preliminary grades established in 2011 using a
process similar to that used to set initial targets under the No Child Left Behind Act (NCLB). The first
point assignment method is used for Current Standing, OTL Student Survey, Graduation, and Attendance.
The second point assignment method is used for remaining indicators.
Letter Grades. The cut points, or point boundaries leading to the letter grades of A, B, C, D, and F, were
determined by the overall point distributions in the state (elementary/middle schools as one group and
high schools as another) in 2011. For example, the “A” boundary was equated at the 90th percentile of
school points. The “C” boundaries were placed around the 50th percentile. The letter grades for all the
supplementary components of school grading were based on the 90th, 70th, 50th, and 30th percentiles,
with the exception of OTL, which was based on 90th, 80th, 70th, and 60th, for A, B, C, D, and F,
respectively. The overall grade is based on the 90th, 70th, 40th, and 10th percentiles (values rounded).
Overall and component letter grade point frameworks are appended to this document.
Growth. The grading model relies on a year’s worth of growth, which on the New Mexico scale is equal
to a growth index of 0. Growth for each student is measured in relation to how a particular student
scored in the current year compared to his or her academic peers. Academic peers are students who
scored the same in the two prior years in reading and math. A student who scored the same as the
average of his or her academic peer group has made one year’s worth of growth. A benefit of such a
model is that it is easy to determine if students are demonstrating more or less than a year’s worth of
growth simply by whether the growth index is positive or negative. Another advantage of this scale is
that the standard error of measurement is both small and very stable across the grade levels.
Value-Added Modeling (VAM) is used to estimate certain elements of school improvement. The VAM
framework was established in 2011 for application to future years. To determine the anchors, each
school’s VAM estimate was derived from their position in a distribution of all schools. This position was
then used to assign point boundaries (see Definitions, CDF). For example, a school at the 90th percentile
of their distribution would receive 90% of the points available. The VAM distribution and its associated

School Grading Technical Guide 2015 Page 14
cut points from the base year of 2011 were frozen for use in the evaluation of future years, which makes
advancement to a higher letter grade obtainable by every school. In 2015, the value-added models
were adjusted to accommodate New Mexico’s shift to the PARCC test, but the cut points remain
consistent with 2011.
To arrive at the anchor values, the VAM estimates were converted to t scores, and cut points were
established at the point where a set proportion of schools fell below. This process is similar to a
percentile rank but is based on the actual distribution of scores. The VAM estimates that corresponded
to certain percentiles were used to form the point boundaries for VAM. VAM was estimated
simultaneously for School Growth and Current Standing using mixed effects methods.
Reading and Mathematics. These two subject areas are equally weighted throughout school grading for
all grade levels. While a school’s grading indicators (e.g., Current Standing) summarize both content
areas taken together, reading and mathematics statistics are detailed separately in the remainder of the
report, along with subgroup statistics, to help inform factors leading to overall performance. With the
introduction of new assessments in 2015 reading is synonymous with English language arts (ELA).
Schools Rated. Grades are calculated for public, locally authorized charter, state-authorized charter,
and feeder schools. School calculations exclude off-site locations, programs, and students tested in
those locations. These students are rolled up into LEA accountability or are reassigned to an accountable
school where possible.
VI. Calculations
Each component of school grading is assigned its own grade. The points from components are then
summed together with bonus points for a final overall grade. The components that make up each of the
two models are outlined in the model summaries appended to this document.
A. Current Standing is computed identically for both EL and HS models, although each receives
different point totals, 40 and 30 points respectively. Current Standing consists of two components: 1) an
unconditional proficiency status model and 2) a conditional value-added model (VAM). Unconditional
proficiency status is the familiar concept of the percentage of students who achieve proficient or
advanced at the most recent testing occasion. Conditional VAM summarizes scaled scores and
generates an expectation for the school that is adjusted to account for the school’s size and student
mobility. A strong positive relationship exists between a school’s proficiency rate and a school’s average
scaled score.
1. Proficiency (sometimes referred to as “status”) refers to the percent of students who are proficient
or above in the current reporting year and uses the goal of 100%. The resulting percentage is
rounded to one decimal place for reporting (e.g., 65.3%) while the unrounded figures (up to 12
decimal places) are used to compute points. Those familiar with AYP will recognize proficiencies as
the basis for that accountability model, and Current Standing is the only portion of school grading

School Grading Technical Guide 2015 Page 15
TECHNICAL DETAIL
where this concept is used. Proficiency percentages account for valid tests only, after invalid tests
and students exempted from testing are removed.
Points for proficiency are awarded based on an equally weighted combination of mathematics and
reading. Each are computed as the proportion of students who are proficient multiplied by the
number of available points. For example, elementary mathematics is worth 12.5 points; a school
with 50% proficient would score .50 X 12.5 = 6.25 points.
2. Current Standing VAM is calculated based on students’ scaled scores and is used to isolate the
school’s effect on student achievement from the pre-existing differences in school setting and
population. The VAM computes an expected school average scaled score (index), adjusted for the
enrollment (N), prior school achievement (mean scaled scores in the prior two years), student grade
level (middle school grades), and mobility (proportion of the student body that is FAY).
a) The difference between a school’s index and its actual average scaled score is computed.
b) The standardized difference is divided by its standard error to arrive at a t-score.
c) The t-score is transformed to a CDF equivalent score to assign points.
The VAM for school grading utilizes a mixed-effects multilevel model with two levels:
STUDENT
SCHOOL
The mixed-effects multilevel model conditions for MOBILITY and GRADE at the student level (1); YEAR of
measurement at the time level (2), and MOBILITY and SIZE at the school level (3).
1. STUDENT MOBILITY (FAY) is the student’s status in the current year (see I. Definitions and
Abbreviations and IV. Conditioning of Data, FAY, for details).
2. GRADE is a measure of middle school grades 6, 7, and 8 (see VIII. Theoretical Background, for
details).
3. PriorR1 is the student’s prior reading score (typically the previously tested year)
4. PriorR2 is the student’s prior second reading score (typically the second previously tested year)
5. PriorM1 is the student’s prior mathematics score (typically the previously tested year)
6. PriorM2 is the student’s prior second mathematics score (typically the second previously tested
year)
7. SCHOOL MOBILITY (MOB) is the percent of a school’s population that is not full academic year (FAY)
(see IV. Conditioning of Data, FAY, for details).

School Grading Technical Guide 2015 Page 16
8. SIZE is the number of students assessed in grades 3-8 (EL model), H2, and H3 (HS model).
The VAM index is computed separately for reading and mathematics, and both are weighted equally in
the final assignment of points. VAM scores (VAS) are converted to CDF equivalent scores, which are
then used to assign points.
In the VAM descriptions that follow, these conventions are used:
i is for individuals
j is for schools
𝜋0j is the mean scaled score for all individuals, at school k
Level 1 - Student
Student variables were indicator coded and grand-mean centered:
1. FAY (Y, N) is a measure of the student’s FAY status and
2. GRADE (Y, N) adjusts for whether the student was in either the 6th (GRADE6), 7th (GRADE7), or
8th (GRADE8) grade.
Grand-mean centering of dichotomous predictors, such as FAY, produces intercepts that are weighted
by the proportion of 1 to 0 values in the population. This is analogous to using weighting to make a
sample mean be proportionate to the population mean. The equation for Level 1 shows the grand mean
centering of each indicator variable:
SSZij= π0j + π1(FAYij − FAY. . ) + π2 (GRADE6ij − GRADE6. . )
+ π3 (GRADE7ij − GRADE7. . ) + π4 (GRADE8ij − GRADE8. . )
+ π5(PriorM1ij − PriorM1. . ) + π6(PriorM2ij − PriorM2. . ) +eij
This figure illustrates the multilevel structure for Current Standing and Student Growth VAM. Students exist within school. This structure is similar to employees nested within work teams, work teams nested within departments, and departments nested within directors.

School Grading Technical Guide 2015 Page 17
Current Standing Effect: Empirical Bayes estimate of school random intercept
where
SSZij is the normalized scaled score for student i in school j, after adjusting for the student’s FAY,
and Grade status.
π0j is the intercept for all students in school j. It may also be thought of as the expected average of
all students’ scaled scores when predictors in the model are set to zero (no effect). It is a random
effect conditioned by Level 2.
π1 to π6 are fixed effects resulting from state level aggregations that define students with the
associated characteristic (e.g., FAY).
FAYij for student i in school j is an indicator variable that is 1 if a student is FAY =Y and 0 otherwise.
GRADE6ij GRADE7ij or GRADE8ij is an indicator variable for student i in school j and is 1 if the
student is in that grade, and 0 otherwise.
GRADE6ij. . GRADE7ij. . or GRADE8ij.. is the scaled score grand mean for students i in school j.
eij is the portion of the student’s score that is not explained by the other variables (FAY, Prior
Achievement, or GRADE).
Level 2 - School
The Level 2 random effects adjust the school’s group mean by the impact of the school’s student
mobility (MOB) and student count (SIZE). These factors are aggregated at the school level across all
YEARs:
𝜋0𝑗 = 𝛽00 + β01(MOBj– MOB. . ) + 𝛽02 (SIZE𝑗 – SIZE. . ) + U0j
where:
β0j is the mean scaled score for all individuals at school k; it is the intercept for Level 2.
β00 is the grand mean across all schools.
β01 is the school level effect of the grand mean centered proportion of non-FAY students MOBj is
the proportion of students in school j who are mobile (FAY=No).
β02 is the school level effect of the grand mean centered number of students.
SIZEj is count of students assessed in school k.
U0j is the school’s residual that is unexplained by school characteristics of MOB and SIZE.
The residual U0j is the estimate of each school’s unique contribution to Current Standing.

School Grading Technical Guide 2015 Page 18
Separate models are run for each grade and subject, and the empirical Bayes estimates of Uoj are
averaged (weighting by the number of students who took each test) by school to get an overall VAS for
each school.
To establish points, the residual is standardized (t distribution) and converted to a cumulative
distribution probability (see Definitions, CDF). These probabilities are then used to weight the available
points for VAM for that indicator, illustrated here for Current Standing reading (total possible points
7.5):
z = X
SDX [where X = U0j]
VAMScore = CDF(t) [VAMScore ranges from 0.0 to 1.0]
7.5 X VAMScore [Points attributed to VAM, Current Standing, Reading]
High School Model
The VAM model requires minor adjustment because high schools do not have three contiguous years of
scaled scores like elementary and middle schools. The three years that lead to scaled score growth are
the student’s 8th grade, 10th grade (H2) and 11th grade (H3).
B. School Growth is computed identically for both EL and HS models and yields 10 points toward
the total score. School Growth is differentiated from Current Standing in that it measures a school’s
normalized scaled score changes in relation to other schools with similar characteristics. It also accounts
for improvement of all students, not just those reaching Proficient.
1. The performance of all tested students in the current year is averaged by subtest and is compared to
all tested students in prior years. While a school’s student body will vary slightly over the years as
new students enter and others exit or graduate, School Growth is in general a stable and sensitive
measure of growth in grade-level performance.
2. Growth is calculated using value added methods to evaluate the current year. The individual
residuals for each subtest are averaged by school, and weighted by the number tested to get a VAS
for each school representing each school’s growth.
SSZj = π0j + π1(MOBj – MOB. . ) + π2 (GRADE6j
− GRADE6. . ) + π3 (GRADE7j −
GRADE7. . ) + π4 (GRADE8j − GRADE8. . ) + π5(PriorM1j
− PriorM1. . ) + π6(PriorM2j −
PriorM2. . ) + π8(SIZEj − SIZE. . ) + ej
Calculations utilize the technical detail provided in Current Standing with this variation in the last step.
The variation is illustrated here for reading which has a total possible points of five.
TECHNICAL DETAIL

School Grading Technical Guide 2015 Page 19
This example shows a typical point calculation:
CDF tU00k = .80
VAM Points for reading = .80 X 5 = 4
The school was at the 80th percentile for the available reading points of 5, yielding a total of 4 points. If the reading score is joined by a similar score in mathematics, the total of 8 points will earn the school a high B in School Growth (see Point Boundaries, Appendix).
z = X
SDX [where X = U01k]
VAMScore = CDF(t) [VAM Score ranges from 0.0 to 1.0]
5 X VAMScore [Points attributed to VAM, School Growth, Reading]
C. Student Growth resembles Current Standing in that the metric is in standard deviation units,
and it conveys growth in comparison to a student’s academic peers. The unit of analysis is a student
within a school, and the model computes the results by two student subgroups, Q1 and Q3 (see IV.
Conditioning of Data, Determine Q1 Q3).
3. Growth results from a mixed effects statistical paradigm and is computed identically for both EL and
HS models and for both Q1 and Q3 subgroups separately. The HS model yields Q1/Q3 point totals of
10/10, while the EL/MS model yields 20/20.
4. Growth is expressed in standard deviations from expected. For example, a school with a Q1 student
growth index of +1.0 is raising low performing student achievement by an average of 1 standard
deviation more than the average of the other students in the state. The growth model is flexible and
accommodates outcome assessments that differ from the assessments used as predictors. This
model facilitates a seamless move from legacy assessments used prior to 2015 to the five new
assessments used in 2015.
5. In 2015, DIBELS was included as the outcome assessments for kindergarten through 2nd grade and as
the predictor for third grade PARCC achievement. Since DIBELS measures only reading its impact on
the available points was doubled to maintain continuity with the reading/mathematic weighting.
6. The standard for Q3 Student Growth is 0, which represents one year’s worth of growth and is
equivalent to a letter grade of “C.”
7. The model is run once for each outcome assessment for Q1 and Q3 separately. The individual VASs
for each assessment are then aggregated using a weighted (n of students) average.
8. Points are awarded using method 2 (see V. Points and VAM). The school’s growth indices are
compared to the distributions of all schools, where their percentile rank is then used to arrive at
School Grading Technical Guide 2015 Page 20
their earned share. This is performed separately for math and for reading and repeated for Q1 and
Q3 groups.
9. Data preparation parallels that used for School Growth. Using the procedures described earlier, a
student level file is created with one record per student, which includes the current year outcome
variable, and two years of reading and math scores. The file is also aggregated by school and by
year, summarizing the student variables used for school effects.
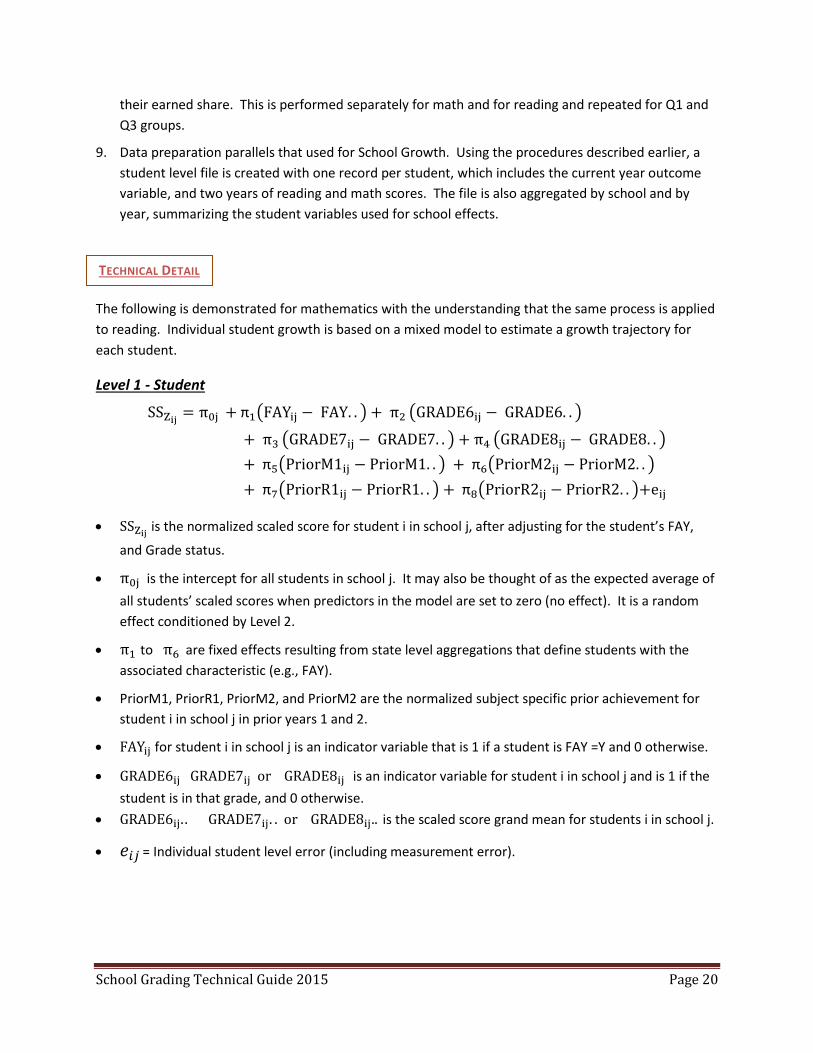
The following is demonstrated for mathematics with the understanding that the same process is applied
to reading. Individual student growth is based on a mixed model to estimate a growth trajectory for
each student.
Level 1 - Student
SSZij= π0j + π1(FAYij − FAY. . ) + π2 (GRADE6ij − GRADE6. . )
+ π3 (GRADE7ij − GRADE7. . ) + π4 (GRADE8ij − GRADE8. . )
+ π5(PriorM1ij − PriorM1. . ) + π6(PriorM2ij − PriorM2. . )
+ π7(PriorR1ij − PriorR1. . ) + π8(PriorR2ij − PriorR2. . )+eij
SSZij is the normalized scaled score for student i in school j, after adjusting for the student’s FAY,
and Grade status.
π0j is the intercept for all students in school j. It may also be thought of as the expected average of
all students’ scaled scores when predictors in the model are set to zero (no effect). It is a random
effect conditioned by Level 2.
π1 to π6 are fixed effects resulting from state level aggregations that define students with the
associated characteristic (e.g., FAY).
PriorM1, PriorR1, PriorM2, and PriorM2 are the normalized subject specific prior achievement for
student i in school j in prior years 1 and 2.
FAYij for student i in school j is an indicator variable that is 1 if a student is FAY =Y and 0 otherwise.
GRADE6ij GRADE7ij or GRADE8ij is an indicator variable for student i in school j and is 1 if the
student is in that grade, and 0 otherwise.
GRADE6ij. . GRADE7ij. . or GRADE8ij.. is the scaled score grand mean for students i in school j.
𝑒𝑖𝑗 = Individual student level error (including measurement error).
TECHNICAL DETAIL

School Grading Technical Guide 2015 Page 21
Level 2 - School
𝜋0𝑗 = 𝛽00 + β01(MOBj – MOB. . ) + 𝛽02 (SIZE𝑗 – SIZE. . ) + 𝛽03 (PriorM1𝑗 – PriorM1 ) + U0j
Points are earned through the school’s estimated growth, that is, their empirical Bayes intercept for Q3
and Q1 separately.
z = X
SDX [where X = U0j]
VAMScore = CDF(t) [VAMScore ranges from 0.0 to 1.0]
Possible Points (depends on model) X VAMScore [Points attributed to VAM, Current Standing,
Reading]
D. Opportunity to Learn (OTL) is based on attendance and a classroom survey administered to
students. High schools can earn 8 total points (3 for attendance, 5 for the survey) and
elementary/middle schools can earn 10 points (5 for each).
Attendance is computed schoolwide for every school that is rated, including feeder schools and high
schools. For elementary schools the rate includes grades 1 and excludes PreK and kindergarten.
1. Rates are presented as schoolwide percentages, and calculations are detailed in VI. C. Percentages
are rounded to two decimal places for reporting (e.g., 91.59%).
2. The goal for attendance is 95%. That is, all students enrolled, whether for a short time or a long time,
are in school for an average of 95% of their days enrolled. Schools with average rates less than 95%
are given partial credit, and schools with greater than 95% can earn more than the maximum allotted
points.
3. Ineligible student attendance records are removed prior to calculation:
Days Present < 0 or missing
Days Enrolled < 0 or missing
Days Present > Days Enrolled
Attendance records for students without a corresponding record in Student Snapshot at
the same location
4. The rate is calculated as the unweighted average of individual attendance rates of every student in
40D, 80D, and 120D snapshots. The student’s numerator is the total days attended accumulated
across three enrollment periods (40th, 80th, 120th day snapshots). The student’s denominator is
the days enrolled for the same periods. After each student’s attendance rate is computed, all
student rates are averaged for the school summary.
5. A single student can contribute to the rates of more than one school if they are mobile.
6. When a school is missing a reporting period (40D, 80D, or 120D snapshots) because of submission
error, the rate is computed in the same manner, only excluding the missing reporting period from
School Grading Technical Guide 2015 Page 22
Attendance for an elementary school = 80%
Points = .80 X 5 = 4.0
The school earned 4 out of 5 points even though it did not reach the target attendance rate of 95%.
the days attended and days enrolled. Schools may check their attendance rates by running
specialized reports in STARS.
7. The points awarded
for attendance result
directly from the
percentage. To
illustrate:
Classroom Surveys. The surveys consist of 10 questions about practices known to promote successful
learning. Elementary students are asked to consider the teachers they currently have in general and
respond about the practices they exhibit. Middle and high school students are asked to distinguish
between their mathematics instruction and their reading instruction separately, yielding two equally
weighted scores, which are then averaged.
1. Survey responses are on a 6-step Likert scale, coded 0-5 from least to most beneficial.
2. Responses are summed for each student, yielding scores ranging from 0 to 50.
3. The target score of 45 yields 100% of the five total points possible. Schools that average higher than
45 on the total score can earn slightly higher than five points.
4. Scores for all students are averaged for each school. The ratio of the school’s average to the goal of
45 results in the proportion of the goal that it met, similar to attendance. This ratio is applied to the
total possible points to arrive at the indicator score (see Attendance for an example calculation).
The points from attendance and the student survey are independently calculated, then added to form
the OTL indicator total. In 2015 schools were allowed to substitute their educator effectiveness survey
in place of the OTL survey.
E. Graduation rates are one-year lagged. That is, the rates that are published in January are for the
cohort that graduated by August 1 of the prior year. Calculation of 4-year, 5-year, and 6-year cohort
graduation rates utilizes the Shared Accountability method that is described fully in the Graduation
Technical Manual on the PED website, http://ped.state.nm.us/Graduation/index.html. The method is
not repeated here but in general:
1. A rate is generated for every school that has any grade 9, 10, 11, or 12 (see Definitions, High School).
2. For new high schools that do not yet have a graduating cohort class, a hybrid school grading model
is used. These schools are graded on the remaining non-cohort indicators and they are excused
from College/Career Readiness and Graduation. The resulting total points scale is adjusted to reflect
the reduced number of indicators, however the scale and maximum possible total points are the
same.

School Grading Technical Guide 2015 Page 23
3. The graduation goal is 100%. The model includes 4-year, 5-year, and 6-year rates, which produce a
maximum of 8, 3, and 2 points respectively. Growth of the 4-year rate is worth an additional 4
points yielding a total of 17 possible points for graduation. The extended-year rates include only
members of the prior 4-year cohort and do not allow new entrants in subsequent years.
4. Points are awarded through method 1 (see V. Points) where the rate is multiplied by the possible
points for that category. For example, a 5-year rate of 80% is equal to .80 X 3 = 2.4 points.
Graduation Growth refers to annual increase in the 4-year graduation rate and is based on three years
of data. Growth in the 4-year rate reflects the school’s overall ability to help students complete their
high school careers in a timely way.
Graduation growth utilizes a two-level mixed effects model to estimate a school’s graduation growth
rate, given the school’s prior graduation history (YEAR). The model is constructed with conventions
which are explained more fully in Current Standing, Technical Detail.
𝐺𝑟𝑎𝑑𝑅𝑎𝑡𝑒𝑖𝑗 = 𝛽0𝑗 + 𝛽1𝑗(𝑌𝑒𝑎𝑟_𝑉𝐴𝑀𝑖𝑗) + 𝛽2𝑗(𝑌𝑒𝑎𝑟𝑖𝑗) + 𝑟𝑖𝑗
𝛽0𝑗 = 𝛾00 + 𝑢0𝑗
𝛽1𝑗∗ = 𝛾10 + 𝑢1𝑗
𝐺𝑟𝑎𝑑𝑅𝑎𝑡𝑒𝑖𝑗 is the 4 year graduation rate in year i in school j.
𝑌𝑒𝑎𝑟_𝑉𝐴𝑀𝑖𝑗 is time, where 0 is the current year, -1 and -2 are prior years.
𝛽1𝑗∗
is a school’s average annual change in graduation rates (Grad Rate Growth).
Points for graduation growth utilize the following steps:
Step 1: Subtract the expected graduation growth rate of 2% from the schools graduation
growth rate only for schools with a 4-year graduation rate of less than 85%.
Step 2: Compute a z-score based on step 1 Z = X−2
SDX
Step 3: The z-score is transformed to a CDF equivalent score to assign points.
SAM Graduation Rate
A non-cohort graduation rate augments the 4-year cohort rate to arrive at a compiled SAM graduation
rate. The numerator and denominator are derived from non-cohort members since cohort members are
already counted in the regular 4-year rate. Using this method, schools receive feedback on their success
in graduating returning dropouts and adults whose cohort has long since aged from the system.
TECHNICAL DETAIL

School Grading Technical Guide 2015 Page 24
Both are combined for the final SAM graduation rate using the weighting scheme shown below. The
SAM graduation rate is then used to assign points for SAM schools on the same point framework used
for non-SAM graduation rates.
The formula for the SAM graduation rate is computed as follows:
𝑆𝑎𝑚 𝐺𝑟𝑎𝑑 𝑅𝑎𝑡𝑒 = (4𝐶𝐺𝑅 ∗4𝐶𝐺𝑅 𝐷𝑒𝑛𝑜𝑚𝑖𝑛𝑎𝑡𝑜𝑟
𝑇𝑜𝑡𝑎𝑙 𝐷𝑒𝑛𝑜𝑚𝑖𝑛𝑎𝑡𝑜𝑟) + (𝑁𝐶𝐺𝑅 ∗
𝐶𝑜𝑢𝑛𝑡 𝑜𝑓 𝑎𝑙𝑙 40𝐷 𝑆𝑒𝑛𝑖𝑜𝑟𝑠
𝑇𝑜𝑡𝑎𝑙 𝐷𝑒𝑛𝑜𝑚𝑖𝑛𝑎𝑡𝑜𝑟)
Where:
4𝐶𝐺𝑅 = (𝑆𝑢𝑚 𝑜𝑓 𝑓𝑟𝑎𝑐𝑡𝑖𝑜𝑛𝑠 𝑜𝑓 𝑠𝑛𝑎𝑝𝑠ℎ𝑜𝑡𝑠 𝑜𝑓 4 𝑦𝑒𝑎𝑟 𝑐𝑜ℎ𝑜𝑟𝑡 𝑚𝑒𝑚𝑏𝑒𝑟𝑠 𝑤ℎ𝑜 𝑔𝑟𝑎𝑑𝑢𝑎𝑡𝑒𝑑
𝑆𝑢𝑚 𝑜𝑓 𝑓𝑟𝑎𝑐𝑡𝑖𝑜𝑛𝑠 𝑜𝑓 𝑠𝑛𝑎𝑝𝑠ℎ𝑜𝑡𝑠 𝑜𝑓 𝑎𝑙𝑙 4 𝑦𝑒𝑎𝑟 𝑐𝑜ℎ𝑜𝑟𝑡 𝑚𝑒𝑚𝑏𝑒𝑟𝑠 ) ∗ 100
𝑁𝐶𝐺𝑅 = (𝐴𝑙𝑙 𝑛𝑜𝑛−𝑐𝑜ℎ𝑜𝑟𝑡 𝑔𝑟𝑎𝑑𝑢𝑎𝑡𝑒𝑠
𝐴𝑙𝑙 𝑛𝑜𝑛−𝑐𝑜ℎ𝑜𝑟𝑡 𝑠𝑡𝑢𝑑𝑒𝑛𝑡𝑠) ∗ 100
𝑇𝑜𝑡𝑎𝑙 𝐷𝑒𝑛𝑜𝑚𝑖𝑛𝑎𝑡𝑜𝑟 = 𝐶𝑜𝑢𝑛𝑡 𝑜𝑓 𝑎𝑙𝑙 40𝐷 𝑆𝑒𝑛𝑖𝑜𝑟𝑠 + 4𝐶𝐺𝑅 𝐷𝑒𝑛𝑜𝑚𝑖𝑛𝑎𝑡𝑜𝑟
F. College and Career Readiness (CCR) scores are determined by the percent of cohort
members (high school students’ 4th year) who show evidence of a college or a career preparation, along
with the proportion of those students meeting a benchmark. Credentials are established through
course enrollment leading to an industry recognized certification or through a student’s taking a
recognized academic precursor to post-secondary education.
1. CCR is computed for all high schools that have members of the 4-year graduation cohort for that
assessment year. CCR is not computed for elementary or middle schools.
2. Cohorts must have a minimum of four student records to be included. Otherwise the high school
qualifies for the non-cohort hybrid model (see Graduation 2.).
3. CCR calculations utilize the shared accountability method used for high school cohort graduation
rates. For details see the Graduation Technical Guide at
http://ped.state.nm.us/Graduation/index.html).
4. Any single student attempt (Participation) or single student success (Success) within the four years
of the cohort will be counted.
5. CCR is composed of Participation (5 points) and Success (10 points) yielding a total 15 points in the
high school’s overall grade. The school grading cut points for participation and success were derived
from base rates normalized in 2012 (see V. Points 2). This framework has been fixed for evaluation
of all future rates.
6. The following CCR indicators are eligible. All students enrolled in grades 9 through 12 are eligible for
participation in one or more of these programs:
• PSAT/NMSQT, Preliminary SAT/National Merit Scholarship Qualifying Test, is cosponsored by
the College Board and National Merit Scholarship Corporation. The assessment yields scores in

School Grading Technical Guide 2015 Page 25
English Composition (verbal), Mathematics, and Writing and offers benchmark scores that
indicate college readiness in two age groups, sophomores and younger, and juniors and older.
• SAT is a widely used college admission test that measures the skills in three subjects: Math,
Reading and Writing.
• ACT is a national college admissions examination that is recognized internationally. The ACT
yields scores in four areas, English, Mathematics, Reading, and Science, and offers benchmark
scores that indicate college readiness in each.
• Concurrent Enrollment/Dual Credit in an accredited New Mexico post-secondary institution
offering college credit is counted as evidence of post-secondary preparation. All courses that
are non-remedial are counted.
• AP, Advanced Placement, is a national qualifying examination aligned to 34 college level
courses. Most four-year colleges grant students credit, advanced placement, or both on the
basis of the score on the AP exam for that subject. Students do not get credit for enrolling in a
high school AP class. They must demonstrate participation and/or success in the national exam.
• Career Program of Studies is a sequence of high school courses that are recognized to lead to
industry-recognized certification. Foundations for career readiness are built from the Carl
Perkins Vocational and Applied Technology grant definitions. To be considered successful, the
student must complete all coursework with a C or better and graduate from high school with a
regular diploma.
• Plan, an ACT assessment for 10th graders, is designed to utilize a student’s achievement to guide
career options and the remaining years of high school. PLAN includes four multiple-choice tests:
English, Math, Reading and Science, and it was replaced by the ACT Aspire in 2014.
• AccuPlacer is a computer adaptive college placement test offered by College Board that helps
institutions of higher education place students in appropriate courses. Questions are chosen for
each student on the basis of the answers to previous questions. The Accuplacer consists of
reading, mathematics, writing and language use skills, and writing.
• COMPASS is a computer adaptive college placement test offered by ACT that helps institutions
of higher education place students in appropriate courses. Questions are chosen for each
student on the basis of the answers to previous questions. The Compass provides scores in
reading, writing skills, writing essays, math, and English as a second language.
• IB, or the International Baccalaureate program of studies, is a standardized and enhanced high
school curriculum where students must demonstrate competency in six study areas. The
program originated in Sweden and grants credentials that are recognized outside the U. S.
• SAT Subject Tests, standardized subtests that complement the SAT, are usually taken to
improve a student's credentials for admission to colleges in the United States. Each test is timed
at one-hour, and tests are available in multiple subjects related to a student’s interests or a
college’s requirements.
• TABE, Test of Adult Basic Education, is an assessment that measures a person’s grade level in
reading, mathematics, and language. This test is allowable only for designated SAM schools.

School Grading Technical Guide 2015 Page 26
• WorkKeys, a job skill assessment created by ACT is used by businesses to measure workplace
skills of job applicants, and by schools and colleges to help prepare students for the workplace.
This test is allowable only for designated SAM schools.
• ASVAB, the Armed Service Vocational Aptitude Battery, provides three composites: verbal,
math, and science/technical, as well as a composite score called the Armed Forces Qualification
Test (AFQT) score. The ASVAB scores identify occupations that best suit a candidate’s abilities
and can be used to qualify for enlistment. This test is allowable only for designated SAM
schools.
Participation
1. Cohort members will count as a participant when they attempted any one or more of the CCR
indicators any time during their four-year tenure in high school. Students may make multiple
attempts, with multiple indicators, in multiple years. However this results in only a single credit for
participation.
2. SAM schools are allowed use of additional indicators ASVAB and TABE. These indicators are not
available to other high schools.
Success
1. The success rate follows the same calculation as participation, resulting from weighted numerators
and denominators from shared accountability. Students who achieve any one or more of the
benchmarks (below) or higher are considered successful in the numerator, while students who
attempted any program or assessment form the denominator. The success rate is the percent of
participants (numerator for participation) that succeeded.
The benchmarks for success are shown in the table below.
AccuPlacer
Minimum Required
Score
College-Level Mathematics 66
Elementary Algebra 79
Reading Comprehension 82
Sentence Skills 83
WritePlacer 6
ACT
Mathematics 22
English Composition 18
Reading 22
Science 23
ACT Aspire
Mathematics 432
English 428
Reading 428
Writing 428

School Grading Technical Guide 2015 Page 27
Science 432
ACT PLAN (Expired 2014)
Mathematics 19
English 15
Reading 17
Science 21
Advanced Placement (AP) Art History 3
Biology 3
Calculus AB 3
Calculus BC 3
Chemistry 3
Chinese Language and Culture 3
Computer Science A 3
European History 3
English Language and Composition 3
English Literature and Composition 3
Environmental Science 3
French Language 3
German Language 3
Government and Politics: Comparative 3
Government and Politics: United States 3
Human Geography 3
Italian Language and Culture 3
Japanese Language and Culture 3
Latin: Vergil 3
Macroeconomics 3
Microeconomics 3
Music Theory 3
Physics B 3
Physics C: Electricity and Magnetism 3
Physics C: Mechanics 3
Psychology 3
Spanish Language 3
Spanish Literature 3
Statistics 3
Studio Art: 2-D Design 3
Studio Art: 3-D Design 3
Studio Art: Drawing 3
United States History 3
World History 3
COMPASS
Mathematics 52
Reading 88
Writing Essay (Scale 2–12) 9
Writing Essay (Scale 2–8) 7
Writing Skills 77
CTE Course Sequence
Any PED recognized CTE Pathway C
Dual Credit
Non Remedial Course C or better
International Baccalaureate (IB)
Mathematics 4
Language A 4

School Grading Technical Guide 2015 Page 28
Language B
Individuals and Society 4
Experimental Sciences 4
Arts 4
IB Diploma 24
IB Diploma 24
PSAT
Mathematics 47
Critical Reading 45
Writing 45
SAT
Mathematics 500
Critical Reading 500
Writing 500
SAT Subject Area Tests
Mathematics Level 1 587
Mathematics Level 2 647
Literature 574
Chemistry 642
Ecological Biology 593
Molecular Biology 624
Physics 632
U.S. History 610
World History 589
French 601
French with Listening 626
German 608
German with Listening 594
Spanish 619
Spanish with Listening 640
Modern Hebrew 586
Italian 671
Latin 586
Chinese with Listening 739
Japanese with Listening 662
Korean with Listening 749
In addition SAM schools may apply the following assessments.
ACT WorkKeys
Applied Mathematics 5
Listening for Understanding 4
Reading for Information 5
Business Writing 3
Applied Technology 3
Teamwork 4
Location Information 4
TABE (Complete Battery Subtests)
Mathematics 506
Reading 518
Language 524
ASVAB (Comprehensive)

School Grading Technical Guide 2015 Page 29
AFQT 31
This example shows how students Joe and Jane contributed to the CCR rates for the multiple high schools they attended during
their 4-year tenure. Note that each student’s fractions will always add to 1.0 and are the equivalent of one student statewide.
Note also that the attempt (participation) and success flags are distributed to all schools the student ever attended. This means
that all high schools accountable for readiness no matter the school’s grade configuration or the mobility of the student.
Student High
School
Count of
Snapshots in
School
Count of
Snapshots in
State
Snapshot
Fraction for
that School
CCR
Attempted*
(Y/N)
CCR
Success*
(Y/N)
CCR
Participation
Numerator
CCR Success
Numerator
Joe Pine 4 16 0.25 1 1 0.25 0.25
Joe Elm 8 16 0.50 1 1 0.50 0.50
Joe Oak 4 16 0.25 1 1 0.25 0.25
Jane Cedar 2 10 0.20 1 0 0.20 0.00
Jane Pine 5 10 0.50 1 0 0.50 0.00
Jane Oak 3 10 0.30 1 0 0.30 0.00
* Multiple attempts or multiple successes do not change the student’s weight in the calculation. The student’s single best
effort is used, and is distributed to all schools attended.
The calculation of a school’s points is illustrated for CCR participation (total 5 points).
1. StandardizedRate = (SchoolRate - MeanSchoolRate)/(SDSchoolRate)
2. NormalizedScore = CDF(StandardizedRate, N) where CDF is the cumulative distribution function (see
Definitions) which ranges from 0 to 1.0.
3. PointsAwarded = NormalizedScore X 5
G. Bonus Points
Bonus points are derived from three sources: STARS, the New Mexico Activities Association (NMAA), and
schools and districts by direct submission to an online database. Scores and points are given for these
categories:
Parent Engagement (maximum 2 points)
Student Engagement (maximum 1 point)
Truancy Improvement (maximum 1 point)
Activities (maximum 1 point)
Use of online assessment format (maximum 2 points)
1. Parent and student engagement points are calculated from on school/district submissions, using the
rubric available at:
TECHNICAL DETAIL

School Grading Technical Guide 2015 Page 30
http://webapp2.ped.state.nm.us/SchoolData/docs/1112/SchoolGrading/Bonus_Points_Web_Rubric
_Formated.pdf. Review committees with extensive background in classroom teaching and school
administration score proposals. Applications are reviewed independently by three committee
members, and then resulting scores are averaged for the school’s bonus point award.
2. Improvement in habitual truancy is calculated from STARS submissions from LEAs. This value is
computed for all schools.
3. Student participation in athletic activities is derived from data supplied by NMAA, which includes
counts of participants. This indicator is for middle and high schools only, and elementary school
bonus points are adjusted for the omission of these points. The adjustment is made by multiplying
the elementary school’s final bonus point total by a factor of 1.25.
4. The use of online assessment format is computed as the percentage of students who took the
assessments in computerized format as opposed to paper. The percentage is derived only for
assessments that have multiple formats.
5. Bonus points are added to the school total points prior to determining the school’s overall grade.
H. Feeder Schools
1. Participation rates are not calculated for feeder schools.
2. Attendance rates are generated for feeder schools using the same methods as for non-feeder
schools.
3. Proficiency. DIBELS is the sole source of achievement data.
4. Current Standing. School Growth, and Student Growth are calculated in a manner identical to non-
feeders, although DIBELS is used as the primary achievement measure. Because DIBELS measures
only reading, the points a school earns for reading in each component of school grading are
doubled.
I. Abbreviated Model
A small number of schools do not have enough data, either historical or current, to calculate growth.
For these schools, an alternate model that relies only on attendance and proficiency is used. As with
feeder schools the overall points are adjusted to meet the 100 point scale used for all of school grading.
I. Supplemental Accountability Model (SAM) Schools
SAM schools receive special considerations in VAM (Current Standing), CCR, Graduation, and
Participation. Schools qualify for the SAM model under two conditions: 1) when the percentage of
students with disabilities in the school is higher than typical (20% in 2013), or 2) when the percentage of
students aged 19 or older is higher than typical (10% in 2013). Schools may also petition to become a

School Grading Technical Guide 2015 Page 31
SAM school if the publicized mission of the school is to serve students who have traditionally found a
regular educational setting difficult, such as pregnant teens or behaviorally challenged students.
Schools that specialize in educating higher risk students typically experience higher student mobility that
complicates the calculation of cohort rates and similar time-dependent measures. Therefore, these
schools are allowed to supplement their accountability with additional rigorous measures that
demonstrate that they have met their mission. For example, the accountability for a school that
specializes in credit recovery for returning dropouts will include their ability to build a student’s credit
bank and to graduate non-cohort members in the current year. These supplemental measures are
negotiated with the PED and are in addition to, not in place of, the accountability measures required of
non-SAM schools.
Current Standing VAM. When conditioning data for Current Standing, an offset is applied to level the
playing field for SAM schools. The offset (shown for mathematics, 2012) is based on the mean deviation
of scaled scores for SAM schools in the year of the calculation:
Offset = (MeanVAM+.0636) / (SDMeanVAM)
(For reading in 2012 the offset factor was .0219.)
The offset is recomputed every year and is dependent upon the reading and mathematics performance
of students in SAM schools.
Graduation. An auxiliary graduation rate is computed using a senior completer method which includes
only 12th grade students who are not members of the 4-year cohort. The denominator is comprised of
the count of 12th graders in the first enrollment snapshot (40D). The numerator is derived from the
count of all non-cohort students who graduated by the end of the year (EOY snapshot). Note that these
counts do not track the same students but are considered only samples of typical senior enrollment and
of typical non-cohort graduates. It is possible for a school to have a graduate count at the end of the
year that exceeds their senior population at the 40th day snapshot. This would occur when many
students undertake brief periods of rapid credit recovery and graduate and exit throughout the year,
while the school maintains a relatively stable student count.
The numerator and denominator are derived from only non-cohort members since cohort members are
already counted in the regular 4-year rate. Using this method, schools receive feedback on their success
in graduating returning dropouts and adults whose cohort has long since aged from the system. The
rate calculations are covered in E. Graduation.
College and Career Readiness (CCR) rules were broadened for SAM schools to include additional career
readiness indicators that were in keeping with the mission of the school. For example, in 2012 schools
submitted WorkKeys and TABE data, and in 2013 the ASVAB was added.

School Grading Technical Guide 2015 Page 32
Participation in assessments requires that 95% of enrolled students be assessed. With the high student
turnover in most SAM schools, this rate becomes unrealistically high and unachievable. Therefore SAM
schools were excused from a participation penalty, although PED will continue to monitor SAM schools
to ensure that students are not systematically being excluded from assessment.
VII. Participation in Assessments
All enrolled students in eligible grades must be tested with PARCC, SBA, NMAPA or NCSC. Students with
an invalid assessment are counted as unsuccessfully tested and count against the school’s participation
rate. Students who are FAY=Y at one school (their accountable school) but take the test at another
school, are reassigned to their accountable school.
1. The goal for participation is 95% of the All Students group. The percentage is rounded to the
nearest integer. Schools that fail to meet the minimum of 95% have their letter grade reduced by
one letter, and a penalty flag placed on their report. Schools that are in “F” status will remain “F”
and will have a penalty flag placed on their report.
2. Participation rates are not computed for feeder schools.
3. Examinees whose tests are invalidated for various reasons (see IV. Conditioning of Data, TC Codes,
PL=5) do not receive a score but are still counted for participation.
4. Examinees whose tests are exempted (Medical Exemption, Reading Exemption, Withdrew before
Completion) are excused and do not contribute to school calculations.
5. The participation rate is a percentage, where the numerator is the count of all valid and scorable
tests. Students who received a reading exemption (TC=3) are counted for participation provided
they have successfully completed the English language proficiency examination in lieu of the reading
assessment.
6. The denominator is derived from all students in eligible grades from the 120D, AYP, and EOY
snapshots. Each snapshot is considered singly and averaged with neighboring snapshots. If the rate
is met in one of the snapshot considerations, the school is considered to have met participation.
7. Two participation rates are calculated, one for reading and one for mathematics. If either rate falls
below 95% the school fails to meet the requirement.
8. Participation penalty is applied only to schools with 100 or more students.
9. For small schools the unweighted average of rates from the current and prior two years are applied
as a second tier of evaluation.

School Grading Technical Guide 2015 Page 33
Appendix A: School Growth Targets
School Growth Targets (SGTs)
Year
2013 2014 2015 2016 2017 2018 2019 2020 2021
Proficiency
Math (%) 17.63
Reading (%) 33.32
Growth Q3*
Math (SS) -.0613
Reading (SS) -.0481
Growth Q1*
Math (SS) -.0334
Reading (SS) .0038
High School
Graduation (%) 69.9 71.8 73.7 75.6 75.6 77.4 79.3 81.2 83.1 85.0
These targets will be reset in 2016
following full evaluation of new
assessments introduced in 2015. For
this interim year the state mean was
used for reporting and is shown in the
first column. Graduation targets will
not be reset.

School Grading Technical Guide 2015 Page 34
Appendix B: Elementary/Middle Model and Points
Overall Model and Points - Elementary and Middle Schools Points
Current Standing
How did students perform in the most recent school
year? Students are tested on how well they met targets
for their grade level (Proficient).
Percent Proficient 25
40 Value-added conditioning of
proficiencies, accounting for
school characteristics for the
past 3 years.
15
School Growth
In the past 3 years did the school increase grade level
performance? For example, did this year’s 3rd graders
improve over last year’s 3rd graders?
Value-added conditioning of
performance, taking into account
school characteristics for the
past 3 years.
10 10
Growth of Higher Performing Students (Q3)
How well did the school help individual students
improve? The highest performing students are those
whose prior scores placed them in the top three quarters
(75%) of their school.
Individual Student Growth over
the past 3 years is compared to
the average for the state.
20 20
Growth of Lowest Performing Students (Q1)
How well did the school help individual students
improve? The lowest performing students are those
whose prior scores placed them in the bottom quarter
(25%) of their school.
Individual Student Growth over
the past 3 years is compared to
average for the state.
20 20
Opportunity to Learn
Does the school foster an environment that facilitates
learning? Are teachers using recognized instructional
methods, and do students want to come to school?
Attendance for all students 5
10 Classroom survey 5
Total 100
Student and Parent Engagement
Does the school show exceptional aptitude for involving
students and parents in education, reducing truancy, and
promoting extracurricular activities?
Bonus Points +5
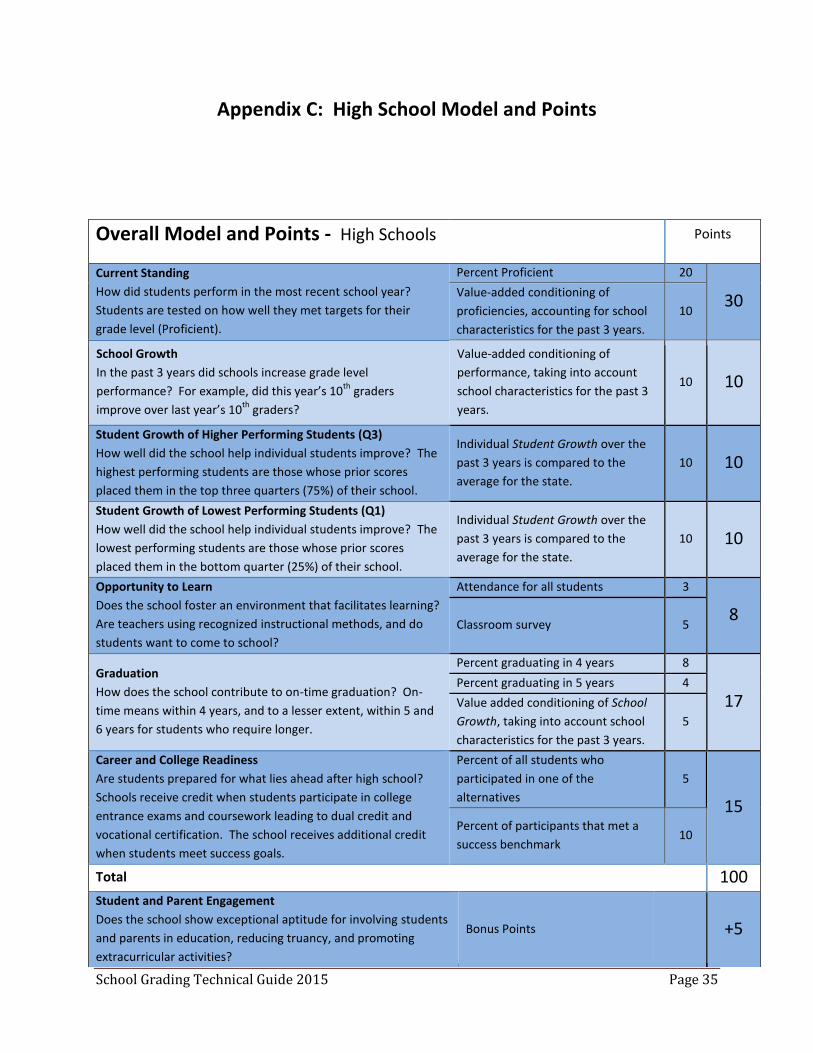
School Grading Technical Guide 2015 Page 35
Appendix C: High School Model and Points
Overall Model and Points - High Schools Points
Current Standing
How did students perform in the most recent school year?
Students are tested on how well they met targets for their
grade level (Proficient).
Percent Proficient 20
30 Value-added conditioning of
proficiencies, accounting for school
characteristics for the past 3 years.
10
School Growth
In the past 3 years did schools increase grade level
performance? For example, did this year’s 10th
graders
improve over last year’s 10th
graders?
Value-added conditioning of
performance, taking into account
school characteristics for the past 3
years.
10 10
Student Growth of Higher Performing Students (Q3)
How well did the school help individual students improve? The
highest performing students are those whose prior scores
placed them in the top three quarters (75%) of their school.
Individual Student Growth over the
past 3 years is compared to the
average for the state.
10 10
Student Growth of Lowest Performing Students (Q1)
How well did the school help individual students improve? The
lowest performing students are those whose prior scores
placed them in the bottom quarter (25%) of their school.
Individual Student Growth over the
past 3 years is compared to the
average for the state.
10 10
Opportunity to Learn
Does the school foster an environment that facilitates learning?
Are teachers using recognized instructional methods, and do
students want to come to school?
Attendance for all students 3
8 Classroom survey 5
Graduation
How does the school contribute to on-time graduation? On-
time means within 4 years, and to a lesser extent, within 5 and
6 years for students who require longer.
Percent graduating in 4 years 8
17 Percent graduating in 5 years 4
Value added conditioning of School
Growth, taking into account school
characteristics for the past 3 years.
5
Career and College Readiness
Are students prepared for what lies ahead after high school?
Schools receive credit when students participate in college
entrance exams and coursework leading to dual credit and
vocational certification. The school receives additional credit
when students meet success goals.
Percent of all students who
participated in one of the
alternatives
5
15 Percent of participants that met a
success benchmark 10
Total 100 Student and Parent Engagement
Does the school show exceptional aptitude for involving students
and parents in education, reducing truancy, and promoting
extracurricular activities?
Bonus Points +5

School Grading Technical Guide 2015 Page 36
Appendix D: Point Boundaries for School Grading Indicators
* Points are rounded for tables for simplicity.
However in calculations, figures were carried out
to 6 or more decimals. Therefore, letter grades at
the highest and lowest boundary of a point span
may not be apparent because of rounding.
Unrounded figures are available upon request
from PED’s Accountability Bureau.
Elementary and Middle Schools
Indicator Grade Points*
Current
Standing
A 30.6 or above
B 23.8 to 30.5
C 18.9 to 23.7
D 14.6 to 18.8
F 14.5 or below
School
Growth
A 8.9 or above
B 6.6 to 8.8
C 5.0 to 6.5
D 3.4 to 4.9
F 3.3 or below
Student Growth
of
Higher
Performing
Students (Q3)
A 13.7 or above
B 8.6 to 13.6
C 5.8 to 8.5
D 3.0 to 5.7
F 2.9 or below
Student Growth
of
Lowest
Performing
Students (Q1)
A 18.6 or above
B 16.5 to 18.5
C 14.2 to 16.4
D 11.5 to 14.1
F 11.4 or below
Opportunity
to
Learn
A 9.0 or above
B 8.0 to 8.9
C 7.0 to 7.9
D 6.0 to 6.9
F 5.9 or below
Overall
Grade
A 75.0 or above
B 60.0 to 74.9
C 50.0 to 59.9
D 37.5 to 49.9
F 37.4 or below
High Schools
Indicator Grade Points*
Current
Standing
A 18.8 or above
B 14.2 to 18.7
C 10.9 to 14.1
D 9.0 to 10.8
F 8.9 or below
School
Growth
A 8.9 or above
B 6.6 to 8.8
C 5.0 to 6.5
D 3.4 to 4.9
F 3.3 or below
Student Growth of
Higher
Performing
Students (Q3)
A 6.8 or above
B 4.3 to 6.7
C 2.9 to 4.2
D 1.5 to 2.8
F 1.4 or below
Student Growth of
Lowest
Performing
Students (Q1)
A 9.3 or above
B 8.3 to 9.2
C 7.1 to 8.2
D 5.7 to 7.0
F 5.6 or below
Opportunity
to
Learn
A 7.2 or above
B 6.4 to 7.1
C 5.6 to 6.3
D 4.8 to 5.5
F 4.7 or below
Graduation
A 15.3 or above
B 13.6 to 15.2
C 11.9 to 13.5
D 10.2 to 11.8
F 10.1 or below
College & Career
Readiness
A 11.3 or above
B 9.7 to 11.2
C 8.2 to 9.6
D 6.7 to 8.1
F 6.6 or below
Overall
Grade
A 75.0 and above
B 65.0 to 74.9
C 50.0 to 64.9
D 35.0 to 49.9
F 34.9 and below