Embed Size (px)
Citation preview

SCHOOL DISTRICT OF THE
BOROUGH OF RAMSEY
COUNTY OF BERGEN, NEW JERSEY
COMPREHENSIVE ANNUAL FINANCIAL REPORT
FOR THE FISCAL YEAR ENDED
JUNE 30, 2015

School Districtof
Ramsey
RAMSEY BOARD OF EDUCATIONRamsey, New Jersey
Comprehensive Annual Financial ReportYear Ended June 30, 2015

Comprehensive Annual Financial Report
of the
RAMSEY BOARD OF EDUCATIONRamsey, New Jersey
Year Ended June 30, 2015
Prepared by
Robert J. MarcotulliAssistant Superintendent-Business/Board Secretary
OUTLINE OF CAFR
INTRODUCTORY SECTION
Letter of Transmittal. . . . . . . . . . . . . . . . . . . . . . . . . . . . . . . . . . . . . . . . . . . . . . . . . . . . . . . . . . . . . 1Organizational Chart. . . . . . . . . . . . . . . . . . . . . . . . . . . . . . . . . . . . . . . . . . . . . . . . . . . . . . . . . . . . . 5Roster of Officials.. . . . . . . . . . . . . . . . . . . . . . . . . . . . . . . . . . . . . . . . . . . . . . . . . . . . . . . . . . . . . . 6Consultants and Advisors. . . . . . . . . . . . . . . . . . . . . . . . . . . . . . . . . . . . . . . . . . . . . . . . . . . . . . . . . 7
FINANCIAL SECTION
Independent Auditor's Report. . . . . . . . . . . . . . . . . . . . . . . . . . . . . . . . . . . . . . . . . . . . . . . . . . . . . . 8
Required Supplementary Information - Part IManagement’s Discussion and Analysis.. . . . . . . . . . . . . . . . . . . . . . . . . . . . . . . . . . . . . . . . . . . . . 12
BASIC FINANCIAL STATEMENTS
A. District-wide Financial Statements:
A-1 Statement of Net Position. . . . . . . . . . . . . . . . . . . . . . . . . . . . . . . . . . . . . . . . . . . . . . . . 25A-2 Statement of Activities. . . . . . . . . . . . . . . . . . . . . . . . . . . . . . . . . . . . . . . . . . . . . . . . . . 26
B. Fund Financial Statements:
Governmental Funds:B-1 Balance Sheet. . . . . . . . . . . . . . . . . . . . . . . . . . . . . . . . . . . . . . . . . . . . . . . . . . . . . . . . . 27B-2 Statement of Revenues, Expenditures and Changes in Fund Balances. . . . . . . . . . . . . 28B-3 Reconciliation of the Statement of Revenues, Expenditures, and
Changes in Fund Balances of Governmental Funds to theStatement of Activities. . . . . . . . . . . . . . . . . . . . . . . . . . . . . . . . . . . . . . . . . . . . . . . . 29
Proprietary Funds:B-4 Statement of Net Position. . . . . . . . . . . . . . . . . . . . . . . . . . . . . . . . . . . . . . . . . . . . . . . . 30B-5 Statement of Revenues, Expenses and Changes in Fund Net Position.. . . . . . . . . . . . . 31B-6 Statement of Cash Flows. . . . . . . . . . . . . . . . . . . . . . . . . . . . . . . . . . . . . . . . . . . . . . . . 32
Fiduciary Funds:B-7 Statement of Fiduciary Net Position. . . . . . . . . . . . . . . . . . . . . . . . . . . . . . . . . . . . . . . . 33B-8 Statement of Changes in Fiduciary Net Position. . . . . . . . . . . . . . . . . . . . . . . . . . . . . . 34
Notes to the Financial Statements. . . . . . . . . . . . . . . . . . . . . . . . . . . . . . . . . . . . . . . . . . . . . . . . 35
Required Supplementary Information - Part II
OUTLINE OF CAFR
C. Budgetary Comparison Schedules:
C-1 Budgetary Comparison Schedule - General Fund.. . . . . . . . . . . . . . . . . . . . . . . . . . . . . 60C-1a Not ApplicableC-1b Not ApplicableC-2 Budgetary Comparison Schedule - Special Revenue Fund.. . . . . . . . . . . . . . . . . . . . . . 65
Notes to the Required Supplementary InformationC-3 Budget-to-GAAP Reconciliation. . . . . . . . . . . . . . . . . . . . . . . . . . . . . . . . . . . . . . . . . . 66
Required Supplementary Information - Part III
L. Schedules Related to Accounting and Reporting for Pensions (GASB 68)
L-1 Schedule of the District's Proportionate Share of the Net PensionLiability – PERS.. . . . . . . . . . . . . . . . . . . . . . . . . . . . . . . . . . . . . . . . . . . . . . . . . . . . ___
L-2 Schedule of District Contributions – PERS. . . . . . . . . . . . . . . . . . . . . . . . . . . . . . . . . . ___L-3 Schedule of the District's Proportionate Share of the Net Pension
Liability – TPAF.. . . . . . . . . . . . . . . . . . . . . . . . . . . . . . . . . . . . . . . . . . . . . . . . . . . . ___L-4 Notes to Required Schedules of Supplementary Information - Part III
Other Supplementary Information
D. School Level Schedules: Not Applicable
E. Special Revenue Fund:
E-1 Combining Schedule of Program Revenues and Expenditures -Budgetary Basis. . . . . . . . . . . . . . . . . . . . . . . . . . . . . . . . . . . . . . . . . . . . . . . . . . . . . 67
E-1a Combining Schedule of Program Revenues and Expenditures -Budgetary Basis. . . . . . . . . . . . . . . . . . . . . . . . . . . . . . . . . . . . . . . . . . . . . . . . . . . . . 68
E-1b Combining Schedule of Program Revenues and Expenditures -Budgetary Basis. . . . . . . . . . . . . . . . . . . . . . . . . . . . . . . . . . . . . . . . . . . . . . . . . . . . . 69
E-2 Not ApplicableE-3 Not Applicable
F. Capital Projects Fund:
F-1 Summary Schedule of Revenues, Expenditures and Changes inFund Balance - Budgetary Basis.. . . . . . . . . . . . . . . . . . . . . . . . . . . . . . . . . . . . . . . . 70
F-1a – Schedule of Project Revenues, Expenditures, Project Balances and ProjectF-1i Status - Budgetary Basis.. . . . . . . . . . . . . . . . . . . . . . . . . . . . . . . . . . . . . . . . . . . . . . 71F-2 Summary Statement of Project Expenditures. . . . . . . . . . . . . . . . . . . . . . . . . . . . . . . . . 83
OUTLINE OF CAFR
G. Proprietary Funds:
Enterprise Fund:G-1 Combining Statement of Net Position. . . . . . . . . . . . . . . . . . . . . . . . . . . . . . . . . . . . . . 84G-2 Combining Statement of Revenues, Expenses and Changes in
Fund Net Position. . . . . . . . . . . . . . . . . . . . . . . . . . . . . . . . . . . . . . . . . . . . . . . . . . . . 85G-3 Combining Statement of Cash Flows. . . . . . . . . . . . . . . . . . . . . . . . . . . . . . . . . . . . . . . 86
Internal Service Fund:Not Applicable
H. Fiduciary Funds:
H-1 Combining Statement of Fiduciary Net Position. . . . . . . . . . . . . . . . . . . . . . . . . . . . . . 87H-2 Combining Statement of Changes in Fiduciary Net Position. . . . . . . . . . . . . . . . . . . . . 88H-3 Student Activity Agency Fund - Schedule of Receipts and Disbursements. . . . . . . . . . 89H-4 Payroll Agency Fund - Schedule of Receipts and Disbursements. . . . . . . . . . . . . . . . . 90H-5 Contributions Pledged to Specific Awards. . . . . . . . . . . . . . . . . . . . . . . . . . . . . . . . . . . 91
I. Long-Term Debt:
I-1 Schedule of Serial Bonds. . . . . . . . . . . . . . . . . . . . . . . . . . . . . . . . . . . . . . . . . . . . . . . . 92I-2 Not ApplicableI-3 Debt Service Fund Budgetary Comparison Schedule. . . . . . . . . . . . . . . . . . . . . . . . . . . 93
J. Statistical Section (Unaudited)
Financial Trends
J-1 Net Position by Component. . . . . . . . . . . . . . . . . . . . . . . . . . . . . . . . . . . . . . . . . . . . . . 94J-2 Changes in Net Position. . . . . . . . . . . . . . . . . . . . . . . . . . . . . . . . . . . . . . . . . . . . . . . . . 95J-3 Fund Balances - Governmental Funds. . . . . . . . . . . . . . . . . . . . . . . . . . . . . . . . . . . . . . 97J-4 Changes in Fund Balances - Governmental Funds. . . . . . . . . . . . . . . . . . . . . . . . . . . . . 98J-5 General Fund Other Local Revenue by Source.. . . . . . . . . . . . . . . . . . . . . . . . . . . . . . . 100
Revenue Capacity
J-6 Assessed Value and Estimated Actual Value of Taxable Property.. . . . . . . . . . . . . . . . 101J-7 Direct and Overlapping Property Tax Rates. . . . . . . . . . . . . . . . . . . . . . . . . . . . . . . . . . 102J-8 Principal Property Taxpayers. . . . . . . . . . . . . . . . . . . . . . . . . . . . . . . . . . . . . . . . . . . . . 103J-9 Property Tax Levies and Collections. . . . . . . . . . . . . . . . . . . . . . . . . . . . . . . . . . . . . . . 104

OUTLINE OF CAFR
Debt Capacity
J-10 Ratios of Outstanding Debt by Type.. . . . . . . . . . . . . . . . . . . . . . . . . . . . . . . . . . . . . . . 105J-11 Ratios of General Bonded Debt Outstanding. . . . . . . . . . . . . . . . . . . . . . . . . . . . . . . . . 106J-12 Direct and Overlapping Governmental Activities Debt. . . . . . . . . . . . . . . . . . . . . . . . . 107J-13 Legal Debt Margin Information. . . . . . . . . . . . . . . . . . . . . . . . . . . . . . . . . . . . . . . . . . . 108
Demographic and Economic Information
J-14 Demographic and Economic Statistics. . . . . . . . . . . . . . . . . . . . . . . . . . . . . . . . . . . . . . 109J-15 Principal Employers. . . . . . . . . . . . . . . . . . . . . . . . . . . . . . . . . . . . . . . . . . . . . . . . . . . . 110
Operating Information
J-16 Full-time Equivalent District Employees by Function/Program.. . . . . . . . . . . . . . . . . . 111J-17 Operating Statistics. . . . . . . . . . . . . . . . . . . . . . . . . . . . . . . . . . . . . . . . . . . . . . . . . . . . . 112J-18 School Building Information. . . . . . . . . . . . . . . . . . . . . . . . . . . . . . . . . . . . . . . . . . . . . 113J-19 Schedule of Allowable Maintenance Expenditures by School Facility. . . . . . . . . . . . . 114J-20 Insurance Schedule. . . . . . . . . . . . . . . . . . . . . . . . . . . . . . . . . . . . . . . . . . . . . . . . . . . . . 115
K. SINGLE AUDIT SECTION
K-1 Independent Auditor’s Report on Internal Control Over FinancialReporting and on Compliance and Other Matters Based on anAudit of Financial Statements Performed in Accordance withGovernment Auditing Standards. . . . . . . . . . . . . . . . . . . . . . . . . . . . . . . . . . . . . . . . 116
K-2 Independent Auditor’s Report on Compliance with RequirementsApplicable to Each Major Program and on Internal Control OverCompliance in Accordance with OMB Circular A-133 and N.J.OMB Circular Letter 04-04. . . . . . . . . . . . . . . . . . . . . . . . . . . . . . . . . . . . . . . . . . . . 118
K-3 Schedule of Expenditures of Federal Awards - Schedule A. . . . . . . . . . . . . . . . . . . . . . 122K-4 Schedule of Expenditures of State Financial Assistance - Schedule B.. . . . . . . . . . . . . 123K-5 Notes to the Schedules of Awards and Financial Assistance. . . . . . . . . . . . . . . . . . . . . 125K-6 Schedule of Findings and Questioned Costs.. . . . . . . . . . . . . . . . . . . . . . . . . . . . . . . . . 127K-7 Summary Schedule of Prior Audit Findings. . . . . . . . . . . . . . . . . . . . . . . . . . . . . . . . . . 131
INTRODUCTORY SECTION
-1-

-2-

-3-
-4-

Ram
sey
Pub
lic S
choo
ls
Boar
d of
Edu
catio
n
Dir.
Of C
urric
ulum
,In
stru
ctio
n, &
Asse
ssm
ent
Prin
cipa
lsAs
st. S
upt.
Busi
ness
Supe
rvis
ors
Aide
sSu
perv
isor
Of B
& G
Dire
ctor
of
Tech
nolo
gy
Asst
. Prin
cipa
ls
Prof
essi
onal
Staf
fPr
inci
pals
Boar
d Se
cret
ary
Supe
rinte
nden
t
Cus
todi
ans
Mai
nten
ance
Gro
unds
&
Driv
ers
Secr
etar
ies
Caf
eter
iaR
amse
yC
omm
unity
Scho
ol
Rev
ised
Mar
ch 2
012
Tech
Sup
port
Staf
fSe
cret
arie
s
Adm
inis
tratio
nBu
sine
ss
-5-

Members of the Board of Education Term Expires
Anthony Gasparovich, President 2018
Laura E. Genovese Behrmann 2018
Timothy Finnegan 2017
Mae Fine 2016
James Meiman 2018
Claudia Monteith 2017
David Rockefeller 2016
Peter Wasek 2016
Keri Walsh 2016
Dr. Matthew Murphy, Superintendent of Schools
Robert J. Marcotulli, Assistant Superintendent-Business Administrator/Board Secretary
Robert M. Jacobs, Esq. Solicitors
LAN Associates, Architects
Other Officials
RAMSEY BOARD OF EDUCATIONBERGEN COUNTY, NEW JERSEY
ROSTER OF OFFICIALSJUNE 30, 2015
-6-

RAMSEY BOARD OF EDUCATION CONSULTANTS AND ADVISORS
JUNE 30, 2015
Architect/Engineer
LAN Associates Engineering 445 Godwin Avenue
Midland Park, NJ 07432
Audit Firm
Ferraioli, Wielkotz, Cerullo & Cuva, P.A. 401 Wanaque Avenue
Pompton Lakes, NJ 07442
Attorney
Robert M. Jacobs, Esq. Winne, Banta, Hetherington
Basralian & Kahn, P.C. Court Plaza South - East Wing
21 Main Street P.O. Box 647
Hackensack, NJ 07602
Official Depositories
TD Bank, N.A. Lake Street
Ramsey, NJ 07446
-7-

FINANCIAL SECTION
Ferraioli, Wielkotz, Cerullo & Cuva, P.A.
Charles J. Ferraioli, Jr., MBA, CPA, RMA Certified Public Accountants Newton Office Steven D. Wielkotz, CPA, RMA 401 Wanaque Avenue 100B Main Street James J. Cerullo, CPA, RMA Pompton Lakes, New Jersey 07442 Newton, NJ 07860Paul J. Cuva, CPA, RMA 973-835-7900 973-579-3212Thomas M. Ferry, CPA, RMA Fax 973-835-6631 Fax 973-579-7128
INDEPENDENT AUDITOR'S REPORT
The Honorable President and
Members of the Board of Education
Borough of Ramsey School District
County of Bergen, New Jersey
Ramsey, New Jersey
Report on the Financial Statements
We have audited the accompanying financial statements of the governmental activities, the business-
type activities, each major fund and the aggregate remaining fund information of the Board of Education
of the Borough of Ramsey School District, in the County of Bergen, State of New Jersey, as of and for
the year ended June 30, 2015, and the related notes to the financial statements, which collectively
comprise the District’s basic financial statements as listed in the table of contents.
Management’s Responsibility for the Financial Statements
Management is responsible for the preparation and fair presentation of these financial statements in
accordance with accounting principles generally accepted in the United States of America; this includes
the design, implementation, and maintenance of internal control relevant to the preparation and fair
presentation of financial statements that are free from material misstatements, whether due to fraud or
error.
Auditor’s Responsibility
Our responsibility is to express an opinion on these financial statements based on our audit. We
conducted our audit in accordance with auditing standards generally accepted in the United States of
America, the audit requirements prescribed by the Office of School Finance, Department of Education,
State of New Jersey, and the standards applicable to financial audits contained in Government Auditing
Standards, issued by the Comptroller General of the United States. Those standards require that we
plan and perform the audit to obtain reasonable assurance about whether the financial statements are
free of material misstatement.
-8-

Honorable President and
Members of the Board of Education
Page 2.
An audit involves performing procedures to obtain audit evidence about the amounts and disclosures in
the financial statements. The procedures selected depend on the auditor’s judgment, including the
assessment of the risks of material misstatement of the financial statements, whether due to fraud or
error. In making those risk assessments, the auditor considers internal control relevant to the entity’s
preparation and fair presentation of the financial statements in order to design audit procedures that are
appropriate in the circumstances, but not for the purpose of expressing an opinion on the effectiveness
of the entity’s internal control. Accordingly, we express no such opinion. An audit also includes
evaluating the appropriateness of accounting policies used and the reasonableness of significant
accounting estimates made by management, as well as evaluating the overall presentation of the
financial statements.
We believe that the audit evidence we have obtained is sufficient and appropriate to provide a basis for
our audit opinions.
Opinions
In our opinion, the financial statements referred to above present fairly, in all material respects, the
respective financial position of the governmental activities, business-type activities, each major fund,
and the aggregate remaining fund information of the Borough of Ramsey Board of Education, in the
County of Bergen, State of New Jersey, as of June 30, 2015, and the respective changes in financial
position and, where applicable, cash flows thereof for the year then ended in accordance with
accounting principles generally accepted in the United States of America.
Other Matters
Required Supplementary Information
Accounting principles generally accepted in the United States of America require that the
Management’s Discussion and Analysis, Budgetary Comparison Information, and schedules related to
accounting and reporting for pensions (GASB 68) identified in the table of contents be presented to
supplement the basic financial statements. Such information, although not a part of the basic financial
statements, is required by the Governmental Accounting Standards Board who considers it to be an
essential part of the financial reporting for placing the basic financial statements in an appropriate
operational, economic, or historical context. We have applied certain limited procedures to the required
supplementary information in accordance with auditing standards generally accepted in the United
States of America, which consisted of inquiries of management about the methods of preparing the
information and comparing the information for consistency with management’s responses to our
inquiries, the basic financial statements, and other knowledge we obtained during our audit of the basic
financial statements. We do not express an opinion or provide any assurance on the information
because the limited procedures do not provide us with sufficient evidence to express an opinion or
provide any assurance.
-9-

Honorable President and
Members of the Board of Education
Page 3.
Other Information
Our audit was conducted for the purpose of forming opinions on the financial statements that
collectively comprise the Borough of Ramsey Board of Education’s basic financial statements. The
introductory section, combining and individual nonmajor fund financial statements, and schedule of
expenditures of federal awards, as required by Office of Management and Budget Circular A-133,
Audits of States, Local Governments, and Non-Profit Organizations and the schedule of expenditures of
state financial assistance as required by NJ OMB 04-04 and the introductory section and statistical
section are presented for purposes of additional analysis and are not a required part of the basic financial
statements.
The combining and individual nonmajor fund financial statements, and the schedule of expenditures of
federal awards, as required by Office of Management and Budget Circular A-133, Audits of States,
Local Governments, and Non-Profit Organizations, the schedule of federal financial awards and the
schedule of expenditures of state financial assistance as required by NJ OMB 04-04 are the
responsibility of management and were derived from and relates directly to the underlying accounting
and other records used to prepare the basic financial statements. Such information has been subjected to
the auditing procedures applied in the audit of the basic financial statements and certain additional
procedures, including comparing and reconciling such information directly to the underlying accounting
and other records used to prepare the basic financial statements or to the basic financial statements
themselves, and other additional procedures in accordance with auditing standards generally accepted in
the United States of America. In our opinion, the combining and individual nonmajor fund financial
statements, schedule of expenditures of federal awards, as required by Office of Management and
Budget Circular A-133, Audits of States, Local Governments, and Non-Profit Organizations, and the
schedule of expenditures of state financial assistance as required by NJ OMB 04-04 are fairly stated, in
all material respects, in relation to the basic financial statements as a whole.
The introductory section and statistical data section has not been subject to the auditing procedures
applied in the audit of the basic financial statements, and accordingly, we do not express an opinion or
provide any assurance on it.
Other Reporting Required by Government Auditing Standards
In accordance with Government Auditing Standards, we have also issued our report dated October 14,
2015 on our consideration of the Borough of Ramsey Board of Education’s internal control over
financial reporting and on our tests of its compliance with certain provisions of laws, regulations,
contracts, and grant agreements and other matters. The purpose of that report is to describe the scope of
-10-

Honorable President and
Members of the Board of Education
Page 4.
our testing of internal control over financial reporting and compliance and the results of that testing, and
not to provide an opinion on internal control over financial reporting or on compliance. That report is an
integral part of an audit performed in accordance with Government Auditing Standards in considering
the Borough of Ramsey Board of Education’s internal control over financial reporting and compliance.
Steven D. WielkotzSteven D. WielkotzSteven D. WielkotzSteven D. Wielkotz
Steven D. Wielkotz, C.P.A.
Licensed Public School Accountant
No. 816
Ferraioli, Wielkotz, Cerullo & Cuva, P.A.Ferraioli, Wielkotz, Cerullo & Cuva, P.A.Ferraioli, Wielkotz, Cerullo & Cuva, P.A.Ferraioli, Wielkotz, Cerullo & Cuva, P.A.
FERRAIOLI, WIELKOTZ, CERULLO & CUVA, P.A.
Certified Public Accountants
Pompton Lakes, New Jersey
October 14, 2015
-11-

REQUIRED SUPPLEMENTARY
INFORMATION - PART I

RAMSEY BOARD OF EDUCATIONRAMSEY, NJ
MANAGEMENT’S DISCUSSION AND ANALYSISFOR THE FISCAL YEAR ENDED JUNE 30, 2015
UNAUDITED
As management of the Borough of Ramsey School District (the “School District”), we offerreaders of the School District’s financial statements this narrative overview and analysis of thefinancial activities of the Borough of Ramsey School District for the fiscal year ended June 30,2015.
The management’s discussion and analysis is provided at the beginning of the audit to providean overall review of the past and current position of the School District’s financial condition. This summary should not be taken as a replacement for the audit which consists of the financialstatements and other supplemental information that presents all the School District’s revenuesand expenditures by program for the General Fund, Special Revenue Fund, Capital ProjectsFund, Debt Service Fund and Enterprise Fund.
FINANCIAL HIGHLIGHTS
In total, net position increased $3,124,798. Net position of governmental activities increased$3,191,906 while net assets of business-type activity decreased by $(67,108).
General revenues accounted for $66,202,685 in revenue or 97 percent of all district revenues. Program specific revenues in the form of charges for services and sales, grants and contributionsaccounted for $1,821,352 or 3 percent of total revenues of $68,024,037.
The School District had $64,194,432 in expenses related to governmental activities; only$1,183,677 of these expenses were offset by program specific charges for services, grants orcontributions. General revenues (primarily grants, entitlements and property taxes) of$66,202,661 were adequate to provide for these programs.
-12-
RAMSEY BOARD OF EDUCATIONRAMSEY, NJ
MANAGEMENT’S DISCUSSION AND ANALYSISFOR THE FISCAL YEAR ENDED JUNE 30, 2015
UNAUDITED (CONTINUED)
USING THIS ANNUAL REPORT
This discussion and analysis are intended to serve as an introduction to the Borough of RamseySchool District’s basic financial statements. The Borough of Ramsey School District’s basicfinancial statements are comprised of three components: 1) district-wide financial statements, 2)fund financial statements, and 3) notes to the financial statements. This report also containsother supplementary information in addition to the basic financial statements themselves.
District-Wide Financial Statements
The district-wide financial statements are designed to provide readers with a broad overview ofthe Borough of Ramsey School District’s finances, in a manner similar to a private-sectorbusiness.
The statement of net position presents information on all of the Borough of Ramsey SchoolDistrict’s assets and liabilities using the accrual basis of accounting, with the difference betweenthe two reported as net position. Over time, increases or decreases in net position may serve as auseful indicator of whether the financial position of the Borough of Ramsey School District isimproving or deteriorating.
The statement of activities presents information showing how the government’s net positionchanged during the most recent fiscal year. All changes in net position are reported as soon asthe underlying event giving rise to the change occurs, regardless of the timing of related cashflows. Thus, revenues and expenses are reported in this statement for some items that will onlyresult in cash flows in future fiscal periods.
Both of the district-wide financial statements distinguish functions of the Borough of RamseySchool District that are principally supported by taxes and intergovernmental revenues(governmental activities) from other functions that are intended to recover all or a significantportion of their costs through user fees and charges (business-type activities). The governmentalactivities of the Borough of Ramsey School District include instruction, support services andspecial schools. The business-type activities of the Borough of Ramsey School District includethe food service program.
-13-
RAMSEY BOARD OF EDUCATIONRAMSEY, NJ
MANAGEMENT’S DISCUSSION AND ANALYSISFOR THE FISCAL YEAR ENDED JUNE 30, 2015
UNAUDITED (CONTINUED)
USING THIS ANNUAL REPORT, (continued)
Fund Financial Statements
A fund is a grouping of related accounts that is used to maintain control over resources that havebeen segregated for specific activities or objectives. The Borough of Ramsey School District,like other state and local governments, uses fund accounting to ensure and demonstratecompliance with finance-related legal requirements. All of these funds of the Borough ofRamsey School District can be divided into three categories: governmental funds, proprietaryfunds, and fiduciary funds.
Governmental Funds
Governmental funds are used to account for essentially the same functions reported asgovernmental activities in the district-wide financial statements. However, unlike the district-wide financial statements, governmental fund financial statements focus on near-term inflowsand outflow of spendable resources, as well as on balances of spendable resources available atthe end of the fiscal year. Such information may be useful in evaluating a District’s near-termfinancing requirements.
Because the focus of governmental funds is narrower than that of the district-wide financialstatements, it is useful to compare the information presented for governmental funds with similarinformation presented for governmental activities in the district-wide financial statements. Bydoing so, readers may better understand the long-term impact of the District’s near-termfinancing decisions. Both the governmental fund balance sheet and the governmental fundstatement of revenues, expenditures, and changes in fund balances provide a reconciliation tofacilitate this comparison between governmental funds and governmental activities.
The Borough of Ramsey School District maintains four individual governmental funds. Information is presented separately in the governmental fund balance sheet and in thegovernmental fund statement of revenues, expenditures, and changes in fund balances for thegeneral fund, special revenue fund, capital projects fund, and debt service fund which are allconsidered to be major funds.
The Borough of Ramsey School District adopts annual appropriated budgets for its governmentalfunds except for the capital projects fund. A budgetary comparison statement has been providedfor the general fund, special revenue fund and debt service fund to demonstrate compliance withtheir budgets.
-14-

RAMSEY BOARD OF EDUCATIONRAMSEY, NJ
MANAGEMENT’S DISCUSSION AND ANALYSISFOR THE FISCAL YEAR ENDED JUNE 30, 2015
UNAUDITED (CONTINUED)
USING THIS ANNUAL REPORT, (continued)
Proprietary Funds
The Borough of Ramsey School District maintains one proprietary fund. Enterprise funds areused to report the same functions presented as business-type activities in the district-widefinancial statements. The Borough of Ramsey School District uses enterprise funds to accountfor its food service program.
Proprietary funds provide the same type of information as the district-wide financial statements,only in more detail. The proprietary fund financial statements provide information for the localdistrict services operations.
Fiduciary Funds
Fiduciary funds are used to account for resources held for the benefit of parties outside theDistrict. Fiduciary funds are not reflected in the district-wide financial statements because theresources of those funds are not available to support the Borough of Ramsey School District’sown programs. The accounting used for fiduciary funds is much like that used for proprietaryfunds.
Notes to the Financial Statements
The notes provide additional information that is essential to a full understanding of the dataprovided in the district-wide and fund financial statements.
Other Information
In addition to the basic financial statements and accompanying notes, this report also presentscertain required supplementary information concerning budgetary information for the District’smajor funds.
Our auditor has provided assurance in his independent auditor’s report, located immediatelypreceding this Management’s Discussion and Analysis, that the Basic Financial Statements arefairly stated. Varying degrees of assurance are being provided by the auditor regarding theRequired Supplemental Information and the Supplemental Information identified above. A userof this report should read the independent auditor’s report carefully to ascertain the level ofassurance being provided for each of the other parts in the Financial Section.
-15-

RAMSEY BOARD OF EDUCATIONRAMSEY, NJ
MANAGEMENT’S DISCUSSION AND ANALYSISFOR THE FISCAL YEAR ENDED JUNE 30, 2015
UNAUDITED (CONTINUED)
DISTRICT-WIDE FINANCIAL ANALYSIS
The Statement of Net Position provides the perspective of the District as a whole. Net positionmay, over time, serve as a useful indicator of a government’s financial position.
The District’s financial position is the product of several financial transactions including the netresults of activities, the acquisition and payment of debt, the acquisition and disposal of capitalassets and the depreciation of capital assets.
The School District’s net position was $16,255,569 at June 30, 2015 and $27,549,311 at June 30,2014, respectively. Restricted items of net position are reported separately to show legalconstraints that limit the School District’s ability to use those items of net position for day-to-day operations. Our analysis below focuses on the net position for 2015 compared to 2014(Table 1) and change in net position (Table 2) of the School District.
-16-

RAMSEY BOARD OF EDUCATIONRAMSEY, NJ
MANAGEMENT’S DISCUSSION AND ANALYSISFOR THE FISCAL YEAR ENDED JUNE 30, 2015
UNAUDITED (CONTINUED)
DISTRICT-WIDE FINANCIAL ANALYSIS, (continued)
Table 1
Net PositionJune 30,
Governmental Activities Business-Type Activities Total
2015Restated
2014 2015Restated
2014 2015Restated
2014
Assets
Current and Other Assets 11,748,962 13,563,290 219,928 205,444 11,968,890 13,768,734
Capital Assets 35,413,437 35,018,002 70,570 60,889 35,484,007 35,078,891
Total Assets 47,162,399 48,581,292 290,498 266,333 47,452,897 48,847,625
Deferred Outflows:
Unamortized Bond Issuance Costs 120,698 137,941 120,698 137,941
Differed Outflows of Resources
Related to PERS 1,522,924 1,522,924
Total Deferred Outflows 1,643,622 137,941 1,643,622 137,941
Liabilities
Current Liabilities 1,432,278 2,770,024 66,654 1,498,932 2,770,024
Noncurrent Liabilities 29,476,275 17,040,475 29,476,275 17,040,475
Total Liabilities 30,908,553 19,810,499 66,654 30,975,207 19,810,499
Deferred Inflows:
Unamortized Bond Issuance
Premiums 973,637 1,112,728 973,637 1,112,728
Deferred Inflows of Resources
Related to PERS 867,487 867,487
Total Deferred Inflows 1,841,124 1,112,728 1,841,124 1,112,728
Net Assets
Net Investment in Capital Assets 20,645,498 18,278,215 45,951 46,391 20,691,449 18,324,606
Restricted 10,271,833 9,794,237 10,271,833 9,794,237
Unrestricted (14,860,987) (276,446) 153,274 205,444 (14,707,713) (71,002)
Total Net Position 16,056,344 27,796,006 199,225 251,835 16,255,569 28,047,841
-17-
RAMSEY BOARD OF EDUCATIONRAMSEY, NJ
MANAGEMENT’S DISCUSSION AND ANALYSISFOR THE FISCAL YEAR ENDED JUNE 30, 2015
UNAUDITED (CONTINUED)
DISTRICT-WIDE FINANCIAL ANALYSIS, (continued)
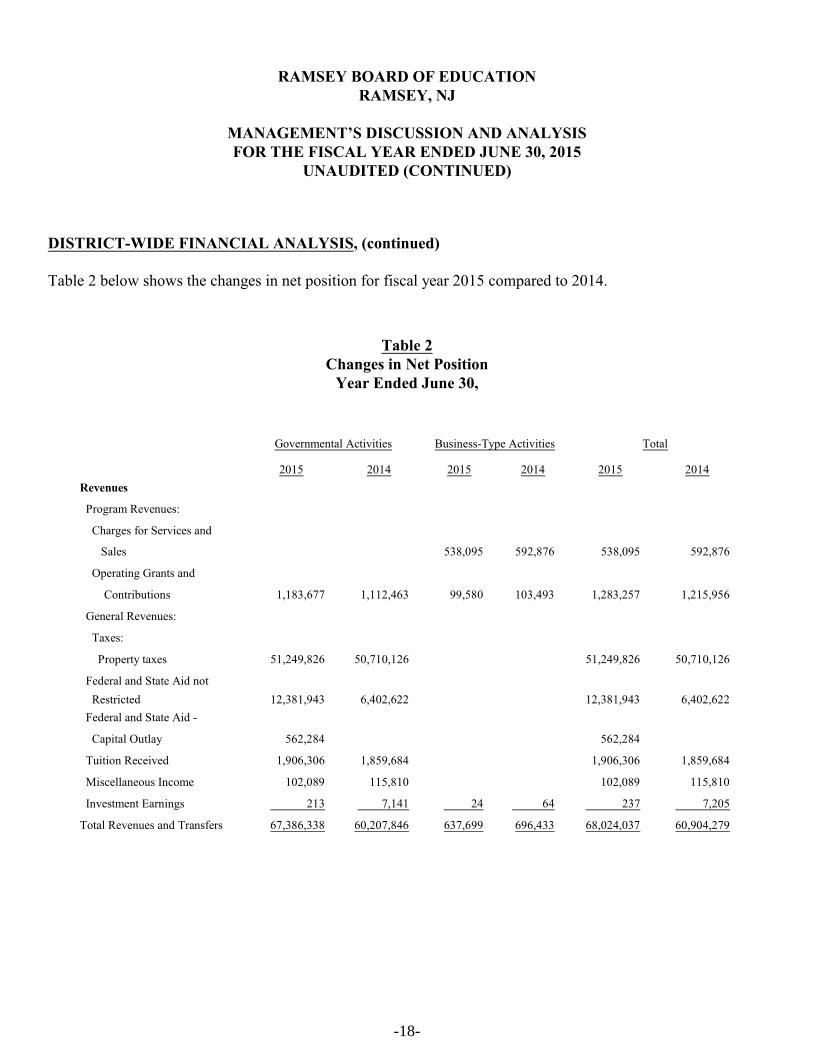
Table 2 below shows the changes in net position for fiscal year 2015 compared to 2014.
Table 2Changes in Net Position
Year Ended June 30,
Governmental Activities Business-Type Activities Total
2015 2014 2015 2014 2015 2014
Revenues
Program Revenues:
Charges for Services and
Sales 538,095 592,876 538,095 592,876
Operating Grants and
Contributions 1,183,677 1,112,463 99,580 103,493 1,283,257 1,215,956
General Revenues:
Taxes:
Property taxes 51,249,826 50,710,126 51,249,826 50,710,126
Federal and State Aid not
Restricted 12,381,943 6,402,622 12,381,943 6,402,622
Federal and State Aid -
Capital Outlay 562,284 562,284
Tuition Received 1,906,306 1,859,684 1,906,306 1,859,684
Miscellaneous Income 102,089 115,810 102,089 115,810
Investment Earnings 213 7,141 24 64 237 7,205
Total Revenues and Transfers 67,386,338 60,207,846 637,699 696,433 68,024,037 60,904,279
-18-
RAMSEY BOARD OF EDUCATIONRAMSEY, NJ
MANAGEMENT’S DISCUSSION AND ANALYSISFOR THE FISCAL YEAR ENDED JUNE 30, 2015
UNAUDITED (CONTINUED)
DISTRICT-WIDE FINANCIAL ANALYSIS, (continued)
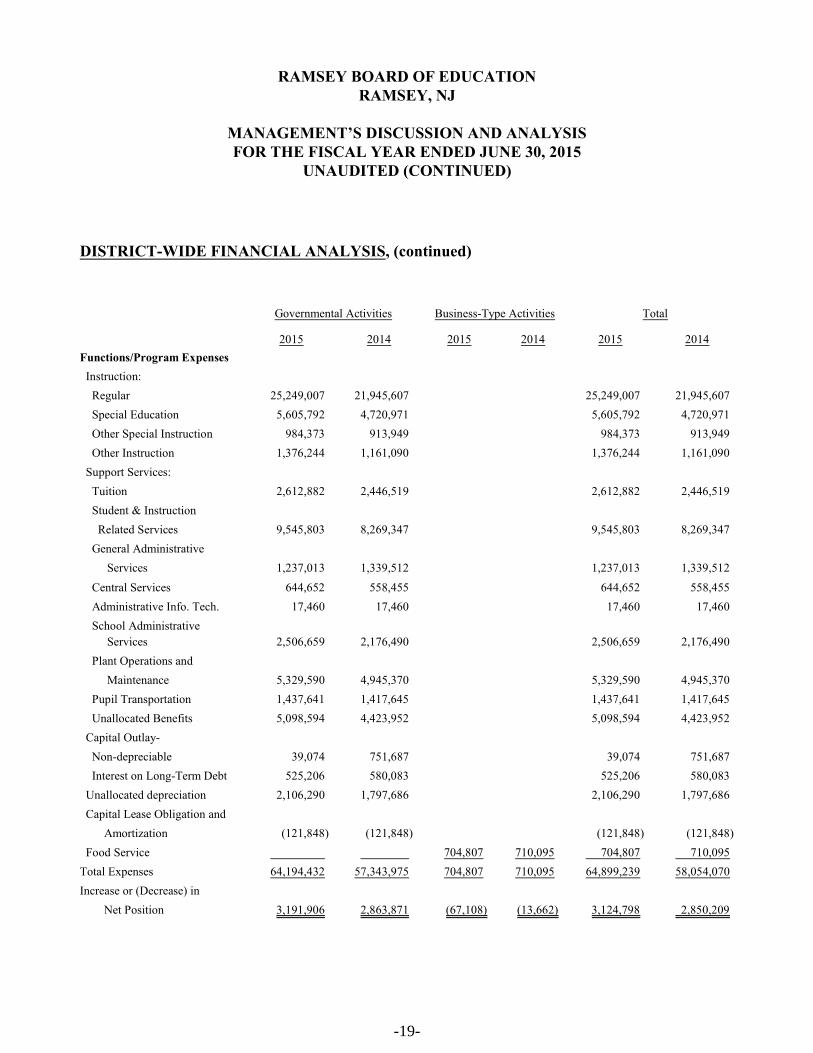
Governmental Activities Business-Type Activities Total
2015 2014 2015 2014 2015 2014
Functions/Program Expenses
Instruction:
Regular 25,249,007 21,945,607 25,249,007 21,945,607
Special Education 5,605,792 4,720,971 5,605,792 4,720,971
Other Special Instruction 984,373 913,949 984,373 913,949
Other Instruction 1,376,244 1,161,090 1,376,244 1,161,090
Support Services:
Tuition 2,612,882 2,446,519 2,612,882 2,446,519
Student & Instruction
Related Services 9,545,803 8,269,347 9,545,803 8,269,347
General Administrative
Services 1,237,013 1,339,512 1,237,013 1,339,512
Central Services 644,652 558,455 644,652 558,455
Administrative Info. Tech. 17,460 17,460 17,460 17,460
School Administrative
Services 2,506,659 2,176,490 2,506,659 2,176,490
Plant Operations and
Maintenance 5,329,590 4,945,370 5,329,590 4,945,370
Pupil Transportation 1,437,641 1,417,645 1,437,641 1,417,645
Unallocated Benefits 5,098,594 4,423,952 5,098,594 4,423,952
Capital Outlay-
Non-depreciable 39,074 751,687 39,074 751,687
Interest on Long-Term Debt 525,206 580,083 525,206 580,083
Unallocated depreciation 2,106,290 1,797,686 2,106,290 1,797,686
Capital Lease Obligation and
Amortization (121,848) (121,848) (121,848) (121,848)
Food Service 704,807 710,095 704,807 710,095
Total Expenses 64,194,432 57,343,975 704,807 710,095 64,899,239 58,054,070
Increase or (Decrease) in
Net Position 3,191,906 2,863,871 (67,108) (13,662) 3,124,798 2,850,209
-19-
RAMSEY BOARD OF EDUCATIONRAMSEY, NJ
MANAGEMENT’S DISCUSSION AND ANALYSISFOR THE FISCAL YEAR ENDED JUNE 30, 2015
UNAUDITED (CONTINUED)
DISTRICT-WIDE FINANCIAL ANALYSIS, (continued)
Governmental and Business-Type Activities
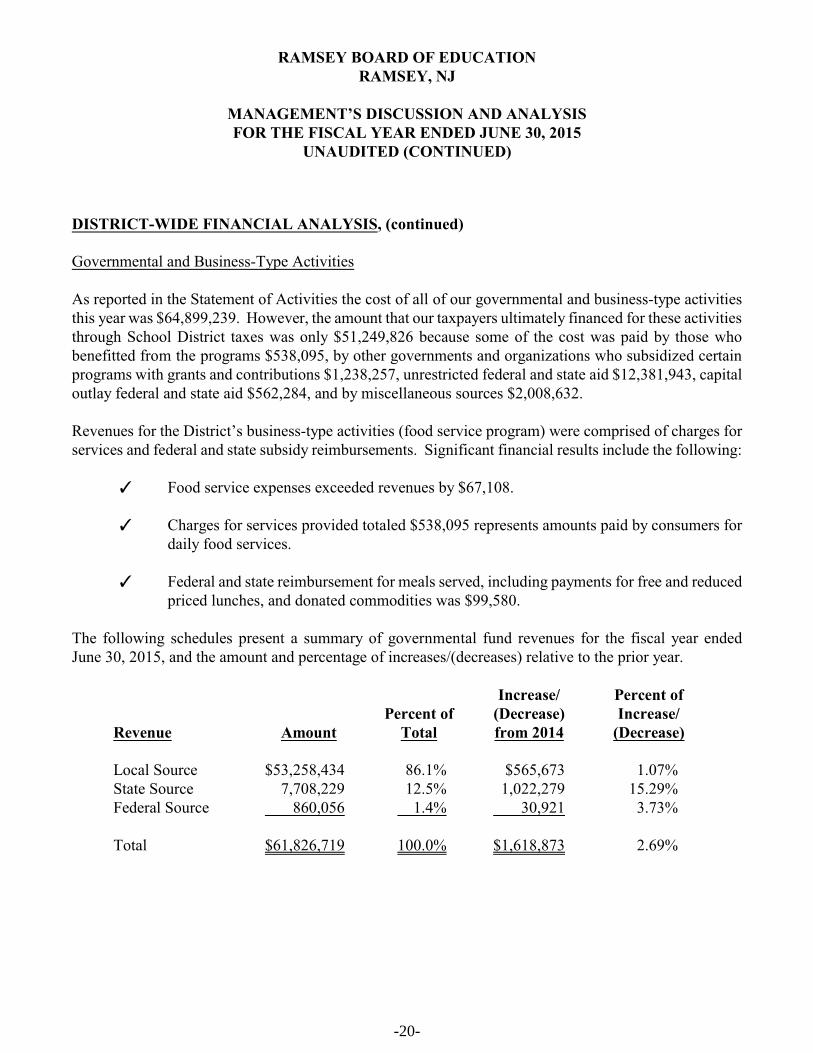
As reported in the Statement of Activities the cost of all of our governmental and business-type activitiesthis year was $64,899,239. However, the amount that our taxpayers ultimately financed for these activitiesthrough School District taxes was only $51,249,826 because some of the cost was paid by those whobenefitted from the programs $538,095, by other governments and organizations who subsidized certainprograms with grants and contributions $1,238,257, unrestricted federal and state aid $12,381,943, capitaloutlay federal and state aid $562,284, and by miscellaneous sources $2,008,632.
Revenues for the District’s business-type activities (food service program) were comprised of charges forservices and federal and state subsidy reimbursements. Significant financial results include the following:
T Food service expenses exceeded revenues by $67,108.
T Charges for services provided totaled $538,095 represents amounts paid by consumers fordaily food services.
T Federal and state reimbursement for meals served, including payments for free and reducedpriced lunches, and donated commodities was $99,580.
The following schedules present a summary of governmental fund revenues for the fiscal year endedJune 30, 2015, and the amount and percentage of increases/(decreases) relative to the prior year.
Revenue AmountPercent of
Total
Increase/(Decrease)from 2014
Percent ofIncrease/
(Decrease)
Local Source $53,258,434 86.1% $565,673 1.07%State Source 7,708,229 12.5% 1,022,279 15.29%Federal Source 860,056 1.4% 30,921 3.73%
Total $61,826,719 100.0% $1,618,873 2.69%
-20-

RAMSEY BOARD OF EDUCATIONRAMSEY, NJ
MANAGEMENT’S DISCUSSION AND ANALYSISFOR THE FISCAL YEAR ENDED JUNE 30, 2015
UNAUDITED (CONTINUED)
DISTRICT-WIDE FINANCIAL ANALYSIS, (continued)
Expenditures AmountPercent of
Total
Increase/(Decrease)from 2014
Percent ofIncrease/
(Decrease)
Current Expenditures:Instruction $24,883,607 40.4% $664,541 2.74%Undistributed 31,297,631 50.7% 1,180,330 3.92%
Debt Service 2,392,164 3.9% (29,732) (1.23)%Capital Outlay 3,053,827 5.0% 1,814,410 146.39%
Total $61,627,229 100.0% $3,629,549 6.26%
Changes in expenditures were the result of varying factors. Current expense undistributed increased due tosignificant health insurance cost increases combined with increased student special education enrollment.
MAJOR GOVERNMENTAL FUNDS BUDGETING AND OPERATING HIGHLIGHTS
The School District’s budgets are prepared according to New Jersey law, and are based on accounting forcertain transactions on a basis of cash receipts, disbursements and encumbrances. The most significantbudgeted funds are the general fund and the special revenue fund.
During the fiscal year ended June 30, 2015, the School District amended the budgets of these majorgovernmental funds several times. Revisions in the budget were made to recognize revenues that were notanticipated and to prevent over-expenditures in specific line item accounts. Several of these revisions bearnotation:
• TPAF, which is the state’s contribution to the pension fund, is neither a revenue item nor anexpenditures item to the district but is required to be reflected in the financial statements.
• The special revenue fund was increased by $109,459 for increases in federal and state grantawards.
-21-

RAMSEY BOARD OF EDUCATIONRAMSEY, NJ
MANAGEMENT’S DISCUSSION AND ANALYSISFOR THE FISCAL YEAR ENDED JUNE 30, 2015
UNAUDITED (CONTINUED)
General Fund
The general fund actual revenue was $57,818,296. That amount is $5,693,535 above the final amendedbudget of $52,124,761. The variance between the actual revenues and final budget was the result of non-budgeted on-behalf payments of $5,193,741 for TPAF social security reimbursements and on-behalf pensionpayments, a reduction in other state and federal aids of $(29,601) and an excess of $529,395 in miscellaneousanticipated revenues.
The actual expenditures of the general fund were $55,709,966 including transfers which is $2,583,631 abovethe final amended budget of $55,126,335. The variance between the actual expenditures and final budget wasdue to non-budget on-behalf TPAF social security and pension payments of $5,193,741, and $2,610,110unexpended budgeted funds.
General fund had total revenues of $57,818,296 and total expenditures and transfers of $57,709,966 with anending fund balance of $10,990,325.
Special Revenue Fund
The special revenue fund actual revenue was $1,183,677. That amount is above the original budget estimateof $1,139,937 and below the final amended budget of $1,249,396. The $109,459 variance between theoriginal and final budget was due to additional state grant monies awarded and an increase in federal awardsto the District after the original budget was approved. The $(65,719) variance between the final amendedbudget and the June 30, 2015 actual results was due to the deferral of State grants received in the currentfiscal year to be spent in the next fiscal year and miscellaneous receivables.
The actual expenditures of the special revenue fund were $1,183,677, which is above the original budget of$1,139,937 and below the final amended budget of $1,249,396. The $109,459 variance between the originaland final budget was due to a reduction in federal grants awarded to the District after the original budget wasapproved. The $(65,719) variance between the final amended budget and the June 30, 2015 actual resultswas due to the anticipation of fully expending federal and state grant programs. Expenditures will be incurredin the next fiscal year.
-22-

RAMSEY BOARD OF EDUCATIONRAMSEY, NJ
MANAGEMENT’S DISCUSSION AND ANALYSISFOR THE FISCAL YEAR ENDED JUNE 30, 2015
UNAUDITED (CONTINUED)
CAPITAL ASSETS AND DEBT ADMINISTRATION
Capital Assets
At the end of fiscal year 2015 the School District had $64,563,389 invested in sites, buildings, equipment. Of this amount $29,104,001 in depreciation has been taken over the years. We currently have a net bookvalue of $35,459,388. Table 3 shows fiscal year 2015 balances compared to 2014.
Table 3
Capital Assets at June 30,
(Net of Depreciation)
Governmental Activities Business-Type Activities Total
2015
Restated
2014 2015
Restated
2014 2015
Restated
2014
Sites and Improvements $4,425,700 $4,425,700 $ $ $4,425,700 $4,425,700
Buildings and
Improvements 28,611,976 27,168,178 28,611,976 27,168,178
Furniture, Equipment
and Vehicles 2,375,761 2,911,096 45,951 60,889 2,421,712 2,971,985
$35,413,437 $34,504,974 $45,951 $60,889 $35,459,388 $34,565,863
Debt Administration
At June 30, 2015, the District had $29,476,275 of long-term debt. Of this amount, $1,004,798 is forcompensated absences, $13,915,000 is school improvement serial bonds issues dated April 4, 2012, and$14,556,477 is for net pension liability.
Table 4Outstanding Serial Bonds at June 30,
Governmental Activities2015 2014
School Refunding Bonds - 2012 $13,915,000 $15,765,000
-23-

RAMSEY BOARD OF EDUCATIONRAMSEY, NJ
MANAGEMENT’S DISCUSSION AND ANALYSISFOR THE FISCAL YEAR ENDED JUNE 30, 2015
UNAUDITED (CONTINUED)
ECONOMIC FACTORS AND NEXT YEAR’S BUDGETS
The economy in the State of New Jersey is slowly improving. The current State of New Jersey revenueestimates are at the point that the legislature and governor have approved a State Aid funding bill for the2015-2016 school year that is greater than the level of the 2014-2015 school year.
These factors were considered in preparing the Borough of Ramsey School District’s budgets for the 2015-2016 fiscal year.
REQUESTS FOR INFORMATION
This financial report is designed to provide a general overview of the Ramsey Board of Education’s financesfor all those with an interest in the government’s finances. Questions concerning any of the informationprovided in this report or requests for additional information should be addressed to:
Robert J. MarcotulliAssistant Superintendent-Business / Board SecretaryRamsey Board of Education266 East Main StreetRamsey, NJ 07446
-24-

BASIC FINANCIAL STATEMENTS

DISTRICT-WIDE FINANCIAL STATEMENTS

Exhibit A-1
RAMSEY BOARD OF EDUCATIONStatement of Net Position
June 30, 2015
Governmental Business-typeActivities Activities Total
ASSETSCash and cash equivalents 74,445 74,445 Investments 239,693 239,693 Receivables, net 6,931,646 6,040 6,937,686 Internal balances (130,221) 130,221 - Inventory 9,222 9,222 Restricted assets: Capital reserve account - cash 4,707,844 4,707,844 Capital assets, net: Land 4,425,700 4,425,700 Other capital assets, net 30,987,737 45,951 31,033,688 Total Assets 47,162,399 265,879 47,428,278
Deferred Outflow of Resources: Unamortized bond issuance costs 120,698 120,698 Deferred outflows of resources related to PERS 1,522,924
Total Deferred Outflows 1,643,622 1,643,622
LIABILITIESDeficit in cash and cash equivalents 453,506 453,506 Accounts payable and accrued liabilities 910,280 66,654 976,934 Payable to state government 65,720 65,720 Unearned revenue 2,772 2,772 Noncurrent liabilities: Due within one year 1,850,000 1,850,000 Due beyond one year 27,626,275 27,626,275 Total liabilities 30,908,553 66,654 30,975,207
Deferred Inflow of Resources: Unamortized bond issuance premiums 973,637 973,637 Deferred inflows of resources related to PERS 867,487 867,487
Total Deferred Inflows 1,841,124 1,841,124
NET POSITIONNet investment in capital assets 20,645,498 45,951 20,691,449 Restricted for: Debt service 12,235 12,235 Capital projects 5,035,299 5,035,299 Other purposes 5,224,299 5,224,299 Unrestricted (Deficit) (14,860,987) 153,274 (14,707,713) Total net position 16,056,344 199,225 16,255,569
The accompanying Notes to Basic Financial Statements are an integral part of this statement.
-25-

Exh
ibit
A-2
RA
MS
EY
BO
AR
D O
F E
DU
CA
TIO
NS
tate
men
t of
Act
ivit
ies
Fis
cal Y
ear
En
ded
Ju
ne
30, 2
015
Net
(E
xpen
se)
Rev
enu
e an
dP
rogr
am R
even
ues
Ch
ange
s in
Net
Pos
itio
nIn
dir
ect
Op
erat
ing
Exp
ense
sC
har
ges
for
Gra
nts
an
dG
over
nm
enta
lB
usi
nes
s-ty
pe
Fu
nct
ion
s/P
rogr
ams
Exp
ense
sA
lloca
tion
Ser
vice
sC
ontr
ibu
tion
sA
ctiv
itie
sA
ctiv
itie
sT
otal
G
over
nmen
tal a
ctiv
ities
:
In
stru
ctio
n:
Reg
ular
18,9
34,3
93
6,31
4,61
4
746,
907
(24,
502,
100)
(24,
502,
100)
Spec
ial e
duca
tion
4,11
9,09
7
1,
486,
695
(5
,605
,792
)
(5
,605
,792
)
O
ther
spe
cial
inst
ruct
ion
757,
983
22
6,39
0
(9
84,3
73)
(9
84,3
73)
O
ther
inst
ruct
ion
1,07
2,13
4
30
4,11
0
(1
,376
,244
)
(1
,376
,244
)
Supp
ort s
ervi
ces:
In
stru
ctio
n2,
612,
882
(2,6
12,8
82)
(2,6
12,8
82)
Stud
ent &
inst
ruct
ion
rela
ted
serv
ices
7,24
9,73
6
2,
296,
067
43
6,77
0
(9
,109
,033
)
(9
,109
,033
)
G
ener
al a
dmin
istr
ativ
e se
rvic
es1,
088,
766
148,
247
(1,2
37,0
13)
(1,2
37,0
13)
Scho
ol a
dmin
istr
ativ
e se
rvic
es1,
890,
814
615,
845
(2,5
06,6
59)
(2,5
06,6
59)
Cen
tral
Ser
vice
s48
8,16
2
156,
490
(644
,652
)
(644
,652
)
Adm
inis
trat
ive
info
rmat
ion
tech
.17
,460
(1
7,46
0)
(1
7,46
0)
P
lant
ope
ratio
ns a
nd m
aint
enan
ce4,
479,
237
850,
353
(5,3
29,5
90)
(5,3
29,5
90)
Pup
il tr
ansp
orta
tion
1,38
1,06
2
56
,579
(1,4
37,6
41)
(1,4
37,6
41)
Una
lloca
ted
bene
fits
5,09
8,59
4
(5
,098
,594
)
(5
,098
,594
)
Cap
ital o
utla
y -
non-
depr
ecia
ble
39,0
74
(39,
074)
(39,
074)
In
tere
st o
n lo
ng-t
erm
deb
t52
5,20
6
(525
,206
)
(525
,206
)
U
nallo
cate
d de
prec
iatio
n2,
106,
290
(2,1
06,2
90)
(2,1
06,2
90)
A
mor
tizat
ion
(121
,848
)
12
1,84
8
12
1,84
8
T
otal
gov
ernm
enta
l act
iviti
es51
,739
,042
12
,455
,390
-
1,
183,
677
(6
3,01
0,75
5)
-
(6
3,01
0,75
5)
B
usin
ess-
type
act
iviti
es:
Food
Ser
vice
704,
807
53
8,09
5
99
,580
(67,
132)
(6
7,13
2)
T
otal
bus
ines
s-ty
pe a
ctiv
ities
704,
807
53
8,09
5
99
,580
(67,
132)
(6
7,13
2)
Tot
al p
rim
ary
gove
rnm
ent
52,4
43,8
49
538,
095
1,28
3,25
7
(63,
010,
755)
(67,
132)
(6
3,07
7,88
7)
Gen
eral
rev
enue
s:T
axes
:
Lev
ied
for
gene
ral p
urpo
ses
48,9
71,7
45
48
,971
,745
Tax
es le
vied
for
deb
t ser
vice
2,27
8,08
1
2,27
8,08
1
Fe
dera
l and
Sta
te a
id n
ot r
estr
icte
d 12
,381
,943
12,3
81,9
43
Fede
ral a
nd S
tate
aid
- C
apita
l Out
lay
562,
284
562,
284
T
uitio
n re
ceiv
ed17
2,79
9
17
2,79
9
Tut
ion
from
Oth
er L
EA
s W
ithin
the
Stat
e1,
733,
507
1,
733,
507
Tra
nspo
rtat
ion
Fees
30,9
41
30
,941
In
vest
men
t Ear
ning
s21
3
24
237
M
isce
llane
ous
Inco
me
71,1
48
71
,148
Tot
al g
ener
al r
even
ues,
spe
cial
item
s, e
xtra
ordi
nary
item
s an
d tr
ansf
ers
66,2
02,6
61
24
66,2
02,6
85
C
hang
e in
Net
Pos
ition
3,19
1,90
6
(67,
108)
3,
124,
798
Net
Pos
ition
—be
ginn
ing
(res
tate
d)12
,864
,438
266,
333
13
,130
,771
N
et P
ositi
on—
endi
ng16
,056
,344
199,
225
16
,255
,569
Th
e ac
com
pan
yin
g N
otes
to
Bas
ic F
inan
cial
Sta
tem
ents
are
an
inte
gral
par
t of
th
is s
tate
men
t.
-26-
FUND FINANCIAL STATEMENTS

Exhibit B-1
RAMSEY BOARD OF EDUCATIONBalance Sheet
Governmental FundsJune 30, 2015
Special Capital Debt TotalGeneral Revenue Projects Service Governmental
Fund Fund Fund Fund Funds
ASSETS Cash and cash equivalents
Checking 5,576,053 12,022 5,588,075 Investments 239,693 239,693
Accounts Receivable -Intergovernmental - State 437,264 6,129,556 6,566,820 Intergovernmental - Federal 244,459 244,459
Interfund receivables 178,739 213 178,952 Other receivables 120,367 120,367 Restricted cash and cash equivalents:
Capital Reserve 4,707,844 4,707,844
Total assets 11,020,267 244,459 6,369,249 12,235 17,646,210
LIABILITIES AND FUND BALANCES Liabilities: Deficit in cash and cash equivalents 6,041,581 6,041,581 Intergovernmental payable:
State 65,720 65,720 Interfund Payable 130,221 178,739 213 309,173 Unearned revenue 2,772 2,772
Total liabilities 132,993 244,459 6,041,794 - 6,419,246
Fund Balances: Restricted for: Excess Surplus - current year 2,686,088 2,686,088 Excess Surplus - prior year - designated for
subsequent year's expenditures 2,352,131 2,352,131 Capital reserve account 4,707,844 4,707,844 Assigned to: Designated by the BOE for
subsequent year's expenditures 186,080 186,080 Capital projects fund 327,455 327,455 Debt service fund 12,235 12,235 Unassigned: General Fund 955,131 955,131
Total Fund balances 10,887,274 - 327,455 12,235 11,226,964
Total liabilities and fund balances 11,020,267 244,459 6,369,249 12,235
Amounts reported for governmental activities in the statement of net position (A-1) are different because:
Capital assets used in governmental activities are not financial resources and therefore are not reported in the funds. The cost of the assets is $64,115,295 and the accumulated depreciation is $28,701,858. 35,413,437
Accounts payable for subsequent Pension payment is not a payable in the funds (693,030)
Bond issuance premium is recorded as revenue in the Governmental Funds in the year of receipt. The original premium is $1,390,910 and and accumulated amortization is $417,273 (973,637)
Bond issuance costs are reported as expenditures in the Governmental Funds in the year of the expenditure. The costs are $172,427 and accumulated amortization is $51,729 120,698
Deferred outflows and inflows of resources are applicable to future periods and therefore are not reported in the funds. Deferred outflows of resources related to PERS Pension Liability 1,522,924 Deferred inflows of resources related to PERS Pension Liability (867,487)
Accrued interest liabilities are not due and payable in the current period and therefore are not reported as liabilties in the funds (see Note 8) (217,250)
Long-term liabilities are not due and payable in the current period and therefore are not reported as liabilties in the funds (see Note 8) (29,476,275)
Net position of governmental activities 16,056,344
The accompanying Notes to Basic Financial Statements are an integral part of this statement.
-27-

Exhibit B-2
RAMSEY BOARD OF EDUCATIONStatement of Revenues, Expenditures, and Changes in Fund Balances
Governmental FundsFiscal Year Ended June 30, 2015
Special Capital Debt TotalGeneral Revenue Projects Service Governmental
Fund Fund Fund Fund Funds
REVENUESLocal sources: Local tax levy 48,971,745 2,278,081 51,249,826 Tuition charges 172,799 172,799 Tuition from Other LEAs Within the State 1,733,507 1,733,507
Transportation Fees 30,941 30,941 Interest on Investments 213 213 Miscellaneous 71,148 71,148
Total - Local Sources 50,980,140 - 213 2,278,081 53,258,434
State sources 6,819,216 326,729 562,284 7,708,229 Federal sources 3,108 856,948 860,056
Total revenues 57,802,464 1,183,677 562,497 2,278,081 61,826,719
EXPENDITURESCurrent: Regular instruction 18,187,486 746,907 18,934,393 Special education instruction 4,119,097 4,119,097 Other special instruction 757,983 757,983 School sponsored/other instructional 1,072,134 1,072,134 Support services and undistributed costs: Instruction 2,612,882 2,612,882 Attendance and social work services 43,686 43,686 Health services 470,360 470,360 Student & instruction related services 6,298,920 436,770 6,735,690 General administrative services 1,088,766 1,088,766 School administrative services 1,890,814 1,890,814 Central services 488,162 488,162 Administrative information tech. 17,460 17,460 Plant operations and maintenance 4,479,237 4,479,237 Pupil transportation 1,381,062 1,381,062 Unallocated benefits 6,895,771 6,895,771 On-behalf contributions 5,193,741 5,193,741 Debt Service: Principal 1,850,000 1,850,000 Interest and charges 542,164 542,164 Capital outlay 259,948 2,793,879 3,053,827
Total expenditures 55,257,509 1,183,677 2,793,879 2,392,164 61,627,229
Excess (Deficiency) of revenues over expenditures 2,544,955 - (2,231,382) (114,083) 199,490
OTHER FINANCING SOURCES (USES)Transfers out - Capital Reserves (2,452,457) (2,452,457) Transfers out - Debt Service (213) (213) Transfers in - Capital Projects 213 213 Transfers in - Capital Projects 2,452,457 2,452,457
Total other financing sources and uses (2,452,457) - 2,452,244 213 -
Net change in fund balances 92,498 - 220,862 (113,870) 199,490
Fund balance—July 1 10,794,776 - 106,593 126,105 11,027,474
Fund balance—June 30 10,887,274 - 327,455 12,235 11,226,964
The accompanying Notes to Basic Financial Statements are an integral part of this statement.
-28-

Exhibit B-3
RAMSEY BOARD OF EDUCATIONReconciliation of the Statement of Revenues, Expenditures,
and Changes in Fund Balances of Governmental Fundsto the Statement of Activities
Fiscal Year Ended June 30, 2015
Total net change in fund balances - governmental funds (from B-2) 199,490
Amounts reported for governmental activities in the statementof activities (A-2) are different because:
Capital outlays are reported in governmental funds as expenditures. However, in the statement of activities, the cost of those assets is allocated over their estimated useful lives as depreciation expense. This is the amount by which capital outlays exceeded depreciation in the period.
Depreciation expense (2,106,290) Depreciable outlays 3,014,753
908,463
Repayment of long-term debt is reported as an expenditure in the governmental funds, but the repayment reduces long-term liabilities in the statement of net position and is not reported in the statement of activities. In the current year , these amounts consist of: Serial bond obligations 1,850,000
In the statement of activities, interest on long-term debt in the statement of activities is accrued, regardless of when due. In the governmental funds, interest is reported when due. The change in interest is an adjustment in the reconciliation. Prior Year 234,208 Current Year (217,250)
16,958
In the statement of activities, certain operating expenses, e.g., compensated absences (vacations) are measured by the amounts earned during the year. In the governmental funds, however, expenditures for these items are reported in the amount of financial resources used (paid). When the earned amount exceeds the paid amount, the difference is reduction in the reconciliation (-); when the paid amount exceeds the earned amount the difference is an addition to the reconciliation (+).
Decrease in compensated absences payable 270,677
District pension contributions are reported as expenditures in the governmental funds when made. However, per GASB No. 68 they are reported as deferred outflows of resources in the Statement of Net Position because the reported net pension liability is measured a year before the District's report date. Pension expense, which is the change in the net pension liability adjusted for changed in deferred outflows and inflows of resources related to pensions, is reported in the Statement of Activities.
District Pension Contributions 640,940Less: Pension Expense (816,470)
(Increase)/Decrease in Pension Expense (175,530)
Per GASB No. 68, Non-employer contributing entities are required to record any increases in revenue and expense for On-behalf TPAF pension payments paid by the State of New Jersey on the Statement of Activities that are in excess of those amounts reported in the fund financial statements.
Increase in On-behalf State Aid TPAF Pension 5,559,619Increase in On-behalf TPAF Pension Expense (5,559,619)
The governmental funds report the effect of bond premiums when debt is first issued. Whereas these amounts are deferred and amortized in the Statement of Activities (+) 139,091
The governmental funds report the effect of issuance costs when debt is first issued. Whereas these amounts are deferred and amortized in the Statement of Activities (-) (17,243)
Change in net position of governmental activities 3,191,906
The accompanying Notes to Basic Financial Statements are an integral part of this statement.
-29-

Exhibit B-4
Food ServiceProgram
ASSETS
Current assets:Cash and cash equivalents 74,445 Accounts receivable:
State 305 Federal 5,735 Interfund - General Fund 130,221
Inventories 9,222 Total current assets 219,928
Noncurrent assets:Capital assets: Equipment 448,094 Less accumulated depreciation (402,143) Total capital assets (net of accumulated depreciation) 45,951 Total assets 265,879
Current liabilities:Accounts payable 66,654 Total current liabilities 66,654
NET POSITIONNet investment in capital assets 45,951 Unrestricted 153,274
Total net position 199,225
The accompanying Notes to Basic Financial Statements are an integral part of this statement.
RAMSEY BOARD OF EDUCATIONStatement of Net Position
Proprietary FundsJune 30, 2015
-30-

Exhibit B-5
Food ServiceProgram
Operating revenues:Charges for services: Daily sales - reimbursable programs 173,533 Daily sales - non-reimbursable programs 289,964 Special functions 74,598 Total operating revenues 538,095
Operating expenses:Cost of sales 250,147 Salaries 217,504 Benefits 58,773 Supplies and materials 45,083 Purchased property services 65,000 Cleaning repair & maintenance 53,362 Depreciation 14,938 Total Operating Expenses 704,807 Operating income (loss) (166,712)
Nonoperating revenues (expenses):State sources: State school lunch program 3,262 Federal sources: National school lunch program 61,352 Food distribution program 34,966 Interest Income 24 Total nonoperating revenues (expenses) 99,604 Income (loss) before contributions & transfers (67,108)
Change in net position (67,108) Total net position—beginning (restated) 266,333 Total net position—ending 199,225
The accompanying Notes to Basic Financial Statements are an integral part of this statement.
RAMSEY BOARD OF EDUCATIONStatement of Revenues, Expenses, and Changes in Fund Net Position
Proprietary FundsFiscal Year Ended June 30, 2015
-31-

Exhibit B-6
RAMSEY BOARD OF EDUCATIONStatement of Cash Flows
Proprietary Funds
Food ServiceProgram
CASH FLOWS FROM OPERATING ACTIVITIESReceipts from customers 538,232 Payments to suppliers (611,873) Net cash provided by (used for) operating activities (73,641)
CASH FLOWS FROM NONCAPITAL FINANCING ACTIVITIESLocal Sources 81,397 Net cash provided by (used for) non-capital financing activities 81,397
CASH FLOWS FROM INVESTING ACTIVITIESInterest and dividends 24 Net cash provided by (used for) investing activities 24
Net increase (decrease) in cash and cash equivalents 7,780 Balances—beginning of year 66,665 Balances—end of year 74,445
Reconciliation of operating income (loss) to net cash provided (used) by operating activities: Operating income (loss) (166,712) Adjustments to reconcile operating income (loss) to net cash provided by (used for) operating activities (Increase) decrease in accounts receivable (21,760) Depreciation and net amortization 14,938 Food Distribution Program 34,966 (Increase) decrease in inventories (1,727) Increase (decrease) in accounts payable 66,654 Total adjustments 93,071 Net cash provided by (used for) operating activities (73,641)
The accompanying Notes to Basic Financial Statements are an integral part of this statement.
Fiscal Year Ended June 30, 2015
-32-
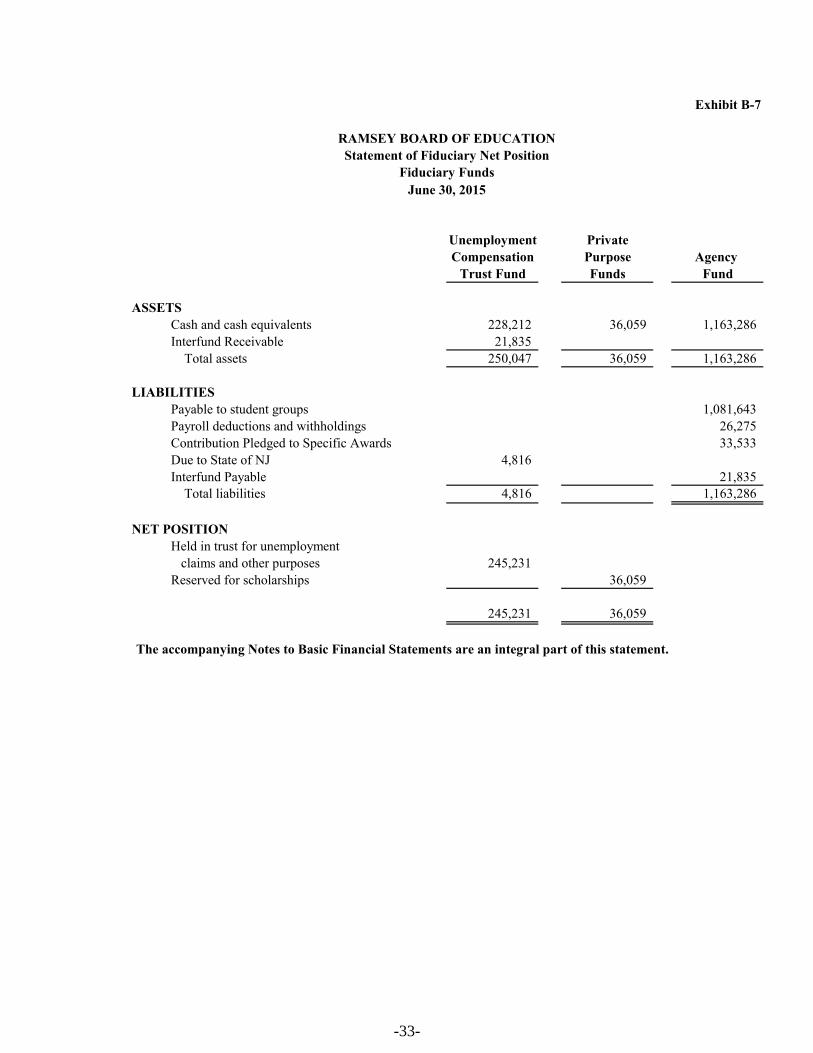
Exhibit B-7
RAMSEY BOARD OF EDUCATIONStatement of Fiduciary Net Position
Fiduciary FundsJune 30, 2015
Unemployment PrivateCompensation Purpose Agency
Trust Fund Funds Fund
ASSETSCash and cash equivalents 228,212 36,059 1,163,286Interfund Receivable 21,835 Total assets 250,047 36,059 1,163,286
LIABILITIES Payable to student groups 1,081,643Payroll deductions and withholdings 26,275Contribution Pledged to Specific Awards 33,533Due to State of NJ 4,816Interfund Payable 21,835 Total liabilities 4,816 1,163,286
NET POSITIONHeld in trust for unemployment claims and other purposes 245,231Reserved for scholarships 36,059
245,231 36,059
The accompanying Notes to Basic Financial Statements are an integral part of this statement.
-33-
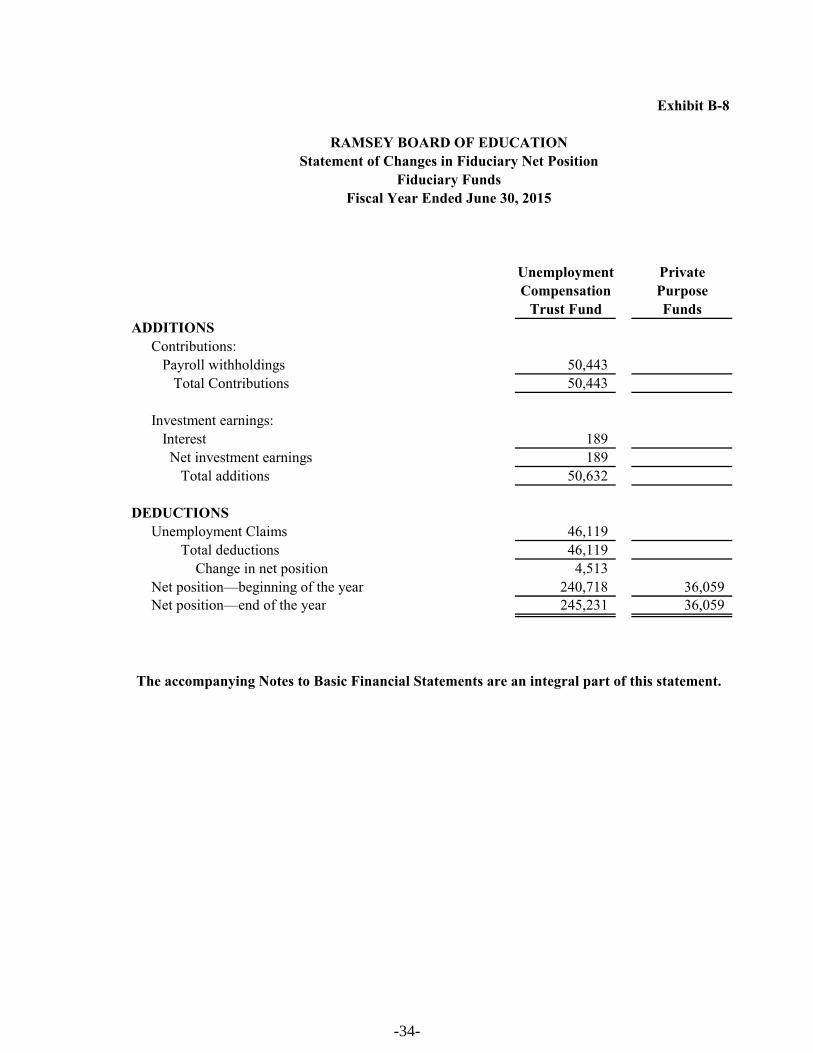
Exhibit B-8
RAMSEY BOARD OF EDUCATIONStatement of Changes in Fiduciary Net Position
Fiduciary FundsFiscal Year Ended June 30, 2015
Unemployment PrivateCompensation Purpose
Trust Fund FundsADDITIONS
Contributions: Payroll withholdings 50,443 Total Contributions 50,443
Investment earnings: Interest 189 Net investment earnings 189 Total additions 50,632
DEDUCTIONSUnemployment Claims 46,119 Total deductions 46,119 Change in net position 4,513Net position—beginning of the year 240,718 36,059Net position—end of the year 245,231 36,059
The accompanying Notes to Basic Financial Statements are an integral part of this statement.
-34-

NOTES TO THE FINANCIAL STATEMENTS

Borough of Ramsey School DistrictNotes to the Basic Financial Statementsfor the fiscal year ended June 30, 2015
NOTE 1. DESCRIPTION OF THE SCHOOL DISTRICT AND REPORTING ENTITY
The Board of Education (“Board”) of the Borough of Ramsey School District (“District”) is aninstrumentality of the State of New Jersey, established to function as an educational institution. TheBorough of Ramsey School District is a Type II district located in the County of Bergen, State of NewJersey. As a Type II district, the School District functions independently through a Board of Education. Theboard is comprised of nine members elected to three-year terms. The purpose of the District is to educatestudents in grades K-12. A superintendent is appointed by the Board and is responsible for theadministrative control of the District. Under existing statutes, the Board’s duties and powers include, butare not limited to, the development and adoption of a school program; the establishment, organization andoperation of schools; and the acquisition, maintenance and disposition of school property.
The Board also has broad financial responsibilities, including the approval of the annual budget and theestablishment of a system of accounting and budgetary controls.
The primary criterion for including activities within the District's reporting entity, as set forth in Section2100 of the GASB Codification of Governmental Accounting and Financial Reporting Standards, is whether:
C the organization is legally separate (can sue or be sued in their own name)C the Board holds the corporate powers of the organizationC the Board appoints a voting majority of the organization’s boardC the Board is able to impose its will on the organizationC the organization has the potential to impose a financial benefit/burden on the BoardC there is a fiscal dependency by the organization on the Board
Based on the aforementioned criteria, the Board has no component units. Furthermore, the Board is notincludable in any other reporting entity on the basis of such criteria.
NOTE 2. SUMMARY OF SIGNIFICANT ACCOUNTING POLICIES
The financial statements of the Board of Education of the Borough of Ramsey School District have beenprepared in conformity with accounting principles generally accepted in the United States of America(GAAP) as applied to governmental units. The Governmental Accounting Standards Board (GASB) is theaccepted standard-setting body for establishing governmental accounting and financial reporting principles. The more significant of the board’s accounting policies are described below.
-35-

Borough of Ramsey School DistrictNotes to the Basic Financial Statementsfor the fiscal year ended June 30, 2015
NOTE 2. SUMMARY OF SIGNIFICANT ACCOUNTING POLICIES, (continued)
A. Basis of Presentation
The Board’s basic financial statements consist of District-wide statements, including a statement of netposition and a statement of activities, and fund financial statements which provide a more detailed level offinancial information.
District-wide Financial Statements
The statement of net position and the statement of activities display information about the Board as a whole. These statements include the financial activities of the overall District, except for the fiduciary funds. Thestatements distinguish between those activities of the Board that are governmental and those that areconsidered business-type activities.
The statement of net position presents the financial condition of the governmental and business-typeactivities of the Board at year-end. The statement of activities presents a comparison between directexpenses and program revenues for each program or function of the governmental activities and for thebusiness-type activities of the Board. Direct expenses are those that are specifically associated with aservice, program or department and therefore clearly identifiable to a particular function. Program revenuesinclude charges paid by the recipient of the goods or services offered by the program, grants andcontributions that are restricted to meeting the operational or capital requirements of a particular program. Revenues which are not classified as program revenues are presented as general revenues of the Board, withcertain limited exceptions. The comparison of direct expenses with program revenues identifies the extentto which each business segment or governmental function is self-financing or draws from the generalrevenues of the Board.
Fund Financial Statements
During the fiscal year, the School District segregates transactions related to certain School District functionsor activities in separate funds in order to aid financial management and to demonstrate legal compliance. The fund financial statements provide information about the District’s funds, including its fiduciary funds. Separate statements for each fund category - government, proprietary, and fiduciary - are presented. TheNew Jersey Department of Education (NJDOE) has elected to require New Jersey districts to treat eachgovernmental fund as a major fund in accordance with the option noted in GASB No. 34, paragraph 76. TheNJDOE believes that the presentation of all funds as major is important for public interest and to promoteconsistency among district financial reporting models. The various funds of the Board are grouped into thecategories governmental, proprietary and fiduciary.
-36-

Borough of Ramsey School DistrictNotes to the Basic Financial Statementsfor the fiscal year ended June 30, 2015
NOTE 2. SUMMARY OF SIGNIFICANT ACCOUNTING POLICIES, (continued)
GOVERNMENTAL FUNDS
Governmental funds are those through which most governmental functions of the Board are financed. Governmental fund reporting focuses on the sources, uses and balances of current financial resources. Expendable assets are assigned to the various governmental funds according to the purposes for whichthey may or must be used. Current liabilities are assigned to the fund from which they will be paid. The difference between governmental fund assets and liabilities is reported as fund balance. Thefollowing are the Board’s governmental funds:
General Fund - The General Fund is the general operating fund of the Board. It is used to account forall financial resources except those required to be accounted for in another fund. Included are certainexpenditures for vehicles and movable instructional or noninstructional equipment which are classifiedin the Capital Outlay subfund.
As required by the New Jersey State Department of Education, the Board includes budgeted CapitalOutlay in this fund. Accounting principles generally accepted in the United States of America as theypertain to governmental entities state that General Fund resources may be used to directly financecapital outlays for long-lived improvements as long as the resources in such cases are derivedexclusively from unrestricted revenues.
Resources for budgeted capital outlay purposes are normally derived from State of New Jersey Aid,District taxes and appropriated fund balance. Expenditures are those that result in the acquisition ofor additions to fixed assets for land, existing buildings, improvements of grounds, construction ofbuildings, additions to or remodeling of buildings and the purchase of built-in equipment. Theseresources can be transferred from and to Current Expense by board resolution.
Special Revenue Fund - The Special Revenue Fund is used to account for the proceeds of specificrevenue from State and Federal Government, (other than major capital projects, Debt Service or theEnterprise Funds) and local appropriations that are legally restricted to expenditures for specifiedpurposes.
Capital Projects Fund - The Capital Projects Fund is used to account for all financial resources to beused for the acquisition or construction of major capital facilities (other than those financed byProprietary Funds). The financial resources are derived from sale of bonds, lease purchases and otherrevenues.
Debt Service Fund - The debt service fund is used to account for the accumulation of resources forand the payment of principal and interest on bonds issued to finance major property acquisition,construction and improvement programs.
-37-
Borough of Ramsey School DistrictNotes to the Basic Financial Statementsfor the fiscal year ended June 30, 2015
NOTE 2. SUMMARY OF SIGNIFICANT ACCOUNTING POLICIES, (continued)
PROPRIETARY FUNDS
The focus of Proprietary Fund measurement is upon determination of net income, changes in netposition, financial position and cash flows. The accounting principles generally accepted in the UnitedStates of America applicable are those similar to businesses in the private sector. Proprietary funds areclassified as enterprise or internal service; the Board has no internal service funds. The following isa description of the Proprietary Funds of the Board:
Enterprise Funds - The Enterprise Funds are utilized to account for operations that are financed andoperated in a manner similar to private business enterprises -- where the intent of the Board is that thecosts (i.e. expenses including depreciation and indirect costs) of providing goods or services to thestudents on a continuing basis be financed or recovered primarily through user charges; or, where theBoard has decided that periodic determination of revenues earned, expenses incurred, and/or netincome is appropriate for capital maintenance, public policy, management control, accountability orother purposes.
The Board's Enterprise Fund is comprised of the Food Service Fund.
FIDUCIARY FUNDS
Fiduciary Fund - Fiduciary Fund reporting focuses on net position and changes in net position. TheFiduciary Funds are used to account for assets held by the Board on behalf of individuals, privateorganizations, other governments and/or other funds. Fiduciary Funds include UnemploymentCompensation Insurance, the Memorial Funds, Student Activities Fund and Payroll Agency Fund.
B. Measurement Focus
District-wide Financial Statements
The District-wide statements (i.e., the statement of net position and the statement of activities) are preparedusing the economic resources measurements focus and the accrual basis of accounting. All assets andliabilities associated with the operation of the Board are included on the statement of net position, exceptfor fiduciary funds.
-38-
Borough of Ramsey School DistrictNotes to the Basic Financial Statementsfor the fiscal year ended June 30, 2015
NOTE 2. SUMMARY OF SIGNIFICANT ACCOUNTING POLICIES, (continued)
B. Measurement Focus, (continued)
Fund Financial Statements
All governmental funds are accounted for using a flow of current financial resources measurement focus. With this measurement focus, only current assets and current liabilities generally are included on the balancesheet. The statement of revenues, expenditures and changes in fund balances reports on the sources (i.e.,revenues and other financing sources) and uses (i.e., expenditures and other financing uses) of currentfinancial resources. This approach differs from the manner in which the governmental activities of theDistrict-wide financial statements are prepared. Governmental fund financial statements therefore includea reconciliation with brief explanations to better identify the relationship between the government-widestatements and the statements for governmental funds.
Like the District-wide statements, all proprietary fund types are accounted for on a flow of economicresources measurement focus. All assets and all liabilities associated with the operation of these funds areincluded on the statement of net position. The statement of changes in fund net position presents increases(i.e., revenues) and decreases (i.e., expenses) in net total assets. The statement of cash flows providesinformation about how the Board finances and meets the cash flow needs of its proprietary activities.
C. Basis of Accounting
Basis of accounting determines when transactions are recorded in the financial records and reported on thefinancial statements. The District-wide financial statements and the financial statements of the proprietaryand fiduciary funds are prepared using the accrual basis of accounting. Governmental funds use themodified accrual basis of accounting. Differences in the accrual and the modified accrual basis ofaccounting arise in the recognition of revenue, the recording of unearned revenue, and in the presentationof expenses versus expenditures.
Revenues - Exchange and Non-exchange Transactions
Revenue resulting from exchange transactions, in which each party gives and receives essentially equalvalue, is recorded on the accrual basis when the exchange takes place. On a modified accrual basis, revenueis recorded in the fiscal year in which the resources are measurable and become available. Available meansthat the resources will be collected within the current fiscal year or are expected to be collected soon enoughthereafter to be used to pay liabilities of the current fiscal year.
-39-

Borough of Ramsey School DistrictNotes to the Basic Financial Statementsfor the fiscal year ended June 30, 2015
NOTE 2. SUMMARY OF SIGNIFICANT ACCOUNTING POLICIES, (continued)
Revenues - Exchange and Non-exchange Transactions, (continued)
Nonexchange transactions, in which the Board receives value without directly giving equal value in return,include property taxes, grants, entitlements and donations. On an accrual basis, revenue from property taxesis recognized in the fiscal year for which the taxes are levied. Revenue from grants, entitlements anddonations is recognized in the fiscal year in which all eligibility requirements have been satisfied. Eligibilityrequirements include timing requirements, which specify the year when the resources are required to be usedor the year when use is first permitted, matching requirements, in which the Board must provide localresources to be used for a specified purpose, and expenditure requirements, in which the resources areprovided to the Board on a reimbursement basis. On a modified accrual basis, revenue from nonexchangetransactions must also be available before it can be recognized. Under GAAP, in accordance with GASBNo. 33, Accounting and Financial Reporting for Nonexchange Transactions, the last state aid payment is notconsidered revenue to the school district if the state has not recorded the corresponding expenditure, eventhough state law dictates recording the revenue.
Under the modified accrual basis, the following revenue sources are considered to be both measurable andavailable at year-end: ad valorem property taxes, tuition, unrestricted grants and interest.
Expenses/Expenditures
On the accrual basis of accounting, expenses are recognized at the time they are incurred. The fair value ofdonated commodities used during the year is reported in the operating statement as an expense with a likeamount reported as donated commodities revenue.
The measurement of focus of governmental fund accounting is on decreases in net financial resources(expenditures) rather than expenses. Expenditures are generally recognized in the accounting period inwhich the related fund liability is incurred, if measurable. Allocations of cost, such as depreciation andamortization, are not recognized in the governmental funds.
D. Budgets/Budgetary Control
Annual appropriated budgets are adopted in the spring of the preceding year for the general, and specialrevenue funds. The budgets are submitted to the county superintendents office for approval. Budgets areprepared using the modified accrual basis of accounting, except for the special revenue fund as describedlater. The legal level of budgetary control is established at line item accounts within each fund. Line itemaccounts are defined as the lowest (most specific) level of detail as established pursuant to the minimumchart of accounts referenced in N.J.A.C. 6A:23-2(g)1. Transfers of appropriations may be made by SchoolBoard resolution at any time during the fiscal year. The Board of Education made additional appropriationsof $230,695 during the year for additional withdrawals from capital reserve.
-40-
Borough of Ramsey School DistrictNotes to the Basic Financial Statementsfor the fiscal year ended June 30, 2015
NOTE 2. SUMMARY OF SIGNIFICANT ACCOUNTING POLICIES, (continued)
D. Budgets/Budgetary Control, (continued)
Formal budgetary integration into the accounting system is employed as a management control device duringthe year. For governmental funds there are no substantial differences between the budgetary basis ofaccounting and accounting principles generally accepted in the United States of America with the exceptionof the legally mandated revenue recognition of the last state aid payment for budgetary purposes only andspecial revenue fund as noted below. Encumbrance accounting is also employed as an extension of formalbudgetary integration in the governmental fund types. Unencumbered appropriations lapse at fiscal year end.
The accounting records of the special revenue fund are maintained on the grant accounting budgetary basis. The grant accounting budgetary basis differs from GAAP in that the grant accounting budgetary basisrecognizes encumbrances as expenditures and also recognizes the related revenues, whereas the GAAP basisdoes not. Sufficient supplemental records are maintained to allow for the presentation of GAAP basisfinancial reports.
E. Encumbrances
Under encumbrance accounting purchase orders, contracts and other commitments for the expenditure ofresources are recorded to reserve a portion of the applicable appropriation. Open encumbrances ingovernmental funds, other than the special revenue fund, are reported as reservations of fund balances atfiscal year end as they do not constitute expenditures or liabilities but rather commitments related tounperformed contracts for goods and services.
Open encumbrances in the special revenue fund, for which the Board has received advances, are reflectedin the balance sheet as unearned revenues at fiscal year end.
The encumbered appropriation authority carries over into the next fiscal year. An entry will be made at thebeginning of the next fiscal year to increase the appropriation reflected in the certified budget by theoutstanding encumbrance amount as of the current fiscal year end.
F. Cash, Cash Equivalents and Investments
Cash and cash equivalents include petty cash, change funds, cash in banks and all highly liquid investmentswith a maturity of three months or less at the time of purchase and are stated at cost plus accrued interest. U.S. Treasury and agency obligations and certificates of deposit with maturities of one year or less whenpurchased are stated at cost. All other investments are stated at fair value.
New Jersey school districts are limited as to the types of investments and types of financial institutions theymay invest in. New Jersey statute 18A:20-37 provides a list of permissible investments that may bepurchased by New Jersey school districts.
-41-

Borough of Ramsey School DistrictNotes to the Basic Financial Statementsfor the fiscal year ended June 30, 2015
NOTE 2. SUMMARY OF SIGNIFICANT ACCOUNTING POLICIES, (continued)
F. Cash, Cash Equivalents and Investments, (continued)
Additionally, the Board has adopted a cash management plan that requires it to deposit public funds in publicdepositories protected from loss under the provisions of the Governmental Unit Deposit Protection Act("GUDPA"). GUDPA was enacted in 1970 to protect Governmental Units from a loss of funds on depositwith a failed banking institution in New Jersey.
N.J.S.A. 17:9-41 et. seq. establishes the requirements for the security of deposits of governmental units. Thestatute requires that no governmental unit shall deposit public funds in a public depository unless such fundsare secured in accordance with the Act. Public depositories include Savings and Loan institutions, banks(both state and national banks) and savings banks the deposits of which are federally insured. All publicdepositories must pledge collateral, having a market value at least equal to five percent of the average dailybalance of collected public funds, to secure the deposits of Governmental Units. If a public depository fails,the collateral it has pledged, plus the collateral of all other public depositories, is available to pay the fullamount of their deposits to the Governmental Units.
G. Tuition Revenues/Receivable
Tuition charges were established by the Board of Education based on estimated costs. The charges aresubject to adjustment when the final costs have been determined.
H. Inventories
On District-wide financial statements, inventories are presented at cost, which approximates market on afirst-in, first-out basis and are expensed when used.
On fund financial statements inventories are valued at cost, which approximates market, using thefirst-in-first-out (FIFO) method. Inventories of proprietary funds consist of food and goods held for resale,as well as supplies, and are expensed when used.
I. Prepaid Items
Payments made to vendors for services that will benefit periods beyond June 30, 2015 are recorded asprepaid items using the consumption method. A current asset for the prepaid amount is recorded at the timeof purchase and an expenditure/expense is reported in the year in which services are consumed.
-42-

Borough of Ramsey School DistrictNotes to the Basic Financial Statementsfor the fiscal year ended June 30, 2015
NOTE 2. SUMMARY OF SIGNIFICANT ACCOUNTING POLICIES, (continued)
J. Short-Term Interfund Receivables/Payables
On fund financial statements, receivables and payables resulting from short-term interfund loans areclassified as “interfund receivables/payables.” These amounts are eliminated in the governmental andbusiness-type activities columns of the statement of net position, except for the net residual amounts duebetween governmental and business-type activities, which are presented as internal balances.
K. Capital Assets
General capital assets are those assets not specifically related to activities reported in the enterprise fund. These assets generally result from expenditures in the governmental funds. These assets are reported in thegovernmental activities column of the district -wide statement of net position but are not reported in the fundfinancial statements. Capital assets utilized by the enterprise fund are reported both in the business-typeactivity column of the District-wide statement of net position and in the fund.
All capital assets acquired or constructed during the year are recorded at actual cost. Donated fixed assetsare valued at their estimated fair market value on the date received. The capital assets acquired orconstructed prior to June 30, 1993 are valued at cost based on historical records or through estimationprocedures performed by an independent appraisal company. Donated capital assets are valued at theirestimated fair market value on the date received. The Board maintains a capitalization threshold of$2,000.00. The Board does not possess any infrastructure. Improvements are capitalized; the costs ofnormal maintenance and repairs that do not add to the value fo the asset or materially extend an asset’s lifeare not.
All reported capital assets except land and construction in progress are depreciated. Improvements aredepreciated over the remaining useful lives of the related capital assets. Depreciation is computed using thestraight-line method over the following useful lives:
Description
GovernmentalActivities
Estimated Lives
Business-TypeActivity
Estimated Lives
Sites and Improvements 20 years N/ABuildings and Improvements 7-50 years N/AFurniture, Equipment and Vehicles 5-20 years 5-20 years
-43-

Borough of Ramsey School DistrictNotes to the Basic Financial Statementsfor the fiscal year ended June 30, 2015
NOTE 2. SUMMARY OF SIGNIFICANT ACCOUNTING POLICIES, (continued)
L. Compensated Absences
Compensated absences are those absences for which employees will be paid, such as vacation, sick leave,and sabbatical leave. A liability for compensated absences that are attributable to services already rendered,and that are not contingent on a specific event that is outside the control of the Board and its employees, isaccrued as the employees earn the rights to the benefits. Compensated absences that relate to future services,or that are contingent on a specific event that is outside the control of the Board and its employees, areaccounted for in the period in which such services are rendered or in which such events take place.
For the District-wide Statements, the current portion is the amount estimated to be used in the followingyear. In accordance with GAAP, for the governmental funds, in the Fund Financial Statements, all of thecompensated absences are considered long-term and therefore, are not a fund liability and represents areconciling item between the fund level and District-wide presentations.
M. Unearned Revenue
Unearned revenue arises when assets are recognized before revenue recognition criteria have been satisfied.
Unearned revenue in the special revenue fund represents cash that has been received but not yet earned. SeeNote 2(E) regarding the special revenue fund.
N. Accrued Liabilities and Long-term Obligations
All payables, accrued liabilities and long-term obligations are reported in the District-wide financialstatements.
In general, governmental fund payables and accrued liabilities that, once incurred, are paid in a timelymanner and in full from current financial resources, are reported as obligations of the funds. However,claims and judgements, compensated absences, special termination benefits and contractually requiredpension contributions that will be paid from governmental funds are reported as a liability in the fundfinancial statements only to the extent that they are due for payment in the current year. Bonds, long-termobligations, and capital leases that will be paid from governmental funds are recognized as a liability in thefund financial statements when due.
-44-
Borough of Ramsey School DistrictNotes to the Basic Financial Statementsfor the fiscal year ended June 30, 2015
NOTE 2. SUMMARY OF SIGNIFICANT ACCOUNTING POLICIES, (continued)
O. Accounting and Financial Reporting for Pensions:
In fiscal year 2015, the District implemented GASB 68. This Statement amends GASB Statement No. 27.It improves accounting and financial reporting by state and local governments for pensions. It also improvesinformation provided by state and local government employers about financial support for pensions that isprovided by other entities. This Statement results from a comprehensive review of the effectiveness ofexisting standards of accounting and financial reporting for pensions with regard to providing decision usefulinformation, supporting assessments of accountability and interperiod equity, and creating additionaltransparency. This Statement replaces the requirement of Statement No. 27, Accounting for Pension by Stateand Local Governmental Employers, as well as the requirements of Statement No. 50, Pension Disclosures,as they relate to pensions that are provided through pension plans administered as trusts or equivalentarrangements that meet certain criteria. The requirements of Statements 27 and 50 remain applicable forpensions that are not covered by the scope of this Statement. This statement is effective for periodsbeginning after June 15, 2014.
The District has also implemented GASB Statement 71, Pension Transition for Contributions madeSubsequent to the Measurement Date-an amendment to GASB No. 68. The objective of this Statement isto address an issue regarding application of the transition provisions of Statement No. 68, Accounting andFinancial Reporting for Pensions. The issue relates to amounts associated with contributions, if any, madeby a state or local government employer or nonemployer contributing entity to a defined benefit pension planafter the measurement date of the government's beginning net pension liability.
Statement 68 requires a state or local government employer (or nonemployer contributing entity in a specialfunding situation) to recognize a net pension liability measured as of a date (the measurement date) no earlierthan the end of its prior fiscal year. If a state or local government employer or nonemployer contributingentity makes a contribution to a defined benefit pension plan between the measurement date of the reportednet pension liability and the end of the government's reporting period, Statement 68 requires that thegovernment recognize its contribution as a deferred outflow of resources.
In addition, Statement 68 requires recognition of deferred outflows of resources and deferred inflows ofresources for changes in the net pension liability of a state or local government employer or nonemployercontributing entity that arise from other types of events. At transition to Statement 68, if it is not practicalfor an employer or nonemployer contributing entity to determine the amounts of all deferred outflows ofresources and deferred inflows of resources related to pensions, paragraph 137 of Statement 68 required thatbeginning balances for deferred outflows of resources and deferred inflows of resources not be reported.Consequently, if it is not practical to determine the amounts of all deferred outflows of resources anddeferred inflows of resources related to pensions, contributions made after the measurement date of thebeginning net pension liability could not have been reported as deferred outflows of resources at transition.This could have resulted in a significant understatement of an employer or nonemployer contributing entity'sbeginning net position and expense in the initial period of implementation.
-45-
Borough of Ramsey School DistrictNotes to the Basic Financial Statementsfor the fiscal year ended June 30, 2015
NOTE 2. SUMMARY OF SIGNIFICANT ACCOUNTING POLICIES, (continued)
O. Accounting and Financial Reporting for Pensions: (continued)
This Statement amends paragraph 137 of Statement 68 to require that, at transition, a government recognizea beginning deferred outflow of resources for its pension contributions, if any, made subsequent to themeasurement date of the beginning net pension liability. Statement 68, as amended, continues to require thatbeginning balances for other deferred outflows of resources and deferred inflows of resources related topensions be reported at transition only if it is practical to determine all such amounts.
P. Fund Balances
Fund balance is divided into five classifications based primarily on the extent to which the Board is boundto observe constraints imposed upon the resources in the governmental funds. The classifications are asfollows:
• Nonspendable fund balance includes amounts that are not in a spendable form (inventory,for example) or are required to be maintained intact (the principal of an endowment fund,for example).
• Restricted fund balance includes amounts that can be spent only for the specific purposesstipulated by external resource providers (for example, grant providers), constitutionally,or through enabling legislation (that is, legislation that creates a new revenue source andrestricts its use). Effectively, restrictions may be changed or lifted only with the consent ofresource providers.
• Committed fund balance includes amounts that can be used only for the specific purposesdetermined by a formal action of the Board’s highest level of decision-making authority. Commitments may be changed or lifted only by the government taking the same formalaction that imposed the constraint originally.
• Assigned fund balance comprises amounts intended to be used by the Board for specificpurposes. Intent can be expressed by the governing body or by an official or body to whichthe governing body delegates the authority. In governmental funds other than the generalfund, assigned fund balance represents the amount that is not restricted or committed. Thisindicates that resources in other governmental funds are, at a minimum, intended to be usedfor the purpose of that fund.
• Unassigned fund balance is the residual classification for the general fund and includes allamounts not contained in the other classifications. Unassigned amounts are technicallyavailable for any purpose. If another governmental fund has a fund balance deficit, then itwill be reported as a negative amount in the unassigned classification in that fund. Positiveunassigned amounts will be reported only in the general fund.
-46-

Borough of Ramsey School DistrictNotes to the Basic Financial Statementsfor the fiscal year ended June 30, 2015
NOTE 2. SUMMARY OF SIGNIFICANT ACCOUNTING POLICIES, (continued)
Q. Net Position
Net position represents the difference between assets and deferred outflows of resources and liabilities anddeferred inflows of resources. Net position invested in capital assets, net of related debt consists of capitalassets, net of accumulated depreciation, reduced by the outstanding balances of any borrowings used for theacquisition, construction or improvement of those assets. Net position is reported as restricted when thereare limitations imposed on their use either through the enabling legislation adopted by the Board or throughexternal restrictions imposed by creditors, grantors or laws or regulations of other governments.
The Board applies restricted resources first when an expense is incurred for purposes for which bothrestricted and unrestricted net position are available.
R. Operating Revenues and Expenses
Operating revenues are those revenues that are generated directly from the primary activity of the proprietaryfunds. For the Board, these revenues are sales for food service. Operating expenses are necessary costsincurred to provide the good or service that is the primary activity of the fund.
S. Extraordinary and Special Items
Extraordinary items are transactions or events that are both unusual in nature and infrequent in occurrence. Special items are transactions or events that are within the control of the Board and that are either unusualin nature or infrequent in occurrence. Neither type of transaction occurred during the fiscal year.
T. Allocation of Indirect Expenses
The District reports all direct expenses by function in the Statement of Activities. Direct expenses are thosethat are clearly identifiable with a function. Indirect expenses are allocated to functions but are reportedseparately in the Statement of Activities. Employee benefits, including the employer’s share of socialsecurity, workers compensation, and medical and dental benefits, were allocated based on salaries of thatprogram. TPAF on-behalf contributions and changes in compensated absences have not been allocated andhave been reported as unallocated benefits on the Statement of Activities. Depreciation expense, wherepracticable, is specifically identified by function and is included in the indirect expense column of theStatement of Activities. Depreciation expense that could not be attributed to a specific function isconsidered an indirect expense and is reported separately on the Statement of Activities as unallocateddepreciation. Interest on long-term debt is considered an indirect expense and is reported separately on theStatement of Activities.
-47-

Borough of Ramsey School DistrictNotes to the Basic Financial Statementsfor the fiscal year ended June 30, 2015
NOTE 2. SUMMARY OF SIGNIFICANT ACCOUNTING POLICIES, (continued)
U. Use of Estimates
The preparation of financial statements in accordance with accounting principles generally accepted in theUnited States of America requires management to make estimates and assumptions that effect certainreports, amounts and disclosures. Accordingly, actual results could differ from those estimates.
V. Recent Accounting Pronouncements
The Governmental Accounting Standards Board (GASB) issued Statement No. 68, “Accounting andFinancial Reporting for Pensions – an amendment of GASB Statement No. 27”. This statement, which iseffective for fiscal periods beginning after June 15, 2014 and was implemented by the District for the yearended June 30, 2015.
The Governmental Accounting Standards Board (GASB) issued Statement No. 71 “Pension Transition forContributions Made Subsequent to the Measurement Date-an-amendment of GASB Statement No. 68”. Theprovisions of this statement are required to be applied simultaneously with the provisions of Statement 68which is effective for periods beginning after June 15, 2014 and was implemented by the District for the yearended June 30, 2015.
The Government Accounting Standards Board issued GASB Statement No. 72, Fair Value Measurementand Application. This Statement addresses accounting and financial reporting issues related to fair valuemeasurements. The definition of fair value is the price that would be received to sell an asset or paid totransfer a liability in an orderly transaction between market participants at the measurement date. ThisStatement also provides guidance for determining a fair value measurement for financial reporting purposes. This Statement also provides guidance for applying fair value to certain investments and disclosures relatedto all fair value measurements. The District is currently reviewing what effect, if any, this Statement mighthave on future financial statements.
The Government Accounting Standards Board issued GASB Statement No. 73, Accounting and FinancialReporting for Pensions and Related Assets That Are Not Within the Scope of GASB Statement 68 andAmendments to Certain Provisions of GASB Statements 67 and 68. This Statement is effective for fiscalyears beginning after June 15, 2015 – except those provisions that address employers and governmentalnonemployer contributing entities for pensions that are not within the scope of Statement 68, which areeffective for financial statements for fiscal years beginning after June 15,2016. The District is currentlyreviewing what effect, if any, this Statement might have on future financial statements.
The Government Accounting Standards Board issued GASB Statement No. 74, Financial Reporting forPostemployment Benefit Plans Other Than Pension Plans. This Statement applies to OPEB plans andbasically parallels GASB Statement 67 and replaces GASB Statement 43 and is effective for fiscal yearsbeginning after June 15, 2016. The District is currently reviewing what effect, if any, this Statement mighthave on future financial statements.
-48-

Borough of Ramsey School DistrictNotes to the Basic Financial Statementsfor the fiscal year ended June 30, 2015
NOTE 2. SUMMARY OF SIGNIFICANT ACCOUNTING POLICIES, (continued)
V. Recent Accounting Pronouncements, (continued)
The Government Accounting Standards Board issued GASB Statement No. 75, Accounting and FinancialReporting for Postemployment Benefits Other Than Pensions. This Statement applies to governmentemployers who provided OPEB plans to their employees and basically parallels GASB Statement 68 andreplaces GASB Statement 45. The Statement is effective for fiscal years beginning after June 15, 2017. TheDistrict is currently reviewing what effect, if any, this Statement might have on future financial statements.
NOTE 3. CASH AND CASH EQUIVALENTS AND INVESTMENTS
Cash
Custodial Credit Risk - Deposits
Custodial credit risk is the risk that in the event of a bank failure, the government’s deposits may not bereturned to it. The District’s policy is based on New Jersey Statutes requiring cash be deposited only in NewJersey based banking institutions that participate in New Jersey Governmental Depository Protection Act(GUDPA) or in qualified investments established in New Jersey Statutes 18A:20-37 that are treated as cashequivalents. As of June 30, 2015, $3,724 of the District’s bank balance of $8,447,372 was exposed tocustodial credit risk.
Investments
Investment Rate Risk
The District does not have a formal investment policy that limits investment maturities as a means ofmanaging its exposure to fair value losses arising from increasing interest rates. However, New JerseyStatutes 18A:20-37 limits the length of time for most investments to 397 days.
Credit Risk
New Jersey Statutes 18A:20-37 limits school district investments to those specified in the Statutes. The typeof allowance investments are Bonds of the United States of America, bonds or other obligations of theschool districts or bonds or other obligations of the local unit or units within which the school district islocated: obligations of federal agencies not exceeding 397 days; government money market mutual funds;the State of New Jersey Cash Management Plan; local government investment pools; or repurchase of fullycollateralized securities.
Concentration of Credit Risk
The District places no limit on the amount the District may invest in any one issuer.
-49-

Borough of Ramsey School DistrictNotes to the Basic Financial Statementsfor the fiscal year ended June 30, 2015
NOTE 4. RECEIVABLES
Receivables at June 30, 2015, consisted of accounts and intergovernmental. All receivables are consideredcollectible in full. A summary of the principal items of receivables follows:
GovernmentalFund Financial
StatementsEnterprise
Fund
District WideFinancial
Statements
State Aid $6,566,820 $305 $6,567,125Federal Aid 244,459 5,735 250,194Other 120,367 120,367Interfunds 178,952 130,221 Gross Receivables 7,110,598 136,261 6,937,686Less: Allowance for Uncollectibles Total Receivables, Net $7,110,598 $136,261 $6,937,686
NOTE 5. INTERFUND BALANCES AND ACTIVITY
Balances due to/from other funds at June 30, 2015, consist of the following:
$213 Due to the Debt Service Fund from the Capital Projects Fund forinterest earned on investments in the Capital Projects Fund.
2,772 Due to the General Fund from the Special Revenue Fund for prioryears Distance Learning Network Aid deferred revenue.
130,221 Due to the Food Service Fund from the General Fund for subsidyreimbursements received but not turned over and Board share ofexpenses paid.
175,967 Due to the General Fund from the Special Revenue Fund to coverdeficit in cash.
$309,173
It is anticipated that all interfunds will be liquidated during the fiscal year.
Interfund transfers for the year ended June 30, 2015 consisted of the following:
$2,452,457 from the General Fund Capital Reserve to the Capital Projects Fund to provide resources to Fundthe local Share of Capital Projects, $213 from the Capital Projects Fund to the Debt Service Fund for interestearnings.
-50-

Borough of Ramsey School DistrictNotes to the Basic Financial Statementsfor the fiscal year ended June 30, 2015
NOTE 6. CAPITAL ASSETS
Capital asset activity for the fiscal year ended June 30, 2015 was as follows:
Restated
Balance
6/30/14 Additions Deductions
Balance
6/30/15
Governmental Activities
Capital Assets That Are Not Being
Depreciated:
Land $4,425,700 $ $ $4,425,700
Total Capital Assets, Not Being Depreciated 4,425,700 4,425,700
Building and building improvements 46,668,745 2,962,079 49,630,824
Machinery and equipment 10,006,097 52,674 10,058,771
Totals at Historical Cost 56,674,842 3,014,753 59,689,595
Less Accumulated Depreciation For:
Buildings and Improvements (19,500,567) (1,518,281) (21,018,848)
Equipment (7,095,001) (588,009) (7,683,010)
Total Accumulated Depreciation (26,595,568) (2,106,290) (28,701,858)
Total Capital Assets, Being Depreciated, Net
of Accumulated Depreciation 30,079,274 908,463 30,987,737
Governmental Activities Capital Assets, Net $34,504,974 $908,463 $ $35,413,437
Restated
Balance
6/30/14 Additions Deductions
Balance
6/30/15
Business-Type Activity
Equipment 448,094 448,094
Less Accumulated Depreciation For:
Equipment (387,205) (14,938) (402,143)
Business-Type Activity Capital Assets, Net $60,889 ($14,938) $ $45,951
Depreciation expense was not allocated to governmental functions. It appears on the statement of activitiesas “unallocated depreciation”.
-51-
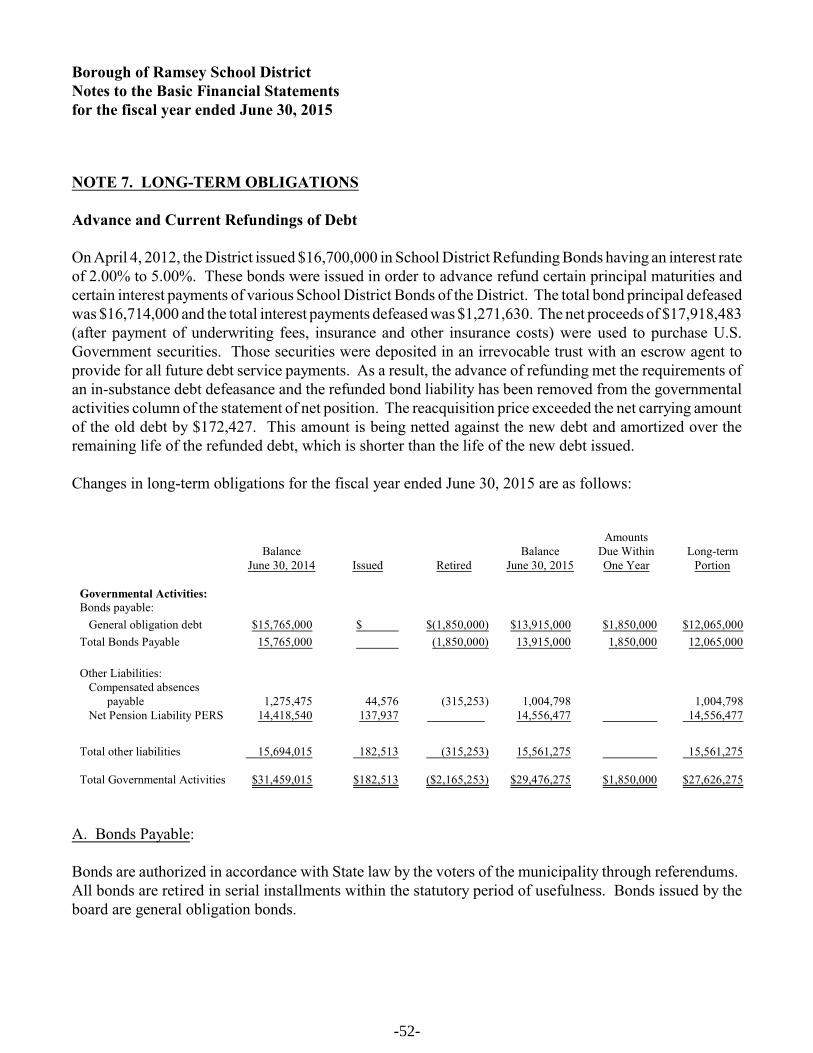
Borough of Ramsey School DistrictNotes to the Basic Financial Statementsfor the fiscal year ended June 30, 2015
NOTE 7. LONG-TERM OBLIGATIONS
Advance and Current Refundings of Debt
On April 4, 2012, the District issued $16,700,000 in School District Refunding Bonds having an interest rateof 2.00% to 5.00%. These bonds were issued in order to advance refund certain principal maturities andcertain interest payments of various School District Bonds of the District. The total bond principal defeasedwas $16,714,000 and the total interest payments defeased was $1,271,630. The net proceeds of $17,918,483(after payment of underwriting fees, insurance and other insurance costs) were used to purchase U.S.Government securities. Those securities were deposited in an irrevocable trust with an escrow agent toprovide for all future debt service payments. As a result, the advance of refunding met the requirements ofan in-substance debt defeasance and the refunded bond liability has been removed from the governmentalactivities column of the statement of net position. The reacquisition price exceeded the net carrying amountof the old debt by $172,427. This amount is being netted against the new debt and amortized over theremaining life of the refunded debt, which is shorter than the life of the new debt issued.
Changes in long-term obligations for the fiscal year ended June 30, 2015 are as follows:
BalanceJune 30, 2014 Issued Retired
BalanceJune 30, 2015
AmountsDue WithinOne Year
Long-termPortion
Governmental Activities:Bonds payable:
General obligation debt $15,765,000 $ $(1,850,000) $13,915,000 $1,850,000 $12,065,000
Total Bonds Payable 15,765,000 (1,850,000) 13,915,000 1,850,000 12,065,000
Other Liabilities: Compensated absences payable 1,275,475 44,576 (315,253) 1,004,798 1,004,798 Net Pension Liability PERS 14,418,540 137,937 14,556,477 14,556,477
Total other liabilities 15,694,015 182,513 (315,253) 15,561,275 15,561,275
Total Governmental Activities $31,459,015 $182,513 ($2,165,253) $29,476,275 $1,850,000 $27,626,275
A. Bonds Payable:
Bonds are authorized in accordance with State law by the voters of the municipality through referendums. All bonds are retired in serial installments within the statutory period of usefulness. Bonds issued by theboard are general obligation bonds.
-52-

Borough of Ramsey School DistrictNotes to the Basic Financial Statementsfor the fiscal year ended June 30, 2015
NOTE 7. LONG-TERM OBLIGATIONS, (continued)
Outstanding bonds payable at June 30, 2015 consisted of the following:
Issue
Amount
Issued
Issue
Date
Interest
Rates
Date of
Maturity
Principal
Balance
June 30, 2015
Refunding School Bonds $16,700,000 4/4/2012 2.0%-5.0% 1/15/2024 $13,915,000
Principal and interest due on serial bonds outstanding is as follows:
Year Ending June 30, Principal Interest Total2016 $1,850,000 $474,000 $2,324,0002017 1,865,000 437,000 2,302,0002018 1,310,000 381,050 1,691,0502019 1,355,000 341,750 1,696,7502020 1,395,000 301,100 1,696,100
2021-2024 6,140,000 976,950 7,116,950$13,915,000 $2,911,850 $16,826,850
B. Bonds Authorized But Not Issued:
As of June 30, 2015 the Board has no authorized but not issued bonds.
C. Capital Leases:
The District had no capital leases outstanding at June 30, 2015.
NOTE 8. OPERATING LEASES
The District has commitments to lease certain office equipment under operating leases that expire in 2021. Total operating lease payments made during the year ended June 30, 2015 were $117,057. Future minimumlease payments are as follows:
Year ending June 30, Amount
2016 $73,0422017 69,7342018 64,9132019 55,5912020 26,3312021 134
Total future minimum lease payments $289,745
-53-

Borough of Ramsey School DistrictNotes to the Basic Financial Statementsfor the fiscal year ended June 30, 2015
NOTE 9. PENSION PLANS
Description of Plans - All required employees of the District are covered by either the Public Employees'Retirement System or the Teachers' Pension and Annuity Fund which have been established by state statuteand are administered by the New Jersey Division of Pension and Benefits (Division). According to the Stateof New Jersey Administrative Code, all obligations of both Systems will be assumed by the State of NewJersey should the Systems terminate. The Division issues a publicly available financial report that includesthe financial statements and required supplementary information for the Public Employees RetirementSystem and the Teachers' Pension and Annuity Fund. These reports may be obtained by writing to theDivision of Pensions and Benefits, PO Box 295, Trenton, New Jersey, 08625 or reports can be accessed onthe internet at: http://www.state.nj.us/treasury/pensions/annrpts_archive.htm.
Teachers' Pension and Annuity Fund (TPAF) - The Teachers' Pension and Annuity Fund was establishedas of January 1, 1955, under the provisions of N.J.S.A. 18A:66 to provide retirement benefits, death,disability and medical benefits to certain qualified members. The Teachers' Pension and Annuity Fund isconsidered a cost-sharing multiple-employer plan with a special funding situation, as under current statute,all employer contributions are made by the State of New Jersey on behalf of the District and the system'sother related non-contributing employers. Membership is mandatory for substantially all teachers ormembers of the professional staff certified by the State Board of Examiners, and employees of theDepartment of Education who have titles that are unclassified, professional and certified.
Public Employees' Retirement System (PERS) - The Public Employees' Retirement System (PERS) wasestablished as of January 1, 1955 under the provisions of N.J.S.A. 43:15A to provide retirement, death,disability and medical benefits to certain qualified members. The Public Employees' Retirement System isa cost-sharing multiple-employer plan. Membership is mandatory for substantially all full-time employeesof the State of New Jersey or any county, municipality, school district, or public agency, provided theemployee is not required to be a member of another state-administered retirement system or other state orlocal jurisdiction.
Defined Contribution Retirement Program (DCRP) - The Defined Contribution Retirement Program(DCRP) was established as of July 1, 2008 under the provisions of Chapter 92, P.L. 2008 and Chapter 103,P.L. 2008 (NJSA 43:15C-1 et seq). The DCRP is a cost-sharing multiple-employer defined contributionpension fund. The DCRP provides eligible members, and their beneficiaries with a tax-sheltered, definedcontribution retirement benefit, along with life insurance and disability coverage. Vesting and benefitprovisions are established by NJSA 43:15C-1 et seq.
Contribution Requirements Fund Based Statements - The contribution policy is set by laws of the Stateof New Jersey and, in most retirement systems, contributions are required by active members andcontributing employers. Plan member and employer contributions may be amended by State of New Jerseylegislation. The pension funds provide for employee contributions based on 5.5% for PERS and 5.5% forTPAF of the employee’s annual compensation. Pursuant to the provisions of Chapter 78, P.L. 2011, thisamount will increase to 6.5% plus an additional 1% phased in over 7 years beginning in the first year. Forfiscal year 2012, the member rate will increase in October 2011. The phase in will take place on July 1 of
-54-

Borough of Ramsey School DistrictNotes to the Basic Financial Statementsfor the fiscal year ended June 30, 2015
NOTE 9. PENSION PLANS, (continued)
each subsequent fiscal year. Employers are required to contribute at an actuarially determined rate in allFunds except the SACT. The actuarially determined employer contribution includes funding for cost-of-living adjustments and noncontributory death benefits in the PERS and TPAF. In the PERS and TPAF, theemployer contribution includes funding for post-retirement medical premiums.
During the year ended June 30, 2015 for TPAF, which is a cost sharing plan with special funding situations,annual pension cost equals annual required contribution. For PERS, which is a cost sharing multi-employerdefined benefit pension plan, the annual pension cost differs from the annual required contribution due tothe enactment of Chapter 114, P.L. 1997. TPAF employer contributions are made annually by the State ofNew Jersey to the pension system on behalf of the Board. PERS employer contributions are made annuallyby the Board to the pension system in accordance with Chapter 114, P.L. 1997.
The Board’s contribution to PERS AND DCRP, equal to the required contributions for each year as reportedin the fund based statements, were as follows:
YearEnding PERS DCRP6/30/15 $640,940 $21,7366/30/14 568,443 9,5216/30/13 609,132 4,038
The State of New Jersey contribution to TPAF (paid on-behalf of the District) for normal and post retirementbenefits have been included in the fund-based statements as revenues and expenditures in accordance withGASB 24, paragraphs 7 through 13, as follows:
YearEnding
PensionContributions
Post-RetirementMedical
ContributionsNCGI
Premium6/30/15 $1,313,105 $2,084,557 $88,1316/30/14 928,960 1,657,587 81,9966/30/13 1,477,770 1,758,902 77,751
In addition, the post-retirement medical benefits are included in the district-wide financial statements.
Also, in accordance with N.J.S.A. 18A:66-66 the State of New Jersey reimbursed the Board $1,796,079during the year ended June 30, 2015 for the employer’s share of social security contributions for TPAFmembers as calculated on their base salaries. This amount has been included in the fund-based statementsas revenues and expenditures in accordance with GASB 24, paragraphs 7 through 13.
-55-
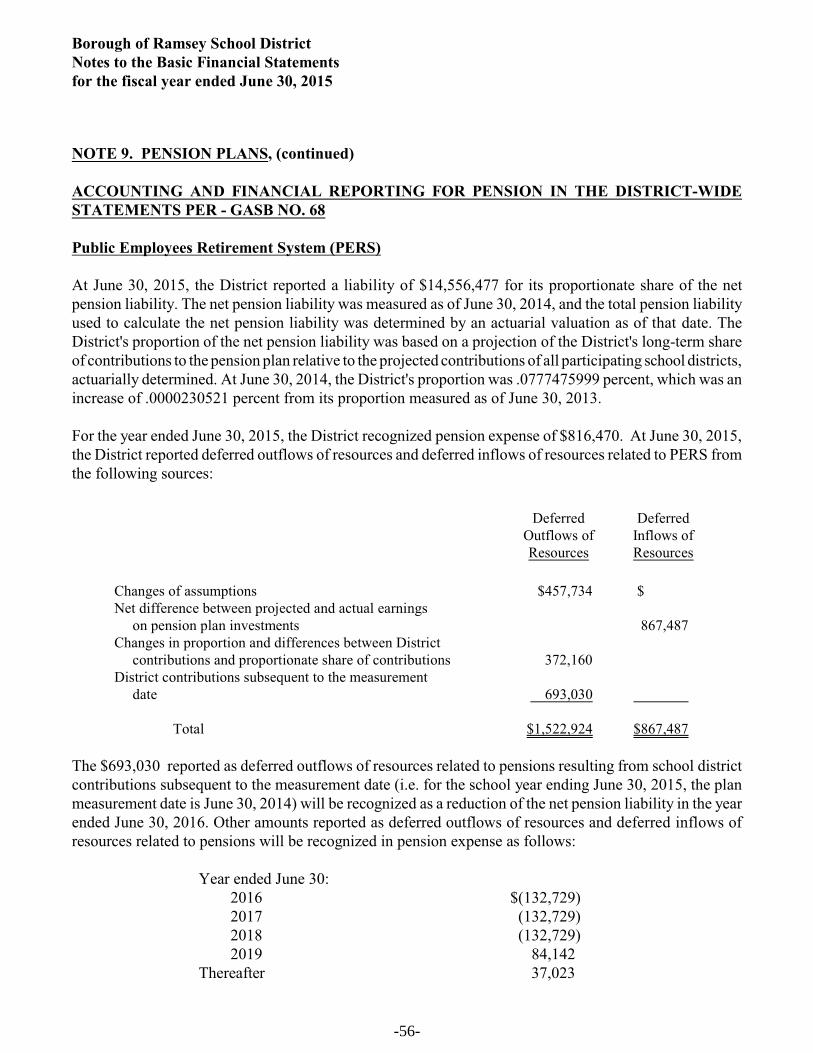
Borough of Ramsey School DistrictNotes to the Basic Financial Statementsfor the fiscal year ended June 30, 2015
NOTE 9. PENSION PLANS, (continued)
ACCOUNTING AND FINANCIAL REPORTING FOR PENSION IN THE DISTRICT-WIDESTATEMENTS PER - GASB NO. 68
Public Employees Retirement System (PERS)
At June 30, 2015, the District reported a liability of $14,556,477 for its proportionate share of the netpension liability. The net pension liability was measured as of June 30, 2014, and the total pension liabilityused to calculate the net pension liability was determined by an actuarial valuation as of that date. TheDistrict's proportion of the net pension liability was based on a projection of the District's long-term shareof contributions to the pension plan relative to the projected contributions of all participating school districts,actuarially determined. At June 30, 2014, the District's proportion was .0777475999 percent, which was anincrease of .0000230521 percent from its proportion measured as of June 30, 2013.
For the year ended June 30, 2015, the District recognized pension expense of $816,470. At June 30, 2015,the District reported deferred outflows of resources and deferred inflows of resources related to PERS fromthe following sources:
DeferredOutflows ofResources
DeferredInflows ofResources
Changes of assumptions $457,734 $ Net difference between projected and actual earnings on pension plan investments 867,487Changes in proportion and differences between District contributions and proportionate share of contributions 372,160District contributions subsequent to the measurement date 693,030
Total $1,522,924 $867,487
The $693,030 reported as deferred outflows of resources related to pensions resulting from school districtcontributions subsequent to the measurement date (i.e. for the school year ending June 30, 2015, the planmeasurement date is June 30, 2014) will be recognized as a reduction of the net pension liability in the yearended June 30, 2016. Other amounts reported as deferred outflows of resources and deferred inflows ofresources related to pensions will be recognized in pension expense as follows:
Year ended June 30:2016 $(132,729)2017 (132,729)2018 (132,729)2019 84,142
Thereafter 37,023
-56-

Borough of Ramsey School DistrictNotes to the Basic Financial Statementsfor the fiscal year ended June 30, 2015
NOTE 9. PENSION PLANS, (continued)
Additional Information
Local Group Collective balances at December 31, 2014 and 2013 are as follows:
Dec. 31, 2014 Dec. 31, 2013
Collective deferred outflows of resources $952,194,675 Not Available
Collective deferred inflows of resources 1,479,224,662 Not Available
Collective net pension liability18,722,735,003 $19,111,986,911
District's Proportion .0777475999% .0754423901%
Actuarial Assumptions
The total pension liability for the June 30, 2014 measurement date was determined by an actuarial valuationas of July 1, 2013, which rolled forward to June 30, 2014. The total pension liability for the July 1, 2013measurement date was determined by an actuarial valuation as of July 1, 2013. This actuarial valuation usedthe following assumptions, applied to all periods in the measurement.
Inflation 3.01 PercentSalary Increases: 2012-2021 2.15-4.40 Percent (based on age) Thereafter 3.15-5.40 Percent (based on age)
Investment Rate of Return 7.90 Percent
The actuarial assumptions used in the June 30, 2013 valuation were based on the results of an actuarialexperience study for the period July 1, 2008 to June 30, 2011.
Mortality Rates
Mortality rates were based on the RP-2000 Combined Healthy Male and Female Mortality Tables (setbackone year for females) with adjustments for mortality improvements from the base year of 2012 based onProjection Scale AA.
-57-
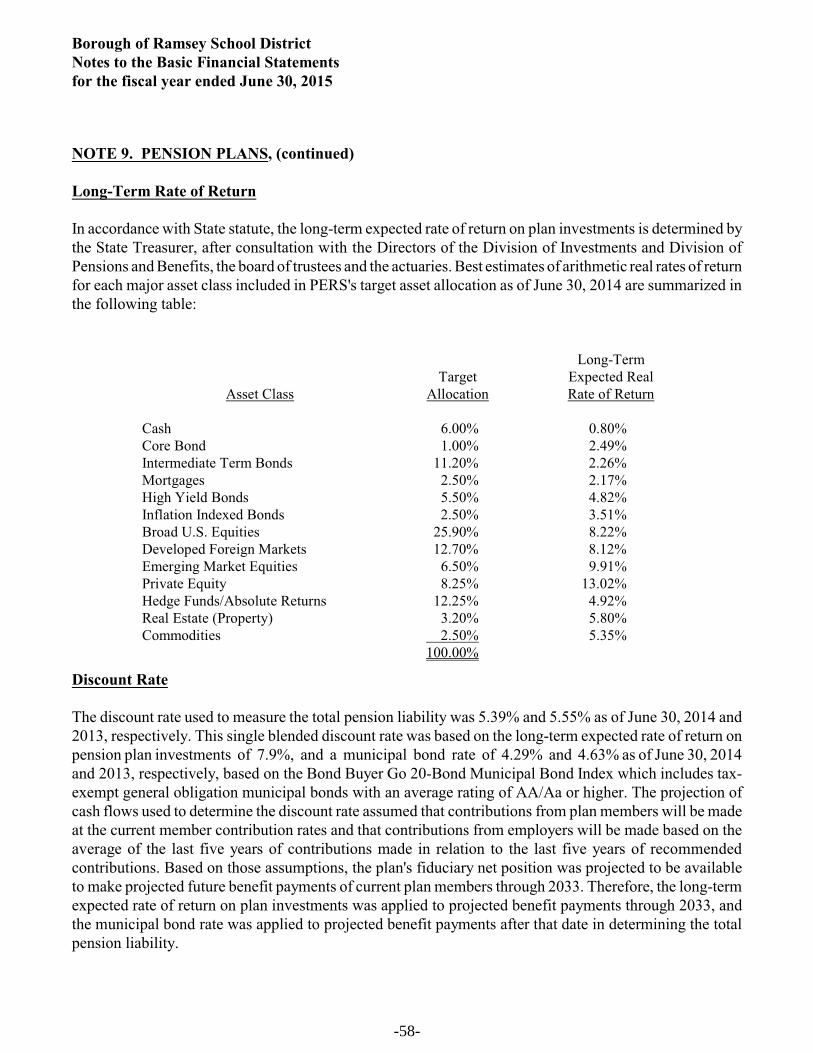
Borough of Ramsey School DistrictNotes to the Basic Financial Statementsfor the fiscal year ended June 30, 2015
NOTE 9. PENSION PLANS, (continued)
Long-Term Rate of Return
In accordance with State statute, the long-term expected rate of return on plan investments is determined bythe State Treasurer, after consultation with the Directors of the Division of Investments and Division ofPensions and Benefits, the board of trustees and the actuaries. Best estimates of arithmetic real rates of returnfor each major asset class included in PERS's target asset allocation as of June 30, 2014 are summarized inthe following table:
Asset ClassTarget
Allocation
Long-TermExpected RealRate of Return
Cash 6.00% 0.80%Core Bond 1.00% 2.49%Intermediate Term Bonds 11.20% 2.26%Mortgages 2.50% 2.17%High Yield Bonds 5.50% 4.82%Inflation Indexed Bonds 2.50% 3.51%Broad U.S. Equities 25.90% 8.22%Developed Foreign Markets 12.70% 8.12%Emerging Market Equities 6.50% 9.91%Private Equity 8.25% 13.02%Hedge Funds/Absolute Returns 12.25% 4.92%Real Estate (Property) 3.20% 5.80%Commodities 2.50% 5.35%
100.00%
Discount Rate
The discount rate used to measure the total pension liability was 5.39% and 5.55% as of June 30, 2014 and2013, respectively. This single blended discount rate was based on the long-term expected rate of return onpension plan investments of 7.9%, and a municipal bond rate of 4.29% and 4.63% as of June 30, 2014and 2013, respectively, based on the Bond Buyer Go 20-Bond Municipal Bond Index which includes tax-exempt general obligation municipal bonds with an average rating of AA/Aa or higher. The projection ofcash flows used to determine the discount rate assumed that contributions from plan members will be madeat the current member contribution rates and that contributions from employers will be made based on theaverage of the last five years of contributions made in relation to the last five years of recommendedcontributions. Based on those assumptions, the plan's fiduciary net position was projected to be availableto make projected future benefit payments of current plan members through 2033. Therefore, the long-termexpected rate of return on plan investments was applied to projected benefit payments through 2033, andthe municipal bond rate was applied to projected benefit payments after that date in determining the totalpension liability.
-58-

Borough of Ramsey School DistrictNotes to the Basic Financial Statementsfor the fiscal year ended June 30, 2015
NOTE 9. PENSION PLANS, (continued)
Sensitivity of the Collective Net Pension Liability to Changes in the Discount Rate
The following presents the collective net pension liability of the participating employers as of June 30, 2014respectively, calculated using the discount rate as disclosed above as well as what the collective net pensionliability would be if it was calculated using a discount rate that is 1 -percentage point lower or 1- percentage-point higher than the current rate:
June 30, 2014 1%
Decrease4.39%
At CurrentDiscount Rate
5.39%
1%Increase6.39%
District's proportionate share of the pension liability $18,312,544 $14,556,477 $11,402,337
Pension Plan Fiduciary Net Position
Detailed information about the pension plan’s fiduciary net position is available in the separately issuedFinancial Report for the State of New Jersey Public Employees Retirement System (PERS).
Teachers Pensions and Annuity Fund (TPAF)
The employer contributions for local participating employers are legally required to be funded by the Statein accordance with N.J.S.A 18:66-33. Therefore, these local participating employers are considered to bein a special funding situation as defined by GASB Statement No. 68 and the State is treated as anonemployer contributing entity. Since the local participating employers do not contribute directly to theplan (except for employer specific financed amounts), there is no net pension liability or deferred outflowsor inflows to report in the financial statements of the local participating employers. However, the notes tothe financial statements of the local participating employers must disclose the portion of the nonemployercontributing entities' total proportionate share of the net pension liability that is associated with the localparticipating employer.
The portion of the TPAF Net Pension Liability that was associated with the District recognized at June 30,2015 was as follows:
Net Pension Liability:District's proportionate share $ -0- State's proportionate share
associated with the District 127,723,517
$127,723,517
-59-
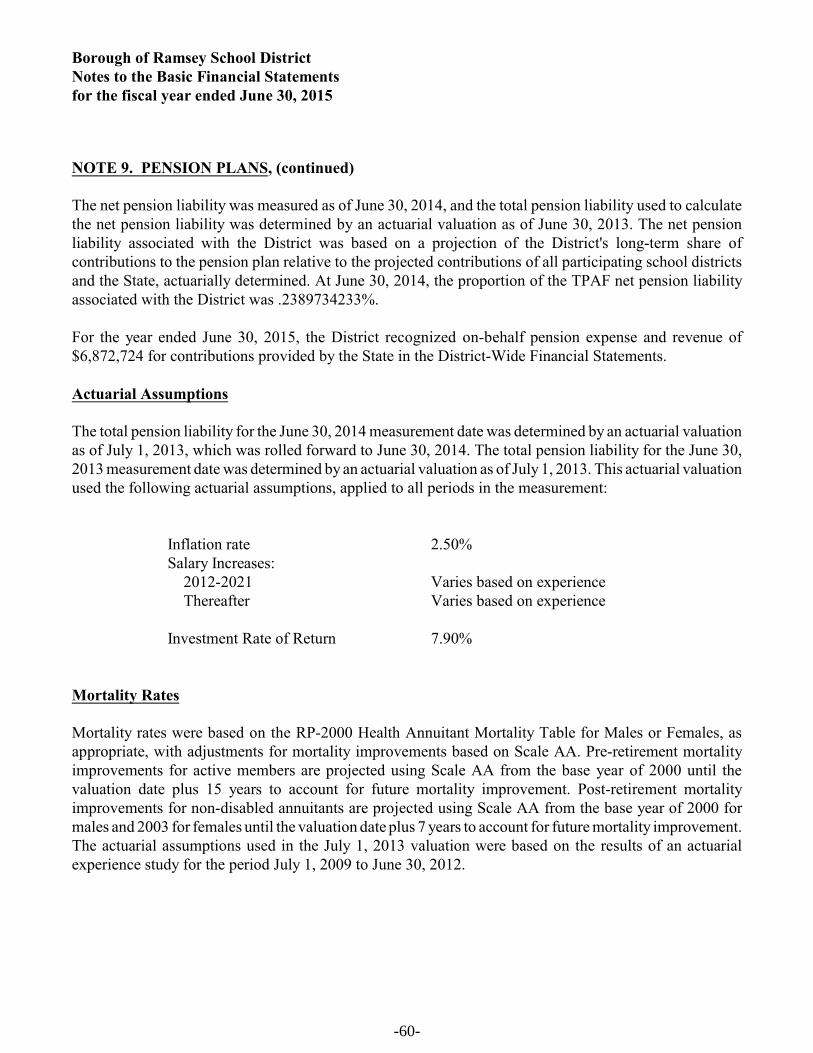
Borough of Ramsey School DistrictNotes to the Basic Financial Statementsfor the fiscal year ended June 30, 2015
NOTE 9. PENSION PLANS, (continued)
The net pension liability was measured as of June 30, 2014, and the total pension liability used to calculatethe net pension liability was determined by an actuarial valuation as of June 30, 2013. The net pensionliability associated with the District was based on a projection of the District's long-term share ofcontributions to the pension plan relative to the projected contributions of all participating school districtsand the State, actuarially determined. At June 30, 2014, the proportion of the TPAF net pension liabilityassociated with the District was .2389734233%.
For the year ended June 30, 2015, the District recognized on-behalf pension expense and revenue of$6,872,724 for contributions provided by the State in the District-Wide Financial Statements.
Actuarial Assumptions
The total pension liability for the June 30, 2014 measurement date was determined by an actuarial valuationas of July 1, 2013, which was rolled forward to June 30, 2014. The total pension liability for the June 30,2013 measurement date was determined by an actuarial valuation as of July 1, 2013. This actuarial valuationused the following actuarial assumptions, applied to all periods in the measurement:
Inflation rate 2.50%Salary Increases: 2012-2021 Varies based on experience Thereafter Varies based on experience
Investment Rate of Return 7.90%
Mortality Rates
Mortality rates were based on the RP-2000 Health Annuitant Mortality Table for Males or Females, asappropriate, with adjustments for mortality improvements based on Scale AA. Pre-retirement mortalityimprovements for active members are projected using Scale AA from the base year of 2000 until thevaluation date plus 15 years to account for future mortality improvement. Post-retirement mortalityimprovements for non-disabled annuitants are projected using Scale AA from the base year of 2000 formales and 2003 for females until the valuation date plus 7 years to account for future mortality improvement.The actuarial assumptions used in the July 1, 2013 valuation were based on the results of an actuarialexperience study for the period July 1, 2009 to June 30, 2012.
-60-

Borough of Ramsey School DistrictNotes to the Basic Financial Statementsfor the fiscal year ended June 30, 2015
NOTE 9. PENSION PLANS, (continued)
Long-Term Expected Rate of Return
In accordance with State statute, the long-term expected rate of return on plan investments is determined bythe State Treasurer, after consultation with the Directors of the Division of Investments and Division ofPensions and Benefits, the board of trustees and the actuaries. Best estimates of arithmetic real rates of returnfor each major asset class included in TPAF's target asset allocation as of June 30, 2014 are summarized inthe following table:
Asset ClassTarget
Allocation
Long-TermExpected RealRate of Return
Cash 6.00% 0.50%Core Fixed Income 0.00% 2.19%Core Bonds 1.00% 1.38%Short-Term Bonds 0.00% 1.00%Intermediate-Term Bonds 11.20% 2.60%Long-Term Bonds 0.00% 3.23%Mortgages 2.50% 2.84%High Yield Bonds 5.50% 4.15%Non-US Fixed Income 0.00% 1.41%Inflation-Indexed Bonds 2.50% 1.30%Broad US Equities 25.90% 5.88%Large Cap US Equities 0.00% 5.62%Mid Cap US Equities 0.00% 6.39%Small Cap US Equities 0.00% 7.39%Developed Foreign Equities 12.70% 6.05%Emerging Market Equities 6.50% 8.90%Private Equity 8.25% 9.15%Hedge Funds Absolute Return 12.25% 3.85%Real Estate (Property) 3.20% 4.43%Real Estate (REITS) 0.00% 5.58%Commodities 2.50% 3.60%Long Credit Bonds 0.00% 3.74%
100.00%
-61-

Borough of Ramsey School DistrictNotes to the Basic Financial Statementsfor the fiscal year ended June 30, 2015
NOTE 9. PENSION PLANS, (continued)
Discount Rate
The discount rate used to measure the total pension liability was 4.68% and 4.95% as of June 30, 2014 and2013, respectively. This single blended discount rate was based on the long-term expected rate of return onpension plan investments of 7.9%, and a municipal bond rate of 4.29% and 4.63% as of June 30, 2014and 2013, respectively, based on the Bond Buyer Go 20-Bond Municipal Bond Index which includes tax-exempt general obligation municipal bonds with an average rating of AA/Aa or higher. The projection ofcash flows used to determine the discount rate assumed that contributions from plan members will be madeat the current member contribution rates and that contributions from employers will be made based on theaverage of the last five years. Based on those assumptions, the plan's fiduciary net position was projectedto be available to make projected future benefit payments of current plan members through 2027. Therefore,the long-term expected rate of return on plan investments was applied to projected benefit payments through2027, and the municipal bond rate was applied to projected benefit payments after that date in determiningthe total pension liability. Sensitivity of the Net Pension Liability to Changes in the Discount Rate
Because the District's proportionate share of the net pension liability is zero, consideration of potentialchanges in the discount rate is not applicable to the District.
NOTE 10. POST-RETIREMENT BENEFITS
Chapter 384 of Public Laws 1987 and Chapter 6 of Public Laws 1990 required Teachers’ Pension andAnnuity Fund (TPAF) and the Public Employees’ Retirement System (PERS), respectively, to fund post-retirement medical benefits for those State employees who retire after accumulating 25 years of creditedservice or on a disability retirement. P.L. 2007, c.103 amended the law to eliminate the funding of post-retirement medical benefits through the TPAF and PERS. It created separate funds outside of the pensionplans for the funding and payment of post-retirement medical benefits for retired State employees and retirededucational employees. As of June 30, 2014, there were 103,432 retirees receiving post-retirement medicalbenefits, and the State contributed $1.04 billion on their behalf. The cost of these benefits is funded throughcontributions by the State in accordance with P.L. 1994 Chapter 62. Funding of post-retirement medicalpremiums changed from a prefunding basis to a pay-as-you-go basis beginning in fiscal year 1994.
The State is also responsible for the cost attributable to P.L. 1992 Chapter 126, which provides employerpaid health benefits to members of PERS and the Alternate Benefit Program who retired from a board ofeducation or county college with 25 years of service. The State paid $165.8 million toward Chapter 126benefits for 18,122 eligible retired members in Fiscal Year 2014.
-62-

Borough of Ramsey School DistrictNotes to the Basic Financial Statementsfor the fiscal year ended June 30, 2015
NOTE 11. DEFERRED COMPENSATION
The Board offers its employees a choice of the following deferred compensation plans created in accordancewith Internal Revenue Code Section 403(b). The plans, which are administered by the entities listed below,permits participants to defer a portion of their salary until future years. Amounts deferred under the plansare not available to employees until termination, retirement, death or unforeseeable emergency. The planadministrators are as follows:
AIM Fund Services EquitableAmerican United Life MFS FundsGuardian Insurance LincolnMass Mutual Merrill LynchMetropolitan Life TravlersPaul Revere Union Central LifeValic
NOTE 12. RISK MANAGEMENT
The District is exposed to various risks of loss related to torts; theft of, damage to, and destruction of assets;errors and omissions; injuries to employees; and natural disasters.
Property and Liability Insurance - The District maintains commercial insurance coverage for property,liability, student accident and surety bonds. A complete schedule of insurance coverage can be found in theStatistical Section of this Comprehensive Annual Financial Report.
There has been no significant reduction in insurance coverage from the previous year nor have there beenany settlements in excess of insurance coverages.
New Jersey Unemployment Compensation Insurance - The District has elected to fund its New JerseyUnemployment Compensation Insurance under the “Benefit Reimbursement Method”. Under this plan, theDistrict is required to reimburse the New Jersey Unemployment Trust Fund for benefits paid to its formeremployees and charged to its account with the State. The District is billed quarterly for amounts due to theState. The following is a summary of District contributions, employee contributions, reimbursements to theState for benefits paid and the ending balance of the District’s expendable trust fund for the current andprevious two years:
Fiscal Year
Interest Earnings/District
ContributionsEmployee
ContributionsAmount
ReimbursedEndingBalance
2014-2015 $189 $50,443 $46,119 $245,2312013-2014 235 49,476 58,009 240,7182012-2013 195 47,248 19,974 249,016
-63-

Borough of Ramsey School DistrictNotes to the Basic Financial Statementsfor the fiscal year ended June 30, 2015
NOTE 13. CAPITAL RESERVE ACCOUNT
A capital reserve account was established by the Borough of Ramsey Board of Education by inclusion of$502,000 on September 26, 2000 for the accumulation of funds for use as capital outlay expenditures insubsequent fiscal years. The capital reserve account is maintained in the general fund and its activity isincluded in the general fund annual budget.
Funds placed in the capital reserve account are restricted to capital projects in the district’s approved LongRange Facilities Plan (LRFP). A district may increase the balance in the capital reserve by appropriatingfunds in the annual general fund budget certified for taxes or by transfer by board resolution at year end ofany unanticipated revenue or unexpended line-item appropriation amounts, or both. A district may alsoappropriate additional amounts when the express approval of the voters has been obtained either by aseparate proposal at budget time or by a special question at one of the four special elections authorizedpursuant to N.J.S.A. 19:60-2. Pursuant to N.J.A.C. 6A:23A-14.1(g), the balance in the account cannot at anytime exceed the local support costs of uncompleted capital projects in its approved LRFP.
The activity of the capital reserve for the July 1, 2014 to June 30, 2015 fiscal year is as follows:
Beginning balance, July 1, 2014 $4,837,630Increased by: Budget Appropriation 1,822,671 Budget Approved by Resolution - June 30, 2015 500,000Decreased by: Transfer to Capital Projects 2,452,457Ending balance, June 30, 2015 $4,707,844
NOTE 14. FUND BALANCE APPROPRIATED
General Fund [Exhibit B-1] - Of the $10,887,274 General Fund fund balance at June 30, 2015, $5,038,219is reserved as excess surplus in accordance with N.J.S.A. 18A:7F-7 ($2,352,131 of the total reserve forexcess surplus has been appropriated and included as anticipated revenue for the year ending June 30, 2016);$4,707,844 has been reserved in the Capital Reserve Account; $186,080 has been designated by the Boardfor subsequent year’s expenditures; and $955,131 is unreserved and undesignated.
Debt Service Fund - The Debt Service Fund fund balance at June 30, 2015 of $12,235 is unreserved andundesignated.
-64-

Borough of Ramsey School DistrictNotes to the Basic Financial Statementsfor the fiscal year ended June 30, 2015
NOTE 15. CALCULATION OF EXCESS SURPLUS
In accordance with N.J.S.A. 18A:7F-7, as amended by P.L. 2004, c.73 (S1701) the designation for ReservedFund Balance — Excess Surplus is a required calculation pursuant to the New Jersey ComprehensiveEducational Improvement and Financing Act of 1996 (CEIFA). New Jersey school districts are required toreserve General Fund fund balance at the fiscal year end of June 30 if they did not appropriate a requiredminimum amount as budgeted fund balance in their subsequent years’ budget. The excess fund balance atJune 30, 2015 is $5,038,219. Of this amount, $2,686,088 is the result of current year operations.
NOTE 16. INVENTORY
Inventory in the Food Service Fund at June 30, 2015 consisted of the following:
Food $4,534Supplies 4,688
$9,222
The United States Department of Agriculture (USDA) commodity portion of the Food Service Fundinventory consists of food donated by USDA. It is valued at estimated market prices by USDA. The amountof unused commodities at year end is reported on Schedule A as deferred revenue.
NOTE 17. CONTINGENT LIABILITIES
Grant Programs - The school district participates in federally assisted grant programs. These programs aresubject to program compliance audits by the grantors or their representatives. The school district ispotentially liable for expenditures which may be disallowed pursuant to the terms of these grant programs. Management is not aware of any material items of noncompliance which would result in the disallowanceof program expenditures.
Litigation - The District is a party defendant in some lawsuits, none of a kind unusual for a school districtof its size and scope of operation. In the opinion of the Board's Attorney the potential claims against theDistrict not covered by insurance policies would not materially affect the financial condition of the District.
NOTE 18. SUBSEQUENT EVENTS
The District has evaluated subsequent events through October 14, 2015, the date which the financialstatements were available to be issued and no other items were noted for disclosure.
-65-

Borough of Ramsey School DistrictNotes to the Basic Financial Statementsfor the fiscal year ended June 30, 2015
NOTE 19. RETROACTIVE RESTATEMENT DUE TO UPDATED FIXED ASSET SCHEDULE
During fiscal year 2015, the District's fixed asset report was updated by the outside service provider to reflectadjustments not made prior to the issuance of the June 30, 2014 audit report. In addition, net for June 30,2014 was restated in the amount of $14,418,540 to reflect the net pension liability at June 30, 2014 for thePublic Employee Retirement System (PERS) as per Governmental Accounting Standards Board ("GASB")number 68. This resulted in the following restatements of net position and the capital asset schedule andthe Statement of Net Position as of June 30, 2015.
Balance
June 30, 2014 Restatement
Restated
Balance
June 30, 2014
Governmental Funds:
Assets:
Capital Assets Being Depreciates, Net $35,018,002 $(513,028) $34,504,974
Net Assets:
Net Investment in Capital Assets 18,278,215 (513,028) 17,765,187
Total Net Position 27,796,006 (513,028) 27,282,978
Prior Period Adjustment for Net Position
Liabilities (14,418,540)
Net Position at June 30, 2014 - Restated $12,864,438
Business-Type Activities:
Assets:
Capital Assets Being Depreciates, Net $46,391 $14,498 $60,889
Net Assets:
Net Investment in Capital Assets 46,391 14,498 60,889
Total Net Position 251,835 14,498 266,333
-66-

REQUIRED SUPPLEMENTARY
INFORMATION - PART II
BUDGETARY COMPARISON SCHEDULES

Page 1 of 5
Exhibit C-1
Budget
Original Transfers/ Final Variance
Budget Adjustments Budget Actual Final to Actual
REVENUES:
General Fund:
Revenues from Local Sources:
Local Tax Levy 48,971,745 48,971,745 48,971,745
Tuition 40,000 40,000 172,799 132,799
Tuition from Other LEAs Within the State 1,288,000 1,288,000 1,733,507 445,507
Transportation Fees from Individuals 21,000 21,000 30,941 9,941
Interest Earned on Capital Reserve Funds 5,000 5,000 (5,000)
Other Restricted Miscellaneous Revenues 65,000 65,000 (65,000)
Unrestricted Miscellaneous Revenues 60,000 60,000 71,148 11,148
Total - Local Sources 50,450,745 50,450,745 50,980,140 529,395
Revenues from State Sources:
Categorical Special Education Aid 1,124,738 1,124,738 1,124,738
Categorical Security Aid 42,203 42,203 42,203
Categorical Transportation Aid 73,635 73,635 73,635
Extraordinary Aid 380,000 380,000 339,433 (40,567)
Nonpublic Transportation 7,858 7,858
Other State Aids 53,440 53,440 53,440
On-behalf TPAF Post Retirement Medical Contributions (non-budgeted) 2,084,557 2,084,557
On-behalf TPAF Pension (non-budgeted) 1,224,974 1,224,974
On-behalf TPAF NCGI Premium (non-budgeted) 88,131 88,131
Reimbursed TPAF Social Security Contributions (non-budgeted) 1,796,079 1,796,079Total - State Sources 1,674,016 1,674,016 6,835,048 5,161,032
Revenues from Federal Sources:
Special Education Medicaid Initiative 3,108 3,108
Total - Federal Sources 3,108 3,108
TOTAL REVENUES 52,124,761 52,124,761 57,818,296 5,693,535
EXPENDITURES:
Current Expense:
Regular Programs - Instruction
Kindergarten - Salaries of Teachers 480,369 (86,000) 394,369 311,712 82,657
Grades 1-5 - Salaries of Teachers 5,905,385 (173,000) 5,732,385 5,731,318 1,067
Grades 6-8 - Salaries of Teachers 4,203,807 88,000 4,291,807 4,282,261 9,546
Grades 9-12 - Salaries of Teachers 7,050,623 (72,500) 6,978,123 6,955,460 22,663
Regular Programs - Home Instruction:
Salaries of Teachers 85,000 4,000 89,000 50,932 38,068
Purchased Professional-Educational Services 10,000 30,000 40,000 34,586 5,414
General Supplies 1,000 (500) 500 500
Regular Programs - Undistributed Instruction
Purchased Professional-Educational Services 112,900 335 113,235 76,254 36,981
Other Purchased Services (400-500 series) 68,608 690 69,298 63,096 6,202
General Supplies 395,113 (4,913) 390,200 374,498 15,702
Textbooks 325,201 (6,553) 318,648 303,647 15,001
Other Objects 6,213 6,213 3,722 2,491
TOTAL REGULAR PROGRAMS - INSTRUCTION 18,644,219 (220,441) 18,423,778 18,187,486 236,292
SPECIAL EDUCATION - INSTRUCTION
Learning and/or Language Disabilities
Salaries of Teachers 903,024 8,000 911,024 908,532 2,492
Other Salaries for Instruction 667,310 113,000 780,310 780,182 128
General Supplies 7,200 7,200 6,433 767
Total Learning and/or Language Disabilities 1,577,534 121,000 1,698,534 1,695,147 3,387
Multiple Disabilities
Salaries of Teachers 251,332 251,332 249,870 1,462
Other Salaries for Instruction 135,651 30,000 165,651 154,124 11,527
Other Purchased Services (400-500 Series) 56 56 54 2
General Supplies 2,521 2,521 1,642 879
Total Multiple Disabilities 389,560 30,000 419,560 405,690 13,870
Resource Room/Resource Center:
Salaries of Teachers 1,688,061 (40,200) 1,647,861 1,621,121 26,740
Other Salaries for Instruction 30,078 30,078 19,075 11,003
Other Purchased Services (400-500 Series) 2,100 2,100 2,099 1
General Supplies 21,475 21,475 18,734 2,741
Textbooks 9,030 (1,232) 7,798 5,758 2,040
Total Resource Room/Resource Center 1,750,744 (41,432) 1,709,312 1,666,787 42,525
RAMSEY BOARD OF EDUCATION
Budgetary Comparison Schedule
General Fund
Fiscal Year Ended June 30, 2015
-67-

Page 2 of 5
Exhibit C-1
Budget
Original Transfers/ Final Variance
Budget Adjustments Budget Actual Final to Actual
RAMSEY BOARD OF EDUCATION
Budgetary Comparison Schedule
General Fund
Fiscal Year Ended June 30, 2015
Preschool Disabilities- Full-Time:
Salaries of Teachers 124,353 124,353 122,927 1,426
Other Salaries for Instruction 218,410 36,000 254,410 224,690 29,720
General Supplies 3,500 3,500 3,401 99
Total Preschool Disabilities - Full-Time 346,263 36,000 382,263 351,018 31,245
Home Instruction:
Salaries of Teachers 30,000 30,000 30,000
Professional Svcs-Educational Services 1,000 1,000 455 545
Total Home Instruction 30,000 1,000 31,000 455 30,545
TOTAL SPECIAL EDUCATION - INSTRUCTION 4,094,101 146,568 4,240,669 4,119,097 121,572
Basic Skills/Remedial - Instruction
Salaries of Teachers 525,400 525,400 511,612 13,788
Other Salaries for Instruction 214,200 (51,000) 163,200 130,167 33,033
General Supplies 5,486 5,486 3,970 1,516
Total Basic Skills/Remedial - Instruction 745,086 (51,000) 694,086 645,749 48,337
Bilingual Education - Instruction
Salaries of Teachers 100,128 10,000 110,128 109,760 368
General Supplies 1,593 1,593 1,280 313
Textbooks 1,300 1,300 1,194 106
Total Bilingual Education - Instruction 103,021 10,000 113,021 112,234 787
School-Sponsored Co/Extra Curricular Activities - Instruction
Salaries 246,386 14,000 260,386 259,616 770
Purchased Services (300-500 series) 30,950 7,748 38,698 33,157 5,541
Supplies and Materials 6,874 3,312 10,186 8,581 1,605
Other Objects 3,300 2,000 5,300 4,930 370
Total School-Sponsored Co/Extra Curricular Activities - Instruction 287,510 27,060 314,570 306,284 8,286
School-Sponsored Athletics - Instruction
Salaries 589,560 589,560 575,072 14,488
Purchased Services (300-500 series) 119,806 6,200 126,006 123,956 2,050
Supplies and Materials 43,169 32,530 75,699 43,932 31,767
Other Objects 22,975 22,975 22,890 85
Total School-Sponsored Athletics - Instruction 775,510 38,730 814,240 765,850 48,390
TOTAL INSTRUCTION 24,649,447 (49,083) 24,600,364 24,136,700 463,664
Undistributed Expenditures - Instruction:
Tuition to Other LEAs Within the State - Special 766,250 40,000 806,250 791,137 15,113
Tuition to County Voc. School Dist. - Regular 186,296 11,000 197,296 196,975 321
Tuition to CSSD & Regional Day Schools 421,660 421,660 253,364 168,296
Tuition to Private Schools for the Disabled Within State 1,562,648 (167,000) 1,395,648 1,246,725 148,923
Tuition to Private School Disabled & Other LEAs - Spl, O/S State 91,000 40,000 131,000 124,681 6,319
Total Undistributed Expenditures - Instruction: 3,027,854 (76,000) 2,951,854 2,612,882 338,972
Undistributed Expend. - Attend. & Social Work
Salaries 44,160 44,160 43,686 474
Total Undistributed Expend. - Attend. & Social Work 44,160 44,160 43,686 474
Undist. Expend. - Health Services
Salaries 440,617 (4,100) 436,517 434,628 1,889
Purchased Professional and Technical Services 1,700 1,700 1,338 362
Other Purchased Services (400-500 Series) 473 473 466 7
Supplies and Materials 30,776 3,896 34,672 33,903 769
Other Objects 248 248 25 223
Total Undistributed Expenditures - Health Services 472,114 1,496 473,610 470,360 3,250
Undist. Expend. - Speech, OT, PT & Related Services
Salaries 664,887 664,887 661,057 3,830
Supplies and Materials 3,185 (375) 2,810 2,553 257
Total Undist. Expend. - Speech, OT, PT & Related Services 668,072 (375) 667,697 663,610 4,087
Undist. Expend. - Other Supp. Serv. Students - Extra Serv.
Salaries 332,417 332,417 317,654 14,763
Purchased Professional - Educational Services 450,000 25,000 475,000 473,129 1,871
Total Undist. Expend. - Other Supp. Serv. Students - Extra Serv. 782,417 25,000 807,417 790,783 16,634
Undist. Expend. - Guidance
Salaries of Other Professional Staff 971,916 11,000 982,916 970,653 12,263
Salaries of Secretarial and Clerical Assistants 194,229 194,229 181,220 13,009
Other Purchased Professional and Technical Services 124,000 (22,000) 102,000 94,748 7,252
Other Purchased Services (400-500 Series) 7,672 (1,500) 6,172 5,958 214
Supplies and Materials 20,097 20,097 19,414 683
Other Objects 1,685 1,685 1,670 15
Total Undist. Expend. - Guidance 1,319,599 (12,500) 1,307,099 1,273,663 33,436
Undist. Expend. - Child Study Teams
Salaries of Other Professional Staff 1,166,714 1,166,714 1,111,168 55,546
-68-

Page 3 of 5
Exhibit C-1
Budget
Original Transfers/ Final Variance
Budget Adjustments Budget Actual Final to Actual
RAMSEY BOARD OF EDUCATION
Budgetary Comparison Schedule
General Fund
Fiscal Year Ended June 30, 2015
Salaries of Secretarial and Clerical Assistants 143,531 143,531 137,412 6,119
Other Purchased Professional and Technical Services 75,000 84,000 159,000 91,764 67,236
Misc. Pur Services (400-500 Series) 13,476 13,476 10,953 2,523
Supplies and Materials 68,346 (274) 68,072 63,037 5,035
Other Objects 2,550 2,550 1,460 1,090
Total Undist. Expend. - Child Study Teams 1,469,617 83,726 1,553,343 1,415,794 137,549
Undist. Expend. - Improvement of Instructional Services
Salaries of Supervisors of Instruction 186,197 186,197 185,474 723
Salaries of Other Professional Staff 53,375 53,375 51,680 1,695
Purchased Prof-Educational Services 35,000 12,000 47,000 45,228 1,772
Other Purch Prof. and Tech. Services 9,000 9,000 9,000
Supplies and Materials 18,500 18,500 15,484 3,016
Total Undist. Expend. - Improvement of Inst. Services 302,072 12,000 314,072 297,866 16,206
Undist. Expend. - Educational Media Serv./Sch. Library
Salaries 1,045,755 (70,000) 975,755 956,388 19,367
Salaries of Technology Coordinators 113,223 2,000 115,223 115,032 191
Other Purchased Services (400-500) 39,576 (4,807) 34,769 31,835 2,934
Supplies and Materials 710,317 4,396 714,713 697,984 16,729
Other Objects 805 805 764 41
Total Undist. Expend. - Educational Media Serv./Sch. Library 1,909,676 (68,411) 1,841,265 1,802,003 39,262
Undist. Expend. - Instructional Staff Training Serv.
Salaries of Other Professional Staff 6,000 6,000 1,200 4,800
Purchased Professional - Educational Services 15,000 15,000 8,958 6,042
Other Purchased Services (400-500 Series) 40,000 (900) 39,100 35,959 3,141
Supplies and Materials 1,000 1,000 425 575
Other Objects 7,765 900 8,665 8,659 6
Total Undist. Expend. - Instructional Staff Training Serv. 69,765 69,765 55,201 14,564
Undist. Expend. - Supp. Serv. - General Administration
Salaries 439,065 439,065 406,891 32,174
Legal Services 93,000 7,000 100,000 99,554 446
Audit Fees 29,500 29,500 29,000 500
Architectural/Engineering Services 80,000 80,000 77,959 2,041
Other Purchased Professional Services 117,000 23,000 140,000 139,671 329
Purchased Technical Services 25,000 25,000 10,955 14,045
Communications/Telephone 68,600 68,600 48,717 19,883
BOE Other Purchased Services 5,500 5,500 61 5,439
Other Purch Services (400-500 Series) 264,422 264,422 218,756 45,666
General Supplies 69,000 69,000 26,498 42,502
Judgements Against The School District 25,000 25,000 3,100 21,900
Misc. Expenditures 6,500 6,500 4,736 1,764
BOE Membership Dues and Fees 31,500 31,500 22,868 8,632
Total Undist. Expend. - Supp. Serv. - General Administration 1,254,087 30,000 1,284,087 1,088,766 195,321
Undist. Expend. - Support Serv. - School Administration
Salaries of Principals/Assistant Principals 1,128,862 1,128,862 1,058,356 70,506
Salaries of Secretarial and Clerical Assistants 628,592 5,000 633,592 631,949 1,643
Purchased Professional and Technical Services 9,012 1,300 10,312 8,946 1,366
Other Purchased Services (400-500 series) 86,695 1,387 88,082 77,712 10,370
Supplies and Materials 129,193 (10,166) 119,027 104,668 14,359
Other Objects 7,237 3,116 10,353 9,183 1,170
Total Undist. Expend. - Support Serv. - School Administration 1,989,591 637 1,990,228 1,890,814 99,414
Undist. Expend. - Central Services
Salaries 435,004 435,004 429,518 5,486
Purchased Professional Services 8,500 3,000 11,500 10,375 1,125
Purchased Technical Services 3,000 3,000 3,000
Misc. Pur Services (400-500 Series) 21,600 21,600 14,440 7,160
Supplies and Materials 33,000 33,000 32,395 605
Miscellaneous Expenditures 2,000 2,000 1,434 566
Total Undist. Expend. - Central Services 503,104 3,000 506,104 488,162 17,942
Undist. Expend. - Admin Info. Technology
Information Technology
Purchased Technical Services 22,000 22,000 17,460 4,540
Total Undist. Expend. - Support Serv. - Administrative
Information Technology 22,000 22,000 17,460 4,540
Undist. Expend. - Required Maint. for School Facilities (261)
Salaries 413,042 27,000 440,042 361,878 78,164
Cleaning, Repair and Maintenance Services 262,460 (61,000) 201,460 201,450 10
General Supplies 41,300 41,300 27,177 14,123
Total Undist. Expend. - Required Maint. for School Facilities 716,802 (34,000) 682,802 590,505 92,297
Undist. Expend. - Oth. Oper. & Maint. of Plant (262)
Salaries 1,536,983 2,000 1,538,983 1,376,925 162,058
Salaries of Non-Instructional Aides 255,501 25,000 280,501 271,498 9,003
Cleaning, Repair and Maintenance Services 253,114 117,000 370,114 369,158 956
-69-
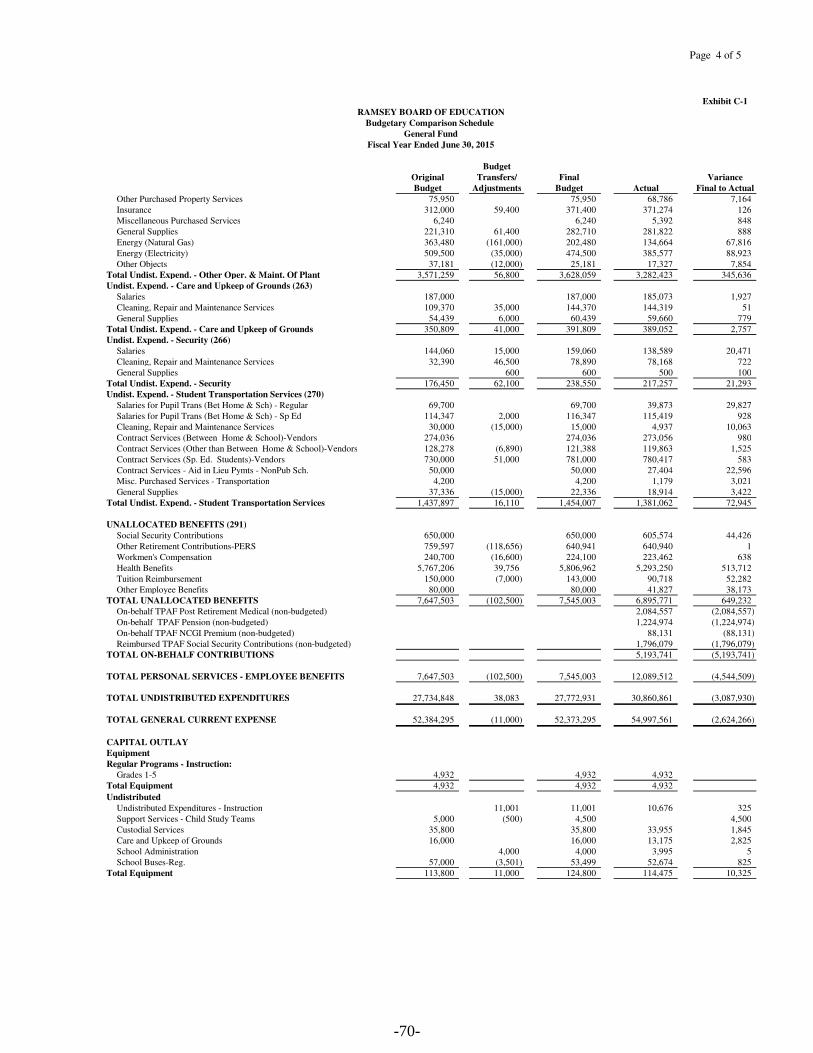
Page 4 of 5
Exhibit C-1
Budget
Original Transfers/ Final Variance
Budget Adjustments Budget Actual Final to Actual
RAMSEY BOARD OF EDUCATION
Budgetary Comparison Schedule
General Fund
Fiscal Year Ended June 30, 2015
Other Purchased Property Services 75,950 75,950 68,786 7,164
Insurance 312,000 59,400 371,400 371,274 126
Miscellaneous Purchased Services 6,240 6,240 5,392 848
General Supplies 221,310 61,400 282,710 281,822 888
Energy (Natural Gas) 363,480 (161,000) 202,480 134,664 67,816
Energy (Electricity) 509,500 (35,000) 474,500 385,577 88,923
Other Objects 37,181 (12,000) 25,181 17,327 7,854
Total Undist. Expend. - Other Oper. & Maint. Of Plant 3,571,259 56,800 3,628,059 3,282,423 345,636
Undist. Expend. - Care and Upkeep of Grounds (263)
Salaries 187,000 187,000 185,073 1,927
Cleaning, Repair and Maintenance Services 109,370 35,000 144,370 144,319 51
General Supplies 54,439 6,000 60,439 59,660 779
Total Undist. Expend. - Care and Upkeep of Grounds 350,809 41,000 391,809 389,052 2,757
Undist. Expend. - Security (266)
Salaries 144,060 15,000 159,060 138,589 20,471
Cleaning, Repair and Maintenance Services 32,390 46,500 78,890 78,168 722
General Supplies 600 600 500 100
Total Undist. Expend. - Security 176,450 62,100 238,550 217,257 21,293
Undist. Expend. - Student Transportation Services (270)
Salaries for Pupil Trans (Bet Home & Sch) - Regular 69,700 69,700 39,873 29,827
Salaries for Pupil Trans (Bet Home & Sch) - Sp Ed 114,347 2,000 116,347 115,419 928
Cleaning, Repair and Maintenance Services 30,000 (15,000) 15,000 4,937 10,063
Contract Services (Between Home & School)-Vendors 274,036 274,036 273,056 980
Contract Services (Other than Between Home & School)-Vendors 128,278 (6,890) 121,388 119,863 1,525
Contract Services (Sp. Ed. Students)-Vendors 730,000 51,000 781,000 780,417 583
Contract Services - Aid in Lieu Pymts - NonPub Sch. 50,000 50,000 27,404 22,596
Misc. Purchased Services - Transportation 4,200 4,200 1,179 3,021
General Supplies 37,336 (15,000) 22,336 18,914 3,422
Total Undist. Expend. - Student Transportation Services 1,437,897 16,110 1,454,007 1,381,062 72,945
UNALLOCATED BENEFITS (291)
Social Security Contributions 650,000 650,000 605,574 44,426
Other Retirement Contributions-PERS 759,597 (118,656) 640,941 640,940 1
Workmen's Compensation 240,700 (16,600) 224,100 223,462 638
Health Benefits 5,767,206 39,756 5,806,962 5,293,250 513,712
Tuition Reimbursement 150,000 (7,000) 143,000 90,718 52,282
Other Employee Benefits 80,000 80,000 41,827 38,173
TOTAL UNALLOCATED BENEFITS 7,647,503 (102,500) 7,545,003 6,895,771 649,232
On-behalf TPAF Post Retirement Medical (non-budgeted) 2,084,557 (2,084,557)
On-behalf TPAF Pension (non-budgeted) 1,224,974 (1,224,974)
On-behalf TPAF NCGI Premium (non-budgeted) 88,131 (88,131)
Reimbursed TPAF Social Security Contributions (non-budgeted) 1,796,079 (1,796,079)
TOTAL ON-BEHALF CONTRIBUTIONS 5,193,741 (5,193,741)
TOTAL PERSONAL SERVICES - EMPLOYEE BENEFITS 7,647,503 (102,500) 7,545,003 12,089,512 (4,544,509)
TOTAL UNDISTRIBUTED EXPENDITURES 27,734,848 38,083 27,772,931 30,860,861 (3,087,930)
TOTAL GENERAL CURRENT EXPENSE 52,384,295 (11,000) 52,373,295 54,997,561 (2,624,266)
CAPITAL OUTLAY
Equipment
Regular Programs - Instruction:
Grades 1-5 4,932 4,932 4,932
Total Equipment 4,932 4,932 4,932
Undistributed
Undistributed Expenditures - Instruction 11,001 11,001 10,676 325
Support Services - Child Study Teams 5,000 (500) 4,500 4,500
Custodial Services 35,800 35,800 33,955 1,845
Care and Upkeep of Grounds 16,000 16,000 13,175 2,825
School Administration 4,000 4,000 3,995 5
School Buses-Reg. 57,000 (3,501) 53,499 52,674 825
Total Equipment 113,800 11,000 124,800 114,475 10,325
-70-

Page 5 of 5
Exhibit C-1
Budget
Original Transfers/ Final Variance
Budget Adjustments Budget Actual Final to Actual
RAMSEY BOARD OF EDUCATION
Budgetary Comparison Schedule
General Fund
Fiscal Year Ended June 30, 2015
Facilities Acquisition and Construction Services
Construction Services 162,300 162,300 131,990 30,310
Assessment for Debt Service on SDA Funding 8,551 8,551 8,551
Total Facilities Acquisition and Construction Services 170,851 170,851 140,541 30,310
TOTAL CAPITAL OUTLAY 289,583 11,000 300,583 259,948 40,635
TOTAL EXPENDITURES 52,673,878 52,673,878 55,257,509 (2,583,631)
Excess (Deficiency) of Revenues
Over (Under) Expenditures (549,117) (549,117) 2,560,787 3,109,904
Other Financing Sources/(Uses):
Operating Transfers Out:
Capital Outlay - Transfer to Capital Projects
Capital Reserve - Transfer to Capital Projects (2,221,762) (230,695) (2,452,457) (2,452,457)
Total Other Financing Sources/(Uses): (2,221,762) (230,695) (2,452,457) (2,452,457)
Excess (Deficiency) of Revenues and Other Financing Sources
Over (Under) Expenditures and Other Financing Sources (Uses) (2,770,879) (230,695) (3,001,574) 108,330 3,109,904
Fund Balance, July 1 10,881,995 10,881,995 10,881,995
Fund Balance, June 30 8,111,116 (230,695) 7,880,421 10,990,325 3,109,904
Recapitulation of Excess (Deficiency) of Revenues Over (Under) Expenditures
Adjustment for Prior Year Encumbrances
Increase in Capital Reserve:
Principal 1,817,671 1,817,671 2,322,671 505,000
Interest Deposit to Capital Reserve 5,000 5,000 (5,000)
Withdrawal from Capital Reserve (2,221,762) (230,695) (2,452,457) (2,452,457)
Budgeted Fund Balance (2,371,788) (2,371,788) 238,116 2,609,904
(2,770,879) (230,695) (3,001,574) 108,330 3,109,904
Recapitulation:
Restricted Fund Balance:
Excess Surplus - Current Year 2,686,088
Legally Restricted - Excess Surplus - Designated for Subsequent
Year's Expenditures 2,352,131
Capital Reserve 4,707,844
Assigned Fund Balance:
Designated for Subsequent Year's Expenditures 186,080
Unassigned Fund Balance 1,058,182
Total Fund Balance per Governmental Funds (Budgetary) 10,990,325
Recapitulation to Governmental Fund Statement (GAAP):
Less: Last State Aid Payment not Recognized GAAP Basis 103,051
Total Fund Balance per Governmental Funds (GAAP) 10,887,274
-71-

Ex
hib
it C
-2
RA
MS
EY
BO
AR
D O
F E
DU
CA
TIO
N
Bu
dg
eta
ry
Co
mp
aris
on
Sch
ed
ule
Sp
ecia
l R
even
ue F
un
d
Fis
ca
l Y
ea
r E
nd
ed
Ju
ne 3
0, 2
01
5
Bud
get
Ori
gin
alT
ransf
ers/
Fin
alV
aria
nce
Bud
get
Ad
just
men
tsB
ud
get
Act
ual
Fin
al t
o A
ctual
RE
VE
NU
ES
:
Sta
te S
ourc
es3
27
,84
8
64
,60
0
39
2,4
48
32
6,7
29
(65
,71
9)
Fed
eral
Sourc
es8
12
,08
9
44
,85
9
85
6,9
48
85
6,9
48
-
To
tal
Reven
ues
1,1
39
,93
7
10
9,4
59
1,2
49
,39
6
1,1
83
,67
7
(65
,71
9)
EX
PE
ND
ITU
RE
S:
Inst
ru
cti
on
:
S
alar
ies
of
Tea
cher
s2
0,9
15
(5,2
74
)
15
,64
1
15
,64
1
-
O
ther
Purc
has
ed S
ervic
es (
40
0-5
00
ser
ies)
54
3,9
74
42
,41
6
58
6,3
90
58
6,3
90
-
G
ener
al S
up
pli
es1
16
,23
1
(16
,19
9)
10
0,0
32
10
1,3
52
(1,3
20
)
T
extb
ook
s4
2,5
63
3,3
14
45
,87
7
43
,52
4
2,3
53
To
tal
inst
ru
cti
on
72
3,6
83
24
,25
7
74
7,9
40
74
6,9
07
1,0
33
Su
pp
ort
servic
es:
O
ther
Sal
arie
s fo
r In
stru
ctio
n-
23
,30
9
23
,30
9
23
,30
9
-
P
erso
nal
Ser
vic
es -
Em
plo
yee
Ben
efit
s1
,60
0
5,6
58
7,2
58
7,2
58
-
P
urc
has
ed P
rofe
ssio
nal
- E
duca
tional
Ser
vic
es2
89
,54
5
18
1,3
44
47
0,8
89
40
6,2
03
64
,68
6
O
ther
Purc
has
ed S
ervic
es (
40
0-5
00
ser
ies)
12
5,1
09
(12
5,1
09
)
-
-
To
tal
sup
po
rt
servic
es
41
6,2
54
85
,20
2
50
1,4
56
43
6,7
70
64
,68
6
To
tal
Ex
pen
dit
ures
1,1
39
,93
7
10
9,4
59
1,2
49
,39
6
1,1
83
,67
7
65
,71
9
Ex
cess
(D
efi
cien
cy
) o
f R
even
ues
Over (
Un
der)
Ex
pen
dit
ures
an
d O
ther F
ina
ncin
g S
ou
rces
(Use
s)-
-
-
-
-
-72-
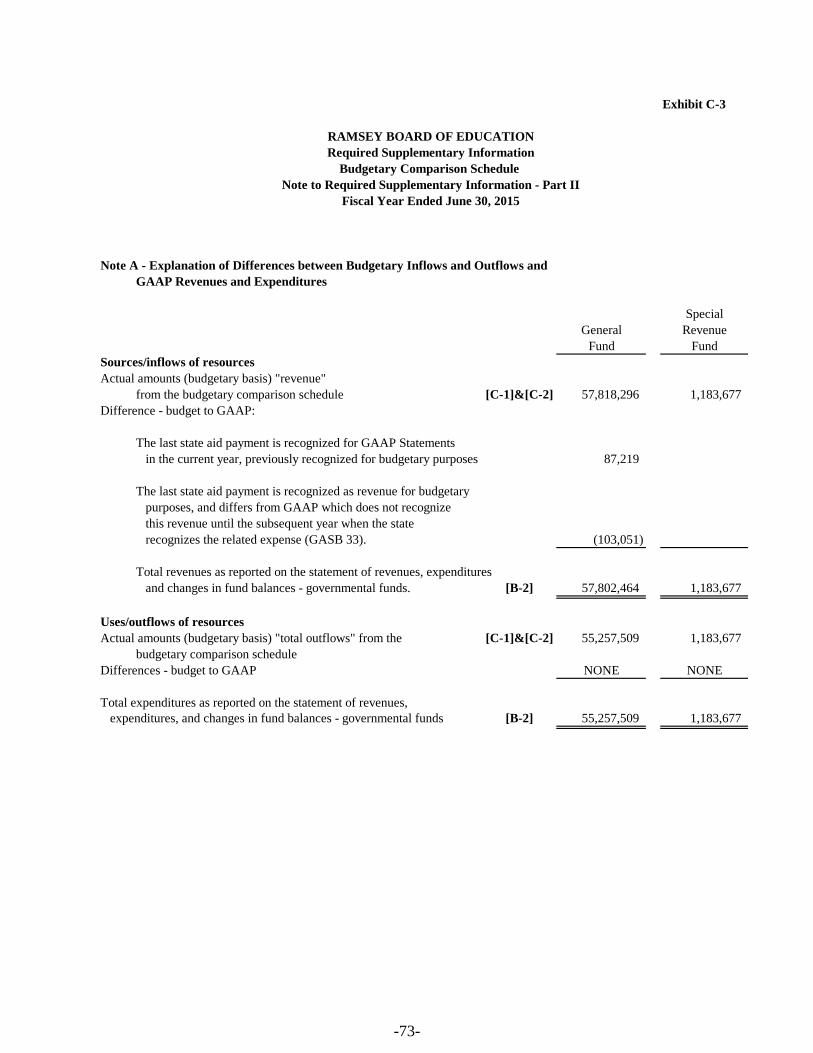
Exhibit C-3
Note A - Explanation of Differences between Budgetary Inflows and Outflows and
GAAP Revenues and Expenditures
Special
General Revenue
Fund Fund
Sources/inflows of resources
Actual amounts (budgetary basis) "revenue"
from the budgetary comparison schedule [C-1]&[C-2] 57,818,296 1,183,677
Difference - budget to GAAP:
The last state aid payment is recognized for GAAP Statements
in the current year, previously recognized for budgetary purposes 87,219
The last state aid payment is recognized as revenue for budgetary
purposes, and differs from GAAP which does not recognize
this revenue until the subsequent year when the state
recognizes the related expense (GASB 33). (103,051)
Total revenues as reported on the statement of revenues, expenditures
and changes in fund balances - governmental funds. [B-2] 57,802,464 1,183,677
Uses/outflows of resources
Actual amounts (budgetary basis) "total outflows" from the [C-1]&[C-2] 55,257,509 1,183,677
budgetary comparison schedule
Differences - budget to GAAP NONE NONE
Total expenditures as reported on the statement of revenues,
expenditures, and changes in fund balances - governmental funds [B-2] 55,257,509 1,183,677
Fiscal Year Ended June 30, 2015
RAMSEY BOARD OF EDUCATION
Required Supplementary Information
Budgetary Comparison Schedule
Note to Required Supplementary Information - Part II
-73-
REQUIRED SUPPLEMENTARY
INFORMATION - PART III
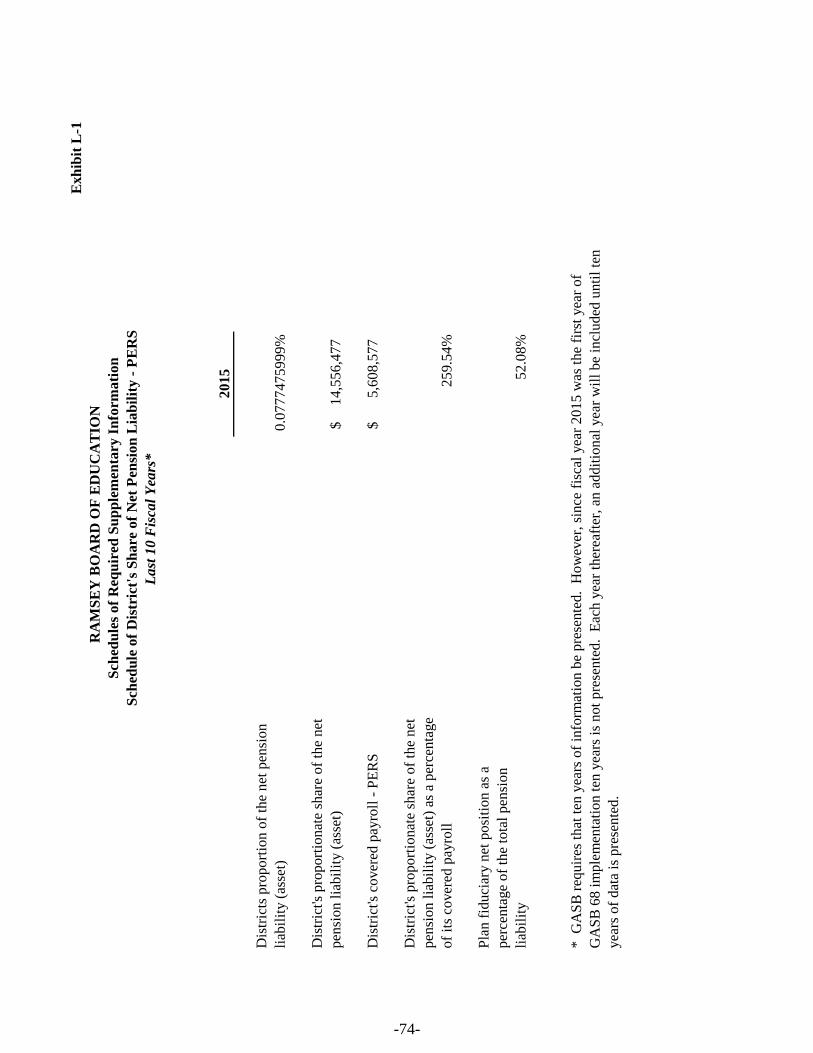
Exh
ibit
L-1
Sch
edu
les
of
Req
uir
ed S
up
ple
men
tary
In
form
ati
on
Sch
edu
le o
f D
istr
ict'
s S
hare
of
Net
Pen
sion
Lia
bil
ity -
PE
RS
Last
10 F
iscal
Yea
rs*
2015
Dis
tric
ts p
rop
ort
ion
of
the
net
pen
sio
n
liab
ilit
y (
asse
t)0.0
777475
99
9%
Dis
tric
t's p
rop
ort
ion
ate
shar
e o
f th
e n
et
pen
sion l
iab
ilit
y (
asse
t)14,5
56,4
77
$
Dis
tric
t's c
over
ed p
ayro
ll -
PE
RS
5,6
08,5
77
$
Dis
tric
t's p
rop
ort
ion
ate
shar
e o
f th
e n
et
pen
sion l
iab
ilit
y (
asse
t) a
s a
per
cen
tage
of
its
cover
ed p
ayro
ll259.5
4%
Pla
n f
iduci
ary n
et p
osi
tio
n a
s a
per
centa
ge
of
the
tota
l p
ensi
on
liab
ilit
y52
.08
%
*
GA
SB
req
uir
es t
hat
ten
yea
rs o
f in
form
atio
n b
e pre
sente
d.
How
ever
, si
nce
fis
cal
yea
r 2015 w
as t
he
firs
t yea
r o
f
GA
SB
68 i
mp
lem
enta
tio
n t
en y
ears
is
not
pre
sente
d.
Eac
h y
ear
ther
eaft
er,
an a
ddit
ional
yea
r w
ill
be
incl
ud
ed u
nti
l te
n
yea
rs o
f dat
a is
pre
sen
ted
.
RA
MS
EY
BO
AR
D O
F E
DU
CA
TIO
N
-74-

Exh
ibit
L-2
Sch
edu
les
of
Req
uir
ed S
up
ple
men
tary
In
form
ati
on
Sch
edu
le o
f D
istr
ict'
s C
on
trib
uti
on
s -
PE
RS
Last
10 F
iscal
Yea
rs*
2015
Contr
actu
ally
req
uir
ed c
on
trib
uti
on
640,9
40.0
0$
Contr
ibuti
on
s in
rel
atio
n t
o t
he
contr
actu
ally
req
uir
ed c
on
trib
uti
on
(640,9
40.0
0)
$
Contr
ibuti
on
def
icie
ncy
(ex
cess
)-
$
Dis
tric
t's c
over
ed p
ayro
ll -
PE
RS
5,6
08,5
77
$
Contr
ibuti
on
s as
a p
erce
nta
ge
of
11.4
3%
cover
ed p
ayro
ll
*
GA
SB
req
uir
es t
hat
ten
yea
rs o
f in
form
atio
n b
e pre
sente
d.
How
ever
, si
nce
fis
cal
yea
r 2015 w
as t
he
firs
t yea
r o
f
GA
SB
68 i
mp
lem
enta
tio
n t
en y
ears
is
not
pre
sente
d.
Eac
h y
ear
ther
eaft
er,
an a
ddit
ional
yea
r w
ill
be
incl
ud
ed u
nti
l te
n
yea
rs o
f dat
a is
pre
sen
ted
.
RA
MS
EY
BO
AR
D O
F E
DU
CA
TIO
N
-75-

Exh
ibit
L-3
Sch
edu
les
of
Req
uir
ed S
up
ple
men
tary
In
form
ati
on
Sch
edu
le o
f D
istr
ict'
s S
hare
of
Net
Pen
sion
Lia
bil
ity -
TP
AF
Last
10 F
iscal
Yea
rs*
2015
Dis
tric
ts p
rop
ort
ion
of
the
net
pen
sio
n
liab
ilit
y (
asse
t)0.2
38973423
3%
Dis
tric
t's p
rop
ort
ion
ate
shar
e o
f th
e n
et
pen
sion l
iab
ilit
y (
asse
t)-
$
Sta
te's
pro
po
rtio
nat
e sh
are
of
the
net
pen
sion l
iab
ilit
y A
sso
ciat
ed w
ith
th
e D
istr
ict
(ass
et)
127,7
23,5
17
$
Dis
tric
t's c
over
ed p
ayro
ll -
TP
AF
25,0
46,1
27
$
Dis
tric
t's p
rop
ort
ion
ate
shar
e o
f th
e n
et
pen
sion l
iab
ilit
y (
asse
t) a
s a
per
cen
tage
of
its
cover
ed p
ayro
ll0.0
0%
Pla
n f
iduci
ary n
et p
osi
tio
n a
s a
per
centa
ge
of
the
tota
l p
ensi
on
liab
ilit
y33.6
4%
*
GA
SB
req
uir
es t
hat
ten
yea
rs o
f in
form
atio
n b
e pre
sente
d.
How
ever
, si
nce
fis
cal
yea
r 2015 w
as t
he
firs
t yea
r o
f
GA
SB
68 i
mp
lem
enta
tio
n t
en y
ears
is
not
pre
sente
d.
Eac
h y
ear
ther
eaft
er,
an a
ddit
ional
yea
r w
ill
be
incl
ud
ed u
nti
l te
n
yea
rs o
f dat
a is
pre
sen
ted
.
RA
MS
EY
BO
AR
D O
F E
DU
CA
TIO
N
-76-

Exhibit L-4
Note to Required Schedules of Supplementary Information - Part III
PUBLIC EMPLOYEES RETIREMENT SYSTEM (PERS)
Change in benefit terms
None
Change in assumptions
The calculation of the discount rate used to measure the total
pension liability is dependent upon the long·term expected rate
of return, and the municipal bond index rate. There was a change
in the municipal bond index rate from the prior measurement date
(4.63%) to the current measurement date (4.29%), resulting in a
change in the discount rate from 5.55% to 5.39%. This change in the
discount rate is considered to be a change in actuarial assumptions
under GASBS No. 68.
TEACHERS PENSION AND ANNUITY FUND (TPAF)
Change in benefit terms
Change in assumptions
The calculation of the discount rate used to measure the total
pension liability is dependent upon the long·term expected rate
of return, and the municipal bond index rate. There was a change
in the municipal bond index rate from the prior measurement date
(4.63%) to the current measurement date (4.29%), resulting in a
change in the discount rate from 4.95% to 4.68%. This change in the
discount rate is considered to be a change in actuarial assumptions
under GASBS No. 68.
RAMSEY BOARD OF EDUCATION
Fiscal Year Ended June 30, 2015
-77-

SPECIAL REVENUE FUND

Exh
ibit
E-1
RA
MS
EY
BO
AR
D O
F E
DU
CA
TIO
N
Sp
ecia
l R
even
ue
Fu
nd
Com
bin
ing S
ched
ule
of
Pro
gra
m R
even
ues
an
d E
xp
end
itu
res
- B
ud
get
ary
Ba
sis
Fis
cal
Yea
r E
nd
ed J
un
e 30,
2015
Tota
lT
itle
II,
Pa
rt A
Bro
ugh
tT
each
er &
Forw
ard
I.D
.E.A
Part
BT
itle
I,
Pri
nci
pa
l T
rain
ing
To
tals
(Ex.
E-1
a)
Basi
cP
resc
hool
Pa
rt A
& R
ecru
itin
g2
01
5
RE
VE
NU
ES
S
tate
Sourc
es326,7
29
32
6,7
29
F
eder
al S
ourc
es-
727,4
03
30,5
00
42
,64
0
5
6,4
05
85
6,9
48
T
ota
l R
even
ues
326,7
29
727,4
03
30,5
00
42
,64
0
5
6,4
05
1,1
83
,67
7
EX
PE
ND
ITU
RE
S:
Inst
ruct
ion
:
S
alar
ies
of
Tea
cher
s-
15
,64
1
1
5,6
41
O
ther
Purc
has
ed S
ervic
es (
400-5
00 s
erie
s)-
586,3
90
5
86
,39
0
G
ener
al S
uppli
es24,5
01
13,3
29
1,1
30
25
,80
2
3
6,5
90
10
1,3
52
T
extb
ooks
43,5
24
43
,52
4
Tota
l in
stru
ctio
n68,0
25
599,7
19
1,1
30
41
,44
3
3
6,5
90
74
6,9
07
Su
pp
ort
ser
vic
es:
O
ther
Sal
arie
s fo
r In
stru
ctio
n-
23,3
09
23
,30
9
P
erso
nal
Ser
vic
es -
Em
plo
yee
Ben
efit
s-
6,0
61
1,1
97
7
,25
8
P
urc
has
ed P
rofe
ssio
nal
- E
duca
tion
al S
ervic
es258,7
04
127,6
84
1
9,8
15
40
6,2
03
Tota
l su
pp
ort
ser
vic
es258,7
04
127,6
84
29,3
70
1,1
97
1
9,8
15
43
6,7
70
Tota
l E
xp
end
itu
res
326,7
29
727,4
03
30,5
00
42
,64
0
5
6,4
05
1,1
83
,67
7
Exce
ss (
Def
icie
ncy
) of
Rev
enu
es O
ver
(U
nd
er)
E
xp
end
itu
res
an
d O
ther
Fin
an
cin
g S
ou
rces
(U
ses)
-
-
-
-
-
-
-78-

Exh
ibit
E-1
a
RA
MS
EY
BO
AR
D O
F E
DU
CA
TIO
N
Sp
ecia
l R
even
ue
Fu
nd
Com
bin
ing S
ched
ule
of
Pro
gra
m R
even
ues
an
d E
xp
end
itu
res
- B
ud
get
ary
Ba
sis
Fis
cal
Yea
r E
nd
ed J
un
e 30,
2015
N.J
. N
on
pu
bli
c
Au
xil
iary
Tota
lN
.J.
N.J
.N
.J.
Ser
vic
es
Bro
ugh
tN
on
pu
bli
cN
on
pu
bli
cN
on
pu
bli
cC
ha
pte
r 1
92
To
tal
Forw
ard
Tex
tbook
Nu
rsin
gT
ech
no
log
yC
om
pen
sato
ryC
arr
ied
(Ex.
E-1
b)
Aid
Aid
Aid
Ed
uca
tio
nF
orw
ard
RE
VE
NU
ES
S
tate
Sourc
es115,2
33
43,5
24
105,7
58
24
,50
1
37
,71
3
3
26
,72
9
F
eder
al S
ourc
es-
-
T
ota
l R
even
ues
115,2
33
43,5
24
105,7
58
24
,50
1
37
,71
3
3
26
,72
9
EX
PE
ND
ITU
RE
S:
Inst
ruct
ion
:
S
alar
ies
of
Tea
cher
s-
-
O
ther
Purc
has
ed S
ervic
es (
400-5
00 s
erie
s)-
-
G
ener
al S
uppli
es-
24
,50
1
24
,50
1
T
extb
ooks
-
43,5
24
43
,52
4
Tota
l in
stru
ctio
n-
43,5
24
24
,50
1
-
6
8,0
25
Su
pp
ort
ser
vic
es:
O
ther
Sal
arie
s fo
r In
stru
ctio
n-
-
P
erso
nal
Ser
vic
es -
Em
plo
yee
Ben
efit
s-
-
P
urc
has
ed P
rofe
ssio
nal
- E
duca
tional
Ser
vic
es115,2
33
105,7
58
37
,71
3
2
58
,70
4
Tota
l su
pp
ort
ser
vic
es115,2
33
-
105,7
58
-
3
7,7
13
2
58
,70
4
Tota
l E
xp
end
itu
res
115,2
33
43,5
24
105,7
58
24
,50
1
37
,71
3
3
26
,72
9
Exce
ss (
Def
icie
ncy
) of
Rev
enu
es O
ver
(U
nd
er)
E
xp
end
itu
res
an
d O
ther
Fin
an
cin
g S
ou
rces
(U
ses)
-
-
-
-
-
-
-79-

Exh
ibit
E-1
b
RA
MS
EY
BO
AR
D O
F E
DU
CA
TIO
N
Sp
ecia
l R
even
ue
Fu
nd
Co
mb
inin
g S
ched
ule
of
Pro
gra
m R
even
ues
an
d E
xp
end
itu
res
- B
ud
get
ary
Basi
s
Fis
cal
Yea
r E
nd
ed J
un
e 3
0,
20
15
Tota
l
Su
pp
lem
enta
lE
xa
min
ati
on
&C
orr
ecti
ve
Carr
ied
Inst
ruct
ion
Cla
ssif
icati
on
Sp
eech
Forw
ard
RE
VE
NU
ES
S
tate
So
urc
es2
2,9
92
69,3
58
22,8
83
115,2
33
F
eder
al S
ou
rces
-
Tota
l R
even
ues
22
,99
2
69,3
58
22,8
83
115,2
33
EX
PE
ND
ITU
RE
S:
Inst
ruct
ion
:
S
alar
ies
of
Tea
cher
s-
O
ther
Pu
rch
ased
Ser
vic
es (
40
0-5
00
ser
ies)
-
G
ener
al S
up
pli
es-
T
extb
oo
ks
-
To
tal
inst
ruct
ion
-
-
-
-
Su
pp
ort
ser
vic
es:
O
ther
Sal
arie
s fo
r In
stru
ctio
n-
P
erso
nal
Ser
vic
es -
Em
plo
yee
Ben
efit
s-
P
urc
has
ed P
rofe
ssio
nal
- E
du
cati
on
al S
ervic
es2
2,9
92
69,3
58
22,8
83
115,2
33
To
tal
sup
po
rt s
erv
ices
22
,99
2
69,3
58
22,8
83
115,2
33
-
To
tal
Ex
pen
dit
ure
s2
2,9
92
69,3
58
22,8
83
115,2
33
Ex
cess
(D
efic
ien
cy)
of
Rev
enu
es O
ver
(U
nd
er)
E
xp
end
itu
res
an
d O
ther
Fin
an
cin
g S
ou
rces
(U
ses)
-
-
-
-
N.J
. N
on
pu
bli
c H
an
dic
ap
ped
Ser
vic
es,
Ch
ap
ter
193
-80-
CAPITAL PROJECTS FUND

Exhibit F-1
RAMSEY BOARD OF EDUCATION
Capital Projects Fund
Summary Schedule of Revenues, Expenditures, and Changes
in Fund Balance-Budgetary Basis
Fiscal Year Ended June 30, 2015
Revenues and Other Financing Sources
State Sources - SCC Grant 681,175
Bond proceeds and transfers -
Transfers from Capital Reserve 2,452,457
Transfers from Capital Outlay -
Interest on Investments 213
3,133,845
Expenditures and Other Financing Uses
Purchased professional and technical services -
Land and improvements -
Construction services 1,886,908
Equipment purchases 906,971
Transfer to Capital Reserve -
Transfer to Debt Service Fund 213
2,794,092
Excess (deficiency) of revenues over (under) expenditures 339,753
Fund balance - beginning 152,984
Fund balance - ending 492,737
Recapitulation:
Unrestricted Fund Balance 492,737
Reconciliation to Governmental Funds Statements (GAAP):
SDA Grant Receivable not Recognized on GAAP Basis (165,282)
Fund Balance per Governmental Funds 327,455
-81-
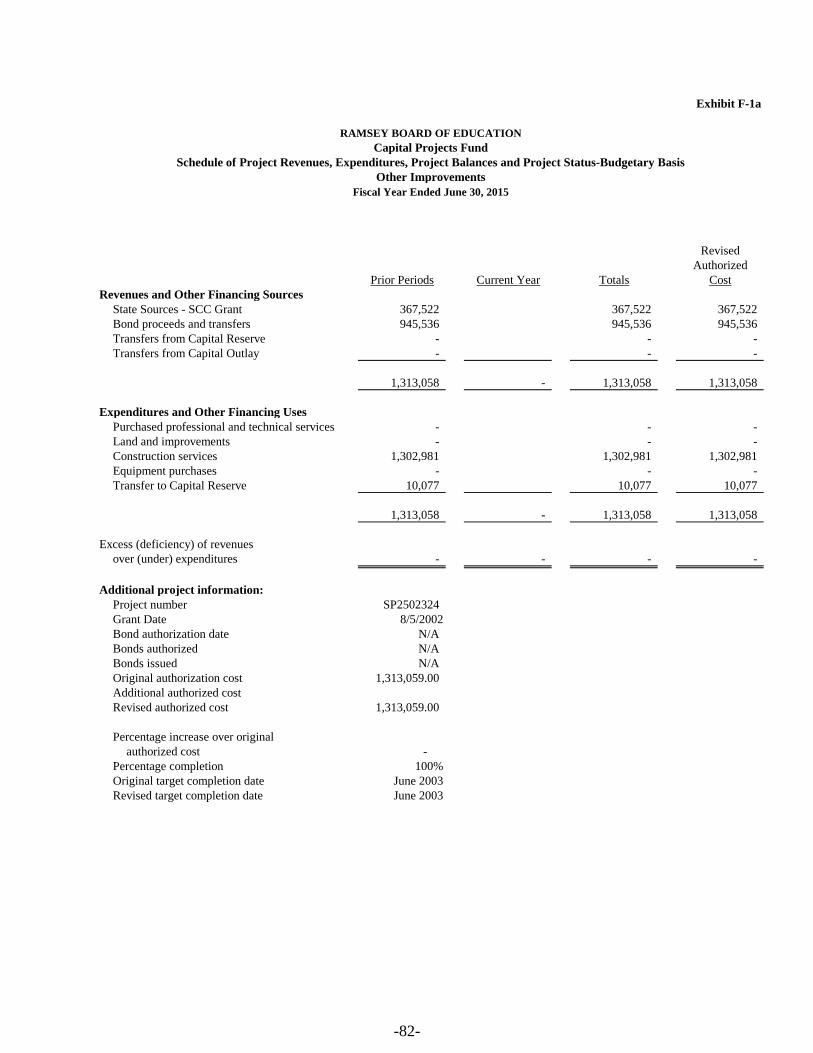
Exhibit F-1a
RAMSEY BOARD OF EDUCATION
Capital Projects Fund
Schedule of Project Revenues, Expenditures, Project Balances and Project Status-Budgetary Basis
Other Improvements
Fiscal Year Ended June 30, 2015
Revised
Authorized
Prior Periods Current Year Totals Cost
Revenues and Other Financing Sources
State Sources - SCC Grant 367,522 367,522 367,522
Bond proceeds and transfers 945,536 945,536 945,536
Transfers from Capital Reserve - - -
Transfers from Capital Outlay - - -
1,313,058 - 1,313,058 1,313,058
Expenditures and Other Financing Uses
Purchased professional and technical services - - -
Land and improvements - - -
Construction services 1,302,981 1,302,981 1,302,981
Equipment purchases - - -
Transfer to Capital Reserve 10,077 10,077 10,077
1,313,058 - 1,313,058 1,313,058
Excess (deficiency) of revenues
over (under) expenditures - - - -
Additional project information:
Project number SP2502324
Grant Date 8/5/2002
Bond authorization date N/A
Bonds authorized N/A
Bonds issued N/A
Original authorization cost 1,313,059.00
Additional authorized cost
Revised authorized cost 1,313,059.00
Percentage increase over original
authorized cost -
Percentage completion 100%
Original target completion date June 2003
Revised target completion date June 2003
-82-

Exhibit F-1b
RAMSEY BOARD OF EDUCATION
Capital Projects Fund
Schedule of Project Revenues, Expenditures, Project Balances and Project Status-Budgetary Basis
Other Improvements
Fiscal Year Ended June 30, 2015
Revised
Authorized
Prior Periods Current Year Totals Cost
Revenues and Other Financing Sources
State Sources - SCC Grant 309,491 309,491 309,491
Bond proceeds and transfers 2,057,660 2,057,660 2,057,660
Transfers from Capital Reserve - - -
Transfers from Capital Outlay - - -
2,367,151 - 2,367,151 2,367,151
Expenditures and Other Financing Uses
Purchased professional and technical services 227,772 227,772 227,772
Land and improvements - - -
Construction services 2,139,379 2,139,379 2,139,379
Equipment purchases - - -
Transfer to Capital Reserve - - -
2,367,151 - 2,367,151 2,367,151
Excess (deficiency) of revenues
over (under) expenditures - - - -
Additional project information:
Project number 4310-070-03-1049
Grant Date 9/23/2003
Bond authorization date 12/11/2003
Bonds authorized 23,434,000.00
Bonds issued 23,434,000.00
Original authorization cost 2,297,470.00
Additional authorized cost 69,681.00
Revised authorized cost 2,367,151.00
Percentage increase over original
authorized cost 0.03
Percentage completion 100%
Original target completion date June 2005
Revised target completion date June 2005
-83-

Exhibit F-1c
RAMSEY BOARD OF EDUCATION
Capital Projects Fund
Schedule of Project Revenues, Expenditures, Project Balances and Project Status-Budgetary Basis
Other Improvements
Fiscal Year Ended June 30, 2015
Revised
Authorized
Prior Periods Current Year Totals Cost
Revenues and Other Financing Sources
State Sources - SCC Grant 1,194,641 1,194,641 1,194,641
Bond proceeds and transfers 2,303,411 2,303,411 2,303,411
Transfers from Capital Reserve - - -
Transfers from Capital Outlay - - -
3,498,052 - 3,498,052 3,498,052
Expenditures and Other Financing Uses
Purchased professional and technical services 463,939 463,939 463,939
Land and improvements - - -
Construction services 3,034,113 3,034,113 3,034,113
Equipment purchases - - -
Transfer to Capital Reserve - - -
3,498,052 - 3,498,052 3,498,052
Excess (deficiency) of revenues
over (under) expenditures - - - -
Additional project information:
Project number 4310-055-03-1048
Grant Date 9/23/2003
Bond authorization date 12/11/2003
Bonds authorized 23,434,000.00
Bonds issued 23,434,000.00
Original authorization cost 3,484,745.00
Additional authorized cost 13,307.00
Revised authorized cost 3,498,052.00
Percentage increase over original
authorized cost 0.00
Percentage completion 100%
Original target completion date October 2006
Revised target completion date October 2006
-84-
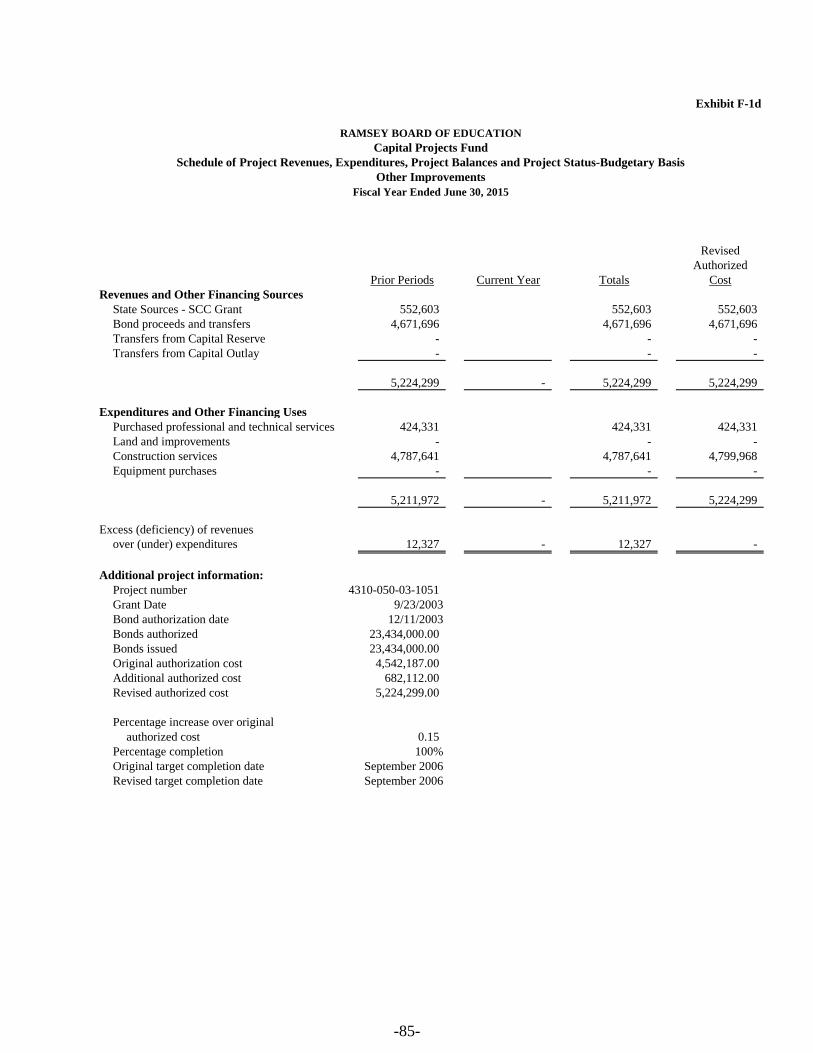
Exhibit F-1d
RAMSEY BOARD OF EDUCATION
Capital Projects Fund
Schedule of Project Revenues, Expenditures, Project Balances and Project Status-Budgetary Basis
Other Improvements
Fiscal Year Ended June 30, 2015
Revised
Authorized
Prior Periods Current Year Totals Cost
Revenues and Other Financing Sources
State Sources - SCC Grant 552,603 552,603 552,603
Bond proceeds and transfers 4,671,696 4,671,696 4,671,696
Transfers from Capital Reserve - - -
Transfers from Capital Outlay - - -
5,224,299 - 5,224,299 5,224,299
Expenditures and Other Financing Uses
Purchased professional and technical services 424,331 424,331 424,331
Land and improvements - - -
Construction services 4,787,641 4,787,641 4,799,968
Equipment purchases - - -
5,211,972 - 5,211,972 5,224,299
Excess (deficiency) of revenues
over (under) expenditures 12,327 - 12,327 -
Additional project information:
Project number 4310-050-03-1051
Grant Date 9/23/2003
Bond authorization date 12/11/2003
Bonds authorized 23,434,000.00
Bonds issued 23,434,000.00
Original authorization cost 4,542,187.00
Additional authorized cost 682,112.00
Revised authorized cost 5,224,299.00
Percentage increase over original
authorized cost 0.15
Percentage completion 100%
Original target completion date September 2006
Revised target completion date September 2006
-85-

Exhibit F-1e
RAMSEY BOARD OF EDUCATION
Capital Projects Fund
Schedule of Project Revenues, Expenditures, Project Balances and Project Status-Budgetary Basis
Other Improvements
Fiscal Year Ended June 30, 2015
Revised
Authorized
Prior Periods Current Year Totals Cost
Revenues and Other Financing Sources
State Sources - SCC Grant 3,706,560 3,706,560 3,706,560
Bond proceeds and transfers 14,401,458 14,401,458 14,401,458
Transfers from Capital Reserve - - -
Transfers from Capital Outlay - - -
18,108,018 - 18,108,018 18,108,018
Expenditures and Other Financing Uses
Purchased professional and technical services 1,486,120 1,486,120 1,486,120
Land and improvements - - -
Construction services 16,621,898 16,621,898 16,621,898
Equipment purchases - - -
Transfer to Capital Reserve - - -
18,108,018 - 18,108,018 18,108,018
Excess (deficiency) of revenues
over (under) expenditures - - - -
Additional project information:
Project number 4310-055-03-1050
Grant Date 9/23/2003
Bond authorization date 12/11/2003
Bonds authorized 23,434,000.00
Bonds issued 23,434,000.00
Original authorization cost 18,873,118.00
Additional authorized cost (765,100.00)
Revised authorized cost 18,108,018.00
Percentage increase over original
authorized cost (0.04)
Percentage completion 100%
Original target completion date May 2006
Revised target completion date May 2006
-86-
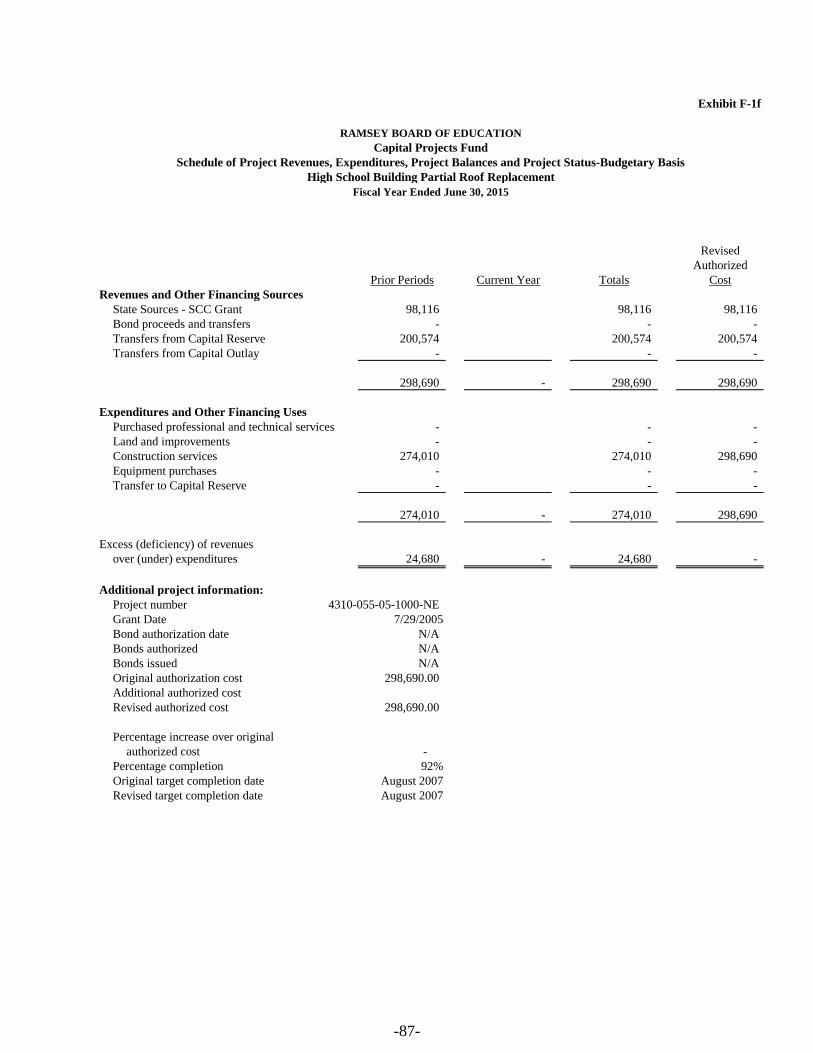
Exhibit F-1f
RAMSEY BOARD OF EDUCATION
Capital Projects Fund
Schedule of Project Revenues, Expenditures, Project Balances and Project Status-Budgetary Basis
High School Building Partial Roof Replacement
Fiscal Year Ended June 30, 2015
Revised
Authorized
Prior Periods Current Year Totals Cost
Revenues and Other Financing Sources
State Sources - SCC Grant 98,116 98,116 98,116
Bond proceeds and transfers - - -
Transfers from Capital Reserve 200,574 200,574 200,574
Transfers from Capital Outlay - - -
298,690 - 298,690 298,690
Expenditures and Other Financing Uses
Purchased professional and technical services - - -
Land and improvements - - -
Construction services 274,010 274,010 298,690
Equipment purchases - - -
Transfer to Capital Reserve - - -
274,010 - 274,010 298,690
Excess (deficiency) of revenues
over (under) expenditures 24,680 - 24,680 -
Additional project information:
Project number 4310-055-05-1000-NE
Grant Date 7/29/2005
Bond authorization date N/A
Bonds authorized N/A
Bonds issued N/A
Original authorization cost 298,690.00
Additional authorized cost
Revised authorized cost 298,690.00
Percentage increase over original
authorized cost -
Percentage completion 92%
Original target completion date August 2007
Revised target completion date August 2007
-87-

Exhibit F-1g
RAMSEY BOARD OF EDUCATION
Capital Projects Fund
Schedule of Project Revenues, Expenditures, Project Balances and Project Status-Budgetary Basis
High School PEC Sprinkler Systems
Fiscal Year Ended June 30, 2015
Revised
Authorized
Prior Periods Current Year Totals Cost
Revenues and Other Financing Sources
State Sources - SCC Grant 41,384 41,384 41,384
Bond proceeds and transfers - - -
Transfers from Capital Reserve 62,076 62,076 62,076
Transfers from Capital Outlay - - -
103,460 - 103,460 103,460
Expenditures and Other Financing Uses
Purchased professional and technical services - - -
Land and improvements - - -
Construction services 89,000 89,000 103,460
Equipment purchases - - -
89,000 - 89,000 103,460
Excess (deficiency) of revenues
over (under) expenditures 14,460 - 14,460 -
Additional project information:
Project number 1310-050-090-1001-G02
Grant Date 6/19/2009
Bond authorization date N/A
Bonds authorized N/A
Bonds issued N/A
Original authorization cost 103,460.00
Additional authorized cost
Revised authorized cost 103,460.00
Percentage increase over original
authorized cost -
Percentage completion 86%
Original target completion date October 2010
Revised target completion date October 2010
-88-

Exhibit F-1h
RAMSEY BOARD OF EDUCATION
Capital Projects Fund
Schedule of Project Revenues, Expenditures, Project Balances and Project Status-Budgetary Basis
High School Partial Roof Replacement and HVAC Upgrades
Fiscal Year Ended June 30, 2015
Revised
Authorized
Prior Periods Current Year Totals Cost
Revenues and Other Financing Sources
State Sources - SCC Grant 127,108 127,108 127,108
Bond proceeds and transfers - - -
Transfers from Capital Reserve 190,662 190,662 190,662
Transfers from Capital Outlay - - -
317,770 - 317,770 317,770
Expenditures and Other Financing Uses
Purchased professional and technical services - - -
Land and improvements - - -
Construction services 216,253 216,253 317,770
Equipment purchases - - -
216,253 - 216,253 317,770
Excess (deficiency) of revenues
over (under) expenditures 101,517 - 101,517 -
Additional project information:
Project number 4310-050-10-1001-G0PB
Grant Date 9/1/2010
Bond authorization date N/A
Bonds authorized N/A
Bonds issued N/A
Original authorization cost 317,770.00
Additional authorized cost
Revised authorized cost 317,770.00
Percentage increase over original
authorized cost -
Percentage completion 68%
Original target completion date January 1, 2011
Revised target completion date January 1, 2011
-89-

Exhibit F-1i
RAMSEY BOARD OF EDUCATION
Capital Projects Fund
Schedule of Project Revenues, Expenditures, Project Balances and Project Status-Budgetary Basis
Fiscal Year Ended June 30, 2015
Revised
Authorized
Prior Periods Current Year Totals Cost
Revenues and Other Financing Sources
State Sources - SCC Grant - 46,480 46,480 46,480
Bond proceeds and transfers - - -
Transfers from Capital Reserve - 69,720 69,720 69,720
Transfers from Capital Outlay - - -
- 116,200 116,200 116,200
Expenditures and Other Financing Uses
Purchased professional and technical services - - -
Land and improvements - - -
Construction services 110,055 110,055 116,200
Equipment purchases - - -
- 110,055 110,055 116,200
Excess (deficiency) of revenues
over (under) expenditures - 6,145 6,145 -
Additional project information:
Project number 4310-080-14-1004
Grant Date Sept. 3, 2013
Bond authorization date N/A
Bonds authorized N/A
Bonds issued N/A
Original authorization cost 116,200.00
Additional authorized cost
Revised authorized cost 116,200.00
Percentage increase over original
authorized cost -
Percentage completion 95%
Original target completion date July 11, 2014
Revised target completion date July 11, 2014
Window Replacement at Tisdale Elementary School
-90-

Exhibit F-1j
RAMSEY BOARD OF EDUCATION
Capital Projects Fund
Schedule of Project Revenues, Expenditures, Project Balances and Project Status-Budgetary Basis
Fiscal Year Ended June 30, 2015
Revised
Authorized
Prior Periods Current Year Totals Cost
Revenues and Other Financing Sources
State Sources - SCC Grant - 344,600 344,600 344,600
Bond proceeds and transfers - - -
Transfers from Capital Reserve - 516,900 516,900 516,900
Transfers from Capital Outlay - - -
- 861,500 861,500 861,500
Expenditures and Other Financing Uses
Purchased professional and technical services - - -
Land and improvements - - -
Construction services - 570,417 570,417 861,500
Equipment purchases - - -
- 570,417 570,417 861,500
Excess (deficiency) of revenues
over (under) expenditures - 291,083 291,083 -
Additional project information:
Project number 4310-055-14-1003
Grant Date September 3, 2013
Bond authorization date N/A
Bonds authorized N/A
Bonds issued N/A
Original authorization cost 861,500.00
Additional authorized cost
Revised authorized cost 861,500.00
Percentage increase over original
authorized cost -
Percentage completion 66%
Original target completion date July 11, 2014
Revised target completion date July 11, 2014
Boiler Replacement at Eric Smith School
-91-

Exhibit F-1k
RAMSEY BOARD OF EDUCATION
Capital Projects Fund
Schedule of Project Revenues, Expenditures, Project Balances and Project Status-Budgetary Basis
Fiscal Year Ended June 30, 2015
Revised
Authorized
Prior Periods Current Year Totals Cost
Revenues and Other Financing Sources
State Sources - SCC Grant - 290,095 290,095 290,095
Bond proceeds and transfers - - -
Transfers from Capital Reserve - 665,837 665,837 665,837
Transfers from Capital Outlay - - -
- 955,932 955,932 955,932
Expenditures and Other Financing Uses
Purchased professional and technical services - - -
Land and improvements - - -
Construction services - 955,932 955,932 955,932
Equipment purchases - - -
- 955,932 955,932 955,932
Excess (deficiency) of revenues
over (under) expenditures - - - -
Additional project information:
Project number 4310-050-14-2000
Grant Date January 6, 2014
Bond authorization date N/A
Bonds authorized N/A
Bonds issued N/A
Original authorization cost 955,932.00
Additional authorized cost
Revised authorized cost 955,932.00
Percentage increase over original
authorized cost -
Percentage completion 100%
Original target completion date July 12, 2014
Revised target completion date Aug. 31, 2015
HVAC Replacement in Gyms at Ramsey High School
-92-

Exhibit F-1l
RAMSEY BOARD OF EDUCATION
Capital Projects Fund
Schedule of Project Revenues, Expenditures, Project Balances and Project Status-Budgetary Basis
Sports Field Upgrade, Turf/Lights/Stormwater Control at Ramsey High School
Fiscal Year Ended June 30, 2015
Revised
Authorized
Prior Periods Current Year Totals Cost
Revenues and Other Financing Sources
State Sources - SCC Grant - - -
Bond proceeds and transfers - - -
Transfers from Capital Reserve - 1,200,000 1,200,000 1,200,000
Transfers from Capital Outlay - - -
- 1,200,000 1,200,000 1,200,000
Expenditures and Other Financing Uses
Purchased professional and technical services - - -
Land and improvements - - -
Construction services - 250,504 250,504 200,000
Equipment purchases - 906,971 906,971 1,000,000
- 1,157,475 1,157,475 1,200,000
Excess (deficiency) of revenues
over (under) expenditures - 42,525 42,525 -
Additional project information:
Project number 4310-050-14-2000
Grant Date April 9, 2014
Bond authorization date N/A
Bonds authorized N/A
Bonds issued N/A
Original authorization cost 1,200,000.00
Additional authorized cost
Revised authorized cost 1,200,000.00
Percentage increase over original
authorized cost -
Percentage completion 96%
Original target completion date Aug. 31, 2014
Revised target completion date Aug. 31, 2014
-93-

Ex
hib
it F
-2
RA
MS
EY
BO
AR
D O
F E
DU
CA
TIO
N
Cap
ital
Pro
ject
s F
un
d
Su
mm
ary
Sta
tem
ent
of
Pro
ject
Ex
pen
dit
ure
s
Fis
cal
Yea
r E
nd
ed J
un
e 3
0,
20
15
Op
erati
ng
Un
exp
end
ed
Pri
or
Cu
rren
tT
ran
sfer
to
Bala
nce
Date
Ap
pro
pri
ati
on
sY
ears
Year
Cap
ital
Res
erve
Ju
ne
30,
2015
Wes
ley D
. T
isdal
e E
lem
enta
ry S
chool
Buil
din
g A
ddit
ions
August
5, 2002
1,3
13,0
58
1,3
13,0
58
-
Mar
y A
. H
ubbar
d E
lem
enta
ry S
chool
Buil
din
g A
ddit
ions
and R
enovat
ions
Sep
tem
ber
23, 2003
2,3
67,1
51
2,3
67,1
51
-
Eri
c S
. S
mit
h M
iddle
Sch
ool
Buil
din
g A
ddit
ion
s an
d
Ren
ovat
ions
Sep
tem
ber
23, 2003
3,4
98,0
52
3,4
98,0
52
-
Ram
sey H
igh S
chool
Buil
din
g A
ddit
ions
and R
enovat
ions
Sep
tem
ber
23, 2003
5,2
24,2
99
5,2
11,9
72
12,3
27
John Y
. D
ater
Ele
men
tary
Sch
ool
Addit
ions,
Ren
ovat
ions
and C
onst
ruct
ion o
f N
ew S
chool
Sep
tem
ber
23, 2003
18,1
08,0
18
18,1
08,0
18
-
Ram
sey H
igh S
chool
Buil
din
g P
arti
al R
oof
Rep
lace
men
tJu
ly 2
9, 2005
298,6
90
27
4,0
10
24,6
80
Ram
sey H
S P
EC
Spri
nkle
r S
yst
ems
June
19, 2009
103,4
60
89,0
00
14,4
60
Ram
sey H
igh S
chool
Par
tial
Roof
Rep
lace
men
t an
d
HV
AC
Upgra
des
Sep
tem
ber
1, 2010
317,7
70
21
6,2
53
101,5
17
Tis
dal
e E
lem
enta
ry S
chool
at W
indow
Rep
lace
men
tS
epte
mber
3, 2013
116,2
00
110,0
55
6,1
45
Eri
c S
. S
mit
h M
iddle
Sch
ool
Boil
er R
epla
cem
ent
Sep
tem
ber
3, 2013
861,5
00
570,4
17
291,0
83
Ram
sey H
igh S
chool
HV
AC
Rep
lace
men
t in
GY
MS
Januar
y 6
, 2014
955,9
32
955,9
32
-
Ram
sey H
igh S
chool
Sport
s F
ield
Upgra
de,
Tu
rf/L
ights
/
Sto
rmw
ater
Contr
ol
Apri
l 9, 2014
1,2
00,0
00
1,1
57,4
75
42,5
25
34,3
64,1
30
31,0
77,5
14
2,7
93,8
79
-
492,7
37
Pro
ject
Tit
le/I
ssu
e
Ex
pen
dit
ure
s to
Date
-94-

PROPRIETARY FUNDS
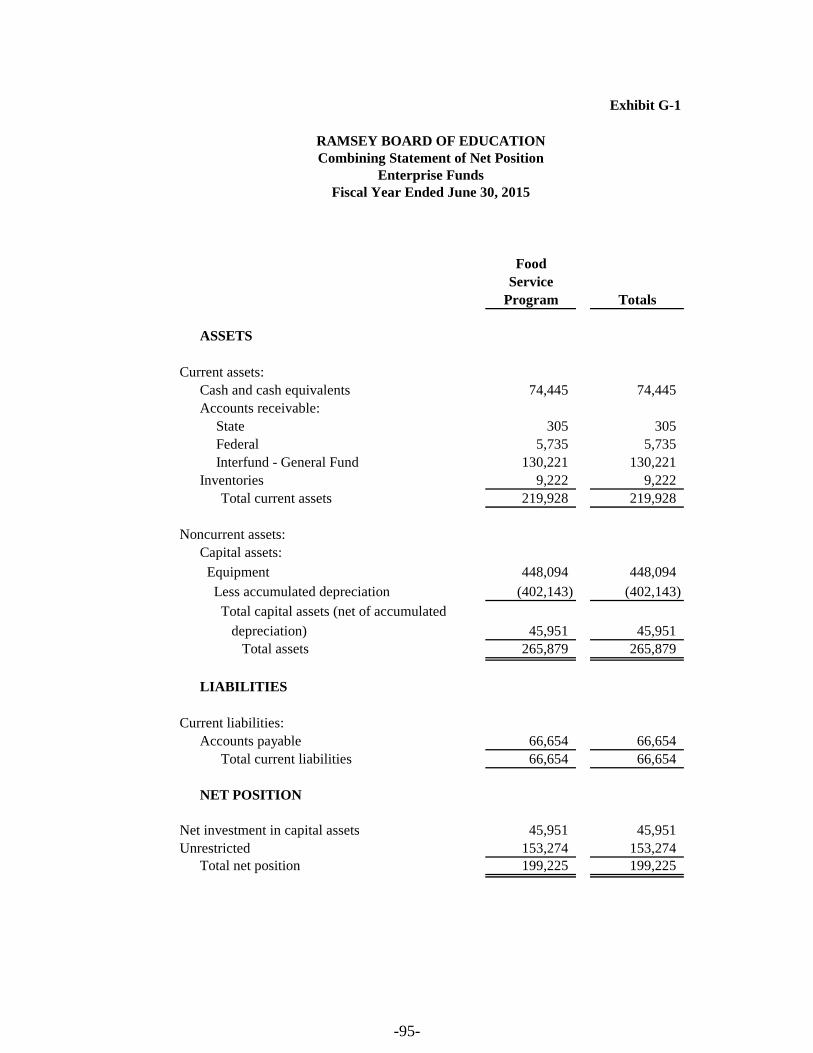
Exhibit G-1
Food
Service
Program Totals
ASSETS
Current assets:
Cash and cash equivalents 74,445 74,445
Accounts receivable:
State 305 305
Federal 5,735 5,735
Interfund - General Fund 130,221 130,221
Inventories 9,222 9,222
Total current assets 219,928 219,928
Noncurrent assets:
Capital assets:
Equipment 448,094 448,094
Less accumulated depreciation (402,143) (402,143)
Total capital assets (net of accumulated
depreciation) 45,951 45,951
Total assets 265,879 265,879
LIABILITIES
Current liabilities:
Accounts payable 66,654 66,654
Total current liabilities 66,654 66,654
NET POSITION
Net investment in capital assets 45,951 45,951
Unrestricted 153,274 153,274
Total net position 199,225 199,225
RAMSEY BOARD OF EDUCATION
Combining Statement of Net Position
Enterprise Funds
Fiscal Year Ended June 30, 2015
-95-

Exhibit G-2
Food
Service
Program Totals
Operating revenues:
Charges for services:
Daily sales - reimbursable programs 173,533 173,533
Daily sales - non-reimbursable programs 289,964 289,964
Special functions 74,598 74,598
Total operating revenues 538,095 538,095
Operating expenses:
Cost of sales 250,147 250,147
Salaries 217,504 217,504
Benefits 58,773 58,773
Supplies and materials 45,083 45,083
Purchased property services 65,000 65,000
Cleaning repair & maintenance 53,362 53,362
Depreciation 14,938 14,938
Total Operating Expenses 704,807 704,807
Operating income (loss) (166,712) (166,712)
Nonoperating revenues (expenses):
State sources:
State school lunch program 3,262 3,262
Federal sources:
National school lunch program 61,352 61,352
Food distribution program 34,966 34,966
Interest Income 24 24
Total nonoperating revenues (expenses) 99,604 99,604
Income (loss) before contributions & transfers (67,108) (67,108)
Total net position—beginning (restated) 266,333 266,333
Total net position—ending 199,225 199,225
RAMSEY BOARD OF EDUCATION
Combining Statement of Revenues, Expenses, and Changes in Fund Net Position
Enterprise Funds
Fiscal Year Ended June 30, 2015
-96-
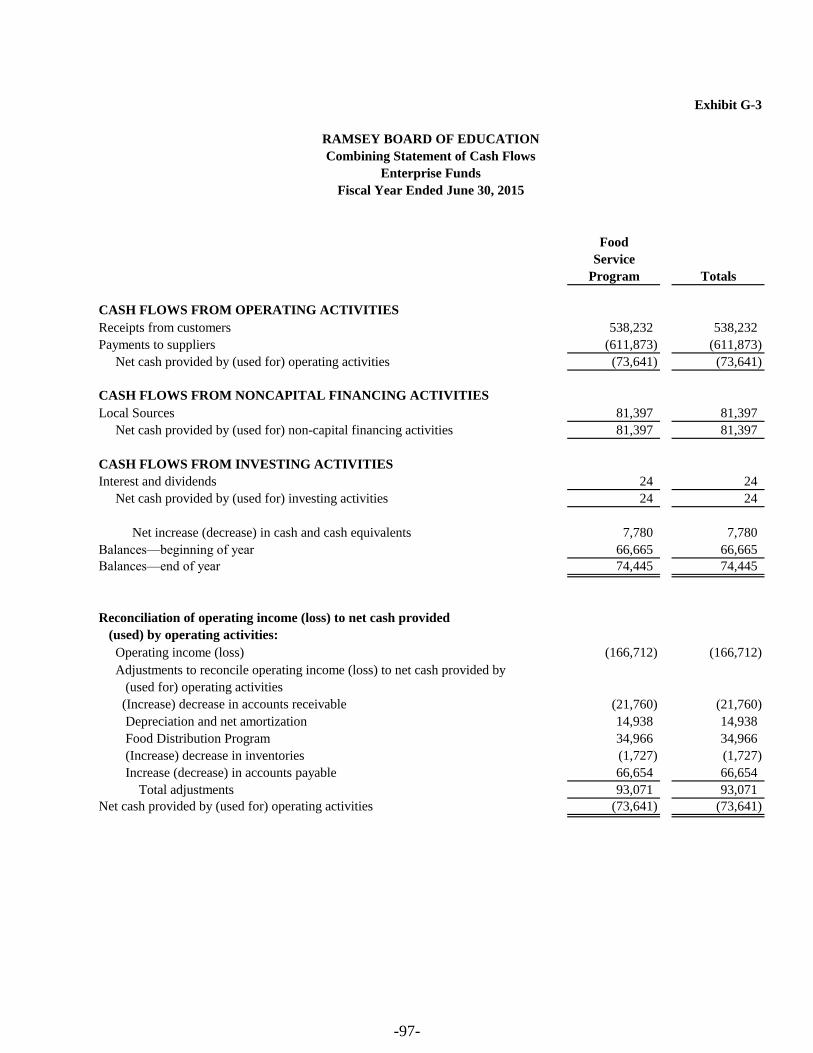
Exhibit G-3
RAMSEY BOARD OF EDUCATION
Combining Statement of Cash Flows
Enterprise Funds
Food
Service
Program Totals
CASH FLOWS FROM OPERATING ACTIVITIES
Receipts from customers 538,232 538,232
Payments to suppliers (611,873) (611,873)
Net cash provided by (used for) operating activities (73,641) (73,641)
CASH FLOWS FROM NONCAPITAL FINANCING ACTIVITIES
Local Sources 81,397 81,397
Net cash provided by (used for) non-capital financing activities 81,397 81,397
CASH FLOWS FROM INVESTING ACTIVITIES
Interest and dividends 24 24
Net cash provided by (used for) investing activities 24 24
Net increase (decrease) in cash and cash equivalents 7,780 7,780
Balances—beginning of year 66,665 66,665
Balances—end of year 74,445 74,445
Reconciliation of operating income (loss) to net cash provided
(used) by operating activities:
Operating income (loss) (166,712) (166,712)
Adjustments to reconcile operating income (loss) to net cash provided by
(used for) operating activities
(Increase) decrease in accounts receivable (21,760) (21,760)
Depreciation and net amortization 14,938 14,938
Food Distribution Program 34,966 34,966
(Increase) decrease in inventories (1,727) (1,727)
Increase (decrease) in accounts payable 66,654 66,654
Total adjustments 93,071 93,071
Net cash provided by (used for) operating activities (73,641) (73,641)
Fiscal Year Ended June 30, 2015
-97-

FIDUCIARY FUND
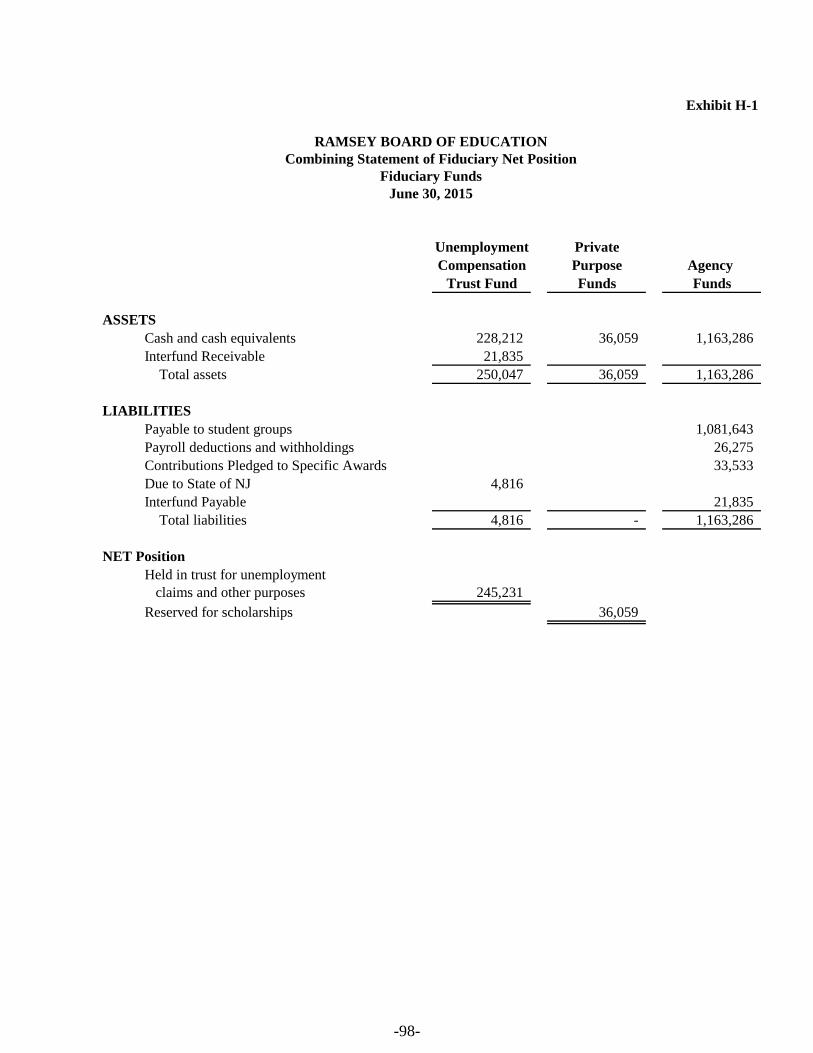
Exhibit H-1
RAMSEY BOARD OF EDUCATION
Combining Statement of Fiduciary Net Position
Fiduciary Funds
June 30, 2015
Unemployment Private
Compensation Purpose Agency
Trust Fund Funds Funds
ASSETS
Cash and cash equivalents 228,212 36,059 1,163,286
Interfund Receivable 21,835
Total assets 250,047 36,059 1,163,286
LIABILITIES
Payable to student groups 1,081,643
Payroll deductions and withholdings 26,275
Contributions Pledged to Specific Awards 33,533
Due to State of NJ 4,816
Interfund Payable 21,835
Total liabilities 4,816 - 1,163,286
NET Position
Held in trust for unemployment
claims and other purposes 245,231
Reserved for scholarships 36,059
-98-
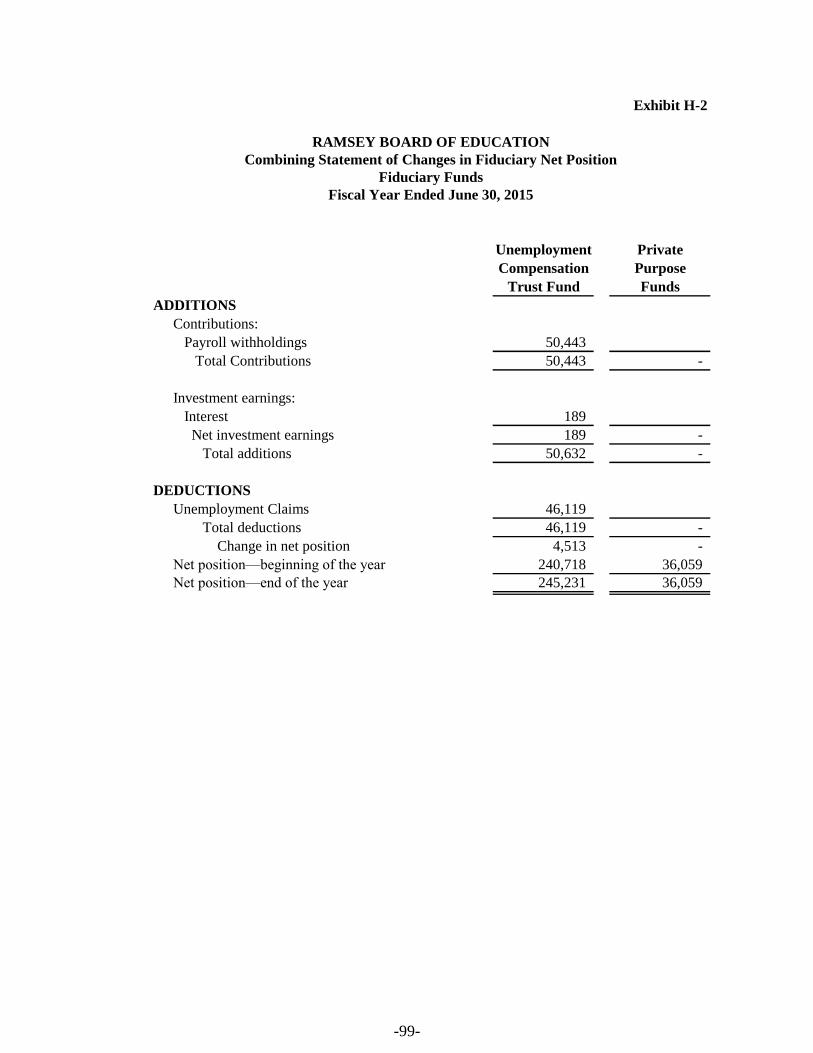
Exhibit H-2
Unemployment Private
Compensation Purpose
Trust Fund Funds
ADDITIONS
Contributions:
Payroll withholdings 50,443
Total Contributions 50,443 -
Investment earnings:
Interest 189
Net investment earnings 189 -
Total additions 50,632 -
DEDUCTIONS
Unemployment Claims 46,119
Total deductions 46,119 -
Change in net position 4,513 -
Net position—beginning of the year 240,718 36,059
Net position—end of the year 245,231 36,059
RAMSEY BOARD OF EDUCATION
Combining Statement of Changes in Fiduciary Net Position
Fiduciary Funds
Fiscal Year Ended June 30, 2015
-99-

Exhibit H-3
RAMSEY BOARD OF EDUCATION
Student Activity Agency Fund
Schedule of Receipts and Disbursements
Fiscal Year Ended June 30, 2015
Balance Cash Cash Balance
July 1, 2014 Receipts Disbursed June 30, 2015
Elementary Schools:
Wesley D. Tisdale School 7,962 23,755 18,886 12,831
Mary A. Hubbard School 3,219 20,769 22,444 1,544
John Y. Dater School 1,847 17,627 17,517 1,957
Total Elementary Schools 13,028 62,151 58,847 16,332
Middle School:
Eric S. Smith School 23,957 86,994 86,927 24,024
Total Middle Schools 23,957 86,994 86,927 24,024
High School:
High School 215,120 364,745 352,791 227,074
Student Fund 77,011 71,286 5,725
Total High Schools 215,120 441,756 424,077 232,799
Athletic Departments:
Athletic Department 1,511 128,407 128,408 1,510
Total Athletic Department 1,511 128,407 128,408 1,510
Adult Education:
Due to Nonsupportive Enrichment
Adult Program 768,957 1,397,242 1,359,221 806,978
Total Adult Education 768,957 1,397,242 1,359,221 806,978
Total All Schools $ 1,022,573 2,116,550 2,057,480 1,081,643
-100-

Exhibit H-4
RAMSEY BOARD OF EDUCATION
Payroll Agency Fund
Schedule of Receipts and Disbursements
Fiscal Year Ended June 30, 2015
Balance Cash Cash BalanceJuly 1, 2014 Receipts Disbursed June 30, 2015
Net Payroll - 20,425,286 20,423,814 1,472 Payroll Deductions and Withholdings 223,227 17,185,524 17,399,595 9,156 Flexible Spending Account 18,982 78,934 82,269 15,647 Interfund Payable - UCI 12,667 13,530 4,362 21,835
254,876 37,703,274 37,910,040 48,110
-101-
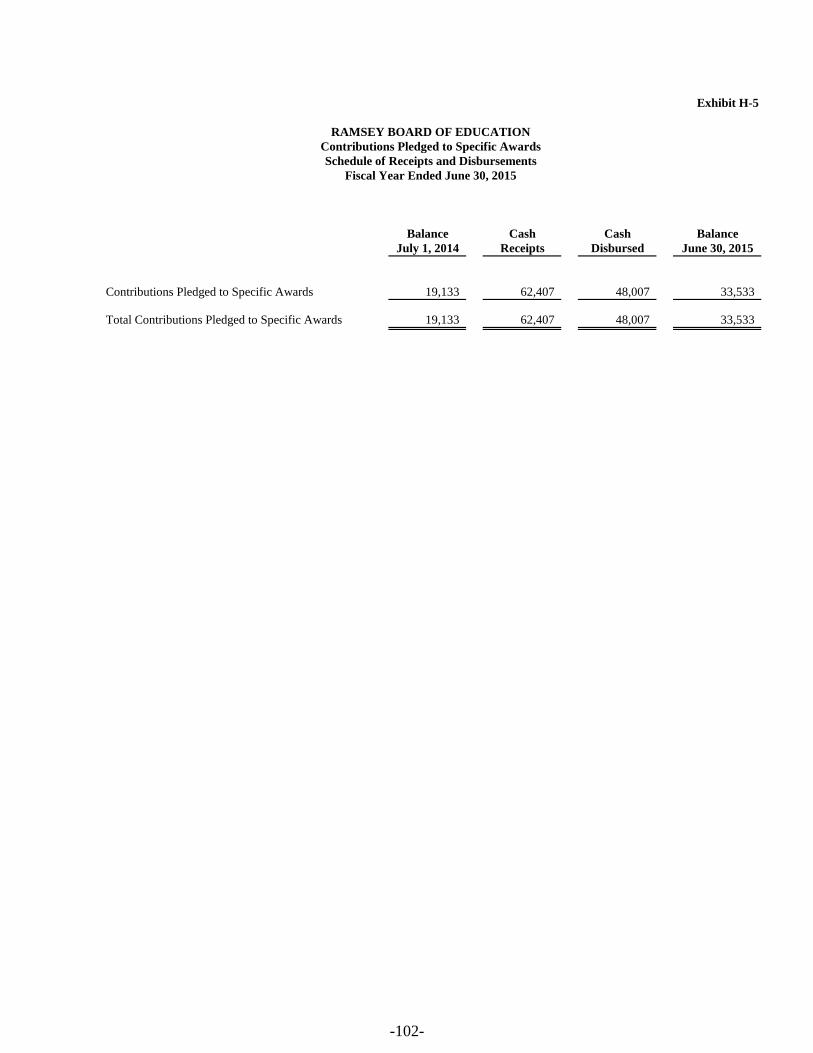
Exhibit H-5
RAMSEY BOARD OF EDUCATION
Contributions Pledged to Specific Awards
Schedule of Receipts and Disbursements
Fiscal Year Ended June 30, 2015
Balance Cash Cash Balance
July 1, 2014 Receipts Disbursed June 30, 2015
Contributions Pledged to Specific Awards 19,133 62,407 48,007 33,533
Total Contributions Pledged to Specific Awards 19,133 62,407 48,007 33,533
-102-

LONG-TERM DEBT

Exh
ibit
I-1
Bal
ance
,B
alan
ce,
Dat
e o
fA
mo
un
t o
fP
rin
cip
al P
aym
ent
Inte
rest
Jun
e 30
,Ju
ne
30
,
Issu
eL
oan
Lo
anD
ate
Am
ou
nt
Rat
e2
01
4R
etir
ed2
01
5
Ref
un
din
g B
on
dA
pri
l 4
, 2
01
21
6,7
00
,00
0
1/1
5/1
61
,85
0,0
00
2
.00
%1
5,7
65
,00
0
1,8
50
,00
0
13
,91
5,0
00
1/1
5/1
71
,86
5,0
00
3
.00
%
1/1
5/1
81
,31
0,0
00
3
.00
%
1/1
5/1
91
,35
5,0
00
3
.00
%
1/1
5/2
01
,39
5,0
00
3
-4%
1/1
5/2
11
,45
5,0
00
3
.00
0%
1/1
5/2
21
,50
0,0
00
4
.00
%
1/1
5/2
31
,56
0,0
00
4
.00
%
1/1
5/2
41
,62
5,0
00
5
.00
%
$1
5,7
65
,00
0
1,8
50
,00
0
13
,91
5,0
00
RA
MS
EY
BO
AR
D O
F E
DU
CA
TIO
N
Gen
era
l L
on
g-T
erm
Deb
t A
cco
un
t G
rou
p
Sch
edu
le o
f S
eria
l B
on
ds
Ju
ne 3
0,
2015
-103-

Ex
hib
it I
-3
RA
MS
EY
BO
AR
D O
F E
DU
CA
TIO
N
Bu
dg
eta
ry
Co
mp
aris
on
Sch
ed
ule
Deb
t S
ervic
e F
un
d
Fis
ca
l Y
ea
r E
nd
ed
Ju
ne 3
0, 2
01
5
Var
iance
Ori
gin
alB
ud
get
Fin
alP
osi
tive
(Neg
ativ
e)
Bud
get
Tra
nsf
ers
Bud
get
Act
ual
Fin
al t
o A
ctual
RE
VE
NU
ES
:
Loca
l S
ourc
es:
Loca
l T
ax L
evy
2,2
78
,08
1
2,2
78
,08
1
2,2
78
,08
1
-
Tota
l -
Loca
l S
ourc
es2
,27
8,0
81
-
2,2
78
,08
1
2,2
78
,08
1
-
To
tal
Reven
ues
2,2
78
,08
1
-
2,2
78
,08
1
2,2
78
,08
1
-
EX
PE
ND
ITU
RE
S:
Reg
ula
r D
ebt
Ser
vic
e:
Inte
rest
54
2,1
64
-
54
2,1
64
54
2,1
64
-
Red
emp
tion o
f P
rinci
pal
1,8
50
,00
0
-
1,8
50
,00
0
1,8
50
,00
0
-
Tota
l R
egula
r D
ebt
Ser
vic
e2
,39
2,1
64
-
2,3
92
,16
4
2,3
92
,16
4
-
To
tal
ex
pen
dit
ures
2,3
92
,16
4
-
2,3
92
,16
4
2,3
92
,16
4
-
Exce
ss (
Def
icie
ncy
) of
Rev
enues
Over
(U
nd
er)
Exp
end
iture
s(1
14
,08
3)
-
(11
4,0
83
)
(11
4,0
83
)
-
Oth
er F
inan
cing S
ourc
es:
Op
erat
ing T
ransf
ers
In:
Inte
rest
Ear
ned
in C
apit
al P
roje
ct F
und
21
3
21
3
Tota
l O
ther
Fin
anci
ng S
ourc
es-
-
-
21
3
21
3
Exce
ss (
Def
icie
ncy
) of
Rev
enues
and
Oth
er
Fin
anci
ng S
ourc
es O
ver
(U
nd
er)
Exp
end
iture
s(1
14
,08
3)
-
(11
4,0
83
)
(11
3,8
70
)
21
3
Fund
Bal
ance
, Ju
ly 1
12
6,1
05
-
12
6,1
05
12
6,1
05
-
Fund
Bal
ance
, Ju
ne
30
12
,02
2
-
12
,02
2
12
,23
5
21
3
Reca
pit
ula
tio
n o
f E
xcess
(D
efi
cien
cy
) o
f R
even
ues
Over (
Un
der)
Ex
pen
dit
ures
Bud
get
ed F
und
Bal
ance
(11
4,0
83
)
(11
4,0
83
)
(11
4,0
83
)
-
Inte
rest
Ear
ned
in C
apit
al P
roje
ct F
und
21
3
21
3
(11
4,0
83
)
-
(11
4,0
83
)
(11
3,8
70
)
21
3
-104-
STATISTICAL SECTION

STATISTICAL SECTION (UNAUDITED)
Introduction to the Statistical Section
Financial Trends
J-1 Net Assets/Position by Component
J-2 Changes in Net Assets/Position
J-3 Fund Balances - Governmental Funds
J-4 Changes in Fund Balances - Governmental Funds
J-5 General Fund Other Local Revenue by Source
Revenue Capacity
J-6 Assessed Value and Estimated Actual Value of Taxable Property
J-7 Direct and Overlapping Property Tax Rates
J-8 Principal Property Taxpayers
J-9 Property Tax Levies and Collections
Debt Capacity
J-10 Ratios of Outstanding Debt by Type
J-11 Ratios of General Bonded Debt Outstanding
J-12 Direct and Overlapping Governmental Activities Debt
J-13 Legal Debt Margin Information
Demographic and Economic Information
J-14 Demographic and Economic Statistics
J-15 Principal Employers
Operating Information
J-16 Full-time Equivalent District Employees by Function/Program
J-17 Operating Statistics
J-18 School Building Information*
J-19 Schedule of Allowable Maintenance Expenditures by School Facility
J-20 Insurance Schedule
STATISTICAL SECTION (UNAUDITED) - INTRODUCTION
J SERIES
Contents Page
Financial TrendsThese schedules contain trend information to help the readerunderstand how the district’s financial performance andwell-being have changes over time. J-1 to J-5
Revenue CapacityThese schedules contain information to help the reader assessthe district’s most significant local revenue sources, theproperty tax. J-6 to J-9
Debt CapacityThese schedules present information to help the reader assessthe affordability of the district’s current levels of outstandingdebt and the district’s ability to issue additional debt in thefuture. J-10 to J-13
Demographic and Economic InformationThese schedules offer demographic and economic indicatorsto help the reader understand the environment within whichthe district’s financial activities take place. J-14 to J-15
Operating InformationThese schedules contain service and infrastructure data tohelp the reader understand how the information in thedistrict’s financial report relates to the services the districtprovides and the activities it performs. J-16 to J-20
Sources: Unless otherwise noted, the information in these schedules isderived from the comprehensive annual financial reports(CAFR) for the relevant year. The district implemented GASBStatement 34 in the fiscal year ending June 30, 2004; schedulespresenting district-wide information include informationbeginning in that year.
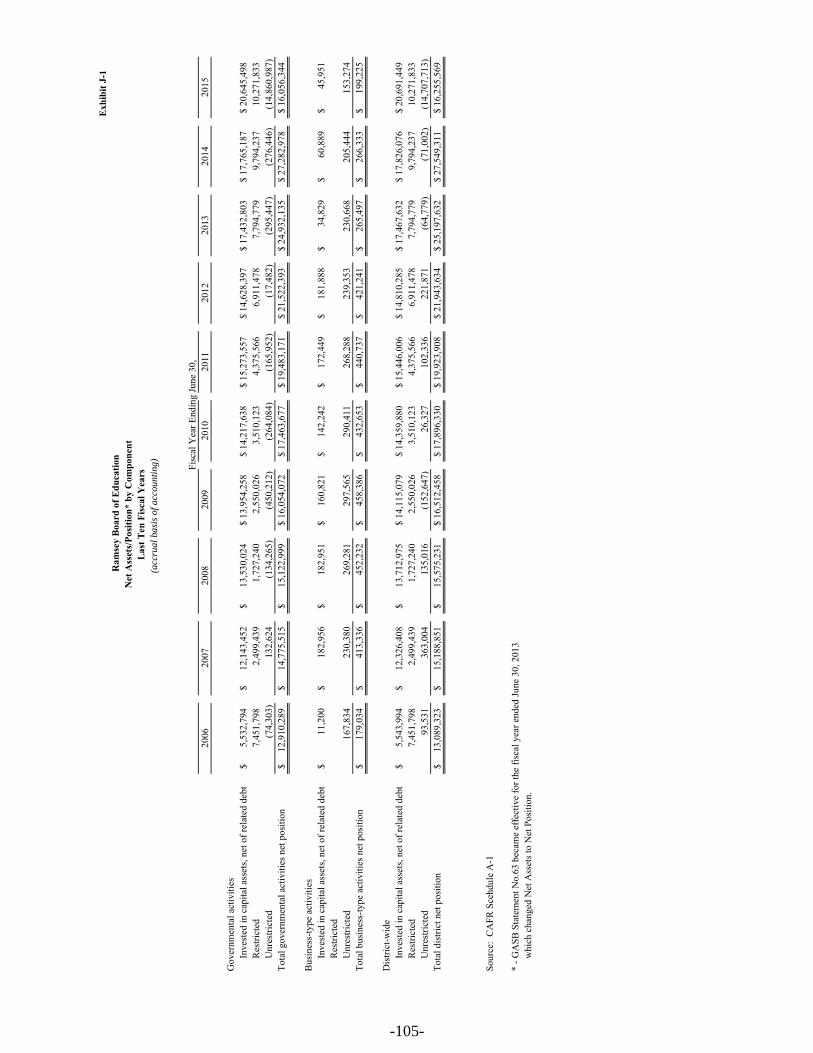
Exh
ibit
J-1
2006
2007
2008
2009
2010
2011
2012
2013
2014
2015
Gov
ernm
enta
l act
iviti
esIn
vest
ed in
cap
ital a
sset
s, ne
t of r
elat
ed d
ebt
5,53
2,79
4$
12
,143
,452
$
13
,530
,024
$
13
,954
,258
$
14,2
17,6
38$
15
,273
,557
$
14,6
28,3
97$
17
,432
,803
$
17,7
65,1
87$
20
,645
,498
$
Res
trict
ed7,
451,
798
2,49
9,43
9
1,
727,
240
2,55
0,02
6
3,
510,
123
4,37
5,56
6
6,
911,
478
7,79
4,77
9
9,
794,
237
10,2
71,8
33
U
nres
trict
ed(7
4,30
3)
132,
624
(1
34,2
65)
(4
50,2
12)
(2
64,0
84)
(1
65,9
52)
(1
7,48
2)
(295
,447
)
(276
,446
)
(14,
860,
987)
To
tal g
over
nmen
tal a
ctiv
ities
net
pos
ition
12,9
10,2
89$
14,7
75,5
15$
15,1
22,9
99$
16,0
54,0
72$
17
,463
,677
$
19,4
83,1
71$
21
,522
,393
$
24,9
32,1
35$
27
,282
,978
$
16,0
56,3
44$
Bus
ines
s-ty
pe a
ctiv
ities
Inve
sted
in c
apita
l ass
ets,
net o
f rel
ated
deb
t11
,200
$
18
2,95
6$
182,
951
$
16
0,82
1$
142,
242
$
17
2,44
9$
181,
888
$
34
,829
$
60,8
89$
45
,951
$
Res
trict
edU
nres
trict
ed16
7,83
4
230,
380
26
9,28
1
297,
565
29
0,41
1
268,
288
23
9,35
3
230,
668
20
5,44
4
153,
274
To
tal b
usin
ess-
type
act
iviti
es n
et p
ositi
on17
9,03
4$
413,
336
$
45
2,23
2$
458,
386
$
43
2,65
3$
440,
737
$
42
1,24
1$
265,
497
$
26
6,33
3$
199,
225
$
Dis
trict
-wid
eIn
vest
ed in
cap
ital a
sset
s, ne
t of r
elat
ed d
ebt
5,54
3,99
4$
12
,326
,408
$
13
,712
,975
$
14
,115
,079
$
14,3
59,8
80$
15
,446
,006
$
14,8
10,2
85$
17
,467
,632
$
17,8
26,0
76$
20
,691
,449
$
Res
trict
ed7,
451,
798
2,49
9,43
9
1,
727,
240
2,55
0,02
6
3,
510,
123
4,37
5,56
6
6,
911,
478
7,79
4,77
9
9,
794,
237
10,2
71,8
33
U
nres
trict
ed93
,531
36
3,00
4
135,
016
(1
52,6
47)
26
,327
102,
336
22
1,87
1
(64,
779)
(7
1,00
2)
(14,
707,
713)
To
tal d
istri
ct n
et p
ositi
on13
,089
,323
$
15
,188
,851
$
15
,575
,231
$
16
,512
,458
$
17,8
96,3
30$
19
,923
,908
$
21,9
43,6
34$
25
,197
,632
$
27,5
49,3
11$
16
,255
,569
$
Sour
ce:
CA
FR S
cehd
ule
A-1
* - G
ASB
Sta
tem
ent N
o.63
bec
ame
effe
ctiv
e fo
r the
fisc
al y
ear e
nded
June
30,
201
3w
hich
cha
nged
Net
Ass
ets t
o N
et P
ositi
on.
Ram
sey
Boa
rd o
f Edu
catio
nN
et A
sset
s/Po
sitio
n* b
y C
ompo
nent
Las
t Ten
Fis
cal Y
ears
(acc
rual
bas
is o
f acc
ount
ing) Fi
scal
Yea
r End
ing
June
30,
-105-

Exh
ibit
J-2
2006
2007
2008
2009
2010
2011
2012
2013
2014
2015
Exp
ense
sG
over
nmen
tal a
ctiv
ities
Inst
ruct
ion
Reg
ular
17,0
18,3
85$
18
,031
,316
$
18,8
38,0
09$
19
,400
,100
$
21
,022
,394
$
21
,340
,017
$
21
,268
,865
$
21
,847
,647
$
21
,945
,607
$
25
,249
,007
$
Sp
ecia
l edu
catio
n4,
679,
258
5,
403,
849
5,
625,
028
5,
811,
653
5,78
3,78
7
4,
919,
294
4,59
0,02
3
4,
651,
567
4,72
0,97
1
5,
605,
792
Oth
er sp
ecia
l edu
catio
n1,
107,
254
86
5,57
1
1,
208,
876
1,
237,
458
1,04
4,85
3
84
2,15
9
925,
934
92
4,52
1
913,
949
98
4,37
3
Oth
er in
stru
ctio
n84
6,84
3
93
0,97
6
97
3,36
5
1,
046,
027
1,04
6,58
6
1,
023,
763
1,05
5,24
8
1,
099,
984
1,16
1,09
0
1,
376,
244
Supp
ort S
ervi
ces:
Tuiti
on2,
340,
361
2,
175,
810
2,
729,
687
2,
516,
482
1,94
5,01
6
2,
758,
946
2,98
8,15
7
2,
336,
364
2,44
6,51
9
2,
612,
882
Stud
ent &
inst
ruct
ion
rela
ted
serv
ices
6,07
0,87
5
6,12
2,21
6
6,30
3,71
0
6,91
0,93
8
7,
041,
305
7,20
3,83
3
7,
124,
675
7,73
3,78
5
8,
269,
347
9,54
5,80
3
G
ener
al a
dmin
istra
tive
serv
ices
1,32
2,44
6
1,34
6,64
4
1,11
8,30
8
1,50
0,42
0
1,
114,
013
1,23
9,01
1
1,
295,
683
1,24
7,04
7
1,
339,
512
1,23
7,01
3
Sc
hool
adm
inis
trativ
e se
rvic
es2,
243,
484
2,
211,
433
2,
232,
781
2,
397,
196
2,15
2,70
1
2,
275,
194
2,32
0,49
4
2,
177,
689
2,17
6,49
0
2,
506,
659
Cen
tral s
ervi
ces
414,
089
369,
167
472,
582
492,
412
51
3,87
7
533,
362
54
0,50
6
538,
395
55
8,45
5
644,
652
A
dmin
istra
tive
info
rmat
ion
tech
.16
,000
49,9
56
16
,980
17
,460
17,4
60
17
,460
17,4
60
17
,460
17,4
60
17
,460
Plan
t ope
ratio
ns a
nd m
aint
enan
ce3,
866,
368
4,
256,
897
4,
388,
776
4,
196,
998
4,31
9,35
4
4,
518,
777
4,83
7,58
0
4,
792,
863
4,94
5,37
0
5,
329,
590
Pupi
l tra
nspo
rtatio
n1,
500,
168
1,
577,
582
1,
775,
989
1,
702,
849
1,71
6,73
7
1,
635,
220
1,51
5,91
7
1,
350,
075
1,41
7,64
5
1,
437,
641
Una
lloca
ted
Ben
efits
3,60
2,24
1
5,05
9,23
3
5,14
4,65
3
3,23
0,69
6
3,
268,
891
3,20
5,69
1
4,
082,
254
5,16
3,14
1
4,
423,
952
5,09
8,59
4
C
apita
l out
lay
- non
-dep
reci
able
34,5
63
7,
753
32
4,21
6
54
8
-
17
,175
6,23
0
751,
687
39
,074
Inte
rest
on
long
-term
deb
t1,
172,
386
1,
146,
172
1,
224,
900
1,
207,
941
1,07
4,84
5
96
7,72
9
630,
270
66
4,73
4
580,
083
52
5,20
6
Una
lloca
ted
depr
ecia
tion
647,
409
1,38
2,20
5
1,35
0,63
3
1,40
3,02
4
1,
394,
350
1,33
3,94
6
1,
215,
320
1,60
3,07
2
1,
797,
686
2,10
6,29
0
C
apita
l lea
se o
blig
atio
ns a
nd a
mor
tizat
ion
1,20
4,48
3
(1
21,8
48)
(1
21,8
48)
(1
21,8
48)
To
tal g
over
nmen
tal a
ctiv
ities
exp
ense
s46
,882
,130
50,9
36,7
80
53
,728
,493
53,0
72,2
02
53,4
56,1
69
53,8
31,5
77
55,6
19,0
99
56,0
26,4
96
57,3
43,9
75
64,1
94,4
32
Bus
ines
s-ty
pe a
ctiv
ities
:Fo
od se
rvic
e71
9,79
3
69
9,58
6
75
1,60
1
70
3,25
0
787,
647
78
5,73
8
809,
196
73
0,01
3
710,
095
70
4,80
7
Tota
l bus
ines
s-ty
pe a
ctiv
ities
exp
ense
719,
793
699,
586
751,
601
703,
250
78
7,64
7
785,
738
80
9,19
6
730,
013
71
0,09
5
704,
807
To
tal d
istri
ct e
xpen
ses
47,6
01,9
23$
51
,636
,366
$
54,4
80,0
94$
53
,775
,452
$
54
,243
,816
$
54
,617
,315
$
56
,428
,295
$
56
,756
,509
$
58
,054
,070
$
64
,899
,239
$
Prog
ram
Rev
enue
sG
over
nmen
tal a
ctiv
ities
:C
harg
es fo
r ser
vice
s:O
pera
ting
gran
ts a
nd c
ontri
butio
ns93
8,72
4$
1,
069,
304
$
1,
107,
207
$
1,
172,
014
$
1,81
0,55
7$
1,
178,
123
$
1,12
3,27
8$
1,
121,
693
$
1,11
2,46
3$
1,
183,
677
$
Cap
ital g
rant
s and
con
tribu
tions
-
-
-
-
35
,600
-
-
Tota
l gov
ernm
enta
l act
iviti
es p
rogr
am re
venu
es93
8,72
4
1,
069,
304
1,
107,
207
1,
172,
014
1,84
6,15
7
1,
178,
123
1,12
3,27
8
1,
121,
693
1,11
2,46
3
1,
183,
677
Ram
sey
Boa
rd o
f Edu
catio
nC
hang
es in
Net
Ass
ets/
Posi
tion*
, Las
t Ten
Fis
cal Y
ears
(acc
rual
bas
is o
f acc
ount
ing)
Fisc
al Y
ear E
ndin
g Ju
ne 3
0,
-106-

Exh
ibit
J-2
2006
2007
2008
2009
2010
2011
2012
2013
2014
2015
Ram
sey
Boa
rd o
f Edu
catio
nC
hang
es in
Net
Ass
ets/
Posi
tion*
, Las
t Ten
Fis
cal Y
ears
(acc
rual
bas
is o
f acc
ount
ing)
Fisc
al Y
ear E
ndin
g Ju
ne 3
0,
Bus
ines
s-ty
pe a
ctiv
ities
:C
harg
es fo
r ser
vice
sFo
od se
rvic
e68
9,26
9
67
2,93
8
69
1,33
9
63
1,45
0
692,
468
70
9,35
0
692,
178
59
7,77
2
592,
876
53
8,09
5
Ope
ratin
g gr
ants
and
con
tribu
tions
58,2
84
64
,139
74,1
03
75,4
86
88
,025
84,4
72
97
,522
93,9
15
10
3,49
3
99,5
80
C
apita
l gra
nts a
nd c
ontri
butio
ns-
-
-
-
-
-
-
-
-
-
Tota
l bus
ines
s typ
e ac
tiviti
es p
rogr
am re
venu
es74
7,55
3
73
7,07
7
76
5,44
2
70
6,93
6
780,
493
79
3,82
2
789,
700
69
1,68
7
696,
369
63
7,67
5
Tota
l dis
trict
pro
gram
reve
nues
1,68
6,27
7$
1,80
6,38
1$
1,87
2,64
9$
1,87
8,95
0$
2,
626,
650
$
1,97
1,94
5$
1,
912,
978
$
1,81
3,38
0$
1,
808,
832
$
1,82
1,35
2$
Net
(Exp
ense
)/Rev
enue
Gov
ernm
enta
l act
iviti
es(4
5,94
3,40
6)$
(4
9,86
7,47
6)$
(5
2,62
1,28
6)$
(5
1,90
0,18
8)$
(51,
610,
012)
$
(5
2,65
3,45
4)$
(54,
495,
821)
$
(5
4,90
4,80
3)$
(56,
231,
512)
$
(6
3,01
0,75
5)$
Bus
ines
s-ty
pe a
ctiv
ities
27,7
60
37
,491
13,8
41
3,68
6
(7,1
54)
8,08
4
(19,
496)
(3
8,32
6)
(13,
726)
(6
7,13
2)
Tota
l dis
trict
-wid
e ne
t exp
ense
(45,
915,
646)
$
(49,
829,
985)
$
(52,
607,
445)
$
(51,
896,
502)
$
(5
1,61
7,16
6)$
(52,
645,
370)
$
(5
4,51
5,31
7)$
(54,
943,
129)
$
(5
6,24
5,23
8)$
(63,
077,
887)
$
Gen
eral
Rev
enue
s and
Oth
er C
hang
es in
Net
Pos
ition
Gov
ernm
enta
l act
iviti
es:
Prop
erty
taxe
s lev
ied
for g
ener
al p
urpo
ses,
net
36,1
09,7
34$
39
,011
,486
$
40,5
27,6
56$
41
,700
,559
$
43
,243
,170
$
46
,159
,075
$
46
,954
,695
$
47
,541
,824
$
48
,292
,660
$
48
,971
,745
$
Ta
xes l
evie
d fo
r deb
t ser
vice
2,39
8,81
0
2,19
0,29
3
2,30
5,31
0
2,35
4,72
3
2,
556,
156
2,57
7,38
9
2,
556,
822
2,54
5,34
0
2,
417,
466
2,27
8,08
1
U
nres
trict
ed g
rant
s and
con
tribu
tions
5,71
2,83
8
7,23
9,71
6
7,18
8,58
9
5,71
6,80
0
5,
241,
212
3,95
7,15
1
5,
454,
640
6,81
9,52
5
6,
402,
622
12,3
81,9
43
Fede
ral a
nd S
tate
aid
- C
apita
l Out
lay
5,40
0
562,
284
Tu
ition
rece
ived
1,57
3,14
4
1,66
7,52
8
1,33
0,51
4
1,72
6,88
5
1,
690,
798
1,54
7,11
6
1,
510,
925
1,32
9,17
7
1,
859,
684
1,90
6,30
6
Tr
ansp
orta
tion
Fees
26,9
51
13
,301
14,0
81
23,9
16
15
,830
22,2
97
24
,562
23,6
77
27
,216
30,9
41
In
vest
men
t ear
ning
s41
8,23
8
45
9,97
4
16
8,19
8
68
,529
39,8
93
51
,977
185
216
7,14
1
213
Mis
cella
neou
s inc
ome
64,3
76
12
1,47
6
52
,217
87
6,95
6
232,
558
35
7,94
3
33,2
14
37
,429
88,5
94
71
,148
Tota
l gov
ernm
enta
l act
iviti
es46
,304
,091
50,8
01,8
90
51
,586
,565
52,4
68,3
68
53,0
19,6
17
54,6
72,9
48
56,5
35,0
43
58,3
02,5
88
59,0
95,3
83
66,2
02,6
61
Bus
ines
s-ty
pe a
ctiv
ities
:In
vest
men
t ear
ning
s-
-
-
-
-
-
-
25
64
24
M
isce
llane
ous i
ncom
e-
-
-
-
-
-
-
12,7
06
-
-
To
tal b
usin
ess-
type
act
iviti
es-
-
-
-
-
-
-
12,7
31
64
24
To
tal d
istri
ct-w
ide
46,3
04,0
91$
50
,801
,890
$
51,5
86,5
65$
52
,468
,368
$
53
,019
,617
$
54
,672
,948
$
56
,535
,043
$
58
,315
,319
$
59
,095
,447
$
66
,202
,685
$
Cha
nge
in N
et P
ositi
onG
over
nmen
tal a
ctiv
ities
360,
685
$
934,
414
$
(1,0
34,7
21)
$
56
8,18
0$
1,40
9,60
5$
2,
019,
494
$
2,03
9,22
2$
3,
397,
785
$
2,86
3,87
1$
3,
191,
906
$
Bus
ines
s-ty
pe a
ctiv
ities
27,7
60
37
,491
13,8
41
3,68
6
(7,1
54)
8,08
4
(19,
496)
(2
5,59
5)
(13,
662)
(6
7,10
8)
Tota
l dis
trict
388,
445
$
971,
905
$
(1,0
20,8
80)
$
57
1,86
6$
1,40
2,45
1$
2,
027,
578
$
2,01
9,72
6$
3,
372,
190
$
2,85
0,20
9$
3,
124,
798
$
Sour
ce:
CA
FR S
ched
ule
A-2
* - G
ASB
Sta
tem
ent N
o.63
bec
ame
effe
ctiv
e fo
r the
fisc
al y
ear e
nded
June
30,
201
3w
hich
cha
nged
Net
Ass
ets t
o N
et P
ositi
on.
-107-

Exh
ibit
J-3
2006
2007
2008
2009
2010
2011
2012
2013
2014
2015
Gen
eral
Fun
dR
eser
ved
1,17
4,22
4$
1,62
4,14
5$
1,39
0,11
5$
2,48
0,60
7$
3,
445,
095
$
Unr
eser
ved
1,14
2,44
9
1,31
1,08
0
1,13
0,01
5
822,
014
1,
016,
861
Res
trict
ed4,
118,
464
6,34
4,13
1
7,
504,
974
9,53
1,40
0
9,
746,
063
Com
mitt
ed42
0,00
0
Ass
igne
d12
7,56
2
32,7
22
64,6
99
30,1
39
18
6,08
0
Una
ssig
ned
1,04
2,50
4
1,
094,
025
1,02
2,52
9
1,
233,
237
955,
131
To
tal g
ener
al fu
nd2,
316,
673
$
2,
935,
225
$
2,
520,
130
$
3,
302,
621
$
4,46
1,95
6$
5,
288,
530
$
7,89
0,87
8$
8,
592,
202
$
10,7
94,7
76$
10
,887
,274
$
All
Oth
er G
over
nmen
tal F
unds
Res
erve
d-
$
-
$
-
$
-$
-$
-$
-$
-$
-$
-
$
Unr
eser
ved,
repo
rted
in:
Spec
ial r
even
ue fu
nd-
-
-
-
-
-
-
-
-
-
Cap
ital p
roje
cts f
und
5,70
0,34
1
315,
548
47,0
84
47
,084
45
,683
10
6,59
3
106,
593
10
6,59
3
106,
593
32
7,45
5
Deb
t ser
vice
fund
577,
233
559,
746
290,
041
22,3
35
19,3
45
22,9
47
8,03
2
11
8,51
3
126,
105
12
,235
Perm
anen
t fun
d-
-
-
-
-
-
-
Tota
l all
othe
r gov
ernm
enta
l fun
ds6,
277,
574
$
87
5,29
4$
33
7,12
5$
69
,419
$
65
,028
$
12
9,54
0$
114,
625
$
22
5,10
6$
232,
698
$
33
9,69
0$
Sour
ce:
CA
FR S
ched
ule
B-1
Ram
sey
Boa
rd o
f Edu
catio
nFu
nd B
alan
ces,
Gov
ernm
enta
l Fun
ds,
Las
t Ten
Fis
cal Y
ears
(mod
ified
acc
rual
bas
is o
f acc
ount
ing)
Fisc
al Y
ear E
ndin
g Ju
ne 3
0,
-108-

Exh
ibit
J-4
2006
2007
2008
2009
2010
2011
2012
2013
2014
2015
Rev
enue
sTa
x le
vy38
,508
,544
$
41,2
01,7
79$
42
,832
,966
$
44,0
55,2
82$
45
,799
,326
$
48,7
36,4
64$
49
,511
,517
$
50
,087
,164
$
50
,710
,126
$
51
,249
,826
$
Tu
ition
cha
rges
1,57
3,14
41,
667,
528
1,33
0,51
41,
726,
885
1,69
0,79
81,
547,
116
1,51
0,92
51,
329,
177
1,85
9,68
4
1,90
6,30
6
Tran
spor
tatio
n fe
es26
,951
13,3
0114
,081
23,9
1615
,830
22,2
9724
,562
23,6
7727
,216
30
,941
In
tere
st e
arne
d14
3,64
917
4,81
516
3,31
368
,529
39,8
9351
,977
185
216
7,14
1
213
Oth
er L
ocal
Rev
enue
64,3
7612
1,47
652
,217
876,
956
232,
558
357,
943
33,2
1437
,429
88,5
94
71,1
48
Stat
e so
urce
s6,
032,
572
7,
552,
265
7,51
3,80
1
6,
064,
521
5,57
2,28
9
4,21
7,89
9
5,63
5,96
8
7,09
4,53
2
6,68
5,95
0
7,70
8,22
9
Fede
ral s
ourc
es61
8,99
0
75
6,75
5
781,
995
82
4,29
3
1,51
5,08
0
917,
375
941,
950
852,
086
829,
135
860,
056
Tota
l rev
enue
46,9
68,2
26
51
,487
,919
52,6
88,8
87
53
,640
,382
54,8
65,7
74
55
,851
,071
57,6
58,3
21
59,4
24,2
81
60,2
07,8
46
61,8
26,7
19
Exp
endi
ture
sIn
stru
ctio
nR
egul
ar In
stru
ctio
n14
,455
,060
15,0
20,1
31
15
,835
,712
16,1
91,5
26
17
,192
,653
17,2
47,7
62
17
,213
,992
18
,593
,763
18
,492
,941
18
,934
,393
Sp
ecia
l edu
catio
n in
stru
ctio
n3,
988,
999
4,
490,
278
4,68
1,49
1
4,
786,
241
4,63
0,80
8
3,91
2,53
9
3,65
4,05
1
3,81
3,02
6
3,93
1,86
2
4,11
9,09
7
Oth
er sp
ecia
l ins
truct
ion
926,
447
839,
054
1,
001,
460
1,01
5,95
3
86
5,38
2
68
2,33
4
77
7,32
9
79
4,12
1
79
1,83
7
75
7,98
3
O
ther
inst
ruct
ion
738,
003
793,
637
83
8,03
9
894,
799
84
2,08
6
84
9,80
2
87
5,68
4
93
5,88
1
1,
002,
426
1,
072,
134
Su
ppor
t Ser
vice
s:Tu
ition
2,34
0,36
1
2,17
5,81
0
2,
353,
407
2,51
6,48
2
1,
945,
016
2,
758,
946
2,
994,
928
2,
336,
364
2,
446,
519
2,
612,
882
A
ttend
ance
and
soci
al w
ork
seriv
ces
40,5
56
41,7
74
43
,168
44,1
77
45
,225
44
,137
74
,196
40
,645
42
,916
43
,686
H
ealth
serv
ices
298,
739
300,
730
33
3,11
2
353,
605
38
1,02
7
40
1,58
3
40
8,93
0
42
3,03
1
44
3,31
5
47
0,36
0
St
uden
t & in
stru
ctio
n re
late
d se
rvic
es4,
990,
482
5,
128,
089
5,42
9,81
5
5,
576,
927
5,51
2,24
3
5,67
4,54
0
5,24
6,22
7
6,00
4,62
7
6,55
4,09
3
6,73
5,69
0
Gen
eral
adm
inis
trativ
e se
rvic
es1,
237,
337
1,
247,
229
1,02
2,13
5
1,
394,
797
989,
238
1,11
0,82
2
1,15
9,07
4
1,15
7,92
7
1,24
9,80
9
1,08
8,76
6
Scho
ol A
dmin
istra
tive
serv
ices
1,92
5,36
1
1,88
5,03
5
1,
882,
569
2,00
3,18
1
1,
750,
632
1,
843,
531
1,
880,
884
1,
818,
342
1,
846,
347
1,
890,
814
C
entra
l ser
vice
s35
1,01
4
36
9,16
7
399,
437
41
1,99
1
418,
446
432,
114
439,
942
449,
197
473,
459
488,
162
Adm
inis
trativ
e in
form
atio
n te
ch16
,000
49
,956
16,9
80
17
,460
17,4
60
17,4
60
17,4
60
17,4
60
17,4
60
17,4
60
Plan
t ope
ratio
ns a
nd m
aint
enan
ce3,
511,
685
3,
829,
041
3,99
0,83
6
3,
794,
057
3,93
9,19
1
3,99
2,07
4
4,32
9,07
1
4,33
7,03
1
4,50
0,90
2
4,47
9,23
7
Pupi
l tra
nspo
rtatio
n1,
469,
777
1,
577,
582
1,74
2,76
5
1,
665,
714
1,67
3,94
3
1,59
2,39
9
1,47
2,32
5
1,31
2,94
6
1,38
6,59
6
1,38
1,06
2
Una
lloca
ted
empl
oyee
ben
efits
5,37
9,64
6
5,77
4,21
5
6,
274,
272
6,56
3,08
3
7,
620,
214
8,
113,
738
8,
014,
412
7,
255,
936
6,
731,
933
6,
895,
771
TP
AF
Pens
ion
/ Soc
ial S
ecur
ity3,
386,
324
4,
865,
451
4,89
7,72
2
3,
195,
812
3,23
3,97
6
3,24
8,52
0
3,88
3,30
6
5,09
6,10
4
4,42
3,95
2
5,19
3,74
1
Cap
ital o
utla
y39
,583
91
,321
55,7
52
59
,913
92,2
49
460,
295
52,9
10
1,77
5,77
3
1,23
9,41
7
3,05
3,82
7
Deb
t ser
vice
:Pr
inci
pal
1,23
5,00
0
1,29
5,00
0
1,
355,
000
1,40
5,00
0
1,
460,
000
1,
580,
000
1,
650,
000
1,
925,
000
1,
815,
000
1,
850,
000
In
tere
st a
nd o
ther
cha
rges
1,24
6,83
6
1,19
7,93
9
1,
224,
900
1,23
4,87
9
1,
101,
041
99
7,38
9
92
6,16
7
52
5,30
2
60
6,89
6
54
2,16
4
To
tal e
xpen
ditu
res
47,5
77,2
10
50
,971
,439
53,3
78,5
72
53
,125
,597
53,7
10,8
30
54
,959
,985
55,0
70,8
88
58,6
12,4
76
57,9
97,6
80
61,6
27,2
29
Exce
ss (D
efic
ienc
y) o
f rev
enue
s o
ver (
unde
r) e
xpen
ditu
res
(608
,984
)
51
6,48
0
(689
,685
)
514,
785
1,
154,
944
89
1,08
6
2,
587,
433
81
1,80
5
2,
210,
166
19
9,49
0
Ram
sey
Boa
rd o
f Edu
catio
nC
hang
es in
Fun
d B
alan
ces,
Gov
ernm
enta
l Fun
ds,
Las
t Ten
Fis
cal Y
ears
-109-

Exh
ibit
J-4
2006
2007
2008
2009
2010
2011
2012
2013
2014
2015
Ram
sey
Boa
rd o
f Edu
catio
nC
hang
es in
Fun
d B
alan
ces,
Gov
ernm
enta
l Fun
ds,
Las
t Ten
Fis
cal Y
ears
Oth
er F
inan
cing
sour
ces (
uses
)B
ond
proc
eeds
274,
589
Tran
sfer
s in
285,
159
17
,450
74,0
48
192,
564
185
1,44
0,11
6
1,04
1,92
6
2,45
2,67
0
Tran
sfer
s out
(200
,574
)
4,88
5
(17,
450)
(74,
048)
(192
,564
)
(1
85)
(1,4
40,1
16)
(1
,041
,926
)
(2,4
52,6
70)
To
tal o
ther
fina
ncin
g so
urce
s (us
es)
274,
589
84,5
85
4,
885
-
-
-
-
-
-
-
Net
cha
nge
in fu
nd b
alan
ces
(334
,395
)$
60
1,06
5$
(684
,800
)$
514,
785
$
1,
154,
944
$
89
1,08
6$
2,
587,
433
$
81
1,80
5$
2,
210,
166
$
19
9,49
0$
Deb
t ser
vice
as a
per
cent
age
ofno
ncap
ital e
xpen
ditu
res
5.2%
4.9%
4.8%
5.0%
4.8%
4.7%
4.7%
4.3%
4.3%
4.1%
-110-
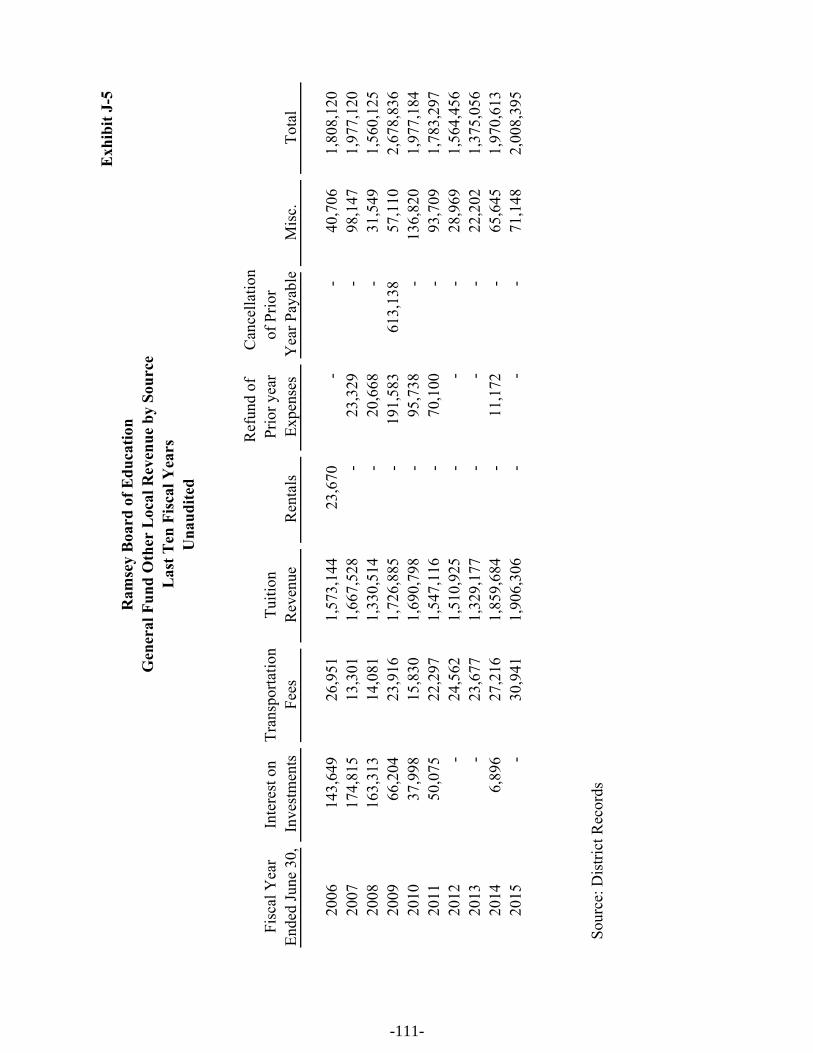
Exh
ibit
J-5
Ref
und
of
Can
cella
tion
Fisc
al Y
ear
Inte
rest
on
Tran
spor
tatio
nTu
ition
Prio
r yea
rof
Prio
rEn
ded
June
30,
Inve
stm
ents
Fees
Rev
enue
Ren
tals
Expe
nses
Yea
r Pay
able
Mis
c.To
tal
2006
143,
649
26
,951
1,
573,
144
23,6
70
-
-
40,7
06
1,80
8,12
0
2007
174,
815
13
,301
1,
667,
528
-
23
,329
-
98,1
47
1,97
7,12
0
2008
163,
313
14
,081
1,
330,
514
-
20
,668
-
31,5
49
1,56
0,12
5
2009
66,2
04
23,9
16
1,72
6,88
5
-
191,
583
613,
138
57,1
10
2,67
8,83
6
2010
37,9
98
15,8
30
1,69
0,79
8
-
95,7
38
-
13
6,82
0
1,
977,
184
20
1150
,075
22
,297
1,
547,
116
-
70
,100
-
93,7
09
1,78
3,29
7
2012
-
24,5
62
1,51
0,92
5
-
-
-
28,9
69
1,56
4,45
6
2013
-
23,6
77
1,32
9,17
7
-
-
-
22,2
02
1,37
5,05
6
2014
6,89
6
27
,216
1,
859,
684
-
11
,172
-
65,6
45
1,97
0,61
3
2015
-
30,9
41
1,90
6,30
6
-
-
-
71,1
48
2,00
8,39
5
Sour
ce: D
istri
ct R
ecor
ds
Ram
sey
Boa
rd o
f Edu
catio
nG
ener
al F
und
Oth
er L
ocal
Rev
enue
by
Sour
ceL
ast T
en F
isca
l Yea
rsU
naud
ited
-111-
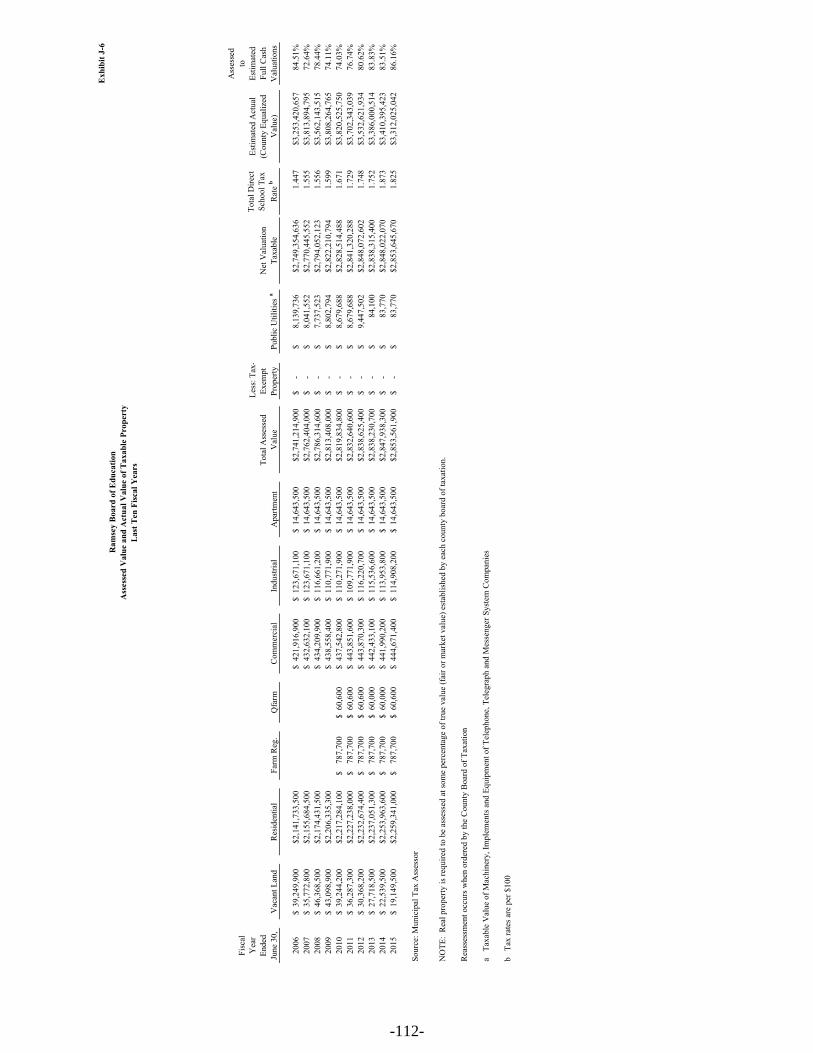
Exh
ibit
J-6
Fisc
al
Yea
r En
ded
June
30,
Vac
ant L
and
Res
iden
tial
Farm
Reg
.Q
farm
Com
mer
cial
Indu
stria
lA
partm
ent
Tota
l Ass
esse
d V
alue
Less
: Tax
-Ex
empt
Pr
oper
tyPu
blic
Util
ities
aN
et V
alua
tion
Taxa
ble
Tota
l Dire
ct
Scho
ol T
ax
Rat
e b
Estim
ated
Act
ual
(Cou
nty
Equa
lized
V
alue
)
Ass
esse
d to
Es
timat
ed
Full
Cas
h V
alua
tions
2006
39,2
49,9
00$
$2
,141
,733
,500
421,
916,
900
$
123,
671,
100
$
14,6
43,5
00$
$2
,741
,214
,900
-$
8,13
9,73
6$
$2
,749
,354
,636
1.44
7$3
,253
,420
,657
84.5
1%20
0735
,772
,800
$
$2,1
55,6
84,5
0043
2,63
2,10
0$
12
3,67
1,10
0$
14
,643
,500
$
$2,7
62,4
04,0
00-
$
8,
041,
552
$
$2,7
70,4
45,5
521.
555
$3,8
13,8
94,7
9572
.64%
2008
46,3
68,5
00$
$2
,174
,431
,500
434,
209,
900
$
116,
661,
200
$
14,6
43,5
00$
$2
,786
,314
,600
-$
7,73
7,52
3$
$2
,794
,052
,123
1.55
6$3
,562
,143
,515
78.4
4%20
0943
,098
,900
$
$2,2
06,3
35,3
0043
8,55
8,40
0$
11
0,77
1,90
0$
14
,643
,500
$
$2,8
13,4
08,0
00-
$
8,
802,
794
$
$2,8
22,2
10,7
941.
599
$3,8
08,2
64,7
6574
.11%
2010
39,2
44,2
00$
$2
,217
,284
,100
787,
700
$
60,6
00$
43
7,54
2,80
0$
11
0,27
1,90
0$
14
,643
,500
$
$2,8
19,8
34,8
00-
$
8,
679,
688
$
$2,8
28,5
14,4
881.
671
$3,8
20,5
25,7
5074
.03%
2011
36,2
87,3
00$
$2
,227
,238
,000
787,
700
$
60,6
00$
44
3,85
1,60
0$
10
9,77
1,90
0$
14
,643
,500
$
$2,8
32,6
40,6
00-
$
8,
679,
688
$
$2,8
41,3
20,2
881.
729
$3,7
02,3
43,0
3976
.74%
2012
30,3
68,2
00$
$2
,232
,674
,400
787,
700
$
60,6
00$
44
3,87
0,30
0$
11
6,22
0,70
0$
14
,643
,500
$
$2,8
38,6
25,4
00-
$
9,
447,
502
$
$2,8
48,0
72,6
021.
748
$3,5
32,6
21,9
3480
.62%
2013
27,7
18,5
00$
$2
,237
,051
,300
787,
700
$
60,0
00$
44
2,43
3,10
0$
11
5,53
6,60
0$
14
,643
,500
$
$2,8
38,2
30,7
00-
$
84
,100
$
$2,8
38,3
15,4
001.
752
$3,3
86,0
00,5
1483
.83%
2014
22,5
39,5
00$
$2
,253
,963
,600
787,
700
$
60,0
00$
44
1,99
0,20
0$
11
3,95
3,80
0$
14
,643
,500
$
$2,8
47,9
38,3
00-
$
83
,770
$
$2,8
48,0
22,0
701.
873
$3,4
10,3
95,4
2383
.51%
2015
19,1
49,5
00$
$2
,259
,341
,000
787,
700
$
60,6
00$
44
4,67
1,40
0$
11
4,90
8,20
0$
14
,643
,500
$
$2,8
53,5
61,9
00-
$
83
,770
$
$2,8
53,6
45,6
701.
825
$3,3
12,0
25,0
4286
.16%
Sour
ce: M
unic
ipal
Tax
Ass
esso
r
Rea
sses
smen
t occ
urs w
hen
orde
red
by th
e C
ount
y B
oard
of T
axat
ion
a T
axab
le V
alue
of M
achi
nery
, Im
plem
ents
and
Equ
ipm
ent o
f Tel
epho
ne, T
eleg
raph
and
Mes
seng
er S
yste
m C
ompa
nies
b T
ax ra
tes a
re p
er $
100
NO
TE:
Rea
l pro
perty
is re
quire
d to
be
asse
ssed
at s
ome
perc
enta
ge o
f tru
e va
lue
(fai
r or m
arke
t val
ue) e
stab
lishe
d by
eac
h co
unty
boa
rd o
f tax
atio
n.
Ram
sey
Boa
rd o
f Edu
catio
nA
sses
sed
Val
ue a
nd A
ctua
l Val
ue o
f Tax
able
Pro
pert
yL
ast T
en F
isca
l Yea
rs
-112-

Exh
ibit
J-7
Ove
rlapp
ing
Rat
es
Fisc
al
Yea
r En
ded
Dec
. 31,
Bas
ic R
ate
a
Gen
eral
O
blig
atio
n D
ebt S
ervi
ce
bTo
tal
Dire
ct
Bor
ough
of
R
amse
yB
erge
n C
ount
y
2006
1.37
90.
068
1.44
70.
477
0.21
82.
1420
070.
000
0.00
01.
518
0.49
90.
233
2.25
2008
1.49
60.
059
1.55
50.
519
0.25
62.
3320
091.
540
0.05
91.
599
0.53
90.
260
2.40
2010
1.57
80.
093
1.67
10.
558
0.26
52.
4920
111.
637
0.09
21.
729
0.56
20.
271
2.56
2012
1.65
70.
091
1.74
80.
569
0.27
22.
5920
131.
663
0.08
91.
752
0.57
80.
273
2.60
2014
1.70
30.
085
1.78
80.
617
0.27
62.
6820
151.
743
0.08
21.
825
0.55
80.
276
2.66
Sour
ce: D
istri
ct R
ecor
ds a
nd M
unic
ipal
Tax
Col
lect
or
Not
e:
aTh
e di
stric
t's b
asic
tax
rate
is c
alcu
late
d fr
om th
e A
4F fo
rm w
hich
is su
bmitt
ed w
ith th
ebu
dget
and
the
Net
val
uatio
n ta
xabl
e.b
Rat
es fo
r deb
t ser
vice
are
bas
ed o
n ea
ch y
ear's
requ
irem
ents
.
Ram
sey
Boa
rd o
f Edu
catio
n
NJS
A 1
8A:7
F-5d
lim
its th
e am
ount
that
the
dist
rict c
an su
bmit
for a
gen
eral
fund
tax
levy
. Th
e le
vy w
hen
adde
d to
oth
er c
ompo
nent
s of t
he d
istri
ct's
net b
udge
t may
not
exc
eed
the
preb
udge
t ye
ar n
et b
udge
t by
mor
e th
an th
e sp
endi
ng g
row
th li
mita
tion
calc
ulat
ed a
s fol
low
s: t
he
preb
udge
t yea
r net
bud
get i
ncre
ased
by
the
cost
of l
ivin
g or
2.5
per
cent
, whi
chev
er is
gre
ater
, pl
us a
ny sp
endi
ng g
row
th a
djus
tmen
ts.
Tota
l Dire
ct
and
Ove
rlapp
ing
Tax
Rat
e
Ram
sey
Boa
rd o
f Edu
catio
nD
irec
t and
Ove
rlap
ping
Pro
pert
y T
ax R
ates
Las
t Ten
Yea
rs(r
ate
per $
100
of a
sses
sed
valu
e)
-113-

Exh
ibit
J-8
Tax
able
% o
f T
ota
lT
axab
le%
of
Tota
l
Ass
esse
dR
ank
Dis
tric
t N
et
Ass
esse
dR
ank
Dis
tric
t N
et
Tax
pay
erV
alue
[Opti
onal
]A
sses
sed V
alue
Val
ue
[Opti
onal
]A
sses
sed V
alue
Ram
sey I
nte
rsta
te C
TR
LL
C62,2
17,6
00
$
12.1
8%
55,8
00,0
00
$
1
Com
mer
cial
Rea
lty E
nte
rpri
ses
32,6
75,0
00
$
21.1
5%
32,6
75,0
00
$
21.1
9%
Min
olt
a C
orp
. C
/O T
ax M
gr
27,5
00,0
00
$
30.9
6%
13,1
33,3
00
$
60.4
8%
Kri
suje
n R
ealt
y L
.P.
20,6
25,3
00
$
40.7
2%
14,4
00,0
00
$
40.5
2%
Rea
lty A
ssoci
ates
Fu
nd
VII
I L
P15,0
75,6
00
$
50.5
3%
17,4
63,1
00
$
30.6
4%
Sop
ris
Mgm
t L
LC
14,4
00,0
00
$
60.5
0%
Tri
angle
17
Cen
ter
LL
C12,8
60,0
00
$
70.4
5%
13,6
00,0
00
$
50.4
9%
Min
olt
a C
orp
. C
/O T
ax M
gr
10,2
65,3
00
$
70.3
7%
Adven
ture
s in
Rec
reat
ion
, In
c.9,1
25,0
00
$
80.3
2%
9,1
25,0
00
$
80.3
3%
Fer
ncr
oft
C/O
H.W
. Y
ou
ng &
Ass
oc.
, In
c.9,0
02,6
00
$
90.3
2%
9,0
02,6
00
$
90.3
3%
Kis
levit
z, C
/O H
unte
r G
rou
p9,0
00,0
00
$
10
0.3
2%
Gab
rell
ian
Ass
oci
ates
0.0
0%
BR
E/E
SA
Pro
per
ties
LL
C8,7
50,0
00
$
10
0.3
2%
Tota
l212,4
81,1
00
$
7.4
5%
184,2
14,3
00
$
4.6
7%
N
et A
sses
sed V
aluat
ion:
2,8
53,6
45,6
70
$
2,7
49,3
54,6
36
$
Sou
rce:
M
un
icip
al T
ax A
sses
sor.
2015
2006
Ram
sey
Board
of
Ed
ucati
on
Prin
cip
al
Prop
erty
Taxp
ay
ers
Cu
rren
t Y
ear a
nd
Nin
e Y
ears
Ago
-114-

Exh
ibit
J-9
Am
ount
Perc
enta
ge
of L
evy
2006
39,7
40,6
79
39
,740
,679
100.
00%
-$
20
0742
,061
,180
42,0
61,1
80
10
0.00
%-
$
2008
43,4
62,5
18
43
,461
,518
100.
00%
-$
20
0945
,019
,071
45,0
19,0
71
10
0.00
%-
$
2010
47,2
64,9
67
47
,264
,967
100.
00%
-$
20
1148
,736
,464
48,7
36,4
64
10
0.00
%-
$
2012
49,5
11,5
17
49
,511
,517
100.
00%
-$
20
1350
,087
,164
50,0
87,1
64
10
0.00
%-
$
20
1450
,710
,126
50,7
10,1
26
10
0.00
%-
$
20
1551
,249
,826
51,2
49,8
26
10
0.00
%-
$
Sour
ce: M
unic
ipal
Tax
Col
lect
or
Ram
sey
Boa
rd o
f Edu
catio
nPr
oper
ty T
ax L
evie
s and
Col
lect
ions
Las
t Ten
Yea
rs
Fisc
al
Yea
r En
ded
June
30,
Col
lect
ed w
ithin
the
Fisc
al
Yea
r of t
he L
evy
Taxe
s Lev
ied
for t
he Y
ear
Col
lect
ions
in
Su
bseq
uent
Y
ears
-115-

Exh
ibit
J-10
Bus
ines
s-Ty
pe
Act
iviti
esFi
scal
Y
ear
Ende
d Ju
ne 3
0,
Gen
eral
O
blig
atio
n B
onds
b
Cer
tific
ates
of
Pa
rtici
patio
nC
apita
l Le
ases
Tem
pora
ry
Not
e Pa
yabl
eC
apita
l Lea
ses
Tota
l Dis
trict
Perc
enta
ge o
f Pe
rson
al
Inco
me
aPe
r Cap
ita
a
2006
28,2
64,0
00
-
-
-
-
28,2
64,0
00
3.09
6%44
8$
20
0726
,969
,000
-
-
-
-
26
,969
,000
2.
755%
399
$
2008
25,6
14,0
00
-
-
4,
000,
000
-
29,6
14,0
00
3.02
7%44
0$
20
0924
,209
,000
-
-
2,50
0,00
0
-
26
,709
,000
2.
841%
418
$
2010
22,7
49,0
00
-
-
2,
500,
000
-
25,2
49,0
00
2.72
7%39
5$
20
1121
,169
,000
-
-
2,50
0,00
0
-
23
,669
,000
2.
411%
352
$
2012
19,5
05,0
00
-
-
2,
500,
000
-
22,0
05,0
00
2.16
6%31
8$
20
1317
,580
,000
-
-
2,50
0,00
0
-
20
,080
,000
1.
960%
289
$
2014
15,7
65,0
00
-
-
2,
500,
000
-
18,2
65,0
00
Not
Ava
ilabl
eN
ot A
vaila
ble
2015
13,9
15,0
00
-
-
-
-
13,9
15,0
00
Not
Ava
ilabl
eN
ot A
vaila
ble
Sour
ce:
Dis
trict
CA
FR S
ched
ules
I-1,
I-2
Not
e: D
etai
ls re
gard
ing
the
dist
rict's
out
stan
ding
deb
t can
be
foun
d in
the
note
s to
the
finan
cial
stat
emen
ts.
aSe
e E
xhib
it N
J J-1
4 fo
r per
sona
l inc
ome
and
popu
latio
n da
ta.
Thes
e ra
tios a
re c
alcu
late
d us
ing
pers
onal
inco
me
and
popu
latio
n fo
r the
prio
r cal
enda
r yea
r.
bIn
clud
es E
arly
Ret
irem
ent I
ncen
tive
Plan
(ER
IP) r
efun
ding
Gov
ernm
enta
l Act
iviti
es
Ram
sey
Boa
rd o
f Edu
catio
nR
atio
s of O
utst
andi
ng D
ebt b
y T
ype
Las
t Ten
Fis
cal Y
ears
-116-
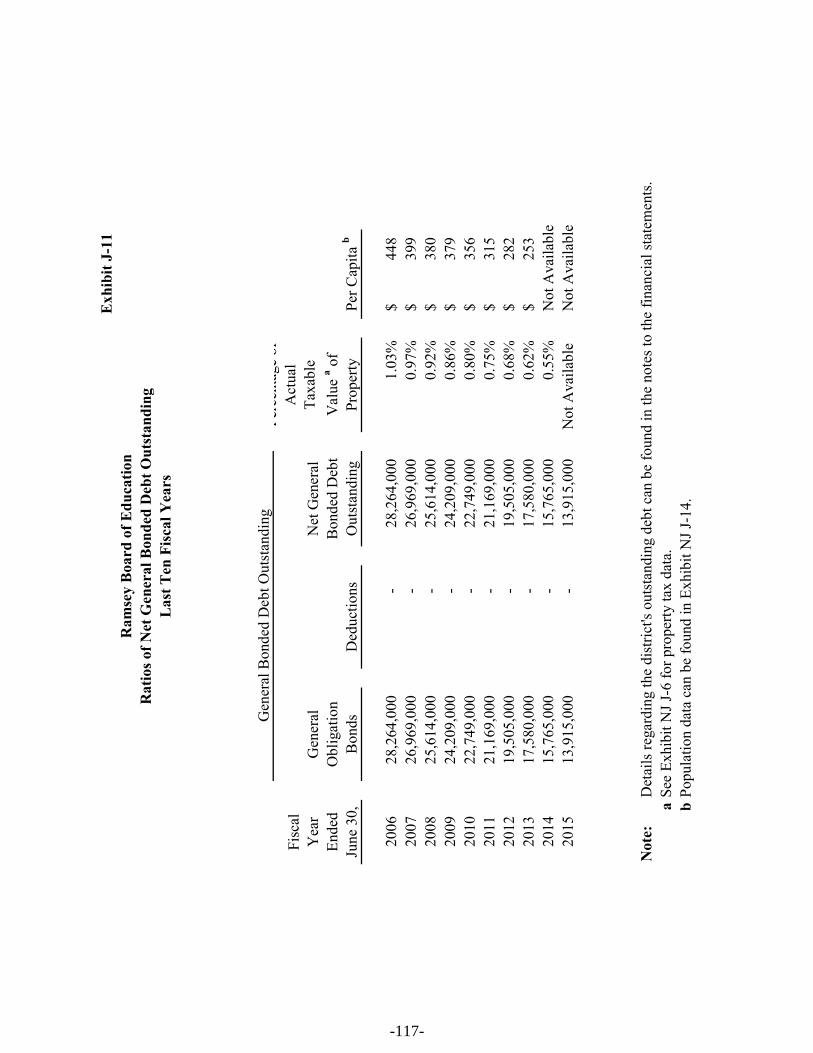
Exh
ibit
J-11
Fisc
al
Yea
r En
ded
June
30,
Gen
eral
O
blig
atio
n B
onds
Ded
uctio
ns
Net
Gen
eral
B
onde
d D
ebt
Out
stan
ding
Perc
enta
ge o
f A
ctua
l Ta
xabl
e V
alue
a of
Prop
erty
Per C
apita
b
2006
28,2
64,0
00
-
28
,264
,000
1.
03%
448
$
20
0726
,969
,000
-
26,9
69,0
00
0.97
%39
9$
2008
25,6
14,0
00
-
25
,614
,000
0.
92%
380
$
20
0924
,209
,000
-
24,2
09,0
00
0.86
%37
9$
2010
22,7
49,0
00
-
22
,749
,000
0.
80%
356
$
20
1121
,169
,000
-
21,1
69,0
00
0.75
%31
5$
2012
19,5
05,0
00
-
19
,505
,000
0.
68%
282
$
20
1317
,580
,000
-
17,5
80,0
00
0.62
%25
3$
2014
15,7
65,0
00
-
15
,765
,000
0.
55%
Not
Ava
ilabl
e20
1513
,915
,000
-
13,9
15,0
00
Not
Ava
ilabl
eN
ot A
vaila
ble
Not
e:D
etai
ls re
gard
ing
the
dist
rict's
out
stan
ding
deb
t can
be
foun
d in
the
note
s to
the
finan
cial
stat
emen
ts.
aSe
e Ex
hibi
t NJ J
-6 fo
r pro
perty
tax
data
. b
Popu
latio
n da
ta c
an b
e fo
und
in E
xhib
it N
J J-1
4.
Gen
eral
Bon
ded
Deb
t Out
stan
ding
Ram
sey
Boa
rd o
f Edu
catio
nR
atio
s of N
et G
ener
al B
onde
d D
ebt O
utst
andi
ngL
ast T
en F
isca
l Yea
rs
-117-

Exh
ibit
J-12
Gov
ernm
enta
l Uni
t
Estim
ated
Pe
rcen
tage
A
pplic
able
aD
ebt
Out
stan
ding
Estim
ated
Sh
are
of
Ove
rlapp
ing
Deb
t
D
irec
t Deb
t of S
choo
l Dis
tric
t as o
f Jun
e 30
, 201
513
,915
,000
$
N
et o
verl
appi
ng d
ebt o
f Sch
ool D
istr
ict:
To
wn
of R
amse
y10
0.00
0%14
,178
,409
$
C
ount
y of
Ber
gen
1.85
3%17
,296
,912
$
Su
btot
al, o
verl
appi
ng d
ebt
31,4
75,3
21$
Tot
al d
irec
t and
ove
rlap
ping
deb
t45
,390
,321
$
Sour
ces:
Ram
sey
Mun
icip
al F
inan
ce O
ffic
er /
Ber
gen
Cou
nty
Trea
sure
r's O
ffic
e
Not
e:
Ove
rlapp
ing
gove
rnm
ents
are
thos
e th
at c
oinc
ide,
at l
east
in p
art,
with
the
geog
raph
ic b
ound
arie
s of t
he D
istri
ct.
This
sche
dule
est
imat
es th
e po
rtion
of t
he o
utst
andi
ng d
ebt o
f tho
se o
verla
ppin
g go
vern
men
ts th
at is
bor
ne b
y th
e re
side
nts a
nd
busi
ness
es o
f Ram
sey.
Thi
s pro
cess
reco
gniz
es th
at, w
hen
cons
ider
ing
the
Dis
trict
's ab
ility
to is
sue
and
repa
y lo
ng-te
rm d
ebt,
the
entir
e de
bt b
urde
n bo
rne
by th
e re
side
nts a
nd b
usin
esse
s sho
uld
be ta
ken
into
acc
ount
. H
owev
er th
is d
oes n
ot im
ply
that
ev
ery
taxp
ayer
is a
resi
dent
, and
ther
efor
e re
spon
sibl
e fo
r rep
ayin
g th
e de
bt, o
f eac
h ov
erla
ppin
g pa
ymen
t.
For
deb
t rep
aid
with
pro
perty
taxe
s, th
e pe
rcen
tage
of o
verla
ppin
g de
bt a
pplic
able
is e
stim
ated
usi
ng ta
xabl
e as
sess
ed p
rope
rty v
alue
s.A
pplic
able
per
cent
ages
wer
e es
timat
ed b
y de
term
inin
g th
e po
rtion
of a
noth
er g
over
nmen
tal u
nit's
taxa
ble
valu
e th
at is
with
in th
e di
stric
t's b
ound
arie
s and
div
idin
g it
by e
ach
unit'
s tot
al ta
xabl
e va
lue.
Ram
sey
Boa
rd o
f Edu
catio
nR
atio
s of O
verl
appi
ng G
over
nmen
tal A
ctiv
ities
Deb
tA
s of J
une
30, 2
015
-118-

Exh
ibit
J-13
Leg
al D
ebt M
argi
n C
alcu
latio
n fo
r Fi
scal
Yea
r 20
15
Equa
lized
val
uatio
n ba
sis
2014
3,41
0,39
5,42
3$
20
133,
386,
000,
514
2012
3,53
2,62
1,93
4
[A
]10
,329
,017
,871
$
Ave
rage
equ
aliz
ed v
alua
tion
of ta
xabl
e pr
oper
ty[A
/3]
3,44
3,00
5,95
7$
Deb
t lim
it (4
% o
f ave
rage
equ
aliz
atio
n va
lue)
[B]
137,
720,
238
a
Net
bon
ded
scho
ol d
ebt
[C]
13,9
15,0
00
Le
gal d
ebt m
argi
n[B
-C]
123,
805,
238
$
2006
2007
2008
2009
2010
2011
2012
2013
2014
2015
Deb
t lim
it11
3,97
7,22
8$
12
8,03
2,81
1$
14
1,02
9,51
4$
148,
562,
832
$
151,
489,
796
$
149,
466,
173
$
149,
628,
416
$
144,
375,
036
$
13
9,98
3,18
6$
137,
720,
238
$
Tota
l net
deb
t app
licab
le to
lim
it28
,264
,000
26,9
69,0
00
25
,614
,000
24,2
09,0
00
22,7
49,0
00
21
,169
,000
19,5
05,0
00
17,5
80,0
00
15
,765
,000
13,9
15,0
00
Lega
l deb
t mar
gin
85,7
13,2
28$
10
1,06
3,81
1$
11
5,41
5,51
4$
124,
353,
832
$
128,
740,
796
$
128,
297,
173
$
130,
123,
416
$
126,
795,
036
$
12
4,21
8,18
6$
123,
805,
238
$
Tota
l net
deb
t app
licab
le to
the
limit
as a
per
cent
age
of d
ebt l
imit
24.8
0%21
.06%
18.1
6%16
.30%
15.0
2%14
.16%
13.0
4%12
.18%
11.2
6%10
.10%
Sour
ce:
Abs
tract
of R
atab
les a
nd D
istri
ct R
ecor
ds C
AFR
Sch
edul
e J-
7
aLi
mit
set b
y N
JSA
18A
:24-
19 fo
r a K
thro
ugh
12 d
istri
ct; o
ther
% li
mits
wou
ld b
e ap
plic
able
for o
ther
dis
trict
s
Ram
sey
Boa
rd o
f Edu
catio
nL
egal
Deb
t Mar
gin
Info
rmat
ion
Las
t Ten
Fis
cal Y
ears
-119-
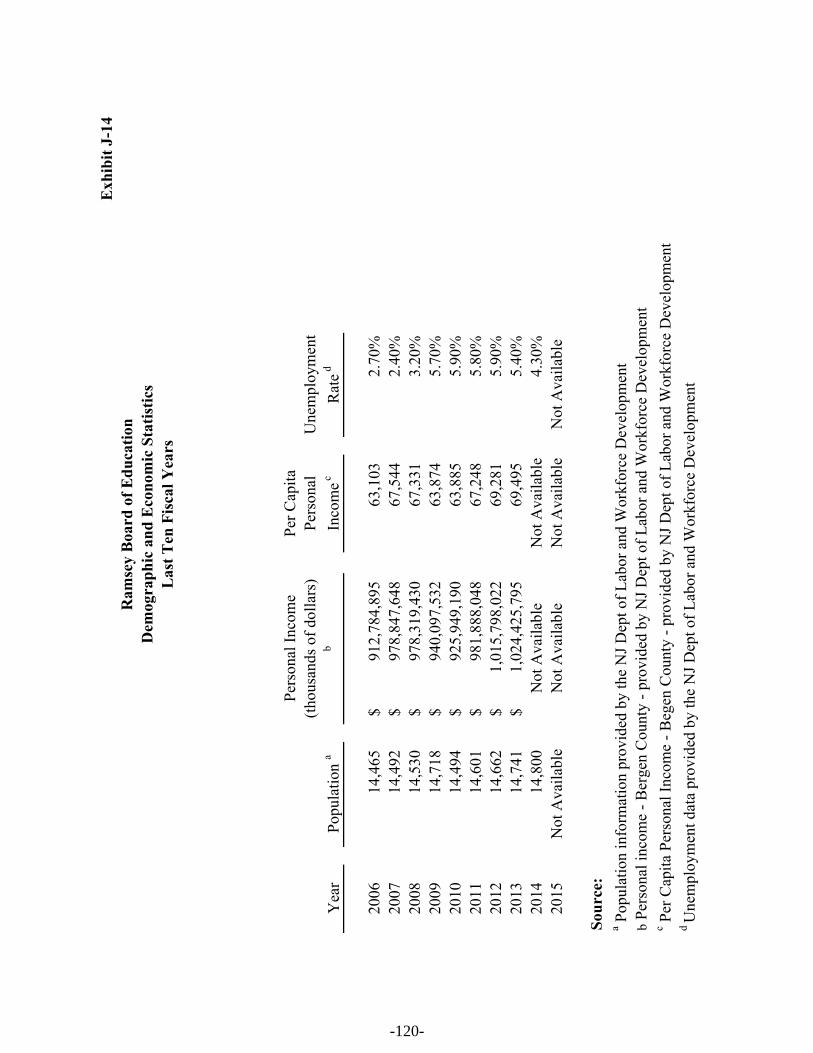
Exh
ibit
J-14
Yea
rPo
pula
tion
a
Pers
onal
Inco
me
(thou
sand
s of d
olla
rs)
b
Per C
apita
Pe
rson
al
Inco
me c
Une
mpl
oym
ent
Rat
e d
2006
14,4
65
91
2,78
4,89
5$
63,1
03
2.
70%
2007
14,4
92
97
8,84
7,64
8$
67,5
44
2.
40%
2008
14,5
30
97
8,31
9,43
0$
67,3
31
3.
20%
2009
14,7
18
94
0,09
7,53
2$
63,8
74
5.
70%
2010
14,4
94
92
5,94
9,19
0$
63,8
85
5.
90%
2011
14,6
01
98
1,88
8,04
8$
67,2
48
5.
80%
2012
14,6
62
1,
015,
798,
022
$
69,2
81
5.
90%
2013
14,7
41
1,
024,
425,
795
$
69,4
95
5.
40%
2014
14,8
00
N
ot A
vaila
ble
Not
Ava
ilabl
e4.
30%
2015
Not
Ava
ilabl
eN
ot A
vaila
ble
Not
Ava
ilabl
eN
ot A
vaila
ble
Sour
ce:
a Pop
ulat
ion
info
rmat
ion
prov
ided
by
the
NJ D
ept o
f Lab
or a
nd W
orkf
orce
Dev
elop
men
tb
Pers
onal
inco
me
- Ber
gen
Cou
nty
- pro
vide
d by
NJ D
ept o
f Lab
or a
nd W
orkf
orce
Dev
elop
men
tc P
er C
apita
Per
sona
l Inc
ome
- Beg
en C
ount
y - p
rovi
ded
by N
J Dep
t of L
abor
and
Wor
kfor
ce D
evel
opm
ent
d U
nem
ploy
men
t dat
a pr
ovid
ed b
y th
e N
J Dep
t of L
abor
and
Wor
kfor
ce D
evel
opm
ent
Ram
sey
Boa
rd o
f Edu
catio
nD
emog
raph
ic a
nd E
cono
mic
Sta
tistic
sL
ast T
en F
isca
l Yea
rs
-120-
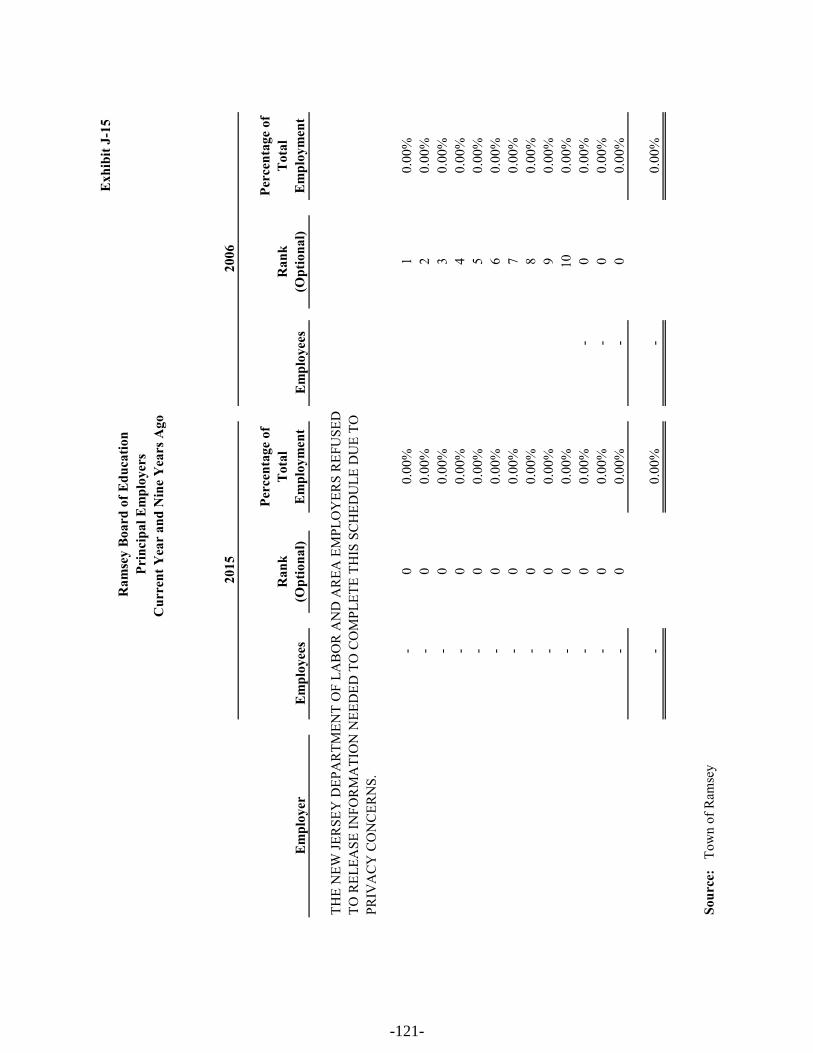
Exh
ibit
J-15
Em
ploy
erE
mpl
oyee
sR
ank
(Opt
iona
l)
Perc
enta
ge o
f T
otal
E
mpl
oym
ent
Em
ploy
ees
Ran
k (O
ptio
nal)
Perc
enta
ge o
f T
otal
E
mpl
oym
ent
THE
NEW
JER
SEY
DEP
AR
TMEN
T O
F LA
BO
R A
ND
AR
EA E
MPL
OY
ERS
REF
USE
DTO
REL
EASE
INFO
RM
ATI
ON
NEE
DED
TO
CO
MPL
ETE
THIS
SC
HED
ULE
DU
E TO
PR
IVA
CY
CO
NC
ERN
S.
-
0
0.00
%1
0.00
%-
00.
00%
20.
00%
-
0
0.00
%3
0.00
%-
00.
00%
40.
00%
-
0
0.00
%5
0.00
%-
00.
00%
60.
00%
-
0
0.00
%7
0.00
%-
00.
00%
80.
00%
-
0
0.00
%9
0.00
%-
00.
00%
100.
00%
-
00.
00%
-
0
0.00
%-
00.
00%
-
0
0.00
%-
00.
00%
-
0
0.00
%
-
0.
00%
-
0.
00%
Sour
ce:
Tow
n of
Ram
sey
2006
2015
Ram
sey
Boa
rd o
f Edu
catio
nPr
inci
pal E
mpl
oyer
sC
urre
nt Y
ear
and
Nin
e Y
ears
Ago
-121-

Exh
ibit
J-16
2006
2007
2008
2009
2010
2011
2012
2013
2014
2015
Func
tion/
Prog
ram
Inst
ruct
ion
Reg
ular
252
254
253
25
3
24
8
24
1
23
9
242
24
3
243
Sp
ecia
l edu
catio
n41
43
43
44
42
41
41
42
42
42
O
ther
spec
ial e
duca
tion
-
-
-
-
-
-
-
-
-
-
Voc
atio
nal
-
-
-
-
-
-
-
-
-
-
Oth
er in
stru
ctio
n-
-
-
-
-
-
-
-
-
-
N
onpu
blic
scho
ol p
rogr
ams
-
-
-
-
-
-
-
-
-
-
Adu
lt/co
ntin
uing
edu
catio
n pr
ogra
ms
-
-
-
-
-
-
-
-
-
-
Supp
ort S
ervi
ces:
Tuiti
on-
-
-
-
-
-
-
-
-
-
St
uden
t & in
stru
ctio
n re
late
d se
rvic
es50
50
50
48
48
48
48
48
44
48
G
ener
al a
dmin
sitra
tive
serv
ices
5
5
5
5
5
5
5
5
5
5
Scho
ol a
dmin
istra
tive
serv
ices
18
18
18
18
18
18
17
17
17
16
Bus
ines
s adm
insi
trativ
e se
rvic
es5
5
5
5
5
5
5
5
5
5
Pl
ant o
pera
tions
and
mai
nten
ance
37
37
37
37
37
37
37
37
37
37
Pupi
l tra
nspo
rtatio
n5
5
5
5
5
5
5
5
5
5
Sp
ecia
l Sch
ools
-
-
-
-
-
-
-
-
-
-
Food
Ser
vice
Chi
ld C
are
Tota
l41
3
41
7
41
6
415
408
400
397
40
1
398
40
1
Sour
ce: D
istri
ct P
erso
nnel
Rec
ords
Ram
sey
Boa
rd o
f Edu
catio
nFu
ll-tim
e E
quiv
alen
t Dis
tric
t Em
ploy
ees b
y Fu
nctio
n/Pr
ogra
m,
Las
t Ten
Fis
cal Y
ears
-122-
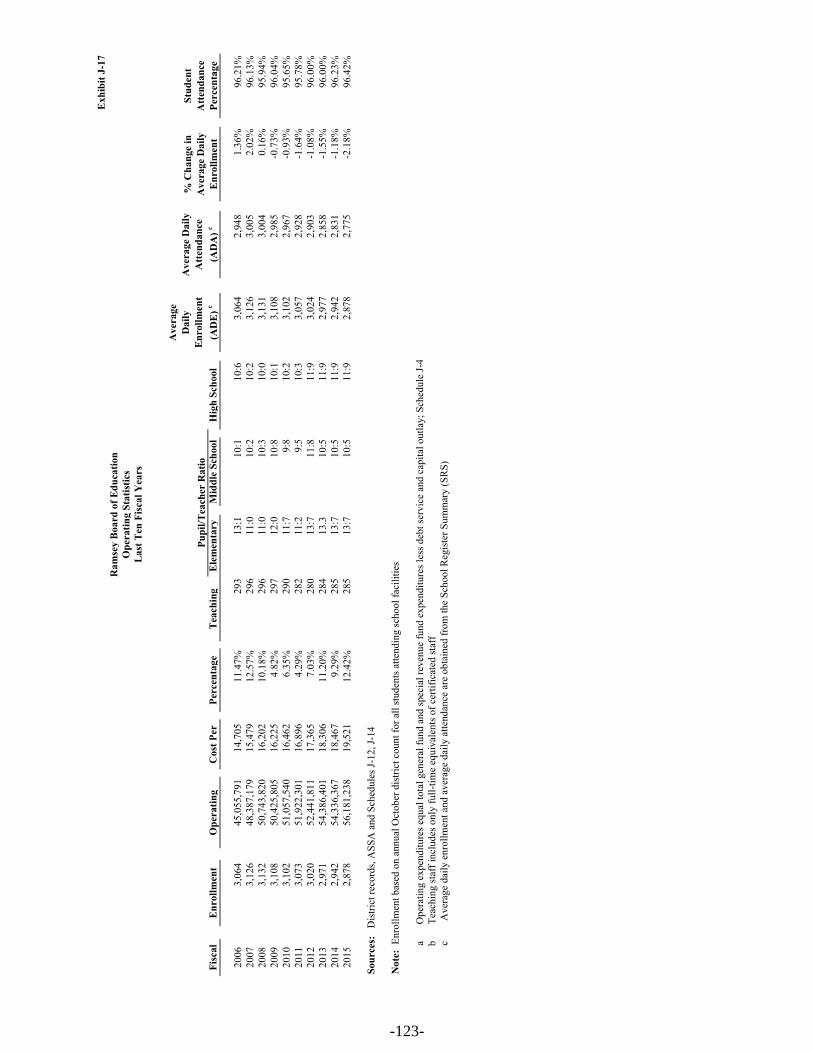
Exh
ibit
J-17
Fisc
al
Enr
ollm
ent
Ope
ratin
g C
ost P
er
Perc
enta
ge
Tea
chin
g E
lem
enta
ryM
iddl
e Sc
hool
Hig
h Sc
hool
2006
3,0
64
45,0
55,7
91
14,
705
11.4
7%29
313
:110
:110
:6
3,0
64
2,9
48
1.36
%96
.21%
2007
3,1
26
48,3
87,1
79
15,
479
12.5
7%29
611
:010
:210
:2
3,1
26
3,0
05
2.02
%96
.13%
2008
3,1
32
50,7
43,8
20
16,
202
10.1
8%29
611
:010
:310
:0
3,1
31
3,0
04
0.16
%95
.94%
2009
3,1
08
50,4
25,8
05
16,
225
4.82
%29
712
:010
:810
:1
3,1
08
2,9
85
-0.7
3%96
.04%
2010
3,1
02
51,0
57,5
40
16,
462
6.35
%29
011
:79:
810
:2
3,1
02
2,9
67
-0.9
3%95
.65%
2011
3,0
73
51,9
22,3
01
16,
896
4.29
%28
211
:29:
510
:3
3,0
57
2,9
28
-1.6
4%95
.78%
2012
3,0
20
52,4
41,8
11
17,
365
7.03
%28
013
:711
:811
:9
3,0
24
2,9
03
-1.0
8%96
.00%
2013
2,9
71
54,3
86,4
01
18,
306
11.2
0%28
413
.310
:511
:9
2,9
77
2,8
58
-1.5
5%96
.00%
2014
2,9
42
54,3
36,3
67
18,
467
9.29
%28
513
:710
:511
:9
2,9
42
2,8
31
-1.1
8%96
.23%
2015
2,8
78
56,1
81,2
38
19,
521
12.4
2%28
513
:710
:511
:9
2,8
78
2,7
75
-2.1
8%96
.42%
Sour
ces:
D
istri
ct re
cord
s, A
SSA
and
Sch
edul
es J-
12, J
-14
Not
e: E
nrol
lmen
t bas
ed o
n an
nual
Oct
ober
dis
trict
cou
nt fo
r all
stud
ents
atte
ndin
g sc
hool
faci
litie
s.
aO
pera
ting
expe
nditu
res e
qual
tota
l gen
eral
fund
and
spec
ial r
even
ue fu
nd e
xpen
ditu
res l
ess d
ebt s
ervi
ce a
nd c
apita
l out
lay;
Sch
edul
e J-
4b
Teac
hing
staf
f inc
lude
s onl
y fu
ll-tim
e eq
uiva
lent
s of c
ertif
icat
ed st
aff
cA
vera
ge d
aily
enr
ollm
ent a
nd a
vera
ge d
aily
atte
ndan
ce a
re o
btai
ned
from
the
Scho
ol R
egis
ter S
umm
ary
(SR
S)
Ram
sey
Boa
rd o
f Edu
catio
nO
pera
ting
Stat
istic
sL
ast T
en F
isca
l Yea
rs
Ave
rage
D
aily
E
nrol
lmen
t (A
DE
) c
Ave
rage
Dai
ly
Att
enda
nce
(AD
A) c
% C
hang
e in
A
vera
ge D
aily
E
nrol
lmen
t
Stud
ent
Att
enda
nce
Perc
enta
gePu
pil/T
each
er R
atio
-123-
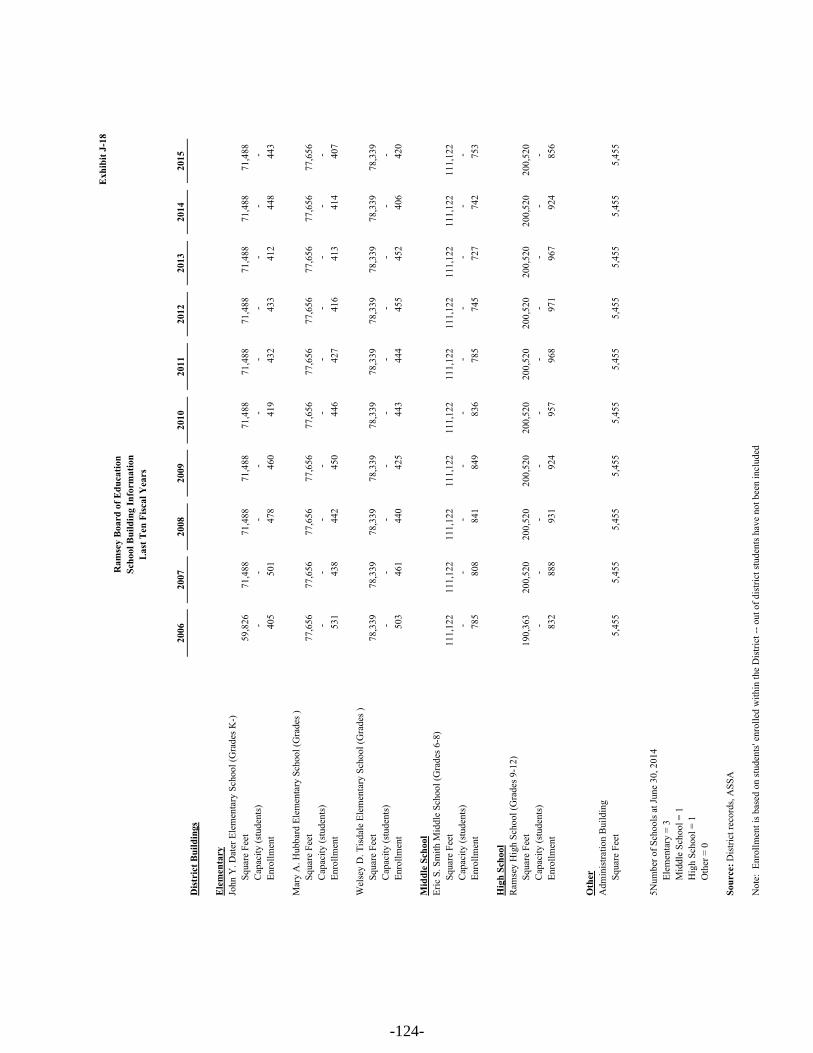
2006
2007
2008
2009
2010
2011
2012
2013
2014
2015
Dis
tric
t Bui
ldin
gs
Ele
men
tary
John
Y. D
ater
Ele
men
tary
Sch
ool (
Gra
des K
-)Sq
uare
Fee
t59
,826
71,4
88
71
,488
71,4
88
71
,488
71,4
88
71
,488
71,4
88
71
,488
71,4
88
C
apac
ity (s
tude
nts)
-
-
-
-
-
-
-
-
-
-
Enro
llmen
t40
5
50
1
47
8
46
0
41
9
43
2
43
3
412
44
8
443
Mar
y A
. Hub
bard
Ele
men
tary
Sch
ool (
Gra
des )
Squa
re F
eet
77,6
56
77
,656
77,6
56
77
,656
77,6
56
77
,656
77,6
56
77
,656
77,6
56
77
,656
Cap
acity
(stu
dent
s)-
-
-
-
-
-
-
-
-
-
En
rollm
ent
531
438
442
450
446
427
416
41
3
414
40
7
Wel
sey
D. T
isda
le E
lem
enta
ry S
choo
l (G
rade
s )Sq
uare
Fee
t78
,339
78,3
39
78
,339
78,3
39
78
,339
78,3
39
78
,339
78,3
39
78
,339
78,3
39
C
apac
ity (s
tude
nts)
-
-
-
-
-
-
-
-
-
-
Enro
llmen
t 50
3
46
1
44
0
42
5
44
3
44
4
45
5
452
40
6
420
Mid
dle
Scho
olEr
ic S
. Sm
ith M
iddl
e Sc
hool
(Gra
des 6
-8)
Squa
re F
eet
111,
122
11
1,12
2
111,
122
11
1,12
2
111,
122
11
1,12
2
111,
122
11
1,12
2
111,
122
11
1,12
2
Cap
acity
(stu
dent
s)-
-
-
-
-
-
-
-
-
-
En
rollm
ent
785
808
841
849
836
785
745
72
7
742
75
3
Hig
h Sc
hool
Ram
sey
Hig
h Sc
hool
(Gra
des 9
-12)
Squa
re F
eet
190,
363
20
0,52
0
200,
520
20
0,52
0
200,
520
20
0,52
0
200,
520
20
0,52
0
200,
520
20
0,52
0
Cap
acity
(stu
dent
s)-
-
-
-
-
-
-
-
-
-
En
rollm
ent
832
888
931
924
957
968
971
96
7
924
85
6
Oth
erA
dmin
istra
tion
Bui
ldin
gSq
uare
Fee
t5,
455
5,
455
5,
455
5,
455
5,
455
5,
455
5,
455
5,45
5
5,
455
5,45
5
5Num
ber o
f Sch
ools
at J
une
30, 2
014
Elem
enta
ry =
3M
iddl
e Sc
hool
= 1
Hig
h Sc
hool
= 1
Oth
er =
0
Sour
ce: D
istri
ct re
cord
s, A
SSA
Not
e: E
nrol
lmen
t is b
ased
on
stud
ents
' enr
olle
d w
ithin
the
Dis
trict
-- o
ut o
f dis
trict
stud
ents
hav
e no
t bee
n in
clud
ed
Exh
ibit
J-18
Ram
sey
Boa
rd o
f Edu
catio
nSc
hool
Bui
ldin
g In
form
atio
nL
ast T
en F
isca
l Yea
rs
-124-

Exh
ibit
J-19
Ram
sey
Boa
rd o
f Edu
catio
nG
ener
al F
und
Sche
dule
of R
equi
red
Man
tena
nce
for
Scho
ol F
acili
ties
Las
t Ten
Fis
cal Y
ears
Una
udite
d
Scho
ol F
acili
ties
Proj
ect #
(s)
2015
2014
2013
2012
2011
2010
2009
2008
2007
2006
Ram
sey
Hig
h Sc
hool
N/A
236,
870
186,
110
210,
818
214,
032
197,
365
140,
332
17
3,60
1
24
5,78
6
17
4,76
0
10
8,64
1
Er
ic S
. Sm
ith M
iddl
e Sc
hool
N/A
77,5
24
111,
489
70,8
26
108,
028
87,7
11
93,3
51
99
,386
128,
573
114,
570
98,7
00
John
Y. D
ater
Ele
men
tary
Sch
ool
N/A
96,8
50
127,
547
105,
316
100,
404
117,
377
84,5
49
91
,307
112,
158
182,
282
87,2
10
Mar
y A
. Hub
bard
Ele
men
tary
Sch
ool
N/A
114,
177
109,
326
107,
105
111,
799
87,9
09
96,8
56
14
4,71
9
88
,861
113,
703
74,2
34
Wel
sey
D. T
isda
le E
lem
enta
ry S
choo
lN
/A65
,084
13
6,27
5
12
6,26
3
92
,930
10
0,58
6
95
,568
96,4
31
10
6,70
6
10
6,79
2
70
,089
Gra
nd T
otal
590,
505
$
670,
748
$
620,
328
$
627,
193
$
590,
948
$
510,
656
$
60
5,44
4$
68
2,08
4$
69
2,10
7$
43
8,87
4$
UN
DIS
TRIB
UTE
D E
XPE
ND
ITU
RES
- R
EQU
IRED
MA
INTE
NA
NC
E FO
R S
CH
OO
L FA
CIL
ITIE
S11
-000
-261
-XX
X
-125-

Exhibit J-20Ramsey Board of Education
Insurance ScheduleFor the Fiscal Year Ended June 30, 2015
Unaudited
Company Type of Coverage Coverage Deductible
School Alliance Insurance Fund Property Blanket Building & Contents- 7,700,000,000 2,500 Replacement Cost Values
General Liability 5,000,000 Comprehensive Automobile Liability 5,000,000 Employee Benefit Liability 5,000,000 1,000 Umbrella Liability 5,000,000 First Layer Catastrophe Electronic Data Processing Equipment Included in Blanket Limit
Boiler & Machinery - Umbrella policy Included in Blanket Limit School Board Legal Liability -Directors and Officers Policy 5,000,000 15,000
Student Accident Liability Public Employees' Faithful Performance BlanketPosition Bond - Board SecretaryPosition Bond - Assistant Board SecretaryBlanket Dishonesty Bond 500,000 1,000
Source: District Records
-126-

SINGLE AUDIT SECTION

Ferraioli, Wielkotz, Cerullo & Cuva, P.A.
Charles J. Ferraioli, Jr., MBA, CPA, RMA Certified Public Accountants Newton Office Steven D. Wielkotz, CPA, RMA 401 Wanaque Avenue 100B Main Street James J. Cerullo, CPA, RMA Pompton Lakes, New Jersey 07442 Newton, NJ 07860Paul J. Cuva, CPA, RMA 973-835-7900 973-579-3212Thomas M. Ferry, CPA, RMA Fax 973-835-6631 Fax 973-579-7128
K-1
Page 1 of 2
INDEPENDENT AUDITOR’S REPORT ON INTERNAL CONTROL OVER
FINANCIAL REPORTING AND ON COMPLIANCE AND OTHER MATTERS
BASED ON AN AUDIT OF FINANCIAL STATEMENTS PERFORMED IN
ACCORDANCE WITH GOVERNMENT AUDITING STANDARDS
Honorable President and
Members of the Board of Education
Borough of Ramsey School District
County of Bergen, New Jersey
We have audited, in accordance with auditing standards generally accepted in the United States of
America; audit requirements as prescribed by the Office of School Finance, Department of Education,
State of New Jersey; and the standards applicable to financial audits contained in Government Auditing
Standards, issued by the Comptroller General of the United States, the financial statements of the
governmental activities, the business-type activities and each major fund and the aggregate remaining
fund information of the Board of Education of the Borough of Ramsey School District, in the County of
Bergen, New Jersey, as of and for the year ended June 30, 2015, and the related notes to the financial
statements, which collectively comprise the District’s basic financial statements, and have issued our
report thereon dated October 14, 2015.
Internal Control Over Financial Reporting
In planning and performing our audit on the financial statements, we considered the Borough of Ramsey
Board of Education’s internal control over financial reporting (internal control) to determine the audit
procedures that are appropriate in the circumstances for the purpose of expressing our opinions on the
financial statements, but not for the purpose of expressing an opinion on the effectiveness of the
Borough of Ramsey Board of Education’s internal control. Accordingly, we do not express an opinion
on the effectiveness of the Borough of Ramsey Board of Education’s internal control.
A deficiency in internal control exists when the design or operation of a control does not allow
management or employees, in the normal course of performing their assigned functions, to prevent, or
detect and correct, misstatements on a timely basis. A material weakness is a deficiency, or a
combination of deficiencies, in internal control, such that there is a reasonable possibility that a material
misstatement of the entity’s financial statements will not be prevented, or detected and corrected on a
timely basis. A significant deficiency is a deficiency, or a combination of deficiencies, in internal
control that is less severe than a material weakness, yet important enough to merit attention by those
charged with governance.
-127-
Honorable President and K-1
Members of the Board of Education Page 2 of 2
Our consideration of internal control was for the limited purpose described in the first paragraph of this
section and was not designed to identify all deficiencies in internal control that might be material
weaknesses or significant deficiencies. Given these limitations, during our audit we did not identify any
deficiencies in internal control that we consider to be material weaknesses. However, material
weaknesses may exist that have not been identified.
Compliance and Other Matters
As part of obtaining reasonable assurance about whether the Borough of Ramsey Board of Education’s
financial statements are free of material misstatement, we performed tests of its compliance with certain
provisions of laws, regulations, contracts and grant agreements, noncompliance with which could have a
direct and material effect on the determination of financial statement amounts. However, providing an
opinion on compliance with those provisions was not an objective of our audit and, accordingly, we do
not express such an opinion. The results of our tests disclosed no instances of noncompliance or other
matters that are required to be reported under Government Auditing Standards or the audit requirements
as prescribed by the Office of School Finance, Department of Education, State of New Jersey.
We noted certain matters that were required to be reported to the Board of Education of the Borough of
Ramsey School District in the separate Auditors’ Management Report on Administrative Findings -
Financial, Compliance and Performance dated October 14, 2015.
Purpose of this Report
The purpose of this report is solely to describe the scope of our testing of internal control and
compliance and the results of that testing, and not to provide an opinion on the effectiveness of the
entity’s internal control or on compliance. This report is an integral part of an audit performed in
accordance with Government Auditing Standards in considering the entity’s internal control and
compliance. Accordingly, this communication is not suitable for any other purpose.
Steven D. WielkotzSteven D. WielkotzSteven D. WielkotzSteven D. Wielkotz
Steven D. Wielkotz, C.P.A.
Licensed Public School Accountant
No. 816
Ferraioli, Wielkotz, Cerullo & Cuva, P.A.Ferraioli, Wielkotz, Cerullo & Cuva, P.A.Ferraioli, Wielkotz, Cerullo & Cuva, P.A.Ferraioli, Wielkotz, Cerullo & Cuva, P.A.
FERRAIOLI, WIELKOTZ, CERULLO & CUVA, P.A.
Certified Public Accountants
Pompton Lakes, New Jersey
October 14, 2015
-128-
Ferraioli, Wielkotz, Cerullo & Cuva, P.A.
Charles J. Ferraioli, Jr., MBA, CPA, RMA Certified Public Accountants Newton Office Steven D. Wielkotz, CPA, RMA 401 Wanaque Avenue 100B Main Street James J. Cerullo, CPA, RMA Pompton Lakes, New Jersey 07442 Newton, NJ 07860Paul J. Cuva, CPA, RMA 973-835-7900 973-579-3212Thomas M. Ferry, CPA, RMA Fax 973-835-6631 Fax 973-579-7128
K-2
Page 1 of 3
INDEPENDENT AUDITOR’S REPORT ON COMPLIANCE WITH REQUIREMENTS
APPLICABLE TO EACH MAJOR PROGRAM AND INTERNAL
CONTROL OVER COMPLIANCE IN ACCORDANCE WITH
OMB CIRCULAR A-133 AND N.J. OMB CIRCULAR 04-04
Honorable President and
Members of the Board of Education
Borough of Ramsey School District
County of Bergen, New Jersey
Report on Compliance for Each Major Federal and State Program
We have audited the Board of Education of the Borough of Ramsey School District in the County of
Bergen, New Jersey, compliance with the types of compliance requirements described in the OMB
Circular A-133 Compliance Supplements and the New Jersey State Aid/Grant Compliance Supplement
that could have a direct and material effect on each of the Borough of Ramsey Board of Education’s
major federal and state programs for the year ended June 30, 2015. The Borough of Ramsey Board of
Education’s major federal and state programs are identified in the summary of auditor’s results section
of the accompanying schedule of findings and questioned costs.
Management’s Responsibility
Management is responsible for compliance with the requirements of laws, regulations, contracts, and
grants applicable to its federal and state programs.
Auditor’s Responsibility
Our responsibility is to express an opinion on compliance for each of the Borough of Ramsey Board of
Education’s major federal and state programs based on our audit of the types of compliance
requirements referred to above. We conducted our audit of compliance in accordance with auditing
standards generally accepted in the United States of America; the standards applicable to financial
audits contained in Government Auditing Standards, issued by the Comptroller General of the United
States; and OMB Circular A-133, Audits of States, Local Governments, and Non-Profit Organizations
and Single Audit Policy for Recipients of Federal Grants, State Grants and State Aid. Those standards,
OMB Circular A-133 and N.J. OMB Circular 04-04 require that we plan and perform the audit to obtain
-129-

Honorable President and K-2
Members of the Board of Education Page 2 of 3
reasonable assurance about whether noncompliance with the types of compliance requirements referred
to above that could have a direct and material effect on a major federal and state program occurred. An
audit includes examining, on a test basis, evidence about the Borough of Ramsey Board of Education’s
compliance with those requirements and performing such other procedures as we considered necessary
in the circumstances.
We believe that our audit provides a reasonable basis for our opinion on compliance for each major
federal and state program. However, our audit does not provide a legal determination of the Borough of
Ramsey Board of Education’s compliance.
Opinion on Each Major Federal and State Program
In our opinion, the Borough of Ramsey Board of Education complied, in all material respects, with the
types of compliance requirements referred to above that could have a direct and material effect on each
of its major federal and state programs for the year ended June 30, 2015.
Report on Internal Control Over Compliance
Management of the Borough of Ramsey Board of Education is responsible for establishing and
maintaining effective internal control over compliance with the types of compliance requirements
referred to above. In planning and performing our audit of compliance, we considered the Borough of
Ramsey Board of Education’s internal control over compliance with the type of requirements that could
have a direct and material effect on each major federal and state program to determine the auditing
procedures that are appropriate in the circumstances for the purpose of expressing an opinion on
compliance for each major federal and state program and to test and report on internal control over
compliance in accordance with OMB Circular A-133 and N.J. OMB Circular 04-04, but not for the
purpose of expressing an opinion on the effectiveness of internal control over compliance. Accordingly,
we do not express an opinion on the effectiveness of Borough of Ramsey Board of Education’s internal
control over compliance.
A deficiency in internal control over compliance exists when the design or operation of a control over
compliance does not allow management or employees, in the normal course of performing their
assigned functions, to prevent, or detect and correct, noncompliance with a type of compliance
requirement of a federal and state program on a timely basis. A material weakness in internal control
over compliance is a deficiency, or combination of deficiencies, in internal control over compliance,
such that there is a reasonable possibility that material noncompliance with a type of compliance
requirement of a federal and state program will not be prevented, or detected and corrected, on a timely
basis. A significant deficiency in internal control over compliance is a deficiency, or a combination of
deficiencies, in internal control over compliance with a type of compliance requirement of a federal and
state program that is less severe than a material weakness in internal control over compliance, yet
important enough to merit attention by those charged with governance.
-130-
Honorable President and K-2
Members of the Board of Education Page 3 of 3
Our consideration of internal control over compliance was for the limited purpose described in the first
paragraph of this section and was not designed to identify all deficiencies in internal control over
compliance that might be material weaknesses or significant deficiencies. We did not identify any
deficiencies in internal control over compliance that we consider to be material weaknesses. However,
material weaknesses may exist that have not been identified.
The purpose of this report on internal control over compliance is solely to describe the scope of our
testing of internal control over compliance and the results of that testing based on the requirements of
OMB Circular A-133 and N.J. OMB Circular 04-04. Accordingly, this report is not suitable for any
other purpose.
Report on Schedule of Expenditures of Federal and State Awards Required by OMB Circular A-
133
We have audited the financial statements of the Borough of Ramsey Board of Education as of and for
the year ended June 30, 2015, and have issued our report there dated October 14, 2015 which contained
an unmodified opinion on those financial statements. Our audit was conducted for the purpose of
forming an opinion on the financial statements as a whole. The accompanying schedule of expenditures
of federal and state awards is presented for purposes of additional analysis as required by OMB Circular
A-133 and N.J. OMB Circular 04-04 and is not a required part of the financial statements. Such
information is the responsibility of management and was derived from and relates directly to the
underlying accounting and other records used to prepare the financial statements. The information has
been subjected to the auditing procedures applied in the audit of the financial statements and certain
additional procedures, including comparing and reconciling such information directly to the underlying
accounting and other records used to prepare the financial statements or to the financial statements
themselves, and other additional procedures in accordance with auditing standards generally accepted in
the United States of America. In our opinion, the schedule of expenditure of federal and state awards is
fairly stated in all material respects in relation to the financial statements as a whole.
Steven D. WielkotzSteven D. WielkotzSteven D. WielkotzSteven D. Wielkotz
Steven D. Wielkotz, C.P.A.
Licensed Public School Accountant
No. 816
Ferraioli, Wielkotz, Cerullo & Cuva, P.A.Ferraioli, Wielkotz, Cerullo & Cuva, P.A.Ferraioli, Wielkotz, Cerullo & Cuva, P.A.Ferraioli, Wielkotz, Cerullo & Cuva, P.A.
FERRAIOLI, WIELKOTZ, CERULLO & CUVA, P.A.
Certified Public Accountants
Pompton Lakes, New Jersey
October 14, 2015
-131-

K-3
1 of
3
MEM
OFe
dera
lG
rant
or S
tate
Bal
ance
at
Car
ryov
er/
Rep
aym
ent
Cum
ulat
ive
CFD
APr
ojec
tA
war
dJu
ne 3
0,(W
alko
ver)
Cas
hB
udge
tary
of P
rior Y
ears
'(A
ccou
nts
Def
erre
dD
ue to
To
tal
Num
ber
Num
ber
Am
ount
From
To20
14A
mou
ntR
ecei
ved
Expe
nditu
res
Bal
ance
sR
ecei
vabl
e)R
even
ueG
rant
or a
tEx
pend
iture
s
Gen
eral
Fun
d:A
RR
A -
Spec
ial E
duca
tion
Med
icai
d In
itiat
ive
93.7
783,
108
7/1/
2014
6/30
/201
53,
108
3,
108
*3,
108
Sp
ecia
l Edu
catio
n M
edic
aid
Initi
ativ
e93
.778
17,0
46
7/1/
2013
6/30
/201
4(1
7,04
6)
17,0
46*
17,0
46*
Tot
al G
ener
al F
und
(17,
046)
20,1
543,
108
*20
,154
*U
S D
epar
tmen
t of E
duca
tion
*Pa
ssed
Thr
ough
Sta
te D
ept o
f Edu
catio
n:*
Spec
ial R
even
ue F
und
*Ti
tle I,
Par
t A84
.010
NC
LB43
1015
42,6
40
7/1/
2014
6/30
/201
5(5
,669
)36
,434
42,6
40(1
1,87
5)*
42,6
40
Title
I, P
art A
84.0
10N
CLB
4310
1445
,005
7/
1/20
136/
30/2
014
(5,6
69)
5,66
9*
45,0
05
(5,6
69)
36,4
3442
,640
(11,
875)
*87
,645
*Ti
tle II
, Par
t A, T
each
er/P
rinci
pal
*Tr
aini
ng a
nd R
ecru
iting
84.3
67N
CLB
4310
1556
,405
7/
1/20
146/
30/2
015
(7,7
76)
51,3
4756
,405
(12,
834)
*56
,405
Title
II, P
art A
, Tea
cher
/Prin
cipa
l*
Trai
ning
and
Rec
ruiti
ng84
.367
NC
LB43
1014
55,7
63
7/1/
2013
6/30
/201
4(7
,776
)7,
776
*55
,763
(7,7
76)
51,3
4756
,405
(12,
834)
*11
2,16
8*
IDEA
, Par
t B-B
asic
84.0
27ID
EA43
1015
727,
403
7/1/
2014
6/30
/201
5(5
7,75
4)59
5,90
772
7,40
3(1
89,2
50)
*72
7,40
3ID
EA, P
art B
-Bas
ic84
.027
IDEA
4310
1468
0,91
9
7/
1/20
136/
30/2
014
(57,
754)
57,7
54*
680,
919
IDEA
, Par
t B-P
resc
hool
84.1
73ID
EA43
1015
30,5
00
7/1/
2014
6/30
/201
5(2
,644
)2,
644
30,5
00(3
0,50
0)*
30,5
00ID
EA, P
art B
-Pre
scho
ol84
.173
IDEA
4310
1430
,402
7/
1/20
136/
30/2
014
(2,6
44)
2,64
4*
30,4
02(6
0,39
8)59
8,55
175
7,90
3(2
19,7
50)
*1,
469,
224
*T
otal
Spe
cial
Rev
enue
Fun
d(7
3,84
3)68
6,33
285
6,94
8(2
44,4
59)
*1,
669,
037
*U
S D
epar
tmen
t of A
gric
ultu
re*
Pass
ed T
hrou
gh S
tate
Dep
t of E
duca
tion:
*E
nter
pris
e Fu
nd*
Food
Dis
tribu
tion
Prog
ram
10.5
50N
/A34
,966
7/
1/20
146/
30/2
015
34,9
6634
,966
*34
,966
Nat
iona
l Sch
ool L
unch
Pro
gram
10.5
55N
/A61
,352
7/
1/20
146/
30/2
015
55,6
1761
,352
(5,7
35)
*61
,352
Nat
iona
l Sch
ool L
unch
Pro
gram
10.5
55N
/A67
,942
7/
1/20
136/
30/2
014
(12,
946)
12,9
46*
67,9
42
*T
otal
Ent
erpr
ise
Fund
(12,
946)
103,
529
96,3
18(5
,735
)*
164,
260
*T
otal
Fed
eral
Fin
anci
al A
ssis
tanc
e$
(103
,835
)81
0,01
595
6,37
4(2
50,1
94)
*1,
853,
451
Bal
ance
at J
une
30, 2
015
P
roga
m T
itle
Fede
ral G
rant
or/P
ass-
thro
ugh
Gra
ntor
/
BO
RO
UG
H O
F R
AM
SEY
SC
HO
OL
DIS
TR
ICT
Sche
dule
of E
xpen
ditu
res o
f Fed
eral
Aw
ards
For
the
Fisc
al Y
ear
ende
d Ju
ne 3
0, 2
015
Gra
nt P
erio
d
-132-

K-4
2 of
3
Bal
ance
at J
une
30, 2
014
Bal
ance
at J
une
30, 2
015
Def
erre
dD
efer
red
Car
ryov
er/
Rep
aym
ent
Rev
enue
/C
umul
ativ
eG
rant
or S
tate
Aw
ard
Rev
enue
Due
to
(Wal
kove
r)C
ash
Bud
geta
ryof
Prio
r Yea
rs'
(Acc
ount
sIn
terf
und
Due
to
Bud
geta
ryTo
tal
Proj
ect N
umbe
rA
mou
ntFr
om
To(A
ccts
Rec
eiva
ble)
Gra
ntor
Am
ount
Rec
eive
dEx
pend
iture
sB
alan
ces
Rec
eiva
ble)
Paya
ble
Gra
ntor
at
Rec
eiva
ble
Expe
nditu
res
Stat
e D
epar
tmen
t of E
duca
tion:
Gen
eral
Fun
dTr
ansp
orta
tion
Aid
15-4
95-0
34-5
120-
014
$73
,635
7/1/
2014
6/30
/201
5$
67,7
3273
,635
*(5
,903
)73
,635
Spec
ial E
duca
tion
Cat
egor
ical
Aid
15-4
95-0
34-5
120-
089
1,12
4,73
87/
1/20
146/
30/2
015
1,03
5,25
61,
124,
738
*(8
9,48
2)1,
124,
738
Secu
rity
Aid
15-4
95-0
34-5
120-
084
42,2
037/
1/20
146/
30/2
015
38,8
2042
,203
*(3
,383
)42
,203
PAR
CC
Rea
dine
ss A
id15
-495
-034
-512
0-09
826
,720
7/1/
2014
6/30
/201
524
,578
26,7
20*
(2,1
42)
26,7
20Pe
r Pup
il G
row
th A
id15
-495
-034
-512
0-09
726
,720
7/1/
2014
6/30
/201
524
,578
26,7
20*
(2,1
42)
26,7
20Ex
traor
dina
ry A
id15
-100
-034
-512
0-47
333
9,43
37/
1/20
146/
30/2
015
339,
433
(339
,433
)*
339,
433
Extra
ordi
nary
Aid
14-1
00-0
34-5
120-
473
695,
825
7/1/
2013
6/30
/201
4(6
95,8
25)
695,
825
*69
5,82
5N
on P
ublic
Tra
nspo
rtatio
n15
-495
-078
-606
0-03
47,
858
7/1/
2014
6/30
/201
57,
858
(7,8
58)
*7,
858
Non
Pub
lic T
rans
porta
tion
14-4
95-0
78-6
060-
034
8,45
57/
1/20
136/
30/2
014
(8,4
55)
8,45
5*
8,45
5N
TE H
omel
ess R
eim
burs
emen
t07
-100
-029
-606
0-03
45,
460
7/1/
2006
6/30
/200
7(7
71)
(771
)*
5,46
0R
eim
burs
ed T
PAF
Soci
al S
ecur
ity15
-495
-034
-509
4-00
31,
796,
079
7/1/
2014
6/30
/201
51,
706,
877
1,79
6,07
9(8
9,20
2)*
1,79
6,07
9*
Tot
al G
ener
al F
und
(705
,051
)3,
602,
121
3,43
7,38
6(4
37,2
64)
*(1
03,0
52)
5,90
2,53
5*
Spec
ial R
even
ue F
und
*D
ista
nce
Lear
ning
Net
wor
k A
idN
/A2,
772
7/1/
2007
6/30
/200
82,
772
2,77
2*
NJ
Non
Publ
ic A
id:
*Te
xtbo
ok A
id15
-100
-034
-512
0-06
445
,877
7/1/
2014
6/30
/201
545
,877
43,5
242,
353
*43
,524
Text
book
Aid
14-1
00-0
34-5
120-
064
42,5
637/
1/20
136/
30/2
014
1,00
21,
002
*41
,561
Tech
nolo
gy A
id15
-100
-034
-512
0-37
324
,640
7/1/
2014
6/30
/201
524
,640
24,5
0113
9*
24,5
01Te
chno
logy
Aid
14-1
00-0
34-5
120-
373
15,7
407/
1/20
136/
30/2
014
3636
*15
,704
Nur
sing
Ser
vice
s15
-100
-034
-512
0-07
010
5,75
87/
1/20
146/
30/2
015
105,
758
105,
758
*10
5,75
8 H
andi
capp
ed S
ervi
ces:
*Ex
am &
Cla
ssifi
catio
n15
-100
-034
-512
0-06
693
,840
7/1/
2014
6/30
/201
593
,840
69,3
5824
,482
*69
,358
Exam
& C
lass
ifica
tion
14-1
00-0
34-5
120-
066
79,6
327/
1/20
136/
30/2
014
1,43
31,
433
*78
,199
Cor
rect
ive
Spee
ch15
-100
-034
-512
0-06
627
,300
7/1/
2014
6/30
/201
527
,300
22,8
834,
417
*22
,883
Cor
rect
ive
Spee
ch14
-100
-034
-512
0-06
616
,562
7/1/
2013
6/30
/201
42,
578
2,57
8*
13,9
84Su
pple
men
tary
Inst
.15
-100
-034
-512
0-06
637
,666
7/1/
2014
6/30
/201
537
,666
22,9
9114
,675
*22
,992
Supp
lem
enta
ry In
st.
14-1
00-0
34-5
120-
066
28,2
397/
1/20
136/
30/2
014
7,00
87,
008
*21
,231
A
uxill
iary
Ser
vice
s:*
Com
pens
ator
y Ed
ucat
ion
15-1
00-0
34-5
120-
067
55,5
407/
1/20
146/
30/2
015
55,5
4037
,713
17,8
27*
37,7
13C
ompe
nsat
ory
Educ
atio
n14
-100
-034
-512
0-06
752
,215
7/1/
2013
6/30
/201
47,
618
7,61
8*
44,5
97En
glis
h as
a S
econ
d La
ngua
ge15
-100
-034
-512
0-06
71,
827
7/1/
2014
6/30
/201
51,
827
1,82
7*
Engl
ish
as a
Sec
ond
Lang
uage
14-1
00-0
34-5
120-
067
3,49
27/
1/20
136/
30/2
014
2,61
92,
619
*87
3Tr
ansp
orta
tion
14-1
00-0
34-5
120-
068
10,7
507/
1/20
136/
30/2
014
10,7
5010
,750
* * *T
otal
Spe
cial
Rev
enue
Fun
d2,
772
33,0
4439
2,44
832
6,72
833
,044
2,77
265
,720
*54
2,87
8
Mem
o
Stat
e G
rant
or/P
rogr
am T
itles
BO
RO
UG
H O
F R
AM
SEY
SC
HO
OL
DIS
TR
ICT
Sche
dule
of E
xpen
ditu
res o
f Sta
te a
nd L
ocal
Fin
anci
al A
war
ds
Yea
r en
ded
June
30,
201
5
Gra
nt P
erio
d
-133-

K-4
3 of
3
Bal
ance
at J
une
30, 2
014
Bal
ance
at J
une
30, 2
015
Def
erre
dD
efer
red
Car
ryov
er/
Rep
aym
ent
Rev
enue
/C
umul
ativ
eG
rant
or S
tate
Aw
ard
Rev
enue
Due
to
(Wal
kove
r)C
ash
Bud
geta
ryof
Prio
r Yea
rs'
(Acc
ount
sIn
terf
und
Due
to
Bud
geta
ryTo
tal
Proj
ect N
umbe
rA
mou
ntFr
om
To(A
ccts
Rec
eiva
ble)
Gra
ntor
Am
ount
Rec
eive
dEx
pend
iture
sB
alan
ces
Rec
eiva
ble)
Paya
ble
Gra
ntor
at
Rec
eiva
ble
Expe
nditu
res
Mem
o
Stat
e G
rant
or/P
rogr
am T
itles
BO
RO
UG
H O
F R
AM
SEY
SC
HO
OL
DIS
TR
ICT
Sche
dule
of E
xpen
ditu
res o
f Sta
te a
nd L
ocal
Fin
anci
al A
war
ds
Yea
r en
ded
June
30,
201
5
Gra
nt P
erio
d
*C
apita
l Pro
ject
s Fun
d*
Stat
e Sc
hool
Bui
ldin
g A
id -
EDA
Gra
nt*
Hig
h Sc
hool
Bui
ldin
g R
enov
atio
n Pr
ojec
tSP
# 2
0236
120
4,43
6(4
0,88
7)(4
0,88
7)*
204,
436
Tisd
ale
Elem
enta
ry S
choo
l Bui
ldin
g A
dditi
ons
SP #
202
324
367,
522
(365
,684
)(3
65,6
84)
*36
5,68
4M
ary
A. H
ubba
rd E
lem
enta
ry S
choo
l Bui
ldin
g*
A
dditi
ons &
Ren
ovat
ions
4310
-070
-03-
1049
309,
491
(57,
588)
(57,
588)
*30
9,49
1Er
ic S
. Sm
ith M
iddl
e Sc
hool
Bui
ldin
g A
dditi
ons
*
& R
enov
atio
ns43
10-0
55-0
3-10
481,
194,
641
(1,0
69,2
04)
(1,0
69,2
04)
*1,
194,
641
Ram
sey
Hig
h Sc
hool
Bui
ldin
g A
dditi
ons &
*
Ren
ovat
ions
4310
-050
-03-
1051
552,
603
(496
,321
)(4
96,3
21)
*55
2,60
3Jo
hn Y
. Dat
er E
lem
enta
ry S
choo
l Add
ition
s,*
R
enov
atio
n &
Con
stru
ctio
n of
New
Sch
ool
4310
-060
-03-
1050
3,70
6,56
0(3
,317
,371
)(3
,317
,371
)*
3,70
6,56
0R
amse
y H
igh
Scho
ol B
uild
ing
Parti
al R
oof
*
Rep
lace
men
t41
90-0
50-0
5-10
00-N
E98
,116
(98,
116)
(98,
116)
*98
,116
Ram
sey
Hig
h Sc
hool
PEC
Spr
inkl
er S
yste
ms
4310
-050
-090
-100
1-G
0241
,384
(35,
600)
(35,
600)
*35
,600
Ram
sey
Hig
h Sc
hool
Par
tial R
oof R
epla
cem
ent
*
an
d H
VA
C U
pgra
des
4310
-050
-09-
1001
-G0P
B12
7,10
8(8
6,50
1)(8
6,50
1)*
86,5
01Ti
sdal
e El
emen
tary
Sch
ool W
indo
w R
epla
cem
ent
4310
-080
-14-
1004
46,4
8044
,022
(44,
022)
*44
,022
Eric
S. S
mith
Mid
dle
Scho
ol B
oile
r Rep
lace
men
t43
10-0
55-1
4-10
0334
4,60
022
8,16
7(2
28,1
67)
*22
8,16
7R
amse
y H
igh
Scho
ol H
VA
C R
epla
cem
ent i
n G
ym43
10-0
50-1
4-10
0129
0,09
529
0,09
5(2
90,0
95)
*29
0,09
5* *
Tot
al C
apita
l Pro
ject
s Fun
d(5
,567
,272
)56
2,28
4(6
,129
,556
)*
7,11
5,91
6*
Ent
erpr
ise
Fund
*St
ate
Dep
artm
ent o
f Agr
icul
ture
*N
atio
nal S
choo
l Lun
ch P
rogr
am (S
tate
Sha
re)
14-1
00-0
10-3
350-
023
3,26
27/
1/20
146/
30/2
015
2,95
73,
262
(305
)*
3,26
2N
atio
nal S
choo
l Lun
ch P
rogr
am (S
tate
Sha
re)
13-1
00-0
10-3
350-
023
4,12
47/
1/20
136/
30/2
014
(979
)97
9*
4,12
4*
Tot
al E
nter
pris
e Fu
nd(9
79)
3,93
63,
262
(305
)*
7,38
6*
Tot
al S
tate
Fin
anci
al A
ssis
tanc
e Su
bjec
t to
OM
B 0
4-04
(6,2
70,5
30)
33,0
443,
998,
505
4,32
9,66
033
,044
(6,5
67,1
25)
2,77
265
,720
*(1
03,0
52)
13,5
68,7
15*
On
Beh
alf T
PAF
Con
tribu
tions
Not
Sub
ject
to O
MB
04-
04*
On
Beh
alf T
PAF
- Pos
t Ret
irem
ent M
edic
al15
-495
-034
-509
4-00
12,
084,
557
7/1/
2014
6/30
/201
52,
084,
557
2,08
4,55
7*
2,08
4,55
7O
n B
ehal
f TPA
F Pe
nsio
n15
-495
-034
-509
4-00
61,
224,
974
7/1/
2014
6/30
/201
51,
224,
974
1,22
4,97
4*
1,22
4,97
4O
n B
ehal
f TPA
F N
CG
I Pre
miu
m15
-495
-034
-509
4-00
788
,131
7/1/
2014
6/30
/201
588
,131
88,1
31*
88,1
31*
Tot
al S
tate
Fin
anci
al A
ssis
tanc
e(6
,270
,530
)33
,044
7,39
6,16
77,
727,
322
33,0
44(6
,567
,125
)2,
772
65,7
20*
(103
,052
)16
,966
,377
See
acco
mpa
nyin
g no
tes t
o th
e Sc
hedu
les o
f Exp
endi
ture
s of F
eder
al a
nd S
tate
Aw
ards
.
-134-

Borough of Ramsey School District K-5Notes to the Schedules of Expenditures of Federal Awards and Page 1 of 2 State Financial Assistance June 30, 2015
NOTE 1. GENERAL
The accompanying Schedules of Expenditures of Federal Awards and State Financial Assistance includethe activity of all federal and state award programs of the Board of Education, Borough of Ramsey SchoolDistrict. The Board of Education is defined in Note 1 to the Board's basic financial statements. All federaland state awards received directly from federal and state agencies, as well as federal and state awards passedthrough other government agencies is included on the Schedule of Expenditures of Federal Awards and StateFinancial Assistance.
NOTE 2. BASIS OF ACCOUNTING
The accompanying Schedules of Expenditures of Federal and State Awards are presented on the budgetarybasis of accounting with the exception of programs recorded in the food service fund, which are presentedusing the accrual basis of accounting. These bases of accounting are described in Notes 2(C) and 2(D) tothe Board's basic financial statements. The information in these schedules is presented in accordance withthe requirements of OMB Circular A-133, “Audits of States, Local Governments, and Non-ProfitOrganizations.” Therefore, some amounts presented in this schedule may differ in amounts presented in orused in the preparation of the basic financial statements.
NOTE 3. RELATIONSHIP TO BASIC FINANCIAL STATEMENTS
The basic financial statements present the general fund and special revenue fund on a GAAP basis. Budgetary comparison statements or schedules (RSI) are presented for the general fund and special revenuefund to demonstrate finance-related legal compliance in which certain revenue is permitted by law or grantagreement to be recognized in the audit year, whereas for GAAP reporting, revenue is not recognized untilthe subsequent year or when expenditures have been made.
The general fund is presented in the accompanying schedules on the modified accrual basis with theexception of the revenue recognition of the last state aid payment in the current budget year, which ismandated pursuant to N.J.S.A. 18A:22-44.2. For GAAP purposes, that payment is not recognized until thesubsequent budget year due to the state deferral and recording of the last state aid payment in the subsequentyear. The special revenue fund is presented in the accompanying schedules on the grant accountingbudgetary basis which recognizes encumbrances as expenditures and also recognizes the related revenues,whereas the GAAP basis does not. The special revenue fund also recognizes the last state aid payment inthe current budget year, consistent with N.J.S.A. 18A:22-44.2.
-135-

Borough of Ramsey School District K-5Notes to the Schedules of Expenditures of Federal Awards and Page 2 of 2 State Financial AssistanceJune 30, 2015
NOTE 3. RELATIONSHIP TO BASIC FINANCIAL STATEMENTS, (continued)
The net adjustment to reconcile from the budgetary basis to the GAAP basis is $(15,832) for the general fundand $-0- for the special revenue fund. See the Notes to Required Supplementary Information for areconciliation of the budgetary basis to the modified accrual basis of accounting for the general and specialrevenue funds. Awards and financial assistance revenues are reported in the Board’s basic financialstatements on a GAAP basis as follows:
Federal State Total
General Fund $3,108 $6,819,216 $6,822,324
Special Revenue Fund 856,948 326,729 1,183,677
Food Service Fund 96,318 3,262 99,580
Capital Projects Fund 562,284 562,284
Total Financial Awards $956,374 $7,711,491 $8,667,865
NOTE 4. RELATIONSHIP TO FEDERAL AND STATE FINANCIAL REPORTS
Amounts reported in the accompanying schedules agree with the amounts reported in the related federal andstate financial reports.
NOTE 5. OTHER
Revenues and expenditures reported under the U.S.D.A. Food Distribution Program represent current yearvalue received and current year distributions respectively. The amount reported as TPAF Social SecurityContributions represents the amount reimbursed by the state for the employer's share of social securitycontributions for TPAF members for the year ended June 30, 2015.
NOTE 6. ON-BEHALF PROGRAMS NOT SUBJECT TO STATE SINGLE AUDIT
On-behalf State Programs for TPAF Pension and Post-Retirement Medical Benefits Contributions are notsubject to a State single audit and, therefore, the amount of $3,485,793 of on-behalf payments is excludedfrom major program determination.
-136-
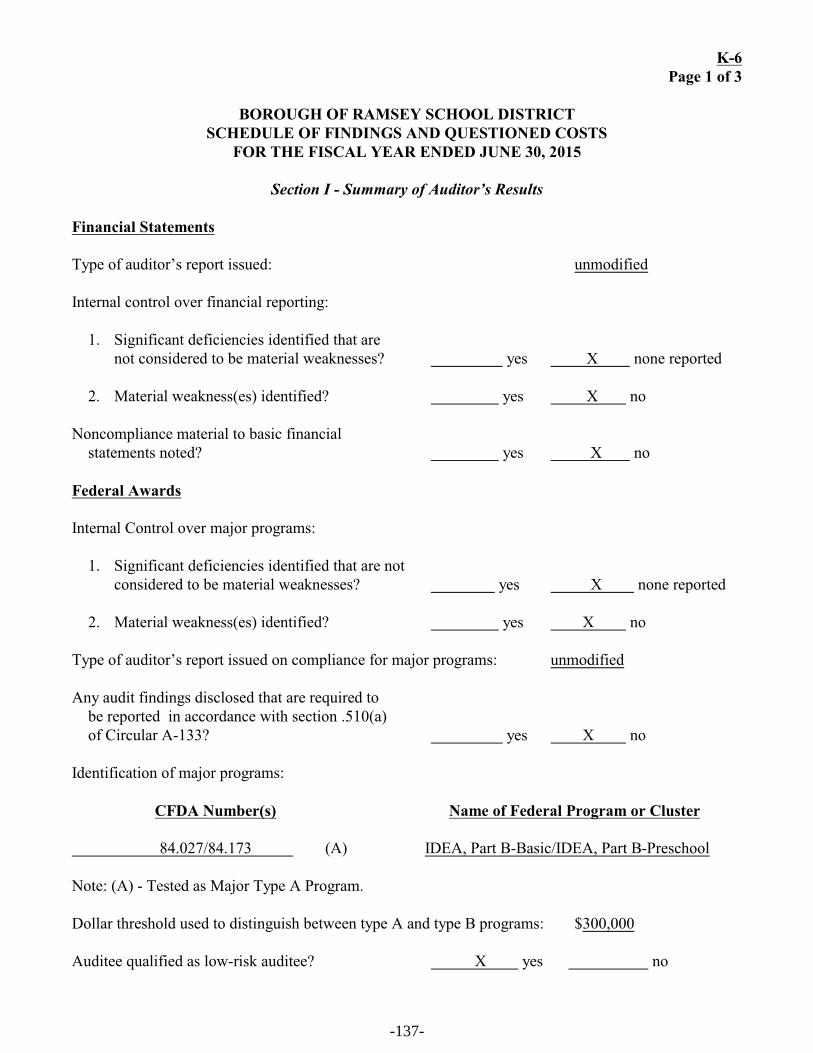
K-6Page 1 of 3
BOROUGH OF RAMSEY SCHOOL DISTRICTSCHEDULE OF FINDINGS AND QUESTIONED COSTS
FOR THE FISCAL YEAR ENDED JUNE 30, 2015
Section I - Summary of Auditor’s Results
Financial Statements
Type of auditor’s report issued: unmodified
Internal control over financial reporting:
1. Significant deficiencies identified that arenot considered to be material weaknesses? yes X none reported
2. Material weakness(es) identified? yes X no
Noncompliance material to basic financialstatements noted? yes X no
Federal Awards
Internal Control over major programs:
1. Significant deficiencies identified that are not considered to be material weaknesses? yes X none reported
2. Material weakness(es) identified? yes X no
Type of auditor’s report issued on compliance for major programs: unmodified
Any audit findings disclosed that are required tobe reported in accordance with section .510(a) of Circular A-133? yes X no
Identification of major programs:
CFDA Number(s) Name of Federal Program or Cluster
84.027/84.173 (A) IDEA, Part B-Basic/IDEA, Part B-Preschool
Note: (A) - Tested as Major Type A Program.
Dollar threshold used to distinguish between type A and type B programs: $300,000
Auditee qualified as low-risk auditee? X yes no
-137-

K-6Page 2 of 3
BOROUGH OF RAMSEY SCHOOL DISTRICTSCHEDULE OF FINDINGS AND QUESTIONED COSTS
FOR THE FISCAL YEAR ENDED JUNE 30, 2015(continued)
Section I - Summary of Auditor’s Results, (continued)
State Awards
Dollar threshold used to distinguish between type A and type B programs: $ 300,000
Auditee qualified as low-risk auditee? yes X no
Type of auditor’s report issued on compliance for major programs: unmodified
Internal Control over major programs:
1. Significant deficiencies identified that are not considered to be material weaknesses? yes X none reported
2. Material weakness(es) identified? yes X no
Any audit findings disclosed that are required tobe reported in accordance with NJ OMB Circular Letter 04-04? yes X no
Identification of major programs:
GMIS Number(s) Name of State Program
495-034-5094-003 (A) Reimbursed TPAF Social Security Contribution
495-034-5120-089/
495-034-5120-084/ Special Education Categorical Aid/Security
495-034-5120-098/ Aid/PARCC Readiness Aid/Per Pupil Growth
495-034-5120-097/ (A) Aid
100-034-5120-473 (A) Extraordinary Aid
4310-055-14-1003 (A) State School Building Aid-EDA Grant
Note: (A) - Tested as Major Type A Program.
Section II - Financial Statement Findings
None
-138-

K-6
Page 3 of 3
SCHOOL DISTRICT OF THE BOROUGH OF RAMSEY
SCHEDULE OF FINDINGS AND QUESTIONED COSTS
FOR THE YEAR ENDED JUNE 30, 2015
Section III – Federal Awards and State Financial Assistance Findings and Questioned Costs
FEDERAL AWARDS
None
STATE AWARDS
None
-139-
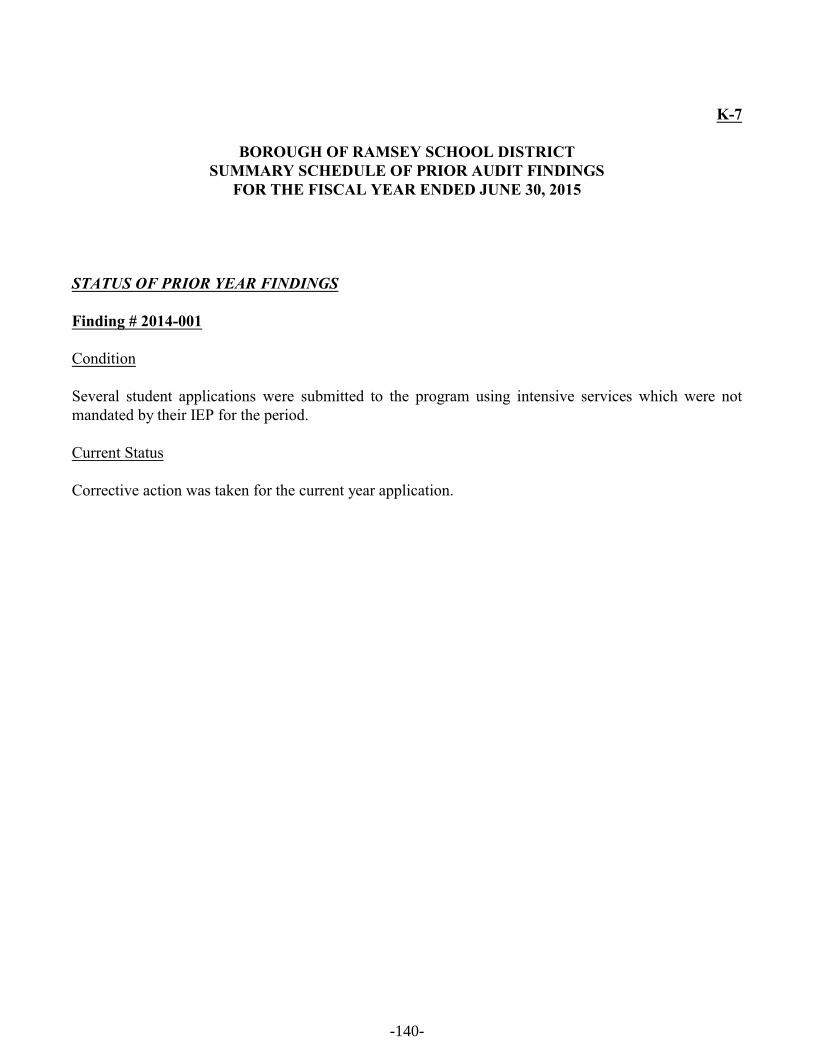
K-7
BOROUGH OF RAMSEY SCHOOL DISTRICTSUMMARY SCHEDULE OF PRIOR AUDIT FINDINGS
FOR THE FISCAL YEAR ENDED JUNE 30, 2015
STATUS OF PRIOR YEAR FINDINGS
Finding # 2014-001
Condition
Several student applications were submitted to the program using intensive services which were notmandated by their IEP for the period.
Current Status
Corrective action was taken for the current year application.
-140-