Embed Size (px)
Citation preview

SCHOOL DISTRICT OF THE
BOROUGH OF FORT LEE
COUNTY OF BERGEN, NEW JERSEY
COMPREHENSIVE ANNUAL FINANCIAL REPORT
FOR THE FISCAL YEAR ENDED
JUNE 30, 2015

School Districtof
BOROUGH OF FORT LEE
BOROUGH OF FORT LEE BOARD OF EDUCATIONFort Lee, New Jersey
Comprehensive Annual Financial ReportYear Ended June 30, 2015

Comprehensive Annual Financial Report
of the
BOROUGH OF FORT LEEBOARD OF EDUCATION
Fort Lee, New Jersey
Year Ended June 30, 2015
Prepared by
David L. RinderknechtBusiness Administrator/Board Secretary

OUTLINE OF CAFR
INTRODUCTORY SECTION
Letter of Transmittal . . . . . . . . . . . . . . . . . . . . . . . . . . . . . . . . . . . . . . . . . . . . . . . . . . . . . . . . . 1
Organizational Chart . . . . . . . . . . . . . . . . . . . . . . . . . . . . . . . . . . . . . . . . . . . . . . . . . . . . . . . . . 6
Roster of Officials . . . . . . . . . . . . . . . . . . . . . . . . . . . . . . . . . . . . . . . . . . . . . . . . . . . . . . . . . . . 7
Consultants and Advisors . . . . . . . . . . . . . . . . . . . . . . . . . . . . . . . . . . . . . . . . . . . . . . . . . . . . . 8
FINANCIAL SECTION
Independent Auditor's Report . . . . . . . . . . . . . . . . . . . . . . . . . . . . . . . . . . . . . . . . . . . . . . . . . . 9
Required Supplementary Information - Part I
Management’s Discussion and Analysis . . . . . . . . . . . . . . . . . . . . . . . . . . . . . . . . . . . . . . . 13
BASIC FINANCIAL STATEMENTS
A. District-wide Financial Statements:
A-1 Statement of Net Position . . . . . . . . . . . . . . . . . . . . . . . . . . . . . . . . . . . . . . . . . . . . 24
A-2 Statement of Activities . . . . . . . . . . . . . . . . . . . . . . . . . . . . . . . . . . . . . . . . . . . . . . 25
B. Fund Financial Statements:
Governmental Funds:
B-1 Balance Sheet . . . . . . . . . . . . . . . . . . . . . . . . . . . . . . . . . . . . . . . . . . . . . . . . . . . . . 26
B-2 Statement of Revenues, Expenditures, and Changes in
Fund Balance . . . . . . . . . . . . . . . . . . . . . . . . . . . . . . . . . . . . . . . . . . . . . . . . . . . . . . 27
B-3 Reconciliation of the Statement of Revenues, Expenditures,
and Changes in Fund Balances of Governmental Funds to
the Statement of Activities . . . . . . . . . . . . . . . . . . . . . . . . . . . . . . . . . . . . . . . . . . . 28
Proprietary Funds:
B-4 Statement of Net Position . . . . . . . . . . . . . . . . . . . . . . . . . . . . . . . . . . . . . . . . . . . . 29
B-5 Statement of Revenues, Expenses, and Changes in Fund Net Position . . . . . . . . . 30
B-6 Statement of Cash Flows . . . . . . . . . . . . . . . . . . . . . . . . . . . . . . . . . . . . . . . . . . . . 31
Fiduciary Funds:
B-7 Statement of Fiduciary Net Position . . . . . . . . . . . . . . . . . . . . . . . . . . . . . . . . . . . . 32
B-8 Statement of Changes in Fiduciary Net Position . . . . . . . . . . . . . . . . . . . . . . . . . . 33
Notes to the Financial Statements . . . . . . . . . . . . . . . . . . . . . . . . . . . . . . . . . . . . . . . . . . . . 34

OUTLINE OF CAFR, (continued)
Required Supplemental Information - Part II
C. Budgetary Comparison Schedules:
C-1 Budgetary Comparison Schedule - General Fund . . . . . . . . . . . . . . . . . . . . . . . . . . 67
C-2 Budgetary Comparison Schedule - Special Revenue Fund . . . . . . . . . . . . . . . . . . . 73
Notes to the Required Supplementary Information
C-3 Budget to GAAP Reconciliation . . . . . . . . . . . . . . . . . . . . . . . . . . . . . . . . . . . . . . . 74
Required Supplementary Information - Part III
L. Schedules Related to Accounting and Reporting for Pensions (GASB 68)
L-1 Schedule of the District's Proportionate Share of the Net Pension
Liability – PERS . . . . . . . . . . . . . . . . . . . . . . . . . . . . . . . . . . . . . . . . . . . . . . . . . . . 75
L-2 Schedule of District Contributions – PERS . . . . . . . . . . . . . . . . . . . . . . . . . . . . . . 76
L-3 Schedule of the District's Proportionate Share of the Net Pension
Liability – TPAF . . . . . . . . . . . . . . . . . . . . . . . . . . . . . . . . . . . . . . . . . . . . . . . . . . . 77
L-4 Notes to Required Schedules of Supplementary Information - Part III . . . . . . . . . 78
Other Supplementary Information
D. School Level Schedules:
Not Applicable
E. Special Revenue Fund:
E-1 Combining Schedule of Program Revenues and Expenditures -
Budgetary Basis . . . . . . . . . . . . . . . . . . . . . . . . . . . . . . . . . . . . . . . . . . . . . . . . . . . 79
E-1a Combining Schedule of Program Revenues and Expenditures -
Budgetary Basis . . . . . . . . . . . . . . . . . . . . . . . . . . . . . . . . . . . . . . . . . . . . . . . . . . . 80
E-1b Combining Schedule of Program Revenues and Expenditures -
Budgetary Basis . . . . . . . . . . . . . . . . . . . . . . . . . . . . . . . . . . . . . . . . . . . . . . . . . . . 81
E-1c Not Applicable
E-2 Not Applicable
F. Capital Projects Fund:
F-1 Summary Schedule of Revenues, Expenditures, and Changes in Fund
Balance - Budgetary Basis . . . . . . . . . . . . . . . . . . . . . . . . . . . . . . . . . . . . . . . . . . . 82
F-1a-s Summary Schedules of Project Revenues, Expenditures, Project Balances
and Project Status - Budgetary Basis . . . . . . . . . . . . . . . . . . . . . . . . . . . . . . . . . . . 83
F-2 Summary Statement of Project Expenditures . . . . . . . . . . . . . . . . . . . . . . . . . . . . . 102
OUTLINE OF CAFR, (continued)
G. Proprietary Funds:
Enterprise Fund:
G-1 Combining Statement of Net Position . . . . . . . . . . . . . . . . . . . . . . . . . . . . . . . . . . 103
G-2 Combining Statement of Revenues, Expenses and Changes
in Fund Net Position . . . . . . . . . . . . . . . . . . . . . . . . . . . . . . . . . . . . . . . . . . . . . . . . 104
G-3 Combining Statement of Cash Flows . . . . . . . . . . . . . . . . . . . . . . . . . . . . . . . . . . . 105
Internal Service Fund:
N/A
H. Fiduciary Fund:
H-1 Combining Statement of Fiduciary Net Position . . . . . . . . . . . . . . . . . . . . . . . . . . 106
H-2 Combining Statement of Changes in Fiduciary Net Position . . . . . . . . . . . . . . . . . 107
H-3 Student Activity Agency Fund - Schedule of Receipts and Disbursements . . . . . . 108
H-4 Payroll Agency Fund - Schedule of Receipts and Disbursements . . . . . . . . . . . . . 109
I. Long Term Debt:
I-1 Schedule of Serial Bonds . . . . . . . . . . . . . . . . . . . . . . . . . . . . . . . . . . . . . . . . . . . . 110
I-2 Schedule of Capital Leases Payable . . . . . . . . . . . . . . . . . . . . . . . . . . . . . . . . . . . . 112
I-3 Debt Service Fund - Budgetary Comparison Schedule . . . . . . . . . . . . . . . . . . . . . . 114
J. Statistical Section (Unaudited)
Financial Trends
J-1 Net Position by Component . . . . . . . . . . . . . . . . . . . . . . . . . . . . . . . . . . . . . . . . . . 115
J-2 Changes in Net Position . . . . . . . . . . . . . . . . . . . . . . . . . . . . . . . . . . . . . . . . . . . . . 116
J-3 Fund Balances - Governmental Funds . . . . . . . . . . . . . . . . . . . . . . . . . . . . . . . . . . 118
J-4 Changes in Fund Balances - Governmental Funds . . . . . . . . . . . . . . . . . . . . . . . . . 119
J-5 General Fund Other Local Revenue by Source . . . . . . . . . . . . . . . . . . . . . . . . . . . . 121
Revenue Capacity
J-6 Assessed Value and Estimated Actual Value of Taxable Property . . . . . . . . . . . . 122
J-7 Direct and Overlapping Property Tax Rates . . . . . . . . . . . . . . . . . . . . . . . . . . . . . 123
J-8 Principal Property Taxpayers . . . . . . . . . . . . . . . . . . . . . . . . . . . . . . . . . . . . . . . . 124
J-9 Property Tax Levies and Collections . . . . . . . . . . . . . . . . . . . . . . . . . . . . . . . . . . 125
Debt Capacity
J-10 Ratios of Outstanding Debt by Type . . . . . . . . . . . . . . . . . . . . . . . . . . . . . . . . . . . 126
J-11 Ratios of Net General Bonded Debt Outstanding . . . . . . . . . . . . . . . . . . . . . . . . . 127
J-12 Ratios of Overlapping Governmental Activities Debt . . . . . . . . . . . . . . . . . . . . . 128
J-13 Legal Debt Margin Information . . . . . . . . . . . . . . . . . . . . . . . . . . . . . . . . . . . . . . 129

OUTLINE OF CAFR, (continued)
Demographic and Economic Information
J-14 Demographic and Economic Statistics . . . . . . . . . . . . . . . . . . . . . . . . . . . . . . . . . 130
J-15 Principal Employers . . . . . . . . . . . . . . . . . . . . . . . . . . . . . . . . . . . . . . . . . . . . . . . 131
Operating Information
J-16 Full-time Equivalent District Employees by Function/Program . . . . . . . . . . . . . . 132
J-17 Operating Statistics . . . . . . . . . . . . . . . . . . . . . . . . . . . . . . . . . . . . . . . . . . . . . . . . 133
J-18 School Building Information . . . . . . . . . . . . . . . . . . . . . . . . . . . . . . . . . . . . . . . . 134
J-19 Schedule of Required Maintenance for School Facilities . . . . . . . . . . . . . . . . . . . 135
J-20 Insurance Schedule . . . . . . . . . . . . . . . . . . . . . . . . . . . . . . . . . . . . . . . . . . . . . . . . 136
K. SINGLE AUDIT SECTION
K-1 Independent Auditor’s Report on Internal Control Over Financial
Reporting and on Compliance and Other Matters Based on an Audit
of Financial Statements Performed in Accordance with Government
Auditing Standards . . . . . . . . . . . . . . . . . . . . . . . . . . . . . . . . . . . . . . . . . . . . . . . . 137
K-2 Independent Auditor’s Report on Compliance with Requirements
Applicable to Each Major Federal and State Program and Internal
Control Over Compliance in Accordance with OMB Circular A-133
and N.J. OMB Circular 04-04 . . . . . . . . . . . . . . . . . . . . . . . . . . . . . . . . . . . . . . . . 139
K-3 Schedule of Expenditures of Federal Awards . . . . . . . . . . . . . . . . . . . . . . . . . . . . 142
K-4 Schedule of Expenditures of State Awards and Other Local Awards . . . . . . . . . 143
K-5 Notes to the Schedules of Expenditures of Federal Awards and
State Financial Assistance . . . . . . . . . . . . . . . . . . . . . . . . . . . . . . . . . . . . . . . . . . . 145
K-6 Schedule of Findings and Questioned Costs . . . . . . . . . . . . . . . . . . . . . . . . . . . . . 147
K-7 Summary Schedule of Prior Audit Findings . . . . . . . . . . . . . . . . . . . . . . . . . . . . . 151

INTRODUCTORY SECTION
-1-

-2-

-3-
-4-

-5-

-6-

Members of the Board of Education Term Expires
David Sarnoff, President 12/31/2015Holly Morell, Vice President 12/31/2015Yusang Park (James) 12/31/2015Joseph J. Surace 12/31/2017Esther Han Silver 12/31/2015Jeffrey Weinberg 12/31/2016Candace Romba 12/31/2016Michael Osso 12/31/2017Ammad Quraishi 12/31/2017Paula Colbath 12/31/2015
Kenneth Rota - Superintendent
Dr. Sharon Amato - Direcetor of Curriculum & Operations
Ronald Smith - Interim Business Administrator/Board Secretary
Charles Hangley, Treasurer of School Monies
Ana M. Flores, Assistant Business Administrator
Jack L. DeNichilo, Supervisor Buildings & Grounds
Mr. Dennis McKeever, Esq., Board Attorney
Other Officials
FORT LEE BOARD OF EDUCATION
ROSTER OF OFFICIALS
JUNE 30, 2015
-7-
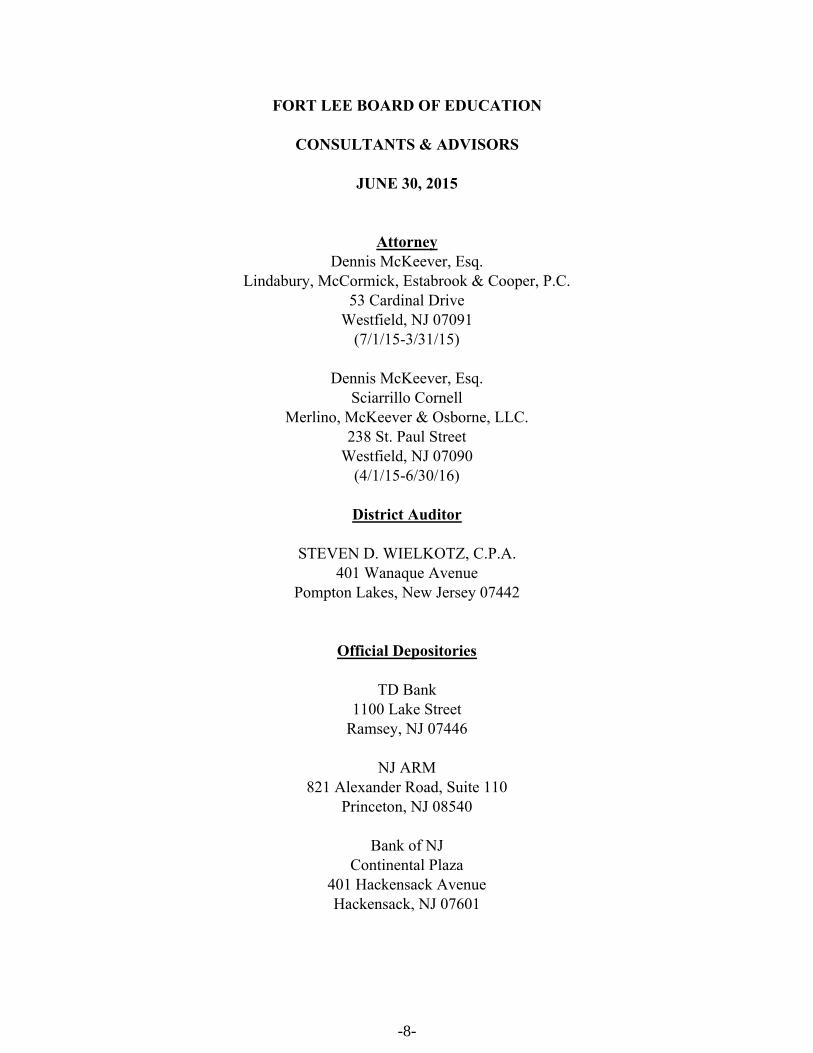
Merlino, McKeever & Osborne, LLC.Sciarrillo Cornell
238 St. Paul StreetWestfield, NJ 07090
TD Bank
District Auditor
(4/1/15-6/30/16)
FORT LEE BOARD OF EDUCATION
CONSULTANTS & ADVISORS
JUNE 30, 2015
AttorneyDennis McKeever, Esq.
Lindabury, McCormick, Estabrook & Cooper, P.C.53 Cardinal Drive
Westfield, NJ 07091(7/1/15-3/31/15)
Dennis McKeever, Esq.
401 Hackensack AvenueHackensack, NJ 07601
NJ ARM821 Alexander Road, Suite 110
Princeton, NJ 08540
Bank of NJContinental Plaza
1100 Lake StreetRamsey, NJ 07446
STEVEN D. WIELKOTZ, C.P.A.401 Wanaque Avenue
Pompton Lakes, New Jersey 07442
Official Depositories
-8-

FINANCIAL SECTION

Ferraioli, Wielkotz, Cerullo & Cuva, P.A.
Charles J. Ferraioli, Jr., MBA, CPA, RMA Certified Public Accountants Newton Office Steven D. Wielkotz, CPA, RMA 401 Wanaque Avenue 100B Main Street James J. Cerullo, CPA, RMA Pompton Lakes, New Jersey 07442 Newton, NJ 07860Paul J. Cuva, CPA, RMA 973-835-7900 973-579-3212Thomas M. Ferry, CPA, RMA Fax 973-835-6631 Fax 973-579-7128
INDEPENDENT AUDITOR'S REPORT
Honorable President and
Members of the Board of Education
Borough of Fort Lee School District
County of Bergen, New Jersey
Fort Lee, New Jersey
Report on the Financial Statements
We have audited the accompanying financial statements of the governmental activities, the business-
type activities, each major fund and the aggregate remaining fund information of the Borough of Fort
Lee School District, in the County of Bergen, State of New Jersey, as of and for the year ended June 30,
2015, and the related notes to the financial statements, which collectively comprise the District’s basic
financial statements as listed in the table of contents.
Management’s Responsibility for the Financial Statements
Management is responsible for the preparation and fair presentation of these financial statements in
accordance with accounting principles generally accepted in the United States of America; this includes
the design, implementation, and maintenance of internal control relevant to the preparation and fair
presentation of financial statements that are free from material misstatements, whether due to fraud or
error.
Auditor’s Responsibility
Our responsibility is to express an opinion on these financial statements based on our audit. We
conducted our audit in accordance with auditing standards generally accepted in the United States of
America, the audit requirements prescribed by the Office of School Finance, Department of Education,
State of New Jersey, and the standards applicable to financial audits contained in Government Auditing
Standards, issued by the Comptroller General of the United States. Those standards require that we
plan and perform the audit to obtain reasonable assurance about whether the financial statements are
free of material misstatement.
-9-

Honorable President and
Members of the Board of Education
Page 2.
An audit involves performing procedures to obtain audit evidence about the amounts and disclosures in
the financial statements. The procedures selected depend on the auditor’s judgment, including the
assessment of the risks of material misstatement of the financial statements, whether due to fraud or
error. In making those risk assessments, the auditor considers internal control relevant to the entity’s
preparation and fair presentation of the financial statements in order to design audit procedures that are
appropriate in the circumstances, but not for the purpose of expressing an opinion on the effectiveness
of the entity’s internal control. Accordingly, we express no such opinion. An audit also includes
evaluating the appropriateness of accounting policies used and the reasonableness of significant
accounting estimates made by management, as well as evaluating the overall presentation of the
financial statements.
We believe that the audit evidence we have obtained is sufficient and appropriate to provide a basis for
our audit opinions.
Opinions
In our opinion, the financial statements referred to above present fairly, in all material respects, the
respective financial position of the governmental activities, business-type activities, each major fund,
and the aggregate remaining fund information of the Borough of Fort Lee Board of Education, in the
County of Bergen, State of New Jersey, as of June 30, 2015, and the respective changes in financial
position and, where applicable, cash flows thereof for the year then ended in accordance with
accounting principles generally accepted in the United States of America.
Other Matters
Required Supplementary Information
Accounting principles generally accepted in the United States of America require that the
Management’s Discussion and Analysis, Budgetary Comparison Information and schedules related to
accounting and reporting for pensions (GASB 68) identified in the table of contents be presented to
supplement the basic financial statements. Such information, although not a part of the basic financial
statements, is required by the Governmental Accounting Standards Board who considers it to be an
essential part of the financial reporting for placing the basic financial statements in an appropriate
operational, economic, or historical context. We have applied certain limited procedures to the required
supplementary information in accordance with auditing standards generally accepted in the United
States of America, which consisted of inquiries of management about the methods of preparing the
information and comparing the information for consistency with management’s responses to our
inquiries, the basic financial statements, and other knowledge we obtained during our audit of the basic
financial statements. We do not express an opinion or provide any assurance on the information
because the limited procedures do not provide us with sufficient evidence to express an opinion or
provide any assurance.
-10-

Honorable President and
Members of the Board of Education
Page 3.
Other Information
Our audit was conducted for the purpose of forming opinions on the financial statements that
collectively comprise the Borough of Fort Lee Board of Education’s basic financial statements. The
introductory section, combining and individual nonmajor fund financial statements, and schedule of
expenditures of federal awards, as required by Office of Management and Budget Circular A-133,
Audits of States, Local Governments, and Non-Profit Organizations and the schedule of expenditures of
state financial assistance as required by NJ OMB 04-04 and the introductory section and statistical
section are presented for purposes of additional analysis and are not a required part of the basic financial
statements.
The combining and individual nonmajor fund financial statements and the schedule of expenditures of
federal awards, as required by Office of Management and Budget Circular A-133, Audits of States,
Local Governments, and Non-Profit Organizations, the schedule of federal financial awards and the
schedule of expenditures of state financial assistance as required by NJ OMB 04-04 are the
responsibility of management and were derived from and relates directly to the underlying accounting
and other records used to prepare the basic financial statements. Such information has been subjected to
the auditing procedures applied in the audit of the basic financial statements and certain additional
procedures, including comparing and reconciling such information directly to the underlying accounting
and other records used to prepare the basic financial statements or to the basic financial statements
themselves, and other additional procedures in accordance with auditing standards generally accepted in
the United States of America. In our opinion, the combining and individual nonmajor fund financial
statements, schedule of expenditures of federal awards, as required by Office of Management and
Budget Circular A-133, Audits of States, Local Governments, and Non-Profit Organizations, and the
schedule of expenditures of state financial assistance as required by NJ OMB 04-04 are fairly stated, in
all material respects, in relation to the basic financial statements as a whole.
The introductory section and statistical data section has not been subject to the auditing procedures
applied in the audit of the basic financial statements, and accordingly, we do not express an opinion or
provide any assurance on it.
Other Reporting Required by Government Auditing Standards
In accordance with Government Auditing Standards, we have also issued our report dated November 17,
2015 on our consideration of the Borough of Fort Lee Board of Education’s internal control over
financial reporting and on our tests of its compliance with certain provisions of laws, regulations,
contracts, and grant agreements and other matters. The purpose of that report is to describe the scope
-11-

Honorable President and
Members of the Board of Education
Page 4.
of our testing of internal control over financial reporting and compliance and the results of that testing,
and not to provide an opinion on internal control over financial reporting or on compliance. That report
is an integral part of an audit performed in accordance with Government Auditing Standards in
considering the Borough of Fort Lee Board of Education’s internal control over financial reporting and
compliance.
Steven D. WielkotzSteven D. WielkotzSteven D. WielkotzSteven D. Wielkotz
Steven D. Wielkotz, C.P.A.
Licensed Public School Accountant
No. 816
Ferraioli, Wielkotz, Cerullo & Cuva, P.A.Ferraioli, Wielkotz, Cerullo & Cuva, P.A.Ferraioli, Wielkotz, Cerullo & Cuva, P.A.Ferraioli, Wielkotz, Cerullo & Cuva, P.A.
FERRAIOLI, WIELKOTZ, CERULLO & CUVA, P.A.
Certified Public Accountants
Pompton Lakes, New Jersey
November 17, 2015
-12-

REQUIRED SUPPLEMENTARY
INFORMATION - PART I
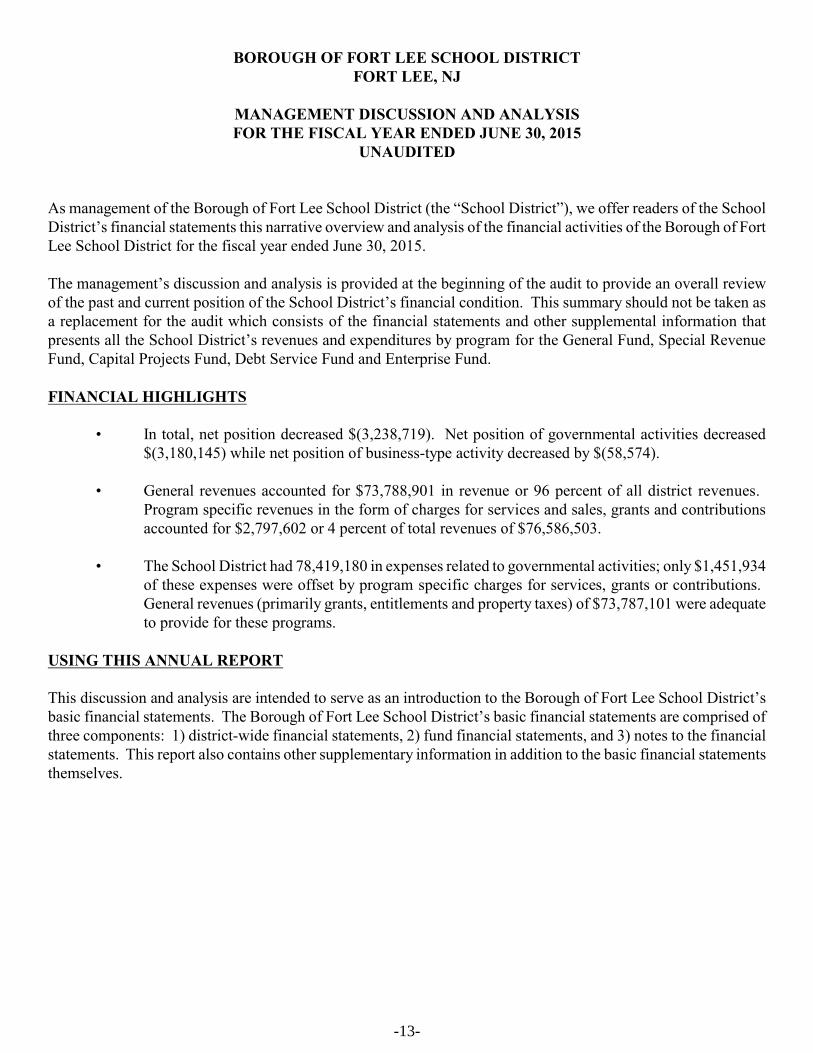
BOROUGH OF FORT LEE SCHOOL DISTRICTFORT LEE, NJ
MANAGEMENT DISCUSSION AND ANALYSISFOR THE FISCAL YEAR ENDED JUNE 30, 2015
UNAUDITED
As management of the Borough of Fort Lee School District (the “School District”), we offer readers of the SchoolDistrict’s financial statements this narrative overview and analysis of the financial activities of the Borough of FortLee School District for the fiscal year ended June 30, 2015.
The management’s discussion and analysis is provided at the beginning of the audit to provide an overall reviewof the past and current position of the School District’s financial condition. This summary should not be taken asa replacement for the audit which consists of the financial statements and other supplemental information thatpresents all the School District’s revenues and expenditures by program for the General Fund, Special RevenueFund, Capital Projects Fund, Debt Service Fund and Enterprise Fund.
FINANCIAL HIGHLIGHTS
• In total, net position decreased $(3,238,719). Net position of governmental activities decreased$(3,180,145) while net position of business-type activity decreased by $(58,574).
• General revenues accounted for $73,788,901 in revenue or 96 percent of all district revenues. Program specific revenues in the form of charges for services and sales, grants and contributionsaccounted for $2,797,602 or 4 percent of total revenues of $76,586,503.
• The School District had 78,419,180 in expenses related to governmental activities; only $1,451,934of these expenses were offset by program specific charges for services, grants or contributions. General revenues (primarily grants, entitlements and property taxes) of $73,787,101 were adequateto provide for these programs.
USING THIS ANNUAL REPORT
This discussion and analysis are intended to serve as an introduction to the Borough of Fort Lee School District’sbasic financial statements. The Borough of Fort Lee School District’s basic financial statements are comprised ofthree components: 1) district-wide financial statements, 2) fund financial statements, and 3) notes to the financialstatements. This report also contains other supplementary information in addition to the basic financial statementsthemselves.
-13-

BOROUGH OF FORT LEE SCHOOL DISTRICTFORT LEE, NJ
MANAGEMENT DISCUSSION AND ANALYSISFOR THE FISCAL YEAR ENDED JUNE 30, 2015
UNAUDITED (continued)
USING THIS ANNUAL REPORT, (continued)
District-Wide Financial Statements
The district-wide financial statements are designed to provide readers with a broad overview of the Borough of FortLee School District’s finances, in a manner similar to a private-sector business.
The statement of net position presents information on all of the Borough of Fort Lee School District’s assets andliabilities using the accrual basis of accounting, with the difference between the two reported as net position. Overtime, increases or decreases in net position may serve as a useful indicator of whether the financial position of theBorough of Fort Lee School District is improving or deteriorating.
The statement of activities presents information showing how the government’s net position changed during themost recent fiscal year. All changes in net position are reported as soon as the underlying event giving rise to thechange occurs, regardless of the timing of related cash flows. Thus, revenues and expenses are reported in thisstatement for some items that will only result in cash flows in future fiscal periods.
Both of the district-wide financial statements distinguish functions of the Borough of Fort Lee School District thatare principally supported by taxes and intergovernmental revenues (governmental activities) from other functionsthat are intended to recover all or a significant portion of their costs through user fees and charges (business-typeactivities). The governmental activities of the Borough of Fort Lee School District include instruction, supportservices and special schools. The business-type activities of the Borough of Fort Lee School District include thefood service program and latchkey program.
Fund Financial Statements
A fund is a grouping of related accounts that is used to maintain control over resources that have been segregatedfor specific activities or objectives. The Borough of Fort Lee School District, like other state and local governments,uses fund accounting to ensure and demonstrate compliance with finance-related legal requirements. All of thesefunds of the Borough of Fort Lee School District can be divided into three categories: governmental funds,proprietary funds, and fiduciary funds.
-14-

BOROUGH OF FORT LEE SCHOOL DISTRICTFORT LEE, NJ
MANAGEMENT DISCUSSION AND ANALYSISFOR THE FISCAL YEAR ENDED JUNE 30, 2015
UNAUDITED (continued)
USING THIS ANNUAL REPORT, (continued)
Governmental Funds
Governmental funds are used to account for essentially the same functions reported as governmental activities inthe district-wide financial statements. However, unlike the district-wide financial statements, governmental fundfinancial statements focus on near-term inflows and outflow of spendable resources, as well as on balances ofspendable resources available at the end of the fiscal year. Such information may be useful in evaluating a District’snear-term financing requirements.
Because the focus of governmental funds is narrower than that of the district-wide financial statements, it is usefulto compare the information presented for governmental funds with similar information presented for governmentalactivities in the district-wide financial statements. By doing so, readers may better understand the long-term impactof the District’s near-term financing decisions. Both the governmental fund balance sheet and the governmentalfund statement of revenues, expenditures, and changes in fund balances provide a reconciliation to facilitate thiscomparison between governmental funds and governmental activities.
The Borough of Fort Lee School District maintains four individual governmental funds. Information is presentedseparately in the governmental fund balance sheet and in the governmental fund statement of revenues, expenditures,and changes in fund balances for the general fund, special revenue fund, capital projects fund, and debt service fund which are all considered to be major funds.
The Borough of Fort Lee School District adopts annual appropriated budgets for its governmental funds except forthe capital projects fund. A budgetary comparison statement has been provided for the general fund, special revenuefund and debt service fund to demonstrate compliance with their budgets.
Proprietary Funds
The Borough of Fort Lee School District maintains one proprietary fund. Enterprise funds are used to report thesame functions presented as business-type activities in the district-wide financial statements. The Borough of FortLee School District uses enterprise funds to account for its food service program and latchkey program.
Proprietary funds provide the same type of information as the district-wide financial statements, only in more detail. The proprietary fund financial statements provide information for the local district services operations.
Fiduciary Funds
Fiduciary funds are used to account for resources held for the benefit of parties outside the District. Fiduciary fundsare not reflected in the district-wide financial statements because the resources of those funds are not available tosupport the Borough of Fort Lee School District’s own programs. The accounting used for fiduciary funds is muchlike that used for proprietary funds.
-15-

BOROUGH OF FORT LEE SCHOOL DISTRICTFORT LEE, NJ
MANAGEMENT DISCUSSION AND ANALYSISFOR THE FISCAL YEAR ENDED JUNE 30, 2015
UNAUDITED (continued)
USING THIS ANNUAL REPORT, (continued)
Notes to the Financial Statements
The notes provide additional information that is essential to a full understanding of the data provided in the district-wide and fund financial statements.
Other Information
In addition to the basic financial statements and accompanying notes, this report also presents certain requiredsupplementary information concerning budgetary information for the District’s major funds.
Our auditor has provided assurance in his independent auditor’s report, located immediately preceding thisManagement’s Discussion and Analysis, that the Basic Financial Statements are fairly stated. Varying degrees ofassurance are being provided by the auditor regarding the Required Supplemental Information and the SupplementalInformation identified above. A user of this report should read the independent auditor’s report carefully to ascertainthe level of assurance being provided for each of the other parts in the Financial Section.
DISTRICT-WIDE FINANCIAL ANALYSIS
The Statement of Net Position provides the perspective of the District as a whole. Net position may, over time,serve as a useful indicator of a government’s financial position.
The District’s financial position is the product of several financial transactions including the net results of activities,the acquisition and payment of debt, the acquisition and disposal of capital assets and the depreciation of capitalassets.
-16-

BOROUGH OF FORT LEE SCHOOL DISTRICTFORT LEE, NJ
MANAGEMENT DISCUSSION AND ANALYSISFOR THE FISCAL YEAR ENDED JUNE 30, 2015
UNAUDITED (continued)
DISTRICT-WIDE FINANCIAL ANALYSIS, (continued)
The School District’s net positions were $2,535,694 at June 30, 2015 and $18,239,267 at June 30, 2014. Restricteditems of net position are reported separately to show legal constraints that limit the School District’s ability to usethose items of net position for day-to-day operations. Our analysis below focuses on the net position for 2015compared to 2014 (Table 1) and change in net position (Table 2) of the School District.
Table 1
Net PositionJune 30,
Governmental Activities Business-Type Activities Total
2015 2014 2015 2014 2015 2014
Assets
Current and Other Assets 59,704,076 21,590,765 359,880 496,159 60,063,956 22,086,924
Capital Assets 39,155,916 24,842,230 96,328 65,940 39,252,244 24,908,170
Total Assets 98,859,992 46,432,995 456,208 562,099 99,316,200 46,995,094
Deferred Outflows:
Unamortized Bond Issuance
Costs 297,970 340,537 297,970 340,537
Deferred Outflows of Resources
Related to PERS 2,376,475 2,376,475
Total Deferred Outflows 2,674,445 340,537 2,674,445 340,537
Liabilities
Current Liabilities 3,464,558 2,036,358 88,349 135,666 3,552,907 2,172,024
Noncurrent Liabilities 93,398,958 24,999,803 93,398,958 24,999,803
Total Liabilities 96,863,516 27,036,161 88,349 135,666 96,951,865 27,171,827
Deferred Inflows:
Unamortized Bond Issuance
Premiums 1,683,970 1,924,537 1,683,970 1,924,537
Deferred Inflows of Resources
Related to PERS 819,116 819,116
Total Deferred Inflows 2,503,086 1,924,537 2,503,086 1,924,537
Net Position
Net Investment in Capital
Assets (36,171,048) 3,994,842 96,328 65,940 (36,074,720) 4,060,782
Restricted 56,001,477 18,051,812 56,001,477 18,051,812
Unrestricted (17,662,594) (4,233,820) 271,531 360,493 (17,391,063) (3,873,327)
Total Net Position 2,167,835 17,812,834 367,859 426,433 2,535,694 18,239,267
-17-

BOROUGH OF FORT LEE SCHOOL DISTRICTFORT LEE, NJ
MANAGEMENT DISCUSSION AND ANALYSISFOR THE FISCAL YEAR ENDED JUNE 30, 2015
UNAUDITED (continued)
DISTRICT-WIDE FINANCIAL ANALYSIS, (continued)
Table 2 below shows the changes in net position for fiscal year 2015 compared to 2014.
Table 2Changes in Net Position
Year Ended June 30,
Governmental Activities Business-Type Activities Total
2015 2014 2015 2014 2015 2014
Revenues
Program Revenues:
Charges for Services and
Sales 915,764 836,887 915,764 836,887
Operating Grants and
Contributions 1,451,934 1,675,017 429,904 437,334 1,881,838 2,112,351
General Revenues:
Taxes:
Property taxes 56,707,369 54,673,393 56,707,369 54,673,393
Federal and State Aid not
Restricted 16,611,285 7,654,476 16,611,285 7,654,476
Capital Outlay 2,193,768 2,193,768
Tuition 43,650 43,650
Cancellation of Capital
Outlay to Capital Reserves 1,397,566 1,397,566
Miscellaneous Income 361,823 567,332 1,800 363,623 567,332
Investment Income 62,974 3,978 43 62,974 4,021
Total Revenues and Transfers 75,239,035 68,165,530 1,347,468 1,274,264 76,586,503 69,439,794
-18-

BOROUGH OF FORT LEE SCHOOL DISTRICTFORT LEE, NJ
MANAGEMENT DISCUSSION AND ANALYSISFOR THE FISCAL YEAR ENDED JUNE 30, 2015
UNAUDITED (continued)
DISTRICT-WIDE FINANCIAL ANALYSIS, (continued)
Governmental Activities Business-Type Activities Total
2015 2014 2015 2014 2015 2014
Functions/Program Expenses
Instruction:
Regular 27,939,247 23,815,229 27,939,247 23,815,229
Special Education 5,285,671 5,081,131 5,285,671 5,081,131
Other Special Education 3,111,092 2,680,798 3,111,092 2,680,798
Other Instruction 1,434,806 1,313,645 1,434,806 1,313,645
Support Services:
Tuition 3,792,977 3,496,240 3,792,977 3,496,240
Student & Instruction
Related Services 10,175,398 9,078,827 10,175,398 9,078,827
General Administrative
Services 1,685,546 1,591,783 1,685,546 1,591,783
School Administrative
Services 3,361,029 2,987,540 3,361,029 2,987,540
Central Services and Admin.
Info. Tech. 1,167,626 1,113,877 1,167,626 1,113,877
Plant Operations and
Maintenance 5,624,082 5,158,782 5,624,082 5,158,782
Pupil Transportation 1,711,881 1,616,017 1,711,881 1,616,017
Unallocated Benefits 5,883,397 4,118,192 5,883,397 4,118,192
Charter School 9,686 9,686
Food Service 1,406,042 1,502,023 1,406,042 1,502,023
Interest on Long-Term Debt 868,913 699,444 868,913 699,444
Unallocated Depreciation 976,850 982,630 976,850 982,630
Capital Outlay -
Nondepreciable 5,588,979 3,378,021 5,588,979 3,378,021
Amortization and Capital
Lease Obligations (198,000) (198,000) (198,000) (198,000)
Total Expenses 78,419,180 66,914,156 1,406,042 1,502,023 79,825,222 68,416,179
Increase or (Decrease) in
Net Position (3,180,145) 1,251,374 (58,574) (227,759) (3,238,719) 1,023,615
-19-

BOROUGH OF FORT LEE SCHOOL DISTRICTFORT LEE, NJ
MANAGEMENT DISCUSSION AND ANALYSISFOR THE FISCAL YEAR ENDED JUNE 30, 2015
UNAUDITED (continued)
DISTRICT-WIDE FINANCIAL ANALYSIS, (continued)
Governmental and Business-Type Activities
As reported in the Statement of Activities the cost of all of our governmental and business-type activities this yearwas $79,825,222. However, the amount that our taxpayers ultimately financed for these activities through SchoolDistrict taxes was only $56,707,369 because some of the cost was paid by those who benefitted from the programs$915,764, by other governments and organizations who subsidized certain programs with grants and contributions$1,881,838, investment income $62,974, tuition $43,650, and by miscellaneous sources $361,823.
The following schedules present a summary of governmental fund revenues and expenditures for the fiscal yearended June 30, 2015, and the amount and percentage of increases/(decreases) relative to the prior year.
Revenue AmountPercent of
Total
Increase/(Decrease)from 2014
Percent ofIncrease/
(Decrease)
Local Source $57,178,715 82.4% $1,934,012 3.50%State Source 10,846,091 15.6 914,154 9.20%Federal Source 1,347,667 1.9 (243,657) (15.31)%
Total $69,372,473 100.0% $2,604,509 3.90%
Expenditures AmountPercent of
Total
Increase/(Decrease)from 2014
Percent ofIncrease/
(Decrease)
Current Expenditures:Instruction $26,783,701 30.7% $832,178 3.21%Undistributed 38,279,999 43.9 1,423,813 3.86%
Debt Service 1,345,575 1.5 (6,525) (0.48)%Capital Outlay 20,879,515 23.9 10,259,278 96.60%
Total $87,288,790 100.0% $12,508,744 16.73%
Changes in expenditures were the result of varying factors. Current expense undistributed increased due to spendingfor tuition, plant operations and maintenance, transportation and health insurance cost.
-20-

BOROUGH OF FORT LEE SCHOOL DISTRICTFORT LEE, NJ
MANAGEMENT DISCUSSION AND ANALYSISFOR THE FISCAL YEAR ENDED JUNE 30, 2015
UNAUDITED (continued)
MAJOR GOVERNMENTAL FUNDS BUDGETING AND OPERATING HIGHLIGHTS
The School District’s budgets are prepared according to New Jersey law. The most significant budgeted funds arethe general fund, the special revenue fund and the debt service fund. The capital projects fund is funded by the bondproceeds and state aid. Therefore no budget is presented.
During the fiscal year ended June 30, 2015, the School District amended the special revenue fund by $352,816 forincreases in federal and state grants.
General Fund
The general fund actual revenue including transfers and capital leases was $69,712,066. That amount is$11,468,408 above the final amended budget of $58,243,658. The variance between the actual revenues and finalbudget was the result of non-budgeted on-behalf payments of $5,562,353 for TPAF pension and Social Securityreimbursements, $10,610 for additional extraordinary state aid, $26,280 for additional state aid, $(27,880) for areduction in federal aid, $5,571,444 for capital lease non-budgeted, and $325,601 for increases in other anticipatedrevenues.
The actual expenditures of the general fund were $71,031,309 including transfers and capital leases which is$9,203,021 above the final amended budget of $61,828,288. The variance between the actual and final budget wasdue to non-budget on-behalf payments of $5,562,353 for TPAF pension and Social Security reimbursements,$5,571,444 for capital lease non-budgeted, and $1,930,776 of unexpended budgeted funds.
General fund had total revenues and other financing sources of $69,712,066 and total expenditures and transfersof $71,031,309 with an ending fund balance of $4,756,021 on the budgetary basis of accounting.
Special Revenue Fund
The special revenue fund actual revenue was $1,495,620. That amount is $484,145 below the final amended budgetof $1,979,765. The variance between the actual revenues and the final budget was state and federal grant revenuethat was anticipated to be spent by fiscal year end. The state and federal grant revenue will be received/realized inthe next fiscal year.
The actual expenditures of the special revenue fund were $1,495,620, which is $484,145 below the final amendedbudget of $1,979,765. The variance between the actual expenditures and the final budget was due to the anticipationof fully expending state and federal grant programs. Expenditures will be incurred in the next fiscal year.
-21-

BOROUGH OF FORT LEE SCHOOL DISTRICTFORT LEE, NJ
MANAGEMENT DISCUSSION AND ANALYSISFOR THE FISCAL YEAR ENDED JUNE 30, 2015
UNAUDITED (continued)
CAPITAL ASSETS AND DEBT ADMINISTRATION
Capital Assets
At the end of fiscal year 2015 the School District had $67,281,703 invested in sites, buildings, equipment andconstruction in progress. Of this amount $28,029,459 in depreciation has been taken over the years. We currentlyhave a net book value of $39,252,244. Total additions for the year were $15,343,031, the majority of which wasfor various technology and office equipment, transportation equipment, food service equipment and improvementsto the District’s facilities. Table 3 shows fiscal year 2015 balances compared to 2014.
Table 3
Capital Assets at June 30,
(Net of Depreciation)
Governmental Activities Business-Type Activities Total
2015 2014 2015 2014 2015 2014
Land and Construction in
Progress $21,662,735 $9,566,661 $21,662,735 $9,566,661
Site Improvements 435,543 503,945 435,543 503,945
Buildings and Building
Improvements 16,563,926 14,406,482 16,563,926 14,406,482
Machinery and Equipment 493,712 365,142 $96,328 $65,940 590,040 431,082
$39,155,916 $24,842,230 $96,328 $65,940 $39,252,244 $24,908,170
Debt Administration
At June 30, 2015, the District had $93,398,958 of outstanding debt. Of this amount, $5,713,190 is for compensatedabsences; $7,750,964 is for obligations under capital leases; $66,109,000 of serial bonds for school improvements;and $13,744,804 is for net pension liability.
-22-

BOROUGH OF FORT LEE SCHOOL DISTRICTFORT LEE, NJ
MANAGEMENT DISCUSSION AND ANALYSISFOR THE FISCAL YEAR ENDED JUNE 30, 2015
UNAUDITED (continued)
ECONOMIC FACTORS AND NEXT YEAR’S BUDGETS
The economy in the State of New Jersey is slowly improving. The current State of New Jersey revenue estimatesare at the point that the legislature and governor have approved a State Aid funding bill for the 2015-2016 schoolyear that is greater than the level of the 2014-2015 school year.
These factors were considered in preparing the Borough of Fort Lee School District’s budgets for the 2015-2016fiscal year.
REQUESTS FOR INFORMATION
This financial report is designed to provide a general overview of the Borough of Fort Lee School District’s financesfor all those with an interest in the government’s finances. Questions concerning any of the information providedin this report or requests for additional information should be addressed to:
Ronald SmithInterim School Business Administrator/Board SecretaryBorough of Fort Lee School District2175 Lemoine Avenue, 6 Floorth
Fort Lee, NJ 07024
-23-

BASIC FINANCIAL STATEMENTS

DISTRICT-WIDE FINANCIAL STATEMENTS
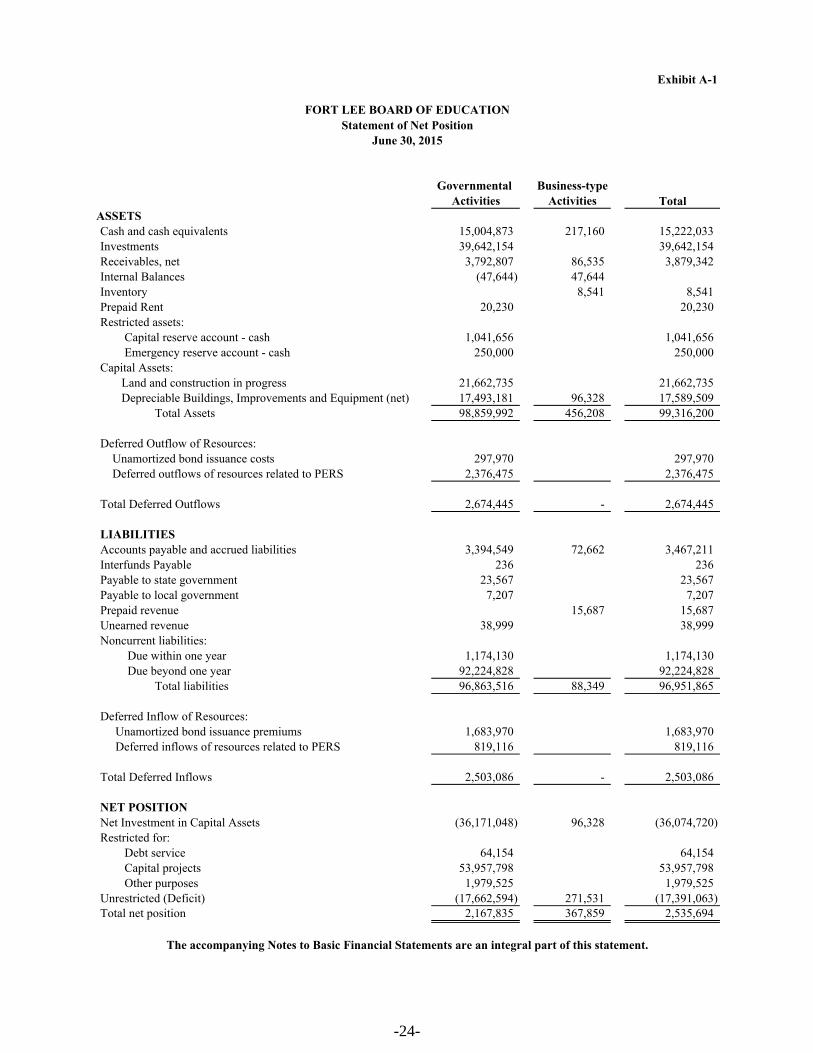
Exhibit A-1
FORT LEE BOARD OF EDUCATIONStatement of Net Position
June 30, 2015
Governmental Business-typeActivities Activities Total
ASSETSCash and cash equivalents 15,004,873 217,160 15,222,033 Investments 39,642,154 39,642,154 Receivables, net 3,792,807 86,535 3,879,342 Internal Balances (47,644) 47,644 Inventory 8,541 8,541 Prepaid Rent 20,230 20,230 Restricted assets: Capital reserve account - cash 1,041,656 1,041,656 Emergency reserve account - cash 250,000 250,000 Capital Assets: Land and construction in progress 21,662,735 21,662,735 Depreciable Buildings, Improvements and Equipment (net) 17,493,181 96,328 17,589,509 Total Assets 98,859,992 456,208 99,316,200
Deferred Outflow of Resources: Unamortized bond issuance costs 297,970 297,970 Deferred outflows of resources related to PERS 2,376,475 2,376,475
Total Deferred Outflows 2,674,445 - 2,674,445
LIABILITIESAccounts payable and accrued liabilities 3,394,549 72,662 3,467,211 Interfunds Payable 236 236 Payable to state government 23,567 23,567 Payable to local government 7,207 7,207 Prepaid revenue 15,687 15,687 Unearned revenue 38,999 38,999 Noncurrent liabilities: Due within one year 1,174,130 1,174,130 Due beyond one year 92,224,828 92,224,828 Total liabilities 96,863,516 88,349 96,951,865
Deferred Inflow of Resources: Unamortized bond issuance premiums 1,683,970 1,683,970 Deferred inflows of resources related to PERS 819,116 819,116
Total Deferred Inflows 2,503,086 - 2,503,086
NET POSITIONNet Investment in Capital Assets (36,171,048) 96,328 (36,074,720) Restricted for: Debt service 64,154 64,154 Capital projects 53,957,798 53,957,798 Other purposes 1,979,525 1,979,525 Unrestricted (Deficit) (17,662,594) 271,531 (17,391,063) Total net position 2,167,835 367,859 2,535,694
The accompanying Notes to Basic Financial Statements are an integral part of this statement.
-24-

Exh
ibit
A-2
FO
RT
LE
E B
OA
RD
OF
ED
UC
AT
ION
Sta
tem
ent
of A
ctiv
itie
sF
isca
l Yea
r E
nded
Jun
e 30
, 201
5N
et (
Exp
ense
) R
even
ue a
ndP
rogr
am R
even
ues
Cha
nges
in N
et P
osit
ion
Ind
irec
t O
per
atin
gE
xpen
ses
Cha
rges
for
Gra
nts
and
Gov
ernm
enta
lB
usin
ess-
typ
eF
unct
ions
/Pro
gram
sE
xpen
ses
All
ocat
ion
Ser
vice
sC
ontr
ibut
ions
Act
ivit
ies
Act
ivit
ies
Tot
al
G
over
nmen
tal a
ctiv
ities
:
In
stru
ctio
n:
Reg
ular
19,5
93,1
14
8,34
6,13
3
(27,
939,
247)
(27,
939,
247)
Spe
cial
edu
catio
n3,
986,
239
1,29
9,43
2
1,12
8,59
9
(4,1
57,0
72)
(4,1
57,0
72)
Oth
er s
peci
al in
stru
ctio
n2,
136,
879
974,
213
(3,1
11,0
92)
(3,1
11,0
92)
Oth
er in
stru
ctio
n1,
067,
469
367,
337
(1,4
34,8
06)
(1,4
34,8
06)
S
uppo
rt s
ervi
ces:
T
uitio
n3,
792,
977
(3,7
92,9
77)
(3,7
92,9
77)
Stu
dent
& in
stru
ctio
n re
late
d se
rvic
es7,
588,
933
2,58
6,46
5
323,
335
(9,8
52,0
63)
(9,8
52,0
63)
Sch
ool a
dmin
istr
ativ
e se
rvic
es2,
324,
603
1,03
6,42
6
(3,3
61,0
29)
(3,3
61,0
29)
Gen
eral
adm
inis
trat
ive
serv
ices
1,44
0,70
3
24
4,84
3
(1
,685
,546
)
(1
,685
,546
)
C
entr
al s
ervi
ces
and
adm
inis
trat
ive
in
form
atio
n te
chno
logy
856,
281
31
1,34
5
(1
,167
,626
)
(1
,167
,626
)
P
lant
ope
ratio
ns a
nd m
aint
enan
ce4,
947,
119
676,
963
(5,6
24,0
82)
(5,6
24,0
82)
Pup
il tr
ansp
orta
tion
1,56
4,67
3
14
7,20
8
(1
,711
,881
)
(1
,711
,881
)
U
nallo
cate
d be
nefi
ts5,
883,
397
(5,8
83,3
97)
(5,8
83,3
97)
C
hart
er s
choo
ls9,
686
(9,6
86)
(9
,686
)
C
apita
l out
lay
5,58
8,97
9
(5
,588
,979
)
(5
,588
,979
)
Inte
rest
on
long
-ter
m d
ebt
868,
913
(8
68,9
13)
(868
,913
)
U
nallo
cate
d de
prec
iatio
n97
6,85
0
(976
,850
)
(9
76,8
50)
Am
ortiz
atio
n(1
98,0
00)
198,
000
198,
000
Tot
al g
over
nmen
tal a
ctiv
ities
62,4
28,8
15
15,9
90,3
65
-
1,45
1,93
4
(76,
967,
246)
-
(76,
967,
246)
B
usin
ess-
type
act
iviti
es:
Food
Ser
vice
1,40
6,04
2
91
5,76
4
42
9,90
4
(6
0,37
4)
(6
0,37
4)
T
otal
bus
ines
s-ty
pe a
ctiv
ities
1,40
6,04
2
91
5,76
4
42
9,90
4
(6
0,37
4)
(6
0,37
4)
Tot
al p
rim
ary
gove
rnm
ent
63,8
34,8
57
915,
764
1,88
1,83
8
(76,
967,
246)
(60,
374)
(77,
027,
620)
Gen
eral
rev
enue
s:T
axes
:
Lev
ied
for
gene
ral p
urpo
ses
55,4
38,4
24
55
,438
,424
Tax
es le
vied
for
deb
t ser
vice
1,26
8,94
5
1,26
8,94
5
Fede
ral a
nd S
tate
aid
not
res
tric
ted
16,6
11,2
85
16
,611
,285
Tui
tion
43,6
50
43,6
50
In
vest
men
t Ear
ning
s62
,974
62
,974
Mis
cella
neou
s In
com
e36
1,82
3
1,
800
36
3,62
3
T
otal
gen
eral
rev
enue
s, s
peci
al it
ems,
ext
raor
dina
ry it
ems
and
tran
sfer
s73
,787
,101
1,80
0
73,7
88,9
01
C
hang
e in
Net
Pos
ition
(3,1
80,1
45)
(58,
574)
(3,2
38,7
19)
Net
Pos
ition
—be
ginn
ing
(res
tate
d)5,
347,
980
42
6,43
3
5,77
4,41
3
N
et P
ositi
on—
endi
ng2,
167,
835
36
7,85
9
2,53
5,69
4
The
acc
omp
anyi
ng N
otes
to
Bas
ic F
inan
cial
Sta
tem
ents
are
an
inte
gral
par
t of
thi
s st
atem
ent.
-25-

FUND FINANCIAL STATEMENTS

Exhibit B-1
FORT LEE BOARD OF EDUCATIONBalance Sheet
Governmental FundsJune 30, 2015
Special Capital Debt TotalGeneral Revenue Projects Service Governmental
Fund Fund Fund Fund Funds
ASSETS Cash and cash equivalents
Checking 3,519,128 11,483,537 2,208 15,004,873 Investments 39,642,154 39,642,154
Accounts Receivable -Interfunds 1,131,633 61,946 1,193,579 Intergovernmental - Federal 972,124 972,124 Intergovernmental - State 805,229 1,805,566 2,610,795 Other receivables 179,065 179,065
Prepaid Rent 20,230 20,230 Restricted cash and cash equivalents
Capital reserve 1,041,656 1,041,656 Emergency reserve 250,000 250,000
Total assets 6,946,941 972,124 52,931,257 64,154 60,914,476
LIABILITIES AND FUND BALANCES Liabilities: Accounts payable 204,199 83,683 206,267 494,149 Intergovernmental accounts payable - State 23,567 23,567 Intergovernmental accounts payable - Local 7,207 7,207 Accrued salaries & benefits 2,027,453 2,027,453 Interfund payables 44,261 857,527 308,848 1,210,636 Unearned revenue 31,652 7,347 38,999
Total liabilities 2,314,772 972,124 515,115 - 3,802,011
Fund Balances: Restricted for: Excess Surplus - current year 502,337 502,337 Capital reserve account 1,541,656 1,541,656 Emergency reserve account 250,000 250,000 Assigned to: Year-end Encumbrances 737,178 737,178 Designated by the BOE for
subsequent year's expenditures 490,010 490,010 Capital projects fund 52,416,142 52,416,142 Debt service fund 64,154 64,154 Unassigned: General Fund 1,110,988 1,110,988
Total Fund balances 4,632,169 - 52,416,142 64,154 57,112,465
Total liabilities and fund balances 6,946,941 972,124 52,931,257 64,154
Amounts reported for governmental activities in the statement of net position (A-1) are different because:
Capital assets used in governmental activities are not financial resources and therefore are not reported in the funds. The cost of the assets is $66,832,560 and the accumulated depreciation is $17,493,181 39,155,916
Accrued liability for interest on long-term debt is not due and payable in the current period and is not reported as a liability in the funds (251,269)
Accounts payable for subsequent Pension payment is not a payable in the funds (621,678)
Bond issuance premium is recorded as revenue in the Governmental Funds in the year of receipt. The original premium is $2,405,671 and and accumulated amortization is $721,701 (1,683,970)
Bond issuance costs are reported as expenditures in the Governmental Funds in the year of the expenditure. The costs are $425,671 and accumulated amortization is $127,701 297,970
Deferred outflows and inflows of resources are applicable to future periods and therefore are not reported in the funds. Deferred outflows of resources related to PERS Pension Liability 2,376,475 Deferred inflows of resources related to PERS Pension Liability (819,116)
Long-term liabilities are not due and payable in the current period and therefore are not reported as liabilties in the funds (see Note 7) (93,398,958)
Net position of governmental activities 2,167,835
The accompanying Notes to Basic Financial Statements are an integral part of this statement.
-26-

Exhibit B-2
FORT LEE BOARD OF EDUCATIONStatement of Revenues, Expenditures, and Changes in Fund Balances
Governmental FundsFiscal Year Ended June 30, 2015
Special Capital Debt TotalGeneral Revenue Projects Service Governmental
Fund Fund Fund Fund Funds
REVENUESLocal sources: Municipal tax levy 55,438,424 1,268,945 56,707,369
Tuition 43,650 43,650 Interest Earned on Capital Reserve Funds 1,028 61,946 62,974 Miscellaneous 361,823 2,899 364,722
Total - Local Sources 55,844,925 2,899 61,946 1,268,945 57,178,715
State sources 8,306,275 101,368 2,438,448 10,846,091 Federal sources 1,347,667 1,347,667
Total revenues 64,151,200 1,451,934 2,500,394 1,268,945 69,372,473
EXPENDITURESCurrent: Regular instruction 19,593,114 19,593,114 Special education instruction 2,857,640 1,128,599 3,986,239 Other special instruction 2,136,879 2,136,879 School sponsored/other instructional 1,067,469 1,067,469 Support services and undistributed costs: Tuition 3,792,977 3,792,977 Attendance and social work services 195,721 195,721 Health services 644,768 644,768 Student & instruction related services 6,425,109 323,335 6,748,444 School administrative services 2,324,603 2,324,603 General administrative services 1,440,703 1,440,703 Central services & administrative
information technology 856,281 856,281 Plant operations and maintenance 4,947,119 4,947,119 Pupil transportation 1,633,541 1,633,541 Unallocated benefits 10,123,803 10,123,803 On-behalf contributions 5,562,353 5,562,353 Transfer to charter school 9,686 9,686 Debt service:
Principal 665,000 665,000 Interest and other charges 680,575 680,575
Capital outlay 7,419,543 13,459,972 20,879,515
Total expenditures 71,031,309 1,451,934 13,459,972 1,345,575 87,288,790
Excess (Deficiency) of revenues (6,880,109) - (10,959,578) (76,630) (17,916,317)
OTHER FINANCING SOURCES (USES)Transfers in 61,946 61,946 Transfers out (61,946) (61,946) Proceeds from Sale of Bonds 49,840,000 49,840,000 Capital Leases (non-budget) 5,571,444 5,571,444
Total other financing sources and uses 5,571,444 - 49,778,054 61,946 55,411,444
Net change in fund balances (1,308,665) - 38,818,476 (14,684) 37,495,127
Fund balance—July 1 5,940,834 13,597,666 78,838 19,617,338
Fund balance—June 30 4,632,169 - 52,416,142 64,154 57,112,465
The accompanying Notes to Basic Financial Statements are an integral part of this statement.
-27-

Exhibit B-3
FORT LEE BOARD OF EDUCATIONReconciliation of the Statement of Revenues, Expenditures,
and Changes in Fund Balances of Governmental Fundsto the Statement of Activities
Fiscal Year Ended June 30, 2015
Total net change in fund balances - governmental funds (from B-2) 37,495,127
Amounts reported for governmental activities in the statementof activities (A-2) are different because:
Capital outlays are reported in governmental funds as expenditures. However, in the statement of activities, the cost of those assets is allocated over their estimated useful lives as depreciation expense. This is the amount by which capital outlays exceeded depreciation in the period.
Depreciation expense (976,850)Depreciable Capital outlays 15,290,536
14,313,686
Repayment of long-term debt is reported as an expenditure in the governmental funds, but the repayment reduces long-term liabilities in the statement of net assets and is not reported in the statement of activities. In the current year , these amounts consist of: General Serial Bonds 665,000 Capital Lease Obligations 68,868
733,868
Proceeds from debt issues are a financing source in the governmental funds. They are not revenue in the statement of activities; issuing debt increases long-term liabilities in the statement of net assets. Proceeds of long-term debt (49,840,000) Capital lease proceeds (5,571,444)
In the statement of activities, interest on long-term debt in the statement of activities is accrued, regardless of when due. In the governmental funds, interest is reported when due. The accrued interest is an addition in the reconciliation. (+) General Bond Obligations - Prior Year 57,546 General Bond Obligations (202,503) General Capital Lease Obligations - Prior Year 5,385 General Capital Lease Obligations (48,766)
(188,338)
In the statement of activities, certain operating expenses, e.g., compensated absences (vacations) are measured by the amounts earned during the year. In the governmental funds, however, expenditures for these items are reported in the amount of financial resources used (paid). When the earned amount exceeds the paid amount, the difference is reduction in the reconciliation (-); when the paid amount exceeds the earned amount the difference is an addition to the reconciliation (+).
Decrease in compensated absences payable 23,225
District pension contributions are reported as expenditures in the governmental funds when made. However, per GASB No. 68 they are reported as deferred outflows of resources in the Statement of Net Position because the reported net pension liability is measured a year before the District's report date. Pension expense, which is the change in the net pension liability adjusted for changed in deferred outflows and inflows of resources related to pensions, is reported in the Statement of Activities.
District Pension Contributions 605,201Less: Pension Expense (949,470)
Increase in Pension Expense (344,269)
Per GASB No. 68, Non-employer contributing entities are required to record any increases in revenue and expense for On-behalf TPAF pension payments paid by the State of New Jersey on the Statement of Activities that are in excess of those amounts reported in the fund financial statements.
Increase in On-behalf State Aid TPAF Pension 5,866,562Increase in On-behalf TPAF Pension Expense (5,866,562)
The governmental funds report the effect of bond premiums when debt is first issued. Whereas these amounts are deferred and amortized in the Statement of Activities (+) 240,567
The governmental funds report the effect of issuance costs when debt is first issued. Whereas these amounts are deferred and amortized in the Statement of Activities (-) (42,567)
Change in net position of governmental activities (3,180,145)
The accompanying Notes to Basic Financial Statements are an integral part of this statement.
-28-
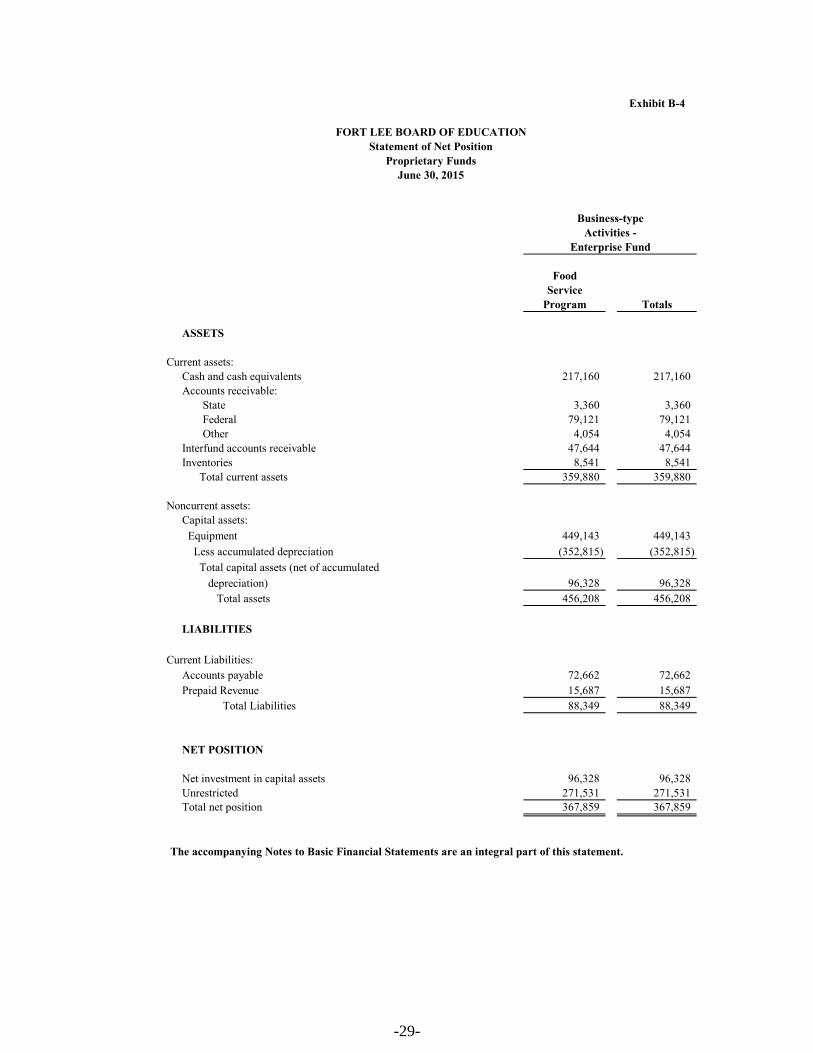
Exhibit B-4
FoodService
Program Totals
ASSETS
Current assets:Cash and cash equivalents 217,160 217,160 Accounts receivable:
State 3,360 3,360 Federal 79,121 79,121 Other 4,054 4,054
Interfund accounts receivable 47,644 47,644 Inventories 8,541 8,541 Total current assets 359,880 359,880
Noncurrent assets:Capital assets:
Equipment 449,143 449,143
Less accumulated depreciation (352,815) (352,815)
Total capital assets (net of accumulated
depreciation) 96,328 96,328 Total assets 456,208 456,208
LIABILITIES
Current Liabilities:Accounts payable 72,662 72,662 Prepaid Revenue 15,687 15,687
Total Liabilities 88,349 88,349
NET POSITION
Net investment in capital assets 96,328 96,328 Unrestricted 271,531 271,531 Total net position 367,859 367,859
The accompanying Notes to Basic Financial Statements are an integral part of this statement.
Business-typeActivities -
Enterprise Fund
FORT LEE BOARD OF EDUCATIONStatement of Net Position
Proprietary FundsJune 30, 2015
-29-

Exhibit B-5
FoodService
Program TotalsOperating revenues:
Charges for services: Daily sales - reimbursable programs 854,244 854,244 Daily sales - other 61,520 61,520 Total operating revenues 915,764 915,764
Operating expenses:Cost of food 568,422 568,422 Salaries 429,863 429,863 Supplies and materials 51,607 51,607 Employee benefits 150,854 150,854 Depreciation 22,107 22,107 Repairs and other expenses 70,389 70,389 Purchased services 112,800 112,800 Total Operating Expenses 1,406,042 1,406,042 Operating income (loss) (490,278) (490,278)
Nonoperating revenues (expenses):State sources: School lunch program 13,832 13,832 Federal sources: School lunch program 327,793 327,793 School breakfast program 28,517 28,517 U.S.D.A. Commodities 59,762 59,762 Interest on investements 1,800 1,800 Total nonoperating revenues (expenses) 431,704 431,704 Income (loss) before contributions & transfers (58,574) (58,574)
Total net position—beginning 426,433 426,433 Total net position—ending 367,859 367,859
The accompanying Notes to Basic Financial Statements are an integral part of this statement.
Business-typeActivities -
Enterprise Fund
FORT LEE BOARD OF EDUCATIONStatement of Revenues, Expenses, and Changes in Fund Net Position
Proprietary FundsFiscal Year Ended June 30, 2015
-30-

Exhibit B-6
FoodService
Program Totals
CASH FLOWS FROM OPERATING ACTIVITIESReceipts from customers 928,217 928,217 Payments to suppliers (1,372,584) (1,372,584) Net cash provided by (used for) operating activities (444,367) (444,367)
CASH FLOWS FROM NONCAPITAL FINANCING ACTIVITIESState Sources 10,533 10,533 Federal Sources 261,429 261,429 Miscellaneous 3,945 3,945 Net cash provided by (used for) non-capital financing activities 275,907 271,962
CASH FLOWS FROM CAPITAL AND RELATED FINANCING ACTIVITIESAcquisition of capital assets (52,495) (52,495) Net cash used for capital and related financing activities (52,495) (52,495)
Net increase (decrease) in cash and cash equivalents (220,955) (224,900)
Balances—beginning of year 438,115 438,115 Balances—end of year 217,160 213,215
Reconciliation of operating income (loss) to net cash provided (used) by operating activities: Operating income (loss) (490,278) (490,278) Adjustments to reconcile operating income (loss) to net cash provided by Depreciation and net amortization 22,107 22,107 Food distribution program 59,762 59,762 (Increase) decrease in accounts receivable 20,544 20,544 (Increase) decrease in interfunds receivable (5,815) (5,815) (Increase) decrease in inventories (3,370) (3,370) Increase (decrease) in prepaid revenue (2,276) (2,276) Increase (decrease) in accounts payable (45,041) (45,041) Total adjustments 45,911 45,911 Net cash provided by (used for) operating activities (444,367) (444,367)
The accompanying Notes to Basic Financial Statements are an integral part of this statement.
Business-typeActivities -
Enterprise Fund
FORT LEE BOARD OF EDUCATIONStatement of Cash Flows
Proprietary FundsFiscal Year Ended June 30, 2015
-31-

Exhibit B-7
FORT LEE BOARD OF EDUCATIONStatement of Fiduciary Net Position
Fiduciary FundsJune 30, 2015
PrivatePurpose Unemployment
Scholarship Compensation Agency Fund Trust Fund Funds
ASSETSCash and cash equivalents 31,258 317,850 391,967 Miscellaneous receivables 1,745 Interfund receivables 12,938 Total assets 31,258 330,788 393,712
LIABILITIES Accounts payable 288,277 Interfund payable 43,524 Payable to student groups 61,911 Due to State of NJ - Unemployment 7,316 Total liabilities - 7,316 393,712
NET POSITIONReserved
Principal portion 5,000 Held in trust for unemployment claims and other purposes 323,472
Reserved for scholarships 26,258
31,258
The accompanying Notes to Basic Financial Statements are an integral part of this statement.
-32-

Exhibit B-8
FORT LEE BOARD OF EDUCATIONStatement of Changes in Fiduciary Net Position
Fiduciary FundsFiscal Year Ended June 30, 2015
PrivatePurpose Unemployment
Scholarship CompensationFund Trust Fund
ADDITIONSContributions: Donations 3,672 Payroll withholdings 48,768 Total Contributions 3,672 48,768
Investment earnings: Interest 237 Net investment earnings - 237 Total additions 3,672 49,005
DEDUCTIONSQuarterly contribution reports 102,874 Scholarships awarded 4,300 Total deductions 4,300 102,874
OTHER CHANGES TO FIDUCIARY NET POSITION Change in net position (628) (53,869) Net position—beginning of the year 31,886 377,341 Net position—end of the year 31,258 323,472
The accompanying Notes to Basic Financial Statements are an integral part of this statement.
-33-

NOTES TO THE FINANCIAL STATEMENTS

Borough of Fort Lee School DistrictNotes to the Basic Financial Statementsfor the fiscal year ended June 30, 2015
NOTE 1. DESCRIPTION OF THE SCHOOL DISTRICT AND REPORTING ENTITY:
The Board of Education (“Board”) of the Borough of Fort Lee School District (“District”) is aninstrumentality of the State of New Jersey, established to function as an educational institution. TheBorough of Fort Lee School District is a Type II district located in the County of Bergen, State of NewJersey. As a Type II district, the School District functions independently through a Board of Education. Theboard is comprised of nine members, all elected to three-year terms. The purpose of the District is to educatestudents in grades K-12. A superintendent is appointed by the Board and is responsible for theadministrative control of the District. Under existing statutes, the Board’s duties and powers include, butare not limited to, the development and adoption of a school program; the establishment, organization andoperation of schools; and the acquisition, maintenance and disposition of school property.
The Board also has broad financial responsibilities, including the approval of the annual budget and theestablishment of a system of accounting and budgetary controls.
The primary criterion for including activities within the District's reporting entity, as set forth in Section2100 of the GASB Codification of Governmental Accounting and Financial Reporting Standards, is whether:
C the organization is legally separate (can sue or be sued in their own name)C the Board holds the corporate powers of the organizationC the Board appoints a voting majority of the organization’s boardC the Board is able to impose its will on the organizationC the organization has the potential to impose a financial benefit/burden on the BoardC there is a fiscal dependency by the organization on the Board
Based on the aforementioned criteria, the Board has no component units. Furthermore, the Board is notincludable in any other reporting entity on the basis of such criteria.
NOTE 2. SUMMARY OF SIGNIFICANT ACCOUNTING POLICIES:
The financial statements of the Board of Education of the Borough of Fort Lee School District have beenprepared in conformity with accounting principles generally accepted in the United States of America(GAAP) as applied to governmental units. The Governmental Accounting Standards Board (GASB) is theaccepted standard-setting body for establishing governmental accounting and financial reporting principles. The more significant of the board’s accounting policies are described below.
A. Basis of Presentation:
The Board’s basic financial statements consist of District-wide statements, including a statement of netposition and a statement of activities, and fund financial statements which provide a more detailed level offinancial information.
-34-

Borough of Fort Lee School DistrictNotes to the Basic Financial Statementsfor the fiscal year ended June 30, 2015
NOTE 2. SUMMARY OF SIGNIFICANT ACCOUNTING POLICIES: (continued)
District-wide Financial Statements:
The statement of net position and the statement of activities display information about the Board as a whole. These statements include the financial activities of the overall District, except for the fiduciary funds. Thestatements distinguish between those activities of the Board that are governmental and those that areconsidered business-type activities.
The statement of net position presents the financial condition of the governmental and business-typeactivities of the Board at year-end. The statement of activities presents a comparison between directexpenses and program revenues for each program or function of the governmental activities and for thebusiness-type activities of the Board. Direct expenses are those that are specifically associated with aservice, program or department and therefore clearly identifiable to a particular function. Program revenuesinclude charges paid by the recipient of the goods or services offered by the program, grants andcontributions that are restricted to meeting the operational or capital requirements of a particular program. Revenues which are not classified as program revenues are presented as general revenues of the Board, withcertain limited exceptions. The comparison of direct expenses with program revenues identifies the extentto which each business segment or governmental function is self-financing or draws from the generalrevenues of the Board.
Fund Financial Statements:
During the fiscal year, the School District segregates transactions related to certain School District functionsor activities in separate funds in order to aid financial management and to demonstrate legal compliance. The fund financial statements provide information about the District’s funds, including its fiduciary funds. Separate statements for each fund category - government, proprietary, and fiduciary - are presented. TheNew Jersey Department of Education (NJDOE) has elected to require New Jersey districts to treat eachgovernmental fund as a major fund in accordance with the option noted in GASB No. 34, paragraph 76. TheNJDOE believes that the presentation of all funds as major is important for public interest and to promoteconsistency among district financial reporting models. The various funds of the Board are grouped into thecategories governmental, proprietary and fiduciary.
GOVERNMENTAL FUNDS
Governmental funds are those through which most governmental functions of the Board are financed. Governmental fund reporting focuses on the sources, uses and balances of current financial resources. Expendable assets are assigned to the various governmental funds according to the purposes for whichthey may or must be used. Current liabilities are assigned to the fund from which they will be paid. The difference between governmental fund assets and liabilities is reported as fund balance. Thefollowing are the Board’s governmental funds:
-35-

Borough of Fort Lee School DistrictNotes to the Basic Financial Statementsfor the fiscal year ended June 30, 2015
NOTE 2. SUMMARY OF SIGNIFICANT ACCOUNTING POLICIES: (continued)
GOVERNMENTAL FUNDS, (continued)
General Fund - The General Fund is the general operating fund of the Board. It is used to account forall financial resources except those required to be accounted for in another fund. Included are certainexpenditures for vehicles and movable instructional or noninstructional equipment which are classifiedin the Capital Outlay subfund.
As required by the New Jersey State Department of Education, the Board includes budgeted CapitalOutlay in this fund. Accounting principles generally accepted in the United States of America as theypertain to governmental entities state that General Fund resources may be used to directly financecapital outlays for long-lived improvements as long as the resources in such cases are derivedexclusively from unrestricted revenues.
Resources for budgeted capital outlay purposes are normally derived from State of New Jersey Aid,District taxes and appropriated fund balance. Expenditures are those that result in the acquisition ofor additions to fixed assets for land, existing buildings, improvements of grounds, construction ofbuildings, additions to or remodeling of buildings and the purchase of built-in equipment. Theseresources can be transferred from and to Current Expense by board resolution.
Special Revenue Fund - The Special Revenue Fund is used to account for the proceeds of specificrevenue from State and Federal Government, (other than major capital projects, Debt Service or theEnterprise Funds) and local appropriations that are legally restricted to expenditures for specifiedpurposes.
Capital Projects Fund - The Capital Projects Fund is used to account for all financial resources to beused for the acquisition or construction of major capital facilities (other than those financed byProprietary Funds). The financial resources are derived from sale of bonds, lease purchases and otherrevenues.
PROPRIETARY FUNDS
The focus of Proprietary Fund measurement is upon determination of net income, changes in netposition, financial position and cash flows. The accounting principles generally accepted in the UnitedStates of America applicable are those similar to businesses in the private sector. Proprietary funds areclassified as enterprise or internal service; the Board has no internal service funds. The following isa description of the Proprietary Funds of the Board:
-36-

Borough of Fort Lee School DistrictNotes to the Basic Financial Statementsfor the fiscal year ended June 30, 2015
NOTE 2. SUMMARY OF SIGNIFICANT ACCOUNTING POLICIES: (continued)
PROPRIETARY FUNDS, (continued)
Enterprise Funds - The Enterprise Funds are utilized to account for operations that are financed andoperated in a manner similar to private business enterprises -- where the intent of the Board is that thecosts (i.e. expenses including depreciation and indirect costs) of providing goods or services to thestudents on a continuing basis be financed or recovered primarily through user charges; or, where theBoard has decided that periodic determination of revenues earned, expenses incurred, and/or netincome is appropriate for capital maintenance, public policy, management control, accountability orother purposes.
The Board's Enterprise Fund is comprised of the Food Service Fund and Latchkey Program Fund.
FIDUCIARY FUNDS
Fiduciary Fund - Fiduciary Fund reporting focuses on net position and changes in net position. TheFiduciary Funds are used to account for assets held by the Board on behalf of individuals, privateorganizations, other governments and/or other funds. Fiduciary Funds include UnemploymentCompensation Insurance, the Memorial Funds, Student Activities Fund and Payroll Agency Fund.
B. Measurement Focus:
District-wide Financial Statements
The District-wide statements (i.e., the statement of net position and the statement of activities) are preparedusing the economic resources measurements focus and the accrual basis of accounting. All assets andliabilities associated with the operation of the Board are included on the statement of net position, exceptfor fiduciary funds.
Fund Financial Statements
All governmental funds are accounted for using a flow of current financial resources measurement focus. With this measurement focus, only current assets and current liabilities generally are included on the balancesheet. The statement of revenues, expenditures and changes in fund balances reports on the sources (i.e.,revenues and other financing sources) and uses (i.e., expenditures and other financing uses) of currentfinancial resources. This approach differs from the manner in which the governmental activities of theDistrict-wide financial statements are prepared. Governmental fund financial statements therefore includea reconciliation with brief explanations to better identify the relationship between the government-widestatements and the statements for governmental funds.
-37-

Borough of Fort Lee School DistrictNotes to the Basic Financial Statementsfor the fiscal year ended June 30, 2015
NOTE 2. SUMMARY OF SIGNIFICANT ACCOUNTING POLICIES: (continued)
Like the District-wide statements, all proprietary fund types are accounted for on a flow of economicresources measurement focus. All assets and all liabilities associated with the operation of these funds areincluded on the statement of net position. The statement of changes in fund net position presents increases(i.e., revenues) and decreases (i.e., expenses) in net total assets. The statement of cash flows providesinformation about how the Board finances and meets the cash flow needs of its proprietary activities.
C. Basis of Accounting:
Basis of accounting determines when transactions are recorded in the financial records and reported on thefinancial statements. The District-wide financial statements and the financial statements of the proprietaryand fiduciary funds are prepared using the accrual basis of accounting. Governmental funds use themodified accrual basis of accounting. Differences in the accrual and the modified accrual basis ofaccounting arise in the recognition of revenue, the recording of unearned revenue, and in the presentationof expenses versus expenditures.
Revenues - Exchange and Non-exchange Transactions
Revenue resulting from exchange transactions, in which each party gives and receives essentially equalvalue, is recorded on the accrual basis when the exchange takes place. On a modified accrual basis, revenueis recorded in the fiscal year in which the resources are measurable and become available. Available meansthat the resources will be collected within the current fiscal year or are expected to be collected soon enoughthereafter to be used to pay liabilities of the current fiscal year.
Nonexchange transactions, in which the Board receives value without directly giving equal value in return,include property taxes, grants, entitlements and donations. On an accrual basis, revenue from property taxesis recognized in the fiscal year for which the taxes are levied. Revenue from grants, entitlements anddonations is recognized in the fiscal year in which all eligibility requirements have been satisfied. Eligibilityrequirements include timing requirements, which specify the year when the resources are required to be usedor the year when use is first permitted, matching requirements, in which the Board must provide localresources to be used for a specified purpose, and expenditure requirements, in which the resources areprovided to the Board on a reimbursement basis. On a modified accrual basis, revenue from nonexchangetransactions must also be available before it can be recognized. Under GAAP, in accordance with GASBNo. 33, Accounting and Financial Reporting for Nonexchange Transactions, the last state aid payment is notconsidered revenue to the school district if the state has not recorded the corresponding expenditure, eventhough state law dictates recording the revenue.
Under the modified accrual basis, the following revenue sources are considered to be both measurable andavailable at year-end: ad valorem property taxes, tuition, unrestricted grants and interest.
-38-
Borough of Fort Lee School DistrictNotes to the Basic Financial Statementsfor the fiscal year ended June 30, 2015
NOTE 2. SUMMARY OF SIGNIFICANT ACCOUNTING POLICIES: (continued)
Expenses/Expenditures
On the accrual basis of accounting, expenses are recognized at the time they are incurred. The fair value ofdonated commodities used during the year is reported in the operating statement as an expense with a likeamount reported as donated commodities revenue.
The measurement of focus of governmental fund accounting is on decreases in net financial resources(expenditures) rather than expenses. Expenditures are generally recognized in the accounting period inwhich the related fund liability is incurred, if measurable. Allocations of cost, such as depreciation andamortization, are not recognized in the governmental funds.
D. Budgets/Budgetary Control:
Annual appropriated budgets are adopted in the spring of the preceding year for the general, and specialrevenue funds. The budgets are submitted to the county superintendents office for approval. Budgets areprepared using the modified accrual basis of accounting, except for the special revenue fund as describedlater. The legal level of budgetary control is established at line item accounts within each fund. Line itemaccounts are defined as the lowest (most specific) level of detail as established pursuant to the minimumchart of accounts referenced in N.J.A.C. 6A:23-2(g)1. Transfers of appropriations may be made by SchoolBoard resolution at any time during the fiscal year.
Formal budgetary integration into the accounting system is employed as a management control device duringthe year. For governmental funds there are no substantial differences between the budgetary basis ofaccounting and accounting principles generally accepted in the United States of America with the exceptionof the legally mandated revenue recognition of the last state aid payment for budgetary purposes only andspecial revenue fund as noted below. Encumbrance accounting is also employed as an extension of formalbudgetary integration in the governmental fund types. Unencumbered appropriations lapse at fiscal year end.
The accounting records of the special revenue fund are maintained on the grant accounting budgetary basis. The grant accounting budgetary basis differs from GAAP in that the grant accounting budgetary basisrecognizes encumbrances as expenditures and also recognizes the related revenues, whereas the GAAP basisdoes not. Sufficient supplemental records are maintained to allow for the presentation of GAAP basisfinancial reports.
-39-

Borough of Fort Lee School DistrictNotes to the Basic Financial Statementsfor the fiscal year ended June 30, 2015
NOTE 2. SUMMARY OF SIGNIFICANT ACCOUNTING POLICIES: (continued)
E. Encumbrances:
Under encumbrance accounting purchase orders, contracts and other commitments for the expenditure ofresources are recorded to reserve a portion of the applicable appropriation. Open encumbrances ingovernmental funds, other than the special revenue fund, are reported as reservations of fund balances atfiscal year end as they do not constitute expenditures or liabilities but rather commitments related tounperformed contracts for goods and services.
Open encumbrances in the special revenue fund, for which the Board has received advances, are reflectedin the balance sheet as unearned revenues at fiscal year end.
The encumbered appropriation authority carries over into the next fiscal year. An entry will be made at thebeginning of the next fiscal year to increase the appropriation reflected in the certified budget by theoutstanding encumbrance amount as of the current fiscal year end.
F. Cash, Cash Equivalents and Investments:
Cash and cash equivalents include petty cash, change funds, cash in banks and all highly liquid investmentswith a maturity of three months or less at the time of purchase and are stated at cost plus accrued interest. U.S. Treasury and agency obligations and certificates of deposit with maturities of one year or less whenpurchased are stated at cost. All other investments are stated at fair value.
New Jersey school districts are limited as to the types of investments and types of financial institutions theymay invest in. New Jersey statute 18A:20-37 provides a list of permissible investments that may bepurchased by New Jersey school districts.
Additionally, the Board has adopted a cash management plan that requires it to deposit public funds in publicdepositories protected from loss under the provisions of the Governmental Unit Deposit Protection Act("GUDPA"). GUDPA was enacted in 1970 to protect Governmental Units from a loss of funds on depositwith a failed banking institution in New Jersey.
N.J.S.A. 17:9-41 et. seq. establishes the requirements for the security of deposits of governmental units. Thestatute requires that no governmental unit shall deposit public funds in a public depository unless such fundsare secured in accordance with the Act. Public depositories include Savings and Loan institutions, banks(both state and national banks) and savings banks the deposits of which are federally insured. All publicdepositories must pledge collateral, having a market value at least equal to five percent of the average dailybalance of collected public funds, to secure the deposits of Governmental Units. If a public depository fails,the collateral it has pledged, plus the collateral of all other public depositories, is available to pay the fullamount of their deposits to the Governmental Units.
-40-

Borough of Fort Lee School DistrictNotes to the Basic Financial Statementsfor the fiscal year ended June 30, 2015
NOTE 2. SUMMARY OF SIGNIFICANT ACCOUNTING POLICIES: (continued)
G. Tuition Revenues/Receivable:
Tuition charges were established by the Board of Education based on estimated costs. The charges aresubject to adjustment when the final costs have been determined.
H. Inventories:
On District-wide financial statements, inventories are presented at cost, which approximates market on afirst-in, first-out basis and are expensed when used.
On fund financial statements inventories are valued at cost, which approximates market, using thefirst-in-first-out (FIFO) method. Inventories of proprietary funds consist of food and goods held for resale,as well as supplies, and are expensed when used.
I. Prepaid Items:
Payments made to vendors for services that will benefit periods beyond June 30, 2015, are recorded asprepaid items using the consumption method. A current asset for the prepaid amount is recorded at the timeof purchase and an expenditure/expense is reported in the year in which services are consumed.
J. Short-Term Interfund Receivables/Payables:
On fund financial statements, receivables and payables resulting from short-term interfund loans areclassified as “interfund receivables/payables.” These amounts are eliminated in the governmental andbusiness-type activities columns of the statement of net position, except for the net residual amounts duebetween governmental and business-type activities, which are presented as internal balances.
K. Capital Assets:
General capital assets are those assets not specifically related to activities reported in the enterprise fund. These assets generally result from expenditures in the governmental funds. These assets are reported in thegovernmental activities column of the district -wide statement of net position but are not reported in the fundfinancial statements. Capital assets utilized by the enterprise fund are reported both in the business-typeactivity column of the District-wide statement of net position and in the fund.
-41-

Borough of Fort Lee School DistrictNotes to the Basic Financial Statementsfor the fiscal year ended June 30, 2015
NOTE 2. SUMMARY OF SIGNIFICANT ACCOUNTING POLICIES: (continued)
All capital assets acquired or constructed during the year are recorded at actual cost. Donated fixed assetsare valued at their estimated fair market value on the date received. The capital assets acquired orconstructed prior to June 30, 1993 are valued at cost based on historical records or through estimationprocedures performed by an independent appraisal company. Donated capital assets are valued at theirestimated fair market value on the date received. The Board maintains a capitalization threshold of$2,000.00. The Board does not possess any infrastructure. Improvements are capitalized; the costs ofnormal maintenance and repairs that do not add to the value fo the asset or materially extend an asset’s lifeare not.
All reported capital assets except land and construction in progress are depreciated. Improvements aredepreciated over the remaining useful lives of the related capital assets. Depreciation is computed using thestraight-line method over the following useful lives:
Description
GovernmentalActivities
Estimated Lives
Business-TypeActivity
Estimated Lives
Sites and Improvements 20 years N/ABuildings and Improvements 7-50 years N/AFurniture, Equipment and Vehicles 5-20 years 5-20 years
L. Compensated Absences:
Compensated absences are those absences for which employees will be paid, such as vacation, sick leave,and sabbatical leave. A liability for compensated absences that are attributable to services already rendered,and that are not contingent on a specific event that is outside the control of the Board and its employees, isaccrued as the employees earn the rights to the benefits. Compensated absences that relate to future services,or that are contingent on a specific event that is outside the control of the Board and its employees, areaccounted for in the period in which such services are rendered or in which such events take place.
For the District-wide Statements, the current portion is the amount estimated to be used in the followingyear. In accordance with GAAP, for the governmental funds, in the Fund Financial Statements, all of thecompensated absences are considered long-term and therefore, are not a fund liability and represents areconciling item between the fund level and District-wide presentations.
-42-

Borough of Fort Lee School DistrictNotes to the Basic Financial Statementsfor the fiscal year ended June 30, 2015
NOTE 2. SUMMARY OF SIGNIFICANT ACCOUNTING POLICIES: (continued)
M. Unearned Revenue:
Unearned revenue arises when assets are recognized before revenue recognition criteria have been satisfied.
Unearned revenue in the special revenue fund represents cash that has been received but not yet earned. SeeNote 2(E) regarding the special revenue fund.
N. Accrued Liabilities and Long-term Obligations:
All payables, accrued liabilities and long-term obligations are reported in the District-wide financialstatements.
In general, governmental fund payables and accrued liabilities that, once incurred, are paid in a timelymanner and in full from current financial resources, are reported as obligations of the funds. However,claims and judgements, compensated absences, special termination benefits and contractually requiredpension contributions that will be paid from governmental funds are reported as a liability in the fundfinancial statements only to the extent that they are due for payment in the current year. Bonds, long-termobligations, and capital leases that will be paid from governmental funds are recognized as a liability in thefund financial statements when due.
O. Accounting and Financial Reporting for Pensions:
In fiscal year 2015, the District implemented GASB 68. This Statement amends GASB Statement No. 27.It improves accounting and financial reporting by state and local governments for pensions. It also improvesinformation provided by state and local government employers about financial support for pensions that isprovided by other entities. This Statement results from a comprehensive review of the effectiveness ofexisting standards of accounting and financial reporting for pensions with regard to providing decision usefulinformation, supporting assessments of accountability and interperiod equity, and creating additionaltransparency. This Statement replaces the requirement of Statement No. 27, Accounting for Pension by Stateand Local Governmental Employers, as well as the requirements of Statement No. 50, Pension Disclosures,as they relate to pensions that are provided through pension plans administered as trusts or equivalentarrangements that meet certain criteria. The requirements of Statements 27 and 50 remain applicable forpensions that are not covered by the scope of this Statement. This statement is effective for periodsbeginning after June 15, 2014.
The District has also implemented GASB Statement 71, Pension Transition for Contributions madeSubsequent to the Measurement Date-an amendment to GASB No. 68. The objective of this Statement isto address an issue regarding application of the transition provisions of Statement No. 68, Accounting andFinancial Reporting for Pensions. The issue relates to amounts associated with contributions, if any, madeby a state or local government employer or nonemployer contributing entity to a defined benefit pension planafter the measurement date of the government's beginning net pension liability.
-43-

Borough of Fort Lee School DistrictNotes to the Basic Financial Statementsfor the fiscal year ended June 30, 2015
NOTE 2. SUMMARY OF SIGNIFICANT ACCOUNTING POLICIES: (continued)
O. Accounting and Financial Reporting for Pensions: (continued)
Statement 68 requires a state or local government employer (or nonemployer contributing entity in a specialfunding situation) to recognize a net pension liability measured as of a date (the measurement date) no earlierthan the end of its prior fiscal year. If a state or local government employer or nonemployer contributingentity makes a contribution to a defined benefit pension plan between the measurement date of the reportednet pension liability and the end of the government's reporting period, Statement 68 requires that thegovernment recognize its contribution as a deferred outflow of resources.
In addition, Statement 68 requires recognition of deferred outflows of resources and deferred inflows ofresources for changes in the net pension liability of a state or local government employer or nonemployercontributing entity that arise from other types of events. At transition to Statement 68, if it is not practicalfor an employer or nonemployer contributing entity to determine the amounts of all deferred outflows ofresources and deferred inflows of resources related to pensions, paragraph 137 of Statement 68 required thatbeginning balances for deferred outflows of resources and deferred inflows of resources not be reported.Consequently, if it is not practical to determine the amounts of all deferred outflows of resources anddeferred inflows of resources related to pensions, contributions made after the measurement date of thebeginning net pension liability could not have been reported as deferred outflows of resources at transition.This could have resulted in a significant understatement of an employer or nonemployer contributing entity'sbeginning net position and expense in the initial period of implementation.
This Statement amends paragraph 137 of Statement 68 to require that, at transition, a government recognizea beginning deferred outflow of resources for its pension contributions, if any, made subsequent to themeasurement date of the beginning net pension liability. Statement 68, as amended, continues to require thatbeginning balances for other deferred outflows of resources and deferred inflows of resources related topensions be reported at transition only if it is practical to determine all such amounts.
P. Fund Balances:
Fund balance is divided into five classifications based primarily on the extent to which the Board is boundto observe constraints imposed upon the resources in the governmental funds. The classifications are asfollows:
• Nonspendable fund balance includes amounts that are not in a spendable form (inventory,for example) or are required to be maintained intact (the principal of an endowment fund,for example).
-44-

Borough of Fort Lee School DistrictNotes to the Basic Financial Statementsfor the fiscal year ended June 30, 2015
NOTE 2. SUMMARY OF SIGNIFICANT ACCOUNTING POLICIES: (continued)
P. Fund Balances: (continued)
• Restricted fund balance includes amounts that can be spent only for the specific purposesstipulated by external resource providers (for example, grant providers), constitutionally,or through enabling legislation (that is, legislation that creates a new revenue source andrestricts its use). Effectively, restrictions may be changed or lifted only with the consent ofresource providers.
• Committed fund balance includes amounts that can be used only for the specific purposesdetermined by a formal action of the Board’s highest level of decision-making authority. Commitments may be changed or lifted only by the government taking the same formalaction that imposed the constraint originally.
• Assigned fund balance comprises amounts intended to be used by the Board for specificpurposes. Intent can be expressed by the governing body or by an official or body to whichthe governing body delegates the authority. In governmental funds other than the generalfund, assigned fund balance represents the amount that is not restricted or committed. Thisindicates that resources in other governmental funds are, at a minimum, intended to be usedfor the purpose of that fund.
• Unassigned fund balance is the residual classification for the general fund and includes allamounts not contained in the other classifications. Unassigned amounts are technicallyavailable for any purpose. If another governmental fund has a fund balance deficit, then itwill be reported as a negative amount in the unassigned classification in that fund. Positiveunassigned amounts will be reported only in the general fund.
Q. Net Position:
Net position represent the difference between assets and liabilities. Net position invested in capital assets,net of related debt consists of capital assets, net of accumulated depreciation, reduced by the outstandingbalances of any borrowings used for the acquisition, construction or improvement of those assets. Netposition are reported as restricted when there are limitations imposed on their use either through the enablinglegislation adopted by the Board or through external restrictions imposed by creditors, grantors or laws orregulations of other governments.
The Board applies restricted resources first when an expense is incurred for purposes for which bothrestricted and unrestricted net position are available.
-45-

Borough of Fort Lee School DistrictNotes to the Basic Financial Statementsfor the fiscal year ended June 30, 2015
NOTE 2. SUMMARY OF SIGNIFICANT ACCOUNTING POLICIES: (continued)
R. Operating Revenues and Expenses:
Operating revenues are those revenues that are generated directly from the primary activity of the proprietaryfunds. For the Board, these revenues are sales for food service. Operating expenses are necessary costsincurred to provide the good or service that is the primary activity of the fund.
S. Extraordinary and Special Items:
Extraordinary items are transactions or events that are both unusual in nature and infrequent in occurrence. Special items are transactions or events that are within the control of the Board and that are either unusualin nature or infrequent in occurrence. Neither type of transaction occurred during the fiscal year.
T. Allocation of Indirect Expenses:
The District reports all direct expenses by function in the Statement of Activities. Direct expenses are thosethat are clearly identifiable with a function. Indirect expenses are allocated to functions but are reportedseparately in the Statement of Activities. Employee benefits, including the employer’s share of socialsecurity, workers compensation, and medical and dental benefits, were not allocated. Depreciation expense,where practicable, is specifically identified by function and is included in the indirect expense column ofthe Statement of Activities. Depreciation expense that could not be attributed to a specific function isconsidered an indirect expense and is reported separately on the Statement of Activities as unallocateddepreciation. Interest on long-term debt is considered an indirect expense and is reported separately on theStatement of Activities.
U. Use of Estimates:
The preparation of financial statements in accordance with accounting principles generally accepted in theUnited States of America requires management to make estimates and assumptions that effect certainreports, amounts and disclosures. Accordingly, actual results could differ from those estimates.
V. Recent Accounting Pronouncements:
The Governmental Accounting Standards Board (GASB) issued Statement No. 68, “Accounting andFinancial Reporting for Pensions – an amendment of GASB Statement No. 27”. This statement, which iseffective for fiscal periods beginning after June 15, 2014 and was implemented by the District for the yearended June 30, 2015.
-46-

Borough of Fort Lee School DistrictNotes to the Basic Financial Statementsfor the fiscal year ended June 30, 2015
NOTE 2. SUMMARY OF SIGNIFICANT ACCOUNTING POLICIES: (continued)
V. Recent Accounting Pronouncements:(continued)
The Governmental Accounting Standards Board (GASB) issued Statement No. 71 “Pension Transition forContributions Made Subsequent to the Measurement Date-an-amendment of GASB Statement No. 68”. Theprovisions of this statement are required to be applied simultaneously with the provisions of Statement 68which is effective for periods beginning after June 15, 2014 and was implemented by the District for the yearended June 30, 2015.
The Government Accounting Standards Board issued GASB Statement No. 72, Fair Value Measurementand Application. This Statement addresses accounting and financial reporting issues related to fair valuemeasurements. The definition of fair value is the price that would be received to sell an asset or paid totransfer a liability in an orderly transaction between market participants at the measurement date. ThisStatement also provides guidance for determining a fair value measurement for financial reporting purposes. This Statement also provides guidance for applying fair value to certain investments and disclosures relatedto all fair value measurements. The District is currently reviewing what effect, if any, this Statement mighthave on future financial statements.
The Government Accounting Standards Board issued GASB Statement No. 73, Accounting and FinancialReporting for Pensions and Related Assets That Are Not Within the Scope of GASB Statement 68 andAmendments to Certain Provisions of GASB Statements 67 and 68. This Statement is effective for fiscalyears beginning after June 15, 2015 – except those provisions that address employers and governmentalnonemployer contributing entities for pensions that are not within the scope of Statement 68, which areeffective for financial statements for fiscal years beginning after June 15,2016. The District is currentlyreviewing what effect, if any, this Statement might have on future financial statements.
The Government Accounting Standards Board issued GASB Statement No. 74, Financial Reporting forPostemployment Benefit Plans Other Than Pension Plans. This Statement applies to OPEB plans andbasically parallels GASB Statement 67 and replaces GASB Statement 43 and is effective for fiscal yearsbeginning after June 15, 2016. The District is currently reviewing what effect, if any, this Statement mighthave on future financial statements.
The Government Accounting Standards Board issued GASB Statement No. 75, Accounting and FinancialReporting for Postemployment Benefits Other Than Pensions. This Statement applies to governmentemployers who provided OPEB plans to their employees and basically parallels GASB Statement 68 andreplaces GASB Statement 45. The Statement is effective for fiscal years beginning after June 15, 2017. TheDistrict is currently reviewing what effect, if any, this Statement might have on future financial statements.
-47-

Borough of Fort Lee School DistrictNotes to the Basic Financial Statementsfor the fiscal year ended June 30, 2015
NOTE 3. CASH AND CASH EQUIVALENTS AND INVESTMENTS:
Cash
Custodial Credit Risk - Deposits
Custodial credit risk is the risk that in the event of a bank failure, the government’s deposits may not bereturned to it. The District’s policy is based on New Jersey Statutes requiring cash be deposited only in NewJersey based banking institutions that participate in New Jersey Governmental Depository Protection Act(GUDPA) or in qualified investments established in New Jersey Statutes 18A:20-37 that are treated as cashequivalents. As of June 30, 2015, $46,008,153 of the District’s bank balance of $58,836,666 was exposedto custodial credit risk.
Investments
Investment Rate Risk
The District does not have a formal investment policy that limits investment maturities as a means ofmanaging its exposure to fair value losses arising from increasing interest rates. However, New JerseyStatutes 18A:20-37 limits the length of time for most investments to 397 days. As of June 30, 2015, theDistrict invested in various U.S. Treasury Bonds with maturity dates from 6 months to 4 years.
Credit Risk
New Jersey Statutes 18A:20-37 limits school district investments to those specified in the Statutes. The typeof allowance investments are Bonds of the United States of America, bonds or other obligations of theschool districts or bonds or other obligations of the local unit or units within which the school district islocated: obligations of federal agencies not exceeding 397 days; government money market mutual funds;the State of New Jersey Cash Management Plan; local government investment pools; or repurchase of fullycollateralized securities.
Concentration of Credit Risk
The District places no limit on the amount the District may invest in any one issuer.
-48-

Borough of Fort Lee School DistrictNotes to the Basic Financial Statementsfor the fiscal year ended June 30, 2015
NOTE 4. RECEIVABLES:
Receivables at June 30, 2015, consisted of accounts receivable and intergovernmental. All receivables areconsidered collectible in full. A summary of the principal items of intergovernmental receivables follows:
GovernmentalFund Financial
StatementsEnterprise
Fund
District WideFinancial
Statements
Interfunds $1,193,579 $47,644 $30,823State Aid 2,610,795 3,360 2,614,155Federal Aid 972,124 79,121 1,051,245Other 179,065 4,054 183,119Gross Receivables 4,955,563 134,179 3,879,342
Less: Allowance for Uncollectibles Total Receivables, Net $4,955,563 $134,179 $3,879,342
NOTE 5. INTERFUND BALANCE AND ACTIVITY:
Balances due to/from other funds at June 30, 2015 consist of the following:
$30,823 Due to the General Fund from the Fiduciary Funds for interest earnings and expense
reimbursements.
853,907 Due to the General Fund from the Special Revenue Fund to cover deficit in cash and
expense reimbursement.
246,903 Due to the General Fund from the Capital Projects Fund for expense reimbursement.
3,995 Due to the Cafeteria Fund from the General Fund for expense reimbursements
40,029 Due to the Cafeteria Fund from the General Fund for subsidy reimbursements.
3,620 Due to the Cafeteria Fund from the Special Revenue Fund for expense reimbursements.
12,701 Due to the Unemployment Account from the Payroll Agency Funds for employee
deductions.
237 Due to the Unemployment Account from the General Fund interest earnings.
5,000 Due to the Payroll Agency Fund from the FSA Account for expense reimbursements.
61,946 Due to the Debt Service Fund from the Capital Projects Fund for interest earnings.
$1,259,161
-49-
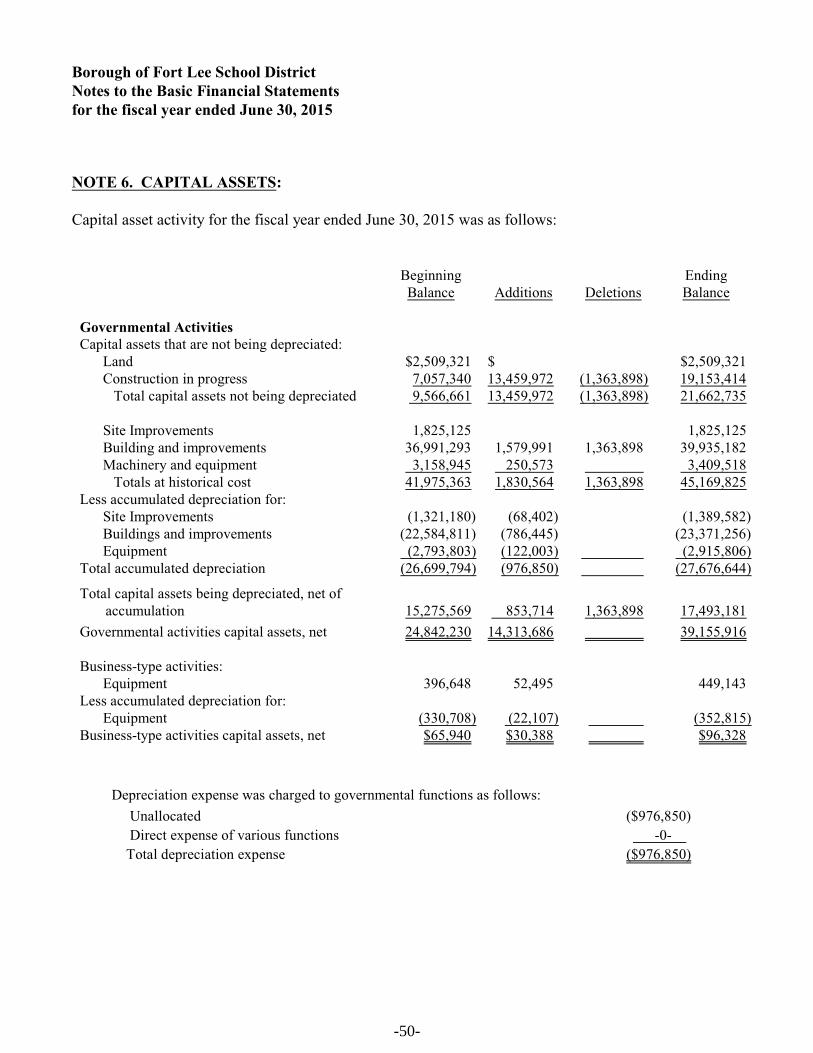
Borough of Fort Lee School DistrictNotes to the Basic Financial Statementsfor the fiscal year ended June 30, 2015
NOTE 6. CAPITAL ASSETS:
Capital asset activity for the fiscal year ended June 30, 2015 was as follows:
BeginningBalance Additions Deletions
EndingBalance
Governmental ActivitiesCapital assets that are not being depreciated:
Land $2,509,321 $ $2,509,321Construction in progress 7,057,340 13,459,972 (1,363,898) 19,153,414
Total capital assets not being depreciated 9,566,661 13,459,972 (1,363,898) 21,662,735
Site Improvements 1,825,125 1,825,125Building and improvements 36,991,293 1,579,991 1,363,898 39,935,182Machinery and equipment 3,158,945 250,573 3,409,518
Totals at historical cost 41,975,363 1,830,564 1,363,898 45,169,825Less accumulated depreciation for:
Site Improvements (1,321,180) (68,402) (1,389,582)Buildings and improvements (22,584,811) (786,445) (23,371,256)Equipment (2,793,803) (122,003) (2,915,806)
Total accumulated depreciation (26,699,794) (976,850) (27,676,644)
Total capital assets being depreciated, net of accumulation 15,275,569 853,714 1,363,898 17,493,181
Governmental activities capital assets, net 24,842,230 14,313,686 39,155,916
Business-type activities:Equipment 396,648 52,495 449,143
Less accumulated depreciation for:Equipment (330,708) (22,107) (352,815)
Business-type activities capital assets, net $65,940 $30,388 $96,328
Depreciation expense was charged to governmental functions as follows:
Unallocated ($976,850)
Direct expense of various functions -0-
Total depreciation expense ($976,850)
-50-

Borough of Fort Lee School DistrictNotes to the Basic Financial Statementsfor the fiscal year ended June 30, 2015
NOTE 7. LONG-TERM OBLIGATION ACTIVITY:
Changes in long-term obligations for the fiscal year ended June 30, 2015 were as follows:
Beginning
Balance Issued Retired
Ending
Balance
Amount Due
Within
One Year
Governmental Activities:
Bonds Payable:
General Obligation Debt $17,015,000 $49,840,000 $(665,000) $17,015,000 $685,000
Total Bonds Payable 17,015,000 49,840,000 (665,000) 17,015,000 685,000
Other Liabilities:
Net Pension Liability PERS 12,464,854 1,279,950 13,744,804
Obligations Under Capital Lease 2,248,388 5,571,444 (68,868) 7,750,964 489,130
Compensated Absences Payable 5,736,415 410,067 (433,292) 5,713,190
Total Other Liabilities 20,449,657 7,261,461 (502,160) 27,208,958 489,130
$37,464,657 $57,101,461 ($1,167,160) $93,398,958 $1,174,130
A. Bonds Payable:
Bonds are authorized in accordance with State law by the voters of the municipality through referendums. All bonds are retired in serial installments within the statutory period of usefulness. Bonds issued by theBoard are general obligation bonds.
Outstanding bonds payable at June 30, 2015 consisted of the following:
PrincipalIssue Interest Dat of Balance
Issue Date Rates Maturity June 30, 2015
BCIA Improvement Bonds 8/7/2012 2.00%-5.00% 11/1/2031 $16,350,000General Serial Bonds 4/7/2015 3.00%-3.500% 3/15/2041 49,840,000
$66,190,000
-51-

Borough of Fort Lee School DistrictNotes to the Basic Financial Statementsfor the fiscal year ended June 30, 2015
NOTE 7. LONG-TERM OBLIGATION ACTIVITY: (continued)
Principal and interest due on bonds outstanding is as follows:
Year EndingJune 30, Total Principal Interest
2016 $2,850,869 $685,000 $2,165,8692017 4,513,012 2,270,000 2,243,0122018 4,290,888 2,120,000 2,170,8882019 4,274,387 2,175,000 2,099,3872020 4,255,112 2,230,000 2,025,112
2020-2024 21,384,163 12,500,000 8,884,1632021-2025 21,470,087 14,975,000 6,495,087
2026-2030 17,501,813 13,560,000 3,941,813
2031-2035 14,760,325 12,895,000 1,865,325
2036-2040 2,877,300 2,780,000 97,300
$98,177,956 $66,190,000 $31,987,956
B. Bonds Authorized But Not Issued:
As of June 30, 2015 the Board has no authorized but not issued bonds.
C. Capital Leases:
The District is leasing various equipment and temporary classroom trailers under capital leases. The capitalleases are for terms of five years and fifteen years. The following is a schedule of future minimum leasepayments under these capital leases, and the present value of the net minimum lease payments at June 30,2015:
Year EndingJune 30, Total Principal Interest
2016 $660,788 $489,130 $171,658
2017 945,502 783,539 161,9632018 969,129 822,525 146,6042019 849,083 718,283 130,8002020 632,242 514,859 117,383
2021-2025 2,137,107 1,674,916 462,1912026-2030 2,431,813 2,206,896 224,917
2031 551,111 540,816 10,295$9,176,775 $7,750,964 $1,425,811
Total minimum lease payments $9,176,775Less: Amount representing interest (1,425,811)
Present value of lease payments $7,750,964
-52-

Borough of Fort Lee School DistrictNotes to the Basic Financial Statementsfor the fiscal year ended June 30, 2015
NOTE 8. OPERATING LEASES:
The District is leasing certain office equipment and office space under operating leases that expire from 2015through 2019. Total operating lease payments made during the year ended June 30, 2015 were $362,957. Future minimum lease payments are as follows:
Year Ending June 30, Amount2016 $245,7082017 176,7882018 95,8682019 95,868
$614,232
NOTE 9. PENSION PLANS:
Description of Plans - All required employees of the District are covered by either the Public Employees'Retirement System or the Teachers' Pension and Annuity Fund which have been established by state statuteand are administered by the New Jersey Division of Pension and Benefits (Division). According to the Stateof New Jersey Administrative Code, all obligations of both Systems will be assumed by the State of NewJersey should the Systems terminate. The Division issues a publicly available financial report that includesthe financial statements and required supplementary information for the Public Employees Retirement Systemand the Teachers' Pension and Annuity Fund. These reports may be obtained by writing to the Division ofPensions and Benefits, PO Box 295, Trenton, New Jersey, 08625 or reports can be accessed on the internetat: http://www.state.nj.us/treasury/pensions/annrpts_archive.htm.
Teachers' Pension and Annuity Fund (TPAF) - The Teachers' Pension and Annuity Fund was establishedas of January 1, 1955, under the provisions of N.J.S.A. 18A:66 to provide retirement benefits, death,disability and medical benefits to certain qualified members. The Teachers' Pension and Annuity Fund isconsidered a cost-sharing multiple-employer plan with a special funding situation, as under current statute,all employer contributions are made by the State of New Jersey on behalf of the District and the system'sother related non-contributing employers. Membership is mandatory for substantially all teachers or membersof the professional staff certified by the State Board of Examiners, and employees of the Department ofEducation who have titles that are unclassified, professional and certified.
Public Employees' Retirement System (PERS) - The Public Employees' Retirement System (PERS) wasestablished as of January 1, 1955 under the provisions of N.J.S.A. 43:15A to provide retirement, death,disability and medical benefits to certain qualified members. The Public Employees' Retirement System isa cost-sharing multiple-employer plan. Membership is mandatory for substantially all full-time employeesof the State of New Jersey or any county, municipality, school district, or public agency, provided theemployee is not required to be a member of another state-administered retirement system or other state orlocal jurisdiction.
-53-
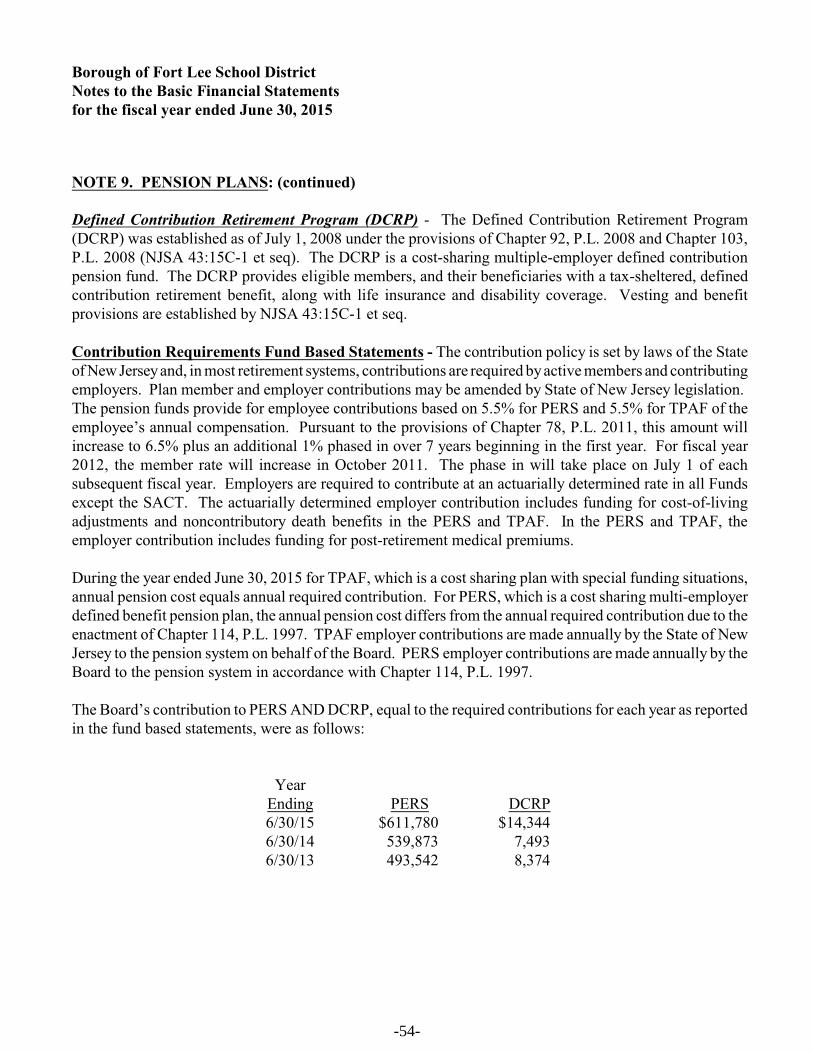
Borough of Fort Lee School DistrictNotes to the Basic Financial Statementsfor the fiscal year ended June 30, 2015
NOTE 9. PENSION PLANS: (continued)
Defined Contribution Retirement Program (DCRP) - The Defined Contribution Retirement Program(DCRP) was established as of July 1, 2008 under the provisions of Chapter 92, P.L. 2008 and Chapter 103,P.L. 2008 (NJSA 43:15C-1 et seq). The DCRP is a cost-sharing multiple-employer defined contributionpension fund. The DCRP provides eligible members, and their beneficiaries with a tax-sheltered, definedcontribution retirement benefit, along with life insurance and disability coverage. Vesting and benefitprovisions are established by NJSA 43:15C-1 et seq.
Contribution Requirements Fund Based Statements - The contribution policy is set by laws of the Stateof New Jersey and, in most retirement systems, contributions are required by active members and contributingemployers. Plan member and employer contributions may be amended by State of New Jersey legislation. The pension funds provide for employee contributions based on 5.5% for PERS and 5.5% for TPAF of theemployee’s annual compensation. Pursuant to the provisions of Chapter 78, P.L. 2011, this amount willincrease to 6.5% plus an additional 1% phased in over 7 years beginning in the first year. For fiscal year2012, the member rate will increase in October 2011. The phase in will take place on July 1 of eachsubsequent fiscal year. Employers are required to contribute at an actuarially determined rate in all Fundsexcept the SACT. The actuarially determined employer contribution includes funding for cost-of-livingadjustments and noncontributory death benefits in the PERS and TPAF. In the PERS and TPAF, theemployer contribution includes funding for post-retirement medical premiums.
During the year ended June 30, 2015 for TPAF, which is a cost sharing plan with special funding situations,annual pension cost equals annual required contribution. For PERS, which is a cost sharing multi-employerdefined benefit pension plan, the annual pension cost differs from the annual required contribution due to theenactment of Chapter 114, P.L. 1997. TPAF employer contributions are made annually by the State of NewJersey to the pension system on behalf of the Board. PERS employer contributions are made annually by theBoard to the pension system in accordance with Chapter 114, P.L. 1997.
The Board’s contribution to PERS AND DCRP, equal to the required contributions for each year as reportedin the fund based statements, were as follows:
YearEnding PERS DCRP6/30/15 $611,780 $14,3446/30/14 539,873 7,4936/30/13 493,542 8,374
-54-

Borough of Fort Lee School DistrictNotes to the Basic Financial Statementsfor the fiscal year ended June 30, 2015
NOTE 9. PENSION PLANS: (continued)
The State of New Jersey contribution to TPAF (paid on-behalf of the District) for normal and post retirementbenefits have been included in the fund-based statements as revenues and expenditures in accordance withGASB 24, paragraphs 7 through 13, as follows:
YearEnding
PensionContributions
Post-RetirementMedical
ContributionsNCGI
Premium6/30/15 $1,331,038 $2,265,047 $95,7626/30/14 985,815 1,759,038 87,0156/30/13 1,607,674 1,913,519 84,586
In addition, the post-retirement medical benefits are included in the district-wide financial statements.
Also, in accordance with N.J.S.A. 18A:66-66 the State of New Jersey reimbursed the Board $1,870,506during the year ended June 30, 2015 for the employer’s share of social security contributions for TPAFmembers as calculated on their base salaries. This amount has been included in the fund-based statementsas revenues and expenditures in accordance with GASB 24, paragraphs 7 through 13.
ACCOUNTING AND FINANCIAL REPORTING FOR PENSION IN THE DISTRICT-WIDESTATEMENTS PER - GASB NO. 68
Public Employees Retirement System (PERS)
At June 30, 2015, the District reported a liability of $13,744,804 for its proportionate share of the net pensionliability. The net pension liability was measured as of June 30, 2014, and the total pension liability used tocalculate the net pension liability was determined by an actuarial valuation as of that date. The District'sproportion of the net pension liability was based on a projection of the District's long-term share ofcontributions to the pension plan relative to the projected contributions of all participating school districts,actuarially determined. At June 30, 2014, the District's proportion was .0734123712 percent, which was anincrease of .0000819229 percent from its proportion measured as of June 30, 2013.
-55-

Borough of Fort Lee School DistrictNotes to the Basic Financial Statementsfor the fiscal year ended June 30, 2015
NOTE 9. PENSION PLANS: (continued)
For the year ended June 30, 2015, the District recognized pension expense of $949,470. At June 30, 2015,the District reported deferred outflows of resources and deferred inflows of resources related to PERS fromthe following sources:
DeferredOutflows ofResources
DeferredInflows ofResources
Changes of assumptions $432,210 $ Net difference between projected and actual earnings on pension plan investments 819,116Changes in proportion and differences between District contributions and proportionate share of contributions 1,322,587District contributions subsequent to the measurement date 621,678
Total $2,376,475 $819,116
The $621,678 reported as deferred outflows of resources related to pensions resulting from school districtcontributions subsequent to the measurement date (i.e. for the school year ending June 30, 2015, the planmeasurement date is June 30, 2014) will be recognized as a reduction of the net pension liability in the yearended June 30, 2016. Other amounts reported as deferred outflows of resources and deferred inflows ofresources related to pensions will be recognized in pension expense as follows:
Year ended June 30:2016 $(125,328)2017 (125,328)2018 (125,328)2019 79,450
Thereafter 34,958
-56-

Borough of Fort Lee School DistrictNotes to the Basic Financial Statementsfor the fiscal year ended June 30, 2015
NOTE 9. PENSION PLANS: (continued)
Additional Information
Local Group Collective balances at December 31, 2014 and 2013 are as follows:
Dec. 31, 2014 Dec. 31, 2013
Collective deferred outflows of resources $952,194,675 Not Available
Collective deferred inflows of resources 1,479,224,662 Not Available
Collective net pension liability18,722,735,003 19,111,986,911
District's Proportion .0734123712% .0652200824%
Actuarial Assumptions
The total pension liability for the June 30, 2014 measurement date was determined by an actuarial valuationas of July 1, 2013, which rolled forward to June 30, 2014. The total pension liability for the July 1, 2013measurement date was determined by an actuarial valuation as of July 1, 2013. This actuarial valuation usedthe following assumptions, applied to all periods in the measurement.
Inflation 3.01 PercentSalary Increases: 2012-2021 2.15-4.40 Percent (based on age) Thereafter 3.15-5.40 Percent (based on age)
Investment Rate of Return 7.90 Percent
The actuarial assumptions used in the June 30, 2013 valuation were based on the results of an actuarialexperience study for the period July 1, 2008 to June 30, 2011.
Mortality Rates
Mortality rates were based on the RP-2000 Combined Healthy Male and Female Mortality Tables (setbackone year for females) with adjustments for mortality improvements from the base year of 2012 based onProjection Scale AA.
-57-

Borough of Fort Lee School DistrictNotes to the Basic Financial Statementsfor the fiscal year ended June 30, 2015
NOTE 9. PENSION PLANS: (continued)
Long-Term Rate of Return
In accordance with State statute, the long-term expected rate of return on plan investments is determined bythe State Treasurer, after consultation with the Directors of the Division of Investments and Division ofPensions and Benefits, the board of trustees and the actuaries. Best estimates of arithmetic real rates of returnfor each major asset class included in PERS's target asset allocation as of June 30, 2014 are summarized inthe following table:
Asset ClassTarget
Allocation
Long-TermExpected RealRate of Return
Cash 6.00% 0.80%Core Bond 1.00% 2.49%Intermediate Term Bonds 11.20% 2.26%Mortgages 2.50% 2.17%High Yield Bonds 5.50% 4.82%Inflation Indexed Bonds 2.50% 3.51%Broad U.S. Equities 25.90% 8.22%Developed Foreign Markets 12.70% 8.12%Emerging Market Equities 6.50% 9.91%Private Equity 8.25% 13.02%Hedge Funds/Absolute Returns 12.25% 4.92%Real Estate (Property) 3.20% 5.80%Commodities 2.50% 5.35%
100.00%
Discount Rate
The discount rate used to measure the total pension liability was 5.39% and 5.55% as of June 30, 2014 and2013, respectively. This single blended discount rate was based on the long-term expected rate of return onpension plan investments of 7.9%, and a municipal bond rate of 4.29% and 4.63% as of June 30, 2014and 2013, respectively, based on the Bond Buyer Go 20-Bond Municipal Bond Index which includes tax-exempt general obligation municipal bonds with an average rating of AA/Aa or higher. The projection of cashflows used to determine the discount rate assumed that contributions from plan members will be made at thecurrent member contribution rates and that contributions from employers will be made based on the averageof the last five years of contributions made in relation to the last five years of recommended contributions.Based on those assumptions, the plan's fiduciary net position was projected to be available to make projectedfuture benefit payments of current plan members through 2033. Therefore, the long-term expected rate ofreturn on plan investments was applied to projected benefit payments through 2033, and the municipal bondrate was applied to projected benefit payments after that date in determining the total pension liability.
-58-

Borough of Fort Lee School DistrictNotes to the Basic Financial Statementsfor the fiscal year ended June 30, 2015
NOTE 9. PENSION PLANS: (continued)
Sensitivity of the Collective Net Pension Liability to Changes in the Discount Rate
The following presents the collective net pension liability of the participating employers as of June 30, 2014respectively, calculated using the discount rate as disclosed above as well as what the collective net pensionliability would be if it was calculated using a discount rate that is 1 -percentage point lower or 1- percentage-point higher than the current rate:
June 30, 2014 1%
Decrease4.39%
At CurrentDiscount Rate
5.39%
1%Increase6.39%
District's proportionate share of the pension liability $17,291,431 $13,744,804 $10,766,539
Pension Plan Fiduciary Net Position
Detailed information about the pension plan’s fiduciary net position is available in the separately issuedFinancial Report for the State of New Jersey Public Employees Retirement System (PERS).
Teachers Pensions and Annuity Fund (TPAF)
The employer contributions for local participating employers are legally required to be funded by the Statein accordance with N.J.S.A 18:66-33. Therefore, these local participating employers are considered to be ina special funding situation as defined by GASB Statement No. 68 and the State is treated as a nonemployercontributing entity. Since the local participating employers do not contribute directly to the plan (except foremployer specific financed amounts), there is no net pension liability or deferred outflows or inflows to reportin the financial statements of the local participating employers. However, the notes to the financial statementsof the local participating employers must disclose the portion of the nonemployer contributing entities' totalproportionate share of the net pension liability that is associated with the local participating employer.
The portion of the TPAF Net Pension Liability that was associated with the District recognized at June 30,2015 was as follows:
Net Pension Liability:District's proportionate share $ -0- State's proportionate share
associated with the District 135,540,690
$135,540,690
-59-

Borough of Fort Lee School DistrictNotes to the Basic Financial Statementsfor the fiscal year ended June 30, 2015
NOTE 9. PENSION PLANS: (continued)
The net pension liability was measured as of June 30, 2014, and the total pension liability used to calculatethe net pension liability was determined by an actuarial valuation as of June 30, 2013. The net pensionliability associated with the District was based on a projection of the District's long-term share ofcontributions to the pension plan relative to the projected contributions of all participating school districtsand the State, actuarially determined. At June 30, 2014, the proportion of the TPAF net pension liabilityassociated with the District was .2535995199%.
For the year ended June 30, 2015, the District recognized on-behalf pension expense and revenue of$7,293,362 for contributions provided by the State in the District-Wide Financial Statements.
Actuarial Assumptions
The total pension liability for the June 30, 2014 measurement date was determined by an actuarial valuationas of July 1, 2013, which was rolled forward to June 30, 2014. The total pension liability for the June 30,2013 measurement date was determined by an actuarial valuation as of July 1, 2013. This actuarial valuationused the following actuarial assumptions, applied to all periods in the measurement:
Inflation rate 2.50%Salary Increases: 2012-2021 Varies based on experience Thereafter Varies based on experience
Investment Rate of Return 7.90%
Mortality Rates
Mortality rates were based on the RP-2000 Health Annuitant Mortality Table for Males or Females, asappropriate, with adjustments for mortality improvements based on Scale AA. Pre-retirement mortalityimprovements for active members are projected using Scale AA from the base year of 2000 until thevaluation date plus 15 years to account for future mortality improvement. Post-retirement mortalityimprovements for non-disabled annuitants are projected using Scale AA from the base year of 2000 for malesand 2003 for females until the valuation date plus 7 years to account for future mortality improvement. Theactuarial assumptions used in the July 1, 2013 valuation were based on the results of an actuarial experiencestudy for the period July 1, 2009 to June 30, 2012.
-60-

Borough of Fort Lee School DistrictNotes to the Basic Financial Statementsfor the fiscal year ended June 30, 2015
NOTE 9. PENSION PLANS: (continued)
Long-Term Expected Rate of Return
In accordance with State statute, the long-term expected rate of return on plan investments is determined bythe State Treasurer, after consultation with the Directors of the Division of Investments and Division ofPensions and Benefits, the board of trustees and the actuaries. Best estimates of arithmetic real rates of returnfor each major asset class included in TPAF's target asset allocation as of June 30, 2014 are summarized inthe table on the following page:
Asset ClassTarget
Allocation
Long-TermExpected RealRate of Return
Cash 6.00% 0.50%Core Fixed Income 0.00% 2.19%Core Bonds 1.00% 1.38%Short-Term Bonds 0.00% 1.00%Intermediate-Term Bonds 11.20% 2.60%Long-Term Bonds 0.00% 3.23%Mortgages 2.50% 2.84%High Yield Bonds 5.50% 4.15%Non-US Fixed Income 0.00% 1.41%Inflation-Indexed Bonds 2.50% 1.30%Broad US Equities 25.90% 5.88%Large Cap US Equities 0.00% 5.62%Mid Cap US Equities 0.00% 6.39%Small Cap US Equities 0.00% 7.39%Developed Foreign Equities 12.70% 6.05%Emerging Market Equities 6.50% 8.90%Private Equity 8.25% 9.15%Hedge Funds Absolute Return 12.25% 3.85%Real Estate (Property) 3.20% 4.43%Real Estate (REITS) 0.00% 5.58%Commodities 2.50% 3.60%Long Credit Bonds 0.00% 3.74%
100.00%
Discount Rate
The discount rate used to measure the total pension liability was 4.68% and 4.95% as of June 30, 2014 and2013, respectively. This single blended discount rate was based on the long-term expected rate of return onpension plan investments of 7.9%, and a municipal bond rate of 4.29% and 4.63% as of June 30, 2014and 2013, respectively, based on the Bond Buyer Go 20-Bond Municipal Bond Index which includes tax-exempt general obligation municipal bonds with an average rating of AA/Aa or higher. The projection of cashflows used to determine the discount rate assumed that contributions from plan members will be made
-61-
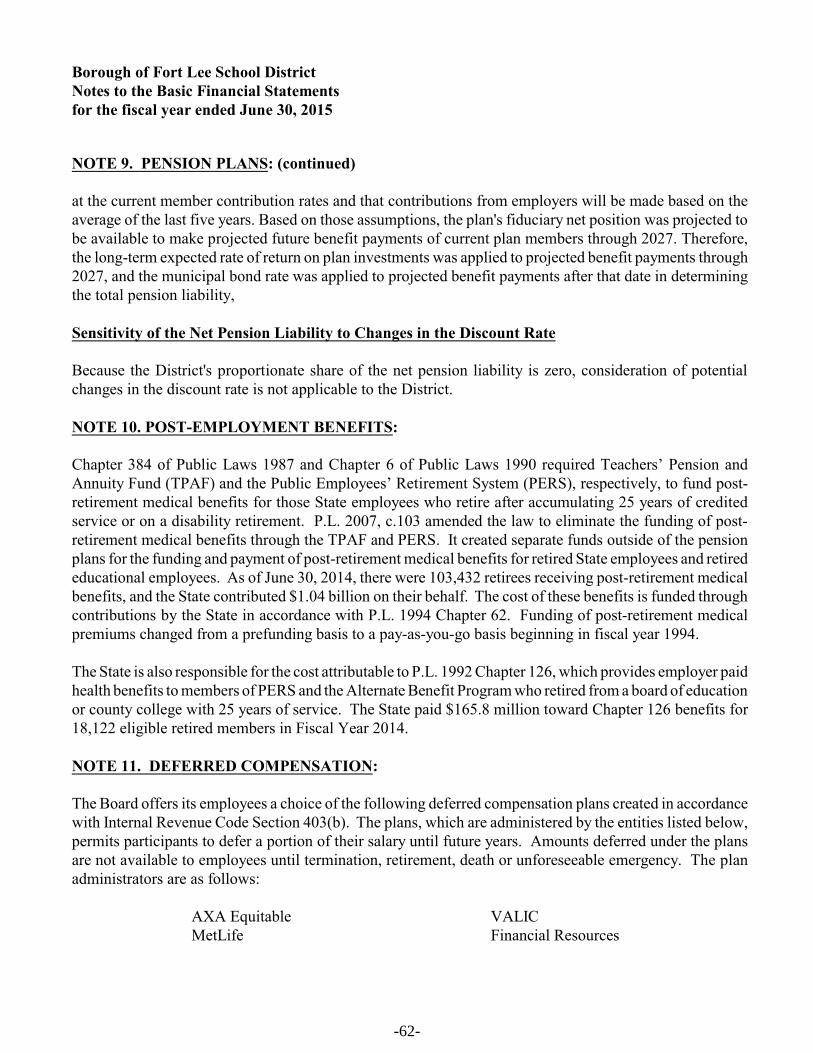
Borough of Fort Lee School DistrictNotes to the Basic Financial Statementsfor the fiscal year ended June 30, 2015
NOTE 9. PENSION PLANS: (continued)
at the current member contribution rates and that contributions from employers will be made based on theaverage of the last five years. Based on those assumptions, the plan's fiduciary net position was projected tobe available to make projected future benefit payments of current plan members through 2027. Therefore,the long-term expected rate of return on plan investments was applied to projected benefit payments through2027, and the municipal bond rate was applied to projected benefit payments after that date in determiningthe total pension liability, Sensitivity of the Net Pension Liability to Changes in the Discount Rate
Because the District's proportionate share of the net pension liability is zero, consideration of potentialchanges in the discount rate is not applicable to the District.
NOTE 10. POST-EMPLOYMENT BENEFITS:
Chapter 384 of Public Laws 1987 and Chapter 6 of Public Laws 1990 required Teachers’ Pension andAnnuity Fund (TPAF) and the Public Employees’ Retirement System (PERS), respectively, to fund post-retirement medical benefits for those State employees who retire after accumulating 25 years of creditedservice or on a disability retirement. P.L. 2007, c.103 amended the law to eliminate the funding of post-retirement medical benefits through the TPAF and PERS. It created separate funds outside of the pensionplans for the funding and payment of post-retirement medical benefits for retired State employees and retirededucational employees. As of June 30, 2014, there were 103,432 retirees receiving post-retirement medicalbenefits, and the State contributed $1.04 billion on their behalf. The cost of these benefits is funded throughcontributions by the State in accordance with P.L. 1994 Chapter 62. Funding of post-retirement medicalpremiums changed from a prefunding basis to a pay-as-you-go basis beginning in fiscal year 1994.
The State is also responsible for the cost attributable to P.L. 1992 Chapter 126, which provides employer paidhealth benefits to members of PERS and the Alternate Benefit Program who retired from a board of educationor county college with 25 years of service. The State paid $165.8 million toward Chapter 126 benefits for18,122 eligible retired members in Fiscal Year 2014.
NOTE 11. DEFERRED COMPENSATION:
The Board offers its employees a choice of the following deferred compensation plans created in accordancewith Internal Revenue Code Section 403(b). The plans, which are administered by the entities listed below,permits participants to defer a portion of their salary until future years. Amounts deferred under the plansare not available to employees until termination, retirement, death or unforeseeable emergency. The planadministrators are as follows:
AXA Equitable VALICMetLife Financial Resources
-62-

Borough of Fort Lee School DistrictNotes to the Basic Financial Statementsfor the fiscal year ended June 30, 2015
NOTE 12. RISK MANAGEMENT:
The District is exposed to various risks of loss related to torts; theft of, damage to, and destruction of assets;errors and omissions; injuries to employees; and natural disasters.
Property and Liability Insurance - The District maintains commercial insurance coverage for property,liability, student accident and surety bonds. A complete schedule of insurance coverage can be found in theStatistical Section of this Comprehensive Annual Financial Report.
There has been no significant reduction in insurance coverage from the previous year nor have there been anysettlements in excess of insurance coverages.
New Jersey Unemployment Compensation Insurance - The District has elected to fund its New JerseyUnemployment Compensation Insurance under the “Benefit Reimbursement Method”. Under this plan, theDistrict is required to reimburse the New Jersey Unemployment Trust Fund for benefits paid to its formeremployees and charged to its account with the State. The District is billed quarterly for amounts due to theState. The following is a summary of District contributions, employee contributions, reimbursements to theState for benefits paid and the ending balance of the District’s expendable trust fund for the current andprevious two years:
Fiscal Year
Interest Earnings/District
ContributionsEmployee
ContributionsAmount
ReimbursedEndingBalance
2014-2015 $237 $48,768 $102,874 $323,4722013-2014 246 49,392 109,341 377,3412012-2013 336 47,978 70,676 437,044
NOTE 13. CAPITAL RESERVE ACCOUNT:
A capital reserve account was established by the Borough of Fort Lee Board of Education by inclusion of$960,000 in the 1999 budget for the accumulation of funds for use as capital outlay expenditures insubsequent fiscal years. The capital reserve account is maintained in the general fund and its activity isincluded in the general fund annual budget. There existed a balance of $1,541,656 in the capital reserveaccount at June 30, 2015.
Funds placed in the capital reserve account are restricted to capital projects in the district’s approved LongRange Facilities Plan (LRFP). Upon submission of the LRFP to the department, a district may increase thebalance in the capital reserve by appropriating funds in the annual general fund budget certified for taxes orby transfer by board resolution at year end of any unanticipated revenue or unexpended line-itemappropriation amounts, or both. A district may also appropriate additional amount when the express approvalof the voters has been obtained either by a separate proposal at budget time or by a special question at oneof the four special elections authorized pursuant to N.J.S.A. 19:60-2. Pursuant to N.J.A.C. 6A:23A-14.1(g),the balance in the account cannot at any time exceed the local support costs of uncompleted capital projectsin its approved LRFP.
-63-
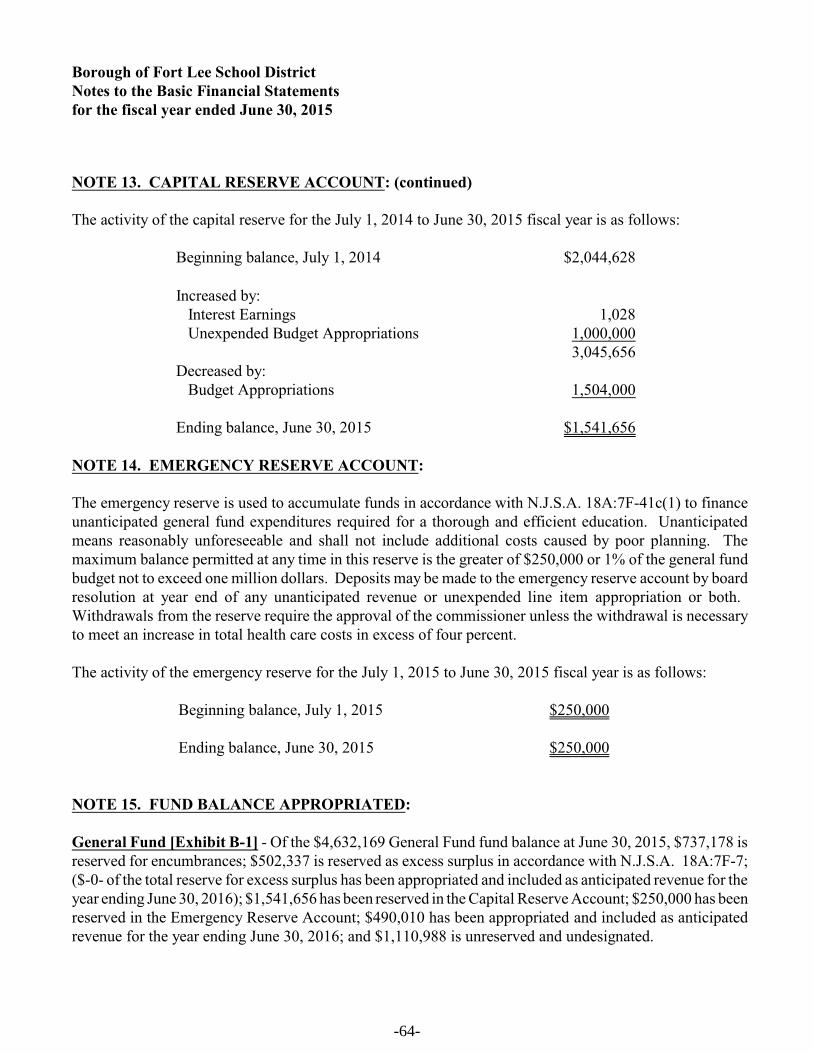
Borough of Fort Lee School DistrictNotes to the Basic Financial Statementsfor the fiscal year ended June 30, 2015
NOTE 13. CAPITAL RESERVE ACCOUNT: (continued)
The activity of the capital reserve for the July 1, 2014 to June 30, 2015 fiscal year is as follows:
Beginning balance, July 1, 2014 $2,044,628
Increased by: Interest Earnings 1,028 Unexpended Budget Appropriations 1,000,000
3,045,656Decreased by: Budget Appropriations 1,504,000
Ending balance, June 30, 2015 $1,541,656
NOTE 14. EMERGENCY RESERVE ACCOUNT:
The emergency reserve is used to accumulate funds in accordance with N.J.S.A. 18A:7F-41c(1) to financeunanticipated general fund expenditures required for a thorough and efficient education. Unanticipatedmeans reasonably unforeseeable and shall not include additional costs caused by poor planning. Themaximum balance permitted at any time in this reserve is the greater of $250,000 or 1% of the general fundbudget not to exceed one million dollars. Deposits may be made to the emergency reserve account by boardresolution at year end of any unanticipated revenue or unexpended line item appropriation or both. Withdrawals from the reserve require the approval of the commissioner unless the withdrawal is necessaryto meet an increase in total health care costs in excess of four percent.
The activity of the emergency reserve for the July 1, 2015 to June 30, 2015 fiscal year is as follows:
Beginning balance, July 1, 2015 $250,000
Ending balance, June 30, 2015 $250,000
NOTE 15. FUND BALANCE APPROPRIATED:
General Fund [Exhibit B-1] - Of the $4,632,169 General Fund fund balance at June 30, 2015, $737,178 isreserved for encumbrances; $502,337 is reserved as excess surplus in accordance with N.J.S.A. 18A:7F-7;($-0- of the total reserve for excess surplus has been appropriated and included as anticipated revenue for theyear ending June 30, 2016); $1,541,656 has been reserved in the Capital Reserve Account; $250,000 has beenreserved in the Emergency Reserve Account; $490,010 has been appropriated and included as anticipatedrevenue for the year ending June 30, 2016; and $1,110,988 is unreserved and undesignated.
-64-
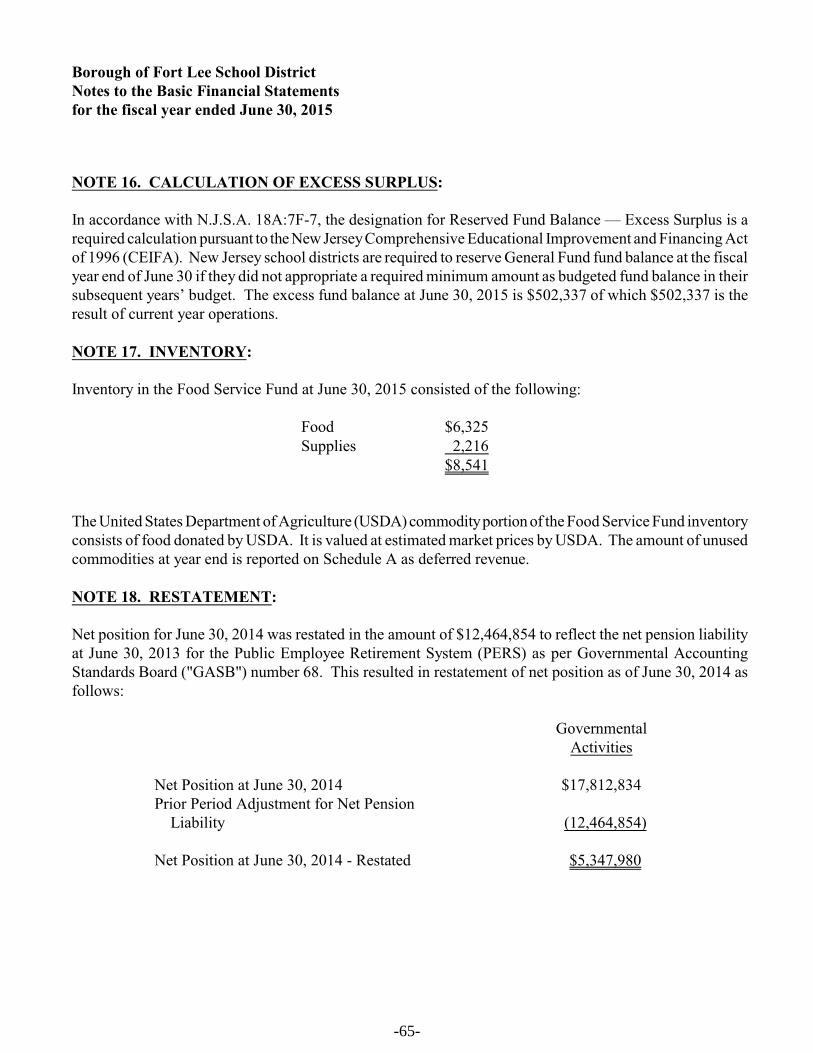
Borough of Fort Lee School DistrictNotes to the Basic Financial Statementsfor the fiscal year ended June 30, 2015
NOTE 16. CALCULATION OF EXCESS SURPLUS:
In accordance with N.J.S.A. 18A:7F-7, the designation for Reserved Fund Balance — Excess Surplus is arequired calculation pursuant to the New Jersey Comprehensive Educational Improvement and Financing Actof 1996 (CEIFA). New Jersey school districts are required to reserve General Fund fund balance at the fiscalyear end of June 30 if they did not appropriate a required minimum amount as budgeted fund balance in theirsubsequent years’ budget. The excess fund balance at June 30, 2015 is $502,337 of which $502,337 is theresult of current year operations.
NOTE 17. INVENTORY:
Inventory in the Food Service Fund at June 30, 2015 consisted of the following:
Food $6,325Supplies 2,216
$8,541
The United States Department of Agriculture (USDA) commodity portion of the Food Service Fund inventoryconsists of food donated by USDA. It is valued at estimated market prices by USDA. The amount of unusedcommodities at year end is reported on Schedule A as deferred revenue.
NOTE 18. RESTATEMENT:
Net position for June 30, 2014 was restated in the amount of $12,464,854 to reflect the net pension liabilityat June 30, 2013 for the Public Employee Retirement System (PERS) as per Governmental AccountingStandards Board ("GASB") number 68. This resulted in restatement of net position as of June 30, 2014 asfollows:
GovernmentalActivities
Net Position at June 30, 2014 $17,812,834Prior Period Adjustment for Net Pension Liability (12,464,854)
Net Position at June 30, 2014 - Restated $5,347,980
-65-

Borough of Fort Lee School DistrictNotes to the Basic Financial Statementsfor the fiscal year ended June 30, 2015
NOTE 19. CONTINGENT LIABILITIES:
Grant Programs - The school district participates in federally assisted grant programs. These programs aresubject to program compliance audits by the grantors or their representatives. The school district ispotentially liable for expenditures which may be disallowed pursuant to the terms of these grant programs. Management is not aware of any material items of noncompliance which would result in the disallowanceof program expenditures.
Litigation - The District is a party defendant in some lawsuits, none of a kind unusual for a school districtof its size and scope of operation. In the opinion of the Board's Attorney the potential claims against theDistrict not covered by insurance policies would not materially affect the financial condition of the District.
NOTE 20. SUBSEQUENT EVENTS:
The District has evaluated subsequent events through November 17, 2015, the date which the financialstatements were available to be issued and no other items were noted for disclosure.
-66-

REQUIRED SUPPLEMENTARY
INFORMATION - PART II

BUDGETARY COMPARISON SCHEDULES

Page 1 of 6
Exhibit C-1
BudgetOriginal Transfers/ Final VarianceBudget Adjustments Budget Actual Final to Actual
REVENUES:General Fund:
Revenues from Local Sources: Local Tax Levy 55,438,424 55,438,424 55,438,424Tuition 20,000 (20,000) 43,650 Interest Earned on Capital Reserve Funds 50 (50) 1,028 1,028 Unrestricted Miscellaneous Revenues 88,730 (7,830) 80,900 361,823 280,923Total - Local Sources 55,547,204 (27,880) 55,519,324 55,844,925 325,601Revenues from State Sources:
Categorical Special Education Aid 1,797,805 1,797,805 1,797,805Categorical Security Aid 91,765 91,765 91,765Categorical Transportation Aid 79,344 79,344 79,344Extraordinary Aid 650,000 650,000 660,610 10,610Other State Aid 77,540 77,540 77,540Non-Public Transportation Aid 26,280 26,280
On-behalf TPAF Post-Retirement Medical (non-budgeted) 2,265,047 2,265,047On-behalf TPAF Pension (non-budgeted) 1,331,038 1,331,038On-behalf TPAF NCGI Premium (non-budgeted) 95,762 95,762Reimbursed TPAF Social Security Contributions (non-budgeted) 1,870,506 1,870,506Total - State Sources 2,696,454 2,696,454 8,295,697 5,599,243Revenues from Federal Sources:
Special Education Medicaid Initiative 27,880 27,880 (27,880)Total - Federal Sources 27,880 27,880 (27,880)
TOTAL REVENUES 58,243,658 58,243,658 64,140,622 5,896,964
EXPENDITURES:Current Expense:Regular Programs - Instruction
Kindergarten - Salaries of Teachers 1,309,839 (15,153) 1,294,686 1,270,057 24,629Grades 1-5 - Salaries of Teachers 7,397,069 212,706 7,609,775 7,607,287 2,488Grades 6-8 - Salaries of Teachers 3,890,460 125,844 4,016,304 3,959,218 57,086Grades 9-12 - Salaries of Teachers 4,976,945 (278,751) 4,698,194 4,697,047 1,147
Regular Programs - Home Instruction:Salaries of Teachers 107,000 18,000 125,000 111,975 13,025Purchased Professional-Educational Services 10,000 4,000 14,000 10,046 3,954
Regular Programs - Undistributed InstructionOther Salaries for Instruction 844,239 (197,100) 647,139 645,683 1,456Purchased Professional - Educational Services 4,000 138,425 142,425 64,040 78,385Purchased Technical Services 34,500 8,000 42,500 40,793 1,707Other Purchased Services (400-500 series) 210,900 20,057 230,957 202,076 28,881General Supplies 882,482 293,177 1,175,659 847,591 328,068Textbooks 562,640 (280,542) 282,098 121,975 160,123Other Objects 16,000 900 16,900 15,326 1,574TOTAL REGULAR PROGRAMS - INSTRUCTION 20,246,074 49,563 20,295,637 19,593,114 702,523
SPECIAL EDUCATION - INSTRUCTIONLearning and/or Language Disabilities
Salaries of Teachers 269,233 13,810 283,043 282,102 941Other Salaries for Instruction 281,807 (94,083) 187,724 177,380 10,344General Supplies 2,500 (2,000) 500 301 199
Total Learning and/or Language Disabilities 553,540 (82,273) 471,267 459,783 11,484Resource Room/Resource Center:
Salaries of Teachers 1,562,411 (203,410) 1,359,001 1,350,430 8,571Other Salaries for Instruction 15,477 1,100 16,577 13,380 3,197General Supplies 10,000 (5,000) 5,000 3,043 1,957
Total Resource Room/Resource Center 1,587,888 (207,310) 1,380,578 1,366,853 13,725Autism
Salaries of Teachers 241,460 1,050 242,510 238,513 3,997Other Salaries for Instruction 335,929 (88,200) 247,729 245,784 1,945General Supplies 3,600 (1,250) 2,350 2,200 150
Total Autism 580,989 (88,400) 492,589 486,497 6,092Preschool Disabilities- Full-Time:
Salaries of Teachers 236,301 58,700 295,001 294,853 148Other Salaries for Instruction 233,837 15,499 249,336 245,376 3,960General Supplies 9,900 9,900 4,278 5,622
Total Preschool Disabilities - Full-Time 480,038 74,199 554,237 544,507 9,730TOTAL SPECIAL EDUCATION - INSTRUCTION 3,202,455 (303,784) 2,898,671 2,857,640 41,031
FORT LEE BOARD OF EDUCATIONBudgetary Comparison Schedule
General FundFiscal Year Ended June 30, 2015
-67-

Page 2 of 6
Exhibit C-1
BudgetOriginal Transfers/ Final VarianceBudget Adjustments Budget Actual Final to Actual
FORT LEE BOARD OF EDUCATIONBudgetary Comparison Schedule
General FundFiscal Year Ended June 30, 2015
Basic Skills/Remedial - InstructionSalaries of Teachers 843,555 (93,320) 750,235 749,259 976General Supplies 3,000 (3,000)
Total Basic Skills/Remedial - Instruction 846,555 (96,320) 750,235 749,259 976Bilingual Education - Instruction
Salaries of Teachers 1,341,564 44,778 1,386,342 1,385,728 614Other Purchased Services (400-500 series) 100 200 300 86 214General Supplies 4,500 1,100 5,600 1,806 3,794
Total Bilingual Education - Instruction 1,346,164 46,078 1,392,242 1,387,620 4,622
School-Sponsored Cocurricular Activities - InstructionSalaries 305,097 (60,650) 244,447 242,186 2,261Purchased Services (300-500 series) 10,700 19,250 29,950 27,714 2,236Supplies and Materials 104,114 (20,650) 83,464 76,248 7,216Other Objects 31,500 (10,250) 21,250 14,265 6,985
Total School-Sponsored Cocurricular Activities - Instruction 451,411 (72,300) 379,111 360,413 18,698School-Sponsored Athletics - Instruction
Salaries 436,846 (19,000) 417,846 383,240 34,606Purchased Services (300-500 series) 65,942 790 66,732 48,247 18,485Supplies and Materials 72,957 (1,000) 71,957 65,600 6,357Other Objects 28,055 6,000 34,055 30,343 3,712
Total School-Sponsored Athletics - Instruction 603,800 (13,210) 590,590 527,430 63,160Before/After School Programs - Instruction
Salaries 19,430 (11,680) 7,750 7,750Total Before/After School Programs - Instruction 19,430 (11,680) 7,750 7,750Summer School - Instruction
Salaries 105,765 16,500 122,265 116,232 6,033Other Salaries for Instruction 54,855 11,999 66,854 63,394 3,460
Total Summer School - Instruction 160,620 28,499 189,119 179,626 9,493TOTAL INSTRUCTION 26,876,509 (373,154) 26,503,355 25,655,102 848,253
Undistributed Expenditures - Instruction:Tuition to Other LEAs Within the State - Special 1,145,277 (119,565) 1,025,712 1,019,776 5,936Tuition to County Voc. School Dist. - Regular 668,304 64,260 732,564 729,898 2,666Tuition to CSSD & Regional Day Schools 678,850 206,300 885,150 884,991 159Tuition to Private Schools for the Handicapped - Within State 1,061,725 103,723 1,165,448 1,158,312 7,136Tuition to Priv. Scho. Disabled & Other LEAs - Spl, O/S State 30,804 4,200 35,004 35,004
Total Undistributed Expenditures - Instruction: 3,584,960 258,918 3,843,878 3,792,977 50,901Undistributed Expend. - Attend. & Social Work
Salaries 91,013 (3,000) 88,013 87,219 794Salaries of Family Support Teams 66,642 4,101 70,743 70,722 21Purchased Professional and Technical Services 37,000 (960) 36,040 36,040Supplies and Materials 2,500 2,500 1,740 760
Total Undistributed Expend. - Attend. & Social Work 197,155 141 197,296 195,721 1,575Undist. Expend. - Health Services
Salaries 495,160 52,697 547,857 547,427 430Purchased Professional and Technical Services 48,300 16,200 64,500 61,614 2,886Other Purchased Services (400-500 series) 4,380 4,380 4,325 55Supplies and Materials 13,805 19,105 32,910 31,402 1,508
Total Undistributed Expenditures - Health Services 557,265 92,382 649,647 644,768 4,879Undist. Expend. - Speech, OT, PT & Related Svcs.
Salaries 768,468 (111,000) 657,468 644,852 12,616Purchased Prof. Services-Educational Services 829,934 54,164 884,098 853,651 30,447Supplies and Materials 6,300 6,300 6,146 154
Total Undist. Expend. - Speech, OT, PT, & Related Svcs 1,604,702 (56,836) 1,547,866 1,504,649 43,217Undist. Expend. - Other Supp. Serv. Students-Extra Serv.
Salaries 773,529 7,610 781,139 776,178 4,961Purchased Prof. Services-Educational Services 478,551 (70,500) 408,051 396,842 11,209Supplies and Materials 3,000 3,000 2,432 568
Total Undist. Expend. - Other Supp. Serv. Students-Extra Svcs. 1,252,080 (59,890) 1,192,190 1,175,452 16,738Undist. Expend. - Guidance
Salaries of Other Professional Staff 963,251 5,000 968,251 962,437 5,814Salaries of Secretarial and Clerical Assistants 105,608 2,000 107,608 107,420 188Purchased Professional - Educational Services 2,750 2,750 1,550 1,200Purchased Professional and Technical Services 209,374 (184,925) 24,449 18,522 5,927Other Purchased Services (400-500 series) 500 500 150 350Supplies and Materials 9,350 (2,000) 7,350 3,043 4,307Other Objects 4,600 (4,000) 600 480 120
Total Undist. Expend. - Guidance 1,292,683 (181,175) 1,111,508 1,093,602 17,906Undist. Expend. - Other Supp. Child Study Teams
Salaries of Other Professional Staff 1,005,794 (13,654) 992,140 991,646 494
-68-

Page 3 of 6
Exhibit C-1
BudgetOriginal Transfers/ Final VarianceBudget Adjustments Budget Actual Final to Actual
FORT LEE BOARD OF EDUCATIONBudgetary Comparison Schedule
General FundFiscal Year Ended June 30, 2015
Salaries of Secretarial and Clerical Assistants 160,935 5,300 166,235 166,171 64Purchased Prof. Services-Educational Services 248,150 248,150 226,953 21,197Other Purchased Professional and Technical Services 7,000 5,000 12,000 11,770 230Misc. Pur Services (400-500 Series) 1,575 1,575 837 738Supplies and Materials 22,000 20,000 42,000 39,934 2,066
Total Undist. Expend. - Other Supp. Serv. Students-Special 1,197,304 264,796 1,462,100 1,437,311 24,789Undist. Expend. - Improvement of Instructional Services
Salaries of Supervisors of Instruction 463,455 (95,800) 367,655 323,205 44,450Salaries of Other Professional Staff 62,000 5,140 67,140 67,091 49Purchased Prof-Ed Services 15,000 12,800 27,800 27,000 800Other Purch Services (400-500) 1,600 1,600 524 1,076Supplies and Materials 8,000 (4,000) 4,000 3,815 185Other Objects 4,500 4,500 2,460 2,040
Total Undist. Expend. - Improvement of Inst. Services 554,555 (81,860) 472,695 424,095 48,600Undist. Expend. - Educational Media Serv./Sch. Library
Salaries 446,847 17,000 463,847 462,893 954Salaries of Technology Coordinators 105,182 105,182 105,182Purchased Professional and Technical Services 23,420 (9,818) 13,602 12,276 1,326Supplies and Materials 84,678 5,813 90,491 86,241 4,250
Total Undist. Expend. - Educational Media Serv./Sch. Library 660,127 12,995 673,122 666,592 6,530Undist. Expend. - Instructional Staff Training Serv.
Salaries-Other Prof. Staff 67,876 3,000 70,876 70,814 62Purchased Professional - Educational Services 40,000 6,500 46,500 36,886 9,614Other Purchased Services (400-500 series) 8,800 3,200 12,000 8,457 3,543Supplies and Materials 54,000 (46,700) 7,300 7,251 49
Total Undist. Expend. - Instructional Staff Training Serv. 170,676 (34,000) 136,676 123,408 13,268Undist. Expend. - Supp. Serv. - General Administration
Salaries 600,561 (61,000) 539,561 536,596 2,965Legal Services 173,525 28,395 201,920 183,036 18,884Audit Fees 77,125 (625) 76,500 38,500 38,000Architectural/Engineering Services 80,031 17,455 97,486 9,591 87,895Other Purchased Professional Services 36,600 76,200 112,800 108,356 4,444 Purchased Technical Services 26,500 11,500 38,000 37,085 915Communications/Telephone 168,421 (38,900) 129,521 113,842 15,679BOE Other Purchased Services 4,000 3,200 7,200 5,339 1,861Other Purch Services (400-500 Series) 200,591 7,450 208,041 202,543 5,498General Supplies 25,000 (2,000) 23,000 21,376 1,624BOE In-House Training/Meeting Supplies 200 200 200Judgements against the School District 20,000 132,000 152,000 151,592 408Misc. Expenditures 17,310 (400) 16,910 9,123 7,787BOE Membership Dues and Fees 25,000 (1,275) 23,725 23,724 1
Total Undist. Expend. - Supp. Serv. - General Administration 1,454,864 172,000 1,626,864 1,440,703 186,161Undist. Expend. - Support Serv. - School Administration
Salaries of Principals/Assistant Principals 1,798,844 (98,917) 1,699,927 1,699,504 423Salaries of Secretarial and Clerical Assistants 552,732 21,501 574,233 571,914 2,319Other Purchased Services (400-500 series) 10,790 (1,691) 9,099 584 8,515Supplies and Materials 39,250 (1,400) 37,850 31,829 6,021Other Objects 18,000 4,891 22,891 20,772 2,119
Total Undist. Expend. - Support Serv. - School Administration 2,419,616 (75,616) 2,344,000 2,324,603 19,397Undist. Expend. - Support Serv. - Central Services
Salaries 569,182 (14,500) 554,682 548,048 6,634Purchased Professional Services 37,590 (13,000) 24,590 23,860 730Purchased Technical Services 14,700 14,700 14,010 690Misc. Pur Services (400-500 Series) 11,628 (500) 11,128 9,497 1,631Supplies and Materials 13,532 13,868 27,400 25,584 1,816Interest on Lease Purchase Agreement 14,500 14,500 14,370 130Misc. Expenditures 2,780 100 2,880 2,725 155
Total Undist. Expend. - Support Serv. - Central Services 649,412 468 649,880 638,094 11,786Undist. Expend. - Admin Info. Technology
Information TechnologySalaries 134,450 134,450 134,290 160Purchased Technical Services 49,000 (500) 48,500 26,468 22,032Other Purchased Services (400-500 series) 2,900 (1,000) 1,900 357 1,543Supplies and Materials 53,000 5,997 58,997 57,072 1,925Other Objects 600 (100) 500 500
Total Undist. Expend. - Support Serv. - AdministrativeInformation Technology 239,950 4,397 244,347 218,187 26,160
-69-

Page 4 of 6
Exhibit C-1
BudgetOriginal Transfers/ Final VarianceBudget Adjustments Budget Actual Final to Actual
FORT LEE BOARD OF EDUCATIONBudgetary Comparison Schedule
General FundFiscal Year Ended June 30, 2015
Undist. Expend. - Required Maint. for School Facilities (261)Salaries 206,838 (37,000) 169,838 135,324 34,514Cleaning, Repair and Maintenance Services 257,979 50,120 308,099 259,713 48,386General Supplies 7,500 7,500 4,186 3,314Other Objects 600 3,480 4,080 2,988 1,092
Undist. Expend. - Required Maint. for School Facilities 472,917 16,600 489,517 402,211 87,306Undist. Expend. - Oth. Oper. & Maint. of Plant (262)
Salaries 1,323,122 (11,800) 1,311,322 1,279,470 31,852Purchased Prof. And Tech. Services 18,500 (9,500) 9,000 9,000Cleaning, Repair and Maintenance Services 969,910 75,400 1,045,310 1,007,880 37,430Rental of Land & Bldg. Oth. Than Lease Pur Agrmt. 386,966 (79,000) 307,966 307,959 7Other Purchased Property Services 357,000 (277,376) 79,624 79,290 334Insurance 175,692 175,692 170,024 5,668General Supplies 165,000 45,500 210,500 202,885 7,615Energy (Natural Gas) 310,000 30,000 340,000 325,264 14,736Energy (Energy and Electricity) 445,000 215,000 660,000 654,022 5,978Energy (Gasoline) 22,000 (3,000) 19,000 13,721 5,279Other Objects 1,550 3,900 5,450 5,384 66
Total Undist. Expend. - Other Oper. & Maint. Of Plant 4,174,740 (10,876) 4,163,864 4,045,899 117,965Undist. Expend. - Care & Upkeep of Grounds (263)
Salaries 9,734 24,000 33,734 28,446 5,288Cleaning, Repair and Maintenance Services 141,415 23,500 164,915 142,653 22,262General Supplies 13,919 13,919 13,243 676
Total Undist. Expend. - Care & Upkeep of Grounds 165,068 47,500 212,568 184,342 28,226Undist. Expend. - Security
Salaries 48,000 48,000 40,384 7,616Purchased Professional and Technical Services 151,816 109,000 260,816 251,406 9,410Cleaning, Repair and Maintenance Services 10,000 9,000 19,000 11,815 7,185General Supplies 14,500 9,000 23,500 11,062 12,438
Total Undist. Expend. - Security 176,316 175,000 351,316 314,667 36,649Undist. Expend. - Student Transportation Services (270)
Salaries for Pupil Trans (Bet. Home & Sch. ) - Sp Ed 316,543 7,000 323,543 322,619 924Cleaning, Repair and Maintenance Services 33,000 5,000 38,000 37,172 828Contract Services (Between Home & School)-Vendors 180,597 (4,000) 176,597 175,666 931Contract Services (Other than Between Home & School)-Vendors 105,131 (25,590) 79,541 76,227 3,314Contract Services (Sp. Ed. Students)-Vendors 713,367 162,000 875,367 874,973 394Contract Services - Aid in lieu Pymts - Non Public Schools 132,600 (17,000) 115,600 111,974 3,626Transportation Supplies 52,000 52,000 34,217 17,783Other Objects 1,000 1,000 693 307
Total Undist. Expend. - Student Transportation Services 1,534,238 127,410 1,661,648 1,633,541 28,107ALLOCATED BENEFITSRegular Programs - Instruction
Other Employee Benefits 518,634 (518,634)Total Regular Programs - Instruction 518,634 (518,634)Special Programs - Instruction
Other Employee Benefits 54,383 (54,383)Total Special Programs - Instruction 54,383 (54,383)Attendance and Social Work Services
Other Employee Benefits 16,669 (16,669)Total Attendance and Social Work Services 16,669 (16,669)Health Services
Other Employee Benefits 50,071 (50,071)Total Health Services 50,071 (50,071)Other Supp. Serv. - Guidance
Other Employee Benefits 6,646 (6,646)Total Other Supp. Serv. - Guidance 6,646 (6,646)Other Supp. Serv. - Child Study Teams
Other Employee Benefits 40,047 (40,047)Total Other Supp Serv. - Child Study Teams 40,047 (40,047)Educational Media Services - School Library
Other Employee Benefits 50,071 (50,071)Total Educational Media Services - School Library 50,071 (50,071)Operation and Maintenance of Plant Service
Other Employee Benefits 23,581 (23,581)Total Operation and Maintenance of Plant Service 23,581 (23,581)TOTAL ALLOCATED BENEFITS 760,102 (760,102)
-70-

Page 5 of 6
Exhibit C-1
BudgetOriginal Transfers/ Final VarianceBudget Adjustments Budget Actual Final to Actual
FORT LEE BOARD OF EDUCATIONBudgetary Comparison Schedule
General FundFiscal Year Ended June 30, 2015
UNALLOCATED BENEFITS Social Security Contributions 660,000 660,000 611,773 48,227Other Retirement Contributions-PERS 627,217 (15,437) 611,780 611,780Workmen's Compensation 226,500 65,783 292,283 292,283Health Benefits 8,559,600 (541,279) 8,018,321 7,989,311 29,010Tuition Reimbursements 112,990 (22,000) 90,990 52,499 38,491Other Employee Benefits 103,932 471,864 575,796 566,157 9,639
TOTAL UNALLOCATED BENEFITS 10,290,239 (41,069) 10,249,170 10,123,803 125,367On-behalf TPAF Post-Retirement Medical (non-budgeted) 2,265,047 (2,265,047)On-behalf TPAF Pension (non-budgeted) 1,331,038 (1,331,038)On-behalf TPAF NCGI Premium (non-budgeted) 95,762 (95,762)Reimbursed TPAF Social Security Contributions (non-budgeted) 1,870,506 (1,870,506)
TOTAL ON-BEHALF CONTRIBUTIONS 5,562,353 (5,562,353)
TOTAL PERSONAL SERVICES - EMPLOYEE BENEFITS 11,050,341 (801,171) 10,249,170 15,686,156 (5,436,986)
TOTAL UNDISTRIBUTED EXPENDITURES 33,408,969 (128,817) 33,280,152 37,946,978 (4,666,826)
TOTAL GENERAL CURRENT EXPENSE 60,285,478 (501,971) 59,783,507 63,602,080 (3,818,573)
CAPITAL OUTLAYEquipmentVocational Programs:
School-Sponsored and Other Instructional Programs 12,515 12,515 9,762 2,753Total Equipment 12,515 12,515 9,762 2,753Undist. Expenditures:
Undistributed Expenditures - Instruction 290,074 290,074 164,596 125,478Undistributed Expenditures - Admin Info Tech. 10,000 10,000 10,000Undistributed Expenditures - Custodial Services 7,000 103,065 110,065 76,215 33,850Undistributed Expenditures - Care and Upkeep of Grounds 14,000 14,000 14,000
Total Undist. Expend. 7,000 417,139 424,139 240,811 183,328Facilities Acquisition and Construction Services
Architectural/Engineering Services 102,152 102,152 101,251 901Other Purchased Prof. and Tech. Services 71,344 71,344 71,344Construction Services 1,518,276 (110,879) 1,407,397 1,407,397Assessment for Debt Service on SDA Funding 17,534 17,534 17,534
Total Facilities Acquisition and Construction Services 1,535,810 62,617 1,598,427 1,597,526 901
Capital Leases (non-budgeted)Energy Savings Improvement Program (ESIP) 5,571,444 (5,571,444)
Total Capital Leases (non-budgeted) 5,571,444 (5,571,444)
TOTAL CAPITAL OUTLAY 1,542,810 492,271 2,035,081 7,419,543 (5,384,462)
Transfer of Funds to Charter Schools 9,700 9,700 9,686 14
TOTAL EXPENDITURES 61,828,288 61,828,288 71,031,309 (9,203,021)
Excess (Deficiency) of RevenuesOver (Under) Expenditures (3,584,630) (3,584,630) (6,890,687) (3,306,057)
Other Financing Sources/(Uses):Capital Lease (non-budgeted) 5,571,444 (5,571,444)
Total Other Financing Sources/(Uses): 5,571,444 (5,571,444)
Excess (Deficiency) of Revenues and Other Financing SourcesOver (Under) Expenditures and Other Financing Sources (Uses) (3,584,630) (3,584,630) (1,319,243) (8,877,501)
Fund Balance, July 1 6,075,264 6,075,264 6,075,264
Fund Balance, June 30 2,490,634 2,490,634 4,756,021 (8,877,501)
-71-

Page 6 of 6
Exhibit C-1
BudgetOriginal Transfers/ Final VarianceBudget Adjustments Budget Actual Final to Actual
FORT LEE BOARD OF EDUCATIONBudgetary Comparison Schedule
General FundFiscal Year Ended June 30, 2015
Recapitulation of Excess (Deficiency) of Revenues Over (Under) ExpendituresAdjustment for Prior Year Encumbrances (1,331,021) (1,331,021) (1,331,021)Increase in Capital Reserve:
Principal 100,000 (100,000)Interest Deposit to Capital Reserve 50 50 1,028 (978)
Withdrawal from Capital Reserve (1,504,000) (1,504,000) (1,504,000)Budgeted Fund Balance (749,659) (749,659) 1,414,750 (8,776,523)
(3,584,630) (3,584,630) (1,319,243) (8,877,501)
Recapitulation:Restricted Fund Balance:
Excess Surplus - Current Year 502,337 Capital Reserve 1,541,656Emergency Reserve 250,000
Assigned Fund Balance:Year-end Encumbrances 737,178Designated for Subsequent Year's Expenditures 490,010
Unassigned Fund Balance 1,234,840Total Fund Balance per Governmental Funds (Budgetary) 4,756,021
Recapitulation to Governmental Fund Statement (GAAP):Less: Last State Aid Payment not Recognized GAAP Basis 123,852
Total Fund Balance per Governmental Funds (GAAP) 4,632,169
-72-

Exh
ibit
C-2
FO
RT
LE
E B
OA
RD
OF
ED
UC
AT
ION
Bu
dge
tary
Com
par
ison
Sch
edu
le
Sp
ecia
l Rev
enu
e F
un
dF
isca
l Yea
r E
nd
ed J
un
e 30
, 201
5
Bud
get
Ori
gina
lT
rans
fers
/F
inal
Var
ianc
eB
udge
tA
djus
tmen
tsB
udge
tA
ctua
lF
inal
to A
ctua
lR
EV
EN
UE
S:
Loc
al S
ourc
es2,
899
2,89
9
2,
899
-
Sta
te S
ourc
es97
,520
31
,355
12
8,87
5
10
5,30
8
(2
3,56
7)
Fed
eral
Sou
rces
1,43
9,63
1
408,
360
1,84
7,99
1
1,38
7,41
3
(460
,578
)
Tot
al R
even
ues
1,53
7,15
1
442,
614
1,97
9,76
5
1,49
5,62
0
(484
,145
)
EX
PE
ND
ITU
RE
S:
Inst
ruct
ion
: S
alar
ies
of T
each
ers
270,
633
363,
701
634,
334
344,
559
289,
775
Oth
er P
urch
ased
Ser
vice
s (4
00-5
00 s
erie
s)54
4,10
5
16
3,38
3
70
7,48
8
69
6,11
5
11
,373
G
ener
al S
uppl
ies
198,
437
(34,
573)
16
3,86
4
80
,399
83
,465
T
extb
ooks
8,55
7
5,
563
14,1
20
13,7
59
361
Tot
al in
stru
ctio
n1,
021,
732
49
8,07
4
1,
519,
806
1,
134,
832
38
4,97
4
Su
pp
ort
serv
ices
: S
alar
ies
of P
rogr
am D
irec
tors
74,1
80
1,22
0
75
,400
75
,400
-
P
erso
nal S
ervi
ces
- E
mpl
oyee
Ben
efit
s10
1,00
7
6,
128
107,
135
88,5
90
18,5
45
Pur
chas
ed P
rofe
ssio
nal -
Edu
cati
onal
Ser
vice
s34
0,23
2
(1
10,9
22)
229,
310
187,
810
41,5
00
Sup
plie
s &
Mat
eria
ls18
,144
18
,144
2,
651
15,4
93
Oth
er O
bjec
ts29
,970
29
,970
6,
337
23,6
33
Tot
al s
up
por
t se
rvic
es51
5,41
9
(5
5,46
0)
459,
959
360,
788
99,1
71
Tot
al E
xpen
ditu
res
1,53
7,15
1
442,
614
1,97
9,76
5
1,49
5,62
0
484,
145
Exc
ess
(Def
icie
ncy
) of
Rev
enu
es O
ver
(Un
der
)E
xpen
dit
ure
s an
d O
ther
Fin
anci
ng
Sou
rces
(U
ses)
-
-
-
-
-
-73-

Exhibit C-3
Note A - Explanation of Differences between Budgetary Inflows and Outflows and GAAP Revenues and Expenditures
SpecialGeneral Revenue
Fund FundSources/inflows of resourcesActual amounts (budgetary basis) "revenue"
from the budgetary comparison schedule [C-1]&[C-2] 64,140,622 1,495,620
Difference - budget to GAAP:Grant accounting budgetary basis differs from GAAP in that encumbrances are recognized as expenditures, and the related revenue is recognized. Prior Year 5,143 Current Year (48,829)
State aid payment recognized for GAAP statements in thecurrent year, previously recognized for budgetary purposes. 134,430
The last state aid payment is recognized as revenue for budgetary purposes, and differs from GAAP which does not recognize this revenue until the subsequent year when the state recognizes the related expense (GASB 33). (123,852)
Total revenues as reported on the statement of revenues, expenditures and changes in fund balances - governmental funds. [B-2] 64,151,200 1,451,934
Uses/outflows of resourcesActual amounts (budgetary basis) "total outflows" from the [C-1]&[C-2] 71,031,309 1,495,620
budgetary comparison schedule
Differences - budget to GAAPEncumbrances for supplies and equipment ordered but not received are reported in the year the order is placed for budgetary purposes, but in the year the supplies are received for financial reporting purposes. Prior Year 5,143 Current Year (48,829)
Total expenditures as reported on the statement of revenues, expenditures, and changes in fund balances - governmental funds [B-2] 71,031,309 1,451,934
Fiscal Year Ended June 30, 2015
FORT LEE BOARD OF EDUCATIONRequired Supplementary Information
Budgetary Comparison Schedule Note to Required Supplementary Information - Part II
-74-

REQUIRED SUPPLEMENTARY
INFORMATION - PART III

Exh
ibit
L-1
Sch
edu
les
of R
equ
ired
Su
pp
lem
enta
ry I
nfo
rmat
ion
Sch
edu
le o
f D
istr
ict'
s S
har
e of
Net
Pen
sion
Lia
bil
ity
- P
ER
SLa
st 1
0 F
isca
l Yea
rs*
2015
Dis
tric
ts p
ropo
rtio
n of
the
net p
ensi
onli
abil
ity
(ass
et)
0.07
3412
3712
%
Dis
tric
t's p
ropo
rtio
nate
sha
re o
f th
e ne
t pe
nsio
n li
abil
ity
(ass
et)
13,7
44,8
04$
Dis
tric
t's c
over
ed p
ayro
ll -
PE
RS
4,56
3,41
0$
Dis
tric
t's p
ropo
rtio
nate
sha
re o
f th
e ne
tpe
nsio
n li
abil
ity
(ass
et)
as a
per
cent
age
of it
s co
vere
d pa
yrol
l30
1.20
%
Pla
n fi
duci
ary
net p
osit
ion
as a
perc
enta
ge o
f th
e to
tal p
ensi
onli
abil
ity
52.0
8%
* G
AS
B r
equi
res
that
ten
year
s of
info
rmat
ion
be p
rese
nted
. H
owev
er, s
ince
fis
cal y
ear
2015
was
the
firs
t yea
r of
GA
SB
68
impl
emen
tati
on te
n ye
ars
is n
ot p
rese
nted
. E
ach
year
ther
eaft
er, a
n ad
diti
onal
yea
r w
ill b
e in
clud
ed u
ntil
ten
year
s of
dat
a is
pre
sent
ed.
FO
RT
LE
E B
OA
RD
OF
ED
UC
AT
ION
-75-
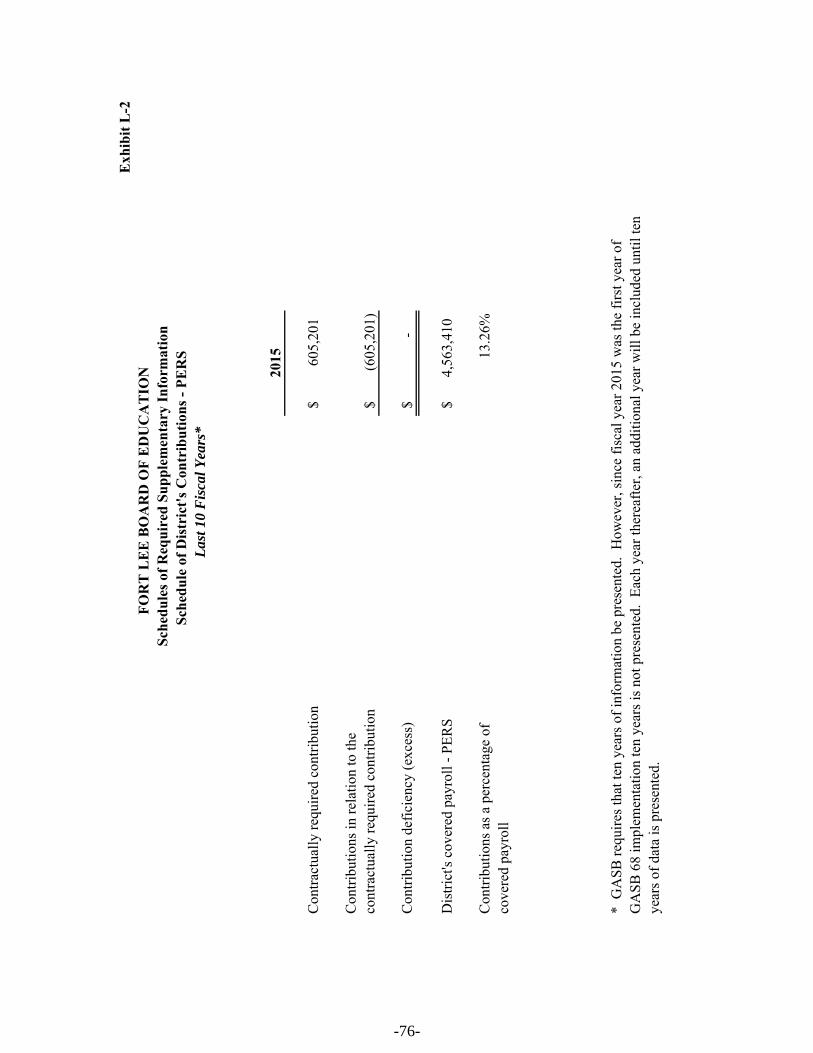
Exh
ibit
L-2
Sch
edu
les
of R
equ
ired
Su
pp
lem
enta
ry I
nfo
rmat
ion
Sch
edu
le o
f D
istr
ict'
s C
ontr
ibu
tion
s -
PE
RS
Last
10
Fis
cal Y
ears
*
2015
Con
trac
tual
ly r
equi
red
cont
ribu
tion
605,
201
$
Con
trib
utio
ns in
rel
atio
n to
the
cont
ract
uall
y re
quir
ed c
ontr
ibut
ion
(605
,201
)$
Con
trib
utio
n de
fici
ency
(ex
cess
)-
$
Dis
tric
t's c
over
ed p
ayro
ll -
PE
RS
4,56
3,41
0$
Con
trib
utio
ns a
s a
perc
enta
ge o
f 13
.26%
cove
red
payr
oll
* G
AS
B r
equi
res
that
ten
year
s of
info
rmat
ion
be p
rese
nted
. H
owev
er, s
ince
fis
cal y
ear
2015
was
the
firs
t yea
r of
GA
SB
68
impl
emen
tati
on te
n ye
ars
is n
ot p
rese
nted
. E
ach
year
ther
eaft
er, a
n ad
diti
onal
yea
r w
ill b
e in
clud
ed u
ntil
ten
year
s of
dat
a is
pre
sent
ed.
FO
RT
LE
E B
OA
RD
OF
ED
UC
AT
ION
-76-

Exh
ibit
L-3
Sch
edu
les
of R
equ
ired
Su
pp
lem
enta
ry I
nfo
rmat
ion
Sch
edu
le o
f D
istr
ict'
s S
har
e of
Net
Pen
sion
Lia
bil
ity
- T
PA
FLa
st 1
0 F
isca
l Yea
rs*
2015
Dis
tric
ts p
ropo
rtio
n of
the
net p
ensi
onli
abil
ity
(ass
et)
0.25
3599
5199
%
Dis
tric
t's p
ropo
rtio
nate
sha
re o
f th
e ne
t pe
nsio
n li
abil
ity
(ass
et)
-$
Sta
te's
pro
port
iona
te s
hare
of
the
net
pens
ion
liab
ilit
y A
ssoc
iate
d w
ith
the
Dis
tric
t (as
set)
135,
540,
690
$
Dis
tric
t's c
over
ed p
ayro
ll -
TP
AF
24,9
14,4
04$
Dis
tric
t's p
ropo
rtio
nate
sha
re o
f th
e ne
tpe
nsio
n li
abil
ity
(ass
et)
as a
per
cent
age
of it
s co
vere
d pa
yrol
l0.
00%
Pla
n fi
duci
ary
net p
osit
ion
as a
perc
enta
ge o
f th
e to
tal p
ensi
onli
abil
ity
33.6
4%
* G
AS
B r
equi
res
that
ten
year
s of
info
rmat
ion
be p
rese
nted
. H
owev
er, s
ince
fis
cal y
ear
2015
was
the
firs
t yea
r of
GA
SB
68
impl
emen
tati
on te
n ye
ars
is n
ot p
rese
nted
. E
ach
year
ther
eaft
er, a
n ad
diti
onal
yea
r w
ill b
e in
clud
ed u
ntil
ten
year
s of
dat
a is
pre
sent
ed.
FO
RT
LE
E B
OA
RD
OF
ED
UC
AT
ION
-77-

Exhibit L-4
Note to Required Schedules of Supplementary Information - Part III
PUBLIC EMPLOYEES RETIREMENT SYSTEM (PERS)
Change in benefit terms
None
Change in assumptions
The calculation of the discount rate used to measure the total pension liability is dependent upon the long·term expected rate of return, and the municipal bond index rate. There was a change in the municipal bond index rate from the prior measurement date (4.63%) to the current measurement date (4.29%), resulting in a change in the discount rate from 5.55% to 5.39%. This change in the discount rate is considered to be a change in actuarial assumptions under GASBS No. 68.
TEACHERS PENSION AND ANNUITY FUND (TPAF)
Change in benefit terms
Change in assumptions
The calculation of the discount rate used to measure the total pension liability is dependent upon the long·term expected rate of return, and the municipal bond index rate. There was a change in the municipal bond index rate from the prior measurement date (4.63%) to the current measurement date (4.29%), resulting in a change in the discount rate from 4.95% to 4.68%. This change in the discount rate is considered to be a change in actuarial assumptions under GASBS No. 68.
FORT LEE BOARD OF EDUCATION
Fiscal Year Ended June 30, 2015
-78-

SPECIAL REVENUE FUND

Exh
ibit
E-1
FO
RT
LE
E B
OA
RD
OF
ED
UC
AT
ION
Sp
ecia
l Rev
enu
e F
un
dC
omb
inin
g S
ched
ule
of
Pro
gram
Rev
enu
es a
nd
Exp
end
itu
res
- B
ud
geta
ry B
asis
Fis
cal Y
ear
En
ded
Ju
ne
30, 2
015
Tot
alB
rou
ght
NC
LB
NC
LB
IDE
AF
orw
ard
NC
LB
Tit
le I
I, A
NC
LB
Tit
le I
IIID
EA
Par
t -
BT
otal
s(E
x. E
-1a)
Tit
le I
Tra
inin
gT
itle
III
Imm
igra
nt
Par
t -
BP
resc
hoo
l20
15R
EV
EN
UE
S
Loc
al S
ourc
es2,
899
2,
899
Sta
te S
ourc
es10
5,30
8
105,
308
Fed
eral
Sou
rces
-
283,
592
10
9,93
7
87,4
52
10
4,91
4
784,
343
17
,175
1,38
7,41
3
T
otal
Rev
enu
es10
8,20
7
283,
592
10
9,93
7
87,4
52
10
4,91
4
784,
343
17
,175
1,49
5,62
0
EX
PE
ND
ITU
RE
S:
Inst
ruct
ion
: S
alar
ies
of T
each
ers
-
201,
434
83
,700
59,4
25
34
4,55
9
Oth
er P
urch
ased
Ser
vice
s (4
00-5
00 s
erie
s)-
67
8,94
0
17,1
75
69
6,11
5
Gen
eral
Sup
plie
s10
,245
20,1
42
33
,737
3,13
5
13,1
40
80
,399
Tex
tboo
ks13
,759
13,7
59
Tot
al in
stru
ctio
n24
,004
221,
576
-
33
,737
86,8
35
75
1,50
5
17,1
75
1,
134,
832
Su
pp
ort
serv
ices
: S
alar
ies
of P
rogr
am D
irec
tors
-
75,4
00
75
,400
Per
sona
l Ser
vice
s -
Em
ploy
ee B
enef
its
-
49,6
79
16
,286
18,0
79
4,
546
88
,590
Pur
chas
ed P
rofe
ssio
nal -
Edu
cati
onal
Ser
vice
s84
,203
6,00
0
15,6
00
53
,715
28,2
92
18
7,81
0
Sup
plie
s &
Mat
eria
ls-
2,
651
2,
651
O
ther
Obj
ects
-
6,33
7
6,33
7
Tot
al s
up
por
t se
rvic
es84
,203
62,0
16
10
9,93
7
53,7
15
18
,079
32,8
38
-
36
0,78
8
Tot
al E
xpen
dit
ure
s10
8,20
7
283,
592
10
9,93
7
87,4
52
10
4,91
4
784,
343
17
,175
1,49
5,62
0
Exc
ess
(Def
icie
ncy
) of
Rev
enu
es O
ver
(Un
der
)
Ex p
end
itu
res
and
Oth
er F
inan
cin
g S
ourc
es (
Use
s)-
-
-
-
-
-
-
-
-79-

Exh
ibit
E-1
aF
OR
T L
EE
BO
AR
D O
F E
DU
CA
TIO
NS
pec
ial R
even
ue
Fu
nd
Com
bin
ing
Sch
edu
le o
f P
rogr
am R
even
ues
an
d E
xpen
dit
ure
s -
Bu
dge
tary
Bas
isF
isca
l Yea
r E
nd
ed J
un
e 30
, 201
5
Tot
alB
rou
ght
Ch
apte
r 19
2C
hap
ter
193
Ch
apte
r 19
3C
hap
ter
193
Tot
alF
orw
ard
Com
pes
ator
yC
hap
ter
192
Su
pp
lem
enta
lE
xam
&C
orre
ctiv
eC
arri
ed(E
x. E
-1b
)E
du
cati
onE
SL
Inst
ruct
ion
Cla
ssif
icat
ion
Sp
eech
For
war
dR
EV
EN
UE
S
Loc
al S
ourc
es2,
899
2,89
9
S
tate
Sou
rces
43,5
84
23,3
80
20,7
36
1,
805
3,96
4
11
,839
10
5,30
8
Fed
eral
Sou
rces
-
-
T
otal
Rev
enu
es46
,483
23
,380
20
,736
1,80
5
3,
964
11,8
39
108,
207
EX
PE
ND
ITU
RE
S:
Inst
ruct
ion
: S
alar
ies
of T
each
ers
-
-
Oth
er P
urch
ased
Ser
vice
s (4
00-5
00 s
erie
s)-
-
G
ener
al S
uppl
ies
10,2
45
10,2
45
Tex
tboo
ks13
,759
13
,759
Tot
al in
stru
ctio
n24
,004
-
-
-
-
-
24,0
04
Su
pp
ort
serv
ices
: S
alar
ies
of P
rogr
am D
irec
tors
-
-
Per
sona
l Ser
vice
s -
Em
ploy
ee B
enef
its
-
-
Pur
chas
ed P
rofe
ssio
nal -
Edu
cati
onal
Ser
vice
s22
,479
23
,380
20
,736
1,80
5
3,
964
11,8
39
84,2
03
Sup
plie
s &
Mat
eria
ls-
-
O
ther
Obj
ects
-
-
Tot
al s
up
por
t se
rvic
es22
,479
23
,380
20
,736
1,80
5
3,
964
11,8
39
84,2
03
Tot
al E
xpen
dit
ure
s46
,483
23
,380
20
,736
1,80
5
3,
964
11,8
39
108,
207
Exc
ess
(Def
icie
ncy
) of
Rev
enu
es O
ver
(Un
der
)
Ex p
end
itu
res
and
Oth
er F
inan
cin
g S
ourc
es (
Use
s)-
-
-
-
-
-
-
-80-

Exh
ibit
E-1
bF
OR
T L
EE
BO
AR
D O
F E
DU
CA
TIO
NS
pec
ial R
even
ue
Fu
nd
Com
bin
ing
Sch
edu
le o
f P
rogr
am R
even
ues
an
d E
xpen
dit
ure
s -
Bu
dge
tary
Bas
isF
isca
l Yea
r E
nd
ed J
un
e 30
, 201
5
Ch
apte
r 19
4T
otal
Non
pu
bli
cN
onp
ub
lic
Tec
hn
olog
yE
xxon
Sch
ool 1
Iron
man
Car
ried
Tex
tboo
kN
urs
ing
Gra
nt
Don
atio
nD
onat
ion
Don
atio
nF
orw
ard
RE
VE
NU
ES
L
ocal
Sou
rces
1,49
9
20
0
1,20
0
2,
899
S
tate
Sou
rces
13,7
59
22,4
79
7,34
6
43
,584
Fed
eral
Sou
rces
-
T
otal
Rev
enu
es13
,759
22
,479
7,
346
1,49
9
20
0
1,20
0
46
,483
EX
PE
ND
ITU
RE
S:
Inst
ruct
ion
: S
alar
ies
of T
each
ers
-
Oth
er P
urch
ased
Ser
vice
s (4
00-5
00 s
erie
s)-
G
ener
al S
uppl
ies
7,34
6
1,
499
200
1,
200
10,2
45
Tex
tboo
ks13
,759
13
,759
Tot
al in
stru
ctio
n13
,759
-
7,
346
1,49
9
20
0
1,20
0
24
,004
Su
pp
ort
serv
ices
: S
alar
ies
of P
rogr
am D
irec
tors
-
Per
sona
l Ser
vice
s -
Em
ploy
ee B
enef
its
-
Pur
chas
ed P
rofe
ssio
nal -
Edu
cati
onal
Ser
vice
s22
,479
22
,479
S
uppl
ies
& M
ater
ials
-
Oth
er O
bjec
ts-
Tot
al s
up
por
t se
rvic
es-
22
,479
-
-
-
-
22
,479
Tot
al E
xpen
dit
ure
s13
,759
22
,479
7,
346
1,49
9
20
0
1,20
0
46
,483
Exc
ess
(Def
icie
ncy
) of
Rev
enu
es O
ver
(Un
der
)
Exp
end
itu
res
and
Oth
er F
inan
cin
g S
ourc
es (
Use
s)-
-
-
-
-
-
-
-81-

CAPITAL PROJECTS FUND

Exhibit F-1
FORT LEE BOARD OF EDUCATIONCapital Projects Fund
Summary Schedule of Revenues, Expenditures, and Changesin Fund Balance-Budgetary Basis
Fiscal Year Ended June 30, 2015
Revenues and Other Financing SourcesState Sources - SCC Grant (992,527) Bond proceeds and transfers 49,840,000 Transfers from Capital Reserve - Transfers from Capital Outlay - Transfers from Emergency Reserve - Interest on Investments 61,946
48,909,419
Expenditures and Other Financing UsesPurchased professional and technical services 1,227,618 Land and improvements - Construction services 12,219,649 Equipment purchases 12,705
Total expenditures 13,459,972
Excess (deficiency) of revenues over (under) expenditures 35,449,447
Other Finance Sources (Uses)Transfers out:
Debt Service Fund (61,946)
Total other financing sources (uses) (61,946)
Net change in fund balance 35,387,501
Fund balance - beginning 17,577,588
Fund balance - ending 52,965,089
Recapitulation:Unrestricted Fund Balance 52,965,089
Reconciliation to Governmental Funds Statements (GAAP):SDA Grant Receivable not Recognized on GAAP Basis (548,947)
Fund Balance per Governmental Funds 52,416,142
-82-

Exhibit F-1a
FORT LEE BOARD OF EDUCATIONCapital Projects Fund
Schedule of Project Revenues, Expenditures, Project Balances and Project Status-Budgetary BasisHigh School Window Replacement
Fiscal Year Ended June 30, 2015
RevisedAuthorized
Prior Periods Current Year Totals CostRevenues and Other Financing Sources
State Sources - SCC Grant 420,000 420,000 420,000 Bond proceeds and transfers 630,000 630,000 630,000 Transfers from Capital Reserve - - Transfers from Capital Outlay - - Transfers from Emergency Reserve - -
1,050,000 - 1,050,000 1,050,000
Expenditures and Other Financing UsesPurchased professional and technical services 53,000 53,000 196,900 Land and improvements - - Construction services - 853,100 Equipment purchases - -
53,000 - 53,000 1,050,000
Other Finance Sources (Uses)Transfers out -
Total other financing sources (uses) - - - -
Excess (deficiency) of revenuesover (under) expenditures 997,000 - 997,000 -
Additional project information:Project number 1550-050-10-1001Grant Date 9/28/2010Bond authorization date N/ABonds authorized N/ABonds issued N/AOriginal authorization cost 1,050,000 Additional authorized costRevised authorized cost 1,050,000
Percentage increase over originalauthorized cost 0%
Percentage completion 5%Original target completion date 9/30/2013Revised target completion date
-83-

Exhibit F-1b
FORT LEE BOARD OF EDUCATIONCapital Projects Fund
Schedule of Project Revenues, Expenditures, Project Balances and Project Status-Budgetary BasisHigh School Masonry RepairsFiscal Year Ended June 30, 2015
RevisedAuthorized
Prior Periods Current Year Totals CostRevenues and Other Financing Sources
State Sources - SCC Grant 130,212 130,212 130,212 Bond proceeds and transfers 197,667 197,667 197,667 Transfers from Capital Reserve - - Transfers from Capital Outlay - - Transfers from Emergency Reserve - -
327,879 - 327,879 327,879
Expenditures and Other Financing UsesPurchased professional and technical services 27,879 27,879 27,879 Land and improvements - - Construction services 300,000 300,000 300,000 Equipment purchases - -
327,879 - 327,879 327,879
Other Finance Sources (Uses)Transfers in -
Total other financing sources (uses) - - - -
Excess (deficiency) of revenuesover (under) expenditures - - - -
Additional project information:Project number 1550-050-10-1002Grant Date 9/28/2010Bond authorization date N/ABonds authorized N/ABonds issued N/AOriginal authorization cost 796,077 Additional authorized cost (468,198) Revised authorized cost 327,879
Percentage increase over originalauthorized cost -59%
Percentage completion 100%Original target completion date 9/1/2012Revised target completion date 9/1/2013
-84-

Exhibit F-1c
FORT LEE BOARD OF EDUCATIONCapital Projects Fund
Schedule of Project Revenues, Expenditures, Project Balances and Project Status-Budgetary BasisHigh School Interior Alterations
Fiscal Year Ended June 30, 2015
RevisedAuthorized
Prior Periods Current Year Totals CostRevenues and Other Financing Sources
State Sources - SCC Grant 1,592,000 (225,403) 1,366,597 1,366,597 Bond proceeds and transfers 2,388,000 (337,520) 2,050,480 2,050,480 Transfers from Capital Reserve - - Transfers from Capital Outlay - - Transfers from Emergency Reserve - -
3,980,000 (562,923) 3,417,077 3,417,077
Expenditures and Other Financing UsesPurchased professional and technical services 330,931 121,808 452,739 452,739 Land and improvements - - Construction services 1,480,107 1,484,231 2,964,338 2,964,338 Equipment purchases - -
1,811,038 1,606,039 3,417,077 3,417,077
Other Finance Sources (Uses)Transfers out -
Total other financing sources (uses) - - - -
Excess (deficiency) of revenuesover (under) expenditures 2,168,962 (2,168,962) - -
Additional project information:Project number 1550-050-10-1003Grant Date 9/28/2010Bond authorization date N/ABonds authorized N/ABonds issued N/AOriginal authorization cost 3,980,000 Additional authorized cost (562,923) Revised authorized cost 3,417,077
Percentage increase over originalauthorized cost -14%
Percentage completion 100%Original target completion date 9/30/2014Revised target completion date
-85-

Exhibit F-1d
FORT LEE BOARD OF EDUCATIONCapital Projects Fund
Schedule of Project Revenues, Expenditures, Project Balances and Project Status-Budgetary BasisHigh School HVAC UpgradesFiscal Year Ended June 30, 2015
RevisedAuthorized
Prior Periods Current Year Totals CostRevenues and Other Financing Sources
State Sources - SCC Grant 192,597 192,597 192,597 Bond proceeds and transfers 288,895 288,895 288,895 Transfers from Capital Reserve - - Transfers from Capital Outlay - - Transfers from Emergency Reserve - -
481,492 - 481,492 481,492
Expenditures and Other Financing UsesPurchased professional and technical services 38,988 38,988 38,988 Land and improvements - - Construction services 442,504 442,504 442,504 Equipment purchases - -
481,492 - 481,492 481,492
Other Finance Sources (Uses)Transfers out -
Total other financing sources (uses) - - - -
Excess (deficiency) of revenuesover (under) expenditures - - - -
Additional project information:Project number 1550-050-10-1005Grant Date 9/28/2010Bond authorization date N/ABonds authorized N/ABonds issued N/AOriginal authorization cost 870,000 Additional authorized cost (388,508) Revised authorized cost 481,492
Percentage increase over originalauthorized cost -45%
Percentage completion 100%Original target completion date 12/31/2012Revised target completion date 12/31/2013
-86-

Exhibit F-1e
FORT LEE BOARD OF EDUCATIONCapital Projects Fund
Schedule of Project Revenues, Expenditures, Project Balances and Project Status-Budgetary BasisSchool No. 1 HVAC UpgradesFiscal Year Ended June 30, 2015
RevisedAuthorized
Prior Periods Current Year Totals CostRevenues and Other Financing Sources
State Sources - SCC Grant 327,918 327,918 327,918 Bond proceeds and transfers 491,878 491,878 491,878 Transfers from Capital Reserve - - Transfers from Capital Outlay - - Transfers from Emergency Reserve - -
819,796 - 819,796 819,796
Expenditures and Other Financing UsesPurchased professional and technical services 146,587 146,587 146,587 Land and improvements - - Construction services 673,209 673,209 673,209 Equipment purchases - -
819,796 - 819,796 819,796
Other Finance Sources (Uses)Transfers out -
Total other financing sources (uses) - - - -
Excess (deficiency) of revenuesover (under) expenditures - - - -
Additional project information:Project number 1550-060-10-1006Grant Date 9/28/2010Bond authorization date N/ABonds authorized N/ABonds issued N/AOriginal authorization cost 1,329,750 Additional authorized cost (509,954) Revised authorized cost 819,796
Percentage increase over originalauthorized cost -38%
Percentage completion 100%Original target completion date 9/30/2012Revised target completion date 9/30/2013
-87-

Exhibit F-1f
FORT LEE BOARD OF EDUCATIONCapital Projects Fund
Schedule of Project Revenues, Expenditures, Project Balances and Project Status-Budgetary BasisSchool No. 1 Roof ReplacementFiscal Year Ended June 30, 2015
RevisedAuthorized
Prior Periods Current Year Totals CostRevenues and Other Financing Sources
State Sources - SCC Grant 371,023 371,023 371,023 Bond proceeds and transfers 559,162 559,162 559,162 Transfers from Capital Reserve - - Transfers from Capital Outlay - - Transfers from Emergency Reserve - -
930,185 - 930,185 930,185
Expenditures and Other Financing UsesPurchased professional and technical services 74,832 74,832 74,832 Land and improvements - - Construction services 855,353 855,353 855,353 Equipment purchases - -
930,185 - 930,185 930,185
Other Finance Sources (Uses)Transfers out -
Total other financing sources (uses) - - - -
Excess (deficiency) of revenuesover (under) expenditures - - - -
Additional project information:Project number 1550-060-10-1007Grant Date 9/28/2010Bond authorization date N/ABonds authorized N/ABonds issued N/AOriginal authorization cost 1,165,250 Additional authorized cost (235,065) Revised authorized cost 930,185
Percentage increase over originalauthorized cost -20%
Percentage completion 100%Original target completion date 9/30/2012Revised target completion date 9/30/2013
-88-

Exhibit F-1g
FORT LEE BOARD OF EDUCATIONCapital Projects Fund
Schedule of Project Revenues, Expenditures, Project Balances and Project Status-Budgetary BasisSchool No. 1 Window Replacement
Fiscal Year Ended June 30, 2015
RevisedAuthorized
Prior Periods Current Year Totals CostRevenues and Other Financing Sources
State Sources - SCC Grant 278,000 (126,699) 151,301 151,301 Bond proceeds and transfers 417,000 (190,049) 226,951 226,951 Transfers from Capital Reserve - - Transfers from Capital Outlay - - Transfers from Emergency Reserve - -
695,000 (316,748) 378,252 378,252
Expenditures and Other Financing UsesPurchased professional and technical services 41,331 2,421 43,752 43,752 Land and improvements - - Construction services 305,501 28,999 334,500 334,500 Equipment purchases - -
346,832 31,420 378,252 378,252
Other Finance Sources (Uses)Transfers out -
Total other financing sources (uses) - - - -
Excess (deficiency) of revenuesover (under) expenditures 348,168 (348,168) - -
Additional project information:Project number 1550-060-10-1008Grant Date 9/28/2010Bond authorization date N/ABonds authorized N/ABonds issued N/AOriginal authorization cost 695,000 Additional authorized cost (316,748) Revised authorized cost 378,252
Percentage increase over originalauthorized cost -46%
Percentage completion 100%Original target completion date 9/30/2013Revised target completion date 9/30/2013
-89-

Exhibit F-1h
FORT LEE BOARD OF EDUCATIONCapital Projects Fund
Schedule of Project Revenues, Expenditures, Project Balances and Project Status-Budgetary BasisSchool No. 3 Window Replacement
Fiscal Year Ended June 30, 2015
RevisedAuthorized
Prior Periods Current Year Totals CostRevenues and Other Financing Sources
State Sources - SCC Grant 212,800 (67,769) 145,031 145,031 Bond proceeds and transfers 319,200 (97,979) 221,221 221,221 Transfers from Capital Reserve - - Transfers from Capital Outlay - - Transfers from Emergency Reserve - -
532,000 (165,748) 366,252 366,252
Expenditures and Other Financing UsesPurchased professional and technical services 42,202 550 42,752 42,752 Land and improvements - - Construction services 271,168 52,332 323,500 323,500 Equipment purchases - -
313,370 52,882 366,252 366,252
Other Finance Sources (Uses)Transfers out -
Total other financing sources (uses) - - - -
Excess (deficiency) of revenuesover (under) expenditures 218,630 (218,630) - -
Additional project information:Project number 1550-080-10-1010Grant Date 9/28/2010Bond authorization date N/ABonds authorized N/ABonds issued N/AOriginal authorization cost 532,000 Additional authorized cost (165,748) Revised authorized cost 366,252
Percentage increase over originalauthorized cost -31%
Percentage completion 100%Original target completion date 9/30/2013Revised target completion date
-90-

Exhibit F-1i
FORT LEE BOARD OF EDUCATIONCapital Projects Fund
Schedule of Project Revenues, Expenditures, Project Balances and Project Status-Budgetary BasisSchool No. 3 Masonry RepairsFiscal Year Ended June 30, 2015
RevisedAuthorized
Prior Periods Current Year Totals CostRevenues and Other Financing Sources
State Sources - SCC Grant 88,030 88,030 88,030 Bond proceeds and transfers 132,952 132,952 132,952 Transfers from Capital Reserve - - Transfers from Capital Outlay - - Transfers from Emergency Reserve - -
220,982 - 220,982 220,982
Expenditures and Other Financing UsesPurchased professional and technical services 18,482 18,482 18,482 Land and improvements - - Construction services 202,500 202,500 202,500 Equipment purchases - -
220,982 - 220,982 220,982
Other Finance Sources (Uses)Transfers out -
Total other financing sources (uses) - - - -
Excess (deficiency) of revenuesover (under) expenditures - - - -
Additional project information:Project number 1550-080-10-1011Grant Date 9/28/2010Bond authorization date N/ABonds authorized N/ABonds issued N/AOriginal authorization cost 383,000 Additional authorized cost (162,018) Revised authorized cost 220,982
Percentage increase over originalauthorized cost -42%
Percentage completion 100%Original target completion date 9/1/2012Revised target completion date 9/1/2013
-91-

Exhibit F-1j
FORT LEE BOARD OF EDUCATIONCapital Projects Fund
Schedule of Project Revenues, Expenditures, Project Balances and Project Status-Budgetary BasisSchool No. 4 Masonry RepairsFiscal Year Ended June 30, 2015
RevisedAuthorized
Prior Periods Current Year Totals CostRevenues and Other Financing Sources
State Sources - SCC Grant 69,559 69,559 69,559 Bond proceeds and transfers 105,209 105,209 105,209 Transfers from Capital Reserve - - Transfers from Capital Outlay - - Transfers from Emergency Reserve - -
174,768 - 174,768 174,768
Expenditures and Other Financing UsesPurchased professional and technical services 14,568 14,568 14,568 Land and improvements - - Construction services 160,200 160,200 160,200 Equipment purchases - -
174,768 - 174,768 174,768
Other Finance Sources (Uses)Transfers out -
Total other financing sources (uses) - - - -
Excess (deficiency) of revenuesover (under) expenditures - - - -
Additional project information:Project number 1550-090-10-1012Grant Date 9/28/2010Bond authorization date N/ABonds authorized N/ABonds issued N/AOriginal authorization cost 430,000 Additional authorized cost (255,232) Revised authorized cost 174,768
Percentage increase over originalauthorized cost -59%
Percentage completion 100%Original target completion date 9/1/2012Revised target completion date 9/1/2013
-92-

Exhibit F-1k
FORT LEE BOARD OF EDUCATIONCapital Projects Fund
Schedule of Project Revenues, Expenditures, Project Balances and Project Status-Budgetary BasisSchool No. 4 HVAC UpgradesFiscal Year Ended June 30, 2015
RevisedAuthorized
Prior Periods Current Year Totals CostRevenues and Other Financing Sources
State Sources - SCC Grant 1,656,000 (351,748) 1,304,252 1,304,252 Bond proceeds and transfers 2,484,000 (527,620) 1,956,380 1,956,380 Transfers from Capital Reserve - - Transfers from Capital Outlay - - Transfers from Emergency Reserve - -
4,140,000 (879,368) 3,260,632 3,260,632
Expenditures and Other Financing UsesPurchased professional and technical services 250,452 116,563 367,015 383,321 Land and improvements - - Construction services 1,367,909 1,385,468 2,753,377 2,877,311 Equipment purchases - -
1,618,361 1,502,031 3,120,392 3,260,632
Other Finance Sources (Uses)Transfers out -
Total other financing sources (uses) - - - -
Excess (deficiency) of revenuesover (under) expenditures 2,521,639 (2,381,399) 140,240 -
Additional project information:Project number 1550-090-10-1013Grant Date 9/28/2010Bond authorization date N/ABonds authorized N/ABonds issued N/AOriginal authorization cost 4,140,000 Additional authorized cost (879,368) Revised authorized cost 3,260,632
Percentage increase over originalauthorized cost -21%
Percentage completion 96%Original target completion date 9/30/2014Revised target completion date
-93-
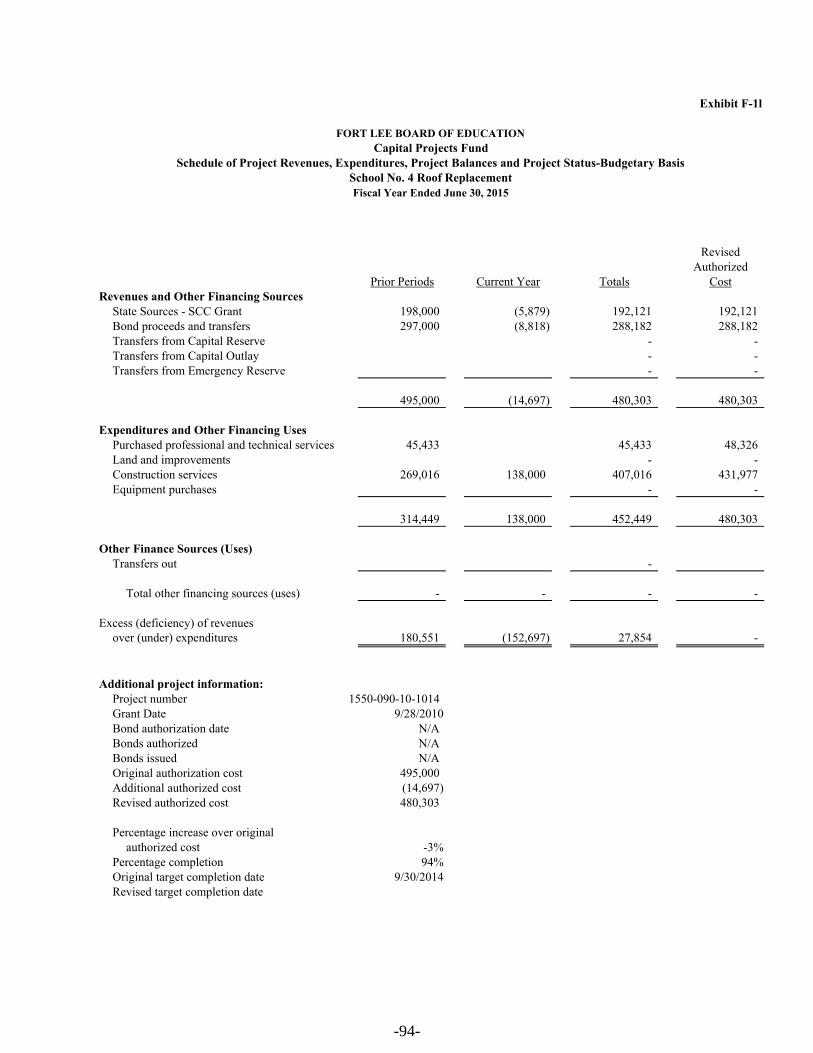
Exhibit F-1l
FORT LEE BOARD OF EDUCATIONCapital Projects Fund
Schedule of Project Revenues, Expenditures, Project Balances and Project Status-Budgetary BasisSchool No. 4 Roof ReplacementFiscal Year Ended June 30, 2015
RevisedAuthorized
Prior Periods Current Year Totals CostRevenues and Other Financing Sources
State Sources - SCC Grant 198,000 (5,879) 192,121 192,121 Bond proceeds and transfers 297,000 (8,818) 288,182 288,182 Transfers from Capital Reserve - - Transfers from Capital Outlay - - Transfers from Emergency Reserve - -
495,000 (14,697) 480,303 480,303
Expenditures and Other Financing UsesPurchased professional and technical services 45,433 45,433 48,326 Land and improvements - - Construction services 269,016 138,000 407,016 431,977 Equipment purchases - -
314,449 138,000 452,449 480,303
Other Finance Sources (Uses)Transfers out -
Total other financing sources (uses) - - - -
Excess (deficiency) of revenuesover (under) expenditures 180,551 (152,697) 27,854 -
Additional project information:Project number 1550-090-10-1014Grant Date 9/28/2010Bond authorization date N/ABonds authorized N/ABonds issued N/AOriginal authorization cost 495,000 Additional authorized cost (14,697) Revised authorized cost 480,303
Percentage increase over originalauthorized cost -3%
Percentage completion 94%Original target completion date 9/30/2014Revised target completion date
-94-
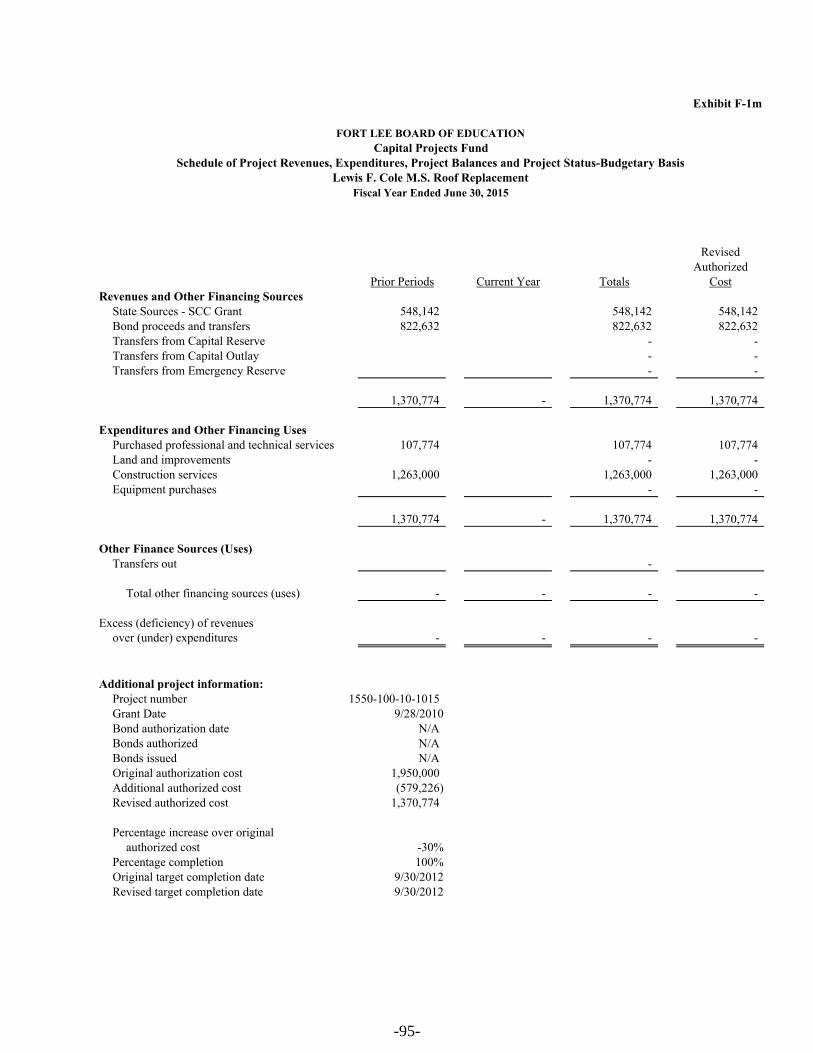
Exhibit F-1m
FORT LEE BOARD OF EDUCATIONCapital Projects Fund
Schedule of Project Revenues, Expenditures, Project Balances and Project Status-Budgetary BasisLewis F. Cole M.S. Roof Replacement
Fiscal Year Ended June 30, 2015
RevisedAuthorized
Prior Periods Current Year Totals CostRevenues and Other Financing Sources
State Sources - SCC Grant 548,142 548,142 548,142 Bond proceeds and transfers 822,632 822,632 822,632 Transfers from Capital Reserve - - Transfers from Capital Outlay - - Transfers from Emergency Reserve - -
1,370,774 - 1,370,774 1,370,774
Expenditures and Other Financing UsesPurchased professional and technical services 107,774 107,774 107,774 Land and improvements - - Construction services 1,263,000 1,263,000 1,263,000 Equipment purchases - -
1,370,774 - 1,370,774 1,370,774
Other Finance Sources (Uses)Transfers out -
Total other financing sources (uses) - - - -
Excess (deficiency) of revenuesover (under) expenditures - - - -
Additional project information:Project number 1550-100-10-1015Grant Date 9/28/2010Bond authorization date N/ABonds authorized N/ABonds issued N/AOriginal authorization cost 1,950,000 Additional authorized cost (579,226) Revised authorized cost 1,370,774
Percentage increase over originalauthorized cost -30%
Percentage completion 100%Original target completion date 9/30/2012Revised target completion date 9/30/2012
-95-

Exhibit F-1n
FORT LEE BOARD OF EDUCATIONCapital Projects Fund
Schedule of Project Revenues, Expenditures, Project Balances and Project Status-Budgetary BasisLewis F. Cole M.S. Boiler Replacement
Fiscal Year Ended June 30, 2015
RevisedAuthorized
Prior Periods Current Year Totals CostRevenues and Other Financing Sources
State Sources - SCC Grant 248,878 248,878 248,878 Bond proceeds and transfers 373,316 373,316 373,316 Transfers from Capital Reserve - - Transfers from Capital Outlay - - Transfers from Emergency Reserve - -
622,194 - 622,194 622,194
Expenditures and Other Financing UsesPurchased professional and technical services 53,880 53,880 53,880 Land and improvements - - Construction services 568,314 568,314 568,314 Equipment purchases - -
622,194 - 622,194 622,194
Other Finance Sources (Uses)Transfers out -
Total other financing sources (uses) - - - -
Excess (deficiency) of revenuesover (under) expenditures - - - -
Additional project information:Project number 1550-100-10-1016Grant Date 9/28/2010Bond authorization date N/ABonds authorized N/ABonds issued N/AOriginal authorization cost 1,130,000 Additional authorized cost (507,806) Revised authorized cost 622,194
Percentage increase over originalauthorized cost -45%
Percentage completion 100%Original target completion date 9/30/2012Revised target completion date 9/30/2012
-96-

Exhibit F-1o
FORT LEE BOARD OF EDUCATIONCapital Projects Fund
Schedule of Project Revenues, Expenditures, Project Balances and Project Status-Budgetary BasisLewis F. Cole M.S. Addition and Rehabilitation
Fiscal Year Ended June 30, 2015
RevisedAuthorized
Prior Periods Current Year Totals CostRevenues and Other Financing Sources
State Sources - SCC Grant 1,557,180 1,557,180 1,557,180 Bond proceeds and transfers 9,963,555 1,484,530 11,448,085 11,448,085 Transfers from Capital Reserve - - Transfers from Capital Outlay - - Transfers from Emergency Reserve - -
11,520,735 1,484,530 13,005,265 13,005,265
Expenditures and Other Financing UsesPurchased professional and technical services 933,318 408,255 1,341,573 1,584,253 Land and improvements - - Construction services 868,836 8,155,910 9,024,746 11,108,010 Equipment purchases 12,705 12,705 313,002
1,802,154 8,576,870 10,379,024 13,005,265
Other Finance Sources (Uses)Transfers out -
Total other financing sources (uses) - - - -
Excess (deficiency) of revenuesover (under) expenditures 9,718,581 (7,092,340) 2,626,241 -
Additional project information:Project number 1550-100-10-1018Grant Date 9/28/2010Bond authorization date N/ABonds authorized N/ABonds issued N/AOriginal authorization cost 9,660,000 Additional authorized cost 3,345,265 Revised authorized cost 13,005,265
Percentage increase over originalauthorized cost 35%
Percentage completion 80%Original target completion date 9/30/2014Revised target completion date
-97-

Exhibit F-1p
FORT LEE BOARD OF EDUCATIONCapital Projects Fund
Schedule of Project Revenues, Expenditures, Project Balances and Project Status-Budgetary BasisLewis F. Cole M.S. Interior Alterations
Fiscal Year Ended June 30, 2015
RevisedAuthorized
Prior Periods Current Year Totals CostRevenues and Other Financing Sources
State Sources - SCC Grant 640,000 (215,029) 424,971 424,971 Bond proceeds and transfers 960,000 (322,544) 637,456 637,456 Transfers from Capital Reserve - - Transfers from Capital Outlay - - Transfers from Emergency Reserve - -
1,600,000 (537,573) 1,062,427 1,062,427
Expenditures and Other Financing UsesPurchased professional and technical services 120,988 37,273 158,261 192,557 Land and improvements - - Construction services 54,955 641,935 696,890 869,870 Equipment purchases - -
175,943 679,208 855,151 1,062,427
Other Finance Sources (Uses)Transfers out -
Total other financing sources (uses) - - - -
Excess (deficiency) of revenuesover (under) expenditures 1,424,057 (1,216,781) 207,276 -
Additional project information:Project number 1550-100-10-1019Grant Date 9/28/2010Bond authorization date N/ABonds authorized N/ABonds issued N/AOriginal authorization cost 1,600,000 Additional authorized cost (537,573) Revised authorized cost 1,062,427
Percentage increase over originalauthorized cost -34%
Percentage completion 80%Original target completion date 9/30/2014Revised target completion date
-98-

Exhibit F-1q
FORT LEE BOARD OF EDUCATIONCapital Projects Fund
Schedule of Project Revenues, Expenditures, Project Balances and Project Status-Budgetary BasisLewis F. Cole M.S. AdditionsFiscal Year Ended June 30, 2015
RevisedAuthorized
Prior Periods Current Year Totals CostRevenues and Other Financing Sources
State Sources - SCC Grant - - Bond proceeds and transfers 37,175,000 37,175,000 37,175,000 Transfers from Capital Reserve - - Transfers from Capital Outlay - - Transfers from Emergency Reserve - -
- 37,175,000 37,175,000 37,175,000
Expenditures and Other Financing UsesPurchased professional and technical services 327,824 327,824 3,729,691 Land and improvements - - Construction services 19,798 19,798 33,445,309 Equipment purchases - -
- 347,622 347,622 37,175,000
Other Finance Sources (Uses)Transfers out -
Total other financing sources (uses) - - - -
Excess (deficiency) of revenuesover (under) expenditures - 36,827,378 36,827,378 -
Additional project information:Project number 1550-100-15-1000Grant Date 11/18/2014Bond authorization date N/ABonds authorized N/ABonds issued N/AOriginal authorization cost 37,175,000 Additional authorized costRevised authorized cost 37,175,000
Percentage increase over originalauthorized cost 0%
Percentage completion 1%Original target completion date 12/31/2016Revised target completion date
-99-
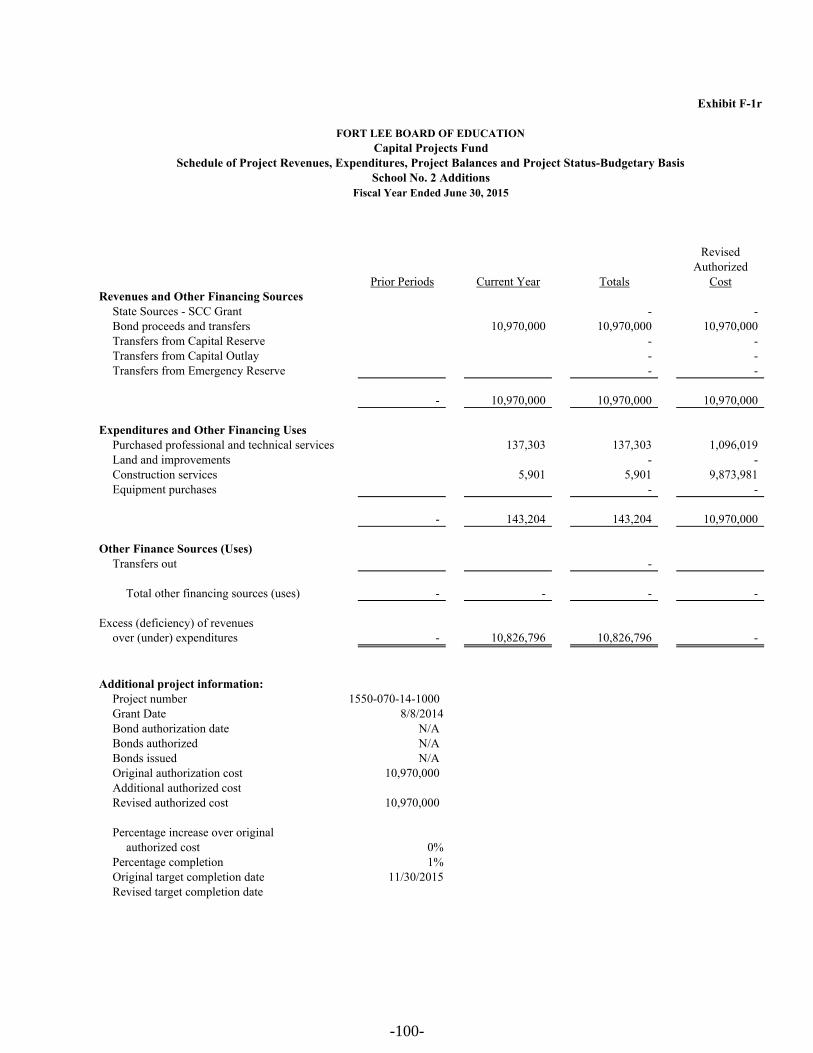
Exhibit F-1r
FORT LEE BOARD OF EDUCATIONCapital Projects Fund
Schedule of Project Revenues, Expenditures, Project Balances and Project Status-Budgetary BasisSchool No. 2 Additions
Fiscal Year Ended June 30, 2015
RevisedAuthorized
Prior Periods Current Year Totals CostRevenues and Other Financing Sources
State Sources - SCC Grant - - Bond proceeds and transfers 10,970,000 10,970,000 10,970,000 Transfers from Capital Reserve - - Transfers from Capital Outlay - - Transfers from Emergency Reserve - -
- 10,970,000 10,970,000 10,970,000
Expenditures and Other Financing UsesPurchased professional and technical services 137,303 137,303 1,096,019 Land and improvements - - Construction services 5,901 5,901 9,873,981 Equipment purchases - -
- 143,204 143,204 10,970,000
Other Finance Sources (Uses)Transfers out -
Total other financing sources (uses) - - - -
Excess (deficiency) of revenuesover (under) expenditures - 10,826,796 10,826,796 -
Additional project information:Project number 1550-070-14-1000Grant Date 8/8/2014Bond authorization date N/ABonds authorized N/ABonds issued N/AOriginal authorization cost 10,970,000 Additional authorized costRevised authorized cost 10,970,000
Percentage increase over originalauthorized cost 0%
Percentage completion 1%Original target completion date 11/30/2015Revised target completion date
-100-

Exhibit F-1s
FORT LEE BOARD OF EDUCATIONCapital Projects Fund
Schedule of Project Revenues, Expenditures, Project Balances and Project Status-Budgetary BasisHigh School Field Improvements
Fiscal Year Ended June 30, 2015
RevisedAuthorized
Prior Periods Current Year Totals CostRevenues and Other Financing Sources
State Sources - SCC Grant - - Bond proceeds and transfers 1,695,000 1,695,000 1,695,000 Transfers from Capital Reserve - - Transfers from Capital Outlay - - Transfers from Emergency Reserve - -
- 1,695,000 1,695,000 1,695,000
Expenditures and Other Financing UsesPurchased professional and technical services 75,621 75,621 155,000 Land and improvements - - Construction services 307,075 307,075 1,540,000 Equipment purchases - -
- 382,696 382,696 1,695,000
Other Finance Sources (Uses)Transfers out -
Total other financing sources (uses) - - - -
Excess (deficiency) of revenuesover (under) expenditures - 1,312,304 1,312,304 -
Additional project information:Project numberGrant DateBond authorization date N/ABonds authorized N/ABonds issued N/AOriginal authorization cost 1,695,000 Additional authorized costRevised authorized cost 1,695,000
Percentage increase over originalauthorized cost 0%
Percentage completion 23%Original target completion date 12/31/2016Revised target completion date
-101-

Exh
ibit
F-2
FO
RT
LE
E B
OA
RD
OF
ED
UC
AT
ION
Cap
ital
Pro
ject
s F
un
dS
um
mar
y S
tate
men
t of
Pro
ject
Exp
end
itu
res
Fis
cal Y
ear
En
ded
Ju
ne
30, 2
015
Un
exp
end
edP
roje
ct F
un
ds
Un
exp
end
edP
rior
Cu
rren
tT
ran
sfer
red
Bal
ance
Dat
eA
pp
rop
riat
ion
sY
ears
Yea
rO
ut
Jun
e 30
, 201
5
Hig
h S
choo
l Win
dow
Rep
lace
men
t20
11-2
012
1,05
0,00
0
53
,000
-
99
7,00
0
Hig
h S
choo
l Mas
onry
Rep
airs
2011
-201
232
7,87
9
327,
879
-
-
Hig
h S
choo
l Int
erio
r A
lter
atio
ns20
11-2
012
3,41
7,07
7
1,
811,
038
1,60
6,03
9
-
Hig
h S
choo
l HV
AC
Upg
rade
s20
11-2
012
481,
492
48
1,49
2
-
-
Sch
ool N
o. 1
HV
AC
Upg
rade
s20
11-2
012
819,
796
81
9,79
6
-
-
Sch
ool N
o. 1
Roo
f R
epla
cem
ent
2011
-201
293
0,18
5
930,
185
-
-
Sch
ool N
o. 1
Win
dow
Rep
lace
men
t20
11-2
012
378,
252
34
6,83
2
31,4
20
-
Sch
ool N
o. 3
Win
dow
Rep
lace
men
t20
11-2
012
366,
252
31
3,37
0
52,8
82
-
Sch
ool N
o. 3
Mas
onry
Rep
airs
2011
-201
222
0,98
2
220,
982
-
-
Sch
ool N
o. 4
Mas
onry
Rep
airs
2011
-201
217
4,76
8
174,
768
-
-
Sch
ool N
o. 4
HV
AC
Upg
rade
s20
11-2
012
3,26
0,63
2
1,
618,
361
1,50
2,03
1
140,
240
Sch
ool N
o. 4
Roo
f R
epla
cem
ent
2011
-201
248
0,30
3
314,
449
13
8,00
0
27
,854
Lew
is F
. Col
e M
.S. R
oof
Rep
lace
men
t20
11-2
012
1,37
0,77
4
1,
370,
774
-
-
Lew
is F
. Col
e M
.S. B
oile
r R
epla
cem
ent
2011
-201
262
2,19
4
622,
194
-
-
Lew
is F
. Col
e M
.S. A
ddit
ion
and
Reh
abil
itat
ion
2011
-201
213
,005
,265
1,
802,
154
8,57
6,87
0
2,62
6,24
1
Lew
is F
. Col
e M
.S. I
nter
ior
Alt
erat
ions
2011
-201
21,
062,
427
175,
943
67
9,20
8
20
7,27
6
Lew
is F
. Col
e M
.S. A
ddit
ions
2014
-201
537
,175
,000
-
34
7,62
2
36
,827
,378
Sch
ool N
o. 2
Add
itio
ns20
14-2
015
10,9
70,0
00
-
143,
204
10,8
26,7
96
Hig
h S
choo
l Fie
ld I
mpr
ovem
ents
2014
-201
51,
695,
000
-
382,
696
1,31
2,30
4
77,8
08,2
78
11,3
83,2
17
13,4
59,9
72
-
52,9
65,0
89
Pro
ject
Tit
le/I
ssu
e
Exp
end
itu
res
to D
ate
-102-

PROPRIETARY FUNDS

Exhibit G-1
FoodService
Program Totals
ASSETS
Current assets:Cash and cash equivalents 217,160 217,160 Accounts receivable:
State 3,360 3,360 Federal 79,121 79,121 Other 4,054 4,054
Interfund accounts receivable 47,644 47,644 Inventories 8,541 8,541 Total current assets 359,880 359,880
Noncurrent assets:Capital assets: Equipment 449,143 449,143 Less accumulated depreciation (352,815) (352,815) Total capital assets (net of accumulated depreciation) 96,328 96,328 Total assets 456,208 456,208
LIABILITIES
Current Liabilities:Accounts Payable 72,662 72,662 Prepaid Revenue 15,687 15,687
Total Liabilities 88,349 88,349
NET POSITION
Net investment in capital assets 96,328 96,328 Unrestricted 271,531 271,531 Total net position 367,859 367,859
FORT LEE BOARD OF EDUCATIONCombining Statement of Net Position
Enterprise FundsJune 30, 2015
-103-
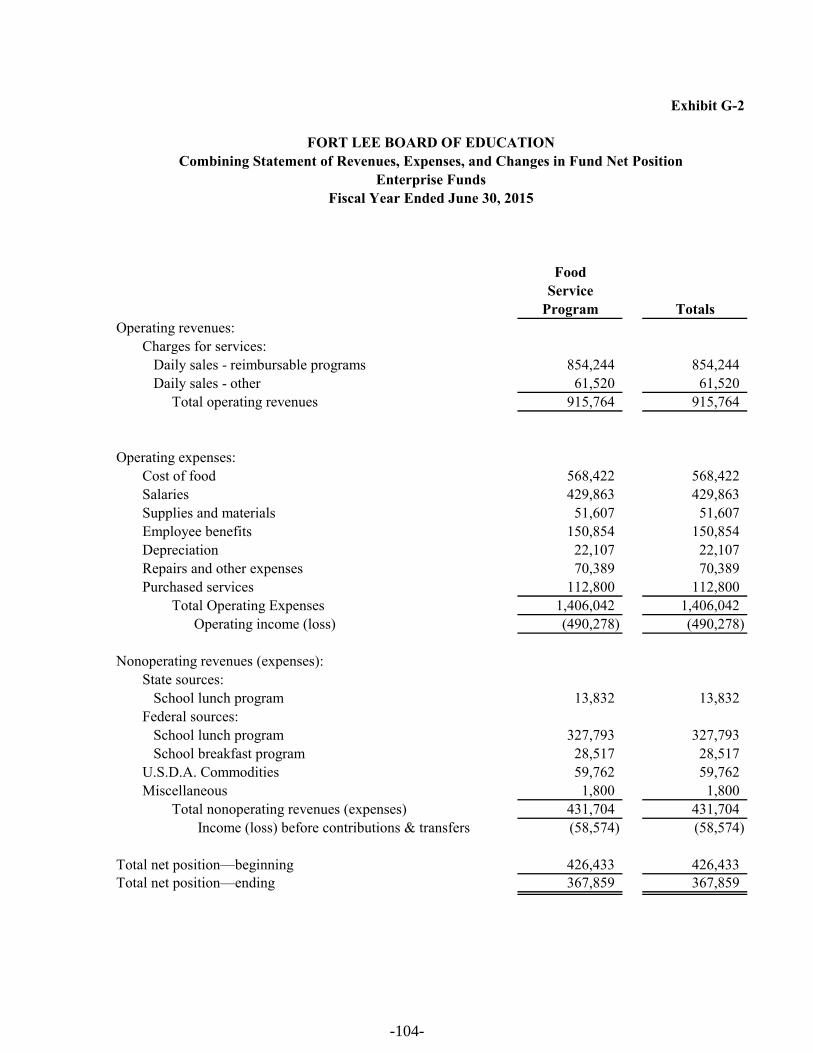
Exhibit G-2
FoodService
Program TotalsOperating revenues:
Charges for services: Daily sales - reimbursable programs 854,244 854,244 Daily sales - other 61,520 61,520 Total operating revenues 915,764 915,764
Operating expenses:Cost of food 568,422 568,422 Salaries 429,863 429,863 Supplies and materials 51,607 51,607 Employee benefits 150,854 150,854 Depreciation 22,107 22,107 Repairs and other expenses 70,389 70,389 Purchased services 112,800 112,800 Total Operating Expenses 1,406,042 1,406,042 Operating income (loss) (490,278) (490,278)
Nonoperating revenues (expenses):State sources: School lunch program 13,832 13,832 Federal sources: School lunch program 327,793 327,793 School breakfast program 28,517 28,517 U.S.D.A. Commodities 59,762 59,762 Miscellaneous 1,800 1,800 Total nonoperating revenues (expenses) 431,704 431,704 Income (loss) before contributions & transfers (58,574) (58,574)
Total net position—beginning 426,433 426,433 Total net position—ending 367,859 367,859
FORT LEE BOARD OF EDUCATIONCombining Statement of Revenues, Expenses, and Changes in Fund Net Position
Enterprise FundsFiscal Year Ended June 30, 2015
-104-

Exhibit G-3
FORT LEE BOARD OF EDUCATIONCombining Statement of Cash Flows
Enterprise FundsFiscal Year Ended June 30, 2015
FoodService
Program Totals
CASH FLOWS FROM OPERATING ACTIVITIESReceipts from customers 928,217 928,217 Payments to suppliers (1,372,584) (1,372,584) Net cash provided by (used for) operating activities (444,367) (444,367)
CASH FLOWS FROM NONCAPITAL FINANCING ACTIVITIESState Sources 10,533 10,533 Federal Sources 261,429 261,429 Interfunds 3,945 3,945 Net cash provided by (used for) non-capital financing activities 275,907 271,962
CASH FLOWS FROM CAPITAL AND RELATED FINANCING ACTIVITIESAcquisition of capital assets (52,495) (52,495) Net cash used for capital and related financing activities (52,495) (52,495)
Net increase (decrease) in cash and cash equivalents (220,955) (224,900)
Balances—beginning of year 438,115 438,115 Balances—end of year 217,160 213,215
Reconciliation of operating income (loss) to net cash provided (used) by operating activities: Operating income (loss) (490,278) (490,278) Adjustments to reconcile operating income (loss) to net cash provided by Depreciation and net amortization 22,107 22,107 Food distribution program 59,762 59,762 (Increase) decrease in accounts receivable 20,544 20,544 (Increase) decrease in interfunds receivable (5,815) (5,815) (Increase) decrease in inventories (3,370) (3,370) Increase (decrease) in prepaid revenue (2,276) (2,276) Increase (decrease) in accounts payable (45,041) (45,041) Total adjustments 45,911 45,911 Net cash provided by (used for) operating activities (444,367) (444,367)
-105-

FIDUCIARY FUND

Exhibit H-1
FORT LEE BOARD OF EDUCATIONCombining Statement of Fiduciary Net Position
Fiduciary FundsJune 30, 2015
PrivatePurpose Unemployment
Scholarship Compensation Agency Fund Trust Fund Funds
ASSETSCash and cash equivalents 31,258 317,850 391,967 Miscellaneous receivables 1,745 Interfund receivables 12,938 Total assets 31,258 330,788 393,712
LIABILITIES Accounts payable 288,277 Interfunds payable 43,524 Payable to student groups 61,911 Due to State of NJ - Unemployment 7,316 Total liabilities - 7,316 393,712
NET POSITIONReserved
Principal portion 5,000 Held in trust for unemployment claims and other purposes 323,472
Reserved for scholarships 26,258
31,258
-106-

Exhibit H-2
PrivatePurpose Unemployment
Scholarship CompensationFund Trust Fund
ADDITIONSContributions: Donations 3,672 Payroll withholdings 48,768 Total Contributions 3,672 48,768
Investment earnings: Interest 237 Net investment earnings - 237 Total additions 3,672 49,005
DEDUCTIONSQuarterly contribution reports 102,874 Scholarships awarded 4,300 Total deductions 4,300 102,874
OTHER CHANGES TO FIDUCIARY NET ASSETS Change in net assets (628) (53,869) Net position—beginning of the year 31,886 377,341 Net position—end of the year 31,258 323,472
FORT LEE BOARD OF EDUCATIONCombining Statement of Changes in Fiduciary Net Position
Fiduciary FundsFiscal Year Ended June 30, 2015
-107-
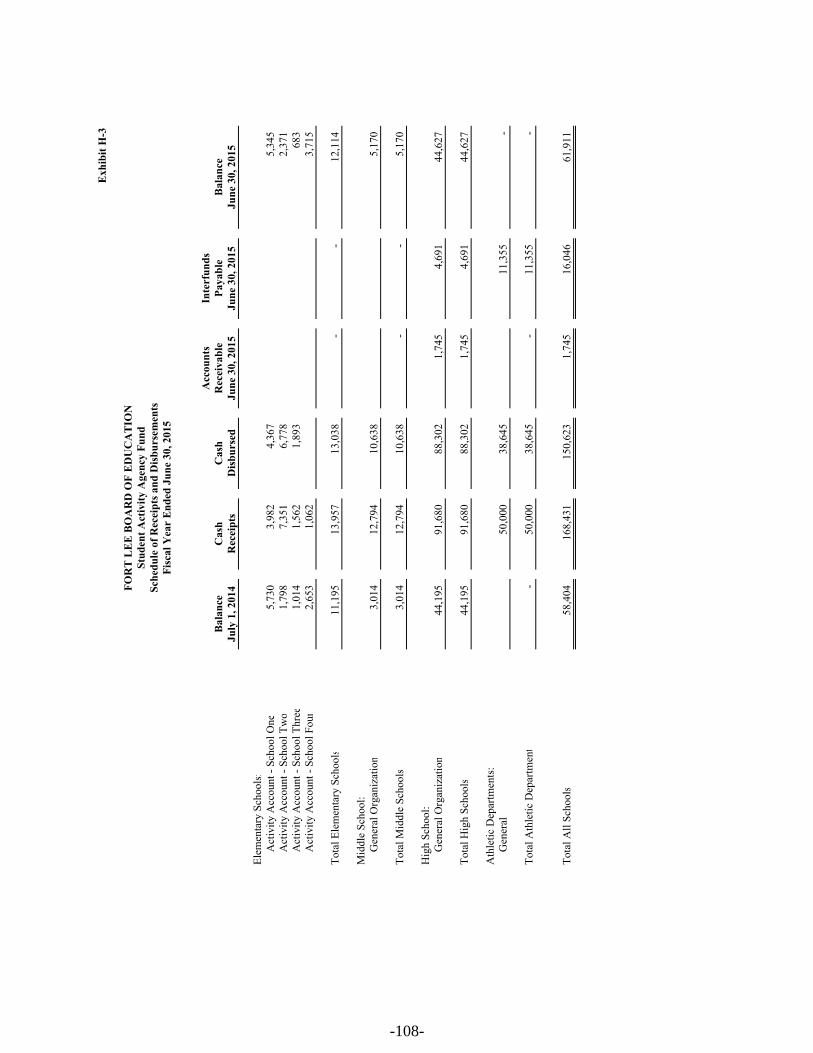
Exh
ibit
H-3
FO
RT
LE
E B
OA
RD
OF
ED
UC
AT
ION
Stu
den
t A
ctiv
ity
Age
ncy
Fu
nd
Sch
edu
le o
f R
ecei
pts
an
d D
isb
urs
emen
tsF
isca
l Yea
r E
nd
ed J
un
e 30
, 201
5
Acc
oun
tsIn
terf
un
ds
Bal
ance
Cas
hC
ash
Rec
eiva
ble
Pay
able
Bal
ance
July
1, 2
014
Rec
eip
tsD
isb
urs
edJu
ne
30, 2
015
Jun
e 30
, 201
5Ju
ne
30, 2
015
Ele
men
tary
Sch
ools
:A
ctiv
ity
Acc
ount
- S
choo
l One
5,73
0
3,98
2
4,36
7
5,34
5
Act
ivit
y A
ccou
nt -
Sch
ool T
wo
1,79
8
7,35
1
6,77
8
2,37
1
Act
ivit
y A
ccou
nt -
Sch
ool T
hre e
1,01
4
1,56
2
1,89
3
683
Act
ivit
y A
ccou
nt -
Sch
ool F
our
2,65
3
1,06
2
3,71
5
Tot
al E
lem
enta
ry S
choo
l s11
,195
13,9
57
13
,038
-
-
12,1
14
Mid
dle
Sch
ool:
Gen
eral
Org
aniz
atio
n3,
014
12
,794
10,6
38
5,
170
Tot
al M
iddl
e S
choo
l s3,
014
12
,794
10,6
38
-
-
5,
170
Hig
h S
choo
l:G
ener
al O
rgan
izat
ion
44,1
95
91
,680
88,3
02
1,
745
4,69
1
44
,627
Tot
al H
igh
Sch
ool s
44,1
95
91
,680
88,3
02
1,
745
4,69
1
44
,627
Ath
leti
c D
epar
tmen
ts:
Gen
eral
50
,000
38,6
45
11
,355
-
Tot
al A
thle
tic
Dep
artm
ent
-
50,0
00
38
,645
-
11,3
55
-
Tot
al A
ll S
choo
ls58
,404
168,
431
15
0,62
3
1,74
5
16
,046
61
,911
-108-

Exh
ibit
H-4
FO
RT
LE
E B
OA
RD
OF
ED
UC
AT
ION
Pay
roll
Age
ncy
Fu
nd
Sch
edu
le o
f R
ecei
pts
an
d D
isb
urs
emen
tsF
isca
l Yea
r E
nd
ed J
un
e 30
, 201
5
Acc
oun
tsB
alan
ceC
ash
Cas
hP
ayab
leB
alan
ceJu
ly 1
, 201
4R
ecei
pts
Dis
bu
rsed
Jun
e 30
, 201
5Ju
ne
30, 2
015
N
et p
ayro
ll20
,353
,705
20
,353
,705
-
P
ayro
ll d
educ
tion
s
a
nd w
ithh
oldi
ngs
-
16,8
42,2
75
16,5
58,4
28
283,
847
-
Fle
xibl
e S
pend
ing
Acc
ount
-
55,4
47
51
,017
4,43
0
-
Int
erfu
nds
paya
ble
15,1
96
27
,478
15,1
96
27
,478
$15
,196
37,2
78,9
05
36,9
78,3
46
288,
277
27,4
78
-109-

LONG-TERM DEBT

Exh
ibit
I-1
Bal
ance
,B
alan
ce,
Dat
e of
Am
ount
of
Ann
ual M
atur
itie
sIn
tere
stJu
ly 1
,Ju
ne 3
0,Is
sue
Issu
eIs
sue
Dat
eA
mou
ntR
ate
2014
Issu
edR
etir
ed20
15
BC
IA I
mpr
ovem
ent B
onds
Aug
ust 7
, 201
218
,450
,000
11/1
/201
568
5,00
03.
000
$17
,015
,000
665,
000
$16
,350
,000
11/1
/201
670
5,00
03.
000
11/1
/201
773
0,00
04.
000
11/1
/201
876
0,00
04.
000
11/1
/201
927
5,00
03.
000
11/1
/201
950
0,00
05.
000
11/1
/202
082
5,00
04.
000
11/1
/202
185
5,00
04.
000
11/1
/202
289
5,00
05.
000
11/1
/202
394
0,00
05.
000
11/1
/202
499
0,00
05.
000
11/1
/202
51,
035,
000
4.00
011
/1/2
026
1,08
0,00
04.
000
11/1
/202
71,
120,
000
4.00
011
/1/2
028
1,17
0,00
04.
000
11/1
/202
91,
215,
000
4.00
011
/1/2
030
1,26
5,00
04.
000
11/1
/203
11,
305,
000
4.00
0
FO
RT
LE
E B
OA
RD
OF
ED
UC
AT
ION
Gen
eral
Lon
g-T
erm
Deb
t A
ccou
nt
Gro
up
Sch
edu
le o
f S
eria
l Bon
ds
Fis
cal Y
ear
En
ded
Ju
ne
30, 2
015
-110-

Exh
ibit
I-1
Bal
ance
,B
alan
ce,
Dat
e of
Am
ount
of
Ann
ual M
atur
itie
sIn
tere
stJu
ly 1
,Ju
ne 3
0,Is
sue
Issu
eIs
sue
Dat
eA
mou
ntR
ate
2014
Issu
edR
etir
ed20
15
FO
RT
LE
E B
OA
RD
OF
ED
UC
AT
ION
Gen
eral
Lon
g-T
erm
Deb
t A
ccou
nt
Gro
up
Sch
edu
le o
f S
eria
l Bon
ds
Fis
cal Y
ear
En
ded
Ju
ne
30, 2
015
Gen
eral
Ser
ial B
onds
Apr
il 7
, 201
549
,840
,000
3/15
/201
71,
565,
000
3.00
049
,840
,000
49,8
40,0
003/
15/2
018
1,39
0,00
03.
000
3/15
/201
91,
415,
000
3.00
03/
15/2
020
1,45
5,00
03.
000
3/15
/202
11,
500,
000
3.00
03/
15/2
022
1,55
0,00
03.
000
3/15
/202
31,
595,
000
3.00
03/
15/2
024
1,65
0,00
03.
000
3/15
/202
51,
700,
000
3.00
03/
15/2
026
1,75
5,00
03.
000
3/15
/202
71,
810,
000
3.00
03/
15/2
028
1,87
0,00
03.
000
3/15
/202
91,
930,
000
3.12
53/
15/2
030
1,99
0,00
03.
250
3/15
/203
12,
055,
000
3.25
03/
15/2
032
2,12
5,00
03.
250
3/15
/203
32,
195,
000
3.25
03/
15/2
034
2,27
0,00
03.
250
3/15
/203
52,
345,
000
3.50
03/
15/2
036
2,43
5,00
03.
500
3/15
/203
72,
510,
000
3.50
03/
15/2
038
2,58
0,00
03.
500
3/15
/203
92,
650,
000
3.50
03/
15/2
040
2,72
0,00
03.
500
3/15
/204
12,
780,
000
3.50
0
$17
,015
,000
49,8
40,0
0066
5,00
066
,190
,000
-111-

Exh
ibit
I-2
Bal
ance
,B
alan
ce,
Dat
e of
Am
ount
of
Pri
ncip
al P
aym
ent
Inte
rest
June
30,
June
30,
Issu
eL
ease
Lea
seD
ate
Am
ount
Rat
e20
14Is
sued
Ret
ired
2015
Dis
tric
t Wir
eles
s S
yste
mJu
ne 2
5, 2
013
354,
919
7/1/
1568
,817
2.56
7%
280,
663
68,8
6821
1,79
57/
1/16
70,5
832.
567
%7/
1/17
72,3
952.
567
%
12 T
empo
rary
Cla
ssro
om
Uni
tsJu
ne 9
, 201
41,
967,
725
7/7/
1520
8,98
11.
461
%1,
967,
725
1,96
7,72
51/
7/16
211,
332
1.46
1%
7/7/
1621
3,70
91.
461
%1/
7/17
216,
114
1.46
1%
7/7/
1721
8,54
51.
461
%1/
7/18
221,
004
1.46
1%
7/7/
1822
3,49
01.
461
%1/
7/19
226,
004
1.46
1%
7/7/
1922
8,54
71.
461
%
FO
RT
LE
E B
OA
RD
OF
ED
UC
AT
ION
Gen
eral
Lon
g-T
erm
Deb
t A
ccou
nt
Gro
up
Sch
edu
le o
f C
apit
al L
ease
sF
isca
l Yea
r E
nd
ed J
un
e 30
, 201
5
-112-

Exh
ibit
I-2
Bal
ance
,B
alan
ce,
Dat
e of
Am
ount
of
Pri
ncip
al P
aym
ent
Inte
rest
June
30,
June
30,
Issu
eL
ease
Lea
seD
ate
Am
ount
Rat
e20
14Is
sued
Ret
ired
2015
FO
RT
LE
E B
OA
RD
OF
ED
UC
AT
ION
Gen
eral
Lon
g-T
erm
Deb
t A
ccou
nt
Gro
up
Sch
edu
le o
f C
apit
al L
ease
sF
isca
l Yea
r E
nd
ed J
un
e 30
, 201
5
Ene
rgy
Sav
ings
Inv
estm
ent
P
lan
Apr
il 1
6, 2
015
5,57
1,44
410
/16/
1614
0,65
22.
495
%5,
571,
444
5,57
1,44
44/
16/1
714
2,48
12.
495
%10
/16/
1715
4,28
82.
495
%4/
16/1
815
6,29
42.
495
%10
/16/
1813
3,52
62.
495
%4/
16/1
913
5,26
22.
495
%10
/16/
1914
2,23
22.
495
%4/
16/2
014
4,08
12.
495
%10
/16/
2015
0,99
42.
495
%4/
16/2
115
2,95
72.
495
%10
/16/
2115
5,58
32.
495
%4/
16/2
215
7,60
62.
495
%10
/16/
2216
5,11
22.
495
%4/
16/2
316
7,25
82.
495
%10
/16/
2317
5,02
42.
495
%4/
16/2
417
7,30
02.
495
%10
/16/
2418
5,33
72.
495
%4/
16/2
518
7,74
62.
495
%10
/16/
2519
6,06
22.
495
%4/
16/2
619
8,61
12.
495
%10
/16/
2620
7,21
22.
495
%4/
16/2
720
9,90
62.
495
%10
/16/
2721
8,80
72.
495
%4/
16/2
822
1,65
22.
495
%10
/16/
2823
0,85
82.
495
%4/
16/2
923
3,86
02.
495
%10
/16/
2924
3,38
22.
495
%4/
16/3
024
6,54
62.
495
%10
/16/
3025
6,39
62.
495
%4/
16/3
128
4,41
92.
495
%
$2,
248,
388
5,57
1,44
468
,868
7,75
0,96
4
-113-

Exh
ibit
I-3
FO
RT
LE
E B
OA
RD
OF
ED
UC
AT
ION
Bu
dge
tary
Com
par
ison
Sch
edu
le
Deb
t S
ervi
ce F
un
dF
isca
l Yea
r E
nd
ed J
un
e 30
, 201
5
Var
ianc
eO
rigi
nal
Bud
get
Fin
alP
osit
ive
(Neg
ativ
e)B
udge
tT
rans
fers
Bud
get
Act
ual
Fin
al to
Act
ual
RE
VE
NU
ES
:L
ocal
Sou
rces
:L
ocal
Tax
Lev
y1,
268,
945
1,
268,
945
1,
268,
945
-
Tot
al R
even
ues
1,26
8,94
5
-
1,
268,
945
1,
268,
945
-
EX
PE
ND
ITU
RE
S:
Reg
ular
Deb
t Ser
vice
:In
tere
st68
0,57
5
68
0,57
5
68
0,57
5
-
R
edem
ptio
n of
Pri
ncip
al66
5,00
0
66
5,00
0
66
5,00
0
-
Tot
al R
egul
ar D
ebt S
ervi
ce1,
345,
575
-
1,34
5,57
5
1,34
5,57
5
-
Tot
al e
xpen
dit
ure
s1,
345,
575
-
1,34
5,57
5
1,34
5,57
5
-
Exc
ess
(Def
icie
ncy)
of
Rev
enue
s O
ver
(Und
er)
Exp
endi
ture
s(7
6,63
0)
-
(76,
630)
(76,
630)
-
Oth
er F
inan
cing
Sou
rces
/(U
ses)
: O
pera
ting
Tra
nsfe
rs I
n:In
tere
st e
arne
d in
Cap
ital
Pro
ject
s F
und
-
61
,946
61
,946
Tot
al O
ther
Fin
anci
ng S
ourc
es/(
Use
s)-
-
-
61,9
46
61,9
46
Exc
ess
(Def
icie
ncy)
of
Rev
enue
s an
d O
ther
Fin
anci
ng S
ourc
es O
ver
(Und
er)
Exp
endi
ture
s(7
6,63
0)
-
(76,
630)
(14,
684)
61,9
46
Fun
d B
alan
ce, J
uly
178
,838
-
78,8
38
78,8
38
-
Fun
d B
alan
ce, J
une
302,
208
-
2,20
8
64,1
54
61,9
46
Rec
apit
ula
tion
of
Exc
ess
(Def
icie
ncy
) of
Rev
enu
es O
ver
(Un
der
) E
xpen
dit
ure
s
Bud
gete
d F
und
Bal
ance
(76,
630)
(76,
630)
(76,
630)
-
Ope
rati
ng T
rans
fer
In61
,946
61
,946
Tot
al(7
6,63
0)
-
(76,
630)
(14,
684)
61,9
46
-114-

STATISTICAL SECTION

STATISTICAL SECTION (UNAUDITED)
Introduction to the Statistical Section
Financial Trends
J-1 Net Assets/Position by Component
J-2 Changes in Net Assets/Position
J-3 Fund Balances - Governmental Funds
J-4 Changes in Fund Balances - Governmental Funds
J-5 General Fund Other Local Revenue by Source
Revenue Capacity
J-6 Assessed Value and Estimated Actual Value of Taxable Property
J-7 Direct and Overlapping Property Tax Rates
J-8 Principal Property Taxpayers
J-9 Property Tax Levies and Collections
Debt Capacity
J-10 Ratios of Outstanding Debt by Type
J-11 Ratios of General Bonded Debt Outstanding
J-12 Direct and Overlapping Governmental Activities Debt
J-13 Legal Debt Margin Information
Demographic and Economic Information
J-14 Demographic and Economic Statistics
J-15 Principal Employers
Operating Information
J-16 Full-time Equivalent District Employees by Function/Program
J-17 Operating Statistics
J-18 School Building Information*
J-19 Schedule of Allowable Maintenance Expenditures by School Facility
J-20 Insurance Schedule

STATISTICAL SECTION (UNAUDITED) - INTRODUCTION
J SERIES
Contents Page
Financial TrendsThese schedules contain trend information to help the readerunderstand how the district’s financial performance andwell-being have changes over time. J-1 to J-5
Revenue CapacityThese schedules contain information to help the reader assessthe district’s most significant local revenue sources, theproperty tax. J-6 to J-9
Debt CapacityThese schedules present information to help the reader assessthe affordability of the district’s current levels of outstandingdebt and the district’s ability to issue additional debt in thefuture. J-10 to J-13
Demographic and Economic InformationThese schedules offer demographic and economic indicatorsto help the reader understand the environment within whichthe district’s financial activities take place. J-14 to J-15
Operating InformationThese schedules contain service and infrastructure data tohelp the reader understand how the information in thedistrict’s financial report relates to the services the districtprovides and the activities it performs. J-16 to J-20
Sources: Unless otherwise noted, the information in these schedules isderived from the comprehensive annual financial reports(CAFR) for the relevant year. The district implemented GASBStatement 34 in the fiscal year ending June 30, 2004; schedulespresenting district-wide information include informationbeginning in that year.

Exh
ibit
J-1
2006
2007
2008
2009
2010
2011
2012
2013
2014
2015
Gov
ernm
enta
l act
iviti
esN
et in
vest
men
t in
capi
tal a
sset
s12
,708
,878
$
14,1
13,7
41$
14
,267
,966
$
10,9
50,9
10$
13
,327
,585
$
12,7
58,8
56$
14
,116
,324
$
(1,2
78,9
60)
$
3,99
4,84
2$
(36,
171,
048)
$
Res
trict
ed3,
061,
302
2,
748,
475
2,
876,
841
3,
184,
034
2,
015,
950
3,05
4,35
8
4,
869,
850
22,6
50,0
12
18
,051
,812
56,0
01,4
77
U
nres
trict
ed(5
,916
,252
)
(5
,581
,765
)
(4
,680
,195
)
(4
,454
,396
)
(5
,705
,497
)
(5
,079
,224
)
(4
,733
,750
)
(4
,809
,592
)
(4
,233
,820
)
(1
7,66
2,59
4)
To
tal g
over
nmen
tal a
ctiv
ities
net
ass
ets
9,85
3,92
8$
11,2
80,4
51$
12
,464
,612
$
9,68
0,54
8$
9,63
8,03
8$
10
,733
,990
$
14,2
52,4
24$
16
,561
,460
$
17,8
12,8
34$
2,
167,
835
$
Bus
ines
s-ty
pe a
ctiv
ities
Net
inve
stm
ent i
n ca
pita
l ass
ets
153,
302
$
355,
041
$
305,
612
$
139,
334
$
86,6
09$
10
0,02
4$
92,7
72$
79
,460
$
65,9
40$
96
,328
$
R
estri
cted
Unr
estri
cted
657,
171
538,
598
310,
523
197,
002
228,
977
295,
328
449,
260
574,
732
360,
493
271,
531
Tota
l bus
ines
s-ty
pe a
ctiv
ities
net
ass
ets
810,
473
$
893,
639
$
616,
135
$
336,
336
$
315,
586
$
39
5,35
2$
542,
032
$
65
4,19
2$
42
6,43
3$
36
7,85
9$
Dis
trict
-wid
eN
et in
vest
men
t in
capi
tal a
sset
s12
,862
,180
$
14,4
68,7
82$
14
,573
,578
$
11,0
90,2
44$
13
,414
,194
$
12,8
58,8
80$
14
,209
,096
$
(1,1
99,5
00)
$
4,06
0,78
2$
(36,
074,
720)
$
Res
trict
ed3,
061,
302
2,
748,
475
2,
876,
841
3,
184,
034
2,
015,
950
3,05
4,35
8
4,
869,
850
22,6
50,0
12
18
,051
,812
56,0
01,4
77
U
nres
trict
ed(5
,259
,081
)
(5
,043
,167
)
(4
,369
,672
)
(4
,257
,394
)
(5
,476
,520
)
(4
,783
,896
)
(4
,284
,490
)
(4
,234
,860
)
(3
,873
,327
)
(1
7,39
1,06
3)
To
tal d
istri
ct n
et a
sset
s10
,664
,401
$
12,1
74,0
90$
13
,080
,747
$
10,0
16,8
84$
9,
953,
624
$
11,1
29,3
42$
14
,794
,456
$
17,2
15,6
52$
18
,239
,267
$
2,53
5,69
4$
* - G
ASB
Sta
tem
ent N
o. 6
3 be
cam
e ef
fect
ive
for t
he fi
scal
yea
r end
ed Ju
ne 3
0, 2
014
whi
ch c
hang
ed N
et A
sets
to N
et P
ositi
on.
Sour
ce:
CA
FR E
xhib
it A
-1
Fort
Lee
Boa
rd o
f Edu
catio
nN
et A
sset
s/Po
sitio
n* b
y C
ompo
nent
Las
t Ten
Fis
cal Y
ears
(acc
rual
bas
is o
f acc
ount
ing)
-115-

Exh
ibit
J-2
2006
2007
2008
2009
2010
2011
2012
2013
2014
2015
Exp
ense
sG
over
nmen
tal a
ctiv
ities
Inst
ruct
ion
Reg
ular
21,1
03,6
65$
22
,819
,372
$
23,2
62,9
61$
20
,525
,561
$
22,8
52,2
91$
22
,037
,507
$
21,9
69,1
82$
23
,773
,786
$
23,8
15,2
29$
27
,939
,247
$
Spec
ial e
duca
tion
2,67
6,50
8
2,86
1,24
7
2,61
3,51
2
2,28
2,10
3
3,14
6,97
7
4,14
6,53
6
4,82
0,81
5
5,48
0,92
7
5,08
1,13
1
5,28
5,67
1
Oth
er sp
ecia
l edu
catio
n1,
857,
142
2,
183,
453
2,
257,
617
2,
313,
667
2,
646,
190
2,
506,
824
2,
501,
588
2,
439,
814
2,
680,
798
3,
111,
092
O
ther
inst
ruct
ion
866,
530
1,05
1,00
7
1,06
5,48
8
1,21
9,43
8
910,
661
954,
758
955,
886
1,00
3,25
1
1,31
3,64
5
1,43
4,80
6
Supp
ort S
ervi
ces:
Tuiti
on3,
677,
911
4,
358,
617
4,
246,
167
4,
650,
182
4,
178,
690
3,
149,
926
3,
315,
783
3,
472,
301
3,
496,
240
3,
792,
977
St
uden
t & in
stru
ctio
n re
late
d se
rvic
es5,
709,
233
6,
587,
759
6,
927,
382
7,
038,
342
8,
250,
972
8,
138,
886
8,
165,
565
9,
010,
969
9,
078,
827
10
,175
,398
Scho
ol a
dmin
istra
tive
serv
ices
3,07
8,16
6
3,14
0,11
2
3,31
0,44
0
2,85
8,20
9
3,16
3,42
5
3,32
7,08
0
2,74
4,67
7
2,54
9,70
0
2,98
7,54
0
3,36
1,02
9
Gen
eral
adm
inis
trativ
e se
rvic
es1,
532,
120
1,
766,
260
1,
768,
959
1,
623,
595
1,
654,
299
1,
428,
638
1,
304,
146
1,
315,
155
1,
591,
783
1,
685,
546
C
entra
l ser
vice
s and
adm
inis
trativ
ein
form
atio
n te
chno
logy
783,
099
890,
773
931,
765
792,
153
830,
678
869,
440
892,
131
880,
547
1,11
3,87
7
1,16
7,62
6
Bus
ines
s and
oth
er su
ppor
t ser
vice
sPl
ant o
pera
tions
and
mai
nten
ance
5,29
8,10
9
5,52
0,39
5
5,36
0,19
2
5,40
9,96
8
5,28
2,70
4
4,33
4,19
1
4,53
6,97
8
4,69
7,86
2
5,15
8,78
2
5,62
4,08
2
Pupi
l tra
nspo
rtatio
n1,
138,
842
1,
513,
638
1,
520,
693
1,
743,
806
1,
560,
289
1,
343,
168
1,
480,
585
1,
493,
593
1,
616,
017
1,
711,
881
U
nallo
cate
d B
enef
its3,
996,
266
4,
026,
554
3,
493,
585
3,
799,
983
5,
939,
141
4,
118,
192
5,
883,
397
Sp
ecia
l Sch
ools
69,2
89
79
,426
78,7
34
C
harte
r Sch
ools
9,68
6
Inte
rest
on
long
-term
deb
t1,
993
5,
360
(1
,730
)
(1
,800
)
61
6,66
4
69
9,44
4
86
8,91
3
U
nallo
cate
d de
prec
iatio
n1,
092,
808
1,
147,
370
74
7,08
1
75
7,54
7
74
5,85
0
74
6,95
5
73
1,45
7
90
2,36
6
98
2,63
0
97
6,85
0
A
mor
tizat
ion
& C
apita
l Lea
se O
blig
atio
ns(1
98,0
00)
(1
98,0
00)
(1
98,0
00)
C
apita
l Out
lay
- non
depr
ecia
ble
294,
537
490
364,
675
3,37
8,02
1
5,58
8,97
9
Tota
l gov
ernm
enta
l act
iviti
es e
xpen
ses
48,8
83,4
22
53
,919
,429
54,0
90,9
91
55
,507
,367
59,2
54,9
40
56
,475
,764
57,2
17,4
66
63
,742
,751
66,9
14,1
56
78
,419
,180
Bus
ines
s-ty
pe a
ctiv
ities
:Fo
od se
rvic
e97
2,68
7
99
4,44
8
1,
035,
099
1,
069,
784
1,
087,
838
1,
147,
633
1,
123,
403
1,
211,
683
1,
246,
312
1,
406,
042
La
tchk
ey p
rogr
am20
3,43
5
22
1,45
2
25
1,97
9
69
6,12
7
35
5,21
4
49
2,73
7
50
1,27
3
52
1,02
4
25
5,71
1
-
Tota
l bus
ines
s-ty
pe a
ctiv
ities
exp
ense
1,17
6,12
2
1,21
5,90
0
1,28
7,07
8
1,76
5,91
1
1,44
3,05
2
1,64
0,37
0
1,62
4,67
6
1,73
2,70
7
1,50
2,02
3
1,40
6,04
2
Tota
l dis
trict
exp
ense
s50
,059
,544
$
55,1
35,3
29$
55
,378
,069
$
57,2
73,2
78$
60
,697
,992
$
58,1
16,1
34$
58
,842
,142
$
65,4
75,4
58$
68
,416
,179
$
79,8
25,2
22$
Prog
ram
Rev
enue
sG
over
nmen
tal a
ctiv
ities
:C
harg
es fo
r ser
vice
s:Sp
ecia
l sch
ools
54,8
00
62
,005
38,7
00
-
-
O
pera
ting
gran
ts a
nd c
ontri
butio
ns5,
643,
931
7,
382,
950
7,
609,
758
1,
913,
648
3,
893,
615
1,
886,
702
1,
733,
644
1,
810,
086
1,
675,
017
1,
451,
934
To
tal g
over
nmen
tal a
ctiv
ities
pro
gram
reve
nues
5,69
8,73
1
7,44
4,95
5
7,64
8,45
8
1,91
3,64
8
3,89
3,61
5
1,88
6,70
2
1,73
3,64
4
1,81
0,08
6
1,67
5,01
7
1,45
1,93
4
Fort
Lee
Boa
rd o
f Edu
catio
nC
hang
es in
Net
Ass
ets/
Net
Pos
ition
*, L
ast T
en F
isca
l Yea
rs(a
ccru
al b
asis
of a
ccou
ntin
g)
Fisc
al Y
ear E
ndin
g Ju
ne 3
0,
-116-

Exh
ibit
J-2
2006
2007
2008
2009
2010
2011
2012
2013
2014
2015
Fort
Lee
Boa
rd o
f Edu
catio
nC
hang
es in
Net
Ass
ets/
Net
Pos
ition
*, L
ast T
en F
isca
l Yea
rs(a
ccru
al b
asis
of a
ccou
ntin
g)
Fisc
al Y
ear E
ndin
g Ju
ne 3
0,
Bus
ines
s-ty
pe a
ctiv
ities
:C
harg
es fo
r ser
vice
sFo
od se
rvic
e80
1,46
6
78
7,00
3
79
7,20
8
80
3,60
2
81
7,31
7
83
3,56
9
91
2,66
5
88
7,63
7
83
6,70
4
91
5,76
4
La
tchk
ey p
rogr
am33
0,15
5
35
6,19
4
43
4,95
9
29
9,47
1
46
9,03
7
51
0,20
5
52
4,69
2
57
2,72
2
18
3
O
pera
ting
gran
ts a
nd c
ontri
butio
ns20
9,22
0
19
6,42
6
23
4,64
1
25
5,54
8
33
2,75
5
35
7,87
2
44
2,03
0
44
3,44
2
43
7,33
4
42
9,90
4
To
tal b
usin
ess t
ype
activ
ities
pro
gram
reve
nues
1,34
0,84
1
1,33
9,62
3
1,46
6,80
8
1,35
8,62
1
1,61
9,10
9
1,70
1,64
6
1,87
9,38
7
1,90
3,80
1
1,27
4,22
1
1,34
5,66
8
Tota
l dis
trict
pro
gram
reve
nues
7,03
9,57
2$
8,78
4,57
8$
9,11
5,26
6$
3,27
2,26
9$
5,51
2,72
4$
3,58
8,34
8$
3,61
3,03
1$
3,71
3,88
7$
2,94
9,23
8$
2,79
7,60
2$
Net
(Exp
ense
)/Rev
enue
Gov
ernm
enta
l act
iviti
es(4
3,18
4,69
1)$
(46,
474,
474)
$ (4
6,44
2,53
3)$
(53,
593,
719)
$ (5
5,36
1,32
5)$
(54,
589,
062)
$ (5
5,48
3,82
2)$
(61,
932,
665)
$ (6
5,23
9,13
9)$
(76,
967,
246)
$
B
usin
ess-
type
act
iviti
es16
4,71
9
12
3,72
3
17
9,73
0
(4
07,2
90)
17
6,05
7
61
,276
254,
711
171,
094
(227
,802
)
(60,
374)
Tota
l dis
trict
-wid
e ne
t exp
ense
(43,
019,
972)
$ (4
6,35
0,75
1)$
(46,
262,
803)
$ (5
4,00
1,00
9)$
(55,
185,
268)
$ (5
4,52
7,78
6)$
(55,
229,
111)
$ (6
1,76
1,57
1)$
(65,
466,
941)
$
(7
7,02
7,62
0)$
Gen
eral
Rev
enue
s and
Oth
er C
hang
es in
Net
Ass
ets
Gov
ernm
enta
l act
iviti
es:
Prop
erty
taxe
s lev
ied
for g
ener
al p
urpo
ses,
net
39,1
82,1
71$
42
,581
,845
$
44,2
85,1
19$
46
,056
,524
$
47,8
98,7
85$
50
,245
,845
$
51,2
50,7
62$
52
,275
,777
$
53,3
21,2
93$
55
,438
,424
$
Taxe
s lev
ied
for d
ebt s
ervi
ce1,
400,
000
1,35
2,10
01,
268,
945
Unr
estri
cted
gra
nts a
nd c
ontri
butio
ns2,
848,
004
2,99
6,69
33,
019,
066
6,83
8,63
27,
152,
921
4,89
5,93
76,
604,
235
8,57
0,98
17,
654,
476
16,6
11,2
85R
estri
cted
gra
nts a
nd c
ontri
butio
ns66
3,11
31,
693,
536
2,19
3,76
8C
ance
llatio
n C
apita
l Out
lay
to C
apita
l Res
erve
1,39
7,56
6Tu
ition
43,6
50
Inve
stm
ent e
arni
ngs
217,
401
350,
416
215,
821
49,7
55
78
7
45
49
7
5,
313
3,
978
62
,974
Mis
cella
neou
s inc
ome
465,
717
1,97
2,04
3
106,
688
313,
173
266,
322
543,
187
483,
649
296,
094
567,
332
361,
823
Tota
l gov
ernm
enta
l act
iviti
es42
,713
,293
47,9
00,9
97
47
,626
,694
53,2
58,0
84
55
,318
,815
55,6
85,0
14
59
,002
,256
64,2
41,7
01
66
,490
,513
73,7
87,1
01
Bus
ines
s-ty
pe a
ctiv
ities
:In
vest
men
t ear
ning
s30
,621
21,5
99
2,
904
51
1
2,
796
78
78
43
1,
800
Tota
l bus
ines
s-ty
pe a
ctiv
ities
30,6
21
21
,599
2,90
4
511
2,79
6
-
78
78
43
1,80
0
Tot
al d
isct
rict
-wid
e42
,743
,914
$
47,9
22,5
96$
47
,629
,598
$
53,2
58,5
95$
55
,321
,611
$
55,6
85,0
14$
59
,002
,334
$
64,2
41,7
79$
66
,490
,556
$
73,7
88,9
01$
Cha
nge
in n
et a
sset
sG
over
nmen
tal a
ctiv
ities
(339
,260
)$
(471
,398
)$
1,42
6,52
3$
1,18
4,16
1$
(42,
510)
$
1,09
5,95
2$
3,51
8,43
4$
2,30
9,03
6$
1,25
1,37
4$
(3,1
80,1
45)
$
Bus
ines
s-ty
pe a
ctiv
ities
96,9
27
14
1,07
1
83
,166
(277
,504
)
178,
853
61,2
76
25
4,78
9
17
1,17
2
(2
27,7
59)
(5
8,57
4)
Tot
al d
istr
ict
(242
,333
)$
(330
,327
)$
1,50
9,68
9$
906,
657
$
136,
343
$
1,15
7,22
8$
3,77
3,22
3$
2,48
0,20
8$
1,02
3,61
5$
(3,2
38,7
19)
$
* - G
ASB
Sta
tem
ent N
o. 6
3 be
cam
e ef
fect
ive
for t
he fi
scal
yea
r end
ed Ju
ne 3
0, 2
013
whi
ch c
hang
ed N
et A
sets
to N
et P
ositi
on.
Sour
ce:
CA
FR E
xhib
it A
-2
Not
es:
Cen
tral S
ervi
ce a
nd A
dmin
istra
tive
Info
rmat
ion
Tech
nolo
gy se
rvic
es a
ccou
nt c
lass
ifica
tions
wer
e ad
ded
begi
nnin
g w
ithye
ar e
nd Ju
ne 3
0, 2
006.
Prio
r to
June
30,
200
5, C
entra
l Ser
vice
s and
Adm
inis
trativ
e In
form
atio
n Te
chno
logy
Ser
vice
s wer
eco
mbi
ned
in O
ther
Sup
port
Serv
ices
as B
usin
ess a
nd O
ther
Sup
port
Serv
ices
.
-117-

Exh
ibit
J-3
2006
2007
2008
2009
2010
2011
2012
2013
2014
2015
Gen
eral
Fun
dR
eser
ved
2,30
4,51
2$
2,23
5,49
2$
2,72
2,01
5$
3,02
9,20
9$
778,
099
$
Unr
eser
ved
762,
290
823,
380
1,38
6,13
5
2,23
5,87
6
958,
404
Res
trict
ed1,
639,
659
3,
210,
976
3,
658,
099
2,
475,
618
2,29
3,99
3
Com
mitt
ed27
4,42
5
1,
182,
757
A
ssig
ned
650,
000
1,31
5,95
9
1,86
4,96
8
1,89
9,69
0
1,
227,
188
U
nass
igne
d1,
442,
570
1,
297,
861
1,
614,
117
1,
565,
526
1,11
0,98
8
Tota
l gen
eral
fund
3,06
6,80
2$
3,05
8,87
2$
4,10
8,15
0$
5,26
5,08
5$
1,73
6,50
3$
-$
7,
007,
553
$
7,
137,
184
$
5,
940,
834
$
4,63
2,16
9$
All
Oth
er G
over
nmen
tal F
unds
Res
erve
d-
$
471,
984
$
-$
-
$
-$
-
$
-$
-
$
-$
-
$
Unr
eser
ved,
repo
rted
in:
Cap
ital p
roje
cts f
und
756,
790
40,9
99
15
4,82
6
15
4,82
6
1,
237,
851
49
0,27
4
(8
39,8
42)
17
,050
,315
13,5
97,6
66
52
,416
,142
Deb
t ser
vice
fund
76,6
30
78
,838
64,1
54
To
tal a
ll ot
her g
over
nmen
tal f
unds
756,
790
$
512,
983
$
154,
826
$
154,
826
$
1,23
7,85
1$
490,
274
$
(839
,842
)$
17,1
26,9
45$
13
,676
,504
$
52,4
80,2
96$
Sour
ce:
CA
FR E
xhib
it B
-1
Fort
Lee
Boa
rd o
f Edu
catio
nFu
nd B
alan
ces,
Gov
ernm
enta
l Fun
ds,
Las
t Ten
Fis
cal Y
ears
(mod
ified
acc
rual
bas
is o
f acc
ount
ing)
-118-

Exh
ibit
J-4
2006
2007
2008
2009
2010
2011
2012
2013
2014
2015
Rev
enue
sTa
x le
vy39
,182
,171
$
42,5
81,8
45$
44
,285
,119
$
46,0
56,5
24$
47
,898
,785
$
50,2
45,8
45$
51
,250
,762
$
53,6
75,7
77$
54
,673
,393
$
56,7
07,3
69$
In
tere
st- c
apita
l res
erve
fund
s40
,931
53,4
2238
,501
16,8
8278
745
497
5,31
33,
978
62,9
74In
tere
st e
arni
ngs
176,
470
296,
994
177,
320
32,8
732,
946
37,5
894,
894
4,72
01,
918
3,77
7Tr
ansp
orta
tion
38,1
058,
628
Tuiti
on85
,973
19,5
0034
,750
30,0
0043
,650
Mis
cella
neou
s52
1,87
12,
034,
048
526,
988
314,
073
266,
627
386,
129
457,
199
256,
624
535,
414
360,
945
Stat
e so
urce
s6,
710,
136
8,
493,
651
8,
856,
381
6,
987,
844
8,
227,
542
5,
001,
235
7,
271,
822
10
,361
,082
9,93
1,93
7
10,8
46,0
91
Fe
dera
l sou
rces
1,78
0,44
5
1,88
5,99
2
1,77
2,44
3
1,76
3,53
6
2,81
5,74
3
1,77
6,79
5
1,72
2,59
8
1,71
3,52
1
1,59
1,32
4
1,34
7,66
7
Tota
l rev
enue
48,4
12,0
24
55
,345
,952
55,6
56,7
52
55
,171
,732
59,2
12,4
30
57
,571
,716
60,7
35,9
00
66
,051
,787
66,7
67,9
64
69
,372
,473
Exp
endi
ture
sIn
stru
ctio
nR
egul
ar In
stru
ctio
n15
,539
,586
16,1
34,9
18
16
,257
,191
16,6
89,8
17
17
,978
,798
17,4
70,3
48
17
,686
,731
19,2
99,4
15
18
,639
,107
19,5
93,1
14
Sp
ecia
l edu
catio
n in
stru
ctio
n1,
931,
599
1,
924,
589
1,
828,
329
1,
816,
700
2,
392,
416
3,
205,
818
3,
799,
173
4,
314,
565
4,
191,
760
3,
986,
239
O
ther
spec
ial i
nstru
ctio
n1,
336,
521
1,
476,
232
1,
575,
356
2,
064,
966
2,
006,
619
1,
932,
043
1,
965,
408
1,
915,
689
2,
049,
705
2,
136,
879
O
ther
inst
ruct
ion
655,
165
781,
949
804,
182
779,
313
746,
698
797,
260
782,
915
821,
867
1,07
0,95
1
1,06
7,46
9
Supp
ort S
ervi
ces:
Tuiti
on3,
677,
911
4,
358,
617
4,
246,
167
4,
650,
182
4,
178,
690
3,
149,
926
3,
315,
783
3,
472,
301
3,
496,
240
3,
792,
977
St
uden
t and
inst
ruct
ion
rela
ted
serv
ices
4,47
8,16
3
4,92
4,25
9
5,27
9,59
9
5,92
3,10
1
6,83
6,78
3
6,59
9,85
7
6,80
7,39
3
7,51
4,04
7
7,39
0,30
0
7,58
8,93
3
Scho
ol a
dmin
istra
tive
serv
ices
2,21
5,55
1
2,17
5,85
8
2,27
9,41
0
2,27
9,47
7
2,40
9,95
5
2,57
6,61
6
2,16
7,90
7
2,01
3,90
0
2,29
5,52
8
2,32
4,60
3
Gen
eral
adm
inis
trativ
e se
rvic
es1,
237,
152
1,
399,
421
1,
403,
297
1,
418,
364
1,
419,
757
1,
265,
634
1,
191,
334
1,
189,
393
1,
417,
870
1,
440,
703
C
entra
l ser
vice
s and
adm
inis
trativ
ein
form
atio
n te
chno
logy
serv
ices
611,
462
677,
160
703,
875
654,
668
663,
011
713,
536
741,
121
725,
705
889,
545
856,
281
Bus
ines
s and
oth
er su
ppor
t ser
vice
sPl
ant o
pera
tions
and
mai
nten
ance
4,29
1,01
1
4,46
5,62
2
4,55
9,45
3
4,68
8,08
6
4,41
4,45
0
3,93
9,18
2
4,14
9,46
9
4,29
6,95
0
4,70
9,09
2
4,94
7,11
9
Pupi
l tra
nspo
rtatio
n1,
124,
950
1,
499,
037
1,
503,
774
1,
732,
005
1,
528,
574
1,
308,
313
1,
451,
533
1,
464,
678
1,
573,
249
1,
633,
541
Em
ploy
ee b
enef
its10
,508
,684
13,1
48,3
68
13
,544
,958
11,1
34,6
61
14
,016
,326
12,9
69,1
13
12
,959
,691
14,7
44,8
71
15
,084
,362
15,6
86,1
56
Sp
ecia
l sch
ools
69,2
89
79
,426
78,7
34
C
apita
l out
lay
1,14
8,29
4
2,55
2,23
3
901,
306
446,
297
3,06
5,91
0
121,
496
2,04
6,65
9
5,62
7,00
7
10,6
20,2
37
20
,879
,515
Deb
t ser
vice
:Pr
inci
pal
780,
000
655,
000
665,
000
Inte
rest
and
oth
er c
harg
es55
9,90
0
69
7,10
0
68
0,57
5
Tr
ansf
er to
cha
rter s
choo
l9,
686
To
tal e
xpen
ditu
res
48,8
25,3
38
55
,597
,689
54,9
65,6
31
54
,277
,637
61,6
57,9
87
56
,049
,142
59,0
65,1
17
68
,740
,288
74,7
80,0
46
87
,288
,790
Exce
ss (D
efic
ienc
y) o
f rev
enue
s o
ver (
unde
r) e
xpen
ditu
res
(413
,314
)
(251
,737
)
691,
121
894,
095
(2,4
45,5
57)
1,52
2,57
4
1,67
0,78
3
(2,6
88,5
01)
(8,0
12,0
82)
(17,
916,
317)
Fort
Lee
Boa
rd o
f Edu
catio
nC
hang
es in
Fun
d B
alan
ces,
Gov
ernm
enta
l Fun
ds,
Las
t Ten
Fis
cal Y
ears
Fisc
al Y
ear E
ndin
g Ju
ne 3
0,
(mod
ified
acc
rual
bas
is o
f acc
ount
ing)
-119-

Exh
ibit
J-4
2006
2007
2008
2009
2010
2011
2012
2013
2014
2015
Fort
Lee
Boa
rd o
f Edu
catio
nC
hang
es in
Fun
d B
alan
ces,
Gov
ernm
enta
l Fun
ds,
Las
t Ten
Fis
cal Y
ears
Fisc
al Y
ear E
ndin
g Ju
ne 3
0,
(mod
ified
acc
rual
bas
is o
f acc
ount
ing)
Oth
er F
inan
cing
sour
ces (
uses
)C
apita
l lea
ses (
non-
budg
eted
)-
-
-
262,
840
354,
919
1,96
7,72
5
5,57
1,44
4
Bon
d pr
ocee
ds-
-
-
-
-
-
-
20,4
30,0
00
-
49
,840
,000
Can
cella
tion
of C
apita
l Out
lay
to C
apita
l Res
erve
1,39
7,56
6
Tran
sfer
s in
2,48
4,00
0
747,
577
334,
958
3,95
2
157,
034
61,9
46
Tr
ansf
ers o
ut(2
,484
,000
)
(7
47,5
77)
(3
34,9
58)
(3
,952
)
(157
,034
)
(61,
946)
Tota
l oth
er fi
nanc
ing
sour
ces (
uses
)-
-
-
262,
840
-
-
-
20
,784
,919
3,36
5,29
1
55,4
11,4
44
Net
cha
nge
in fu
nd b
alan
ces
(413
,314
)$
(251
,737
)$
691,
121
$
1,15
6,93
5$
(2,4
45,5
57)
$
1,52
2,57
4$
1,67
0,78
3$
18,0
96,4
18$
(4
,646
,791
)$
37
,495
,127
$
Deb
t ser
vice
as a
per
cent
age
ofno
ncap
ital e
xpen
ditu
res
0.0%
0.0%
0.0%
0.0%
0.0%
0.0%
0.0%
2.1%
2.1%
2.0%
Sour
ce: C
AFR
Exh
ibit
B-2
Cen
tral S
ervi
ce a
nd A
dmin
istra
tive
Info
rmat
ion
Tech
nolo
gy se
rvic
es a
ccou
nt c
lass
ifica
tions
wer
e ad
ded
begi
nnin
g w
ithye
ar e
nd Ju
ne 3
0, 2
005.
Prio
r to
June
30,
200
5, C
entra
l Ser
vice
s and
Adm
inis
trativ
e In
form
atio
n Te
chno
logy
Ser
vice
s wer
eco
mbi
ned
in O
ther
Sup
port
Serv
ices
as B
usin
ess a
nd O
ther
Sup
port
Serv
ices
.
-120-

Exh
ibit
J-5
2006
2007
2008
2009
2010
2011
2012
2013
2014
2015
Gen
eral
Fun
d:In
tere
st o
n in
vest
men
ts17
6,47
0$
29
6,99
4$
17
7,32
0$
32
,873
$
2,94
6$
37
,589
$
4,
894
$
4,72
0$
1,
918
$
3,
777
$
Su
mm
er sc
hool
tuiti
on a
nd fe
es54
,800
62
,005
38
,700
85
,973
19
,500
34
,750
30
,000
43,6
50
Pr
ior y
ears
' ref
unds
34,7
09
74,4
09
18,3
22
Ren
tals
98,6
67
94
,500
14
0,55
0
17
4,17
5
95
,000
5,
500
-
D
onat
ions
5,50
0
2,
721
433
89
,635
2,
150
500
200
Tran
spor
tatio
n37
,584
38
,105
8,
628
Can
cella
tion
of p
rior y
ear v
oid
chec
ks7,
554
7,19
4
2,
443
1,73
7
5,
305
5,
319
C
ontri
butio
ns1,
926
2,75
7
13
,574
M
isce
llane
ous-
rest
ricte
dR
eim
burs
emen
t of c
usto
dial
13,0
00
45,5
00
433,
600
194,
611
11
0,56
5
97
,409
84
,620
82
,086
20
3,91
1
264,
722
A
thle
tic re
ceip
ts7,
821
5,31
0
3,
712
587
1,
356
4,46
3
4,
650
6,19
8
5,
021
3,
623
O
ther
4,08
0
4,
075
93,4
48
7,86
2
4,
259
4,
691
B
ook
fines
9,29
9
7,
416
9,03
0
5,
268
5,02
3
2,
839
2,06
1
1,
282
1,
108
R
estit
utio
n no
n-re
side
nts
240
4,
080
Mis
cella
neou
s-un
rest
ricte
d12
,142
3,
791
3,20
9
1,
886
4,43
3
39
,935
97
,547
46
,020
30
9,63
6
78,3
83
To
tal M
isce
llane
ous
314,
487
$
502,
262
$
701,
542
$
346,
946
$
26
6,32
2$
54
3,18
7$
48
3,64
9$
28
2,58
4$
56
7,33
2$
405,
473
$
Inte
rest
on
capi
tal r
eser
ve fu
nds
40,9
31
53,4
22
38,5
01
16,8
82
78
7
45
497
1,
827
1,77
0
1,02
8
Tota
l Gen
eral
Fun
d35
5,41
8$
55
5,68
4$
74
0,04
3$
36
3,82
8$
267,
109
$
543,
232
$
484,
146
$
284,
411
$
569,
102
$
40
6,50
1$
Fort
Lee
Boa
rd o
f Edu
catio
nG
ener
al F
und
Oth
er L
ocal
Rev
enue
by
Sour
ceL
ast T
en F
isca
l Yea
rs(m
odifi
ed a
ccru
al b
asis
of a
ccou
ntin
g)
-121-

Exh
ibit
J-6
Fisc
al
Yea
r En
ded
Dec
. 31,
Vac
ant L
and
Res
iden
tial
Com
mer
cial
/Ind
ustri
alA
partm
ent
Tota
l Ass
esse
d V
alue
Publ
ic U
tiliti
es a
Net
Val
uatio
n Ta
xabl
eM
emo
Onl
y Ta
x Ex
empt
Pro
perty
Estim
ated
Act
ual
(Cou
nty
Equa
lized
V
alue
)
Tota
l Dire
ct
Scho
ol T
ax
Rat
e b
2006
47,4
50,1
00$
3,50
3,23
1,10
0$
96
1,97
8,90
0$
1,
417,
207,
720
$
5,
929,
867,
820
$
8,65
8,57
8$
5,
938,
526,
398
$
351,
037,
400
$
5,
822,
717,
382
$
0.69
2007
130,
801,
900
$
3,52
5,09
8,50
0$
93
7,10
2,30
0$
1,
411,
590,
620
$
6,
004,
593,
320
$
8,54
0,03
8$
6,
013,
133,
358
$
358,
234,
700
$
6,
085,
431,
283
$
0.72
2008
122,
770,
000
$
3,55
4,62
0,70
0$
94
7,92
3,90
0$
1,
414,
385,
820
$
6,
039,
700,
420
$
8,33
7,13
0$
6,
048,
037,
550
$
363,
433,
300
$
6,
522,
953,
051
$
0.75
2009
124,
914,
300
$
3,58
5,52
3,40
0$
94
8,00
9,50
0$
1,
415,
253,
320
$
6,
073,
700,
520
$
8,72
3,96
9$
6,
082,
424,
489
$
360,
587,
400
$
6,
588,
899,
981
$
0.77
2010
124,
462,
700
$
3,59
4,30
9,70
0$
95
0,31
4,30
0$
1,
440,
155,
620
$
6,
109,
242,
320
$
8,56
4,84
9$
6,
117,
807,
169
$
329,
971,
800
$
6,
417,
757,
379
$
0.80
2011
127,
344,
500
$
2,59
9,11
4,20
0$
94
9,27
6,80
0$
1,
437,
682,
320
$
5,
113,
417,
820
$
9,18
0,43
9$
5,
122,
598,
259
$
328,
933,
300
$
6,
588,
899,
981
$
0.77
2012
100,
665,
200
$
3,59
9,24
1,40
0$
93
5,80
4,50
0$
1,
440,
403,
020
$
6,
076,
114,
120
$
10,2
19,6
89$
6,08
6,33
3,80
9$
32
9,37
2,30
0$
6,07
6,11
4,12
0$
0.
8620
1389
,754
,600
$
3,
590,
670,
300
$
944,
612,
900
$
1,44
4,61
7,22
0$
6,06
9,65
5,02
0$
7,
980,
343
$
6,07
7,63
5,36
3$
32
8,64
2,00
0$
6,42
3,96
3,63
5$
0.
8920
1414
2,30
8,60
0$
3,
602,
571,
100
$
853,
593,
300
$
1,49
1,29
8,42
0$
6,08
9,77
1,42
0$
7,
070,
493
$
6,09
6,84
1,91
3$
34
3,28
7,80
1$
6,44
0,12
9,71
4$
0.
9220
1513
4,17
5,70
0$
3,
608,
370,
300
$
852,
711,
100
$
1,55
3,52
2,52
0$
6,14
8,77
9,62
0$
7,
218,
641
$
6,15
5,99
8,26
1$
33
6,15
3,90
0$
6,72
3,51
1,98
4$
0.
95
Sour
ce:
Mun
icip
al T
ax A
sses
sor a
nd A
bstra
ct o
f Rat
able
s, C
ount
y B
oard
of T
axat
ion
NO
TE:
Rea
l pro
perty
is re
quire
d to
be
asse
ssed
at s
ome
perc
enta
ge o
f tru
e va
lue
(fai
r or m
arke
t val
ue) e
stab
lishe
d by
eac
h co
unty
boa
rd o
f tax
atio
n.
N/A
- At t
he ti
me
of C
AFR
com
plet
ion,
this
dat
a w
as n
ot y
et a
vaila
ble.
Rea
sses
smen
t occ
urs w
hen
the
Cou
nty
Boa
rd o
f Tax
atio
n re
ques
ts T
reas
ury
to o
rder
a re
asse
ssm
ent.
a- T
axab
le V
alue
of M
achi
nery
, Im
plem
ents
and
Equ
ipm
ent o
f Tel
epho
ne, T
eleg
raph
and
Mes
seng
er S
yste
m C
ompa
nies
.b-
Tax
rate
s are
per
$10
0.
Fort
Lee
Boa
rd o
f Edu
catio
nA
sses
sed
Val
ue a
nd A
ctua
l Val
ue o
f Tax
able
Pro
pert
yL
ast T
en Y
ears
Una
udite
d
-122-

Exh
ibit
J-7
Ove
rlapp
ing
Rat
es
Bas
ic R
ate
a
Gen
eral
O
blig
atio
n D
ebt S
ervi
ce b
Tota
l Dire
ctB
orou
gh o
f Fo
rt Le
eC
ount
y of
B
erge
n
Fisc
al
Yea
r En
ded
Dec
. 31,
2006
0.69
0.69
0.79
0.18
1.66
2007
0.72
0.72
0.82
0.18
1.72
2008
0.75
0.75
0.89
0.20
1.84
2009
0.77
0.77
0.91
0.21
1.89
2010
0.80
0.80
0.93
0.21
1.94
2011
0.83
0.83
0.94
0.22
1.99
2012
0.86
0.86
0.96
0.23
2.05
2013
0.87
0.02
30.
890.
990.
242.
1220
140.
890.
023
0.92
1.00
0.25
2.16
2015
0.95
0.95
0.99
0.26
2.20
Sour
ce: M
unic
ipal
Tax
Col
lect
or
Not
es:
whe
n ad
ded
to o
ther
com
pone
nts o
f the
dis
trict
's ne
t bud
get m
ay n
ot e
xcee
d th
e pr
ebud
get y
ear n
etbu
dget
by
mor
e th
an th
e sp
endi
ng g
row
th li
mita
tion.
aTh
e di
stric
t's b
asic
tax
rate
is c
alcu
late
d fr
om th
e A
4F fo
rm w
hich
is su
bmitt
ed w
ith th
e bu
dget
and
the
Net
val
u a
bR
ates
for d
ebt s
ervi
ce a
re b
ased
on
each
yea
r's re
quire
men
ts.
Fort
Lee
Boa
rd o
f Edu
catio
nD
irec
t and
Ove
rlap
ping
Pro
pert
y T
ax R
ates
Las
t Six
Fis
cal Y
ears
(rat
e pe
r $10
0 of
ass
esse
d va
lue)
Fort
Lee
Boa
rd o
f Edu
catio
n
N.J.
S.A
. 18A
:7F-
5d li
mits
the
amou
nt th
at th
e di
stric
t can
subm
it fo
r a g
ener
al fu
nd ta
x le
vy.
The
levy
Tota
l Dire
ct
and
Ove
rlapp
ing
Tax
Rat
e
-123-

Exh
ibit
J-8
Taxa
ble
% o
f Tot
alTa
xabl
e%
of T
otal
Ass
esse
dR
ank
Dis
trict
Net
A
sses
sed
Ran
kD
istri
ct N
et
Taxp
ayer
Val
ue[O
ptio
nal]
Ass
esse
d V
alue
Val
ue[O
ptio
nal]
Ass
esse
d V
alue
1266
Apa
rtmen
t cor
p.27
8,00
0,00
0$
14.
56%
289,
151,
000
$
4.
87%
1530
Ow
ners
Cor
p.16
8,47
8,00
0$
22.
76%
168,
478,
000
$
2.
84%
Sout
hbrid
ge P
ark,
Inc.
82,6
73,0
00$
31.
36%
82,6
73,0
00$
1.39
%C
CA
Cre
st a
t For
t Lee
, LLC
82,0
00,0
00$
41.
34%
2100
Lin
woo
d A
ve. O
wne
rs In
c.78
,000
,000
$
5
1.28
%78
,500
,000
$
1.
32%
Med
iterr
anea
n To
wer
s Wes
t Ow
ners
, Inc
.72
,000
,000
$
6
1.18
%91
,058
,000
$
1.
53%
2000
Lin
woo
d A
venu
e O
wne
rs, I
nc.
69,4
03,0
00$
81.
14%
69,4
03,0
00$
1.17
%O
ne C
entu
ry C
ity A
parm
ent C
orp.
64,7
03,0
00$
91.
06%
64,7
03,0
00$
1.09
%N
orth
brid
ge P
ark
Co-
op In
c63
,267
,000
$
10
1.04
%63
7,76
7,00
0$
10.7
4%Fo
rt Le
e EP
, LLC
55,2
75,0
00$
110.
91%
Exec
utiv
e Pa
rk, L
LC36
,725
,000
$
12
0.60
%K
elby
Ass
ocia
tes c
/o P
arke
r Cor
p.46
,354
,900
$
13
0.76
%46
,350
,000
$
0.
78%
1170
Apt
. Cor
p.70
,584
,020
$
7
1.16
%70
,584
,000
$
1.
19%
Tota
l1,
167,
462,
920
$
19.1
5%1,
598,
667,
000
$
26.9
2%
Net
Ass
esse
d V
alua
tion:
6,09
6,84
1,91
3$
5,
938,
526,
398
$
Sour
ce:
Mun
icip
al T
ax A
sses
sor.
2015
2006
Fort
Lee
Boa
rd o
f Edu
catio
nPr
inci
pal P
rope
rty
Tax
paye
rsC
urre
nt Y
ear
and
Ten
Yea
rs A
go
-124-

Exh
ibit
J-9
Am
ount
Perc
enta
ge o
f Le
vy
2006
$39,
182,
171
$39,
182,
171
100.
00%
-$
20
07$4
2,58
1,84
5$4
2,58
1,84
510
0.00
%-
$
2008
$44,
285,
119
$44,
285,
119
100.
00%
-$
20
09$4
6,97
7,65
5$4
6,97
7,65
510
0.00
%-
$
2010
$47,
898,
785
$47,
898,
785
100.
00%
-$
20
11$5
0,24
5,84
5$5
0,24
5,84
510
0.00
%-
$
2012
$51,
250,
762
$51,
250,
762
100.
00%
-$
20
13$5
3,67
5,77
7$5
3,67
5,77
710
0.00
%-
$
2014
$54,
673,
393
$54,
673,
393
100.
00%
-$
20
15$5
6,70
7,36
9$5
6,70
7,36
910
0.00
%-
$
Sour
ce:
Dis
trict
reco
rds i
nclu
ding
the
Cer
tific
ate
and
Rep
ort o
f Sch
ool T
axes
(A4F
form
)
Not
es:
a- S
choo
l tax
es a
re c
olle
cted
by
the
Mun
icip
al T
ax C
olle
ctor
.U
nder
New
Jers
ey S
tate
Sta
tute
, a m
unic
ipal
ity is
requ
ired
to re
mit
to th
e sc
hool
dis
trict
the
entir
e pr
oper
ty ta
x ba
lanc
e, in
the
amou
ntvo
ted
upon
or c
ertif
ied
prio
r to
the
end
of th
e sc
hool
yea
r.
Fort
Lee
Boa
rd o
f Edu
catio
nPr
oper
ty T
ax L
evie
s and
Col
lect
ions
Las
t Ten
Fis
cal Y
ears
Fisc
al
Yea
r En
ded
June
30,
Col
lect
ed w
ithin
the
Fisc
al Y
ear
of th
e Le
vy a
Dis
trict
Tax
es
Levi
ed fo
r the
Fi
scal
Yea
r
Col
lect
ions
in
Subs
eque
nt
Yea
rs
-125-

Exh
ibit
J-10
Fisc
al
Yea
r En
ded
June
30,
Gen
eral
O
blig
atio
n B
onds
/Loa
ns b
Cap
ital
Leas
esTo
tal D
istri
ct
Perc
enta
ge o
f Pe
rson
al In
com
e a
Per C
apita
a
2006
-
-
-
0.
00%
63,1
03$
2007
-
-
-
0.
00%
67,5
44$
2008
-
-
-
0.
00%
67,3
31$
2009
-
-
-
0.
00%
63,8
74$
2010
-
-
-
0.
00%
63,8
85$
2011
-
15
7,71
5
15
7,71
5
0.01
%67
,248
$
20
12-
107,
229
107,
229
0.
00%
69,2
81$
2013
17,6
70,0
00
40
9,60
4
18
,079
,604
0.
72%
69,4
95$
2014
17,0
15,0
00
2,
248,
388
19
,263
,388
N
ot A
vaila
ble
Not
Ava
ilabl
e20
1566
,190
,000
7,75
0,96
4
73,9
40,9
64
Not
Ava
ilabl
eN
ot A
vaila
ble
Sour
ce:
Dis
trict
reco
rds
Not
es:
Det
ails
rega
rdin
g th
e di
stric
t's o
utst
andi
ng d
ebt c
an b
e fo
und
in th
e no
tes t
o th
efin
anci
al st
atem
ents
.
a- S
ee E
xhib
it J-
14 fo
r per
sona
l inc
ome
and
popu
latio
n da
ta.
Thes
e ra
tios a
reca
lcul
ated
usi
ng p
erso
nal i
ncom
e an
d po
pula
tion
for t
he p
rior c
alen
der y
ear.
Gov
ernm
enta
l Act
iviti
es
Fort
Lee
Boa
rd o
f Edu
catio
nR
atio
s of O
utst
andi
ng D
ebt b
y T
ype
Las
t Ten
Fis
cal Y
ears
-126-

Exh
ibit
J-11
Fisc
al
Yea
r En
ded
June
30,
Gen
eral
O
blig
atio
n B
onds
/Loa
nsD
educ
tions
Net
Gen
eral
B
onde
d D
ebt
Out
stan
ding
Perc
enta
ge o
f A
ctua
l Ta
xabl
e V
alue
a o
f Pro
perty
Per C
apita
b
2006
-$
-
-
0.
00%
63,1
03$
2007
-$
-
-
0.
00%
67,5
44$
2008
-$
-
-
0.
00%
67,3
31$
2009
-$
-
-
0.
00%
63,8
74$
2010
-$
-
-
0.
00%
63,8
85$
2011
-$
-
-
0.
00%
67,2
48$
2012
-$
-
-
0.
00%
69,2
81$
2013
17,6
70,0
00$
-
17,6
70,0
00
0.29
%69
,495
$
20
1417
,015
,000
$
-
17
,015
,000
0.
28%
Not
Ava
ilabl
e20
1566
,190
,000
$
-
66
,190
,000
0.
00%
Not
Ava
ilabl
e
Sour
ce:
Dis
trict
Rec
ords
Not
es:
Det
ails
rega
rdin
g th
e di
stric
t's o
utst
andi
ng d
ebt c
an b
e fo
und
in th
e no
tes t
o th
e fin
anci
al st
atem
ents
.
a- S
ee E
xhib
it J-
6 fo
r pro
perty
tax
data
.b-
See
Exh
ibit
J-14
for p
opul
atio
n da
ta.
The
ratio
is c
alcu
late
d us
ing
the
popu
latio
nfo
r the
prio
r cal
ende
r yea
r.
Gen
eral
Bon
ded
Deb
t Out
stan
ding
Fort
Lee
Boa
rd o
f Edu
catio
nR
atio
s of N
et G
ener
al B
onde
d D
ebt O
utst
andi
ngL
ast T
en Y
ears
-127-

Exh
ibit
J-12
Gov
ernm
enta
l Uni
t
Estim
ated
Pe
rcen
tage
A
pplic
able
aD
ebt
Out
stan
ding
Estim
ated
Sha
re
of O
verla
ppin
g D
ebt
Dir
ect D
ebt o
f Sch
ool D
istr
ict a
s of J
une
30, 2
015
66,1
90,0
00$
N
et o
verl
appi
ng d
ebt o
f Sch
ool D
istr
ict:
B
orou
gh o
f For
t Lee
100.
000%
57,3
36,9
44$
C
ount
y of
Ber
gen
- City
's Sh
are
3.96
7%3,
451,
126
$
B
erge
n C
ount
y U
tility
Aut
horit
y-C
ity's
Shar
e 7.
889%
16,5
10,9
06$
Subt
otal
, ove
rlap
ping
deb
t77
,298
,976
$
Tot
al d
irec
t and
ove
rla p
ping
deb
t14
3,48
8,97
6$
Sour
ces:
Bor
ough
of F
ort L
ee F
inan
ce O
ffic
e / B
erge
n C
ount
y Tr
easu
rer's
Off
ice
Not
e:
Ove
rlapp
ing
gove
rnm
ents
are
thos
e th
at c
oinc
ide,
at l
east
in p
art,
with
the
geog
raph
ic b
ound
arie
s of t
he D
istri
ct.
This
sche
dule
est
imat
es th
e po
rtion
of t
he o
utst
andi
ng d
ebt o
f tho
se o
verla
ppin
g go
vern
men
ts th
at is
bor
ne b
y th
e re
side
nts a
nd
busi
ness
es o
f For
t Lee
. Th
is p
roce
ss re
cogn
izes
that
, whe
n co
nsid
erin
g th
e D
istri
ct's
abili
ty to
issu
e an
d re
pay
long
-term
deb
t, th
e en
tire
debt
bur
den
born
e by
the
resi
dent
s and
bus
ines
ses s
houl
d be
take
n in
to a
ccou
nt.
How
ever
this
doe
s not
impl
y th
at
ever
y ta
xpay
er is
a re
side
nt, a
nd th
eref
ore
resp
onsi
ble
for r
epay
ing
the
debt
, of e
ach
over
lapp
ing
paym
ent.
For
deb
t rep
aid
with
pro
perty
taxe
s, th
e pe
rcen
tage
of o
verla
ppin
g de
bt a
pplic
able
is e
stim
ated
usi
ng ta
xabl
e as
sess
ed p
rope
rty v
alue
s.A
pplic
able
per
cent
ages
wer
e es
timat
ed b
y de
term
inin
g th
e po
rtion
of a
noth
er g
over
nmen
tal u
nit's
taxa
ble
valu
e th
at is
with
in th
e di
stric
t's b
ound
arie
s and
div
idin
g it
by e
ach
unit'
s tot
al ta
xabl
e va
lue.
Fort
Lee
Boa
rd o
f Edu
catio
nR
atio
s of O
verl
appi
ng G
over
nmen
tal A
ctiv
ities
Deb
tA
s of J
une
30, 2
015
-128-

Exh
ibit
J-13
Leg
al D
ebt M
argi
n C
alcu
latio
n fo
r Fi
scal
Yea
r 20
15
Equa
lized
val
uatio
n ba
sis
2014
6,44
0,12
9,71
4
2013
6,42
3,96
3,63
5
2012
6,07
6,11
4,12
0
[A]
18,9
40,2
07,4
69$
Ave
rage
equ
aliz
ed v
alua
tion
of ta
xabl
e pr
oper
ty[A
/3]
6,31
3,40
2,49
0$
Deb
t lim
it (4
% o
f ave
rage
equ
aliz
atio
n va
lue)
[B]
252,
536,
100
aN
et b
onde
d sc
hool
deb
t[C
]66
,190
,000
Lega
l deb
t mar
gin
[B-C
]18
6,34
6,10
0$
2006
2007
2008
2009
2010
2011
2012
2013
2014
2015
Deb
t lim
it20
7,96
9,49
4$
22
7,74
9,16
8$
23
9,92
2,04
8$
25
1,12
1,31
6$
25
9,32
6,99
3
25
6,55
5,05
6
17
2,69
3,51
1
23
9,83
1,69
6
23
9,83
1,69
6
18
6,34
6,10
0
Tota
l net
deb
t app
licab
le to
lim
it-
-
-
-
-
-
-
17
,670
,000
17,0
15,0
00
66,1
90,0
00
Lega
l deb
t mar
gin
207,
969,
494
$
227,
749,
168
$
239,
922,
048
$
251,
121,
316
$
259,
326,
993
$
256,
555,
056
$
172,
693,
511
$
222,
161,
696
$
222,
816,
696
$
120,
156,
100
$
Tota
l net
deb
t app
licab
le to
the
limit
as a
per
cent
age
of d
ebt l
imit
0.00
%0.
00%
0.00
%0.
00%
0.00
%0.
00%
0.00
%7.
37%
7.09
%35
.52%
Sour
ce:
Equa
lized
val
uatio
ns w
ere
obta
ined
from
the
Ann
ual D
ebt S
tate
men
t, B
orou
gh o
f For
t Lee
aLi
mit
set b
y N
JSA
18A
:24-
19 fo
r a K
thro
ugh
12 d
istri
ct; o
ther
% li
mits
wou
ld b
e ap
plic
able
for o
ther
dis
trict
s
Fort
Lee
Boa
rd o
f Edu
catio
nL
egal
Deb
t Mar
gin
Info
rmat
ion
Las
t Ten
Yea
rs
-129-

Exh
ibit
J-14
Yea
rPo
pula
tion
a (1
)
Pers
onal
Inco
me
(thou
sand
s of
dolla
rs) b
Per C
apita
Pe
rson
al
Inco
me c
(2)
Une
mpl
oym
ent
Rat
e d
2006
36,2
14
2,
285,
212,
042
$
63,1
03
3.
00%
2007
36,1
24
2,
439,
959,
456
$
67,5
44
2.
60%
2008
36,1
07
2,
431,
120,
417
$
67,3
31
3.
20%
2009
36,2
88
2,
317,
859,
712
$
63,8
74
5.
90%
2010
35,3
92
2,
261,
017,
920
$
63,8
85
6.
30%
2011
35,6
64
2,
398,
332,
672
$
67,2
48
6.
20%
2012
35,8
41
2,
483,
100,
321
$
69,2
81
5.
80%
2013
36,3
10
2,
523,
363,
450
$
69,4
95
5.
80%
2014
37,0
26
N
ot A
vaila
ble
Not
Ava
ilabl
e4.
20%
2015
Not
Ava
ilabl
eN
ot A
vaila
ble
Not
Ava
ilabl
eN
ot A
vaila
ble
Sour
ce:
a- P
opul
atio
n in
form
atio
n pr
ovid
ed b
y th
e N
J Dep
artm
ent o
f Lab
or a
nd W
orkf
orce
Dev
elop
men
t.b-
Per
sona
l inc
ome
has b
een
estim
ated
bas
ed u
pon
the
mun
icip
al p
opul
atio
n an
d pe
r cap
ita
pers
onal
inco
me
pres
ente
dc-
US
Bur
eau
of E
cono
mic
Ana
lysi
s per
cap
ita p
erso
nal i
ncom
e fo
r New
Jers
ey b
y co
unty
d- U
nem
ploy
men
t dat
a pr
ovid
ed b
y th
e N
J Dep
t of L
abor
and
Wor
kfor
ce D
evel
opm
ent
Not
es:
(1) R
epre
sent
s est
imat
e of
July
1(2
) Rep
rese
nts c
ount
y in
form
atio
n vs
. mun
icip
ality
N/A
- At t
he ti
me
of C
AFR
com
plet
ion,
this
dat
a w
as n
ot y
et a
vaila
ble
Fort
Lee
Boa
rd o
f Edu
catio
nD
emog
raph
ic a
nd E
cono
mic
Sta
tistic
sL
ast T
en F
isca
l Yea
rs
-130-

Exh
ibit
J-15
Em
ploy
erE
mpl
oyee
sR
ank
(Opt
iona
l)
Perc
enta
ge o
f T
otal
E
mpl
oym
ent
Em
ploy
ees
Ran
k (O
ptio
nal)
Perc
enta
ge o
f T
otal
E
mpl
oym
ent
THE
NEW
JER
SEY
DEP
AR
TMEN
T O
F LA
BO
R A
ND
AR
EA E
MPL
OY
ERS
REF
USE
DTO
REL
EASE
INFO
RM
ATI
ON
NEE
DED
TO
CO
MPL
ETE
THIS
SC
HED
ULE
DU
E TO
PRIV
AC
Y C
ON
CER
NS.
1N
/A1
N/A
2N
/A2
N/A
3N
/A3
N/A
4N
/A4
N/A
5N
/A5
N/A
6N
/A6
N/A
7N
/A7
N/A
8N
/A8
N/A
9N
/A9
N/A
10N
/A10
N/A
Sour
ce:
Bor
ough
of F
ort L
ee a
nd S
tate
of N
ew Je
rsey
Dep
artm
ent o
f Lab
or a
nd In
dust
ry
Ann
ual L
abor
For
ce E
stim
ates
by
Mun
icip
ality
N
/A- A
t the
tim
e of
CA
FR c
ompl
etio
n, th
is d
ata
was
not
yet
ava
ilabl
e.
2006
2015
Fort
Lee
Boa
rd o
f Edu
catio
nPr
inci
pal E
mpl
oyer
sC
urre
nt Y
ear
and
Ten
Yea
rs A
go *
*
-131-

Exh
ibit
J-16
2006
2007
2008
2009
2010
2011
2012
2013
2014
2015
Func
tion/
Prog
ram
Inst
ruct
ion
Reg
ular
N/A
231.
023
3.0
237.
024
1.0
229.
021
2.0
231.
026
0.0
271.
5Sp
ecia
l edu
catio
nN
/A26
.027
.027
.029
.037
.064
.082
.063
.061
.5O
ther
inst
ruct
ion
N/A
29.0
31.0
29.0
28.5
33.5
23.0
24.0
27.0
26.0
Supp
ort S
ervi
ces:
Stud
ent &
inst
ruct
ion
rela
ted
serv
ices
N/A
65.0
64.0
66.0
67.0
71.5
78.5
95.0
82.0
79.0
Gen
eral
adm
insi
trativ
e se
rvic
esN
/A12
.012
.012
.012
.010
.08.
58.
08.
08.
5Sc
hool
adm
inis
trativ
e se
rvic
esN
/A33
.033
.033
.033
.024
.024
.022
.026
.026
.5B
usin
ess a
dmin
sitra
tive
serv
ices
N/A
6.0
6.0
6.0
6.0
13.0
14.0
15.0
17.0
17.0
Plan
t ope
ratio
ns a
nd m
aint
enan
ceN
/A46
.046
.045
.044
.021
.020
.521
.021
.022
.0To
tal
0.0
448.
045
2.0
455.
046
0.5
439.
044
4.5
498.
050
4.0
512.
0
Sour
ce: D
istri
ct P
erso
nnel
Rec
ords
Fort
Lee
Boa
rd o
f Edu
catio
nFu
ll-tim
e E
quiv
alen
t Dis
tric
t Em
ploy
ees b
y Fu
nctio
n/Pr
ogra
m,
Las
t Ten
Fis
cal Y
ears
-132-

Exh
ibit
J-17
Fisc
al
Yea
rE
nrol
lmen
tO
pera
ting
Exp
endi
ture
s aC
ost P
er
Pupi
lPe
rcen
tage
C
hang
eT
each
ing
Staf
f bE
lem
enta
ryM
iddl
e Sc
hool
Hig
h Sc
hool
Ave
rage
D
aily
E
nrol
lmen
t (A
DE
) c
Ave
rage
Dai
ly
Att
enda
nce
(AD
A) c
% C
hang
e in
A
vera
ge D
aily
E
nrol
lmen
t
Stud
ent
Att
enda
nce
Perc
enta
ge
2006
3,5
13
47,6
77,0
44
13,
572
0.55
%N
/AN
/AN
/AN
/A
3,4
82
3,3
07
1.60
94.9
7%20
07
3
,546
54
,064
,325
1
5,24
7 12
.34%
231
1:18
1:11
1:15
3
,475
3
,321
(0
.20)
95.5
7%20
08
3
,551
54
,965
,631
1
5,47
9 1.
52%
233
1:17
1:12
1:14
3
,488
3
,338
0.
3795
.70%
2009
3,5
45
54,2
77,6
37
15,
311
0.42
%23
71:
181:
111:
14
3,4
54
3,2
96
(.01)
95.4
3%20
103,
621
58
,592
,077
1
6,18
1 4.
54%
241
1:18
1:11
1:14
3,54
3
3,
406
0.
0496
.13%
2011
3,67
1
55,9
27,6
46
15,
235
-0.5
0%22
91:
171:
111:
143,
601
3,45
0
0.01
95.8
1%20
123,
727
57
,018
,458
1
5,29
9 -5
.45%
212
1:17
1:11
1:14
3,68
9
3,
547
0.
0296
.15%
2013
3,79
1
61,7
73,3
81
16,
295
6.96
%23
11:
171:
111:
143,
740
3,57
0
0.01
95.4
5%20
143,
819
62
,807
,709
1
6,44
6 7.
50%
291
1:10
1:10
1:10
3,77
9
3,
606
0.
0195
.42%
2015
3,78
7
65,0
63,7
00
17,
181
5.44
%29
91:
091:
091:
093,
728
3,54
5
-0.0
195
.09%
Sour
ces:
D
istri
ct re
cord
s, A
SSA
and
Sch
edul
es J-
4
Not
e: E
nrol
lmen
t bas
ed o
n an
nual
Oct
ober
dis
trict
cou
nt.
aO
pera
ting
expe
nditu
res e
qual
tota
l exp
endi
ture
s les
s deb
t ser
vice
and
cap
ital o
utla
y; S
ched
ule
J-4
bTe
achi
ng st
aff i
nclu
des o
nly
full-
time
equi
vale
nts o
f cer
tific
ated
staf
f.c
Ave
rage
dai
ly e
nrol
lmen
t and
ave
rage
dai
ly a
ttend
ance
are
obt
aine
d fr
om th
e Sc
hool
Reg
iste
r Sum
mar
y (S
RS)
.
N/A
At t
he ti
me
of C
AFR
com
plet
ion,
this
dat
a w
as n
ot y
et a
vaila
ble.
Fort
Lee
Boa
rd o
f Edu
catio
nO
pera
ting
Stat
istic
sL
ast T
en F
isca
l Yea
rs
Pupi
l/Tea
cher
Rat
io
-133-

2006
2007
2008
2009
2010
2011
2012
2013
2014
2015
Dis
tric
t Bui
ldin
gs
Ele
men
tary
Scho
ol 1
Squa
re F
eet
57,9
38
57
,938
57
,938
57,9
38
57
,938
57,9
38
57
,938
57,9
38
57
,938
50,4
70
C
apac
ity (s
tude
nts)
447
447
447
447
447
447
447
447
447
590
Enro
llmen
t49
1
49
8
51
7
52
9
52
9
63
4
64
4
67
8
70
8
66
6
Scho
ol 2
Squa
re F
eet
50,9
89
50
,989
50
,989
50,9
89
50
,989
50,9
89
50
,989
50,9
89
50
,989
47,8
00
C
apac
ity (s
tude
nts)
339
339
339
339
339
339
339
339
339
442
Enro
llmen
t 39
7
39
9
41
5
42
1
42
1
42
2
42
8
45
5
45
7
47
0
Scho
ol 3
Squa
re F
eet
41,9
74
41
,974
41
,974
41,9
74
41
,974
41,9
74
41
,974
41,9
74
41
,974
46,2
60
C
apac
ity (s
tude
nts)
392
392
392
392
392
392
392
392
392
450
Enro
llmen
t 46
4
46
4
49
0
49
7
49
7
51
3
53
3
53
0
53
6
53
4
Scho
ol 4
Squa
re F
eet
48,7
22
48
,722
48
,722
48,7
22
48
,722
48,7
22
48
,722
48,7
22
48
,722
48,9
90
C
apac
ity (s
tude
nts)
395
395
395
395
395
395
395
395
395
450
Enro
llmen
t 48
4
48
4
47
4
49
3
49
3
53
5
51
6
54
0
54
1
55
1
Mid
dle
Scho
olLe
wis
F. C
ole
Mid
dle
Scho
olSq
uare
Fee
t78
,455
78,4
55
78,4
55
78
,455
78,4
55
78
,455
78,4
55
78
,455
78,4
55
79
,060
Cap
acity
(stu
dent
s)29
5
29
5
29
5
29
5
29
5
29
5
29
5
29
5
29
5
48
7
En
rollm
ent
509
513
528
477
477
526
556
574
558
534
Hig
h Sc
hool
Fort
Lee
Hig
h Sc
hool
Squa
re F
eet
142,
789
14
2,78
9
14
2,78
9
14
2,78
9
14
2,78
9
14
2,78
9
14
2,78
9
14
2,78
9
142,
789
14
8,05
0
Cap
acity
(stu
dent
s)55
2
55
2
55
2
55
2
55
2
55
2
55
2
55
2
55
2
1,
000
En
rollm
ent
1,08
9
1,09
6
1,04
1
1,03
9
1,03
9
979
995
959
978
983
Num
ber o
f Sch
ools
at J
une
30, 2
015
Elem
enta
ry
4
Mid
dle
Scho
ol
1
Hig
h Sc
hool
1
Sour
ce: D
istri
ct re
cord
s, A
SSA
Not
e: R
evis
ed S
quar
e fo
otag
e an
d ca
paci
ty o
btai
ned
from
Dis
trict
's A
rchi
tect
ural
firm
.En
rollm
ent i
s bas
ed o
n th
e an
nual
Oct
ober
dis
trict
cou
nt.
Exh
ibit
J-18
Fort
Lee
Boa
rd o
f Edu
catio
nSc
hool
Bui
ldin
g In
form
atio
nL
ast T
en F
isca
l Yea
rs
-134-
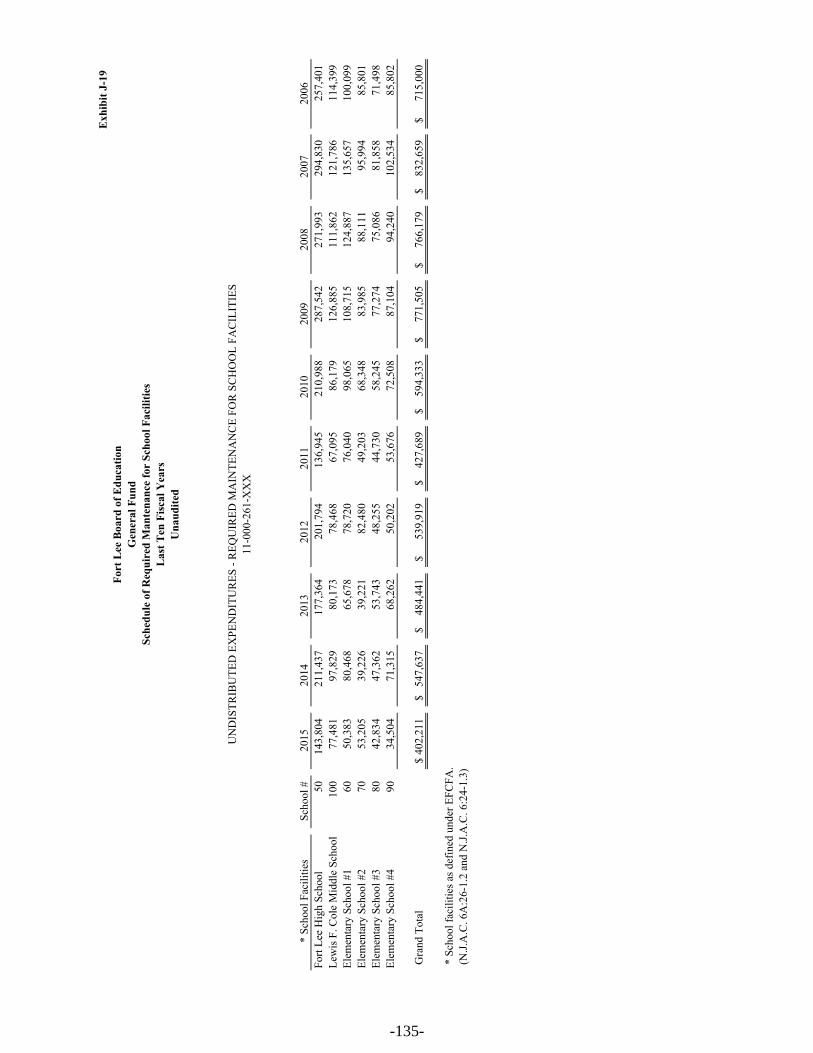
Exh
ibit
J-19
* Sc
hool
Fac
ilitie
sSc
hool
#20
1520
1420
1320
1220
1120
1020
0920
0820
0720
06Fo
rt Le
e H
igh
Scho
ol50
143,
804
211,
437
177,
364
20
1,79
4
136,
945
21
0,98
8
287,
542
27
1,99
3
294,
830
25
7,40
1
Lew
is F
. Col
e M
iddl
e Sc
hool
100
77
,481
97,8
29
80,1
73
78,4
68
67
,095
86
,179
12
6,88
5
111,
862
12
1,78
6
114,
399
El
emen
tary
Sch
ool #
160
50,3
83
80
,468
65
,678
78
,720
76,0
40
98,0
65
108,
715
12
4,88
7
135,
657
10
0,09
9
Elem
enta
ry S
choo
l #2
70
53
,205
39,2
26
39,2
21
82,4
80
49
,203
68
,348
83
,985
88,1
11
95
,994
85
,801
Elem
enta
ry S
choo
l #3
80
42
,834
47,3
62
53,7
43
48,2
55
44
,730
58
,245
77
,274
75,0
86
81
,858
71
,498
Elem
enta
ry S
choo
l #4
90
34
,504
71,3
15
68,2
62
50,2
02
53
,676
72
,508
87
,104
94,2
40
10
2,53
4
85,8
02
Gra
nd T
otal
402,
211
$
547,
637
$
484,
441
$
53
9,91
9$
427,
689
$
59
4,33
3$
771,
505
$
76
6,17
9$
832,
659
$
71
5,00
0$
* Sc
hool
faci
litie
s as d
efin
ed u
nder
EFC
FA.
(N.J.
A.C
. 6A
:26-
1.2
and
N.J.
A.C
. 6:2
4-1.
3)
11-0
00-2
61-X
XX
Fort
Lee
Boa
rd o
f Edu
catio
nG
ener
al F
und
Sche
dule
of R
equi
red
Man
tena
nce
for
Scho
ol F
acili
ties
Las
t Ten
Fis
cal Y
ears
Una
udite
d
UN
DIS
TRIB
UTE
D E
XPE
ND
ITU
RES
- R
EQU
IRED
MA
INTE
NA
NC
E FO
R S
CH
OO
L FA
CIL
ITIE
S
-135-

Exhibit J-20Fort Lee Board of Education
Insurance ScheduleFor the Fiscal Year Ended June 30, 2015
Unaudited
Company Coverage Deductible
School Package Policy - School Alliance Insurance Fund Property - Blanket Building and Contents 88,560,709$ 1,000$ Flood/Earthquake 10,000,000/25,000,000 25,000 Commercial General Liability:
General Aggregate 50,000,000 Each Occurance 5,000,000 Prod/Completed Oper. 50,000,000 Fire Damage Legal Liability 2,500,000 Personal Injury 5,000,000 Medical Expense 5,000
Employee Benefit each occurrence/aggregate 5,000,000 1,000 Automobilie Liability CSL
Combined Single Limit 5,000,000 1,000 Comprehensive Crime Coverage:
Employee Dishonesty 500,000 1,000 Robbery - Outside/Inside 50,000/50,000 1,000
Boiler and Machinery - School Alliance Insurance FundProperty Damage 100,000,000 1,000
Board of Education Liability - National Union Fire Ins Limit of Liability 5,000,000 5,000
Excess Liability - Fireman's Fund Insurance Co.Each Occurrence/Aggregate 50,000,000/50,000,000
Excess of 10,000,000 Environmental Site Specific - ACE American Insurance Co.
Each Occurrence/Aggregate 1,000,000/25,000,000 10,000
Public Officials Bonds - Hartford Fire Insurance Co.Board Secretary/Business Administrator 200,000 Treasurer of School Monies 320,000 Assistant Board Secretary/Business Administrator 200,000
Student Accident - Monumental Life Insurance Co.Students 5,000,000 Athletics 5,000,000
Source: District Records.
Note: The District is part of the Northeast Bergen County School Board Insurance Group (NESBIG). Sevabove coverages are the combined amounts for all the school districts under master policies withinsurance companies.
Type of Coverage
-136-

SINGLE AUDIT SECTION

Ferraioli, Wielkotz, Cerullo & Cuva, P.A.
Charles J. Ferraioli, Jr., MBA, CPA, RMA Certified Public Accountants Newton Office Steven D. Wielkotz, CPA, RMA 401 Wanaque Avenue 100B Main Street James J. Cerullo, CPA, RMA Pompton Lakes, New Jersey 07442 Newton, NJ 07860Paul J. Cuva, CPA, RMA 973-835-7900 973-579-3212Thomas M. Ferry, CPA, RMA Fax 973-835-6631 Fax 973-579-7128
K-1
Page 1 of 2
INDEPENDENT AUDITOR’S REPORT ON INTERNAL CONTROL OVER
FINANCIAL REPORTING AND ON COMPLIANCE AND OTHER MATTERS
BASED ON AN AUDIT OF FINANCIAL STATEMENTS PERFORMED IN
ACCORDANCE WITH GOVERNMENT AUDITING STANDARDS
Honorable President and
Members of the Board of Education
Borough of Fort Lee School District
County of Bergen, New Jersey
We have audited, in accordance with auditing standards generally accepted in the United States of
America; audit requirements as prescribed by the Office of School Finance, Department of Education,
State of New Jersey; and the standards applicable to financial audits contained in Government Auditing
Standards, issued by the Comptroller General of the United States, the financial statements of the
governmental activities, the business-type activities and each major fund and the aggregate remaining
fund information of the Board of Education of the Borough of Fort Lee School District, in the County of
Bergen, New Jersey, as of and for the year ended June 30, 2015, and the related notes to the financial
statements, which collectively comprise the District’s basic financial statements, and have issued our
report thereon dated November 17, 2015.
Internal Control Over Financial Reporting
In planning and performing our audit on the financial statements, we considered the Borough of Fort
Lee Board of Education’s internal control over financial reporting (internal control) to determine the
audit procedures that are appropriate in the circumstances for the purpose of expressing our opinions on
the financial statements, but not for the purpose of expressing an opinion on the effectiveness of the
Borough of Fort Lee Board of Education’s internal control. Accordingly, we do not express an opinion
on the effectiveness of the Borough of Fort Lee Board of Education’s internal control.
A deficiency in internal control exists when the design or operation of a control does not allow
management or employees, in the normal course of performing their assigned functions, to prevent, or
detect and correct, misstatements on a timely basis. A material weakness is a deficiency, or a
combination of deficiencies, in internal control, such that there is a reasonable possibility that a material
misstatement of the entity’s financial statements will not be prevented, or detected and corrected on a
timely basis. A significant deficiency is a deficiency, or a combination of deficiencies, in internal
control that is less severe than a material weakness, yet important enough to merit attention by those
charged with governance.
-137-

Honorable President and K-1
Members of the Board of Education Page 2 of 2
Our consideration of internal control was for the limited purpose described in the first paragraph of this
section and was not designed to identify all deficiencies in internal control that might be material
weaknesses or significant deficiencies. Given these limitations, during our audit we did not identify any
deficiencies in internal control that we consider to be material weaknesses. However, material
weaknesses may exist that have not been identified.
Compliance and Other Matters
As part of obtaining reasonable assurance about whether the Borough of Fort Lee Board of Education’s
financial statements are free of material misstatement, we performed tests of its compliance with certain
provisions of laws, regulations, contracts and grant agreements, noncompliance with which could have a
direct and material effect on the determination of financial statement amounts. However, providing an
opinion on compliance with those provisions was not an objective of our audit and, accordingly, we do
not express such an opinion. The results of our tests disclosed no instances of noncompliance or other
matters that are required to be reported under Government Auditing Standards or the audit requirements
as prescribed by the Office of School Finance, Department of Education, State of New Jersey.
We noted certain matters that were required to be reported to the Board of Education of the Borough of
Fort Lee School District in the separate Auditors Management Report on Administrative Findings -
Financial, Compliance and Performance dated November 17, 2015.
Purpose of this Report
The purpose of this report is solely to describe the scope of our testing of internal control and
compliance and the results of that testing, and not to provide an opinion on the effectiveness of the
entity’s internal control or on compliance. This report is an integral part of an audit performed in
accordance with Government Auditing Standards in considering the entity’s internal control and
compliance. Accordingly, this communication is not suitable for any other purpose.
Steven D. WielkotzSteven D. WielkotzSteven D. WielkotzSteven D. Wielkotz
Steven D. Wielkotz, C.P.A.
Licensed Public School Accountant
No. 816
Ferraioli, Wielkotz, Cerullo & Cuva, P.A.Ferraioli, Wielkotz, Cerullo & Cuva, P.A.Ferraioli, Wielkotz, Cerullo & Cuva, P.A.Ferraioli, Wielkotz, Cerullo & Cuva, P.A.
FERRAIOLI, WIELKOTZ, CERULLO & CUVA, P.A.
Certified Public Accountants
Pompton Lakes, New Jersey
November 17, 2015
-138-

Ferraioli, Wielkotz, Cerullo & Cuva, P.A.
Charles J. Ferraioli, Jr., MBA, CPA, RMA Certified Public Accountants Newton Office Steven D. Wielkotz, CPA, RMA 401 Wanaque Avenue 100B Main Street James J. Cerullo, CPA, RMA Pompton Lakes, New Jersey 07442 Newton, NJ 07860Paul J. Cuva, CPA, RMA 973-835-7900 973-579-3212Thomas M. Ferry, CPA, RMA Fax 973-835-6631 Fax 973-579-7128
K-2
Page 1 of 3
INDEPENDENT AUDITOR’S REPORT ON COMPLIANCE WITH REQUIREMENTS
APPLICABLE TO EACH MAJOR PROGRAM AND INTERNAL
CONTROL OVER COMPLIANCE IN ACCORDANCE WITH
OMB CIRCULAR A-133 AND N.J. OMB CIRCULAR 04-04
Honorable President and
Members of the Board of Education
Borough of Fort Lee School District
County of Bergen, New Jersey
Report on Compliance for Each Major Federal and State Program
We have audited the Board of Education of the Borough of Fort Lee School District in the County of
Bergen, New Jersey, compliance with the types of compliance requirements described in the OMB
Circular A-133 Compliance Supplements and the New Jersey State Aid/Grant Compliance Supplement
that could have a direct and material effect on each of the Borough of Fort Lee Board of Education’s
major federal and state programs for the year ended June 30, 2015. The Borough of Fort Lee Board of
Education’s major federal and state programs are identified in the summary of auditor’s results section
of the accompanying schedule of findings and questioned costs.
Management’s Responsibility
Management is responsible for compliance with the requirements of laws, regulations, contracts, and
grants applicable to its federal and state programs.
Auditor’s Responsibility
Our responsibility is to express an opinion on compliance for each of the Borough of Fort Lee Board of
Education’s major federal and state programs based on our audit of the types of compliance
requirements referred to above. We conducted our audit of compliance in accordance with auditing
standards generally accepted in the United States of America; the standards applicable to financial
audits contained in Government Auditing Standards, issued by the Comptroller General of the United
States; and OMB Circular A-133, Audits of States, Local Governments, and Non-Profit Organizations
and Single Audit Policy for Recipients of Federal Grants, State Grants and State Aid. Those standards,
OMB Circular A-133 and N.J. OMB Circular 04-04 require that we plan and perform the audit to obtain
reasonable assurance about whether noncompliance with the types of compliance requirements referred
-139-

Honorable President and K-2
Members of the Board of Education Page 2 of 3
to above that could have a direct and material effect on a major federal and state program occurred. An
audit includes examining, on a test basis, evidence about the Borough of Fort Lee Board of Education’s
compliance with those requirements and performing such other procedures as we considered necessary
in the circumstances.
We believe that our provides a reasonable basis for our opinion on compliance for each major federal
and state program. However, our audit does not provide a legal determination of the Borough of Fort
Lee Board of Education’s compliance.
Opinion on Each Major Federal and State Program
In our opinion, the Borough of Fort Lee Board of Education complied, in all material respects, with the
types of compliance requirements referred to above that could have a direct and material effect on each
of its major federal and state programs for the year ended June 30, 2015.
Other Matters
Management of the Borough of Fort Lee Board of Education is responsible for establishing and
maintaining effective internal control over compliance with the types of compliance requirements
referred to above. In planning and performing our audit of compliance, we considered the Borough of
Fort Lee Board of Education’s internal control over compliance with the type of requirements that could
have a direct and material effect on each major federal and state program to determine the auditing
procedures that are appropriate in the circumstances for the purpose of expressing an opinion on
compliance for each major federal and state program and to test and report on internal control over
compliance in accordance with OMB Circular A-133 and N.J. OMB Circular 04-04, but not for the
purpose of expressing an opinion on the effectiveness of internal control over compliance. Accordingly,
we do not express an opinion on the effectiveness of Borough of Fort Lee Board of Education’s internal
control over compliance.
A deficiency in internal control over compliance exists when the design or operation of a control over
compliance does not allow management or employees, in the normal course of performing their
assigned functions, to prevent, or detect and correct, noncompliance with a type of compliance
requirement of a federal and state program on a timely basis. A material weakness in internal control
over compliance is a deficiency, or combination of deficiencies, in internal control over compliance,
such that there is a reasonable possibility that material noncompliance with a type of compliance
requirement of a federal and state program will not be prevented, or detected and corrected, on a timely
basis. A significant deficiency in internal control over compliance is a deficiency, or a combination of
deficiencies, in internal control over compliance with a type of compliance requirement of a federal and
state program that is less severe than a material weakness in internal control over compliance, yet
important enough to merit attention by those charged with governance.
-140-

Honorable President and K-2
Members of the Board of Education Page 3 of 3
Our consideration of internal control over compliance was for the limited purpose described in the first
paragraph of this section and was not designed to identify all deficiencies in internal control over
compliance that might be material weaknesses or significant deficiencies and therefore, material
weaknesses or significant deficiencies may exist that were not identified. We did not identify any
deficiencies in internal control over compliance that we consider to be material weaknesses.
The Borough of Fort Lee Board of Education’s response to internal control over compliance finding
identified in our audit is described in the accompanying schedule of findings and questioned costs. The
Borough of Fort Lee Board of Education’s response was not subjected to the auditing procedures
applied in the audit of compliance and, accordingly, we express no opinion on the response.
Steven D. WielkotzSteven D. WielkotzSteven D. WielkotzSteven D. Wielkotz
Steven D. Wielkotz, C.P.A.
Licensed Public School Accountant
No. 816
Ferraioli, Wielkotz, Cerullo & Cuva, P.A.Ferraioli, Wielkotz, Cerullo & Cuva, P.A.Ferraioli, Wielkotz, Cerullo & Cuva, P.A.Ferraioli, Wielkotz, Cerullo & Cuva, P.A.
FERRAIOLI, WIELKOTZ, CERULLO & CUVA, P.A.
Certified Public Accountants
Pompton Lakes, New Jersey
November 17, 2015
-141-

K-3
1 of
3
Fede
ral
Gra
nt o
r Sta
teB
alan
ce a
tC
arry
over
/R
epay
men
tC
FDA
Proj
ect
Aw
ard
June
30,
(Wal
kove
r)C
ash
Bud
geta
ryof
Prio
r Yea
rs'
(Acc
ount
sD
efer
red
Due
to
Num
ber
Num
ber
Am
ount
From
To20
14A
mou
ntR
ecei
ved
Expe
nditu
res
Adj
ustm
ents
Bal
ance
sR
ecei
vabl
e)R
even
ueG
rant
or a
t
US
Dep
artm
ent o
f Edu
catio
nPa
ssed
Thr
ough
Sta
te D
ept o
f Edu
catio
n:Sp
ecia
l Rev
enue
Fun
dTi
tle I
Part
A, I
mpr
ovin
g B
asic
Pro
gra m
84.0
10N
CLB
4310
1547
8,48
4
7/
1/14
6/30
/15
(114
,899
)11
4,89
927
9,56
2(2
79,5
62)
Title
I Pa
rt A
, Im
prov
ing
Bas
ic P
rogr
a m84
.010
NC
LB43
1014
475,
928
7/1/
136/
30/1
4(1
14,8
99)
114,
899
(114
,899
)11
4,89
927
9,56
2(2
79,5
62)
Title
II, P
art A
, Tea
cher
/Prin
cipa
Trai
ning
and
Rec
ruiti
ng84
.367
NC
LB43
1015
125,
764
7/1/
146/
30/1
5(3
1,83
1)30
,095
111,
674
1,73
6(1
11,6
74)
Title
II, P
art A
, Tea
cher
/Prin
cipa
lTr
aini
ng a
nd R
ecru
iting
84.3
67N
CLB
4310
1412
2,87
6
7/
1/13
6/20
/14
(31,
831)
31,8
31(3
1,83
1)30
,095
111,
674
1,73
6(1
11,6
74)
Title
III
84.3
65N
CLB
4310
1591
,825
7/
1/14
6/30
/15
(18,
099)
18,0
9949
,999
(49,
999)
Title
III
84.3
65N
CLB
4310
1487
,800
7/
1/13
6/30
/14
(18,
099)
18,0
99Ti
tle II
I, Im
mig
rant
84.3
65N
CLB
4310
1510
0,22
1
7/
1/14
6/30
/15
(11,
474)
11,4
7410
4,91
4(1
04,9
14)
Title
III,
Imm
igra
nt84
.365
NC
LB43
1014
67,1
97
7/1/
136/
30/1
4(1
1,47
4)11
,474
(29,
573)
29,5
7315
4,91
3(1
54,9
13)
IDEA
, Par
t B-B
asic
84.0
27ID
EA43
1015
833,
356
7/1/
146/
30/1
5(3
73,6
40)
749,
183
784,
343
(408
,800
)ID
EA, P
art B
-Bas
ic84
.027
IDEA
4310
1479
4,18
7
7/
1/13
6/30
/14
(373
,640
)37
3,64
0ID
EA, P
art B
-Pre
scho
ol84
.173
IDEA
4310
1520
,410
7/
1/14
6/30
/15
(4,9
41)
4,94
117
,175
(17,
175)
IDEA
, Par
t B-P
resc
hool
84.1
73ID
EA43
1014
20,4
28
7/1/
136/
30/1
4(4
,941
)4,
941
(378
,581
)75
4,12
480
1,51
8(4
25,9
75)
Tot
al S
peci
al R
even
ue F
und
(554
,884
)92
8,69
11,
347,
667
1,73
6(9
72,1
24)
US
Dep
artm
ent o
f Agr
icul
ture
Pass
ed T
hrou
gh S
tate
Dep
t of E
duca
tion:
Ent
erpr
ise
Fund
Food
Dis
tribu
tion
Prog
ram
10.5
65N
/A59
,762
7/
1/14
6/30
/15
59,7
6259
,762
Nat
iona
l Sch
ool B
reak
fast
Pro
gram
10.5
53N
/A28
,517
7/
1/14
6/30
/15
21,7
3628
,517
(6,7
81)
Nat
iona
l Sch
ool B
reak
fast
Pro
gram
10.5
53N
/A22
,785
7/
1/13
6/30
/14
(1,8
90)
1,89
0N
atio
nal S
choo
l Lun
ch P
rogr
am10
.555
N/A
327,
793
7/1/
146/
30/1
525
5,45
332
7,79
3(7
2,34
0)N
atio
nal S
choo
l Lun
ch P
rogr
am10
.555
N/A
320,
743
7/1/
136/
30/1
4(2
0,93
0)20
,930
Tot
al E
nter
pris
e Fu
nd(2
2,82
0)35
9,77
141
6,07
2(7
9,12
1)
Tot
al F
eder
al F
inan
cial
Ass
ista
nce
$(5
77,7
04)
1,28
8,46
21,
763,
739
1,73
6(1
,051
,245
)
See
acco
mpa
nyin
g no
tes t
o th
e Sc
hedu
les o
f Exp
endi
ture
s of F
eder
al a
nd S
tate
Aw
ards
.
Bal
ance
at J
une
30, 2
015
P
roga
m T
itle
Fede
ral G
rant
or/P
ass-
thro
ugh
Gra
ntor
/
BO
RO
UG
H O
F FO
RT
LE
E S
CH
OO
L D
IST
RIC
T
Sche
dule
of E
xpen
ditu
res o
f Fed
eral
Aw
ards
For
the
Fisc
al Y
ear
ende
d Ju
ne 3
0, 2
015
Gra
nt P
erio
d
-142-

K-4
2 of
3
Bal
ance
at J
une
30, 2
014
Bal
ance
at J
une
30, 2
015
Def
erre
dD
efer
red
Rep
aym
ent
Rev
enue
/C
umul
ativ
eG
rant
or S
tate
Aw
ard
Rev
enue
Due
to
Cas
hB
udge
tary
of P
rior Y
ears
'(A
ccou
nts
Inte
rfun
dD
ue to
B
udge
tary
Tota
lPr
ojec
t Num
ber
Am
ount
From
To
(Acc
ts R
ecei
vabl
e)G
rant
orR
ecei
ved
Expe
nditu
res
Adj
ustm
ents
Bal
ance
sR
ecei
vabl
e)Pa
yabl
eG
rant
or a
tR
ecei
vabl
eEx
pend
iture
s
Stat
e D
epar
tmen
t of E
duca
tion:
Gen
eral
Fun
dTr
ansp
orta
tion
Aid
15-4
95-0
34-5
120-
014
$79
,344
7/1/
2014
6/30
/201
5$
74,5
4279
,344
*(4
,802
)79
,344
Spec
ial E
duca
tion
Aid
15-4
95-0
34-5
120-
089
1,79
7,80
57/
1/20
146/
30/2
015
1,68
9,00
11,
797,
805
*(1
08,8
04)
1,79
7,80
5Se
curit
y A
id15
-495
-034
-512
0-08
491
,765
7/1/
2014
6/30
/201
586
,211
91,7
65*
(5,5
54)
91,7
65PA
RC
C R
eadi
ness
Aid
15-4
95-0
34-5
120-
098
38,7
707/
1/20
146/
30/2
015
36,4
2438
,770
*(2
,346
)38
,770
Per P
upil
Gro
wth
Aid
15-4
95-0
34-5
120-
097
38,7
707/
1/20
146/
30/2
011
36,4
2438
,770
*(2
,346
)38
,770
Extra
ordi
nary
Aid
15-1
00-0
34-5
120-
473
660,
610
7/1/
2014
6/30
/201
566
0,61
0(6
60,6
10)
*66
0,61
0Ex
traor
dina
ry A
id14
-100
-034
-512
0-47
390
7,74
17/
1/20
136/
30/2
014
(907
,741
)90
7,74
1*
907,
741
Non
Pub
lic T
rans
porta
tion
15-4
95-0
34-5
120-
014
26,2
807/
1/20
146/
30/2
015
26,2
80(2
6,28
0)*
26,2
80N
on P
ublic
Tra
nspo
rtatio
n14
-495
-034
-512
0-01
431
,185
7/1/
2013
6/30
/201
4(3
1,18
5)31
,185
*31
,185
Rei
mbu
rsed
TPA
F So
cial
Sec
urity
15-4
95-0
34-5
094-
003
1,87
0,50
67/
1/20
146/
30/2
015
1,75
2,16
71,
870,
506
(118
,339
)*
1,87
0,50
6R
eim
burs
ed T
PAF
Soci
al S
ecur
ity14
-495
-034
-509
4-00
31,
913,
031
7/1/
2013
6/30
/201
4(8
9,00
4)89
,004
*1,
913,
031
*T
otal
Gen
eral
Fun
d(1
,027
,930
)4,
702,
699
4,60
3,85
0(8
05,2
29)
*(1
23,8
52)
7,45
5,80
7*
Spec
ial R
even
ue F
und
*N
J N
onPu
blic
Aid
:*
Text
book
Aid
15-1
00-0
34-5
120-
064
14,1
207/
1/20
146/
30/2
015
14,1
2013
,759
361
*13
,759
Tech
nolo
gy A
id15
-100
-034
-512
0-37
37,
584
7/1/
2014
6/30
/201
57,
584
7,34
623
8*
7,34
6Te
chno
logy
Aid
14-1
00-0
34-5
120-
373
3,90
07/
1/20
136/
30/2
014
398
398
*3,
502
Nur
sing
Ser
vice
s15
-100
-034
-512
0-07
022
,479
7/1/
2014
6/30
/201
522
,479
22,4
79*
22,4
79 H
andi
capp
ed S
ervi
ces:
*Ex
am &
Cla
ssifi
catio
n15
-100
-034
-512
0-06
610
,086
7/1/
2014
6/30
/201
510
,086
3,96
46,
122
*3,
964
Exam
& C
lass
ifica
tion
14-1
00-0
34-5
120-
066
7,16
67/
1/20
136/
30/2
014
3,34
23,
342
*3,
824
Cor
rect
ive
Spee
ch15
-100
-034
-512
0-06
613
,606
7/1/
2014
6/30
/201
513
,606
11,8
391,
767
*11
,839
Cor
rect
ive
Spee
ch14
-100
-034
-512
0-06
610
,937
7/1/
2013
6/30
/201
43,
438
3,43
8*
7,49
9Su
pple
men
tary
Inst
.15
-100
-034
-512
0-06
64,
708
7/1/
2014
6/30
/201
54,
708
1,80
52,
903
*1,
805
Supp
lem
enta
ry In
st.
14-1
00-0
34-5
120-
066
6,24
57/
1/20
136/
30/2
014
3,88
63,
886
*2,
359
A
uxill
iary
Ser
vice
s:*
Com
pens
ator
y Ed
ucat
ion
15-1
00-0
34-5
120-
067
31,3
537/
1/20
146/
30/2
015
31,3
5323
,380
7,97
3*
23,3
80C
ompe
nsat
ory
Educ
atio
n14
-100
-034
-512
0-06
747
,935
7/1/
2013
6/30
/201
425
,679
25,6
79*
22,2
56En
glis
h as
a S
econ
d La
ngua
ge15
-100
-034
-512
0-06
724
,939
7/1/
2014
6/30
/201
524
,939
20,7
364,
203
*20
,736
*T
otal
Spe
cial
Rev
enue
36,7
4312
8,87
510
5,30
836
,743
23,5
67*
144,
748
*
Mem
o
Stat
e G
rant
or/P
rogr
am T
itles
BO
RO
UG
H O
F FO
RT
LE
E S
CH
OO
L D
IST
RIC
T
Sche
dule
of E
xpen
ditu
res o
f Sta
te F
inan
cial
Aw
ards
Yea
r en
ded
June
30,
201
5
Gra
nt P
erio
d
-143-

K-4
3 of
3
Bal
ance
at J
une
30, 2
014
Bal
ance
at J
une
30, 2
015
Def
erre
dD
efer
red
Rep
aym
ent
Rev
enue
/C
umul
ativ
eG
rant
or S
tate
Aw
ard
Rev
enue
Due
to
Cas
hB
udge
tary
of P
rior Y
ears
'(A
ccou
nts
Inte
rfun
dD
ue to
B
udge
tary
Tota
lPr
ojec
t Num
ber
Am
ount
From
To
(Acc
ts R
ecei
vabl
e)G
rant
orR
ecei
ved
Expe
nditu
res
Adj
ustm
ents
Bal
ance
sR
ecei
vabl
e)Pa
yabl
eG
rant
or a
tR
ecei
vabl
eEx
pend
iture
s
Mem
o
Stat
e G
rant
or/P
rogr
am T
itles
BO
RO
UG
H O
F FO
RT
LE
E S
CH
OO
L D
IST
RIC
T
Sche
dule
of E
xpen
ditu
res o
f Sta
te F
inan
cial
Aw
ards
Yea
r en
ded
June
30,
201
5
Gra
nt P
erio
d
Cap
ital P
roje
cts F
und
*Se
ctio
n 15
Gra
nt:
*H
igh
Scho
ol W
indo
w R
epla
cem
ent
1550
-050
-10-
1001
420,
000
(21,
200)
(21,
200)
*21
,200
Hig
h Sc
hool
Mas
onry
Rep
airs
1550
-050
-10-
1002
130,
212
(130
,212
)13
0,21
2*
130,
212
Hig
h Sc
hool
Inte
rior A
ltera
tions
1550
-050
-10-
1003
1,36
6,83
0(7
24,4
15)
1,04
1,67
364
2,41
5(3
20)
(325
,477
)*
1,36
6,83
0H
igh
Scho
ol H
VA
C U
pgra
des
1550
-050
-10-
1005
192,
597
(192
,597
)19
2,59
7*
192,
597
Scho
ol N
o. 1
HV
AC
Upg
rade
s15
50-0
60-1
0-10
0632
7,91
8(3
27,9
18)
327,
366
552
*32
7,91
8Sc
hool
No.
1 R
oof R
epla
cem
ent
1550
-060
-10-
1007
371,
023
(371
,023
)37
1,02
3*
371,
023
Scho
ol N
o. 1
Win
dow
Rep
lace
men
t15
50-0
60-1
0-10
0815
1,30
1(1
38,7
33)
127,
541
12,5
68(2
3,76
0)*
151,
301
Scho
ol N
o. 3
Win
dow
Rep
lace
men
t15
50-0
80-1
0-10
1014
6,50
1(1
25,3
48)
122,
775
21,1
531,
470
(22,
256)
*14
6,50
1Sc
hool
No.
3 M
ason
ry R
epai
rs15
50-0
80-1
0-10
1188
,031
(88,
031)
88,0
31*
88,0
31Sc
hool
No.
4 M
ason
ry R
epai
rs15
50-0
90-1
0-10
1269
,559
(69,
559)
69,5
59*
69,5
59Sc
hool
No.
4 H
VA
C U
pgra
des
1550
-090
-10-
1013
1,30
4,25
3(6
47,3
44)
1,03
1,54
260
0,81
2(2
16,6
14)
*1,
248,
156
Scho
ol N
o. 4
Roo
f Rep
lace
men
t15
50-0
90-1
0-10
1419
2,12
1(1
25,7
80)
110,
379
55,2
00(7
0,60
1)*
180,
980
Lew
is F
. Col
e M
.S. R
oof R
epla
cem
ent
1550
-100
-10-
1015
548,
142
(548
,142
)54
8,14
2*
548,
142
Lew
is F
. Col
e M
.S. B
oile
r Rep
lace
men
t15
50-1
00-1
0-10
1624
8,87
8(2
48,8
78)
248,
878
*24
8,87
8Le
wis
F. C
ole
M.S
. Add
ition
& R
ehab
ilita
tion
1550
-100
-10-
1018
1,55
7,18
0(7
20,8
61)
622,
872
836,
319
(934
,308
)*
1,55
7,18
0Le
wis
F. C
ole
M.S
. Int
erio
r Alte
ratio
ns15
50-1
00-1
0-10
1942
4,97
1(7
0,37
7)15
0,71
027
1,68
3(1
91,3
50)
*34
2,06
0* *
Tot
al C
apita
l Pro
ject
s Fun
d(4
,550
,418
)5,
183,
300
2,44
0,15
01,
702
(1,8
05,5
66)
*6,
990,
568
*E
nter
pris
e Fu
nd*
Stat
e D
epar
tmen
t of A
gric
ultu
re*
Nat
iona
l Sch
ool L
unch
Pro
gram
(Sta
te S
hare
)15
-100
-010
-336
0-06
713
,832
7/1/
2014
6/30
/201
510
,472
13,8
32(3
,360
)*
13,8
32N
atio
nal S
choo
l Lun
ch P
rogr
am (S
tate
Sha
re)
14-1
00-0
10-3
360-
067
12,8
307/
1/20
136/
30/2
014
(1,5
10)
1,51
0*
12,8
30*
Tot
al E
nter
pris
e Fu
nd(1
,510
)11
,982
13,8
32(3
,360
)*
26,6
62*
Tot
al S
tate
Fin
anci
al A
ssis
tanc
e Su
bjec
t to
OM
B 0
4-04
(5,5
79,8
58)
36,7
4310
,026
,856
7,16
3,14
01,
702
36,7
43(2
,614
,155
)23
,567
*(1
23,8
52)
14,6
17,7
85*
On
Beh
alf T
PAF
Con
tribu
tions
Not
Sub
ject
to O
MB
04-
04O
n B
ehal
f TPA
F - P
ost R
etire
men
t Med
ical
15-4
95-0
34-5
094-
001
2,26
5,04
77/
1/20
146/
30/2
015
2,26
5,04
72,
265,
047
*2,
265,
047
On
Beh
alf T
PAF
Pens
ion
15-4
95-0
34-5
094-
006
1,33
1,03
87/
1/20
146/
30/2
015
1,33
1,03
81,
331,
038
*1,
331,
038
On
Beh
alf T
PAF
NC
GI P
rem
ium
15-4
95-0
34-5
094-
007
95,7
627/
1/20
146/
30/2
015
95,7
6295
,762
*95
,762
*T
otal
Sta
te F
inan
cial
Ass
ista
nce
(5,5
79,8
58)
36,7
4313
,718
,703
10,8
54,9
871,
702
36,7
43(2
,614
,155
)23
,567
*(1
23,8
52)
18,3
09,6
32*
Loc
al S
ourc
es:
*Sc
hool
1 -
Don
atio
nN
/A20
07/
1/20
146/
30/2
015
200
200
*20
0Ex
xon
- Don
atio
nN
/A50
07/
1/20
146/
30/2
015
500
500
*50
0Ex
xon
- Don
atio
nN
/A75
07/
1/20
106/
30/2
011
750
750
*75
0Ex
xon
- Don
atio
nN
/A50
07/
1/20
096/
30/2
010
249
249
*50
0Ir
onm
an D
onat
ion
N/A
1,20
07/
1/20
116/
30/2
012
1,20
01,
200
*1,
200
*T
otal
Loc
al S
ourc
es2,
199
700
2,89
9*
3,15
0*
Tota
l Sta
te a
nd L
ocal
Fin
anci
al A
ssis
tanc
e(5
,577
,659
)36
,743
13,7
19,4
0310
,857
,886
1,70
236
,743
(2,6
14,1
55)
23,5
67*
(123
,852
)18
,312
,782
See
acco
mpa
nyin
g no
tes t
o th
e Sc
hedu
les o
f Exp
endi
ture
s of F
eder
al a
nd S
tate
Aw
ards
.
-144-
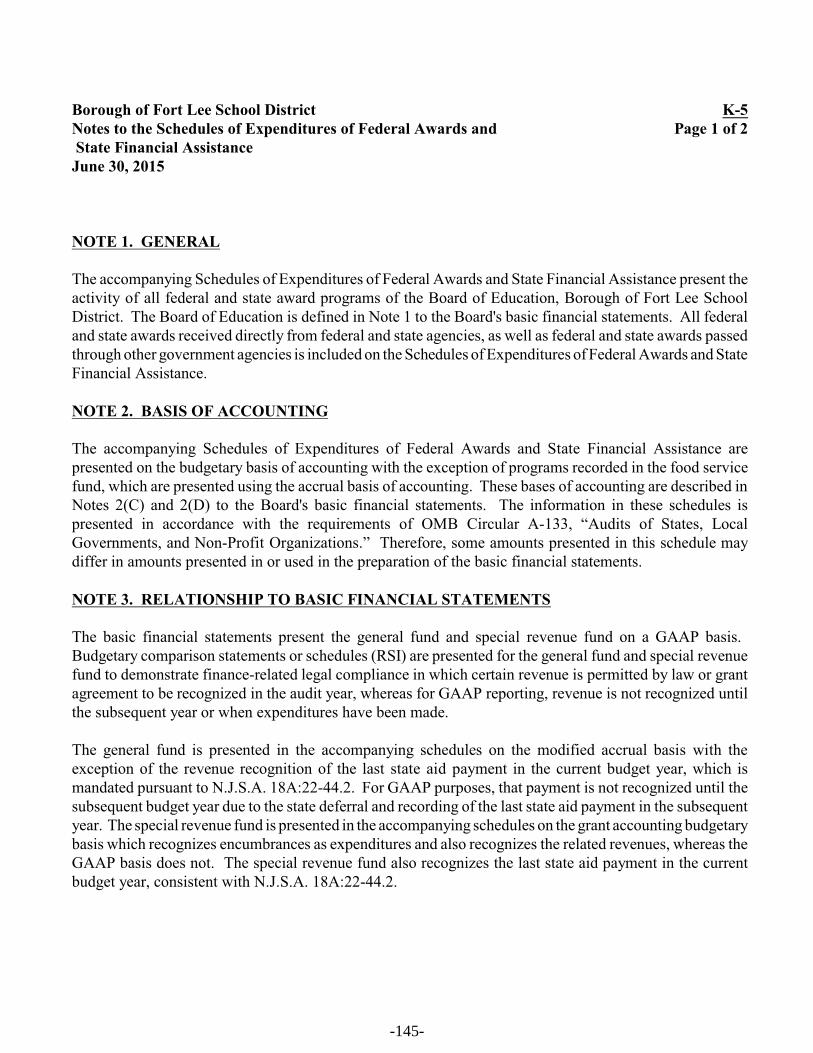
Borough of Fort Lee School District K-5Notes to the Schedules of Expenditures of Federal Awards and Page 1 of 2 State Financial Assistance June 30, 2015
NOTE 1. GENERAL
The accompanying Schedules of Expenditures of Federal Awards and State Financial Assistance present theactivity of all federal and state award programs of the Board of Education, Borough of Fort Lee SchoolDistrict. The Board of Education is defined in Note 1 to the Board's basic financial statements. All federaland state awards received directly from federal and state agencies, as well as federal and state awards passedthrough other government agencies is included on the Schedules of Expenditures of Federal Awards and StateFinancial Assistance.
NOTE 2. BASIS OF ACCOUNTING
The accompanying Schedules of Expenditures of Federal Awards and State Financial Assistance arepresented on the budgetary basis of accounting with the exception of programs recorded in the food servicefund, which are presented using the accrual basis of accounting. These bases of accounting are described inNotes 2(C) and 2(D) to the Board's basic financial statements. The information in these schedules ispresented in accordance with the requirements of OMB Circular A-133, “Audits of States, LocalGovernments, and Non-Profit Organizations.” Therefore, some amounts presented in this schedule maydiffer in amounts presented in or used in the preparation of the basic financial statements.
NOTE 3. RELATIONSHIP TO BASIC FINANCIAL STATEMENTS
The basic financial statements present the general fund and special revenue fund on a GAAP basis. Budgetary comparison statements or schedules (RSI) are presented for the general fund and special revenuefund to demonstrate finance-related legal compliance in which certain revenue is permitted by law or grantagreement to be recognized in the audit year, whereas for GAAP reporting, revenue is not recognized untilthe subsequent year or when expenditures have been made.
The general fund is presented in the accompanying schedules on the modified accrual basis with theexception of the revenue recognition of the last state aid payment in the current budget year, which ismandated pursuant to N.J.S.A. 18A:22-44.2. For GAAP purposes, that payment is not recognized until thesubsequent budget year due to the state deferral and recording of the last state aid payment in the subsequentyear. The special revenue fund is presented in the accompanying schedules on the grant accounting budgetarybasis which recognizes encumbrances as expenditures and also recognizes the related revenues, whereas theGAAP basis does not. The special revenue fund also recognizes the last state aid payment in the currentbudget year, consistent with N.J.S.A. 18A:22-44.2.
-145-
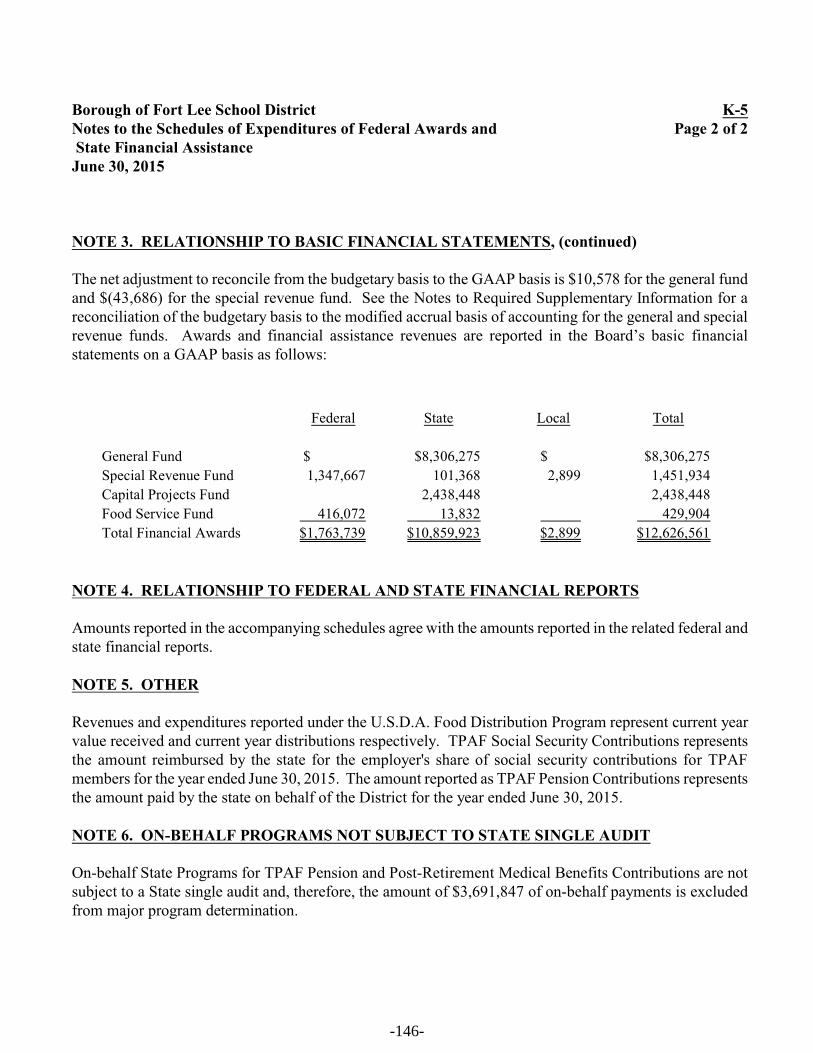
Borough of Fort Lee School District K-5Notes to the Schedules of Expenditures of Federal Awards and Page 2 of 2 State Financial Assistance June 30, 2015
NOTE 3. RELATIONSHIP TO BASIC FINANCIAL STATEMENTS, (continued)
The net adjustment to reconcile from the budgetary basis to the GAAP basis is $10,578 for the general fundand $(43,686) for the special revenue fund. See the Notes to Required Supplementary Information for areconciliation of the budgetary basis to the modified accrual basis of accounting for the general and specialrevenue funds. Awards and financial assistance revenues are reported in the Board’s basic financialstatements on a GAAP basis as follows:
Federal State Local Total
General Fund $ $8,306,275 $ $8,306,275
Special Revenue Fund 1,347,667 101,368 2,899 1,451,934
Capital Projects Fund 2,438,448 2,438,448
Food Service Fund 416,072 13,832 429,904
Total Financial Awards $1,763,739 $10,859,923 $2,899 $12,626,561
NOTE 4. RELATIONSHIP TO FEDERAL AND STATE FINANCIAL REPORTS
Amounts reported in the accompanying schedules agree with the amounts reported in the related federal andstate financial reports.
NOTE 5. OTHER
Revenues and expenditures reported under the U.S.D.A. Food Distribution Program represent current yearvalue received and current year distributions respectively. TPAF Social Security Contributions representsthe amount reimbursed by the state for the employer's share of social security contributions for TPAFmembers for the year ended June 30, 2015. The amount reported as TPAF Pension Contributions representsthe amount paid by the state on behalf of the District for the year ended June 30, 2015.
NOTE 6. ON-BEHALF PROGRAMS NOT SUBJECT TO STATE SINGLE AUDIT
On-behalf State Programs for TPAF Pension and Post-Retirement Medical Benefits Contributions are notsubject to a State single audit and, therefore, the amount of $3,691,847 of on-behalf payments is excludedfrom major program determination.
-146-

K-6Page 1 of 4
BOROUGH OF FORT LEE SCHOOL DISTRICTSCHEDULE OF FINDINGS AND QUESTIONED COSTS
FOR THE FISCAL YEAR ENDED JUNE 30, 2015
Section I - Summary of Auditor’s Results
Financial Statements
Type of auditor’s report issued: unmodified
Internal control over financial reporting:
1. Significant deficiencies identified that arenot considered to be material weaknesses? yes X none reported
2. Material weakness(es) identified? yes X no
Noncompliance material to basic financialstatements noted? yes X no
Federal Awards
Internal Control over major programs:
1. Significant deficiencies identified that are not considered to be material weaknesses? yes X none reported
2. Material weakness(es) identified? yes X no
Type of auditor’s report issued on compliance for major programs: unmodified
Any audit findings disclosed that are required tobe reported in accordance with section .510(a) of Circular A-133? yes X no
Identification of major programs:
CFDA Number(s) Name of Federal Program or Cluster
84.027/84.173 (A) IDEA, Part B-Basic/IDEA, Part B- Preschool
National School Lunch Program/National
10.553/10.555 (A) School Breakfast Program
Note: (A) - Tested as Major Type A Program.
Dollar threshold used to distinguish between type A and type B programs: $300,000
Auditee qualified as low-risk auditee? yes X no
-147-

K-6Page 2 of 4
BOROUGH OF FORT LEE SCHOOL DISTRICTSCHEDULE OF FINDINGS AND QUESTIONED COSTS
FOR THE FISCAL YEAR ENDED JUNE 30, 2015(continued)
Section I - Summary of Auditor’s Results, (continued)
State Awards
Dollar threshold used to distinguish between type A and type B programs: $ 300,000
Auditee qualified as low-risk auditee? X yes no
Type of auditor’s report issued on compliance for major programs: unmodified
Internal Control over major programs:
1. Significant deficiencies identified that are not considered to be material weaknesses? yes X none reported
2. Material weakness(es) identified? yes X no
Any audit findings disclosed that are required tobe reported in accordance with NJ OMB Circular Letter 04-04? yes X no
Identification of major programs:
GMIS Number(s) Name of State Program
495-034-5095-003 (A) Reimbursed TPAF Social Security Contribution
Note: (A) - Tested as Major Type A Program.
-148-

K-6Page 3 of 4
BOROUGH OF FORT LEE SCHOOL DISTRICTSCHEDULE OF FINDINGS AND QUESTIONED COSTS
FOR THE FISCAL YEAR ENDED JUNE 30, 2015(continued)
Section II - Financial Statement Findings
None
-149-

K-6Page 4 of 4
BOROUGH OF FORT LEE SCHOOL DISTRICTSCHEDULE OF FINDINGS AND QUESTIONED COSTS
FOR THE FISCAL YEAR ENDED JUNE 30, 2015(continued)
Section III - Federal Awards and State Financial Assistance Findings and Questioned Costs
FEDERAL AWARDS
None
-150-

K-7
BOROUGH OF FORT LEE SCHOOL DISTRICTSUMMARY SCHEDULE OF PRIOR AUDIT FINDINGS
FOR THE FISCAL YEAR ENDED JUNE 30, 2015
Status of Prior Year Findings
Finding 2015-1:
The District submitted for federal reimbursement, expenditures for textbooks and workbooks for studentsnot enrolled in the Title I, Part A program. A purchase order including both allowance and non-allowablecosts was included in the total reimbursement amount.
Current Status
Corrective action has been taken.
-151-