Embed Size (px)
Citation preview
1
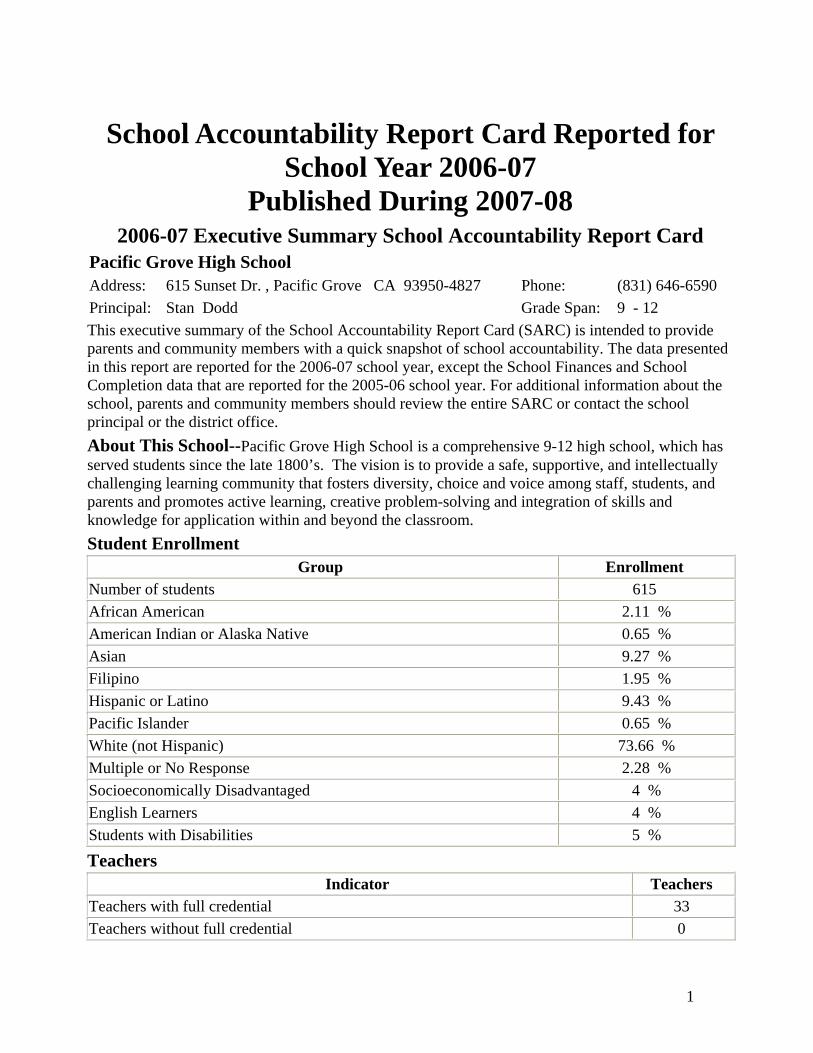
School Accountability Report Card Reported for School Year 2006-07
Published During 2007-08 2006-07 Executive Summary School Accountability Report Card
Pacific Grove High School Address: 615 Sunset Dr. , Pacific Grove CA 93950-4827 Phone: (831) 646-6590 Principal: Stan Dodd Grade Span: 9 - 12 This executive summary of the School Accountability Report Card (SARC) is intended to provide parents and community members with a quick snapshot of school accountability. The data presented in this report are reported for the 2006-07 school year, except the School Finances and School Completion data that are reported for the 2005-06 school year. For additional information about the school, parents and community members should review the entire SARC or contact the school principal or the district office. About This School--Pacific Grove High School is a comprehensive 9-12 high school, which has served students since the late 1800’s. The vision is to provide a safe, supportive, and intellectually challenging learning community that fosters diversity, choice and voice among staff, students, and parents and promotes active learning, creative problem-solving and integration of skills and knowledge for application within and beyond the classroom. Student Enrollment
Group Enrollment Number of students 615 African American 2.11 % American Indian or Alaska Native 0.65 % Asian 9.27 % Filipino 1.95 % Hispanic or Latino 9.43 % Pacific Islander 0.65 % White (not Hispanic) 73.66 % Multiple or No Response 2.28 % Socioeconomically Disadvantaged 4 % English Learners 4 % Students with Disabilities 5 % Teachers
Indicator Teachers Teachers with full credential 33 Teachers without full credential 0
2
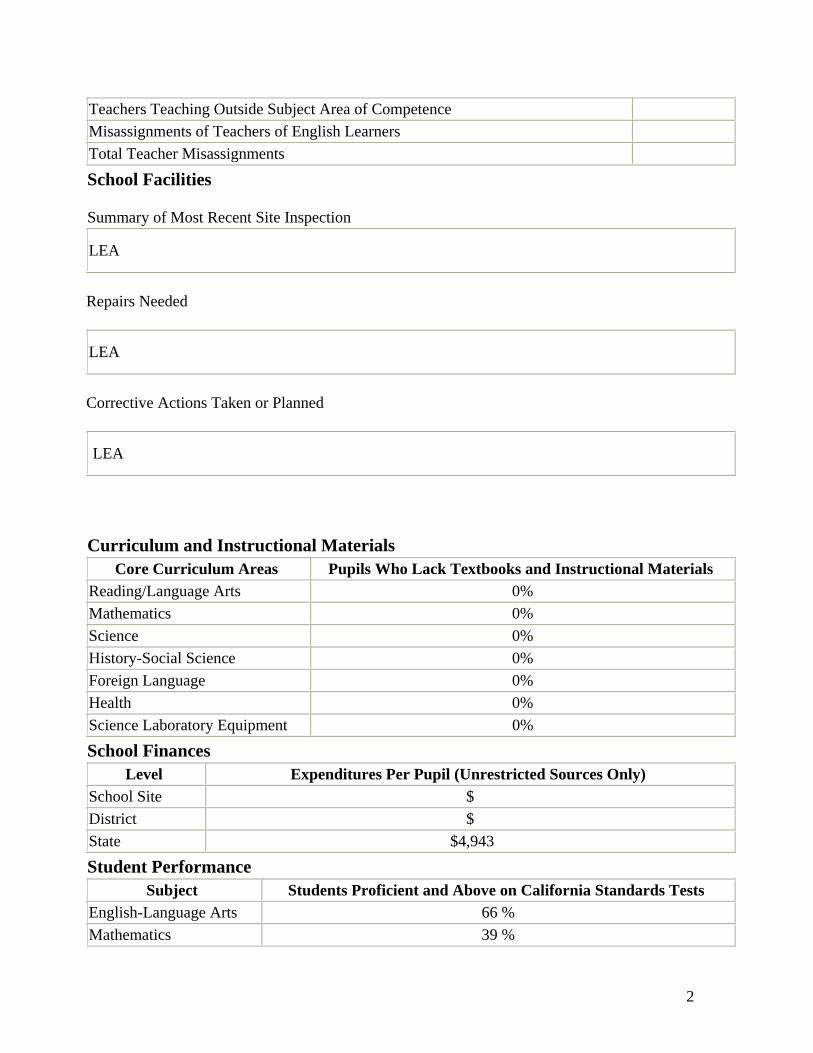
Teachers Teaching Outside Subject Area of Competence Misassignments of Teachers of English Learners Total Teacher Misassignments School Facilities
Summary of Most Recent Site Inspection
LEA
Repairs Needed
LEA
Corrective Actions Taken or Planned
LEA
Curriculum and Instructional Materials Core Curriculum Areas Pupils Who Lack Textbooks and Instructional Materials
Reading/Language Arts 0% Mathematics 0% Science 0% History-Social Science 0% Foreign Language 0% Health 0% Science Laboratory Equipment 0% School Finances
Level Expenditures Per Pupil (Unrestricted Sources Only) School Site $ District $ State $4,943 Student Performance
Subject Students Proficient and Above on California Standards Tests English-Language Arts 66 % Mathematics 39 %
3
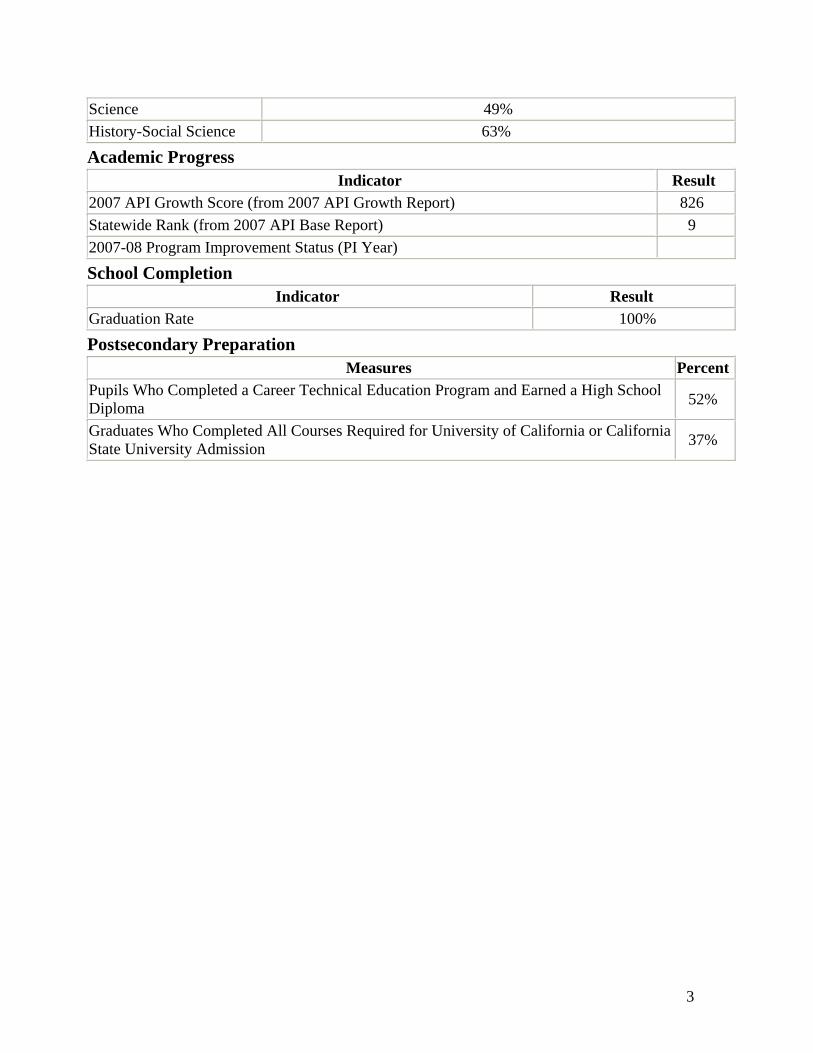
Science 49% History-Social Science 63% Academic Progress
Indicator Result 2007 API Growth Score (from 2007 API Growth Report) 826 Statewide Rank (from 2007 API Base Report) 9 2007-08 Program Improvement Status (PI Year) School Completion
Indicator Result Graduation Rate 100% Postsecondary Preparation
Measures Percent Pupils Who Completed a Career Technical Education Program and Earned a High School Diploma 52%
Graduates Who Completed All Courses Required for University of California or California State University Admission 37%
4
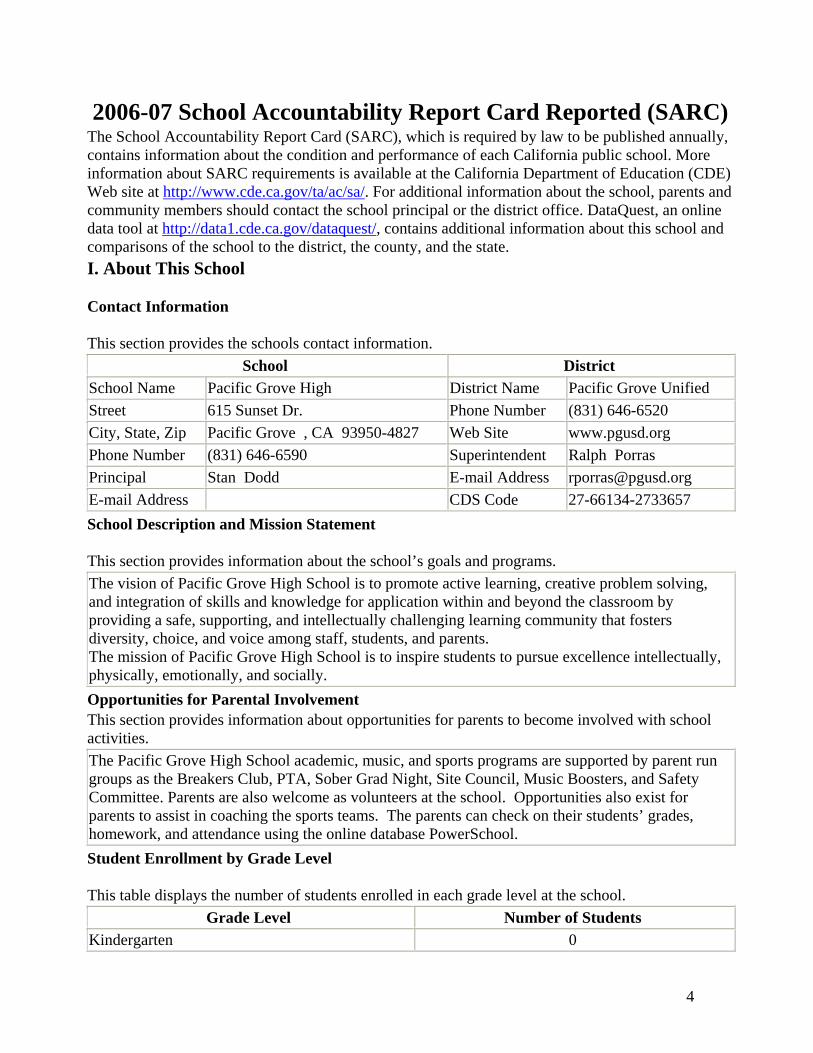
2006-07 School Accountability Report Card Reported (SARC)The School Accountability Report Card (SARC), which is required by law to be published annually, contains information about the condition and performance of each California public school. More information about SARC requirements is available at the California Department of Education (CDE) Web site at http://www.cde.ca.gov/ta/ac/sa/. For additional information about the school, parents and community members should contact the school principal or the district office. DataQuest, an online data tool at http://data1.cde.ca.gov/dataquest/, contains additional information about this school and comparisons of the school to the district, the county, and the state. I. About This School
Contact Information
This section provides the schools contact information. School District
School Name Pacific Grove High District Name Pacific Grove Unified Street 615 Sunset Dr. Phone Number (831) 646-6520 City, State, Zip Pacific Grove , CA 93950-4827 Web Site www.pgusd.org Phone Number (831) 646-6590 Superintendent Ralph Porras Principal Stan Dodd E-mail Address [email protected] E-mail Address CDS Code 27-66134-2733657 School Description and Mission Statement
This section provides information about the school’s goals and programs. The vision of Pacific Grove High School is to promote active learning, creative problem solving, and integration of skills and knowledge for application within and beyond the classroom by providing a safe, supporting, and intellectually challenging learning community that fosters diversity, choice, and voice among staff, students, and parents. The mission of Pacific Grove High School is to inspire students to pursue excellence intellectually, physically, emotionally, and socially. Opportunities for Parental Involvement This section provides information about opportunities for parents to become involved with school activities. The Pacific Grove High School academic, music, and sports programs are supported by parent run groups as the Breakers Club, PTA, Sober Grad Night, Site Council, Music Boosters, and Safety Committee. Parents are also welcome as volunteers at the school. Opportunities also exist for parents to assist in coaching the sports teams. The parents can check on their students’ grades, homework, and attendance using the online database PowerSchool. Student Enrollment by Grade Level
This table displays the number of students enrolled in each grade level at the school. Grade Level Number of Students
Kindergarten 0

5
Grade 1 0 Grade 2 0 Grade 3 0 Grade 4 0 Grade 5 0 Grade 6 0 Grade 7 0 Grade 8 0 Ungraded Elementary 0 Grade 9 156 Grade 10 171 Grade 11 148 Grade 12 140 Ungraded Secondary 0 Total Enrollment 615 Student Enrollment by Group
This table displays the percent of students enrolled at the school who are identified as being in a particular group.
Group Percent of Total Enrollment Group Percent of Total
Enrollment African American 2.11 % White (not Hispanic) 73.66 % American Indian or Alaska Native 0.65 % Multiple or No Response 2.28 %
Asian 9.27 % Socioeconomically Disadvantaged 4 %
Filipino 1.95 % English Learners 4 % Hispanic or Latino 9.43 % Students with Disabilities 5 % Pacific Islander 0.65 % Average Class Size and Class Size Distribution (Secondary)
This table displays by subject area the average class size and the number of classrooms that fall into each size category (a range of total students per classroom).
2004-05 2005-06 2006-07 Number of
Classrooms Number of
Classrooms Number of
Classrooms Subject Avg. Class Size 1-
20 23-32 33+
Avg. Class Size 1-
20 23-32 33+
Avg. Class Size 1-
20 23-32 33+
English 23.8 12 12 24.5 10 14 22.6 11 16
6
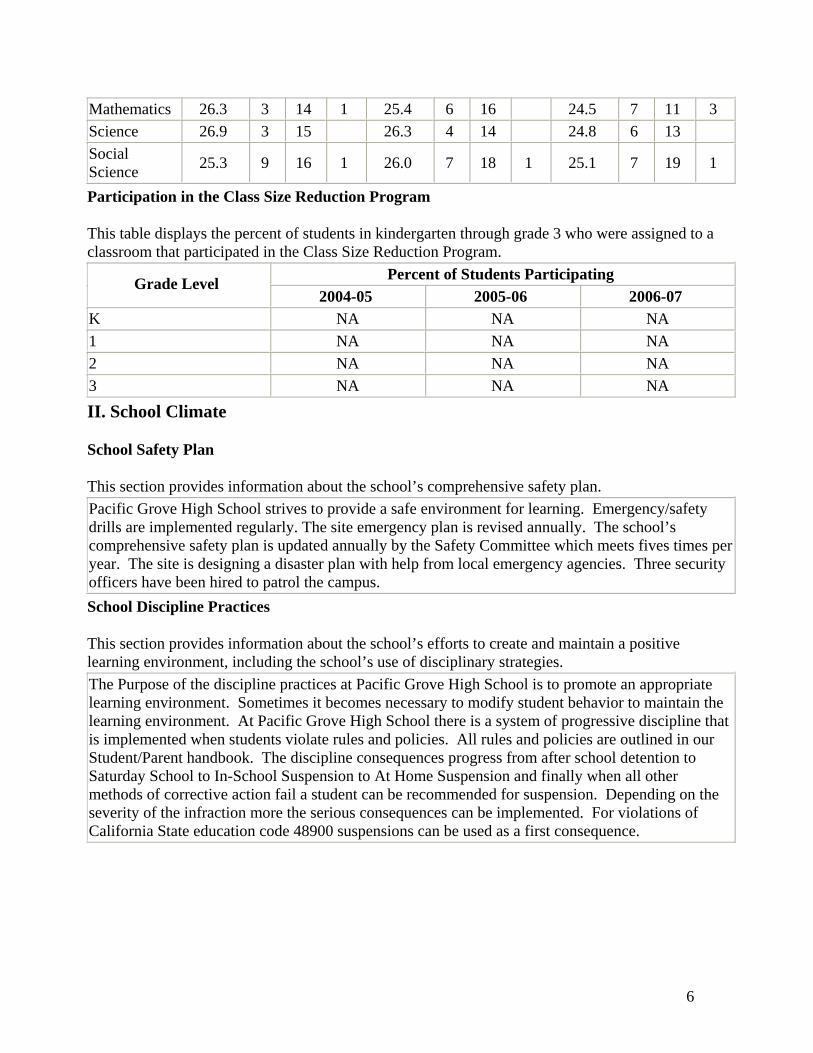
Mathematics 26.3 3 14 1 25.4 6 16 24.5 7 11 3 Science 26.9 3 15 26.3 4 14 24.8 6 13 Social Science 25.3 9 16 1 26.0 7 18 1 25.1 7 19 1 Participation in the Class Size Reduction Program
This table displays the percent of students in kindergarten through grade 3 who were assigned to a classroom that participated in the Class Size Reduction Program.
Percent of Students Participating Grade Level 2004-05 2005-06 2006-07
K NA NA NA 1 NA NA NA 2 NA NA NA 3 NA NA NA II. School Climate
School Safety Plan
This section provides information about the school’s comprehensive safety plan. Pacific Grove High School strives to provide a safe environment for learning. Emergency/safety drills are implemented regularly. The site emergency plan is revised annually. The school’s comprehensive safety plan is updated annually by the Safety Committee which meets fives times per year. The site is designing a disaster plan with help from local emergency agencies. Three security officers have been hired to patrol the campus. School Discipline Practices
This section provides information about the school’s efforts to create and maintain a positive learning environment, including the school’s use of disciplinary strategies. The Purpose of the discipline practices at Pacific Grove High School is to promote an appropriate learning environment. Sometimes it becomes necessary to modify student behavior to maintain the learning environment. At Pacific Grove High School there is a system of progressive discipline that is implemented when students violate rules and policies. All rules and policies are outlined in our Student/Parent handbook. The discipline consequences progress from after school detention to Saturday School to In-School Suspension to At Home Suspension and finally when all other methods of corrective action fail a student can be recommended for suspension. Depending on the severity of the infraction more the serious consequences can be implemented. For violations of California State education code 48900 suspensions can be used as a first consequence.
7
Suspensions and Expulsions
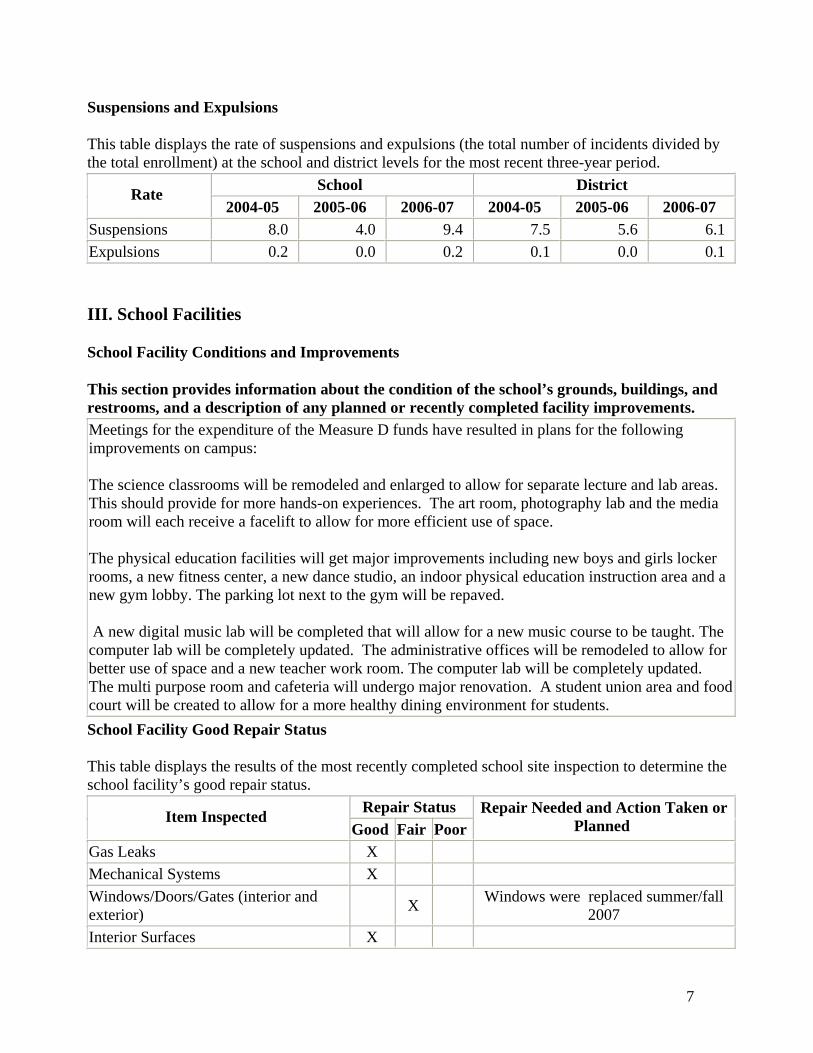
This table displays the rate of suspensions and expulsions (the total number of incidents divided by the total enrollment) at the school and district levels for the most recent three-year period.
School District Rate 2004-05 2005-06 2006-07 2004-05 2005-06 2006-07
Suspensions 8.0 4.0 9.4 7.5 5.6 6.1 Expulsions 0.2 0.0 0.2 0.1 0.0 0.1 III. School Facilities
School Facility Conditions and Improvements
This section provides information about the condition of the school’s grounds, buildings, and restrooms, and a description of any planned or recently completed facility improvements. Meetings for the expenditure of the Measure D funds have resulted in plans for the following improvements on campus: The science classrooms will be remodeled and enlarged to allow for separate lecture and lab areas. This should provide for more hands-on experiences. The art room, photography lab and the media room will each receive a facelift to allow for more efficient use of space. The physical education facilities will get major improvements including new boys and girls locker rooms, a new fitness center, a new dance studio, an indoor physical education instruction area and a new gym lobby. The parking lot next to the gym will be repaved. A new digital music lab will be completed that will allow for a new music course to be taught. The computer lab will be completely updated. The administrative offices will be remodeled to allow for better use of space and a new teacher work room. The computer lab will be completely updated. The multi purpose room and cafeteria will undergo major renovation. A student union area and food court will be created to allow for a more healthy dining environment for students. School Facility Good Repair Status
This table displays the results of the most recently completed school site inspection to determine the school facility’s good repair status.
Repair Status Item Inspected Good Fair Poor
Repair Needed and Action Taken or Planned
Gas Leaks X Mechanical Systems X Windows/Doors/Gates (interior and exterior) X Windows were replaced summer/fall
2007 Interior Surfaces X
8
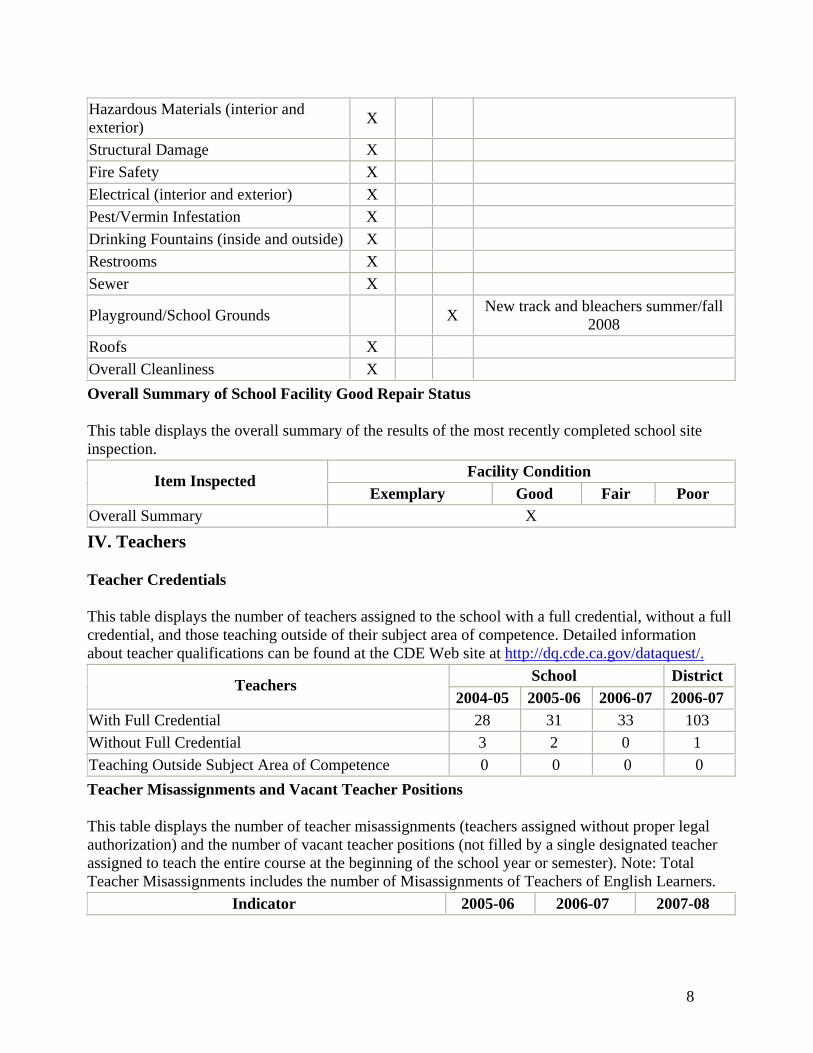
Hazardous Materials (interior and exterior) X
Structural Damage X Fire Safety X Electrical (interior and exterior) X Pest/Vermin Infestation X Drinking Fountains (inside and outside) X Restrooms X Sewer X
Playground/School Grounds X New track and bleachers summer/fall 2008
Roofs X Overall Cleanliness X Overall Summary of School Facility Good Repair Status
This table displays the overall summary of the results of the most recently completed school site inspection.
Facility Condition Item Inspected Exemplary Good Fair Poor
Overall Summary X IV. Teachers
Teacher Credentials
This table displays the number of teachers assigned to the school with a full credential, without a full credential, and those teaching outside of their subject area of competence. Detailed information about teacher qualifications can be found at the CDE Web site at http://dq.cde.ca.gov/dataquest/.
School District Teachers 2004-05 2005-06 2006-07 2006-07
With Full Credential 28 31 33 103 Without Full Credential 3 2 0 1 Teaching Outside Subject Area of Competence 0 0 0 0 Teacher Misassignments and Vacant Teacher Positions
This table displays the number of teacher misassignments (teachers assigned without proper legal authorization) and the number of vacant teacher positions (not filled by a single designated teacher assigned to teach the entire course at the beginning of the school year or semester). Note: Total Teacher Misassignments includes the number of Misassignments of Teachers of English Learners.
Indicator 2005-06 2006-07 2007-08

9
Total Teacher Misassignments 0 0 0
Core Academic Classes Taught by No Child Left Behind Compliant Teachers
This table displays the percent of classes in core academic subjects taught by No Child Left Behind (NCLB) compliant and non-NCLB compliant teachers at the school, at all schools in the district, at high-poverty schools in the district, and at low-poverty schools in the district. More information on teacher qualifications required under NCLB can be found at the CDE Web site at http://www.cde.ca.gov/nclb/sr/tq/.
Percent of Classes In Core Academic Subjects Location of Classes Taught by NCLB
Compliant Teachers Taught by Non-NCLB Compliant
Teachers This School 100.0 0.0 All Schools in District 100.0 0.0 High-Poverty Schools in District
Low-Poverty Schools in District 100.0 0.0 Substitute Teacher Availability
This section provides information about the availability of qualified substitute teachers and the impact of any difficulties in this area on the school’s instructional program. We have an excellent staff of guest teachers for the high school. We have had little difficulty in obtaining qualified guest teachers. Teacher Evaluation Process
This section provides information about the procedures and the criteria used for teacher evaluations. Teacher evaluations are coordinated with the PGTA contract. All tenured teachers are formally evaluated once every two years. Non tenured teachers are evaluated three times a year. The administration does informal evaluations for every teacher throughout the course of the year. V. Support Staff
Academic Counselors and Other Support Staff
This table displays, in units of full-time equivalents (FTE), the number of academic counselors and other support staff who are assigned to the school and the average number of students per academic counselor. One FTE equals one staff member working full time; one FTE could also represent two staff members who each work 50 percent of full time.
Title Number of FTE Assigned to School
Average Number of Students per Academic Counselor
Academic Counselor 2.5 200
10
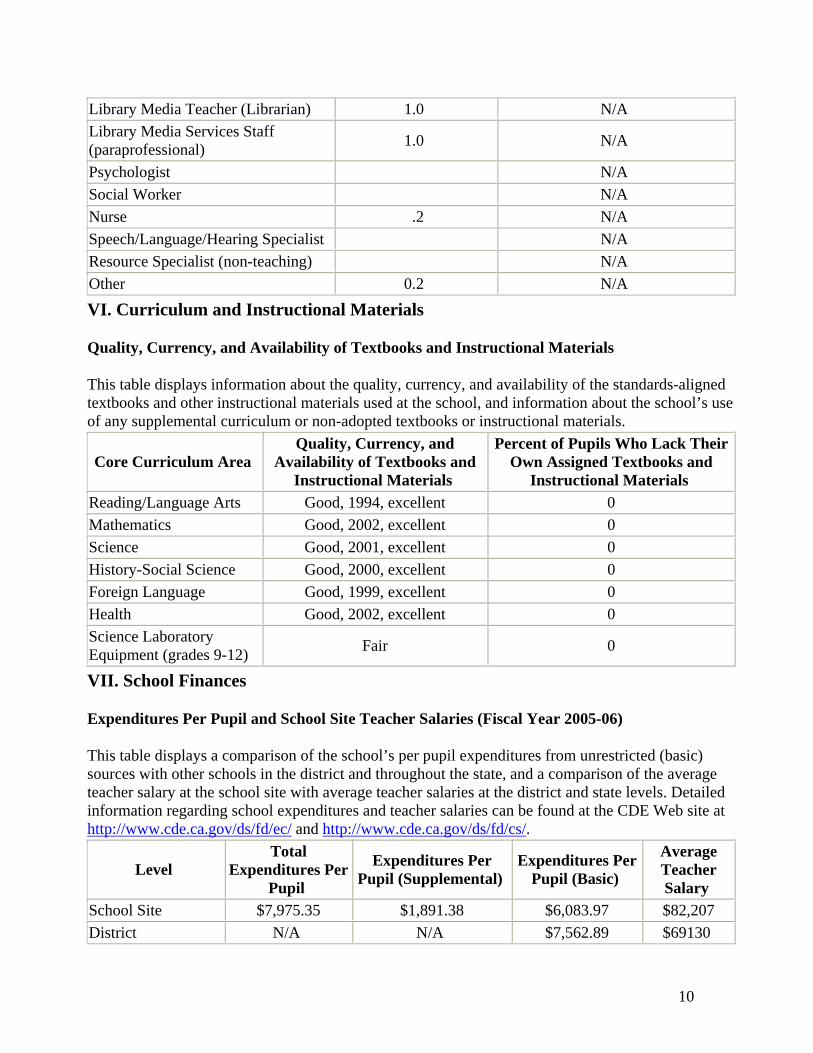
Library Media Teacher (Librarian) 1.0 N/A Library Media Services Staff (paraprofessional) 1.0 N/A
Psychologist N/A Social Worker N/A Nurse .2 N/A Speech/Language/Hearing Specialist N/A Resource Specialist (non-teaching) N/A Other 0.2 N/A VI. Curriculum and Instructional Materials
Quality, Currency, and Availability of Textbooks and Instructional Materials
This table displays information about the quality, currency, and availability of the standards-aligned textbooks and other instructional materials used at the school, and information about the school’s use of any supplemental curriculum or non-adopted textbooks or instructional materials.
Core Curriculum Area Quality, Currency, and
Availability of Textbooks and Instructional Materials
Percent of Pupils Who Lack Their Own Assigned Textbooks and
Instructional Materials Reading/Language Arts Good, 1994, excellent 0 Mathematics Good, 2002, excellent 0 Science Good, 2001, excellent 0 History-Social Science Good, 2000, excellent 0 Foreign Language Good, 1999, excellent 0 Health Good, 2002, excellent 0 Science Laboratory Equipment (grades 9-12) Fair 0 VII. School Finances
Expenditures Per Pupil and School Site Teacher Salaries (Fiscal Year 2005-06)
This table displays a comparison of the school’s per pupil expenditures from unrestricted (basic) sources with other schools in the district and throughout the state, and a comparison of the average teacher salary at the school site with average teacher salaries at the district and state levels. Detailed information regarding school expenditures and teacher salaries can be found at the CDE Web site at http://www.cde.ca.gov/ds/fd/ec/ and http://www.cde.ca.gov/ds/fd/cs/.
Level Total
Expenditures Per Pupil
Expenditures Per Pupil (Supplemental)
Expenditures Per Pupil (Basic)
Average Teacher Salary
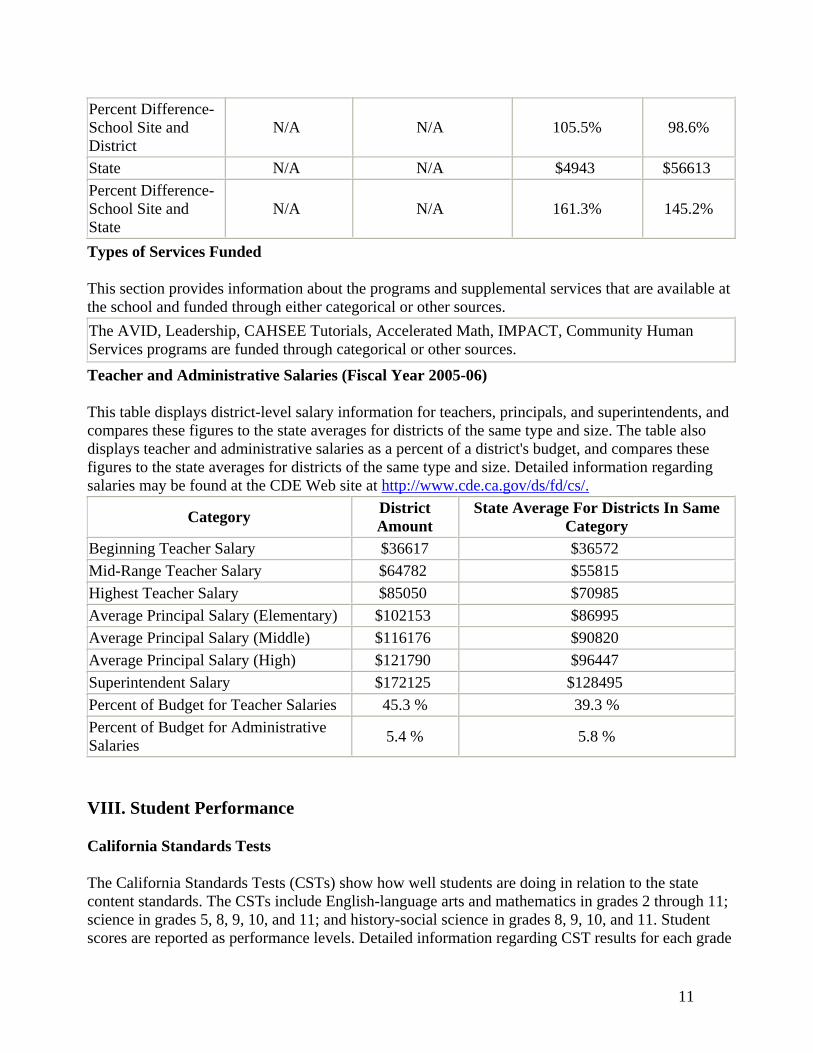
School Site $7,975.35 $1,891.38 $6,083.97 $82,207 District N/A N/A $7,562.89 $69130
11
Percent Difference- School Site and District
N/A N/A 105.5% 98.6%
State N/A N/A $4943 $56613 Percent Difference- School Site and State
N/A N/A 161.3% 145.2% Types of Services Funded
This section provides information about the programs and supplemental services that are available at the school and funded through either categorical or other sources. The AVID, Leadership, CAHSEE Tutorials, Accelerated Math, IMPACT, Community Human Services programs are funded through categorical or other sources. Teacher and Administrative Salaries (Fiscal Year 2005-06)
This table displays district-level salary information for teachers, principals, and superintendents, and compares these figures to the state averages for districts of the same type and size. The table also displays teacher and administrative salaries as a percent of a district's budget, and compares these figures to the state averages for districts of the same type and size. Detailed information regarding salaries may be found at the CDE Web site at http://www.cde.ca.gov/ds/fd/cs/.
Category District Amount
State Average For Districts In Same Category
Beginning Teacher Salary $36617 $36572 Mid-Range Teacher Salary $64782 $55815 Highest Teacher Salary $85050 $70985 Average Principal Salary (Elementary) $102153 $86995 Average Principal Salary (Middle) $116176 $90820 Average Principal Salary (High) $121790 $96447 Superintendent Salary $172125 $128495 Percent of Budget for Teacher Salaries 45.3 % 39.3 % Percent of Budget for Administrative Salaries 5.4 % 5.8 % VIII. Student Performance
California Standards Tests
The California Standards Tests (CSTs) show how well students are doing in relation to the state content standards. The CSTs include English-language arts and mathematics in grades 2 through 11; science in grades 5, 8, 9, 10, and 11; and history-social science in grades 8, 9, 10, and 11. Student scores are reported as performance levels. Detailed information regarding CST results for each grade
12
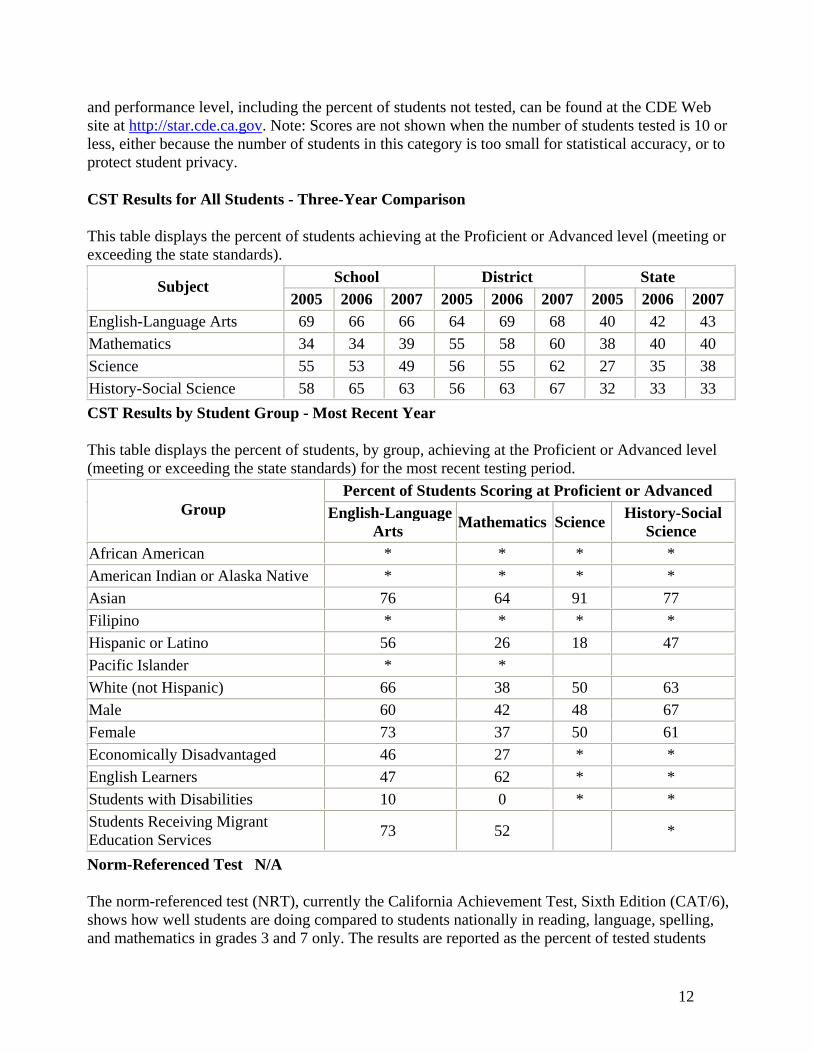
and performance level, including the percent of students not tested, can be found at the CDE Web site at http://star.cde.ca.gov. Note: Scores are not shown when the number of students tested is 10 or less, either because the number of students in this category is too small for statistical accuracy, or to protect student privacy.
CST Results for All Students - Three-Year Comparison
This table displays the percent of students achieving at the Proficient or Advanced level (meeting or exceeding the state standards).
School District State Subject 2005 2006 2007 2005 2006 2007 2005 2006 2007
English-Language Arts 69 66 66 64 69 68 40 42 43 Mathematics 34 34 39 55 58 60 38 40 40 Science 55 53 49 56 55 62 27 35 38 History-Social Science 58 65 63 56 63 67 32 33 33 CST Results by Student Group - Most Recent Year
This table displays the percent of students, by group, achieving at the Proficient or Advanced level (meeting or exceeding the state standards) for the most recent testing period.
Percent of Students Scoring at Proficient or Advanced Group English-Language
Arts Mathematics Science History-Social Science
African American * * * * American Indian or Alaska Native * * * * Asian 76 64 91 77 Filipino * * * * Hispanic or Latino 56 26 18 47 Pacific Islander * * White (not Hispanic) 66 38 50 63 Male 60 42 48 67 Female 73 37 50 61 Economically Disadvantaged 46 27 * * English Learners 47 62 * * Students with Disabilities 10 0 * * Students Receiving Migrant Education Services 73 52 * Norm-Referenced Test N/A
The norm-referenced test (NRT), currently the California Achievement Test, Sixth Edition (CAT/6), shows how well students are doing compared to students nationally in reading, language, spelling, and mathematics in grades 3 and 7 only. The results are reported as the percent of tested students
13
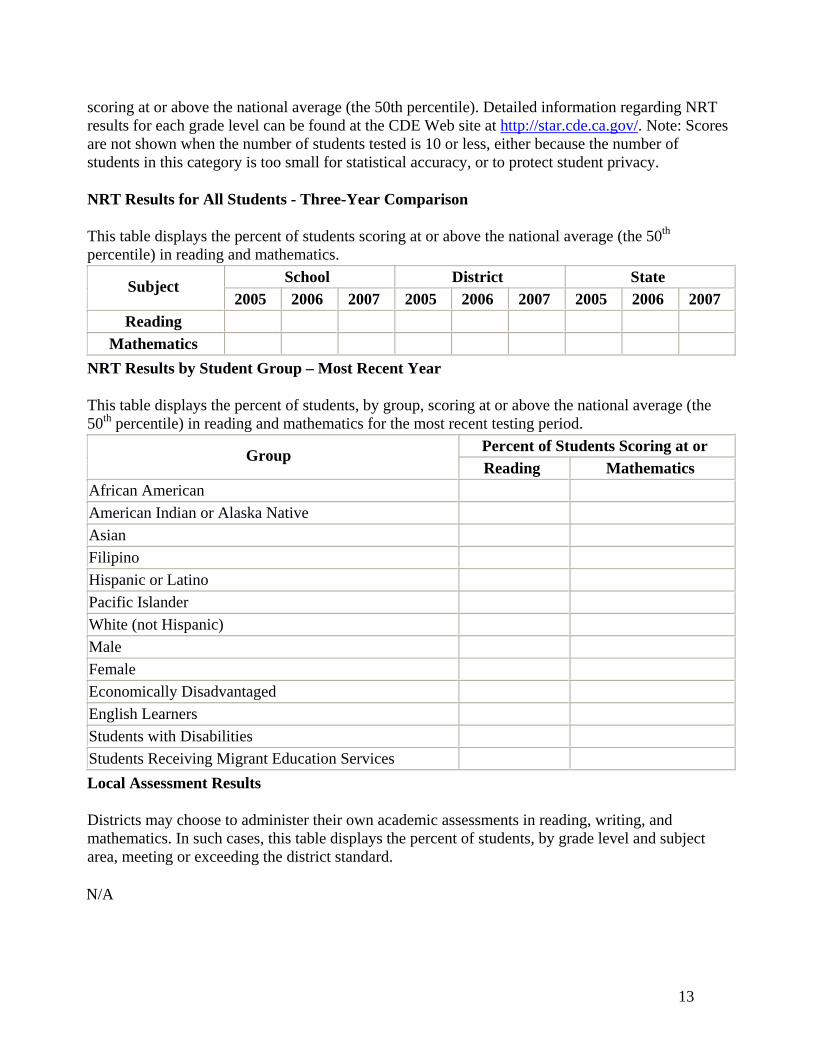
scoring at or above the national average (the 50th percentile). Detailed information regarding NRT results for each grade level can be found at the CDE Web site at http://star.cde.ca.gov/. Note: Scores are not shown when the number of students tested is 10 or less, either because the number of students in this category is too small for statistical accuracy, or to protect student privacy.
NRT Results for All Students - Three-Year Comparison
This table displays the percent of students scoring at or above the national average (the 50th percentile) in reading and mathematics.
School District State Subject 2005 2006 2007 2005 2006 2007 2005 2006 2007
Reading Mathematics
NRT Results by Student Group – Most Recent Year
This table displays the percent of students, by group, scoring at or above the national average (the 50th percentile) in reading and mathematics for the most recent testing period.
Percent of Students Scoring at or Group Reading Mathematics
African American American Indian or Alaska Native Asian Filipino Hispanic or Latino Pacific Islander White (not Hispanic) Male Female Economically Disadvantaged English Learners Students with Disabilities Students Receiving Migrant Education Services Local Assessment Results
Districts may choose to administer their own academic assessments in reading, writing, and mathematics. In such cases, this table displays the percent of students, by grade level and subject area, meeting or exceeding the district standard. N/A
14
California High School Exit Exam (CAHSEE) Results
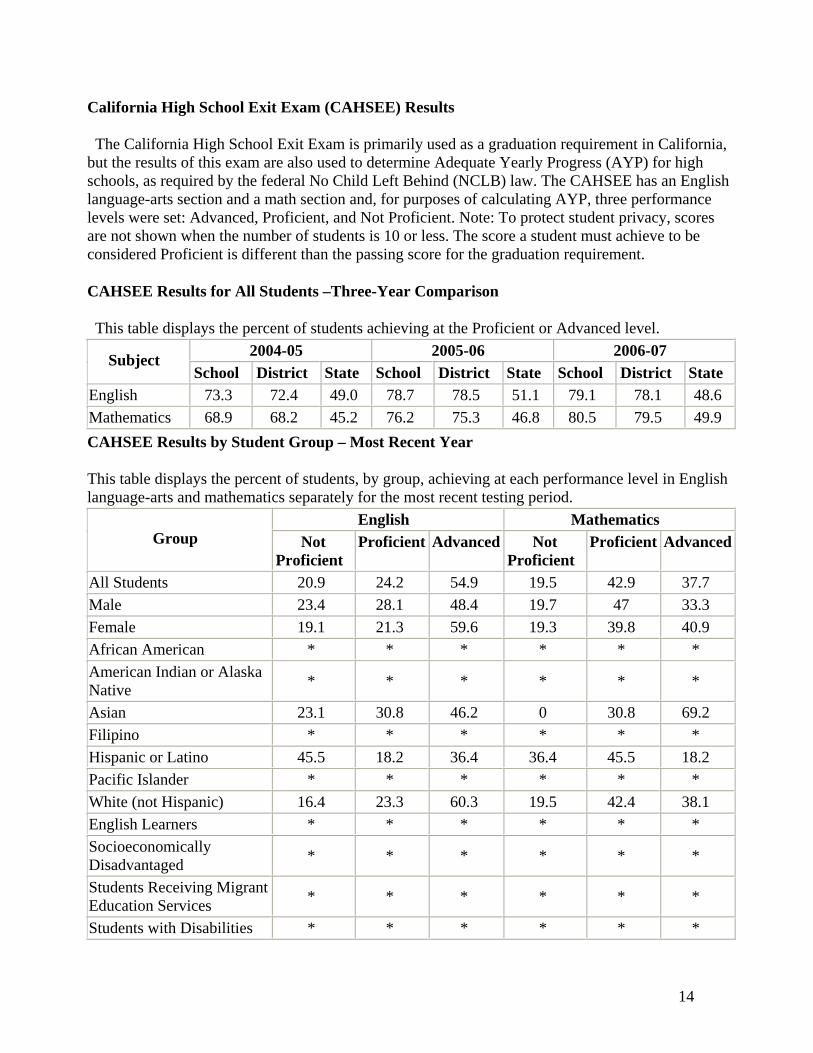
The California High School Exit Exam is primarily used as a graduation requirement in California, but the results of this exam are also used to determine Adequate Yearly Progress (AYP) for high schools, as required by the federal No Child Left Behind (NCLB) law. The CAHSEE has an English language-arts section and a math section and, for purposes of calculating AYP, three performance levels were set: Advanced, Proficient, and Not Proficient. Note: To protect student privacy, scores are not shown when the number of students is 10 or less. The score a student must achieve to be considered Proficient is different than the passing score for the graduation requirement.
CAHSEE Results for All Students –Three-Year Comparison
This table displays the percent of students achieving at the Proficient or Advanced level. 2004-05 2005-06 2006-07 Subject
School District State School District State School District State English 73.3 72.4 49.0 78.7 78.5 51.1 79.1 78.1 48.6 Mathematics 68.9 68.2 45.2 76.2 75.3 46.8 80.5 79.5 49.9 CAHSEE Results by Student Group – Most Recent Year
This table displays the percent of students, by group, achieving at each performance level in English language-arts and mathematics separately for the most recent testing period.
English Mathematics Group Not
Proficient Proficient
Advanced
Not
Proficient Proficient
Advanced
All Students 20.9 24.2 54.9 19.5 42.9 37.7 Male 23.4 28.1 48.4 19.7 47 33.3 Female 19.1 21.3 59.6 19.3 39.8 40.9 African American * * * * * * American Indian or Alaska Native * * * * * *
Asian 23.1 30.8 46.2 0 30.8 69.2 Filipino * * * * * * Hispanic or Latino 45.5 18.2 36.4 36.4 45.5 18.2 Pacific Islander * * * * * * White (not Hispanic) 16.4 23.3 60.3 19.5 42.4 38.1 English Learners * * * * * * Socioeconomically Disadvantaged * * * * * *
Students Receiving Migrant Education Services * * * * * *
Students with Disabilities * * * * * *
15
California Physical Fitness Test Results
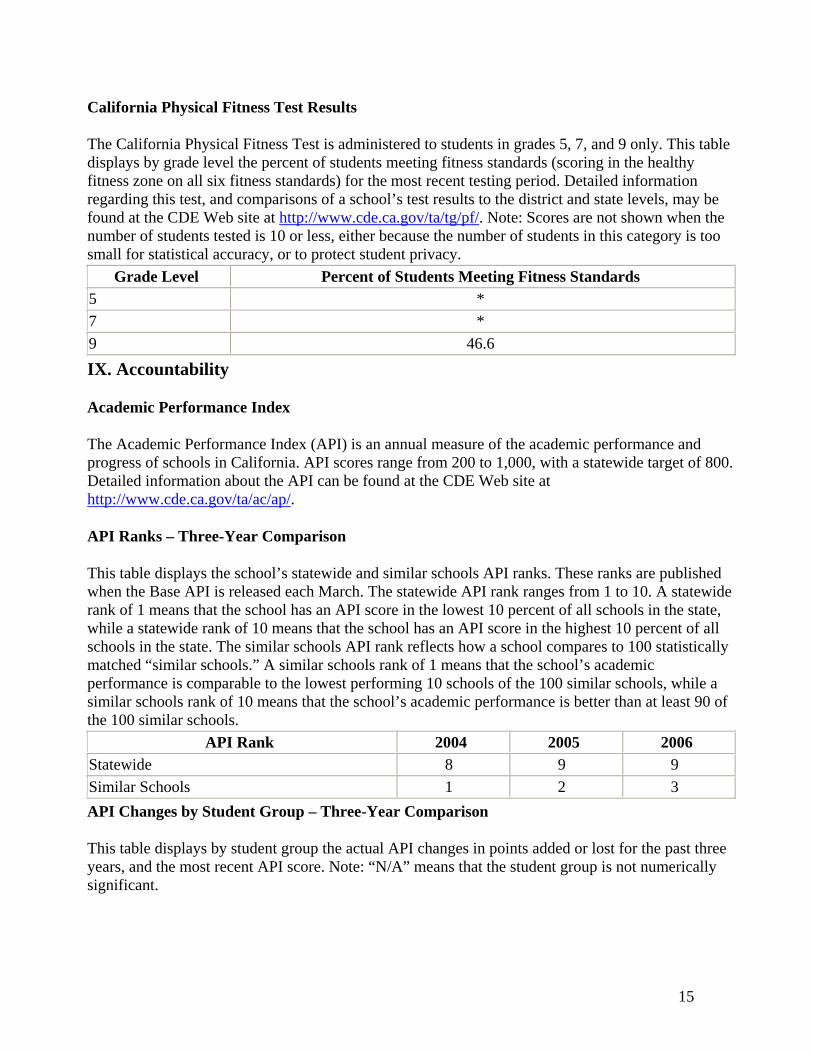
The California Physical Fitness Test is administered to students in grades 5, 7, and 9 only. This table displays by grade level the percent of students meeting fitness standards (scoring in the healthy fitness zone on all six fitness standards) for the most recent testing period. Detailed information regarding this test, and comparisons of a school’s test results to the district and state levels, may be found at the CDE Web site at http://www.cde.ca.gov/ta/tg/pf/. Note: Scores are not shown when the number of students tested is 10 or less, either because the number of students in this category is too small for statistical accuracy, or to protect student privacy.
Grade Level Percent of Students Meeting Fitness Standards 5 * 7 * 9 46.6 IX. Accountability
Academic Performance Index
The Academic Performance Index (API) is an annual measure of the academic performance and progress of schools in California. API scores range from 200 to 1,000, with a statewide target of 800. Detailed information about the API can be found at the CDE Web site at http://www.cde.ca.gov/ta/ac/ap/.
API Ranks – Three-Year Comparison
This table displays the school’s statewide and similar schools API ranks. These ranks are published when the Base API is released each March. The statewide API rank ranges from 1 to 10. A statewide rank of 1 means that the school has an API score in the lowest 10 percent of all schools in the state, while a statewide rank of 10 means that the school has an API score in the highest 10 percent of all schools in the state. The similar schools API rank reflects how a school compares to 100 statistically matched “similar schools.” A similar schools rank of 1 means that the school’s academic performance is comparable to the lowest performing 10 schools of the 100 similar schools, while a similar schools rank of 10 means that the school’s academic performance is better than at least 90 of the 100 similar schools.
API Rank 2004 2005 2006 Statewide 8 9 9 Similar Schools 1 2 3 API Changes by Student Group – Three-Year Comparison
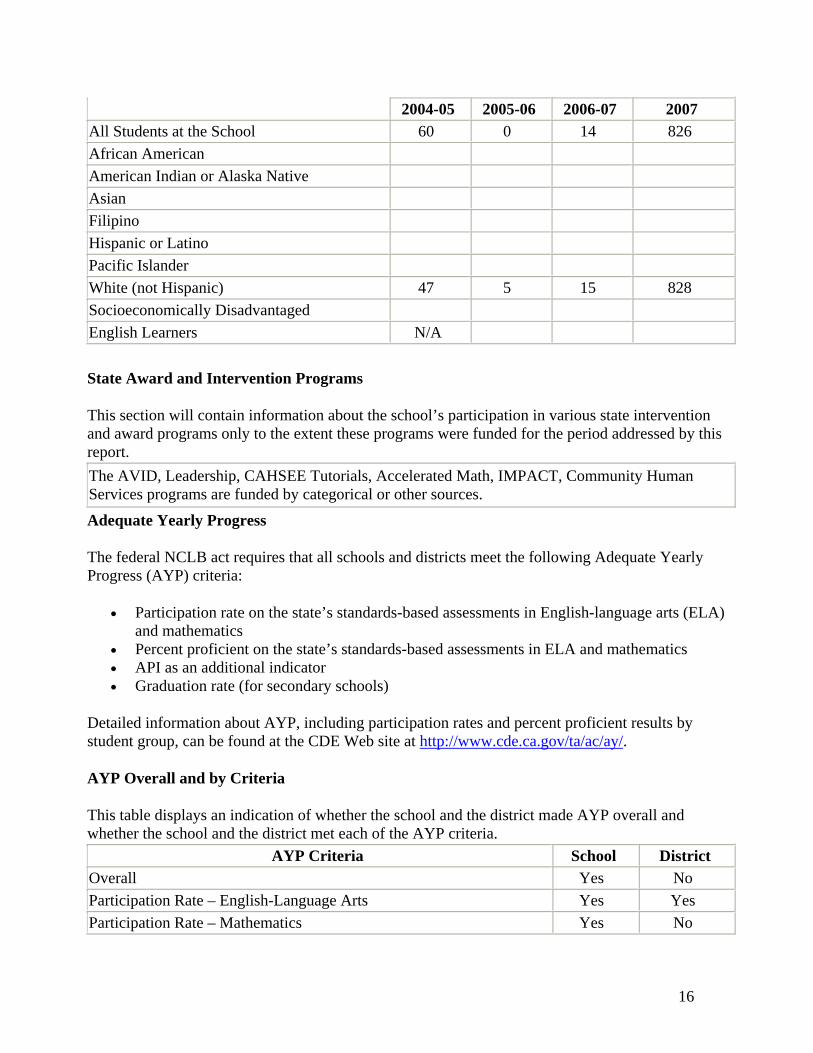
This table displays by student group the actual API changes in points added or lost for the past three years, and the most recent API score. Note: “N/A” means that the student group is not numerically significant.
16
2004-05 2005-06 2006-07 2007 All Students at the School 60 0 14 826 African American American Indian or Alaska Native Asian Filipino Hispanic or Latino Pacific Islander White (not Hispanic) 47 5 15 828 Socioeconomically Disadvantaged English Learners N/A
State Award and Intervention Programs
This section will contain information about the school’s participation in various state intervention and award programs only to the extent these programs were funded for the period addressed by this report. The AVID, Leadership, CAHSEE Tutorials, Accelerated Math, IMPACT, Community Human Services programs are funded by categorical or other sources. Adequate Yearly Progress
The federal NCLB act requires that all schools and districts meet the following Adequate Yearly Progress (AYP) criteria:
• Participation rate on the state’s standards-based assessments in English-language arts (ELA) and mathematics
• Percent proficient on the state’s standards-based assessments in ELA and mathematics • API as an additional indicator • Graduation rate (for secondary schools)
Detailed information about AYP, including participation rates and percent proficient results by student group, can be found at the CDE Web site at http://www.cde.ca.gov/ta/ac/ay/.
AYP Overall and by Criteria
This table displays an indication of whether the school and the district made AYP overall and whether the school and the district met each of the AYP criteria.
AYP Criteria School District Overall Yes No Participation Rate – English-Language Arts Yes Yes Participation Rate – Mathematics Yes No
17
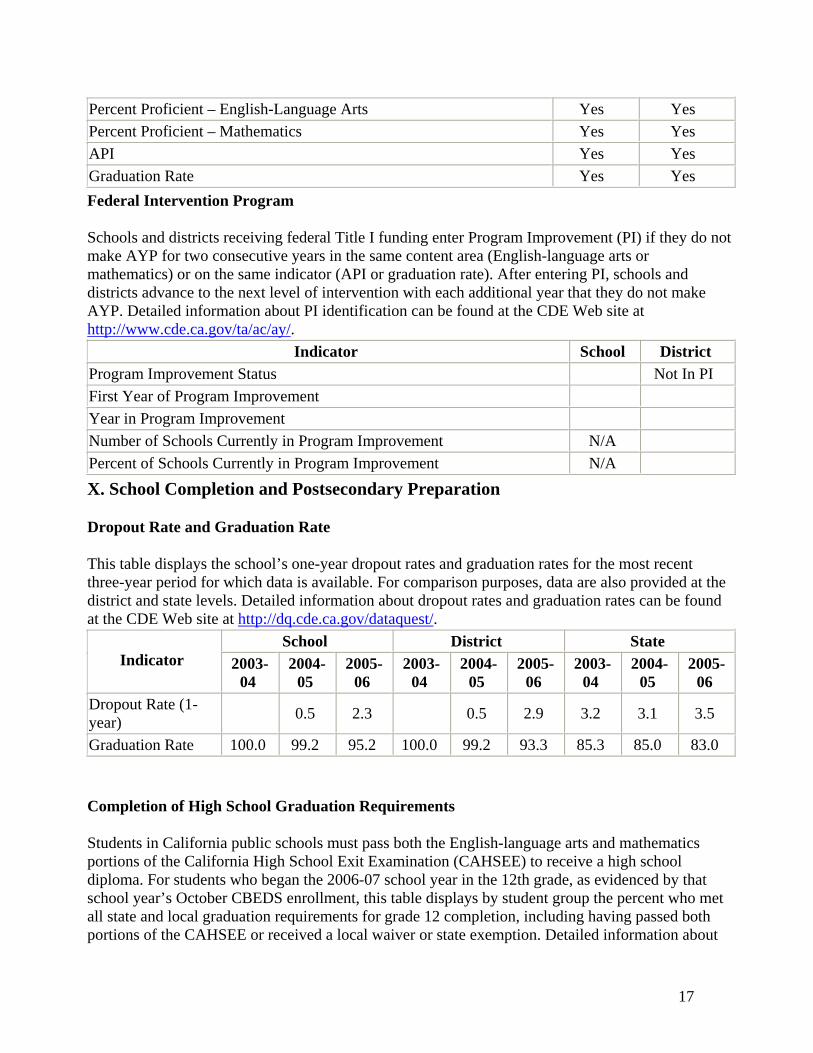
Percent Proficient – English-Language Arts Yes Yes Percent Proficient – Mathematics Yes Yes API Yes Yes Graduation Rate Yes Yes Federal Intervention Program
Schools and districts receiving federal Title I funding enter Program Improvement (PI) if they do not make AYP for two consecutive years in the same content area (English-language arts or mathematics) or on the same indicator (API or graduation rate). After entering PI, schools and districts advance to the next level of intervention with each additional year that they do not make AYP. Detailed information about PI identification can be found at the CDE Web site at http://www.cde.ca.gov/ta/ac/ay/.
Indicator School District Program Improvement Status Not In PI First Year of Program Improvement Year in Program Improvement Number of Schools Currently in Program Improvement N/A Percent of Schools Currently in Program Improvement N/A X. School Completion and Postsecondary Preparation
Dropout Rate and Graduation Rate
This table displays the school’s one-year dropout rates and graduation rates for the most recent three-year period for which data is available. For comparison purposes, data are also provided at the district and state levels. Detailed information about dropout rates and graduation rates can be found at the CDE Web site at http://dq.cde.ca.gov/dataquest/.
School District State Indicator 2003-
04 2004-
05 2005-
06 2003-
04 2004-
05 2005-
06 2003-
04 2004-
05 2005-
06 Dropout Rate (1-year) 0.5 2.3 0.5 2.9 3.2 3.1 3.5
Graduation Rate 100.0 99.2 95.2 100.0 99.2 93.3 85.3 85.0 83.0 Completion of High School Graduation Requirements
Students in California public schools must pass both the English-language arts and mathematics portions of the California High School Exit Examination (CAHSEE) to receive a high school diploma. For students who began the 2006-07 school year in the 12th grade, as evidenced by that school year’s October CBEDS enrollment, this table displays by student group the percent who met all state and local graduation requirements for grade 12 completion, including having passed both portions of the CAHSEE or received a local waiver or state exemption. Detailed information about

18
the CAHSEE can be found at the CDE Web site at http://www.cde.ca.gov/ta/tg/hs/. Note: "N/A" means that the student group is not numerically significant.
Graduating Class of 2007 Group School District State
All Students 143 150 N/A African American 6% N/A American Indian or Alaska Native 1% N/A Asian 11% N/A Filipino 1% N/A Hispanic or Latino 8% N/A Pacific Islander 0 N/A White (not Hispanic) 73% N/A Socioeconomically Disadvantaged 0 N/A English Learners 0 N/A Students with Disabilities 4% N/A Career Technical Education Programs
This section provides information about the degree to which pupils are prepared to enter the workforce, including a list of career technical education (CTE) programs offered at the school. Pacific Grove High School offers a challenging curriculum geared to respond to diverse student need and interest. To graduate, students must complete a program of study that exposes them to four years of English Language arts, along with mathematics, physical/life science, social studies, physical education, visual/performing arts or foreign language and a vocational education class. Counselors discuss and assist students in career planning during students’ four-year plan meetings starting freshman year. In addition, students participate in skill/interest assessments in the required computer class. Based on the assessment results students choose a career to research and, using power point, present their findings to the class. Senior year students participate in additional interest/value assessments as part of their senior project. Regional occupational classes such as foods, computers, digital imaging, photography, drafting, woodshop, first responder, introduction to fire and police are offered to students that are 16 years of age or older. A work experience class is available for students to earn credit for working.
Career Technical Education Participation
This table displays information about participation in the school’s CTE programs.
Measure CTE Program Participation
19
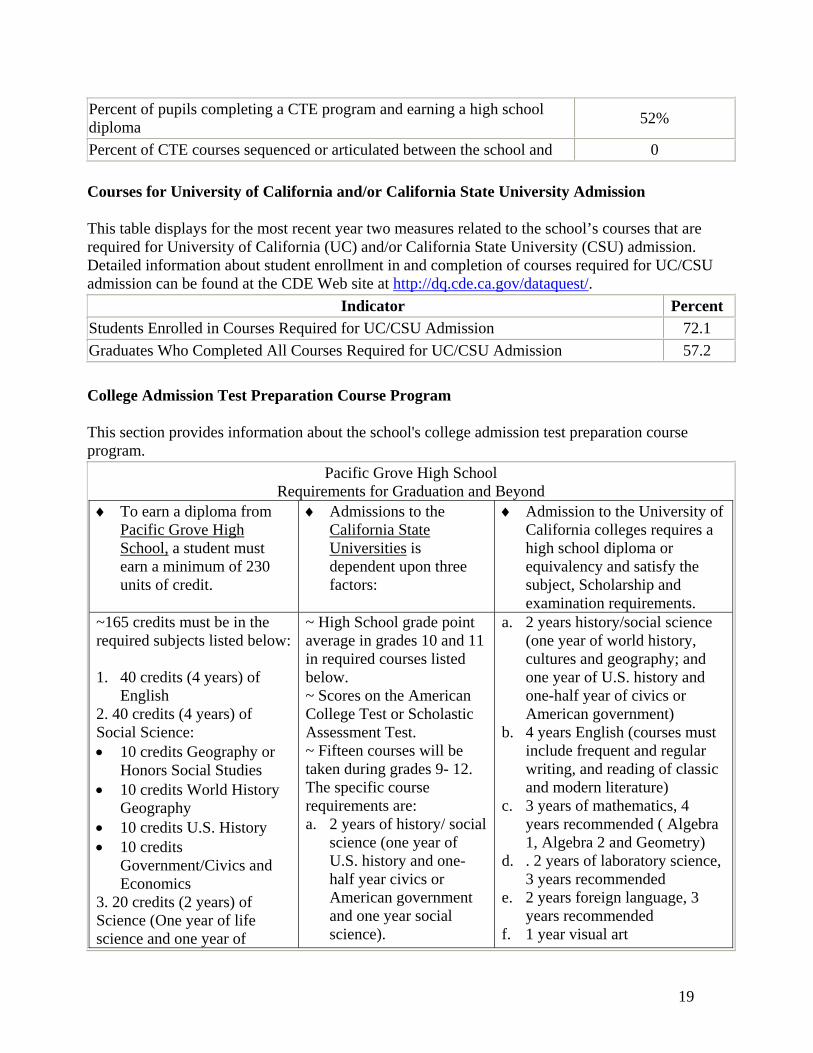
Percent of pupils completing a CTE program and earning a high school diploma 52%
Percent of CTE courses sequenced or articulated between the school and 0
Courses for University of California and/or California State University Admission
This table displays for the most recent year two measures related to the school’s courses that are required for University of California (UC) and/or California State University (CSU) admission. Detailed information about student enrollment in and completion of courses required for UC/CSU admission can be found at the CDE Web site at http://dq.cde.ca.gov/dataquest/.
Indicator Percent Students Enrolled in Courses Required for UC/CSU Admission 72.1 Graduates Who Completed All Courses Required for UC/CSU Admission 57.2 College Admission Test Preparation Course Program
This section provides information about the school's college admission test preparation course program.
Pacific Grove High School Requirements for Graduation and Beyond
♦ To earn a diploma from Pacific Grove High School, a student must earn a minimum of 230 units of credit.
♦ Admissions to the California State Universities is dependent upon three factors:
♦ Admission to the University of California colleges requires a high school diploma or equivalency and satisfy the subject, Scholarship and examination requirements.
~165 credits must be in the required subjects listed below: 1. 40 credits (4 years) of
English 2. 40 credits (4 years) of Social Science: • 10 credits Geography or
Honors Social Studies • 10 credits World History
Geography • 10 credits U.S. History • 10 credits
Government/Civics and Economics
3. 20 credits (2 years) of Science (One year of life science and one year of
~ High School grade point average in grades 10 and 11 in required courses listed below. ~ Scores on the American College Test or Scholastic Assessment Test. ~ Fifteen courses will be taken during grades 9- 12. The specific course requirements are: a. 2 years of history/ social
science (one year of U.S. history and one-half year civics or American government and one year social science).
a. 2 years history/social science (one year of world history, cultures and geography; and one year of U.S. history and one-half year of civics or American government)
b. 4 years English (courses must include frequent and regular writing, and reading of classic and modern literature)
c. 3 years of mathematics, 4 years recommended ( Algebra 1, Algebra 2 and Geometry)
d. . 2 years of laboratory science, 3 years recommended
e. 2 years foreign language, 3 years recommended
f. 1 year visual art
20
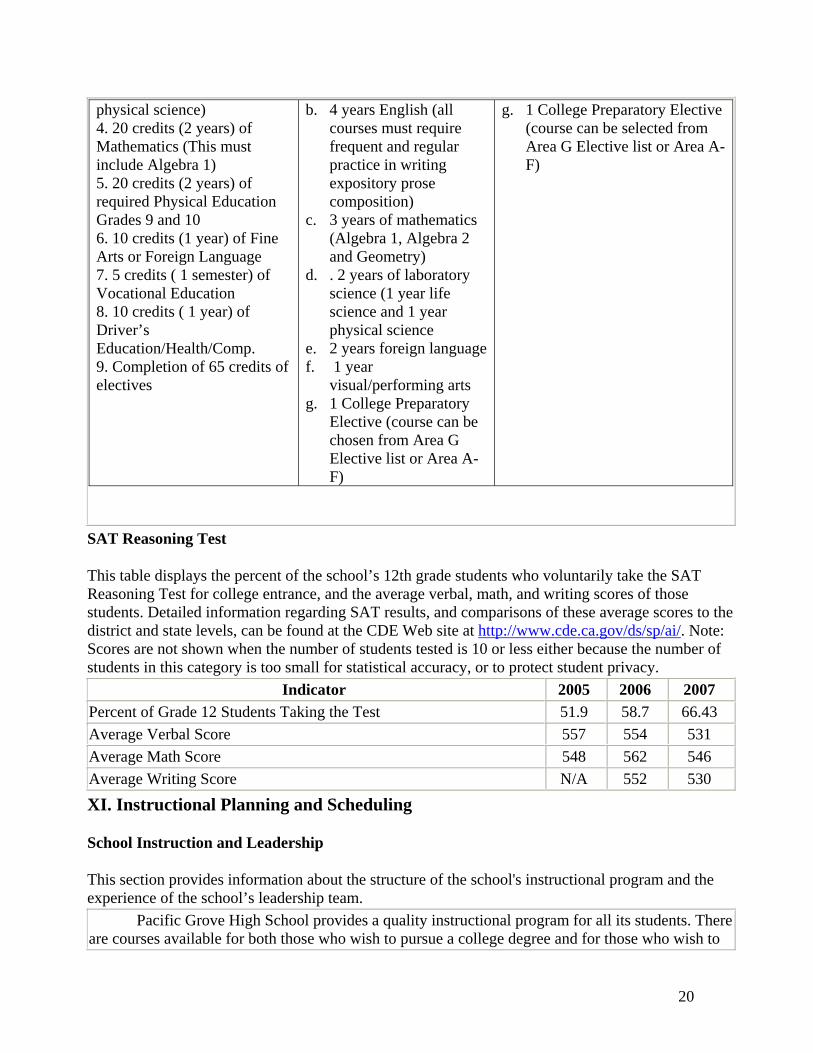
physical science) 4. 20 credits (2 years) of Mathematics (This must include Algebra 1) 5. 20 credits (2 years) of required Physical Education Grades 9 and 10 6. 10 credits (1 year) of Fine Arts or Foreign Language 7. 5 credits ( 1 semester) of Vocational Education 8. 10 credits ( 1 year) of Driver’s Education/Health/Comp. 9. Completion of 65 credits of electives
b. 4 years English (all courses must require frequent and regular practice in writing expository prose composition)
c. 3 years of mathematics (Algebra 1, Algebra 2 and Geometry)
d. . 2 years of laboratory science (1 year life science and 1 year physical science
e. 2 years foreign language f. 1 year
visual/performing arts g. 1 College Preparatory
Elective (course can be chosen from Area G Elective list or Area A- F)
g. 1 College Preparatory Elective (course can be selected from Area G Elective list or Area A-F)
SAT Reasoning Test
This table displays the percent of the school’s 12th grade students who voluntarily take the SAT Reasoning Test for college entrance, and the average verbal, math, and writing scores of those students. Detailed information regarding SAT results, and comparisons of these average scores to the district and state levels, can be found at the CDE Web site at http://www.cde.ca.gov/ds/sp/ai/. Note: Scores are not shown when the number of students tested is 10 or less either because the number of students in this category is too small for statistical accuracy, or to protect student privacy.
Indicator 2005 2006 2007 Percent of Grade 12 Students Taking the Test 51.9 58.7 66.43 Average Verbal Score 557 554 531 Average Math Score 548 562 546 Average Writing Score N/A 552 530 XI. Instructional Planning and Scheduling
School Instruction and Leadership
This section provides information about the structure of the school's instructional program and the experience of the school’s leadership team.
Pacific Grove High School provides a quality instructional program for all its students. There are courses available for both those who wish to pursue a college degree and for those who wish to

21
enter a vocational profession directly after high school. Courses are aligned with state standards. Teachers review their students’ performance on state standards testing regularly to determine students’ mastery of standards.
Department instructional leaders also facilitate review of student finals and other project work to help department members assess student progress toward standards with benchmark assessments. When areas of student weakness are identified, departments request staff development opportunities (both on campus and through conferences) to remediate deficiencies. Departments are encouraged to attend state subject matter conferences on a regular basis.
There are three primary instructional leadership teams on campus: the site cabinet, leadership, and instructional leaders (department chairs). Site cabinet review instructional policies, school board policies, current calendaring of major events, reviews of justifiable absences, and any other schoolwide policy that require review.
Instructional leaders address instructional practices and policies as they affect their departments, WASC guideline implementation, testing schedules, technology/library services and other direct support services to the classroom. To assure that all students are progressing toward achieving the core curriculum, counselors meet with students up to at least four times a year to assess progress and provide additional remedial or study skill support. Professional Development This section provides information about the program for training the school's teachers and other professional staff. Staff development activities, essential for maintaining and improving equality education, emphasize the following areas: o SB395 (English Language Learners) o An integrated, literature-based language arts program, which includes reading, writing, listening and speaking o A problem-solving, manipulative-based mathematics and science program o Integration of all subject areas o Higher-level thinking skills o Cooperative learning and peer coaching o Technology integration o Addressing the needs of students with special needs o Data driven learning activities and assessments o Standards alignment o Differentiated instruction Instructional Minutes
This table displays a comparison of the number of instructional minutes offered at the school to the state requirement for each grade level.
Instructional Minutes Grade Level Offered State Requirement
9 66,930 64,800 10 66,930 64,800 11 66,930 64,800 12 66,930 64,800
22
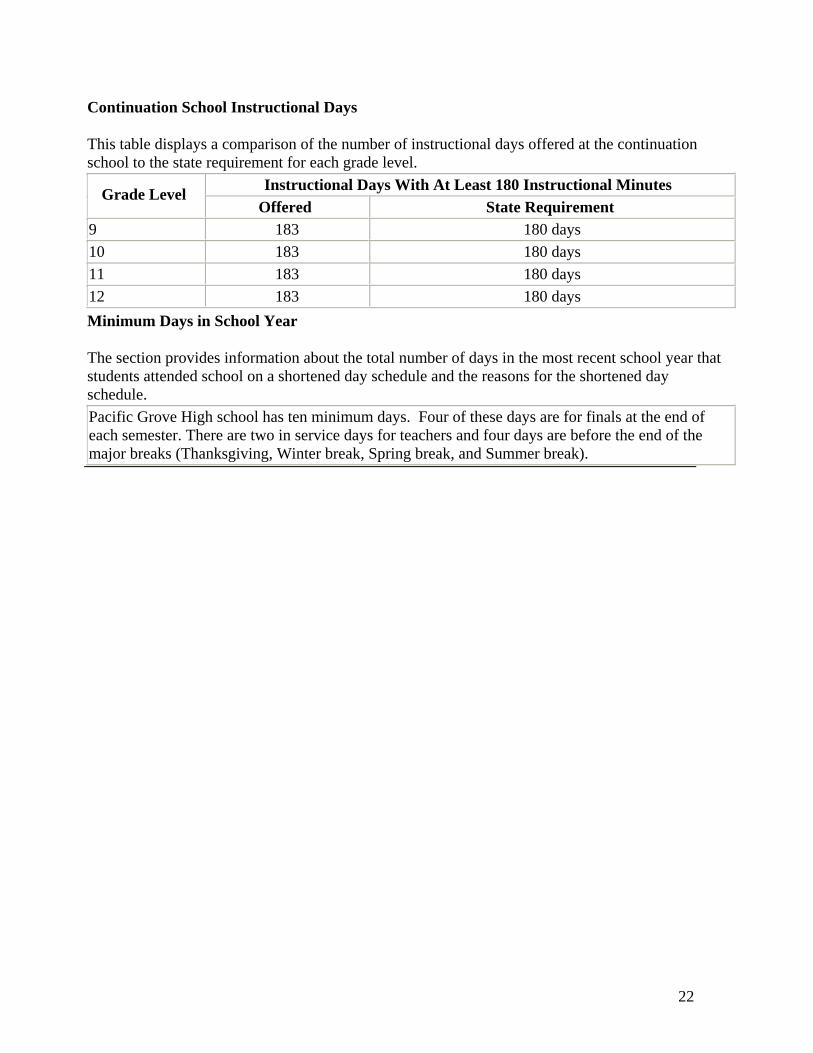
Continuation School Instructional Days
This table displays a comparison of the number of instructional days offered at the continuation school to the state requirement for each grade level.
Instructional Days With At Least 180 Instructional Minutes Grade Level Offered State Requirement
9 183 180 days 10 183 180 days 11 183 180 days 12 183 180 days Minimum Days in School Year
The section provides information about the total number of days in the most recent school year that students attended school on a shortened day schedule and the reasons for the shortened day schedule. Pacific Grove High school has ten minimum days. Four of these days are for finals at the end of each semester. There are two in service days for teachers and four days are before the end of the major breaks (Thanksgiving, Winter break, Spring break, and Summer break).