Embed Size (px)
Citation preview

Schedules to the Consolidated Financial Statements for the year ended March 31, 2010
24. Significant accounting policies and notes on accounts
Company overview
Infosys Technologies Limited ("Infosys" or "the company") along with its majority owned and controlled subsidiary,
Infosys BPO Limited ("Infosys BPO") and wholly owned and controlled subsidiaries, Infosys Technologies (Australia)
Pty. Limited ("Infosys Australia"), Infosys Technologies (China) Co. Limited ("Infosys China"), Infosys Consulting,
Inc.("Infosys Consulting"), Infosys Technologies S. De R.L. de C.V. ("Infosys Mexico"), Infosys Technologies
(Sweden) AB ("Infosys Sweden"), Infosys Tecnologia Do Brasil LTDA ("Infosys Brasil") and Infosys Public Services,
Inc, USA ("Infosys Public Servies") and controlled trusts is a leading global technology services corporation. The group
of companies ("the Group") provides end-to-end business solutions that leverage technology thereby enabling clients to
enhance business performance. The Group provides solutions that span the entire software life cycle encompassing
technical consulting, design, development, re-engineering, maintenance, systems integration, package evaluation and
implementation, testing and infrastructure management services. In addition, the Group offers software products for the
banking industry, business consulting and business process management services.
24.1. Significant accounting policies
24.1.1. Basis of preparation of financial statements
The financial statements are prepared in accordance with Indian Generally Accepted Accounting Principles (GAAP)
under the historical cost convention on the accrual basis except for certain financial instruments which are measured at
fair value. GAAP comprises mandatory accounting standards prescribed by the Companies (Accounting Standards)
Rules, 2006 and guidelines issued by the Securities and Exchange Board of India (SEBI). Accounting policies have
been consistently applied except where a newly issued accounting standard is initially adopted or a revision to an
existing accounting standard requires a change in the accounting policy hitherto in use.
The financial statements are prepared in accordance with the principles and procedures required for the preparation and
presentation of consolidated financial statements as laid down under the Accounting Standard (AS) 21, “Consolidated
Financial Statements” . The financial statements of Infosys - the parent company, Infosys BPO, Infosys China, Infosys
Australia, Infosys Mexico, Infosys Consulting, Infosys Sweden, Infosys Brasil, Infosys Public Services and controlled
trusts have been combined on a line-by-line basis by adding together book values of like items of assets, liabilities,
income and expenses after eliminating intra-group balances and transactions and resulting unrealized gain/loss. The
consolidated financial statements are prepared by applying uniform accounting policies in use at the Group. Minority
interests have been excluded. Minority interests represent that part of the net profit or loss and net assets of subsidiaries
that are not, directly or indirectly, owned or controlled by the company.
24.1.2. Use of estimates
The preparation of the financial statements in conformity with GAAP requires the management to make estimates and
assumptions that affect the reported balances of assets and liabilities and disclosures relating to contingent liabilities as
at the date of the financial statements and reported amounts of income and expenses during the period. Examples of
such estimates include computation of percentage-of-completion which requires the Group to estimate the efforts
expended to date as a proportion of the total efforts to be expended, provisions for doubtful debts, future obligations
under employee retirement benefit plans, income taxes, post-sales customer support and the useful lives of fixed assets
and intangible assets.
14

Accounting estimates could change from period to period. Actual results could differ from those estimates. Appropriate
changes in estimates are made as management becomes aware of changes in circumstances surrounding the estimates.
Changes in estimates are reflected in the consolidated financial statements in the period in which changes are made and,
if material, their effects are disclosed in the notes to the consolidated financial statements.
The Management periodically assesses using, external and internal sources, whether there is an indication that an asset
may be impaired. An impairment loss is recognised wherever the carrying value of an asset exceeds its recoverable
amount. The recoverable amount is higher of the asset’s net selling price and value in use which means the present
value of future cash flows expected to arise from the continuing use of the asset and its eventual disposal. An
impairment loss for an asset other than goodwill is reversed if, and only if, the reversal can be related objectively to an
event occurring after the impairment loss was recognized. The carrying amount of an asset other than goodwill is
increased to its revised recoverable amount, provided that this amount does not exceed the carrying amount that would
have been determined (net of any accumulated amortization or depreciation) had no impairment loss been recognized
for the asset in previous years.
24.1.3. Revenue recognition
Revenue is primarily derived from software development and related services, licensing of software products and
business process management. Arrangements with customers are either on a fixed price, fixed timeframe or on a time
and material basis.
Revenue on time-and-material contracts are recognized as the related services are performed and revenue from the end
of the last billing to the Balance Sheet date is recognized as unbilled revenues. Revenue from fixed-price, fixed-
timeframe contracts, where there is no uncertainty as to measurement or collectability of consideration, is recognized
based upon the percentage-of-completion. When there is uncertainty as to measurement or ultimate collectability
revenue recognition is postponed until such uncertainty is resolved. Cost and earnings in excess of billings are classified
as unbilled revenue while billing in excess of cost and earnings is classified as unearned revenue. Provision for
estimated losses, if any, on uncompleted contracts are recorded in the period in which such losses become probable
based on the current estimates.
Annual Technical Services revenue and revenue from fixed-price maintenance contracts are recognized ratably over the
period in which services are rendered. Revenue from the sale of user licenses for software applications is recognized on
transfer of the title in the user license, except in case of multiple element contracts, which require significant
implementation services, where revenue for the entire arrangement is recognized over the implementation period based
upon the percentage of completion. Revenue from client training, support and other services arising due to the sale of
software products is recognized as the related services are performed.
The Group accounts for volume discounts and pricing incentives to customers as a reduction of revenue based on the
ratable allocation of the discount / incentive amount to each of the underlying revenue transactions that result in
progress by the customer towards earning the discount / incentive. Also, when the level of discount varies with
increases in levels of revenue transactions, the Group recognizes the liability based on its estimate of the customer's
future purchases. If it is probable that the criteria for the discount will not be met, or if the amount thereof cannot be
estimated reliably, then discount is not recognized until the payment is probable and the amount can be estimated
reliably. The Group recognizes changes in the estimated amount of obligations for discounts using a cumulative catch-
up approach. The discounts are passed on to the customer either as direct payments or as a reduction of payments due
from the customer.
The Group presents revenues net of value-added taxes in its consolidated profit and loss account.
Profit on sale of investments is recorded on transfer of title from the Group and is determined as the difference between
the sale price and carrying value of the investment. Lease rentals are recognized ratably on a straight line basis over the
lease term. Interest is recognized using the time-proportion method, based on rates implicit in the transaction. Dividend
income is recognized when the Group’s right to receive dividend is established.
15
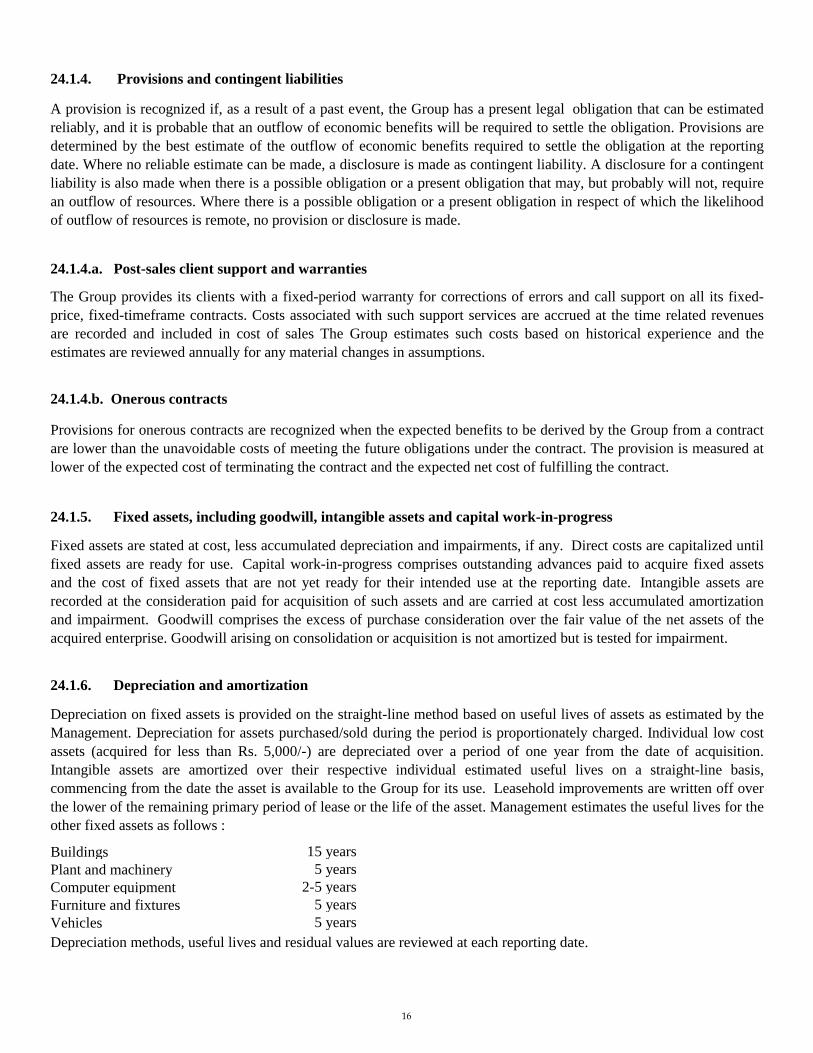
Buildings 15 years
Plant and machinery 5 years
Computer equipment 2-5 years
Furniture and fixtures 5 years
Vehicles 5 years
24.1.4. Provisions and contingent liabilities
A provision is recognized if, as a result of a past event, the Group has a present legal obligation that can be estimated
reliably, and it is probable that an outflow of economic benefits will be required to settle the obligation. Provisions are
determined by the best estimate of the outflow of economic benefits required to settle the obligation at the reporting
date. Where no reliable estimate can be made, a disclosure is made as contingent liability. A disclosure for a contingent
liability is also made when there is a possible obligation or a present obligation that may, but probably will not, require
an outflow of resources. Where there is a possible obligation or a present obligation in respect of which the likelihood
of outflow of resources is remote, no provision or disclosure is made.
24.1.4.a. Post-sales client support and warranties
The Group provides its clients with a fixed-period warranty for corrections of errors and call support on all its fixed-
price, fixed-timeframe contracts. Costs associated with such support services are accrued at the time related revenues
are recorded and included in cost of sales The Group estimates such costs based on historical experience and the
estimates are reviewed annually for any material changes in assumptions.
24.1.4.b. Onerous contracts
Provisions for onerous contracts are recognized when the expected benefits to be derived by the Group from a contract
are lower than the unavoidable costs of meeting the future obligations under the contract. The provision is measured at
lower of the expected cost of terminating the contract and the expected net cost of fulfilling the contract.
24.1.5. Fixed assets, including goodwill, intangible assets and capital work-in-progress
Fixed assets are stated at cost, less accumulated depreciation and impairments, if any. Direct costs are capitalized until
fixed assets are ready for use. Capital work-in-progress comprises outstanding advances paid to acquire fixed assets
and the cost of fixed assets that are not yet ready for their intended use at the reporting date. Intangible assets are
recorded at the consideration paid for acquisition of such assets and are carried at cost less accumulated amortization
and impairment. Goodwill comprises the excess of purchase consideration over the fair value of the net assets of the
acquired enterprise. Goodwill arising on consolidation or acquisition is not amortized but is tested for impairment.
24.1.6. Depreciation and amortization
Depreciation on fixed assets is provided on the straight-line method based on useful lives of assets as estimated by the
Management. Depreciation for assets purchased/sold during the period is proportionately charged. Individual low cost
assets (acquired for less than Rs. 5,000/-) are depreciated over a period of one year from the date of acquisition.
Intangible assets are amortized over their respective individual estimated useful lives on a straight-line basis,
commencing from the date the asset is available to the Group for its use. Leasehold improvements are written off over
the lower of the remaining primary period of lease or the life of the asset. Management estimates the useful lives for the
other fixed assets as follows :
Depreciation methods, useful lives and residual values are reviewed at each reporting date.
16

24.1.7. Retirement benefits to employees
24.1.7.a. Gratuity
In accordance with the Payment of Gratuity Act, 1972, Infosys provides for gratuity, a defined benefit retirement plan
("the Gratuity Plan") covering eligible employees of the company and Infosys BPO. The Gratuity Plan provides a lump-
sum payment to vested employees at retirement, death, incapacitation or termination of employment, of an amount
based on the respective employee's salary and the tenure of employment with the Group.
Liabilities with regard to the Gratuity Plan are determined by actuarial valuation at each Balance Sheet date using the
projected unit credit method. The company fully contributes all ascertained liabilities to the Infosys Technologies
Limited Employees' Gratuity Fund Trust ("the Trust"). In case of Infosys BPO, contributions are made to the Infosys
BPO's Employees' Gratuity Fund Trust. Trustees administer contributions made to the Trusts and contributions are
invested in specific instruments, as permitted by the law. The Group recognizes the net obligation of the Gratuity plan
in the consolidated Balance Sheet as an asset or liability, respectively in accordance with AS 15, “Employee Benefits”.
The Group's overall expected long-term rate-of-return on assets has been determined based on consideration of
available market information, current provisions of Indian law specifying the instruments in which investments can be
made and historical returns. The discount rate is based on the Government securities yield. Actuarial gains and losses
arising from experience adjustments and changes in actuarial assumptions are recognized in the consolidated profit and
loss account in the period in which they arise.
24.1.7.b. Superannuation
Certain employees of Infosys are also participants in the superannuation plan (“the Plan”) which is a defined
contribution plan. Until March 2005, the Company made contributions under the Plan to the Infosys Technologies
Limited Employees' Superannuation Fund Trust. The Company had no further obligations to the Plan beyond its
monthly contributions. Certain employees of Infosys BPO and Infosys Australia were also eligible for superannuation
benefit. Infosys BPO and Infosys Australia made monthly provisions under the superannuation plan based on a
specified percentage of each covered employee's salary. Infosys BPO had no further obligations to the superannuation
plan beyond its monthly provisions which are periodically contributed to a trust fund, the corpus of which is invested
with the Life Insurance Corporation of India.
Effective April 1, 2005, a portion of the monthly contribution amount is paid directly to the employees as an allowance
and the balance amount is contributed to the Infosys Superannuation Trust.
24.1.7.c. Provident fund
Eligible employees of Infosys receive benefits from a provident fund, which is a defined benefit plan. Both the
employee and the Company make monthly contributions to the provident fund plan equal to a specified percentage of
the covered employee's salary. The Company contributes a part of the contributions to the Infosys Technologies Limited
Employees' Provident Fund Trust. The remaining portion is contributed to the government administered pension fund.
The rate at which the annual interest is payable to the beneficiaries by the trust is being administered by the
government. The Company has an obligation to make good the shortfall, if any, between the return from the
investments of the Trust and the notified interest rate.
In respect of Infosys BPO, eligible employees receive benefits from a provident fund, which is a defined contribution
plan. Both the employee and Infosys BPO make monthly contributions to this provident fund plan equal to a specified
percentage of the covered employee's salary. Amounts collected under the provident fund plan are deposited in a
government administered provident fund. Infosys BPO has no further obligations under the provident fund plan beyond
its monthly contributions.
17

24.1.10. Forward contracts and options in foreign currencies
24.1.7.d. Compensated absences
The employees of the Group are entitled to compensated absences which are both accumulating and non-accumulating
in nature. The expected cost of accumulating compensated absences is determined by actuarial valuation based on the
additional amount expected to be paid as a result of the unused entitlement that has accumulated at the Balance Sheet
date. Expense on non-accumulating compensated absences is recognized in the period in which the absences occur.
24.1.8. Research and development
Research costs are expensed as incurred. Software product development costs are expensed as incurred unless technical
and commercial feasibility of the project is demonstrated, future economic benefits are probable, the Company has an
intention and ability to complete and use or sell the software and the costs can be measured reliably.
24.1.9. Foreign currency transactions
Foreign currency denominated monetary assets and liabilities are translated into the relevant functional currency at
exchange rates in effect at the Balance Sheet date. The gains or losses resulting from such translations are included in
the profit or loss account. Non-monetary assets and non-monetary liabilities denominated in a foreign currency and
measured at fair value are translated at the exchange rate prevalent at the date when the fair value was determined. Non-
monetary assets and non-monetary liabilities denominated in a foreign currency and measured at historical cost are
translated at the exchange rate prevalent at the date of transaction.
Revenue, expense and cash-flow items denominated in foreign currencies are translated into the relevant functional
currencies using the exchange rate in effect on the date of the transaction. Transaction gains or losses realized upon
settlement of foreign currency transactions are included in determining net profit for the period in which the transaction
is settled.
The functional currency of Infosys and Infosys BPO is the Indian Rupee. The functional currencies for Infosys
Australia, Infosys China, Infosys Consulting, Infosys Mexico, Infosys Sweden, Infosys Brasil and Infosys Public
Services are their respective local currencies. The translation of financial statements of the foreign subsidiaries from the
local currency to the functional currency of the Company is performed for Balance Sheet accounts using the exchange
rate in effect at the Balance Sheet date and for revenue, expense and cash-flow items using a monthly average exchange
rate for the respective periods and the resulting difference is presented as foreign currency translation reserve included
in “Reserves and Surplus”. When a subsidiary is disposed off, in part or in full, the relevant amount is transferred to
profit or loss.
The Group uses foreign exchange forward and options contracts to hedge its exposure to movements in foreign
exchange rates. The use of these foreign exchange forward and options contracts reduce the risk or cost to the Group
and the Group does not use those for trading or speculation purposes.
Effective April 1, 2008, the Group adopted AS 30, “Financial Instruments : Recognition and Measurement”, to the
extent that the adoption did not conflict with existing accounting standards and other authoritative pronouncements of
Company Law and other regulatory requirements.
18

Forward and options contracts are fair valued at each reporting date. The resultant gain or loss from these transactions is
recognized in the profit or loss account. The Group records the gain or loss on effective hedges, if any, in the foreign
currency fluctuation reserve until the transactions are complete. On completion, the gain or loss is transferred to the
consolidated Profit and Loss account of that period. To designate a forward or options contract as an effective hedge,
management objectively evaluates and evidences with appropriate supporting documents at the inception of each
contract whether the contract is effective in achieving offsetting cash flows attributable to the hedged risk. In the
absence of a designation as effective hedge, a gain or loss is recognized in the consolidated Profit and Loss account.
Currently, the hedges undertaken by the Group are all ineffective in nature and the resultant gain or loss consequent to
fair valuation is recognized in the consolidated Profit and Loss account at each reporting date.
24.1.11. Income taxes
Income taxes are accrued in the same period the related revenue and expenses arise. A provision is made for income tax
annually based on the tax liability computed after considering tax allowances and exemptions. Provisions are recorded
when it is estimated that a liability due to disallowances or other matters is probable. MAT paid in accordance to the tax
laws, which gives rise to future economic benefits in the form of tax credit against future income tax liability, is
recognized as an asset in the consolidated Balance Sheet if there is convincing evidence that the Group will pay normal
tax after the tax holiday period and the resultant asset can be measured reliably. The Group offsets, on a year-on-year
basis, the current tax assets and liabilities, where it has a legally enforceable right and where it intends to settle such
assets and liabilities on a net basis.
The differences that result between the profit offered for income taxes and the profit as per the financial statements are
identified and thereafter a deferred tax asset or deferred tax liability is recorded for timing differences, namely the
differences that originate in one accounting period and reverse in another, based on the tax effect of the aggregate
amount of timing difference. The tax effect is calculated on the accumulated timing differences at the end of an
accounting period based on enacted or substantively enacted regulations. Deferred tax assets, in situation where
unabsorbed depreciation and carry forward business loss exists, are recognized only if there is virtual certainty
supported by convincing evidence that sufficient future taxable income will be available against which such deferred
tax asset can be realized. Deferred tax assets, other than in situation of unabsorbed depreciation and carry forward
business loss, are recognized only if there is reasonable certainty that they will be realized. Deferred tax assets are
reviewed for the appropriateness of their respective carrying values at each reporting date. Tax benefits of deductions
earned on exercise of employee share options in excess of compensation charged to the consolidated Profit and Loss
account are credited to the share premium account.
24.1.12. Earnings per share
Basic earnings per share is computed by dividing the net profit after tax by the weighted average number of equity
shares outstanding during the period. Diluted earnings per share is computed by dividing the net profit after tax by the
weighted average number of equity shares considered for deriving basic earnings per share and also the weighted
average number of equity shares that could have been issued upon conversion of all dilutive potential equity shares. The
diluted potential equity shares are adjusted for the proceeds receivable had the shares been actually issued at fair value
which is the average market value of the outstanding shares. Dilutive potential equity shares are deemed converted as at
the beginning of the period, unless issued at a later date. Dilutive potential equity shares are determined independently
for each period presented.
The number of shares and potentially dilutive equity shares are adjusted retrospectively for all periods presented for any
share splits and bonus shares issues including for changes effected prior to the approval of the consolidated financial
statements by the Board of Directors.
19

24.1.13. Investments
24.1.17. Government grants
The Group recognizes government grants only when there is reasonable assurance that the conditions attached to them
shall be complied with, and the grants will be received. Government grants related to depreciable fixed assets are
treated as deferred income and are recognized in the profit and loss statement on a systematic and rational basis over the
useful life of the asset. Government grants related to revenue are recognized on a systematic basis in the profit and loss
statement over the periods necessary to match them with the related costs which they are intended to compensate.
24.1.16. Leases
Lease under which the Group assumes substantially all the risks and rewards of ownership are classified as finance
leases. Such assets acquired are capitalized at fair value of the asset or present value of the minimum lease payments at
the inception of the lease, whichever is lower. Lease payments under operating leases are recognised as an expense on a
straight line basis in the profit and loss account over the lease term.
Trade investments are the investments made to enhance the Group's business interests. Investments are either classified
as current or long-term based on Management's intention at the time of purchase. Current investments are carried at
lower of cost and fair value of each investment individually. Cost for overseas investments comprises the Indian Rupee
value of the consideration paid for the investment translated at the exchange rate prevalent at the date of investment.
Long-term investments are carried at cost less provisions recorded to recognize any decline, other than temporary, in the
carrying value of each investment.
24.1.14. Cash and cash equivalents
Cash and cash equivalents comprise cash and cash on deposit with banks and corporations. The Group considers all
highly liquid investments with a remaining maturity at the date of purchase of three months or less and that are readily
convertible to known amounts of cash to be cash equivalents.
24.1.15. Cash flow statement
Cash flows are reported using the indirect method, whereby net profit before tax is adjusted for the effects of
transactions of a non-cash nature, any deferrals or accruals of past or future operating cash receipts or payments and
item of income or expenses associated with investing or financing cash flows. The cash flows from operating, investing
and financing activities of the Group are segregated.
20

24.2.
24.2.1.
in Rs. crore
2010 2009
Salaries and bonus including overseas staff expenses 11,576 10,913
Overseas group health Insurance 157 151
Contribution to provident and other funds 306 265
Staff welfare 46 76
Overseas travel expenses 610 748
Traveling and conveyance 82 97
Technical sub-contractors 372 396
Software packages
For own use 336 320
For service delivery to clients 17 41
Professional charges 278 259
Telephone charges 139 174
Communication expenses 86 98
Power and fuel 145 147
Office maintenance 165 168
Guesthouse maintenance 4 5
Rent 125 114
Brand building 57 62
Commission charges 16 11
Insurance charges 31 26
Printing and stationery 12 13
Computer maintenance 29 25
Consumables 25 22
Rates and taxes 31 34
Advertisements 3 6
Donations 44 21
Marketing expenses 15 20
Professional membership and seminar participation fees 9 10
Repairs to building 34 33
Repairs to plant and machinery 32 22
Postage and courier 12 11
Provision for post-sales client support and warranties (2) 39
Books and periodicals 4 3
Recruitment and training 2 6
Provision for bad and doubtful debts - 75
Provision for doubtful loans and advances 1 1
Commission to non-whole time directors 6 6
Sales promotion expenses 1 2
Auditor’s remuneration
Statutory audit fees 2 2
Bank charges and commission 2 3
Freight charges 1 1
Research grants 23 20
Miscellaneous expenses 47 52
14,881 14,498
Notes on accounts
Aggregate expenses
The aggregate amounts incurred on expenses are as follows:
Amounts in the financial statements are presented in Rupees crore, except for per share data and as otherwise stated. Certain amounts
do not appear due to rounding off, and are detailed in note 24.3. All exact amounts are stated with the suffix “/-”. One crore equals 10
million.
The previous year figures have been regrouped / reclassified, wherever necessary to conform to the current presentation.
Year ended March 31,
21

24.2.2.
in Rs. crore
Particulars As at March 31,
Estimated amount of unexecuted capital contracts
(net of advances and deposits) 301 ` 372
18 17
Claims against the Company, not acknowledged as debts(1)
28 4
in million in Rs. crore in million in Rs. crore
Forward contracts outstanding
In USD 267 1,199 278 1,407
In Euro 22 130 27 179
In GBP 11 71 21 149
In AUD 3 12 - -
Options contracts outstanding
In USD 200 898 173 877
(1) Claims against the Company not acknowledged as debts include demand from the Indian tax authorities for payment of
additional tax of Rs. 214 crore (Rs. 197 crore), including interest of Rs. 39 crore (Rs. 43 crore) upon completion of their tax review
for fiscal 2005 and fiscal 2006. The tax demands are mainly on account of disallowance of a portion of the deduction claimed by
the Company under Section 10A of the Income tax Act. The deductible amount is determined by the ratio of export turnover to
total turnover. The disallowance arose from certain expenses incurred in foreign currency being reduced from export turnover but
not reduced from total turnover. The matter for fiscal 2005 and fiscal 2006 is pending before the Commissioner of Income tax
(Appeals) Bangalore.
The Company is contesting the demands and the Management, including its tax advisors, believes that its position will likely be
upheld in the appellate process. No tax expense has been accrued in the financial statements for the tax demand raised. The
Management believes that the ultimate outcome of this proceeding will not have a material adverse effect on the Company's
financial position and results of operations.
2010
Outstanding guarantees and counter guarantees to various
banks, in respect of the guarantees given by those banks in
favour of various government authorities and others
Capital commitments and contingent liabilities
[Net of amount paid to statutory authorities of Rs. 241
crore (Rs. 200 crore) ]
2009
22

24.2.3.
in Rs. crore
Particulars
2010 2009
Lease rentals recognized during the year 125 114
in Rs. crore
Lease obligations payable
2010 2009
Within one year of the balance sheet date 84 80
Due in a period between one year and five years 249 223
Due after five years 62 72
24.2.4.
24.2.5.
24.2.6.
in Rs. crore
Particulars
2010 2009
Capital 3 31
Revenue 435 237
Transactions with key management personnel
Particulars of remuneration and other benefits paid to key management personnel during the year ended March 31, 2010 and March
31, 2009 have been detailed in Schedule 24.4
Research and development expenditure
Year ended March 31,
During the year ended March 31, 2010, an amount of Rs. 35 crore (Rs. 20 crore for the year ended March 31, 2009) was donated to
Infosys Foundation, a not-for-profit foundation, in which certain directors and officers of the Company are trustees.
Related parties include Infosys Science Foundation and Infosys Technologies Limited Employees' Welfare Trust which are
controlled trusts.
Related party transactions
The lease rentals charged for the ended March 31, 2010 and March 31, 2009 and maximum obligations on long-term non-
cancelable operating leases payable as per the rentals stated in the respective agreements:
Year ended March 31,
The operating lease arrangements extend upto a maximum of ten years from their respective dates of inception and relates to rented
overseas premises. Some of these lease agreements have price escalation clause.
As at March 31,
Obligations on long-term, non-cancelable operating leases
23

24.2.7.
2010 2009
The 1998 Plan :
Options outstanding, beginning of year 9,16,759 15,30,447
Less: Exercised 6,14,071 4,55,586
Forfeited 60,424 1,58,102
Options outstanding, end of year 2,42,264 9,16,759
The 1999 Plan :
Options outstanding, beginning of year 9,25,806 14,94,693
Less: Exercised 3,81,078 3,78,699
Forfeited 3,40,264 1,90,188
Options outstanding, end of year 2,04,464 9,25,806
Range of exercise prices per share (Rs.)
Weighted
average exercise
price
1,74,404 0.94 551
67,860 1.27 773
2,42,264 1.03 613
The 1999 Plan:
300-700 1,52,171 0.91 439
1,401-2,500 52,293 1.44 2,121
2,04,464 1.05 869
In fiscal 2000, the Company instituted the 1999 Plan. The shareholders and the Board of Directors approved the plan in September
1999, which provides for the issue of 5,28,00,000 equity shares to the employees. The Compensation Committee administers the
1999 Plan. Options will be issued to employees at an exercise price that is not less than the fair market value. The 1999 Plan lapsed
on June 11, 2009, and consequently no further shares will be issued to employees under this plan.
The activity in the 1998 Plan and 1999 Plan during the year ended March 31, 2010 and March 31, 2009 is as follows:
The weighted average share price of options exercised under the 1998 Plan during the year ended March 31, 2010 and March 31,
2009 was Rs. 2,266 and Rs. 1,683, respectively. The weighted average share price of options exercised under the 1999 Plan during
the year ended March 31, 2010 and March 31, 2009 was Rs. 2,221 and Rs. 1,566, respectively.
The following tables summarize information about the 1998 and 1999 share options outstanding as of March 31, 2010 and March
31, 2009:
Number of shares
arising out of
options
Weighted average
remaining
contractual life
Stock option plans
The Company has two Stock Option Plans that are currently operational.
1998 Stock Option Plan (“the 1998 Plan”)
The 1998 Plan was approved by the Board of Directors in December 1997 and by the shareholders in January 1998, and is for issue
of 1,17,60,000 ADSs representing 1,17,60,000 equity shares. All options under the 1998 Plan are exercisable for ADSs representing
equity shares. A Compensation Committee comprising independent members of the Board of Directors administers the 1998 Plan.
All options have been granted at 100% of fair market value. The 1998 Plan lapsed on January 6, 2008, and consequently no further
shares will be issued to employees under this plan.
The 1998 Plan:
300-700
Year ended March 31,
1999 Stock Option Plan (“the 1999 Plan”)
Year ended March 31, 2010
701-1,400
24

Range of exercise prices per share (Rs.)
Weighted
average exercise
price
3,37,790 1.46 567
4,93,048 1.56 980
76,641 0.46 1,693
6,880 0.13 2,453
2,400 0.02 2,899
9,16,759 1.41 904
The 1999 Plan:
300-700 3,00,976 1.55 429
701-1,400 2,23,102 0.60 802
1,401-2,500 4,01,728 1.06 2,121
9,25,806 1.11 1,253
Particulars
2010 2009
Net Profit after tax, exceptional item and minority interest
As Reported 6,266 5,988
Less: Stock-based employee compensation expense 1 7
Adjusted Proforma 6,265 5,981
Basic Earnings per share as reported 109.84 104.60
Proforma Basic Earnings per share 109.83 104.47
Diluted Earnings per share as reported 109.72 104.43
Proforma Diluted Earnings per share 109.71 104.30
24.2.8. Income taxes
Year ended March 31,
As allowed by the guidance note, Infosys has elected to continue to apply the intrinsic value-based method of accounting described
above, and has adopted the disclosure requirements of the guidance note "Accounting for employee share based payments". Had the
compensation cost for Infosys's stock-based compensation plan been determined in a manner consistent with the fair value approach
described in guidance note, the Company's net profit and basic and diluted earnings per share as reported would have reduced to the
proforma amounts as indicated :
The 1998 Plan:
Guidance note on "Accounting for employee share based payments" issued by Institute of Chartered Accountants of India
establishes financial accounting and reporting principles for employee share based payment plans. The guidance note applies to
employee share based payment plans, the grant date in respect of which falls on or after April 1, 2005.
Proforma Accounting for Stock Option Grants
Year ended March 31, 2009
Number of shares
arising out of
options
Weighted average
remaining
contractual life
2,801-4,200
300-700
As at March 31, 2010, the company has provided for branch profit tax of Rs. 232 crore for its overseas branches, as the company
estimates that these branch profits would be distributed in the foreseeable future. Further, the tax provision for the year ended March
31, 2010, includes a net tax reversal of Rs. 316 crore relating to SEZ units, for provisions no longer required.
The provision for taxation includes tax liabilities in India on the company’s global income as reduced by exempt incomes and any
tax liabilities arising overseas on income sourced from those countries. Infosys' operations are conducted through Software
Technology Parks ("STPs") and Special Economic Zones ("SEZs"). Income from STPs are tax exempt for the earlier of 10 years
commencing from the fiscal year in which the unit commences software development, or March 31, 2011. Income from SEZs is
fully tax exempt for the first 5 years, 50% exempt for the next 5 years and 50% exempt for another 5 years subject to fulfilling
certain conditions. For Fiscal 2008 and 2009, the company had calculated its tax liability under Minimum Alternate Tax (MAT).
The MAT credit can be carried forward and set off against the future tax payable. In the current year, the company has calculated its
tax liability under normal provisions of the Income Tax Act and utilised the brought forward MAT Credit.
The aggregate options considered for dilution are set out in note 24.2.16
701-1,400
1,401-2,100
2,101-2,800
25
in Rs. crore
Particulars 2010 2009
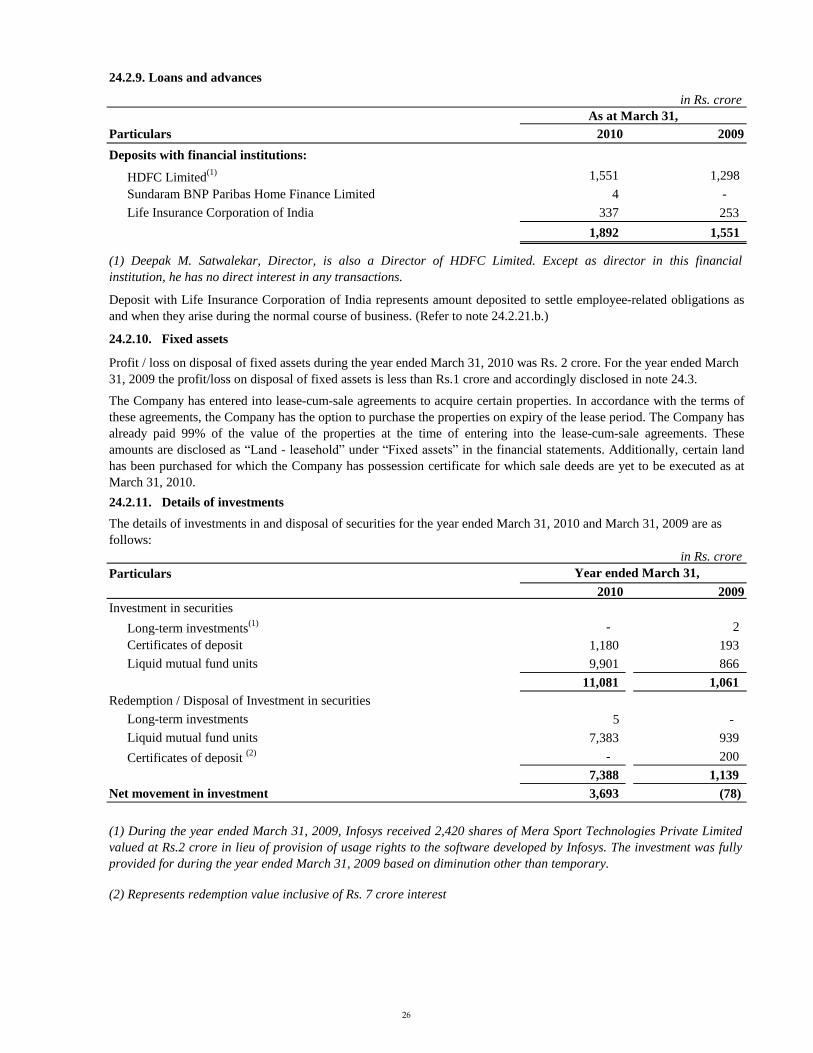
Deposits with financial institutions:
HDFC Limited(1) 1,551 1,298
Sundaram BNP Paribas Home Finance Limited 4 -
Life Insurance Corporation of India 337 253
1,892 1,551
in Rs. crore
Particulars
2010 2009
Investment in securities
Long-term investments(1) - 2
Certificates of deposit 1,180 193
Liquid mutual fund units 9,901 866
11,081 1,061
Redemption / Disposal of Investment in securities
Long-term investments 5 -
Liquid mutual fund units 7,383 939
Certificates of deposit (2) - 200
7,388 1,139
Net movement in investment 3,693 (78)
24.2.10. Fixed assets
Profit / loss on disposal of fixed assets during the year ended March 31, 2010 was Rs. 2 crore. For the year ended March
31, 2009 the profit/loss on disposal of fixed assets is less than Rs.1 crore and accordingly disclosed in note 24.3.
(2) Represents redemption value inclusive of Rs. 7 crore interest
Year ended March 31,
(1) Deepak M. Satwalekar, Director, is also a Director of HDFC Limited. Except as director in this financial
institution, he has no direct interest in any transactions.
The Company has entered into lease-cum-sale agreements to acquire certain properties. In accordance with the terms of
these agreements, the Company has the option to purchase the properties on expiry of the lease period. The Company has
already paid 99% of the value of the properties at the time of entering into the lease-cum-sale agreements. These
amounts are disclosed as “Land - leasehold” under “Fixed assets” in the financial statements. Additionally, certain land
has been purchased for which the Company has possession certificate for which sale deeds are yet to be executed as at
March 31, 2010.
Deposit with Life Insurance Corporation of India represents amount deposited to settle employee-related obligations as
and when they arise during the normal course of business. (Refer to note 24.2.21.b.)
24.2.9. Loans and advances
As at March 31,
24.2.11. Details of investments
The details of investments in and disposal of securities for the year ended March 31, 2010 and March 31, 2009 are as
follows:
(1) During the year ended March 31, 2009, Infosys received 2,420 shares of Mera Sport Technologies Private Limited
valued at Rs.2 crore in lieu of provision of usage rights to the software developed by Infosys. The investment was fully
provided for during the year ended March 31, 2009 based on diminution other than temporary.
26

Country of
incorporation 2010 2009
Infosys BPO India 99.98% 99.98%
Infosys Australia Australia 100% 100%
Infosys China China 100% 100%
Infosys Consulting (1) USA 100% 100%
Infosys Mexico (2) Mexico 100% 100%
Infosys Sweden (3) Sweden 100% -
Infosys Brasil (4) Brazil 100% -
Infosys Public Services, Inc. (5) USA 100% -
Infosys BPO s. r. o (6) Czech Republic 99.98% 99.98%
Infosys BPO (Poland) Sp Z.o.o (6) Poland 99.98% 99.98%
Infosys BPO (Thailand) Limited (6) Thailand 99.98% 99.98%
Mainstream Software Pty Limited (7) Australia 100% 100%
Infosys Consulting India Limited (8) India 100% -
McCamish Systems LLC (9) USA 99.98% -
(6) Infosys BPO s.r.o, Infosys BPO (Poland) Sp Z.o.o, Infosys BPO (Thailand) Limited and McCamish Systems LLC are
wholly owned subsidiaries of Infosys BPO.
(4) On August 7, 2009 the Company incorporated wholly-owned subsidiary, Infosys Tecnologia DO Brasil LTDA. As of
March 31,2010 the company has invested an aggregate of Rs. 28 crore (BRL 11 million) in the subsidiary
(1) During the year ended March 31, 2010 the Company made an additional investment of Rs. 50 crore (USD 10
million) in Infosys Consulting, which is a wholly owned subsidiary. As of March 31, 2010 and March 31, 2009, the
Company has invested an aggregate of Rs. 243 crore (USD 55 million) and Rs.193 crore (USD 45 million), respectively
in the subsidiary.
(2) During the year ended March 31, 2010 the Company made an additional investment of Rs.18 crore (Mexican Peso
50 million) in Infosys Mexico, which is a wholly owned subsidiary. As of March 31, 2010 and March 31, 2009 the
Company has invested an aggregate of Rs. 40 crore (Mexican Peso 110 million) and Rs. 22 crore (Mexican Peso 60
million), respectively in the subsidiary.
(3) During the year ended March 31, 2009, the Company incorporated wholly-owned subsidiary, Infosys Technologies
(Sweden) AB, which was capitalized on July 8, 2009.
(8) On August 19, 2009 Infosys Consulting incorporated wholly-owned subsidiary, Infosys Consulting India Limited.
As of March 31, 2010 Infosys Consulting has invested Rs. 1 crore in the subsidiary.
(9) On December 4, 2009, Infosys BPO acquired 100% of the voting interests in McCamish Systems LLC (McCamish),
a business process solutions provider based in Atlanta, Georgia, in the United States. The business acquisition was
conducted by entering into Membership Interest Purchase Agreement for a cash consideration of Rs. 173 crore and a
contingent consideration of Rs. 67 crore. The acquisition was completed during the year and accounted as a business
combination which resulted in goodwill of Rs. 227 crore.
(7) Mainstream Software Pty Limited is a wholly owned subsidiary of Infosys Australia.
As at March 31, Name of the subsidiary
24.2.12. Holding of Infosys in its subsidiaries
(5) On October 9, 2009 the Company incorporated wholly-owned subsidiary, Infosys Public Services, Inc. As of March
31, 2010 the Company invested Rs. 24 crore (USD 5 million) in the subsidiary.
27
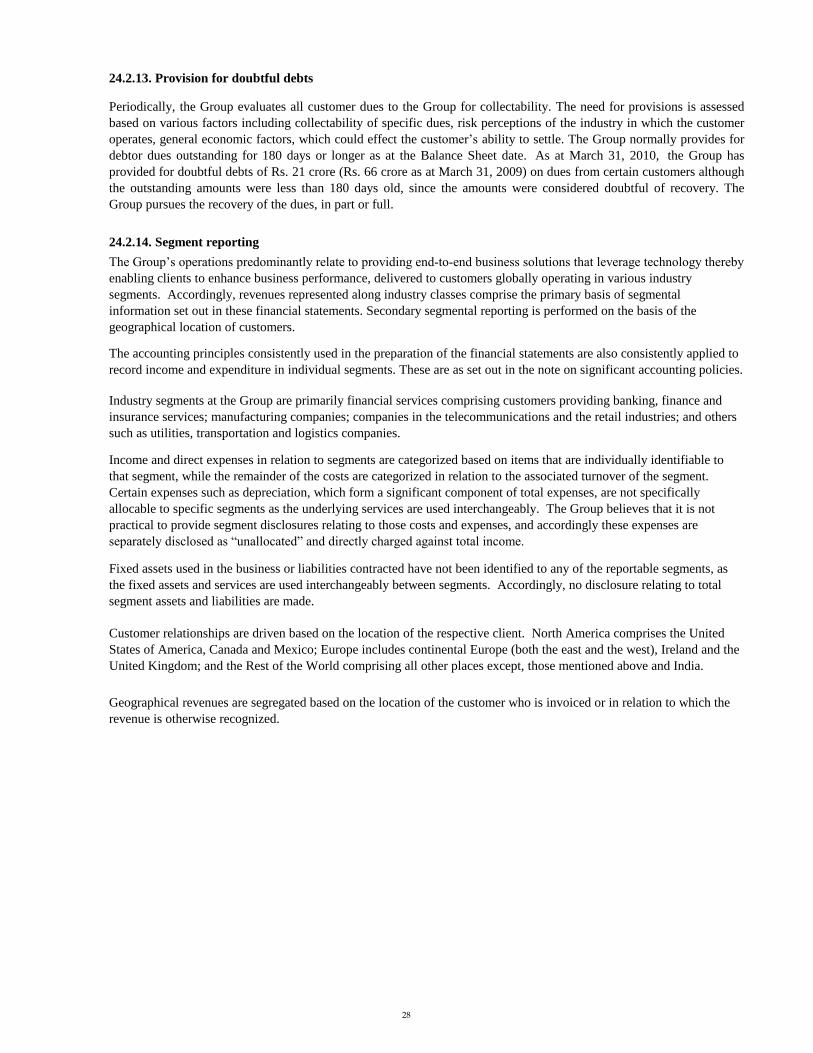
24.2.13. Provision for doubtful debts
24.2.14. Segment reporting
Periodically, the Group evaluates all customer dues to the Group for collectability. The need for provisions is assessed
based on various factors including collectability of specific dues, risk perceptions of the industry in which the customer
operates, general economic factors, which could effect the customer’s ability to settle. The Group normally provides for
debtor dues outstanding for 180 days or longer as at the Balance Sheet date. As at March 31, 2010, the Group has
provided for doubtful debts of Rs. 21 crore (Rs. 66 crore as at March 31, 2009) on dues from certain customers although
the outstanding amounts were less than 180 days old, since the amounts were considered doubtful of recovery. The
Group pursues the recovery of the dues, in part or full.
Geographical revenues are segregated based on the location of the customer who is invoiced or in relation to which the
revenue is otherwise recognized.
The Group’s operations predominantly relate to providing end-to-end business solutions that leverage technology thereby
enabling clients to enhance business performance, delivered to customers globally operating in various industry
segments. Accordingly, revenues represented along industry classes comprise the primary basis of segmental
information set out in these financial statements. Secondary segmental reporting is performed on the basis of the
geographical location of customers.
The accounting principles consistently used in the preparation of the financial statements are also consistently applied to
record income and expenditure in individual segments. These are as set out in the note on significant accounting policies.
Industry segments at the Group are primarily financial services comprising customers providing banking, finance and
insurance services; manufacturing companies; companies in the telecommunications and the retail industries; and others
such as utilities, transportation and logistics companies.
Income and direct expenses in relation to segments are categorized based on items that are individually identifiable to
that segment, while the remainder of the costs are categorized in relation to the associated turnover of the segment.
Certain expenses such as depreciation, which form a significant component of total expenses, are not specifically
allocable to specific segments as the underlying services are used interchangeably. The Group believes that it is not
practical to provide segment disclosures relating to those costs and expenses, and accordingly these expenses are
separately disclosed as “unallocated” and directly charged against total income.
Fixed assets used in the business or liabilities contracted have not been identified to any of the reportable segments, as
the fixed assets and services are used interchangeably between segments. Accordingly, no disclosure relating to total
segment assets and liabilities are made.
Customer relationships are driven based on the location of the respective client. North America comprises the United
States of America, Canada and Mexico; Europe includes continental Europe (both the east and the west), Ireland and the
United Kingdom; and the Rest of the World comprising all other places except, those mentioned above and India.
28

in Rs. crore
ParticularsFinancial
ServicesManufacturing Telecom Retail Others Total
Revenues 7,731 4,506 3,661 3,035 3,809 22,742
7,358 4,289 3,906 2,728 3,412 21,693
Identifiable operating expenses 3,068 1,993 1,284 1,243 1,544 9,132
3,042 1,830 1,431 1,120 1,347 8,770
Allocated expenses 1,953 1,139 926 767 964 5,749
1,942 1,133 1,033 720 900 5,728
Segmental operating income 2,710 1,374 1,451 1,025 1,301 7,861
2,374 1,326 1,442 888 1,165 7,195
Unallocable expenses 905
761
Operating income 6,956
6,434
Other income, net 934
475
Provision for investments (9)
2
Net profit before taxes and exceptional item 7,899
6,907
Income taxes 1,681
919
Net profit after taxes before exceptional item 6,218
5,988
Income on sale of investments, net of taxes 48
-
Net profit after taxes and exceptional item 6,266
5,988
in Rs. crore
Particulars North America Europe IndiaRest of the
WorldTotal
Revenues 14,972 5,237 270 2,263 22,742
13,736 5,705 284 1,968 21,693
Identifiable operating expenses 6,067 2,093 80 892 9,132
5,716 2,284 62 708 8,770
Allocated expenses 3,784 1,325 68 572 5,749
3,624 1,507 76 521 5,728
Segmental operating income 5,121 1,819 122 799 7,861
4,396 1,914 146 739 7,195
Unallocable expenses 905
761
Operating income 6,956
6,434
Other income, net 934
475
Provision on investments (9)
2
Net profit before taxes and exceptional item 7,899
6,907
Income taxes 1,681
919
Net profit after taxes before exceptional item 6,218
5,988
Income on sale of investments, net of taxes 48
-
Net profit after taxes and exceptional item 6,266
5,988
Industry segments
Geographic segments
Year ended March 31, 2010 and March 31, 2009:
Year ended March 31, 2010 and March 31, 2009 :
29

24.2.15. Dividends remitted in foreign currencies
The particulars of dividends remitted are as follows:
in Rs. crore
Particulars
2010 2009
Interim dividend for fiscal 2010 107 -
Interim dividend for fiscal 2009 - 110
145 -
- 79
- 219
24.2.16. Reconciliation of basic and diluted shares used in computing earnings per share
2010 2009
57,04,75,923 57,24,90,211
6,40,108 9,72,970
57,11,16,031 57,34,63,181
* Excludes shares held by controlled trusts
24.2.17. Provision for post-sales client support and warranties
The movement in the provision for post-sales client support and warranties is as follows :
in Rs. crore
2010 2009
Balance at the beginning 92 53
Provision recognized/(reversed) (2) 39
Provision utilized (8) -
Balance at the end 82 92
Provision for post-sales client support is expected to be utilized over a period of 6 months to 1 year.
Year ended March 31,
Final dividend for fiscal 2009
10,70,15,201
10,97,63,357
Number of shares considered as basic weighted average shares
outstanding *
Add: Effect of dilutive issues of shares/stock options
10,73,97,313
10,95,11,049
10,95,11,049
Number of shares to which the
dividends relate
Number of shares considered as weighted average shares and
potential shares outstanding
Year ended March 31,
Year ended March 31,
The Company remits the equivalent of the dividends payable to equity shareholders and holders of ADS. For ADS holders the
dividend is remitted in Indian rupees to the depository bank, which is the registered shareholder on record for all owners of the
Company’s ADSs. The depositary bank purchases the foreign currencies and remits dividends to the ADS holders.
Final dividend for fiscal 2008
Special dividend for fiscal 2008
30

24.2.18. Gratuity Plan
Reconciliation of opening and closing balances of the present value of the defined benefit obligation and plan assets : in Rs. crore
2010 2009 2008 2007
Obligations at year beginning 267 224 225 183
Service cost 80 51 50 45
Interest cost 19 16 17 14
Actuarial loss / (gain) (5) 1 (8) (1)
Benefits paid (36) (25) (23) (16)
Amendment in benefit plan - - (37) -
Obligations at year end 325 267 224 225
Defined benefit obligation liability as at the Balance Sheet is fully funded by the Group.
Change in plan assets
Plans assets at year beginning, at fair value 268 236 225 170
Expected return on plan assets 25 17 18 16
Actuarial gain 1 5 2 3
Contributions 69 35 14 54
Benefits paid (36) (25) (23) (18)
Plans assets at year end, at fair value 327 268 236 225
Reconciliation of present value of the obligation and the fair value of the plan assets :
Fair value of plan assets at the end of the period 327 268 236 225
325 267 224 225
Asset recognized in the Balance Sheet 2 1 12 -
Assumptions
Interest rate 7.82% 7.01% 7.92% 7.99%
Estimated rate of return on plan assets 9.00% 7.01% 7.92% 7.99%
Weighted expected rate of salary increase 7.27% 5.10% 5.10% 5.10%
Net gratuity cost for the year ended March 31, 2010 and March 31, 2009 comprises of the following components :
in Rs. Crore
2010 2009
Gratuity cost for the year
Service cost 80 51
Interest cost 19 16
Expected return on plan assets (25) (17)
Actuarial gain (6) (4)
Plan amendment amortization (3) (4)
Net gratuity cost 65 42
Actual return on plan assets 26 22
24.2.19.a. Provident Fund
24.2.19.b. Superannuation
As of March 31, 2010 and March 31, 2009, the plan assets have been primarily invested in government securities. The estimates of
future salary increases, considered in actuarial valuation, take account of inflation, seniority, promotion and other relevant factors such
as supply and demand factors in the employment market.
Effective July 1, 2007, the Company revised the employee death benefits provided under the gratuity plan, and included all eligible
employees under a consolidated term insurance cover. Accordingly, the obligations under the gratuity plan reduced by Rs.37 crore,
which is being amortised on a straight line basis to the net Profit and Loss account over 10 years representing the average future
service period of the employees. The unamortized liability as at March 31, 2010 and March 31, 2009 amounted to Rs. 26 crore and
Rs. 29 crore, respectively and is disclosed under "Current Liabilities".
The group expects to contribute approximately Rs. 61 crore to the gratuity trusts during fiscal 2011.
The Company contributed Rs. 91 crore and Rs. 80 crore to the Superannuation Trust during the year ended March 31, 2010 and March
31, 2009 respectively.
The Company contributed Rs. 171 crore and Rs. 153 crore to the Provident Fund during the year ended March 31, 2010 and March 31,
2009 respectively.
The following table set out the status of the gratuity plan as required under AS 15.
As at March 31,
Present value of the defined benefit obligations at the
end of the year
Gratuity cost, as disclosed above, is included under salaries and bonus and is segregated between software development expenses,
selling and marketing expenses and general and administration expenses on the basis of number of employees.
Year ended March 31,
The Guidance on Implementing AS 15, Employee Benefits (revised 2005) issued by Accounting Standards Board (ASB) states that
benefits involving employer established provident funds, which require interest shortfalls to be recompensed are to be considered as
defined benefit plans. Pending the issuance of the guidance note from the Actuarial Society of India, the Company’s actuary has
expressed an inability to reliably measure provident fund liabilities. Accordingly the Company is unable to exhibit the related
information.
31
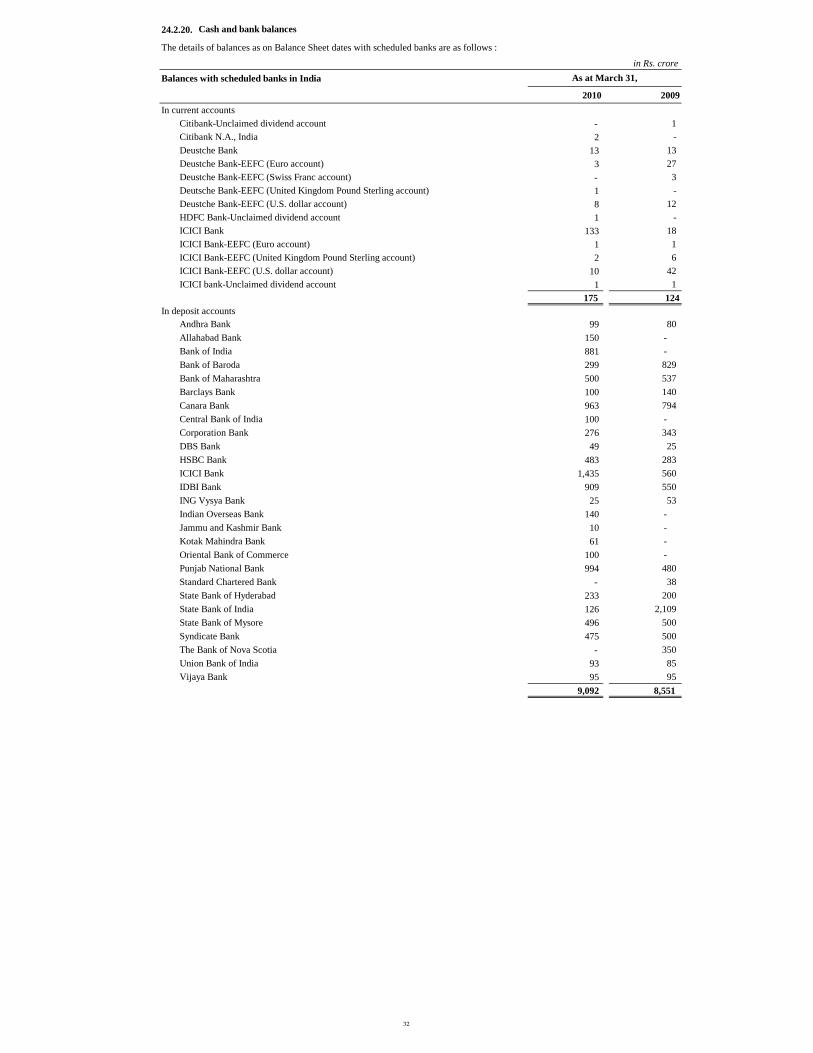
24.2.20.
in Rs. crore
Balances with scheduled banks in India
2010 2009
In current accounts
Citibank-Unclaimed dividend account - 1
Citibank N.A., India 2 -
Deustche Bank 13 13
Deustche Bank-EEFC (Euro account) 3 27
Deustche Bank-EEFC (Swiss Franc account) - 3
Deutsche Bank-EEFC (United Kingdom Pound Sterling account) 1 -
Deustche Bank-EEFC (U.S. dollar account) 8 12
HDFC Bank-Unclaimed dividend account 1 -
ICICI Bank 133 18
ICICI Bank-EEFC (Euro account) 1 1
ICICI Bank-EEFC (United Kingdom Pound Sterling account) 2 6
ICICI Bank-EEFC (U.S. dollar account) 10 42
ICICI bank-Unclaimed dividend account 1 1
175 124
In deposit accounts
Andhra Bank 99 80
Allahabad Bank 150 -
Bank of India 881 -
Bank of Baroda 299 829
Bank of Maharashtra 500 537
Barclays Bank 100 140
Canara Bank 963 794
Central Bank of India 100 -
Corporation Bank 276 343
DBS Bank 49 25
HSBC Bank 483 283
ICICI Bank 1,435 560
IDBI Bank 909 550
ING Vysya Bank 25 53
Indian Overseas Bank 140 -
Jammu and Kashmir Bank 10 -
Kotak Mahindra Bank 61 -
Oriental Bank of Commerce 100 -
Punjab National Bank 994 480
Standard Chartered Bank - 38
State Bank of Hyderabad 233 200
State Bank of India 126 2,109
State Bank of Mysore 496 500
Syndicate Bank 475 500
The Bank of Nova Scotia - 350
Union Bank of India 93 85
Vijaya Bank 95 95
9,092 8,551
As at March 31,
The details of balances as on Balance Sheet dates with scheduled banks are as follows :
Cash and bank balances
32

in Rs. crore
Balances with non-scheduled banks
2010 2009
In current accounts
ABN Amro Bank, China 33 6
ABN Amro Bank, China (U.S. dollar account) 14 14
ABN Amro Bank, Taiwan 2 1
Bank of America, Mexico 18 2
Bank of America, USA 686 587
Banamex, Mexico 2 -
China Merchants Bank , China 1 -
Citibank NA, Australia 25 33
Citibank NA, Brazil 9 -
Citibank NA, Czech Republic (Euro account) - 3
Citibank NA, Czech Republic (U.S. dollar account) 2 4
Citibank NA, New Zealand 1 -
Citibank NA, Japan 2 2
Citibank NA, Singapore - 7
Citibank NA, Thailand 1 1
Deutsche Bank, Belgium 18 6
Deutsche Bank, France 1 1
Deutsche Bank, Germany 12 5
Deutsche Bank, Moscow (U.S.dollar account) 1 -
Deutsche Bank, Netherlands 7 1
Deustche Bank, Philiphines - 1
Deustche Bank, Philiphines (U.S. dollar account) 3 1
Deutsche Bank, Poland 2 -
Deustche Bank, Poland (Euro account) 1 -
Deutsche Bank, Spain 1 1
Deustche Bank, Thailand 3 2
Deustche Bank, Thailand (U.S dollar account) 1 -
Deutsche Bank, UK 29 58
Deutsche Bank, Singapore 1 -
Deutsche Bank, Switzerland 10 -
Deutsche Bank, Switzerland (U.S. dollar account) 1 -
HSBC Bank, UK 2 8
ICICI Bank, UK 1 -
National Australia Bank Limited, Australia 21 30
National Australia Bank Limited, Australia (U.S. dollar account) 14 7
Nordbanken, Sweden 1 -
Royal Bank of Canada, Canada 20 6
The Bank of Tokyo-Mitsubishi UFJ Ltd., Japan - 1
Wachovia Bank, USA 7 -
953 788 In deposit accounts
Citibank N.A., Czech Republic 9 4
Citibank, Euro 3 -
Citibank, USD 4 -
Deutsche Bank , Poland 8 -
National Australia Bank Limited, Australia 312 228
336 232
Total Cash and bank balances as per balance sheet 10,556 9,695
24.2.21. Cash flow statement
24.2.21.a. Unclaimed dividend
24.2.21.b. Balances held by controlled trusts
24.2.21.c. Restricted cash
24.2.22 Exceptional item
During the year ended March 31, 2010 the company sold 32,31,151 shares of On Mobile Systems Inc, USA (OMSI) at a price of Rs.
166.58 per share amounting to a total consideration of Rs. 53 crore, net of taxes and transaction costs. The resultant income of Rs. 48
crore has been appropriated to capital reserve.
The balance of cash and cash equivalents includes Rs. 69 crore as at March 31, 2010 held by controlled trusts.
Deposits with financial institutions as at March 31, 2010 include Rs. 337 crore (Rs. 253 crore as at March 31, 2009) deposited with
Life Insurance Corporation of India to settle employee related obligations as and when they arise during the normal course of business.
This amount is considered as restricted cash and is hence not considered "cash and cash equivalents".
The balance of cash and cash equivalents includes Rs. 2 crore as at March 31, 2010 (Rs. 2 crore as at March 31, 2009) set aside for
payment of dividends.
As at March 31,
The details of balances as on Balance Sheet dates with non-scheduled banks are as follows:
33
24.3.
Balance Sheet Items in Rs. crore
Schedule Description
2010 2009
Balance Sheet
3 Fixed assets
Deductions/retirements
Leasehold improvements - 0.04
Vehicles 0.04 0.23
Buildings 0.04 -
Depreciation on assets sold during the period
Vehicles - 0.05
7 Cash on hand 0.09 0.07
Scheduled banks-Current Accounts
Citi Bank - Unclaimed dividend account 0.49 0.58
Citibank N.A. 2.29 0.12
Citibank - EEFC account in U.S. dollar 0.22 -
State Bank of India 0.04 0.01
Deutsche Bank-EEFC account in Swiss Franc, India 0.33 3.35
Deutsche Bank-EEFC account in United Kingdom Pound Sterling, India 0.51 0.33
HDFC Bank - Unclaimed dividend account 0.84 0.46
Non-scheduled banks-Current Account
ABN Amro Bank, Denmark 0.21 0.06
Banamex, Mexico 2.00 0.02
Bank of Baroda, Mauritius 0.02 0.06
China Merchants Bank, China 0.62 0.17
Citibank N.A., Czech Republic 0.35 0.29
Citibank N.A., Czech Republic Euro account 0.13 3.34
Citibank N.A., Poland - 0.01
Deustche Bank, Moscow 0.34 -
Deutsche Bank, Philiphines 0.39 0.56
Deustche Bank, Poland 2.37 0.21
Deustche Bank, Poland Euro account 0.74 0.12
Deutsche Bank,Zurich, Switzerland 9.72 0.22
ICICI Bank, UK 1.07 0.09
Nordbanken, Sweden 0.73 0.11
PNC Bank, USA 0.02 0.03
Shanghai Pudong Development Bank, China - 0.01
Standard Chartered Bank , UAE 0.09 -
Svenska Handelsbanken, Sweden 0.01 -
The Bank of Tokyo - Mitsubishi UFJ, Ltd.,Japan 0.16 0.59
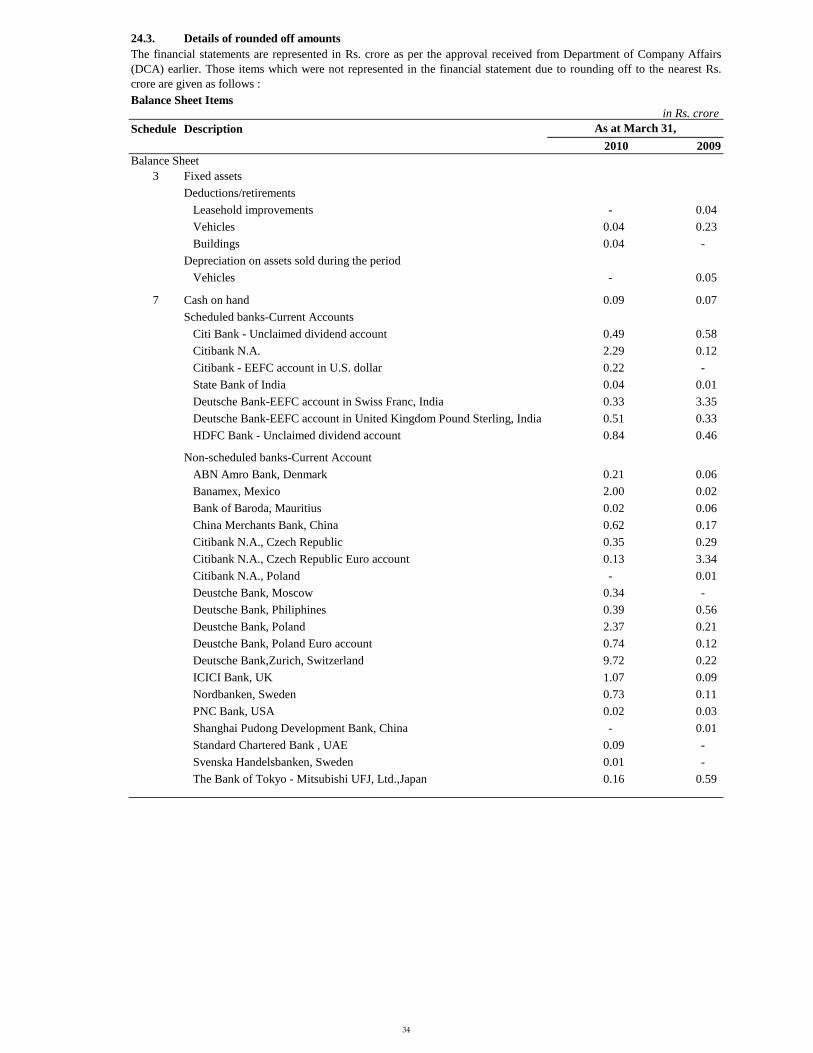
Details of rounded off amounts
The financial statements are represented in Rs. crore as per the approval received from Department of Company Affairs
(DCA) earlier. Those items which were not represented in the financial statement due to rounding off to the nearest Rs.
crore are given as follows :
As at March 31,
34

in Rs. crore
Schedule
2010 2009
Profit and Loss
Minority Interest 0.06 0.02
Residual dividend paid 0.25 -
Additional dividend tax 0.04 -
12 Selling and Marketing expenses
Office maintenance 0.31 0.40
Consumables 0.07 0.17
Software for own use - 0.04
Insurance charges 0.31 0.33
Advertisements 0.01 1.77
Repairs to plant and machinery - 0.07
Computer Maintenance 0.02 -
Rates and Taxes 0.10 0.01
13 General and Administrative expenses
Auditor’s remuneration :
Out-of-pocket expenses 0.04 0.04
Certification charges 0.05 0.05
Others 0.01 -
24.2.1 Aggregate expenses
0.01 1.49
Auditor’s remuneration :
Certification charges 0.05 0.05
Out-of-pocket expenses 0.04 0.04
Others 0.01 -
24.2.10 Profit on disposal of fixed assets, included in miscellaneous income 2.00 0.38
Cash Flow Statement Items
Schedule
2010 2009
Profit/ loss on sale of fixed assets 2.00 0.38
Profit & Loss Items
Year ended March 31,
Description
Description
Provision for doubtful loans and advances
Year ended March 31,
35

24.4 Transactions with key management personnel
in Rs. crore
Name Salary
Contributions
to provident
and other
funds
Perquisites and
incentives
Total
Remuneration
Co-Chairman(1)
Nandan M. Nilekani 0.09 0.02 0.23 0.34 0.30 0.07 0.54 0.91
Chief Executive Officer and Managing DirectorS. Gopalakrishnan 0.32 0.08 0.61 1.01
0.30 0.07 0.55 0.92 Chief Operating Officer and DirectorS. D. Shibulal 0.31 0.08 0.56 0.95
0.28 0.07 0.52 0.87 Whole-time directorsK. Dinesh 0.32 0.08 0.61 1.01
0.30 0.07 0.54 0.91
T. V. Mohandas Pai 0.36 0.08 2.69 3.13
0.36 0.09 2.14 2.59
Srinath Batni 0.36 0.07 1.98 2.41 0.35 0.09 1.43 1.87
Chief Financial OfficerV. Balakrishnan 0.30 0.08 2.06 2.44
0.29 0.07 2.00 2.36 Executive Council MembersAshok Vemuri 2.09 - 2.79 4.88
1.99 - 2.05 4.04
Chandra Shekar Kakal 0.28 0.06 1.73 2.07 0.26 0.06 1.26 1.58
B.G. Srinivas 1.81 - 2.75 4.56 1.82 - 2.85 4.67
Subhash B. Dhar 0.24 0.07 1.42 1.73 0.23 0.06 0.98 1.27
Key management personnel comprise directors and members of the executive council.
Particulars of remuneration and other benefits paid to whole-time directors and members of executive council during
the year ended March 31, 2010 and March 31, 2009 are as follows:
(1) Effective July 9, 2009, Mr. Nandan M Nilekani has relinquished the positions of Co-Chairman, Member of the
Board and employee of Infosys.
36

Name Commission Sitting feesReimbursement
of expenses
Total
Remuneration
Independent directors
Deepak M. Satwalekar 0.60 - - 0.60 0.68 - 0.02 0.70
Prof.Marti G. Subrahmanyam 0.65 - 0.20 0.85 0.71 - 0.25 0.96
Dr.Omkar Goswami 0.52 - 0.03 0.55 0.58 - 0.03 0.61
Claude Smadja 0.59 - 0.25 0.84 0.67 - 0.26 0.93
Rama Bijapurkar 0.49 - 0.02 0.51 0.56 - 0.01 0.57
Sridar A. Iyengar 0.74 - 0.21 0.95
0.82 - 0.20 1.02
David L. Boyles 0.59 - 0.15 0.74 0.69 - 0.21 0.90
Prof. Jeffrey S. Lehman 0.61 - 0.24 0.85 0.63 - 0.22 0.85
K.V.Kamath(1) 0.39 - 0.02 0.41
- - - - Non-Executive director
N. R. Narayana Murthy(2) 0.57 - - 0.57
0.63 - - 0.63
(1) Joined the board effective May 02, 2009
(2) Non-executive chairman of the board and chief mentor.
Particulars of remuneration and other benefits of non-executive/ independent directors for the year ended March 31,
2010 and March 31, 2009 :
37