Embed Size (px)
Citation preview
CONSOLIDATED FINANCIAL STATEMENTS AND
INDEPENDENT AUDITORS’ REPORT
June 30, 2013 and 2012
IVY TECH FOUNDATION, INC.
CONTENTS
Page CONSOLIDATED FINANCIAL STATEMENTS Independent Auditors’ Report 1-2 Consolidated Statements of Financial Position 3 Consolidated Statements of Activities 4 Consolidated Statements of Cash Flows 5-6 Notes to Consolidated Financial Statements 7-28
CONSOLIDATING INFORMATION Independent Auditors’ Report on Consolidating Information 29 Consolidating Schedule – Statement of Financial Position Information 30 Consolidating Schedule – Statement of Activities Information 31
1
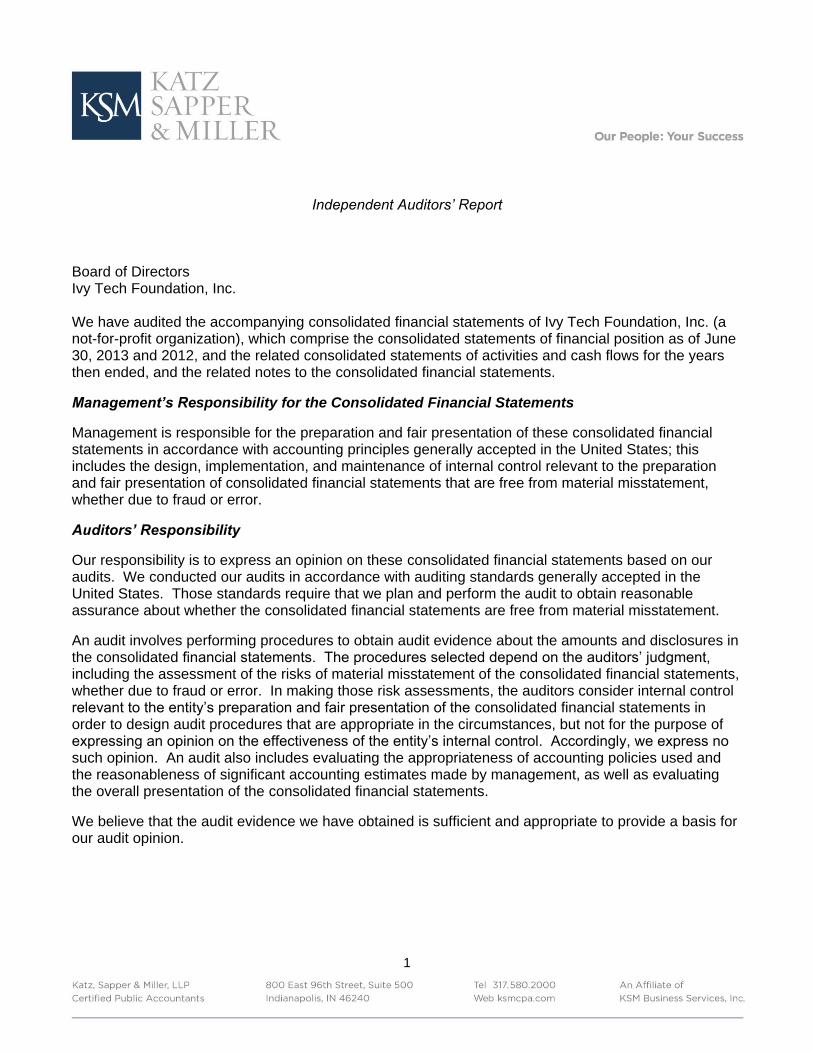
Independent Auditors’ Report Board of Directors Ivy Tech Foundation, Inc. We have audited the accompanying consolidated financial statements of Ivy Tech Foundation, Inc. (a not-for-profit organization), which comprise the consolidated statements of financial position as of June 30, 2013 and 2012, and the related consolidated statements of activities and cash flows for the years then ended, and the related notes to the consolidated financial statements. Management’s Responsibility for the Consolidated Financial Statements Management is responsible for the preparation and fair presentation of these consolidated financial statements in accordance with accounting principles generally accepted in the United States; this includes the design, implementation, and maintenance of internal control relevant to the preparation and fair presentation of consolidated financial statements that are free from material misstatement, whether due to fraud or error. Auditors’ Responsibility Our responsibility is to express an opinion on these consolidated financial statements based on our audits. We conducted our audits in accordance with auditing standards generally accepted in the United States. Those standards require that we plan and perform the audit to obtain reasonable assurance about whether the consolidated financial statements are free from material misstatement. An audit involves performing procedures to obtain audit evidence about the amounts and disclosures in the consolidated financial statements. The procedures selected depend on the auditors’ judgment, including the assessment of the risks of material misstatement of the consolidated financial statements, whether due to fraud or error. In making those risk assessments, the auditors consider internal control relevant to the entity’s preparation and fair presentation of the consolidated financial statements in order to design audit procedures that are appropriate in the circumstances, but not for the purpose of expressing an opinion on the effectiveness of the entity’s internal control. Accordingly, we express no such opinion. An audit also includes evaluating the appropriateness of accounting policies used and the reasonableness of significant accounting estimates made by management, as well as evaluating the overall presentation of the consolidated financial statements. We believe that the audit evidence we have obtained is sufficient and appropriate to provide a basis for our audit opinion.
2
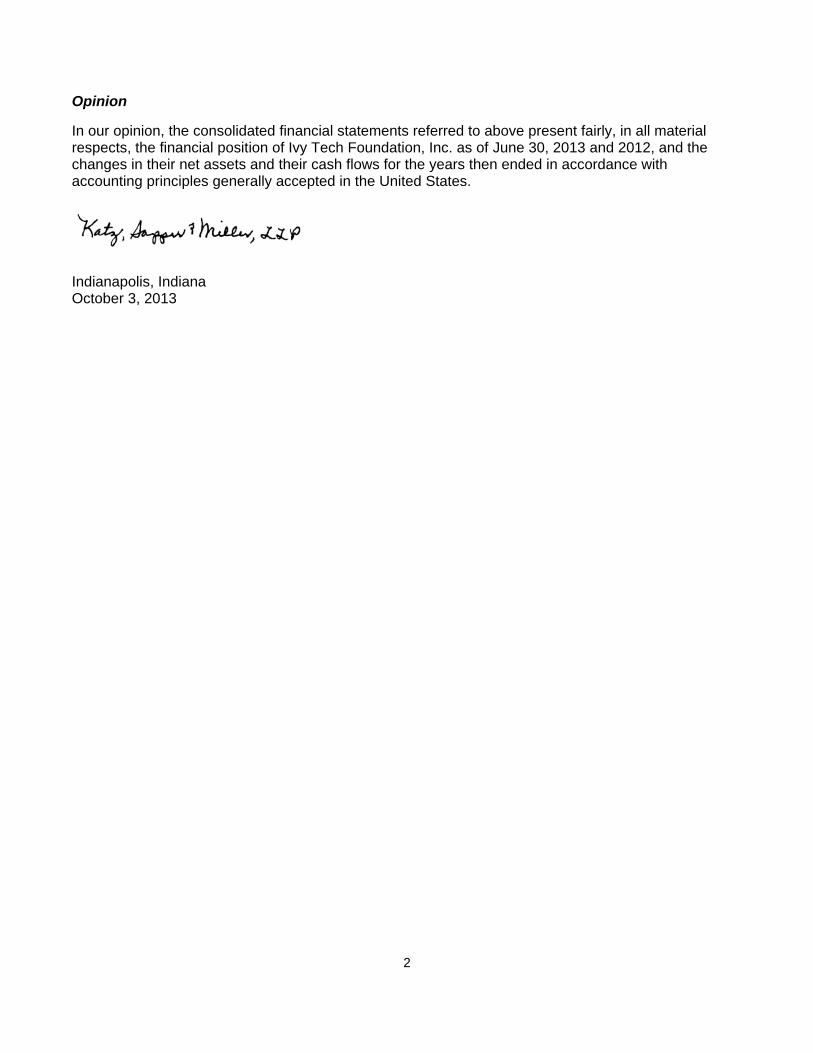
Opinion In our opinion, the consolidated financial statements referred to above present fairly, in all material respects, the financial position of Ivy Tech Foundation, Inc. as of June 30, 2013 and 2012, and the changes in their net assets and their cash flows for the years then ended in accordance with accounting principles generally accepted in the United States. Indianapolis, Indiana October 3, 2013
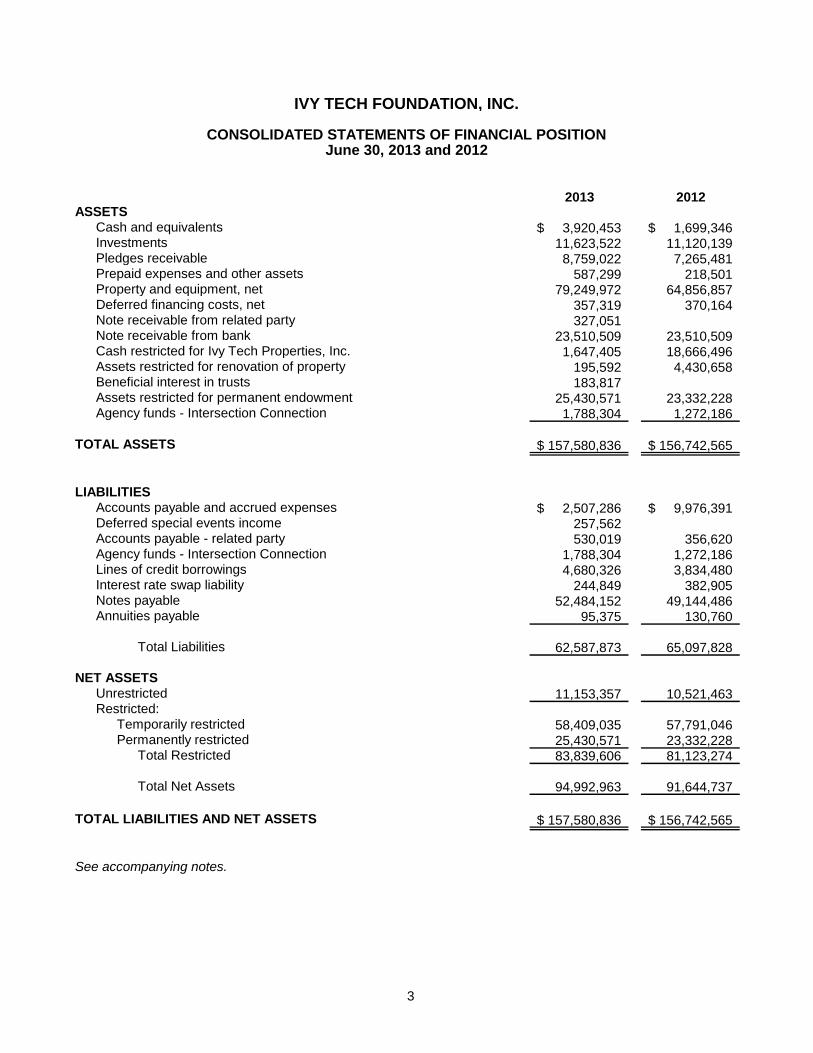
2013 2012ASSETS
Cash and equivalents 3,920,453$ 1,699,346$ Investments 11,623,522 11,120,139 Pledges receivable 8,759,022 7,265,481Prepaid expenses and other assets 587,299 218,501Property and equipment, net 79,249,972 64,856,857Deferred financing costs, net 357,319 370,164Note receivable from related party 327,051 Note receivable from bank 23,510,509 23,510,509Cash restricted for Ivy Tech Properties, Inc. 1,647,405 18,666,496Assets restricted for renovation of property 195,592 4,430,658Beneficial interest in trusts 183,817Assets restricted for permanent endowment 25,430,571 23,332,228Agency funds - Intersection Connection 1,788,304 1,272,186
TOTAL ASSETS 157,580,836$ 156,742,565$
LIABILITIESAccounts payable and accrued expenses 2,507,286$ 9,976,391$ Deferred special events income 257,562Accounts payable - related party 530,019 356,620Agency funds - Intersection Connection 1,788,304 1,272,186Lines of credit borrowings 4,680,326 3,834,480Interest rate swap liability 244,849 382,905Notes payable 52,484,152 49,144,486Annuities payable 95,375 130,760
Total Liabilities 62,587,873 65,097,828
NET ASSETSUnrestricted 11,153,357 10,521,463 Restricted:
Temporarily restricted 58,409,035 57,791,046Permanently restricted 25,430,571 23,332,228
Total Restricted 83,839,606 81,123,274
Total Net Assets 94,992,963 91,644,737
TOTAL LIABILITIES AND NET ASSETS 157,580,836$ 156,742,565$
See accompanying notes.
IVY TECH FOUNDATION, INC.
CONSOLIDATED STATEMENTS OF FINANCIAL POSITIONJune 30, 2013 and 2012
3
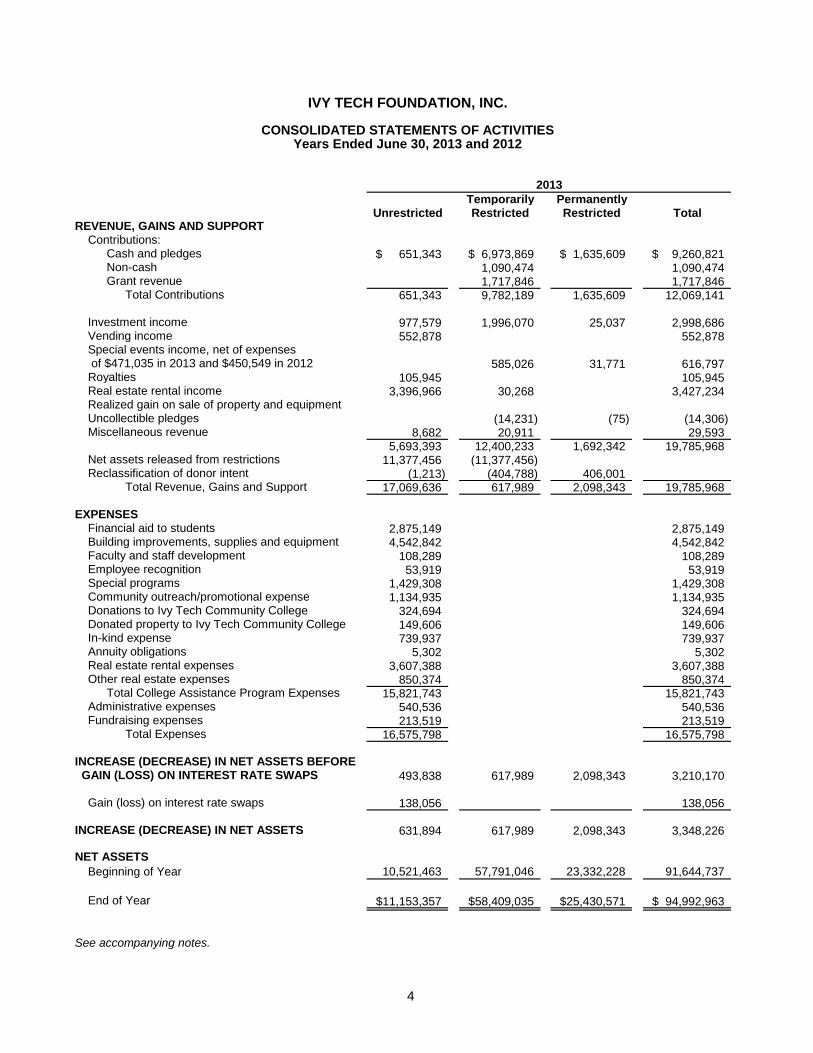
Temporarily PermanentlyUnrestricted Restricted Restricted Total
REVENUE, GAINS AND SUPPORTContributions:
Cash and pledges 651,343$ 6,973,869$ 1,635,609$ 9,260,821$ Non-cash 1,090,474 1,090,474 Grant revenue 1,717,846 1,717,846
Total Contributions 651,343 9,782,189 1,635,609 12,069,141
Investment income 977,579 1,996,070 25,037 2,998,686 Vending income 552,878 552,878 Special events income, net of expenses of $471,035 in 2013 and $450,549 in 2012 585,026 31,771 616,797 Royalties 105,945 105,945 Real estate rental income 3,396,966 30,268 3,427,234 Realized gain on sale of property and equipment Uncollectible pledges (14,231) (75) (14,306) Miscellaneous revenue 8,682 20,911 29,593
5,693,393 12,400,233 1,692,342 19,785,968 Net assets released from restrictions 11,377,456 (11,377,456) Reclassification of donor intent (1,213) (404,788) 406,001
Total Revenue, Gains and Support 17,069,636 617,989 2,098,343 19,785,968
EXPENSESFinancial aid to students 2,875,149 2,875,149 Building improvements, supplies and equipment 4,542,842 4,542,842 Faculty and staff development 108,289 108,289 Employee recognition 53,919 53,919 Special programs 1,429,308 1,429,308 Community outreach/promotional expense 1,134,935 1,134,935 Donations to Ivy Tech Community College 324,694 324,694 Donated property to Ivy Tech Community College 149,606 149,606 In-kind expense 739,937 739,937 Annuity obligations 5,302 5,302 Real estate rental expenses 3,607,388 3,607,388 Other real estate expenses 850,374 850,374
Total College Assistance Program Expenses 15,821,743 15,821,743 Administrative expenses 540,536 540,536 Fundraising expenses 213,519 213,519
Total Expenses 16,575,798 16,575,798
INCREASE (DECREASE) IN NET ASSETS BEFORE GAIN (LOSS) ON INTEREST RATE SWAPS 493,838 617,989 2,098,343 3,210,170
Gain (loss) on interest rate swaps 138,056 138,056
INCREASE (DECREASE) IN NET ASSETS 631,894 617,989 2,098,343 3,348,226
NET ASSETS
Beginning of Year 10,521,463 57,791,046 23,332,228 91,644,737
End of Year 11,153,357$ 58,409,035$ 25,430,571$ 94,992,963$
See accompanying notes.
2013
IVY TECH FOUNDATION, INC.
CONSOLIDATED STATEMENTS OF ACTIVITIESYears Ended June 30, 2013 and 2012
4
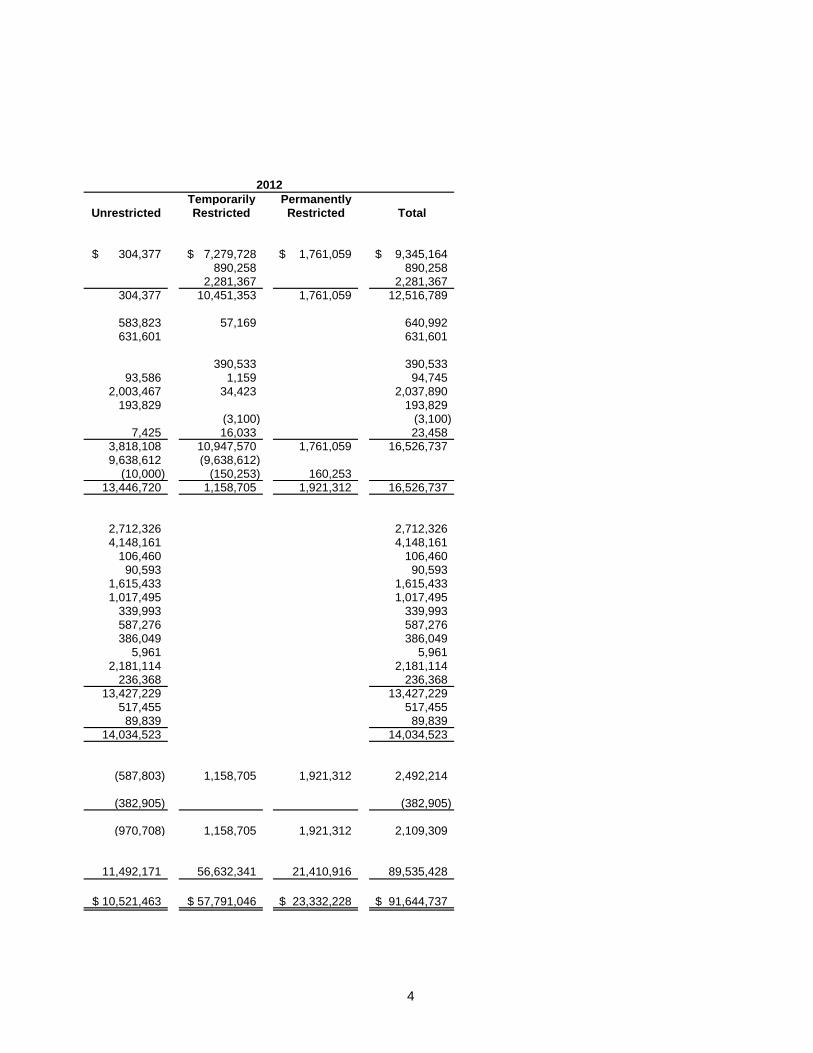
Temporarily PermanentlyUnrestricted Restricted Restricted Total
304,377$ 7,279,728$ 1,761,059$ 9,345,164$ 890,258 890,258
2,281,367 2,281,367 304,377 10,451,353 1,761,059 12,516,789
583,823 57,169 640,992 631,601 631,601
390,533 390,533
93,586 1,159 94,745 2,003,467 34,423 2,037,890
193,829 193,829 (3,100) (3,100)
7,425 16,033 23,458 3,818,108 10,947,570 1,761,059 16,526,737 9,638,612 (9,638,612)
(10,000) (150,253) 160,253 13,446,720 1,158,705 1,921,312 16,526,737
2,712,326 2,712,326 4,148,161 4,148,161
106,460 106,460 90,593 90,593
1,615,433 1,615,433 1,017,495 1,017,495
339,993 339,993 587,276 587,276 386,049 386,049
5,961 5,961 2,181,114 2,181,114
236,368 236,368 13,427,229 13,427,229
517,455 517,455 89,839 89,839
14,034,523 14,034,523
(587,803) 1,158,705 1,921,312 2,492,214
(382,905) (382,905)
(970,708) 1,158,705 1,921,312 2,109,309
11,492,171 56,632,341 21,410,916 89,535,428
10,521,463$ 57,791,046$ 23,332,228$ 91,644,737$
2012
IVY TECH FOUNDATION, INC.
CONSOLIDATED STATEMENTS OF ACTIVITIESYears Ended June 30, 2013 and 2012
4
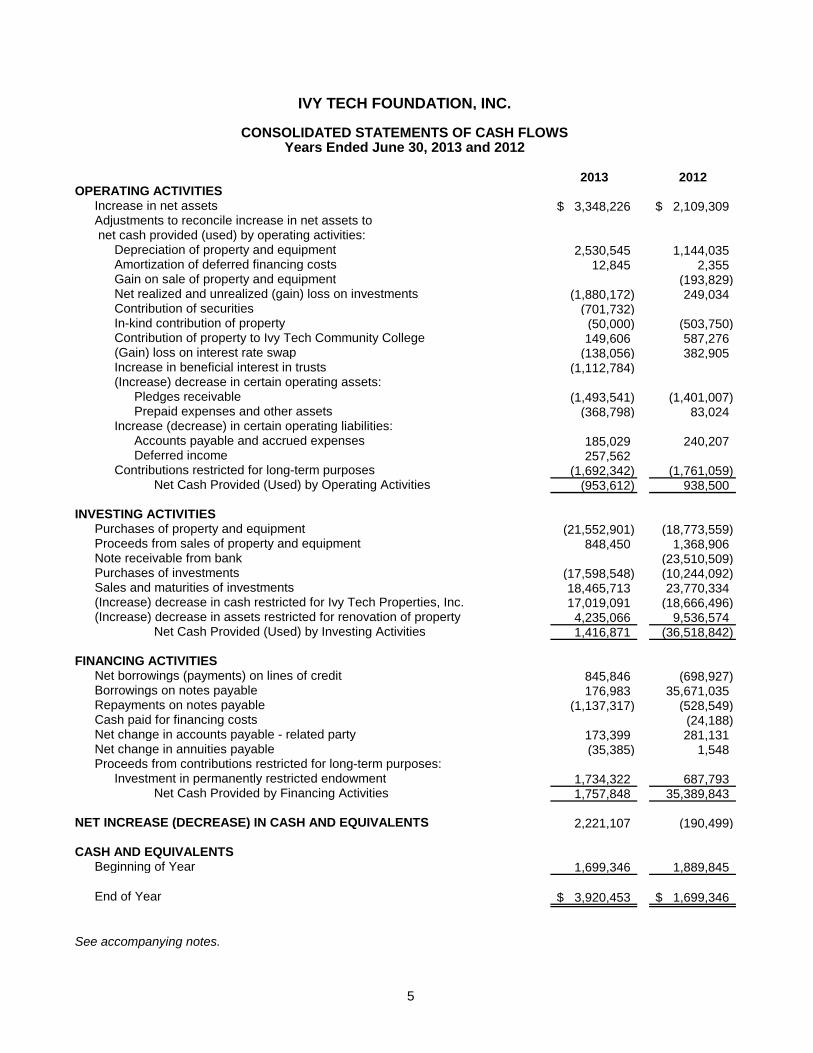
2013 2012OPERATING ACTIVITIES
Increase in net assets 3,348,226$ 2,109,309$ Adjustments to reconcile increase in net assets to net cash provided (used) by operating activities:
Depreciation of property and equipment 2,530,545 1,144,035 Amortization of deferred financing costs 12,845 2,355 Gain on sale of property and equipment (193,829) Net realized and unrealized (gain) loss on investments (1,880,172) 249,034 Contribution of securities (701,732) In-kind contribution of property (50,000) (503,750) Contribution of property to Ivy Tech Community College 149,606 587,276 (Gain) loss on interest rate swap (138,056) 382,905 Increase in beneficial interest in trusts (1,112,784) (Increase) decrease in certain operating assets:
Pledges receivable (1,493,541) (1,401,007) Prepaid expenses and other assets (368,798) 83,024
Increase (decrease) in certain operating liabilities:Accounts payable and accrued expenses 185,029 240,207 Deferred income 257,562
Contributions restricted for long-term purposes (1,692,342) (1,761,059) Net Cash Provided (Used) by Operating Activities (953,612) 938,500
INVESTING ACTIVITIESPurchases of property and equipment (21,552,901) (18,773,559) Proceeds from sales of property and equipment 848,450 1,368,906 Note receivable from bank (23,510,509) Purchases of investments (17,598,548) (10,244,092) Sales and maturities of investments 18,465,713 23,770,334 (Increase) decrease in cash restricted for Ivy Tech Properties, Inc. 17,019,091 (18,666,496) (Increase) decrease in assets restricted for renovation of property 4,235,066 9,536,574
Net Cash Provided (Used) by Investing Activities 1,416,871 (36,518,842)
FINANCING ACTIVITIESNet borrowings (payments) on lines of credit 845,846 (698,927) Borrowings on notes payable 176,983 35,671,035 Repayments on notes payable (1,137,317) (528,549) Cash paid for financing costs (24,188) Net change in accounts payable - related party 173,399 281,131 Net change in annuities payable (35,385) 1,548 Proceeds from contributions restricted for long-term purposes:
Investment in permanently restricted endowment 1,734,322 687,793 Net Cash Provided by Financing Activities 1,757,848 35,389,843
NET INCREASE (DECREASE) IN CASH AND EQUIVALENTS 2,221,107 (190,499)
CASH AND EQUIVALENTSBeginning of Year 1,699,346 1,889,845
End of Year 3,920,453$ 1,699,346$
See accompanying notes.
IVY TECH FOUNDATION, INC.
CONSOLIDATED STATEMENTS OF CASH FLOWSYears Ended June 30, 2013 and 2012
5
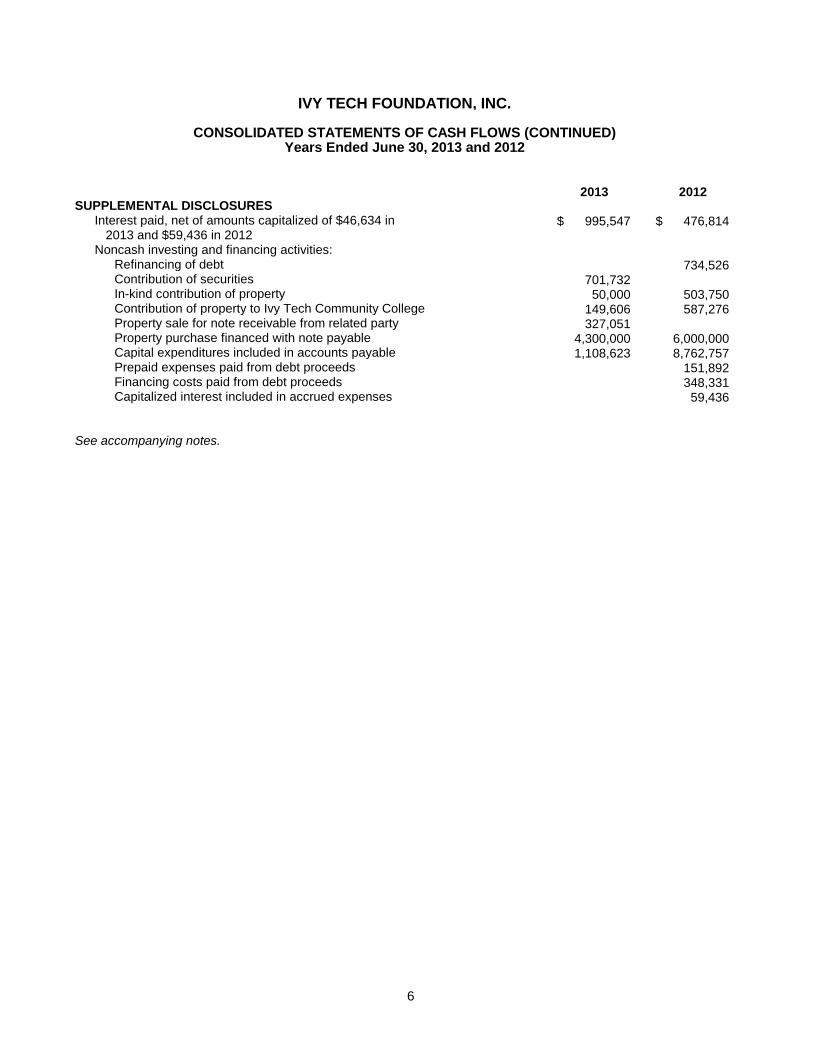
2013 2012SUPPLEMENTAL DISCLOSURES
Interest paid, net of amounts capitalized of $46,634 in 995,547$ 476,814$ 2013 and $59,436 in 2012
Noncash investing and financing activities:Refinancing of debt 734,526 Contribution of securities 701,732 In-kind contribution of property 50,000 503,750 Contribution of property to Ivy Tech Community College 149,606 587,276 Property sale for note receivable from related party 327,051 Property purchase financed with note payable 4,300,000 6,000,000 Capital expenditures included in accounts payable 1,108,623 8,762,757 Prepaid expenses paid from debt proceeds 151,892 Financing costs paid from debt proceeds 348,331 Capitalized interest included in accrued expenses 59,436
See accompanying notes.
IVY TECH FOUNDATION, INC.
Years Ended June 30, 2013 and 2012CONSOLIDATED STATEMENTS OF CASH FLOWS (CONTINUED)
6
7
IVY TECH FOUNDATION, INC.
NOTES TO CONSOLIDATED FINANCIAL STATEMENTS
June 30, 2013 and 2012
NOTE 1 - NATURE OF OPERATIONS AND SIGNIFICANT ACCOUNTING POLICIES General: Ivy Tech Foundation, Inc. (the Foundation) was incorporated on June 9, 1969 under The Indiana Foundations and Holding Companies Act of 1921 (as amended), and during the 1992-1993 fiscal year elected to be governed under the Indiana Nonprofit Corporation Act of 1991. The Foundation, whose principal activity is to promote educational, scientific and charitable purposes in connection with, or at the request of, Ivy Tech Community College of Indiana (College), commenced its financial activities with the receipt of various unrestricted contributions in October 1970. Major sources of revenue for the Foundation include contributions from individuals, corporations and granting foundations. The financial affairs of the Foundation are included in a number of self-balancing accounting entities referred to as funds as set forth in the accompanying consolidated financial statements. The accompanying consolidated financial statements include the accounts of the Foundation and the following wholly-owned subsidiaries:
Community Enterprises Incorporated (CEI) – A corporation formed on October 15, 2008.
Community Enterprises Properties, LLC (CEP) – A member managed limited liability company formed on June 29, 2009 to engage in real estate transactions.
Ivy Tech Properties, Inc. (ITP) – an Indiana public benefit corporation formed on February 15, 2012, to partially acquire, own and redevelop a multi-story building for the expansion of the Ivy Tech Community College’s Indianapolis campus. ITP is a qualified active low-income community business under Section 45D(f)(2) of the Internal Revenue Code.
The Foundation and its subsidiaries are collectively referred to as the Foundation throughout this report. All intra-entity accounts and transactions have been eliminated in consolidation. Basis of Accounting: The Foundation reports its operations on the accrual basis wherein revenue and support are recognized in the period earned and expenses in the period incurred. Estimates: Management uses estimates and assumptions in preparing financial statements in conformity with accounting principles generally accepted in the United States. Those estimates and assumptions affect the reported amounts of asset and liabilities, the disclosure of contingent assets and liabilities and the reported amounts of revenues and expenses. Actual results could differ from those estimates. Net Asset Classifications: The consolidated financial statements report the changes in and the total of each of the net asset classes, based upon donor restrictions, as applicable. Net assets are classified as unrestricted, temporarily restricted, and permanently restricted. The following classes of net assets are maintained by the Foundation:
Unrestricted Net Assets include general and board designated assets and liabilities which may be used at the discretion of management to support the Foundation’s purposes and operations.
Temporarily Restricted Net Assets include assets related to gifts with explicit donor-imposed restrictions that have not been met as to specified purpose, or to later periods of time or after specified dates. Unconditional promises to give that are due in future periods and are not permanently restricted are classified as temporarily restricted net assets.
8
NOTE 1 - NATURE OF OPERATIONS AND SIGNIFICANT ACCOUNTING POLICIES (CONTINUED)
Permanently Restricted Net Assets include assets related to gifts with donor-imposed restrictions that stipulate the principal be held in perpetuity with the earnings thereon being temporarily restricted until appropriated for expenditure.
At times, the Foundation receives requests by donors or their designates to change the use for which their original gift was intended. These requests are reviewed by the Foundation for approval. Approved changes, depending on the donors’ requests, may result in the reclassification of net assets between unrestricted, temporarily restricted, or permanently restricted net asset classes. Reclassifications of $406,001 and $160,253 are reflected in the consolidated statements of activities as reclassifications of donor intent for the years ended June 30, 2013 and 2012, respectively.
Cash and Equivalents: For the purposes of the consolidated statement of cash flows, cash equivalents includes money market fund shares. The Foundation maintains its cash in bank deposit accounts which, at times, may exceed the federally insured limits. The Foundation has not experienced any losses from these bank accounts.
Promises to Give: Unconditional promises to give are recognized as revenues or gains in the period received and as assets, decreases of liabilities, or expenses depending on the form of the benefits received. Conditional promises to give are recognized when the conditions on which they depend are substantially met.
Investment Valuation and Income Recognition: Investments are stated at fair value. Fair value is the price that would be received to sell an asset or paid to transfer a liability in an orderly transaction between market participants at the measurement date. See Note 4 for discussion of fair value measurements. Interest income is recorded on the accrual basis, and dividends are recorded on the ex-dividend date. Purchases and sales of investments are recorded on the trade date. Gains and losses on the sale of investments are determined using the specific-identification method. Realized and unrealized gains and losses of investments are included in the consolidated statements of activities. Investment income is allocated to capital campaign accounts and endowment funds only. Investment income is not allocated to other expendable restricted funds in lieu of charging an investment management fee to these funds.
Investment Pools: The Foundation maintains master investment accounts for its endowments. Interest, dividends, and realized gains and losses from securities in the master investment accounts are allocated quarterly to the individual endowments based on the relationship of the value of each endowment to the total.
Beneficial Interest in Trusts: The Foundation is an irrevocable beneficiary of four trusts. The Foundation’s beneficial interest in trusts is reported at fair value in the temporarily restricted or permanently restricted net asset class, based on the nature of the trust and donor restrictions. See Note 4 for discussion of fair value measurements. Changes in value of beneficial interest in trusts are recognized in investment income in the same net asset class as the initial value.
Property and Equipment: Expenditures for property and equipment and items which substantially increase the useful lives of existing assets are capitalized at cost, except for donated items, which are recorded at fair market value at the date of donation. The Foundation provides for depreciation on the straight-line method at rates designed to depreciate the costs of assets over estimated useful lives as follows: Furniture and equipment 5-10 years Land improvements 10 years Software 3-5 years Buildings and improvements 20-30 years
9
NOTE 1 - NATURE OF OPERATIONS AND SIGNIFICANT ACCOUNTING POLICIES (CONTINUED) Property and equipment are reviewed for impairment whenever events or changes in circumstances indicate that the carrying amount of an asset may not be recoverable. Recoverability is measured by comparison of the asset’s carrying amount to future net undiscounted cash flows expected to be generated by the asset. If such assets are considered to be impaired, the impairment to be recognized is measured by the amount by which the carrying amount of the assets exceeds their fair market value. To date, no adjustments to the carrying amount of property and equipment have been required.
Deferred Financing Costs: Financing costs paid to obtain long-term financing are deferred and amortized over the term of the related loans on a basis that approximates a constant effective interest rate.
Assets Restricted for Renovation of Property consists of assets that may only be used for the renovation of the Foundation’s property, based on the gift agreement with the donor, which have not yet been fully spent for that purpose.
Agency Funds represent cash and pledges receivable maintained by the Foundation on behalf of the Intersection Connection joint venture agreement that were not designated by the donor for the exclusive use of one particular organization. The Foundation and two other unrelated, non-profit organizations formed the joint venture to raise funds for facility and program expansion. The Foundation serves as the fiscal agent for the joint venture; however, any expenditure of the funds are subject to the approval of the coordinating committee established under the agreement, which includes representation from all three parties.
Support and Revenue: The Foundation reports gifts of cash and other assets as restricted support if they are received with donor stipulations that limit the use of the donated assets. When a donor restriction expires, that is, when a stipulated time restriction ends or purpose restriction is accomplished, temporarily restricted net assets are reclassified to unrestricted net assets and reported in the consolidated statement of activities as net assets released from restrictions.
Deferred Special Events Income includes amounts received for events which will occur in a subsequent fiscal year. These funds may be returned if the events are cancelled and, accordingly, are deferred until the events have occurred.
Derivative Instrument and Hedging Activities: The Foundation has entered into an interest rate swap agreement principally to protect against the risk of interest rate movements on bond debt. The Foundation does not engage in speculative derivative transactions for trading purposes. See Notes 4 and 11.
Non-Cash Contributions: In addition to receiving cash contributions, the Foundation receives non-cash contributions including gifts of securities and real estate from various donors. The Foundation's policy is to record securities and real estate donations at their fair market value on the date of donation. Real estate donations are considered to have an implied time restriction and are treated as temporarily restricted support.
Functional Allocation of Expenses: The costs of providing the programs and services of the Foundation have been summarized on a functional basis in the consolidated statement of activities. Accordingly, certain costs have been allocated among the programs and supporting activities benefited. Although the method used was appropriate, other methods could have produced different results.
10
NOTE 1 - NATURE OF OPERATIONS AND SIGNIFICANT ACCOUNTING POLICIES (CONTINUED)
Income Taxes: Ivy Tech Foundation, Inc. is exempt from federal income taxes under Section 501(c)(3) of the Internal Revenue Code (IRC). CEP is a single member, member managed limited liability company that is treated as a disregarded entity for federal and state income tax purposes, and thus is also exempt from federal income taxes under Section 501(c)(3) of the IRC. Ivy Tech Properties, Inc. is exempt from federal income taxes under Section 501(c)(2) of the IRC. Therefore, no provision or liability for income taxes has been included in the consolidated financial statements for these entities. In addition, Ivy Tech Foundation, Inc. has been determined by the Internal Revenue Service not to be a private foundation within the meaning of Section 509(a) of the IRC. There was no unrelated business income for the years ended June 30, 2013 and 2012. CEI is a taxable corporation; however, it had no federal or state income taxes currently payable or deferred tax assets or liabilities as of June 30, 2013 and 2012.
The Foundation files U.S. federal and state of Indiana informational tax returns. The Foundation is no longer subject to U.S. federal and state income tax examinations by tax authorities for years before the year ended June 30, 2010.
Subsequent Events: The Foundation has evaluated the consolidated financial statements for subsequent events occurring through October 3, 2013, the date the consolidated financial statements were available to be issued. See Note 11.
NOTE 2 - ASSETS RESTRICTED FOR LONG-TERM PURPOSES Assets with donor-imposed restrictions limiting their use to long-term purposes, which include assets restricted for renovation of the Foundation’s property and for permanent endowment, have been excluded from other assets which are available for current use. Assets restricted for renovation of the Foundation’s property consisted of the following at June 30, 2013 and 2012: 2013 2012 Cash and equivalents $ 195,592 $ 4,430,658 Total Assets Restricted for Renovation of Foundation Property $ 195,592 $ 4,430,658 Assets restricted for permanent endowment consisted of the following at June 30, 2013 and 2012: 2013 2012 Investments $23,389,809 $22,178,453 Beneficial interest in trusts 928,967 Pledges receivable 1,111,795 1,153,775 Total Assets Restricted for Permanent Endowment $25,430,571 $23,332,228 NOTE 3 - ENDOWMENT The Foundation’s endowment consists of over 200 individual funds established for a variety of purposes. As required by accounting principles generally accepted in the United States (GAAP), net assets associated with endowment funds, including funds designated by the Board of Directors to function as endowments, are classified and reported based on the existence or absence of donor-imposed restrictions. The Foundation’s endowment includes only donor-restricted endowment funds, as the Board of Directors has not designated any funds to function as endowments.
11
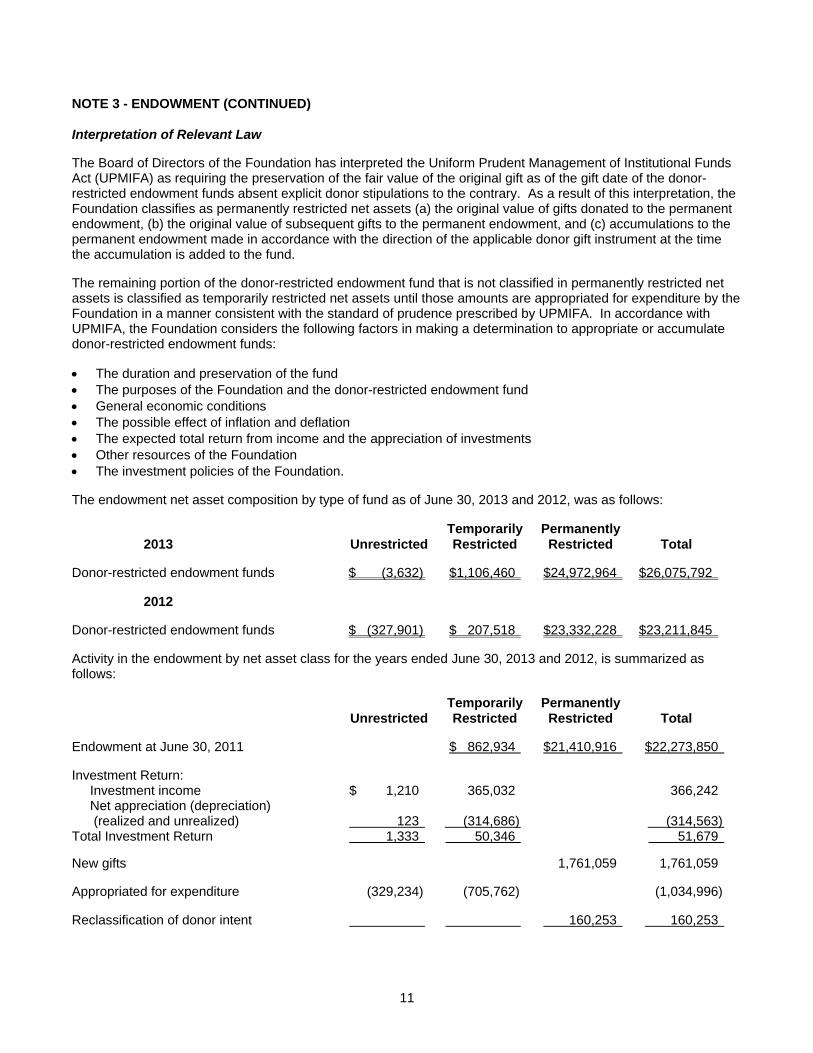
NOTE 3 - ENDOWMENT (CONTINUED) Interpretation of Relevant Law The Board of Directors of the Foundation has interpreted the Uniform Prudent Management of Institutional Funds Act (UPMIFA) as requiring the preservation of the fair value of the original gift as of the gift date of the donor-restricted endowment funds absent explicit donor stipulations to the contrary. As a result of this interpretation, the Foundation classifies as permanently restricted net assets (a) the original value of gifts donated to the permanent endowment, (b) the original value of subsequent gifts to the permanent endowment, and (c) accumulations to the permanent endowment made in accordance with the direction of the applicable donor gift instrument at the time the accumulation is added to the fund.
The remaining portion of the donor-restricted endowment fund that is not classified in permanently restricted net assets is classified as temporarily restricted net assets until those amounts are appropriated for expenditure by the Foundation in a manner consistent with the standard of prudence prescribed by UPMIFA. In accordance with UPMIFA, the Foundation considers the following factors in making a determination to appropriate or accumulate donor-restricted endowment funds:
The duration and preservation of the fund
The purposes of the Foundation and the donor-restricted endowment fund
General economic conditions
The possible effect of inflation and deflation
The expected total return from income and the appreciation of investments
Other resources of the Foundation
The investment policies of the Foundation. The endowment net asset composition by type of fund as of June 30, 2013 and 2012, was as follows: Temporarily Permanently 2013 Unrestricted Restricted Restricted Total Donor-restricted endowment funds $ (3,632) $1,106,460 $24,972,964 $26,075,792 2012 Donor-restricted endowment funds $ (327,901) $ 207,518 $23,332,228 $23,211,845 Activity in the endowment by net asset class for the years ended June 30, 2013 and 2012, is summarized as follows: Temporarily Permanently Unrestricted Restricted Restricted Total Endowment at June 30, 2011 $ 862,934 $21,410,916 $22,273,850 Investment Return: Investment income $ 1,210 365,032 366,242 Net appreciation (depreciation) (realized and unrealized) 123 (314,686) (314,563) Total Investment Return 1,333 50,346 51,679 New gifts 1,761,059 1,761,059 Appropriated for expenditure (329,234) (705,762) (1,034,996) Reclassification of donor intent 160,253 160,253
12
NOTE 3 - ENDOWMENT (CONTINUED)
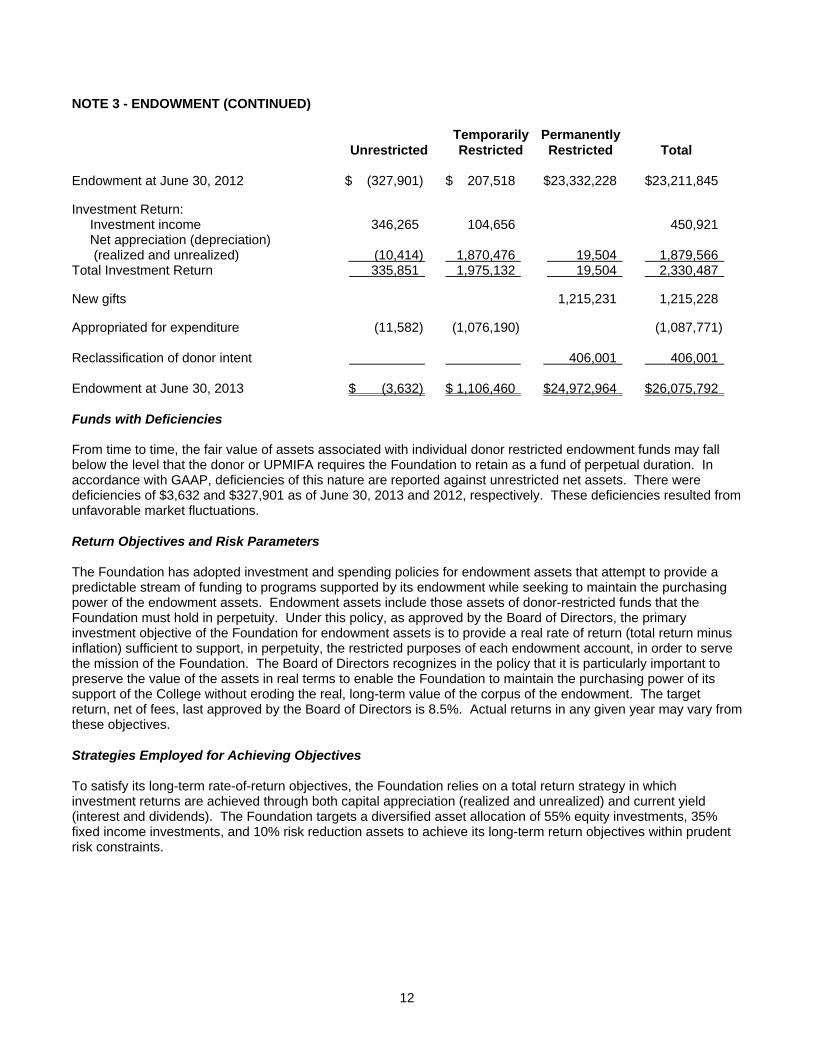
Temporarily Permanently Unrestricted Restricted Restricted Total Endowment at June 30, 2012 $ (327,901) $ 207,518 $23,332,228 $23,211,845 Investment Return: Investment income 346,265 104,656 450,921 Net appreciation (depreciation) (realized and unrealized) (10,414) 1,870,476 19,504 1,879,566 Total Investment Return 335,851 1,975,132 19,504 2,330,487 New gifts 1,215,231 1,215,228 Appropriated for expenditure (11,582) (1,076,190) (1,087,771) Reclassification of donor intent 406,001 406,001 Endowment at June 30, 2013 $ (3,632) $ 1,106,460 $24,972,964 $26,075,792
Funds with Deficiencies From time to time, the fair value of assets associated with individual donor restricted endowment funds may fall below the level that the donor or UPMIFA requires the Foundation to retain as a fund of perpetual duration. In accordance with GAAP, deficiencies of this nature are reported against unrestricted net assets. There were deficiencies of $3,632 and $327,901 as of June 30, 2013 and 2012, respectively. These deficiencies resulted from unfavorable market fluctuations.
Return Objectives and Risk Parameters The Foundation has adopted investment and spending policies for endowment assets that attempt to provide a predictable stream of funding to programs supported by its endowment while seeking to maintain the purchasing power of the endowment assets. Endowment assets include those assets of donor-restricted funds that the Foundation must hold in perpetuity. Under this policy, as approved by the Board of Directors, the primary investment objective of the Foundation for endowment assets is to provide a real rate of return (total return minus inflation) sufficient to support, in perpetuity, the restricted purposes of each endowment account, in order to serve the mission of the Foundation. The Board of Directors recognizes in the policy that it is particularly important to preserve the value of the assets in real terms to enable the Foundation to maintain the purchasing power of its support of the College without eroding the real, long-term value of the corpus of the endowment. The target return, net of fees, last approved by the Board of Directors is 8.5%. Actual returns in any given year may vary from these objectives.
Strategies Employed for Achieving Objectives
To satisfy its long-term rate-of-return objectives, the Foundation relies on a total return strategy in which investment returns are achieved through both capital appreciation (realized and unrealized) and current yield (interest and dividends). The Foundation targets a diversified asset allocation of 55% equity investments, 35% fixed income investments, and 10% risk reduction assets to achieve its long-term return objectives within prudent risk constraints.
13
NOTE 3 - ENDOWMENT (CONTINUED) Spending Policy and How the Investment Objectives Relate to Spending Policy
The Foundation has a policy of appropriating for distribution each year 5% of its endowment fund’s asset value as of the immediately preceding January 1. However, the amount may be increased with the approval of the Treasurer of the Foundation if significant additional endowment contributions are received after that January 1 date and before the start of the third quarter of the fiscal year. The amount may also be reduced if deemed prudent based on a balanced view of investment returns, spending needs of the College, and maintaining fund values in perpetuity. Over the long term, the Foundation expects the current spending policy to allow its endowment to grow. This is consistent with the Foundation’s objective to maintain the purchasing power of the endowment assets held in perpetuity or for a specified term as well as to provide additional real growth through new gifts and investment return.
NOTE 4 - FAIR VALUE MEASUREMENTS The Foundation categorizes its assets and liabilities that are measured at fair value into a three-level fair value hierarchy. The hierarchy prioritizes the inputs to valuation techniques used to measure fair value. The hierarchy gives the highest priority to unadjusted quoted prices in active markets for identical assets or liabilities (Level 1 measurements) and the lowest priority to unobservable inputs (Level 3 measurements). The asset or liability’s fair value measurement level within the fair value hierarchy is based on the lowest level of any input that is significant to the fair value measurement. Valuation techniques used need to maximize the use of observable inputs and minimize the use of unobservable inputs. The three levels of the fair value hierarchy are described as follows:
Level 1 – Inputs to the valuation methodology are unadjusted quoted prices for identical assets or liabilities in active markets that the Foundation has the ability to access.
Level 2 – Inputs to the valuation methodology may include: quoted prices for similar assets or liabilities in active markets; quoted prices for identical or similar assets or liabilities in inactive markets; inputs other than quoted prices that are observable for the asset or liability; and/or inputs that are derived principally from or corroborated by observable market data by correlation or other means. If the asset or liability has a specified (contractual) term, the Level 2 input must be observable for substantially the full term of the asset or liability.
Level 3 – Inputs to the valuation methodology are unobservable and significant to the fair value measurement. In situations where there is little or no market activity for the asset or liability, the Foundation makes estimates and assumptions related to the pricing of the asset or liability including assumptions regarding risk.
Following is a description of the valuation methodologies used by the Foundation for assets and liabilities that are measured at fair value on a recurring basis. There have been no changes in the methodologies used at June 30, 2013 and 2012.
Mutual Fund Shares and Money Market Fund Shares: Valued at the published net asset value (NAV), as reported by each fund, of the shares held by the Foundation at the reporting date.
Common Stocks, Exchange Traded Funds, Government Obligations, and Corporate Bonds: Valued at the closing price reported on the active market on which the individual securities are traded.
14
NOTE 4 - FAIR VALUE MEASUREMENTS (CONTINUED) Hedge Funds: Valued at the net asset value (NAV) of the various hedge funds at the reporting date. The NAV is used as a practical expedient to estimate fair value and is based on the fair value of the hedge funds’ underlying investments less its liabilities. If management determines, based on its own due diligence and investment monitoring procedures, that the reported NAV of any hedge fund is not representative of fair value, and the difference between fair value and reported value is material, management will estimate the fair value of the investment in the hedge fund in good faith. For the year ended June 30, 2013, no adjustments to the reported NAV were recorded.
Structured Products-commodities: Unsecured debt obligations with returns linked to the performance of a referenced commodity or commodities, which are valued based on the fixing price of the referenced commodity or commodities at the reporting date, adjusted for the upside participation factor, downside participation factor, or buffer level, as applicable.
Certificates of Deposit: Determined by discounting the related cash flows on current yields of similar investments with comparable durations considering the credit-worthiness of the issuer.
Beneficial Interest in Perpetual Trust: Valued using the fair value of the assets in the trust as a practical expedient, since no facts and circumstances indicate that the fair value of the assets in the trust differs from the fair value of the beneficial interest.
Beneficial Interest in Charitable Remainder Trusts: Valued at the present value of future cash flows considering the estimated return on invested assets during the term of the agreement, the contractual payment obligations under the agreement, and a discount rate commensurate with the characteristics of the trust. The expected term of each agreement is determined based on life expectancies of the beneficiaries.
Interest Rate Swap Derivatives: Valued by using models which include assumptions about the interest yield curve at the reporting date.
The preceding methods may produce a fair value calculation that may not be indicative of net realizable value or reflective of future fair values. Furthermore, although the Foundation’s management believes its valuation methods are appropriate and consistent with other market participants, the use of different methodologies or assumptions to determine the fair value of certain assets and liabilities could result in a different fair value measurement at the reporting date.
For assets and liabilities with fair value measured using Level 3 inputs, management determines the fair value measurement policies and procedures in consultation with the Foundation’s Finance Committee. Those policies and procedures are reassessed at least annually to determine if the current valuation techniques are still appropriate. At that time, the unobservable inputs used in the fair value measurements are evaluated and adjusted, as necessary, based on current market conditions and other third-party information. The Foundation’s investments in hedge funds, which are valued at fair value utilizing the practical expedient, are generally classified within the fair value hierarchy based on the Foundation’s ability to redeem its investment in a hedge fund at NAV per share, or its equivalent, as of the measurement date. When the Foundation has the ability to redeem its investment in a hedge fund at NAV in the near term, as determined by management, the investment is generally categorized as a Level 2 fair value measurement. When the Foundation neither has the ability to redeem its investment in a hedge fund at NAV nor has the ability to redeem at NAV in the near term, the investment is generally categorized as a Level 3 fair value measurement.
The Foundation’s beneficial interest in perpetual trust is categorized as a Level 3 fair value measurement because the Foundation does not have the ability to redeem the asset at its practical expedient.
15
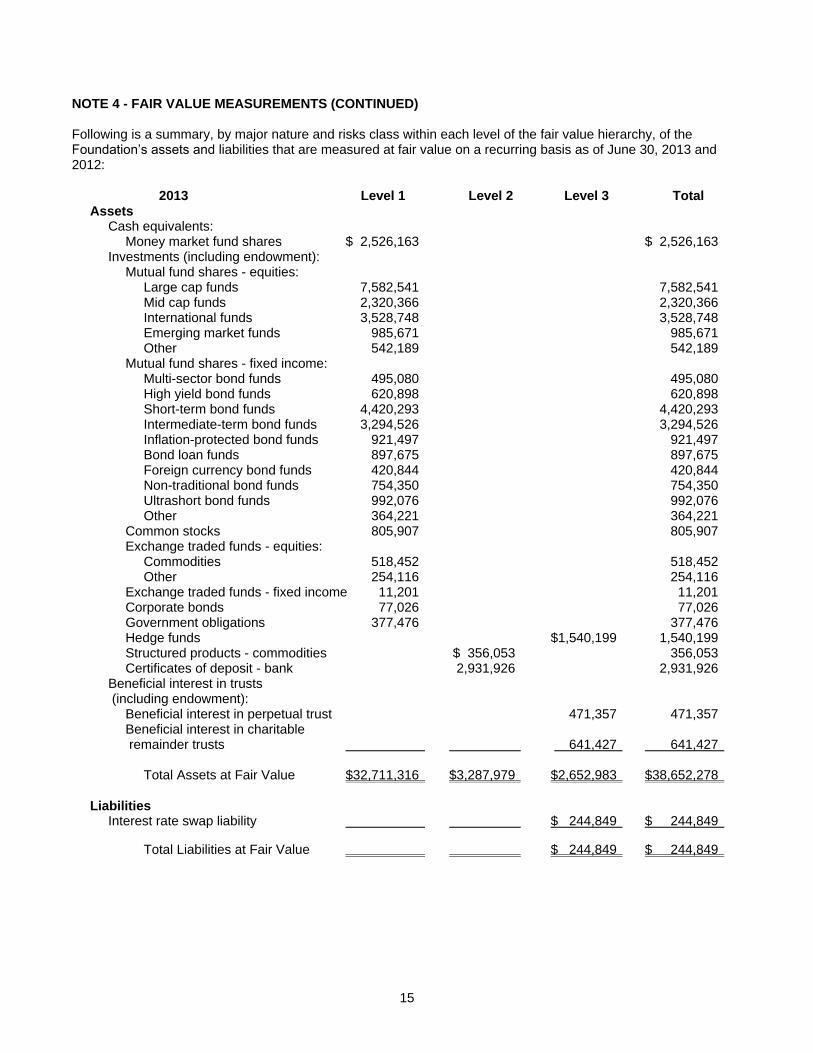
NOTE 4 - FAIR VALUE MEASUREMENTS (CONTINUED) Following is a summary, by major nature and risks class within each level of the fair value hierarchy, of the Foundation’s assets and liabilities that are measured at fair value on a recurring basis as of June 30, 2013 and 2012:
2013 Level 1 Level 2 Level 3 Total Assets Cash equivalents: Money market fund shares $ 2,526,163 $ 2,526,163 Investments (including endowment): Mutual fund shares - equities: Large cap funds 7,582,541 7,582,541 Mid cap funds 2,320,366 2,320,366 International funds 3,528,748 3,528,748 Emerging market funds 985,671 985,671 Other 542,189 542,189 Mutual fund shares - fixed income: Multi-sector bond funds 495,080 495,080 High yield bond funds 620,898 620,898 Short-term bond funds 4,420,293 4,420,293 Intermediate-term bond funds 3,294,526 3,294,526 Inflation-protected bond funds 921,497 921,497 Bond loan funds 897,675 897,675 Foreign currency bond funds 420,844 420,844 Non-traditional bond funds 754,350 754,350 Ultrashort bond funds 992,076 992,076 Other 364,221 364,221 Common stocks 805,907 805,907 Exchange traded funds - equities: Commodities 518,452 518,452 Other 254,116 254,116 Exchange traded funds - fixed income 11,201 11,201 Corporate bonds 77,026 77,026 Government obligations 377,476 377,476 Hedge funds $1,540,199 1,540,199 Structured products - commodities $ 356,053 356,053 Certificates of deposit - bank 2,931,926 2,931,926
Beneficial interest in trusts (including endowment):
Beneficial interest in perpetual trust 471,357 471,357 Beneficial interest in charitable remainder trusts 641,427 641,427 Total Assets at Fair Value $32,711,316 $3,287,979 $2,652,983 $38,652,278
Liabilities Interest rate swap liability $ 244,849 $ 244,849 Total Liabilities at Fair Value $ 244,849 $ 244,849
16
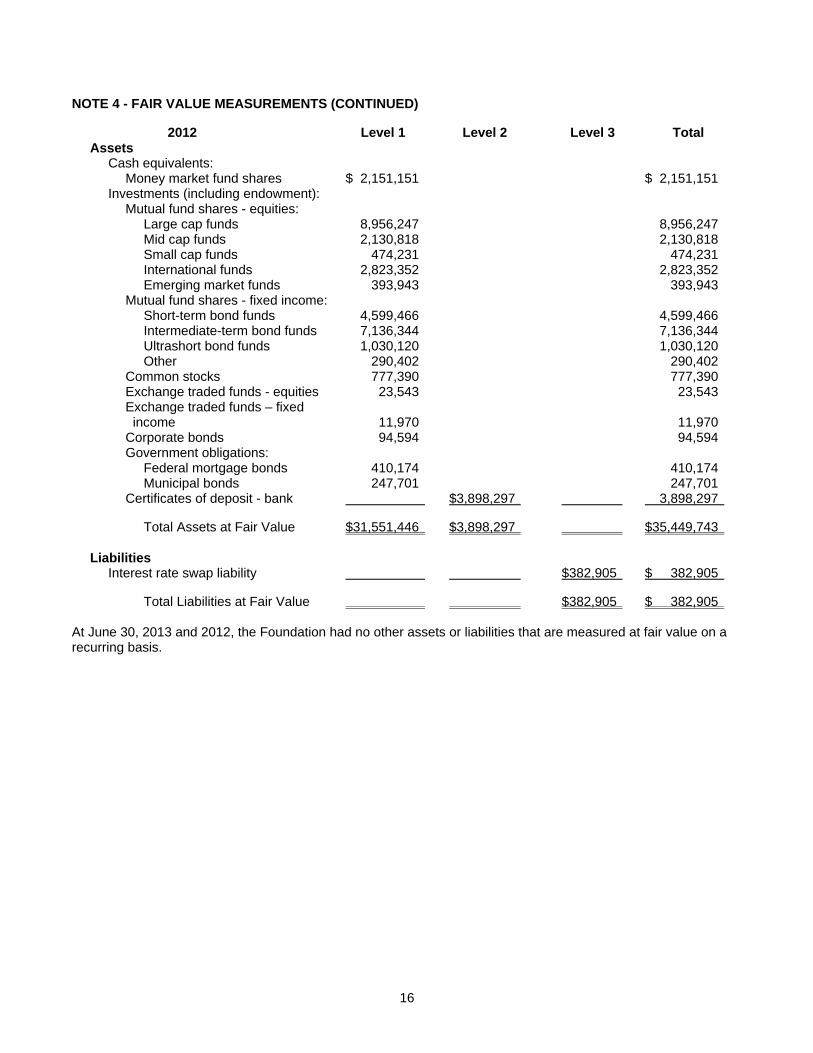
NOTE 4 - FAIR VALUE MEASUREMENTS (CONTINUED)
2012 Level 1 Level 2 Level 3 Total Assets Cash equivalents: Money market fund shares $ 2,151,151 $ 2,151,151 Investments (including endowment): Mutual fund shares - equities: Large cap funds 8,956,247 8,956,247 Mid cap funds 2,130,818 2,130,818 Small cap funds 474,231 474,231 International funds 2,823,352 2,823,352 Emerging market funds 393,943 393,943 Mutual fund shares - fixed income: Short-term bond funds 4,599,466 4,599,466 Intermediate-term bond funds 7,136,344 7,136,344 Ultrashort bond funds 1,030,120 1,030,120 Other 290,402 290,402 Common stocks 777,390 777,390 Exchange traded funds - equities 23,543 23,543 Exchange traded funds – fixed income 11,970 11,970 Corporate bonds 94,594 94,594 Government obligations: Federal mortgage bonds 410,174 410,174 Municipal bonds 247,701 247,701 Certificates of deposit - bank $3,898,297 3,898,297 Total Assets at Fair Value $31,551,446 $3,898,297 $35,449,743
Liabilities Interest rate swap liability $382,905 $ 382,905 Total Liabilities at Fair Value $382,905 $ 382,905 At June 30, 2013 and 2012, the Foundation had no other assets or liabilities that are measured at fair value on a recurring basis.
17
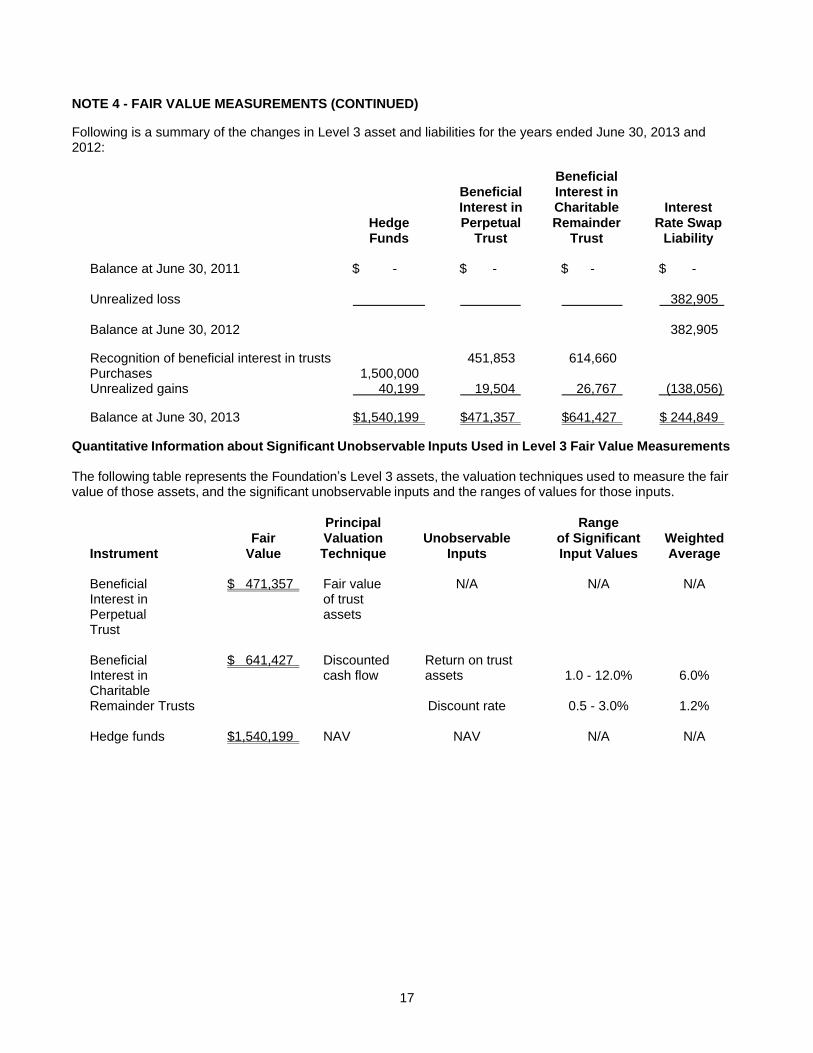
NOTE 4 - FAIR VALUE MEASUREMENTS (CONTINUED) Following is a summary of the changes in Level 3 asset and liabilities for the years ended June 30, 2013 and 2012: Beneficial Beneficial Interest in Interest in Charitable Interest Hedge Perpetual Remainder Rate Swap Funds Trust Trust Liability Balance at June 30, 2011 $ - $ - $ - $ - Unrealized loss 382,905 Balance at June 30, 2012 382,905 Recognition of beneficial interest in trusts 451,853 614,660 Purchases 1,500,000 Unrealized gains 40,199 19,504 26,767 (138,056) Balance at June 30, 2013 $1,540,199 $471,357 $641,427 $ 244,849 Quantitative Information about Significant Unobservable Inputs Used in Level 3 Fair Value Measurements The following table represents the Foundation’s Level 3 assets, the valuation techniques used to measure the fair value of those assets, and the significant unobservable inputs and the ranges of values for those inputs.
Principal Range Fair Valuation Unobservable of Significant Weighted Instrument Value Technique Inputs Input Values Average Beneficial $ 471,357 Fair value N/A N/A N/A Interest in of trust Perpetual assets Trust Beneficial $ 641,427 Discounted Return on trust Interest in cash flow assets 1.0 - 12.0% 6.0% Charitable Remainder Trusts Discount rate 0.5 - 3.0% 1.2% Hedge funds $1,540,199 NAV NAV N/A N/A
18
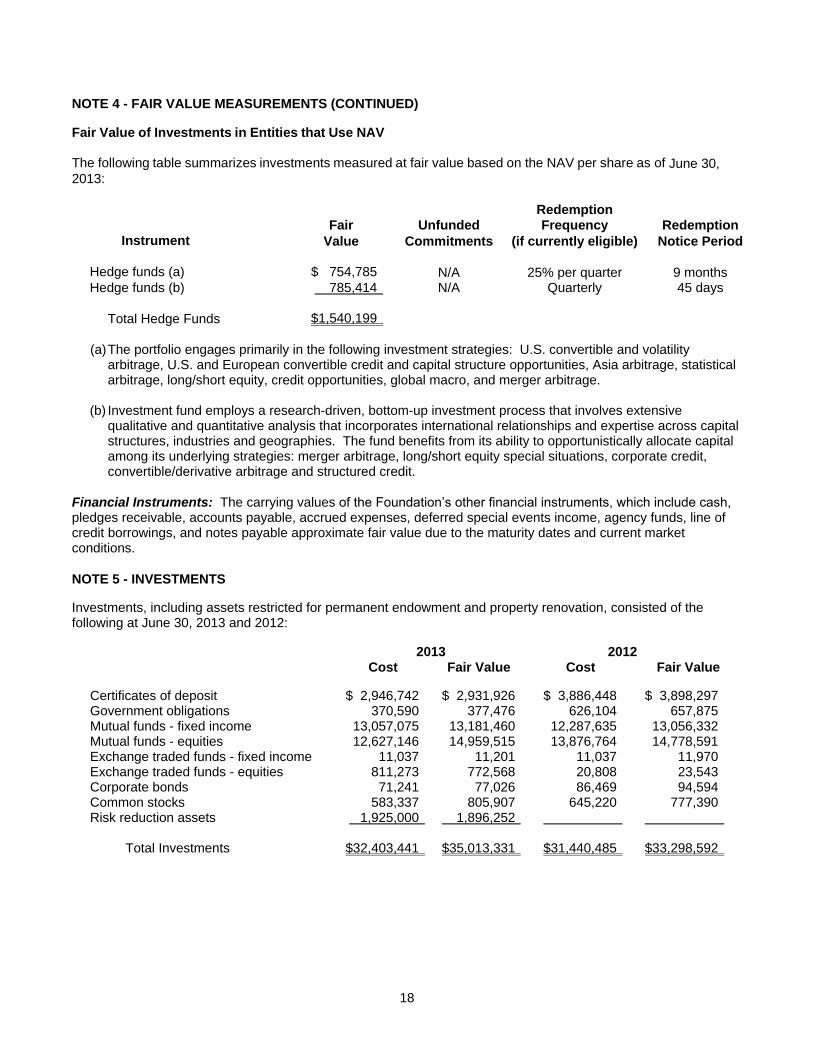
NOTE 4 - FAIR VALUE MEASUREMENTS (CONTINUED) Fair Value of Investments in Entities that Use NAV The following table summarizes investments measured at fair value based on the NAV per share as of June 30, 2013:
Redemption Fair Unfunded Frequency Redemption
Instrument Value Commitments (if currently eligible) Notice Period Hedge funds (a) $ 754,785 N/A 25% per quarter 9 months Hedge funds (b) 785,414 N/A Quarterly 45 days
Total Hedge Funds $1,540,199
(a) The portfolio engages primarily in the following investment strategies: U.S. convertible and volatility
arbitrage, U.S. and European convertible credit and capital structure opportunities, Asia arbitrage, statistical arbitrage, long/short equity, credit opportunities, global macro, and merger arbitrage.
(b) Investment fund employs a research-driven, bottom-up investment process that involves extensive qualitative and quantitative analysis that incorporates international relationships and expertise across capital structures, industries and geographies. The fund benefits from its ability to opportunistically allocate capital among its underlying strategies: merger arbitrage, long/short equity special situations, corporate credit, convertible/derivative arbitrage and structured credit.
Financial Instruments: The carrying values of the Foundation’s other financial instruments, which include cash, pledges receivable, accounts payable, accrued expenses, deferred special events income, agency funds, line of credit borrowings, and notes payable approximate fair value due to the maturity dates and current market conditions.
NOTE 5 - INVESTMENTS Investments, including assets restricted for permanent endowment and property renovation, consisted of the following at June 30, 2013 and 2012: 2013 2012 Cost Fair Value Cost Fair Value Certificates of deposit $ 2,946,742 $ 2,931,926 $ 3,886,448 $ 3,898,297 Government obligations 370,590 377,476 626,104 657,875 Mutual funds - fixed income 13,057,075 13,181,460 12,287,635 13,056,332 Mutual funds - equities 12,627,146 14,959,515 13,876,764 14,778,591 Exchange traded funds - fixed income 11,037 11,201 11,037 11,970 Exchange traded funds - equities 811,273 772,568 20,808 23,543 Corporate bonds 71,241 77,026 86,469 94,594 Common stocks 583,337 805,907 645,220 777,390 Risk reduction assets 1,925,000 1,896,252 Total Investments $32,403,441 $35,013,331 $31,440,485 $33,298,592
19
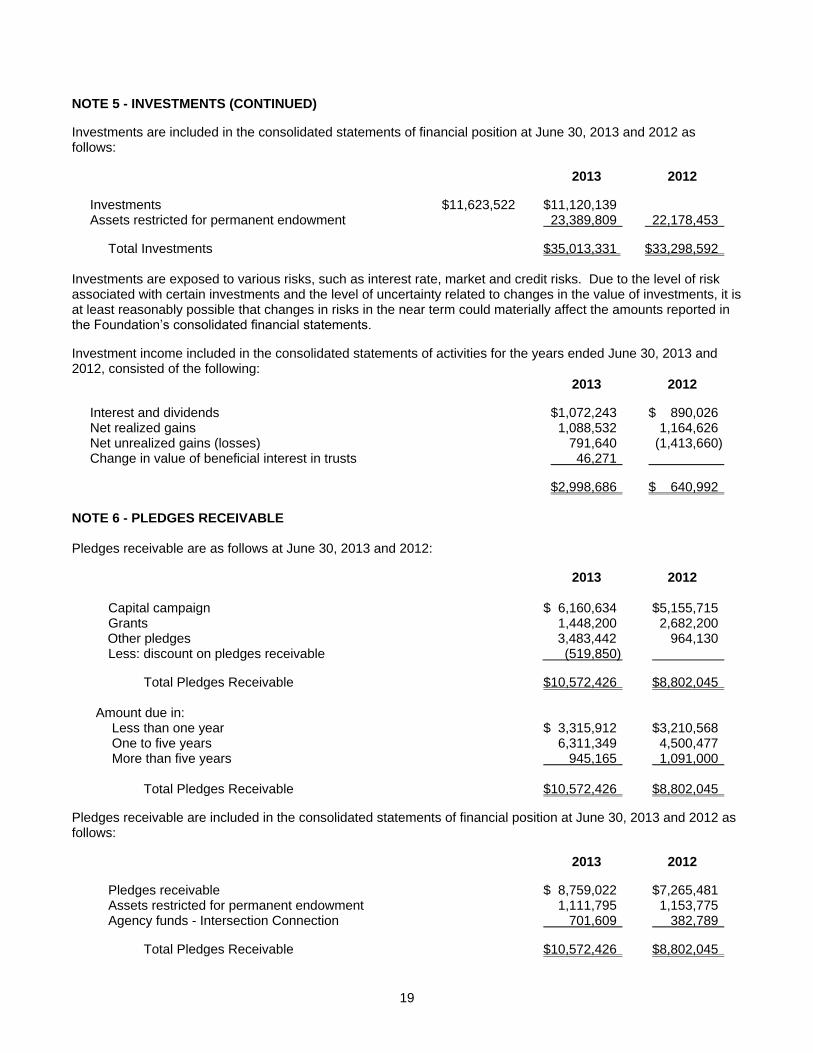
NOTE 5 - INVESTMENTS (CONTINUED) Investments are included in the consolidated statements of financial position at June 30, 2013 and 2012 as follows: 2013 2012 Investments $11,623,522 $11,120,139 Assets restricted for permanent endowment 23,389,809 22,178,453 Total Investments $35,013,331 $33,298,592 Investments are exposed to various risks, such as interest rate, market and credit risks. Due to the level of risk associated with certain investments and the level of uncertainty related to changes in the value of investments, it is at least reasonably possible that changes in risks in the near term could materially affect the amounts reported in the Foundation’s consolidated financial statements. Investment income included in the consolidated statements of activities for the years ended June 30, 2013 and 2012, consisted of the following:
2013 2012 Interest and dividends $1,072,243 $ 890,026 Net realized gains 1,088,532 1,164,626 Net unrealized gains (losses) 791,640 (1,413,660) Change in value of beneficial interest in trusts 46,271 $2,998,686 $ 640,992
NOTE 6 - PLEDGES RECEIVABLE Pledges receivable are as follows at June 30, 2013 and 2012: 2013 2012 Capital campaign $ 6,160,634 $5,155,715 Grants 1,448,200 2,682,200 Other pledges 3,483,442 964,130
Less: discount on pledges receivable (519,850) Total Pledges Receivable $10,572,426 $8,802,045
Amount due in: Less than one year $ 3,315,912 $3,210,568 One to five years 6,311,349 4,500,477 More than five years 945,165 1,091,000
Total Pledges Receivable $10,572,426 $8,802,045
Pledges receivable are included in the consolidated statements of financial position at June 30, 2013 and 2012 as follows: 2013 2012 Pledges receivable $ 8,759,022 $7,265,481 Assets restricted for permanent endowment 1,111,795 1,153,775 Agency funds - Intersection Connection 701,609 382,789 Total Pledges Receivable $10,572,426 $8,802,045
20
NOTE 7 - NOTE RECEIVABLE
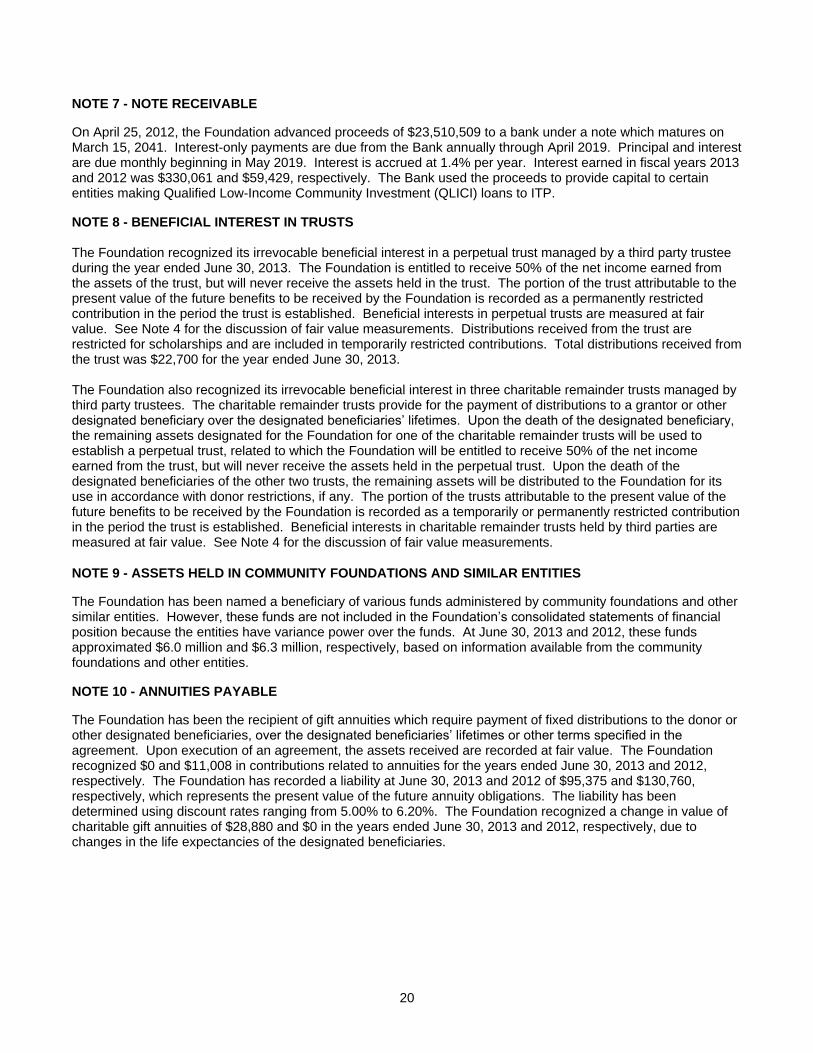
On April 25, 2012, the Foundation advanced proceeds of $23,510,509 to a bank under a note which matures on March 15, 2041. Interest-only payments are due from the Bank annually through April 2019. Principal and interest are due monthly beginning in May 2019. Interest is accrued at 1.4% per year. Interest earned in fiscal years 2013 and 2012 was $330,061 and $59,429, respectively. The Bank used the proceeds to provide capital to certain entities making Qualified Low-Income Community Investment (QLICI) loans to ITP. NOTE 8 - BENEFICIAL INTEREST IN TRUSTS The Foundation recognized its irrevocable beneficial interest in a perpetual trust managed by a third party trustee during the year ended June 30, 2013. The Foundation is entitled to receive 50% of the net income earned from the assets of the trust, but will never receive the assets held in the trust. The portion of the trust attributable to the present value of the future benefits to be received by the Foundation is recorded as a permanently restricted contribution in the period the trust is established. Beneficial interests in perpetual trusts are measured at fair value. See Note 4 for the discussion of fair value measurements. Distributions received from the trust are restricted for scholarships and are included in temporarily restricted contributions. Total distributions received from the trust was $22,700 for the year ended June 30, 2013. The Foundation also recognized its irrevocable beneficial interest in three charitable remainder trusts managed by third party trustees. The charitable remainder trusts provide for the payment of distributions to a grantor or other designated beneficiary over the designated beneficiaries’ lifetimes. Upon the death of the designated beneficiary, the remaining assets designated for the Foundation for one of the charitable remainder trusts will be used to establish a perpetual trust, related to which the Foundation will be entitled to receive 50% of the net income earned from the trust, but will never receive the assets held in the perpetual trust. Upon the death of the designated beneficiaries of the other two trusts, the remaining assets will be distributed to the Foundation for its use in accordance with donor restrictions, if any. The portion of the trusts attributable to the present value of the future benefits to be received by the Foundation is recorded as a temporarily or permanently restricted contribution in the period the trust is established. Beneficial interests in charitable remainder trusts held by third parties are measured at fair value. See Note 4 for the discussion of fair value measurements.
NOTE 9 - ASSETS HELD IN COMMUNITY FOUNDATIONS AND SIMILAR ENTITIES The Foundation has been named a beneficiary of various funds administered by community foundations and other similar entities. However, these funds are not included in the Foundation’s consolidated statements of financial position because the entities have variance power over the funds. At June 30, 2013 and 2012, these funds approximated $6.0 million and $6.3 million, respectively, based on information available from the community foundations and other entities. NOTE 10 - ANNUITIES PAYABLE The Foundation has been the recipient of gift annuities which require payment of fixed distributions to the donor or other designated beneficiaries, over the designated beneficiaries’ lifetimes or other terms specified in the agreement. Upon execution of an agreement, the assets received are recorded at fair value. The Foundation recognized $0 and $11,008 in contributions related to annuities for the years ended June 30, 2013 and 2012, respectively. The Foundation has recorded a liability at June 30, 2013 and 2012 of $95,375 and $130,760, respectively, which represents the present value of the future annuity obligations. The liability has been determined using discount rates ranging from 5.00% to 6.20%. The Foundation recognized a change in value of charitable gift annuities of $28,880 and $0 in the years ended June 30, 2013 and 2012, respectively, due to changes in the life expectancies of the designated beneficiaries.
21
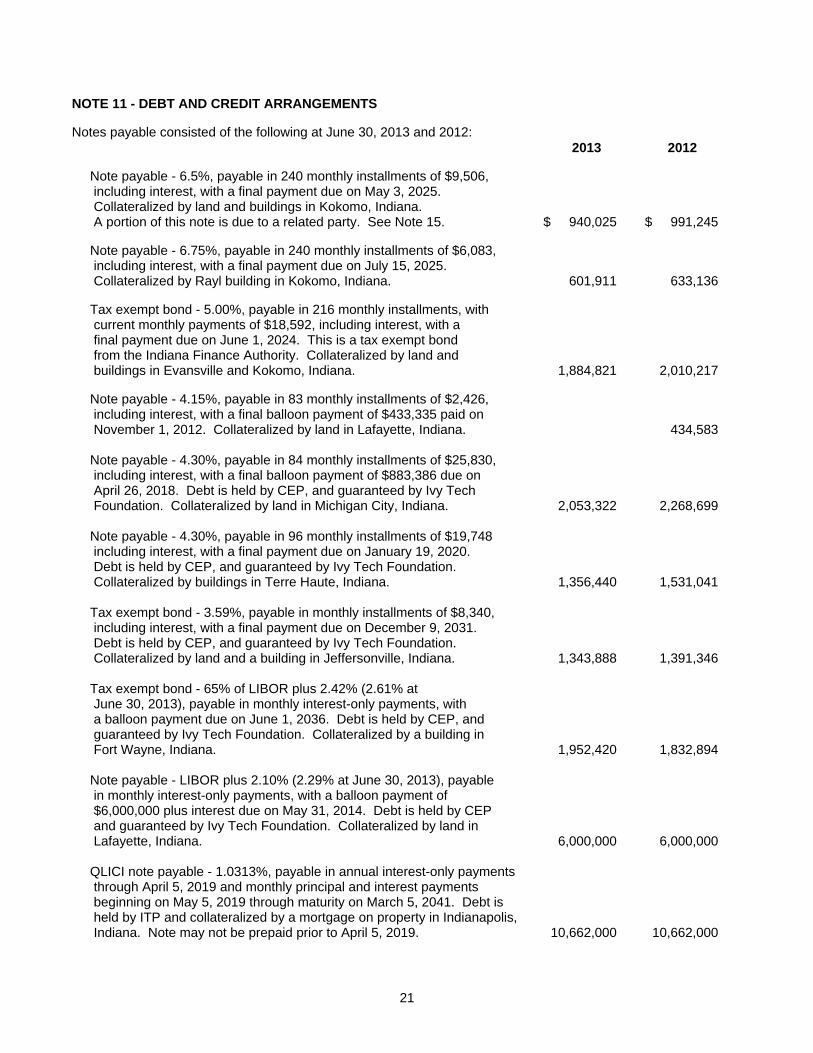
NOTE 11 - DEBT AND CREDIT ARRANGEMENTS Notes payable consisted of the following at June 30, 2013 and 2012:
2013 2012 Note payable - 6.5%, payable in 240 monthly installments of $9,506, including interest, with a final payment due on May 3, 2025. Collateralized by land and buildings in Kokomo, Indiana. A portion of this note is due to a related party. See Note 15. $ 940,025 $ 991,245 Note payable - 6.75%, payable in 240 monthly installments of $6,083, including interest, with a final payment due on July 15, 2025. Collateralized by Rayl building in Kokomo, Indiana. 601,911 633,136 Tax exempt bond - 5.00%, payable in 216 monthly installments, with current monthly payments of $18,592, including interest, with a final payment due on June 1, 2024. This is a tax exempt bond from the Indiana Finance Authority. Collateralized by land and buildings in Evansville and Kokomo, Indiana. 1,884,821 2,010,217 Note payable - 4.15%, payable in 83 monthly installments of $2,426, including interest, with a final balloon payment of $433,335 paid on November 1, 2012. Collateralized by land in Lafayette, Indiana. 434,583 Note payable - 4.30%, payable in 84 monthly installments of $25,830, including interest, with a final balloon payment of $883,386 due on April 26, 2018. Debt is held by CEP, and guaranteed by Ivy Tech Foundation. Collateralized by land in Michigan City, Indiana. 2,053,322 2,268,699 Note payable - 4.30%, payable in 96 monthly installments of $19,748 including interest, with a final payment due on January 19, 2020. Debt is held by CEP, and guaranteed by Ivy Tech Foundation. Collateralized by buildings in Terre Haute, Indiana. 1,356,440 1,531,041
Tax exempt bond - 3.59%, payable in monthly installments of $8,340, including interest, with a final payment due on December 9, 2031. Debt is held by CEP, and guaranteed by Ivy Tech Foundation. Collateralized by land and a building in Jeffersonville, Indiana. 1,343,888 1,391,346 Tax exempt bond - 65% of LIBOR plus 2.42% (2.61% at June 30, 2013), payable in monthly interest-only payments, with a balloon payment due on June 1, 2036. Debt is held by CEP, and guaranteed by Ivy Tech Foundation. Collateralized by a building in Fort Wayne, Indiana. 1,952,420 1,832,894 Note payable - LIBOR plus 2.10% (2.29% at June 30, 2013), payable in monthly interest-only payments, with a balloon payment of $6,000,000 plus interest due on May 31, 2014. Debt is held by CEP and guaranteed by Ivy Tech Foundation. Collateralized by land in Lafayette, Indiana. 6,000,000 6,000,000 QLICI note payable - 1.0313%, payable in annual interest-only payments through April 5, 2019 and monthly principal and interest payments beginning on May 5, 2019 through maturity on March 5, 2041. Debt is held by ITP and collateralized by a mortgage on property in Indianapolis, Indiana. Note may not be prepaid prior to April 5, 2019. 10,662,000 10,662,000
22
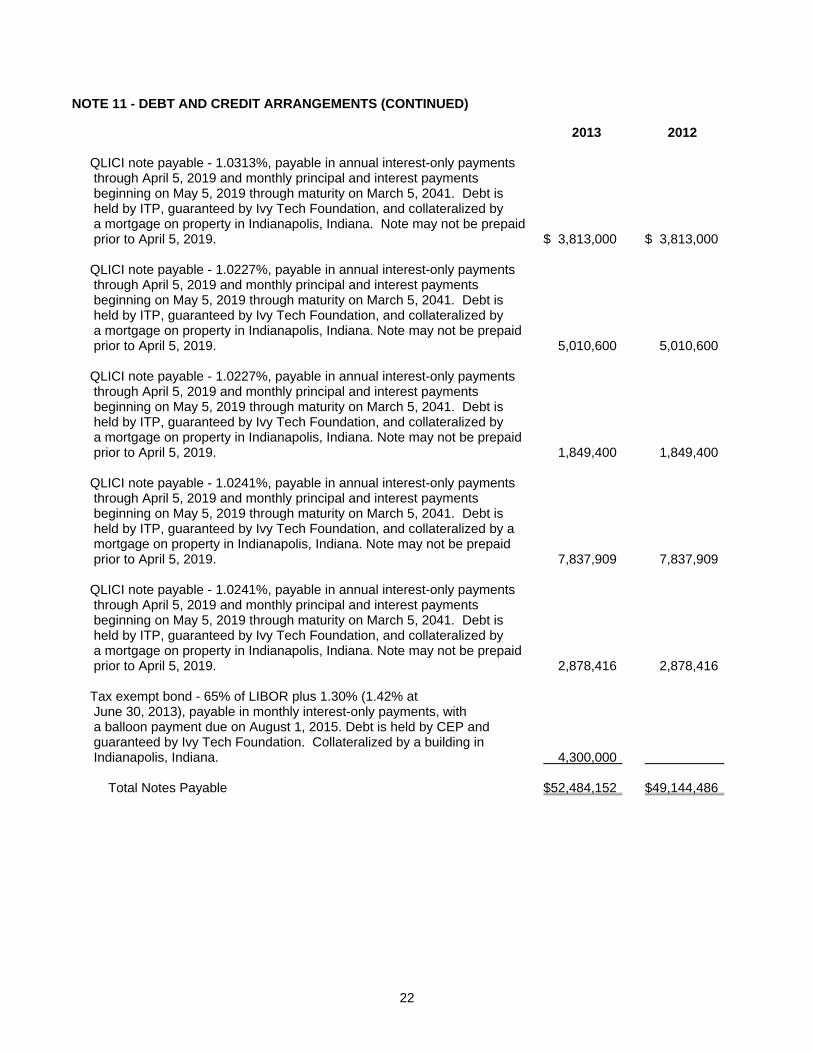
NOTE 11 - DEBT AND CREDIT ARRANGEMENTS (CONTINUED) 2013 2012 QLICI note payable - 1.0313%, payable in annual interest-only payments through April 5, 2019 and monthly principal and interest payments beginning on May 5, 2019 through maturity on March 5, 2041. Debt is held by ITP, guaranteed by Ivy Tech Foundation, and collateralized by a mortgage on property in Indianapolis, Indiana. Note may not be prepaid prior to April 5, 2019. $ 3,813,000 $ 3,813,000 QLICI note payable - 1.0227%, payable in annual interest-only payments through April 5, 2019 and monthly principal and interest payments beginning on May 5, 2019 through maturity on March 5, 2041. Debt is held by ITP, guaranteed by Ivy Tech Foundation, and collateralized by a mortgage on property in Indianapolis, Indiana. Note may not be prepaid prior to April 5, 2019. 5,010,600 5,010,600 QLICI note payable - 1.0227%, payable in annual interest-only payments through April 5, 2019 and monthly principal and interest payments beginning on May 5, 2019 through maturity on March 5, 2041. Debt is held by ITP, guaranteed by Ivy Tech Foundation, and collateralized by a mortgage on property in Indianapolis, Indiana. Note may not be prepaid prior to April 5, 2019. 1,849,400 1,849,400 QLICI note payable - 1.0241%, payable in annual interest-only payments through April 5, 2019 and monthly principal and interest payments beginning on May 5, 2019 through maturity on March 5, 2041. Debt is held by ITP, guaranteed by Ivy Tech Foundation, and collateralized by a mortgage on property in Indianapolis, Indiana. Note may not be prepaid prior to April 5, 2019. 7,837,909 7,837,909 QLICI note payable - 1.0241%, payable in annual interest-only payments through April 5, 2019 and monthly principal and interest payments beginning on May 5, 2019 through maturity on March 5, 2041. Debt is held by ITP, guaranteed by Ivy Tech Foundation, and collateralized by a mortgage on property in Indianapolis, Indiana. Note may not be prepaid prior to April 5, 2019. 2,878,416 2,878,416 Tax exempt bond - 65% of LIBOR plus 1.30% (1.42% at June 30, 2013), payable in monthly interest-only payments, with a balloon payment due on August 1, 2015. Debt is held by CEP and guaranteed by Ivy Tech Foundation. Collateralized by a building in Indianapolis, Indiana. 4,300,000 Total Notes Payable $52,484,152 $49,144,486
23
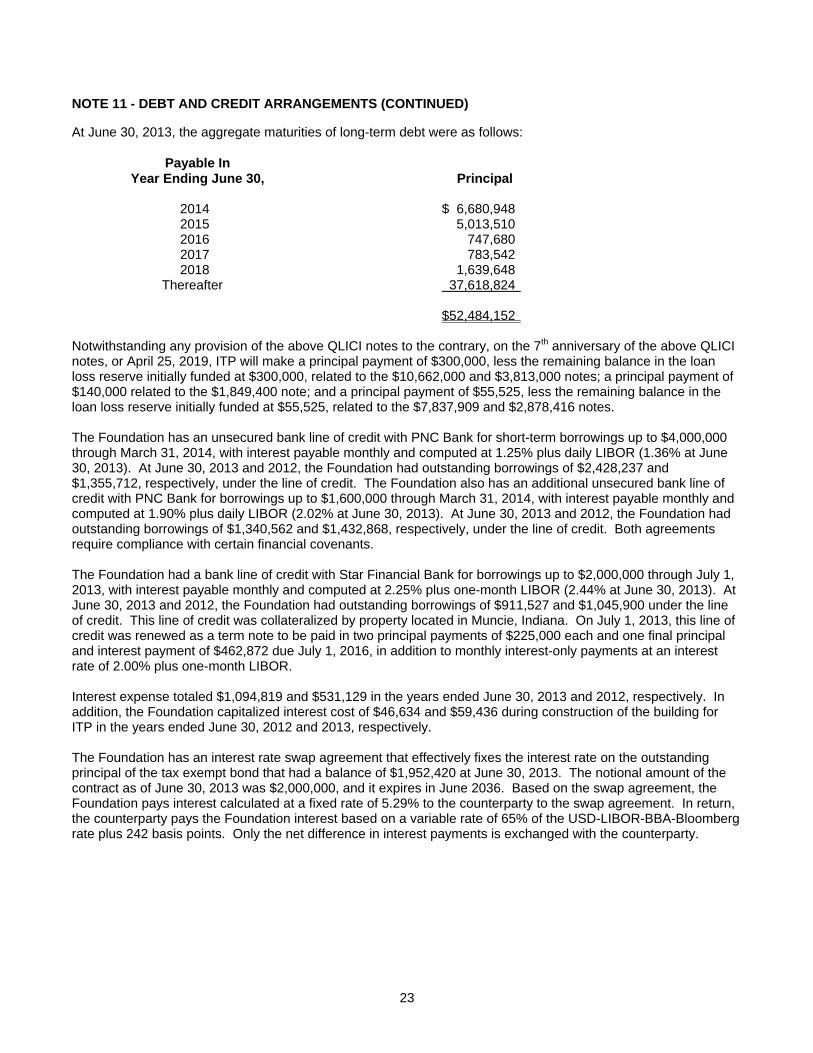
NOTE 11 - DEBT AND CREDIT ARRANGEMENTS (CONTINUED) At June 30, 2013, the aggregate maturities of long-term debt were as follows:
Payable In Year Ending June 30, Principal 2014 $ 6,680,948 2015 5,013,510 2016 747,680 2017 783,542 2018 1,639,648 Thereafter 37,618,824 $52,484,152 Notwithstanding any provision of the above QLICI notes to the contrary, on the 7th anniversary of the above QLICI notes, or April 25, 2019, ITP will make a principal payment of $300,000, less the remaining balance in the loan loss reserve initially funded at $300,000, related to the $10,662,000 and $3,813,000 notes; a principal payment of $140,000 related to the $1,849,400 note; and a principal payment of $55,525, less the remaining balance in the loan loss reserve initially funded at $55,525, related to the $7,837,909 and $2,878,416 notes. The Foundation has an unsecured bank line of credit with PNC Bank for short-term borrowings up to $4,000,000 through March 31, 2014, with interest payable monthly and computed at 1.25% plus daily LIBOR (1.36% at June 30, 2013). At June 30, 2013 and 2012, the Foundation had outstanding borrowings of $2,428,237 and $1,355,712, respectively, under the line of credit. The Foundation also has an additional unsecured bank line of credit with PNC Bank for borrowings up to $1,600,000 through March 31, 2014, with interest payable monthly and computed at 1.90% plus daily LIBOR (2.02% at June 30, 2013). At June 30, 2013 and 2012, the Foundation had outstanding borrowings of $1,340,562 and $1,432,868, respectively, under the line of credit. Both agreements require compliance with certain financial covenants. The Foundation had a bank line of credit with Star Financial Bank for borrowings up to $2,000,000 through July 1, 2013, with interest payable monthly and computed at 2.25% plus one-month LIBOR (2.44% at June 30, 2013). At June 30, 2013 and 2012, the Foundation had outstanding borrowings of $911,527 and $1,045,900 under the line of credit. This line of credit was collateralized by property located in Muncie, Indiana. On July 1, 2013, this line of credit was renewed as a term note to be paid in two principal payments of $225,000 each and one final principal and interest payment of $462,872 due July 1, 2016, in addition to monthly interest-only payments at an interest rate of 2.00% plus one-month LIBOR. Interest expense totaled $1,094,819 and $531,129 in the years ended June 30, 2013 and 2012, respectively. In addition, the Foundation capitalized interest cost of $46,634 and $59,436 during construction of the building for ITP in the years ended June 30, 2012 and 2013, respectively. The Foundation has an interest rate swap agreement that effectively fixes the interest rate on the outstanding principal of the tax exempt bond that had a balance of $1,952,420 at June 30, 2013. The notional amount of the contract as of June 30, 2013 was $2,000,000, and it expires in June 2036. Based on the swap agreement, the Foundation pays interest calculated at a fixed rate of 5.29% to the counterparty to the swap agreement. In return, the counterparty pays the Foundation interest based on a variable rate of 65% of the USD-LIBOR-BBA-Bloomberg rate plus 242 basis points. Only the net difference in interest payments is exchanged with the counterparty.
24
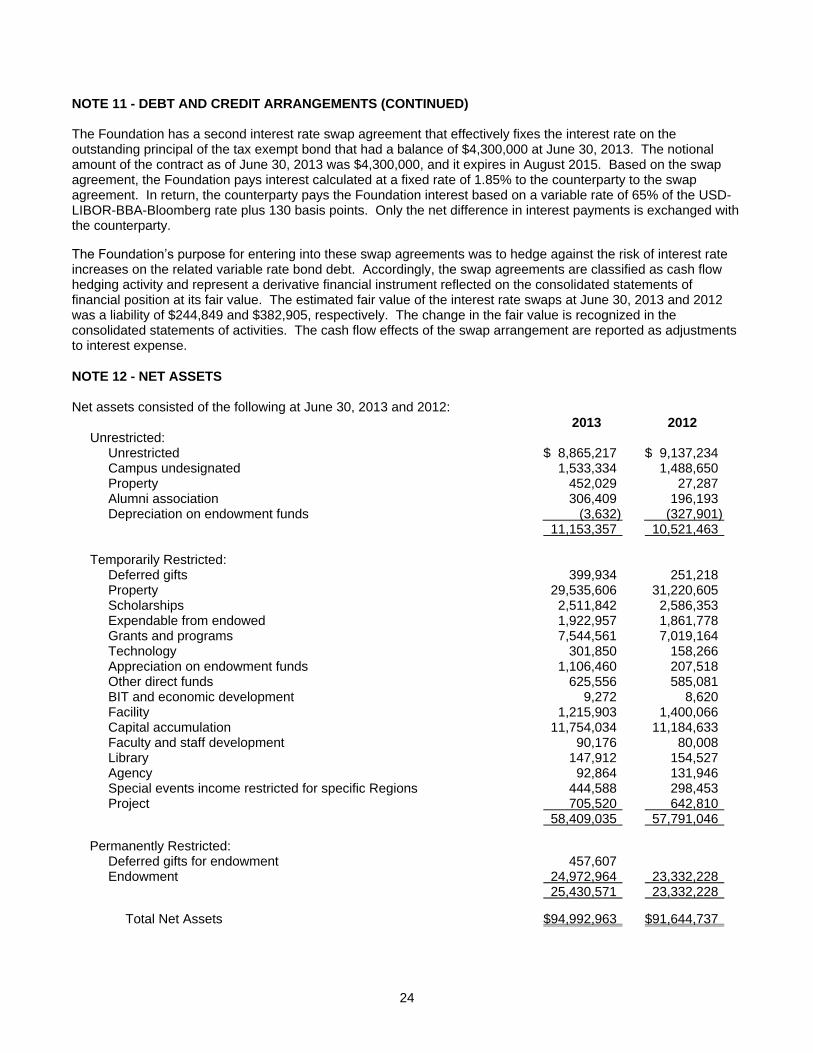
NOTE 11 - DEBT AND CREDIT ARRANGEMENTS (CONTINUED) The Foundation has a second interest rate swap agreement that effectively fixes the interest rate on the outstanding principal of the tax exempt bond that had a balance of $4,300,000 at June 30, 2013. The notional amount of the contract as of June 30, 2013 was $4,300,000, and it expires in August 2015. Based on the swap agreement, the Foundation pays interest calculated at a fixed rate of 1.85% to the counterparty to the swap agreement. In return, the counterparty pays the Foundation interest based on a variable rate of 65% of the USD-LIBOR-BBA-Bloomberg rate plus 130 basis points. Only the net difference in interest payments is exchanged with the counterparty. The Foundation’s purpose for entering into these swap agreements was to hedge against the risk of interest rate increases on the related variable rate bond debt. Accordingly, the swap agreements are classified as cash flow hedging activity and represent a derivative financial instrument reflected on the consolidated statements of financial position at its fair value. The estimated fair value of the interest rate swaps at June 30, 2013 and 2012 was a liability of $244,849 and $382,905, respectively. The change in the fair value is recognized in the consolidated statements of activities. The cash flow effects of the swap arrangement are reported as adjustments to interest expense.
NOTE 12 - NET ASSETS Net assets consisted of the following at June 30, 2013 and 2012:
2013 2012 Unrestricted: Unrestricted $ 8,865,217 $ 9,137,234 Campus undesignated 1,533,334 1,488,650 Property 452,029 27,287 Alumni association 306,409 196,193 Depreciation on endowment funds (3,632) (327,901) 11,153,357 10,521,463 Temporarily Restricted: Deferred gifts 399,934 251,218 Property 29,535,606 31,220,605 Scholarships 2,511,842 2,586,353 Expendable from endowed 1,922,957 1,861,778 Grants and programs 7,544,561 7,019,164 Technology 301,850 158,266 Appreciation on endowment funds 1,106,460 207,518 Other direct funds 625,556 585,081 BIT and economic development 9,272 8,620 Facility 1,215,903 1,400,066 Capital accumulation 11,754,034 11,184,633 Faculty and staff development 90,176 80,008 Library 147,912 154,527 Agency 92,864 131,946 Special events income restricted for specific Regions 444,588 298,453 Project 705,520 642,810 58,409,035 57,791,046
Permanently Restricted:
Deferred gifts for endowment 457,607 Endowment 24,972,964 23,332,228 25,430,571 23,332,228 Total Net Assets $94,992,963 $91,644,737
25
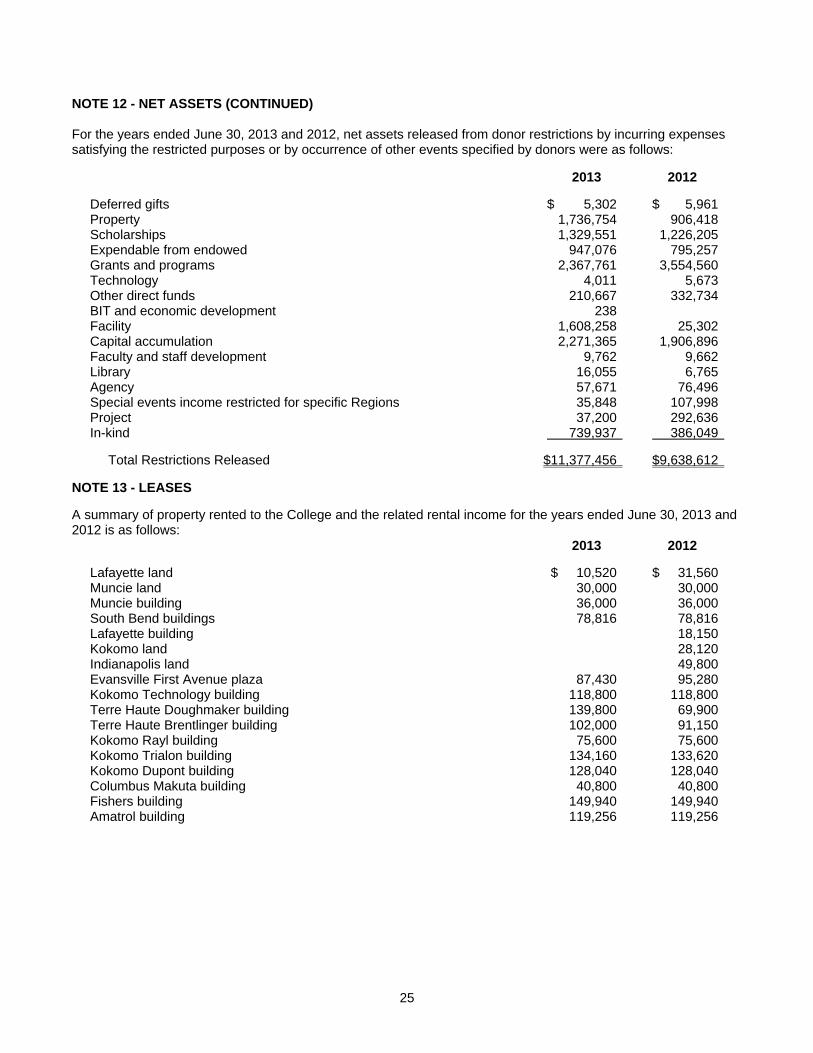
NOTE 12 - NET ASSETS (CONTINUED) For the years ended June 30, 2013 and 2012, net assets released from donor restrictions by incurring expenses satisfying the restricted purposes or by occurrence of other events specified by donors were as follows: 2013 2012 Deferred gifts $ 5,302 $ 5,961 Property 1,736,754 906,418 Scholarships 1,329,551 1,226,205 Expendable from endowed 947,076 795,257 Grants and programs 2,367,761 3,554,560 Technology 4,011 5,673 Other direct funds 210,667 332,734 BIT and economic development 238 Facility 1,608,258 25,302 Capital accumulation 2,271,365 1,906,896 Faculty and staff development 9,762 9,662 Library 16,055 6,765 Agency 57,671 76,496 Special events income restricted for specific Regions 35,848 107,998 Project 37,200 292,636 In-kind 739,937 386,049 Total Restrictions Released $11,377,456 $9,638,612 NOTE 13 - LEASES A summary of property rented to the College and the related rental income for the years ended June 30, 2013 and 2012 is as follows:
2013 2012 Lafayette land $ 10,520 $ 31,560 Muncie land 30,000 30,000 Muncie building 36,000 36,000 South Bend buildings 78,816 78,816 Lafayette building 18,150 Kokomo land 28,120 Indianapolis land 49,800 Evansville First Avenue plaza 87,430 95,280 Kokomo Technology building 118,800 118,800 Terre Haute Doughmaker building 139,800 69,900 Terre Haute Brentlinger building 102,000 91,150 Kokomo Rayl building 75,600 75,600 Kokomo Trialon building 134,160 133,620 Kokomo Dupont building 128,040 128,040 Columbus Makuta building 40,800 40,800 Fishers building 149,940 149,940 Amatrol building 119,256 119,256
26
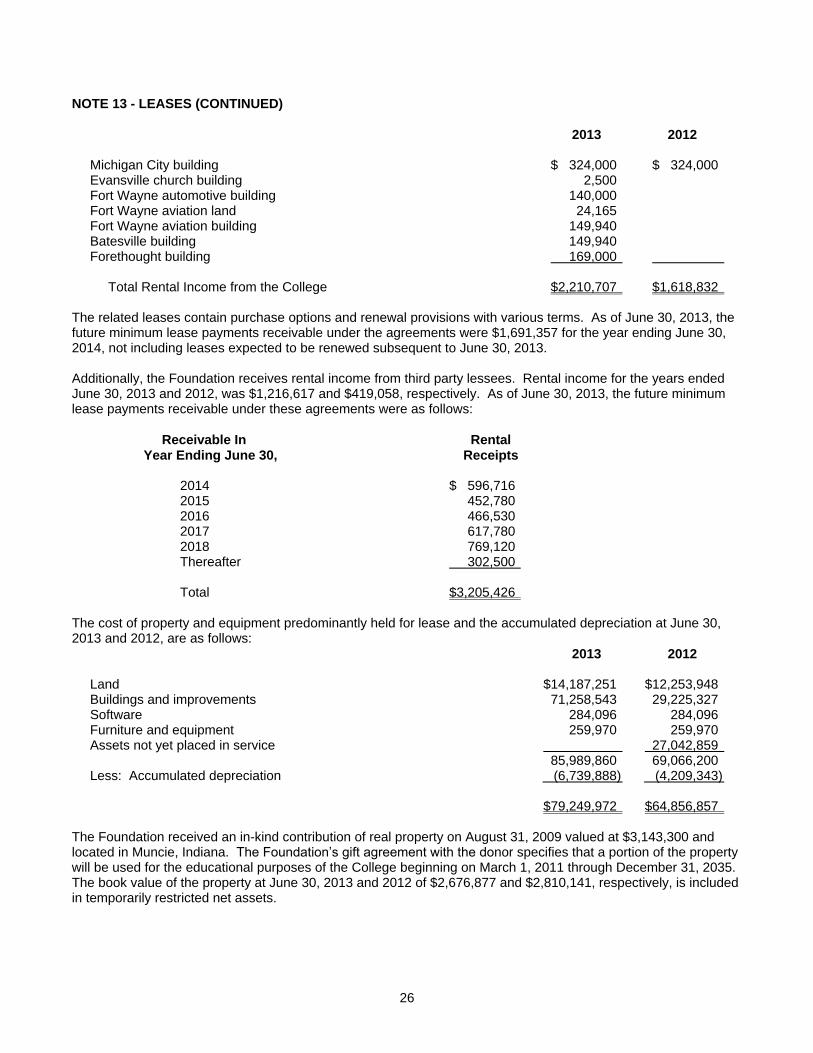
NOTE 13 - LEASES (CONTINUED) 2013 2012
Michigan City building $ 324,000 $ 324,000 Evansville church building 2,500
Fort Wayne automotive building 140,000 Fort Wayne aviation land 24,165 Fort Wayne aviation building 149,940 Batesville building 149,940 Forethought building 169,000 Total Rental Income from the College $2,210,707 $1,618,832 The related leases contain purchase options and renewal provisions with various terms. As of June 30, 2013, the future minimum lease payments receivable under the agreements were $1,691,357 for the year ending June 30, 2014, not including leases expected to be renewed subsequent to June 30, 2013. Additionally, the Foundation receives rental income from third party lessees. Rental income for the years ended June 30, 2013 and 2012, was $1,216,617 and $419,058, respectively. As of June 30, 2013, the future minimum lease payments receivable under these agreements were as follows:
Receivable In Rental Year Ending June 30, Receipts 2014 $ 596,716 2015 452,780 2016 466,530 2017 617,780 2018 769,120 Thereafter 302,500 Total $3,205,426
The cost of property and equipment predominantly held for lease and the accumulated depreciation at June 30, 2013 and 2012, are as follows:
2013 2012 Land $14,187,251 $12,253,948 Buildings and improvements 71,258,543 29,225,327 Software 284,096 284,096 Furniture and equipment 259,970 259,970 Assets not yet placed in service 27,042,859 85,989,860 69,066,200 Less: Accumulated depreciation (6,739,888) (4,209,343) $79,249,972 $64,856,857
The Foundation received an in-kind contribution of real property on August 31, 2009 valued at $3,143,300 and located in Muncie, Indiana. The Foundation’s gift agreement with the donor specifies that a portion of the property will be used for the educational purposes of the College beginning on March 1, 2011 through December 31, 2035. The book value of the property at June 30, 2013 and 2012 of $2,676,877 and $2,810,141, respectively, is included in temporarily restricted net assets.
27
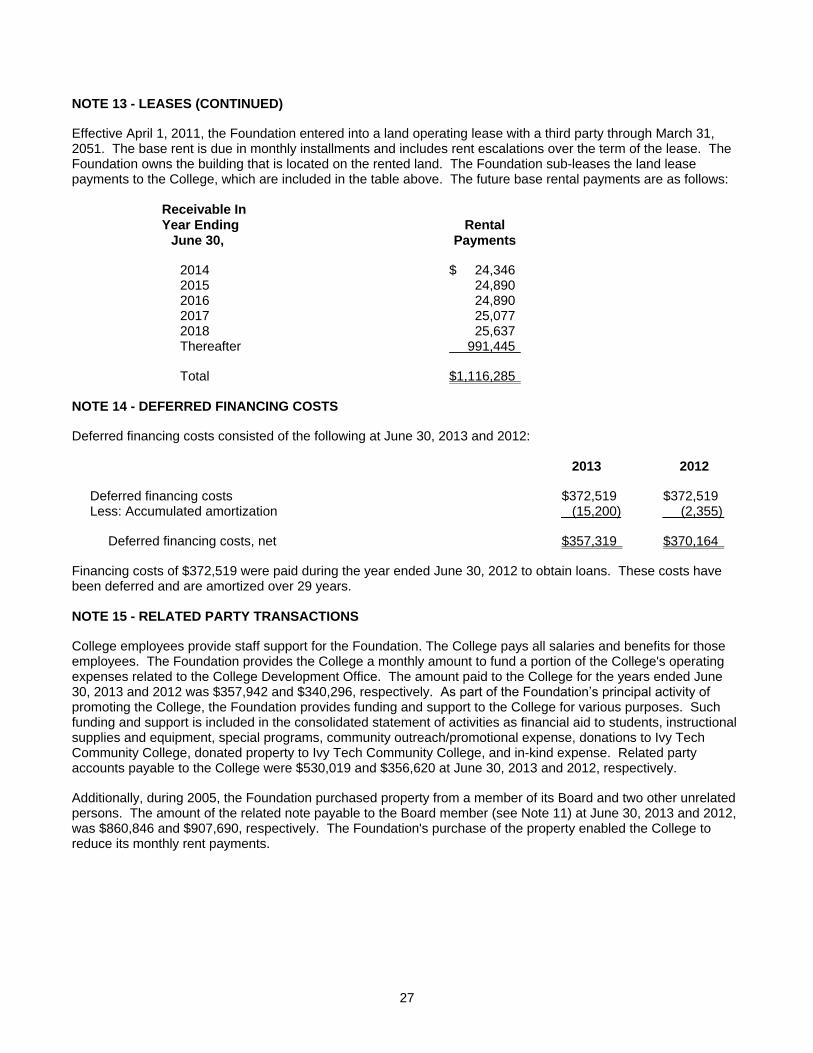
NOTE 13 - LEASES (CONTINUED) Effective April 1, 2011, the Foundation entered into a land operating lease with a third party through March 31, 2051. The base rent is due in monthly installments and includes rent escalations over the term of the lease. The Foundation owns the building that is located on the rented land. The Foundation sub-leases the land lease payments to the College, which are included in the table above. The future base rental payments are as follows:
Receivable In Year Ending Rental June 30, Payments 2014 $ 24,346 2015 24,890 2016 24,890 2017 25,077 2018 25,637 Thereafter 991,445 Total $1,116,285
NOTE 14 - DEFERRED FINANCING COSTS Deferred financing costs consisted of the following at June 30, 2013 and 2012:
2013 2012
Deferred financing costs $372,519 $372,519 Less: Accumulated amortization (15,200) (2,355)
Deferred financing costs, net $357,319 $370,164 Financing costs of $372,519 were paid during the year ended June 30, 2012 to obtain loans. These costs have been deferred and are amortized over 29 years.
NOTE 15 - RELATED PARTY TRANSACTIONS College employees provide staff support for the Foundation. The College pays all salaries and benefits for those employees. The Foundation provides the College a monthly amount to fund a portion of the College's operating expenses related to the College Development Office. The amount paid to the College for the years ended June 30, 2013 and 2012 was $357,942 and $340,296, respectively. As part of the Foundation’s principal activity of promoting the College, the Foundation provides funding and support to the College for various purposes. Such funding and support is included in the consolidated statement of activities as financial aid to students, instructional supplies and equipment, special programs, community outreach/promotional expense, donations to Ivy Tech Community College, donated property to Ivy Tech Community College, and in-kind expense. Related party accounts payable to the College were $530,019 and $356,620 at June 30, 2013 and 2012, respectively. Additionally, during 2005, the Foundation purchased property from a member of its Board and two other unrelated persons. The amount of the related note payable to the Board member (see Note 11) at June 30, 2013 and 2012, was $860,846 and $907,690, respectively. The Foundation's purchase of the property enabled the College to reduce its monthly rent payments.
28
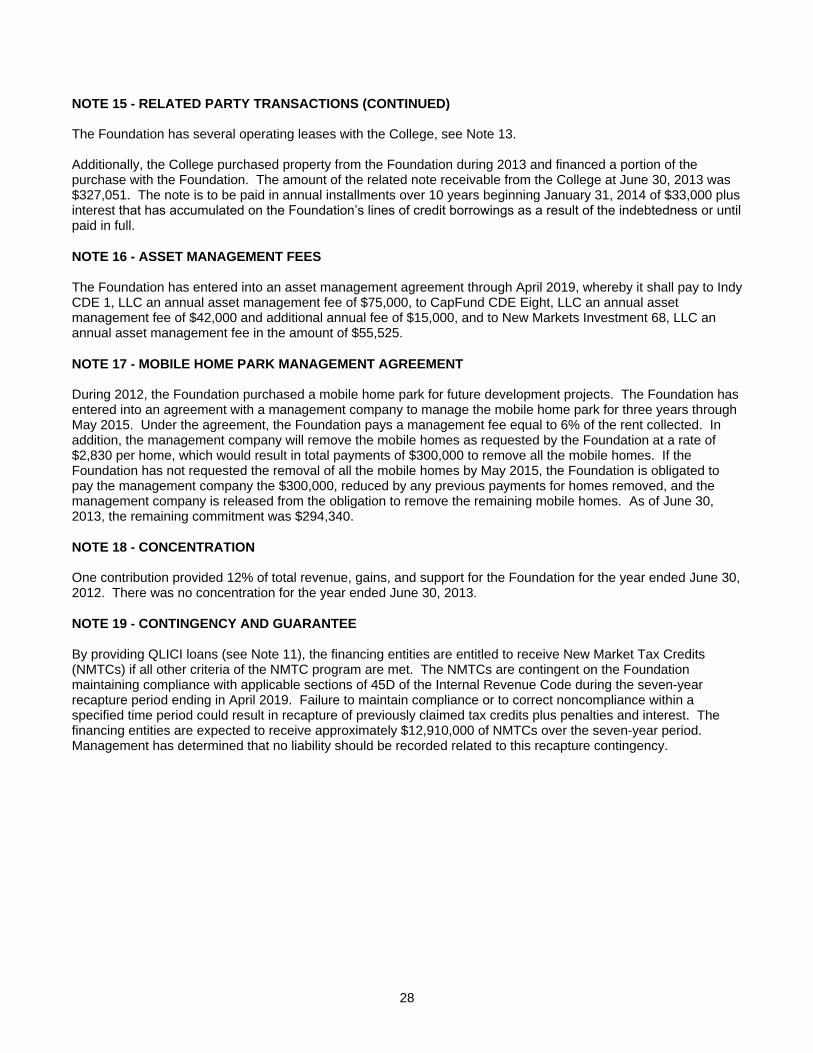
NOTE 15 - RELATED PARTY TRANSACTIONS (CONTINUED) The Foundation has several operating leases with the College, see Note 13. Additionally, the College purchased property from the Foundation during 2013 and financed a portion of the purchase with the Foundation. The amount of the related note receivable from the College at June 30, 2013 was $327,051. The note is to be paid in annual installments over 10 years beginning January 31, 2014 of $33,000 plus interest that has accumulated on the Foundation’s lines of credit borrowings as a result of the indebtedness or until paid in full.
NOTE 16 - ASSET MANAGEMENT FEES The Foundation has entered into an asset management agreement through April 2019, whereby it shall pay to Indy CDE 1, LLC an annual asset management fee of $75,000, to CapFund CDE Eight, LLC an annual asset management fee of $42,000 and additional annual fee of $15,000, and to New Markets Investment 68, LLC an annual asset management fee in the amount of $55,525.
NOTE 17 - MOBILE HOME PARK MANAGEMENT AGREEMENT During 2012, the Foundation purchased a mobile home park for future development projects. The Foundation has entered into an agreement with a management company to manage the mobile home park for three years through May 2015. Under the agreement, the Foundation pays a management fee equal to 6% of the rent collected. In addition, the management company will remove the mobile homes as requested by the Foundation at a rate of $2,830 per home, which would result in total payments of $300,000 to remove all the mobile homes. If the Foundation has not requested the removal of all the mobile homes by May 2015, the Foundation is obligated to pay the management company the $300,000, reduced by any previous payments for homes removed, and the management company is released from the obligation to remove the remaining mobile homes. As of June 30, 2013, the remaining commitment was $294,340.
NOTE 18 - CONCENTRATION One contribution provided 12% of total revenue, gains, and support for the Foundation for the year ended June 30, 2012. There was no concentration for the year ended June 30, 2013.
NOTE 19 - CONTINGENCY AND GUARANTEE By providing QLICI loans (see Note 11), the financing entities are entitled to receive New Market Tax Credits (NMTCs) if all other criteria of the NMTC program are met. The NMTCs are contingent on the Foundation maintaining compliance with applicable sections of 45D of the Internal Revenue Code during the seven-year recapture period ending in April 2019. Failure to maintain compliance or to correct noncompliance within a specified time period could result in recapture of previously claimed tax credits plus penalties and interest. The financing entities are expected to receive approximately $12,910,000 of NMTCs over the seven-year period. Management has determined that no liability should be recorded related to this recapture contingency.

CONSOLIDATING INFORMATION
29
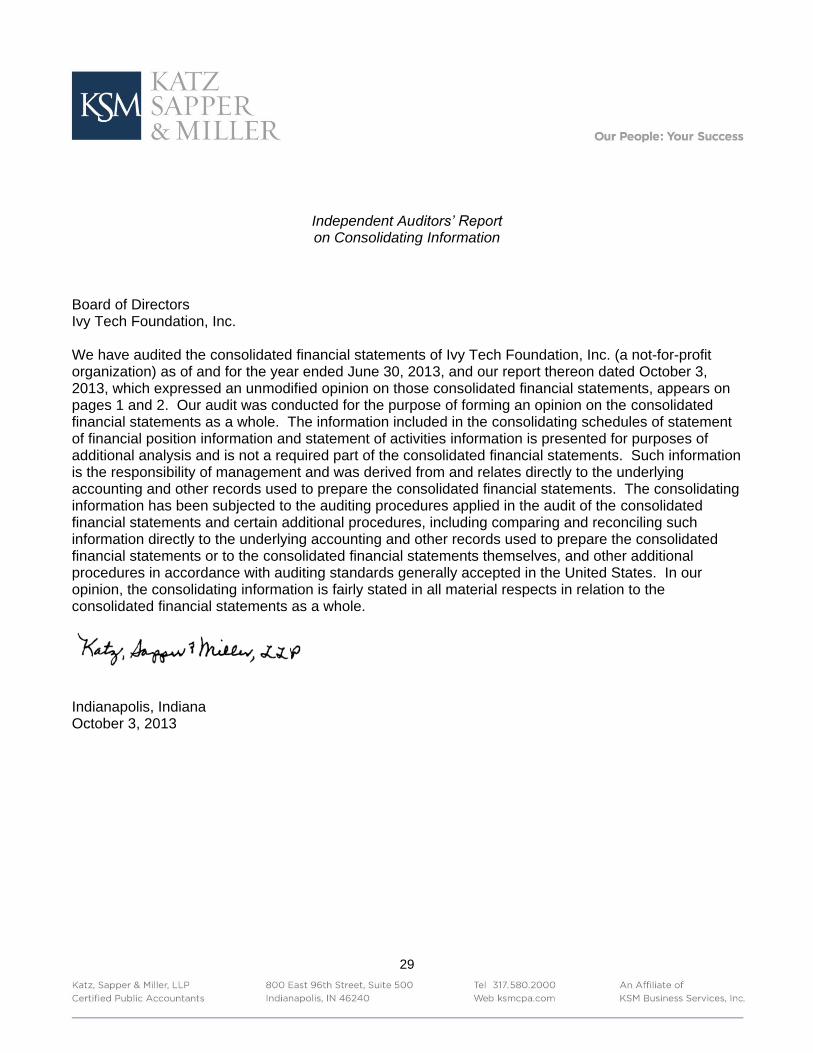
Independent Auditors’ Report on Consolidating Information
Board of Directors Ivy Tech Foundation, Inc. We have audited the consolidated financial statements of Ivy Tech Foundation, Inc. (a not-for-profit organization) as of and for the year ended June 30, 2013, and our report thereon dated October 3, 2013, which expressed an unmodified opinion on those consolidated financial statements, appears on pages 1 and 2. Our audit was conducted for the purpose of forming an opinion on the consolidated financial statements as a whole. The information included in the consolidating schedules of statement of financial position information and statement of activities information is presented for purposes of additional analysis and is not a required part of the consolidated financial statements. Such information is the responsibility of management and was derived from and relates directly to the underlying accounting and other records used to prepare the consolidated financial statements. The consolidating information has been subjected to the auditing procedures applied in the audit of the consolidated financial statements and certain additional procedures, including comparing and reconciling such information directly to the underlying accounting and other records used to prepare the consolidated financial statements or to the consolidated financial statements themselves, and other additional procedures in accordance with auditing standards generally accepted in the United States. In our opinion, the consolidating information is fairly stated in all material respects in relation to the consolidated financial statements as a whole. Indianapolis, Indiana October 3, 2013
Ivy Tech Ivy TechFoundation, Properties,
Inc. Inc.
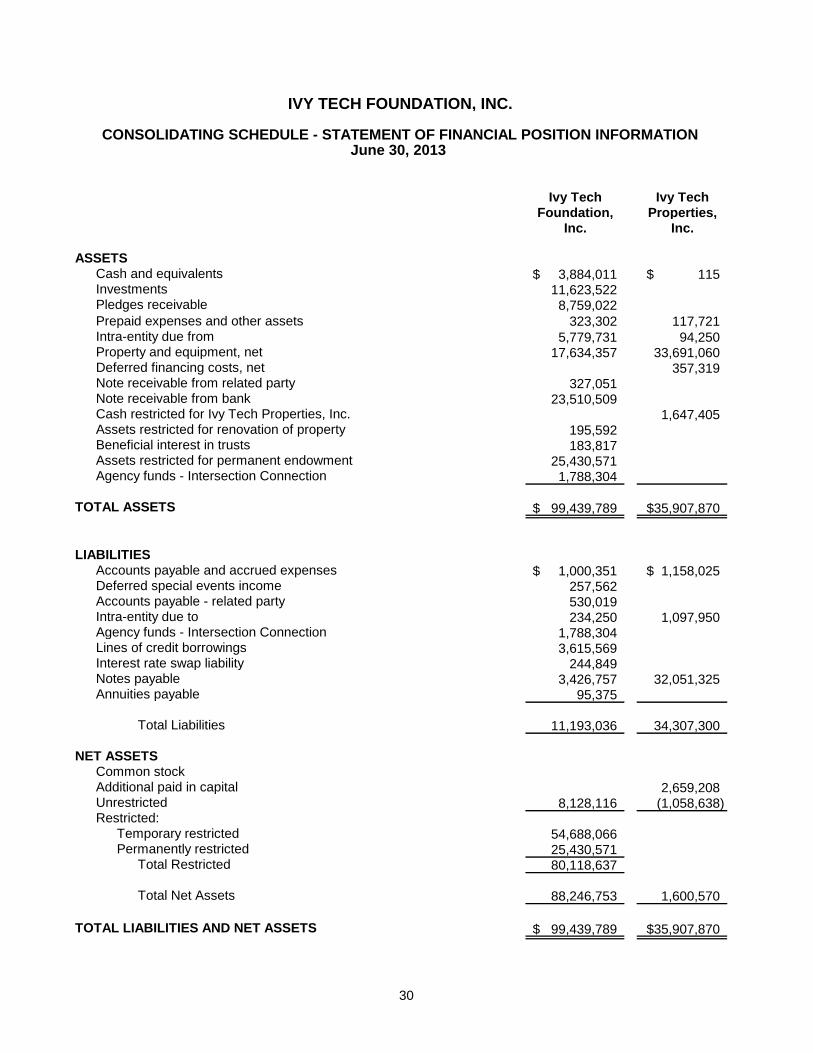
ASSETSCash and equivalents 3,884,011$ 115$ Investments 11,623,522 Pledges receivable 8,759,022
Prepaid expenses and other assets 323,302 117,721Intra-entity due from 5,779,731 94,250 Property and equipment, net 17,634,357 33,691,060Deferred financing costs, net 357,319Note receivable from related party 327,051Note receivable from bank 23,510,509Cash restricted for Ivy Tech Properties, Inc. 1,647,405Assets restricted for renovation of property 195,592Beneficial interest in trusts 183,817Assets restricted for permanent endowment 25,430,571Agency funds - Intersection Connection 1,788,304
TOTAL ASSETS 99,439,789$ 35,907,870$
LIABILITIESAccounts payable and accrued expenses 1,000,351$ 1,158,025$ Deferred special events income 257,562Accounts payable - related party 530,019Intra-entity due to 234,250 1,097,950Agency funds - Intersection Connection 1,788,304Lines of credit borrowings 3,615,569Interest rate swap liability 244,849Notes payable 3,426,757 32,051,325Annuities payable 95,375
Total Liabilities 11,193,036 34,307,300
NET ASSETSCommon stockAdditional paid in capital 2,659,208 Unrestricted 8,128,116 (1,058,638) Restricted:
Temporary restricted 54,688,066Permanently restricted 25,430,571
Total Restricted 80,118,637
Total Net Assets 88,246,753 1,600,570
TOTAL LIABILITIES AND NET ASSETS 99,439,789$ 35,907,870$
IVY TECH FOUNDATION, INC.
CONSOLIDATING SCHEDULE - STATEMENT OF FINANCIAL POSITION INFORMATIONJune 30, 2013
30
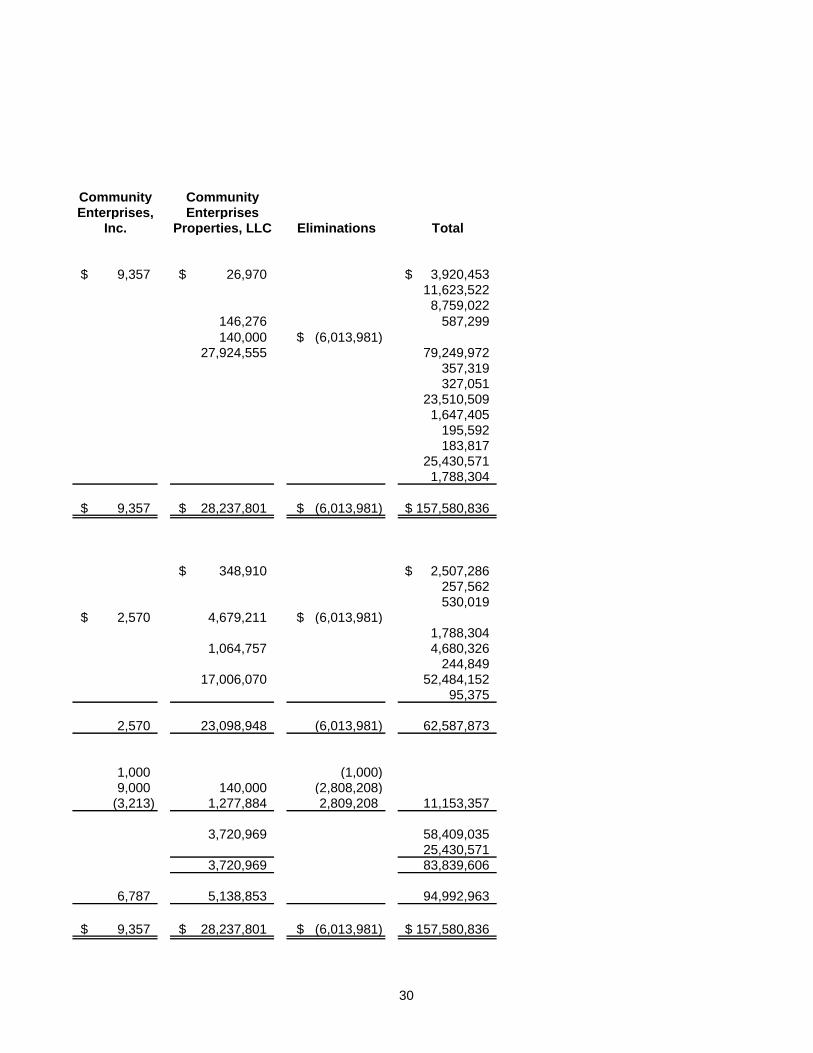
Community CommunityEnterprises, Enterprises
Inc. Properties, LLC Eliminations Total
9,357$ 26,970$ 3,920,453$ 11,623,522
8,759,022
146,276 587,299
140,000 (6,013,981)$ 27,924,555 79,249,972
357,319 327,051
23,510,509 1,647,405
195,592 183,817
25,430,571 1,788,304
9,357$ 28,237,801$ (6,013,981)$ 157,580,836$
348,910$ 2,507,286$ 257,562 530,019
2,570$ 4,679,211 (6,013,981)$ 1,788,304
1,064,757 4,680,326 244,849
17,006,070 52,484,152 95,375
2,570 23,098,948 (6,013,981) 62,587,873
1,000 (1,000) 9,000 140,000 (2,808,208)
(3,213) 1,277,884 2,809,208 11,153,357
3,720,969 58,409,035 25,430,571
3,720,969 83,839,606
6,787 5,138,853 94,992,963
9,357$ 28,237,801$ (6,013,981)$ 157,580,836$
30
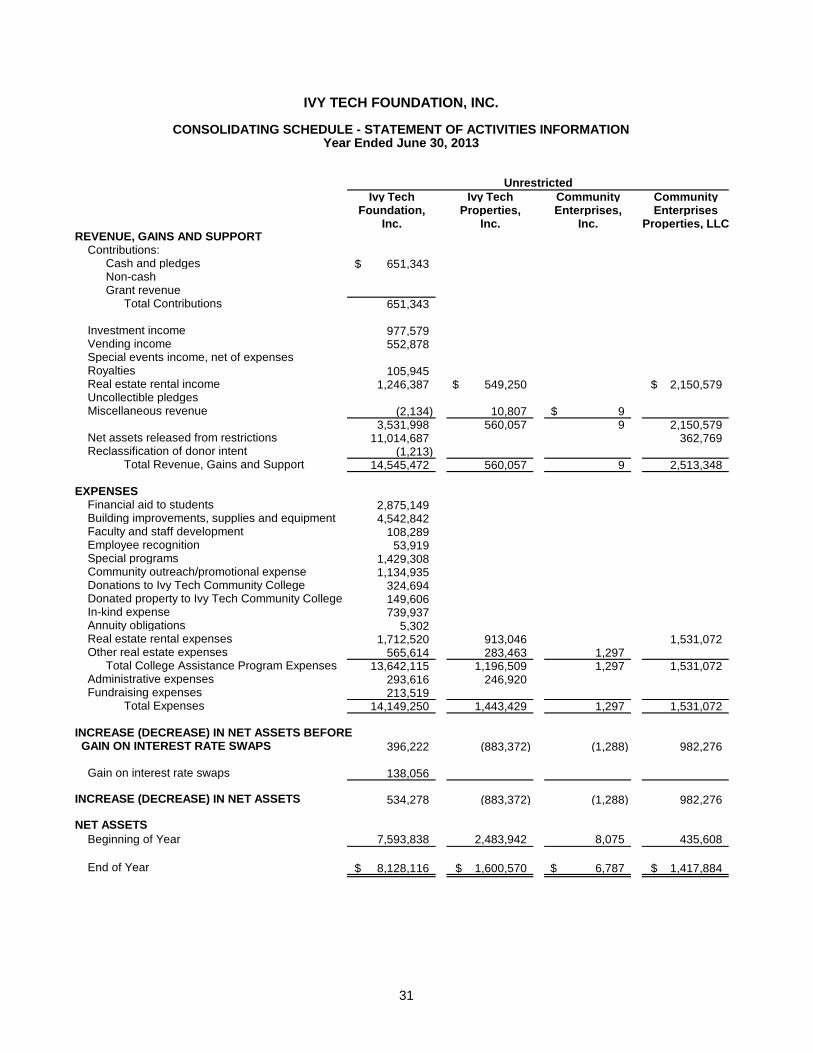
Ivy Tech Ivy Tech Community CommunityFoundation, Properties, Enterprises, Enterprises
Inc. Inc. Inc. Properties, LLCREVENUE, GAINS AND SUPPORT
Contributions:Cash and pledges 651,343$ Non-cashGrant revenue
Total Contributions 651,343
Investment income 977,579Vending income 552,878 Special events income, net of expensesRoyalties 105,945 Real estate rental income 1,246,387 549,250$ 2,150,579$ Uncollectible pledgesMiscellaneous revenue (2,134) 10,807 9$
3,531,998 560,057 9 2,150,579 Net assets released from restrictions 11,014,687 362,769 Reclassification of donor intent (1,213)
Total Revenue, Gains and Support 14,545,472 560,057 9 2,513,348
EXPENSESFinancial aid to students 2,875,149 Building improvements, supplies and equipment 4,542,842 Faculty and staff development 108,289Employee recognition 53,919Special programs 1,429,308Community outreach/promotional expense 1,134,935Donations to Ivy Tech Community College 324,694Donated property to Ivy Tech Community College 149,606 In-kind expense 739,937Annuity obligations 5,302 Real estate rental expenses 1,712,520 913,046 1,531,072Other real estate expenses 565,614 283,463 1,297
Total College Assistance Program Expenses 13,642,115 1,196,509 1,297 1,531,072 Administrative expenses 293,616 246,920Fundraising expenses 213,519
Total Expenses 14,149,250 1,443,429 1,297 1,531,072
INCREASE (DECREASE) IN NET ASSETS BEFORE GAIN ON INTEREST RATE SWAPS 396,222 (883,372) (1,288) 982,276
Gain on interest rate swaps 138,056
INCREASE (DECREASE) IN NET ASSETS 534,278 (883,372) (1,288) 982,276
NET ASSETS
Beginning of Year 7,593,838 2,483,942 8,075 435,608
End of Year 8,128,116$ 1,600,570$ 6,787$ 1,417,884$
Unrestricted
IVY TECH FOUNDATION, INC.
CONSOLIDATING SCHEDULE - STATEMENT OF ACTIVITIES INFORMATIONYear Ended June 30, 2013
31
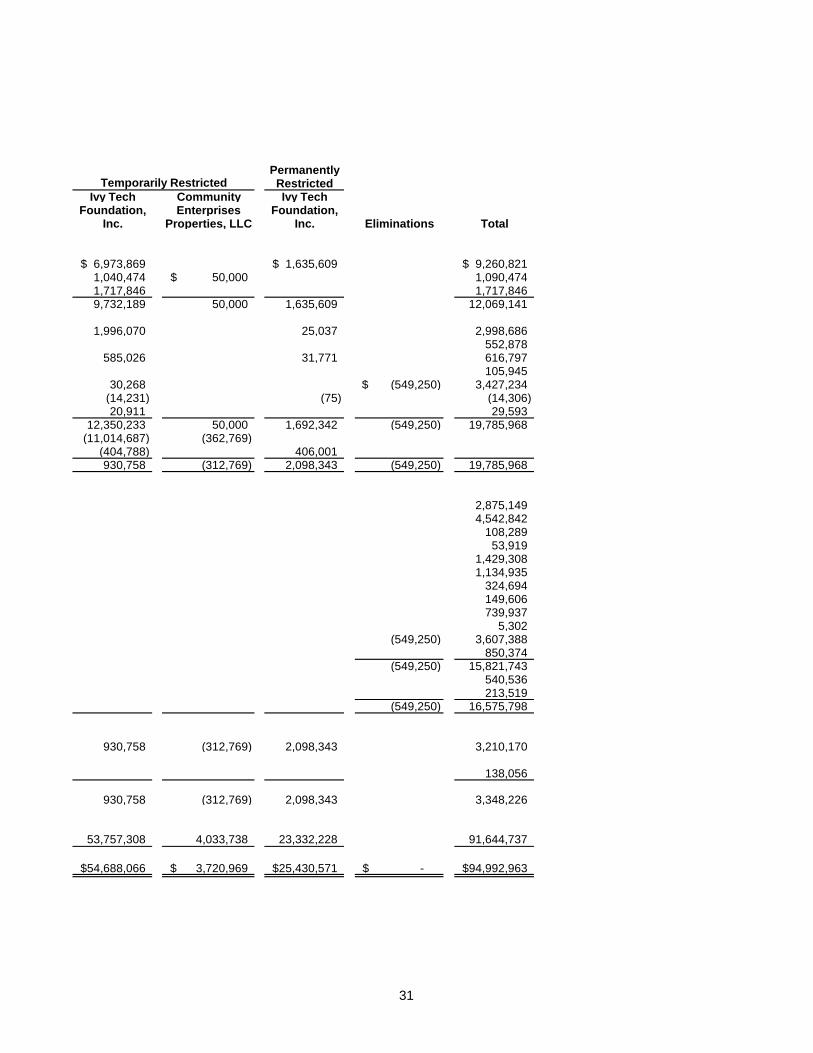
PermanentlyRestricted
Ivy Tech Community Ivy TechFoundation, Enterprises Foundation,
Inc. Properties, LLC Inc. Eliminations Total
6,973,869$ 1,635,609$ 9,260,821$ 1,040,474 50,000$ 1,090,474 1,717,846 1,717,846 9,732,189 50,000 1,635,609 12,069,141
1,996,070 25,037 2,998,686 552,878
585,026 31,771 616,797 105,945
30,268 (549,250)$ 3,427,234 (14,231) (75) (14,306) 20,911 29,593
12,350,233 50,000 1,692,342 (549,250) 19,785,968 (11,014,687) (362,769)
(404,788) 406,001 930,758 (312,769) 2,098,343 (549,250) 19,785,968
2,875,149 4,542,842
108,289 53,919
1,429,308 1,134,935
324,694 149,606 739,937
5,302 (549,250) 3,607,388
850,374 (549,250) 15,821,743
540,536 213,519
(549,250) 16,575,798
930,758 (312,769) 2,098,343 3,210,170
138,056
930,758 (312,769) 2,098,343 3,348,226
53,757,308 4,033,738 23,332,228 91,644,737
54,688,066$ 3,720,969$ 25,430,571$ -$ 94,992,963$
Temporarily Restricted
31