Embed Size (px)
Citation preview

1
Scenario-based assessment of non-functional requirements
Andreas Gregoriades, Alistair Sutcliffe, Member, IEEE
Abstract—This paper describes a method and a tool for validating non-functional requirements in
complex socio-technical systems. The System Requirements Analyser (SRA) tool validates system
reliability and operational performance requirements using scenario-based testing. Scenarios are
transformed into sequences of task steps and the reliability of human agents performing tasks with
computerised technology is assessed using Bayesian Belief Network (BN) models. The tool tests
system performance within an envelope of environmental variations and reports the number of tests
that pass a benchmark threshold. The tool diagnoses problematic areas in scenarios representing
pathways through system models, assists in the identification of their causes and supports comparison
of alternative requirements specifications and system designs. It is suitable for testing socio-technical
systems where operational scenarios are sequential and deterministic, in domains where designs are
incrementally modified so set-up costs of the BNs can be defrayed over multiple tests.
Index Terms—Non-Functional Requirements Validation, Scenario-Based Testing, Bayesian Belief Networks,
Systems Engineering
—————————— � ——————————
1 INTRODUCTION
cenarios have attracted considerable interest as a means of validating requirements
specifications [4, 5, 9, 54]. Foundations of scenario-based approaches were laid by
Hsia and Davis [8, 33], and the influential work of Potts [48] who created the
Inquiry Cycle and later the ScenIC [46] method for scenario-based requirements
validation [46, 47, 48, 49]. The potential of scenario-based requirements validation
has also been recognised by Anderson and Durley [1], Zhu and Jin [71], and Haumer
[28].
Scenarios have been applied to the analysis of non-functional requirements (NFRs)
using dependency tables to assess the relationships between different NFRs [43] and
by modelling the dependencies between goals (representing functional requirements
and non-functional requirements, also called soft goals), and the agents and tasks that
achieve them in the i* language [70]. The “satisfying” or fulfilment of soft goals (i.e.
NFRs) by functional requirements is assessed by inspecting strategic dependency and
rationale models that show goals, agents, tasks and dependency relationships [40, 41,
S

2
70]. Although i* support tools do provide limited reasoning support for assessing
dependencies, most validation still requires human expertise. The TROPOS [20]
language supports more formal reasoning about i* models; however, it does not
explicitly assess non-functional requirements.
Unlike functional requirements, which can be deterministically validated, NFRs are
soft variables that can not be implemented directly; instead, they are satisfied [40] by
a combination of functional requirements. Since many NFRs are influenced by human
properties, they inherit the diverse nature of human characteristics: for example,
assessment of NFRs such as system reliability is influenced by human characteristics
such as ability, stress, concentration, etc. Software engineering and systems
engineering requirements validation methods do not take human factors into account,
even though they are a critical cause of systems failure [30, 31, 52].
In our previous work [61] we developed a method and software tool for scenario-
based requirements validation that prompted designers with questions about potential
problems in a scenario event sequence. The tool used a psychology-based taxonomy
of failure causes [32] with a pathway expansion algorithm that generated alternative
paths from a single seed scenario. It supported an inspection-based process with probe
questions about possible problems and generic requirements as cures for the problems
it identified. However, evaluation of this approach showed that too many scenario
variations were generated and the software developers drowned in excessive detail.
To address this problem, we developed a semi-automated approach to requirements
validation [59], by transforming the taxonomy of human and system failure causes
into a model to predict potential errors in a system design. Bayesian Belief Nets
(BNs) provided a probabilistic reasoning mechanism to predict reliabilities, from
models composed of descriptions of system components and attributes of human
operators [21]. However, the output from the BN model was fed into a paper-based
walkthrough for validating scenarios which was still time-consuming. This led to the
motivation for the research we report in this paper, to create a software tool, for
scenario-based requirements validation that automates as much of the process as
possible.

3
The paper is organised in seven further sections. BN and uncertainty modelling is
briefly described; this is followed by the methodology and the tool’s architecture; the
NFR assessment follows. A case study analysis of NFR compliance and validation of
system-level components in a military command and control domain is presented in
which the tool is applied; the BN evaluation is explained; and the paper concludes
with a discussion and proposals for future development of our approach.
2 RELATED WORK
The SRA – System Requirements Analyser – tool described in this paper can be
regarded as a form of model checking which takes place early in the system
development life cycle, and uses BNs to reason about properties of system
components rather than more detailed models of system behaviour.
Model-checking techniques have been used extensively to verify and validate
requirements. However, despite the advantages, formal modelling suffers from a
communication problem between user-stakeholders and the model developers [7, 11],
since formal models are difficult to communicate to the stakeholders who set the
requirements in the first place. The software cost reduction (SCR) system used a
tabular notation for specifying requirements dependencies which is relatively easy for
software developers and end users to understand [34]. Tabular representation based on
the underlying SCR state transition formal model provided a precise, unambiguous
basis for communication among developers, coupled with automated analysis of
specifications. The approach hides the logic associated with most formal methods and
adopts a notation that developers find easier to use.
While tabular representations can improve communication of requirements, a
combination of visualisations, examples and simulation are necessary to explain
complex requirements to end users [6]. Scenario-based representations and animated
simulations help users see the implications of system behaviour and thereby improve
requirements validation [22]. Lalioti [36, 37] suggested potential benefits from
animating requirements validation including an interactive and user-friendly
validation environment for stakeholders.

4
Animation simulation tools integrated with formal model checkers have been
developed by Dubois in the ALBERT II [10] language and associated requirements
validation-animator tool (animator). The language preserves the structure of the
informal requirements expressed by stakeholders and maintains traceability links to
the formalised software requirements document. The animator validates the
requirements based on scenarios proposed by the stakeholders, allowing them to
cooperatively explore different possible behaviours of the future system. A similar
approach has been adopted in the KAOS language and supporting GRAIL tool which
enable formal reasoning about dependencies between goal model, required system
behaviour and obstacles or constraints [66, 67]. Another similar animator-validator
tool, TROLL [23], uses a formal object-oriented language for modelling information
systems, with syntax and consistency checker tools as well as an animator to
generates executable prototypes that can be used for requirements validation. As with
SCR and ALBERT II animators, our approach employs a tabular and graphical
representation of results [29] and runs test scenarios against the system model to
identify problems with the requirements specifications.
Scenario-based requirements analysis methods, pioneered by Potts [46, 47, 48],
proposed that obstacles or difficulties which might prevent a goal being achieved
should challenge requirements and hence promote refinement of the requirements
specification to deal with such obstacles. This approach was developed by van
Lamsweerde [65, 67], who applied formal reasoning to requirements specifications to
infer whether goals could or could not be achieved given constraints imposed by
obstacles. Hierarchical goal decomposition produced specifications of the states to be
achieved and the system behaviour required to reach those states, so considerable
problem refinement is necessary before automated reasoning can be applied. These
approaches also assumed that a limited number of scenarios and their inherent
obstacles are tested. This raises the question of test data coverage, i.e. just what is a
sufficient set of scenarios to enable validation to be completed with confidence?
While we believe there is no quick answer to this vexing problem, one approach is to
automate the process as far as possible so more scenarios can be tested.
Methods for requirements validation in safety critical systems have adopted
hierarchical fault trees to represent the space of possible normal and abnormal system
5
behaviours and their causal conditions (e.g. THERP [64]). While fault stress can be
formalised as state machines with temporal logic to reason about potential failures in
deterministic systems [27], the influence of human operators and the system
environment are generally not modelled. When they are represented, as performance
shaping factors [35], probabilistic modelling has to be used to reason about the
likelihood of failure of system components based on a description of their properties
and factors such as operator stress and fatigue [68].
Intent specifications provide a hierarchical model to facilitate reasoning about system
goals and requirements in safety critical systems [38]. Goals are decomposed in a
means-ends hierarchy, widely practised in requirements engineering [54, 67]. Intent
specification requirements are assessed by inspecting dependencies between
constraints, design principles and system goals to discover conflicts. Automated
support for reasoning about conflicting system states and behaviour is provided by the
SpecTRM-RL tool which uses a tabular format to represent relationships between
threat events and systems states, based on design assumptions and constraints.
However, intent specifications do not support assessment of human error in systems
or dependencies between human operators and user interfaces.
Assessment of non-functional system requirements, such as system reliability, has to
use probabilistic reasoning since the range of potential system behaviours is either
unknown, in the early requirements phase, or too large to specify. Bayesian Nets
(BNs) have been developed to assess software quality from properties of the code and
software engineering process [13, 15, 16, 18, 19], and for system risk analysis and
management [17]. Fenton and Littlewood’s [16] approach predicts the number of
defects in the system. They estimate software reliability using BNs to reason about
quality probabilities based on information gathered during the software development
process, such as the difficulty of the problem, the complexity of the designed solution,
the programmer’s skill, and the design methods employed. Fenton [17, 42] has
developed large BN models to assess risk at the system level, such as the reliability of
system engineering processes for developing ships, vehicles or the operational
reliability of air traffic control systems. This work has also produced methods and
tools for building large BN models to solve complex real world problems and
improved support for use of BN tools by end users. BNs have also been applied to

6
evaluating the confidence which might be assigned to different combinations of test
strategies in assuring reliable software [72].
In summary, BNs have been widely applied as a probabilistic reasoning technique in
software engineering and other domains; however, previous work used single nets to
evaluate a set of discrete states pertaining to a software product or development
process. In our earlier work we extended the application of BNs for safety analysis in
systems engineering domains using a semi-automated scenario-based approach [21].
We then developed more automated tools for scenario analysis of NFR conformance
for requirements specifications with multiple BN tests [60]. This paper extends that
work to show the development of a more comprehensive tool architecture which can
be configured with different types of BNs to analyse other non-functional
requirements; description of the scenario-based NFR evaluation method with different
modes of using BNs in scenario analysis; and validation studies of the BNs. The
extensive case study is reported using the tool to analyse a requirements specification
for an aircraft weapons loading system for a future aircraft carrier.
3 MODELLING UNCERTAINTY
Because of the uncertain nature of NFRs it is necessary to model them using
modelling techniques such as Bayesian probability, Dempster-Shafer theory, fuzzy
sets or possibility theory. Following Wright and Cai’s [69] review of the advantages
and disadvantages of stochastic reasoning methods, we adopted Bayesian probability.
They argued that Bayesian probability offered easier combination of multiple
influences on probability than Dempster Shafer and a sounder reasoning mechanism
than fuzzy sets. Bayesian probability provides a decision theory of how to act on the
world in an optimal fashion under circumstances of uncertainty. It also offers a
language and calculus for reasoning about the beliefs that can be reasonably held, in
the presence of uncertainty, about future events, on the basis of available evidence
[45]. BNs are useful for inferring the probabilities of future events, on the basis of
observations or other evidence that may have a causal relationship to the event in
question [12, 19].

7
BNs are directed acyclic graphs of causal influences, where the nodes represent
variables, and the arcs represent (usually causal) relationships between variables [12].
The example in figure 1 shows two influences on agent stress loading: workload and
duty time. Variables can have any number of states in a BN, so the choice of
measurement scale is left to the analyst’s discretion. For the illustration we have
assigned these variables to one of the two possible states: high, or low.
Fig. 1: Fragment of the proposed BN model.
In the above example, if we know that when the duty time is high (bad) and the
workload is high (bad), then the overall probability of the agent’s stress loading being
high (i.e. bad influence on human agent) will be greater. In the BN we model this by a
network probability table (NPT), as shown in table 1.
Table 1: A network probability table for the BN in figure 1.
Column 1 asserts that if the duty time of a human agent is high (bad) and his/her
workload is high, then the probability of stress loading being high (bad) is 1, with
zero probability of being low. NPTs are configured by estimating the probabilities for
the output variables by an exhaustive pairwise combination of the input variables.
BNs can accommodate both probabilities based on subjective judgements (elicited
from domain experts) and objective data [17]. When the net and NPTs have been
completed, Bayes’ theorem is used to calculate the probability of each state of each
node in the net. The theorem is shown in equation 1:
)(
)()/()/(
bP
aPabPbaP = [1]
Where,
P(a/b) = posterior (unknown) probability of a being true given b is true
P(b/a) = prediction term for b given a is true (from NPT)
Duty Time High Low
Workload High Low High Low
High 1 0.4 0.6 0
Stress-loading Low 0 0.6 0.4 1
8
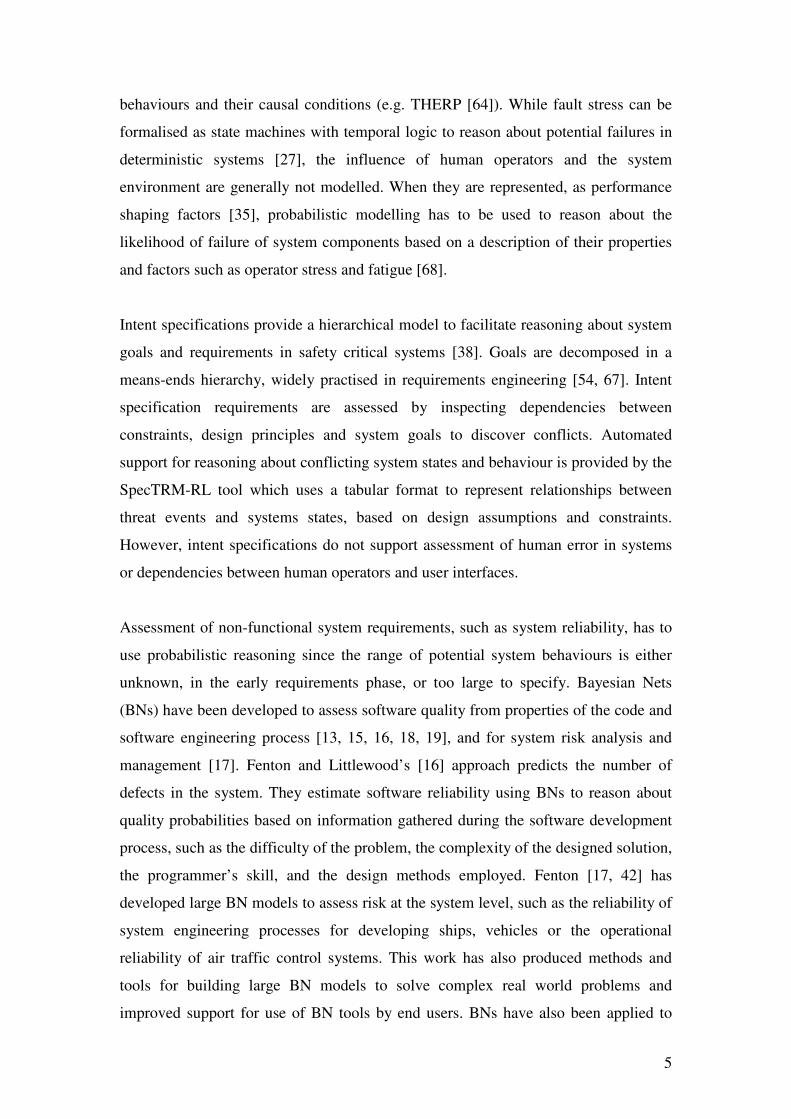
P(a) = prior (input) probability of a
P(b) = input probability of b
or, less formally:
Evidence
abilityPrior_ProbLikelihoodyProbabilitPosterior_
⋅=
Substituting data from the above example, the calculation is as follows. We want to
calculate the probability P that duty_time will be high and if we have opbserved that
the agent has a high workload. The likelihood of P stress (high) given work loading =
high and duty_time = high is 0.6 as given in the network probability table. To
calculate the posterior probability P(duty_time = high) and P(overloading = high), we
need the prior P(duty_time = high) is 0.5 and the input evidence of workload being
high which is 0.42, which produces the following calculation (equation 2):
P(duty = high / load = high) = (P(loading = high / duty = high) * P(duty = high)) /
P(loading = high) or
P(duty = high /load = high) = (0.6 * 0.5) / 0.42 = 0.71 [2]
Input evidence values are propagated through the network, updating the values of
other nodes. The network predicts the probability of certain variable(s) being in
particular state(s), given the combination(s) of evidence entered. BN models are
extremely computation-intensive; however, recent propagation algorithms exploit
graphical models’ topological properties to reduce computational complexity [45].
These are used in several commercial inference engines such as HUGIN, which we
used. BNs have to conform to a strict hierarchy since cycles lead to recursive and non
terminating propagation of probabilities by the algorithm. This imposes some
compromises in modelling influences, which can be partially overcome by
introducing additional input nodes to model cyclic influences, although this increases
complexity of the network and the control process for the algorithm.
BNs are currently used in many applications to reason about probabilities of
properties given a set of existing (prior) states; however, they do not naturally lend
themselves to a time series analysis. We examined three possibilities. First was serial
evaluation using an extended net which contained an input node that accepted the
result from the previous run. Hence the output reliability from step 1 became an input
prior state for step 2. This approach had the advantage of being able to explicitly

9
model the interaction between events; for instance, a high probability of failure at step
1 may make completion of step 2 much more difficult. However, input of a posterior
probability into a BN as a prior observation over many events has doubtful validity,
and we were advised by an expert statistician to avoid this approach. The expert’s
argument was that each run should be assumed to be independent, which would not be
the case if we propagated results between runs. The second approach was to combine
the output probabilities from a sequential run; assuming a BN has been used to assess
the probability of failure in a multi-step scenario, how should N probability
judgements be combined into a single value? One possibility was to use the output
probabilities as input into a “summariser net” that combined all the inputs as prior
observations into a single probability, with the net structure organised to group events
into episodes in a scenario. However, this option also faced the same criticism as the
first, namely converting multiple posterior probabilities into input observations. Our
expert advised that sample runs assuming they were independent, were possible but
this required probabilities of sampling particular runs to be set. This introduced a
subjective sampling bias; accordingly we rejected this option as well.
The third option avoided the net combination problem by converting the output
probability into a Boolean variable by judging each step to have succeeded or failed.
The output calculated probability for each event was compared with a user-defined
target value, and if it surpassed the target is was assigned as a “survivor”, otherwise a
failure and discounted. This option had the advantage of being able to pinpoint
particular steps in scenarios that were posing reliability problems. Furthermore,
sensitivity analyses could be carried out with multiple BN runs for each step by
varying the environmental conditions, and thus producing frequencies of survivors for
a set number of tests at each scenario event. This enabled investigation of the effect of
environmental conditions on design (x) with a set of scenarios (a, b, c) by counting
the number of surviving BN runs per step, having systematically varied all
combinations of the environmental variables from worst case to best case.
The SRA tool currently has two BNs: one to evaluate reliability and one to evaluate
performance time. Each BN model has variants with different probability distributions
in the NPTs to deal with variations in the degree of automation between tasks. New
BNs can be added to the tool to evaluate a wide range of NFRs.

10
3.1 BN MODEL OF SYSTEM RELIABILITY
The BN model of system reliability is based on a taxonomy of influencing factors by
Sutcliffe and Rugg [62] and the slips/mistakes distinction from Reason [52], who
drew on earlier work by Norman [44]. Slips are attention-based lapses and omissions
in skilled behaviour, whereas mistakes are failures in plans and hence fit into
Rasmussen’s [51] rule and knowledge levels of processing. The BN model
distinguishes between tasks that involve highly trained skills and are more prone to
slips (e.g. monitoring tasks) and knowledge-intensive tasks, such as analysis and
planning, that are more prone to mistakes.
According to the human error theory [41], the system environmental variables have an
indirect influence on an individual’s ability through increasing the fatigue and stress
levels, as reflected in the BN model in figure 2. An individual’s ability, however, has
a direct effect on mistakes. Organisational factors (management culture, incentives)
have a direct effect on individuals’ motivation [39]. Finally, individuals’
characteristics, such as domain and task knowledge, have a direct effect on mistake-
type errors [53]. Slips are mainly influenced by the user interface, the constraints
(time constraints, interruptions) and the individual’s dedication [52]. Tasks of high
cognitive complexity are considered to be more prone to mistake-errors, while tasks
of physical complexity, such as complex manipulations involving precise movements
and detailed co-ordination, are more prone to slip-errors [59].

11
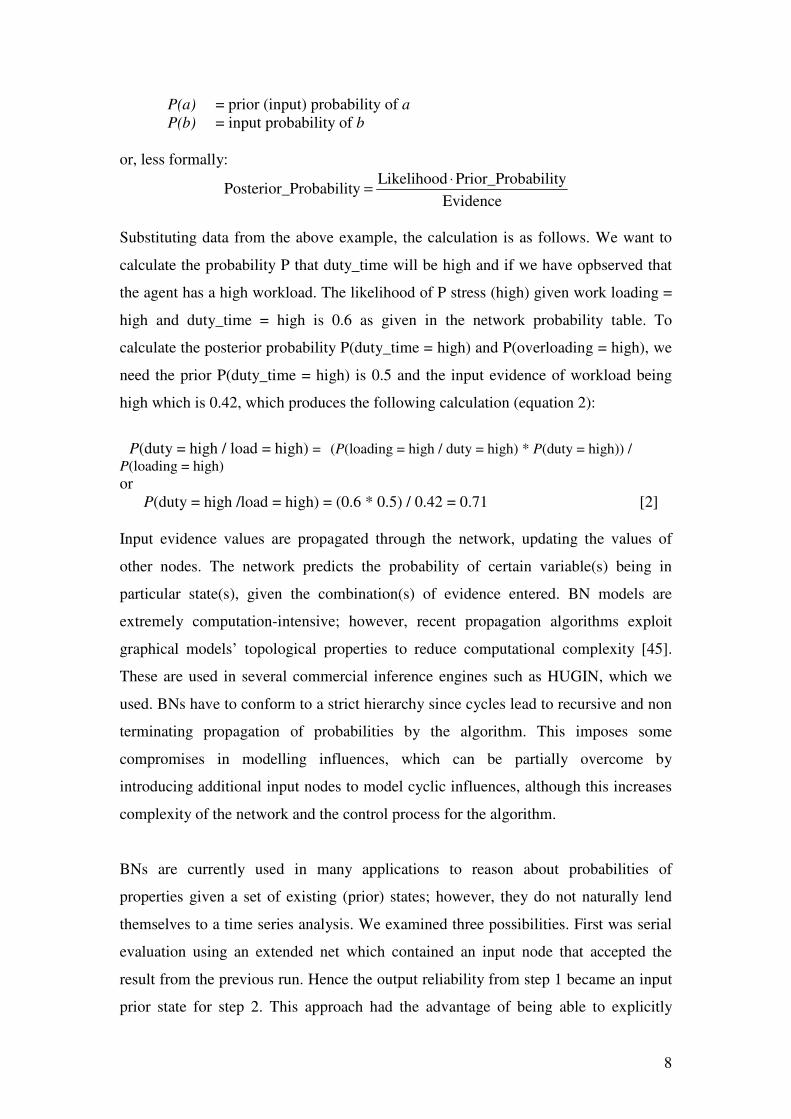
Fig. 2: BN model for system reliability. Inputs 1-2 relate to the task, 3-6 are technology attributes, 7-10 are human attributes and 11-22 are environmental variables. Appendix A
describes the nodes and summarises the NPT influences from parent to child nodes.
The first two inputs represent judgement of task complexity; for instance, operating
radar is cognitively and physically easy, whereas interpreting an object on the radar is
cognitively more complex (hence set to high). Inputs 3 to 6 describe technical
component properties, which can be taken from historic data on similar equipment, or
estimated. Inputs 7 to 10 are properties of human agents which are taken from training
data and job descriptions. Input values for the agent’s task knowledge, domain
knowledge, motivation and so forth can be measured using aptitude and psychometric
tests. The next six variables model influences on the human operational environment.
These include the short-term effects of time pressure, distractions and workload,
which can be estimated from narrative scenario descriptions, to the longer-term
influences of management culture and incentives. The final six inputs describe aspects
of the system’s operational environment (noise, lighting, comfort, sea state, visibility
and war/peace status). All the inputs are held in databases containing attributes of
human agents, technology components, and tasks. The environmental variables, sub-
Physical
complexity
Usability
Time
constraints
Cognitive
complexity
Internal_Env
factors
1 -2
3 -6
7 - 10
11 -16
17 -22 3
18 19 20 21 2217
4
1 2
5
6
87
9
10
11 12
13 14
15
16
Noise Lighting Comfort
External_Env
factors
Functionality Performance Reliability
Task
support
Autom
Effectiveness
Task
knowledge Domain
knowledge
Inherent
ability
Internal
motivation
Task
complexity
Operational
stress
External
influence
Slips
Functional
UI_Design Ability
Knowledge
Motivation
Distractions
Duty_Time Workload
Management
culture
Incentives
War_Peace Sea_State Visibility
Env_Context
Organisation
culture
Enthusiasm
Fatigue
Stress
Ineffective
-ness
Expertise
Mistakes
Dedication Internal
influence
12
divided into human and system operational aspects, can be entered manually to reflect
a particular scenario or systematically varied.
Task complexity can be either cognitive or physical; for instance, operating radar is
cognitively and physically easy, whereas interpreting an object on the radar is
cognitively more complex (hence set to high). Attributes of technical components can
be taken from historic data on similar equipment, or estimated. Inputs from the human
agent are taken from training data, job descriptions or are measured objectively by
using psychological questionnaires. For instance, general ability and
accuracy/concentration can be measured by intelligence aptitude scales, decision
making and judgement by locus of control scales, whilst domain and task knowledge
can be measured by creating simple tests for a specific task/domain. Input nodes in
the human operational environment include the short-term effects of time pressure,
distractions and workload, which can be estimated from narrative scenario
descriptions, to the longer-term influences of management culture and incentives,
which are judged from contextual scenarios. The final input nodes describe aspects of
the system’s operational environment. All the inputs are contained in files that link the
variables to human agents, technology components, task properties or the
environment, sub-divided into human and system operational aspects. The input
variables are all discrete states (best/worst case) which are derived from the measures
detailed in appendix A.
The BN is run with a range of scenarios that stress-test system design against
operational variables. Scenarios can either be taken from domain-specific operational
procedures or by interviewing users, or postulated to cover a variety of organisational
and work situations that may occur in the domain. The BN produces outputs: slip-type
errors that apply to skilled tasks (recognise, interpret and act), and mistake errors
pertinent to judgement-style tasks (analyse, plan and decide).
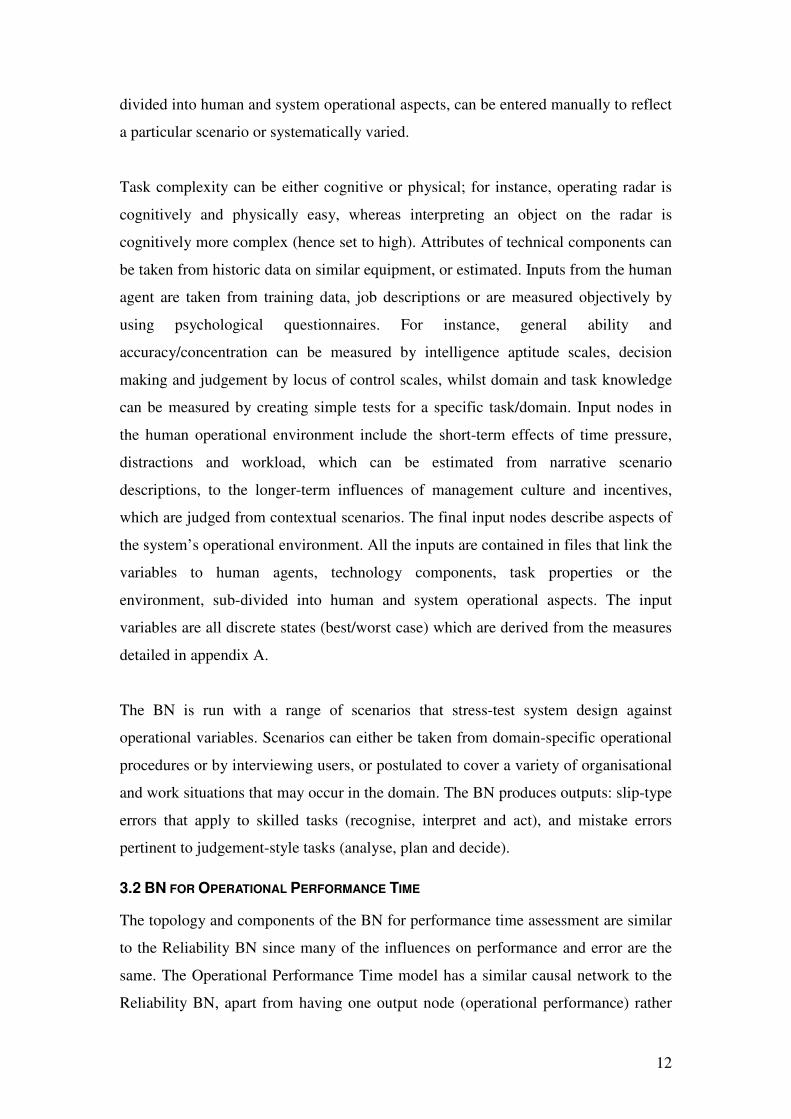
3.2 BN FOR OPERATIONAL PERFORMANCE TIME
The topology and components of the BN for performance time assessment are similar
to the Reliability BN since many of the influences on performance and error are the
same. The Operational Performance Time model has a similar causal network to the
Reliability BN, apart from having one output node (operational performance) rather

13
than two. As with the Reliability BN illustrated in figure 2, the likelihood influences
expressed in the BN model and its NPTs are based on human factors performance
literature [64] (see also appendix A). For example, a poor physical and operational
environment (time on duty and workload) have an adverse influence on the agent’s
stress and fatigue levels which in turn adversely influence the agent’s concentration
[3]. Input variables are either an expert’s assessment of a quality, e.g. information for
decision support provided in a prototype; or a functionally rich and more expensive
design which would have a higher rating for functionality, situation awareness
support, etc. Different levels of automation are reflected in variations in the BNs. For
example highly automated tasks tend to be quicker and more reliable, but this only
applies if the equipment is well designed and maintained. Hence maintenance has
more influence in highly automated tasks than in minimum automation, and this is
reflected in different NPTs based on the equipment types. Similarly, the type of task
(manual, semi-automated) determines the degree of influence of technology.
Whereas the Reliability BN produces probabilities of reliable completion for each
task step, output from the Operational Performance BN is used to increase a best case
task completion time to reflect the less than ideal properties of human and machine
agents. Each task is assigned a best and worst case completion time, obtained from
domain experts. The estimated task completion time is calculated using the following
formula (equation 3):
ET = (Plow
* BT) + (Phigh
) * WT) [3]
Where,
ET = Estimated time
highP = Probability of operational performance being high
BT = Best task-completion time
lowP = Probability of operational performance being low
WT = Worst completion time
Hence, if the probability of high operational performance is equal to 1 then the
probability of low operational performance will be 0 (best case); this will result in a
best case completion time. On the other hand, if the probability of low operational
performance time is 0.57 and the best and worst times are 3 and 10 sec respectively,
then the estimated time is (0.57*3) + (0.43*10) = 6.01 sec. If the threshold value is set

14
at 75% in the range best-worst case, then this is converted into time with the
following formula (equation 4):
Thsec = (Th%
/ 100) * BT + ((1- Th%
) / 100) * WT [4]
Where,
Thsec = Threshold in seconds
BT = Best task-completion time
Th%
= Threshold as a percentage value
WT = Worst completion time
Therefore, according to the above example and equation 5:
sec75.4100
)310(7510sec =
−⋅−=Th [5]
Hence any task completion time less than 4.75 is acceptable. For each task-step the
system counts the BN runs with task completion times below the threshold.
To reflect the case of reverting to manual when an automated technology fails, highly
automated tasks’ worst completion times are generally set much higher than those of
the manual tasks. This is because the human operator has to diagnose the reason for
failure and then substitute the manual version of the task which will not be familiar.
Hence the worst-case time will be longer than the manual task alone. For instance, the
task “Manually load weapons on trolley” requires 120 sec to complete best-case
situations and 180 sec in the worst case. On the other hand, the same task with
automated technology could be completed ideally in 70 seconds but in 320 sec in the
worst case. If the automated technology fails to load the weapons correctly then
intervention of a human agent is required to discover the reason for the failure and
then correct the misplacement or manually load the weapons.
4 SRA SYSTEM ARCHITECTURE
Analysis starts with the selection of the i* model to be evaluated, and creating the test
scenarios. Scenarios are narratives taken from real life experience describing
operation of similar systems from which event sequences are extracted. This process
is explained in more depth in sections 5 and 6. A scenario editor tool is provided [24]
which allows the analyst to point to task nodes on the i* diagram; the tool then
presents a list of the technology and human agents which may be associated with the

15
task. The analyst picks the agents from the list to form a task ‘tuple’ consisting of
<human agent, task, technology agent>. Scenarios are built up in this manner by
following task pathways through the i* model, which is illustrated in figure 3. The
analyst specifies the NFR threshold values, then selected the scenarios and system
database. The SRA loads the required information (for the task and agents in the
scenario) from the domain database. Because of differences between semi- and highly
automated tasks, the system evaluates operational performance for each type of task
using slightly different BN models. Nodes that do not apply to the equipment used are
left undefined and therefore have a neutral influence on operational performance. For
instance, tasks that are highly automated are more dependent on maintenance
compared with semi-automated tasks, whereas highly automated equipment is
generally more reliable as long as it is well designed and maintained. These influences
are reflected in the network probability tables of the BN models.
Fig. 3: System model for a navy command and control combat system represented in the i* notation. To simplify the model only human agents are shown. Scenarios trace pathways
through the model from the radar operator to PWO and then to weapons directors – EWD, WDB or WDV – for a response to the threat.
Furthermore, depending on the task type, the SRA assesses system reliability based on
two types of errors, slips and mistakes. Slips are more common in tasks that are
highly skilled or physical in nature, while mistakes occur in tasks that are cognitively
16
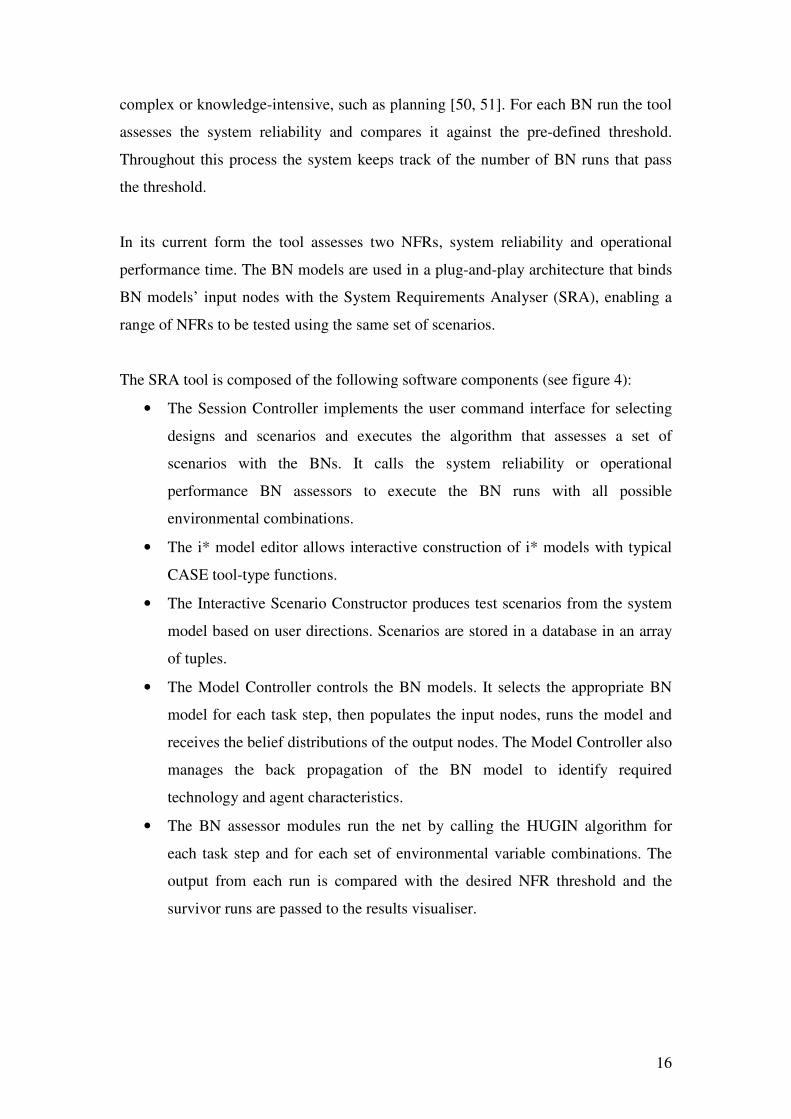
complex or knowledge-intensive, such as planning [50, 51]. For each BN run the tool
assesses the system reliability and compares it against the pre-defined threshold.
Throughout this process the system keeps track of the number of BN runs that pass
the threshold.
In its current form the tool assesses two NFRs, system reliability and operational
performance time. The BN models are used in a plug-and-play architecture that binds
BN models’ input nodes with the System Requirements Analyser (SRA), enabling a
range of NFRs to be tested using the same set of scenarios.
The SRA tool is composed of the following software components (see figure 4):
• The Session Controller implements the user command interface for selecting
designs and scenarios and executes the algorithm that assesses a set of
scenarios with the BNs. It calls the system reliability or operational
performance BN assessors to execute the BN runs with all possible
environmental combinations.
• The i* model editor allows interactive construction of i* models with typical
CASE tool-type functions.
• The Interactive Scenario Constructor produces test scenarios from the system
model based on user directions. Scenarios are stored in a database in an array
of tuples.
• The Model Controller controls the BN models. It selects the appropriate BN
model for each task step, then populates the input nodes, runs the model and
receives the belief distributions of the output nodes. The Model Controller also
manages the back propagation of the BN model to identify required
technology and agent characteristics.
• The BN assessor modules run the net by calling the HUGIN algorithm for
each task step and for each set of environmental variable combinations. The
output from each run is compared with the desired NFR threshold and the
survivor runs are passed to the results visualiser.

17
Fig. 4: System Requirements Analyser – conceptual architecture and functional components.
• The Visualiser provides a visual summary of all qualified BN runs for a set of
scenarios for one or more system designs. This enables different designs to be
compared and problem areas in the requirements to be identified, i.e.
task/technical component combinations which show low potential NFR
assessments. The Visualiser displays results at three levels: System, Scenario
and Phase views based on our previous visualisation model [24].
The system can be configured with new BNs by creating a new net and NPTs using
the HUGIN tool. The new BN is then added to the Model and Session Controllers by
editing menus to allow selection of the new NFR analysis and adding any rules to the
Model Controller to select between different model sub-types and NPTs according to
task or agent/equipment types. Currently only one NFR can be analysed in a session;
however, several designs and scenarios can be analysed sequentially. The system
automatically aggregates results from lower-level phase views, to the scenario and
then system design level, allowing two or more designs to be compared using the
i* model editor Scenario constructor
i* system models
Domain database
Desired NFR thresholds
Session controller
Model controller
Results visualiser
Scenario task sequences
Configuration editing: add new BN models and selection rules
Selects appropriate BN models, controls runs
agent task properties
Survivor runs for each step /
scenario / design
HUGIN BN tool
HUGIN BN editor

18
same set of scenarios. The system was developed in JAVA using JBuilder 9 (J2EE).
The user interface was implemented using Swing components while the model
controller interfaces with the HUGIN Decision Engine via the provided Java API. The
connection to the database uses JDBC.
5 NFR ANALYSIS METHOD
The process, illustrated in figure 5, starts by creating the system model, using the i*
modelling language, to describe the characteristics of agents, tasks, resources and soft
goals. Soft goals in this case constitute the NFRs under investigation, while resources
are the equipment used by the agent to perform the task. The domain knowledge
necessary for the development of the i* model is elicited from domain experts. NFRs
and their validation criteria are specified in the requirements specification (e.g. system
reliability should be >= 95% for a system design with a set of operational scenarios
1..n).
The next step converts scenarios, which are narrative stories, into a format that can be
executed by the system. This is achieved by extracting task sequences undertaken by
agents from the narrative. For example in the naval domain a missile attack scenario
narrative is “The enemy aircraft launches a missile, which is detected by the ship’s
radar. The Radar Operator (RO) reports a hostile contact, speeds and bearing to the
Tactical Picture Complier (TPC) who estimates the direction and closing time of the
threat and notifies the incoming missile threat to the Principal Weapons Officer
(PWO). PWO decides to jam the missile’s radar using electronic counter-measures
and issues the command to the Electronic Weapons Director (EWD) … [continues]”.
Scenario narratives can contain implicit tasks which are not articulated because they
are tacit or assumed knowledge, therefore we apply generic task patterns [58] to
define the task sequence. In the above example the generic pattern for command and
control consists of five tasks Monitor (events), Interpret (threat), Analyse (situation),
Plan (response), and Act.
Using the scenario editor with the i* system model, test scenarios are constructed by
selecting the tasks that are explicit and implicit in the scenario narrative, so for the
above example the task sequence from the Monitor by RO to Plan by PWO followed
by Act (EWD) would be selected. Scenarios are composed of a number of phases and

19
each phase is composed of a number of task-steps, each one modelled as a
<Agent,Task,Technology> tuple.
Fig. 5: NFR analysis method, processes and tool support. Ellipses denote method steps, ordered in a dependency sequence; boxes show tool components that support the method
step they are connected to.
In the above missile attack example, the narrative has four phases, each one
representing a command and control sequence: first electronic counter-measures are
tried; in the next phase the ship manoeuvres to avoid the threat; then fires decoys; and
finally destroys the hostile missile with a defensive missile. Phases are used to
structure task sequences that fulfil a higher order goal. Scenarios can be interactively
constructed by pointing to tasks on the system model editor display. The tool then
automatically creates a scenario task sequence by tracing the human and machine
agents involved with each task.
The Compare Design step finds the best system design using the system view bar
chart (see figure 6) to investigate the number of surviving runs for each task step.
Trade-offs between NFRs can be assessed by selecting different BN models (e.g.
reliability, performance time) from the Session Controller menu, while designs can be
Descriptions of tasks, agents,
goals
Develop system model
Identify critical
components
i* editor
results visualiser
results visualiser
scenario constructor
survivors bar chart
survivors bar chart
back- propagation
Requirements changes
Construct scenarios
Select designs, scenarios
and NFRs Compare designs
Assess environmental
variables
Pinpoint critical tasks
Identify improvements

20
compared by changing the database, which loads different technology and human
agents that represent a new design, and repeating the process. NFR thresholds can be
set at the user’s discretion so the tool allows the analyst to compare designs and
desired performance in a more flexible manner than if the variables had been hard
coded.
The best design will generally have more surviving BN runs (as defined in section 3);
however, it is also desirable that the design succeeds in all scenario steps. Each bar in
the system view (see figure 6) corresponds to the cumulative number of surviving
runs for each task-step in a scenario phase. The analyst can easily identify the best
design and pinpoint task steps with low NFR satisfaction rates by focusing on low
scores on the bar chart. Moving the cursor on top of any bar reveals the total number
of surviving runs for the task-step.
The bar chart identifies poorly performing task steps, which can be cross-referenced
to the human and machine agents involved. Right-clicking on top of any bar to reveal
the components involved. The domain database can then be queried to find the input
variables. The domain database has an annotation field so the analyst can record
reasons for settings, and refer to these when improvement may have to be made. The
BN models have a limited explanation facility of pop-up tool tips that summarise the
NPT influences (see appendix A) for each parent-child node combination. This
information is then used in the Identify Improvement step. Further advice on generic
requirements for technology to support particular tasks, and improving human
operation, is given in a related part of the toolset which we have described elsewhere
[57].
The best design also needs to be resilient to environmental conditions. This analysis is
supported by the results visualiser in the Assess Environment step. The results
visualiser uses colour coding to identify variables which adversely affect system risks
over a range of scenario steps. In the phase view the influences of environmental
variables on survivor runs are collated into a matrix (figure 6). Columns correspond to
the twelve environmental variables, and rows report the percentage scores that passed
the threshold. The impact of environmental variables is calculated as equation 6:
21
100)()(
)(
×=
AllxEP
xEP
b
Q
QxIEP [6]
Where,
)( xEP
bQ = Survivor runs with environmental variable (x) set to best case
AllxEPQ )( = Total survivor runs for all settings
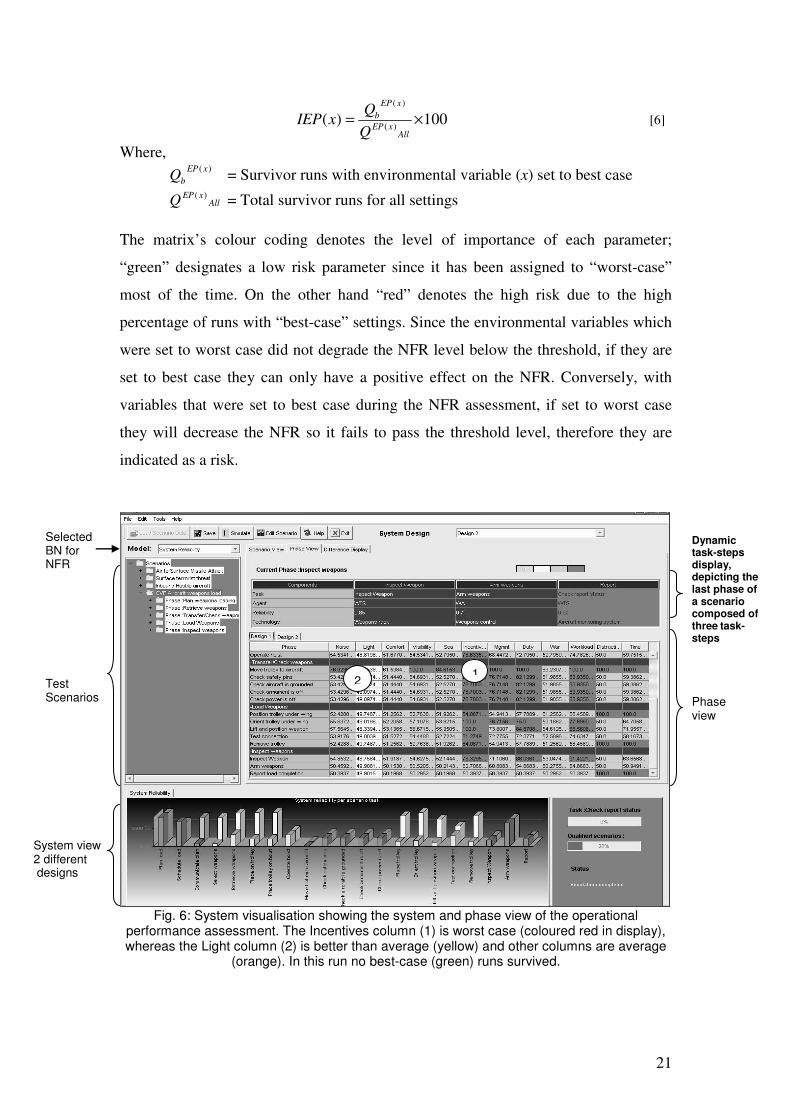
The matrix’s colour coding denotes the level of importance of each parameter;
“green” designates a low risk parameter since it has been assigned to “worst-case”
most of the time. On the other hand “red” denotes the high risk due to the high
percentage of runs with “best-case” settings. Since the environmental variables which
were set to worst case did not degrade the NFR level below the threshold, if they are
set to best case they can only have a positive effect on the NFR. Conversely, with
variables that were set to best case during the NFR assessment, if set to worst case
they will decrease the NFR so it fails to pass the threshold level, therefore they are
indicated as a risk.
Fig. 6: System visualisation showing the system and phase view of the operational
performance assessment. The Incentives column (1) is worst case (coloured red in display), whereas the Light column (2) is better than average (yellow) and other columns are average
(orange). In this run no best-case (green) runs survived.
1
Phase view
System view 2 different designs
Dynamic task-steps display, depicting the last phase of a scenario composed of three task-steps
Selected BN for NFR
Test Scenarios
2

22
In the Identify Improvements step, if an overall design or a particular task step fails to
meet the desired NFR threshold then the back propagation analysis is used to set the
desired NFR value and the BN is back-propagated to discover the necessary settings
of agent or environmental variables to achieve the NFR value. Back propagation can
be used in two modes: all input nodes unconstrained, in which case the BN calculates
the input values required to achieve the user-determined output NFR; or one/few input
nodes unconstrained, in which case the BN calculates the values for these nodes given
settings for the constrained nodes. Back-propagation is usually hypothesis-driven to
focus on where design improvement could be made, so many variables are left with
their original settings, with a few nodes left unconstrained.
The results from the back propagation are compared with the properties of the original
component in order to identify the level of improvement required. For instance, if the
usability of the radar is set to 0.65 (actual) in the database and the assessed usability
from the back propagation is 0.83 (estimated) to achieve the desired NFR for
reliability of 0.85, then the required level of improvement is 0.18, i.e. 0.83 minus
0.65.
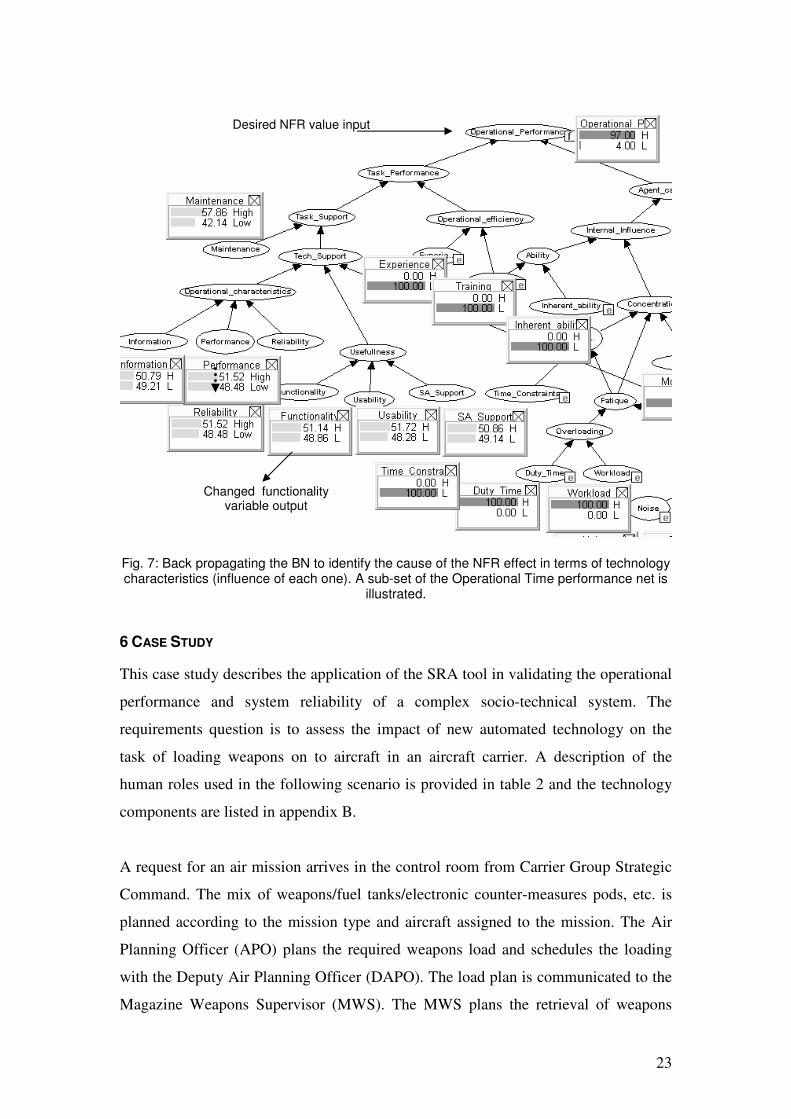
Figure 7 depicts the back propagation of the Operational Performance model using an
input set of environmental variables, the agent properties and the required NFR values
defined by the requirement specifications. The monitor windows on top of system
environment, human agent and NFR notes show the input variables. The monitor
windows on top of technology influences depict the distribution of the output nodes.
23
Fig. 7: Back propagating the BN to identify the cause of the NFR effect in terms of technology characteristics (influence of each one). A sub-set of the Operational Time performance net is
illustrated.
6 CASE STUDY
This case study describes the application of the SRA tool in validating the operational
performance and system reliability of a complex socio-technical system. The
requirements question is to assess the impact of new automated technology on the
task of loading weapons on to aircraft in an aircraft carrier. A description of the
human roles used in the following scenario is provided in table 2 and the technology
components are listed in appendix B.
A request for an air mission arrives in the control room from Carrier Group Strategic
Command. The mix of weapons/fuel tanks/electronic counter-measures pods, etc. is
planned according to the mission type and aircraft assigned to the mission. The Air
Planning Officer (APO) plans the required weapons load and schedules the loading
with the Deputy Air Planning Officer (DAPO). The load plan is communicated to the
Magazine Weapons Supervisor (MWS). The MWS plans the retrieval of weapons
Desired NFR value input
Changed functionality variable output

24
from the magazine and the Magazine Artificer (MA) retrieves the weapons and places
them on a trolley. The trolley is placed on the hoist which lifts it to the flight deck.
The trolley is then moved by the Weapons Artificer (WA) to the specified aircraft.
The Weapons Team Supervisor (WTS) is responsible for organising the WA teams. A
number of checks are performed by the Weapons Loading Controller (WLC) prior to
the loading of the weapons, e.g. check that the aircraft is properly grounded and
engine power is set to off; visually inspect the wing rack to ensure safety pins are
placed and the rack is locked; verify that all cockpit armament selectors are in the off
or safe position. On completion of safety checks the WA positions the trolley under
the aircraft wing, orients the trolley under the desired rack, lifts into position and
attaches the weapons. The trolley has a pneumatic pump to hoist the weapon up to the
wing; however, the final load-and-secure is manual and requires two or more WAs
depending on weapon weight. The process is repeated for the rest of the weapons. On
completion of the loading process the WLC tests the connections between the
weapons and the rack, then the WA removes the trolley. Finally the WLC inspects the
weapons before arming them and reporting completion to the Flight Deck Supervisor.
The process is usually carried out concurrently with two teams, one per aircraft wing.
Table 2. Description of the agent roles.
Roles Description
APO Air Planning Officer is responsible for the planning of the weapons load
according to missions requirements
DAPO Deputy Air Planning Officer is accountable to the APO. Responsible for the
planning of weapons load and communicating the plan to the magazine
MWS Magazine Weapons Supervisor is responsible for the effective management of
the MAs and the planning of the weapons retrieval
MA Magazine Artificer is responsible for the retrieval of weapons from the
magazine and loading on the transportation equipment
WTS Weapons Team Supervisor is responsible for the effective management of the
weapons loading team
WA Weapons Artificer is responsible for handling weapon systems on the flight
deck and elsewhere
WLC Weapons Loading Controller manages the flight deck weapon loading process
The scenario task-steps and components used for two prospective designs are shown
in appendix B. Tasks in Design 1 are manual or semi-automated, while in Design 2
they are semi- or fully automated; for instance, the task “Transfer weapons to aircraft”
has becomes specialised into “Move trolley to aircraft” and “Drive autoload palette to

25
aircraft”. The autoload palette has image sensors to detect the correct position on the
aircraft wing and knowledge of the aircraft and weapon type, so it can automatically
hoist and connect the weapons. The second design saves manpower since it can be
operated by one WA, and is potentially more rapid to operate, but it is more
expensive. The systems engineer needs to compare the two designs with a sensitivity
analysis to test different assumptions.
The analyst can easily pinpoint the more reliable design by focusing on the
comparison in the system view. Overall most of the tasks were more reliable in
Design 2 (advanced technology) at the rear of the bar chart in figure 6; however, tasks
“Schedule load” and “Report task completion” had more survivors and hence better
reliability in Design 1. Also both designs had poor reliability for “Move trolley to
aircraft” and the following checking tasks, so these are critical tasks that warrant
further attention. The two designs have equal and acceptable reliability for the Load
Planning task even though Design 2 was automated. Inspection of the agents’
properties and the BN tables shows that the information accuracy and maintenance
technology properties were set to poor because the planning system was a new
prototype, hence the improvement from automation was small. The poor reliability of
“Move trolley to aircraft” in both designs is a consequence of the effect of
environmental variables on human operation. This can be seen in the phase view in
figure 6 which shows that this task and load planning both suffer from adverse
environmental influences. Moving the trolley is primarily a manual task, so the
system selects the NPT tables which minimise the influence of the technology
component; in the Design 2 autoload palette, poor maintenance settings for new
technology reduce the advantage of automation. The adverse environmental
influences on human and machine agents are present for both designs, reflecting the
experience that manoeuvring equipment on a pitching aircraft carrier deck (sea
variable setting) is prone to error. Similarly the subsequent four checking tasks are all
manual and exposed to reliability influences from motivation (slips when not paying
attention) and interruptions in a busy flight deck environment (concurrency variable).
Solutions require human factors knowledge, which might suggest double checks to
improve reliability or improved design to support checking by augmented reality
display of reminders, location of objects to check, etc.

26
Fig. 8: Task completion time for each task in both designs. The lower part of the bar is the best case time; the upper part is the estimated time taking agent and environment variables
into account.
When the operational performance times are compared (see lower bars at the rear of
figure 8), Design 2 is quicker for nearly all tasks, which is not surprising since it has
more automated tasks. The projected increase from the best case task completion
times for Design 1 reflects the effect of the same variables that also caused poor
reliability.
Completion times for Plan and Schedule load tasks are long for both designs, which
might seem strange since Design 2 partially automated both tasks. However, best case
time even after automation is still long, since human checking is necessary to verify
automated decision making. The projected actual times reflect the poor reliability of
both designs, which can be traced to poor rating of information provided by the
technology, reflecting uncertainty under operational conditions. Most tasks have more
rapid best-case and estimated times in Design 2 because automated processes are
quicker and the time advantage is not changed by the effect of poor reliability in some
tasks, e.g. Planning, Scheduling, and Move trolley to aircraft.
The next step is to consider the critical environmental variables for both designs,
illustrated in figure 9. Figure 9a shows that incentives, motivation, duty time
concurrency, and time constraints were all marked as vulnerable for Design 1. Design
2 (figure 9b) in contrast fares better with only motivation, concurrency and
maintenance marked as vulnerable. Maintenance becomes a concern for the second,
more highly automated design and this reflects the NPTs selected for different levels
of automation. Cures as before require human factors knowledge; however, some
suggestions which can be found in the system database are to increase motivation to
improve crew morale, or provide incentives for these roles. Concurrency is difficult to

27
cure since so many tasks are prone to interruptions, while the effect of maintenance
depends on the system engineer’s judgement about the effectiveness of planned
maintenance. The tool’s role is to point out the problem which can be cured by
changed procedures, and management decisions such as to increase investment in low
maintenance equipment.
Fig. 9(a): Environmental influences for Design 1. The arrow points to critical task. Red (darker
shading) indicates adverse environmental variables.
Fig. 9(b): Environmental influences for Design 2. The arrow points to the critical task.
After identifying the most appropriate design, the problematic tasks and the critical
environmental variables, the analyst investigates the improvements required for the
Autoload palette component, which was the weakest link in Design 2. Using the back-
propagation facility, the minimum acceptable reliability is set in the output node, and
the nodes where design or operational environmental changes can be made are left
unconstrained.

28
Fig. 10: Tuple components suggested improvements for Design 2. The circled cells correspond to the required improvements for the generic task “Drive autoload palette to aircraft”. Dark-filled cells represent properties that are not applicable to the component.
In this case, equipment maintenance (already identified as a vulnerability) and the
human operator’s experience (the only way to overcome difficult carrier deck
operations) are selected. The BN shows that maintenance needs to be improved by
50%, and operator’s experience by 26% (see figure 10). Translating these into specific
needs requires domain expertise; however, the tool does quantify the degree of
improvement and this can be empirically tested by setting targets in a prototype
system.
7 VALIDATING THE BN MODELS
We used data mining techniques to test the assumptions embedded in the BN models
to map the expected influences elicited from domain experts and theory. We
simulated all possible permutations of the input model variables and created a
database of reliability and performance time predictions for these runs. This produced
an extensive set of test data; for example, for one scenario composed of four phases
with six task steps in each phase the tool generated 4*6*312
records. The BN model’s
NPT and the causal influences were analysed with the following data mining
techniques: relevance analysis, association rules and classification [25]. Relevance
analysis ranks input parameters of the model based on their relevance to one of the
model’s output parameters (e.g. reliability in our BN). Association rules describe how
often two or more facts co-occur in a data set and were employed to check the causal
associations in our model. Classification partitions large quantities of data into sets
with common characteristics and properties and was used to provide a further check
on the structure of the BN models.
The initial assumptions made about influences on system reliability and operational
performance were mainly satisfied. However, the relevance analysis revealed that sea
state had only a minor influence on system error, although according to domain
29
experts, it is a major influence on human error. Several intermediate nodes had diluted
the influence of sea state on system error nodes so it was necessary to alter the BN
causal diagram. The two BN models for assessing operational performance with
different levels of automation showed a similar influence of maintenance on
operational performance, which should not be the case. These inaccuracies were
addressed by altering the BN’s NPTs to increase the prior probability influence for
poor maintenance on automated tasks.
Association analysis identified two rules with high significance levels that were not
explicitly defined in the model:
IF (DutyTime = High) THEN (Survived = Fail)
IF (Workload) = High) THEN (Survived = Fail).
These rules indicated that the causal influences of “Duty Time” and “Workload” were
higher than the influences in the BN what had been specified by the domain experts.
In order to overcome this problem we altered the NPT settings to reduce the
weighting of these nodes and increase the influence of the “Distractions” node that
appeared weak. Finally, classification analysis pinpointed problems with crew
motivation and agent ability nodes which suggested changes to the BN model
structure.
8 DISCUSSION AND CONCLUSIONS
The main contribution of this research has been to develop automated testing of
requirements specifications and designs for conformance to non-functional
requirements using a set of scenarios and variations in the system environment. This
is a considerable advance over existing tools which support validation of NFRs by
inspection of models [41]. Our automated scenario-based testing tool explicitly
considers environmental influences, and provides visualisations for pinpointing
problematic tasks and components within a design and scenario sequence. The
technology is applicable to problems where requirements are expressed as properties
of components, such as the human and machine agents in our system engineering
domain. However, the configuration costs of the BNs will limit the cost effectiveness
of the technology for new green-field requirements engineering problems; on the
other hand it should pay back in brown-field domains where designs are incrementally
refined, and the set-up costs can be amortised over many generations of testing.

30
More generally the SRA could be applied to any class of component-based problems
where the selection of components needs to be optimised for non-functional
requirement types of criteria. The architecture is modular and scalable, allowing new
NFRs to be investigated by “plugging in” the appropriate BN. Our work presents a
new view on component-based model-checking using BNs which could, in principle,
be applied to model-checking requirements at lower levels of granularity, such as
black-box software component configuration. The BN approach could apply to any
domain where requirements attributes can be synthesised into a predictive model of
performance, effectiveness, or other non-functional requirements. It can be applied to
problems that can be described by a set of sequential tasks, for instance checking
workflow systems expressed as sequential tasks/functions undertaken by a
collaboration between human and software agents.
The SRA tool was a development from our previous BN requirements analyser [26],
and has partially addressed the difficult problem of scenario-based testing [4, 63x].
Although there is no substitute for domain expertise in generating or acquiring
scenarios, our approach can amplify scenario-based validation by systematically
testing a set of assumptions that are implicit within scenarios. This enables areas of
concern to be pinpointed, as well as enabling trade-off analysis between alternative
designs. However, the fidelity of testing depends on the accuracy and sophistication
of the BN models. There is no quick solution to validating complex models of human
error and environmental influences on system failure since exhaustive experiments on
complex systems can never be complete; incorporating human factors into assessment
of systems or user interfaces has to rely on models constructed from theory and
domain expertise [30, 35, 53]. We have followed both approaches in constructing BN
models.
The SRA tool is aimed at requirements investigation in complex socio-technical
systems, and hence it complements model-checking tools which are more appropriate
to later stages in development when specifications of agent behaviour are available,
e.g. SpecTM-RL [38], KAOS-GRAIL [66, 67]. Other scenario-based requirements
analysis tools such as ARTSCENE [56] help to automatically generate scenario
variations by pathway expansion algorithms that trace normal and
alternative/exception paths through use cases, but no validation support is provided

31
beyond suggestions for generic requirements which may be applications for different
scenario events.
The use of BNs by Fenton et al. in their work on software metrics and risk analysis
[12, 15, 18] is closely related to our approach. However, they employed BNs to assess
the quality of software systems based on the properties of system specifications,
development process and code. Their use of BNs assumes a static view whereas we
have extended Bayesian tests for a dynamic view in operational scenarios by
introducing the notion of test survivors to avoid the problems of Bayesian reasoning
over multiple sequence states. We do not consider operational testing with scenarios.
In the JSIMP tool Fenton and Cates [14] provide predictions of project failures based
on BN analysis of project management practices. Users enter scenario information via
a questionnaire interface and obtain probability distributions of unknown variables
using the back-propagation facilities of BNs, also incorporated within our tool.
Although the JSIMP tool has an end-user interface that hides complexities of the BN
from the user, it does not include sophisticated visualisation facilities to compare with
our SRA tool, which allows the analyst to assess multiple model assessments over a
variety of scenario sequences and environmental conditions.
There is no shortage of scenario-based tools for requirements validation and
verification; however, all these tools use more detailed specifications of system
behaviour which will not exist in the early stages of the requirements process or
domains with black-box component-based design. For instance, Ryser and Glinz [55]
convert natural language scenarios into statecharts which in turn are used to generate
test cases used for system validation. In common with our tool the scenario
conversion process is manual and labour intensive, so one future direction in our work
will be to investigate information extraction tools [57] which may be able to partially
automate generation of scenario event sequences from text-based narratives. Like the
ARTSCENE environment, the SCENT method [53] only provides automated
derivation of possible test cases, and no assistance in validation of requirements
specifications. Zhu and Jin [71] also used formalised scenarios for validating
requirements based on the principles of activity lists [2] but did not provide any
validation for non-functional requirements.

32
Although our approach has delivered an analysis tool for investigating system
requirements, there are some limitations in its applicability. First we make the
assumption of single-threaded tasks. While this is true for highly trained military
domains in event-driven scenarios, it will not be the case in domains where
opportunistic behaviour is the norm. Another simplification is that we do not model
concurrency and communication in our scenarios. Since our scenarios are single-
threaded, concurrency is not a severe problem; furthermore, we argue that the SRA
tool uses approximate models so its value lies not in diagnosis of a completely
realistic task model but rather in comparative assessment of two (or more) different
designs using the same set of scenarios and analysis approach. Given these
limitations, the SRA provides a reasonable trade-off between modelling effort and
diagnostic power. However, in our ongoing research we are investigating concurrent
scenarios and communication within the BN analysis.
REFERENCES
[1] J. S. Anderson and B. Durley, “Using scenarios in deficiency-driven requirements
engineering,” presented at Requirements Engineering RE'93, 1993.
[2] J. S. Annett and K. D. Duncam, “Task analysis and training design,” Occupational
Psychology, vol. 41, pp. 211-221, 1967.
[3] R. W. Bailey, Human Performance Engineering: A Guide for System Designers. Englewood
Cliffs NJ: Prentice Hall, 1982.
[4] J. M. Carroll, Scenario-based design: Envisioning work and technology in system
development. New York.: Wiley, 1995.
[5] J. M. Carroll, M. B. Rosson, G. Chin, and J. Koenemann, “Requirements development in
scenario-based design,” IEEE Transactions on Software Engineering, vol. 24, pp. 1156 -
1170, 1998.
[6] K. Casey and C. Exton, “A Java 3D Implementation of a Geon Based Visualization tool for
UML,” presented at PPPJ, Kilkenny, Ireland, 2003.
[7] S. Cunning, J., “Test scenario generation from structural requirements specification,”
presented at Symposium on Engineering of Computer-Based Systems (ECBS '99), Nashville,
TN, USA, 1999.
[8] A. Davis and P. Hsia, “Giving voice to requirements engineering,” IEEE Software, vol. 11,
pp. 12-16, 1994.
[9] J. C. S. do Prado Leite and L. M. Cysneiros, “Nonfunctional Requirements: From Elicitation
to Conceptual Models,” IEEE Transactions on Software Engineering, vol. 30, pp. 328-350,
2004.

33
[10] P. Dubois, E. Dubois, and J. Zeippen, “On the Use of a Formal Representation,” presented at
3rd IEEE International Symposium on Requirements Engineering, Los Alamitos CA, 1997.
[11] G. Engels, “Model-Based Verification and Validation of properties,” Electronic Notes in
Theoretical Computer Science, vol. 82, 2003.
[12] N. Fenton, “Applying Bayesian belief networks to critical systems assessment,” Critical
Systems, vol. 8, pp. 10-13, 1999.
[13] N. Fenton, “A critique of software defect prediction models,” IEEE Transactions on Software
Engineering, vol. 25, pp. 675-689, 1999.
[14] N. Fenton and P. Cates, “JSIMP: BN model and tool for the SIMP project,” Queen Mary
(University of London), London 30 July 2003.
[15] N. Fenton, P. Krause, and M. Neil, “Software Measurement: Uncertainty and Causal
Modeling,” IEEE Software, vol. 10, pp. 116-122, 2002.
[16] N. Fenton and B. Littlewood, Software reliability and metrics: Elsevier, 1991.
[17] N. Fenton and N. Maiden, “Making Decisions: Using BNs and MCDA.” London.: Computer
Science Dept, Queen Mary and Westfield College, 2000.
[18] N. Fenton and M. Neil, “Software metrics: successes, failures and new directions,” Journal of
Systems Software, 2000.
[19] N. Fenton and S. L. Pfleeger, Software Metrics: A Rigorous Approach. London: International
Thomson Computer Press, 1997.
[20] A. Fuxman, M. Pistore, J. Mylopoulos, and P. Traverso, “Model Checking Early
Requirements Specifications in Tropos,” presented at International Symposium on
Requirements Engineering 01, Toronto, Canada, 2001.
[21] J. Galliers, S. Sutcliffe, and S. Minocha, “An impact analysis method for safety-critical user
interface design,” IEEE Transactions on Software Engineering, vol. 6, pp. 341-369, 1999.
[22] A. Gemino, “Empirical comparison of animation and narration in requirements validation,”
Requirements Engineering, vol. 9, pp. 153-168, 2003.
[23] A. Grau and M. Kowsari, “A validation system for object-oriented specifications of
information systems,” presented at 1st East European symposium on advances in databases
and information systems (ADBIS '97), St Petersburg, 1997.
[24] A. Gregoriades, J. E. Shin, and A. G. Sutcliffe. “Human-centred requirements engineering”. In
Proceedings: RE 04, Kyoto Japan,. Los Alamitos CA: IEEE Computer Society Press, pp154-
164, 2004.
[25] A. Gregoriades, A. G. Sutcliffe, and H. Karanikas, “Evaluation of the SRA Tool Using Data
Mining Techniques,” presented at CAiSE 2003, Klagenfurt/Velden, Austria, 2003.
[26] A. Gregoriades, A. G. Sutcliffe, and J. E. Shin, “Assessing the Reliability of Socio-technical
Systems,” presented at 12th Annual Symposium INCOSE, Las Vegas, USA, 2002.
[27] K. M. Hansen, A. P. Ravn, and V. Stavridou, “From safety analysis to software requirements,”
IEEE Transactions on Software Engineering, vol. 24, pp. 573 - 584, 1998.
[28] P. Haumer, K. Pohl, and K. Weidenhaupt, “Requirements elicitation and validation with real
world scenes,” IEEE Transactions on Software Engineering, vol. 24, pp. 1036-1054, 1998.

34
[29] C. Heitmeyer, J. Kirby, and B. Labaw, “Applying the SCR requirements method to a weapons
control panel: An experience report,” presented at FMSP 98, Clearwater Beach, Florida, USA,
1998.
[30] E. Hollnagel, Cognitive Reliability & Error Analysis Method: Elsevier Science, 1998.
[31] E. Hollnagel, Human Reliability Analysis Context and Control. New York: Academic Press,
1993.
[32] E. Hollnagel, “The phenotype of erroneous actions: Implications for HCI design,” in Human-
computer Interaction and complex systems, G. Weir and J. Alty, Eds. London: Academic
Press, 1990.
[33] P. Hsia, A. Davis, and D. Kung, “Status Report: Requirements engineering,” IEEE Software,
vol. 10, pp. 75-79, 1993.
[34] R. Jeffords and C. Heitmeyer, “A strategy for efficient verifying requirements specification
using composition and invariants,” presented at ESEC/FSE 03, Helsinki, Finland, 2003.
[35] B. I. Kirwan, A Guide to Practical Human Reliability Assessment. London: Taylor and
Francis, 1994.
[36] V. Lalioti, “Animation for validation of business system specifications,” presented at Hawaii
International Conference on System Sciences 30, The dynamics of business systems
engineering, Wailea, Hawaii, January 1997, pp 7-10, 1997.
[37] V. Lalioti and P. Loucopoulos, “Visualisation of conceptual specifications.,” Information
Systems, vol. 19, pp. 291-309, 1994.
[38] N. G. Leveson, “Intent specifications: an approach to building human-centered
specifications,” IEEE Transactions on Software Engineering, vol. 26, pp. 15 - 35, 2000.
[39] N. G. Leveson, Safeware: System Safety and Computers. Reading, MA.: Addison Wesley,
1995.
[40] J. Mylopoulos, L. Chung, and B. Nixon, “Representing and using non-functional
requirements: A process oriented approach,” IEEE Transactions on Software Engineering,
vol. 18, pp. 483-497, 1992.
[41] J. Mylopoulos, L. Chung, and E. Yu, “From Object-Oriented to Goal-Oriented Requirements
Analysis,” Communications of the ACM, vol. 42, pp. 1-7, 1999.
[42] M. Neil, N. Fenton, and L. Nielsen, “Building large-scale Bayesian Networks,” The
Knowledge Engineering Review, vol. 15, pp. 257-284, 2000.
[43] B. Nixon, “Management of performance requirements for information systems,” IEEE
Transactions on Software Engineering, vol. 26, pp. 1122 - 1146, 2000.
[44] D. Norman, The psychology of everyday things. New York: MIT Press, 1988.
[45] J. Pearl, Probabilistic Reasoning in Intelligent Systems: Networks of Plausible Information.
San Francisco: Morgan Kaufmann, 1988.
[46] C. Potts, “ ScenIC: A strategy for inquiry-driven requirements determination,” presented at
RE'99: International Symposium on Requirements Engineering, Limerick, Ireland, 1999.
[47] C. Potts and A. Anton, “A Representational Framework for Scenarios of System Use,”
Requirements Engineering, vol. 3, pp. 219-241, 1998.

35
[48] C. Potts, K. Takahashi, and A. Anton, “Inquiry-Based Requirements Analysis,” IEEE
Software, vol. 11, pp. 21-32, 1994.
[49] C. Potts, K. Takahashi, J. Smith, and K. Ota, “An Evaluation of Inquiry-Based Requirements
Analysis for an Internet Service,” presented at Second International Symposium on
Requirements Engineering, York, UK, 1995.
[50] J. Rasmussen, “Human Error and the Problem of Causality in Analysis of Accidents,”
Philosophical Transactions of the Royal Society of London Series B - Biological Sciences, vol.
327, pp. 449-462, 1990.
[51] J. Rasmussen, “ Skills, rules, knowledge; signals, signs, and symbols; and other distinctions in
human performance models,” IEEE Transactions on System Man and Cybernetics, vol. 13,
pp. 257-266., 1983.
[52] J. Reason, Human Error. New York: Cambridge University Press, 1990.
[53] J. Reason, Managing the Risks of Organizational Accidents. Ashgate: Aldershot, 2000.
[54] C. Rolland, C. Souveyet, and C. B. Achour, “Guiding goal modeling using scenarios,” IEEE
Transactions on Software Engineering, vol. 24, pp. 1055 - 1071, 1998.
[55] J. Ryser and M. Glinz, “A scenario-based approach to validating and testing software systems
using statecharts,” presented at 12th International Conference on Software and Systems
Engineering and their Applications ICSSEA' 99, Paris, France, 1999.
[56] N. Seyff, P. Grunbacher, N. Maiden, and A. Toscar, “Requirements engineering tools go
mobile,” presented at International conference on software engineering (ICSE 04), Scotland,
2004.
[57] J. E. Shin, A. Sutcliffe, and A. Gregoriades, “Scenario Advisor Tool for Requirements
Engineering,” Requirements Engineering, vol. Online
http://www.springerlink.com/app/home/journal.asp?wasp=m3tlwhruwl4u54qmhqvl&referrer=
parent&backto=linkingpublicationresults,1:102830,1, 2004.
[58] Sutcliffe, A.G. The Domain Theory: Patterns for Knowledge and Software Reuse. Mahwah
NJ: Lawrrence Erlbaum Associates, 2002.
[59] A. G. Sutcliffe, J. Galliers, and S. Minocha, “Human Errors and System Requirements,”
presented at 4th IEEE International Symposium on Requirements Engineering, Los Alamitos,
1999.
[60] A. G. Sutcliffe and A. Gregoriades. “Validating Functional System Requirements with
Scenarios.” In Proceedings of 1st IEEE Joint International Conference on Requirements
Engineering, RE02, Essen, Germany Sept 2002, Eds Greenspan S., Siddiqi J., Dubois E. and
Pohl K., pp 181-190. Los Alamitos CA: IEEE Computer Society Press, 2002.
[61] A. Sutcliffe, N. Maiden, S. Minocha, and M. Darrel, “Supporting scenario based requirements
engineering,” IEEE Transactions on software engineering, vol. 24, pp. 1072-1088., 1998.
[62] A. G. Sutcliffe and G. Rugg, “A taxonomy of error types for failure analysis and risk
assessment,” International Journal of Human Computer Interaction, vol. 10, pp. 381-406.,
1998.
[63] A. Sutcliffe, G. and M. Ryan, “Assessing the Usability and Efficiency of Design Rationale,”
presented at Human Computer Interaction INTERACT-97, IFIP/Chapman and Hall, 1997.
[64] A. D. Swain and H. Guttmann, “Handbook of human reliability analysis with emphasis on
nuclear power plants applications,” Nuclear Regulatory Commission, Washington, DC 1983.

36
[65] A. van Lamsweerde, “Goal-Oriented Requirements Engineering: A Guided Tour,” presented
at Fifth IEEE International Symposium on Requirements Engineering (RE '01), 2001.
[66] A. van Lamsweerde, “Goal-oriented requirements engineering: a roundtrip from research to
practice,” presented at Requirements Engineering Conference, Kyoto, Japan, 2004.
[67] A. van Lamsweerde and E. Letier, “Handling obstacles in goal-oriented requirements
engineering,” IEEE Transactions on Software Engineering, vol. 26, pp. 978 - 1005, 2000.
[68] M. Visser and P. A. Wieringa, “PREHEP: human error probability based process unit
selection,” IEEE Transactions on Software Engineering, vol. 31, pp. 1 - 15, 2001.
[69] D. Wright and K. Cai, “Representing uncertainty for safety critical systems,” City University,
London 1994.
[70] E. Yu and J. Mylopoulos, “Towards Modelling Strategic Actor Relationships for Information
Systems Development, with Examples from Business Process Reengineering,” presented at
4th Workshop on Information Technologies and Systems, Vancouver, B.C., Canada, 1994.
[71] H. Zhu and L. Jin, “Scenario analysis in an automated tool for requirements engineering,”
Requirements Engineering, vol. 5, pp. 2-22, 2000.
[72] H. Ziv and D.J. Richardson. “Constructing Bayesian-network Models of Software Testing and
Maintenance Uncertainties”, International Conference on Software Maintenance, Bari, Italy,
September 1997.
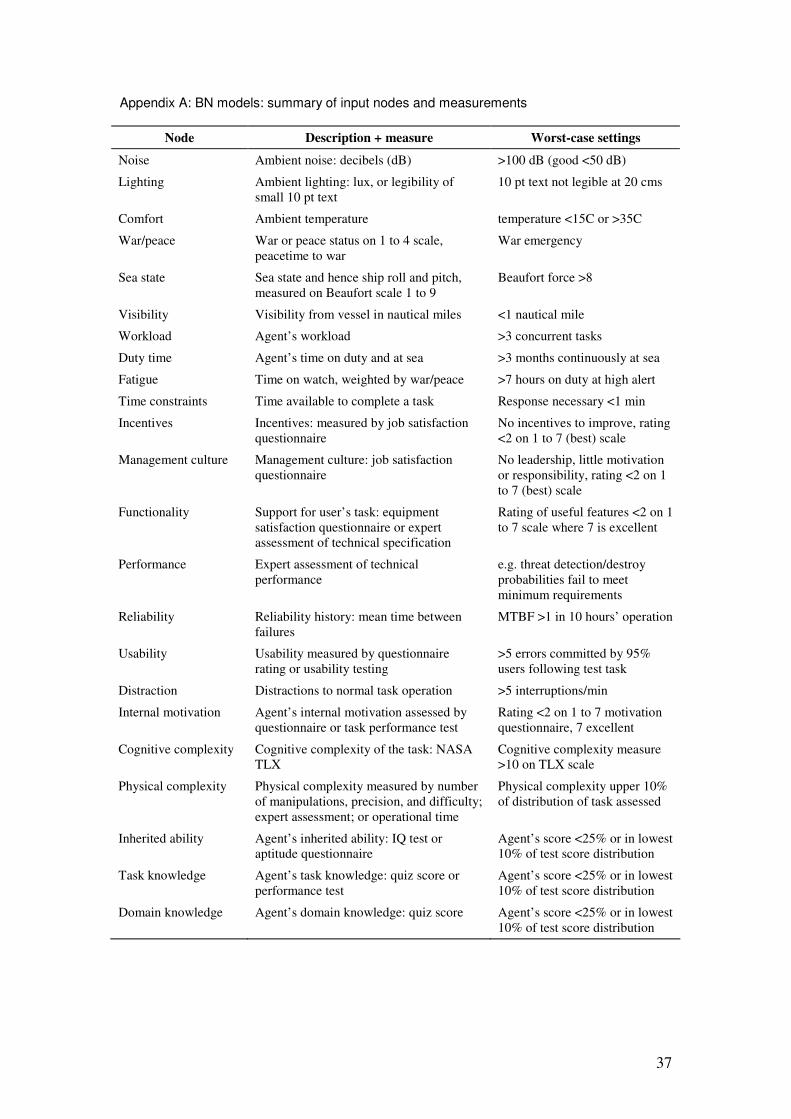
37
Appendix A: BN models: summary of input nodes and measurements
Node Description + measure Worst-case settings
Noise Ambient noise: decibels (dB) >100 dB (good <50 dB)
Lighting Ambient lighting: lux, or legibility of
small 10 pt text
10 pt text not legible at 20 cms
Comfort Ambient temperature temperature <15C or >35C
War/peace War or peace status on 1 to 4 scale,
peacetime to war
War emergency
Sea state Sea state and hence ship roll and pitch,
measured on Beaufort scale 1 to 9
Beaufort force >8
Visibility Visibility from vessel in nautical miles <1 nautical mile
Workload Agent’s workload >3 concurrent tasks
Duty time Agent’s time on duty and at sea >3 months continuously at sea
Fatigue Time on watch, weighted by war/peace >7 hours on duty at high alert
Time constraints Time available to complete a task Response necessary <1 min
Incentives Incentives: measured by job satisfaction
questionnaire
No incentives to improve, rating
<2 on 1 to 7 (best) scale
Management culture Management culture: job satisfaction
questionnaire
No leadership, little motivation
or responsibility, rating <2 on 1
to 7 (best) scale
Functionality Support for user’s task: equipment
satisfaction questionnaire or expert
assessment of technical specification
Rating of useful features <2 on 1
to 7 scale where 7 is excellent
Performance Expert assessment of technical
performance
e.g. threat detection/destroy
probabilities fail to meet
minimum requirements
Reliability Reliability history: mean time between
failures
MTBF >1 in 10 hours’ operation
Usability Usability measured by questionnaire
rating or usability testing
>5 errors committed by 95%
users following test task
Distraction Distractions to normal task operation >5 interruptions/min
Internal motivation Agent’s internal motivation assessed by
questionnaire or task performance test
Rating <2 on 1 to 7 motivation
questionnaire, 7 excellent
Cognitive complexity Cognitive complexity of the task: NASA
TLX
Cognitive complexity measure
>10 on TLX scale
Physical complexity Physical complexity measured by number
of manipulations, precision, and difficulty;
expert assessment; or operational time
Physical complexity upper 10%
of distribution of task assessed
Inherited ability Agent’s inherited ability: IQ test or
aptitude questionnaire
Agent’s score <25% or in lowest
10% of test score distribution
Task knowledge Agent’s task knowledge: quiz score or
performance test
Agent’s score <25% or in lowest
10% of test score distribution
Domain knowledge Agent’s domain knowledge: quiz score Agent’s score <25% or in lowest
10% of test score distribution

38
Appendix B: Alternative designs for the aircraft carrier’s aircraft weapons loading system
Design 1: Manual Design 2:
Increased Automation Tasks
Agent Technology Agent Technology
Plan weapons load for mission APO Weapons aircraft
availability display
APO Automated weapons
aircraft allocation
system
Schedule weapons load
sequence
DAPO Flight deck display APO Aircraft weapons load
scheduler
Communicate load plan to
flight deck and magazine
DAPO Radio DAPO Data link
Plan weapons retrieval MWS Weapons layout chart MWS Weapons layout chart
Retrieve weapons from
magazine
MA Weapons retrieval trolley MWS Weapons retrieval robot
Load weapons onto
transporter
MA Weapons trolley MA Weapons autoload
palette
Place transporter on hoist MA Weapons trolley MA Weapons autoload
palette
Operate hoist MA Hoist MA Autoload hoist
Transfer weapons to aircraft WA Weapons trolley WA Weapons autoload
palette
Check aircraft is grounded WTS Ground cable indicator WTS Ground cable indicator
Check safety pins WTS Safety pins WTS Safety pins
Check armament is set to off WTS Armament indicator WTS Armament indicator
Check power is off WTS Power indicator WTS Power indicator
Position weapons loading
equipment under aircraft wing
WA Weapons loading trolley WA Weapons autoload
palette
Orient weapons loading
equipment
WA Weapons loading trolley WA Weapons autoload
palette
Lift and position weapons on
wing
WA Weapons loading trolley WA Weapons autoload
palette
Test weapons connection WTS Aircraft weapon mounts WTS Weapons autoload
palette
Remove weapons loading
equipment
WA Weapons loading trolley WA Weapons autoload
palette
Inspect weapons WLC Weapon racks and mounts WLC Weapon racks and
mounts
Arm weapons WTS Weapon controls WTS Weapon controls
Report load completion WTS Radio WTS Data link

39
Andreas Gregoriades holds a PhD and MPhil in Computer Science from UMIST
(University of Manchester Institute of Science and Technology). Currently he is
employed as a Research Fellow at the Surrey Defence Technology Centre (DTC). His
research interests cover Artificial Intelligence for smart Decision Support, Systems
Engineering, Human Reliability Assessment and Software Engineering. He has been
involved in a number of EPSRC and European R&D projects in the areas of Complex
Socio-technical Systems Design, Business Process Modelling and Simulation,
Requirements Engineering and Systems Reliability Assessment. He has also acted as
a reviewer for IEEE Transactions on Knowledge and Data Engineering and for
various International Conferences and Workshops.
Alistair Sutcliffe is Professor of Systems Engineering, in the School of Informatics,
University of Manchester. He has been principle investigator on numerous EPSRC
and European Union projects on requirements engineering, multimedia user
interfaces, safety critical systems and cognitive modelling for information retrieval.
He researches in Human Computer Interaction and Software Engineering. In HCI
particular interests are interaction theory, and user interface design methods for web
sites, multimedia, virtual reality, safety critical systems, and design of complex socio-
technical systems. In software engineering he specialises in requirements engineering
methods and tools, scenario based design, knowledge reuse and theories of domain
knowledge. Alistair Sutcliffe on the editorial board of ACM-TOCHI, REJ and JASE.
Alistair Sutcliffe and is the editor of the ISO standard 14915 part 3, on Multimedia
user interface design. He has over 200 publications including five books and several
edited volumes of papers and was awarded the IFIP silver core in 2000.

40