Embed Size (px)
Citation preview
http://ppq.sagepub.com/Party Politics
http://ppq.sagepub.com/content/16/6/823The online version of this article can be found at:
DOI: 10.1177/1354068809346078
2010 16: 823 originally published online 11 May 2010Party PoliticsSusan E. Scarrow and Burcu Gezgor
members in a new eraDeclining memberships, changing members? European political party
Published by:
http://www.sagepublications.com
On behalf of:
Political Organizations and Parties Section of the American Political Science Association
can be found at:Party PoliticsAdditional services and information for
http://ppq.sagepub.com/cgi/alertsEmail Alerts:
http://ppq.sagepub.com/subscriptionsSubscriptions:
http://www.sagepub.com/journalsReprints.navReprints:
http://www.sagepub.com/journalsPermissions.navPermissions:
http://ppq.sagepub.com/content/16/6/823.refs.htmlCitations:
What is This?
- May 11, 2010 OnlineFirst Version of Record
- Oct 21, 2010Version of Record >>
by guest on October 17, 2013ppq.sagepub.comDownloaded from by guest on October 17, 2013ppq.sagepub.comDownloaded from by guest on October 17, 2013ppq.sagepub.comDownloaded from by guest on October 17, 2013ppq.sagepub.comDownloaded from by guest on October 17, 2013ppq.sagepub.comDownloaded from by guest on October 17, 2013ppq.sagepub.comDownloaded from by guest on October 17, 2013ppq.sagepub.comDownloaded from by guest on October 17, 2013ppq.sagepub.comDownloaded from by guest on October 17, 2013ppq.sagepub.comDownloaded from by guest on October 17, 2013ppq.sagepub.comDownloaded from by guest on October 17, 2013ppq.sagepub.comDownloaded from by guest on October 17, 2013ppq.sagepub.comDownloaded from by guest on October 17, 2013ppq.sagepub.comDownloaded from by guest on October 17, 2013ppq.sagepub.comDownloaded from by guest on October 17, 2013ppq.sagepub.comDownloaded from by guest on October 17, 2013ppq.sagepub.comDownloaded from by guest on October 17, 2013ppq.sagepub.comDownloaded from by guest on October 17, 2013ppq.sagepub.comDownloaded from by guest on October 17, 2013ppq.sagepub.comDownloaded from by guest on October 17, 2013ppq.sagepub.comDownloaded from by guest on October 17, 2013ppq.sagepub.comDownloaded from by guest on October 17, 2013ppq.sagepub.comDownloaded from
Article
Declining memberships,changing members?European political partymembers in a new era
Susan E. ScarrowUniversity of Houston, USA
Burcu GezgorUniversity of Houston, USA
AbstractIn recent years, membership in established political parties has been shrinking, but at thesame time members of some parties have received increased powers to help selectcandidates, leaders and party policies. These twin trends make it important to re-examine who is joining today’s smaller parties. As parties shrink, do they attract a chan-ged mixture of members, possibly with different political priorities? Using data from twosets of European surveys, our study investigates this question to study longitudinalchange in party membership. The data show a growing gap between the age of partymembers and the general population. In most other respects, however, party membersseem to be becoming more, not less, like their fellow citizens. This suggests that today’ssmaller but more powerful memberships still have the potential to help link their partiesto a wider electoral base.
KeywordsDemographics, ideological distance, members, membership composition
Paper submitted 14 November 2008; accepted for publication 9 February 2009
Corresponding author:
Susan E. Scarrow, Department of Political Science, University of Houston, Houston, TX 77204–3011, USA.
Email: [email protected]
Party Politics16(6) 823–843
ª The Author(s) 2010Reprints and permission:
sagepub.co.uk/journalsPermissions.navDOI: 10.1177/1354068809346078
ppq.sagepub.com
823

Introduction
In recent years, many established political parties have experienced a seemingly
paradoxical transformation: their memberships have shrunk, but at the same time indi-
vidual party members have gained new powers to shape party policies and pick party
candidates and leaders. In fact, these dual developments are not entirely coincidental:
some parties have expanded intra-party democracy in direct response to declining
membership and to growing public suspicion of political parties. These parties have
given members new roles and new visibility in the hope of increasing both their own
legitimacy and the appeal of party membership (Dalton, 2005; Dalton and Weldon,
2005). And even in parties that have not shifted new powers to members, in this hostile
climate party members could be more important than ever for providing links between
party leaders and local communities. For all these reasons, it is more important than ever
to ask who is joining these shrinking parties. In particular, we want to know whether the
decrease in party membership tends to be accompanied by a qualitative shift: as joining a
party has become less common, have parties’ members become less like other citizens?
Thanks to a growing body of surveys of members of single parties, we know much
more than we used to about the motivations for participation in political parties, and
about the profiles of those who enrol (for instance, Cross and Young, 2004; Gallagher
and Marsh, 2004; Heidar and Saglie, 2003; Heinrich et al., 2002; Pedersen, 2004; Seyd
and Whiteley, 1992, 2004; van Holsteyn, 2001; Whiteley et al., 1994). These national
studies, along with a handful of cross-national studies, have provided nuanced pictures
of the differences between those who merely support a party and those who choose to
join one. However, we have far fewer cross-national and cross-temporal studies of
patterns of participation within political parties. This is unfortunate, because there are
good reasons to suspect that the recent and widespread reduction in party membership
size may have been accompanied by more general changes in the characteristics of those
who join and stay in party politics. Most importantly, we know that the internal life of
many parties has changed, not least because of their smaller sizes. In addition, many
parties have deliberately altered the mixture of membership incentives that they offer;
for instance, highlighting selective incentives that may be accessible from the home
computer, such as member-only informational websites, in lieu of a prior emphasis on
solidary incentives. What we do not know is whether these changes have affected the
profiles of citizens who seek out party membership. The research presented here exam-
ines this question using cross-national survey data from 12 European democracies in two
eras. The quantitative decline in party membership in most of these countries is well
documented; this study examines the extent to which quantitative changes in party
membership have been accompanied by qualitative changes in the profiles of party
memberships, changes that might have an impact on wider democratic processes.
The changing face of membership parties
For over a century, some European political parties have enrolled members as a key part
of their organizational strategies. As Maurice Duverger famously described, this organi-
zational technique was first widely adopted by parties of the left, but its apparent success
824 Party Politics 16(6)
824
led other parties to adopt their own campaigns of membership recruitment (Duverger,
1955). By the middle of the 20th century, the heyday of membership parties, it was not
uncommon for parties in European democracies to claim enrolments in excess of 10 per-
cent of the party vote. Since then, however, party memberships in European and other
established democracies have generally shrunk in both absolute and relative terms.
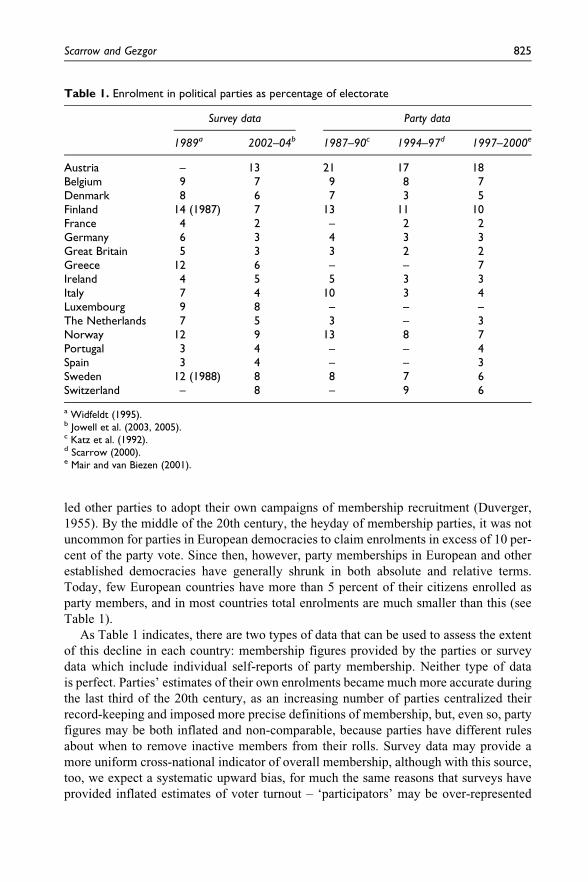
Today, few European countries have more than 5 percent of their citizens enrolled as
party members, and in most countries total enrolments are much smaller than this (see
Table 1).
As Table 1 indicates, there are two types of data that can be used to assess the extent
of this decline in each country: membership figures provided by the parties or survey
data which include individual self-reports of party membership. Neither type of data
is perfect. Parties’ estimates of their own enrolments became much more accurate during
the last third of the 20th century, as an increasing number of parties centralized their
record-keeping and imposed more precise definitions of membership, but, even so, party
figures may be both inflated and non-comparable, because parties have different rules
about when to remove inactive members from their rolls. Survey data may provide a
more uniform cross-national indicator of overall membership, although with this source,
too, we expect a systematic upward bias, for much the same reasons that surveys have
provided inflated estimates of voter turnout – ‘participators’ may be over-represented
Table 1. Enrolment in political parties as percentage of electorate
Survey data Party data
1989a 2002–04b 1987–90c 1994–97d 1997–2000e
Austria – 13 21 17 18Belgium 9 7 9 8 7Denmark 8 6 7 3 5Finland 14 (1987) 7 13 11 10France 4 2 – 2 2Germany 6 3 4 3 3Great Britain 5 3 3 2 2Greece 12 6 – – 7Ireland 4 5 5 3 3Italy 7 4 10 3 4Luxembourg 9 8 – – –The Netherlands 7 5 3 – 3Norway 12 9 13 8 7Portugal 3 4 – – 4Spain 3 4 – – 3Sweden 12 (1988) 8 8 7 6Switzerland – 8 – 9 6
a Widfeldt (1995).b Jowell et al. (2003, 2005).c Katz et al. (1992).d Scarrow (2000).e Mair and van Biezen (2001).
Scarrow and Gezgor 825
825

in samples, people who once were members may report that they still are, and the
question may prompt false responses from some people who feel guilty that they are not
members. Yet, despite these imperfections (or perhaps because the biases are positive in
both cases), survey data and party data present remarkably similar national portraits of
overall party membership levels and of membership declines in the established political
parties of Western Europe. When comparing the data from the two sources in Table 1,
what stands out is that for most countries the party and survey estimates are within 2 per-
centage points of each other. The similarity of these measures reinforces our confidence
in using surveys to study party membership, since surveys apparently do not greatly
over- or under-sample party members.
Whichever type of data we examine, we see that almost all the countries in the sample
experienced at least small drops in party enrolment in the extended decade that lasted
from the late 1980s to the early part of the 21st century. The only exceptions were Ire-
land, Portugal and Spain, which showed a slight increase according to one of the indica-
tors (survey data). In short, the picture painted by both types of data is of Western
European political parties with a modest and declining ability to enrol their supporters.
Can it really matter if party enrolment falls from an already tiny 7 percent to an even
tinier 5 percent of the population? The answer depends in part on whether this quantitative
change signals a simultaneous qualitative shift in the characteristics and priorities of those
who remain within the parties. If so, such a change might have a great impact on the parties
and on the wider arena of political competition, not least because in many countries party
members have a large and, in some cases, increasing role in shaping party decisions.
In recent years there has been a global trend for parties in both new and established
democracies to adopt more internal democracy, a trend that transfers new powers to indi-
vidual party members. In some cases, this change has come about as a direct response to
the drop in membership enrolments, as well as to apparently growing public discontent
with out-of-touch parties and political leaders. In the face of these twin pressures, many
parties have re-written their constitutions to give members a greater direct role in select-
ing party candidates, party leaders and even party policies (Adams and Merrill, 2008;
Pennings and Hazan, 2001). For instance, as part of this trend, in the United Kingdom
in 2005 members of the (opposition) Conservative and Liberal Democrat parties selected
new party leaders in contests that very much resembled general elections, complete with
broadcast debates between the leading candidates. Similarly, in Italy in 2005 Romano
Prodi cemented his claim to lead his party by securing the nomination in a newly insti-
tuted party primary. In 2006, the French Socialists picked their presidential candidate in
a closed primary that resulted in an upset victory for a candidate once regarded within her
own party as an upstart challenger (Segolene Royal). As these examples suggest, it is not
merely the case that party members have been granted new rights: in at least some
instances members’ participation produces outcomes that were otherwise unlikely, and
which have an important impact on the wider polity. As parties increasingly employ
membership contests to enhance the legitimacy of their candidates and leaders, the deci-
sions of this small group, the party members, are becoming more important than ever for
shaping political competition and political careers. Hence, if the quantitative decline in
party membership signals ongoing qualitative changes in the composition of member-
ships, these changes could have a broad impact on national political life.
826 Party Politics 16(6)
826
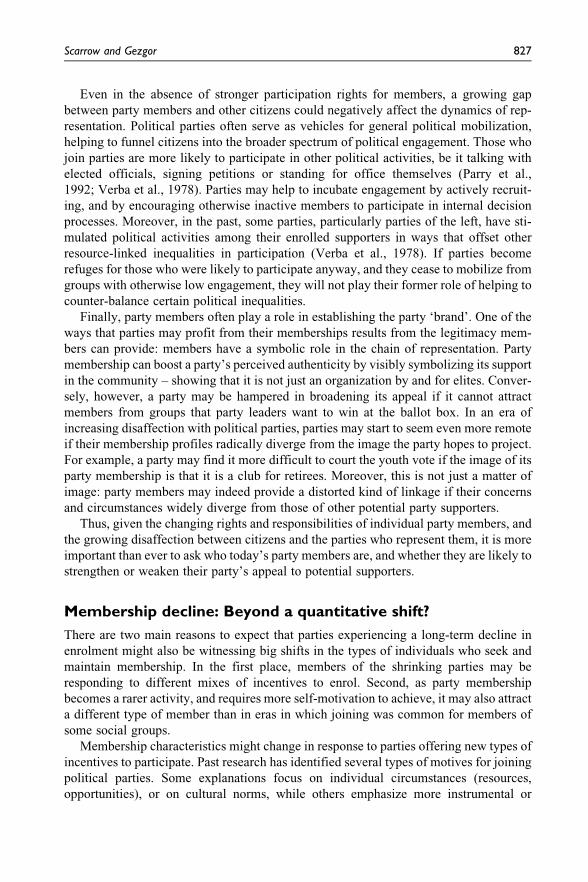
Even in the absence of stronger participation rights for members, a growing gap
between party members and other citizens could negatively affect the dynamics of rep-
resentation. Political parties often serve as vehicles for general political mobilization,
helping to funnel citizens into the broader spectrum of political engagement. Those who
join parties are more likely to participate in other political activities, be it talking with
elected officials, signing petitions or standing for office themselves (Parry et al.,
1992; Verba et al., 1978). Parties may help to incubate engagement by actively recruit-
ing, and by encouraging otherwise inactive members to participate in internal decision
processes. Moreover, in the past, some parties, particularly parties of the left, have sti-
mulated political activities among their enrolled supporters in ways that offset other
resource-linked inequalities in participation (Verba et al., 1978). If parties become
refuges for those who were likely to participate anyway, and they cease to mobilize from
groups with otherwise low engagement, they will not play their former role of helping to
counter-balance certain political inequalities.
Finally, party members often play a role in establishing the party ‘brand’. One of the
ways that parties may profit from their memberships results from the legitimacy mem-
bers can provide: members have a symbolic role in the chain of representation. Party
membership can boost a party’s perceived authenticity by visibly symbolizing its support
in the community – showing that it is not just an organization by and for elites. Conver-
sely, however, a party may be hampered in broadening its appeal if it cannot attract
members from groups that party leaders want to win at the ballot box. In an era of
increasing disaffection with political parties, parties may start to seem even more remote
if their membership profiles radically diverge from the image the party hopes to project.
For example, a party may find it more difficult to court the youth vote if the image of its
party membership is that it is a club for retirees. Moreover, this is not just a matter of
image: party members may indeed provide a distorted kind of linkage if their concerns
and circumstances widely diverge from those of other potential party supporters.
Thus, given the changing rights and responsibilities of individual party members, and
the growing disaffection between citizens and the parties who represent them, it is more
important than ever to ask who today’s party members are, and whether they are likely to
strengthen or weaken their party’s appeal to potential supporters.
Membership decline: Beyond a quantitative shift?
There are two main reasons to expect that parties experiencing a long-term decline in
enrolment might also be witnessing big shifts in the types of individuals who seek and
maintain membership. In the first place, members of the shrinking parties may be
responding to different mixes of incentives to enrol. Second, as party membership
becomes a rarer activity, and requires more self-motivation to achieve, it may also attract
a different type of member than in eras in which joining was common for members of
some social groups.
Membership characteristics might change in response to parties offering new types of
incentives to participate. Past research has identified several types of motives for joining
political parties. Some explanations focus on individual circumstances (resources,
opportunities), or on cultural norms, while others emphasize more instrumental or
Scarrow and Gezgor 827
827

goal-oriented reasons for joining. Instrumental motives can range from the hope of
furthering a collective political goal to the goal of obtaining selective benefits such as
patronage pay-offs or social entertainment. Whiteley and Seyd’s general incentives model
focuses on these instrumental rewards, arguing that it is the direct (selective) rewards of
participation, including positive emotional rewards, which best explain why people engage
in ‘high intensity’ forms of participation, such as joining a political party (Whiteley and
Seyd, 2002). Factors such as these look particularly important for explaining contemporary
enrolment precisely because some traditional motives for joining seem to have weakened.
In particular, there has been a decline in the various cultural milieus that once may have
promoted party membership as an expression of group solidarity. At the same time, civic
norms about political participation may be changing to favour other outlets, not least
because citizens seem to have a diminishing regard for political parties (Dalton and
Weldon, 2005). If the cultural and social incentives to join parties are shrinking, instrumen-
tal and ideological reasons are likely to loom larger in the considerations of those who
continue to be attracted by party membership. These effects are likely to be magnified
by parties’ responses to a shrinking membership: if potential members are more interested
in the political benefits of membership, and less interested in the social rewards, we would
expect parties to adjust their offerings of each. As a result of such changes in the motives
for, and rewards of, membership we would expect to see shifts in the concerns and prio-
rities of those who join, with members as a group becoming more ideologically motivated.
In fact, Whiteley and Seyd (2002) conclude from their research on British party mem-
bers that this is precisely the case. According to them, parties which attract members
with more opportunities for ‘plebiscitary’ participation, but fewer group-based solidary
rewards, may wind up with members who are only loosely attached to the party and are
not otherwise active within it. If their findings hold more generally, the quantitative
decline in party memberships may be accompanied by a qualitative shift that is at least
as important, even if it is less visible.
Another corollary of shrinking size, and of the weakening of group-based incentives
for membership, may be an increase in the threshold for membership in terms of individ-
ual resources. As party membership becomes a rarer activity, and as citizens are there-
fore less likely to know party members who might recruit them, party membership seems
likely to become a bastion for political ‘self-starters’. Research on political participation
has identified resources of time, income and cognitive mobilization as assets that encour-
age participation; these resources become more important the more involved the activ-
ities. Thus, we might expect to find that, as party membership shrinks, party members
may become less representative of fellow citizens in terms of their economic and educa-
tional resources.
In short, there are good reasons to believe that the quantitative decline in memberships
may have been accompanied by potentially important changes in the characteristics and
priorities of those who join. Have such shifts occurred in European parties in recent years?
A changing profile of party membership?
In demographic terms, party memberships have never been an accurate mirror of the
population. Past studies have shown that party members are like those who engage in
828 Party Politics 16(6)
828

other high intensity political activities: they tend to be above average in terms of income,
age and education. They also are more likely to be male than female, and to be middle class
rather than working class. Union membership has generally promoted participation in
political parties as well as in other political activities. For some parties on the right, reli-
giosity has seemed to be a promoter of party membership, with those who attend religious
services on a regular basis more likely to join a political party. These patterns have held
across a wide range of countries and across most types of parties (Parry et al., 1992; Verba
et al., 1978; Widfeldt, 1995; and surveys of individual parties cited above). How valid are
these generalizations today? Have these disparities been exacerbated as joining a party has
become an even more rarified activity?
To answer this question, our research investigates changes in the characteristics of
European party members over the ‘long decade’ between the late 1980s and the early
years of the 21st century. As Table 1 shows, this was a period when party memberships
were shrinking in most established European democracies. By comparing data from a
series of Eurobarometer studies from 1989 to 1991 (EB 30, 31, 31A and 32) with data
from the European Social Surveys (ESS) from 2002/03 and 2004/05, we can construct
a good picture of what types of people are now joining political parties, and how, if at
all, this changed over a period when party memberships were generally shrinking. We
group these surveys into two time periods (here abbreviated 1990s and 2000s) in order
to have a relatively large sample of party members from each of the two eras. (Details on
coding are presented in the Appendix.) Because our focus is on change, we look only at
the countries that are included in both surveys.
The Eurobarometer data that we use were previously analysed by Anders Widfeldt in
his portrait of party members at the beginning of the 1990s (1995). We begin by essen-
tially replicating some of his findings, but using data from both periods so that we can
compare the change in the characteristics of party members, both in absolute terms and
in comparison with the general population. Since we are primarily interested in the repre-
sentativeness of party supporters, this latter, relative, relation is of greatest interest to us.1
We contrast the portraits provided by the two data sets to see how much has changed. We
then model party membership in both eras, constructing a more comprehensive picture of
change in the characteristics and political positions of party members. We conclude with
a discussion of what we can learn from these parallel snapshots about likely future devel-
opments within member-based political parties, and within the democracies in which
such parties continue to play critical roles.
To compare our samples in terms of demographic representativeness, we look at six
characteristics: age, gender, education level, union membership, income level and reli-
giosity. All were measured similarly enough in each of the studies to enable meaningful
comparisons. In each case, our method is to look at the differences between party mem-
bers and the general population, considering whether the gap grew or diminished over
the long decade between the two sets of studies.
Age
For a long time, the average age of party members has been higher than the average
population (with the big exception being parties of the left and the ‘new left’ in the
Scarrow and Gezgor 829
829

1970s and early 1980s). Though this older age is not new, it may be of renewed
importance in an era when pressing public policy issues like pension reform have the
potential to divide interests along generational lines. Age structure seems likely to have
been affected by the decline in memberships, because in many parties the drop in mem-
bership apparently has affected the enrolment of new (younger) members more steeply
than the retention of existing (older) members (Bruter and Harrison, 2009; Cross and
Young, 2008).
Given the importance of pension issues in most European democracies, one politi-
cally relevant way to measure age disparities is to compare the proportion of the general
population which is close to or at retirement age (over 60 and under 81) with similar
figures for party members. This shows that at the beginning of the 21st century party
members in most countries were older than the adult electorate as a whole (indicated
by a positive difference score), and in some countries they were much older (see Table 2).
Importantly, the figures from the more recent time period show a sharp increase in a
trend that was already evident in the 1990s. Nine of the 12 countries for which data were
available saw jumps in their difference scores, many of them representing large changes
in the relative sizes of the two groups; only two countries saw minor declines in this
disparity (The Netherlands and Spain). In the later data, only three countries (Spain,
Portugal, Greece) bucked the general trend, having a smaller percentage of older
Table 2. Age and party membership. Percentage older party members compared with the generalpopulation
1990s 2000s
Partymembers Population
Partymembers Population
%60þ N
%60þ N Diff a
%60þ N
%60þ N Diff a
Changein diff.
Belgium 19 (65) 20 (966) –1 31 (75) 21 (689) 10* þDenmark 30 (130) 22 (1049) 8* 37 (63) 22 (606) 15* þFrance 24 (32) 22 (1030) 2 42 (28) 25 (789) 17* þGermany 24 (66) 24 (1253) 0 32 (56) 26 (1359) 6 þGreat Britain 29 (64) 24 (1452) 5 56 (50) 27 (978) 29* þGreece 14 (46) 21 (992) –7* 31 (90) 32 (1491) –1 þIreland 15 (23) 19 (869) –4 41 (91) 23 (936) 18 þItaly 17 (62) 20 (950) –3 30 (31) 24 (618) 6* þLuxembourg 18 (21) 18 (254) 0 36 (98) 20 (576) 16* þNetherlands 34 (105) 21 (995) 13* 34 (70) 25 (985) 9* –Portugal 17 (14) 21 (988) –4 26 (30) 30 (999) –4 0Spain 16 (14) 22 (1026) –6 17 (19) 25 (790) –8* –
Adult ¼ those from 18 to 80.Comparison of ESS surveys from the 2000s with Eurobarometer surveys from the 1990s.* Difference between members and population is significant at 0.05 level.a Difference between party members and population.
830 Party Politics 16(6)
830
members than the general population. This is not surprising, since in these newest of the
Western European democracies today’s 60-year-olds did not have the opportunity to join
today’s parties in their youth.
Gender
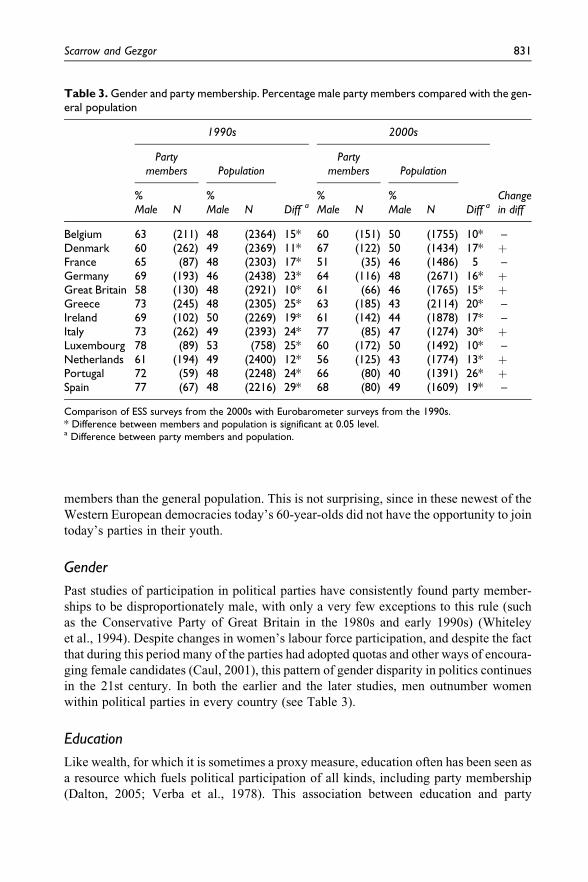
Past studies of participation in political parties have consistently found party member-
ships to be disproportionately male, with only a very few exceptions to this rule (such
as the Conservative Party of Great Britain in the 1980s and early 1990s) (Whiteley
et al., 1994). Despite changes in women’s labour force participation, and despite the fact
that during this period many of the parties had adopted quotas and other ways of encoura-
ging female candidates (Caul, 2001), this pattern of gender disparity in politics continues
in the 21st century. In both the earlier and the later studies, men outnumber women
within political parties in every country (see Table 3).
Education
Like wealth, for which it is sometimes a proxy measure, education often has been seen as
a resource which fuels political participation of all kinds, including party membership
(Dalton, 2005; Verba et al., 1978). This association between education and party
Table 3. Gender and party membership. Percentage male party members compared with the gen-eral population
1990s 2000s
Partymembers Population
Partymembers Population
%Male N
%Male N Diff a
%Male N
%Male N Diff a
Changein diff
Belgium 63 (211) 48 (2364) 15* 60 (151) 50 (1755) 10* –Denmark 60 (262) 49 (2369) 11* 67 (122) 50 (1434) 17* þFrance 65 (87) 48 (2303) 17* 51 (35) 46 (1486) 5 –Germany 69 (193) 46 (2438) 23* 64 (116) 48 (2671) 16* þGreat Britain 58 (130) 48 (2921) 10* 61 (66) 46 (1765) 15* þGreece 73 (245) 48 (2305) 25* 63 (185) 43 (2114) 20* –Ireland 69 (102) 50 (2269) 19* 61 (142) 44 (1878) 17* –Italy 73 (262) 49 (2393) 24* 77 (85) 47 (1274) 30* þLuxembourg 78 (89) 53 (758) 25* 60 (172) 50 (1492) 10* –Netherlands 61 (194) 49 (2400) 12* 56 (125) 43 (1774) 13* þPortugal 72 (59) 48 (2248) 24* 66 (80) 40 (1391) 26* þSpain 77 (67) 48 (2216) 29* 68 (80) 49 (1609) 19* –
Comparison of ESS surveys from the 2000s with Eurobarometer surveys from the 1990s.* Difference between members and population is significant at 0.05 level.a Difference between party members and population.
Scarrow and Gezgor 831
831
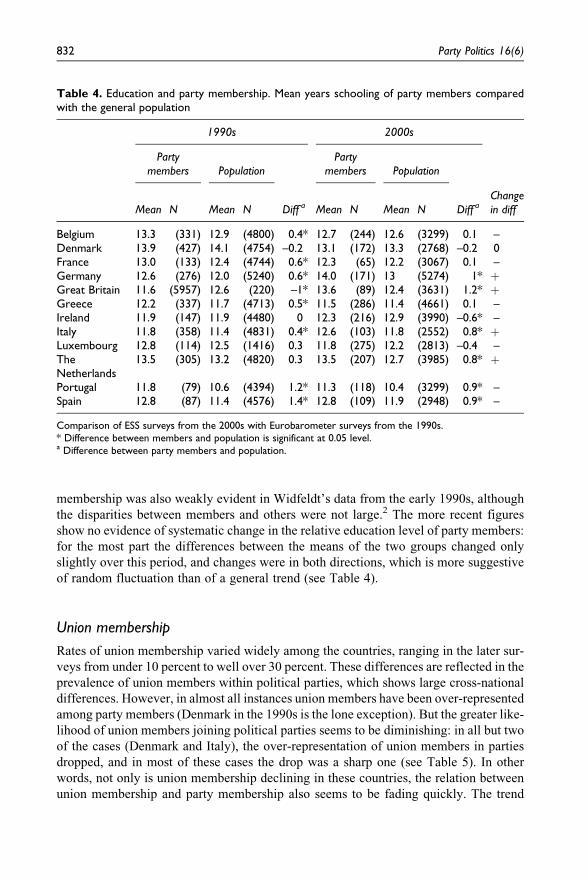
membership was also weakly evident in Widfeldt’s data from the early 1990s, although
the disparities between members and others were not large.2 The more recent figures
show no evidence of systematic change in the relative education level of party members:
for the most part the differences between the means of the two groups changed only
slightly over this period, and changes were in both directions, which is more suggestive
of random fluctuation than of a general trend (see Table 4).
Union membership
Rates of union membership varied widely among the countries, ranging in the later sur-
veys from under 10 percent to well over 30 percent. These differences are reflected in the
prevalence of union members within political parties, which shows large cross-national
differences. However, in almost all instances union members have been over-represented
among party members (Denmark in the 1990s is the lone exception). But the greater like-
lihood of union members joining political parties seems to be diminishing: in all but two
of the cases (Denmark and Italy), the over-representation of union members in parties
dropped, and in most of these cases the drop was a sharp one (see Table 5). In other
words, not only is union membership declining in these countries, the relation between
union membership and party membership also seems to be fading quickly. The trend
Table 4. Education and party membership. Mean years schooling of party members comparedwith the general population
1990s 2000s
Partymembers Population
Partymembers Population
Mean N Mean N Diff a Mean N Mean N Diff aChangein diff
Belgium 13.3 (331) 12.9 (4800) 0.4* 12.7 (244) 12.6 (3299) 0.1 –Denmark 13.9 (427) 14.1 (4754) –0.2 13.1 (172) 13.3 (2768) –0.2 0France 13.0 (133) 12.4 (4744) 0.6* 12.3 (65) 12.2 (3067) 0.1 –Germany 12.6 (276) 12.0 (5240) 0.6* 14.0 (171) 13 (5274) 1* þGreat Britain 11.6 (5957) 12.6 (220) –1* 13.6 (89) 12.4 (3631) 1.2* þGreece 12.2 (337) 11.7 (4713) 0.5* 11.5 (286) 11.4 (4661) 0.1 –Ireland 11.9 (147) 11.9 (4480) 0 12.3 (216) 12.9 (3990) –0.6* –Italy 11.8 (358) 11.4 (4831) 0.4* 12.6 (103) 11.8 (2552) 0.8* þLuxembourg 12.8 (114) 12.5 (1416) 0.3 11.8 (275) 12.2 (2813) –0.4 –TheNetherlands
13.5 (305) 13.2 (4820) 0.3 13.5 (207) 12.7 (3985) 0.8* þ
Portugal 11.8 (79) 10.6 (4394) 1.2* 11.3 (118) 10.4 (3299) 0.9* –Spain 12.8 (87) 11.4 (4576) 1.4* 12.8 (109) 11.9 (2948) 0.9* –
Comparison of ESS surveys from the 2000s with Eurobarometer surveys from the 1990s.* Difference between members and population is significant at 0.05 level.a Difference between party members and population.
832 Party Politics 16(6)
832

seems likely to have the greatest impact on parties of the left, a topic we will explore
more below.
Income level
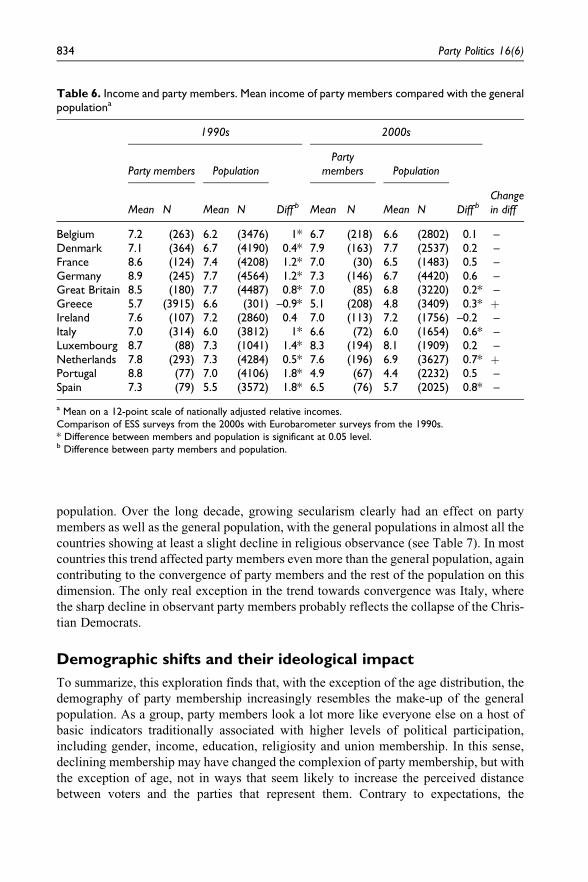
Resources are an important predictor of all sorts of political participation, so it is no
surprise that party members generally have an above-average income. In both surveys,
respondents’ incomes were coded on country-specific 12-point scales of relative income
levels. Although these figures are hard to interpret in terms of real values, the relative
income values show that, in almost all instances, party members’ average income
exceeded that of the general population. However, during the period of these two studies,
this gap narrowed in almost all the countries (except Greece and The Netherlands), and
by the later period the difference between party members and the general population was
statistically significant in only five countries (compared with 11 out of 12 in the earlier
study) (see Table 6).
Religiosity
Our final demographic dimension is religiosity. In the 1990s, political party members as
a group were distinguished by their more regular religious observance than the general
Table 5. Union membership and party members. Percentage union members compared with thegeneral population
1990s 2000s
Partymembers Population
Partymembers Population
UnionMbr N
UnionMbr N Diff a
UnionMbr N
UnionMbr N Diff a
Changein diff
Belgium 47 (155) 25 (976) 22* 40 (95) 32 (1112) 8 –Denmark 58 (250) 59 (2273) –1 70 (126) 67 (1916) 3 þFrance 30 (40) 7 (281) 23* 15 (10) 7 (221) 8* –Germany 37 (104) 15 (624) 22* 22 (39) 13 (737) 9* –Great Britain 29 (65) 20 (948) 9* 20 (22) 16 (630) 4 –Greece 30 (100) 11 (420) 19* 27 (79) 9 (447) 18 –Ireland 24 (36) 14 (515) 10* 22 (50) 20 (838) 2 –Italy 46 (166) 16 (634) 30* 44 (48) 14 (375) 30* 0Luxembourg 61 (69) 30 (335) 31* 49 (140) 30 (875) 19 –TheNetherlands
35 (112) 16 (639) 19* 33 (73) 21 (876) 12* –
Portugal 43 (35) 8 (291) 35* 14 (17) 8 (292) 6* –Spain 28 (24) 5 (171) 23* 24 (28) 8 (252) 16* –
Comparison of ESS surveys from the 2000s with Eurobarometer surveys from the 1990s.* Difference between members and population is significant at 0.05 level.a Difference between party members and population.
Scarrow and Gezgor 833
833
population. Over the long decade, growing secularism clearly had an effect on party
members as well as the general population, with the general populations in almost all the
countries showing at least a slight decline in religious observance (see Table 7). In most
countries this trend affected party members even more than the general population, again
contributing to the convergence of party members and the rest of the population on this
dimension. The only real exception in the trend towards convergence was Italy, where
the sharp decline in observant party members probably reflects the collapse of the Chris-
tian Democrats.
Demographic shifts and their ideological impact
To summarize, this exploration finds that, with the exception of the age distribution, the
demography of party membership increasingly resembles the make-up of the general
population. As a group, party members look a lot more like everyone else on a host of
basic indicators traditionally associated with higher levels of political participation,
including gender, income, education, religiosity and union membership. In this sense,
declining membership may have changed the complexion of party membership, but with
the exception of age, not in ways that seem likely to increase the perceived distance
between voters and the parties that represent them. Contrary to expectations, the
Table 6. Income and party members. Mean income of party members compared with the generalpopulationa
1990s 2000s
Party members PopulationParty
members Population
Mean N Mean N Diff b Mean N Mean N Diff bChangein diff
Belgium 7.2 (263) 6.2 (3476) 1* 6.7 (218) 6.6 (2802) 0.1 –Denmark 7.1 (364) 6.7 (4190) 0.4* 7.9 (163) 7.7 (2537) 0.2 –France 8.6 (124) 7.4 (4208) 1.2* 7.0 (30) 6.5 (1483) 0.5 –Germany 8.9 (245) 7.7 (4564) 1.2* 7.3 (146) 6.7 (4420) 0.6 –Great Britain 8.5 (180) 7.7 (4487) 0.8* 7.0 (85) 6.8 (3220) 0.2* –Greece 5.7 (3915) 6.6 (301) –0.9* 5.1 (208) 4.8 (3409) 0.3* þIreland 7.6 (107) 7.2 (2860) 0.4 7.0 (113) 7.2 (1756) –0.2 –Italy 7.0 (314) 6.0 (3812) 1* 6.6 (72) 6.0 (1654) 0.6* –Luxembourg 8.7 (88) 7.3 (1041) 1.4* 8.3 (194) 8.1 (1909) 0.2 –Netherlands 7.8 (293) 7.3 (4284) 0.5* 7.6 (196) 6.9 (3627) 0.7* þPortugal 8.8 (77) 7.0 (4106) 1.8* 4.9 (67) 4.4 (2232) 0.5 –Spain 7.3 (79) 5.5 (3572) 1.8* 6.5 (76) 5.7 (2025) 0.8* –
a Mean on a 12-point scale of nationally adjusted relative incomes.Comparison of ESS surveys from the 2000s with Eurobarometer surveys from the 1990s.* Difference between members and population is significant at 0.05 level.b Difference between party members and population.
834 Party Politics 16(6)
834

composition of party membership is not shifting in favour of citizens with relatively
higher resources; in fact, the opposite seems to be the case.
But demography gives us only a rough sense of whether we are likely to see growing
or diminishing conflicts between the priorities of voters and party members. Our other
prediction was that new membership incentives would help to attract more politically
motivated members, and hence might increase gaps between the political preferences
of party members and other party supporters. We can get a better sense of what has chan-
ged along this dimension by looking at differences in ideological self-placement. We do
this by examining self-placement on a left–right scale, comparing party members with
other party supporters (not with population means). Recall that we would expect this gap
to be growing if more members are attracted into parties by the new opportunities for
members to participate in party decision-making, and, specifically, that this growing gap
would leave members more ideologically extreme than other party supporters.
This assumption about the direction of the gap is standard. Political scientists have
long suspected that party members might hold more extreme political convictions than
other party supporters. This suspicion, codified as ‘May’s Law’, is based on the assump-
tion that most party members are motivated at least in part by collective political goods,
not selective benefits: individuals take on the costs of party membership partly because
of the intensity of their political views (May, 1973). This intensity is likely to make them
more radical than those who support a party but do not join it. Although the logic of this
hypothesis is strong, the supporting evidence remains rather thin. Most studies of this
phenomenon have found at most small differences between the views of party supporters
and party activists (Gallagher and Marsh, 2004: Herrera and Taylor, 1994; Miller, 1988;
Table 7. Religiosity and party membership. Percentage observant party members compared withthe general population
1990s 2000s
Party members Population Party members Population
% Observant N % Observant N Diff a % Observant N % Observant N Diff aChangein diff
Belgium 26 (83) 18 (817) 8 15 (36) 10 (319) 5* –Denmark 8 (32) 3 (123) 5* 6 (10) 3 (78) 3* –France 12 (13) 9 (386) 3 10 (7) 7 (222) 3 0Germany 29 (76) 15 (737) 14* 17 (30) 8 (422) 9* –Great Britain 25 (51) 13 (724) 12 20 (18) 13 (478) 7 –Greece 18 (802) 13 (39) 5* 22 (62) 25 (1173) –3 –Ireland 91 (132) 65 (2879) 26* 69 (152) 56 (2273) 13* –Italy 36 (119) 33 (1536) 3* 13 (14) 31 (809) –18* þLuxembourg 35 (36) 22 (287) 13 20 (56) 14 (414) 6* –TheNetherlands
36 (105) 14 (655) 22* 30 (63) 12 (493) 18* –
Portugal 26 (18) 31 (1327) –5* 25 (29) 29 (961) –4 þSpain 22 (17) 23 (978) –1 16 (18) 20 (614) –4 –
Comparison of ESS surveys from the 2000s with Eurobarometer surveys from the 1990s.* Difference between members and population is significant at 0.05 level.a Difference between party members and population.
Scarrow and Gezgor 835
835

Narud and Skare, 1999; Norris, 1995). To the extent that the expected differences have
been found, they have been confined to certain ideologically charged issues in certain
types of (ideological) parties (Kitschelt, 1989; Narud and Skare, 1999).
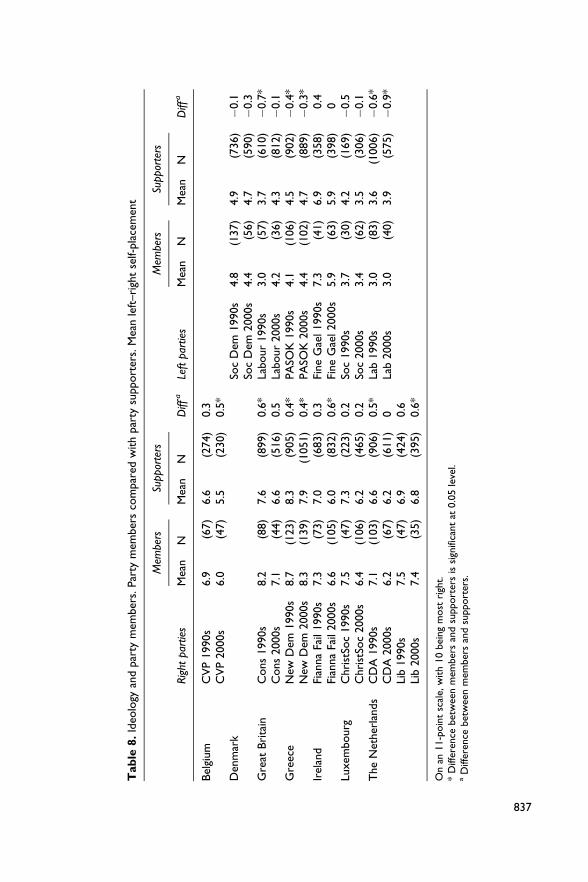
The Eurobarometer data told a similar story. Widfeldt (1995) looked at differences
between party members and party supporters in their self-placement on an 11-point
left–right scale (left ¼ 0, right ¼ 10). In almost all of the 39 parties he examined, the
gap existed and was in the expected direction. In no case were members more moderate
than party supporters. But, as Widfeldt emphasizes, these differences were slight: for no
party was the difference as great as a whole point on a 10-point scale, and often the sum
of differences between members and supporters in left and right parties did not increase
overall political polarization by even a whole point. For Widfeldt, the small size of the
difference cautioned against over emphasizing the gap between party members and other
party supporters.
How, if at all, did these relationships change as party memberships shrank? Has the
decline in party membership and the increase in political incentives for membership
exacerbated the ideological differences, with only the most politically intense choosing
to become or remain party members? Table 8 replicates Widfeldt’s analysis using both
surveys, comparing only the parties which had at least 30 members in both surveys, and
adding significance tests (which Widfeldt did not give us). The picture it presents is
one of striking stability. It remains true in the most recent data that party members are
generally more ideologically extreme than party supporters, but these differences are
very small. Four of the 13 parties show some increase in distance between party
members and general supporters, but this difference is statistically significant in only
three of them (the Belgium Christian Democrats, the Irish Fianna Fail and the Dutch
Labor Party). In the other parties, the relationships are either stable or else not
statistically significant.
Contrary to our predictions, when we look at individual parties, any movement that
we see is at least as much towards the comparative moderation of party members as
towards their radicalization. Crucially, there is no evidence here that the decline in party
memberships has left parties to enrol only the most radical of their supporters, or that the
drops have made party systems more polarized.
Modelling party participation
We can get a more precise picture of the cumulative effects of these demographic
changes by looking at the extent to which our characteristics were good predictors of
party membership at each of the two time-points. To do this, we construct logit models.
We begin by looking at the entire sample, but since there may be some differences in the
determinants of party membership with respect to the left–right political spectrum, we
also run separate models predicting membership in parties of the left (socialist, left
socialist and Communist) and in parties of the right (conservative, religious, centre–
right). The results reported in Table 9 show the different impact of the variables in these
two different periods.3
Starting with the full sample, we see that in both the earlier and later periods our inde-
pendent variables do a good job of predicting party membership, with all of our variables
836 Party Politics 16(6)
836
Tab
le8.
Ideo
logy
and
par
tym
ember
s.Par
tym
ember
sco
mpar
edw
ith
par
tysu
pport
ers.
Mea
nle
ft–ri
ght
self-
pla
cem
ent
Mem
bers
Supp
orte
rsM
embe
rsSu
ppor
ters
Rig
htpa
rtie
sM
ean
NM
ean
ND
iffa
Left
part
ies
Mea
nN
Mea
nN
Diff
a
Bel
gium
CV
P1990s
6.9
(67)
6.6
(274)
0.3
CV
P2000s
6.0
(47)
5.5
(230)
0.5
*D
enm
ark
Soc
Dem
1990s
4.8
(137)
4.9
(736)�
0.1
Soc
Dem
2000s
4.4
(56)
4.7
(590)�
0.3
Gre
atBri
tain
Cons
1990s
8.2
(88)
7.6
(899)
0.6
*La
bour
1990s
3.0
(57)
3.7
(610)�
0.7
*C
ons
2000s
7.1
(44)
6.6
(516)
0.5
Labour
2000s
4.2
(36)
4.3
(812)�
0.1
Gre
ece
New
Dem
1990s
8.7
(123)
8.3
(905)
0.4
*PA
SOK
1990s
4.1
(106)
4.5
(902)�
0.4
*N
ewD
em2000s
8.3
(139)
7.9
(1051)
0.4
*PA
SOK
2000s
4.4
(102)
4.7
(889)�
0.3
*Ir
elan
dFi
anna
Fail
1990s
7.3
(73)
7.0
(683)
0.3
Fine
Gae
l1990s
7.3
(41)
6.9
(358)
0.4
Fian
na
Fail
2000s
6.6
(105)
6.0
(832)
0.6
*Fi
ne
Gae
l2000s
5.9
(63)
5.9
(398)
0Lu
xem
bourg
Chri
stSo
c1990s
7.5
(47)
7.3
(223)
0.2
Soc
1990s
3.7
(30)
4.2
(169)�
0.5
Chri
stSo
c2000s
6.4
(106)
6.2
(465)
0.2
Soc
2000s
3.4
(62)
3.5
(306)�
0.1
The
Net
her
lands
CD
A1990s
7.1
(103)
6.6
(906)
0.5
*La
b1990s
3.0
(83)
3.6
(1006)�
0.6
*C
DA
2000s
6.2
(67)
6.2
(611)
0La
b2000s
3.0
(40)
3.9
(575)�
0.9
*Li
b1990s
7.5
(47)
6.9
(424)
0.6
Lib
2000s
7.4
(35)
6.8
(395)
0.6
*
On
an11-p
oin
tsc
ale,
with
10
bei
ng
most
righ
t.*
Diff
eren
cebet
wee
nm
ember
san
dsu
pport
ers
issi
gnifi
cant
at0.0
5le
vel.
aD
iffer
ence
bet
wee
nm
ember
san
dsu
pport
ers.
Scarrow and Gezgor 837
837

showing a statistically significant relationship with party membership, and with signs in
the expected direction. Party members in both studies are older and wealthier than the
general population, more likely to be male and more likely to be union members and
to be religiously observant (see Table 9). What changes between the two studies is that
the impact of all the variables weakens in the 2000 study.
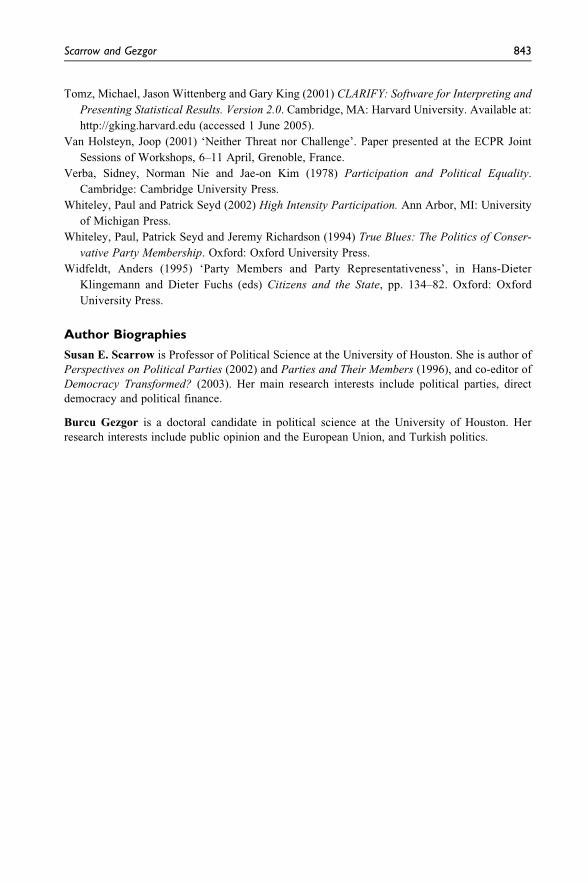
Because the coefficients in logit models are not easy to interpret, we apply CLARIFY
software, which uses simulations to convert the raw output into probabilities that are eas-
ier to interpret, and then we present these relations graphically (King et al., 2000; Tomz
et al., 2001). Take, for instance, a German female in the middle age cohort who has mean
income, mean education, a mean level of religious attendance and who is not a union
member. As Figure 1 shows, the relation between such a person’s ideological extreme-
ness and the likelihood that she was a party member was much stronger in the 1990s than
in the later study. In this multivariate model we see even more clearly than in our bivari-
ate comparisons that while the relationship between ideological extremeness and party
membership remains statistically significant in the more recent period, the strength of
this relationship has greatly diminished.
We expect that shifts in the impact of some variables might be different for parties
of the left and parties of the right, given that such parties traditionally have appealed to
different social bases. Therefore we run these models separately to predict membership
in parties of the left and in parties of the right. We look here exclusively at the ‘old
left’ and the moderate centre–right parties so that we are most likely to capture
changes in established parties. What is most striking in Table 10, which shows predic-
tors of left party membership, are the relationships which disappear as compared to
predictors of membership more generally. Most notably, in neither time period does
Table 9. Predictors of party membership
1990s 2000s
Coef. SE Odds ratio Coef. SE Odds ratio
Ideological extremeness 0.35 0.02*** 1.42 0.24 0.02*** 1.27Religious attendance 0.10 0.03** 1.10 0.29 0.05*** 1.34Female �0.64 0.05*** 0.53 �0.66 0.06*** 0.51Education 0.06 0.01*** 1.06 0.04 0.01*** 1.04Union 0.96 0.05*** 2.62 0.53 0.07*** 1.70Income 0.03 0.01*** 1.03 0.07 0.02*** 1.08Age group 18–30 �0.55 0.06*** 0.58 �0.53 0.10*** 0.59Age group 61–80 0.20 0.06*** 1.23 0.46 0.07*** 1.59Constant �3.55 0.17*** �5.20 0.21***Log likelihood �6777.3221 �4862.0536LR chi2 1721.76*** 804.09***Pseudo R2 0.1127 0.0764Number of observations 28530 25783
**Significant at 0.05 level.***Significant at 0.01 level.
838 Party Politics 16(6)
838

education or relative income have a significant impact on left party membership when
controlling for other factors. In contrast, in both periods these resources are important
predictors of overall party membership. This suggests that even in the 21st century,
and despite the decline in unionization, parties of the left continue to function as orga-
nizations that help to compensate for resource-linked inequalities in political
participation.
One of the biggest changes between the periods is in regard to religiosity: in the
early period, it is a negative predictor of left party membership, but by the beginning
of the 21st century this relationship, while still negative, is no longer statistically
significant (see Table 10). In parties of the right, the relationship with religiosity goes
in exactly the opposite direction: though religiosity remains a statistically significant
and positive predictor of right party membership, the strength of this relationship
diminishes.
In terms of the diminished relative political extremeness of party members, the story
is slightly different. Here we see that party members on both the left and the right have
been moving in the same directions, with both sides of the spectrum showing a reduced
association with views that are extreme compared to the population mean. These figures
give no indication that political parties have been profiting (or suffering) from an influx
of more politicized members who are attracted by new membership incentives that
enhance members’ rights to shape party policies.
Conclusions
These results present a mixed picture of the effects of party membership decline on the
democratic process in European democracies. Party memberships may be shrinking, but
at least so far this has not meant that parties’ grassroots are becoming some kind of odd
subculture, no longer able to provide legitimacy because they are too different from the
rest of society. Parties’ diminished ability to recruit has led to a striking shift in the age
profiles of their memberships: the average age of party members has continued to
1990s
2000s0.00
0.05
0.10
0.15
0.20
0 1 2 3 4
Ideological Extremeness
Pro
babi
lity
Par
ty
Mem
bers
hip
Figure 1. Effect of ideological extremism on party membershipGraph showing the expected probability of party membership for a German female in the middleage cohort (age ¼ 31–60), not a union member, with mean education and mean level of religiousattendance. Produced using CLARIFY (King et al., 2000; Tomz et al., 2001) using estimatedparameters from Table 9.
Scarrow and Gezgor 839
839

increase, a highly visible difference that may make it harder for parties to project an
image of being closely in touch with the people whose votes they are seeking. In other
ways, however, not only have the differences between party members and the general
public not increased; on dimensions like income, union membership and religiosity party
members have become a lot more like the general population. In addition, there is no
evidence that party membership organizations were becoming a refuge for a hard core
of ideologically charged extremists; on this dimension, too, parties were becoming
increasingly representative of their fellow citizens. Duverger’s mass party – a term
which for him also meant ‘the party of the masses’ – is becoming ‘the party of the mean’.
In other words, we find little sign here of the types of differences that ‘May’s Law’
predicts.
This does not mean that smaller memberships do not present other problems for par-
ties: many have traditionally relied on their members to supply large numbers of local
and regional government candidates, and many have counted on the regular income from
party dues to financially support some aspects of party activity. Political parties are
likely to miss both types of contributions. And even if parties of the left continue to
mobilize more evenly across the economic spectrum than other parties, and thus help
to offset economic-linked disparities in political participation, the fact that these parties
are smaller means that their efforts will have less of an overall impact. Nevertheless, in
some respects at least the story of party decline is not as grim as it might be. Most impor-
tantly, there is no reason to fear that today’s smaller party memberships are becoming
more likely to make polarizing political decisions, or, if intra-party democracy spreads,
that they are more likely to pick candidates and policies that might alienate other party
supporters.
Table 10. Predictors of left party membership
1990s 2000s
Coef. SE Odds ratio Coef. SE Odds ratio
Ideological extremeness 0.23 0.03*** 1.26 0.12 0.04** 1.13Religious attendance �0.68 0.06*** 0.51 �0.14 0.09 0.87Female �0.44 0.08*** 0.64 �0.68 0.11*** 0.51Education 0.00 0.01 1.00 0.04 0.02 1.04Union 1.60 0.08*** 4.97 1.05 0.12*** 2.87Income 0.00 0.01 1.00 0.04 0.03 1.04Age group 18–30 �0.67 0.10*** 0.51 �0.78 0.20*** 0.46Age group 61–80 0.11 0.10 1.12 0.39 0.13** 1.48Constant �2.49 0.25*** �2.98 �4.88 0.36***Log likelihood �3303.9382 �1849.3795LR chi2 1164.71*** 287.48***Pseudo R2 0.1498 0.0721Number of observations 28534 25834
**Significant at 0.05 level.***Significant at 0.01 level.
840 Party Politics 16(6)
840

Appendix 1.
Definitions and descriptive statistics for variables used in analyses: combined data
Variable Definition Mean SD
Ideological extremeness Measured using a 5-point index(higher ¼ more ideological extremeness)
1.51 1.31
Income Measured using a 12-point index (higher ¼ more income) 6.88 2.98Union membership Measured dichotomously (1 ¼ union member) 0.22 0.42Party membership Measured dichotomously (1 ¼ party member) 0.06 0.25Education Measured using a 9-point index
(higher ¼ more educated)12.36 2.91
Religious attendance Measured using a 3-point index (higher ¼ more often) 1.83 0.75Gender Measured dichotomously (1 ¼ female) 1.03 0.70Age Measured dichotomously
(1 ¼ age group 18–31)(1¼ age group 61–80)
0.220.22
0.420.42
Notes
We thank Ernesto Calvo, Tim Hellwig and anonymous reviewers for their help on this project.
The Norwegian Social Science Data Services are the data archive and distributor of the ESS data.
1. We replicated all of Widfeldt’s calculations using the same Eurobarometers and followed as
closely as we could his coding and treatment of missing values. Our figures are similar, but not
identical, to Widfeldt’s.
2. Because the Eurobarometer and ESS measured education in slightly different ways, we recoded
the Eurobarometer data on school leaving-age to approximate the ESS data on number of years
of schooling. We do this by subtracting 5 from the respondent’s age at leaving school, assuming
a school-starting age of five. In countries where the normal starting date differs, this assumption
will affect the mean, but not the distance between the party and population means.
3. The models also included country dummies not reported here.
References
Adams, James and Samuel Merrill III (2008) ‘Candidate and Party Strategies in Two-Stage Elec-
tions Beginning with a Primary’, American Journal of Political Science 52: 344–59.
Bruter, Michael and Sarah Harrison (2009) The Future of Our Democracies. London: Palgrave
Macmillan.
Caul, Miki (2001) ‘Political Parties and the Adoption of Candidate Gender Quotas: A Cross-
National Analysis’, Journal of Politics 63: 1214–29.
Cross, William and Lisa Young (2004) ‘The Contours of Political Party Membership in Canada’,
Party Politics 10: 427–44.
Cross, William and Lisa Young (2008) ‘Factors Influencing the Decision of the Young Politically
Engaged to Join a Political Party’, Party Politics 14: 345–69.
Dalton, Russell (2005) Citizen Politics, 4th edn. Washington, DC: Congressional Quarterly Press.
Dalton, Russell and Steven Weldon (2005) ‘Public Images of Political Parties’, West European
Politics 28: 931–51.
Scarrow and Gezgor 841
841

Duverger, Maurice (1955) Political Parties: Their Organization and Activity in the Modern State,
trans. Barbara and Robert North. New York: John Wiley.
Gallagher, Michael and Michael Marsh (2004) ‘Party Membership in Ireland: The Members of
Fine Gael’, Party Politics 10: 407–25.
Heidar, Knut and Jo Saglie (2003) ‘A Decline of Linkage? Intra-party Participation in Norway,
1991–2000’, European Journal of Political Research 42: 761–86.
Heinrich, Roberto, Malte Lubker and Heiko Biehl (2002) Parteimitglieder in Vergleich. Working
Paper: Potsdam University.
Herrera, Richard and Melanie Taylor (1994) ‘The Structure of Opinion in American Political
Parties’, Political Studies 42: 676–89.
Jowell, R. and the Central Coordinating Team, European Social Survey 2002/2003 (2003) Tech-
nical Report. London: Centre for Comparative Social Surveys, City University.
Jowell, R. and the Central Coordinating Team, European Social Survey 2004/2005 (2005)
Technical Report. London: Centre for Comparative Social Surveys, City University.
Katz, Richard, Peter Mair et al. (1992) ‘The Membership of Political Parties in European
Democracies, 1960–1990’, European Journal of Political Research 22: 329–45.
King, Gary, Michael Tomz and Jason Wittenberg (2000) ‘Making the Most of Statistical
Analyses: Improving Interpretation and Presentation’, American Journal of Political Science
44: 347–61.
Kitschelt, Herbert (1989) ‘The Internal Politics of Parties: The Law of Curvilinear Disparity
Revisited’, Political Studies 38: 400–21.
Mair, Peter and Ingrid van Biezen (2001) ‘Party Membership in Twenty European Democracies,
1980–2000’, Party Politics 7: 5–21.
May, John (1973) ‘Opinion Structure of Political Parties: The Special Law of Curvilinear
Disparity’, Political Studies 21: 135–51.
Miller, Warren E. (1988) Without Consent. Lexington, KT: University of Kentucky Press.
Narud, Hanne Marthe and Audun Skare (1999) ‘Are Party Activists the Party
Extremists? The Structure of Opinion in Political Parties’, Scandinavian Political Studies
22: 45–65.
Norris, Pippa (1995) ‘May’s Law of Curvilinear Disparity Revisited’, Party Politics 1: 29–47.
Norris, Pippa (1999) Critical Citizens: Global Support for Democratic Governance. Oxford:
Oxford University Press.
Parry, Geraint, George Moyser and Neil Day (1992) Political Participation and Democracy in
Britain. Cambridge: Cambridge University Press.
Pedersen, Karina, Lars Bille, Roger Buch, Jørgen Elkit, Bernhard Hansen and Hans Jørgen Nielsen
(2004) ‘Sleeping or Active Partners? Danish Party Members at the Turn of the Millennium’,
Party Politics 10: 367–83.
Pennings, Paul and Reuven Hazan (2001) ‘Democratizing Candidate Selection: Causes and
Consequences’, Party Politics 7: 267–75.
Scarrow, Susan (2000) ‘Parties without Members? Party Organization in a Changing
Electoral Environment’, in Russell Dalton and Martin Wattenberg (eds) Parties without
Partisans, pp. 79–101. Oxford: Oxford University Press.
Seyd, Patrick and Paul Whiteley (1992) Labour’s Grass Roots. Oxford: Oxford University Press.
Seyd, Patrick and Paul Whiteley (2004) ‘British Party Members: An Overview’, Party Politics 10:
355–66.
842 Party Politics 16(6)
842
Tomz, Michael, Jason Wittenberg and Gary King (2001) CLARIFY: Software for Interpreting and
Presenting Statistical Results. Version 2.0. Cambridge, MA: Harvard University. Available at:
http://gking.harvard.edu (accessed 1 June 2005).
Van Holsteyn, Joop (2001) ‘Neither Threat nor Challenge’. Paper presented at the ECPR Joint
Sessions of Workshops, 6–11 April, Grenoble, France.
Verba, Sidney, Norman Nie and Jae-on Kim (1978) Participation and Political Equality.
Cambridge: Cambridge University Press.
Whiteley, Paul and Patrick Seyd (2002) High Intensity Participation. Ann Arbor, MI: University
of Michigan Press.
Whiteley, Paul, Patrick Seyd and Jeremy Richardson (1994) True Blues: The Politics of Conser-
vative Party Membership. Oxford: Oxford University Press.
Widfeldt, Anders (1995) ‘Party Members and Party Representativeness’, in Hans-Dieter
Klingemann and Dieter Fuchs (eds) Citizens and the State, pp. 134–82. Oxford: Oxford
University Press.
Author Biographies
Susan E. Scarrow is Professor of Political Science at the University of Houston. She is author of
Perspectives on Political Parties (2002) and Parties and Their Members (1996), and co-editor of
Democracy Transformed? (2003). Her main research interests include political parties, direct
democracy and political finance.
Burcu Gezgor is a doctoral candidate in political science at the University of Houston. Her
research interests include public opinion and the European Union, and Turkish politics.
Scarrow and Gezgor 843
843