Embed Size (px)
Citation preview

SCANNER ANALYSIS OF THE TOPOLOGY OF LASER HYBRID WELDS DEPENDING ON THE JOINT EDGE TOLERANCES Alexander F. H. Kaplan,1 Javier Lamas,1,2 Jan Karlsson,1 Peter Norman,1 Armando Yañez3 1 Luleå University of Technology, Luleå, Sweden www.ltu.se/tfm/produktion 2Centro Tecnolóxico do Naval Galego, Ferrol, Spain 3Centro de Investigacións Tecnolóxicas, Universidade da Coruña, Ferrol, Spain
Abstract
The surface geometry after laser hybrid arc welding is an important quality criterion. What is often called welding in a rough industrial environment can in many cases systematically be reduced to a few local conditions of the joint edge during welding, particularly depending on the edge preparation technique. In the present study, beside the influence of surface oxides studied in separate publications, the conditions are reduced to the local gap width, vertical surface position and edge mismatch. Gas cut edge conditions are compared to milling and laser cutting. By scanning the steel edges of a 10 mm butt joint before and during hybrid welding and relating the systematic variation of the above three properties to the scanned topology of the resulting weld, quantitative correlations are identified. By the aid of high speed imaging, explanations for the trends can be found. Operating windows with controllable trends can be quantitatively mapped and distinguished from instable regimes. Beside higher roughness, gas cut edges show a superimposed edge oscillation of longer periodicity, being less visible but important. During welding, concave surface bending and gap widening alter the initial conditions. Awareness and quantitative identification of the edge conditions is recommended to control the welding process in a rough industrial environment.
Keywords: laser hybrid welding, scanner, joint edge, tolerances, weld geometry, imaging
1 Introduction The quality and strength of a weld is significantly determined by the weld geometry [1,2] that results from the resolidification of a complex fluid flow. Laser hybrid welding, combining a laser beam with an electric arc, is an emerging technique combining the advantages but also the complexity of both techniques. The specific benefits of the combination of arc and laser are high speed and a narrow lower part of the weld due to the laser as well as the bridging of joint gaps by the melting electrode wire. While laser welding requires edges prepared with narrow gap, hybrid welding is more tolerant to poor fit up. The gap width limits have been established,[1,3] and are typically 1-1.5 mm (for parallel sides).

However, the understanding of the basic physics of laser hybrid welding is still poor, particularly with respect to the joint edges. From X-ray imaging it has been observed that the melt pool can be substantially elongated in the direction of travel. High speed imaging has enabled the study of drop transfer and the keyhole conditions for steel [4,5] and aluminium [6]. The pressure from the arc and from keyhole evaporation can drive the melt into the gap [4]. Different situations have been classified [6] dependent on the presence of a gap, the torch arrangement and the corresponding drop flight and heat and mass transfer, partially explaining the weld shape and gap filling. Recently, Computational Fluid Dynamics (CFD) of the whole drop transfer and melt pool flow has been achieved, but numerous uncertainties remain high.
The technique chosen for the edge preparation of a weld is of high economic importance. While plasma cutting or autogeneous flame cutting are cheap and often manual techniques, laser cutting and mechanical milling provide high quality edges, hence narrower geometrical tolerance windows. In addition, clamping of the workpieces and distortion during welding affect the local edge conditions experienced during the welding process. Despite their importance, the geometrical edge fit up conditions have been rarely measured or studied.
The present study on laser hybrid welding of a 10 mm steel butt joint is based on a comparison of edge preparation by gas cutting, laser cutting and milling. By measuring the edge geometries it became clear that gas cutting not only caused higher surface roughness, see Fig. 1(a)-(c), but also tended to lateral oscillations along longer distances, thus further increasing the gap width variations wg. Moreover, distortion bends the plates, enhancing the uncertainties in the vertical edge mismatch ze and surface position z0 compared to laser cutting and milling that both enable a narrow geometry variation window. The application studied is longitudinal welding of a beamer. The variation of the three properties, defined as in Fig. 1(d), (note that ze = z0L-z0R) along part of the edges after gas cutting in the industrial environment (but for a V-shaped joint) are shown in Fig. 1(f), plus the gap width variation during welding, including distortion. A typical weld seam cross section is shown in Fig. 1(e).
(a),(c) (d) (b),(e) (f) Fig. 1: Typical edge preparation for welding: (a) gas-cut surface (thickness 10 mm), (b) upper edge, magnified, (c) top surface appearance of the gap, (d) the tolerance properties of the upper joint edges, studied here, and coordinate system, (e) cross section of a weld of good quality, (f) edge tolerance properties along an industrially prepared gas-cut component Figure 2 shows the scanned profiles of gas-cut edges. The periodic surface ripples (that are typical for thermal cutting techniques) but also a long range variation at the cut surface can be
seen in Fig. 2(a),(b). The surface profiles along the upper edges after cutting are shown in Fig. 2(c)-(f) for four samples. The surface roughness appears as a thickening of the curves and corresponds to a variation of the gap width. However, as can be seen, beside the surface ripples the cut edge experiences long range variations, in particular kinds of oscillations. While here just after cutting the two edges widely compensate each other, keeping the gap limited, when putting the surfaces of two different samples to each other the gap value and variation can rapidly become very large. This kind of variation is not apparent when judging the edge quality but needs to be measured to ensure capture of the real edge tolerances.
(d) `
(e)
(a),(b),(c) (f)
Fig. 2: Gas-cut edge preparation: (a) scanned edge surface, magnified and (b) with right aspect ratio, (c)-(f) scanned profile along the upper edges after gas cutting (four samples) In the following work the properties wg, ze, z0 are systematically studied to identify the tolerance window for the case and a theoretical explanation of the impact of these edge tolerances on the resulting weld, through redistribution of mass by the complex melt flow. 2 Methodology 2.1 Methodological approach The main goal of the study is to identify and to better understand the impact of workpiece edge tolerances on the resulting weld shape in laser hybrid welding. The complex edge geometry can be reduced to three key properties, see Fig. 1(d): gap width, vertical surface position and vertical edge mismatch. Any edge geometry (for the present 10 mm butt joint case) can be described by these three properties. It is assumed that isolated study of each of the three properties provides comprehensive understanding, also for their combination.
While a larger series of exploration experiments was carried out and successfully repeated, in the present paper only the five key experiments are shown: One demonstrator

beamer was produced, to identify real industrial conditions, see Fig. 1(f), one reference weld was made with optimum (close to zero) edge conditions as a starting point and then each of the three properties was linearly varied in a specified range during one weld, while keeping the other two properties (close to) zero. The reference weld represents the regular flow conditions, while the three deviation experiments show the separate impact of each edge property on the flow. The study is based on geometry, i.e. the edge geometry changes the melt flow of the weld and in turn the resolidified weld shape, particularly at the top. Mass redistribution by the melt flow is the responsible mechanism studied.
An optical scanner was used to measure the sample edge geometry (the three properties) before and during welding and the resulting weld profile. This part is a black box I/O-situation: From the experiments correlations were studied on how the resulting weld shape (top surface profile) changes when a certain edge property changes.
However, to try to understand the correlations and trends, welding was accompanied by high speed imaging to observe the melt flow at the top surface. High speed imaging is a very powerful tool when surface flow phenomena are essential, as here is the case. From the high speed imaging records an interpretation of the trends was tried, resulting in illustrative theoretical explanations on how the flow changes when one of the three edge properties is varied, followed by guidelines for the process. In particular, post-processing both of the scanned data and of high speed imaging has led to additional information. 2.2 Welding experiment The laser-MAG-hybrid welding experiment was carried out using a 15kW Yb:fibre-laser IPG (Beam Parameter Product 10.4 mm·mrad, fibre diameter 200 µm, wavelength 1070 nm) together with conventional welding equipment consisting of a welding rectifier model ESAB Aristo LUD450W. This was provided with a MAG wire feed unit ESAB A10 MEK 44C, using Mison8 gas (92% Ar, 8% CO2). The laser axis was tilted to an angle of 7 degree, trailing with respect to the normal of the sample surface to avoid backreflections. The arc welding torch was inclined at an angle of 52 leading, thus 59 with respect to the optical path. The process parameters are listed in the table in Fig. 3(a). The laser was operated at reduced power (8 kW) according to economic prospects. The 2:1-optics focuses the laser beam to a spot diameter of 400 µm (Rayleigh length: 3.5 mm).
For the demonstrator beamer weld, samples of high strength steel DOMEX 400 with a V-butt joint, thickness 10 mm and gas-cut edges were prepared, as in Fig. 1(a)-(c). To determinate the isolated influence of the geometrical issues over the weld, four experiments were carried out, see Fig. 3(b). In all cases the laser and MAG parameters for the process are equal to the optimized parameters of the real processed piece that caused a good quality weld, Fig. 1(f), according to the parameters of Fig. 3(a). For the experiments, plates of high strength steel DOMEX 400, thickness 10 mm and length 200 mm were used. The square butt joint edges were laser-cut to ensure controlled conditions but representing the surface ripples, misalignment and the macroscopical bending of the gas-cut edges, maintaining at the same time the oxides. In the first case, the reference weld, the plates were attached with nominal values wg=0 mm, ze=0 mm and z0=0 mm. In the second case the plates were attached with nominal values ze=0 mm and z0=0 mm, but the gap width wg was changed linearly from 0 mm at x=0 mm to 1.3mm at x=200 mm. Figure 3(b) shows the planned variation of each of the three properties and the measured edge properties, validating that their deviation from planned conditions is sufficiently little, particularly as a wide range is explored. In the third case the plates were attached with nominal values wg=0 mm and ze=0 mm, but the vertical surface position z0 was varied linearly from z0=-5 mm when x=0 mm to z0=+5 mm when
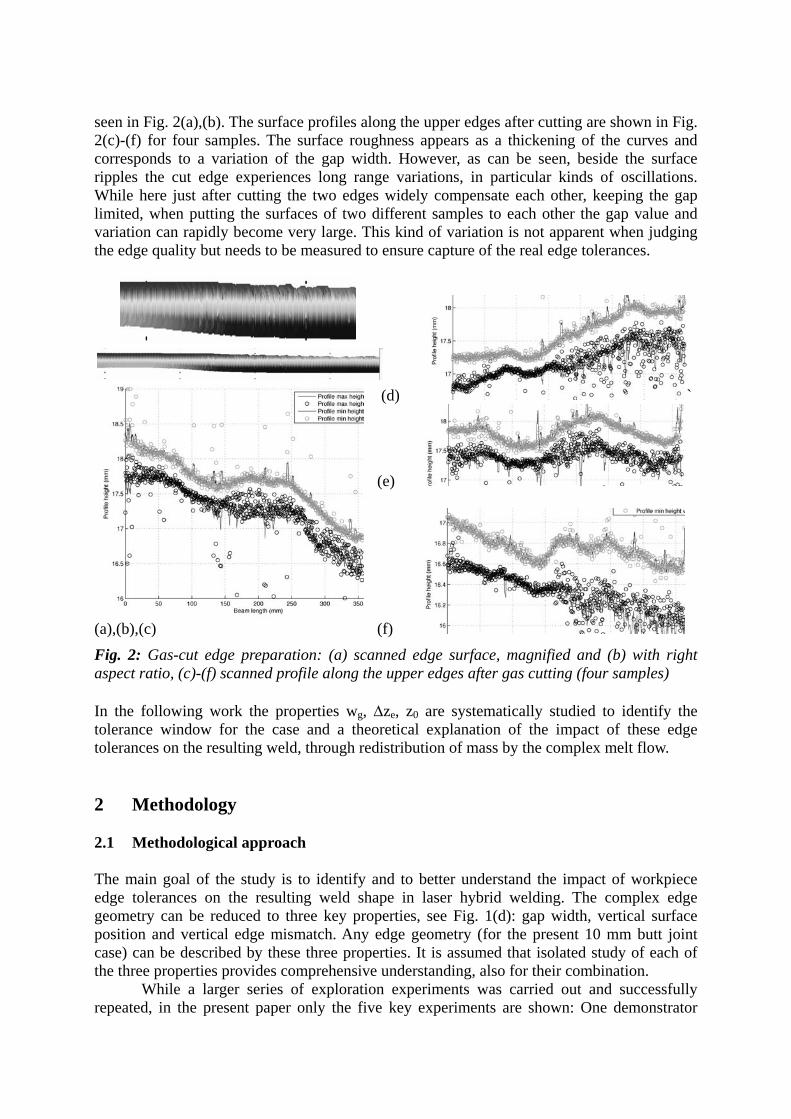
x=200 mm. In the fourth case the plates were attached with nominal values wg=0 mm and z0=-5 mm, but the vertical edge mismatch ze was varied from ze=-0.19 mm when x=0 mm to ze=+2.1 mm when x=200 mm. These ranges were purposefully chosen far beyond the estimated stability limits to study the origin and evolution of the lack of stability and the real quantitative limits for this concrete process.
(a) (b)
Fig. 3: (a) Parameters for the reference weld of good quality, (b) ideal (planned) and real alteration of the gap width and edge mismatch along the weld 2.3 Measurement techniques applied For improved understanding of the link between the welding process and the effect of the edge tolerances, all experiments were accompanied by high speed imaging with a Redlake HS-X3 camera at 3000 and 2000 frames per second, filtered for the illumination laser wavelength (808 nm). The camera was inclined 45 degrees from the surface (hence a projection of the vertical dimension for all images shown), view from the side. The processing zone was illuminated, from the same side as the camera, by a diode laser beam (Cavitar).
For measuring the sample top surface edges before and during (then 100 mm ahead of the beam axis) the welding process and the resulting weld surface topology afterwards, an optical laser scan ServoRobot Smart-20 was used: 20 mm depth-of-field, 10 mm field-of-view, depth resolution 23 µm, 480 points/profile, speed 30 profiles/second (1 profile/mm).
3 Experimental edge conditions and redistributed weld The reference weld aims at optimum edges with ideally zero deviation of the three properties gap width wg = 0, surface position z0 = -5 mm and edge mismatch ze = 0. We measured

maximum deviations of wg = 0.2651mm, z0 = 0.202 mm and ze = 0.197 mm, sufficiently limited to represent a constant weld. The resulting weld surface has only small variations along the weld, too. Part of the top appearance of the reference weld is shown in Fig. 4(a) while the whole scanned weld surface profile is shown in Fig. 4(b). The weld has a width of about 5 mm, slight undercuts up to 0.5 mm deep at the sides and (due to zero gap but wire addition) a peak of about 2 mm.
(a) (b) (c) (d) (e)
Fig. 4: Top weld surface profile for the reference weld (a) photograph, (b) scanned and (c)-(e) for varied gap width wg, surface position z0, and edge mismatch ze, respectively
With the reference weld as the origin, the three edge properties were linearly varied during a single weld, separately one after the other (keeping the other two constant), i.e. the gap width (butt joint) in the range wg = 0...1.3 mm, the surface position z0 = 0...-10 mm and the edge mismatch ze=-0.19...+2.1 mm. These ideal linear variations aimed at and the real measured edge properties along the samples are plotted in Fig. 3(b). Again the deviation from the ideal variation is judged as sufficiently small (and the advantage of linearly varied welding experiments is that anyhow the whole range of variation is passed, just shifted). The properties change during welding due to thermal stress-induced distortion. The on-line edge measurements have shown that also the distortion remained in a tolerable range. As can be seen, the controlled edge property variation experiment covers a more than one order of magnitude wider range than the industrial and reference welds vary – to explore also the extreme conditions for better understanding of the trends and limits.
Figure 4(b)-(e) shows the scanned three-dimensional surface topology of the four resulting welds. The reference weld is rather constant, with a distinct reinforcement but also slight undercuts. For increasing gap the high top reinforcement level is lowered (even below the sample surface). For even wider gap wg > 0.6 mm an unstable regime starts as the weld fails to penetrate. During lack of penetration, accompanied by no more root sagging, the peak of the weld rises again. For even wider gap wg > 0.8 mm suddenly the partial (almost full) penetration weld switches to a bridge. The bridge depth is now constant, about 4...4.5 mm thick (rather than the 10 mm full penetration weld). The further increasing gap now again lowers the peak level.
The surface position was varied (strongly) from z0 = -5 mm (tool centre point in the middle) to z0 = +5 mm (TCP above the workpiece). Both extremes lead to unstable welds, while a regime of z0 = 2 mm positioning has stable, rather constant welding conditions (hence, robustness of the reference weld). For studying the edge mismatch the left plate was

lifted from ze = -0.19 mm to ze = +2.1 mm. Surprisingly, the top peak decreased, accompanied by a lateral drift to the lower plate. Lifting further pronounced the undercut at the lifted plate rather than suppressing it.
Figure 5 shows the measured weld peak height and undercut (left/right) depth for the four welds as a function of the sample position x. Figure 6 shows typical surface profiles.
Fig. 5: Properties peak height and undercut depth (top surface) along the weld for the reference weld and the three variations
Fig. 6: Typical top surface cross section profiles (lower left) and corresponding tolerance envelope (over 10 mm length) at three locations BCE (see Table 1), for wg, z0 and ze, respectively
Figure 6(a) shows typical measured surface profiles of the welds for the reference weld compared to strong and very strong variation of each of the three properties according to Table 1. Figure 6(b) shows the corresponding envelope of variation of the profile along 5 mm around the above selected positions for the three variation cases. The above descriptions of the trends can be clearly seen and quantitatively compared, e.g. lateral shift for increasing edge mismatch or the instability for very high z0-position. Table 1: Studied positions and ranges at the Beginning B, Centre C and End E of the weld
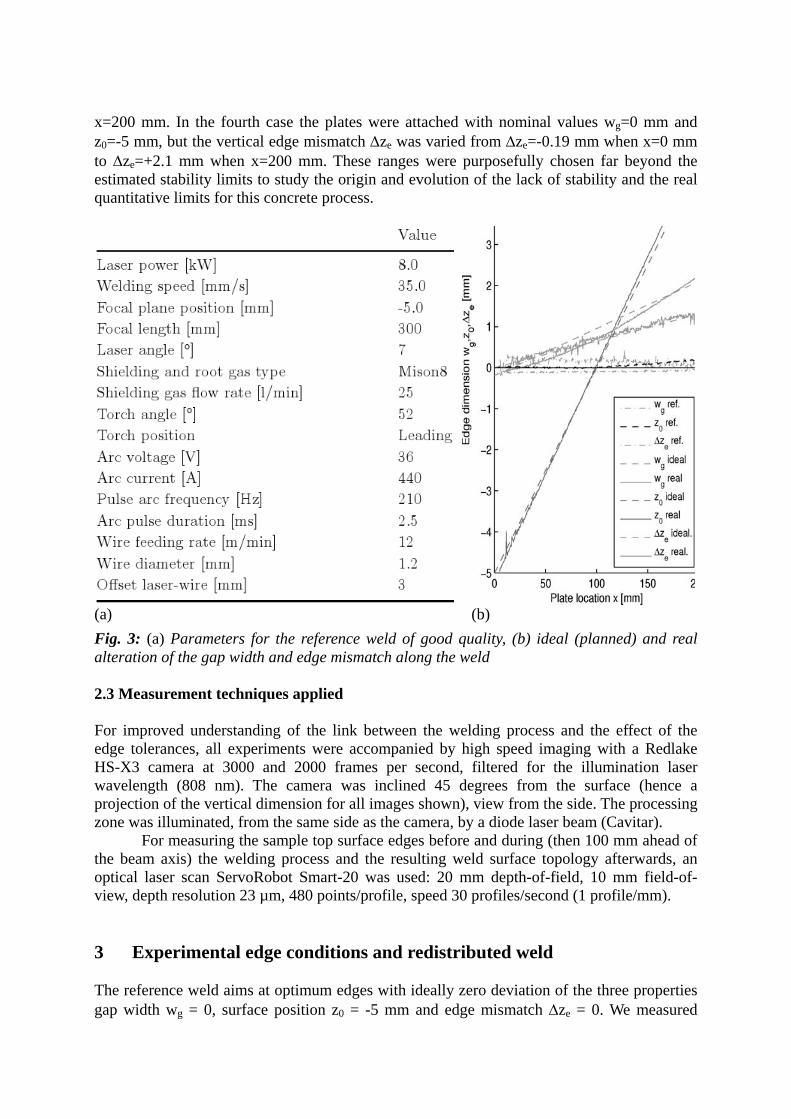
4 Analysis and discussion of the redistributing melt flow The previous section showed the resulting solid weld surface geometry depending on variation of the solid edges. In the following section, the flow of the melt as analysed by high speed imaging will be discussed and analysed. The flow is responsible for the above mass redistribution, thus for the sensitivity of the resulting weld quality on the edge tolerances. 4.1 Comparison of the weld pool surface and theory For the reference weld, i.e. for optimum (good quality) conditions a typical image of the leading pool and of the melting electrode is shown in Fig. 7(a) while the full extension of the long melt pool is shown in Fig. 8(a). Figure 7(b) shows a sequence of front region images during one electric arc pulse period.
(a) (b)
Fig. 7: High speed images of the good quality reference weld with optimum edges: (a)Melt pool front region, (b) sequence of images [250 µs-steps] during one arc pulse period [1.5 ms]
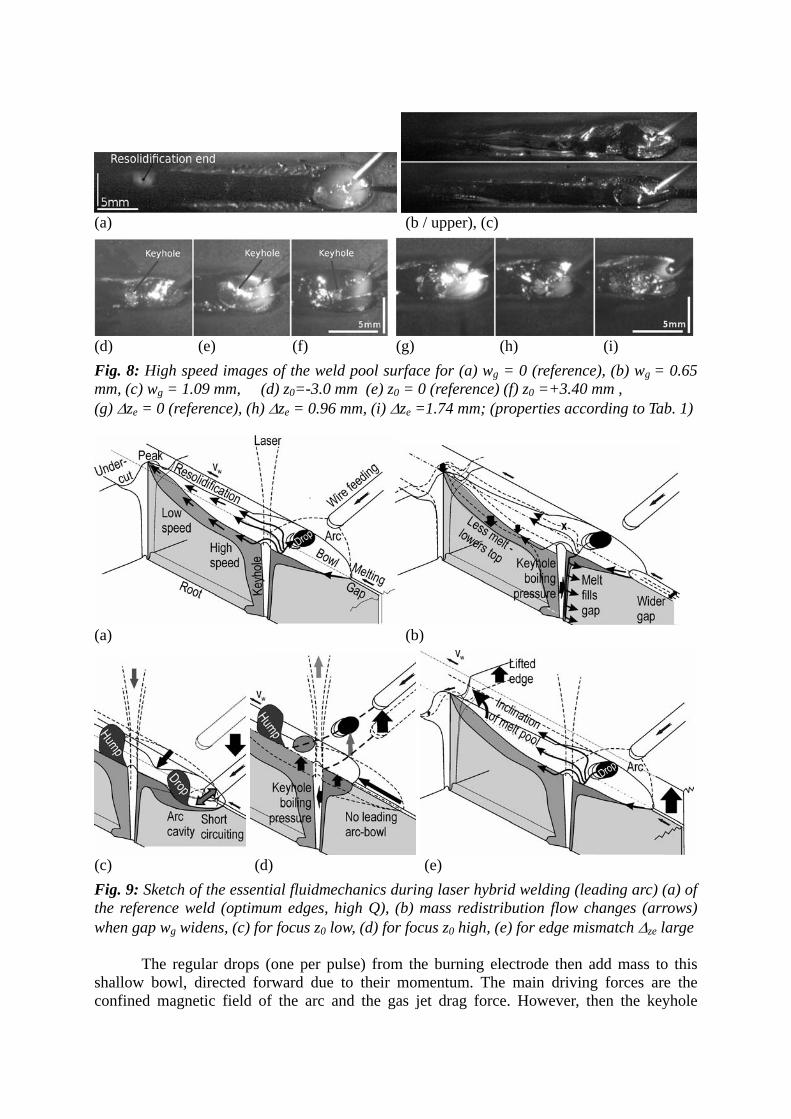
In Figure 8 a typical melt pool surface appearance (from high speed imaging) during welding is shown for the reference weld and for the three property variations, according to Table 1. Correspondingly, in Fig. 9 the main trends are sketched, namely the phenomena taking place when one property deviates from the reference weld.
The paper is only about arc-leading position. This means that the arc, in a pulsed (hence time-dependent) manner, pre-melts the edges before a quasi-steady-state melt pool (being very long at the surface) is established by the cw-laser beam. An important observation is that this preceding melt pool is immediately flushed forward to the centre, thus an empty, shallow bowl-like boundary remains.
(a) (b / upper), (c)
(d) (e) (f) (g) (h) (i)
Fig. 8: High speed images of the weld pool surface for (a) wg = 0 (reference), (b) wg = 0.65 mm, (c) wg = 1.09 mm, (d) z0=-3.0 mm (e) z0 = 0 (reference) (f) z0 =+3.40 mm , (g) ze = 0 (reference), (h) ze = 0.96 mm, (i) ze =1.74 mm; (properties according to Tab. 1)
(a) (b)
(c) (d) (e)
Fig. 9: Sketch of the essential fluidmechanics during laser hybrid welding (leading arc) (a) of the reference weld (optimum edges, high Q), (b) mass redistribution flow changes (arrows) when gap wg widens, (c) for focus z0 low, (d) for focus z0 high, (e) for edge mismatch ze large
The regular drops (one per pulse) from the burning electrode then add mass to this
shallow bowl, directed forward due to their momentum. The main driving forces are the confined magnetic field of the arc and the gas jet drag force. However, then the keyhole

follows (induced by the laser beam) and the melt has to pass beside it (accelerated and redirected by the laser-induced boiling recoil pressure [4]). Important is that the melt tries to move sidewards, but partially fails as a solid oxide has formed on which the melt slides back down again (rather than adhering on the steel melt in case when the oxides were removed from the surface edges before welding). This already determines the outer (nail-head) shape of the weld and initiation of undercuts (inclined, the melt could not adhere) as the laterally outer region of the arc-pool resolidifies during the arc current low-cycle. While the arc-induced bowl has started lateral resolidification growth, slightly inclined downwards (bowle cross section shape), the long narrow weld pool (quasi steady state, as the laser operates cw) continues the resolidification growth from the sides to the centreline until the point most rear in the centre of the pool has resolidified, where both growing trajectories meet. The melt is accelerated by the wire electrode drop (in turn by the arc’s magnetic field and gas shear force) and by the keyhole boiling recoil pressure. High melt speed in the central melt pool up to 2 m/s was measured, much faster than the drops detaching from the electrode.
In the following we will discuss how this reference flow, Fig. 8(a) and Fig. 9(a), is affected by the three edge tolerance properties and how critical they are, one after the other.
4.2 Influence of widening gap
From the experiment on linearly increasing the gap width the basic impact (relative to the reference weld) of the gap on the melt flow and in turn on the resolidification shape is illustrated in Fig. 9(b). The profile level along the weld with its linearly increasing gap width is shown in Fig. 5. It corresponds to a mass balance. We can distinguish four regimes I-IV. In Regime I (wg = 0...0.6 mm) the operating regime, the whole height level of the melt is linearly lowered (from +6 mm to -2 mm) when the gap is widened. As the root height remains constant here, an increasing part of the added drop flows downwards to fill the widening gap. Once the lack of area by the gap can no more be compensated by the added wire, the balance becomes negative – thus the melt and weld level lowers below the surface plane (underfill).
A less stable Regime II follows for wider gap (wg = 0.6...0.8 mm) where lack of penetration alters with the top lowering. Interestingly, the weld pool length now shortened significantly (17 mm instead of 22 mm). In a Regime III (wg = 0.8...0.9 mm) of partial penetration the top surface level is lifted up again, as no root sagging can take place. Suddenly (wg > 0.9 mm, Regime IV) instead of a partial (almost full) penetration weld only a 4-4.5 mm thick bridge forms for wider gaps and remains constant. The process switched to a new (drop and surface tension governed) mode where the laser drills a keyhole through and must transmit part of its excess power now. For wider gap now the lower level of the melt remains constant but the upper level lowers gradually. The weld quality is poor for wide gap. It can be concluded that a gap is acceptable provided the melt flow remains in Regime I where the peak can be linearly controlled (here for wg < 0.7 mm) and as long as a positive mass balance avoids underfill (here for wg < 0.6 mm). 4.3 Influence of varying surface position For linear (strong!) variation of the vertical surface plane position from z0 = -5 mm (thus close to the laser and wire) to z0 = +5 mm the process remains stable and about the same in a certain tolerance range, which here was z0 = -2.2...+2.4 mm (process window), see Fig. 5. When the surface plane is too close to the wire, Fig. 8(d) and Fig. 9(c), the distance laser-arc increases. The arc is then too much separated from the laser and the temperature field induced by the cw-laser hardly supports the pw-arc. The electric parameters of the arc were optimized for

close interaction with the laser beam where the laser-induced temperature field helps developing a stable, strong arc. Without this support the arc is now too weak for this high welding speed, with a short arc and drop transfer below the surface, where a cavity is formed during the voltage-high-period. This process still can basically work, despite the unusual geometry, but short circuiting is likely to take place, which here has happened twice (x=37 mm, x=47mm). Its violent flow (magnetic field, boiling event) has led to a strong peak (humps) and valley of the weld top surface.
Too low surface position causes unstable welding, too, but due to a different mechanism. When the wire is to far away from the surface, z0 > +2.4 mm, the drops fly too close to the keyhole, even hit the keyhole or travel over the keyhole into the rear part of the pool, see Fig. 8(f) and Fig. 9(d). When the drops hit the keyhole they disturb the laser too suddenly and strongly in creating a quasi-steady state keyhole, causing violent evaporation and corresponding strong recoil pressure that disturbs the regular quasi-steady melt flow. While drops that landed on the arc-generated bowl ahead of the keyhole were strongly but smoothly redirected around the keyhole, drops landing behind the keyhole are not forced by evaporation to significant temporary acceleration. This different behaviour has led to significant accumulation of melt and two strong humps (peaks at x=145 mm and x=170 mm) followed by valleys, see Fig. 5, thus again to non-monotonous flow conditions.
For varying vertical surface position (e.g. a bent or distorted workpiece) it can be concluded that too strong variation in either direction leads to an unstable weld with strong peak-valley formation (humps) due to different reasons and has to be avoided. When remaining in the (quite large) stable regime, the process is unaffected by z0-variations. 4.4 Influence of increasing edge mismatch
For lifting the vertical edge of the left plate by ze = -0.19...+2.1 mm corresponding high speed images and an illustration of the essential redistribution flow are shown in Fig. 8(g)-(i) and Fig. 9(e), respectively. Note that edge mismatch is inherently related to the surface position change discussed above, but as a combined more complex process geometry. The root remained welded through. Basically increasing edge mismatch (left plate up) has led to a clear, homogeneous trend throughout, namely a lowering of the weld peak level and its lateral shift to the right. The left undercut became even more pronounced while the right undercut disappeared, see Figs. 4-6. The process remained stable. Lifting the left edge lifts the connection region of the weld pool, hence inclining it. In this inclined melt pool the same mechanism as for the reference weld continues, just in an asymmetric geometry. Gravity acts during asymmetry but used to remain weak on such little scale. Still the melt is strongly accelerated, causing the central peak, accompanied by undercuts. However, the arc-induced bowl has changed and became asymmetric, namely steeper and less wide in the left, lifted plate. Moreover, the mass from the left, lifted plate is redistributed (flushing) in a more pronounced manner than the right plate. This leads to very little undercut at the right while the undercut at the left is determined by the arc-induced bowl inclination that becomes much steeper when lifting the edge. Phenomena observed (however, non-critical) were also a smaller arc, as attracted by the closer edge now, and drop flights that tended alternating to the lifted edge and to the lower plate, rather than keeping in the centreline. We can conclude that edge mismatch does not violate the weld stability but emphasizes the lifted undercut. A design rule can be proper arc parameters to create (by heat conduction) a bowl that has robust (more shallow) cross section, as this acts as the flow-connecting shape.

5 Conclusions For a butt joint, geometrical uncertainties from industrial edge preparation and fixture
can be reduced to three properties; local gap width, surface position, edge mismatch. The influence of these edge uncertainties on a resulting laser-arc hybrid weld surface
shape is determined by mass redistribution through the melt flow. For high quality welds with optimum edges a basic complex melt flow was identified. A wider gap linearly lowers the liquid and weld surface level, until penetration fails The vertical surface position alters the arc-heated region and the drop striking
position; hence short circuiting or mass accumulation causes humping instability. Vertical edge mismatch inclines the weld pool; it lowers the peak and laterally drifts it
to the lower plate; the upper undercut becomes more pronounced, the lower vanishes. A relatively large stable process window was identified, explained by fluid flow
phenomena; they change once exceeding critical tolerances of each of the three edge properties, here wg < 0.7 mm and z0 < 2.2 mm, while ze caused no instability.
Acknowledgements The authors are grateful for funding by the Research Council of Norrbotten, project no. NoFo 09-004, the K&A Wallenberg foundation, project no. KAW 2007-0119, the Xunta de Galicia, Dirección Xeral de Investigación, Desenvolvemento e Innovación, Project 08DPI023CT and the Ministerio de Ciencia e Innovación, Project MAT2008-06882-C04-03. References [1] Yao, Y., Wouters, M., Powell, J., Nilsson, K. and Kaplan, A. F. H.:
The influence of joint geometry and fit-up gaps on hybrid laser-MIG welding Journal of Laser Applications, v 18, n 4, pp 283-288 (2006).
[2] Alam, M. M., Barsoum, Z., Jonsén, P., Häggblad, H. and Kaplan, A. F. H.: The influence of surface geometry and topography on the fatigue cracking behaviour of laser hybrid welded eccentric fillet joints, Applied Surface Science, v 265, n 6, pp 1936-1945 (2010).
[3] Vollertsen, F. and Grünenwald, S.: Defects and process tolerances in welding of thick plates, Proc. of ICALEO'08 (Orlando, FL:LIA) pp 489-497 (2008).
[4] Hayashi, T., Katayama, S. Abe, N., Ohmori, A.: High power CO2 laser-MIG hybrid welding process for increased gap tolerance - Hybrid weldability of thick steel plates with square groove (report I), Quarterly Journal of the Japan Welding Society, 21, n 4, pp. 522-531 (2003).
[5] Fellman, A., Salminen, A.: Observation of the phenomena of CO2 laser-MAG hybrid welding, ICALEO 2006 - 25th International Congress on Applications of Laser and Electro-Optics,Congress Proceedings, art. no. 1904 (2006).
[6] Kim, Y.-P., Alam, N., Bang, H.-S., Bang, H.-S. Observation of hybrid (cw Nd:YAG laser+MIG) welding phenomenon in AA 5083 butt joints with different gap condition, Science and Technology of Welding and Joining, 11, n 3, pp. 295-307 (2006).