Embed Size (px)
Citation preview

School of Science and Engineering
University Honors Program
SAVONIUS VERTICAL WIND TURBINE:
DESIGN, SIMULATION, AND PHYSICAL
TESTING
Eddahmani Aymane
Dr. Hassan Darhmaoui, Dr. Naeem Sheikh
May 2017

SAVONIUS VERTICAL WIND TURBINE: DESIGN, SIMULATION,
AND PHYSICAL TESTING
Honors Capstone Report
I, Eddahmani Aymane, hereby affirm that I have applied ethics to the design process
and in the selection of the final proposed design. And that I have held the safety of the public
to be paramount and have addressed this in the presented design wherever may be applicable.
_____________________________________________________
Approved by the Supervisors
_____________________________________________________

iii
Acknowledgments
I would like to express my gratitude to my supervisors Dr Naeem Sheikh and Dr Hassan
Darhmaoui for their support and continuous feedback throughout the different stages of the
project. Beside my supervisors, I would like to thank the school of Science and Engineering
and the Honors Program for providing us with a multidisciplinary background that allows us
to tackle real world problems.
This project is the fruit of not only hard work but also support of friends and family,
without whom it could not have been completed.
Special gratitude is extended to my family: My mother for her patience, sacrifice, and
endless support; and my brother, Achraf, for his excitement to hear about the smallest updates,
and his support. I am grateful for the many lessons they taught me, and for their precious advice
all along the past 4 years at AUI.
The building process could not have been completed without the amazing assistance
and work of Mr. Abdelkader Balouk from the grounds and maintenance department. I would
like to thank him for taking the time to help us, and having the patience to deal with our lack
of experience.
Warm thanks to all the friends who helped along the way, from running the simulations,
to going on trips to purchase the materials, and setting up the physical tests.

iv
Table of Content
Acknowledgments ......................................................................................................................... iii
Table of Content ............................................................................................................................ iv
List of Figures ............................................................................................................................... vi
List of Tables .............................................................................................................................. viii
Abstract .......................................................................................................................................... ix
1 INTRODUCTION .................................................................................................................. 1
1.1 Context ............................................................................................................................. 1
1.2 Methodology and Objectives .......................................................................................... 2
1.3 Motivation ........................................................................................................................ 3
1.4 STEEPLE Analysis ......................................................................................................... 4
2 LITERATURE REVIEW...................................................................................................... 7
2.1 Theoretical Background .................................................................................................. 7
2.1.1 Betz's law .................................................................................................................. 8
2.1.2 Tip Speed Ratio ........................................................................................................ 9
2.1.3 Power Curve........................................................................................................... 10
2.1.4 Forces Involved ...................................................................................................... 10
2.1.5 Turbulence .............................................................................................................. 11
2.2 Types of Wind Turbines ............................................................................................... 12
2.2.1 Horizontal Axis Wind Turbines ............................................................................. 12
2.2.2 Vertical Axis Wind Turbines ................................................................................. 14
2.3 Savonius Vertical Axis Wind Turbines........................................................................ 19
2.3.1 Characterization of Savonius Wind Turbines ...................................................... 20
2.3.2 Two blades Vs. Three Blades ................................................................................ 21
2.3.3 Wind speed classification ...................................................................................... 21
3 3D COMPUTER DESIGN ................................................................................................... 23
3.1 Savonius wind turbine: Classic barrel design .............................................................. 23
3.2 Icewind Design .............................................................................................................. 28
3.2.1 Icewind ................................................................................................................... 28
3.2.2 Designing the blade ............................................................................................... 30
4 COMPUTATIONAL FLUID DYNAMICS SIMULATIONS .......................................... 35
4.1 2D Simulations: effect of the number of blades .......................................................... 35
4.1.1 Setup ....................................................................................................................... 38
4.1.2 Results ..................................................................................................................... 42

v
4.2 3D Simulations .............................................................................................................. 49
4.2.1 Setup ....................................................................................................................... 50
4.2.2 Results ..................................................................................................................... 51
5 PHYSICAL MODEL TESTING ......................................................................................... 56
5.1 Experimental Procedure ................................................................................................ 58
5.2 Results ............................................................................................................................ 60
6 CONSUMER BEHAVIOR STUDY ................................................................................... 65
7 CONCLUSION AND FUTURE WORK ............................................................................ 72
8 BIBLIOGRAPHY ................................................................................................................. 74
Appendix A - 2D Simulation Results .......................................................................................... 77
Appendix B - Survey distributed to AUI students ...................................................................... 80

vi
List of Figures
Figure 1 STEEPLE Analysis.......................................................................................................... 6
Figure 2 Types of wind turbines ................................................................................................... 7
Figure 3 Power Coefficient plot .................................................................................................... 8
Figure 4 Power Coefficient curve for different types of turbines ............................................... 9
Figure 5 Power curve ................................................................................................................... 10
Figure 6 The effect of lift and drag ............................................................................................. 12
Figure 7 Types of VAWTs .......................................................................................................... 15
Figure 8 Working principle of a Darrieus rotor ......................................................................... 16
Figure 9 Darrieus "eggbeater" turbine ........................................................................................ 17
Figure 10 H-Darrieus rotor .......................................................................................................... 18
Figure 11 Working principle of a Savonius rotor ...................................................................... 19
Figure 12 Three blades Savonius turbine .................................................................................... 20
Figure 13 Overlap of the two blades on a Savonius rotor ......................................................... 23
Figure 14 Four blades Savonius rotor design.............................................................................. 24
Figure 15 Two blades Savonius rotor design .............................................................................. 24
Figure 16 Three blades Savonius rotor design ............................................................................ 24
Figure 17 Three blades Savonius rotor design ............................................................................ 25
Figure 18 Two blades Savonius rotor design .............................................................................. 25
Figure 19 Four blades Savonius rotor design.............................................................................. 25
Figure 20 Three blades Savonius rotor design ............................................................................ 26
Figure 21 Two blades Savonius rotor design .............................................................................. 26
Figure 22 Four blades Savonius rotor design.............................................................................. 26
Figure 23 No base barrel design .................................................................................................. 27
Figure 24 Images from Icewind's promotional material . .......................................................... 29
Figure 25 Icewind blade, step 1. .................................................................................................. 30
Figure 26 Icewind blade, step 2 ................................................................................................... 31
Figure 27 Icewind blade, step 3 ................................................................................................... 31
Figure 28 Icewind blade, step 4 ................................................................................................... 32
Figure 29 Icewind blade - Final design ....................................................................................... 32
Figure 30 Icewind rotor design .................................................................................................... 33
Figure 31 Three blades Icewind rotor: our design vs. the original ............................................ 33
Figure 32 Pressure difference ...................................................................................................... 36
Figure 33 ANSYS Fluent project ................................................................................................ 38
Figure 34 2D model of a 2-blade rotor ........................................................................................ 39
Figure 35 2D 2-blade rotor and tunnel mesh .............................................................................. 40
Figure 36 Residuals plot ............................................................................................................... 41
Figure 37 Two blades rotor at 5 m/s ............................................................................................ 42
Figure 38 Three blades rotor at 5 m/s .......................................................................................... 43
Figure 39 Four blades rotor at 5 m/s............................................................................................ 43
Figure 40 Rotor orientation .......................................................................................................... 45
Figure 41 Pressure difference for two blades rotor .................................................................... 46
vii
Figure 42 Pressure difference for three blades rotor .................................................................. 46
Figure 43 Pressure difference for four blades rotor .................................................................... 47
Figure 44 Pressure values at 5m/s ............................................................................................... 48
Figure 45 Pressure difference summary ...................................................................................... 48
Figure 46 30° vs. 90° orientation ................................................................................................. 49
Figure 47 Icewind design mesh ................................................................................................... 50
Figure 48 Barrel design mesh ...................................................................................................... 50
Figure 49 Barrel Mesh - Close up................................................................................................ 51
Figure 50 Pressure Distribution on Barrel design at 30° ............................................................ 51
Figure 51 Pressure Distribution on Icewind design at 30° ......................................................... 52
Figure 52 Moment values for Barrel at 30 ° ............................................................................... 52
Figure 53 Moment values for Icewind at 30 ° ............................................................................ 53
Figure 54 Pressure Distribution on Icewind design at 90° ......................................................... 54
Figure 55 Pressure Distribution on Barrel design at 90° ............................................................ 54
Figure 56 Moment values for Icewind at 90 ° ............................................................................ 55
Figure 57 Moment values for Barrel at 90 ° ............................................................................... 55
Figure 58 Parts used for the build ................................................................................................ 56
Figure 59 Built models ................................................................................................................. 57
Figure 60 Turbine Test ................................................................................................................. 58
Figure 61 View from overhead camera ....................................................................................... 59
Figure 62 Anemometer used for measuring wind speed ............................................................ 59
Figure 63 Participants' distribution .............................................................................................. 66
Figure 64 Participants’ exposure to HAWTs .............................................................................. 67
Figure 65 Participants’ exposure to VAWTs .............................................................................. 67
Figure 66 Survey Options: Icewind vs. Barrel............................................................................ 68
Figure 67 Design Aesthetics ........................................................................................................ 68
Figure 68 Design Aerodynamics ................................................................................................. 68
Figure 69 Design Aesthetics AND Aerodynamics: Option 1 .................................................... 69
Figure 70 Design Aesthetics AND Aerodynamics: Option 2 .................................................... 69
Figure 71 Importance of overall appearance............................................................................... 70
Figure 72 Importance of noise level ............................................................................................ 70
Figure 73 Importance of efficiency ............................................................................................. 70

viii
List of Tables
Table 1 Comparison of VAWTs & HAWTs .............................................................................. 15
Table 2 Wind speed classification ............................................................................................... 22
Table 3 Measurements (m)........................................................................................................... 24
Table 4 Measurements (m)........................................................................................................... 25
Table 5 Pressure difference in Pa ................................................................................................ 44
Table 6 Generated wind speed ..................................................................................................... 60
Table 7 Velocity and Acceleration Data ..................................................................................... 60
Table 8 Angular Velocity ............................................................................................................. 61
Table 9 Angular Acceleration ...................................................................................................... 62
Table 10 Moment of Inertia for both designs ............................................................................. 62
Table 11 Torque values for both designs .................................................................................... 62
Table 12 Cp Calculations - Aluminum Rotor ............................................................................. 63
Table 13 Cp Calculations - Our Rotor......................................................................................... 64

ix
Abstract
This project consists of designing, and testing the performance of a Savonius Vertical
Wind Turbine. The project compares the performance of two designs: a classic barrel Savonius
design, and the innovative design of Icewind, an Icelandic startup that makes Vertical Axis
Wind Turbines (VAWTs).
In order to do so, first a literature review is carried out to understand the theory behind
wind turbines and to understand the different types and characteristics of VAWT.
A Computer Aided Design (CAD) tool is then used to make a basic barrel Savonius
rotor. Then, the Icewind design is reverse engineered from promotional material available on
the company’s website. Computer simulations, both 2D and 3D, are run to understand the
characteristics of a Savonius rotor, and to obtain its pressure profile when subjected to a wind
flow.
A physical model of both designs is built to physically test and compare the
performance of the two designs under different conditions. Finally, a consumer behavior study
is conducted to learn about the design’s appeal to the public.
From the different steps, we concluded that Icewind does show a better performance on
all fronts. Not only is it more efficient –for the same cost-, but it is more accepted by the public.
Keywords: Vertical Axis Wind Turbine, Savonius, Simulation, Physical testing.

1
1 INTRODUCTION
1.1 Context
It is beyond doubt that the current energy trends and unreasonable use of the planet's
resources are putting the planet in great danger. The desired unlimited growth based on limited
stock of fossil fuels, is not only unrealistic, but also extremely detrimental to the fragile systems
on earth. As sea ice keeps melting, and global temperatures keep rising, the consequences of
human action are already felt across the world. Longer droughts in usually fertile regions and
catastrophic floods in dry regions are signs of a greater disaster that humanity is causing. In the
face of climate change deniers, and unimaginably wealthy and powerful oil companies, the
change is indeed challenging, but extremely necessary.
The switch to more sustainable means to satisfy our ever-increasing energy demand has
never been so urgent, as the scientific community is sounding the alarm for an eminent
environmental disaster. Clean energy sources are not only an alternative to the limited fossil
fuel reserve, but are also a way to help undo the damage we have caused. Around the world,
researchers are investigating cheaper, renewable and more reliable energy sources. Solar and
wind energy being the two most common renewable sources, are the most active research
fields. They are at the center of clean energy innovation. With the sun and the wind being
practically an inexhaustible power source, the ability to convert this energy to electricity may
be the solution to most of our energy problems.
In the recent years, there have been an exponential growth in the use of small-scale
green energy technologies. This further emphasizes the need of innovation in this field,
especially for small-scale applications. Hence, the field of renewable energies is not only
environmentally attractive, but politically, and economically as well.
With the advancements in the fields of renewables, and with the urgent need for
sustainability, many companies claim to have invented the next best source that will change

2
the world. These claims usually manage to raise substantial funds, as this field is very attractive
for investors, even though the claim is often not supported.
Icewind, a startup in Iceland, proposes an innovative design based on the classic
Savonius vertical wind turbine. They claim that their design performs better than the basic
turbine, and they plan to go on the market in the coming months. They have launched many
funding campaigns and have obtained a research grant from the Icelandic government. Their
website does not present any detailed description of the design or its performance, as they are
very secretive about it, to remain competitive.
1.2 Methodology and Objectives
The goal of our project is to investigate whether the design proposed by Icewind is
indeed better than the classic Savonius vertical wind turbine, by reverse engineering their
design from their promotional material, model it, build it, and test it. Our research first
establishes a performance benchmark of a classic Savonius turbine, and then compares the
results and draws conclusions accordingly. The project also includes a fabrication step, where
the model is going to be built and physically tested to obtain experimental data that describes
the rotor’s performance.
Our research question is therefore whether the Icewind turbine design performs better
than the classic Savonius Turbine Design. We will follow a rigorous scientific method in which
claims are confirmed or denied based on results obtained from the analysis we will perform.
This project will make use of the knowledge learned in the different mechanics, design,
engineering process, as well computer simulations classes. It will also reinforce knowledge of
the scientific research process, and serve as introduction to hands-on engineering and
fabrication, a field that our university lacks.

3
There is nothing worse than developing an inefficient turbine than investing on an
efficient turbine that does not sell. Part of the company’s claim is that there were aesthetic (and
not only functional) considerations to their design. In order to better understand what people
think of this design, we will perform a consumer behavior study that will compare the appeal
of the Icewind design to that of the barrel design.
1.3 Motivation
The main motive behind the project is to take us a step closer to a sustainable world,
where the relationship between human beings is that of harmony. Human beings have always
attempted to tame nature, and make the relationship between us and nature one of master and
slave. The truth, however, is that nature will always win. It will adapt, and any damage we
cause to its systems will result in our destruction first.
This project serves as a small step in the advancement of the field of small-scale
renewable energy generation. Small-scale green energy will allow more people to make use of
the planet’s renewable resources, and slowly switch from fossil fuels. At the same time, the
project will look into the company’s claims and attempt to confirm or refute them. Since
currently, a lot of funding is available for the field of renewables; many researchers and
companies are tapping into this, without producing tangible results or even a sound design. We
hope to learn how to deal with such a claim – in this case, the particular claims of Icewind
about their particular design.
4
1.4 STEEPLE Analysis
This project was not chosen because of its technical characteristics only, but also
because it tackles more issues, especially those related to the environment.
Socially, this project aims to provide an alternative small-scale clean energy generation
for people with no access and no connection to the grid. These could be people living in remote
areas with constant wind strong enough to run a small rotor. The project also aims at increasing
awareness of issues of energy and the environment by making the use of renewable sources
easy and widespread.
Technologically, the project is centered on designing and building an innovative
Vertical Axis Wind Turbine by reverse engineering designs available on the market. The
project also involves experimentally testing the performance of Savonius rotors by using both
computer simulations and physical tests. By working towards the objectives mentioned before,
we are actively taking part in the efforts to develop renewable energy technologies and to solve
our energy problems.
Environmentally, the project provides a clean alternative to fossil fuel based generation,
which will reduce our environmental footprint. By making use of a renewable and inexhaustible
energy source (wind), we will be decreasing the energy related emissions.
Economically, designing and testing an alternative design of wind turbines provides a
cheaper way to utilize the energy of the wind as we are building a cheaper vertical rotor. The
project also aims at demonstrating the public appeal that a Vertical Axis Wind Turbine design
has by performing a consumer behavior study.
Politically, we hope that this project would serve as step towards reducing our country's
energy dependence. By proving the usefulness of cheap alternatives, we are helping in pushing
political action to promote the use and integration of renewable energies.

5
Legally, the project aligns with the commitments to the recommendations of the COP
22. Morocco pledged to generate more green energy, and our project represents a step in this
direction. The project also allows for small-scale energy generation according the 13.09, and
the 58.15 Moroccan laws, that will allow individuals to inject the generated energy into the
national grid.
Ethically, this project aims to reduce and undo the vast damage we caused to our
environmental systems. By working on renewable energy sources, we take part in the global
action to protect the environment. Moreover, the project tests the claims of the Icewind
Company in an objective scientific manner to reach well-supported conclusions. Finally, the
project provides people with a clean alternative energy source and empowers people with no
access to conventional energy sources.
Figure 1 summarizes the different aspects of our project:

6
• Provide small-scale clean energy generation for people with no access and no connection to the grid (remote and rural areas)
• Increase awareness of issues of energy and the enviornment by making the use of renewable sources easy and widespread.
Social
• Design and build an innovative Vertical Axis Wind Turbine, and experimentally test the performance of Savonius rotors.
• Take part in the efforts to develop renewable energy technologies to solve our energy problems.
Technological
• Provide a clean alternative for fossil fuel based generation, and reduce our environmental footprint
• Make use of a renewable and inexhaustible energy source instead of basing our generation on limited and polluting sources.
Environmental
• Provide a cheaper way to utilize the energy of the wind by building a cheaper vertical rotor.
• Investigate consumer attitude towards Vertical Axis Wind Turbines.
Economical
• Reduce our country's energy dependence.
• Help in pushing political action to promote the use and integration of renewable energies
Political
• Help achieve the commitments to the recommendations of the COP 22 in generating more green energy.
• Allow for small scale generation according the 13.09 Moroccan law.
Legal
• Help reduce and undo the vast damage we caused to our environmental systems.
• Take part in the global action to protect the environment.
• Test the claims of the Icewind company in an objective scientific manner.
• Provide people with a clean alternative energy source and empower people with no access to conventional energy sources.
Ethical
Figure 1 STEEPLE Analysis

7
2 LITERATURE REVIEW
Before we reproduce the Icewind design and run the simulations, we will first explore
wind energy technologies and focus more on vertical turbines and more specifically Savonius
vertical wind turbines.
2.1 Theoretical Background
Wind is an inexhaustible energy source available all around the world. In fact, on shore
energy is extremely large and reported to be from 20,000*109 kWh to 50,000*109 kWh [1]. In
2014, the International Energy Agency (IEA) reported that the global electricity generation
reached 23903*109 kWh [2]. The potential onshore wind energy is of course not entirely usable,
as the wind might be too slow or too fast for practical applications. Some of the locations are
also very remote and very far from consumption hubs, making the energy transportation not
economically viable.
Wind turbine sizes vary drastically and have known massive developments in the last
decades. The average size in the 1980s was less than 100 kW [1]; nowadays the size can reach
up to 8 MW like the Vestas V164, a horizontal axis offshore wind turbine [3].
There are two types of Wind turbines: the widely spread and most deployed Horizontal
Axis Wind Turbine (HAWT), and the less popular Vertical Axis Wind Turbine (VAWT) as
shown in Figure 2 [4]. We will explore these types in details in the coming sections.
Figure 2 Types of wind turbines [4]

8
The principle behind wind turbines is simple, and humanity has been making good use
of it for centuries. The kinetic energy from the flow of a mass of air is transformed to rotational
kinetic energy. This rotational energy is then used as mechanical energy to run machine parts
to pump water out of a well, mill grains, or generate electricity.
2.1.1 Betz's law
Betz law, named after German physicist Albert Betz, states the maximum theoretical
efficiency that any wind turbine can attain. It states that there is a maximum power that can be
extracted from a flow of air. Because of conservation of momentum and of mass, energy can
never be fully extracted from wind. Betz proved that the maximum kinetic energy that can be
extracted from the wind cannot exceed 16/27 (59.3%). Thus according to this law, no turbine
can extract all the speed out of the flowing wind, and the wind will always have a flow after
passing through the turbine.
Figure 3 is a plot that shows the power coefficient of a turbine Cp (the ratio of the
extracted power to the available power) vs. the ratio of the speed of the wind before and after
passing through the turbine:
Figure 3 Power Coefficient plot [5]
Speed ratio

9
The derivation of the Betz limit is based on a horizontal axis wind turbine, and does not
apply directly to vertical turbines [6]. The same source argues even that this theoretical limit
can be exceeded using an ideal VAWT system. However, it is reported that VAWTs are less
efficient than HAWTs, and are less likely -in their current state- to exceed the limit for
horizontal axis turbine [7].
2.1.2 Tip Speed Ratio
The tip speed ratio (lambda 𝜆) is the ratio of the speed of the tip of the blades to the
speed of the wind: 𝜆 =𝑣𝑡𝑖𝑝
𝑣𝑤𝑖𝑛𝑑.
As the tip speed ratio varies, so does the power coefficient and hence the efficiency of
the turbine. An optimal value that will result in the maximum Cp is desired.
Figure 4 shows the Cp lambda curve for different types of wind turbines as cited in [8]:
Figure 4 Power Coefficient curve for different types of turbines [8]
Low tip speed ratio means not enough energy is extracted from the wind, and
consequently a low Cp. A high wind tip ratio can also result in low Cp, as well as high stresses
in the blades. Therefore, it is very important to have the optimal tip speed ratio, to maximize
the efficiency.
Power
Coefficient
Cp
Ratio of Blade Tip Speed to Wind Speed

10
2.1.3 Power Curve
The power curve is a plot that describes the performance of a wind turbine at different
wind speeds. It shows the electrical energy power output vs. the wind speed, and gives an idea
about the minimum and maximum wind speeds for a wind turbine.
Figure 5 shows a typical power curve as obtained from [9]:
Figure 5 Power curve [9]
The power generated is of course less than the extracted kinetic energy, as it has to go
through a gearbox, and a generator, and both have efficiencies less than 100%.
Every turbine has its own minimum necessary wind speed to run, as shown in the
Figure. Turbines are usually shut down at high speeds to prevent mechanical failure that would
lead to a catastrophic failure of the turbine system.
2.1.4 Forces Involved
There are two types of forces that cause the wind turbines to rotate. These are drag and
lift. Drag force has the same direction as the fluid flow (wind in our case), and lift forces are
perpendicular to the direction of the flow. Depending on the type of the blades used, a turbine
could be using either lift or drag to cause the rotational motion. Horizontal turbines as we will

11
see in the following sections, utilize the lift force on their blades whereas Savonius turbines
make use of the drag force to push the blades.
2.1.5 Turbulence
In [8], turbulence is defined as “instability or disturbance” as well as unpredictability
of the weather (wind speeds, direction, duration ...).
Turbulence presents a major challenge for wind turbines as it makes the generation
profile inconsistent and decreases the lifetime of turbine blades because of the mechanical
stresses. According to [10], predicting turbulence is as important as predicting the general
weather conditions. The random and sudden changes in wind speed and direction pose many
challenges on the turbine components. These components have to be able to accommodate
short duration of peak loads at times of high turbulence, and have to be mechanically strong to
resist the vibrations generated from the turbulent flow [10].
There are other concepts and variables that impact the performance and characteristics
of turbines, such as twist angle of the blades of HAWTs, pitch angle, friction ..., however as
our project deals with Savonius wind turbine we only discuss the concepts that are most
pertinent to this specific type of turbines. We will review other factors in details in the section
detailing Savonius VAWTs.

12
2.2 Types of Wind Turbines
2.2.1 Horizontal Axis Wind Turbines
As mentioned before horizontal axis wind turbines are the most mature and widely used
wind turbines on the planet. In this section, we will briefly look at the principal, advantages,
and challenges of this type of turbines. There are multiple factors that determine design of
horizontal wind turbine, from material choice for the blades and stress distribution, to
turbulence effects and vibrations. As this project deals principally with Savonius vertical wind
turbines, we will only give a brief introduction of HAWTs.
2.2.1.1 Principle
Any turbine whose rotor is connected to a horizontal shaft is a horizontal axis wind
turbine. The rotor’s blades rely on lift in order to make the turbine rotate. This is a result of the
aerofoil shape of the blades of the HAWTs.
The aerofoil blade design works like an airplane wing. The difference of pressure
between the two sides of the blade results in a lift force that is perpendicular to the blade and
hence makes it rotate. Figure 6 shows the effect of lift and drag [11]:
Figure 6 The effect of lift and drag [11]
Differential pressure caused by flow
over airfoil shaped body leads to net
LIFT force
Low-pressure
side of airfoil
High-pressure
side of airfoil

13
They usually have two or three blades, and the diameter and the height vary depending
on the power output needed. The higher the tower, the higher the wind speed, and the longer
the blades, the larger the area swept and the power output. The rotor is attached to a shaft which
goes through a gearbox and then to a generator. A good blade design suitable for a wind turbine
is one with a high lift to drag ratio, as this maximizes the power output of the turbine. By
designing the blade in such a way to maximize lift and minimize drag, most of the wind energy
is going to turn the rotor, and hence produce more power [8].
2.2.1.2 Advantages
As all renewable energy sources, HAWTs are a clean and sustainable energy source,
with a great potential. HAWTs particularly have a “high generating capacity, improved
efficiency, variable pitch blade capability, and tall tower base structure to capture large
amounts of wind energy” [12]. Their massive sizes, allows for large-scale generation, and their
variable pitch angle allows for using an optimal angle of attack which increases their efficiency.
HAWTs are based on a very mature technology, and their high efficiencies offer a very
competitive energy source for both onshore and offshore applications. However, they do have
many disadvantages discussed in the following section.
2.2.1.3 Disadvantages
One of the most negative aspects of HAWTs is that they are extremely noisy. This
usually makes them less socially acceptable than other renewable sources. HAWTs are very
difficult to design and build. There are many variables that go into designing the perfect blade
for a horizontal wind turbine, this makes them rather expensive and difficult to maintain. They
require a strong support to carry the heavy load and resist vibrations. HAWTs also require an
expensive and sophisticated yaw mechanism to turn the rotor, as they always have to face the
direction of the wind.

14
2.2.2 Vertical Axis Wind Turbines
The main reason behind developing Vertical Axis Wind turbines is that they work
regardless of the wind direction. VAWTs do not require a yaw mechanism and are very fixed
in the sense that no change to their direction or that of the blade is made once installed. The
lack of a yaw mechanism is one of the reasons VAWTs are not as expensive or complicated to
make. This makes them ideal for small-scale applications such as remote areas with very small
electric load. Their blades do not require a mechanism to change their angle as they work with
any wind direction. VAWTs are considerably less noisy than HAWTs, which makes them more
socially accepted. In addition to this, the small size means they can be integrated easily within
an urban setting, and present no danger to the wildlife in rural areas.
They still share many components with HAWTs however, such as the shaft, the
gearbox, the tower, and the generator unit. The placement of these units is different, since in
VAWTs the gearbox and generator are placed at the base of the unit and do not require as much
support as HAWTs. This means easier access for maintenance and repairs, which lowers the
overall cost of such systems.
As mentioned before, the way the Betz limit is derived uses some assumptions that are
not applicable to VAWTs. However, in general VAWTs are far less efficient than HAWTs.
Their small capacity makes them ideal for light load application such as communication
systems in remote areas. VAWTs can be used for large capacity installations, but the materials
needed and the massive investment make them undesirable [12]. VAWTs are also suitable for
either low wind speeds at which HAWTs do not function or high wind speeds at which HAWTs
are shut off. As stated in [7], “a HAWT can achieve higher efficiencies, but only if the energy
quality of the wind is high. High wind turbulence, wind fluctuations, and high directional
variability can cause significant problems for a HAWT, whereas VAWTs can operate well”.

15
Table 1 below is a summary comparison of the characteristics and performance of
VAWTs and HAWTs [13]:
Table 1 Comparison of VAWTs & HAWTs
VAWTs HAWTs
Tower Sway Small Large
Tower Mechanism No Yes
Overall Formation Simple Complex
General Location On ground Not on ground
Height from Ground Small Large
Blade’s operation space Small Large
Noise produced Low Relatively high
Wind direction Independent Dependent
Obstruction for Birds Low High
As shown in Figure 7, there exist three types of rotors for the Vertical Axis Wind
Turbines: the Darrieus rotor, the H-Darrieus rotor, and the Savonius rotor [8].
Figure 7 Types of VAWTs [8]

16
2.2.2.1 Darrieus Rotor
Darrieus turbines are vertical turbines whose blades are aerofoils that use lift force to
turn the rotor and generate electricity. They were designed and first fabricated by the French
aeronautical engineer Georges Jean Marie Darrieus in the 1920s. Their working principle is
quite different from that of horizontal axis turbines, even though they both rely on the forces
of lift. After the turbine starts rotating, the motion of its blades through the air creates an
apparent wind that is relative to the rotating blades. This relative airflow is added to the wind
resulting in a force combination. This creates a force that causes a net positive torque in the
rotor, making it rotate in the same direction it had originally. If the Darrieus turbine is
stationary, most of the time the wind will not cause it to move, as it is the combination of the
airflow resulting from the motion of the blades and the wind that sustains the motion, and not
just the wind. The Darrieus rotor has to be started by spinning it until it reaches its operation
speed, which represents a major disadvantage. Figure 8 illustrates its working principle [14].
Figure 8 Working principle of a Darrieus rotor [14]
17
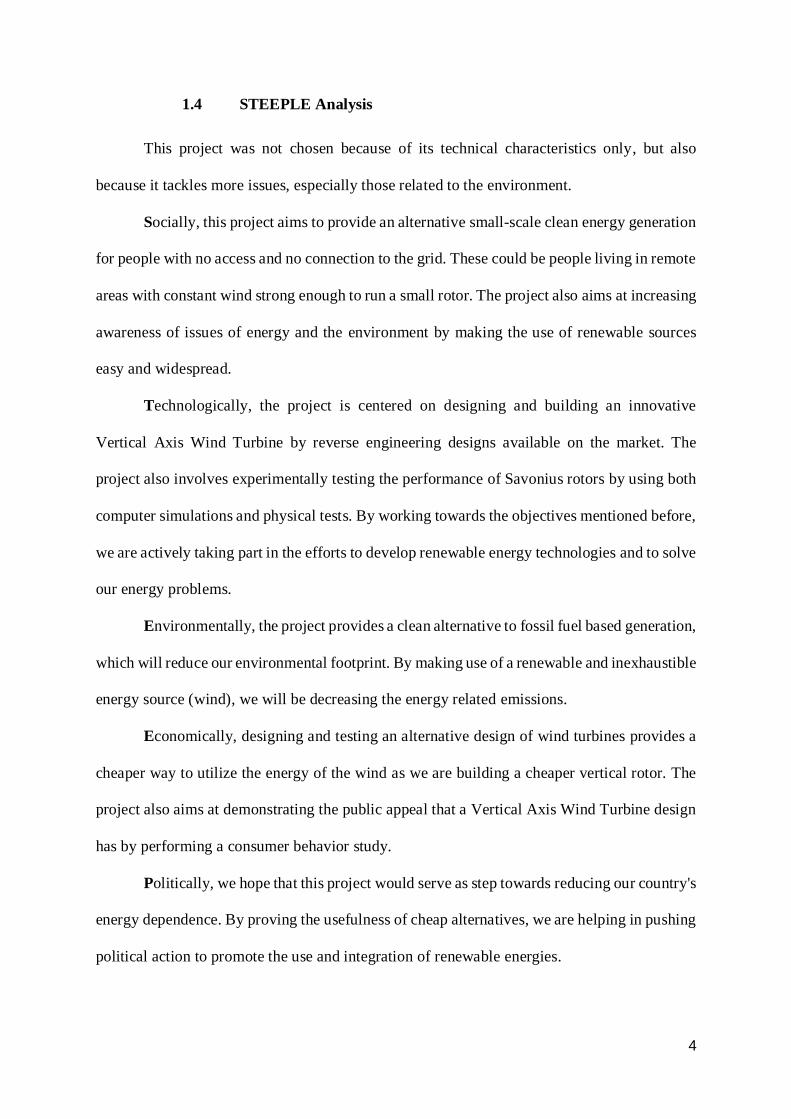
The Darrieus rotor takes the shape of an eggbeater. This curved shape minimizes the
bending moments that result from the centrifugal forces that are exerted on the rotating blade.
Figure 9 shows an example of a Darrieus eggbeater turbine [14]:
Figure 9 Darrieus "eggbeater" turbine [14]
The shape of the blades in these designs is quite difficult and expensive to manufacture
(aerofoil, curvature). This led to the development of a second type of Darrieus turbines
discussed in the next section.
2.2.2.2 H-Darrieus Rotor
The H-Darrieus rotor, also known as the Giromill rotor, is a more efficient version of
the Darrieus rotor. Its blades are easier to manufacture and offer greater efficiency, making it
more attractive both technically and economically. Straight blades replace the curved blades
and use the same principal to operate. The two blades version of the Giromill forms the shape
of the letter H, and hence the name. Its blades can either be fixed or have a variable pitch
depending on the needs, and some of the variable pitch designs are able to self-start [13].

18
Figure 10 shows the most common 3 blades H-Darrieus rotor VAWT [8]:
Figure 10 H-Darrieus rotor [8]
There are other less common experimental variations of the Darrieus rotor, but the ones
discussed are the most used and researched. The last type we will discuss is the Savonius Wind
Turbine, the focus of this project.
2.2.2.3 Savonius Rotor
As this type is the focus of our project, it will be discussed in greater detail in the
following section.

19
2.3 Savonius Vertical Axis Wind Turbines
Savonius wind turbine was invented by the Finnish engineer Sigurd Savonius in 1922.
Its most basic design is S-shaped with two blades.
The Savonius turbine uses drag to push the curved blades to generate a torque that will
make the rotor turn. Aerodynamically it is the simplest wind turbine to design and build which
reduces its cost drastically compared to the aerofoil blade designs of the other VAWTs and
HAWTs.
Its working principle is extremely simple. The turbine rotates because of the difference
of the drag force acting on the concave and convex parts of its blades. Figure 11 illustrates this
principle [15]:
Figure 11 Working principle of a Savonius rotor [15]
The air is trapped in the concave part and pushes the turbine. The flow that hits the
convex part does produce a drag that is lower than the one on the concave part. It is the
differential of the drag force that causes this turbine to rotate.
This lowers the efficiency of the turbine as some of the wind’s power is used in pushing
the convex part and is hence “wasted” [15]. More blades can be added to the S shape design,
and the same principle causes it to spin as shown in Figure 12:

20
Figure 12 Three blades Savonius turbine
According to [16], “a Savonius rotor requires 30 times more surface for the same power
as a conventional rotor blade wind-turbine. Therefore it is only useful and economical for small
power requirements.” This makes Savonius ideal for small applications with low wind speeds.
Savonius are hence desirable for their reliability, as they are able to work at several magnitudes
of wind speed.
2.3.1 Characterization of Savonius Wind Turbines
Every Savonius wind turbine is characterized by the swept area 𝑨𝒔. This area influences
the energy output of the turbine, and the larger it is, the more energy the turbine collects.
𝑨𝒔 = 𝑯 ∗ 𝑫 where H is the height of the turbine and D is its diameter [15].
The tip speed ratio of the rotor is defined by the equation: 𝝀 =𝑽𝒓𝒐𝒕𝒐𝒓
𝑽=
𝛚∗𝐝
𝑽 where V
is the wind speed, 𝜔 is the angular velocity of the turbine, and d is the diameter of the semi-
cylindrical blade [15].
The torque coefficient Ct is the ratio between the torque in the rotor and the theoretical
torque that the wind can cause: 𝑪𝒕 =𝑻
𝑻𝒘=
𝑻𝟏
𝟒𝝆∗𝑨𝒔∗𝒅∗𝑽𝟐
where T is the torque in the rotor and
𝜌 is the air density.

21
The static torque coefficient Cts expresses the turbines ability to self-start. It is the ratio
of the maximum static torque in the turbine and the theoretical wind torque:
𝑪𝒕𝒔 =𝑻𝒔
𝑻𝒘=
𝑻𝒔𝟏
𝟒𝝆∗𝑨𝒔∗𝒅∗𝑽𝟐
where Ts is the maximum static torque [15].
The torque in the rotor can be calculated using the following equation: 𝑇 = 𝐼 ∗ 𝛼, where
I is the rotor’s moment of inertia and 𝛼 is the rotor’s angular acceleration [15].
The power coefficient Cp is the ratio of the extracted power from the wind to the
available power in the wind: 𝑪𝒑 =𝑷𝝎
𝑷𝒂=
𝑻∗𝝎𝟏
𝟐𝝆∗𝑯∗𝑫∗𝑽𝟑
Using these factors, we can learn about the turbine’s characteristics and analyze its
performance.
2.3.2 Two blades Vs. Three Blades
Experimental studies by [15] confirm that Savonius wind turbines do perform well at
low wind speeds (cut in speed at around 2.5 m/s). According to the same study, two blades
perform better than three blades as more drag is wasted in the three blades versions. The power
coefficient of the two blade design is higher than that of the three blade design.
This result is confirmed by [17]. In their experimental study, they found that 2 blades
do perform better than 3 blades. They also found that 4 blades perform even better than 2 blades
at low tip speed ratio (TSR), and that 3 blades perform better at higher TSR.
2.3.3 Wind speed classification
As we keep mentioning high vs. low wind speed, it is important to define what qualifies
as high or low speeds.

22
The IEC 61400 is a comprehensive report that provides detailed comprehensive
international standards for wind turbines by the International Electrotechnical Commission.
[18]. Table 2 shows this classification:
Table 2 Wind speed classification
Wind Turbine Class I II III
Vave (M/S) 10 8.5 7.5
Vref (M/S) 50 42.5 37.5
V50,Gust (M/S) 70 59.5 52.5
Iref
A 0.16
B 0.14
C 0.12
Where “Vave is the annual mean wind speed at hub height. Vref is the 50-year extreme
wind speed over 10 minutes. V50, gust is the 50-year extreme gust over 3 seconds. Iref is the mean
turbulence intensity at 15 m/s, and A, B and C are the categories of higher, medium and lower
turbulence intensity characteristics respectively.” [18].
23
3 3D COMPUTER DESIGN
3.1 Savonius wind turbine: Classic barrel design
As the goal is to test the Icewind design (which we will discuss in the coming
paragraphs), we will first design a classic barrel Savonius wind turbine, and then later modify
it to reach the Icewind design. In the simulation phase, we will first obtain results from the tests
on the classic barrel Savonius rotor, and then compare them to the new Icewind design.
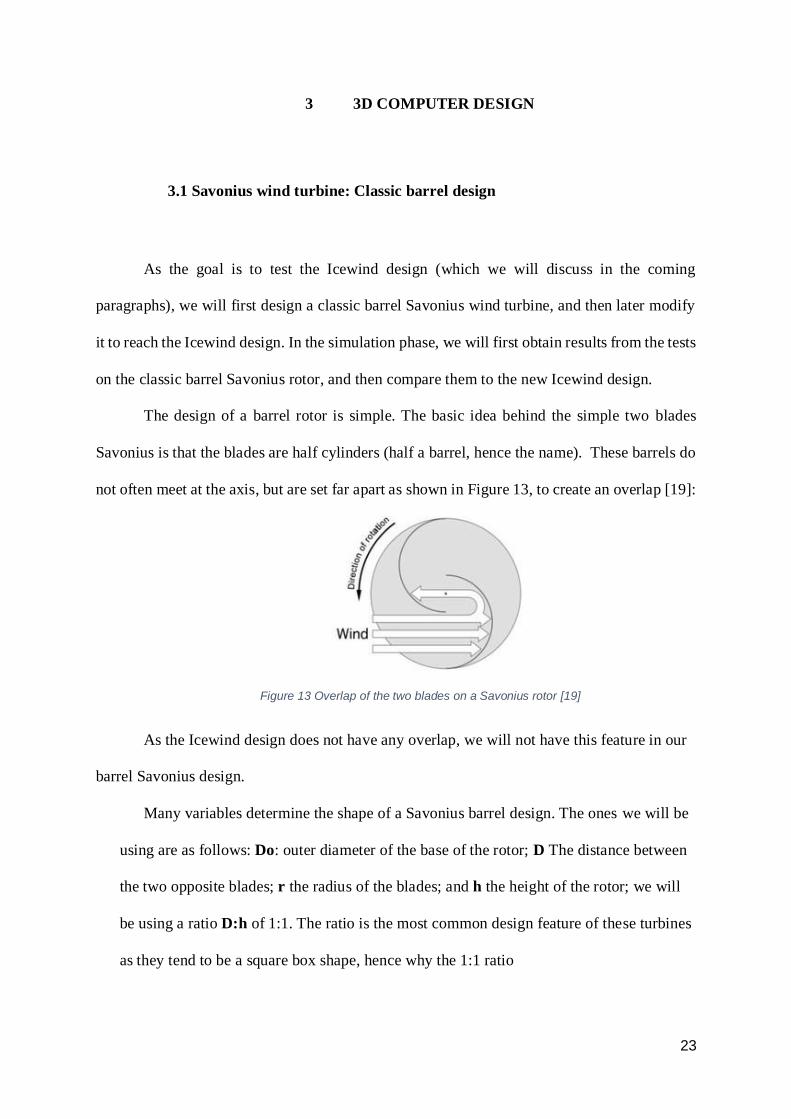
The design of a barrel rotor is simple. The basic idea behind the simple two blades
Savonius is that the blades are half cylinders (half a barrel, hence the name). These barrels do
not often meet at the axis, but are set far apart as shown in Figure 13, to create an overlap [19]:
Figure 13 Overlap of the two blades on a Savonius rotor [19]
As the Icewind design does not have any overlap, we will not have this feature in our
barrel Savonius design.
Many variables determine the shape of a Savonius barrel design. The ones we will be
using are as follows: Do: outer diameter of the base of the rotor; D The distance between
the two opposite blades; r the radius of the blades; and h the height of the rotor; we will
be using a ratio D:h of 1:1. The ratio is the most common design feature of these turbines
as they tend to be a square box shape, hence why the 1:1 ratio

24
Another ratio we will be using is the Do:D, which determines how far the base extends
beyond the blade. We will be using a Do:D of 1.1:1, which is the ratio used in the design
by [17].
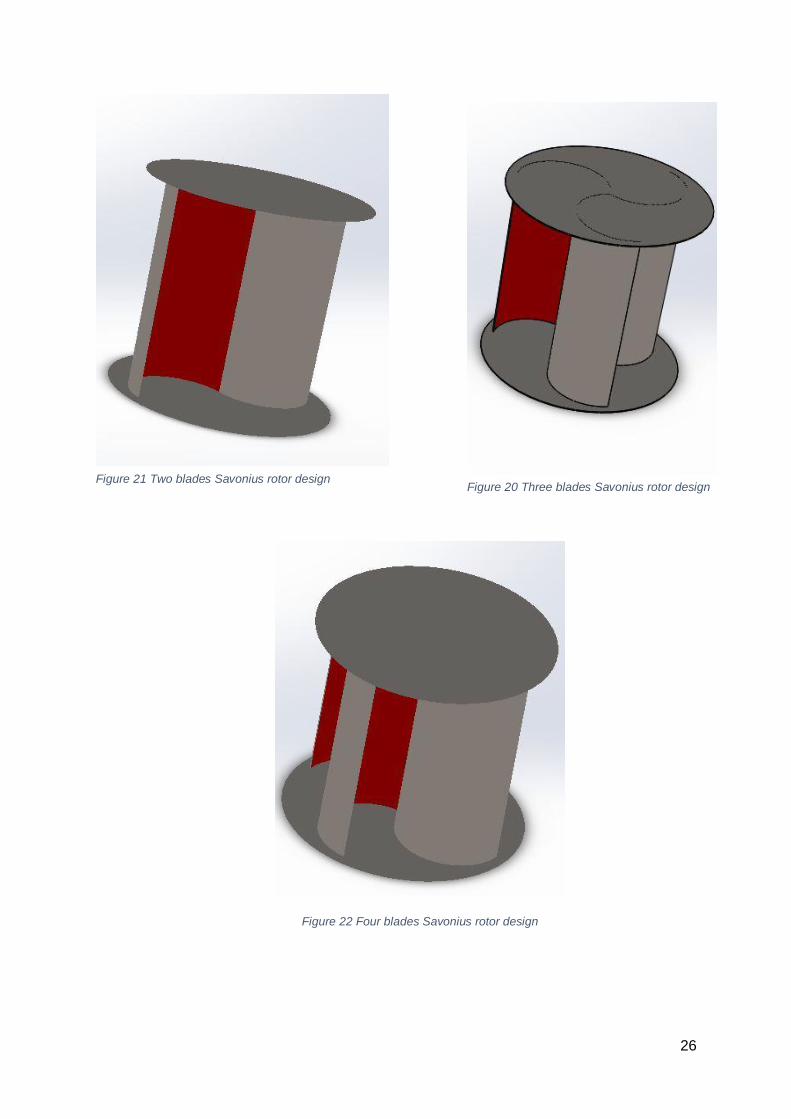
The following figures show the design we built using SolidWorks and the
measurements used for two, three, and four blades barrel Savonius wind turbine:
Table 3 Measurements (m)
Figure 15 Two blades Savonius rotor design Figure 16 Three blades Savonius rotor design
Figure 14 Four blades Savonius rotor design

25
Figure 19 Four blades Savonius rotor design
Table 4 Measurements (m)
Figure 18 Two blades Savonius rotor design Figure 17 Three blades Savonius rotor design
26
Figure 22 Four blades Savonius rotor design
Figure 21 Two blades Savonius rotor design Figure 20 Three blades Savonius rotor design

27
The base of the turbine is necessary for structural integrity. It provides support for the
blades against the drag force of the wind pushing the blades of the rotor. As we will see in the
coming section, the Icewind design does not use a base. In order for our comparison from the
simulations to be representative, we will remove the base and connect the blades with a central
axis. This will not affect our simulation since we are not performing a stress or a fatigue
analysis.
The design is shown in the Figures below:
Figure 23 No base barrel design

28
3.2 Icewind Design
3.2.1 Icewind
Icewind is a startup from Iceland founded in 2012. From their website: “Icewind
designs and manufactures small vertical axis wind turbines for telecom towers and residential
applications such as homes, cabins and farms” [20]. In the about section they say that their
work “demonstrates that turbines can be an elegant, quiet, durable, cost effective and nearly
maintenance free solution for energy production”. One of their designs offer 1000 W at 10 m/s
and smaller one can generate 300 W at10 m/s. they both can produce at speeds ranging from 2
to 60 m/s, without mechanical failure or overheating.
Since they are planning to start selling their products later this year, they are naturally
being very secretive about their design. Only a few pictures are available online, in addition to
a promotional video we found on YouTube [21].
From this promotional material, we managed to collect enough pictures to have a clear
idea about their design and its characteristics. Using the general features we found, we reverse
engineered this design and managed to replicate it.
The following figure shows examples of what we used to understand the features of
their design:

29
Figure 24 Images from Icewind's promotional material [20], [21].

30
3.2.2 Designing the blade
The first thing we noticed is that the blades do not form a half circle at their base, but
an incomplete one. This meant that in our design starting from the barrel shape we would cut
a rectangular block from the inner side of the blade to make it similar to that of Icewind. The
second distinctive feature is that the D:h ratio is not 1. We noticed that their blades are quite
wide and that the diameter of the complete half circle (D/2) making the blade is the same as
the height h (D:h close to 2). Once one end of the blade is trimmed to make the shape seen on
their designs this ratio appears larger as the rotor blades are slightly less wide than the rotor is
high. We achieved this ratio by trimming 1/10 of the blade on the inner end as will be
demonstrated.
The outer curves on the blades are cutouts of tangent circles of unknown radius. Using
SolisWorks constraint tools we managed to find the radius that will satisfy the position of the
tip of the blade (1/5 of the blade’s diameter) as well as tangencies to the lower parts of the
blades.
This is shown in the following steps:
1- We start from a normal Savonius blade with 1:1 D:h ratio. We add the
circles and solve for the mentioned constraints:
Figure 25 Icewind blade, step 1.

31
2- We trim the arcs that are needed and define shape of the blade:
Figure 26 Icewind blade, step 2
3- We intersect the created shape with original blade, and keep the
intersection only:
Figure 27 Icewind blade, step 3

32
4- We trim 1/10 off the inner end of the blade:
Figure 28 Icewind blade, step 4
The final blade and its detailed measurements are shown in the Figure below:
Figure 29 Icewind blade - Final design

33
Now that we have the blade, designing the 3 and 4 blade rotors involved just attaching
the blades to an axis.
The designs are shown below:
The two designs look somewhat similar. The differences are due to the fact that every
picture of the Icewind design we found online had its own characteristics. Consequently, we
tried to match the most general and common features between all the different versions we
found.
Figure 30 Icewind rotor design
Figure 31 Three blades Icewind rotor: our design vs. the original

34
In order for our comparison to be accurate, we have to control for some variables
(otherwise, the results of the analysis cannot be compared). Although we started from the barrel
Savonius and modified it to make the Icewind design, the initial (barrel) and final design
(Icewind) have no common ratios. To solve this problem we fixed the height of the two rotors,
and modified the Icewind to have the same surface area as the barrel design. As the diameter
of the Icewind design is double that of the barrel design, removing half of the blade
compensated for the increase in diameter and kept the surface area constant at 0.12 m². By
modifying, the area cut off the tip of the blade we increased the similarity in surface area to
99.86%, at a surface area of: 0.12441 m² for the barrel design, and 0.12459 m² for the Icewind
design.

35
4 COMPUTATIONAL FLUID DYNAMICS SIMULATIONS
The goal of this project is to compare the performance of the Icewind design to that of
a classic barrel design. Icewind proposes two designs: a 3-blade design (300 W at 10/m/s) and
4-blade design that promises a higher power generation (1000W at 10 m/s). Classic barrel
Savonius turbines come most commonly at two, three, and four blades.
In order to understand the reasons – if any – that Icewind performs better than a classic
barrel, we first have to understand the performance of a barrel design. As mentioned in the
previous sections, there are multiple factors to account for in a barrel Savonius rotor. We
detailed earlier the design considerations that went into making the 3D models. We tried to fix
different variables between the Icewind and the barrel (overlap, surface area …), in order to
have an accurate comparison. One of these variables is the number of blades. Therefore, it is
crucial to understand the effect that the number of blades has on the performance of a Savonius
VAWT.
In the next section, we will look at the 2D simulations performed in order to understand
the effect of the number of blades.
4.1 2D Simulations: effect of the number of blades
The reason we are using 2D simulations is that on a 2D level, a barrel Savonius is
essentially similar to an Icewind design. As they are both close to a semi-circle. By determining
the effect on a 2D level, we can safely apply the conclusions to both barrel and Savonius.
We will first be basing our 2D study on the study “An Experimental Study on the
Performance of Savonius Wind Turbines Related With the Number Of Blades” by
Wenehenubun et al [17]. In this paper, they perform 2D simulations to determine the pressure
differential on the blades of a barrel (as a means of judging the performance).

36
The first step was to try to replicate the work presented by [17]. Their study consisted
of computer simulations as well as a physical setup. The 2D simulations’ output was the
pressure profile on a 2D model, and their results showed that four blades generate a higher
pressure-difference, followed by two blades, and then three blades.
The simulations were performed at one attack angle (that is actually different from one
design to the other), as Figure 32 shows:
Figure 32 Pressure difference as found by [17]
The reason why they chose this specific orientation is not mentioned. We initially
thought that they choosing the orientation where the blades are most open to the wind.
However, this does not apply to the 4 blades as they are not oriented in the direction were the
angle formed by two blades is perfectly open to the wind. It is worth stating that no general
conclusion can be drawn from such comparison. We cannot compare different angles and judge
the performance of the whole rotor just from these results.
37
Another issue we found with this paper (and similar studies involving computer
simulations) is that they do not provide enough information to accurately replicate their work.
As we will see later, performing a simulation on ANSYS (the computer tool chosen) involves
quite a lot of variables and options. From the viscosity model, the meshing settings, to the
tunnel model treatment. These variables and many other have a significant effect on the results.
Whether you consider that the rotor will be rotating in a viscous fluid or not will surely affect
the results. If the decision not to ignore the viscosity is taken, we still have to determine what
kind of viscous model we are using etc. Once all these decisions are made, we need to choose
the solver, the size of the tunnel in which the rotor will be tested, the constraints, etc.
Wenehenubun and his co-authors fail to mention any of these important variables, and
just show the final results. Therefore, it is practically impossible to accurately replicate their
process (and consequently impossible to replicate their results).
In the following paragraphs, we will mention in detail the steps followed as well as the
reasoning (based on our limited understanding of these highly complex software tools and
mathematical models).

38
4.1.1 Setup
To perform these simulations we will be using ANSYS: Fluent. It “contains the broad
physical modeling capabilities needed to model flow, turbulence, heat transfer, and reactions
for industrial applications […] Fluent covers a broad reach, including special models with
capabilities to model in-cylinder combustion, aero-acoustics, turbomachinery and multiphase
systems” [22]. As shown in Figure 33, a fluent project involves different steps:
Figure 33 ANSYS Fluent project
In order to run a simulation we first have to either import the geometry from a CAD
software (such as SolidWorks), or use ANSYS Design Modeler (DM) to model the geometry,
which is then meshed.
The way computational fluid dynamics (CFD) software works is by solving fluid
dynamics equations around the geometry following the constraints we specified. In order to
determine the points at which these equations will be solved a mesh is generated. The mesh
discretize the physical space into a finite number of points. The higher the number of points
(i.e. the mesh size) the more accurate the solution and the more time and power it will take to
solve. An example of a mesh will be shown later.
Once the mesh is generated, we specify the setup for Fluent. This part involves the most
details, as it requires many variables (models, solver, initial values, number of steps, boundary

39
conditions …). Once the solver setup is done, the solution is found and is visualized in the
results tab.
The first part of the simulation is defining the geometry to be simulated. For the 3D
simulations, we import the model that we built on SolidWorks; and for the 2D simulations, we
rebuild a 2D transverse section of the rotor following the dimensions we presented in the
previous sections.
Figure 34 shows the geometry as built on ANSYS DM. It shows the 2-blade rotor
enclosed in a larger rectangle that will serve as the wind tunnel. The wind tunnel is large enough
to allow the flow to become uniform after it had passed around the rotor.
Figure 34 2D model of a 2-blade rotor
The next phase is to mesh this geometry. For the most part, we rely on the default
settings, but we do specify the number or points around the blades and on the different walls
of the tunnel. We define the inlet (the left side, perpendicular to the x-axis), the outlet (the right
side, perpendicular to the x-axis), the tunnel walls (the upper and lower sides), as well as the
walls of the rotor’s blades. Since the point is to understand the effect of wind -coming from the
inlet- on the blades, we give the blades a higher number of points (i.e. a higher resolution) than

40
the inlet, outlet, and walls. We use 40 per side for the blades, 20 for the inlet and the walls, and
10 for the outlet. These values are very common on CFD forums as well as published tutorials.
For this 2D simulation, we based ourselves on [23], and double-checked the step on online
CFD sources. Figure 35 shows the mesh generated by ANSYS:
After generating the mesh, we move to the solver where we will specify the methods
used, the boundary conditions, the turbulence model, as well as the number of iterations and
the convergence condition.
The solver type we will be using is Pressure Based in Steady Time (as opposed to
Transient Time). Choosing Pressure Based vs. Density Based will not make a difference in the
output for our case, as we are working in relatively low speed. It is recommended to use
pressure based approach for low speeds and density based approach for extremely high speeds.
From the tutorials on which this work was based, it was recommended to use Steady Time as
it converges faster.
The air viscosity model we are using is the “realizable k-epsilon turbulence model with
enhanced wall functions”. According to [24], this model provides accurate solutions compared
to the other k-epsilon models. ANSYS Fluent user’s manual specifies that the k-epsilon model
Figure 35 2D 2-blade rotor and tunnel mesh

41
“has been implemented in most general purpose CFD codes and is considered the industry
standard model. It has proven to be stable and numerically robust” [25].
Next, we specify the boundary conditions. We already created named selections, and
marked the inlet, rotor, outlet, and tunnel wall. We will specify that the inlet is of type “velocity
inlet”, and enter the wind speed and direction. We specify that the tunnel wall is of type “wall”,
the rotor of type “interior”, and the outlet of type “pressure outlet”. [23- 25] specify that the
boundary condition for the outlet is a gauge pressure of zero. This means that the pressure at
the outlet (relatively far from the rotor) should be the same as that of inlet.
We do not need to specify any reference values as the will not be asking the solver to
compute any ratios or coefficients. We specify that we use the SIMPLE scheme for the pressure
velocity coupling as found in [23, 24]. As mentioned in [25], SIMPLE is especially useful for
less complicated problems such as the one we are dealing with. We then input the convergence
criteria. In our case, the criterion was that the residuals (i.e. the differences between successive
iterations) from the solution computation should be less than 1e-06. Figure 36 show the
variation of the residuals as the solution is computed:
Figure 36 Residuals plot
Before running the solution, we initialize it with the initial values of the velocity (on
the x, y, and z-axis), and the gauge pressure (the difference between the absolute pressure and
the atmospheric pressure, initialized at a value of zero).
We set the number of iterations at 1000 (the solver will compute the solution for 1000
times or until the solution converges given the user defined condition), and we run the solution.

42
4.1.2 Results
The first goal of the 2D simulations is to replicate (or check) the results presented by
Wenehenubun et al [17]. As we mentioned before, it is difficult to replicate their work, as they
do not provide enough details. However, for the results needed, we believe that details such as
the type of solver, pressure velocity coupling, etc. will not cause much difference as stated by
the different tutorials we followed, as well as ANSYS SLUENT user’s manual [23-25].
We used the same orientation as proposed in [17] for the two, three, and four blade
models. We then run the simulation for 1, 5, and 10 m/s on the positive x-axis (from left to
right).
We generated nine pressure profiles for the nine cases (3 rotors, 3 speeds), and
computed the difference between the front and the back of the blades of the rotor (numerical
results are shown in Appendix A). The Figures below shows the results for 5 m/s for the three
rotors in their respective orientation:
Figure 37 Two blades rotor at 5 m/s

43
Figure 38 Three blades rotor at 5 m/s
Figure 39 Four blades rotor at 5 m/s
As we can see in the figures, the pressure is high on the concave side of the rotor blade
(the receiving open cup) as that is where the wind will hit the most and will not escape as fast
as on the convex side. Negative pressure (vacuum gauge pressure – relative to the atmospheric
pressure) is generated on the backside of the rotor, which makes sense as this a static case
where the rotor is fixed in this specific orientation. This pressure differential causes a net force
on the blades and hence causes rotation.
44
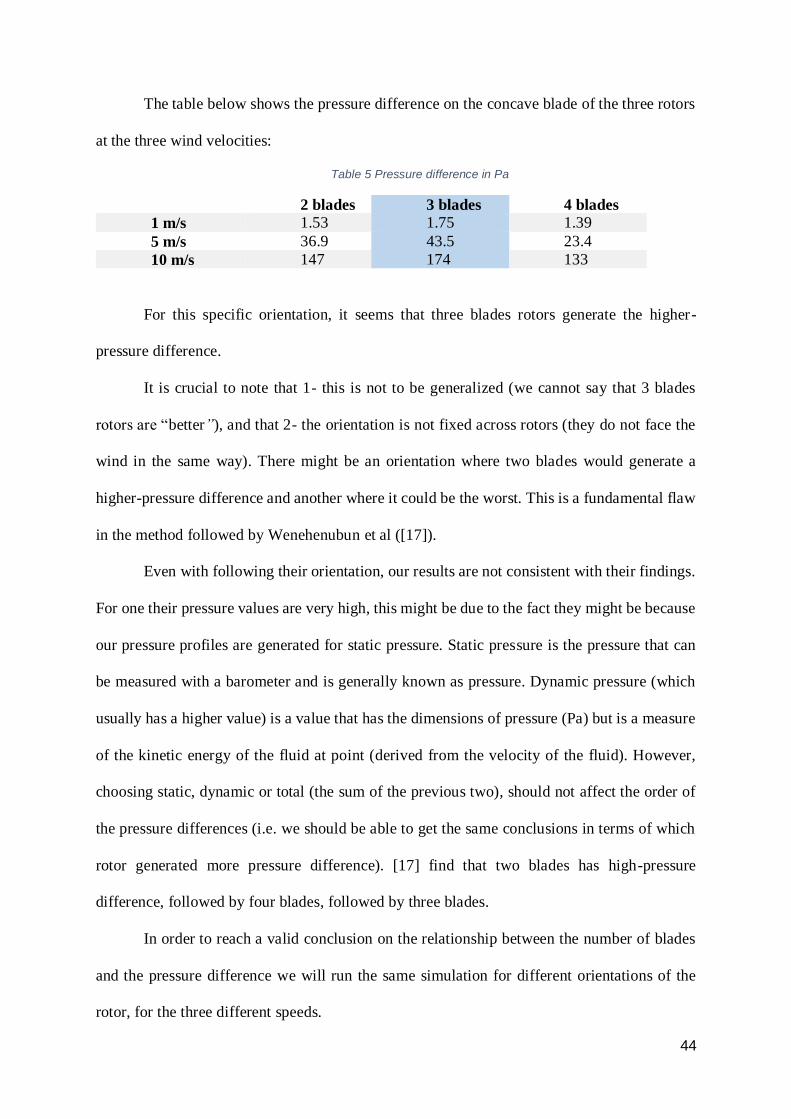
The table below shows the pressure difference on the concave blade of the three rotors
at the three wind velocities:
Table 5 Pressure difference in Pa
2 blades 3 blades 4 blades
1 m/s 1.53 1.75 1.39
5 m/s 36.9 43.5 23.4
10 m/s 147 174 133
For this specific orientation, it seems that three blades rotors generate the higher-
pressure difference.
It is crucial to note that 1- this is not to be generalized (we cannot say that 3 blades
rotors are “better”), and that 2- the orientation is not fixed across rotors (they do not face the
wind in the same way). There might be an orientation where two blades would generate a
higher-pressure difference and another where it could be the worst. This is a fundamental flaw
in the method followed by Wenehenubun et al ([17]).
Even with following their orientation, our results are not consistent with their findings.
For one their pressure values are very high, this might be due to the fact they might be because
our pressure profiles are generated for static pressure. Static pressure is the pressure that can
be measured with a barometer and is generally known as pressure. Dynamic pressure (which
usually has a higher value) is a value that has the dimensions of pressure (Pa) but is a measure
of the kinetic energy of the fluid at point (derived from the velocity of the fluid). However,
choosing static, dynamic or total (the sum of the previous two), should not affect the order of
the pressure differences (i.e. we should be able to get the same conclusions in terms of which
rotor generated more pressure difference). [17] find that two blades has high-pressure
difference, followed by four blades, followed by three blades.
In order to reach a valid conclusion on the relationship between the number of blades
and the pressure difference we will run the same simulation for different orientations of the
rotor, for the three different speeds.

45
We will be measuring the orientation of the rotors with respect to the vertical axis
(perpendicular to the wind speed) as shown in Figure 40:
Figure 40 Rotor orientation
The 2-blade rotor has a 180° symmetry, 120° for the 3-blade rotor, and 90° for the 4-
blade rotor. We will be rotating the model with increments of 20° for the three rotors, until we
reach the initial orientation again.
This means that we will have nine orientations for the 2-balde rotor, six for the 3-blade
rotor, and five for the 4-blade rotor. With three speeds for each orientation (1 m /s, 5 m /s, and
10 m /s), we run 60 different simulations, and get the pressure results (numerical results are
shown in Appendix A). We organize the data with Excel, and generate the following graphs:

46
2 blades:
3 blades:
Figure 41 Pressure difference for two blades rotor
Figure 42 Pressure difference for three blades rotor

47
4 blades:
From these graphs, we conclude that the approach followed by [17] is definitely invalid
as the performance of the rotor varies depending on its orientation. As the rotor turns, its blades
will have an optimal angle that will maximize the exposure to the wind. This angle would be
the one at which the rotor is open towards the direction from which the wind is coming. The
optimal angle for two blades is hence at 0°, for three blades at 30°, and for four blades at 45°.
Similarly we can deduce that the worst angle is when the exposure to the wind is minimized
which happens at 90° for 2 blades as well as 3 blades, and at 80° for 4 blades. These results
confirm the experimental findings of [15].
The following graph shows a comparison of the pressure difference for every
orientation for the three rotors, at a speed of 5 m/s. We find that the same trend is present at
1m/s and at 10 m/s.
Figure 43 Pressure difference for four blades rotor

48
Figure 44 Pressure values at 5m/s
A more convenient way to look at this data is to average the pressure values. We find:
Figure 45 Pressure difference summary
We conclude that on average, a 3-blades rotor generates a higher-pressure difference
than a 2-blades rotor and a 4-blades rotor.
1.45 35.6142.9
1.70 41.7165.4
1.49 36.4 140.3
1 m/s 5 m/s 10 m/s
Pressure Difference (Pa) - Summary
2 blades 3 blades 4 blades
0
10
20
30
40
50
60
0 50 100 150 200 250 300 350 400
Pre
ssu
re (P
a)
Angle °
Pressure Vs Angle at 5 m/s
2blades
3blades
4blades

49
4.2 3D Simulations: comparison between Icewind and Barrel
Now that we have established that -- judging by the generated pressure difference -- a
three blades rotor does perform better than two blades and four blades versions of barrel
Savonius turbines, we can focus on comparing the performance of the Icewind design to that
of the barrel design. It is important to note that the 2D profile of an Icewind rotor is very similar
to that of a barrel design (the cuts that make Icewind special happen on the surface of the blade
not on the semicircle, and the trimming of the semi-circle is too small to be considered).
Therefore, it is reasonable to infer that any conclusions made regarding the effect of the number
of blades on barrel Savonius can be extended to the Icewind design as well.
The main problem with performing 3D simulations is that they are much larger in terms
of nodes in the mesh and hence require a longer time to solve. Because of the limitations of
both computational power and time, we will not simulate the two designs (Icewind and barrel)
on all orientations. We will choose the best and worst orientation as found from the 2D
simulations and run the 3D simulation on both designs at these orientations at 5 m/s. This will
allow us to compare the performance of the two designs at two opposite performance points.
The optimal angle for a 3-barrel design is 30° as it guarantees that the blades are as
open as they can to receive the wind, as opposed to a 90° orientation where the blade is blocking
the wind. The figure below shows the two orientations:
Figure 46 30° vs. 90° orientation

50
4.2.1 Setup
Similar to the 2D simulations, we will follow the steps shown in Figure 33. We import
the geometry from SolidWorks and enclose it in a rectangular box that will serve as our wind
tunnel. We respect the same ratios for the enclosure for both Icewind and barrel design and
orient both of them in the same way.
We then, in the same way as the 2D simulation, mesh the two designs while creating
named selections so we can identify the inlet, outlet, and other elements, and specify the
boundary conditions.
The figures below show the created meshes:
The area highlighted in blue is the inlet of the tunnel, and in red is the outlet. The box
surrounding Icewind is wider as the Icewind design has a larger diameter than the barrel design.
The figure below shows a zoomed in section of the mesh. Same as for the 2D
simulation, we chose a higher resolution for the surface of the rotor than the inlet/outlet:
Figure 48 Barrel design mesh Figure 47 Icewind design mesh

51
Figure 49 Barrel Mesh - Close up
We will use the same solver and settings as the 2D simulation. We run the solver for
1000 iterations or until the solution converges. Because of the very high number of nodes in a
3D mesh (around 180 000 nodes ), it takes up to 8 hours on 100% computing power to run one
of these simulations.
4.2.2 Results
4.2.2.1 30° orientation:
We first get the pressure contour on the surface of the rotors as shown in the figures
below:
Figure 50 Pressure Distribution on Barrel design at 30°

52
We notice that they show similar maximum and minimum pressure values. However,
because of how the Icewind rotor is designed, we get the same maximum as barrel but farther
from the axis.
Moment being force times distance means that a pressure value close to the axis will
generate a low moment compared to the same value far from the axis. This is a particularity of
the Icewind design. Using the same surface area (same amount of material) as Barrel design,
Icewind is able to generate high-pressure values far from the axis. Our hypothesis for now is
that Icewind will generate a higher moment compared to barrel.
In order to test this hypothesis we will generate moment values from the same
simulations using ANSYS Fluent. Results are shown in the following figures:
Figure 52 Moment values for Barrel at 30 °
Figure 51 Pressure Distribution on Icewind design at 30°

53
Figure 53 Moment values for Icewind at 30 °
We notice that Icewind does indeed generate a higher overall moment. The net moment
experienced by the Icewind rotor at this orientation at 30° is 0.035 N·m, whereas the moment
experienced by the Barrel rotor is 0.012 N·m only. Our hypothesis is then correct, and fits with
the pressure profile we saw previously. Icewind generated 3 times the moment Barrel generated
at 5 m/s, and at a 30° orientation.
4.2.2.2 90° orientation:
We repeat the same process again by rotating the designs, importing the geometry,
meshing it at the new orientation and generate the pressure profile as well as moment values.
The results are shown in the figures below:

54
We notice the maximum value of pressure is similar for both designs, with Icewind
having high values far from the axis, similar to what we found for the 30° orientation.
However, we notice that for both designs, the maximum value of pressure is lower than that
of the 30° orientation (19 Pa vs. 21 Pa). This matched the results we found in the 2D
simulations. The moment values are shown in the following figures:
Figure 55 Pressure Distribution on Barrel design at 90°
Figure 54 Pressure Distribution on Icewind design at 90°

55
We notice that Icewind still outperforms Barrel design and experiences double the
moment values (0.34 N·m vs. 0.15 N·m). We also notice that the worst orientation for pressure
distribution (90°) generates a higher moment than that of the best orientation (30°). However,
we do not understand what causes these values to differ in this way consistently for both deigns
(Moment (30°) < Moment (90°)).
From the 3D simulations, we conclude the following:
Icewind shows high pressure values far from the axis of rotation
compared to Barrel design.
Icewind generates higher moment values than Barrel design.
From these results, it does seem that for the same amount of material (same surface area
of the blades) Icewind does show better performance (3x the moment at 30°, and 2x the moment
at 90°).
Figure 57 Moment values for Barrel at 90 °
Figure 56 Moment values for Icewind at 90 °
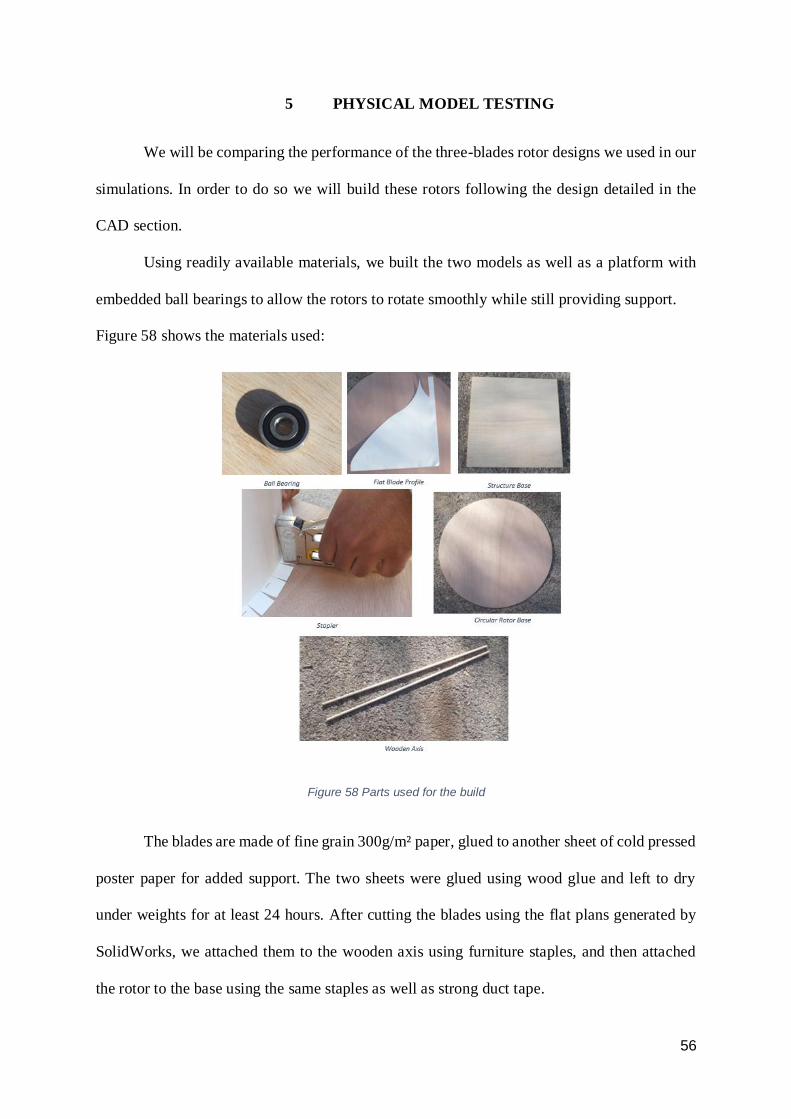
56
5 PHYSICAL MODEL TESTING
We will be comparing the performance of the three-blades rotor designs we used in our
simulations. In order to do so we will build these rotors following the design detailed in the
CAD section.
Using readily available materials, we built the two models as well as a platform with
embedded ball bearings to allow the rotors to rotate smoothly while still providing support.
Figure 58 shows the materials used:
Figure 58 Parts used for the build
The blades are made of fine grain 300g/m² paper, glued to another sheet of cold pressed
poster paper for added support. The two sheets were glued using wood glue and left to dry
under weights for at least 24 hours. After cutting the blades using the flat plans generated by
SolidWorks, we attached them to the wooden axis using furniture staples, and then attached
the rotor to the base using the same staples as well as strong duct tape.

57
The base of the rotor was made of thin plywood, whereas the axis were made of cedar
wood and have the same thickness as the inner diameter of the ball bearing (10 mm). Extra
wood pieces are added to the Icewind design because the thin plywood tends to bend a lot.
The ball bearings are embedded within the shelves of the support. We used two shelves
(two ball bearings) to further stabilize the structure. It is worth noting that building the Icewind
model was much easier than the Barrel model, as Icewind has a larger diameter (smaller
curvature – easier to bend) than Barrel.
The weights of the rotors are as follows: Barrel: 1035.55 grams, and Icewind: 936.60
grams. The 10 % difference is because Barrel has two bases (on the top and the bottom), and
additional vertical wooden rods to prevent the blades from bending.
Figure 59 shows the built models:
Figure 59 Built models
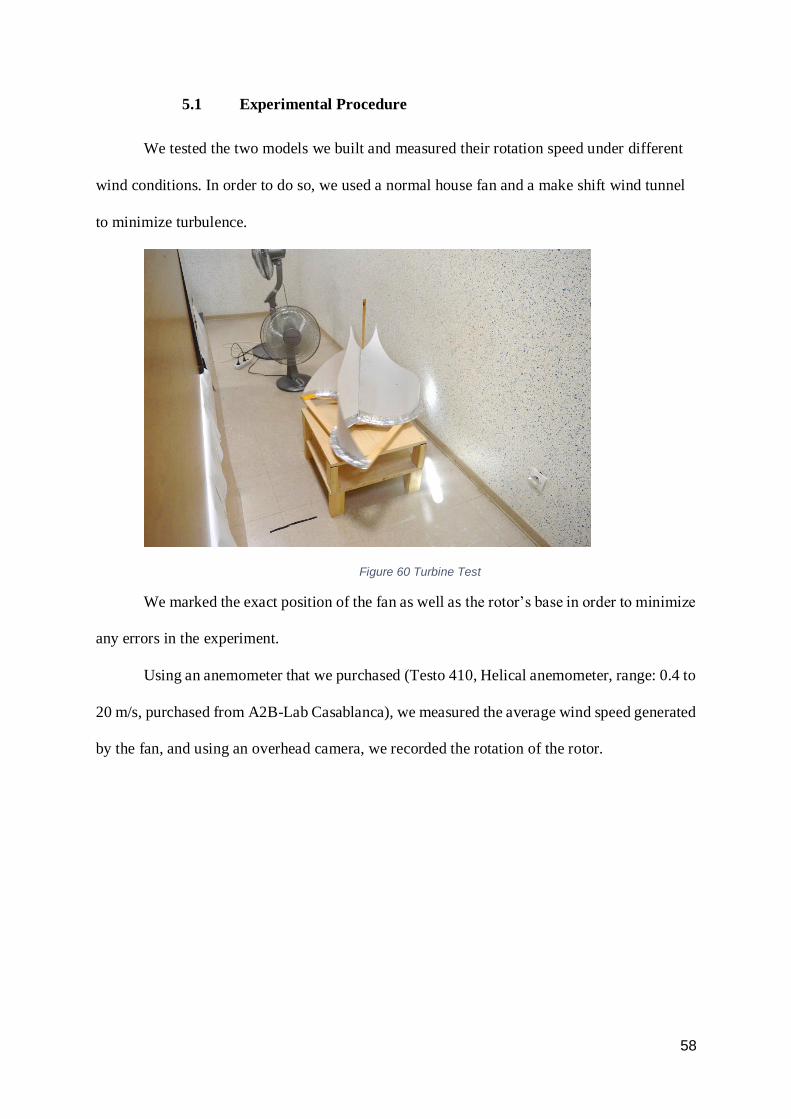
58
5.1 Experimental Procedure
We tested the two models we built and measured their rotation speed under different
wind conditions. In order to do so, we used a normal house fan and a make shift wind tunnel
to minimize turbulence.
Figure 60 Turbine Test
We marked the exact position of the fan as well as the rotor’s base in order to minimize
any errors in the experiment.
Using an anemometer that we purchased (Testo 410, Helical anemometer, range: 0.4 to
20 m/s, purchased from A2B-Lab Casablanca), we measured the average wind speed generated
by the fan, and using an overhead camera, we recorded the rotation of the rotor.

59
Figure 61 View from overhead camera
We used yellow tape to mark one corner of the rotor, and used a black marker to make
a permanent mark on the floor. These two marks helped us to compute the time it takes the
rotor to complete one full turn and hence compute its angular velocity.
Figure 62 Anemometer used for measuring wind speed
We used the three speeds that the fan can generate and measured the resulting air speed.
We noticed that when we measured the air speed while the rotor was behind the anemometer,
we got very inaccurate readings because of the rotor creating air currents that interfered with

60
the reading. We removed the structure, measured the speed resulting for the three settings
multiple times and took the average.
To measure angular acceleration, and angular velocity, we used Tracker. It is an open
source free physics video processing software. We shot all the videos at 50 fps, and using this
software determined the number of frames it takes for the rotor to complete one turn. We
processed this data, generated angular acceleration, and angular velocity measurements.
5.2 Results
The fan used had 3 speed settings: low medium and high, coded respectively 1, 2, and
3. Using the anemometer we took multiple measurements of the speed resulting from these
settings and averaged the values. Results are shown in the following figure:
Table 6 Generated wind speed
Speed N° 1 2 3
Speed in m/s 2 3 4
Using number of frames per revolution, we computed the angular velocity and
acceleration for the different rotors at the different wind speeds. The table below is an
example of the data used to get such results:
Table 7 Velocity and Acceleration Data
The velocity results are shown in the next table:

61
Table 8 Angular Velocity
Angular Velocity (RPM)
Wind
Speed (m/s) Icewind Barrel
2 23.85 16.84
3 37.88 43.60
4 41.10 50.85
Angular Velocity (rad/s)
Wind
Speed (m/s) Icewind Barrel
2 2.50 1.76
3 3.97 4.57
4 4.30 5.32
We notice that Barrel does experience a faster notation for speeds 3, and 4 m/s. On
average, Icewind rotates at 34.27 RPM (3.59 rad/s) and Barrel at 37.09 RPM (3.88 rad/s). We
might be tempted to use these values for our conclusions, but we must keep in mind that speed
of rotation on its own does not describe the performance of a rotor. For example, many
horizontal axis turbines rotate at low speeds such as 15 RPM. This does not mean that these
turbines are slow or have a low performance. This is because every rotor needs (or generates)
a certain torque to rotate at a certain speed.
The torque is a more valid measure of performance, as it is the physical energy that can
be extracted from a rotating turbine.
In order to compute the torque we will use the following equation: 𝑇 = 𝐼 × 𝛼, where I
the moment of inertia around the rotation axis, and 𝛼 is the angular acceleration of the turbine.

62
The table below shows the angular acceleration as computed from the experimental
data:
Table 9 Angular Acceleration
Angular Acceleration (rad/s²)
Wind
Speed (m/s) Icewind Barrel
2 0.50 0.25
3 1.25 1.66
4 1.47 2.26
We will use the CAD design and SolidWorks to compute Iz the moment of inertia
around the z-axis. We specified in the software the material used for the blades, as well as for
the axis (special paper, and cedar wood). We also computed the moment of inertia for an
aluminum structure (material used by Icewind). Results are summarized in the table below:
Table 10 Moment of Inertia for both designs
Icewind Barrel
Iz Our Model 0.002942 0.00192
Aluminum 0.23 0.15
We notice that the value of I for our model is extremely low compared to that of an
aluminum built rotor. However, in both cases the ratio of I Icewind/IBarrel is the same at 1.53.
In order to make our calculations easy to interpret, we will use the larger value of I as it will
make the torque value larger but still proportional to that of our model.
The table below shows the computed torque values:
Table 11 Torque values for both designs
Torque (N·m)
Wind
Speed (m/s) Icewind Barrel
2 0.11 0.04
3 0.29 0.25
4 0.34 0.34

63
These results show that Icewind does generate a higher torque. On average, Icewind
generates 0.25 N·m and Barrel generates 0.21 N·m. For the same type of material and same
surface area of the blades, Icewind generates 19% more torque than Barrel.
To some extent, this does confirm the results of the simulations. In the simulations, we
found that Icewind generated double the torque of Barrel. These experiments confirmed that
Icewind does generate more torque than Barrel, with no added cost.
Now that we have torque data, we can calculate the Coefficient of Performance (Cp).
As we saw in section 2.3.1, the coefficient of performance is the ratio of the energy extracted
by the turbine, to the kinetic energy available in the wind. It is calculated using this equation:
𝑪𝒑 =𝑷𝝎
𝑷𝒂=
𝑻∗𝝎𝟏
𝟐𝝆∗𝑯∗𝑫∗𝑽𝟑
where H*D is the area swept by the rotor, V is the wind velocity, 𝜌 is
the air density, T the torque, and 𝜔 the angular velocity.
Using this formula, we compute Cp for the two rotors at the three different speeds, using
the moment of inertia of an aluminum model, and of our model. Results are shown in the next
tables:
Table 12 Cp Calculations - Aluminum Rotor
Cp - Aluminum Rotors
Wind Speed
(m/s) Icewind Barrel
2 36.36% 8.34%
3 43.17% 42.95%
4 23.26% 28.73%
Average 34.26% 26.68%
% difference 28.45%
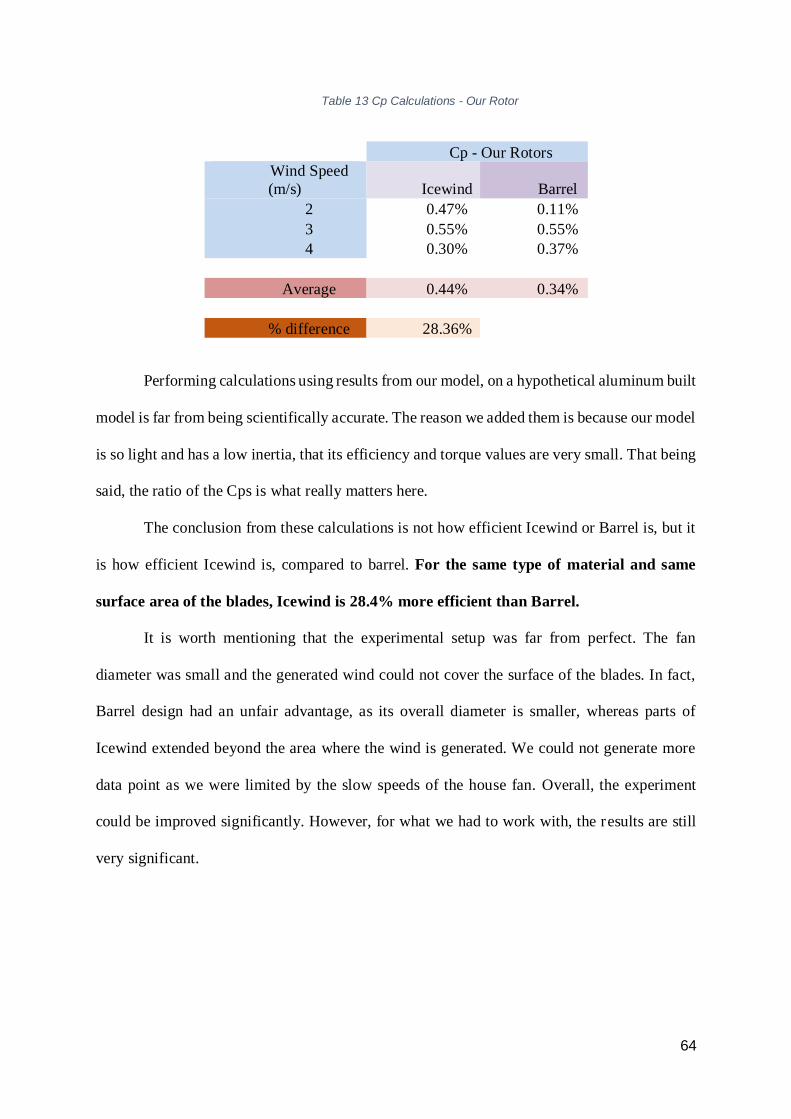
64
Table 13 Cp Calculations - Our Rotor
Cp - Our Rotors
Wind Speed
(m/s) Icewind Barrel
2 0.47% 0.11%
3 0.55% 0.55%
4 0.30% 0.37%
Average 0.44% 0.34%
% difference 28.36%
Performing calculations using results from our model, on a hypothetical aluminum built
model is far from being scientifically accurate. The reason we added them is because our model
is so light and has a low inertia, that its efficiency and torque values are very small. That being
said, the ratio of the Cps is what really matters here.
The conclusion from these calculations is not how efficient Icewind or Barrel is, but it
is how efficient Icewind is, compared to barrel. For the same type of material and same
surface area of the blades, Icewind is 28.4% more efficient than Barrel.
It is worth mentioning that the experimental setup was far from perfect. The fan
diameter was small and the generated wind could not cover the surface of the blades. In fact,
Barrel design had an unfair advantage, as its overall diameter is smaller, whereas parts of
Icewind extended beyond the area where the wind is generated. We could not generate more
data point as we were limited by the slow speeds of the house fan. Overall, the experiment
could be improved significantly. However, for what we had to work with, the results are still
very significant.

65
6 CONSUMER BEHAVIOR STUDY
In their promotional material, Icewind mention that the aesthetics of the turbine had an
impact on their design process. This is not surprising, as in order to sell, a product should not
only show a good performance but should also have a wide acceptance from the public.
Indeed, public acceptance of renewable energies is an important challenge. Research
into social aspects of renewable energies mentions that the extent to which a renewable source
interferes with the landscape affects its acceptance greatly [26]. This is one reason why big
wind farms and large renewable energy installations that radically change the landscape do not
sit well with the public. Generally, people are in principle not opposed to renewable energies.
However, they are opposed to living near these installations because of some inconveniences
that can ensue. In the recent years, there has been a rise in what is known as NIMBY attitudes.
NIMBY (Not In My Back Yard) is a movement where residents are opposed to certain
developments that is too close to their homes [27]. For wind energy, as stated by [27], the main
problems are that the installations are not visually appealing, and are noisy. Therefore, any
attempt to make wind energy less noisy, and more aesthetically pleasing is a step towards a
wider acceptance of this renewable source.
At Icewind, they take these two factors into great consideration, even if they are dealing
with small-scale applications of wind energy. In fact, and as mentioned in the literature review,
one advantage that VAWTs have over HAWTs is that they are less noisy and smaller. In theory,
according to the reasons stated by [26, 27] VAWTs and specifically Savonius wind turbines
should be more accepted.
In order to better understand the Icewind design and its effect on the acceptance of
renewable energy, we distributed a survey (Appendix B) on a random sample of Al Akhawayn
University students, from the three different schools.

66
As shown in Appendix B, the participants were first asked to fill in their school (SSE,
SBA, and SHSS). The reason we asked this question is to determine how diverse our sample
is. Next, we asked if the participants have ever heard of or seen horizontal axis wind turbines,
and if they have ever heard of or seen vertical wind turbines.
We presented them with two designs of a Savonius VAWT: Icewind and Barrel. We
then asked which one is more aesthetically pleasing, and which one looks more aerodynamic.
We also asked them to rate the importance of the following factors for a small-scale wind
turbine: Overall Appearance, Noise Level, and Efficiency.
The results are shown in the figures below:
Figure 63 Participants' distribution
We can see that most of the participants are from SSE; however, the two other schools
are represented as well. Even though the distribution is not perfectly divided across the 3
schools, our sample is quite diverse. With 145 participants (49% SSE, 28% SBA, and 23%
SHSS), the sample is descriptive of the AUI student population.

67
Figure 64 Participants’ exposure to HAWTs
Figure 65 Participants’ exposure to VAWTs
As expected, most people (97.2%) have heard of or seen the widely used Horizontal
Axis Turbines. As for Vertical Axis Wind Turbines, only 43.7% have heard of or seen them.

68
Figure 66 Survey Options: Icewind vs. Barrel
Figure 67 Design Aesthetics
Figure 68 Design Aerodynamics
We notice that most people (57%) think that Icewind design is more aesthetically
pleasing. This was part of what Icewind mentioned as their design considerations. We also
notice that most people (63%) think that Icewind is “aerodynamic”. The term aerodynamic

69
here is between quotes because it is the kind of broad statement that does not have an accurate
scientific meaning when used like this. However, especially since we are discussing wind
turbines, whether people think a rotor design is “aerodynamic” is very important.
In order to determine whether there is a correlation between the perceived
aerodynamics of a design and its aesthetics, we look at the statistical relationship between these
two attributes:
Figure 69 Design Aesthetics AND Aerodynamics: Option 1
Figure 70 Design Aesthetics AND Aerodynamics: Option 2
We notice that of the people who said that design 1 (Icewind) looked better, 63%
thought it was aerodynamic. Moreover, of the people who thought design 2 (barrel) looked
better, 35% thought it was aerodynamic. It seems that in both cases around 64% of the
participants found Icewind to be more aerodynamic regardless of whether it is aesthetically
pleasing or not.

70
This does not a show a relationship between aesthetics and “aerodynamics”, but it does
show that Icewind wins in terms of acceptance as it is more visually appealing and is perceived
to be aerodynamic.
In relation to what [26-27] discuss, and to understand what people prioritize in terms of
important factors for small scale wind installations, we asked the participants to rate efficiency,
noise, and looks.
Figure 71 Importance of overall appearance
Figure 72 Importance of noise level
Figure 73 Importance of efficiency

71
Compared to efficiency and noise level (which both rank five in terms of importance),
overall appearance only ranked three. This makes sense, as a turbine is not only there for
aesthetical reasons, but to generate electricity while not causing any disturbance.
To sum up, we believe that Icewind have a legitimate reason to care about the looks of
their design (especially when compared to the classic Barrel Savonius). Their design looks
“aerodynamic” and is better looking.
Given that looks are important (3/5), designers have to focus on the aesthetics and not
only the functionality of their design. We believe that small steps like these will render
renewable energy more acceptable by the wide public, and help us in the transition towards a
greener energy generation.

72
7 CONCLUSION AND FUTURE WORK
The principal goal of this project was to test the performance of an innovative design
of a Savonius Vertical Axis Wind Turbine proposed by an Iceland based startup. In order to do
so, we first modeled the rotors on SolidWorks and then ran simulation on these designs. The
simulations we ran were done in the ANSYS workbench using Fluent.
From running 2D simulations, we concluded that three blades is the optimal design as
it experienced the highest pressure difference on its wind-receiving blade. We then ran 3D
simulations using the same software tool on the Icewind design and the classic Barrel design.
Results showed that Icewind experienced a higher torque (twice as much) compared to the
barrel design. Through these simulations, we understood some of the design considerations of
Icewind. It generated high pressure farther from the axis compared to the barrel design, and
hence generated a higher torque.
In order to further test these designs, we built simplified models using readily available
materials. Using a makeshift wind tunnel, and commercial fans, we tested the two designs
under three different wind speeds. Through angular velocity, acceleration measurements, and
numerically calculated moment of inertia, we determined the torque generated by the different
designs and calculated their power coefficient. From these tests, we concluded that the Icewind
design is 28% more efficient than the barrel design, which confirms the results of the
simulation.
Part of the Icewind design is not meant for efficiency or better mechanical properties,
but for aesthetics and marketing. What is worse than an inefficient turbine is an efficient
turbine that does not sell. Icewind combines both functionality and aesthetics in their product.
This is confirmed by the consumer behavior study we conducted -- 57% of the participants

73
stated that the Icewind design looked more aesthetically pleasing, and 63% of the participants
stated that they found it more aerodynamic than the barrel design.
To sum up, it does seem that Icewind is winning on all fronts. We can surely say that
Icewind have valid and solid claims, and that their design is indeed better than the classic barrel
design. We hope that their product will be successful once they begin large-scale production,
scheduled for later this year.
Future work would consist of building an actual Icewind turbine that can be used to
generate electricity. The field of small-scale wind energy is very promising and largely
untapped. This means that there are many questions about Savonius and other types of VAWTs
that are worth researching. Variables such as overlap, curvature of the blades, orientation, etc.
need to be investigated in order to better understand these designs.
In the end, we would like to mention that this was an amazing learning journey. We
hope that this will serve as the first step towards establishing a hands-on and fabrication
tradition in the School of Science and Engineering.
Throughout the different phases, we faced and overcame many challenges. It is thanks
to the contributions of many people that this project came to be, and the few acknowledgments
at the beginning of this report do not do justice to their efforts.

74
8 BIBLIOGRAPHY
[1] G. J. Herbert, S. Iniyan, E. Sreevalsan, and S. Rajapandian, “A review of wind energy
technologies,” Renewable and Sustainable Energy Reviews, vol. 11, no. 6, pp. 1117–
1145, 2007.
[2] “World: Electricity and Heat for 2014,” IEA - Report. [Online]. Available:
http://www.iea.org/statistics/statisticssearch/report/?country=WORLD&product=elect
ricityandheat&year=2014. [Accessed: 29-Jan-2017].
[3] “V164-8.0 MW® breaks world record for wind energy production,” MHI Vestas Offshore,
08-May-2015. [Online]. Available: http://www.mhivestasoffshore.com/v164-8-0-mw-
breaks-world-record-for-wind-energy-production/. [Accessed: 29-Jan-2017].
[4] N. Halsey, “Geometry of the Twisted Savonius Wind Turbine,” Geometrically Modeling
the Twisted Savonius Wind Turbine. [Online]. Available:
http://celloexpressions.com/ts/dynamic-documentation/intro/. [Accessed: 29-Jan-
2017].
[5] M. Ragheb,“Wind Turbines Theory - The Betz Equation and Optimal Rotor Tip Speed
Ratio”.[Online].Available: http://cdn.intechopen.com/pdfs-wm/16242.pdf . [Accessed:
29-Jan-2017].
[6] F. Thönnißen, M. Marnett, B. Roidl, and W. Schröder, “A numerical analysis to evaluate
Betz's Law for vertical axis wind turbines,” Journal of Physics: Conference Series, vol.
753, p. 022056, 2016.
[7] K. Pope, I. Dincer, and G. Naterer, “Energy and exergy efficiency comparison of horizontal
and vertical axis wind turbines,” Renewable Energy, vol. 35, no. 9, pp. 2102–2113,
2010.
[8] M. Óskarsdóttir “A General Description and Comparison of Horizontal Axis Wind Turbines
and Vertical Axis Wind Turbines,” University of Iceland 2014.

75
[9]“Wind Turbine Design,” sustainable energy.[Online]. Available:
http://mcensustainableenergy.pbworks.com/w/page/20638217/Wind%20Turbine%20
Design. [Accessed: 29-Jan-2017].
[10] “Modelling turbulence | Windlab,” Modelling turbulence | Windlab. [Online]. Available:
http://www.windlab.com/technology/turbulence. [Accessed: 29-Jan-2017].
[11] “Lift and Drag,” Coherent Application Threads (CATS). [Online]. Available:
http://people.bu.edu/dew11/liftanddrag.html. [Accessed: 30-Jan-2017].
[12] A. R. Jha, Wind turbine technology. Boca Raton, Fla.: CRC Press, 2011.
[13] M. M. A. Bhutta, N. Hayat, A. U. Farooq, Z. Ali, S. R. Jamil, and Z. Hussain, “Vertical
axis wind turbine – A review of various configurations and design techniques,”
Renewable and Sustainable Energy Reviews, vol. 16, no. 4, pp. 1926–1939, 2012.
[14] M. Ragheb , “Vertical Axis Wind Turbines”, 2015.
[15] M. H. Ali, “Experimental Comparison Study for Savonius Wind Turbine of Two & Three
Blades At Low Wind Speed,” International Journal of Modern Engineering Research
(IJMER), vol. 3, no. 5, pp. 2978–2986, 2013.
[16] Robert E. Wilson, Peter B. S. Lissaman, "Applied Aerodynamics of Wind Power
Machine", National Science Foundation, 1974.
[17] F. Wenehenubun, A. Saputra, and H. Sutanto, “An Experimental Study on the
Performance of Savonius Wind Turbines Related With the Number Of Blades,” Energy
Procedia, vol. 68, pp. 297–304, 2015.
[18] M. Zhang , “Wind Resource Assessment and Micro-siting”, Science and Engineering,
First Edition. [Online]. Available:
http://onlinelibrary.wiley.com/doi/10.1002/9781118900116.app2/pdf [Accessed: 30-
Jan-2017].

76
[19] “Savonius design.” [Online].Available: http://cr4.globalspec.com/thread/17270/Savonius.
[Accessed: 07-Feb-2017].
[20] Icewind. [Online]. Available: http://icewind.is/en/. [Accessed: 07-Feb-2017].
[21] “The Tech That Could Fix One of Wind Power's Biggest Problems,” YouTube, 22-Jun-
2016. [Online]. Available: https://www.youtube.com/watch?v=Wlxz-KzebbQ.
[Accessed: 25-Jan-2017].
[22] "ANSYS Fluent: CFD Simulation", Ansys.com, 2017. [Online]. Available:
http://www.ansys.com/Products/Fluids/ANSYS-Fluent. [Accessed: 26- Mar- 2017].
[23] K. Sulaksna and P. Thamatkeng, “Heat Transfer & Fluid Flow Simulation with
ANSYS,” School of Mechanical Engineering Suranaree University of Technology.
[Online]. Available:
http://eng.sut.ac.th/me/2014/document/training/CAETraining(Fluid).pdf [Accessed:
01-Mar-2017].
[24] Fluent tutorial: engrtutorials.thinkific.com/courses/take/ansys-fluent-rotating-wind-
turbine-tutorial/lessons/236233-velocity-vectors-demonstration [Online]
[25] ANSYS documentation: http://148.204.81.206/Ansys/readme.html [Online]
[26] J. Zoellner, P. Schweizer-Ries and C. Wemheuer, "Public acceptance of renewable
energies: Results from case studies in Germany", Energy Policy, vol. 36, no. 11, pp.
4136-4141, 2008.
[27] A. Kontogianni, C. Tourkolias, M. Skourtos, and D. Damigos, “Planning globally,
protesting locally: Patterns in community perceptions towards the installation of wind
farms,” Renewable Energy, vol. 66, pp. 170–177, 2014.

77
Appendix A - 2D Simulation Results
4 Blades:
1 m/s 5 m/s 10 m/s
Angle Pressure
0 1.75 47.2 191.6
20 1.694 51.7 210.6
40 1.818 42.9 162
60 1.79 27.85 93.1
80 0.403 12.6 44.2
90 1.75 47.2 191.6
110 1.694 51.7 210.6
130 1.818 42.9 162
150 1.79 27.85 93.1
170 0.403 12.6 44.2
180 1.75 47.2 191.6
200 1.694 51.7 210.6
220 1.818 42.9 162
240 1.79 27.85 93.1
260 0.403 12.6 44.2
270 1.75 47.2 191.6
290 1.694 51.7 210.6
310 1.818 42.9 162
330 1.79 27.85 93.1
350 0.403 12.6 44.2

78
3 blades
1 m/s 5 m/s 10 m/s
Angle Pressure
0 1.89 42.5 145
20 2.15 53.5 213
40 2.01 54.7 216
60 1.797 39.1 168.6
80 0.737 15.8 66.4
100 1.63 44.8 183.6
120 1.89 42.5 145
140 2.15 53.5 213
160 2.01 54.7 216
180 1.797 39.1 168.6
200 0.737 15.8 66.4
220 1.63 44.8 183.6
240 1.89 42.5 145
260 2.15 53.5 213
280 2.01 54.7 216
300 1.797 39.1 168.6
320 0.737 15.8 66.4
340 1.63 44.8 183.6

79
2 blades:
1 m/s 5 m/s 10 m/s
Angle Pressure
0 2.2 56.9 227
20 1.87 44.1 168
40 1.512 35.1 124.6
60 1.097 22.9 87.3
80 1.252 22.42 93.6
100 0.206 11 63.2
120 0.994 25.1 104.6
140 1.685 51.4 193
160 2.23 51.7 225
180 2.2 56.9 227
200 1.87 44.1 168
220 1.512 35.1 124.6
240 1.097 22.9 87.3
260 1.252 22.42 93.6
280 0.206 11 63.2
300 0.994 25.1 104.6
320 1.685 51.4 193
340 2.23 51.7 225
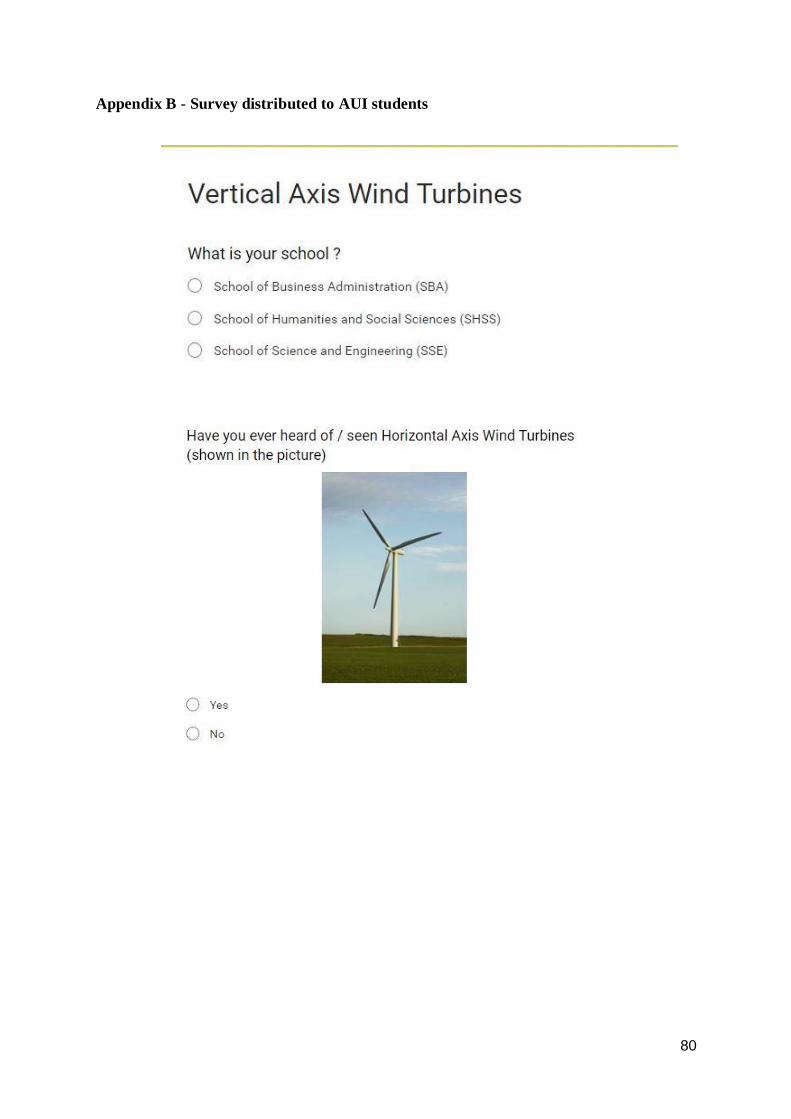
80
Appendix B - Survey distributed to AUI students

81

82


![Design of an airborne vertical axis wind turbine for low ......from a Savonius wind turbine, which is able to self-start and operate in low wind speed conditions [23]. A gas balloon](https://img.dokumen.tips/doc/110x75/60affaa3e6bf9e6952574a89/design-of-an-airborne-vertical-axis-wind-turbine-for-low-from-a-savonius.jpg)


![Experimental Investigation on a Ducted Savonius Vertical ...rera.shahroodut.ac.ir/article_1521_d0bd6a5291820e1c11859f729d7f… · Savonius turbine in the last forty years [6]. A Savonius](https://img.dokumen.tips/doc/110x75/5f9628ac1f2434326902d69a/experimental-investigation-on-a-ducted-savonius-vertical-rera-savonius-turbine.jpg)