Embed Size (px)
Citation preview

Energy
Savings and benefits of global
regulations for energy efficient
products
A ‘cost of non-world’ study
Final report

European Commission Savings and benefits of global regulations for energy efficient products
September 2015
c2
Prepared by Edith Molenbroek, Matthew Smith, Nesen Surmeli, Sven Schimschar (Ecofys), Paul Waide (Waide Strategic Efficiency), Jeremy Tait (Tait Consulting) and Catriona
McAllister (Sea Green Tree)
This study was ordered and paid for by the European Commission, Directorate-General
for Energy.
The information and views set out in this study are those of the author(s) and do not necessarily reflect the official opinion of the Commission. The Commission does not
guarantee the accuracy of the data included in this study. Neither the Commission nor any person acting on the Commission’s behalf may be held responsible for the use
which may be made of the information contained therein.
© European Union, September 2015
Reproduction is authorised provided the source is acknowledged.
More information on the European Union is available on the internet (http://europa.eu).
European Commission Savings and benefits of global regulations for energy efficient products
September 2015
c3
Abstract
This study considers the potential for global regulations on energy efficient products. If the most stringent current minimum energy performance requirements (MEPS) for product energy efficiency had been harmonised globally at this point in time, global final energy consumption would be 9% lower, and energy consumption due specifically to products would be 21% lower. This saving of 8,950 TWh is equivalent to closing 165 coal-fired power plants, or taking 132 million cars off the road globally. In an expanding world of limited resources, where energy consumption is expected to increase by 30% by 2030, there has never been a greater need for such efficiency improvements. If we begin to work toward ambitious global efficiency requirements now, for example implementing the current most stringent MEPS globally from 2020, then annual gross energy savings of 14% (7,600 TWh) could still be achieved by 2030 compared to a business as usual scenario; This would be equivalent to 5-6% of total global final energy consumption in 2030. These savings would occur across all regions, albeit with small variations due to country specific characteristics. Such savings bring with them economic benefits and increased welfare, freeing up consumer spending to grow the whole economy. Working towards harmonisation in this way could result in economic benefits of €280-410 billion per year, driving innovation, enhancing the competitiveness of EU industry and creating of 1.7-2.5 million jobs compared to 2030. In order to achieve these benefits, there are a number of barriers to be overcome - however, the core requirement for harmonisation is simply the coherence and comparability of test standards and policy approaches, which is achievable through coordinated efforts in the short to medium term at relatively low cost.

European Commission Savings and benefits of global regulations for energy efficient products
September 2015
c4
Glossary Key terms and concepts:
Cost of Non-World: this study is labelled a cost of non-world study, this is developed
from the concept of ‘the cost of non-Europe’ studies whose central notion is that the
absence of common action at European level may mean that, in a specific sector, there is an efficiency loss (cost) to the overall economy and/or that a collective public
good that might otherwise exist is not being realised. This study takes a similar approach, but on a global rather than EU level. It considers the avoided cost resulting
from common requirements on energy efficiency of products on a global level.
Energy labelling: refers to the process by which energy-related labels are associated with a product. These can include a description and/or rating of the product energy
use / efficiency. They may also include other basic product or environmental
information. The goal of these labels is to better inform those purchasing the product, so that energy use (and costs) are taken into account and compared on a fair basis
with other similar products. The logic is that this will result in the purchase of more efficient products, stimulating innovation and competition between product
manufacturers to reduce energy use and/or increase efficiency. Energy labels can be mandatory or voluntary and may be introduced by Governments or industry sectors.
Our focus in this work is on Government introduced energy labels.
Harmonisation: refers to the process of creating more coherent and in some cases
common technical standards and policy requirements. Necessary steps towards this include increased international dialogue, mutual recognition, coherent definitions of
products/scope, equivalence or at least comparability of test procedures, coherent product performance level frameworks etc. These may or may not lead to matching
performance requirements, depending upon the economic and political situation in any given economy.
Minimum Energy Performance Standards (MEPS): sometimes also referred to as
Minimum Energy Efficiency Requirements (MEER), are regulatory measures applied in
a particular country or region specifying performance requirements for an energy-using device. They effectively limit the maximum amount of energy that may be
consumed by a product, or the minimum level of efficiency, in performing a specified task. By specifying the minimum acceptable efficiency levels, MEPS define which
products can be marketed and sold. A MEPS is usually made mandatory by a government energy efficiency body. It may include requirements not directly related
to energy; this is to ensure that general performance and user satisfaction are not adversely affected by increasing energy efficiency. A MEPS generally requires use of a
particular test procedure that specifies how performance is measured. The EU
Ecodesign Directive is the primary means for setting MEPS in the EU.
Standards: distinct from standards referred to in the MEPS definition above, these refer to technical standards, which are agreed norms or requirements which establish
uniform technical criteria, methods, processes and practices, for example of test methodologies will typically confirm to an agreed technical standard. Technical
standards are typically set by or agreed through standardisation organisations such as ISO, IEC, ANSI, CEN/CENELC, etc.
European Commission Savings and benefits of global regulations for energy efficient products
September 2015
c5
Table of Contents
Abstract .......................................................................................................... 3 Glossary ......................................................................................................... 4 1 Introduction ............................................................................................... 7
1.1 Background ......................................................................................... 7 1.2 Objectives ........................................................................................... 9 1.3 Structure .......................................................................................... 10
2 Methodology ............................................................................................ 11 2.1 Approach .......................................................................................... 11 2.2 Quantitative modelling of energy savings ............................................... 12
2.2.1 Scope of the modelling exercise .......................................................... 12 2.2.2 Scenarios considered .................................................................... 13
3 Potential impacts of global harmonisation ..................................................... 15 3.1 Energy and environmental impacts ....................................................... 15
3.1.1 Impact on energy consumption ...................................................... 15 3.1.2 Other environmental impacts ......................................................... 22
3.2 Economic impacts ............................................................................... 26 3.2.1 Economic impact of energy savings ................................................. 26 3.2.2 Impact on employment ................................................................. 28 3.2.3 Impact on trade, including technical barriers to trade ........................ 31 3.2.4 Competitiveness of industry ........................................................... 36 3.2.5 Impact on innovation and technological development ........................ 43
3.3 Impact on citizens .............................................................................. 47 3.3.1 Affordability impacts ..................................................................... 47 3.3.2 Functionality and usability of energy related products ........................ 50
4 Barriers to harmonisation ........................................................................... 54 5 Overall merits of harmonisation .................................................................. 59 References .................................................................................................... 63 Annex I: Description of model and modelling methodology ................................... 67
Model design and structure ........................................................................ 67 Treatment of the scenarios considered ......................................................... 71 Proxy data for rest of world ........................................................................ 73 Model outputs .......................................................................................... 74
Annex II: Country / region results .................................................................... 75 EU ............................................................................................................. 75 USA ........................................................................................................... 78 China ......................................................................................................... 81 India .......................................................................................................... 84 South Africa ................................................................................................ 87 Rest of World .............................................................................................. 90
Annex III: Product group results ....................................................................... 94 Lighting ...................................................................................................... 94 HVAC electric .............................................................................................. 95 Hot water (electric) ...................................................................................... 96 White goods ................................................................................................ 96 Consumer electronics ................................................................................... 97 ICT ............................................................................................................ 98 Cooking...................................................................................................... 98 Space heating (thermal) ............................................................................... 99 Water heating (thermal) ............................................................................. 100 Refrigeration (non-domestic) ....................................................................... 100 Cleaning ................................................................................................... 101
European Commission Savings and benefits of global regulations for energy efficient products
September 2015
c6
Pumps (non-industrial) ................................................................................ 102 Motors (industrial) and related applications .................................................... 102 Transformers ............................................................................................. 103
Annex IV: Emission factors used for environmental impact analysis ...................... 104 Annex V: Relevance of global harmonisation for the EU within existing trade
frameworks .................................................................................................. 105
European Commission Savings and benefits of global regulations for energy efficient products
September 2015
c7
1 Introduction
1.1 Background
This study is a follow-up to the study ‘Impacts of the EU’s Ecodesign and Energy/Tyre labelling legislation on third jurisdictions’ prepared for DG Energy by Ecofys, Waide
Strategic Efficiency, ISR Coimbra University, Consumer Research Associates and Tait Consulting in April 20141. The key findings of this previous work included, in summary:
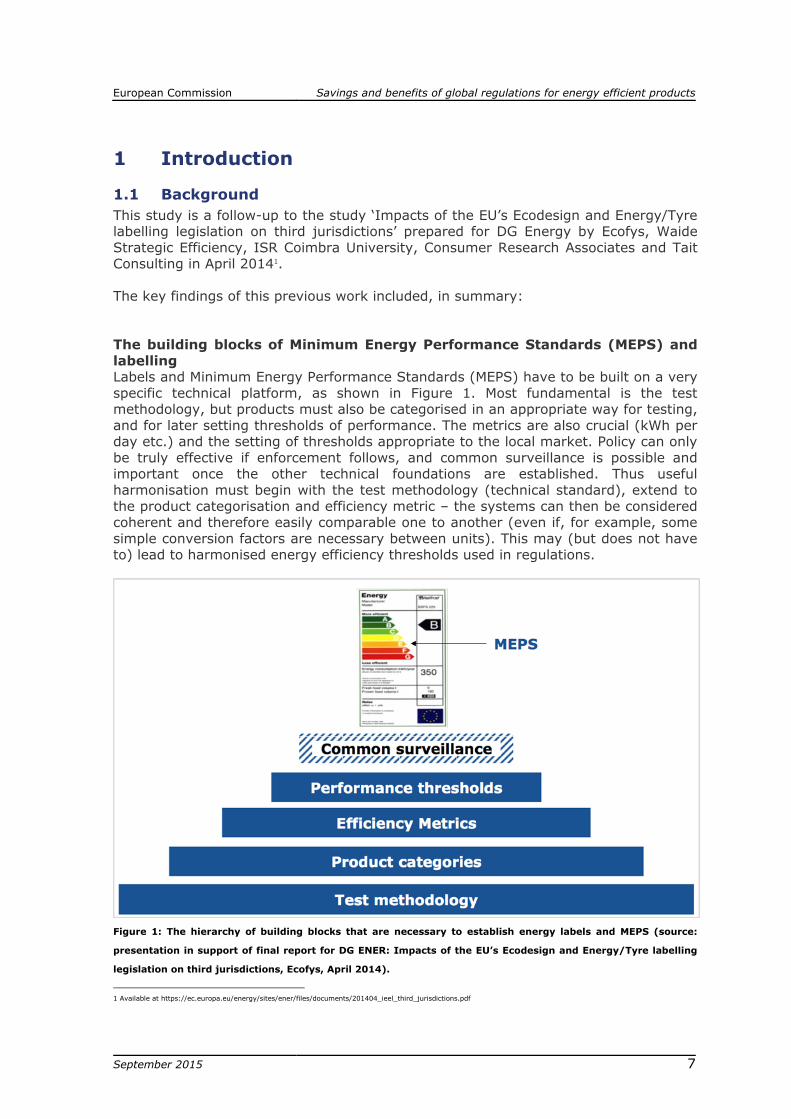
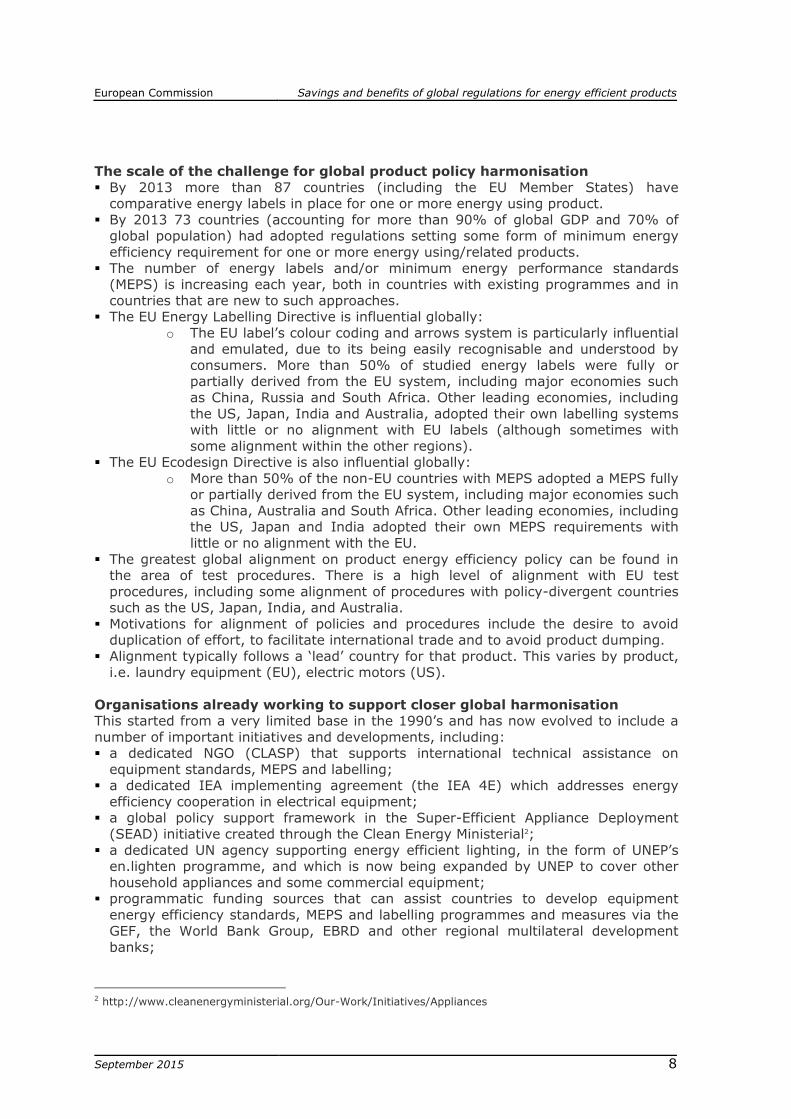
The building blocks of Minimum Energy Performance Standards (MEPS) and
labelling Labels and Minimum Energy Performance Standards (MEPS) have to be built on a very
specific technical platform, as shown in Figure 1. Most fundamental is the test methodology, but products must also be categorised in an appropriate way for testing,
and for later setting thresholds of performance. The metrics are also crucial (kWh per day etc.) and the setting of thresholds appropriate to the local market. Policy can only
be truly effective if enforcement follows, and common surveillance is possible and important once the other technical foundations are established. Thus useful
harmonisation must begin with the test methodology (technical standard), extend to
the product categorisation and efficiency metric – the systems can then be considered coherent and therefore easily comparable one to another (even if, for example, some
simple conversion factors are necessary between units). This may (but does not have to) lead to harmonised energy efficiency thresholds used in regulations.
Figure 1: The hierarchy of building blocks that are necessary to establish energy labels and MEPS (source:
presentation in support of final report for DG ENER: Impacts of the EU’s Ecodesign and Energy/Tyre labelling
legislation on third jurisdictions, Ecofys, April 2014).
1 Available at https://ec.europa.eu/energy/sites/ener/files/documents/201404_ieel_third_jurisdictions.pdf
European Commission Savings and benefits of global regulations for energy efficient products
September 2015
c8
The scale of the challenge for global product policy harmonisation
By 2013 more than 87 countries (including the EU Member States) have comparative energy labels in place for one or more energy using product.
By 2013 73 countries (accounting for more than 90% of global GDP and 70% of global population) had adopted regulations setting some form of minimum energy
efficiency requirement for one or more energy using/related products.
The number of energy labels and/or minimum energy performance standards (MEPS) is increasing each year, both in countries with existing programmes and in
countries that are new to such approaches. The EU Energy Labelling Directive is influential globally:
o The EU label’s colour coding and arrows system is particularly influential and emulated, due to its being easily recognisable and understood by
consumers. More than 50% of studied energy labels were fully or partially derived from the EU system, including major economies such
as China, Russia and South Africa. Other leading economies, including
the US, Japan, India and Australia, adopted their own labelling systems with little or no alignment with EU labels (although sometimes with
some alignment within the other regions). The EU Ecodesign Directive is also influential globally:
o More than 50% of the non-EU countries with MEPS adopted a MEPS fully or partially derived from the EU system, including major economies such
as China, Australia and South Africa. Other leading economies, including the US, Japan and India adopted their own MEPS requirements with
little or no alignment with the EU.
The greatest global alignment on product energy efficiency policy can be found in the area of test procedures. There is a high level of alignment with EU test
procedures, including some alignment of procedures with policy-divergent countries such as the US, Japan, India, and Australia.
Motivations for alignment of policies and procedures include the desire to avoid duplication of effort, to facilitate international trade and to avoid product dumping.
Alignment typically follows a ‘lead’ country for that product. This varies by product, i.e. laundry equipment (EU), electric motors (US).
Organisations already working to support closer global harmonisation This started from a very limited base in the 1990’s and has now evolved to include a
number of important initiatives and developments, including: a dedicated NGO (CLASP) that supports international technical assistance on
equipment standards, MEPS and labelling; a dedicated IEA implementing agreement (the IEA 4E) which addresses energy
efficiency cooperation in electrical equipment; a global policy support framework in the Super-Efficient Appliance Deployment
(SEAD) initiative created through the Clean Energy Ministerial2;
a dedicated UN agency supporting energy efficient lighting, in the form of UNEP’s en.lighten programme, and which is now being expanded by UNEP to cover other
household appliances and some commercial equipment; programmatic funding sources that can assist countries to develop equipment
energy efficiency standards, MEPS and labelling programmes and measures via the GEF, the World Bank Group, EBRD and other regional multilateral development
banks;
2 http://www.cleanenergyministerial.org/Our-Work/Initiatives/Appliances

European Commission Savings and benefits of global regulations for energy efficient products
September 2015
c9
bilateral programmatic funding to support equipment energy efficiency policy
through international technical assistance programmes operated by the EU, USAID and State Departments, METI (Japan), RET in Australia and many others, including
several EU Member State agencies.
It was noted that significant institutionalised international cooperation and harmonisation had only developed in one or two product groups (electric motors,
distribution transformers). In the case of electric motors this resulted in common
energy performance tiers founded on common test procedures, common product categories and common energy efficiency metrics.
The huge potential for further benefits from alignment and harmonisation
The study highlighted the support these new institutions provided to the process of harmonisation, particularly providing a catalyst for the exchange of knowledge and
best practice. It also noted that there were ‘certainly potential benefits from increasing the scale of these efforts’. The study recommended a variety of ways in which the EU
should support further alignment. These included various awareness raising,
cooperation and dissemination activities, and work to expand harmonisation to other products where global cooperation was most likely to result in agreement on common
tiers, testing, categorisation, metrics and thresholds, as achieved for electric motors.
It is clear that product energy efficiency requirements such as MEPS and energy labels are having a significant impact globally. The report estimated annual electricity
consumption savings at 17% in the EU3 and 14% in the US4, and similarly high energy savings in many other economies. Yet it was also identified that there is vast further
potential for energy savings. A study by Waide et al (2011)5 estimated that global
alignment to the most advanced MEPS in place in 2010 by 2030 would result in annual savings in 2030 of 4000 TWh of final electricity demand (12% of the total) and 45% of
oil and gas demand in the residential, commercial and industrial sectors6. More recent work7 also estimates savings of this magnitude for existing MEPS and labels, with
savings of 10-25% achieved.
Thus, the key motivations for this study are to further quantify the huge potential savings (and avoided costs and wider impacts) from global harmonisation, and refine
the understanding of the overall benefits (and costs) of greater global harmonisation.
This is also in-line with the European Commission's Energy Union and the ‘energy efficiency first’ principle.
1.2 Objectives
Building upon the context outlined above, this study had the following objectives:
To prepare a general overview of [the impact of] global policies to improve the energy efficiency of energy-related products, especially using previous studies such
as the study ‘Impacts of the EU’s Ecodesign and Energy/Tyre labelling legislation on third jurisdictions’.
3 Ecofys (2012) Economic Benefits of the EU Ecodesign Directive 4 ASAP (2012) The Efficiency Boom: Cashing In on the Savings from Appliance Standards 5 Waide, P. et al. CLASP (2011a) Opportunities for Success and CO2 Savings from Appliance Energy
Efficiency Harmonization. 6 Excluding energy used for transport and industrial process heat, equivalent to 2600 Mt of CO2 emissions
(11% of emissions from these sectors) 7 IEA4E (2015) Achievements of appliance energy efficiency standards and labelling programs: a global
assessment
European Commission Savings and benefits of global regulations for energy efficient products
September 2015
c10
To assess in detail the potential benefits of aligning these policies to create
common, world-wide minimum energy efficiency performance levels or labelling schemes for energy-related products, establishing the 'costs of non-world’, on:
o environmental aspects such as, but not limited, to the impact on energy consumption, resource efficiency and environmental pollution, both on a
world-wide level and specifically for the European Union; o socio-economic aspects such as, but not limited to, the impact on the
labour market, economic situation for households, affordability of
energy-related products, technical barriers to trade between economies, competitiveness of industry and general economic costs or benefits,
both on a world-wide level and specifically for the European Union; o technological aspects such as, but not limited to, the impact on
invention and innovation of novel technologies, the market penetration of energy efficient products, and functionality and usability of energy-
related products, both on a world-wide level and specifically for the European Union;
To evaluate and present barriers to aligning these policies with common, world-wide
minimum energy efficiency performance levels for energy-related products; and To structure the study in a clear and precise manner to give a complete overview on
the 'costs of non-world' to policy makers but also to a non-technical audience like the general public.
1.3 Structure
Reflecting these objectives, the executive summary presents an overview of the ‘costs
of non-world’ for non-technical readers. The remainder of this report presents the research and evidence that underpins the conclusions presented in the summary, as
follows: Chapter 2: Summarising the methodology used in this work, including the main
approach and scope and the quantitative modelling used to calculate energy
savings. Chapter 3: Presenting the key results of the impact assessment at global and EU
levels, of global harmonisation of policies to improve product energy efficiency. This examines the energy and environmental impacts, the economic impacts and the
impact on citizens. Chapter 4: Reviewing the barriers to greater global harmonisation.
Chapter 5: Presenting an assessment of the overall merits of harmonisation based on the findings of chapters 3 and 4.
Annexes: Providing more detailed elaborations of the specific tools used and results
at the product and country level.

European Commission Savings and benefits of global regulations for energy efficient products
September 2015
c11
2 Methodology This chapter details the scope of this work and describes in more detail the
quantitative modelling used to produce the energy saving estimates.
2.1 Approach
Our approach to this study was based on two key elements, (1) quantitative modelling
of energy saving potential from global harmonisation; and (2) qualitative investigation and assessment of other impacts of global harmonisation. The first element is
discussed in more detail in section 2.2. The remainder of this section describes our overall approach, including the qualitative assessment.
Our approach was underpinned by assumptions on the level at which global harmonisation is achieved, these are described more fully in the scenarios modelled
and their descriptions (see section 2.2.1). The scenarios examine situations where global harmonisation has led to higher product efficiency requirements, at least in
some regions, and for which we then assess the potential benefits such as: Increased energy savings;
Other benefits from energy savings (i.e. reduced costs for consumers, reduced environmental impact, job impacts);
Reduced costs for (internationally operating) companies as it simplifies their
way of working of selling the same products for different markets; Increased imports and exports of products, although other legislation (e.g.
safety) may keep posing barriers.
The wider issue of the ambition level actually possible in a global agreement is explored throughout the text, and particularly in chapter 4 on barriers. This addresses
the question of whether global harmonisation can contribute to increasing overall ambition levels or if it is more likely to lead to a lowest common denominator type
agreement, which while it may be better than nothing for currently unregulated
countries would be unlikely to provide much benefit to energy saving in the economies with ambitious current requirements.
The analysis followed the following steps:
1. Inventory of product groups: MEPS and labelling requirements were examined for each of the product groups and economies in the scope of this study. This
provided key model inputs and contextual information for the study.
2. Product group energy consumption modelling: based on the quantitative approach described above.
3. Assessment of other benefits and savings: including expanding the results to the Rest of the World and using the results to estimate further environmental and
economic impacts.
4. Assessment of other impacts: including the various socio-economic, technological and trade impacts of harmonisation.
5. Assessment of barriers and merits of harmonisation: based on the impacts and known barriers the various practical aspects of harmonisation were discussed.
6. Conclusions and recommendations: based on the assessment conclusions and
recommendations were derived.
The qualitative aspects of this assessment were heavily based on desk review of the most relevant documents globally, particularly in the focus countries and regions of
European Commission Savings and benefits of global regulations for energy efficient products
September 2015
c12
the study (see below). The desk research was supplemented by stakeholder contact
where necessary.
2.2 Quantitative modelling of energy savings
To conduct the quantitative analysis a detailed bottom-up model of product energy use was developed and linked with a top down energy model based on projections
from the International Energy Agency (IEA). This hybrid top-down/bottom-up model analyses 102 specific energy end-uses that are subject to either minimum energy
performance standards (MEPS) regulatory requirements or to energy labelling regulatory requirements or both, in one or more economies around the world. It
aggregates the results by equipment type and energy end-use service (e.g. lighting,
space cooling, motive power, etc.) into one of the residential, tertiary and industrial sectors. Transportation energy use and losses due to the production and transmission
of energy are not considered. In both cases this is because different energy saving policies and ministries are involved than is the case for MEPS and energy labelling. In
addition, direct fossil-fuel consuming industrial end-uses and customised industrial electrical end-uses, such as arc furnaces are not considered. This is because there are
currently no Ecodesign-style MEPS policies applied to these end-uses and the equipment types concerned are not widely traded. All other energy end-uses are
included and thus the ensemble of equipment types subject to MEPS or Energy
Labelling style regulatory activity around the world are encompassed in the analysis8.
A more detailed description of the model is presented in Annex I.
2.2.1 Scope of the modelling exercise
Given the large number of existing requirements and regulated product groups it was
decided to scope the study to defined geographies and product groups with the aim of striking a balance between feasibility of the work and maximising the relevance and
usefulness of the results. For key inputs we analysed the following regions/countries in
detail in this work: China
The European Union India
Republic of South Africa (RSA) The USA
This country/region grouping includes both industrialised and developing economies,
covers a high proportion (~65%) of total global GDP and population (~50%) and also
covers a variety of different climates. These economies also include a variety of MEPS and labelling requirements across different product groups.
The modelling exercise also included a ‘Rest of the World’ (RoW) grouping to capture
all the world’s energy use and much of the regulatory activity around the product types considered; however, it inevitably required some assumptions to be made
regarding the efficiency levels and energy use by product type in the large RoW region. The analysis extrapolated results from the industrialised and developing
economies to the rest of world – see Annex I for more specific details.
8 Excepting some policies applied in the transportation sector

European Commission Savings and benefits of global regulations for energy efficient products
September 2015
c13
The depth of analysis applied varies by equipment (product) group with the most
detailed analyses being conducted for the following energy end-uses:
Lighting (residential and tertiary [commercial and public] sectors) HVAC (heating, ventilation and air conditioning in residential and tertiary
sectors) Water heating (residential and tertiary sectors)
White goods (refrigerators and freezers, washing machines, dishwashers and
clothes dryers) Consumer electronics (televisions, set-top boxes and external power supplies)
ICT (desktops, notebooks, servers, domestic and commercial imaging equipment)
Space heating (residential and tertiary sectors) Electric motors (industrial sector and related applications for pumping, fans and
compressors) Transformers (distribution and power transformers in the industrial and tertiary
sectors)
Slightly less detailed analyses were conducted for:
Refrigeration (tertiary sector) Cleaning (tertiary sector)
Pumps (residential and tertiary sectors) Cooking (residential and tertiary sectors)
These represent the most common appliance groupings and cover a very high
proportion of final energy use. Residential, tertiary (commercial and public) and
industrial uses are all considered. Only policies on MEPS and energy labelling were considered, although the influence of technical standards supporting these policies was
also taken into account where relevant. Product systems were not analysed.
It should be noted that this product coverage while relatively comprehensive does not cover a majority of the energy efficiency potential that exists, with appliance efficiency
being only one of a variety of areas where savings can be made. There can be synergies/overlap between these areas, for example in the area of buildings energy
use and heating appliances, where policies that address the quality of the building
envelope, i.e. requiring better insulation, can also be highly influential in improving energy efficiency and the impact that improved appliance efficiency has.
2.2.2 Scenarios considered
Four product energy scenarios are developed to explore the implications of the potential for energy savings through the adoption of equipment with higher energy
savings potential as describe below.
Business as Usual (BAU) scenario
The BAU scenario considers how much energy would be used by each product type in each economy if energy efficiency policies which have currently been adopted are
implemented but no new policies are adopted and implemented thereafter. In the event no product efficiency policies have been adopted this scenario projects the
energy consumption as would be expected due to autonomous energy efficiency improvements, i.e. due to unregulated market forces.
Cost of Non World MEPS 2015 scenario
This scenario considers how much energy would be consumed were the average
efficiency of products used today (2015) to be at the level equal to the most ambitious
European Commission Savings and benefits of global regulations for energy efficient products
September 2015
c14
currently promulgated MEPS. This Cost of Non World scenario is completely
hypothetical in that it is now too late for it to actually happen; however, it is informative in indicating the magnitude of savings that would have been delivered
today had the most ambitious MEPS policies been adopted in the recent past on an internationally harmonised basis.
Cost of Non World MEPS + High Label 2015 scenario
This scenario considers how much energy would be consumed were the average
efficiency of products used today (2015) to be either at the level equal to the most ambitious currently promulgated MEPS or at the level equal to the most ambitious
currently promulgated energy label threshold (i.e. the so-called “High Label” requirement), whichever is most ambitious. This Cost of Non World scenario is purely
hypothetical in that it is now too late for it to actually happen; however, it is also informative in indicating the magnitude of savings that would have been delivered
today had the most ambitious MEPS and labelling policies been adopted in the recent past on an internationally harmonised basis.
Cost of Non World MEPS 2030 scenario This scenario is different to the two 2015 Cost of Non World scenarios in that it is a
plausible scenario that could yet be actualised. It projects how much energy would be consumed in 2030 were the average efficiency of products sold in the future to be at
the level equal to the most ambitious currently promulgated MEPS. It explicitly takes into account the minimum realistic period it would take for all economies to adopt and
implement these regulations (typically assumed to be about 5 years i.e. from 2020 onwards) and of the degree to which the stock of equipment in 2030 would be
influenced by these regulations. Thus, it takes into account the fact that only a
proportion of the equipment stock in 2030 would be affected by these regulations as some proportion of the equipment stock would have been sold prior to the regulations
coming into effect i.e. would not have been retired from service by 2030. This scenario gives an indication of how much energy could be saved by 2030 were there to be
broadly based international agreement to adopt the world’s most demanding MEPS from 2015 by circa 2020. It should be noted that this scenario could be rather
conservative, particularly for the countries with already well developed MEPS and labelling schemes, as by 2030 products stocks in these markets are likely in reality to
have developed significantly beyond the current highest MEPS levels.
A MEPS + high label 2030 scenario is not modelled as this is not considered realistic
within this timeframe.
Annex I contains more details about how these scenarios are derived and modelled. Annex II contains detailed results for each economy while Annex III contains detailed
results by equipment type.
European Commission Savings and benefits of global regulations for energy efficient products
September 2015
c15
3 Potential impacts of global harmonisation Greater global harmonisation of product policy requirements could have significant
impacts on energy use and the environment, the economy and citizens. This chapter assesses what these impacts could be, in the context of the scenarios outlined in
section 2.2, and by discussing and analysing the important underlying factors that
drive and explain these impacts. In doing so we provide insight into the direction and magnitude of impacts for different countries and affected firms and consumers,
including for impacts where a quantitative analysis is not possible.
Impacts are generally analysed in this chapter at the global or selected country/region level. However, for some impacts and benefits it is worth considering the individual
consumer level and/or the industry sectoral level - this is done where appropriate.
3.1 Energy and environmental impacts
3.1.1 Impact on energy consumption
Key points:
Significant gross annual energy savings of 13% would be achieved in 2030 if
global MEPS were agreed at current highest (most stringent)9 levels and
implemented by 2020: based on the results of the modelling work carried out by
this study savings would be experienced across all countries and regions and across a
large range of product groups.
Gross annual energy savings would be increased if global alignment were
made to either the highest energy label category or MEPS: although it was only
possible to model this for a ‘dream scenario’ of an instantaneous switch in 2015, the
total potential of aligning to higher label classes was assessed to be more than 50%
higher than only aligning to the highest MEPS levels (34% total gross savings
compared to 21% total gross savings).
Energy savings should remain significant even accounting for a rebound
effect: while the precise effects are uncertain, literature strongly suggests rebounds
of less than 100% in the majority of cases, and effects of 20% or less experienced in
the developed world.
Consumer electronics and ICT, lighting and (thermal) heating and hot water
products were assessed to offer the highest relative and absolute potential:
for energy savings in 2030 if current highest MEPS were applied by 2020. Consumer
electronics and ICT and lighting in the residential sector and heating and hot water
technologies in both the residential and tertiary sectors offer significant absolute
energy saving potential.
9 Highest is used in this report to denote the most stringent MEPS requirements, in a few cases, i.e. for
standby power requirements, the ‘highest’ or most stringent requirement is actually for the lowest energy
use.

European Commission Savings and benefits of global regulations for energy efficient products
September 2015
c16
Implementing globally harmonised MEPS as described in scenarios presented in section 2.2.1 would have significant impacts on the final energy use of the regulated
products. This section presents the quantitative results of the modelling exercise undertaken by this study (the approach is described in section 2.2) to estimate the
size of these impacts. Results are presented in aggregate in this section, while comprehensive product and country level results are presented in the annexes.
The results presented below provide both a gross and net estimated impact on energy use. The gross impact represents the saving from simply applying the global MEPS
while the net impact is adjusted for the anticipated rebound in energy use caused by the financial savings being re-spent in the economy leading to increased energy use,
this is known as the rebound effect and is explained further in Box 1. An indicative rebound effect of 20% is applied to the gross energy savings to arrive at net savings.
Box 1: The rebound effect
The rebound effect of efficiency can in some cases mean that efficiency savings lead to
higher overall consumption, this is sometimes referred to as the Jevons Paradox or ‘backfire’. For example if less energy is used due to increased appliance efficiency a
consumer saves money, which can then be spent either to use the appliance more,
buy bigger appliances, or on other activities, i.e. leisure, which also create new energy demand. The applicability of the first effect is limited for many appliances as the
demand for their function does not change with efficiency, i.e. a more efficient refrigerator does not logically lead to more use of the refrigerator, indeed energy use
is rarely a direct factor in a choice to use an appliance. However the second effect, towards larger product sizes, i.e. increased screen sizes, or more features has been
observed, with the result that absolute energy consumption may not decrease in the same proportions as any efficiency improvement. The third effect can also be highly
prominent when efficiency savings are made due to the effects on prices and
consumption at a macroeconomic level.
Significant amounts of research have been carried out into these rebound effects to better understand and quantify them, to assist policymakers in understanding what
the actual result of efficiency policies may be, and particularly to address the concern that policies could ‘backfire’. We include an indicative rebound correction of 20% in
this study. We base this correction on a study by the American Council for an Energy-Efficient Economy (ACEEE, 2012), which is an assessment of a range of studies. It
concludes that the total rebound effect, both direct and indirect, is about 20%. The
IEA also investigated the rebound effect in the World Energy Outlook 2012. Their report notes that depending on the country and consumption sector, the direct
rebound effect generally ranges from 0-10%, and that estimates of the indirect rebound effect vary widely. Accounting for this, the IEA estimated the overall rebound
effect to be 9%. We understand that uncertainty remains on the extent of the rebound effect and that studies have estimated numbers higher than 20%.
As the model used in this study is not sophisticated enough to model specific rebound
effects for the different product groups and countries/regions analysed in this study,
we have adopted the 20% rates across all products and countries. Further research in this area may be an interesting avenue for future research. While the value we apply
is consistent with literature in this area and we believe offers a reasonable assessment of the scale of this effect, the reader should be aware that this is only an assumption
and that there remains potential for higher rebounds, and even in a few cases backfire in efficiency measures. This could be particularly relevant in developing countries
where energy demand remains mostly unmet. It is also relevant to the other
European Commission Savings and benefits of global regulations for energy efficient products
September 2015
c17
environmental and economic impacts also analysed in later chapters.
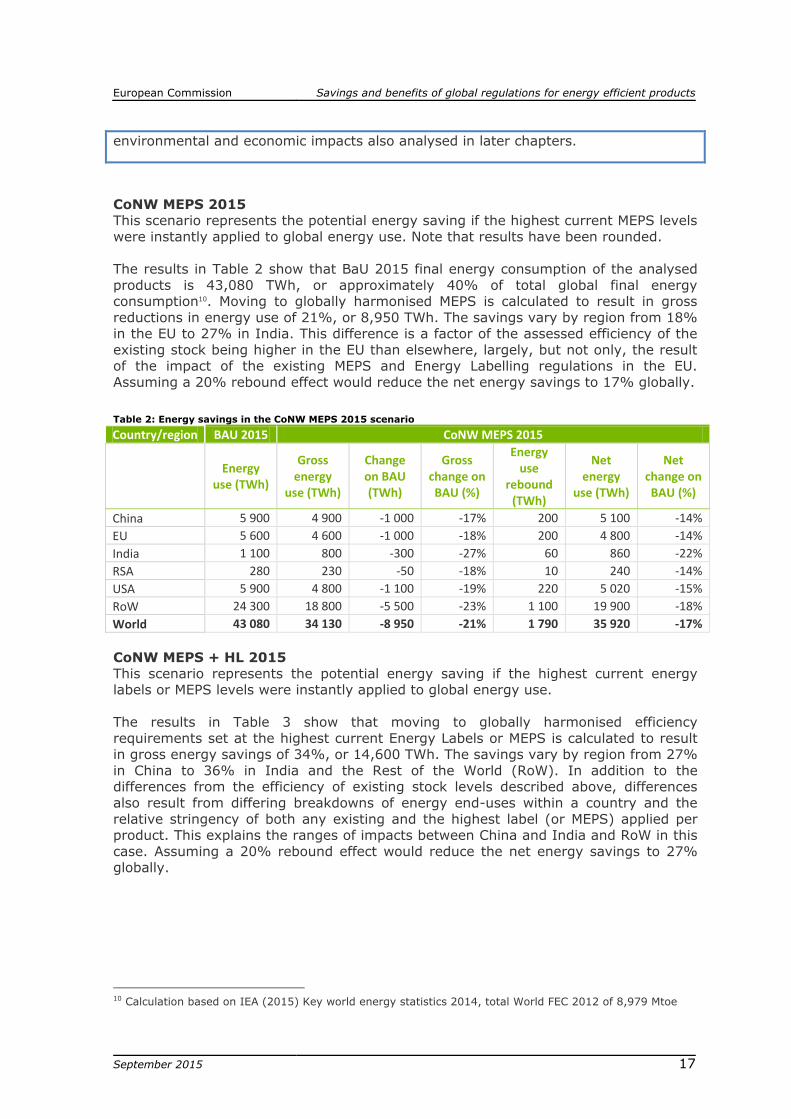
CoNW MEPS 2015 This scenario represents the potential energy saving if the highest current MEPS levels
were instantly applied to global energy use. Note that results have been rounded.
The results in Table 2 show that BaU 2015 final energy consumption of the analysed
products is 43,080 TWh, or approximately 40% of total global final energy consumption10. Moving to globally harmonised MEPS is calculated to result in gross
reductions in energy use of 21%, or 8,950 TWh. The savings vary by region from 18% in the EU to 27% in India. This difference is a factor of the assessed efficiency of the
existing stock being higher in the EU than elsewhere, largely, but not only, the result of the impact of the existing MEPS and Energy Labelling regulations in the EU.
Assuming a 20% rebound effect would reduce the net energy savings to 17% globally.
Table 2: Energy savings in the CoNW MEPS 2015 scenario
Country/region BAU 2015 CoNW MEPS 2015
Energy
use (TWh)
Gross energy
use (TWh)
Change on BAU (TWh)
Gross change on BAU (%)
Energy use
rebound (TWh)
Net energy
use (TWh)
Net change on BAU (%)
China 5 900 4 900 -1 000 -17% 200 5 100 -14%
EU 5 600 4 600 -1 000 -18% 200 4 800 -14%
India 1 100 800 -300 -27% 60 860 -22%
RSA 280 230 -50 -18% 10 240 -14%
USA 5 900 4 800 -1 100 -19% 220 5 020 -15%
RoW 24 300 18 800 -5 500 -23% 1 100 19 900 -18%
World 43 080 34 130 -8 950 -21% 1 790 35 920 -17%
CoNW MEPS + HL 2015
This scenario represents the potential energy saving if the highest current energy labels or MEPS levels were instantly applied to global energy use.
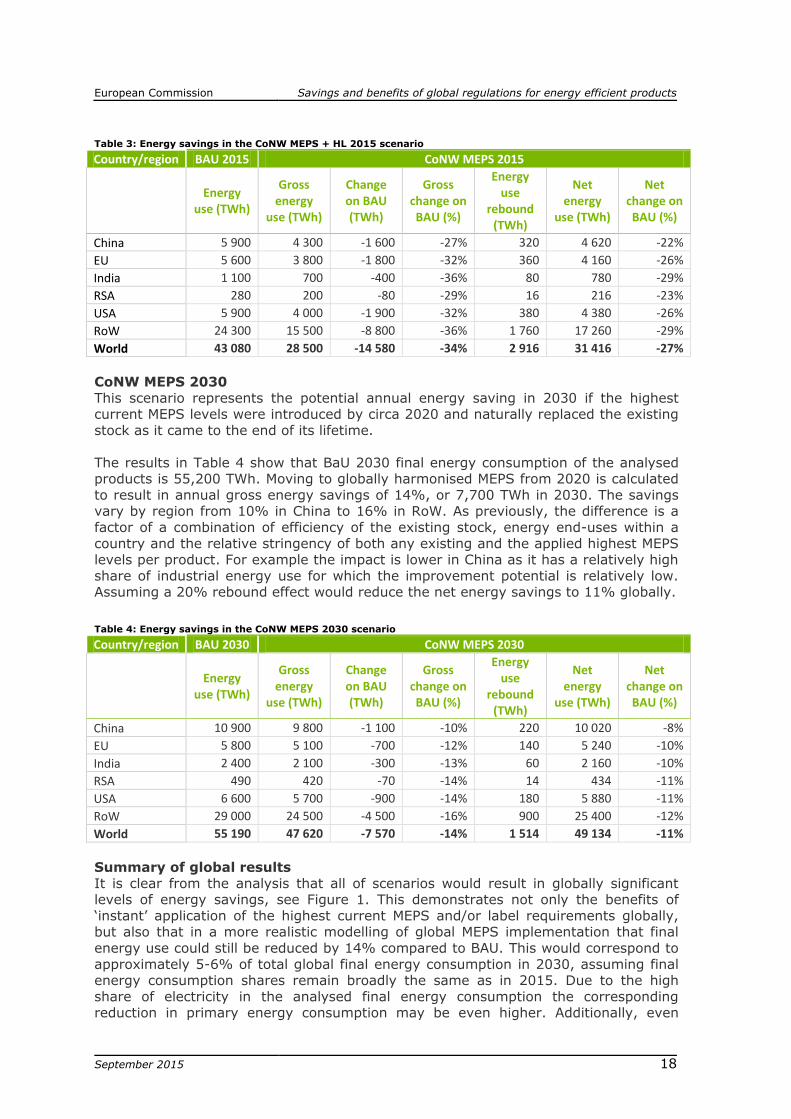
The results in Table 3 show that moving to globally harmonised efficiency
requirements set at the highest current Energy Labels or MEPS is calculated to result in gross energy savings of 34%, or 14,600 TWh. The savings vary by region from 27%
in China to 36% in India and the Rest of the World (RoW). In addition to the differences from the efficiency of existing stock levels described above, differences
also result from differing breakdowns of energy end-uses within a country and the
relative stringency of both any existing and the highest label (or MEPS) applied per product. This explains the ranges of impacts between China and India and RoW in this
case. Assuming a 20% rebound effect would reduce the net energy savings to 27% globally.
10 Calculation based on IEA (2015) Key world energy statistics 2014, total World FEC 2012 of 8,979 Mtoe
European Commission Savings and benefits of global regulations for energy efficient products
September 2015
c18
Table 3: Energy savings in the CoNW MEPS + HL 2015 scenario
Country/region BAU 2015 CoNW MEPS 2015
Energy
use (TWh)
Gross energy
use (TWh)
Change on BAU (TWh)
Gross change on BAU (%)
Energy use
rebound (TWh)
Net energy
use (TWh)
Net change on BAU (%)
China 5 900 4 300 -1 600 -27% 320 4 620 -22%
EU 5 600 3 800 -1 800 -32% 360 4 160 -26%
India 1 100 700 -400 -36% 80 780 -29%
RSA 280 200 -80 -29% 16 216 -23%
USA 5 900 4 000 -1 900 -32% 380 4 380 -26%
RoW 24 300 15 500 -8 800 -36% 1 760 17 260 -29%
World 43 080 28 500 -14 580 -34% 2 916 31 416 -27%
CoNW MEPS 2030
This scenario represents the potential annual energy saving in 2030 if the highest current MEPS levels were introduced by circa 2020 and naturally replaced the existing
stock as it came to the end of its lifetime.
The results in Table 4 show that BaU 2030 final energy consumption of the analysed products is 55,200 TWh. Moving to globally harmonised MEPS from 2020 is calculated
to result in annual gross energy savings of 14%, or 7,700 TWh in 2030. The savings vary by region from 10% in China to 16% in RoW. As previously, the difference is a
factor of a combination of efficiency of the existing stock, energy end-uses within a
country and the relative stringency of both any existing and the applied highest MEPS levels per product. For example the impact is lower in China as it has a relatively high
share of industrial energy use for which the improvement potential is relatively low. Assuming a 20% rebound effect would reduce the net energy savings to 11% globally.
Table 4: Energy savings in the CoNW MEPS 2030 scenario
Country/region BAU 2030 CoNW MEPS 2030
Energy
use (TWh)
Gross energy
use (TWh)
Change on BAU (TWh)
Gross change on BAU (%)
Energy use
rebound (TWh)
Net energy
use (TWh)
Net change on BAU (%)
China 10 900 9 800 -1 100 -10% 220 10 020 -8%
EU 5 800 5 100 -700 -12% 140 5 240 -10%
India 2 400 2 100 -300 -13% 60 2 160 -10%
RSA 490 420 -70 -14% 14 434 -11%
USA 6 600 5 700 -900 -14% 180 5 880 -11%
RoW 29 000 24 500 -4 500 -16% 900 25 400 -12%
World 55 190 47 620 -7 570 -14% 1 514 49 134 -11%
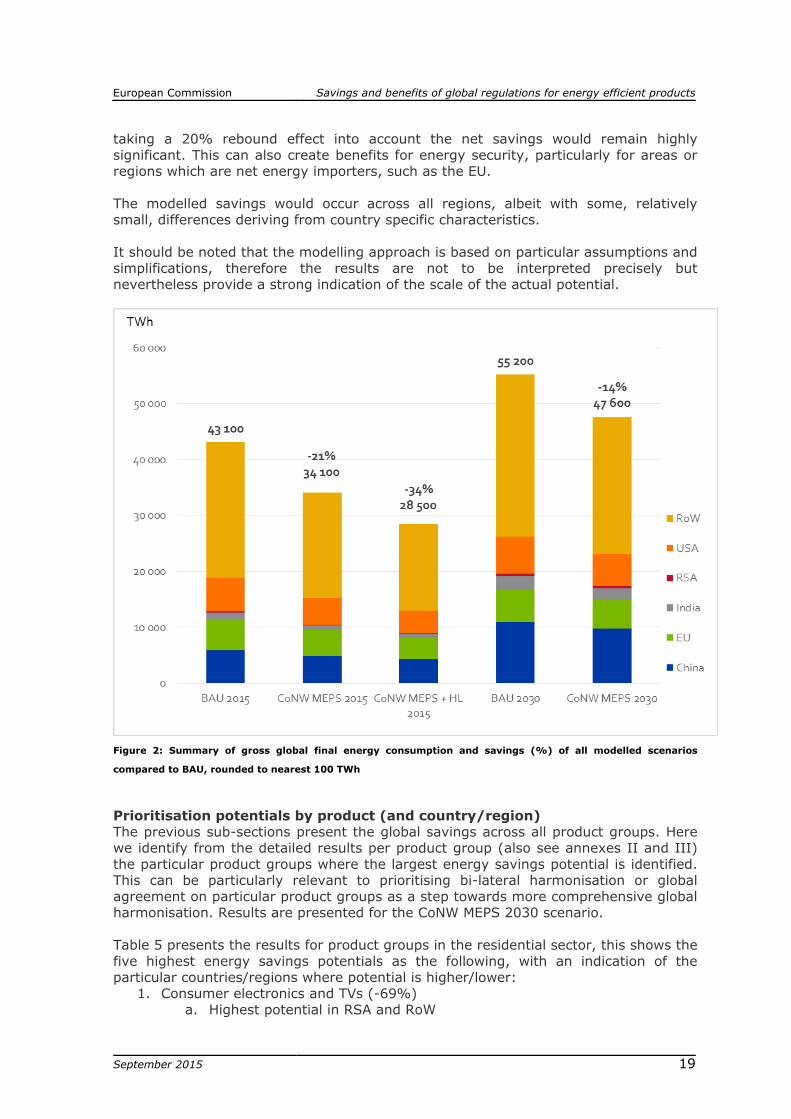
Summary of global results
It is clear from the analysis that all of scenarios would result in globally significant levels of energy savings, see Figure 1. This demonstrates not only the benefits of
‘instant’ application of the highest current MEPS and/or label requirements globally, but also that in a more realistic modelling of global MEPS implementation that final
energy use could still be reduced by 14% compared to BAU. This would correspond to
approximately 5-6% of total global final energy consumption in 2030, assuming final energy consumption shares remain broadly the same as in 2015. Due to the high
share of electricity in the analysed final energy consumption the corresponding reduction in primary energy consumption may be even higher. Additionally, even
European Commission Savings and benefits of global regulations for energy efficient products
September 2015
c19
taking a 20% rebound effect into account the net savings would remain highly
significant. This can also create benefits for energy security, particularly for areas or regions which are net energy importers, such as the EU.
The modelled savings would occur across all regions, albeit with some, relatively
small, differences deriving from country specific characteristics.
It should be noted that the modelling approach is based on particular assumptions and
simplifications, therefore the results are not to be interpreted precisely but nevertheless provide a strong indication of the scale of the actual potential.
Figure 2: Summary of gross global final energy consumption and savings (%) of all modelled scenarios
compared to BAU, rounded to nearest 100 TWh
Prioritisation potentials by product (and country/region)
The previous sub-sections present the global savings across all product groups. Here we identify from the detailed results per product group (also see annexes II and III)
the particular product groups where the largest energy savings potential is identified. This can be particularly relevant to prioritising bi-lateral harmonisation or global
agreement on particular product groups as a step towards more comprehensive global harmonisation. Results are presented for the CoNW MEPS 2030 scenario.
Table 5 presents the results for product groups in the residential sector, this shows the
five highest energy savings potentials as the following, with an indication of the
particular countries/regions where potential is higher/lower: 1. Consumer electronics and TVs (-69%)
a. Highest potential in RSA and RoW

European Commission Savings and benefits of global regulations for energy efficient products
September 2015
c20
b. Lower potential in EU and US
2. Circulator pumps (-48%) a. Even potential globally
3. Lighting (-44%) a. Highest potential in the RSA and RoW
b. Lowest potential in EU and China 4. ICT and Personal Computers (-40%)
a. Higher potentials in RSA and RoW
b. Lower potential in the EU and US 5. Refrigerators (-34%)
a. Highest potential in China, India, RSA and RoW b. Low potential in EU and US
These potentials correspond broadly to the gross energy saving potentials in TWh,
with the exceptions of circulator pumps where the total savings are relatively low and the thermal end-use products for heating and hot water, where even the savings of
14-15% translate into very large savings in TWh. In the case of heating this offers by
far the largest additional savings potential, with the potential a little lower than the global value in the EU and US, but higher in the other regions.
Table 5: Residential products potential energy savings in CoNW MEPS 2030 scenario (colour scale, greener =
larger relative saving potential)
Product group World
BAU 2030 (TWh)
CoNW MEPS 2030 (TWh)
Gross % change Gross change
(TWh)
Electric end-uses
Lighting 1 177 664 -44% -513
Electric (resistance/HPs) 891 797 -11% -94
Circ. Pumps 159 83 -48% -76
Ventilation 398 325 -18% -72
AC 1 495 1 289 -14% -206
Electric water heaters 912 835 -8% -77
Refrigerators 896 592 -34% -304
Clothes Washers 319 235 -26% -84
Clothes Dryers 160 126 -21% -34
Dishwashers 122 90 -26% -32
CE/TVs 1 392 426 -69% -966
ICT/PCs 563 338 -40% -224
Electric 426 391 -8% -35
Sub-total 8 908 6 191 -31% -2 717
Thermal end-uses
Heating 15 147 12 850 -15% -2 296
Hot Water 2 596 2 221 -14% -375
Cooking 846 792 -6% -54
Sub-total 18 589 15 863 -15% -2 726
Total 27 497 22 054 -20% -5 443
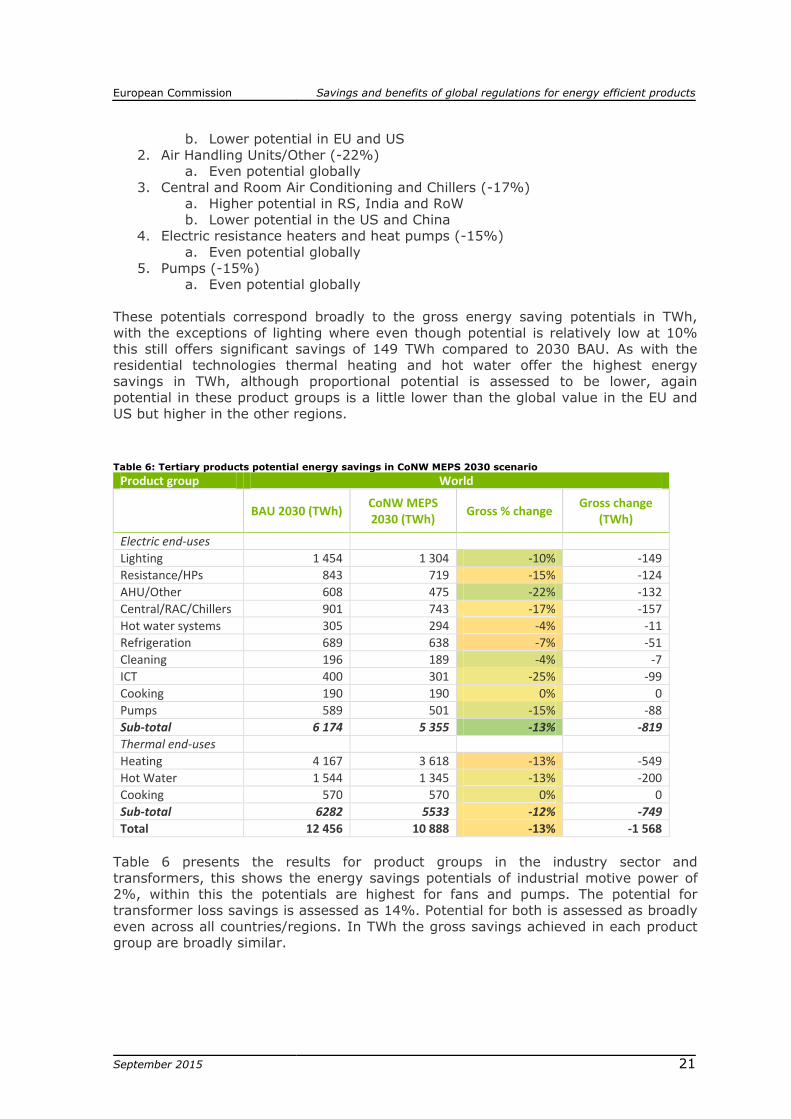
Table 6 presents the results for product groups in the tertiary (commercial and public)
sector, this shows the five highest energy savings potentials as the following, with an indication of the particular countries/regions where potential is higher/lower:
1. ICT (-25%) a. Higher potential in RSA and RoW
European Commission Savings and benefits of global regulations for energy efficient products
September 2015
c21
b. Lower potential in EU and US
2. Air Handling Units/Other (-22%) a. Even potential globally
3. Central and Room Air Conditioning and Chillers (-17%) a. Higher potential in RS, India and RoW
b. Lower potential in the US and China 4. Electric resistance heaters and heat pumps (-15%)
a. Even potential globally
5. Pumps (-15%) a. Even potential globally
These potentials correspond broadly to the gross energy saving potentials in TWh,
with the exceptions of lighting where even though potential is relatively low at 10% this still offers significant savings of 149 TWh compared to 2030 BAU. As with the
residential technologies thermal heating and hot water offer the highest energy savings in TWh, although proportional potential is assessed to be lower, again
potential in these product groups is a little lower than the global value in the EU and
US but higher in the other regions.
Table 6: Tertiary products potential energy savings in CoNW MEPS 2030 scenario
Product group World
BAU 2030 (TWh)
CoNW MEPS 2030 (TWh)
Gross % change Gross change
(TWh)
Electric end-uses
Lighting 1 454 1 304 -10% -149
Resistance/HPs 843 719 -15% -124
AHU/Other 608 475 -22% -132
Central/RAC/Chillers 901 743 -17% -157
Hot water systems 305 294 -4% -11
Refrigeration 689 638 -7% -51
Cleaning 196 189 -4% -7
ICT 400 301 -25% -99
Cooking 190 190 0% 0
Pumps 589 501 -15% -88
Sub-total 6 174 5 355 -13% -819
Thermal end-uses
Heating 4 167 3 618 -13% -549
Hot Water 1 544 1 345 -13% -200
Cooking 570 570 0% 0
Sub-total 6282 5533 -12% -749
Total 12 456 10 888 -13% -1 568
Table 6 presents the results for product groups in the industry sector and
transformers, this shows the energy savings potentials of industrial motive power of 2%, within this the potentials are highest for fans and pumps. The potential for
transformer loss savings is assessed as 14%. Potential for both is assessed as broadly
even across all countries/regions. In TWh the gross savings achieved in each product group are broadly similar.

European Commission Savings and benefits of global regulations for energy efficient products
September 2015
c22
Table 7: Industrial products potential energy savings in CoNW MEPS 2030 scenario
Product group World
BAU 2030
(TWh) CoNW MEPS 2030 (TWh)
Gross % change Gross change
(TWh)
Industry motive (electric) 13 563 13 286 -2% -278
Transformer losses 1 756 1 508 -14% -248
Total 15 319 14 793 -3% -526
On the basis of the product level analysis the most significant products
(proportionally) for energy savings all fall within the residential product groups, especially consumer electronics and TVs and lighting. In addition thermal products for
heating and hot water for both residential and commercial uses, while assessed to have relatively moderate efficiency increase potential, can produce the largest energy
savings in TWh of all products groups. This suggests that if maximum impact is sought
then these four product groups should be among those focused on for harmonisation.
3.1.2 Other environmental impacts
Key points:
Reducing energy use can have important environmental benefits: Energy use
has many negative environmental impacts associated with it, reducing energy use can
bring significant environmental benefits. This report has used a simplified life-cycle
approach to provide a broad order of magnitude estimate of the environmental
benefits that may result from the calculated energy savings. The results scale directly
in proportion to the energy savings. Results are presented gross, but even taking into
account a rebound effect of 20% would still leave significant environmental benefits.
In summary we calculate environmental benefits of: CoNW MEPS 2015: 20-21% reductions in all environmental impacts compared
to 2015 BAU
CoNW MEPS + HL 2015: 28-35% reductions in all environmental impacts compared to 2015 BAU
CoNW MEPS 2030: 13-14% reductions in all environmental impacts compared to a 2030 BAU
Note: significant caution should be taken in using these estimates, yet it is clear the
potential benefits are significant.
Climate change mitigation would be one of the most significant benefits: with
gross emissions reduction potential compared to baseline estimated alternately at
4,650 MtCO2e (CoNW MEPS 2015), 7,200 MtCO2e (CoNW MEPS +HL 2015) to
4,450 MtCO2e (CoNW MEPS 2030), or 10%, 15% and 7% respectively of total global
BAU GHG emissions.
Terrestrial acidification and particulate matter formation would also benefit:
reductions in energy use by appliances can have the most significant impact on total

European Commission Savings and benefits of global regulations for energy efficient products
September 2015
c23
global impacts in these areas. Benefits in other environmental aspects are also
positive but less significant globally.
The energy savings calculated above will naturally translate into reductions of
environmental damage resulting from energy production. This will impact upon the emissions of greenhouse gases (GHG) and also other emissions to land, water and air
as less energy generation is needed.
We use a simplified life-cycle analysis approach to estimate the scale of the
environmental benefits of the energy savings. This utilises the environmental impacts associated with use of the key fuels included the energy model. The environmental
impacts per use of a unit of fuel are sourced from the Ecoinvent dataset11, where we use the ReCiPe v1.11 life-cycle analysis framework12 to assess impacts on the following
environmental aspects (and units): Climate change (tonnes CO2 eq.)
Ozone depletion (kg CFC-11 eq.) Terrestrial acidification (kg SO2 eq.)
Freshwater eutrophication (kg P eq.)
Photochemical oxidant formation (kg NMVOC) Particulate matter formation (kg PM10 eq.)
Natural land transformation (m2) Water depletion (m3)
Metal depletion (kg Fe eq)
The database provides impacts on each of these aspects per MWh of each fuel used, with country specific entries used wherever these are available. Annex IV describes
these input values in more detail.
The impact values are multiplied by the known TWh savings as calculated by the
model and as presented in the previous section and annexes II and III to arrive at gross environmental benefits. An additional step is then taken to account for an
anticipated rebound in energy use as the money saved on energy use is re-spent elsewhere in the economy leading to growth in energy use (and environmental
impacts) in other sectors. This rebound effect does not consider any additional environmental impacts from the increased economic activity in the other sectors,
although in reality further negative environmental impacts could be expected. See Box
1 above.
Important notes: It should be noted that the impact factors that are used are underpinned by various scientific studies and assumptions, with some areas more
developed than others and some remaining areas of scientific debate and uncertainty – this should be kept in mind when interpreting the results presented below.
The highly simplified approach and broad assumptions means that the results provide
only order of magnitude estimates of potential environmental benefits and should not
be used as precise estimates. They will also not provide specific, deeper insights, i.e. it is not possible to indicate specifically where the land transformation or water depletion
is prevented, although it is clear that the geography is important to the actual end-benefit.
11 http://www.ecoinvent.org/database/database.html 12 http://www.lcia-recipe.net/
European Commission Savings and benefits of global regulations for energy efficient products
September 2015
c24
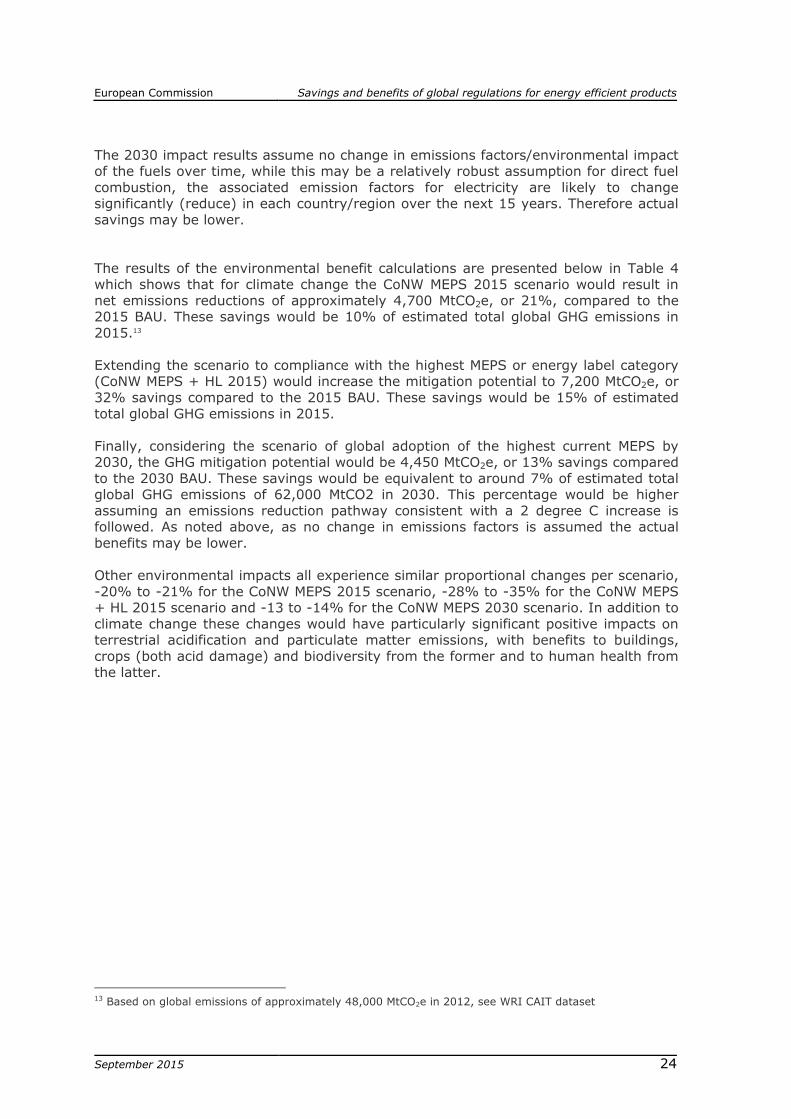
The 2030 impact results assume no change in emissions factors/environmental impact of the fuels over time, while this may be a relatively robust assumption for direct fuel
combustion, the associated emission factors for electricity are likely to change significantly (reduce) in each country/region over the next 15 years. Therefore actual
savings may be lower.
The results of the environmental benefit calculations are presented below in Table 4 which shows that for climate change the CoNW MEPS 2015 scenario would result in
net emissions reductions of approximately 4,700 MtCO2e, or 21%, compared to the 2015 BAU. These savings would be 10% of estimated total global GHG emissions in
2015.13
Extending the scenario to compliance with the highest MEPS or energy label category (CoNW MEPS + HL 2015) would increase the mitigation potential to 7,200 MtCO2e, or
32% savings compared to the 2015 BAU. These savings would be 15% of estimated
total global GHG emissions in 2015.
Finally, considering the scenario of global adoption of the highest current MEPS by 2030, the GHG mitigation potential would be 4,450 MtCO2e, or 13% savings compared
to the 2030 BAU. These savings would be equivalent to around 7% of estimated total global GHG emissions of 62,000 MtCO2 in 2030. This percentage would be higher
assuming an emissions reduction pathway consistent with a 2 degree C increase is followed. As noted above, as no change in emissions factors is assumed the actual
benefits may be lower.
Other environmental impacts all experience similar proportional changes per scenario,
-20% to -21% for the CoNW MEPS 2015 scenario, -28% to -35% for the CoNW MEPS + HL 2015 scenario and -13 to -14% for the CoNW MEPS 2030 scenario. In addition to
climate change these changes would have particularly significant positive impacts on terrestrial acidification and particulate matter emissions, with benefits to buildings,
crops (both acid damage) and biodiversity from the former and to human health from the latter.
13 Based on global emissions of approximately 48,000 MtCO2e in 2012, see WRI CAIT dataset

European Commission Savings and benefits of global regulations for energy efficient products
September 2015
c25
Table 9: Calculated gross environmental impacts of energy savings
Climate change
Ozone depletion
Terrestrial acidification
Photochemical oxidant
formation
Particulate matter
formation Natural land
transformation Water
depletion Metal
depletion
Mt CO2 eq kg CFC-11 eq Mt SO2 eq t NMVOC t PM10 eq ha million m3 t Fe eq
BAU 2015 22 515 1 333 586 124 56 215 850 35 079 282 269 494 42 624 177 083 729
% of 2000 global total 54% 1% 53% 16% 41% 4% - 7%
CoNW MEPS 2015 17 844 1 053 013 99 44 820 546 28 031 098 213 974 34 185 139 663 029
Change from BAU -4 671 -280 573 -25 -11 395 303 -7 048 184 -55 520 -8 439 -37 420 700
Change from BAU (%) -21% -21% -20% -20% -20% -21% -20% -21%
CoNW MEPS + HL 2015 15 312 865 510 87 39 167 847 24 654 024 178 887 30 797 116 892 139
Change from BAU -7 203 -468 076 -37 -17 048 003 -10 425 258 -90 608 -11 827 -60 191 590
Change from BAU (%) -32% -35% -30% -30% -30% -34% -28% -34%
BAU 2030 33 238 1 387 006 207 92 589 728 60 005 210 305 852 76 255 227 873 660
CoNW MEPS 2030 28 794 1 191 352 181 80 787 590 52 483 733 265 443 66 290 195 780 073
Change from BAU -4 444 -195 654 -27 -11 802 138 -7 521 478 -40 410 -9 964 -32 093 587
Change from BAU (%) -13% -14% -13% -13% -13% -13% -13% -14%
Note: the % of 2000 global total row provides contextual information on the share of the global impact that the BAU 2015 scenario would contribute. We understand
that comparing 2015 estimates to 2000 base information (based on the ReCiPe normalisation factors for year 200014) is far from ideal, given the likely significant
changes in the intervening period. Rather the purpose of the information is to show how relevant the energy savings the scenario would achieve are to this particular
impact. The key lesson is that the impacts on climate change, terrestrial acidification and particulate matter formation are particularly significant and where the
largest benefits will arise, while the beneficial impacts on the other aspects, and particularly ozone depletion and natural land transformation, are much less
important at the global level.
14 http://www.lcia-recipe.net/file-cabinet/LCA_ReCiPe_normalisation_2000_factors-revised_2010.zip?attredirects=0

European Commission Savings and benefits of global regulations for energy efficient products
September 2015
c26
3.2 Economic impacts
3.2.1 Economic impact of energy savings
Key points:
Energy efficiency brings economic benefits and increased welfare: greater
energy efficiency, as with efficiency in general, brings economic benefits as the increased efficiency enables increased production and/or consumption, increasing the
welfare of consumers. In the scenarios examined in this study greater energy efficiency delivers significant net energy savings, which can then be spent by
consumers on other things, increasing overall economic welfare. This already takes into account that appliances that are more energy efficient will cost more. These
additional costs are more than repaid by the energy savings.
In summary we calculate energy savings economic benefits of:
CoNW MEPS 2015: €310-470 billion per year, or 13-19% savings compared to 2015 BAU
CoNW MEPS + HL 2015: €490-730 billion per year, or 20-29% savings compared to 2015 BAU
CoNW MEPS 2030: €280-410 billion per year, or 8-13% savings compared to a 2030 BAU
Energy savings can influence economic structure and have important impacts on trade: as money is spent outside the energy sector and elsewhere in the economy
the relative share of the energy sector in the economy will reduce. There are likely to be benefits for the appliance manufacture sector, which will be beneficial for the EU.
In addition regions, such as the EU, which are major energy importers are likely to see improved trade balances as less energy imports are required. Although understanding
the full impacts is too complex to fully explore here.
Economic savings can also be achieved by others: global implementation can
help spread the costs across more players, reducing the costs for all and avoiding inefficiencies from parallel or duplicate approaches. Sharing information can also help
to save costs in testing, compliance and enforcement as well as in policymaking.
Energy efficiency is almost always economically beneficial as it leads to more efficient consumption (and production) in an economy, which improves the economic welfare of
consumers. A recent study15 points to net benefit:cost ratios of existing MEPS and
labelling in the order of 3:1 or 4:1 highlighting the overall benefit of energy saving.
Based on the modelling of energy savings we are able to make an estimate of the economic benefits resulting from increased efficiency. This is achieved by multiplying
the calculated savings by relevant energy prices per fuel, country/region and sector. A cost premium for the more efficient products is subtracted from the savings,
representing the higher up-front costs of more efficient products. It was not possible to identify existing work into price premiums for MEPS compliant products across the
full range of appliances and MEPS we consider in this study. For these reasons we
revert to, what we believe is, a conservative assumption of a 25% premium. This
15 IEA4E (2015) Achievements of appliance energy efficiency standards and labelling programs: a global
assessment

European Commission Savings and benefits of global regulations for energy efficient products
September 2015
c27
assumption was also previously used in other work16 and remains consistent with the
cost:benefit ratios descried above. The savings are presented in a +/- 20% range from those calculated, given the potential uncertainties in prices, particularly for the
rest of the world.
Important note: given the inherent uncertainties in the calculations the following results should be treated as estimates of the potential order of magnitude of the
energy savings rather than precise estimates.
The results of the calculation are presented below in Table 5 which shows that compared to global energy costs of more than €2.5 trillion in 2015 the instant
compliance of all appliances to the current highest MEPS could save between €310-470 billion per year, or 13-19% savings. The savings would be worth
€50-75 billion per year to the EU.
Extending the scenario to compliance with the highest MEPS or energy label category
would increase the savings to €490-730 billion, or 20-29% of current energy expenditure. The savings in this scenario would be €90-140 billion to the EU.
Finally, considering the scenario of global adoption of the highest current MEPS by
2030, the savings are calculated at €280-410 billion, or 8-13% savings on estimated global energy use of €3.3 trillion per year. These savings are estimated on the basis of
2015 energy prices, assuming that in reality energy prices will increase the actual savings would be higher, although we would expect the calculated percentage changes
to remain representative.
Table 10: Estimated economic impact of global harmonisation of MEPS and energy labelling requirements
Gross energy costs - BAU
Net change in costs - low
Net change in costs - high
Net change in costs - low
Net change in costs - high
billion euros billion euros billion euros as % of BAU as % of BAU
CoNW MEPS 2015
China 307 -29 -44 -9% -14%
EU 478 -50 -74 -10% -15%
India 86 -12 -18 -14% -21%
RSA 9 -1 -2 -11% -22%
USA 322 -42 -62 -13% -19%
RoW 1 293 -180 -269 -14% -21%
World 2 495 -314 -469 -13% -19%
CoNW MEPS + HL 2015
China 307 -43 -65 -14% -21%
EU 478 -90 -135 -19% -28%
India 86 -18 -27 -21% -31%
RSA 9 -2 -2 -22% -22%
USA 322 -65 -98 -20% -30%
RoW 1 293 -270 -405 -21% -31%
World 2 495 -488 -732 -20% -29%
16 Ecofys (2012) Economic benefits of Ecodesign

European Commission Savings and benefits of global regulations for energy efficient products
September 2015
c28
Gross energy costs - BAU
Net change in costs - low
Net change in costs - high
Net change in costs - low
Net change in costs - high
billion euros billion euros billion euros as % of BAU as % of BAU
CoNW MEPS 2030
China 640 -35 -52 -5% -8%
EU 510 -37 -55 -7% -11%
India 212 -18 -26 -9% -12%
RSA 16 -1 -2 -6% -12%
USA 369 -33 -49 -9% -13%
RoW 1 535 -153 -230 -10% -15%
World 3 282 -277 -414 -8% -13%
As noted above these energy savings will be re-spent by consumers, either in terms of
increased use of the appliance (the rebound effect) or in the wider economy,
increasing overall welfare. This change in spending can lead to structural economic change, most directly reducing the income of the energy sector while increasing the
income of the appliance manufacturing sector. These changes would be largely beneficial to the EU as a net energy importer and major producer of energy efficient
appliances.
Beyond the direct effects, the indirect increase in consumption will also lead to increasing consumption of services across the whole economy. This will have knock-on
effects on the macro-economy and trade balances. Although the savings are primarily
of electricity and therefore will impact most on imports of gas, coal and other fuels, and less so oil, which is by far the most important energy carrier in global trade. It is
not possible here to quantify the scale or direction (positive or negative) of such impacts. This can be an interesting subject for future research, particularly given the
various knock-on effects of such changes on energy markets and prices.
For implementing authorities a globalised approach can also help to reduce costs of market verification, standardisation and testing, and enforcement. By aligning
activities, development costs and sharing information the benefits can be experienced
by all, reducing inefficiencies from parallel or duplicate approaches, and costs can be spread across more players, reducing the costs for all. The benefits would include
enabling the quicker comparison of the performance of equivalent products between countries and regions, and comparison of policies and their impacts. Policymakers
could then also transpose and adapt analyses from other markets to determine appropriate domestic efficiency requirements, reducing the cost of policy making.
3.2.2 Impact on employment
Key points:
Economic savings will have a positive net employment impact: the economic savings from greater energy efficiency will translate into impacts on the energy sector
and wider economy as spending on the former is reduced and most of the reduction is then re-spent in the latter. The relative labour intensity of the two sectors is such that
this is likely to result in job creation, as the wider economy employs more people per unit of turnover than the energy sector, which is more capital intensive.
In summary we calculate net employment benefits of: CoNW MEPS 2015: 1.8-2.8 million additional jobs compared to 2015 BAU
CoNW MEPS + HL 2015: 2.8-4.2 million additional jobs compared to 2015 BAU
European Commission Savings and benefits of global regulations for energy efficient products
September 2015
c29
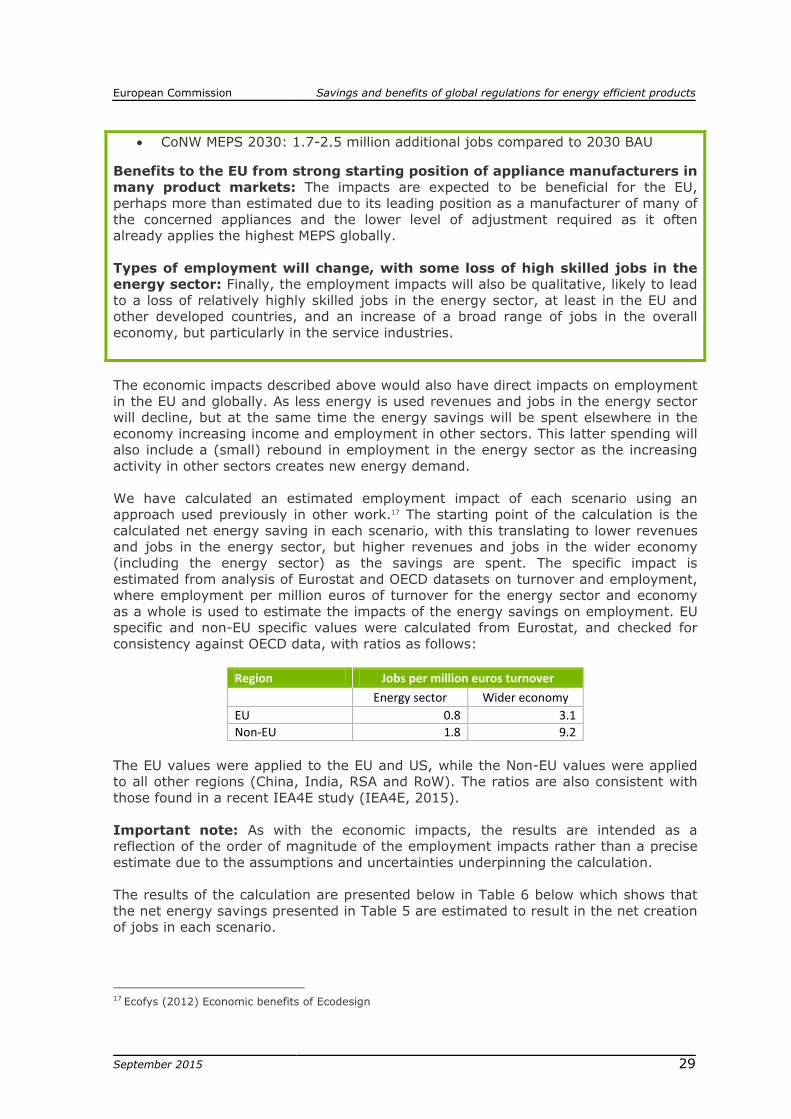
CoNW MEPS 2030: 1.7-2.5 million additional jobs compared to 2030 BAU
Benefits to the EU from strong starting position of appliance manufacturers in
many product markets: The impacts are expected to be beneficial for the EU, perhaps more than estimated due to its leading position as a manufacturer of many of
the concerned appliances and the lower level of adjustment required as it often already applies the highest MEPS globally.
Types of employment will change, with some loss of high skilled jobs in the energy sector: Finally, the employment impacts will also be qualitative, likely to lead
to a loss of relatively highly skilled jobs in the energy sector, at least in the EU and other developed countries, and an increase of a broad range of jobs in the overall
economy, but particularly in the service industries.
The economic impacts described above would also have direct impacts on employment
in the EU and globally. As less energy is used revenues and jobs in the energy sector will decline, but at the same time the energy savings will be spent elsewhere in the
economy increasing income and employment in other sectors. This latter spending will also include a (small) rebound in employment in the energy sector as the increasing
activity in other sectors creates new energy demand.
We have calculated an estimated employment impact of each scenario using an approach used previously in other work.17 The starting point of the calculation is the
calculated net energy saving in each scenario, with this translating to lower revenues
and jobs in the energy sector, but higher revenues and jobs in the wider economy (including the energy sector) as the savings are spent. The specific impact is
estimated from analysis of Eurostat and OECD datasets on turnover and employment, where employment per million euros of turnover for the energy sector and economy
as a whole is used to estimate the impacts of the energy savings on employment. EU specific and non-EU specific values were calculated from Eurostat, and checked for
consistency against OECD data, with ratios as follows:
Region Jobs per million euros turnover
Energy sector Wider economy
EU 0.8 3.1
Non-EU 1.8 9.2
The EU values were applied to the EU and US, while the Non-EU values were applied to all other regions (China, India, RSA and RoW). The ratios are also consistent with
those found in a recent IEA4E study (IEA4E, 2015).
Important note: As with the economic impacts, the results are intended as a reflection of the order of magnitude of the employment impacts rather than a precise
estimate due to the assumptions and uncertainties underpinning the calculation.
The results of the calculation are presented below in Table 6 below which shows that
the net energy savings presented in Table 5 are estimated to result in the net creation of jobs in each scenario.
17 Ecofys (2012) Economic benefits of Ecodesign
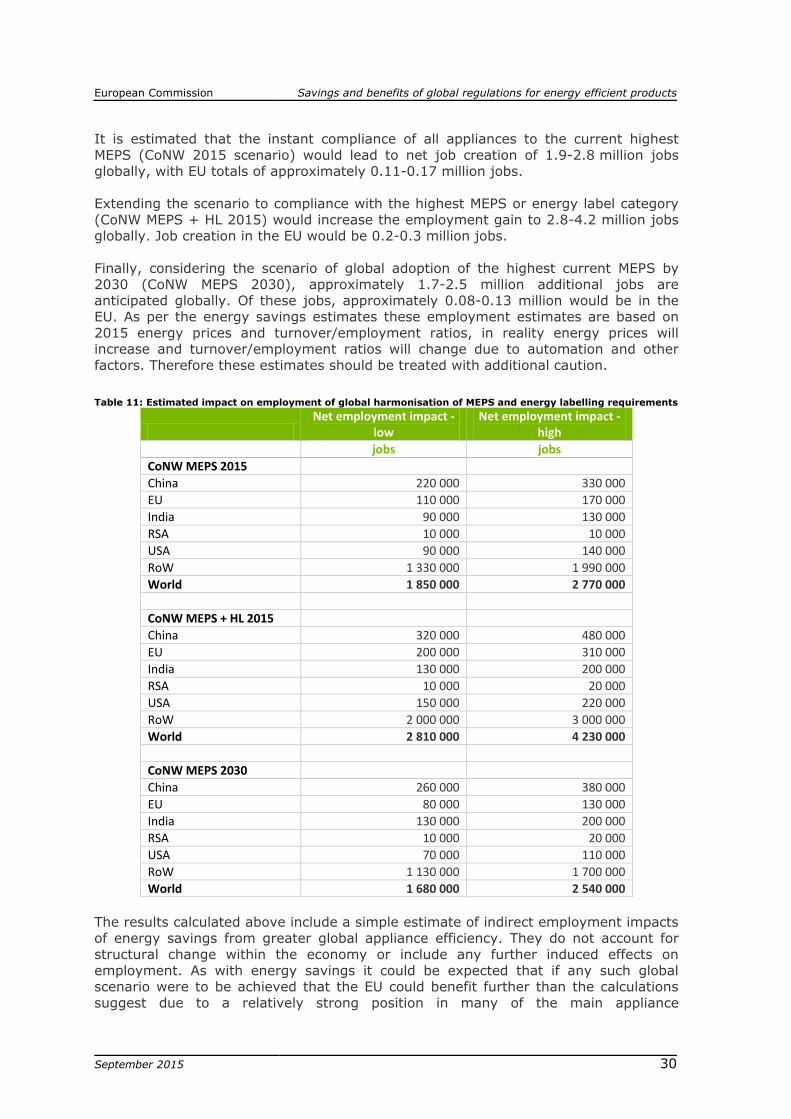
European Commission Savings and benefits of global regulations for energy efficient products
September 2015
c30
It is estimated that the instant compliance of all appliances to the current highest
MEPS (CoNW 2015 scenario) would lead to net job creation of 1.9-2.8 million jobs globally, with EU totals of approximately 0.11-0.17 million jobs.
Extending the scenario to compliance with the highest MEPS or energy label category
(CoNW MEPS + HL 2015) would increase the employment gain to 2.8-4.2 million jobs globally. Job creation in the EU would be 0.2-0.3 million jobs.
Finally, considering the scenario of global adoption of the highest current MEPS by 2030 (CoNW MEPS 2030), approximately 1.7-2.5 million additional jobs are
anticipated globally. Of these jobs, approximately 0.08-0.13 million would be in the EU. As per the energy savings estimates these employment estimates are based on
2015 energy prices and turnover/employment ratios, in reality energy prices will increase and turnover/employment ratios will change due to automation and other
factors. Therefore these estimates should be treated with additional caution.
Table 11: Estimated impact on employment of global harmonisation of MEPS and energy labelling requirements
Net employment impact -
low Net employment impact -
high
jobs jobs
CoNW MEPS 2015
China 220 000 330 000
EU 110 000 170 000
India 90 000 130 000
RSA 10 000 10 000
USA 90 000 140 000
RoW 1 330 000 1 990 000
World 1 850 000 2 770 000
CoNW MEPS + HL 2015
China 320 000 480 000
EU 200 000 310 000
India 130 000 200 000
RSA 10 000 20 000
USA 150 000 220 000
RoW 2 000 000 3 000 000
World 2 810 000 4 230 000
CoNW MEPS 2030
China 260 000 380 000
EU 80 000 130 000
India 130 000 200 000
RSA 10 000 20 000
USA 70 000 110 000
RoW 1 130 000 1 700 000
World 1 680 000 2 540 000
The results calculated above include a simple estimate of indirect employment impacts of energy savings from greater global appliance efficiency. They do not account for
structural change within the economy or include any further induced effects on
employment. As with energy savings it could be expected that if any such global scenario were to be achieved that the EU could benefit further than the calculations
suggest due to a relatively strong position in many of the main appliance

European Commission Savings and benefits of global regulations for energy efficient products
September 2015
c31
manufacturing industries and a headstart on innovation and meeting current highest
MEPS.
The impact on employment would not only be quantitative, but it would also be qualitative, as the jobs that are lost will not be the same as those that are gained. The
jobs lost in the energy sector are likely to be relatively high skilled and high paid compared to those gained, which are more likely to be in the service sectors of the
economy as savings are spent on consumption activities. This will have an impact on
the labour and skills demand within each economy, and potentially also on average salary levels.
3.2.3 Impact on trade, including technical barriers to trade
Key points:
Lack of harmonised MEPS presents a trade barrier: Significant investment in bilateral trade negotiations to reduce barriers to trade mean that free trade agreements (FTAs) pending or in place are on track to cover over two thirds of EU exports. As tariff barriers to trade such as import duties are dismantled, negotiators' agendas shift to the non-tariff or 'technical barriers to trade'. These barriers are more difficult to address than tariffs and technical regulations. An important element of these is consistency of standards for energy efficiency (in terms of both MEPS and testing methods), as viewed by EU business and also by businesses in other countries facing EU regulations.
Potential EU benefits of product policy on trade: Studies suggest that the EU is in a strong position to gain economically from its investment in Ecodesign and labelling policy. Amongst the top ten EU trade partners, countries accounting for over 50% of EU exports have energy efficiency product regulations that are strongly aligned with those of the EU. Most of the other major trading partners are engaged in free trade negotiations that should facilitate influence on regulations, MEPS and standards.
Working towards harmonisation under trade agreements: Ecodesign and environmental labelling harmonisation has to fit within international trade agreements. In most cases, these do provide political and technical means to make progress on harmonisation. For example the draft EU/US Transatlantic Trade and Investment Partnership (TTIP) specifically address the better alignment of technical regulations. However trade agreements can also act to constrain how harmonisation is achieved. For example:
under WTO rules, no country is allowed to use trade measures to force a
country to adopt environmental regulations in line with its own; labelling schemes must not discriminate between trading partner countries and
not favour locally produced products over imports; yet to be resolved is whether regulations are allowed to specify whether the
method of manufacture can be included in the scope of a regulatory specification.
These barriers undoubtedly impact SMEs far more than larger multinationals that have the resources to handle certification administration and to influence the development process for the standards to protect their interests. Trade agreements as a driver for harmonisation: Harmonisation of technical regulations has risen high on the agenda of trade agreement negotiators, now that most tariff barriers have been dismantled. Regulations for energy efficiency have an important and high profile role in this. Trade agreements like TTIP could provide the driver for greater harmonisation – but the key to upholding environmental outcomes will be ensuring that these harmonised levels are appropriately ambitious and do not settle at the lowest common level.
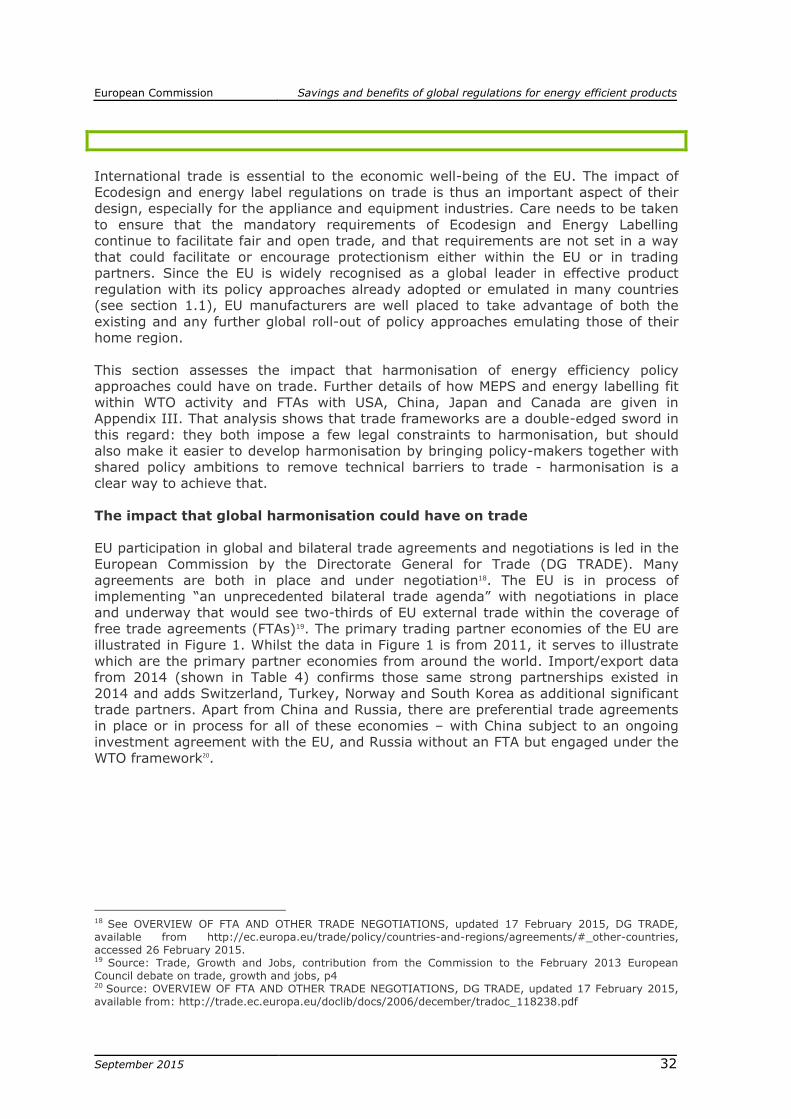
European Commission Savings and benefits of global regulations for energy efficient products
September 2015
c32
International trade is essential to the economic well-being of the EU. The impact of Ecodesign and energy label regulations on trade is thus an important aspect of their
design, especially for the appliance and equipment industries. Care needs to be taken
to ensure that the mandatory requirements of Ecodesign and Energy Labelling continue to facilitate fair and open trade, and that requirements are not set in a way
that could facilitate or encourage protectionism either within the EU or in trading partners. Since the EU is widely recognised as a global leader in effective product
regulation with its policy approaches already adopted or emulated in many countries (see section 1.1), EU manufacturers are well placed to take advantage of both the
existing and any further global roll-out of policy approaches emulating those of their home region.
This section assesses the impact that harmonisation of energy efficiency policy approaches could have on trade. Further details of how MEPS and energy labelling fit
within WTO activity and FTAs with USA, China, Japan and Canada are given in Appendix III. That analysis shows that trade frameworks are a double-edged sword in
this regard: they both impose a few legal constraints to harmonisation, but should also make it easier to develop harmonisation by bringing policy-makers together with
shared policy ambitions to remove technical barriers to trade - harmonisation is a clear way to achieve that.
The impact that global harmonisation could have on trade
EU participation in global and bilateral trade agreements and negotiations is led in the European Commission by the Directorate General for Trade (DG TRADE). Many
agreements are both in place and under negotiation18. The EU is in process of implementing “an unprecedented bilateral trade agenda” with negotiations in place
and underway that would see two-thirds of EU external trade within the coverage of free trade agreements (FTAs)19. The primary trading partner economies of the EU are
illustrated in Figure 1. Whilst the data in Figure 1 is from 2011, it serves to illustrate
which are the primary partner economies from around the world. Import/export data from 2014 (shown in Table 4) confirms those same strong partnerships existed in
2014 and adds Switzerland, Turkey, Norway and South Korea as additional significant trade partners. Apart from China and Russia, there are preferential trade agreements
in place or in process for all of these economies – with China subject to an ongoing investment agreement with the EU, and Russia without an FTA but engaged under the
WTO framework20.
18 See OVERVIEW OF FTA AND OTHER TRADE NEGOTIATIONS, updated 17 February 2015, DG TRADE,
available from http://ec.europa.eu/trade/policy/countries-and-regions/agreements/#_other-countries,
accessed 26 February 2015.
19 Source: Trade, Growth and Jobs, contribution from the Commission to the February 2013 European
Council debate on trade, growth and jobs, p4
20 Source: OVERVIEW OF FTA AND OTHER TRADE NEGOTIATIONS, DG TRADE, updated 17 February 2015,
available from: http://trade.ec.europa.eu/doclib/docs/2006/december/tradoc_118238.pdf
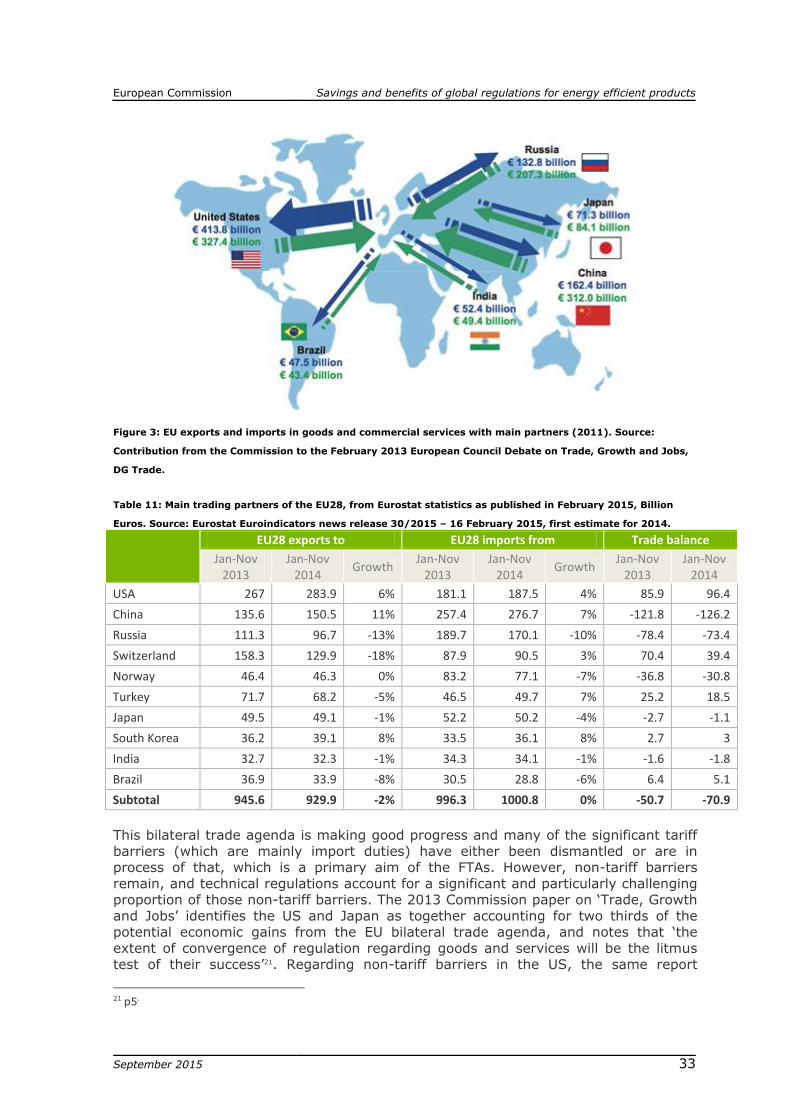
European Commission Savings and benefits of global regulations for energy efficient products
September 2015
c33
Figure 3: EU exports and imports in goods and commercial services with main partners (2011). Source:
Contribution from the Commission to the February 2013 European Council Debate on Trade, Growth and Jobs,
DG Trade.
Table 11: Main trading partners of the EU28, from Eurostat statistics as published in February 2015, Billion
Euros. Source: Eurostat Euroindicators news release 30/2015 – 16 February 2015, first estimate for 2014.
EU28 exports to EU28 imports from Trade balance
Jan-Nov 2013
Jan-Nov 2014
Growth Jan-Nov
2013 Jan-Nov
2014 Growth
Jan-Nov 2013
Jan-Nov 2014
USA 267 283.9 6% 181.1 187.5 4% 85.9 96.4
China 135.6 150.5 11% 257.4 276.7 7% -121.8 -126.2
Russia 111.3 96.7 -13% 189.7 170.1 -10% -78.4 -73.4
Switzerland 158.3 129.9 -18% 87.9 90.5 3% 70.4 39.4
Norway 46.4 46.3 0% 83.2 77.1 -7% -36.8 -30.8
Turkey 71.7 68.2 -5% 46.5 49.7 7% 25.2 18.5
Japan 49.5 49.1 -1% 52.2 50.2 -4% -2.7 -1.1
South Korea 36.2 39.1 8% 33.5 36.1 8% 2.7 3
India 32.7 32.3 -1% 34.3 34.1 -1% -1.6 -1.8
Brazil 36.9 33.9 -8% 30.5 28.8 -6% 6.4 5.1
Subtotal 945.6 929.9 -2% 996.3 1000.8 0% -50.7 -70.9
This bilateral trade agenda is making good progress and many of the significant tariff
barriers (which are mainly import duties) have either been dismantled or are in process of that, which is a primary aim of the FTAs. However, non-tariff barriers
remain, and technical regulations account for a significant and particularly challenging proportion of those non-tariff barriers. The 2013 Commission paper on ‘Trade, Growth
and Jobs’ identifies the US and Japan as together accounting for two thirds of the potential economic gains from the EU bilateral trade agenda, and notes that ‘the
extent of convergence of regulation regarding goods and services will be the litmus test of their success’21. Regarding non-tariff barriers in the US, the same report
21 p5.
European Commission Savings and benefits of global regulations for energy efficient products
September 2015
c34
explains that "these barriers are more difficult [for policy-makers] to address than
tariffs, especially in formal agreements, as they are based on different approaches to regulation, often deeply rooted in historic or societal approaches and political
realities".
US industry also has concerns about EU regulations, particularly for SMEs: a 2014 report from the US International Trade Commission focused on the plight of US SMEs
and cites "numerous EU trade barriers, particularly standards-related measures [that]
limit SMEs' exports to the EU more than those of large exporters"22. More specifically, "SMEs producing machinery, electronic, transportation, and other goods cited a lack of
harmonised international standards and mutual recognition for conformity assessment, as well as problems complying with technical regulations and conformity
assessment procedures".
The situation in the Japanese market is worse for trade and presents, according to the European Commission, "serious non-tariff barriers in the form of discriminatory
regulations, unique standards, anti-competitive behaviour" resulting in the situation
that "Japan has one of the lowest import penetration rates of any country in the OECD (6% or one fifth of the OECD average)"23. These challenges to trade arising from
product standards and MEPS are reflected clearly in the section of this report on ‘Barriers to harmonisation’ (section 4).
These challenges to trade do not only refer to environmental and energy efficiency
regulations of course, but these constitute a significant part of the challenge and are the focus of this study. In this regard, not only do all of the trading partners identified
in Figure 2 and Table 11 have well-established or rapidly emerging systems of energy
efficiency related technical standards for appliances and equipment, but Russia, Brazil, Turkey and China (which account for just over 50% of the EU exports of Table 11)
already have standards and MEPS ‘strongly aligned’ with the EU. Progress on global alignment of MEPS with the EU standards is summarised in Figure 2.
22 Trade Barriers That U.S. Small and Medium-sized Enterprises Perceive as Affecting Exports to the
European Union, Investigation No. 332-541, Publication 4455, March 2014. 23 Source: Trade, Growth and Jobs, contribution from the Commission to the February 2013 European
Council debate on trade, growth and jobs, p6.

European Commission Savings and benefits of global regulations for energy efficient products
September 2015
c35
Figure 4: Countries with MEPS and degree of alignment with EU per country (Source: Impacts of the EU’s
Ecodesign and Energy/Tyre labelling legislation on third jurisdictions, Final Report for DG ENER, Ecofys, 30
April 2014, p4]
There is still work to be done on harmonisation with these countries too, but prospects
are good. Progress for the other key trading partners is listed below: United States: TTIP aims to set up the political and technical mechanisms to
bring closer alignment with the US; India: FTA negotiations are in progress;
Japan: Japan’s technical regulations remain significantly out of step with those
of the EU; Russia: Development of technical regulation is to a large extent modelled on
the EU, but is fragmentary and is likely to be exploited to protect Russian industry interests, although Russia’s accession to the WTO in 2012 provides at
least a mechanism to address major concerns.
A world in which technical standards for energy efficiency were globally harmonised would bring the following specific benefits to trade for businesses large and small:
1. Transparency of performance between markets for strategic planning;
2. Lower cost of compliance in terms of product testing to only one harmonised standard;
3. Reduced barriers to market entry and so faster growth of export markets (which also facilitates competition and stimulates innovation - see later
sections) 4. Easier path to reciprocal recognition of certification to build trust in new
products.
These benefits are illustrated hypothetically in Box 4.
European Commission Savings and benefits of global regulations for energy efficient products
September 2015
c36
Box 4: Hypothetical benefits to trade and competitiveness of globally harmonised technical standards (entirely
fictitious, but illustrating potential benefits)
At some point in the future.......Now that globally harmonised product efficiency standards are established, the (hypothetical) Amethyst Trading, manufacturer of
electric refrigerators based in Mauritius, is making its export plans and finds that: A quick check of MEPS published in Canada against its own registered product
performance data shows that its products can meet the requirements. The
standards are almost completely comparable, once Amethyst's volumes in litres are converted to cubic feet as in Canada; and also the standards include
conversion figures between an ambient operating temperature of 32°C, as used in Mauritius, and for 22°C as used in Canada.
The certification body operating in sub-Saharan Africa, of which Amethyst is a member, has a reciprocal agreement with the body in Canada and so products
can quote the Canadian endorsement in advertising their products and so quickly build customer trust in their products (requirements are transparent
between the two countries and posed no problem for comparison and the
certification bodies have already established common verification procedures acceptable to both).
Amethyst has invested in product testing for all of its main products, at considerable expense as there was no suitable test house in Mauritius itself,
but the results are fully understood and recognised by their agents in Canada and no additional testing is required. This is saving Amethyst tens of thousands
of dollars in testing per new target economy, compared with their attempts to export before harmonisation was secured.
A competitor in the Australian market had challenged an Amethyst efficiency
label claim, but check-testing by the Australians proved the label correct. That positive result is shared by enforcement authorities around the world and so
the product's clean record is already on file in Canada.
Harmonisation of technical regulations for energy efficiency and Ecodesign thus has a key role to play in developing world trade as viewed from within and outside of the
EU, and there are evident political and technical opportunities for making good
progress. Trade agreements like TTIP could provide the driver for greater harmonisation, but the key to securing environmental gains will be ensuring that these
harmonised levels are appropriately ambitious and do not adopt the lowest common approach. A summary of potential opportunities within current trade frameworks are
presented in Annex V to this report. It should also be noted that DG CLIMA, cooperating with DG TRADE, is currently undertaking a study in the area of ‘Fostering
Climate Action through Trade-Related Policy Instruments’ which is considering greater global harmonisation of product MEPS and standards as one of a number of options for
achieving climate goals.
3.2.4 Competitiveness of industry
Key points:
Harmonisation will affect the competitiveness of firms in different ways: the harmonisation of performance and labelling requirements is likely to affect the range
of market players differently for each product group. International Original Equipment Manufacturers (OEMs) are likely to be least affected, whilst large manufacturers and
SMEs operating at a national level in previously unregulated markets are likely to feel
European Commission Savings and benefits of global regulations for energy efficient products
September 2015
c37
most impact, particularly where there is ‘imperfect’ market competition or a disparity in the cost impacts of regulations or labels between market players.
Aspects of competitiveness likely to be influenced by globally-harmonised product
efficiency and labelling requirements include: Cost of manufacture: Lower prices for efficient components due to economies
of scale.
Labelling and MEPS compliance: Reduced compliance costs to international manufacturers and market surveillance authorities. Some increased cost
possible for local producers in previously unregulated markets. Important that market surveillance is consistently implemented to ensure compliance.
Product price: A potential shift in market share from cheaper less efficient products toward higher value products justified (to the customer) by reduced
running costs. If there are additional manufacture or compliance costs, these are unlikely to be passed on to the consumer.
Markets: Access to new markets for already energy efficient European
products. A level playing field for all competitors, preventing ‘free riders’. A drive for manufacturers in previously unregulated markets to shift to efficient
technologies supported by the security of consumer demand.
Proving adequate adjustment time is important to mitigate any negative competitiveness impacts: The most important consideration in terms of limiting any
negative impacts of harmonisation on competitiveness is the timing of the implementation of requirements. Companies whose products would not currently meet
the level of ambition for globally harmonised mandatory requirements will require
implementation dates that allow sufficient time for design and production adaptations to be made. This would enable the manufacturers to minimise costs by integrating
design and manufacturing changes into normal industrial cycles.
The following sections discuss such considerations in more detail.
Cost of manufacture
Increased and wider demand for efficient components over cheaper less-efficient alternatives is likely to broaden supply and drive down the price of these components
(even for manufacturers already using them) due to economies of scale. Investments in new technologies will be more secure due to the transparent legislative framework.
In addition, global improvements in energy efficiency will, in general, result in savings in household energy expenditure, reducing emissions and pressures on energy supply
and ensuring greater energy security for manufacturers24.
Compliance costs
There are various compliance costs that may be incurred as a result of the
harmonisation of regulatory efficiency requirements and energy labelling: Costs for changes to product platforms to comply with harmonised
efficiency requirements: These would not be incurred for Original Equipment Manufacturers (OEMs) already operating in markets where the efficiency
requirements for global roll out are already applied. For other manufacturers, costs
24 Coolproducts estimates that carbon dioxide emissions mitigated could be 56 million tonnes of oil
equivalent, enough to offset the energy consumed by 200 large coal power stations, or from 150 million
cars. www.coolproduts.eu/infographics
European Commission Savings and benefits of global regulations for energy efficient products
September 2015
c38
could be in the range of €50,000 to €100,000 or 5 to 10% of annual turnover
although there is some indication that such costs have been previously overstated and that they may represent “necessary changes to production that can often be
part of firms’ on-going efforts to develop better, more efficient and more environmentally friendly products”25. If implementation dates take into account sufficient time for design and production adaptations to be made, this can minimise costs by enabling manufacturers to
integrate design and manufacturing changes into their normal industrial cycles.
Per-unit product costs of compliance: These would be minimal, incurred by manufacturers operating in previously unregulated markets (up to €10/unit max),
and reducing over time due to the economies of scale of global harmonisation. Harmonisation would enable a reduced number of different labels and markings, a
decrease in supporting documentation costs, and facilitate more coherent marketing of energy efficiency features of products.
Testing and certification costs: There would be compliance cost savings of harmonised test approaches for companies operating in multiple countries, as
manufacturers could potentially test a product in one region and sell in another
region (as long as the issue of different voltage-current combinations was addressed). This could also foster improved competition26. However, in some cases
it may also be necessary to test for other factors such as climatic differences for heating and cooling appliances. Costs for the development and maintenance of
relevant documentation would be comparable with other environmental legislation. There would be savings for companies operating in multiple countries due to the
need to produce basic information only once, although it may still need to be translated into a range of languages.
Market surveillance authority testing costs: Due to the harmonisation of testing
approaches and regulatory requirements, previously unregulated countries would be required to bear the costs of some compliance testing to ensure that requirements
are implemented in their markets. However, there would be potential for market surveillance authorities to collaborate on sharing of testing results in order to avoid
duplication of tests between different countries and regions (subject to matching voltage-current combinations). This can also help to avoid situations where
equipment which is below the MEPS in one market is dumped on another country’s market. The consistent implementation of market surveillance testing and follow up
is important to ensure that companies adhere to regulatory requirements otherwise
regulations will become ineffective.
The costs of compliance could possibly impact profit margins, but reduced unit costs resulting from economies of scale, combined with the increased production volumes
potentially associated with harmonised efficiency performance requirements may mean on average, profit margins remain similar27.
Product price
Rather than an increase in product price, what appears to be more likely, at least for
international manufacturers, is a shift in the types of products sold over time. Some
25 CSES (March 2012), Evaluation of the Ecodesign Directive (2009/125/EC), Final Report
http://ec.europa.eu/enterprise/dg/files/evaluation/cses_ecodesign_finalreport_en.pdf 26 “High quality super-efficient lighting products: the SEAD Global Efficiency Medal”, Gallinat, Karpay Weyl et
al, eceee Summer Study Proceedings 2015 27 Policy Studies Institute & BIO Intelligence Service for the Department for Environment, Food and Rural
Affairs (February 2011), Impacts of Innovation on the Regulatory Costs of Energy-using Product Policy
(SPMT09_045) Final Summary Report
http://randd.defra.gov.uk/Document.aspx?Document=EV0703_10122_FRP.pdf
European Commission Savings and benefits of global regulations for energy efficient products
September 2015
c39
industries have indeed viewed the introduction of regulatory efficiency requirements
and energy labelling as an opportunity to shift sales from the lower value products in their range toward the higher value more-efficient products (e.g. lighting), justified to
consumers from the viewpoint of lifecycle energy savings and the perceived enhanced quality of higher labelling class products28. Price impacts of regulatory requirements tend to be lower than impact assessment
estimates, due to under-accounted for productivity improvements, technology
changes, economies of scale due to increased production volumes and allowance for lower profit margins29. Where there is a price impact due to efficiency regulations, it is
unlikely that costs of compliance would be passed-on to the consumer, particularly due to price pressures placed upon manufacturers from retailers30. In fact, if any
impact on product price occurs for household products (which is often not the case) it is likely to be minimal, justified by energy savings31, and short term within the context
of the wider downward trend in product prices over time. Such trends have been observed for product MEPS implemented in Australia, Japan, the US and the EU32. In
some cases, decreases in prices of efficient products have been observed that are of
similar magnitude to the energy savings of products achieved via MEPS over the same period33.
Markets
As MEPS tend to be set at a relatively low level of ambition, with the intention of
avoiding significant impact on manufacturers and removing only the worst performing products from the market, their impacts are likely to be limited. Likewise, whilst labels
have the potential to pull the market toward greater efficiency by influencing
consumer decisions they are unlikely to have adverse market impacts. However, depending upon the specific product, the impacts on the different players in the
market may be asymmetrical, with some market players being more heavily impacted than others.
There is some degree of risk of a negative market impact of harmonisation on
competition where: Consumer purchasing criteria (price, quality, choice or innovation) are diminished by
the change in nature or intensity of the market competition due to the MEPS or
label. Markets are characterised by imperfect competition, meaning that there are only a
few firms operating (for example the game console market) or the market is comprised of a small number of large firms and a minority of smaller firms, or
where there are significant barriers to entry.
28 Consumer Focus (December 2012) Under the influence? Consumer attitudes to buying appliances and
energy labels http://www.consumerfocus.org.uk/files/2012/12/Under-the-influence.pdf
29 Larry Dale, Camille Antinori, Michael McNeil, James E. McMahon, K. Sydny Fujita (2009), Retrospective
evaluation of appliance price trends, in Energy policy, 37: 597-605
http://www.sciencedirect.com/science/article/pii/S0301421508005193
Mark Ellis, OECD/International Energy Agency (2007), Experience with energy efficiency regulations for
electrical equipment http://www.iea.org/publications/freepublications/publication/appliances_ellis.pdf
30 CSES (March 2012), Evaluation of the Ecodesign Directive (2009/125/EC), Final Report
31 Coolproducts estimates that cost savings from Ecodesign measures including vacuum cleaners, light
bulbs, boilers and fridges will reach €79 billion a year by 2020, breaking down to €350 per European
household. www.coolproduts.eu/infographics
32 Mark Ellis, OECD/International Energy Agency (2007); Policy Studies Institute & BIO Intelligence Service
for the Department for Environment, Food and Rural Affairs (2011)
33 CSES (2012)

European Commission Savings and benefits of global regulations for energy efficient products
September 2015
c40
There is a difference in the cost impacts of the requirements between
manufacturers.34 Strict overarching MEPS are enforced on products that have justified regional variations – for example, it was found that ambitious harmonised
MEPS on windows would not be optimal for all three European climates (north, central, south)35. Stringent MEPS that did not account for the regional variations
could have impacted the competitiveness of companies in some climates.
Therefore it is necessary to balance the environmental objectives of harmonisation
with the need to preserve market competition. The main market players can be broken down into global OEMs, local manufacturers and SMEs – the market impacts of
harmonisation on each of these are considered separately in the following sections.
Global OEMs
Regulatory requirements on energy efficiency of products and energy labels are well established in some economies. These economies tend to be dominated by globally
operating manufacturers. To date, no adverse changes in the market structure
between component manufacturers, equipment suppliers, and OEMs have been highlighted as a result of historical introduction of such initiatives. For example, the
implementation of the Ecodesign and Energy Labelling Directives in Europe has not suggested any impacts in terms of a reduction in imports to the EU. In fact during the
period since regulations began to be enforced, a trend toward an increase in imports has been observed, particularly from China and India, but also from the US, Japan or
South Korea36.
Energy labelling is often viewed positively by manufacturers in terms of
competitiveness. In particular, positive feedback has been communicated in relation to Energy labelling in the EU on refrigerators, washing machines, domestic dishwashers
and laundry dryers37. Views on the competitive impacts of regulatory measures are more mixed, although they can sometimes be viewed by OEMs as having a
constructive influence. For example, a recent impact assessment for regulatory requirements on vacuum cleaners stated that “the proposed minimum requirements
are seen [by manufacturers] as having a positive impact on competitiveness.” 38
The larger international manufacturers tend to have products with a range of
efficiencies in their portfolios, and therefore the impact of mandatory performance requirements is more likely to result in a shift from one product model to another,
rather than the need to develop a whole new product with associated production overheads. In addition, whilst MEPS are usually set at levels that would not
necessitate proprietary technologies, the position of manufacturers with proprietary designs that facilitate improved energy efficiency would probably be strengthened
under such a scenario. Profitability may be further enhanced by opening up new
34 Frontier Economics for the Office of Fair Trading (October 2008), The competition impact of environmental
product standards
35 “Towards an EU energy labelling scheme for windows: insight and learning of the development phase of
the first label for an energy-related building product”, Janssens, C dric, Glass for Europe. eceee Summer
Study Proceedings 2015 36 CSES (2012) Evaluation of the Ecodesign Directive (2009/125/EC)- Final report
37 Molenbrook et al (June 2014), Final technical report: Evaluation of the Energy Labelling Directive and
specific aspects of the Ecodesign Directive ENER/C3/2012-523,
http://www.energylabelevaluation.eu/tmce/Final_technical_report-Evaluation_ELD_ED_June_2014.pdf
38 European Commission (2013), COMMISSION STAFF WORKING DOCUMENT: IMPACT ASSESSMENT
Accompanying Commission Regulation implementing Directive 2009/125/EC of the European Parliament and
of the Council with regard to Ecodesign requirements for vacuum cleaners, http://ec.europa.eu/smart-
regulation/impact/ia_carried_out/docs/ia_2013/swd_2013_0240_en.pdf

European Commission Savings and benefits of global regulations for energy efficient products
September 2015
c41
markets previously served by inefficient, low-cost manufacturers. At the very least,
introduction of MEPS in areas where they have not previously been implemented will preclude ‘free riders’ from remaining unaffected in these markets as well as preventing
the flooding of these markets with inefficient products that cannot be sold in already-regulated countries. Harmonised requirements and labels create demand for more
efficient products in new markets, and already efficient producers operating in regulated markets will be able to react more quickly and gain a greater proportion of
the market.
As such, it is likely that globally trading manufacturers would be able to meet MEPS
and implement energy labels if they were harmonised internationally with little if any impact on their markets.
Local manufacturers
The assumption is often made that requiring compliance to the same labelling and performance requirements across the globe would result in a level playing field that
would benefit all manufacturers by reducing compliance costs and incentivising
efficient technologies.
However, manufacturers operating at a national level in non-EU and particularly less-developed markets tend to focus upon lower-end less efficient technologies, and as a
result are more likely to experience mixed impacts due to global regulatory and labelling requirements. Benefits from harmonisation could include the following:
Efficiency demand, technology transfer and improved competition: MEPS and labels can create new demand for more energy efficient products in these
national markets, providing the certainty necessary to incentivise a shift in
production toward these products. Once these regional / national manufacturers shift to producing more efficient products their competitiveness on the global
market will be improved and other new markets may also be opened up for them. Improvements in production costs: Globally harmonised requirements will
reduce the costs of more efficient components due to economies of scale.
Barriers to these changes could include: Investment: Some national or regional manufacturers may be disadvantaged by
much lower investment capacity for research and development. They may not have
more-advanced efficient technologies in their product portfolio and therefore be required to invest in design and production. They may have issues raising funding
for the transition from established product technologies to more efficient ones. Skills: Where new production lines require a shift in skill set of the workforce, this
may present a timing restraint to the introduction of regulatory efficiency requirements.
Compliance costs: For manufacturers focused on specific markets, the compliance savings of harmonisation will be minimal and there may even be an increase in
costs if harmonised requirements are more rigorous than those currently
implemented in their country. Greater competition: The introduction of a labelling scheme may highlight major
differences between locally produced products and those of international OEMs. Local products may lag in terms of efficiency. Where customers have previously
been unable to distinguish between products on the basis of quality or energy impacts, the introduction of a harmonised label could empower them to make such
decisions39. Where they were previously able to compete on cost, the transparency
39 Frontier Economics for the Office of Fair Trading (2008)
European Commission Savings and benefits of global regulations for energy efficient products
September 2015
c42
provided by energy labelling could result in them losing market share by being
considered more expensive to run and lower quality. Regional market characteristics: These may include divergences in energy
prices, technology availability, market readiness, consumer attitudes, appliance usage etc.
The majority of the above barriers can be overcome by allowing sufficient time for the
transition to harmonised requirements. In countries where technology is lagging in
terms of efficiency, sufficient time-delay in the application of requirements can enable the shift in production toward more efficient models without incurring undue cost.
Box 13: Competitiveness case study on televisions
Televisions are a globally traded product with the market dominated by the large
OEMs, such as Sony, LG, Samsung and Panasonic. This means that the same products are generally available globally with little regional variation. However, some variation
does exist in terms of regional manufacturers and/or variations in market composition. Regional brands generally, but not exclusively, occupy the lower efficiency end of the
market, lagging the technology advancements of the larger OEMs. Some local manufacturers in countries such as India and China are still producing TVs using older
CRT or plasma technology that would be unlikely to meet harmonised efficiency
requirements. Sometimes production lines are dismantled and transferred from countries that have shifted to newer more efficient technologies. It has been
suggested that plasma and even CCFL LCD TV (less-efficient LCD screen) production lines could be dismantled from Taiwan and Eastern European countries and become
established in India over the next few years. In the event of harmonisation of global MEPS, the production lines of these regional/national manufacturers would have to
make the jump toward more efficient technologies sooner.
If this transition is poorly timed, there could be a prohibitive cost to these local
manufacturers. However, if sufficient indication is given prior to the implementation of regulatory requirements, the transition could substitute the transportation of an old
technology TV production line for the setting up of a production line for newer more-efficient TV technology. Costs of one approach compared to the other are already in a
fine balance as economies of scale bring down the manufacturing costs of more efficient LED–LCD displays. Therefore, the harmonisation (and appropriate timing) of
MEPS could provide the additional incentive to jump to the more efficient technology whilst avoiding undue costs in the transition.
Small and medium enterprises (SMEs)
The degree to which there is a competitive advantage of harmonisation for European business depends upon the level of ambition of any MEPS that are globally
implemented. Lower or equal ambition to what is already implemented in Europe may
give smaller EU manufacturers an advantage over local businesses in previously unregulated areas (should they choose to expand to these markets).
As profitability of larger OEMs increases due to harmonisation, their supplier
manufacturers in already regulated areas may see some benefits in terms of a shift back toward more local component manufacture.
It is possible that SMEs manufacturing end products in newly regulated areas could be
disadvantaged by the fixed costs for entry to market associated with the introduction
of performance thresholds. This is due to lower product volumes over which to spread compliance costs and the costs of any necessary production changes. However, in

European Commission Savings and benefits of global regulations for energy efficient products
September 2015
c43
sectors where SMEs are the innovators, for example lighting and the area of LEDs and
other specialist applications (such as museum or street lighting), they can benefit from regulation and labelling as they can take advantage of expanded market opportunities
as the market or technology radically changes and/or provided opportunities for their specialist solutions. In such cases it can be the OEMs that are slower to react to the
changing market.
3.2.5 Impact on innovation and technological development
Key Points
Harmonisation will affect the innovation activities of firms in different ways:
As with competitiveness, international OEMs are likely to be least affected, whilst large manufacturers and SMEs operating at a national level in previously unregulated
markets are likely to need to adapt their innovation activities the most. The impact on innovation is strongly influenced by the ambition of the MEPS requirement levels and
labelling classes, as well as the timescale on which they are implemented. The issue of
compliance is also relevant, as weak compliance systems will create disincentives to innovate.
Aspects of innovation and technological development likely to be influenced by globally-harmonised product efficiency requirements include:
Investments in innovation may increase: at the global level implementation of harmonised MEPS will provide an incentive for firms,
particularly those with only domestic scope, operating in previously unregulated economies to increase their innovation to meet the new (higher)
requirements. Globally harmonised labels, set with relatively stretching upper
thresholds, would be more likely to drive innovation across all firms. In both cases, but particularly labelling, the ambition of the requirements in both the
level and timing, can have a strong bearing on new innovation investments – if not on the total investment, then on the focus (see below).
Innovation speed can be increased: the timing of the implementation of any global requirements will play a crucial role in affecting innovation speed, in
general, longer timescales encourage more incremental innovation, while shorter timescales encourage more radical solutions and faster innovation
progress. It is important to strike a balance on timing, as some firms,
particularly in previously unregulated economies, will not be able to keep up with tight timescales. Other problems can also arise, for example:
o Innovative firms being discouraged if there is not sufficient time to recoup the costs of their previous innovation efforts.
o Innovation being required on timescales that are tighter than normal product development cycles, resulting in undue cost to manufacturers40.
o Innovation moving too fast for consumers to adapt or afford.
A tiered approach can be useful to address these issues.
Innovation focus on energy efficiency: introducing globally harmonised
MEPS and labelling requirements can lead to a greater innovation focus on energy efficiency, again, particularly for firms in previously unregulated
40 Note – this is only an issue for some product groups. For fast moving product groups, manufacturers can
make running improvements on a product line even as the products are being shipped out – which allows
them a greater potential to adapt as MEPS and labelling requirements are introduced. Source: “High quality
super-efficient lighting products: the SEAD Global Efficiency Medal”, Gallinat, Karpay Weyl et al, eceee
Summer Study Proceedings 2015

European Commission Savings and benefits of global regulations for energy efficient products
September 2015
c44
markets. This may divert innovation efforts from other areas such as resource efficiency, styling, design, functionality and accessibility.
The stringency of agreed MEPS or labels is the most important influence on the innovation impact: It is necessary to strike a good balance between the
ambition (stringency) of requirements and their timing. Companies whose products do not currently meet the globally harmonised requirements will require time to innovate
their products to meet any new requirements.
When markets open up, and become more integrated on a world-wide level, the pace of technological innovation accelerates. As technologies and markets evolve, the
regulatory landscape addressing the energy efficiency of products requires revision. There is a dynamic interplay between innovation and regulation. Often, innovation
paves the way for regulation, but in some cases regulation creates the stimulus for innovation (e.g. Ecodesign regulation on pumps). This section explores the potential
impacts of globally harmonised MEPS on technology innovation.
Investments in innovation
Implementation of globally harmonised MEPS will require product improvements by
some manufacturers. In particular, firms operating in previously unregulated markets will be required to improve their products to meet the new (higher) requirements. The
impact per firm will vary on the basis of a few factors, including: Whether their existing product range includes products that meet the
requirements: If so, the firm will be able to shift production to these products and discontinue the now obsolete models, potentially writing off some of their
investment. Those without products that meet the requirements will be
required to invest in innovation to redesign their products using more efficient components / designs.
The ambition of the requirements: Stricter requirement levels increase the innovation effort needed, as would a short timescale for implementation. In
economies with existing MEPS the impact on innovation investment is likely to be minimal, assuming the change in requirements is relatively small.
Labelling requirements have been shown to be more motivating for innovation
investment by firms - if not in terms of total investment, then in terms of investment
focus (see below). This is particularly the case for products where consumers are influenced by a label either persuading them either to take into account product
energy efficiency in their buying decisions or to perceive higher labelling class as an indicator of increased product quality. Design of the labelling classes is key. Globally
harmonised labels, set with stretching upper thresholds, can drive innovation across all firms by creating a level playing field for them to compete on energy efficiency
performance. This then becomes a key competitive factor between firms in addition to classic factors such as price, quality and functionality. Appropriate levels of labelling
class ambition and timing, are essential. Upper classes that are significantly above
current market and/or best available product levels, or are open ended, are necessary for label effectiveness and longevity, and can provide significant incentives to firms to
innovate. However, if the upper labelling classes are unaffordable to achieve on reasonable timescales, labelling may fail to influence investment in energy efficiency
innovation.
Box 13: Innovation impact of EU Ecodesign regulation
The EU Ecodesign Directive and its implementing measures is an example of the type of MEPS requirements that are modelled in the scenarios in this study. Sector specific
research has found the following impacts of Ecodesign on firms innovation activities:

European Commission Savings and benefits of global regulations for energy efficient products
September 2015
c45
Electric motors and pumps: induced process innovation and radical
restructuring of production lines, although not radical impacts on product innovation.
White goods: little innovation impact at high-end of market, but can help support process innovation and have a significant innovation impact when a
change, i.e. refrigerant type is mandated. Consumer electronics: Ecodesign helped to keep energy efficiency on the
innovation agenda but the sector is already innovative and in some cases it
was felt Ecodesign could be counterproductive. Lighting: Ecodesign had a radical impact on the sector, by removing
incandescent bulbs from the market, but the innovation significance was low as all firms already had other products.
Air conditioning: Ecodesign increased the speed with which firms pursued their innovation activities.
Heating: impacts were greatest on companies serving the lower ends of the market, or less developed markets in Southern and Eastern Europe, where
innovation was needed to bring existing product ranges up to the new
requirements.
Firms in the above sectors quite consistently reported that Energy Labelling was a bigger driver for innovation as this was an area in which they could compete within
the market, rather than a simple requirement to fulfil (at the bottom of their product range). Therefore innovation benefits would be most likely to increase if harmonisation
were to also include EU-type performance scoring energy labels.
Innovation speed
Firms already invest in innovation. This results in year-on-year product developments, and often improvements in energy efficiency. Increasing the speed of innovation, to
achieve improvements faster, at higher rates each year, is an important goal of energy efficient product policy. The timescale of implementation of global
requirements will play a crucial role in determining the impact on innovation speed.
A requirement implemented in a short period of time is effectively more ambitious
than the same requirement implemented over a longer period. In implementing MEPS or energy labels it is important that the regulator gives industry enough time to
develop solutions that are energy efficient but that can be achieved within reasonable product innovation cycles whist still meeting important user and other legislative
requirements.
A short implementation period requires rapid technical solutions, acting as a catalyst for an increased rate and speed of innovation. There is a risk that SMEs and firms in
currently unregulated regions struggle to adapt quickly enough to comply and remain
competitive at the same time. Other problems can also arise, such as innovative firms being discouraged if there is not sufficient time to recoup the costs of their previous
innovation efforts, and innovation moving too fast for consumers to adapt or afford. Meeting global requirements could be facilitated through technology transfer, which
would accelerate global deployment of best practice in product design.
A longer implementation period postpones the time for more efficient (innovative) technologies to be adopted, reducing the immediate innovation impact of a measure,
but providing space for firms to adapt their innovation strategy within normal
investment cycles. In either case innovation activity tends to be most concentrated in the immediate run up to the introduction of a requirement.
European Commission Savings and benefits of global regulations for energy efficient products
September 2015
c46
Using a tiered approach to global MEPS and harmonised labels, similar to the system used internationally for electric motors, could provide a balanced way to address this
issue of timing. Structured tiers that are clearly communicated to manufacturers allows them to set clear medium term goals, appropriately plan research and
innovation, and align product changes with standard investment cycles, keeping costs down. Tiers could also be differentiated across economies, at least in the short term,
to support unregulated economies by gradual harmonisation with global requirements.
Innovation focus
Evidence from regulated markets shows that energy performance increasingly
becomes a point of competition between firms as consumers become increasingly aware and influenced by energy labels and firms seek to differentiate their products41. Therefore introducing globally harmonised requirements is likely to encourage this trend at global level, incorporating previously unregulated markets.
The extent to which this effect persists is related to the benefit that firms derive from competing on energy performance. The most innovative firms tend to have an
efficiency culture embedded in their organisation seeing this as not only a consumer demand and differentiating criteria, but also as part of their company mission. For
products that are mature, where main functionalities are relatively fixed, for example washing machines, innovation focuses on energy (or other environmental)
performance to a greater extent than other functionalities. For products undergoing greater functional development and change, for example, consumer electronics, the
focus of innovation on energy performance is less as it is only one of a variety of
dimensions on which firms compete and on which consumers base their purchase decisions. Lighting is an example of a sector that was, until around the last 10 years,
relatively mature in this sense. The phase-out of incandescent bulbs in many countries, plus the development of LED-bulbs has transformed the market, with
innovation now heavily focused on the LED sector. While part of the rationale for this switch is the much better energy performance of LED bulbs, the innovation focus of
firms is not only to develop LEDs in the first place but also to ensure that the functionality, i.e. light colour, warmth, timing, compatibility with fittings and other
aspects; also matches consumer needs.
Regulation can incorporate innovation incentives by providing additional allowances to
encourage specific energy efficient features to be brought to market. Such features could be, for example, presence sensors to enter low power modes when the user is
not present, provision of energy use information to the user, or provision of feedback on use to service providers.
Other considerations
Innovation needs to be protected by a proper regulatory process. Failure to enforce
compliance can put innovation at risk. A recent study42 on the impact of Ecodesign and energy labelling on R&D and innovation concluded that “… the lack of market
surveillance activity reduced the motivation for companies to innovate in order to comply, especially as it was evident that non-compliant products were still visible in
the market place.” (p.95). Mitigations include strengthened market surveillance, stakeholder involvement in MEPS and label design. Other important considerations to
41 Sibylle Braungardt, Edith Molenbroek, Matthew Smith, Rob Williams, Sophie Attali, Catriona McAlister
(2014) Impact of Ecodesign and Energy/Tyre Labelling on R&D and technological innovation- Final Report,
http://www.ecofys.com/en/publication/impact-of-ecodesign-and-energy-labelling-on-rd-and-innovation/ 42 S. Braungardt et al (2014)

European Commission Savings and benefits of global regulations for energy efficient products
September 2015
c47
avoid barriers to innovation include; ensuring procedural clarity; coordinating with
other legislation; protection of intellectual property; and timely impact assessment.
3.3 Impact on citizens
3.3.1 Affordability impacts
Key points:
Affordability is already a key consideration in setting MEPS requirements in most countries and/or regions: the US and the EU explicitly take this into account,
ensuring that requirements are set at the levels that impose the least life-cycle costs for the average end-user. A similar approach is often, but not always, applied in
China.
There is little empirical evidence of significant price increases from MEPS:
empirical work on the subject finds little evidence of real product price increases due to MEPS, but there is significant evidence of reduced life cycle costs producing net
savings for end-users over the full product lifetime. Price increases are thought to be kept low due to:
Manufacturers are find cheaper ways to improve product efficiency than projected.
Scale economies and increased competition between suppliers of higher
efficiency components reduces unit costs following MEPS. Manufacturing systems are increasingly flexible, reducing the fixed costs of
switching production lines to higher efficiency products. Introduction of MEPS is often taken as an opportunity to upgrade production
lines and tooling and to negotiate new supplier arrangements which can help suppress cost increases.
Advance notice of MEPS of 2-6 years is typically given, reducing the costs of switching.
Learning effects increasingly apply as production volumes of higher efficiency
products increases.
Few affordability problems are anticipated for products produced for global markets: for example consumer electronics and ICT goods, which are already only
produced in a few places (often with existing MEPS) for global markets. Products whose costs are strongly linked with material costs, such as electric motors, LEDS or
transformers, would see some (likely small) cost increase from additional material requirements. Locally tailored products of relatively small production volumes may see
larger price increases.
Some affordability impacts may be experienced, particularly in countries with
low energy prices, low disposable incomes and/or low usage patterns: the empirical work flagged above has primarily been carried out in developed countries,
the impact can be different in poorer developing countries. Energy prices, product prices and disposable income levels and usage patterns can all have an important
influence on the life-cycle costs and benefits of higher efficiency. In countries with low energy prices the efficiency level at which least life-cycle cost is achieved will be lower
than in countries with relatively high energy prices as the economic value of each unit
of energy saved is lower. Similarly for the other variables.
An approach based on levels of requirements could mitigate affordability concerns: levels could differentiate per product or related to relative national
European Commission Savings and benefits of global regulations for energy efficient products
September 2015
c48
incomes/prices. Such an approach would address short term product affordability concerns while contributing to greater harmonisation.
As noted in section 3.2.1 on economic impacts, a move towards globally harmonised
MEPS at current maximums would be expected to lead to both increases in product prices for consumers and longer term energy savings. Considering the balance and
timing of these impacts is important to analysing the potential impacts.
The affordability of higher efficiency products is one of the aspects that energy efficiency regulators analyse prior to introducing MEPS and to a lesser degree energy
labels. The USA has long enshrined the principle that MEPS should be set at levels that reduce overall life cycle costs (by lowering energy and operating costs more than they
increase product purchase costs) and result in acceptable payback periods to end-users. The EU’s Ecodesign Directive enshrines the same principle in basing MEPS
requirements at the efficiency level that produces the least life cycle cost for the
average end-user. China has often set MEPS on a similar basis although this approach is not institutionalised within the Chinese regulatory framework. In practice then all
existing MEPS help to lower overall lifecycle costs for consumers and end-users and thus help ensure value for money while only having a modest or negligible impact on
purchase prices.
In theory, requiring the removal from the market of less energy efficient products should necessitate the adoption of designs that are likely to have a higher material,
component and/or design cost. If this increase in cost is passed on to the consumer
then average prices would be expected to rise. Some studies43 have examined this effect to see if the projected increase in prices that were postulated when the
regulations were introduced have produced the expected increase in product prices. Generally, these retrospective analyses have found little or limited evidence for
product price increases stimulated by the adoption of higher efficiency requirements and in some cases the reverse44, that prices continue to decrease as efficiency
improves. There are several potential explanations for this: 1. Manufacturers are likely to find cheaper ways to improve product efficiency
than projected in the regulatory support analyses.
2. The incremental cost of higher efficiency components is related to the volume of demand for those components, so as demand increases due to a regulatory
development, the cost of the component declines as competition among suppliers helps decrease unit costs.
3. Manufacturers that are used to responding to energy efficiency (and or other) regulations will tend to develop more flexible manufacturing systems that lower
the fixed tooling and process costs associated with producing a new series of higher efficiency products.
4. A regulatory stimulus to upgrade a range of product models will often be taken
as an opportunity to upgrade production lines and tooling and to negotiate new supplier arrangements which can help suppress cost increases.
5. Any incremental production costs due to MEPS will also be sensitive to how much advance notice is given before the regulatory measures take affect –
usually this is between 2 and 6 years.
43 Reference studies for the affordability analysis are included in the References section at the end of this
report 44 IEA4E (2015) Achievements of appliance energy efficiency standards and labelling programs: a global
assessment

European Commission Savings and benefits of global regulations for energy efficient products
September 2015
c49
As a result, while most product life cycle cost assessments a priori will project end-
user payback periods of within about a third of a product’s life time from reasonably ambitious MEPS (leaving two thirds where there is a net benefit), the actual payback
periods seem to be considerably shorter and the period of net benefits longer. In fact, this phenomena is well known in technology learning curve theory wherein the price of
a technology with a given performance level declines by the learning rate each time the volume of units produced is doubled. This has been empirically observed for many
energy supply technologies, such as solar photovoltaic panels, whose costs have
declined by an average of 18% each time the volume of panels installed has doubled over many decades, and has also been observed for the efficiency of many energy
using technologies.
Overall, there is little evidence of real product price increases due to MEPS although there is ample evidence of reduced life cycle costs. Over the medium term these net
savings will reduce expenditure burdens for end-users and increase their ability to spend in other areas of economic activity.
However, it is important in this global analysis to consider whether adoption of the world’s most stringent MEPS or highest energy label thresholds would be of economic
benefit to all end-users and/or if it would make products unaffordable for some end-users. Affordability is contextual in that end-users with more disposable income can
more easily afford to purchase more expensive products than those that haven’t. This varies both within economies and across economies and affects expenditure patterns
for all product types regardless of their energy efficiency. Before considering the impact of potential price increases it is important to appreciate that life cycle costs are
sensitive to energy prices, product usage profiles and product prices. The efficiency
level for which a product’s life cycle cost is minimised will be higher for economies with relatively high energy prices and high usage levels than for those with cheap
energy and low usage profiles. For this reason, adoption of common minimum efficiency levels for all economies would not be economically optimal for all.
However, as today’s a priori life cycle cost estimates have been proven to be
systematically conservative in that they tend to overestimate actual product price increases due to higher efficiency requirements, it is likely that broad international
adoption of current most stringent MEPS would not result in very significant increases
in product prices, at least for some product types. Those products that are already manufactured for a global market in a small number of product centres such as
Consumer Electronics and ICT products would likely have very little change in price. Those that are produced for mostly global markets but have a strong link with
material costs, such as electric motors, LEDS or transformers, would be expected to reflect the incremental bill of material costs but little extra production costs. Those
products that are more localised and produced in smaller series would be expected to have the largest increase in price.
For these reasons it may be appropriate for regulators to consider development of a menu or ladder of internationally harmonised energy efficiency thresholds from which
each economy can chose requirement levels which are consistent with local needs but which help maximise international harmonisation. Such an approach would give
sufficient flexibility to regulators to mitigate any near term product affordability concerns while supporting greater harmonisation, thereby building markets and
accelerating the technology learning rate, which in turn will improve affordability.

European Commission Savings and benefits of global regulations for energy efficient products
September 2015
c50
3.3.2 Functionality and usability of energy related products
Key points:
Functionality and usability considerations relating to international harmonisation of
energy efficiency requirements and labelling include:
Regional variations in functionality: Regulations should ensure that global requirements do not result in manufacturers neglecting regional user needs in
favour of cutting costs to supply a one-size-fits all solution. Allowing for modular design approaches and software customisation can facilitate regionally
tailored solutions at low cost, based on a standardised foundation product. Consumer confusion of power characteristics with performance: There
have been some cases of consumers interpreting the phase out of inefficient products as limiting product functionality available to them for purchase. This is
usually due to a misconceived association between the power characteristics of
the product being regulated and its performance. This often arises from power being a key product attribute in marketing material and pricing scales. The
reality is that a well-performing product will be able to execute its core function effectively whilst using the minimum necessary power. Negative consumer
attitudes to phase-out regulations can reduce or be forgotten as: i) the market adapts to promote products in terms of their true functional performance ii)
consumers shift to more efficient products, they may find have improved functionality due to innovation.
Functionality improvements as a result of MEPS: In some cases, efficiency
improvements instigated by mandatory requirements result in additional positive impacts on product usability, reliability and features. E.g. efficient
power supplies that generate less heat (safer) and are smaller and lighter weight (less copper), so easier to transport.
Balancing functionality and user needs: Consumer demands for functionality and price are likely to be lower in areas that have not previously
been regulated. In these countries the majority of the market may initially be focused upon lower quality, less efficient models that may be phased out under
mandatory requirements. It is important that MEPS and labels provide
sufficient allowance for efficient products with basic features, whilst at the same time ensuring that allowances for extra features are proportionate.
Regional variations in functionality
Global harmonisation of MEPS and energy labelling to be applied to products would need to be specified and timed with appropriate impact assessment to ensure that
functionality from the end-user’s perspective is not adversely affected. This will be particularly important for products where there are regional variations in functionality.
For example, air conditioning functionalities failing to meet the varying needs of different climatic zones, or TV automatic brightness adjustments failing to adapt
appropriately for variations in ambient lighting conditions when viewing TV in different
regions. Sensitive design of regulations and labels is important to ensure that global requirements do not result in regional user needs being neglected in favour of cutting
costs to supply a one-size-fits-all solution. Provided that the potential of modular design and custom software is appropriately exploited, low cost customisation should
be possible based on a standardised foundation product. There may need to be some degree of customisation in labelling approaches to ensure that product classes result
European Commission Savings and benefits of global regulations for energy efficient products
September 2015
c51
in representative efficiency ratings taking into account the differences in regional use
profiles, conditions and functionality.
Consumer confusion of power characteristics with performance
The Ecodesign framework directive (2009/125/EC) makes some clear statements with regards to functionality of products addressed by Ecodesign implementing measures:
“there shall be no significant negative impact on the functionality of the
product, from the perspective of the user” “The choice of a specific design solution will achieve a reasonable balance
between the various environmental aspects and between environmental aspects and other relevant considerations, such as safety and health, technical
requirements for functionality, quality, and performance, and economic aspects, including manufacturing costs and marketability, while complying with
all relevant legislation.”
Such considerations are taken into account in the preparatory studies that assess the
potential for regulation. The foundation MEERP methodology for example, defines functionality as one of the boundary conditions where there should be no negative
impacts. However, despite such precautions being taken, sometimes consumers interpret the phasing out of inefficient products as limiting product functionality
available to them for purchase. This is usually due to them misconceiving a link between the power characteristics of the product being regulated and its performance.
The reality is that a well-performing product will be able to execute its core function effectively whilst at the same time as being energy efficient and using the minimum
necessary power. Confusion can arise partly due to the way in which products are
marketed and priced, as power ratings can provide an easy means of differentiating products. However, such a focus can create a barrier to moving toward energy
efficiency as a central driver in product design.
Confusion over the link between power ratings and core product functionality has resulted in some consumer controversies over the minimum energy performance
requirements introduced in Europe. For example: Vacuum cleaners: Minimum efficiency requirements introduced for vacuum
cleaners in Europe, mean that (as well as requirements for minimum dust pick
up) there is now an upper limit to the power rating of these products. One of the key performance indicators on which vacuums were historically marketed
was their power (wattage). The average power of a vacuum on the market in Europe at the time of the proposal was 1800 watts, with the legislation
introducing an initial limit of 1600 watts, reducing to 900 watts from 2017. Therefore some consumer and media reactions to the introduction of the
requirements (in 2014) claimed that the “best” (meaning most powerful) vacuums on the market would be banned. In fact, a well performing vacuum
cleaner will be able pick up dust effectively whilst using the minimum
necessary power. European vacuum cleaner manufacturers finding themselves unable to focus on ever-increasing power ratings in the wake of the EU power
cap, are likely to shift to promoting their products on the basis of their true functionality – the ability to pick up dust effectively.
Televisions: Similar concerns were raised with the phase out of inefficient TVs in Europe, where consumers equating power (high wattage plasma screens)
with screen size panicked that they would no longer be able to buy large screen TVs. In fact other technologies (LED LCD, quantum dot UHD etc.) progressed to
enable more efficient, better resolution and larger screens.

European Commission Savings and benefits of global regulations for energy efficient products
September 2015
c52
Negative consumer attitudes to the phasing out of products due to regulation can
reduce or be forgotten as the market adapts to promote products in terms of their true functional performance, and as consumers shift to alternative products that they
may find have improved functionality (see box 6). In order to successfully design and implement ambitious harmonised MEPS and labelling schemes, management of
consumer perceptions regarding impacts on product choice is key.
Box 14: Functionality case study on domestic light bulbs
Traditional incandescent light bulbs have been phased out in Europe under Ecodesign legislation. Prior to the introduction of minimum performance requirements for light
bulbs, consumers purchased light bulbs by power rating (wattage) rather than
brightness (lumens / candelas). The alternatives available to consumers at the time of the incandescent phase out included halogens, compact fluorescent light bulbs (CFLs)
and light emitting diodes (LEDs). The phase out, combined with subsidy and incentive programmes, had a profound impact on the market. Whilst much of the market moved
to CFLs, there was also a greater than expected shift to halogens, due to consumer-perceived disadvantages of CFLs, and the relative infancy of LED technology at the
time.
Consumer complaints about the relative inadequacy of the functionality of the CFL
bulbs that were being promoted as an alternative included: Lower brightness and colder light colour of comparable CFL substitutes to
traditional incandescent bulbs. The need for a ‘warm up’ time for CFLs to reach full brightness.
Incompatibility with dimmer switches and for specialist applications. Incompatibility with existing light fittings and dimmer switches.
Presence of toxic mercury vapour contained in each CFL bulb. Health concerns around the impact of high-frequency ‘flickering’ of CFLs.
The shift in the market toward alternative lighting technologies enabled CFLs to overcome these challenges through technology developments, drove halogens toward
improved efficiency and led to huge innovation in the LED market. The regulation in fact provided a crucial driver for this change, and the transition to more efficient
lighting solutions with equally satisfactory and often improved quality. Some LEDs now entering the market as a result of demand for more efficient light sources have
advanced capabilities that can even allow users to change the colour temperature of a bulb to their specific preference. A 2011 survey in the United States found that
consumer attitudes in the lighting area had become much more positive than
previously expected toward efficient lighting alternatives such as LEDs in the run up to phase out of less efficient options, but stressed the need for consumer education in
advance of the introduction of such measures.45
Natural improvement in functionality as a result of efficiency
Due to the efficiency drive instigated as a result of MEPS, labelling initiatives, and subsidy schemes, technology improvements can actually result in products that
provide additional user benefits in terms of improved functionality, reliability, usability and performance whilst meeting energy efficiency goals. For example, improvements
45 Wimberly, J., EcoPinion / Ecoalign (March 2011), Lighting the Path Forward for Greater Energy Efficiency -
Survey Report • Issue 10
European Commission Savings and benefits of global regulations for energy efficient products
September 2015
c53
in power supply efficiencies over recent years have resulted in power supply units that
generate less heat (safer) and are smaller and lighter weight (less copper), so easier to transport. Likewise, set top boxes (typically located in poorly ventilated areas) with
improved efficiency have become smaller and by generating less heat have lower failure rates. Balancing functionality and user needs
In a scenario of harmonised mandatory product requirements, the consumers most likely to be impacted by changes in product ranges would be those in areas that have
not previously been regulated – often in poorer areas where consumer demands in terms of functionality and price are likely to be lower. These consumers may only be
able to choose from the lower quality, less efficient models at the bottom of the market, that may be phased out under mandatory requirements. This would have
consequent impacts on product affordability and access for consumers.
These impacts can be managed through careful design of harmonisation initiatives.
Often regulatory requirements take the form of a baseload allowance covering power required for basic functionality, plus additional allowances for greater functionality or
product sizing. If baseload allowances are insufficient, it is the lower functionality, low-cost products that are most likely to be impacted. It is therefore important to ensure
sufficient baseload allowances to enable efficient but basic products to achieve the harmonised levels. For example, too low a baseload allowance for TV energy efficiency
requirements may make it harder for small screen TVs to comply with the requirements, pushing prices up and reducing choice, and therefore impacting the
ability for consumers to affordably purchase products in smaller sizes.
Likewise, if allowances for additional functionality are set which allow a level of power
demand higher than necessary for these features, less-efficient products with unnecessary features not demanded by the user may become commonplace on the
market. For example, in the area of refrigeration there have been discussions around the appropriateness of energy labelling correction factors for additional product
features such as ice makers and water chillers. It was considered that these could have resulted in “misleadingly high energy efficiency ratings” considering the
additional impact these features have on total energy use and running costs46. There are also concerns regarding the way in which the design of energy classes may mislead consumers in terms of the absolute energy impacts of products. For example,
a large TV or refrigerator may have a higher (better) energy class than a smaller TV or fridge. Whilst these products may be efficient for their larger size, they are likely to
consume more energy overall. Consumers interested in reducing absolute energy consumption may make inappropriate purchasing decisions due to not fully
understanding the relation of the energy classes to the size of the device.
Therefore it is important that the design of harmonised regulations and labels ensures
appropriate allowance is made for smaller, lower cost, or lower featured but efficient products to comply, and that such products are not compared unfavourably with larger
or higher-featured products.
46 Consumer Focus (December 2012) Under the influence? Consumer attitudes to buying appliances and
energy labels http://www.consumerfocus.org.uk/files/2012/12/Under-the-influence.pdf

European Commission Savings and benefits of global regulations for energy efficient products
September 2015
c54
4 Barriers to harmonisation Key points:
The world does not yet enjoy the benefits of harmonisation described in this report.
This is due to a number of barriers to achieving global harmonisation of (firstly)
technical standards and then MEPS and labels. The barriers can be grouped into the
following three types:
Regional barriers: Real and perceived needs for differences between regions, which stem from differences in climate, culture and market structure, user
needs, tangential regulations (such as food safety), simple historical accident and efforts to protect local markets.
Barriers to the process of change (harmonisation) itself: These include; a lack of motivation to change (when standards can suffice as they are for
existing trade); a lack of available time and technical resource on the working
committees and for policy-makers; uncertainty during change; the costs of re-testing or developing new products; the investment in new facilities to build or
test new products; the practicality that update cycles are 'out of sync' between regions and so agreements cannot be struck at crucial times. There is also a
disconnect between high level policies aimed at improving comparability and the activities of the technical committees that must make it happen but have
other priorities. Perceived barriers and risks: These could include potential damage to local
industry from exposure to increased competition; disappearance of familiar
products; discontinuity of trend data as test methods change. Some issues seen as barriers are actually insignificant in practice: examples include
language and units of measurement – translation for both is straight-forward and introduces little or no technical uncertainty.
An aspiration for complete global harmonisation is neither realistic nor essential - a
core requirement for harmonisation is simply the coherence and comparability of test standards and policy approaches, and the transparency necessary to identify and
spread best practice standards and policies (including MEPS and energy labels).
The foregoing sections have highlighted many benefits of harmonisation of global
standards and MEPS. A significant amount of alignment does already occur since
technical standards, MEPS and labels are too costly and time-consuming for every nation to develop separately: those needing such approaches tend to adopt or adapt
those of trading partners and/or near-neighbours. Globally, there are a handful of countries that lead these processes, including the USA, EU, China and Japan. These
leader countries tend to be followed by neighbouring countries that base their standards on those of the leader, often with some adaptation.
However, there still remains a disparity of approaches at a global level. This section
examines why the world does not, in reality, enjoy the transparency of product
performance and higher energy savings that might follow from global harmonisation. The barriers examined in this section concern the differences between the countries
leading the development of standards, MEPS and energy labelling schemes, the regional level implementation of requirements, and the potential to re-align the MEPS
and labels of whole groups of countries.

European Commission Savings and benefits of global regulations for energy efficient products
September 2015
c55
When assessing the political priority and feasibility of harmonisation, the relative
strength and applicability of the following barriers must be set in perspective for each case:
1. Why there are, or might need to be, distinct differences between regions
for some products From a legal standpoint, ISO and WTO recognise three main justifications for a region
to impose its own technical regulation, rather than adopting or adjusting an already
existing or imminent international regulation for that product. These are noted in the WTO agreement on Technical Barriers to Trade47 as:
i. fundamental climatic differences; ii. geographical factors; and
iii. fundamental technical problems.
In practical terms, there are other more specific factors that have acted to cause or perpetuate differences between regions. Although these WTO factors lie behind
several in this longer list, any of those not considered as within scope of the WTO
factors could be challenged via WTO. In approximate descending order of significance: a. Local climate: important differences occur due to the local climate. For example,
air conditioners in South East Asia are optimised for efficiency with high ambient temperatures and humidity for much of the year; units in Northern Europe are
optimised differently. Regulatory and labelling requirements therefore need to be developed to take account of local climate. The EU energy labels for air
conditioners are implemented in this way, being allocated according to 4 distinct climate zones. Most types of cooling appliance are similarly affected by climate.
Even if efficiencies could be compared easily between tropical and temperate
climate products, the products would perform poorly (or at least differently) if transferred to the other region and so there is little incentive to resolve such
differences. Thus, it is considered justifiable to have non-comparable requirements across climate zones for equipment for which performance is affected by ambient
conditions. However, it would be possible to harmonise requirements defined within similar climate zones if compromise on rating temperatures could be agreed
– for example for cooling equipment between EU and much of North America. b. Local technical infrastructure and other market conditions, culture and
service needs: some inevitable differences arise from these factors and the set-
top box (STB) is a good example. The built-in functionality of these devices varies enormously depending on: the local media industry (business models used); signal
delivery infrastructure (cable, terrestrial, satellite etc.); and consumer demand (built-in recording, multiple tuners etc.). Comparison of regulatory requirements
for STBs between regions is extremely hard to achieve on a fair basis, except at the most basic level of standby power48. Another example is where local food types
affect the internal design and storage temperatures of domestic fridges (fridges specifically for storing ‘Kimchi’ pickled cabbage that are almost unique to Korea are
one extreme example of that). Also, the actual efficiency achievable by products
that include an electric motor depends upon the frequency of electrical supply (50Hz or 60Hz).
c. Differences in tangential regulations: regulations not directly associated with energy use may affect design of products and lead to necessary differences in
regulatory requirements and labelling schemes. For example, local food safety law dictates storage temperatures for domestic and commercial food refrigerating
47 See https://www.wto.org/english/tratop_e/tbt_e/tbt_e.htm 48 This was shown in analysis of STB products and markets by IEA 4E Mapping and Benchmarking in 2014,
see http://mappingandbenchmarking.iea-4e.org/matrix?type=product&id=14.
European Commission Savings and benefits of global regulations for energy efficient products
September 2015
c56
equipment, which directly affects energy consumption. Similarly local building
regulations affect the nature of energy efficiency requirements for many HVAC products, including performance metrics and types of losses taken into account. In
these cases, however, if other aspects of testing and policy requirements are harmonised then comparison of relative stringency of policy requirements can be
achieved by empirical or theoretical adjustment factors. d. Historical accident: some differences exist due to historical accident, such as:
the particular experience of those involved in developing the MEPS or labelling
scheme; when and where it started, or due to the context in which products are used or sold in that region. This applies to some differences in the metric used
which can make requirements problematic to compare. It also applies to terminology and ways in which products are defined and segmented by type. For
example, efficiency for vertical glass door chilled cabinets in the US is expressed as kWh per unit internal volume, whereas efficiency of these in the EU is measured as
kWh per unit display area visible to the customer. Whilst awkward to change for reasons noted below, such differences could in theory be resolved and harmonised.
e. How product types are segmented: this will affect the stringency of policies
that can be applied and differences can make comparison misleading. For example India segments its policy thresholds for televisions by display technology (CFL
backlit LCD with plasma screens in one category; LED backlit LCD in another), whereas other countries force all technologies to compete in the same category.
Commercial refrigeration standards have many such anomalies which mean that stringency is hampered for some policies that group products in particular ways
and comparisons between policy levels in different economies can be misleading. This troublesome but not insurmountable challenge for comparison and alignment
often arises through historical accident or preferences of local manufacturers and
policy-makers. f. Protectionism: any one of these or other barriers could be exploited by industry
and/or policy-makers to achieve some level of protection for local manufacturing industry, through raising the effective cost of entry to the market. This could result
in larger differences between regions than might technically be justified.
Box 7: Why test methods and policy standards for packaged liquid chillers are so different in the EU compared
with the rest of the world (case study).
The IEA 4E mapping and benchmarking initiative recently analysed why EU seasonal performance metrics are so different and non-comparable with those of the rest of
the world for packaged liquid chillers, as used for central air conditioning and process cooling applications. The August 2015 report49 compares policy thresholds
for cooling mode seasonal efficiency (IPLV) of chillers across USA, Canada, Australia and China, and presents separately the proposed 2017 seasonal efficiency (SEER)
thresholds for the EU. The seasonal IPLV widely used throughout the world cannot be compared on a fair basis with the EU metric due to fundamentally different
assumptions including annual usage profile, climatic temperatures, built-in
assumptions about efficiency of pumps and fans within the system and how to account for low power modes.
As expected, reasons for differences include different dominant technologies
markets, typical capacity range of chillers, climate conditions and cooling demand profiles. But other factors are also important in this case: The EU approach is
embedded in product policy and so products are assessed in isolation, whereas the
49 IEA 4E Policy benchmarking for Packaged Liquid Chillers and evaluating the lack of comparability between
economies, 4 August 2015, available from http://mappingandbenchmarking.iea-
4e.org/matrix?type=product&id=17.
European Commission Savings and benefits of global regulations for energy efficient products
September 2015
c57
IPLV (USA) policy is embedded in building/system policy - this changes the
reference framework and explains the fan/pump assumption differences; but also the USA is dominated by large centrifugal cooling only chillers used throughout the
year whereas the EU has systems used part-year based on chilled water which are often reversible to circulate hot water for heating in winter. The EU policy thus
integrates cooling and heating performance.
Whilst this raises major challenges for harmonisation, policy-makers could make
standards significantly easier to compare through changing some of the assumptions, but an easier route to achieving comparability is through
manufacturers' chiller selection software: This could easily deliver data in the different metrics and in standard formats alongside each other. From that data the
policies could be compared.
2. Barriers to the process of to the process of change and alignment of
standards, MEPS and labels
In approximate descending order of significance:
a. Lack of motivation to change: when policy requirements suffice for intra-regional trade as currently specified, there is limited direct benefit to
manufacturers from wider alignment (unless larger businesses are developing inter-regional trade). Policy makers have historically not prioritised such steps and
consumers do not demand such alignment. b. Lack of available time and technical resources: Development of test methods
relies largely on volunteer effort from industry and so the focus is on producing a
workable standard within the required (often long) timescale. Review of standards and MEPS from other regions and negotiation of changes would require technical
resources that are not available to the committees. c. Uncertainty whilst new MEPS are developed: It takes at least two years after
embarking down that route until test results are available and policy requirements are set - when manufacturers finally know how their products compare, this
creates significant uncertainties for businesses. d. Costs of re-testing: There is a substantial cost to industry of re-testing products
according to a new method. The retest of even a small appliance will cost around €
1,000 per test per product type, with costs rising steeply as complexity and test duration increases.
e. Difference in regulatory and test cycles: Regulatory and test method update cycles are ‘out of sync’ between regions and internally. This can mean discussions
between the right expert groups are hard to organise at the crucial times for each region. This could result in impacts on trade when policy requirements for one
region are fundamentally changed whilst those for another remain as they were for several years. Co-ordinated changes would work best for global industry.
f. Apparent disconnect between policy and action: the few high-level policy
statements that call for alignment50 are not translated into direct guidance to the committees of experts charged with actually writing and modifying policy
requirements, and when those committees meet they often have other priorities.
3. Perceived risks from harmonised or aligned MEPS and labelling schemes In approximate descending order of significance:
50 Examples of policy statements supporting closer alignment include the 'Annual Union work programme for
European standardisation' (COM(2013) 561 final) and the draft Transatlantic Trade and Investment
Partnership (TTIP).

European Commission Savings and benefits of global regulations for energy efficient products
September 2015
c58
a. Damage to local industry through increased competition as technical barriers to
trade are reduced, see also section 3.2.4. b. Concern on reduced availability of familiar products after changes, if new policies
or test requirements mean old approaches can no longer be used and product design has to evolve. Often product design is significantly shaped by local policy
requirements that have existed for many years, see also section 3.3.2. c. A change of test method can lead to discontinuity of historical performance data so
that performance trends cannot easily be tracked for the benefit of policy-makers
and experts. d. Changes can require investment in testing and enforcement infrastructure
necessary to implement the changes.
4. Insignificant barriers Some potential barriers do not pose a problem in practice, such as those listed below:
a. Language: The need for different languages is obvious, but is not relevant to technical specifications and test methods – standards are translated between
languages without significant problems.
b. Units: Use of different units of measurement, as not all regions use SI units. Applying simple factors to convert metrics that are fundamentally identical but use
different units is straight forward and is not an aspect that is necessary to harmonise. For example, kWh per cubic foot for the US can easily be converted
into kWh per litre for the EU. c. Variations in stringency between coherent testing and policy approaches:
It is important to recognise that policy requirements can be harmonised as coherent and comparable, even if they are not set at the same level of stringency:
level of stringency is a separate decision to the test method that underpins it.
Policy requirements in India can be directly compared with those in the US if the underlying test method gives comparable results. It is a matter for local economic
justification, policy ambition, technology availability, industrial policy etc. to influence a decision on stringency.
d. Lack of formal mechanisms: There is no lack of formal mechanisms for
policymakers, experts and industry to co-operate between regions towards alignment, even if these are not widely exploited for the purpose. IEC and ISO
exist for this reason; policy makers meet through IEA, SEAD, ASEAN and other international frameworks. There are proposals to create additional formal
mechanisms for this purpose in the proposed Transatlantic Trade and Investment Partnership (TTIP) between the EU and the US51: TTIP affirms a desire for EU and
US regulators to work more closely together to develop new regulations. It proposes to do this internationally through setting up a Regulatory Co-operation
Body. In conclusion on barriers to harmonisation: whilst many barriers exist, harmonisation
is only necessary up to the point where there is coherence and comparability of policy approaches and standards between economies. If harmonisation is given appropriate
political priority that results in availability of necessary technical resources, many of these barriers can be overcome.
51 See "Regulatory cooperation in TTIP: Cutting red tape for EU firms – without cutting corners", EU fact
sheet on TTIP, available from http://trade.ec.europa.eu/doclib/press/index.cfm?id=1230, accessed 25
February 2015.

European Commission Savings and benefits of global regulations for energy efficient products
September 2015
c59
5 Overall merits of harmonisation The previous chapters explored the potential impacts of greater global harmonisation
of technical standards and product energy efficiency requirements, and the barriers to achieving greater harmonisation in practice. On the basis of the analysis we conclude
that:
Significant global energy saving benefits can be achieved - for example
13% gross global energy savings in 2030: if global MEPS were agreed at current most stringent levels and implemented by 2020. Savings would be
experienced across all countries and regions and across a large range of product groups.
o Savings would remain significant even taking a likely rebound effect into account – estimated from literature review at 20%.
o Consumer electronics and ICT, lighting and (thermal) heating and hot
water products offer the highest relative and absolute energy saving potential.
o If the highest current MEPS were already applied globally, then gross energy savings would be 21%, or 34% if highest label requirements
were also applied. This demonstrates that energy savings can be increased if alignment also included energy labels.
Reducing energy use would also have important GHG mitigation and environmental benefits: these impacts would fall proportionally with the
energy savings, i.e. 13-14% reductions in all impacts in the CoNW MEPS 2030
scenario. Benefits to global emissions are estimated at reduction of 4,450 MtCO2e in this scenario, or 7% of 2030 total global BAU52 emissions.
Important benefits to air quality (reduction in particulate emissions) and environmental quality (reduction in acidifying emissions) would also result from
lower energy use. Improved efficiency would bring economic benefits to end-consumers
and the wider economy: this applies to end-consumers in the residential, tertiary and industrial sectors where products in these sectors are regulated.
Economic benefits will arise from the increased consumption and production
opportunities granted by energy savings and also the indirect economic impact of the savings being re-spent elsewhere in the wider economy. The benefits
already take into account the additional costs of more efficient products, assessed to typically be no more than 25% of the value of the total energy
savings. The value of potential energy savings are assessed to be €280-410 billion per year globally, or savings of 8-13% compared to a 2030 BAU,
assuming today’s energy prices. o Reduced energy use would result in structural economic change,
reducing the relative size of the energy sector, while increasing the size
of other sectors, including the appliance manufacturing industry. o Appliance manufacturers in the EU would be particularly likely to benefit
from increased global energy efficiency requirements due to a leading position in energy efficiency.
o Trade impacts would also occur, with reductions in energy imports anticipated, particularly gas for heating and other fuels for electricity
generation. This would be beneficial for the trade balances of net energy
52 BAU = Business as usual, i.e. continuing current trends, policies and practices

European Commission Savings and benefits of global regulations for energy efficient products
September 2015
c60
importers such as the EU, also contributing to increased energy
security. o Economic savings will also be experienced by implementing agencies
and policymakers as costs and information are shared and inefficiencies and parallel or duplicate processes reduced.
Economic savings will have a positive net employment impact: while jobs may be lost in the energy sector as energy consumption is reduced the re-
spending of economic savings will create more jobs in other economic sectors.
The balance of these changes is positive due to the relatively low labour requirement per unit of turnover of the energy sector in comparison to the
wider economy. The global impact in the CoNW MEPS 2030 scenario is estimated to result in 1.7-2.5 million additional jobs compared to the 2030
BAU. o Changes in skills requirements will go hand-in-hand with the changes in
employment. It is likely that some highly skilled jobs would be lost in the energy sector, with the new jobs being created having a broader
range of skills needs, particularly in the services sector.
Harmonising requirements would reduce trade barriers: which increasingly take the form of non-tariff or technical barriers, such as product
standards and performance requirements including MEPS and labels. Reducing these barriers could be of particular benefit to EU firms which export these
products. Negotiations at the WTO or on free trade agreements could already be used to start the harmonisation process.
Competitiveness impacts are relatively low and can be mitigated: the impacts on manufacturing costs, compliance costs, product prices and markets
are assessed to either be beneficial or generally low, although impacts differ
within the various markets. Impacts are least for international Original Equipment Manufacturers (OEMs), but greater for large manufacturers and
SMEs operating at a national level in previously unregulated markets, which will need to adjust to the new situation. To mitigate these issues it is crucial
therefore that firms are given adequate time to adjust to any new harmonisation of requirements.
Harmonised requirements could positively influence investment in innovation, innovation speed and its focus on energy efficiency: the
extent to which these influences occur is a factor of the ambition (stringency)
of the requirements. Although it is also important to strike a balance between stringency and competitiveness, as more stringent requirements are likely to
require greater innovation efforts (reducing competitiveness), particularly from large manufacturers and SMEs operating at a national level in previously
unregulated markets. A combination of MEPS and labelling can provide a good way to raise efficiency at the bottom of the market and incentivise innovation
at the top. Consumers will benefit from efficiency savings over time, although
affordability may be an issue in some countries: particularly where low
energy prices, low usage and/or low incomes are present, as each of these act to reduce the financial savings from greater efficiency compared to the
increased product cost. Nevertheless existing evidence finds that product price increases have actually been significantly lower than anticipated due to a
variety of factors. Affordability impacts are therefore understood to be generally low, but could be mitigated by adopting a tiered approach to
requirements (see below). Product functionality can benefit from harmonised requirements: for
example increased efficiency can, in some cases, result in additional positive
impacts on product usability, reliability and features. E.g. efficient power supplies that generate less heat (safer) and are smaller and weigh less (less

European Commission Savings and benefits of global regulations for energy efficient products
September 2015
c61
materials used). At the same time requirements must be designed with
sensitivity to regional or national needs for functionality and also to clearly communicate the benefits of any core changes in function to avoid consumer
confusion and/or opposition.
Barriers to harmonisation exist but can be overcome: this work identified three important types of barriers to harmonisation.
o Regional barriers: based on real and perceived needs for differences
between regions, stemming from differences in climate, culture and market structure, user needs, tangential regulations (such as food
safety), simple historical accident and efforts to protect local markets. o Barriers to the process of change (harmonisation) itself: these include a
lack of motivation to change, a lack of time and technical resources, uncertainties, costs of re-testing or developing new products,
investment costs, update cycles being 'out of sync' between regions and disconnect between high-level policy and activities in technical
committees where foundations must be laid for harmonisation.
o Perceived barriers and risks: including potential damage to local industry from exposure to increased competition, the disappearance of
familiar products, discontinuity of data as test methods change. Some issues seen as barriers are actually insignificant in practice: examples
include language and units of measurement – translation for both is straight-forward and introduces little or no technical uncertainty.
In relation to barriers, aspiring for complete global harmonisation is neither realistic nor essential - a core requirement for harmonisation is simply the
coherence and comparability of test standards and policy approaches, and the
transparency necessary to identify and spread best practice standards and policies (including MEPS and energy labels).
It is clear that there are multiple overall benefits to global harmonisation of product
MEPS (and energy labels), and barriers, while important, can be overcome. The benefits are experienced differently per country/region, depending on a variety of
factors, including their starting point, energy consumption patterns, prices, climate, culture, energy system and industry. The EU is relatively well positioned to benefit
from such changes, particularly its appliance manufacturing industries. Although EU
benefits may be proportionally lower than other countries/regions, given its relatively high starting point, there still remain significant economic and environmental benefits
that can be achieved, for example in helping to reduce the need for energy imports.
The scale of the benefits (and any costs) will vary with the stringency of any global requirements, therefore this question remains important. International agreement to
implement MEPS at less stringent requirement levels may be easier, but will produce fewer benefits. Given the disparity in current requirements a tiered approach should
be considered, e.g. offering variations in MEPS per region and that these are
introduced over a reasonable timeframe, as this would help to overcome the concerns and barriers that remain.
In any case, this work has demonstrated the huge global potential benefits in energy
use, GHG emissions, environmental impacts and economically from greater alignment to more stringent MEPS and energy labels for energy-related products. It is clear that
further work in this area by the EU and other countries could be valuable in actually achieving these benefits.
While the main purpose of this work lies not in an investigation how harmonisation could be achieved, the pathway to this should involve at least, in broad terms:
European Commission Savings and benefits of global regulations for energy efficient products
September 2015
c62
Greater alignment of technical standards (test procedures, product groupings
and efficiency metrics); More engagement in international dialogues and fora; and
Capacity building in countries without existing standards and MEPS.

European Commission Savings and benefits of global regulations for energy efficient products
September 2015
c63
References General sources
ACEEE (2012) The rebound effect: large or small? ASAP (2012) The Efficiency Boom: Cashing In on the Savings from Appliance
Standards
CLASP’s global S&L database, http://clasp.ngo/en/Tools/Tools/SL_Search Ecofys (2012) Economic Benefits of the EU Ecodesign Directive
Ecofys, Waide Strategic Efficiency, ISR Coimbra University, Consumer Research Associates and Tait Consulting (2014) Impacts of the EU’s Ecodesign and Energy/Tyre
labelling legislation on third jurisdictions’ prepared for DG Energy Ecoinvent database: http://www.ecoinvent.org/database/database.html
IEA (2013) World Energy Outlook 2012 IEA (2015) Key world energy statistics 2014
IEA4E (2015) Achievements of appliance energy efficiency standards and labelling
programs: a global assessment ReCiPe LCIA method: http://www.lcia-recipe.net/
Waide, P. et al. CLASP (2011a) Opportunities for Success and CO2 Savings from Appliance Energy Efficiency Harmonization, www.clasponline.org
WRI CAIT (2015) http://cait.wri.org/historical
Economy specific references used in modelling:
EU
Molenbrook et al (June 2014), Final technical report: Evaluation of the Energy Labelling Directive and specific aspects of the Ecodesign Directive ENER/C3/2012-523,
http://www.energylabelevaluation.eu/tmce/Final_technical_report-Evaluation_ELD_ED_June_2014.pdf
VHK, 2014, ECODESIGN IMPACT ACCOUNTING Part 1, Specific contract No. ENER/C3/412-2010/FV575-2012/12/SI2.657835, Van Holsteijn en Kemna B.V.,
www.vhk.nl (Note this study was used as the reference for all EU product energy use except space
heating and water heating, where Ecofys data was used, and products that are not yet
subject to Ecodesign regulations, e.g. compressors, commercial refrigeration, etc.) Specific information on EU product policy from:
https://ec.europa.eu/energy/en/topics/energy-efficiency/energy-efficient-products http://www.eceee.org/ecodesign/products
http://www.coolproducts.eu/products http://www.eup-network.de/product-groups/overview-ecodesign/
China
CLASP 2013 Appliance Energy Efficiency Opportunities: China, CLASP,
www.clasponline.org CNIS 2015 White Paper on Appliance Energy Efficiency, China National Institute for
Standardisation, (in Chinese). Lane, K. (2013) China Product Prioritization & Energy Saving Potential, CLASP/Top 10
China, www.clasponline.org Letschert, V. et al (2012) Estimate of Cost-Effective Potential for Minimum Efficiency
Performance Standards in 13 Major World Economies, LBNL and CLASP, www.clasponline.org
Li, J, Yu, Y. & Zheng, S. 2014 Market Analysis of China Energy Efficient Products
(MACEEP), CLASP, www.clasponline.org
European Commission Savings and benefits of global regulations for energy efficient products
September 2015
c64
Zhou, N (2011) Analysis of Potential Energy Saving and CO2 Reduction of Home
Appliances and Commercial Equipment in China, LBNL-4607E, Lawrence Berkeley National Laboratory, China.
USA
DOE (2015), Department of Energy’s Appliance and Equipment Standards Program, energy.gov/eere/buildings/appliance-and-equipment-standards-program
EIA (2015), Annual Energy Outlook 2014, (including product energy shares projected
to 2045), Energy Information Bureau, www.eia.gov EIA (2015b) Residential Energy Consumption Survey,
www.eia.gov/consumption/residential/data/2009/ EIA (2015c) Commercial Buildings Energy Consumption Survey,
http://www.eia.gov/consumption/commercial/
India Bureau of Energy Efficiency (2015), beeindia.in
Bureau of Indian Standards, www.bis.org.in
Deshpande, A. et al, (2012) An Analysis of the Best Practices in Energy Efficiency Adopted by Indian Manufacturing Sector, paper presented at ECEEE Summer Study,
www.eceee.org Market Xcel 2013 Research Report: Designing A Superefficient Appliance (Sea) Label
For Super- Efficient Equipment Program (SEEP), CLASP, www.clasponline.org Saurabbh, D., 2014, Indian Electricity Scenario, Bureau of Energy Efficiency,
beeindia.in
RSA
Aggregate Energy Balance (2014), Department of Mines and Energy, energy.gov.za de la Rue du Can, Letschert, Leventis, Covary & Xia (2013) Energy Efficiency Country
Study: Republic of South Africa, LBNL StatsSA (2013) General Household Survey, Statistics South Africa, statssa.gov.sa
UNEP/CIDB (2009) Greenhouse Gas Emission Baselines and Reduction Potentials From Buildings in South Africa A Discussion Document, 2009 UNEP DTIE, Sustainable
Consumption & Production Branch CIDB, Construction Industry Development Board, Pretoria
Sources for product efficiency benchmarking references used in modelling CLASP www.clasponline.org
IEA 4E - Mapping & Benchmarking Annex, mappingandbenchmarking.iea-4e.org/ Plus many specific studies from:
Policy Partners (2014) Improving Global Comparability of Appliance Energy Efficiency Standards and Labels, www.clasponline.org
Super-efficient Equipment and Appliance Deployment Initiative, www.superefficient.org/
Trade, competitiveness and innovation references: Consumer Focus (2012) Under the influence? Consumer attitudes to buying appliances
and energy labels http://www.consumerfocus.org.uk/files/2012/12/Under-the-influence.pdf
CSES (March 2012), Evaluation of the Ecodesign Directive (2009/125/EC), Final Report
EC (2013) Trade, Growth and Jobs, contribution from the Commission to the February 2013 European Council debate on trade, growth and jobs, p4
EC (2015) OVERVIEW OF FTA AND OTHER TRADE NEGOTIATIONS, DG TRADE,
updated 17 February 2015

European Commission Savings and benefits of global regulations for energy efficient products
September 2015
c65
European Commission (2013), COMMISSION STAFF WORKING DOCUMENT: IMPACT
ASSESSMENT Accompanying Commission Regulation implementing Directive 2009/125/EC of the European Parliament and of the Council with regard to Ecodesign
requirements for vacuum cleaners, http://ec.europa.eu/smart-regulation/impact/ia_carried_out/docs/ia_2013/swd_2013_0240_en.pdf
Eurostat (2015) Euroindicators news release 30/2015 – 16 February 2015 Frontier Economics for the Office of Fair Trading (2008), The competition impact of
environmental product standards
Gallinat, Karpay Weyl et al (2015) High quality super-efficient lighting products: the SEAD Global Efficiency Medal”, eceee Summer Study Proceedings 2015
Janssens, C dric, Glass for Europe (2015) “Towards an EU energy labelling scheme for windows: insight and learning of the development phase of the first label for an
energy-related building product”,. eceee Summer Study Proceedings 2015 Larry Dale, Camille Antinori, Michael McNeil, James E. McMahon, K. Sydny Fujita
(2009), Retrospective evaluation of appliance price trends, in Energy policy, 37: 597-605 http://www.sciencedirect.com/science/article/pii/S0301421508005193
Mark Ellis, OECD/International Energy Agency (2007), Experience with energy
efficiency regulations for electrical equipment http://www.iea.org/publications/freepublications/publication/appliances_ellis.pdf
Policy Studies Institute & BIO Intelligence Service for the Department for Environment, Food and Rural Affairs (2011), Impacts of Innovation on the Regulatory
Costs of Energy-using Product Policy (SPMT09_045) Final Summary Report USITC (2014) Trade Barriers That U.S. Small and Medium-sized Enterprises Perceive
as Affecting Exports to the European Union, Investigation No. 332-541, Publication 4455, March 2014.
Affordability and functionality references: Adler PS and Clarke KB 1991 Behind the learning curve: a sketch of the learning
process Manage. Sci. 37 267–81 Allcott H and Greenstone M 2012 Is there an energy efficiency gap? (Cambridge:
National Bureau of Economic Research) (No. w17766) Available at www.nber.org/papers/w17766
Dale L, Antinori C, McNeil M, McMahon JE and Fujita S 2009 Retrospective evaluation of appliance price trends Energy Policy 37 597–605
Desroches L-B, Garbesi K, Kantner C, Van Buskirk R and Yang H C 2013 Incorporating
experience curves in appliance standards analysis Energy Policy 52 402–16 Ellis, M. 2007 Experience With Energy Efficiency Regulations For Electrical Equipment,
IEA Information Paper, http://www.iea.org/publications/freepublications/publication/experience-with-energy-
efficiency-requirements-for-electrical-equipment.html Geller H and Attali S 2005 The experience with energy efficiency policies and
programmes in iea countries: learning from the critics (Paris, France: Meeting of the International Energy Agency) Available at
www.iea.org/publications/freepublications/publication/IEAEnergyPolicies_Learning_fro
m_critics.pdf Gillingham K and Palmer K 2013 Bridging the Energy Efficiency Gap: Insights for Policy
from Economic Theory and Empirical Analysis (Washington, DC: Resources for the Future) Available at (Accessed 17 February 2014)
Gillingham K, Newell RG and Palmer K 2009 Energy efficiency policies: a retrospective examination Annu. Rev. Resour. Econ. 31 161–92
Gordon RJ 1990 The Measurement of Durable Goods Prices (Chicago, MI: University of Chicago Press)
Irwin DA and Klenow PJ 1994 Learning-by-doing spillovers in the semiconductor
industry J. Polit. Econ. 102 1200–27

European Commission Savings and benefits of global regulations for energy efficient products
September 2015
c66
McKinsey & Company 2009 Unlocking Energy Efficiency in the US Economy. Available
at www.mckinsey.com/client_service/electric_power_and_natural_gas/latest_thinking/un
locking_energy_efficiency_in_the_us_economy Meyers S et al 2003 Impacts of US federal energy efficiency standards for residential
appliances Energy 28 755–67 Nadel S and deLaski A 2013 Appliance Standards: Comparing Predicted and Observed
Prices (Washington, DC: ACEEE) Available at www.appliance-
standards.org/sites/default/files/Appliance_Standards_Comparing_Predicted_Expected_Prices.pdf,
Neubauer M et al 2009 Ka-BOOM! The power of appliance standards: opportunities for new federal appliance and equipment standards, Research Report A091, American
Council for an Energy-Efficient Economy, Available at www.aceee.org/research-report/a091
Newell RG and Siikamäki JV 2013 Nudging Energy Efficiency Behaviour: The Role of Information Labels (Cambridge: National Bureau of Economic Research) Available at
www.nber.org/papers/w19224,
Newell RG, Jaffe AB and Stavins RN 1999 The induced innovation hypothesis and energy-saving technological change Q. J. Econ. 114 941–75
Spurlock CA 2013 Appliance Efficiency Standards and Price Discrimination (Berkeley, CA: Ernest Orlando Lawrence Berkeley National Laboratory) Available at
http://eande.lbl.gov/sites/all/files/appliance_efficiency_standards_and_price_discrimination_lbnl6283e.pdf,
Van Buskirk R 2013 Modelling the dynamics of appliance price efficiency distributions, ECEEE summer study 2013. Available at
http://proceedings.eceee.org/visabstrakt.php?event=3&doc=6-289-13
Van Buskirk, R., Kantner, C., Gerke B. & Chu, S. 2014 A retrospective investigation of energy efficiency standards: policies may have accelerated long term declines in
appliance costs Environmental Research Letters, Volume 9, Number 11 http://iopscience.iop.org/article/10.1088/1748-
9326/9/11/114010;jsessionid=1F87C5DE25846A7EFB1ABB773B891178.c1 Weiss M, Junginger HM and Patel MK 2008 Learning Energy Efficiency: Experience
Curves for Household Appliances and Space Heating, Cooling, and Lighting Technologies (Utrecht, Netherlands: Utrecht University) Available at
http://dspace.library.uu.nl/handle/1874/32937,
Weiss M, Patel M K, Junginger M and Blok K 2010 Analyzing price and efficiency dynamics of large appliances with the experience curve approach Energy Policy 38
770–83 Wimberly, J., EcoPinion / Ecoalign (2011), Lighting the Path Forward for Greater
Energy Efficiency - Survey Report • Issue 10
Barriers references EC (2013) Annual Union work programme for European standardisation' (COM(2013)
561 final)
EC (2015) Regulatory cooperation in TTIP: Cutting red tape for EU firms – without cutting corners", EU fact sheet on TTIP, available from
http://trade.ec.europa.eu/doclib/press/index.cfm?id=1230, accessed 25 February 2015
IEA 4E (2015) Mapping and Benchmarking in 2014 IEA 4E (2015) Policy benchmarking for Packaged Liquid Chillers and evaluating the
lack of comparability between economies, 4 August 2015, available from http://mappingandbenchmarking.iea-4e.org/matrix?type=product&id=17.
WTO (2015) https://www.wto.org/english/tratop_e/tbt_e/tbt_e.htm

European Commission Savings and benefits of global regulations for energy efficient products
September 2015
c67
Annex I: Description of model and modelling
methodology
This annex discusses the modelling methodology and scenarios used for the quantitative analysis presented in-depth in Annexes I and II.
Model design and structure
The model logic is a hybrid top-down linked to a quasi-bottom up approach: Bottom up: To help analyse the impacts of higher-efficiency equipment scenarios a
bottom-up model of equipment energy use was developed. The model is established to separately analyse energy consumption and the impact of changes
in equipment energy efficiency in each of China, the EU, India, the Republic of South Africa and the USA.
Top down: The model takes top down data on energy use by sector (residential, tertiary, industrial) and fuel (electricity, oil, gas) from the IEA’s World Energy
Outlook for 2010, 2020 and 2030 for the Current Policies scenario. This is assumed
to be the base case (Business as Usual) scenario as it has been developed through a careful and extensively reviewed analysis of macroeconomic and econometric
trends linked to a scrutiny of the on-going impact of policies and measures which have already been adopted.
The model treats equipment energy use separately in each of the residential, tertiary
and industrial sectors. In the residential and tertiary sectors it models all final energy forms (electricity, gas, oil) whereas in the industrial sector it only treats electricity as
used in motive power applications (~70% of industrial electricity use) and in
transformers. It does not model other fuels, process heat or other electricity uses (such as arc furnaces) in the industrial sector, nor does it deal with district heating in
the residential or tertiary sectors.
Bottom-up energy consumption For each of the principal economies analysed (China, EU, India, South Africa and the
USA) bottom-up data is assembled on the share of energy consumption by end use within each primary sector (residential, tertiary and industrial) and applied using an
attribution approach to proportion that energy by specific equipment end-use for each
principal sector and fuel (electricity, gas/LPG or oil). In most cases for the five economies analysed in depth this attribution is based on existing studies of the
breakdown of energy consumption by end-use and most notably from the sources in the footnote.53 In cases where there is no available data on the consumption by an
53 Opportunities for Success and CO2 Savings from Appliance Energy Efficiency Harmonization, Waide P. et
al, (2011) http://www.clasponline.org/en/Resources/Resources/PublicationLibrary/2011/Opportunities-for-
appliance-EE-harmonization.aspx
ECODESIGN IMPACT ACCOUNTING Part 1 – Status; Van Holsteijn en Kemna, Specific contract No.
ENER/C3/412-2010/FV575-2012/12/SI2.657835 for DG Energy, November 2013
CNIS. (2012). White paper for the energy efficiency status of China energy-use products. Beijing: China
Standards Press.
Development and implementation of energy efficiency standards and labelling programs in China: Progress
and challenges, Zhou, Nan, Nina Khanna, David Fridley, and John Romankiewicz, LBNL China Energy Group,
(2013), https://china.lbl.gov/publications/development-and-implementation-energy
Report On “Verified Energy Savings with the Activities of “Bureau of Energy Efficiency” For the year 2009-
10, Bureau of Energy Efficiency,
http://www.beeindia.in/content.php?page=miscellaneous/energy_savings_achieved.php
BUENAS Scenarios Estimate Cost-Effective and Technical Savings Potential for MEPS in 13 Major World
Economies, Mc Neil et al, CLASP, (2012),

European Commission Savings and benefits of global regulations for energy efficient products
September 2015
c68
end-use in one of these economies the share taken by the end-use is approximated by
assuming it accounts for the same share as in a proxy economy where the share is known. In the case of the Rest of the World this proxy economy approach is used,
typically by weighting the share of the top down sector level fuel consumption estimates taken by the end use by a weighted blend of the shares taken in the five
economies analysed in depth.
In this way, estimates of the energy consumed by end use in the base year (2010) are
determined for the equipment types shown in Table A53 in each principal economy and the Rest of the World.
http://www.clasponline.org/en/Resources/Resources/PublicationLibrary/2012/BUENAS-Scenario-BAT-
CEP.aspx
For the USA a variety of resources at the USDOE site http://energy.gov/eere/buildings/appliance-and-
equipment-standards-program , the Appliance Standards Awareness Program site http://www.appliance-
standards.org/reports and the Energy Information Administration’s Annual Energy Outlook
http://www.eia.gov/forecasts/aeo/

European Commission Savings and benefits of global regulations for energy efficient products
September 2015
c69
Table A53: Equipment types for which energy end-use is modelled in-depth (bolded) or indirectly (plain text)
Sector Lighting Electronics White goods Industrial products54 Air conditioning Heat supply
Residential
Omni-directional socket lamps (GLS, Halogen, CFL, LED) Directional socket lamps (GLS, Halogen, CFL, LED) Linear fluorescent lamps, ballasts
Consumer electronics – TVs, decoders/set-top boxes, HiFi, external power supplies, VCR/DVD players, game stations ICT – Desktops, notebooks, tablets, monitors, printers, Multi-function devices, routers
Refrigerators, freezers, clothes washers, dishwashers, dryers Cooking appliances – hobs (gas/electric), ovens (gas/electric), microwaves, combination ovens, range hoods
Ventilation – ceiling fans, extractor fans, others Air conditioning – room air conditioners, central air conditioners
Boilers and furnaces – gas Boilers and furnaces – oil Boilers and furnaces – electric (resistance, heat pump) Boilers – circulation pumps Water heaters – electric (storage, instantaneous) Water heaters – gas (storage, instantaneous)
Tertiary
Omni-directional
socket lamps (GLS, Halogen, CFL, LED) Directional socket lamps (GLS, Halogen, CFL, LED) Linear fluorescent lamps, ballasts High intensity discharge lamps (Mercury vapour, sodium, metal halide and ceramic metal halide lamps, ballasts) Note, in the tertiary sector indoor and outdoor lighting applications are treated independently
ICT – Servers, Desktops, notebooks, monitors, printers, Multi-function devices, routers
Refrigeration – self-contained, remote Laundry – clothes washers, dishwashers, dryers Cooking appliances –gas, electric
Ventilation – Air handling units (AHU), other Air conditioning – room air conditioners, central air conditioners, chillers
Boilers – gas Boilers – oil Boilers – electric (resistance, heat pump) Boilers – circulation pumps Water heating – electric Water heating – gas
Industrial
Electric motors – AC
(0.75-375kW, <0.75kW, >375 kW), special motors, VSDs Industrial ventilation Compressors Pumps Transformers – distribution, power
Note: Bolded equipment are those that were fully analysed for the results presented in this report
54 Motors, pumps, fans, compressors
European Commission Savings and benefits of global regulations for energy efficient products
September 2015
c70
In total a 102 specific-end uses that are treated within the model. This division by
end-use is adopted because it broadly matches the breakdown of energy efficiency regulations by product type applied in the economies considered. In a few specific
cases, energy consumption data was not identified for the end-uses indicated above. This situation is most common for South Africa where the data sources are less
abundant, but also in some instances for India and China. By contrast data in the EU and USA was comprehensive for all the above end uses. Whenever data on a specific
end-use was not available, the same proportion of energy use as in a peer economy
was assumed for the economy where the data is missing. Professional judgement was used in the few cases where it was necessary to apply such matching between the
economies.
Once the energy consumption by equipment type is known in the base year (2010) it was then projected forwards in time (up to 2035 depending on the scenario
considered). The approach taken for the analysis was to assume that the end-use takes the same share of its specific fuel consumption (gas, oil, or electricity) for the
sector it operates in (residential, tertiary or industrial) in future years as it does in the
base year. Under the base case scenario the total fuel consumption by fuel type and sector is assumed to match that forecast in the IEA‘s Current Policies scenario; thus,
the consumption for the specific equipment is assumed to be the same proportion of the total in any future year in question as it takes in 2010. E.g. if domestic
refrigerators took 15% of residential electricity consumption for an economy in 2010 under the base case scenario it is assumed they take the same proportion of
residential electricity consumption in any given future year. This approach is a necessary simplification of actual stock dynamics, required in order for the analysis to
be completed within the available resources. In some instances where clear
projections of stock dynamics are known these are taken into account. For example, the EU and US scenarios are based on the projections made in studies conducted for
the European Commission and US Department of Energy respectively and are integrated into the scenarios used in this model. Many of the most important Chinese
energy end-use projections also take account of projected stock dynamics from recently published analyses.
Estimating efficiency levels
The information on equipment efficiency levels is drawn from a variety of sources
including those mentioned in the previous footnote. In practice it was not feasible within the available project resources to gather data and conduct a detailed analysis of
all the 102 end-uses for which energy consumption data is gathered. Accordingly, the approach taken was to select a sub-set of product types for a full analysis and then to
apply proxy efficiency assumptions for the remaining product types. For example, the products in bold in Table A53 are analysed in depth and those not in bold are assumed
to follow the same efficiency trends as proxy products or to have a simplified analysis applied based on differences observed in a subset of the economies.
The efficiency data used included the efficiency (efficiency unit varying by product group) of:
the average of the stock in 2010; the average of new products in 2010;
the minimum MEPS levels (broken down into up to four tiers whenever the application of MEPS is specified in tiers);
the maximum energy label threshold; and, the annual autonomous energy efficiency improvement rate.

European Commission Savings and benefits of global regulations for energy efficient products
September 2015
c71
The data was first gathered using the locally applied energy efficiency metric (i.e.
using the units of energy efficiency adopted in that economy and as measured using the locally applied test procedures).
In order to facilitate comparison of the efficiency levels across economies these local
efficiency levels were then mapped onto a common international scale. The approach taken varies considerably by product type. In some cases, such as electric motors and
lamps, the efficiency test procedures and metrics applied internationally are directly
comparable and thus the local units are essentially the same as the international ones. In other cases, such as for domestic refrigerators or seasonal energy efficiency metrics
for air conditioners, there can be substantial local differences. Derivation of common international comparisons then requires a conversion algorithm to be applied to
convert the local efficiency levels into common international levels. This has been possible building upon a substantial body of work conducted to facilitate such
international benchmarking - most notably in a variety of studies done by CLASP, SEAD and the IEA 4E. The present analysis draws heavily upon these and in particular
from the synthesis of such work reported in the studies listed in the footnote55. Nonetheless, these benchmarking studies are not comprehensive in that they do not
cover all end-uses. For the products analysed, this was found to be the case for space heating and water heating. As a result a different approach is taken for these end-uses
as described further below. All other products either use common international efficiency metrics or were converted to common levels using benchmarking conversion
formulae.
In the specific cases of space and water heating there is considerable variation by
economy in the technologies deployed and the test procedures and performance metrics used. This makes comparability of product efficiency across economies much
more challenging. As previously mentioned, there are no existing benchmarking studies for space and water heating and thus the detailed technical work which would
be needed to enable comparison of efficiency levels across economies to be considered has not been undertaken. It was not within the scope of this work to undertake such
work. The approach taken to resolve this issue is to make an assumption of a level of direct comparability between the performance levels reported via the different test
procedures but then to temper this based on professional knowledge and experience.
This was then translated into a framework of comparable efficiency ratings per heating technology type and applied to each country/region on the basis of an analysis of the
share of each technology type used. In this way comparable starting points, the potential impact of requirements and improvement potentials could be calculated.
Treatment of the scenarios considered
The four scenarios that were modelled are as follows:
Business as Usual (BAU) scenario
The BAU scenario considers how much energy would be used by each product type in each economy if energy efficiency policies which have currently been adopted are
implemented but no new policies are adopted and implemented thereafter. In the
55 CLASP and The Policy Partners Compare Global Appliance Energy Efficiency Standards and Labels,
http://www.clasponline.org/en/Resources/Resources/PublicationLibrary/2014/CLASP-Report-Compares-
Global-Standards-and-Labels.aspx
Opportunities for Success and CO2 Savings from Appliance Energy Efficiency Harmonization, Waide P. et al,
(2011) http://www.clasponline.org/en/Resources/Resources/PublicationLibrary/2011/Opportunities-for-
appliance-EE-harmonization.aspx

European Commission Savings and benefits of global regulations for energy efficient products
September 2015
c72
event no product efficiency policies have been adopted this scenario projects the
energy consumption as would be expected due to autonomous energy efficiency improvements, i.e. due to unregulated market forces.
Cost of Non World MEPS 2015 scenario
This scenario considers how much energy would be consumed were the average efficiency of products used today (2015) to be at the level equal to the most ambitious
currently promulgated minimum energy performance standards (MEPS). This Cost of
Non World scenario is completely hypothetical in that it is now too late for it to actually happen; however, it is informative in indicating the magnitude of savings that
would have been delivered today had the most ambitious minimum energy performance standards policies been adopted in the recent past on an internationally
harmonised basis.
Cost of Non World MEPS + High Label 2015 scenario This scenario considers how much energy would be consumed were the average
efficiency of products used today (2015) to be either at the level equal to the most
ambitious currently promulgated minimum energy performance standards (MEPS) or at the level equal to the most ambitious currently promulgated energy label threshold
(i.e. the so-called “High Label” requirement), whichever is most ambitious. This Cost of Non World scenario is purely hypothetical in that it is now too late for it to actually
happen; however, it is also informative in indicating the magnitude of savings that would have been delivered today had the most ambitious minimum energy
performance standards and labelling policies been adopted in the recent past on an internationally harmonised basis.
Cost of Non World MEPS 2030 scenario This scenario is different to the two 2015 Cost of Non World scenarios in that it is a
plausible scenario that could yet be actualised. It projects how much energy would be consumed in 2030 were the average efficiency of products sold in the future to be at
the level equal to the most ambitious currently promulgated minimum energy performance standards (MEPS). It explicitly takes into account the minimum realistic
period it would take for all economies to adopt and implement these regulations (typically assumed to be about 5 years i.e. from 2020 onwards) and of the degree to
which the stock of equipment in 2030 would be influenced by these regulations. Thus,
it takes into account the fact that only a proportion of the equipment stock in 2030 would be affected by these regulations as some proportion of the equipment stock
would have been sold prior to the regulations coming into effect i.e. would not have been retired from service by 2030. This scenario gives an indication of how much
energy could be saved by 2030 were there to be broadly based international agreement to adopt the world’s most demanding MEPS from 2015 by circa 2020.
Energy savings for each of the three policy scenarios are derived by comparison with
the relevant Business as Usual scenario. The BAU in 2015 is calculated by projecting
the 2010 equipment stock efficiency levels to 2015. This is done by taking the 2010 stock efficiency levels for each equipment type and applying the estimated annual
autonomous energy efficiency improvement estimates for the intervening years (i.e. for the 5 years from 2010 to 2015). The energy savings are then estimated by
comparing the efficiency of the stock projected to 2015 with the efficiency of the most ambitious currently promulgated MEPS for the CoNW 2015 MEPS scenario or with the
currently promulgated high energy label thresholds (or MEPS if there are no high label requirements) for the CoNW MEPS + High Label 2015 scenario. The sectoral (i.e.
residential, tertiary or industrial) level energy consumption under the BAU scenario
matches the consumption by fuel (electricity, gas or oil) of the IEA’s Current Policies scenario from the World Energy Outlook. The IEA scenario takes account of macro

European Commission Savings and benefits of global regulations for energy efficient products
September 2015
c73
level drivers such as GDP, population, energy prices, income and price elasticity of
demand as well as other policies such as fiscal measures and incentives.
The two Cost of Non World 2015 scenarios are only partially time dynamic as they do not require a simulation of the replacement of the stock in response to higher
efficiency requirements being set for new products as old products are steadily retired. Real world scenarios are time dynamic, however, and therefore the Cost of Non World
MEPS 2030 scenario takes account of this by including a proper treatment of time
dependent effects. Specifically, it considers the likely delay necessary for other economies to adopt the world’s most stringent MEPS as promulgated in 2015 and
generally assumes there is a five year delay before they come into effect in other economies. Secondly, it simulates the effect of time on the proportion of the stock
which will be affected by the adoption of these MEPS by 2030 by assuming the product stock follows a typical S-curve survival function. If a product type has a short life
average life expectancy, e.g. of typically less than a few years for incandescent lamps, then most or all of the stock in 2030 would be expected to be replaced by products
that comply with the MEPS requirement (assuming they come into effect in 2020).
However, for most product types considered the average life expectancy is longer, i.e. from 7 to 30 years depending on the product type, and in these cases only a
proportion of the stock in 2030 would be purchased after the regulatory requirements come into effect. The model estimates this proportion for each product type.
Furthermore, even without new policy measures the efficiency of products is unlikely to be static as market forces will still tend to act to improve energy efficiency, albeit at
a lower rate of improvement than achieved by the highest 2015 MEPS. This is captured in the BAU scenario and thus for all these reasons the relative energy
savings in 2030 under the Cost of Non World MEPS 2030 scenario will be less than
they are in the purely hypothetical Cost of Non World MEPS 2015 scenario.
Proxy data for rest of world
Beyond the five economies analysed in-depth the rest of the world region is treated as
if the efficiency of products sold there and their relative importance to overall energy consumption are similar to the cases found among the five economies. With respect to
product efficiency levels in actuality the Rest of the World encompasses a blend of economies that have quite extensive energy efficiency MEPS and labelling
requirements, such as found in Australia, Brazil, Canada, Japan, Jordan, Korea,
Mexico, New Zealand, Russia, Turkey for example, those economies that have some requirements but the number of products covered is intermediate and those that have
no requirements. In total there are 164 countries within the Rest of the World group and generally the efficiency of products sold there is considered for modelling
purposes to be an average of that sold in India and South Africa.
The share of energy consumption by product type will also vary among these 164 economies. The approach adopted in the model takes account of the major differences
by sector and fuel type through aligning with the IEA’s Current Policies scenario
projections at this level for the BAU scenario (i.e. through alignment of energy consumption by fuel (electricity, gas/LPG and oil) and sector (residential, tertiary,
commercial). The sub-division of consumption by energy end use within these constraints is determined by attribution. The model assumes the ROW group has a
proportion of energy consumption by end-use that is a blended share of the within OECD economies (e.g. the EU and USA) and the beyond OECD economies (e.g. China,
India, South Africa). In this way a plausible estimate of the division of consumption by end-use is derived without recourse to individual modelling of each economy, which
was beyond the means of this study.

European Commission Savings and benefits of global regulations for energy efficient products
September 2015
c74
Model outputs
The model produces results with respect to the final energy consumption of each equipment type and fuel considered for the residential, tertiary and industrial sectors.
Although 102 end-uses are simulated in some level of detail the results are reported in a more aggregate format for usability in Annexes II and III.
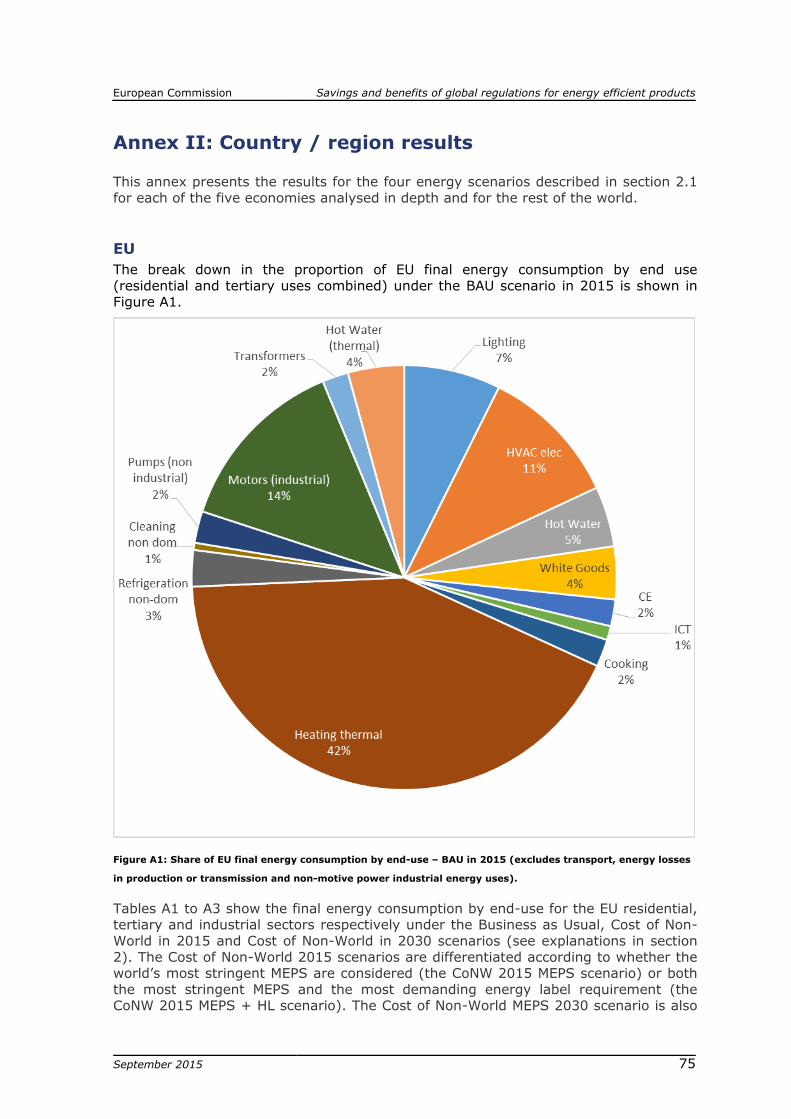
European Commission Savings and benefits of global regulations for energy efficient products
September 2015
c75
Annex II: Country / region results This annex presents the results for the four energy scenarios described in section 2.1
for each of the five economies analysed in depth and for the rest of the world.
EU
The break down in the proportion of EU final energy consumption by end use
(residential and tertiary uses combined) under the BAU scenario in 2015 is shown in Figure A1.
Figure A1: Share of EU final energy consumption by end-use – BAU in 2015 (excludes transport, energy losses
in production or transmission and non-motive power industrial energy uses).
Tables A1 to A3 show the final energy consumption by end-use for the EU residential, tertiary and industrial sectors respectively under the Business as Usual, Cost of Non-
World in 2015 and Cost of Non-World in 2030 scenarios (see explanations in section
2). The Cost of Non-World 2015 scenarios are differentiated according to whether the world’s most stringent MEPS are considered (the CoNW 2015 MEPS scenario) or both
the most stringent MEPS and the most demanding energy label requirement (the CoNW 2015 MEPS + HL scenario). The Cost of Non-World MEPS 2030 scenario is also

European Commission Savings and benefits of global regulations for energy efficient products
September 2015
c76
shown, which indicates the savings that would be expected in 2030 were today’s most
stringent MEPS to be adopted under a plausible timeframe from today and allowing for expected autonomous efficiency improvements plus the time it would take for the
stock of energy using equipment to be replaced. Table A4 shows the aggregate energy consumption and savings expected from all the sectors and end-uses considered under
each scenario.
Table A1: EU residential sector final energy use
Product
group
BAU1
2015
CoNW MEPS 20152 CoNW MEPS + HL
20153
BAU
2030
CoNW MEPS 20304
TWh TWh % saving TWh % saving TWh TWh % saving
Electric end-uses
Lighting 125 72 43% 40 68% 94 62 34%
Electric (resistance/HPs) 178 168 6% 168 6% 178 171 4%
Circ. Pumps 58 26 55% 26 55% 66 35 48%
Ventilation 16 12 27% 12 27% 18 15 18%
AC 33 26 22% 13 60% 49 42 14%
Electric 127 118 7% 53 58% 130 122 6%
Refrigerators 126 110 13% 59 53% 127 113 11%
Clothes Washers 42 41 2% 37 13% 33 33 1%
Clothes Dryers 29 20 30% 6 79% 33 25 26%
Dishwashers 27 27 2% 21 23% 36 36 1%
CE/TVs 113 34 70% 25 78% 98 39 60%
ICT/PCs 27 19 31% 13 52% 22 16 27%
Electric 40 36 9% 35 10% 44 40 8%
Total 941 709 25% 508 46% 930 749 19%
Thermal end-uses
Heating 1686 1367 19% 1021 39% 1410 1231 13%
Hot Water 169 130 23% 103 39% 218 184 16%
Cooking 26 24 10% 24 10% 22 21 6%
Total 1881 1521 19% 1148 39% 1650 1435 13%
1 BAU = Business as Usual scenario, 2 = CoNW MEPS 2015 is the Cost of Non World MEPS in 2015 static
scenario, 3 CoNW MEPS + HL 2015 is the Cost of Non World MEPS and High Label static scenario in 2015, 4
= CoNW MEPS 2030 is the Cost of Non World MEPS in 2030 time dynamic scenario

European Commission Savings and benefits of global regulations for energy efficient products
September 2015
c77
Table A2: EU tertiary sector final energy use
Product
group
BAU1
2015
CoNW MEPS 20152 CoNW MEPS + HL
20153
BAU
2030
CoNW MEPS 20304
TWh TWh % saving TWh % saving TWh TWh % saving
Electric end-uses
Lighting 286 264 8% 245 14% 211 199 6%
Resistance/HPs 182 148 18% 148 18% 182 155 15%
AHU/Other 94 68 27% 68 27% 114 89 22%
Central/RAC/Chillers 94 79 16% 79 16% 108 89 17%
Hot water systems 129 125 4% 54 58% 132 129 3%
Refrigeration 155 141 9% 130 16% 183 170 7%
Cleaning 30 29 5% 24 20% 31 30 4%
ICT 32 24 26% 21 35% 26 20 21%
Cooking 40 40 0% 40 0% 45 45 0%
Pumps 77 62 19% 62 19% 87 74 15%
Total 1119 980 12% 872 22% 1119 999 11%
Thermal end-uses
Heating 685 568 17% 442 35% 573 507 11%
Hot Water 69 54 21% 44 35% 88 76 14%
Cooking 11 11 0% 11 0% 16 16 0%
Total 765 634 17% 497 35% 678 600 12%
1 BAU = Business as Usual scenario, 2 = CoNW MEPS 2015 is the Cost of Non World MEPS in 2015 static
scenario, 3 CoNW MEPS + HL 2015 is the Cost of Non World MEPS and High Label static scenario in 2015, 4
= CoNW MEPS 2030 is the Cost of Non World MEPS in 2030 time dynamic scenario
Table A3: EU industrial sector final energy use
Product
group
BAU1
2015
CoNW MEPS 20152 CoNW MEPS + HL
20153
BAU
2030
CoNW MEPS 20304
TWh TWh % saving TWh % saving TWh TWh % saving
Electric end-uses
Mechanical movement 291 277 5% 281 3% 469 469 0%
Fans 122 100 18% 102 17% 198 179 9%
Compressors 191 181 5% 183 4% 309 307 1%
Pumps 161 149 7% 151 6% 259 254 2%
Total 765 708 8% 717 6% 1234 1209 2%
Transformers
Energy losses 111 79 29% 52 53% 192.8 165 14%
1 BAU = Business as Usual scenario, 2 = CoNW MEPS 2015 is the Cost of Non World MEPS in 2015 static
scenario, 3 CoNW MEPS + HL 2015 is the Cost of Non World MEPS and High Label static scenario in 2015, 4
= CoNW MEPS 2030 is the Cost of Non World MEPS in 2030 time dynamic scenario

European Commission Savings and benefits of global regulations for energy efficient products
September 2015
c78
Table A4: All sectors EU final energy use (i.e. sum of Energy use from Tables A1 to A3)
BAU1
2015
CoNW MEPS 20152 CoNW MEPS + HL
20153
BAU
2030
CoNW MEPS 20304
Total 5471 4511 18% 3720 32% 5612 4969 11%
1 BAU = Business as Usual scenario, 2 = CoNW MEPS 2015 is the Cost of Non World MEPS in 2015 static
scenario, 3 CoNW MEPS + HL 2015 is the Cost of Non World MEPS and High Label static scenario in 2015, 4
= CoNW MEPS 2030 is the Cost of Non World MEPS in 2030 time dynamic scenario
USA
The break down in the proportion of US final energy consumption by end use under
the BAU scenario in 2015 is shown in Figure A2.
Figure A2: Share of US final energy consumption by end-use – BAU in 2015 (excludes transport, energy losses
in production or transmission and non-motive power industrial energy uses).
Tables A5 to A7 show the final energy consumption by end-use for the US residential,
tertiary and industrial sectors respectively under the Business as Usual, Cost of Non-World in 2015 and Cost of Non-World in 2030 scenarios (see explanations in section
2). The Cost of Non-World 2015 scenarios are differentiated according to whether the world’s most stringent MEPS are considered (the CoNW 2015 MEPS scenario) or both

European Commission Savings and benefits of global regulations for energy efficient products
September 2015
c79
the most stringent MEPS and the most demanding energy label requirement (the
CoNW 2015 MEPS + HL scenario). The Cost of Non-World MEPS 2030 scenario is also shown, which indicates the savings that would be expected in 2030 were today’s most
stringent MEPS to be adopted under a plausible timeframe from today and allowing for expected autonomous efficiency improvements plus the time it would take for the
stock of energy using equipment to be replaced. Table A8 shows the aggregate energy consumption and savings expected from all the sectors and end-uses considered under
each scenario.
Table A5: US residential sector final energy use
Product
group
BAU1
2015
CoNW MEPS 20152 CoNW MEPS + HL
20153
BAU
2030
CoNW MEPS 20304
TWh TWh % saving TWh % saving TWh TWh % saving
Electric end-uses
Lighting 185 60 68% 33 82% 207 95 54%
Electric (resistance/HPs) 109 94 14% 94 14% 97 88 9%
Circ. pumps 20 9 55% 9 55% 24 13 48%
Ventilation 65 47 27% 47 27% 67 55 18%
AC 229 199 13% 176 23% 282 259 8%
Electric 133 125 6% 55 58% 139 131 5%
Refrigerators 136 106 22% 57 58% 140 114 19%
Clothes Washers 67 46 31% 36 47% 69 50 27%
Clothes Dryers 60 50 18% 15 75% 67 57 15%
Dishwashers 28 18 36% 13 55% 32 22 31%
CE/TVs 155 48 69% 35 77% 166 66 60%
ICT/PCs 90 61 32% 43 53% 101 73 28%
Electric 73 66 9% 65 10% 70 64 8%
Total 1348 928 31% 677 50% 1462 1088 26%
Thermal end-uses
Heating 1120 917 18% 678 39% 1059 931 12%
Hot Water 460 359 22% 278 39% 435 370 15%
Cooking 83 75 10% 75 10% 79 74 6%
Total 1663 1351 19% 1032 38% 1573 1375 13%
1 BAU = Business as Usual scenario, 2 = CoNW MEPS 2015 is the Cost of Non World MEPS in 2015 static
scenario, 3 CoNW MEPS + HL 2015 is the Cost of Non World MEPS and High Label static scenario in 2015, 4
= CoNW MEPS 2030 is the Cost of Non World MEPS in 2030 time dynamic scenario
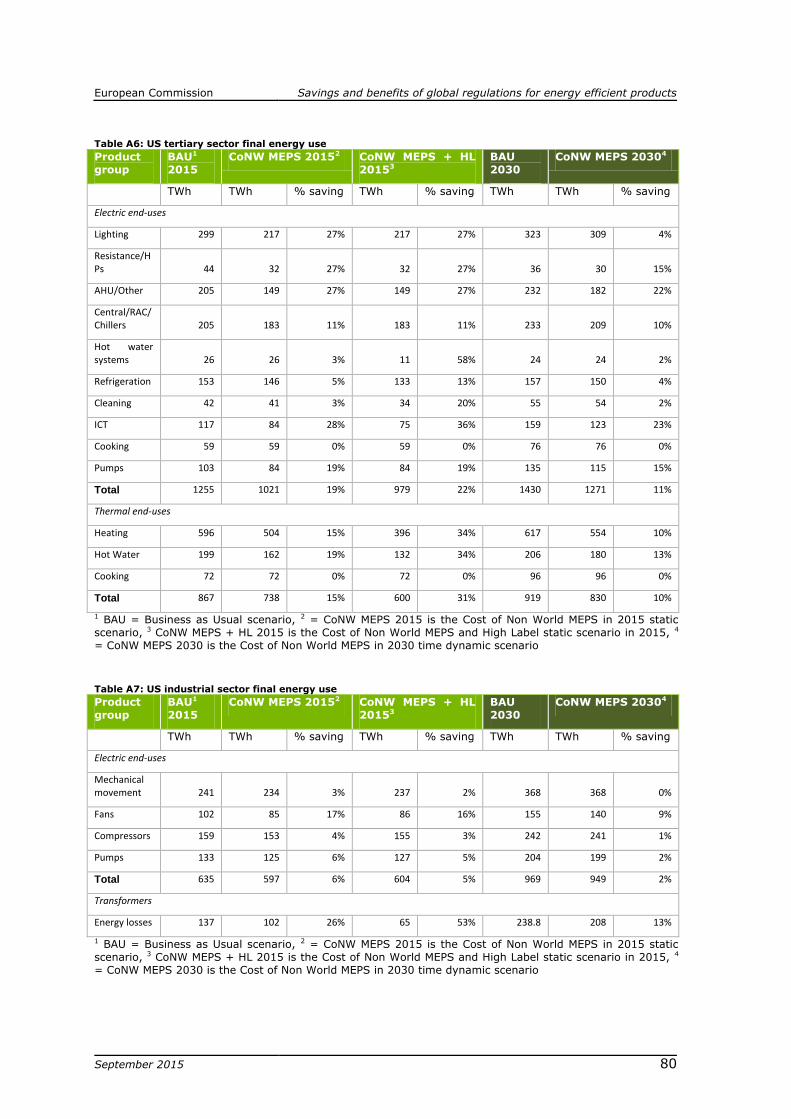
European Commission Savings and benefits of global regulations for energy efficient products
September 2015
c80
Table A6: US tertiary sector final energy use
Product
group
BAU1
2015
CoNW MEPS 20152 CoNW MEPS + HL
20153
BAU
2030
CoNW MEPS 20304
TWh TWh % saving TWh % saving TWh TWh % saving
Electric end-uses
Lighting 299 217 27% 217 27% 323 309 4%
Resistance/HPs 44 32 27% 32 27% 36 30 15%
AHU/Other 205 149 27% 149 27% 232 182 22%
Central/RAC/Chillers 205 183 11% 183 11% 233 209 10%
Hot water systems 26 26 3% 11 58% 24 24 2%
Refrigeration 153 146 5% 133 13% 157 150 4%
Cleaning 42 41 3% 34 20% 55 54 2%
ICT 117 84 28% 75 36% 159 123 23%
Cooking 59 59 0% 59 0% 76 76 0%
Pumps 103 84 19% 84 19% 135 115 15%
Total 1255 1021 19% 979 22% 1430 1271 11%
Thermal end-uses
Heating 596 504 15% 396 34% 617 554 10%
Hot Water 199 162 19% 132 34% 206 180 13%
Cooking 72 72 0% 72 0% 96 96 0%
Total 867 738 15% 600 31% 919 830 10%
1 BAU = Business as Usual scenario, 2 = CoNW MEPS 2015 is the Cost of Non World MEPS in 2015 static
scenario, 3 CoNW MEPS + HL 2015 is the Cost of Non World MEPS and High Label static scenario in 2015, 4
= CoNW MEPS 2030 is the Cost of Non World MEPS in 2030 time dynamic scenario
Table A7: US industrial sector final energy use
Product
group
BAU1
2015
CoNW MEPS 20152 CoNW MEPS + HL
20153
BAU
2030
CoNW MEPS 20304
TWh TWh % saving TWh % saving TWh TWh % saving
Electric end-uses
Mechanical movement 241 234 3% 237 2% 368 368 0%
Fans 102 85 17% 86 16% 155 140 9%
Compressors 159 153 4% 155 3% 242 241 1%
Pumps 133 125 6% 127 5% 204 199 2%
Total 635 597 6% 604 5% 969 949 2%
Transformers
Energy losses 137 102 26% 65 53% 238.8 208 13%
1 BAU = Business as Usual scenario, 2 = CoNW MEPS 2015 is the Cost of Non World MEPS in 2015 static
scenario, 3 CoNW MEPS + HL 2015 is the Cost of Non World MEPS and High Label static scenario in 2015, 4
= CoNW MEPS 2030 is the Cost of Non World MEPS in 2030 time dynamic scenario
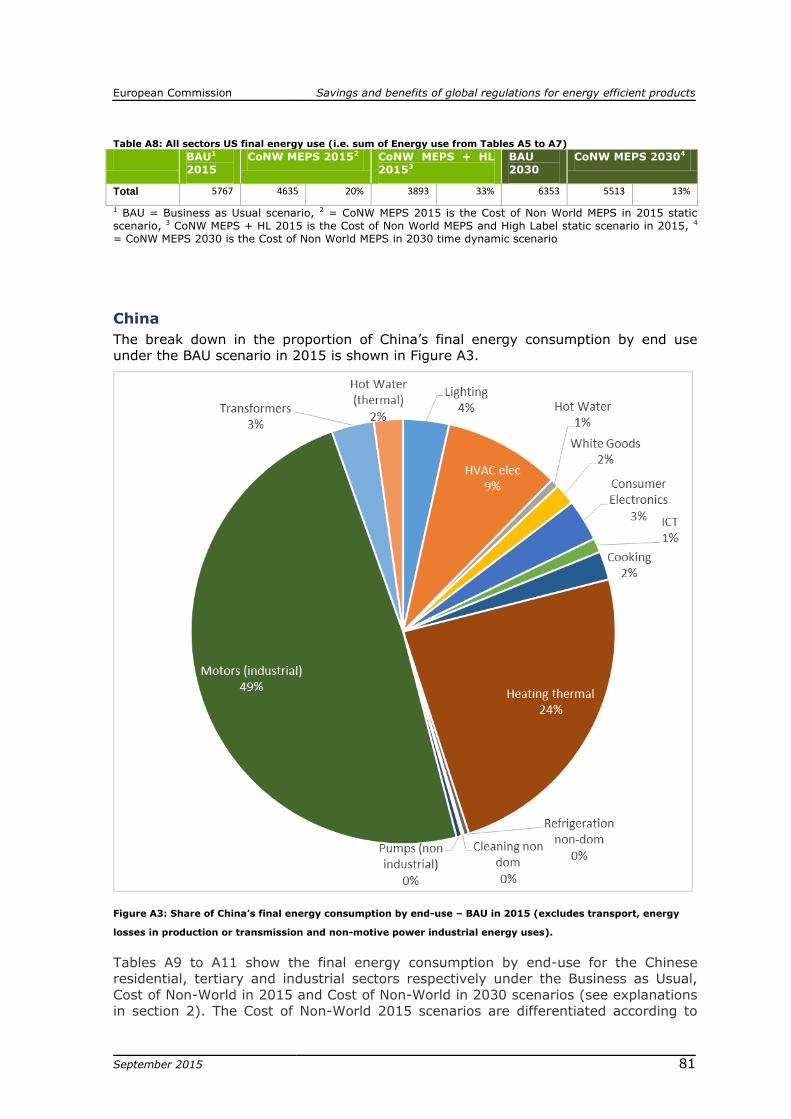
European Commission Savings and benefits of global regulations for energy efficient products
September 2015
c81
Table A8: All sectors US final energy use (i.e. sum of Energy use from Tables A5 to A7)
BAU1
2015
CoNW MEPS 20152 CoNW MEPS + HL
20153
BAU
2030
CoNW MEPS 20304
Total 5767 4635 20% 3893 33% 6353 5513 13%
1 BAU = Business as Usual scenario, 2 = CoNW MEPS 2015 is the Cost of Non World MEPS in 2015 static
scenario, 3 CoNW MEPS + HL 2015 is the Cost of Non World MEPS and High Label static scenario in 2015, 4
= CoNW MEPS 2030 is the Cost of Non World MEPS in 2030 time dynamic scenario
China
The break down in the proportion of China’s final energy consumption by end use under the BAU scenario in 2015 is shown in Figure A3.
Figure A3: Share of China’s final energy consumption by end-use – BAU in 2015 (excludes transport, energy
losses in production or transmission and non-motive power industrial energy uses).
Tables A9 to A11 show the final energy consumption by end-use for the Chinese residential, tertiary and industrial sectors respectively under the Business as Usual,
Cost of Non-World in 2015 and Cost of Non-World in 2030 scenarios (see explanations in section 2). The Cost of Non-World 2015 scenarios are differentiated according to
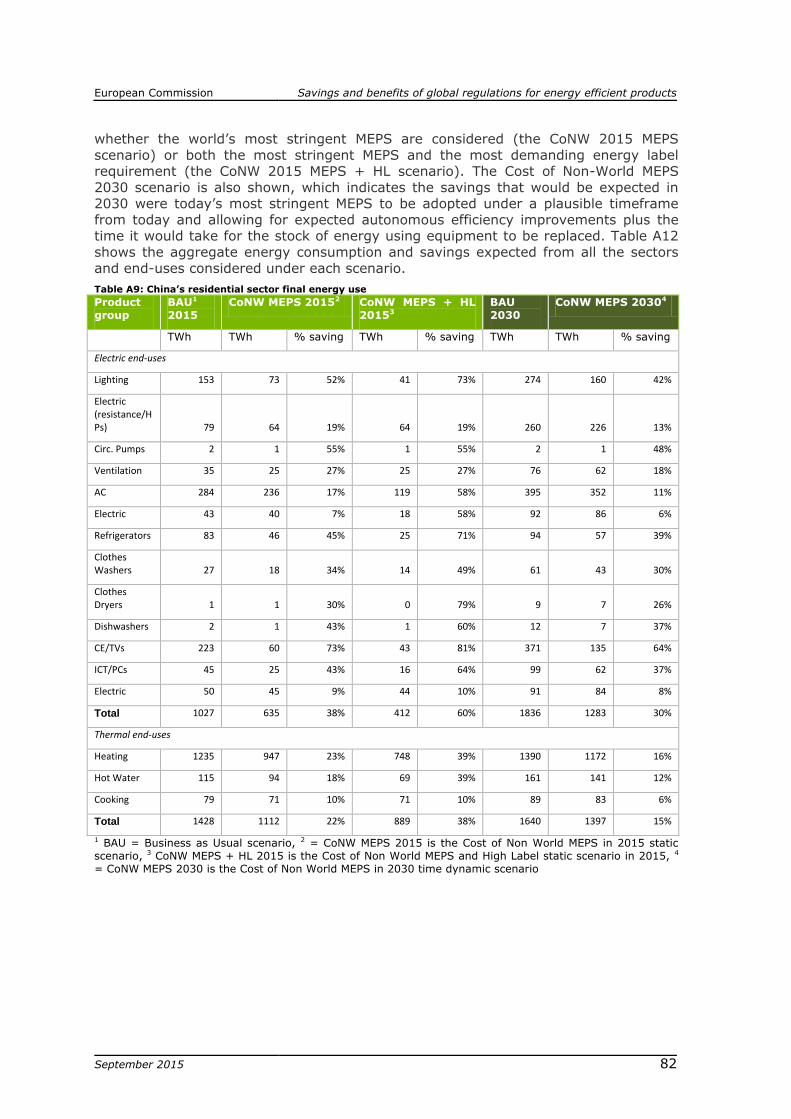
European Commission Savings and benefits of global regulations for energy efficient products
September 2015
c82
whether the world’s most stringent MEPS are considered (the CoNW 2015 MEPS
scenario) or both the most stringent MEPS and the most demanding energy label requirement (the CoNW 2015 MEPS + HL scenario). The Cost of Non-World MEPS
2030 scenario is also shown, which indicates the savings that would be expected in 2030 were today’s most stringent MEPS to be adopted under a plausible timeframe
from today and allowing for expected autonomous efficiency improvements plus the time it would take for the stock of energy using equipment to be replaced. Table A12
shows the aggregate energy consumption and savings expected from all the sectors
and end-uses considered under each scenario.
Table A9: China’s residential sector final energy use
Product
group
BAU1
2015
CoNW MEPS 20152 CoNW MEPS + HL
20153
BAU
2030
CoNW MEPS 20304
TWh TWh % saving TWh % saving TWh TWh % saving
Electric end-uses
Lighting 153 73 52% 41 73% 274 160 42%
Electric (resistance/HPs) 79 64 19% 64 19% 260 226 13%
Circ. Pumps 2 1 55% 1 55% 2 1 48%
Ventilation 35 25 27% 25 27% 76 62 18%
AC 284 236 17% 119 58% 395 352 11%
Electric 43 40 7% 18 58% 92 86 6%
Refrigerators 83 46 45% 25 71% 94 57 39%
Clothes Washers 27 18 34% 14 49% 61 43 30%
Clothes Dryers 1 1 30% 0 79% 9 7 26%
Dishwashers 2 1 43% 1 60% 12 7 37%
CE/TVs 223 60 73% 43 81% 371 135 64%
ICT/PCs 45 25 43% 16 64% 99 62 37%
Electric 50 45 9% 44 10% 91 84 8%
Total 1027 635 38% 412 60% 1836 1283 30%
Thermal end-uses
Heating 1235 947 23% 748 39% 1390 1172 16%
Hot Water 115 94 18% 69 39% 161 141 12%
Cooking 79 71 10% 71 10% 89 83 6%
Total 1428 1112 22% 889 38% 1640 1397 15%
1 BAU = Business as Usual scenario, 2 = CoNW MEPS 2015 is the Cost of Non World MEPS in 2015 static
scenario, 3 CoNW MEPS + HL 2015 is the Cost of Non World MEPS and High Label static scenario in 2015, 4
= CoNW MEPS 2030 is the Cost of Non World MEPS in 2030 time dynamic scenario

European Commission Savings and benefits of global regulations for energy efficient products
September 2015
c83
Table A10: China’s tertiary sector final energy use
Product
group
BAU1
2015
CoNW MEPS 20152 CoNW MEPS + HL
20153
BAU
2030
CoNW MEPS 20304
TWh TWh % saving TWh % saving TWh TWh % saving
Electric end-uses
Lighting 91 78 15% 73 20% 204 179 12%
Resistance/HPs 152 124 18% 124 18% 261 222 15%
AHU/Other 14 10 27% 10 27% 24 19 22%
Central/RAC/Chillers 57 33 41% 33 41% 97 84 14%
Hot water systems 2 2 4% 1 58% 4 4 3%
Refrigeration 28 26 7% 23 15% 47 45 6%
Cleaning 11 11 5% 9 20% 29 28 4%
ICT 31 22 29% 19 39% 54 41 23%
Cooking 1 1 0% 1 0% 2 2 0%
Pumps 27 22 19% 22 19% 46 39 15%
Total 415 329 21% 316 24% 767 663 14%
Thermal end-uses
Heating 444 351 21% 287 35% 500 430 14%
Hot Water 41 34 16% 27 35% 58 52 11%
Cooking 23 23 0% 23 0% 26 26 0%
Total 508 408 20% 336 34% 584 507 13%
1 BAU = Business as Usual scenario, 2 = CoNW MEPS 2015 is the Cost of Non World MEPS in 2015 static
scenario, 3 CoNW MEPS + HL 2015 is the Cost of Non World MEPS and High Label static scenario in 2015, 4
= CoNW MEPS 2030 is the Cost of Non World MEPS in 2030 time dynamic scenario
Table A11: China’s Industrial sector final energy use
Product
group
BAU1
2015
CoNW MEPS 20152 CoNW MEPS + HL
20153
BAU
2030
CoNW MEPS 20304
TWh TWh % saving TWh % saving TWh TWh % saving
Electric end-uses
Mechanical movement 1295 882 32% 879 32% 2165 2165 0%
Fans 545 319 41% 318 42% 911 825 9%
Compressors 852 578 32% 576 32% 1424 1420 0%
Pumps 716 473 34% 472 34% 1196 1172 2%
Total 3408 2253 34% 2245 34% 5696 5582 2%
Transformers
Energy losses 227 114 50% 75 67% 417 359 14%
1 BAU = Business as Usual scenario, 2 = CoNW MEPS 2015 is the Cost of Non World MEPS in 2015 static
scenario, 3 CoNW MEPS + HL 2015 is the Cost of Non World MEPS and High Label static scenario in 2015, 4
= CoNW MEPS 2030 is the Cost of Non World MEPS in 2030 time dynamic scenario
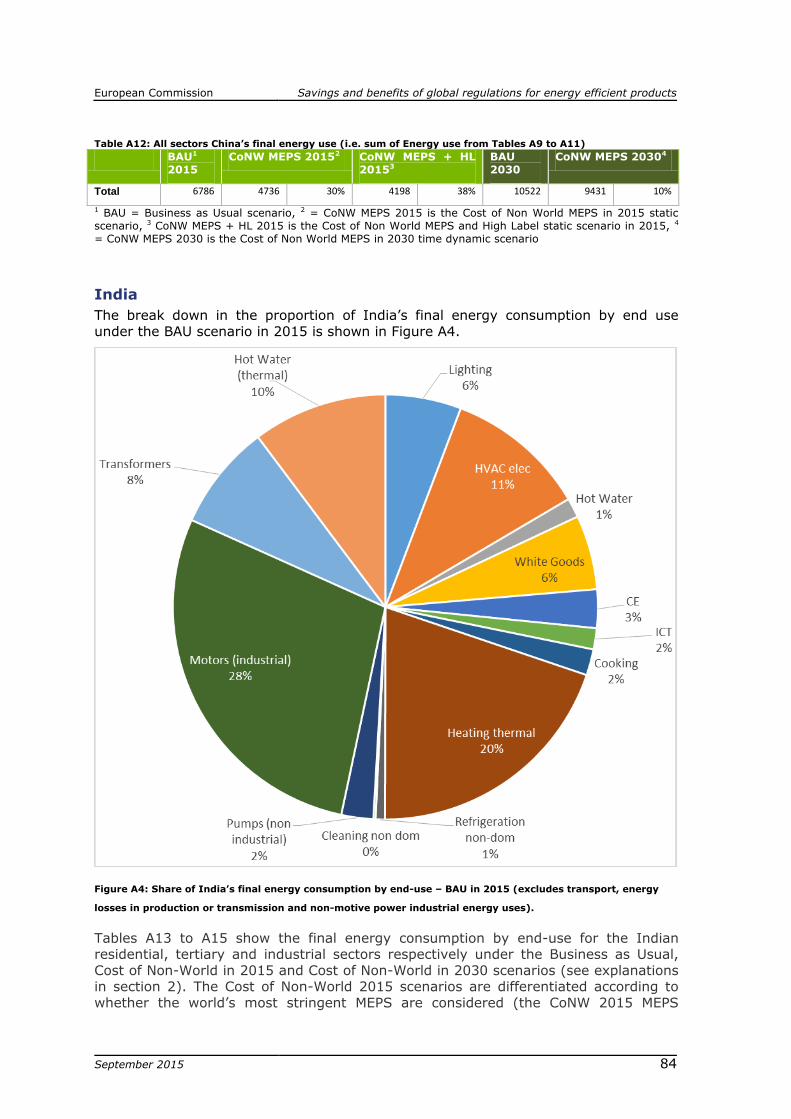
European Commission Savings and benefits of global regulations for energy efficient products
September 2015
c84
Table A12: All sectors China’s final energy use (i.e. sum of Energy use from Tables A9 to A11)
BAU1
2015
CoNW MEPS 20152 CoNW MEPS + HL
20153
BAU
2030
CoNW MEPS 20304
Total 6786 4736 30% 4198 38% 10522 9431 10%
1 BAU = Business as Usual scenario, 2 = CoNW MEPS 2015 is the Cost of Non World MEPS in 2015 static
scenario, 3 CoNW MEPS + HL 2015 is the Cost of Non World MEPS and High Label static scenario in 2015, 4
= CoNW MEPS 2030 is the Cost of Non World MEPS in 2030 time dynamic scenario
India
The break down in the proportion of India’s final energy consumption by end use
under the BAU scenario in 2015 is shown in Figure A4.
Figure A4: Share of India’s final energy consumption by end-use – BAU in 2015 (excludes transport, energy
losses in production or transmission and non-motive power industrial energy uses).
Tables A13 to A15 show the final energy consumption by end-use for the Indian residential, tertiary and industrial sectors respectively under the Business as Usual,
Cost of Non-World in 2015 and Cost of Non-World in 2030 scenarios (see explanations in section 2). The Cost of Non-World 2015 scenarios are differentiated according to
whether the world’s most stringent MEPS are considered (the CoNW 2015 MEPS

European Commission Savings and benefits of global regulations for energy efficient products
September 2015
c85
scenario) or both the most stringent MEPS and the most demanding energy label
requirement (the CoNW 2015 MEPS + HL scenario). The Cost of Non-World MEPS 2030 scenario is also shown, which indicates the savings that would be expected in
2030 were today’s most stringent MEPS to be adopted under a plausible timeframe from today and allowing for expected autonomous efficiency improvements plus the
time it would take for the stock of energy using equipment to be replaced. Table A16 shows the aggregate energy consumption and savings expected from all the sectors
and end-uses considered under each scenario.
Table A13: India’s residential sector final energy use
Product
group
BAU1
2015
CoNW MEPS 20152 CoNW MEPS + HL
20153
BAU
2030
CoNW MEPS 20304
TWh TWh % saving TWh % saving TWh TWh % saving
Electric end-uses
Lighting 53.0 23.3 56% 12.9 76% 65.0 35.9 45%
Electric (resistance/HPs) 0.0 0.0 NA 0.0 NA 0.0 0.0 NA
Circ. Pumps 0.0 0.0 NA 0.0 NA 0.0 0.0 NA
Ventilation 41.5 30.2 27% 30.2 27% 55.7 45.6 18%
AC 31.6 22.8 28% 11.5 63% 137.2 113.1 18%
Electric 15.5 14.0 10% 6.5 58% 57.1 52.1 9%
Refrigerators 49.9 25.5 49% 13.7 73% 96.0 55.3 42%
Clothes Washers 11.5 7.3 36% 5.7 50% 23.1 15.9 31%
Clothes Dryers 0.1 0.1 30% 0.0 79% 0.6 0.4 26%
Dishwashers 0.1 0.1 47% 0.1 62% 0.6 0.3 40%
CE/TVs 32.0 8.1 75% 6.0 81% 62.2 21.9 65%
ICT/PCs 8.2 4.4 46% 2.8 66% 40.3 24.4 40%
Electric 5.0 4.5 9% 4.5 10% 11.5 10.5 8%
Total 248 140 44% 94 62% 549.3 375.5 32%
Thermal end-uses
Heating 216.1 165.7 23% 130.9 39% 332.8 280.6 16%
Hot Water 31.3 24.6 21% 19.0 39% 47.7 40.8 14%
Cooking 13.2 11.9 10% 11.9 10% 20.3 19.0 6%
Total 261 202 22% 162 38% 400.8 340.4 15%
1 BAU = Business as Usual scenario, 2 = CoNW MEPS 2015 is the Cost of Non World MEPS in 2015 static
scenario, 3 CoNW MEPS + HL 2015 is the Cost of Non World MEPS and High Label static scenario in 2015, 4
= CoNW MEPS 2030 is the Cost of Non World MEPS in 2030 time dynamic scenario

European Commission Savings and benefits of global regulations for energy efficient products
September 2015
c86
Table A14: India’s tertiary sector final energy use
Product
group
BAU1
2015
CoNW MEPS 20152 CoNW MEPS + HL
20153
BAU
2030
CoNW MEPS 20304
TWh TWh % saving TWh % saving TWh TWh % saving
Electric end-uses
Lighting 10.0 8.4 15% 8.0 20% 60.9 53.5 12%
Resistance/HPs 0.0 0.0 NA 0.0 NA 0.0 0.0 NA
AHU/Other 8.5 6.2 27% 6.2 27% 14.9 11.7 22%
Central/RAC/Chillers 35.7 21.1 41% 21.1 41% 62.8 48.9 22%
Hot water systems 0.6 0.6 5% 0.2 58% 1.0 1.0 4%
Refrigeration 7.8 6.9 12% 6.3 19% 13.8 12.4 10%
Cleaning 1.8 1.8 5% 1.5 20% 3.8 3.6 4%
ICT 9.4 6.5 31% 5.2 44% 16.5 12.4 24%
Cooking 0.9 0.9 0% 0.9 0% 1.6 1.6 0%
Pumps 26.5 21.6 19% 21.6 19% 46.6 39.7 15%
Total 101 74 27% 71 30% 221.9 184.9 17%
Thermal end-uses
Heating 0.0 0.0 NA 0.0 NA 0.0 0.0 NA
Hot Water 80.3 64.8 19% 51.8 35% 19.9 17.3 13%
Cooking 2.5 2.5 0% 2.5 0% 6.2 6.2 0%
Total 83 67 19% 54 34% 26.1 23.5 10%
1 BAU = Business as Usual scenario, 2 = CoNW MEPS 2015 is the Cost of Non World MEPS in 2015 static
scenario, 3 CoNW MEPS + HL 2015 is the Cost of Non World MEPS and High Label static scenario in 2015, 4
= CoNW MEPS 2030 is the Cost of Non World MEPS in 2030 time dynamic scenario
Table A15: India’s industrial sector final energy use
Product
group
BAU1
2015
CoNW MEPS 20152 CoNW MEPS + HL
20153
BAU
2030
CoNW MEPS 20304
TWh TWh % saving TWh % saving TWh TWh % saving
Electric end-uses
Mechanical movement 117.6 112.1 5% 109.6 7% 362.8 362.8 0%
Fans 49.5 40.6 18% 39.7 20% 152.7 138.3 9%
Compressors 77.3 73.1 5% 71.5 8% 238.7 237.3 1%
Pumps 65.0 60.1 7% 58.8 10% 200.5 196.4 2%
Total 309 286 8% 280 10% 954.6 934.8 2%
Transformers
Energy losses 88 62 29% 41 53% 272.8 233 14%
1 BAU = Business as Usual scenario, 2 = CoNW MEPS 2015 is the Cost of Non World MEPS in 2015 static
scenario, 3 CoNW MEPS + HL 2015 is the Cost of Non World MEPS and High Label static scenario in 2015, 4
= CoNW MEPS 2030 is the Cost of Non World MEPS in 2030 time dynamic scenario

European Commission Savings and benefits of global regulations for energy efficient products
September 2015
c87
Table A16: All sectors India’s final energy use (i.e. sum of Energy use from Tables A13 to A15)
BAU1
2015
CoNW MEPS 20152 CoNW MEPS + HL
20153
BAU
2030
CoNW MEPS 20304
Total 1002 770 23% 661 34% 2153 1859 14%
1 BAU = Business as Usual scenario, 2 = CoNW MEPS 2015 is the Cost of Non World MEPS in 2015 static
scenario, 3 CoNW MEPS + HL 2015 is the Cost of Non World MEPS and High Label static scenario in 2015, 4
= CoNW MEPS 2030 is the Cost of Non World MEPS in 2030 time dynamic scenario
South Africa
The break down in the proportion of South Africa’s final energy consumption by end
use under the BAU scenario in 2015 is shown in Figure A5.
Figure A5: Share of South Africa’s final energy consumption by end-use – BAU in 2015 (excludes transport,
energy losses in production or transmission and non-motive power industrial energy uses).
Tables A17 to A19 show the final energy consumption by end-use for the South African residential, tertiary and industrial sectors respectively under the Business as
Usual, Cost of Non-World in 2015 and Cost of Non-World in 2030 scenarios (see explanations in section 2). The Cost of Non-World 2015 scenarios are differentiated
according to whether the world’s most stringent MEPS are considered (the CoNW 2015
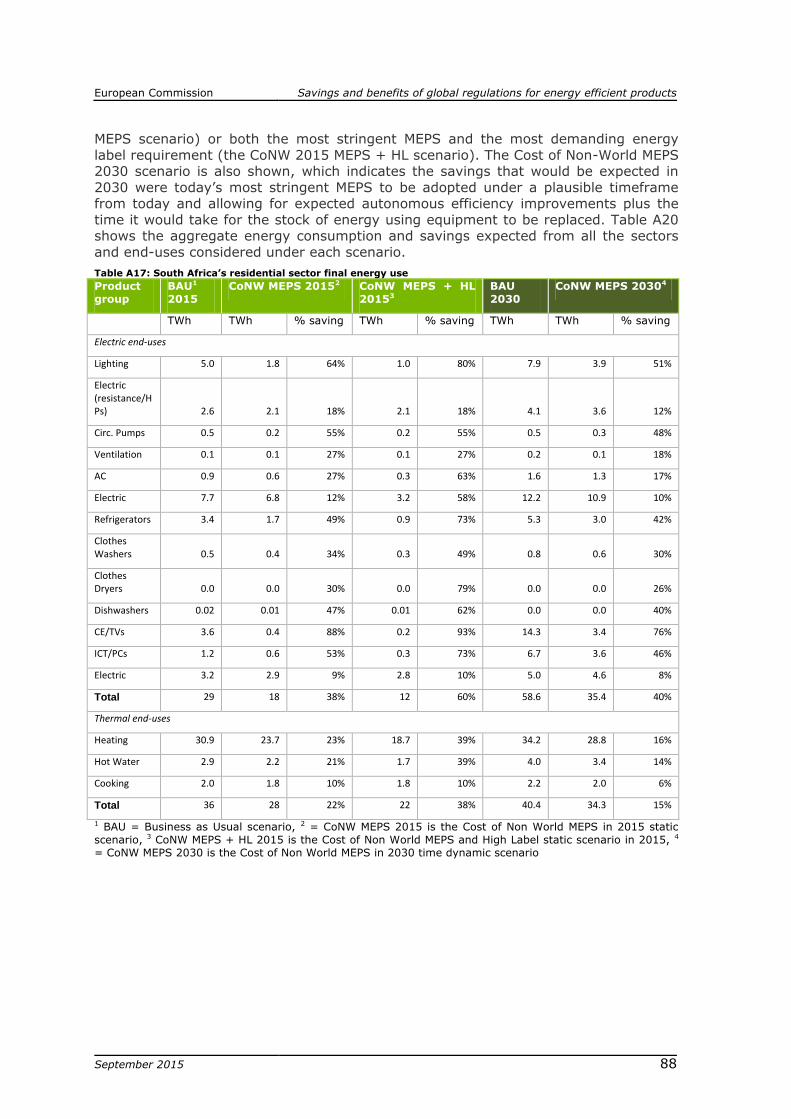
European Commission Savings and benefits of global regulations for energy efficient products
September 2015
c88
MEPS scenario) or both the most stringent MEPS and the most demanding energy
label requirement (the CoNW 2015 MEPS + HL scenario). The Cost of Non-World MEPS 2030 scenario is also shown, which indicates the savings that would be expected in
2030 were today’s most stringent MEPS to be adopted under a plausible timeframe from today and allowing for expected autonomous efficiency improvements plus the
time it would take for the stock of energy using equipment to be replaced. Table A20 shows the aggregate energy consumption and savings expected from all the sectors
and end-uses considered under each scenario.
Table A17: South Africa’s residential sector final energy use
Product
group
BAU1
2015
CoNW MEPS 20152 CoNW MEPS + HL
20153
BAU
2030
CoNW MEPS 20304
TWh TWh % saving TWh % saving TWh TWh % saving
Electric end-uses
Lighting 5.0 1.8 64% 1.0 80% 7.9 3.9 51%
Electric (resistance/HPs) 2.6 2.1 18% 2.1 18% 4.1 3.6 12%
Circ. Pumps 0.5 0.2 55% 0.2 55% 0.5 0.3 48%
Ventilation 0.1 0.1 27% 0.1 27% 0.2 0.1 18%
AC 0.9 0.6 27% 0.3 63% 1.6 1.3 17%
Electric 7.7 6.8 12% 3.2 58% 12.2 10.9 10%
Refrigerators 3.4 1.7 49% 0.9 73% 5.3 3.0 42%
Clothes Washers 0.5 0.4 34% 0.3 49% 0.8 0.6 30%
Clothes Dryers 0.0 0.0 30% 0.0 79% 0.0 0.0 26%
Dishwashers 0.02 0.01 47% 0.01 62% 0.0 0.0 40%
CE/TVs 3.6 0.4 88% 0.2 93% 14.3 3.4 76%
ICT/PCs 1.2 0.6 53% 0.3 73% 6.7 3.6 46%
Electric 3.2 2.9 9% 2.8 10% 5.0 4.6 8%
Total 29 18 38% 12 60% 58.6 35.4 40%
Thermal end-uses
Heating 30.9 23.7 23% 18.7 39% 34.2 28.8 16%
Hot Water 2.9 2.2 21% 1.7 39% 4.0 3.4 14%
Cooking 2.0 1.8 10% 1.8 10% 2.2 2.0 6%
Total 36 28 22% 22 38% 40.4 34.3 15%
1 BAU = Business as Usual scenario, 2 = CoNW MEPS 2015 is the Cost of Non World MEPS in 2015 static
scenario, 3 CoNW MEPS + HL 2015 is the Cost of Non World MEPS and High Label static scenario in 2015, 4
= CoNW MEPS 2030 is the Cost of Non World MEPS in 2030 time dynamic scenario

European Commission Savings and benefits of global regulations for energy efficient products
September 2015
c89
Table A18: South Africa’s tertiary sector final energy use
Product
group
BAU1
2015
CoNW MEPS 20152 CoNW MEPS + HL
20153
BAU
2030
CoNW MEPS 20304
TWh TWh % saving TWh % saving TWh TWh % saving
Electric end-uses
Lighting 30.4 25.2 17% 23.6 22% 51.5 44.3 14%
Resistance/HPs 12.4 10.1 18% 10.1 18% 28.4 24.2 15%
AHU/Other 8.3 6.1 27% 6.1 27% 23.1 18.0 22%
Central/RAC/Chillers 8.3 4.0 52% 4.0 52% 22.0 17.2 22%
Hot water systems 11.5 10.8 6% 4.8 58% 26.8 25.6 5%
Refrigeration 12.4 10.9 12% 10.0 19% 36.1 32.7 10%
Cleaning 2.7 2.6 5% 2.2 20% 6.3 6.1 4%
ICT 2.9 1.9 36% 1.4 52% 5.2 3.7 28%
Cooking 3.6 3.6 0% 3.6 0% 9.1 9.1 0%
Pumps 6.8 5.5 19% 5.5 19% 17.7 15.1 15%
Total 99 81 19% 71 28% 226.2 195.9 13%
Thermal end-uses
Heating 5.9 4.6 21% 3.8 35% 6.5 5.6 14%
Hot Water 0.5 0.4 19% 0.4 35% 0.8 0.7 13%
Cooking 0.4 0.4 0% 0.4 0% 0.5 0.5 0%
Total 7 5 20% 5 34% 7.8 6.8 13%
1 BAU = Business as Usual scenario, 2 = CoNW MEPS 2015 is the Cost of Non World MEPS in 2015 static
scenario, 3 CoNW MEPS + HL 2015 is the Cost of Non World MEPS and High Label static scenario in 2015, 4
= CoNW MEPS 2030 is the Cost of Non World MEPS in 2030 time dynamic scenario
Table A19: South Africa’s industrial sector final energy use
Product
group
BAU1
2015
CoNW MEPS 20152 CoNW MEPS + HL
20153
BAU
2030
CoNW MEPS 20304
TWh TWh % saving TWh % saving TWh TWh % saving
Electric end-uses
Mechanical movement 35.8 33.9 5% 33.4 7% 53.0 53.0 0%
Fans 15.1 12.3 19% 12.1 20% 22.3 20.2 9%
Compressors 23.5 22.1 6% 21.8 8% 34.8 34.6 1%
Pumps 19.8 18.2 8% 17.9 10% 29.3 28.7 2%
Total 94 86 8% 85 10% 139.4 136.5 2%
Transformers
Energy losses 12.3 8.7 29% 5.8 53% 18.3 15.7 14%
1 BAU = Business as Usual scenario, 2 = CoNW MEPS 2015 is the Cost of Non World MEPS in 2015 static
scenario, 3 CoNW MEPS + HL 2015 is the Cost of Non World MEPS and High Label static scenario in 2015, 4
= CoNW MEPS 2030 is the Cost of Non World MEPS in 2030 time dynamic scenario

European Commission Savings and benefits of global regulations for energy efficient products
September 2015
c90
Table A20: All sectors South African final energy use (i.e. sum of Energy use from Tables A17 to A19)
BAU1
2015
CoNW MEPS 20152 CoNW MEPS + HL
20153
BAU
2030
CoNW MEPS 20304
Total 265 218 18% 195 26% 472 409 13%
1 BAU = Business as Usual scenario, 2 = CoNW MEPS 2015 is the Cost of Non World MEPS in 2015 static
scenario, 3 CoNW MEPS + HL 2015 is the Cost of Non World MEPS and High Label static scenario in 2015, 4
= CoNW MEPS 2030 is the Cost of Non World MEPS in 2030 time dynamic scenario
Rest of World
The breakdown in the proportion of the Rest of the World (ROW) final energy
consumption by end use under the BAU scenario in 2015 is shown in Figure A6.
Figure A6: Share of ROW final energy consumption by end-use – BAU in 2015 (excludes transport, energy
losses in production or transmission and non-motive power industrial energy uses).
Tables A21 to A23 show the final energy consumption by end-use for the ROW residential, tertiary and industrial sectors respectively under the Business as Usual,
Cost of Non-World in 2015 and Cost of Non-World in 2030 scenarios (see explanations in section 2). The Cost of Non-World 2015 scenarios are differentiated according to
whether the world’s most stringent MEPS are considered (the CoNW 2015 MEPS
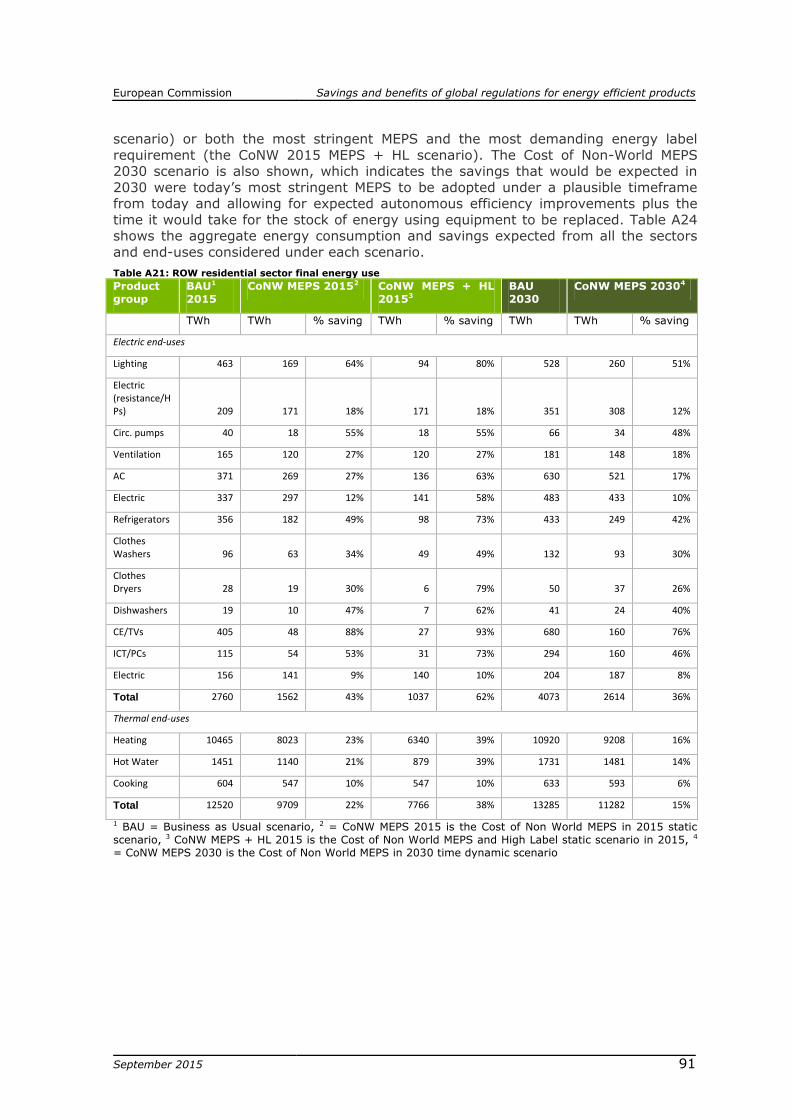
European Commission Savings and benefits of global regulations for energy efficient products
September 2015
c91
scenario) or both the most stringent MEPS and the most demanding energy label
requirement (the CoNW 2015 MEPS + HL scenario). The Cost of Non-World MEPS 2030 scenario is also shown, which indicates the savings that would be expected in
2030 were today’s most stringent MEPS to be adopted under a plausible timeframe from today and allowing for expected autonomous efficiency improvements plus the
time it would take for the stock of energy using equipment to be replaced. Table A24 shows the aggregate energy consumption and savings expected from all the sectors
and end-uses considered under each scenario.
Table A21: ROW residential sector final energy use
Product
group
BAU1
2015
CoNW MEPS 20152 CoNW MEPS + HL
20153
BAU
2030
CoNW MEPS 20304
TWh TWh % saving TWh % saving TWh TWh % saving
Electric end-uses
Lighting 463 169 64% 94 80% 528 260 51%
Electric (resistance/HPs) 209 171 18% 171 18% 351 308 12%
Circ. pumps 40 18 55% 18 55% 66 34 48%
Ventilation 165 120 27% 120 27% 181 148 18%
AC 371 269 27% 136 63% 630 521 17%
Electric 337 297 12% 141 58% 483 433 10%
Refrigerators 356 182 49% 98 73% 433 249 42%
Clothes Washers 96 63 34% 49 49% 132 93 30%
Clothes Dryers 28 19 30% 6 79% 50 37 26%
Dishwashers 19 10 47% 7 62% 41 24 40%
CE/TVs 405 48 88% 27 93% 680 160 76%
ICT/PCs 115 54 53% 31 73% 294 160 46%
Electric 156 141 9% 140 10% 204 187 8%
Total 2760 1562 43% 1037 62% 4073 2614 36%
Thermal end-uses
Heating 10465 8023 23% 6340 39% 10920 9208 16%
Hot Water 1451 1140 21% 879 39% 1731 1481 14%
Cooking 604 547 10% 547 10% 633 593 6%
Total 12520 9709 22% 7766 38% 13285 11282 15%
1 BAU = Business as Usual scenario, 2 = CoNW MEPS 2015 is the Cost of Non World MEPS in 2015 static
scenario, 3 CoNW MEPS + HL 2015 is the Cost of Non World MEPS and High Label static scenario in 2015, 4
= CoNW MEPS 2030 is the Cost of Non World MEPS in 2030 time dynamic scenario

European Commission Savings and benefits of global regulations for energy efficient products
September 2015
c92
Table A22: ROW tertiary sector final energy use
Product
group
BAU1
2015
CoNW MEPS 20152 CoNW MEPS + HL
20153
BAU
2030
CoNW MEPS 20304
TWh TWh % saving TWh % saving TWh TWh % saving
Electric end-uses
Lighting 354 293 17% 275 22% 603 520 14%
Resistance/HPs 240 196 18% 196 18% 336 287 15%
AHU/Other 132 96 27% 96 27% 199 156 22%
Central/RAC/Chillers 283 135 52% 135 52% 378 295 22%
Hot water systems 79 74 6% 33 58% 117 112 5%
Refrigeration 162 142 12% 131 19% 252 228 10%
Cleaning 42 40 5% 34 20% 70 67 4%
ICT 105 68 36% 51 52% 140 100 28%
Cooking 36 36 0% 36 0% 58 58 0%
Pumps 191 155 19% 155 19% 257 219 15%
Total 1624 1236 24% 1142 30% 2411 2041 15%
Thermal end-uses
Heating 2382 1881 21% 1537 35% 2470 2121 14%
Hot Water 1214 980 19% 784 35% 1171 1019 13%
Cooking 168 168 0% 168 0% 425 425 0%
Total 3764 3029 20% 2488 34% 4067 3566 12%
1 BAU = Business as Usual scenario, 2 = CoNW MEPS 2015 is the Cost of Non World MEPS in 2015 static
scenario, 3 CoNW MEPS + HL 2015 is the Cost of Non World MEPS and High Label static scenario in 2015, 4
= CoNW MEPS 2030 is the Cost of Non World MEPS in 2030 time dynamic scenario
Table A23: ROW industrial sector final energy use
Product
group
BAU1
2015
CoNW MEPS 20152 CoNW MEPS + HL
20153
BAU
2030
CoNW MEPS 20304
TWh TWh % saving TWh % saving TWh TWh % saving
Electric end-uses
Mechanical movement 1220 1155 5% 1137 7% 1736 1736 0%
Fans 514 418 19% 411 20% 731 662 9%
Compressors 802 754 6% 742 8% 1142 1136 1%
Pumps 674 619 8% 610 10% 959 940 2%
Total 3210 2946 8% 2901 10% 4569 4474 2%
Transformers
Energy losses 417 296 29% 196 53% 615.8 527 14%
1 BAU = Business as Usual scenario, 2 = CoNW MEPS 2015 is the Cost of Non World MEPS in 2015 static
scenario, 3 CoNW MEPS + HL 2015 is the Cost of Non World MEPS and High Label static scenario in 2015, 4
= CoNW MEPS 2030 is the Cost of Non World MEPS in 2030 time dynamic scenario
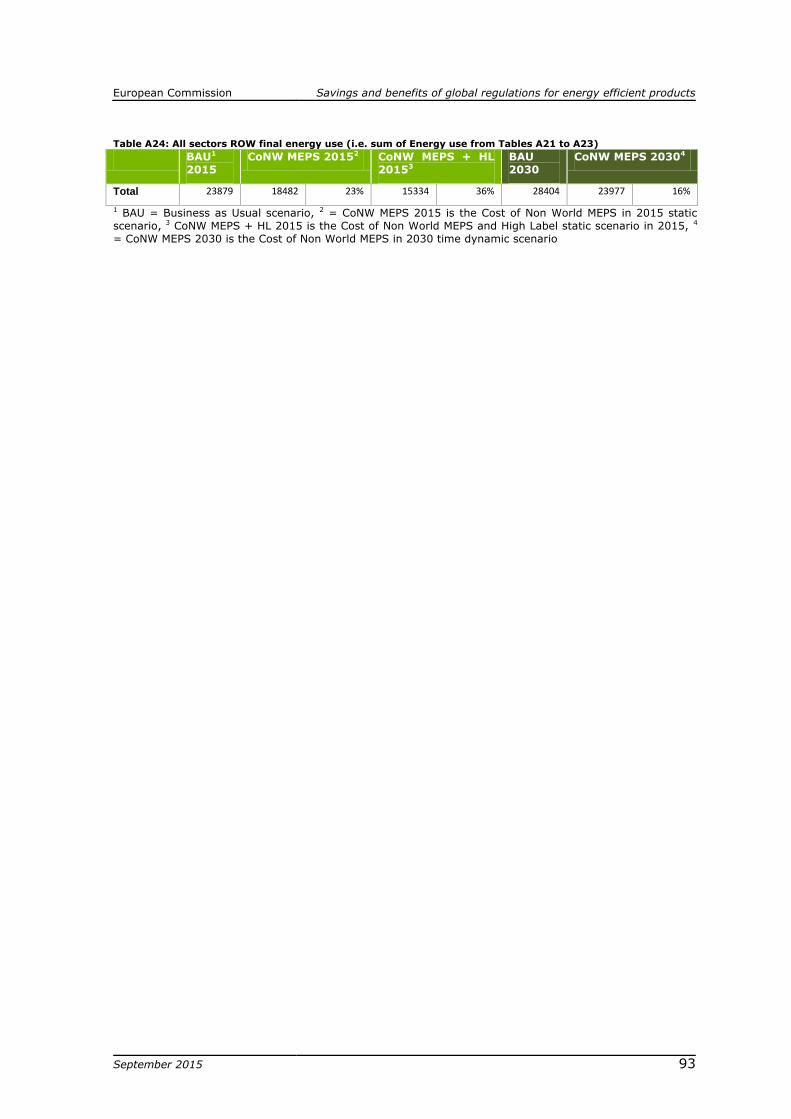
European Commission Savings and benefits of global regulations for energy efficient products
September 2015
c93
Table A24: All sectors ROW final energy use (i.e. sum of Energy use from Tables A21 to A23)
BAU1
2015
CoNW MEPS 20152 CoNW MEPS + HL
20153
BAU
2030
CoNW MEPS 20304
Total 23879 18482 23% 15334 36% 28404 23977 16%
1 BAU = Business as Usual scenario, 2 = CoNW MEPS 2015 is the Cost of Non World MEPS in 2015 static
scenario, 3 CoNW MEPS + HL 2015 is the Cost of Non World MEPS and High Label static scenario in 2015, 4
= CoNW MEPS 2030 is the Cost of Non World MEPS in 2030 time dynamic scenario

European Commission Savings and benefits of global regulations for energy efficient products
September 2015
c94
Annex III: Product group results This annex presents the results for the four energy scenarios described in section 2.1
for each of the product groups analysed in depth and for each economy considered. Under each product group heading it begins by presenting a table that indicates which
economy has currently the most ambitious MEPS and energy labels promulgated. Then
it presents the results showing the energy consumption expected by the product group (residential and tertiary sector combined) for each economy under each scenario and
the expected savings, expressed as a percentage, compared to the Business as Usual (BAU) scenario.
Lighting
Table A25: Economy with highest MEPS and labelling requirements for lighting
Product / sub-product Country with Highest MEPS Country with Highest Label
Household lamps
Non-directional EU EU
Directional EU EU
Tertiary sector lamps/ballasts
Ballasts EU India/China
Fluorescent lamps EU EU
Mercury vapour lamps EU EU
High pressure sodium lamps EU EU
Metal halide lamps EU EU
Table A26: Total Energy consumption and savings for lighting per economy by scenario
Country BAU
2015
CoNW MEPS 2015 CoNW MEPS + HL
2015
BAU
2030
CoNW MEPS 2030
TWh TWh % saving TWh % saving TWh TWh
% saving
on BAU
China 244 158 35% 118 52% 478 349 27%
EU 411 336 18% 285 31% 306 261 15%
India 63 34 46% 22 65% 126 92 27%
South
Africa 35 27 23% 25 30% 59 48 18%
USA 484 299 38% 263 46% 530 423 20%
Rest of
World 817 478 42% 378 54% 1131 795 30%
Total 2055 1332 35% 1091 47% 2630 1968 25%

European Commission Savings and benefits of global regulations for energy efficient products
September 2015
c95
HVAC electric
Table A27: Economy with highest MEPS and labelling requirements for HVAC
Product / sub-product Country with Highest MEPS Country with Highest Label
Air Conditioners
Room AC EU EU
Household ducted USA USA
Heat-pumps
Ground-source EU EU
Air-source EU EU
Fans/AHU
<125W EU EU
>125W EU EU
Table A28: Total Energy consumption and savings for HVAC per economy by scenario
Country BAU
2015
CoNW MEPS 2015 CoNW MEPS + HL
2015
BAU
2030
CoNW MEPS 2030
TWh TWh % saving TWh % saving TWh TWh
% saving
on BAU
China 622 493 21% 377 39% 1113 966 13%
EU 597 501 16% 488 18% 649 562 13%
India 117 80 32% 69 41% 271 219 19%
South
Africa 33 23 30% 23 31% 79 64 19%
USA 856 705 18% 681 20% 947 823 13%
Rest of
World 1400 987 29% 854 39% 2075 1714 17%
Total 3625 2789 23% 2492 31% 5134 4348 15%

European Commission Savings and benefits of global regulations for energy efficient products
September 2015
c96
Hot water (electric)
Table A29: Economy with highest MEPS and labelling requirements for electric water heaters
Product / sub-product Country with Highest MEPS Country with Highest Label
Electric water heaters
Household (storage or
instantaneous) EU EU
Non-domestic EU EU
Heat-pump (only) EU EU/China
Table A30: Total Energy consumption and savings for electric water heaters per economy by scenario
Country BAU
2015
CoNW MEPS 2015 CoNW MEPS + HL
2015
BAU
2030
CoNW MEPS 2030
TWh TWh % saving TWh % saving TWh TWh
% saving
on BAU
China 45 42 7% 19 58% 95 90 6%
EU 256 243 5% 107 58% 262 250 4%
India 16 15 10% 7 58% 58 53 9%
South
Africa 19 18 8% 8 58% 39 36 7%
USA 159 151 6% 66 58% 163 155 5%
Rest of
World 417 371 11% 174 58% 601 545 9%
Total 912 839 8% 380 58% 1218 1129 7%
White goods
Table A31: Economy with highest MEPS and labelling requirements for white goods
Product / sub-product Country with Highest MEPS Country with Highest Label
Refrigerators and freezers USA EU
Washing Machines EU EU
Dishwashers EU EU
Clothes-dryers EU EU

European Commission Savings and benefits of global regulations for energy efficient products
September 2015
c97
Table A32: Total Energy consumption and savings for white goods per economy by scenario
Country BAU
2015
CoNW MEPS 2015 CoNW MEPS + HL
2015
BAU
2030
CoNW MEPS 2030
TWh TWh % saving TWh % saving TWh TWh
% saving
on BAU
China 114 65 42% 40 65% 176 114 35%
EU 224 199 12% 123 45% 230 207 10%
India 62 33 46% 20 68% 120 72 40%
South
Africa 4 2 47% 1 69% 6 4 41%
USA 291 220 24% 121 59% 308 243 21%
Rest of
World 498 274 45% 160 68% 655 403 38%
Total 1193 793 33% 464 61% 1497 1043 30%
Consumer electronics
Table A33: Economy with highest MEPS and labelling requirements for Consumer Electronics
Product / sub-product Country with Highest MEPS Country with Highest Label
Televisions EU EU/RSA
Complex Set-top Box EU NA
External Power Supply EU EU/USA
Table A34: Total Energy consumption and savings for consumer electronics per economy by scenario
Country BAU
2015
CoNW MEPS 2015 CoNW MEPS + HL
2015
BAU
2030
CoNW MEPS 2030
TWh TWh % saving TWh % saving TWh TWh
% saving
on BAU
China 223 60 73% 43 81% 371 135 64%
EU 113 34 70% 25 78% 98 39 60%
India 32 8 75% 6 81% 62 22 65%
South
Africa 4 0 88% 0 93% 14 3 76%
USA 155 48 69% 35 77% 166 66 60%
Rest of
World 405 48 88% 27 93% 680 160 76%
Total 932 198 79% 137 85% 1392 426 69%

European Commission Savings and benefits of global regulations for energy efficient products
September 2015
c98
ICT
Table A35: Economy with highest MEPS and labelling requirements for ICT
Product / sub-product Country with Highest MEPS Country with Highest Label
Desktop computer EU China/EU/USA
Notebook computer China China/EU/USA
Monitors EU EU/RSA
Domestic Imaging Products NA China/EU/India/RSA/USA
Non-domestic Imaging Products NA China/EU/India/RSA/USA
Servers NA USA
Table A36: Total Energy consumption and savings for ICT per economy by scenario
Country BAU
2015
CoNW MEPS 2015 CoNW MEPS + HL
2015
BAU
2030
CoNW MEPS 2030
TWh TWh % saving TWh % saving TWh TWh
% saving
on BAU
China 76 48 37% 35 54% 153 104 32%
EU 59 42 28% 34 43% 47 36 24%
India 18 11 38% 8 54% 57 37 35%
South
Africa 4 2 41% 2 58% 12 7 38%
USA 208 145 30% 118 43% 260 196 25%
Rest of
World 220 122 45% 81 63% 434 260 40%
Total 584 371 37% 278 52% 963 640 34%
Cooking
Table A37: Economy with highest MEPS and labelling requirements for Cooking
Product / sub-product Country with Highest MEPS Country with Highest Label
Rice cookers China China
Electric ovens EU EU
Gas ovens EU EU
Electric cooktops (hobs)
Gas cooktops (hobs) EU India/China
Extractor fans (range hoods) EU EU

European Commission Savings and benefits of global regulations for energy efficient products
September 2015
c99
Table A38: Total Energy consumption and savings for cooking per economy by scenario
Country BAU
2015
CoNW MEPS 2015 CoNW MEPS + HL
2015
BAU
2030
CoNW MEPS 2030
TWh TWh % saving TWh % saving TWh TWh
% saving
on BAU
China 152 140 8% 139 8% 207 194 6%
EU 117 111 5% 110 6% 128 123 4%
India 22 20 8% 20 8% 40 37 6%
South
Africa 9 9 5% 9 6% 17 16 3%
USA 287 272 5% 272 5% 321 310 3%
Rest of
World 965 892 8% 891 8% 1320 1263 4%
Total 1552 1444 7% 1441 7% 2032 1943 4%
Space heating (thermal)
Table A39: Economy with highest MEPS and labelling requirements for non-electric space heating equipment
Product / sub-product Country with Highest MEPS Country with Highest Label
Gas boilers EU EU
Oil boilers EU EU
Table A40: Total Energy consumption and savings for non-electric space heating equipment per economy by
scenario
Country BAU
2015
CoNW MEPS 2015 CoNW MEPS + HL
2015
BAU
2030
CoNW MEPS 2030
TWh TWh % saving TWh % saving TWh TWh
% saving
on BAU
China 1679 1298 23% 1035 38% 1890 1602 15%
EU 2371 1936 18% 1463 38% 1983 1738 12%
India 216 166 23% 131 39% 333 281 16%
South
Africa 37 28 23% 23 39% 41 34 15%
USA 1716 1422 17% 1075 37% 1677 1484 11%
Rest of
World 12846 9904 23% 7877 39% 13391 11329 15%
Total 18865 14754 22% 11603 38% 19314 16468 15%

European Commission Savings and benefits of global regulations for energy efficient products
September 2015
c100
Water heating (thermal)
Table A41: Economy with highest MEPS and labelling requirements for non-electric water heating equipment
Product / sub-product Country with Highest MEPS Country with Highest Label
Gas storage water heater EU EU
Gas instantaneous water heater EU EU
Solar water heater EU EU
Table A42: Total Energy consumption and savings for non-electric water heating equipment per economy by
scenario
Country BAU
2015
CoNW MEPS 2015 CoNW MEPS + HL
2015
BAU
2030
CoNW MEPS 2030
TWh TWh % saving TWh % saving TWh TWh
% saving
on BAU
China 156 128 18% 96 38% 219 193 12%
EU 238 184 23% 147 38% 306 260 15%
India 112 89 20% 71 37% 68 58 14%
South
Africa 3 3 21% 2 39% 5 4 14%
USA 658 520 21% 411 38% 641 551 14%
Rest of
World 2666 2119 20% 1663 38% 2902 2500 14%
Total 3833 3044 21% 2389 38% 4141 3566 14%
Refrigeration (non-domestic)
Table A43: Economy with highest MEPS and labelling requirements for non-domestic refrigeration equipment
Product / sub-product Country with Highest MEPS Country with Highest Label
Reach-in display cabinets USA China
Beverage coolers USA USA
Professional storage cabinets NA NA
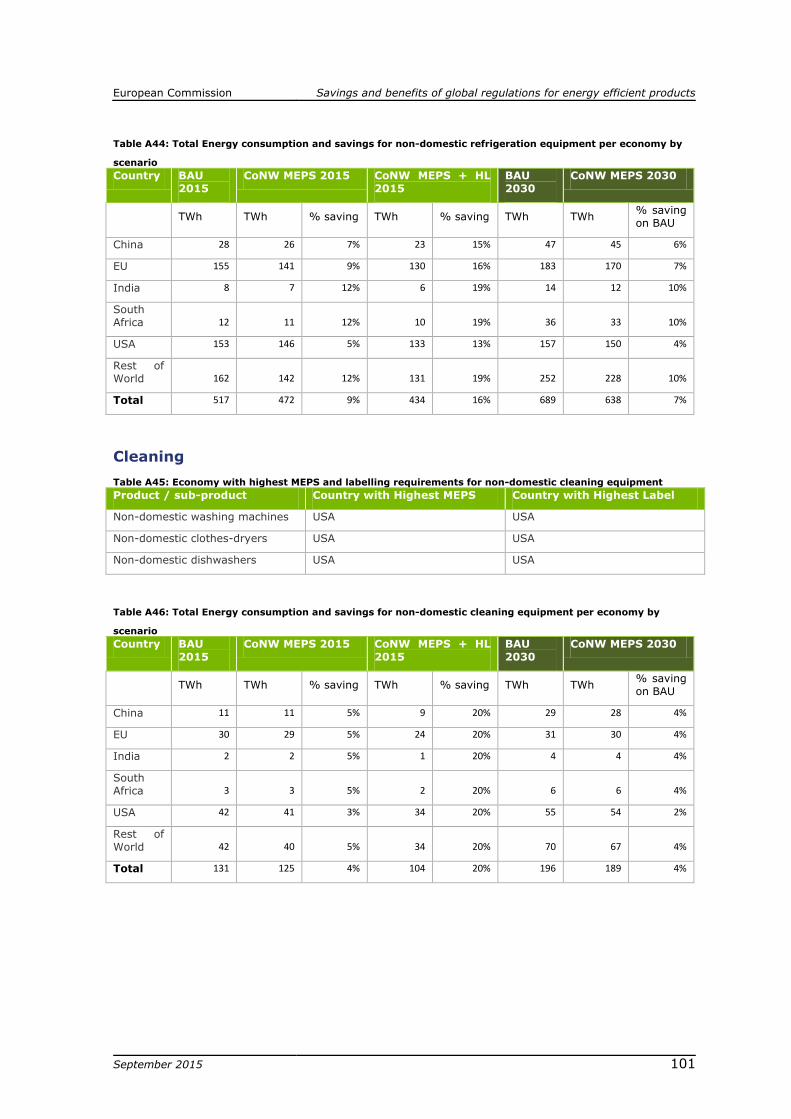
European Commission Savings and benefits of global regulations for energy efficient products
September 2015
c101
Table A44: Total Energy consumption and savings for non-domestic refrigeration equipment per economy by
scenario
Country BAU
2015
CoNW MEPS 2015 CoNW MEPS + HL
2015
BAU
2030
CoNW MEPS 2030
TWh TWh % saving TWh % saving TWh TWh
% saving
on BAU
China 28 26 7% 23 15% 47 45 6%
EU 155 141 9% 130 16% 183 170 7%
India 8 7 12% 6 19% 14 12 10%
South
Africa 12 11 12% 10 19% 36 33 10%
USA 153 146 5% 133 13% 157 150 4%
Rest of
World 162 142 12% 131 19% 252 228 10%
Total 517 472 9% 434 16% 689 638 7%
Cleaning
Table A45: Economy with highest MEPS and labelling requirements for non-domestic cleaning equipment
Product / sub-product Country with Highest MEPS Country with Highest Label
Non-domestic washing machines USA USA
Non-domestic clothes-dryers USA USA
Non-domestic dishwashers USA USA
Table A46: Total Energy consumption and savings for non-domestic cleaning equipment per economy by
scenario
Country BAU
2015
CoNW MEPS 2015 CoNW MEPS + HL
2015
BAU
2030
CoNW MEPS 2030
TWh TWh % saving TWh % saving TWh TWh
% saving
on BAU
China 11 11 5% 9 20% 29 28 4%
EU 30 29 5% 24 20% 31 30 4%
India 2 2 5% 1 20% 4 4 4%
South
Africa 3 3 5% 2 20% 6 6 4%
USA 42 41 3% 34 20% 55 54 2%
Rest of
World 42 40 5% 34 20% 70 67 4%
Total 131 125 4% 104 20% 196 189 4%

European Commission Savings and benefits of global regulations for energy efficient products
September 2015
c102
Pumps (non-industrial)
Table A47: Economy with highest MEPS and labelling requirements for non-industrial pumps
Product / sub-product Country with Highest MEPS Country with Highest Label
Circulation pumps EU EU
Water pumps China China
Pool and aquarium pumps USA USA
Table A48: Total Energy consumption and savings for non-industrial pumps per economy by scenario
Country BAU
2015
CoNW MEPS 2015 CoNW MEPS + HL
2015
BAU
2030
CoNW MEPS 2030
TWh TWh % saving TWh % saving TWh TWh
% saving
on BAU
China 29 23 21% 23 21% 48 40 16%
EU 135 88 34% 88 34% 154 109 29%
India 26 22 19% 22 19% 47 40 15%
South
Africa 7 6 21% 6 21% 18 15 16%
USA 122 92 25% 92 25% 159 127 20%
Rest of
World 231 173 25% 173 25% 323 253 22%
Total 551 404 27% 404 27% 748 584 22%
Motors (industrial) and related applications
Table A49: Economy with highest MEPS and labelling requirements for industrial electric motors and related
applications
Product / sub-product Country with Highest MEPS Country with Highest Label
AC induction motors >0.75kW USA/EU China/EU/India/RSA/USA
Other motor types Mostly USA NA
Industrial fans EU NA
Industrial compressors China China
Industrial pumps NA NA
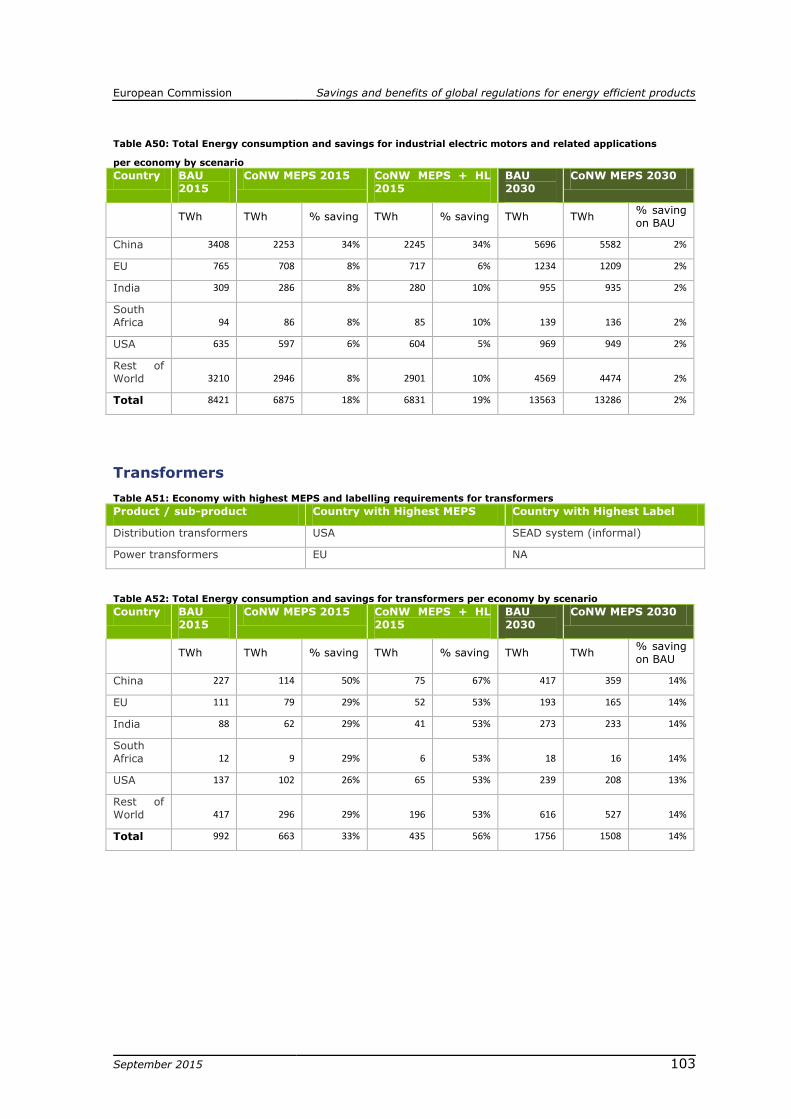
European Commission Savings and benefits of global regulations for energy efficient products
September 2015
c103
Table A50: Total Energy consumption and savings for industrial electric motors and related applications
per economy by scenario
Country BAU
2015
CoNW MEPS 2015 CoNW MEPS + HL
2015
BAU
2030
CoNW MEPS 2030
TWh TWh % saving TWh % saving TWh TWh
% saving
on BAU
China 3408 2253 34% 2245 34% 5696 5582 2%
EU 765 708 8% 717 6% 1234 1209 2%
India 309 286 8% 280 10% 955 935 2%
South
Africa 94 86 8% 85 10% 139 136 2%
USA 635 597 6% 604 5% 969 949 2%
Rest of
World 3210 2946 8% 2901 10% 4569 4474 2%
Total 8421 6875 18% 6831 19% 13563 13286 2%
Transformers
Table A51: Economy with highest MEPS and labelling requirements for transformers
Product / sub-product Country with Highest MEPS Country with Highest Label
Distribution transformers USA SEAD system (informal)
Power transformers EU NA
Table A52: Total Energy consumption and savings for transformers per economy by scenario
Country BAU
2015
CoNW MEPS 2015 CoNW MEPS + HL
2015
BAU
2030
CoNW MEPS 2030
TWh TWh % saving TWh % saving TWh TWh
% saving
on BAU
China 227 114 50% 75 67% 417 359 14%
EU 111 79 29% 52 53% 193 165 14%
India 88 62 29% 41 53% 273 233 14%
South
Africa 12 9 29% 6 53% 18 16 14%
USA 137 102 26% 65 53% 239 208 13%
Rest of
World 417 296 29% 196 53% 616 527 14%
Total 992 663 33% 435 56% 1756 1508 14%
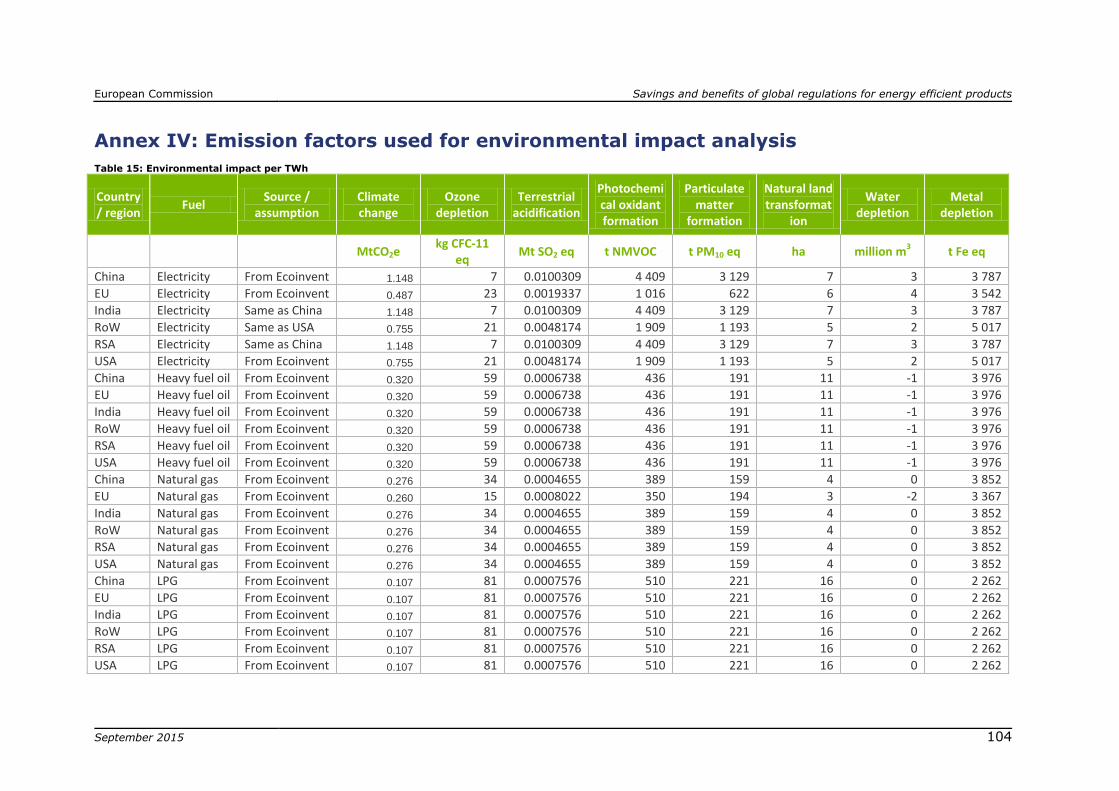
European Commission Savings and benefits of global regulations for energy efficient products
September 2015
c104
Annex IV: Emission factors used for environmental impact analysis
Table 15: Environmental impact per TWh
Country/ region
Fuel Source /
assumption Climate change
Ozone depletion
Terrestrial acidification
Photochemical oxidant formation
Particulate matter
formation
Natural land transformat
ion
Water depletion
Metal depletion
MtCO2e
kg CFC-11 eq
Mt SO2 eq t NMVOC t PM10 eq ha million m3 t Fe eq
China Electricity From Ecoinvent 1.148 7 0.0100309 4 409 3 129 7 3 3 787
EU Electricity From Ecoinvent 0.487 23 0.0019337 1 016 622 6 4 3 542
India Electricity Same as China 1.148 7 0.0100309 4 409 3 129 7 3 3 787
RoW Electricity Same as USA 0.755 21 0.0048174 1 909 1 193 5 2 5 017
RSA Electricity Same as China 1.148 7 0.0100309 4 409 3 129 7 3 3 787
USA Electricity From Ecoinvent 0.755 21 0.0048174 1 909 1 193 5 2 5 017
China Heavy fuel oil From Ecoinvent 0.320 59 0.0006738 436 191 11 -1 3 976
EU Heavy fuel oil From Ecoinvent 0.320 59 0.0006738 436 191 11 -1 3 976
India Heavy fuel oil From Ecoinvent 0.320 59 0.0006738 436 191 11 -1 3 976
RoW Heavy fuel oil From Ecoinvent 0.320 59 0.0006738 436 191 11 -1 3 976
RSA Heavy fuel oil From Ecoinvent 0.320 59 0.0006738 436 191 11 -1 3 976
USA Heavy fuel oil From Ecoinvent 0.320 59 0.0006738 436 191 11 -1 3 976
China Natural gas From Ecoinvent 0.276 34 0.0004655 389 159 4 0 3 852
EU Natural gas From Ecoinvent 0.260 15 0.0008022 350 194 3 -2 3 367
India Natural gas From Ecoinvent 0.276 34 0.0004655 389 159 4 0 3 852
RoW Natural gas From Ecoinvent 0.276 34 0.0004655 389 159 4 0 3 852
RSA Natural gas From Ecoinvent 0.276 34 0.0004655 389 159 4 0 3 852
USA Natural gas From Ecoinvent 0.276 34 0.0004655 389 159 4 0 3 852
China LPG From Ecoinvent 0.107 81 0.0007576 510 221 16 0 2 262
EU LPG From Ecoinvent 0.107 81 0.0007576 510 221 16 0 2 262
India LPG From Ecoinvent 0.107 81 0.0007576 510 221 16 0 2 262
RoW LPG From Ecoinvent 0.107 81 0.0007576 510 221 16 0 2 262
RSA LPG From Ecoinvent 0.107 81 0.0007576 510 221 16 0 2 262
USA LPG From Ecoinvent 0.107 81 0.0007576 510 221 16 0 2 262

European Commission Savings and benefits of global regulations for energy efficient products
September 2015
c105
Annex V: Relevance of global harmonisation for the EU
within existing trade frameworks
1. Global trade initiatives via WTO Ensuring that national and regional regulations do not obstruct trade is the main aim
of agreements of the World Trade Organisation (WTO): the WTO is the only
international organization dealing with the global rules of trade between nations and ensures that ‘trade flows as smoothly, predictably and freely as possible’.
WTO agreements present a double edged sword for harmonisation of Ecodesign regulations: on one hand they provide high level policy drivers for harmonised
standards to facilitate free trade and establish mechanisms for cooperation between nations (such as through ISO). But on the other hand, WTO agreements constrain
some aspects of technical regulations and standards within a legal framework which could hamper some efforts towards harmonisation.
The most relevant and important WTO agreement for Ecodesign and energy labelling
is that on Technical Barriers to Trade56 (TBT), which established principles such as treating suppliers from all WTO member countries equally (the so-called ‘most
favoured nation’ principle), equality within national borders (‘national treatment’) and reducing barriers to trade through negotiation. The TBT deals with voluntary standards
by means of a Code of Good Practice57, which member country governments are obliged to accept and comply with58.
Constraints to harmonisation efforts on Ecodesign and labelling that arise trade rules include59: a) The principle established in a GATT dispute that Mexico raised against the US in
1991: this dispute was about protecting dolphins in tuna fisheries, but established that one country cannot take trade action (such as embargoes) to force another country to
adopt environmental regulation in line with its own. b) Environmental labelling schemes are recognised under WTO as useful and
necessary as long as they do not discriminate between trading partner countries and do not favour locally produced products over imports.
c) One area that is not yet resolved by the WTO Trade and Environment Committee is whether regulations or a label are allowed to specify whether the method of
manufacture is environmentally friendly, especially when the method is not evident in
the final product (labels are certainly allowed to specify environmental properties of the product itself). This could result in blocking aspects of an Ecodesign or labelling
regulation that constrains methods of manufacture.
2. The draft bilateral EU / US Transatlantic Trade and Investment Partnership (TTIP)
The EU is negotiating a trade and investment deal with the US - the Transatlantic Trade and Investment Partnership - or TTIP60. The draft text recognises the potential
impact of environmental regulation on trade and aims to make better use of ISO
standards in common with the US; reduce burdensome procedures for checking products; and notably to ‘improve cooperation between EU and US standardisation
bodies when they draw up new standards’. The TTIP has a specific chapter on regulatory co-operation which would set up ways for regulators to work together
56 See https://www.wto.org/english/tratop_e/tbt_e/tbt_e.htm
57 Code of good practice for the preparation, adoption and application of standards, Annex 3 of the TBT
agreement
58 According to Article 2 of the TBT
59 See https://www.wto.org/english/thewto_e/whatis_e/tif_e/bey2_e.htm accessed 25 Feb 2015
60 See http://ec.europa.eu/trade/policy/in-focus/ttip/ accessed 25 February 2015

European Commission Savings and benefits of global regulations for energy efficient products
September 2015
c106
closely on a particular area; initiate work with the US to promote international
cooperation on regulatory issues and internationally agreed approaches to regulation; and, create a Regulatory Cooperation Body. Once established, the TTIP should provide
a co-operative framework to facilitate harmonisation or alignment of technical regulations and standards both with the US and more widely.
3. Trade negotiations with China
China is the EU’s largest trading partner in Asia. Negotiations of a comprehensive EU-
China investment agreement were launched at the EU-China Summit of November 2013 with the aim to remove market access barriers to investment. Perhaps more
relevant to Ecodesign, however, are negotiations to upgrade the 1985 Trade and Economic Cooperation Agreement which began in 2007 but have stalled since 2011
due to divergent mandates and expectations of the parties.
4. Trade negotiations with Japan Japan is the EU’s second biggest trading partner in Asia, after China. Negotiations for
a free trade agreement were launched in April 2013 with four rounds of talks since
then. A number of non-tariff barriers operating in Japan are of concern to these negotiations; links and similarities on Ecodesign type regulation with Japan are few.
5. The bilateral Canada EU Trade Agreement (CETA)
A substantial Canada / EU trade agreement was agreed in October 2014 which affirms adoption of large parts of the WTO agreement on TBT for trade between Canada and
the EU. In 2012, Canada was the 12th most important trading partner of the EU. Canadian energy efficiency regulations for appliances and equipment are largely
harmonised with the US.