Embed Size (px)
Citation preview

Incorporating Non-Energy Benefits into Energy Savings Performance Contracts
Peter Larsen, Lawrence Berkeley National Laboratory,
Charles Goldman, Stanford University, Donald Gilligan, National Association of Energy Service Companies, Terry E. Singer, National Association of Energy Service Companies
ABSTRACT This paper evaluates the issue of non-energy benefits within the context of the U.S.
energy services company (ESCO) industry−a growing industry comprised of companies that provide energy savings and other benefits to customers through the use of performance-based contracting. Recent analysis has found that ESCO projects in the public/institutional sector, especially at K-12 schools, are using performance-based contracting, at the behest of the customers, to partially -- but not fully -- offset substantial accumulated deferred maintenance needs (e.g., asbestos removal, wiring) and measures that have very long paybacks (roof replacement). This trend is affecting the traditional economic measures policymakers use to evaluate success on a benefit to cost basis. Moreover, the value of non-energy benefits which can offset some or all of the cost of the non-energy measures -- including operations and maintenance (O&M) savings, avoided capital costs, and tradable pollution emissions allowances -- are not always incorporated into a formal cost-effectiveness analysis of ESCO projects. Non-energy benefits are clearly important to customers, but state and federal laws that govern the acceptance of these types of benefits for ESCO projects vary widely (i.e., 0-100% of allowable savings can come from one or more non-energy categories). Clear and consistent guidance on what types of savings are recognized in Energy Savings Agreements under performance contracts is necessary, particularly where customers are searching for deep energy efficiency gains in the building sector.
Introduction
Energy efficiency building retrofits may generate significant non-energy benefits
including: operations and maintenance (O&M) savings, capital cost avoidance, and avoided compliance costs associated with meeting environmental regulatory requirements. These types of project-level benefits should be important criteria when evaluating the cost-effectiveness of large-scale energy efficiency projects. Unfortunately, there are no consistent standards in place to measure, verify, monetize, and report these benefits in most public/institutional sector contracts.
This paper evaluates the issue of non-energy benefits within the context of the U.S. energy services company (ESCO) industry−a growing industry comprised of companies that provide energy savings and other benefits to customers through the use of performance-based contracting. ESCOs deliver energy-efficient technologies, onsite power generation, and other services primarily to public and institutional sector customers (e.g., K-12 schools, universities, hospitals, local/state/federal facilities, public housing). In a typical performance contract, the ESCO guarantees some level of annual savings for their customers and ESCO compensation is
13-189©2012 ACEEE Summer Study on Energy Efficiency in Buildings
therefore linked in some fashion to the performance of the project (Satchwell et al. 2010). Early research into this industry reported that the amount of energy-related savings guaranteed by the ESCO far exceeded the upfront installation costs of the equipment (Hopper et al. 2005). Recent analysis has found that ESCO projects in the public/institutional sector, especially at K-12 schools, are using performance-based contracting, at the behest of the customers, to partially−but not fully− offset substantial accumulated deferred maintenance needs (e.g., asbestos removal, wiring, roof replacement) (Larsen et al. 2012). Many of these non-energy measures generate little or no energy-related savings, yet these projects are highly valued by customers. This trend is affecting the traditional economic measures policymakers use to evaluate success (e.g., benefit-cost ratios) and may lead to incorrect perceptions about the ability of this industry to generate long-term value to their customers−and society.
State and federal enabling policies that encourage the incorporation of non-energy benefits into performance contracts may simultaneously improve U.S. energy efficiency and ameliorate deteriorating infrastructure conditions at public facilities. The purpose of this paper is to: 1) provide background on the U.S. ESCO industry and typical project performance; 2) define non-energy benefits; 3) summarize the variety of ways that non-energy benefits are currently incorporated in government policies; and 4) introduce policies that advocate for transparent data collection and standardization of methods to estimate non-energy benefits.
U.S. Energy Services Company (ESCO) Industry What is an ESCO? Hopper et al. (2007) and Satchwell et al. (2010) define an Energy Service Company (ESCO) as:
A company that provides energy-efficiency-related and other value-added services and for which performance contracting is a core part of its energy-efficiency services business. In a performance contract, the ESCO guarantees energy and/or dollar savings for the project and ESCO compensation is therefore linked in some fashion to the performance of the project. This definition is consistent with the European Commission Directive (2006/32/EC) on
Energy Efficiency and Energy Services definition of an ESCO, in particular the definition that performance-based financial risk is held by the ESCO (Soroye and Nilsson 2010; Marino et al. 2010).
ESCO Customers Prefer Performance-Based Energy Efficiency Contracts
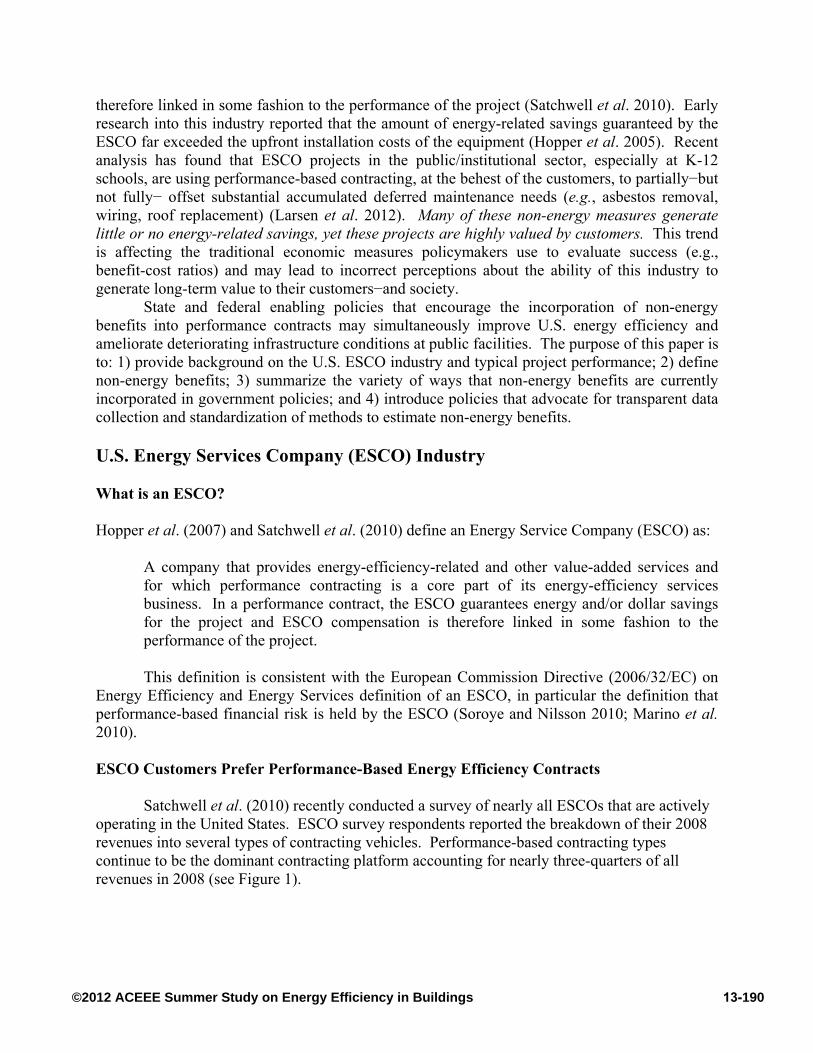
Satchwell et al. (2010) recently conducted a survey of nearly all ESCOs that are actively operating in the United States. ESCO survey respondents reported the breakdown of their 2008 revenues into several types of contracting vehicles. Performance-based contracting types continue to be the dominant contracting platform accounting for nearly three-quarters of all revenues in 2008 (see Figure 1).
13-190©2012 ACEEE Summer Study on Energy Efficiency in Buildings
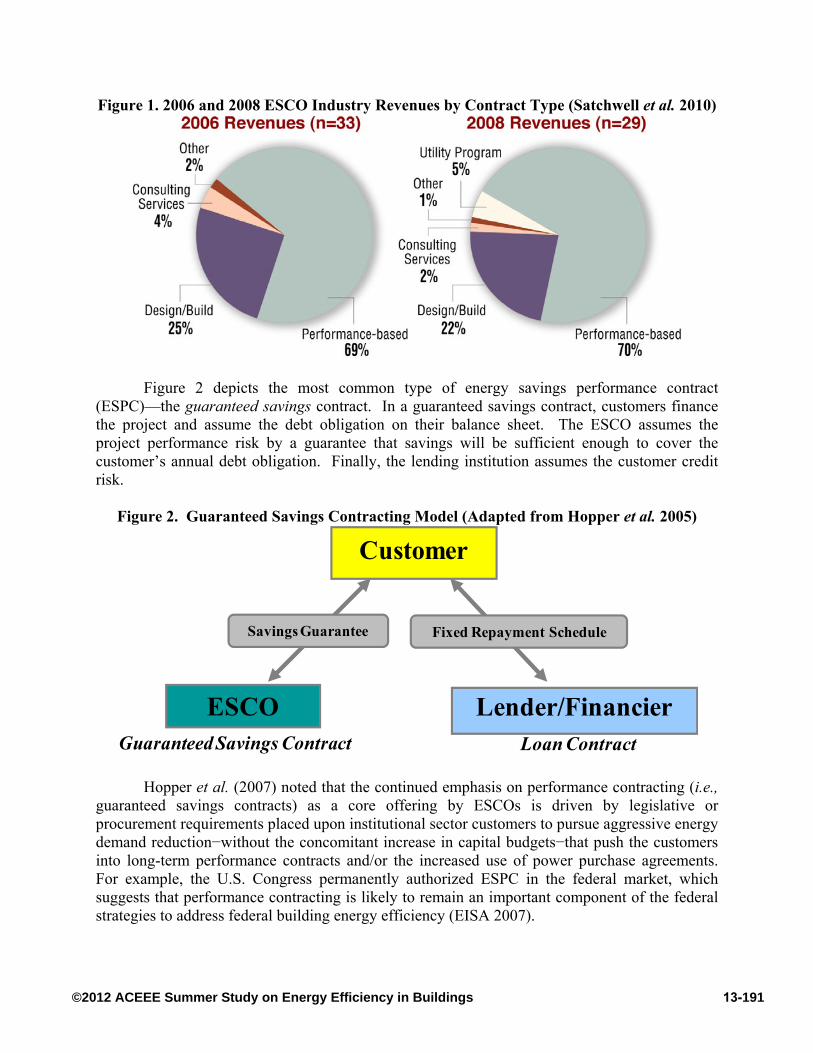
Figure 1. 2006 and 2008 ESCO Industry Revenues by Contract Type (Satchwell et al. 2010)
Figure 2 depicts the most common type of energy savings performance contract
(ESPC)—the guaranteed savings contract. In a guaranteed savings contract, customers finance the project and assume the debt obligation on their balance sheet. The ESCO assumes the project performance risk by a guarantee that savings will be sufficient enough to cover the customer’s annual debt obligation. Finally, the lending institution assumes the customer credit risk.
Figure 2. Guaranteed Savings Contracting Model (Adapted from Hopper et al. 2005)
Hopper et al. (2007) noted that the continued emphasis on performance contracting (i.e.,
guaranteed savings contracts) as a core offering by ESCOs is driven by legislative or procurement requirements placed upon institutional sector customers to pursue aggressive energy demand reduction−without the concomitant increase in capital budgets−that push the customers into long-term performance contracts and/or the increased use of power purchase agreements. For example, the U.S. Congress permanently authorized ESPC in the federal market, which suggests that performance contracting is likely to remain an important component of the federal strategies to address federal building energy efficiency (EISA 2007).
Lender/Financier
Customer
ESCO
Fixed Repayment ScheduleSavings Guarantee
Loan ContractGuaranteed Savings Contract
13-191©2012 ACEEE Summer Study on Energy Efficiency in Buildings

Estimated Size of U.S. ESCO Industry Satchwell et al. (201) asked survey respondents to report their revenues from energy
services in 2008, average annual growth rates since 2007, and projected growth in revenues. Aggregate revenues for the ESCO industry are estimated at about $4.1 billion in 2008 and were expected to exceed $7 billion in 2011.
Past Performance of ESCO Projects
In addition to conducting biennial surveys of the ESCO industry (e.g., Satchwell et al.
2010), Lawrence Berkeley National Laboratory (LBNL) has collected information about performance-based ESCO projects from various sources (i.e., ESCOs, state and federal energy offices) for more than fifteen years (e.g., see Goldman et al. 2000). LBNL Database of ESCO Projects
The LBNL database of ESCO project currently contains about 3,300 projects
(representing over $8B in project investment) including information on installed EE and electricity generation measures, project installation costs and savings, project incentives, baseline energy and location (see Table 1)1. LBNL estimates that the ESCO project database contains about 20% of all U.S. ESCO market activity from 1990-2008.
Table 1. Key Project Data Fields and ESCO Response Rate
Category Details Percent of ESCO projects that provided information
for data field (n=3265)
Project Location City, state, zipcode, country > 99% Customer Contact Name, phone, email > 99% Project Characteristics
Date of completion, floor area, number of buildings, market segment, facility type 72-99%
Project Economics Project cost (including or excluding financing charges), project agreement type, contract term, Utility incentive program participation and amount (if applicable)
20-98%
Baseline Annual Baseline metric 65% Consumption Baseline consumption by fuel/energy source 59% Annual Energy Predicted, guaranteed, actual savings 62-79%
Other Benefits Operations and maintenance and other non-energy savings over the project lifetime 37%
Measures Installed Selected from a categorized list 93% Project-Level Trends
A major focus of recent research by LBNL involves analyzing ESCO project trends over
time. LBNL’s analysis of project data strongly suggests that ESCO customers are demanding 1 Note that ESCOs do not always collect or provide all relevant project information on customer projects.
13-192©2012 ACEEE Summer Study on Energy Efficiency in Buildings
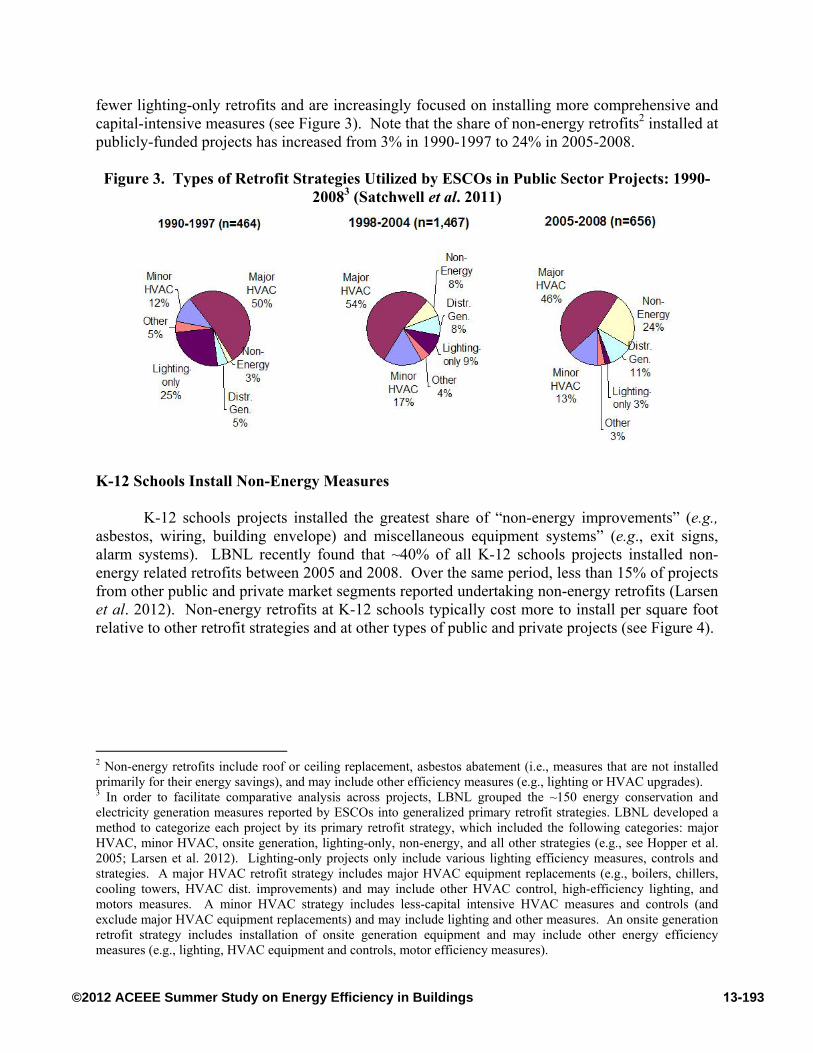
fewer lighting-only retrofits and are increasingly focused on installing more comprehensive and capital-intensive measures (see Figure 3). Note that the share of non-energy retrofits2 installed at publicly-funded projects has increased from 3% in 1990-1997 to 24% in 2005-2008.
Figure 3. Types of Retrofit Strategies Utilized by ESCOs in Public Sector Projects: 1990-
20083 (Satchwell et al. 2011)
K-12 Schools Install Non-Energy Measures K-12 schools projects installed the greatest share of “non-energy improvements” (e.g.,
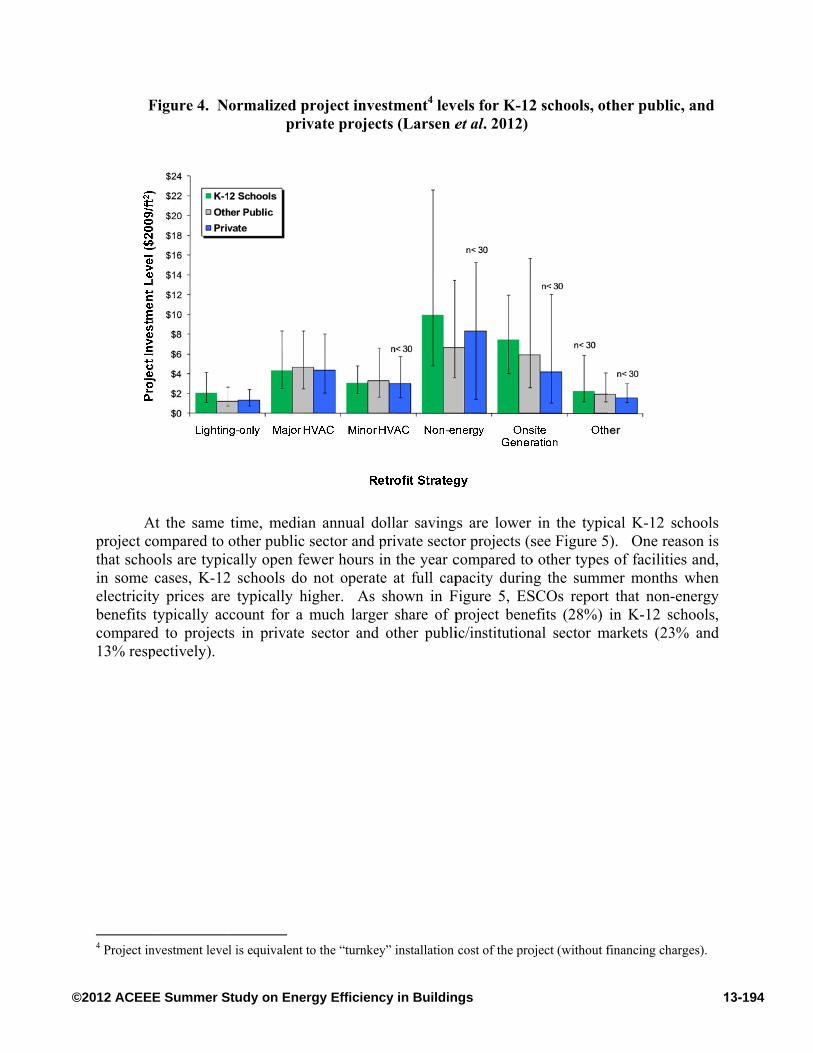
asbestos, wiring, building envelope) and miscellaneous equipment systems” (e.g., exit signs, alarm systems). LBNL recently found that ~40% of all K-12 schools projects installed non-energy related retrofits between 2005 and 2008. Over the same period, less than 15% of projects from other public and private market segments reported undertaking non-energy retrofits (Larsen et al. 2012). Non-energy retrofits at K-12 schools typically cost more to install per square foot relative to other retrofit strategies and at other types of public and private projects (see Figure 4).
2 Non-energy retrofits include roof or ceiling replacement, asbestos abatement (i.e., measures that are not installed primarily for their energy savings), and may include other efficiency measures (e.g., lighting or HVAC upgrades). 3 In order to facilitate comparative analysis across projects, LBNL grouped the ~150 energy conservation and electricity generation measures reported by ESCOs into generalized primary retrofit strategies. LBNL developed a method to categorize each project by its primary retrofit strategy, which included the following categories: major HVAC, minor HVAC, onsite generation, lighting-only, non-energy, and all other strategies (e.g., see Hopper et al. 2005; Larsen et al. 2012). Lighting-only projects only include various lighting efficiency measures, controls and strategies. A major HVAC retrofit strategy includes major HVAC equipment replacements (e.g., boilers, chillers, cooling towers, HVAC dist. improvements) and may include other HVAC control, high-efficiency lighting, and motors measures. A minor HVAC strategy includes less-capital intensive HVAC measures and controls (and exclude major HVAC equipment replacements) and may include lighting and other measures. An onsite generation retrofit strategy includes installation of onsite generation equipment and may include other energy efficiency measures (e.g., lighting, HVAC equipment and controls, motor efficiency measures).
13-193©2012 ACEEE Summer Study on Energy Efficiency in Buildings
F
A
project cthat schoin some electricitybenefits compared13% resp
4 Project in
Figure 4. N
At the same ompared to
ools are typiccases, K-12y prices aretypically acd to projectpectively).
nvestment leve
ormalized ppri
time, mediaother publiccally open fe2 schools doe typically hccount for a ts in private
l is equivalent
project inveivate projec
an annual doc sector and pfewer hours io not operathigher. As
much large sector and
to the “turnkey
estment4 levcts (Larsen e
ollar savingprivate sectoin the year ce at full capshown in F
er share of pother publi
y” installation
vels for K-12et al. 2012)
gs are lower or projects (scompared topacity durin
Figure 5, ESproject beneic/institution
cost of the pro
2 schools, ot
in the typicsee Figure 5
o other typesng the summSCOs reportefits (28%) nal sector m
oject (without f
ther public,
cal K-12 sch). One reas
s of facilitiesmer months wt that non-enin K-12 sch
markets (23%
financing charg
and
hools son is s and, when nergy hools,
% and
ges).
13-194©2012 ACEEE Summer Study on Energy Efficiency in Buildings

Figure 5
It
time (e.gtechnologinclude nadverselyto burderequiremimbalanccustomerparties enK-12 schtime perithan 1.0–
5 This anaimplementprojects, reincluded inavoided cabenefits (eor economet al. (2012discountedeach year produce th
5. Median a
t appears thag., more onsgies like rennon-energy y impacting n the perfo
ments, the ece may be jur requests onntering into hools, all othiod. Not su–for ESCO p
alysis excludest energy efficiespectively. Dn this analysisapital costs, ane.g., reduced po
mic developmen2). Net benefitd gross benefits
through the ahe present value
annual enerfoot b
at changes insite power gnewable memeasures ththe long-run
ormance conconomics oustified by n the economthe contracther public s
urprisingly, bprojects impl
s projects that ency measuresDirect benefitss, but not ind
nd environmentollution, avoidnt benefits). Cots for each projs. Gross proje
average measure of future ben
rgy and nonby project t
n the mix of eneration prasures withhat cannot bn economic ntract with of the undercustomer nemic viabilitytual arrangemsector, and pbenefit-cost lemented in
provide onsits. Results asss – energy cos
direct benefits, tal benefits. F
ded greenhouseomplete detailsject were estimect benefits were lifetime forefits.
n-energy-reltype (Larsen
capital-intenrojects, greathe associat
be fully paiperformancethe inclusiorlying projeeeds but they of the projment. Tableprivate sectoratios were K-12 school
te generation (sume a 3% anst and non-enesuch as impr
Furthermore, the gases, avoides of the econommated by subtraere estimated br every project
lated annuan et al. 2012
nsive retrofitater use of cated longer pid for throue of ESCO p
on of non-eect necessare impact of oject needs te 2 shows mor projects dtypically lo
ls5.
(or renewable nd 8% real disergy operationroved buildinghis analysis doed generation omic analysis asacting the projeby discountingt and then sum
al dollar sav2)
t strategies imcomplex andpaybacks, mugh energy projects. Asnergy deferrily change.the broaden
to be fully umedian benedisaggregateowest–and in
energy systemscount rate fornal savings (wg comfort, emoes not attemptor transmissionssumptions areect cost withou
g future monthmming these d
vings per squ
mplementedd more expemore projects
savings) ma customers b
rred mainten. This econning spectruunderstood befit-cost ratioed by installn one period
ms), but do nor public and p
when reported) mployee produc
t to quantify son infrastructuree discussed in Lut financing fro
hly dollar savindiscounted val
uare
d over ensive s that ay be begin nance nomic um of by all os for lation d less
ot also private – are ctivity, ocietal e costs Larsen om the ngs for lues to
13-195©2012 ACEEE Summer Study on Energy Efficiency in Buildings

Table 2. Median Benefit-Cost Ratios for ESCO Projects by Market Segment Market segment Installation Period Benefit-Cost Ratio
K-12 Schools 1990-1997 1.5 (n=121) 1998-2004 1.1 (n=536) 2005-2008 0.9 (n=263)
Other Public 1990-1997 3.0 (n=220) 1998-2004 1.6 (n=708) 2005-2008 1.2 (n=339)
Private 1990-1997 4.3 (n=138) 1998-2004 2.2 (n=185) 2005-2008 2.7 (n=31)
Despite the fact that some ESCO projects have benefit-cost ratios that are less than one,
these types of projects appear to be highly valued by customers because the projects address the customer’s deferred maintenance needs and improve the customer facility with only a minimal direct capital outlay by the customer. Hopper et al. (2005) noted that non-energy measures often “piggyback” on energy savings measures, which are vital to the project. Thus, it should not be concluded that these types of projects do not save energy, but they may have relatively lower benefit-cost ratios because the savings are used to partially offset non-energy-related infrastructure upkeep.
In addition to the measures that may not necessarily reduce energy consumption like abating the existence of asbestos or replacing a roof, there are other types of non energy benefits that may be associated with an efficiency retrofit. These include operations and maintenance savings and avoided capital costs. At the current time, these “non-energy benefits” are not consistently reported to Lawrence Berkeley National Laboratory; however, these benefits could be standardized and incorporated into future economic analysis to more accurately reflect the true value of these projects to their customers. As currently measured and reported, the calculation of the cost to benefit ratio of the energy efficiency retrofit is probably undervalued as these non-energy benefits are not typically and certainly not consistently quantified.
What Are Non-Energy Benefits?
Birr and Singer (2008) cite a number of non-energy benefits for ESCO projects, but not
all of these benefits can be easily monetized and included into a typical contract (e.g., societal value of reduced GHG pollution, worker “happiness”). For example, Birr and Singer (2008) introduce the following non-energy benefits at energy-related retrofit projects:
• Operations and maintenance savings; • Improving worker/student productivity; • Decreased illness from indoor air quality problems; and • Reduced environmental pollution (GHGs, other air and water pollutants).
Similarly, Gillingham et al. (2006) report on the literature detailing environmental
externalities and found that reducing electricity use provided societal benefits that were approximately 10% of the dollar value of the electricity savings.
13-196©2012 ACEEE Summer Study on Energy Efficiency in Buildings

Sorrell (2005) notes that an ESCO customer has a range of motivations for entering into an energy service contract, but the majority of these reasons cannot be incorporated into a cost-benefit (i.e., contractual) framework. For the purposes of this paper, non-energy benefits are defined as benefits that could be immediately incorporated into a typical contractual framework.
Non-energy benefits are operations and maintenance (O&M) savings, avoided capital costs, and reductions in tradable pollution emissions that can be monetized, but are not consistently incorporated into a formal cost-effectiveness analysis of projects6. Operations and maintenance savings typically include decreased maintenance costs and
staffing reductions that are related to the installation of new energy conservation measures. Avoided capital costs are future capital expenditures that are unnecessary after a building system has been upgraded. In some states, organizations can be compensated for reducing air pollution through a market-based auction.
The LBNL project database indicates that ESCOs report O&M savings for many projects (see Table 3). However, a relatively small number of projects are reporting other types of non-energy benefits (e.g., avoided capital costs). LBNL researchers suspect that other types of non-energy benefits, especially “avoided capital costs”, are being significantly under-reported or under-valued7 in ESCO projects.
Table 3. Percent of Projects in LBNL Database that Report Non-Energy Benefits
Percent of Projects Reporting….
Market Segment N O&M
Savings Any Non-
energy Benefits K-12 schools 1,081 43% 49% All other public/institutional sector projects 1,670 28% 34% Private projects 514 18% 20% It is not surprising that K-12 schools represent the largest share of projects reporting non-
energy benefits. Crampton and Thompson (2008), ASCE (2009), and Bello and Loftness (2010) report that U.S. public schools are the oldest buildings that typically have the largest backlogs of deferred maintenance compared to all other public facilities. Crampton and Thompson (2008) estimate that K-12 schools in the U.S. have a total backlog of infrastructure upkeep that exceeds $250 billion8.
One of the challenges with conducting formal cost-benefit analysis is the difficulty inherent in monetizing the impacts of a project−especially the benefits (Boardman et al. 2006). GAO (2005) briefly mentions ESCO project benefits that cannot be easily quantified, “such as improved reliability of the newer equipment over the aging equipment it replaced, environmental
6 Customers, policymakers, and other stakeholders may consider other non-energy benefits (e.g., worker/student productivity gains and societal benefits from reduced pollution) when deciding on projects, but there is little or no precedent for monetizing and including these types non-energy benefits in a typical contract. Researchers and policy analysts have written about the justification for measuring productivity and societal benefits but currently there is no consensus about quantification methodologies. 7 ESCOs typically estimate energy savings from projects using an accepted method from the International Performance, Measurement, and Verification Protocol (IPMVP), but there are currently no international standards in place for collecting, estimating, and/or monetizing non-energy benefits (e.g., avoided O&M and capital costs). 8 Underfunding K-12 school facility upkeep is not a new issue or unique to the United States (OECD 1992).
13-197©2012 ACEEE Summer Study on Energy Efficiency in Buildings

improvements, and additional energy and financial savings once the contracts have been paid for.” Despite this acknowledgment, the federal government and states have provided inconsistent guidance to agencies (and ESCOs) on how to monetize non-energy benefits (e.g., avoided costs) through energy savings performance contracting (ESPC) legislation.
Life-Cycle Cost Assessment
At least one federal agency has provided some direction on the use of Lifecycle Cost
Assessment (LCCA) for federal projects (USDOE 2005). USDOE (2005) specifically mentions that LCCA can be used to compare the costs of existing equipment against the costs over the same time period of an energy conservation measure (ECM) proposed by an energy service company. USDOE (2005) defines life-cycle costs as “…the sum of present values of investment costs, capital costs, installation costs, energy costs, operating costs, maintenance costs, and disposal costs over the life-time of the project, product, or measure.” (p. 4) The Rocky Mountain Institute (RMI) and General Services Administration (GSA) advocate the use of facility lifecycle cost assessments, because this method more accurately captures significant project costs and benefits (rebates, avoided maintenance, avoided immediate and future capital investments, etc.) leading to more comprehensive retrofits (RMI-GSA 2011). Several states, including Virginia (discussed below), requires that a lifecycle cost assessment be performed for government building retrofits.
Non-Energy Benefits and Performance Contracting Legislation
Non-energy benefits can be significant and represent real value to customers, but state
and federal laws that govern the acceptance of these types of benefits for ESPC projects vary widely (i.e., 0-100% of allowable savings can come from one or more non-energy categories).
Federal ESPC Legislation
ESPCs permit federal agencies to acquire energy conservation measures to meet federal
energy efficiency goals and implement projects without having to request the full amount of appropriations from the federal budget (GAO 2004). The legislation authorizing agencies to enter into these contracts authorizes a contract length up to 25 years. GAO (2004) notes that the legislation provides that “a Federal agency may enter into a multiyear contract . . . and [the contractor] may be paid only from funds appropriated or otherwise made available to the agency for fiscal year 1986 or any fiscal year thereafter for the payment of energy expenses (and related operation and maintenance expenses)”9 The Government Accounting Office (GAO) indicated that agencies structure ESPCs so that financial savings cover costs and they have reported that many do (GAO 2005). RMI-GSA (2011) suggest redefining and clarifying eligible savings, particularly as it relates to O&M and avoided capital costs at ESCO projects. They note that “clear and consistent guidance from GSA on what the ESPC can include [as savings] is necessary for deep energy efficiency gains in federal facilities.”
9 42 U.S.C. § 8287a
13-198©2012 ACEEE Summer Study on Energy Efficiency in Buildings
State ESPC Legislation
Many states have enacted energy savings performance contracting legislation. Most states have a requirement that project benefits must be greater than or equal to costs. In some states (e.g., Hawaii, Pennsylvania, New Jersey), projects that guarantee savings performance are given preference over other types of contracts (i.e., design-build). Table 4 shows a representative sample of state-by-state legislation and information about the types of non-energy benefits recently allowed in government procurement processes.
Hawaii’s (2006) statutes give preference to performance-based contracts. Hawaii allows the inclusion of O&M savings and avoided capital costs in ESPCs, but does not allow other types of non-energy benefits.
New Mexico (2011) has specific rules on the type and amount of non-energy benefits that are allowed in contracts that address energy efficiency upgrades. New Mexico requires that the entire project cost must be guaranteed and no “future avoided capital costs, planned upgrades, engineering fee reductions, or learning environment benefits” are allowed in the contract.
Pennsylvania (1998) and New Jersey (2007) allow avoided capital costs on energy-related upgrades and they cap the percentage (15%) spent on improvements not causally related to energy savings. The rationale for this limitation is that the customer agency is able to add some non-energy measures (e.g., asbestos remediation in a boiler replacement project) for convenience, but any large non-energy project has to be procured through normal public bidding procedures. Costs must be documented using “industry standards”, but it is not immediately clear what industry standards govern this process. Other building improvements are allowed if they are required to implement the energy upgrade. It is likely that the limits placed on an expanded pool of non energy benefits are a reflection of uncertainty by legislators about how these non energy benefits are calculated and how real and persistent the non-energy generated savings may be over the life of the project.
Florida (2011) statutes allow ESCO projects to utilize avoided capital costs as savings. A 2011 report for the Energy and Utilities Subcommittee of the Florida House of Representatives recommended a number of changes to the state ESCO program including reducing the maximum contract length from 20 to 10 years (Florida 2011). The Florida report provides specific guidance on how to accurately monetize the avoided costs of energy efficiency upgrades−using a lifecycle cost approach.
Virginia (2001) legislation allows for O&M savings and avoided capital costs. Virginia requires that contracts do not exceed 12 years. Unlike other states, Virginia requires that the lifecycle method should be used to estimate energy, O&M, and avoided capital costs.
Compared to the other states in this analysis, Virginia appears to have the most clear and consistent methods for quantifying and incorporating non-energy benefits into energy efficiency project decision-making. It is important to note that the 2011 audit conducted by the State of Florida recommended many of the policy designs already implemented in Virginia (e.g., shorter contract length, lifecycle cost approach to estimating savings). It is not clear that shortening the contract length of the energy savings performance contract does much to establish or enhance the credibility of non-energy benefits that legislators are presumably seeking through the imposition of a shorter contract term. It is clear, however, that the shorter contract term makes it more difficult to meet the goal to maximize energy savings and employ the full range of energy savings and renewable energy technologies with longer paybacks.
13-199©2012 ACEEE Summer Study on Energy Efficiency in Buildings
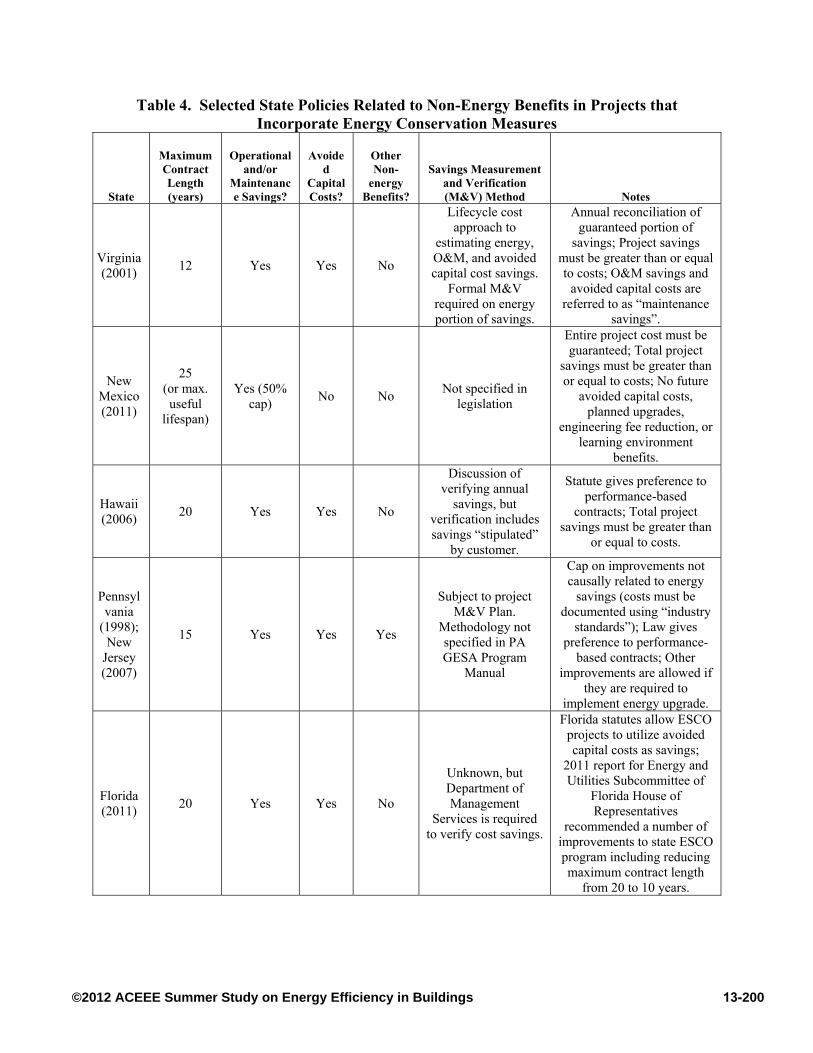
Table 4. Selected State Policies Related to Non-Energy Benefits in Projects that Incorporate Energy Conservation Measures
State
Maximum Contract Length (years)
Operational and/or
Maintenance Savings?
Avoided
Capital Costs?
Other Non-
energy Benefits?
Savings Measurement and Verification (M&V) Method Notes
Virginia (2001) 12 Yes Yes No
Lifecycle cost approach to
estimating energy, O&M, and avoided capital cost savings.
Formal M&V required on energy portion of savings.
Annual reconciliation of guaranteed portion of
savings; Project savings must be greater than or equal to costs; O&M savings and
avoided capital costs are referred to as “maintenance
savings”.
New Mexico (2011)
25 (or max. useful
lifespan)
Yes (50% cap) No No Not specified in
legislation
Entire project cost must be guaranteed; Total project
savings must be greater than or equal to costs; No future
avoided capital costs, planned upgrades,
engineering fee reduction, or learning environment
benefits.
Hawaii (2006) 20 Yes Yes No
Discussion of verifying annual
savings, but verification includes savings “stipulated”
by customer.
Statute gives preference to performance-based
contracts; Total project savings must be greater than
or equal to costs.
Pennsylvania
(1998); New
Jersey (2007)
15 Yes Yes Yes
Subject to project M&V Plan.
Methodology not specified in PA GESA Program
Manual
Cap on improvements not causally related to energy
savings (costs must be documented using “industry
standards”); Law gives preference to performance-
based contracts; Other improvements are allowed if
they are required to implement energy upgrade.
Florida (2011) 20 Yes Yes No
Unknown, but Department of Management
Services is required to verify cost savings.
Florida statutes allow ESCO projects to utilize avoided capital costs as savings;
2011 report for Energy and Utilities Subcommittee of
Florida House of Representatives
recommended a number of improvements to state ESCO program including reducing maximum contract length
from 20 to 10 years.
13-200©2012 ACEEE Summer Study on Energy Efficiency in Buildings

Policy Recommendations Support International Protocols to Quantify and Report Value of Non-Energy Benefits
Most ESCOs currently follow international protocols that standardize how energy and water-related savings are computed (EVO 2010), but there are no international standards in place to collect and then monetize information about avoided O&M and capital costs specifically related to ESCO projects despite an obvious need (Birr and Singer 2008). Existing methods to quantify the value of ESCO projects to their customers were built on the assumption that nearly all of the installation costs are covered by the energy-related savings.
Given the trend to using energy retrofit projects as a basis for infrastructure upgrades that may not have a significant energy savings component and the resultant decline in project-level economics, it is clear that new methods−including a deeper analysis of the lifecycle costs of infrastructure replacement−are needed to more accurately quantify the value of ESCO projects, especially in the K-12 schools market. Successful incorporation of non-energy benefits into performance metrics will 1) increase benefit-cost ratios, 2) result in more ESCO projects moving forward, and 3) generate deeper energy savings and other non-energy benefits for schools and other agencies. Therefore, the International Performance Measurement and Verification Protocol (IPMVP) team, government agencies at all levels, and private energy service companies and contractors, should promote EM&V documentation and practices that include standards for the collection, verification, and monetization of certain types of non-energy benefits. Research Successful Policies and Programs that Incorporate Non-Energy Benefits
This paper identified a sample of state-by-state legislation and information about the
types of non-energy benefits recently allowed in government procurement processes. It is important to find models for governments, ESCOs, and their customers to successfully incorporate avoided O&M, capital costs and other non-energy benefits into performance contracting programs. Researchers should evaluate whether certain policies or program designs can: 1) alleviate concerns that these types of benefits are, in fact, quantifiable; and 2) incorporate the value of these non-energy benefits in a formal cost-benefit framework.
Conclusion
Non-energy benefits -- including operations and maintenance (O&M) savings, avoided
capital costs, and reductions in tradable pollution emissions -- are not always incorporated into a formal cost-effectiveness analysis of ESCO projects. Non-energy benefits are clearly real to, and valued by, customers, but state and federal laws that govern the acceptance of these types of benefits for ESCO projects vary widely (i.e., 0-100% of allowable savings can come from one or more non-energy categories). Clear and consistent guidance on the type and amount of savings that are allowed in contracts is necessary for deep energy efficiency gains in the building sector.
The GSA and several states have introduced some innovative ways (“lifecycle cost assessment”) to more accurately monetize specific types of non-energy benefits. An important new area of research involves supporting benchmarking and standardization efforts to quantify non-energy (and other indirect benefits) for energy efficiency projects. EM&V protocols—
13-201©2012 ACEEE Summer Study on Energy Efficiency in Buildings
including the measurement of indirect and non-energy-related benefits—need to be further developed to truly capture the intrinsic value of these projects to customers.
References
American Society of Civil Engineers (ASCE). 2009. “Report Card for America’s
Infrastructure,” March.
Bello, M. and V. Loftness. 2010. “Addressing Inadequate Investment in School Facility Maintenance,” School of Architecture, Carnegie Mellon University. Paper 50. http://repository.cmu.edu/architecture/50
Birr, D. and T. Singer 2008. “NAESCO Analysis of Non-energy Benefits of Efficiency Retrofits for ESCOs and ESCO Customers.” National Association of Energy Service Companies Report, December.
Boardman, A.E., D. Greenborg, A. Vining, and D. Weimer (eds). 2006. “Cost-Benefit Analysis Concepts and Practice”, Pearson Prentice Hall, Upper Saddle River, New Jersey. Third Edition.
Frost and Sullivan, 2006. “United States ESCO Market.” Palo Alto, CA.
Crampton, F. and D. Thompson. 2008. “Building Minds, Minding Buildings: School Infrastructure Funding Need: A state-by-state assessment and an analysis of recent court cases,” American Federation of Teachers, December.
Efficiency Valuation Organization (EVO). 2010. “International Performance Measurement and Verification Protocol: Concepts and Options for Determining Energy and Water Savings: Volume 1,” September. Accessed at: http://www.evo-world.org/
Energy Independence and Security Act (EISA) of 2007, H.R. 6, 110th Cong., 1st Sess. (2007).
U.S. Department of Energy (DOE). 2005. Guidance on Life-Cycle Cost Analysis Required by Executive Order 13123, April.
Gillingham K, R. Newell, and K. Palmer. 2006. Energy Efficiency Policies: A Retrospective Examination. Annual Review of Environment and Resources 31: 161–92
Goldman, C. A., Juergens, P., Fowlie, M., Osborn, J. G., Kawamoto, K., Singer, T. E., 2000. “Historical performance of the U.S. ESCO industry: Results from the NAESCO project database.” Paper presented to American Council for an Energy Efficient Economy (ACEEE) Summer Study on Buildings Conference, Asilomar, CA, August.
Government Accounting Office (GAO). 2004. “Partnerships and Energy Savings Performance Contracts Raise Budgeting and Monitoring Concerns.” Report to the Chairman, Committee on the Budget, U.S. Senate. GAO-05-55, December.
13-202©2012 ACEEE Summer Study on Energy Efficiency in Buildings
Government Accounting Office (GAO). 2005. “Performance Contracts Offer Benefits, but Vigilance Is Needed to Protect Government Interests” Report to Congressional Requesters. GAO-05-340, June.
Hawaii. 2006. Energy retrofit and performance contracting for public facilities. Revised statutes 36-41.
Hopper, N., C. Goldman, J. McWilliams, D. Birr, and K. McMordie-Stoughton 2005. “Public and Institutional Markets for ESCO Services: Comparing Programs, Practices and Performance,” Lawrence Berkeley National Laboratory: LBNL-55002, Berkeley CA, March.
Hopper, N., C. Goldman, D. Gilligan and T. Singer, D. Birr. 2007. “A Survey of the U.S. ESCO Industry: Market Growth and Development from 2000 to 2006”, LBNL-62679. May.
Larsen, P., C. Goldman and A. Satchwell. 2012. “Analysis of U.S. ESCO Public and Private Sector Projects: 1990-2008”, Lawrence Berkeley National Laboratory”. In submission to Energy Policy, March.
Mahoney, J. and L. Thompson. 1998. “Upgrade Your Facilities Without a Bond Issue”, School Planning and Management; v37 n2 , pp 56-60.
Marino, A., P. Bertoldi, and S. Rezessy. 2010. “Energy Service Companies Market in Europe-Status Report 2010”, European Commission Joint Research Centre: EUR 24516 EN – 2010.
New Jersey. 2007. Assembly 4357, 212th Legislature. “Establish procedures for guaranteed energy savings contracts by governmental entities”, June.
New Mexico. 2011. Public Facility Energy Efficiency and Water Conservation Act. Guidelines for Guaranteed Energy Efficiency Projects, January.
Organisation for Economic Cooperation and Development (OECD). 1992. “Decentralisation and Educational Building Management: The Impact of Recent Reforms”, Paris.
Pennsylvania. 1998. Act 57 of 1998. Guaranteed Energy Savings Performance Contracting Program for Agencies of the Commonwealth of Pennsylvania.
Rocky Mountain Institute-General Services Administration (RMI-GSA). 2011. “GSA Net Zero Renovation Challenge Charrette” December.
Satchwell, A., P. Larsen, and C. Goldman. 2011. “Combining Energy Efficiency Building Retrofits and Onsite Generation: An Emerging Business Model from the ESCO Industry.” ACEEE Summer Study on Energy Efficiency in Industry, August.
Satchwell, A., C. Goldman, P. Larsen, D. Gilligan, and T. Singer. 2010. “A Survey of the U.S. Energy Services Company (ESCO) Industry: Market Growth and Development from 2008 to 2011”. LBNL Report 3479-E, June.
13-203©2012 ACEEE Summer Study on Energy Efficiency in Buildings

Sorrell, S., 2005. “The Contribution of Energy Service Contracting to a Low Carbon Economy.” Final report to the Tyndall Centre for Climate Change Research. SPRU, University of Sussex, Brighton.
Soroye, K. and L. Nilsson 2010. “Building a business to close the efficiency gap: the Swedish ESCO Experience”. Energy Efficiency, 3(3), 237-256.
Virginia. 2001. Virginia Acts of Assembly—2001 Session. Chapter 219: Energy and Operational Efficiency Performance-based Contracting Act, March.
13-204©2012 ACEEE Summer Study on Energy Efficiency in Buildings