Embed Size (px)
Citation preview

VOL. 4 4 , SUPP. 1 ( 1 9 9 1 ) P. 102-107 ARCTIC
Satellite Geological Mapping of the Yellowknife Volcanic Belt JOHN A. BROPHY’
(Received 5 September 1990; accepted in revised form 15 April 1991)
ABSTRACT. An ARIES III Image Analysis System was used to manipulate digitized Landsat 5 Thematic Mapper (TM) imagery of the Yellowknife Volcanic belt (YVB) to demonstrate geological applications of this technology in a boreal region characterized by subdued topography, open-canopy forest cover and about 50% outcrop exposure. The YVB was selected for study because detailed geological mapping is available against which com- puter-generated imagery could be compared and evaluated.
The study area encompasses a northerly trending belt of principally mafic volcanic rocks (Kam Group) flanked to the west by a multi-phase batholith (Western Granodiorite Complex) and to the east by turbiditic sediments (Burwash Formation) and granitic stocks. Intermediate volcanic rocks (Banting Group) and a narrow belt of conglomerates (Jackson Lake Formation) separate the Kam Group from the Burwash Formation.
Initially, images from each of the six TM channels were analyzed, and it was found that channels 7 (short-wave infrared), 3 (red) and 2 (green) yield the best discrimination of geological features. Subsequently, various computer-generated enhancement programs were applied to these channels to intensify geological discrimination, and the resulting images were combined to produce a number of false-colour composite images that were com- pared to published geological maps.
On the best of these “satellite geological maps” at least three phases of igneous intrusions can be identified, as well as the boundaries of the Kam Group and a number of important structural discontinuities. The adjacent Banting Group volcanics and Burwash Formation sediments could not be chromatically separated but are sometimes distinguishable using textural criteria. Most notably, certain computer-enhanced images highlight two zones of alteration within the Kam Group that have not previously been noted on published maps. These alteration zones appear to be spatially asso- ciated with a number of gold showings and one significant gold deposit.
It is concluded that computer manipulation of satellite imagery can add worthwhile information to the geological database of areas that have been mapped at a detailed scale of 1:lO OOO. Key words: geology, satellite imagery, Landsat 5, Thematic Mapper, Yellowknife Volcanic Belt, computer, DIPIX, ARIES III
RÉSUMÉ. On s’est servi d’un systbme d’analyse d’images ARIES III pour manipuler des images de la ceinture volcanique de Yellowknife obtenues avec l’appareil de cartographie thtmatique Landsat 5, afin de dtmontrer les applications gtologiques de cette technologie 9 une rtgion bortale où la topographie est peu marquée et le couvert forestier ouvert, et où les affleurements exposts représentent 50 p. cent de la surface. On a choisi la cein- ture volcanique de Yellowknife il cause de la possibilitt de comparer l’imagerie informatiste avec la cartographie dttaillde dtjil disponible, et de faire une évaluation.
La zone d’étude englobe une ceinture orientte géntralement vers le nord, composte surtout de roches volcaniques mafiques (groupe Kam), bordde il l’ouest par un batholite il phases multiples (complexe granodioritique occidental) et il l’est par des sddiments turbiditiques (formation Burwash) et des stocks granitiques. Des roches volcaniques intermddiaires (groupe Banting) et une ceinture ttroite de conglomtrats (formation Jackson Lake) dparent le groupe Kam de la formation Burwash. On a tout d’abord proctdt il l’analyse des images obtenues avec chacune des 6 fréquences de l’appareil de cartographie thtmatique, et on a trouvé
que les bandes 7 (ondes courtes infrarouges), 3 (rouge) et 2 (vert) permettaient la meilleure discrimination des caracttristiques gtologiques. On a ensuite appliqué il ces bandes des programmes d’accentuation informatisée, en vue d’intensifier la discrimination gdologique, et on a combiné les images obtenues pour produire plusieurs images compostes en fausse couleur que l’on a compdes ?I des cartes gtologiques publiées. Sur les meilleures de ces <a r t e s gtologiques satellitesr, on a pu identifier au moins trois phases d’intrusions endogbnes ainsi que les limites du groupe Kam et plusieurs grandes discontinuités de structure. On n’a pu stparer par chromatographie les roches volcaniques du groupe Banting et les stdiments de la formation Burwash, tous deux adjacents, mais on a pu les discerner parfois en utilisant des critbres de texture. I1 est il remarquer que certaines images traitées par accentuation informatisée mettent en tvidence deux zones d’alttration dans le groupe Kam, qui n’apparaissaient pas jusque-lil sur les cartes publiées. Ces zones d’alttration semblent être associées spatialement il plusieurs indices auritères et il un gisement auritère d’importance.
On conclut que le traitement informatist de l’imagerie satellite peut ajouter une information t&s valable il la base de donntes gtologiques de régions ayant étd cartographikes il une khelle détaillte de 1:lO OOO. Mots ~16s: g6ologie, imagerie satellite, Landsat 5, appareil de cartographie thdmatique, ceinture volcanique de Yellowknife, ordinateur, DIPIX, ARES III
Traduit pour le journal par Ntsida Loyer.
INTRODUCTION
The DIPIX ARIES III Image Analysis System (software pack- age version 4.6) is designed to manipulate digital data from satellite imagery. The main purpose of this study was to gain familiarity with the general capabilities of this technology and to evaluate and report on its relevance as a geological tool, particularly from the perspective of an exploration geologist.
The Yellowknife Volcanic Belt (YVB) was chosen as a test area because 1:lO O00 scale geological mapping is available (Helmstaedt et al., 1979, 1980 Henderson and Brown, 1966), against which computer-enhanced imagery could be compared and evaluated. The author’s familiarity with the geology of this area and the presence of significant gold deposits in the YVB (Nerco-Con Mine, Giant Mine) were ancillary factors favouring the selected test area. Analogous studies have been
done in other parts of Canada (Aronoff and Goodfellow, 1985; Aronoff et al., 1985, 1986; Slaney, 1985).
In this study, data used were from Thematic Mapper (TM) imagery taken by the Landsat 5 satellite on 12 July 1987.
The ARIES III features an ability to discriminate 256 “grey levels” (reflectance values) from each of the approximately 10 million pixels that constitute a single TM “scene” (1 85 km x 185 km). Since each TM scene is imaged on 7 different spectral channels, the ARIES III can actually work with about 70 million pixels of information. Its image-enhancing powers are derived mainly from its capability to apply algorithms to modify the spectral signature of a scene or sub-scene, thus altering the image to reveal features that were obscure on the original image. The user can also “classify” an image by iden- tifying the reflectance characteristics corresponding to a
‘Bear-Slave Region, Geology Division, Northern Affairs Program, Box 1500, Yellowknife, Northwest Territories, Canada XIA 2R3 @The Arctic Institute of North America

known or interpreted feature and instructing the computer to identify all similar reflectance values in order to map out simi- lar features throughout the image. Such classifications can be “supervised” (requiring ground data) or “unsupervised” (rely- ing mainly on computer classification).
The ARIES I11 can also produce a composite false-colour image by combining three images processed successively through a red, green and blue “gun.” In doing so, the computer assigns each grey reflectance value an equivalent red, green or blue reflectance value. Features on the colour composite are easier to detect than features on a black-and-white image because the human eye distinguishes variations in colour more easily than variations in shades of grey. The three images that are combined may be enhanced and/or unmodified.
YELLOWKNIFE VOLCANIC BELT / 103
THE YELLOWKNIFE VOLCANIC BELT (YVB)
The study area comprises a 15 km by 35 km segment of the YVB and adjacent sediments and granitoids (Figs. 1, 2). The topography of the study area appears flat from a regional per- spective, but in detail it is rugged, with rocky hills and ridges rising abruptly from lake or muskeg to heights of 15-30 m. The north-trending YVB stands out as a positive topographic feature. It is composed mainly of mafic volcanic rocks (basalt and andesite) and intrusive equivalents (gabbro and diorite), known collectively as the Kam Group. Most of the Yellow- knife townsite and both of the principle gold mines (Nerco- Con and Giant) are within the Kam Group (Fig. 2). Flanking the Kam Group to the east is a succession of intermediate to
me$neZxl rocks based on Mirage islands EXteflS/On of Ye//owkn/fe
West Mirage lslands
FIG. I . Geology of the Yellowknife region, showing the location of the study area (from Henderson, 1985).
E W

104 / J.A. BROPHY
felsic volcanics (andesite to rhyolite) and minor sediments of nmow unit of conglomerate and sandstone, separates parts of the Banting Group. The Jackson Lake Formation, a relatively the K m Group from the Banting Group.
FIG. 2. Geology of the Yellowknife Volcanic Belt. The study area is outlined in bold. The north half of the study area corresponds with Figure 3 (from Falck, 1990).

The YVB is flanked to the east by batholithic intrusions of the Western Granodiorite Complex and farther to the north by the Ducktish Lake Granite. Granitic terrains tend to be very well exposed and to form areas of intermediate topographic relief.
To the east of the YVB lies an extensive region of subdued topography underlain by sediments (mainly arenite and argillite) of the Burwash Formation. These are intruded by other granites, most notably the Prosperous Lake Granite to the north and the Defeat Plutonic Complex to the south. All rock units described above are of Archean age, approximately 2.65 billion years, and are intruded by diabase dikes of Pro- terozoic age. Linear geological features in the study area include tuffaceous interbeds, shear zones, diabase dikes and post-diabase faults.
Forest cover is of the open-canopy type, constituting mainly spruce, pine, larch and birch. Outcrop exposure is excellent, averaging about 50%, although bedrock detail is typically obscured by lichen, mainly brown rock tripe. The reader is referred to Helmstaedt and Padgham (1986) and Henderson (1985) for more detailed accounts of the geology of the Yellowknife Volcanic Belt.
METHODS
The detailed study area was blocked out from the TM satel- lite scene and a geometric correction program was imple- mented to link the study area to a UTM grid and reorient the sub-scene to astronomical north. Individual TM channels (Table 1) were studied to identify those three that best repre- sented geological features. A variety of enhancement routines were tested on the selected TM channels to identify those modifications that produced the best enhancements of geologi- cal features. Finally, false-colour composite images obtained by combining triads of the best of these enhanced images were generated at a 1 : 10 OOO scale using a colour plotter. The result- ing products were compared to published geological maps.
RESULTS
Analysis of Individual TM Channels Channels TM 7 and TM 5 give the best definition of linear
elements and relief. In addition to local relief, they chromati- cally separate zones of subdued topography underlain mainly by sediments (dark grey) from zones of more positive topogra- phy underlain mainly by mafic volcanics and granites (light grey). Of the two channels, TM 7 provides the better contrast between geological units and was therefore selected as one of the three channels to be used in subsequent test work.
Channel TM 4 produces an extremely monotonous “washed” image that renders little information useful from a geological perspective. Channels TM 3, TM 2 and TM 1 pro- duce images in which the Kam Group volcanics (medium grey) can be clearly distinguished from adjacent granites to the west (light grey). Channel TM 1 provides the least contrast between these two units.
Channels TM 7, TM 3 and TM 2 were therefore chosen as subjects for subsequent enhancement tests.
Analysis of Image Enhancements In this study, only the image-enhancement routines of the
ARIES I11 were evaluated. These include various contrast stretches (linear, histogram and logarithmic), convolution fil- tering (enhancement of linears), principal component enhance-
YELLOWKNIFE VOLCANIC BELT / 105
TABLE 1. Landsat Thematic Mapper channels
Channel Wavelength (pm) Colour TM 1 0.45-0.52 blue TM 2 0.52-0.57 TM 3
green
TM 4 0.76-0.90 near infrared (IR) TM 5 1.55-1.75 shortwave IR (1) TM 7 2.08-2.35 shortwave IR (2) TM 6 10.80-12.5 thermal (not used in this study)
0.63-0.69 red
ments and colour unpackings of these enhancements, statistics filtering and input-output transformations. In subsequent dis- cussions, little attempt is made to elaborate computer proce- dures or to detail the algorithmic functions that produce the enhanced image. Convolution filtering, however, is described in some detail as an example to illustrate the myriad sub-rou- tines and parameter choices typically offered by the computer and to underscore the superficiality, due to time constraints, of this study’s sampling of the available enhancement routines.
In order to facilitate comparison and analysis of the images generated by the various enhancement routines, photographs of the images on the monitor were taken that could later be reviewed at leisure. Because the screen holds a relatively non- decimated image of only half the study area, the north half (Fig. 3), which is farthest away from the cultural disturbances at Yellowknife, was selected for photographic evaluation.
Convolution Filtering Because the two large gold mines in the YVB, Nerco-Con
and Giant, are hosted in crudely linear structures (shear zones) and are spatially associated with a fault linear (the West Bay Fault), some time was spent evaluating a Convolution Filtering program used to enhance lineaments by selectively altering pixel brightness values to “mark” locations of signifi- cant changes in “brightness slope.” The menu offers 3 sub- routines, 31 choices of filter size and 8 choices of filter direc- tion. In effect, hundreds of alternative enhancements of an original image are possible, only a sprinkling of which were actually investigated.
Using TM 7 as the input image and scanning in four differ- ent directions (N, NE, E, NW) with a coarse filter (21 x 21 pixel matrix) and a fine filter (5 x 5 pixel matrix), eight enhanced images were produced. These images resemble lunar landscapes rippled by linear fabrics most clearly pronounced along trends perpendicular to the scanning direction of the fil- ter. Many of the linear elements in the study area were empha- sized, including those mentioned earlier. However, most of the linears could very well have been traced from the original satellite image, albeit more painstakingly, without the aid of a computer. Admittedly, some subtle lineaments, obscured by the plethora of more obvious lineaments in this exceptionally well-exposed belt, might have been overlooked in a manual analysis. Moreover, the lineament patterns can be used as a tool to map geology, since rheological differences in the vari- ous geological units influence the pattern, quantity and size of linear fabrics.
Other Enhancements Some enhancements (principle components, cube root
transformations and certain contrast stretches, for example) are clearly useful in elucidating the geology of the study area
106 I J.A. BROPHY
and improving details of the input image. It was found that study of individual monochromatic enhanced images yields more information than study of false-colour composite images. This is because certain enhancements clearly emphasize the mafic volcanics (Kam Group) but obscure the differences between granitic terrain and volcano-sedimentary terrain (Burwash Formation + Banting Group), while others clearly emphasize either the volcano-sedimentary terrain or the granitic terrain. But since none was able to differentiate all
three of these main geological units, false-colour composites using the best enhanced images as inputs usually give good chromatic contrast between only two units.
One of the most useful images produced was a “colour unpacking” of the second principal component of channels TM 7, 3 and 2. (Principal component enhancements identify new axes on a scatter plot among input channels that maximize variance in the data set. “Colour unpacking” computes red, green and blue output files by mapping two specified input
DIABASE DIKE
PROSPEROUS LAKE GRANITE a ALTERED KAM GROUP SCALE
DUCKFISH LAKE GRANITE KAM GROUP 400 aoo I 0
WESTERN GRANODIORITE @ GOLD SHOWING/DEPOSIT
- METERS
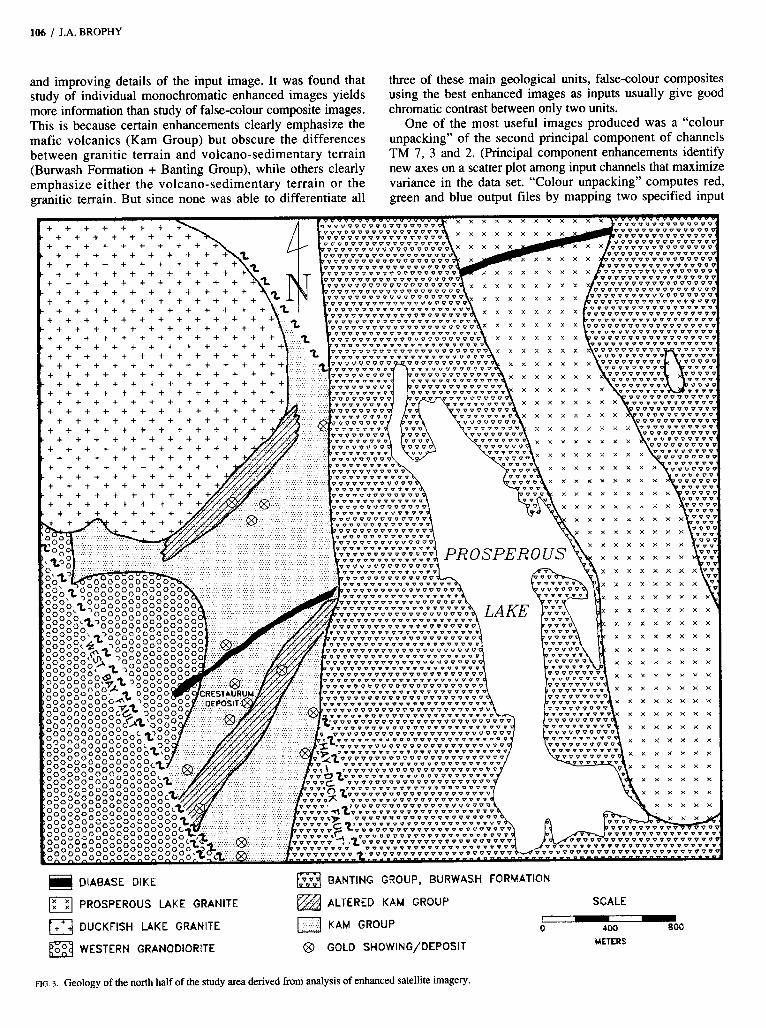
FIG. 3. Geology of the north half of the study area derived from analysis of enhanced satellite imagery.

components to brightness, red-greenness and blue-yellow- ness.) This enhanced image, referred to as TA 3, clarifies cer- tain internal features of the Kam Group that might be related to gold mineralization, as will be discussed in the next section.
Satellite Mapping Figure 3 is a geological map of the north half of the study
area based on satellite imagery discussed in this report. It can be compared to the geology shown in Figure 2, which is based on 1: 10 OOO scale mapping.
The satellite imagery was able to distinguish the three main granitic bodies in the area. The Duckfish Lake Granite is char- acterized by a conspicuous and unique pattern of north-north- westerly trending fractures. The Prosperous Lake Granite is recognized by its isolation from other granite bodies and a homogeneous texture. The Western Granodiorite Complex is distinguishable by a mottled, heterogeneous texture, suggest- ing, as is known to be the case, that it is a complex of various intrusive phases.
The Kam Group emerges on channels TM 2 and TM 3, and details within the Kam are particularly well emphasized on the enhanced image TA 3. Of particular interest are two zones within the Kam that are evident on the enhanced image but are not shown on detailed published maps. Both zones manifest as clearly demarcated lighter grey reflections against the gener- ally darker reflections that typify the Kam Group on TA 3. The more southerly zone is a stratabound belt of alteration comprising silicification and carbonatization (pers. obs.). The more northerly is confined to the southeast margin of the Duckfish Lake Granite and is possibly an effect or alteration due to contact metamorphism. Figure 3 shows the fifteen gold Occurrences that are known within the Kam Group in the study area (Falck, 1990). Three are clearly related to the contact between the Kam Group and the undifferentiated volcano-sedi- mentary terrain (Banting Group + Burwash Formation) to the east. But six, and perhaps as many as eight, appear to be spa- tially associated with the two zones of alteration identified in this study. This includes the most significant of these occur- rences, the Crestaurum Deposit, which has reserves of 100 OOO tonnes grading 19 g/t gold and is described as being hosted in “shears in altered sills” (data from Northern Mineral Inventory Sheets).
The satellite imagery was also able to identify one of the two main diabase dikes that cut east-northeasterly across the study area and was also able to locate the main northwesterly trending Proterozoic faults.
On the negative side, satellite imagery failed to identify the Jackson Lake Formation, partly because of exceedingly nar- row exposure and partly because it is associated with a reces- sive-weathering fault lineament. Nor could satellite imagery separate intermediate volcanics and subordinate sediments of the Banting Group from sediments of the Burwash Formation, although farther south of the area shown in Figure 3, fold pat- terns in the Burwash can sometimes be used to distinguish it from the generally more competent rocks of the Banting. Henderson (1985) suggests that sediments of the Burwash Formation were derived mainly from intermediate volcanics such as constitute much of the Banting Group, and it is per- haps this commonality of composition that makes it difficult to distinguish them by satellite mapping.
YELLOWKNIFE VOLCANIC BELT / 107
CONCLUSIONS
Satellite geological mapping of YVB succeeded in identify- ing most of the geological units present in the study area. Moreover, two major zones of alteration were identified within volcanics of the economically important Kam Group that had not been noted in detailed published maps, and both zones appear to be related to gold mineralization. These results, based on enhancement techniques that represent a small frac- tion of the total capability of computer/satellite technology, suggest that this technology should play a fundamental role in the geological sciences generally, and in mineral exploration specifically.
ACKNOWLEDGEMENTS
I would like to thank the Canada Centre for Remote Sensing and the Department of Renewable Resources, Government of the Northwest Territories, for their support of this undertaking under the auspices of the Remote Sensing Technology Transfer Program. In particular, I wish to thank Mr. Helmut Epp, of the Canada Centre for Remote Sensing, for his instructions and guidance on this project.
REFERENCES
ARONOFF, S., and GOODFELLOW, W. 1985. Image processing for the effective analysis of regional geochemical data. Paper presented at the International Conference on Advanced Technology for Monitoring and Processing Global Environmental Data, convenued at the University of London, UK, by the Remote Sensing Society and CERMA, 10-12 September 1985. Proceedings volume p. 123-136.
ARONOFF, S., DUNN, C.E., and REILLY, G. 1985. Biogeochemical anoma- lies and landsat imagery: A comparison in the Wollaston Lake area, Saskatchewan. I n : Summary of investigations 1985, Saskatchewan Geological Survey. Saskatchwan Energy and Mines, Miscellaneous Report 85-4.9 p.
WOOD, D.J. 1986. Integration of surficial geochemistry and landsat imagery to discover skarn tungsten deposits using image analysis tech- niques. Proceedings of IGARSS 86 Symposium, Zurich, 8-1 1 September 1986. Reference ESA SP-254. ESA Publications Division. 513-520.
FALCK, H. 1990. Gold and where it is found, Yellowknife Mining District, NWT. In: Exploration overview 1990, NWT mining, exploration and geo- logical investigations. Abstracts of papers given at the 18th Annual Geoscience Forum, Yellowknife, 27-29 November 1990. NWT Geology Division, Northern Affairs Program. (Data taken with permission from
HELMSTAEDT, H., and PADGHAM, W.A. 1986. A new look at the stratig- poster session given in conjunction with this paper.)
raphy of the Yellowknife Supergroup at Yellowknife, N.W.T. Canadian Journal of Earth Sciences 23:454-475.
HELMSTAEDT, H., GOODWIN, J.A., PATTERSON, J.G., and KING, J. 1979. Preliminary geological map, southern end of the Yellowknife Greenstone Belt. Department of Indian and Northern Affairs, Yellowknife, Canada, E.G.S. 1979-19. Map 1:lO OOO.
HELMSTAEDT, H., KING, J., and BOODLE, R. 1980. Geology of the Banting and Walsh lakes map area, N.T.S. 85 J/S. Department of Indian and Northern Affairs, Yellowknife, Canada, E.G.S. 1979-10. Map 1 : l O OOO.
HENDERSON, J.B. 1985. Geology of the Yellowknife-Heme Lake area, District of Mackenzie, A segment across an Archean basin. Geological Survey of Canada, Memoir 414. 135 p.
HENDERSON, J.F., and BROWN, IC. 1966. Geology and structure of the Yellowknife Greenstone Belt, District of Mackenzie. Geological Survey of Canada, Bulletin 141. 87 p.
SLANEY, V.R. 1985. Landsat MSS and airborne geophysical data combined for mapping granite in southwest Nova Scotia. Paper presented at the 1985 Symposium on Machine Processing of Remotely Sensed Data, Purdue University, West Lafayette, Indiana, U.S.A., June 1985. Proceedings vol- ume p. 198-205.
ARONOFF, S., GOODFELLOW, W., BONHAM CARTER, G.F., and ELL-

components to brightness, red-greenness and blue-yellow- ness.) This enhanced image, referred to as TA 3, clarifies cer- tain internal features of the Kam Group that might be related to gold mineralization, as will be discussed in the next section.
Satellite Mapping Figure 3 is a geological map of the north half of the study
area based on satellite imagery discussed in this report. It can be compared to the geology shown in Figure 2, which is based on 1 : 10 0oO scale mapping.
The satellite imagery was able to distinguish the three main granitic bodies in the area. The Duckfish Lake Granite is char- acterized by a conspicuous and unique pattern of north-north- westerly trending fractures. The Prosperous Lake Granite is recognized by its isolation from other granite bodies and a homogeneous texture. The Western Granodiorite Complex is distinguishable by a mottled, heterogeneous texture, suggest- ing, as is known to be the case, that it is a complex of various intrusive phases.
The Kam Group emerges on channels TM 2 and TM 3, and details within the Kam are particularly well emphasized on the enhanced image TA 3. Of particular interest are two zones within the Kam that are evident on the enhanced image but are not shown on detailed published maps. Both zones manifest as clearly demarcated lighter grey reflections against the gener- ally darker reflections that typify the Kam Group on TA 3. The more southerly zone is a stratabound belt of alteration comprising silicification and carbonatization (pers. obs.). The more northerly is confined to the southeast margin of the Duckfish Lake Granite and is possibly an effect or alteration due to contact metamorphism. Figure 3 shows the fifteen gold occurrences that are known within the Kam Group in the study area (Falck, 1990). Three are clearly related to the contact between the Kam Group and the undifferentiated volcano-sedi- mentary terrain (Banting Group + Burwash Formation) to the east. But six, and perhaps as many as eight, appear to be spa- tially associated with the two zones of alteration identified in this study. This includes the most significant of these occur- rences, the Crestaurum Deposit, which has reserves of 100 OOO tonnes grading 19 g/t gold and is described as being hosted in “shears in altered sills” (data from Northern Mineral Inventory Sheets).
The satellite imagery was also able to identify one of the two main diabase dikes that cut east-northeasterly across the study area and was also able to locate the main northwesterly trending Proterozoic faults.
On the negative side, satellite imagery failed to identify the Jackson Lake Formation, partly because of exceedingly nar- row exposure and partly because it is associated with a reces- sive-weathering fault lineament. Nor could satellite imagery separate intermediate volcanics and subordinate sediments of the Banting Group from sediments of the Burwash Formation, although farther south of the area shown in Figure 3, fold pat- terns in the Burwash can sometimes be used to distinguish it from the generally more competent rocks of the Banting. Henderson (1985) suggests that sediments of the Burwash Formation were derived mainly from intermediate volcanics such as constitute much of the Banting Group, and it is per- haps this commonality of composition that makes it difficult to distinguish them by satellite mapping.
YELLOWKNIFE VOLCANIC BELT / 107
CONCLUSIONS
Satellite geological mapping of YVB succeeded in identify- ing most of the geological units present in the study area. Moreover, two major zones of alteration were identified within volcanics of the economically important Kam Group that had not been noted in detailed published maps, and both zones appear to be related to gold mineralization. These results, based on enhancement techniques that represent a small frac- tion of the total capability of computer/satellite technology, suggest that this technology should play a fundamental role in the geological sciences generally, and in mineral exploration specifically.
ACKNOWLEDGEMENTS
I would like to thank the Canada Centre for Remote Sensing and the Department of Renewable Resources , Government of the Northwest Territories, for their support of this undertaking under the auspices of the Remote Sensing Technology Transfer Program. In particular, I wish to thank Mr. Helmut Epp, of the Canada Centre for Remote Sensing, for his instructions and guidance on this project.
REFERENCES
ARONOFF, S . , and GOODFELLOW, W. 1985. Image processing for the effective analysis of regional geochemical data. Paper presented at the International Conference on Advanced Technology for Monitoring and Processing Global Environmental Data, convenued at the University of London, UK, by the Remote Sensing Society and CERMA, 10-12 September 1985. Proceedings volume p. 123-136.
ARONOFF, S., DUNN, C.E., and REILLY, G. 1985. Biogeochemical anoma- lies and landsat imagery: A comparison in the Wollaston Lake area, Saskatchewan. I n : Summary of investigations 1985, Saskatchewan Geological Survey. Saskatchwan Energy and Mines, Miscellaneous Report 85-4.9 p.
WOOD, D.J. 1986. Integration of surficial geochemistry and landsat imagery to discover skarn tungsten deposits using image analysis tech- niques. Proceedings of IGARSS 86 Symposium, Zurich, 8-1 1 September 1986. Reference ESA SP-254. ESA Publications Division. 513-520.
FALCK, H. 1990. Gold and where it is found, Yellowknife Mining District, NWT. In: Exploration overview 1990, NWT mining, exploration and geo- logical investigations. Abstracts of papers given at the 18th Annual Geoscience Forum, Yellowknife, 27-29 November 1990. NWT Geology Division, Northern Affairs Program. (Data taken with permission from
HELMSTAEDT, H., and PADGHAM, W.A. 1986. A new look at the stratig- poster session given in conjunction with this paper.)
raphy of the Yellowknife Supergroup at Yellowknife, N.W.T. Canadian Journal of Earth Sciences 23:454-475.
HELMSTAEDT, H., GOODWIN, J.A., PATTERSON, J.G., and KING, J. 1979. Preliminary geological map, southern end of the Yellowknife Greenstone Belt. Department of Indian and Northern Affairs, Yellowknife, Canada, E.G.S. 1979-19. Map 1:lO OOO.
HELMSTAEDT, H., KING, J., and BOODLE, R. 1980. Geology of the Banting and Walsh lakes map area, N.T.S. 85 JD. Department of Indian and Northern Affairs, Yellowknife, Canada, E.G.S. 1979-10. Map 1:lO ooo.
HENDERSON, J.B. 1985. Geology of the Yellowknife-Hearne Lake area, District of Mackenzie, A segment across an Archean basin. Geological Survey of Canada, Memoir 414.135 p.
HENDERSON, J.F., and BROWN, LC. 1966. Geology and stmcture of the Yellowknife Greenstone Belt, District of Mackenzie. Geological Survey of Canada, Bulletin 141. 87 p.
SLANEY, V.R. 1985. Landsat MSS and airborne geophysical data combined for mapping granite in southwest Nova Scotia. Paper presented at the 1985 Symposium on Machine Processing of Remotely Sensed Data, Purdue University, West Lafayette, Indiana, U.S.A., June 1985. Proceedings vol- ume p. 198-205.
ARONOFF, S. , GOODFELLOW, W., BONHAM CARTER, G.F., and ELL-