Embed Size (px)
Citation preview
10/18/10
1
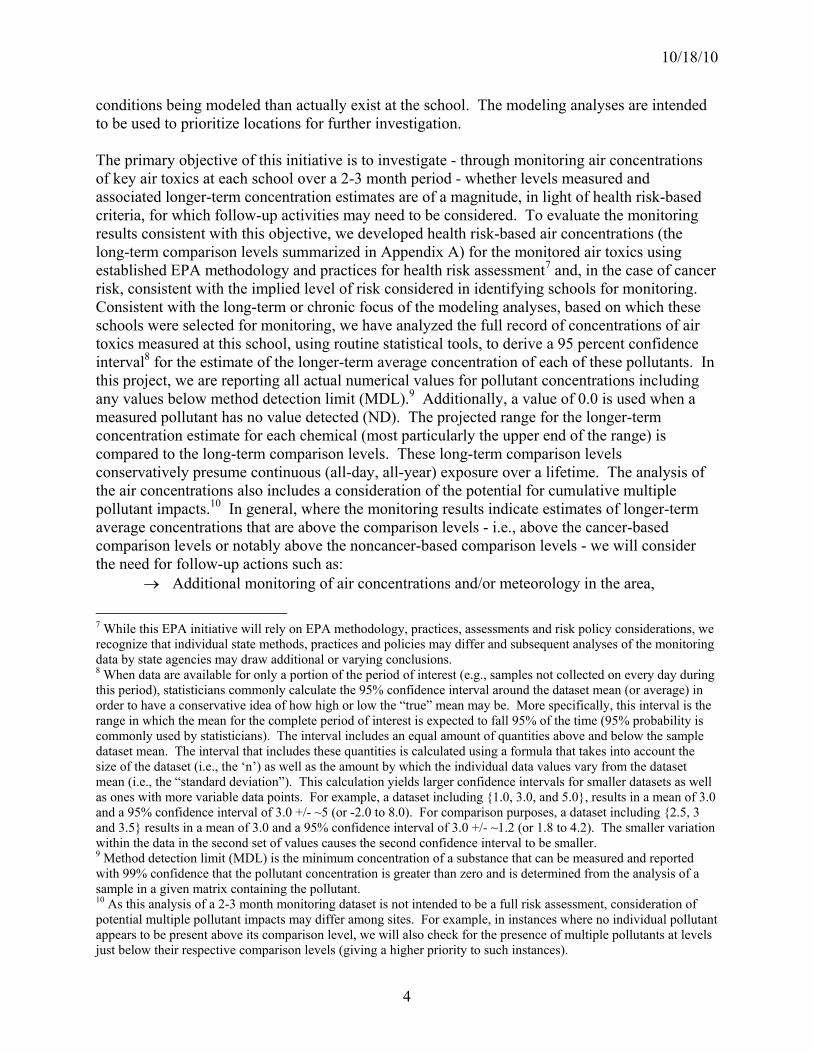
SAT Initiative: Cabell County Career Technology Center (Huntington, West Virginia)
This document describes the analysis of air monitoring and other data collected under EPA’s initiative to assess potentially elevated air toxics levels at some of our nation’s schools. The document has been prepared for technical audiences (e.g., risk assessors, meteorologists) and their management. It is intended to describe the technical analysis of data collected for this school in clear, but generally technical, terms. A summary of this analysis is presented on the page focused on this school on EPA’s website (www.epa.gov/schoolair).
I. Executive Summary
Air monitoring has been conducted at Cabell County Career Technology Center as part of the EPA initiative to monitor specific air toxics in the outdoor air around priority schools in 22 states and 2 tribal areas.
This school was selected for monitoring based on information indicating the potential for elevated ambient concentrations of nickel in air outside the school. This decision was made based on consultation with the West Virginia Department of Environmental Protection (WVDEP). In addition, the school was ranked in the middle portion of the top 100 on a USA Today list due to 2005 Toxics Release Inventory estimates of nickel emissions from two nearby metals processing facilities. One facility is a hot-rolled steel products manufacturer of structural parts from scrap metal, and the other facility is a large rolling mill devoted to the production of wrought nickel and high nickel alloy products.
Air monitoring for nickel and other metals in particulate matter less than 10 microns (PM10) was performed from August 17, 2009 through October 10, 2009.
Measured levels of nickel (PM10) and their associated longer-term concentration estimates are significantly below levels of concern for short- or long-term exposures.
The levels of nickel (PM10) measured in the outdoor air at this school indicate the influence of a nearby source.
Based on the analysis described here, EPA will not extend air toxics monitoring at this school.
The WVDEP will continue to oversee both industrial facilities through their Title V air program.
Background on this Initiative As part of an EPA initiative to implement Administrator Lisa Jackson’s commitment to assess potentially elevated air toxics levels at some of our nation’s schools, EPA and state and local air pollution control agencies are monitoring specific (key) air toxics in the outdoor air around priority schools in 22 states and 2 tribal areas (http://www.epa.gov/schoolair/schools.html).
The schools selected for monitoring include some schools that are near large industries that are sources of air toxics, and some schools that are in urban areas, where emissions

10/18/10
2
of air toxics come from a mix of large and small industries, cars, trucks, buses and other sources.
EPA selected schools based on information available to us about air pollution in the vicinity of the school, including results of the 2002 National-Scale Air Toxics Assessment (NATA), results from a 2008 USA Today analysis on air toxics at schools, and information from state and local air agencies. The analysis by USA Today involved use of EPA’s Risk Screening Environmental Indicators tool and Toxics Release Inventory (TRI) for 2005.
Available information had raised some questions about air quality near these schools that EPA concluded merited investigation. In many cases, the information indicated that estimated long-term average concentrations of one or more air toxics were above the upper end of the range that EPA generally considers as acceptable (e.g., above 1-in-10,000 cancer risk for carcinogens).
Monitors are placed at each school for approximately 60 days, and take air samples on at least 10 different days during that time. The samples are analyzed for specific air toxics identified for monitoring at the school (i.e., key pollutants).1
These monitoring results and other information collected at each school during this initiative allow us to:
assess specific air toxics levels occurring at these sites and associated estimates of longer-term concentrations in light of health risk-based criteria for long-term exposures,
better understand, in many cases, potential contributions from nearby sources to key air toxics concentrations at the schools,
consider what next steps might be appropriate to better understand and address air toxics at the school, and
Improve the information and methods we will use in the future (e.g., NATA) for estimating air toxics concentrations in communities across the U.S.
Assessment of air quality under this initiative is specific to the air toxics identified for monitoring at each school. This initiative is being implemented in addition to ongoing state, local and national air quality monitoring and assessment activities, including those focused on criteria pollutants (e.g., ozone and particulate matter) or existing, more extensive, air toxics programs. Several technical documents prepared for this project provide further details on aspects of monitoring and data interpretation and are available on the EPA website (e.g., www.epa.gov/schoolair/techinfo.html). The full titles of these documents are provided here:
School Air Toxics Ambient Monitoring Plan Quality Assurance Project Plan For the EPA School Air Toxics Monitoring Program Schools Air Toxics Monitoring Activity (2009), Uses of Health Effects Information in
Evaluating Sample Results
1 In analyzing air samples for these key pollutants, samples are also being analyzed for some additional pollutants that are routinely included in the analytical methods for the key pollutants.

10/18/10
3
Information on health effects of air toxics being monitored2 and educational materials describing risk concepts3 are also available from EPA’s website.
II. Basis for Selecting this School and the Air Monitoring Conducted This school was selected for monitoring in consultation with the State air agency, West Virginia Department of Environmental Protection (WVDEP). WVDEP expressed interest in evaluating the ambient concentrations of nickel outside the school, because the school was ranked in the top 100 on the USA Today list due to estimates of nickel emissions in the 2005 Toxics Release Inventory for a nearby facility that emits particulates containing nickel. There are two metals processing facilities near the school. One facility is a hot rolled steel products manufacturer of structural parts from scrap metal, and the other facility is a large rolling mill devoted to the production of wrought nickel and high nickel alloy products. Monitoring commenced at this school on August 17, 2009 and continued through October 10, 2009. During this period 11 samples of airborne particles were collected using a PM10 sampler,4 and analyzed for nickel, the key pollutant at this school. In addition, we also collected and analyzed for a small standardized set of additional metals that are routinely included via the analytical method for this key pollutant (http://www.epa.gov/schoolair/techinfo.html).5
III. Monitoring Results and Analysis
A. Background for the SAT Analysis The majority of schools being monitored in this initiative were selected based on modeling analyses that indicated the potential for annual average air concentrations of some specific (key) hazardous air pollutants (HAPs or air toxics)6 to be of particular concern based on approaches that are commonly used in the air toxics program for considering potential for long-term risk. For example, such analyses suggested annual average concentrations of some air toxics were greater than long-term risk-based concentrations associated with an additional cancer risk greater than 10-in-10,000 or a hazard index on the order of or above 10. To make projections of air concentrations, the modeling analyses combined estimates of air toxics emissions from industrial, motor vehicle and other sources, with past measurements of winds, and other meteorological factors that can influence air concentrations, from a weather station in the general area. In some cases, the weather station was very close (within a few miles), but in other cases, it was much further away (e.g., up to 60 miles), which may contribute to quite different
2 For example, http://www.epa.gov/schoolair/pollutants.html, http://www.epa.gov/ttn/fera/risk_atoxic.html. 3 For example, http://www.epa.gov/ttn/atw/3_90_022.html, http://www.epa.gov/ttn/atw/3_90_024.html. 4 In general, this sampler collects airborne particles with a diameter of 10 microns or smaller, more of which would be considered to be in the respirable range which is what the health-based comparison level for nickel is based on. 5 WVDEP staff operated the monitors and sent the sample filters to the analytical laboratory under contract to EPA. 6 The term hazardous air pollutants (commonly called HAPs or air toxics) refers to pollutants identified in section 112(b) of the Clean Air Act which are the focus of regulatory actions involving stationary sources described by CAA section 112 and are distinguished from the six pollutants for which criteria and national ambient air quality standards (NAAQS) are developed as described in section 108. One of the criteria pollutants, lead, is also represented, as lead compounds, on the HAP list.
10/18/10
4
conditions being modeled than actually exist at the school. The modeling analyses are intended to be used to prioritize locations for further investigation. The primary objective of this initiative is to investigate - through monitoring air concentrations of key air toxics at each school over a 2-3 month period - whether levels measured and associated longer-term concentration estimates are of a magnitude, in light of health risk-based criteria, for which follow-up activities may need to be considered. To evaluate the monitoring results consistent with this objective, we developed health risk-based air concentrations (the long-term comparison levels summarized in Appendix A) for the monitored air toxics using established EPA methodology and practices for health risk assessment7 and, in the case of cancer risk, consistent with the implied level of risk considered in identifying schools for monitoring. Consistent with the long-term or chronic focus of the modeling analyses, based on which these schools were selected for monitoring, we have analyzed the full record of concentrations of air toxics measured at this school, using routine statistical tools, to derive a 95 percent confidence interval8 for the estimate of the longer-term average concentration of each of these pollutants. In this project, we are reporting all actual numerical values for pollutant concentrations including any values below method detection limit (MDL).9 Additionally, a value of 0.0 is used when a measured pollutant has no value detected (ND). The projected range for the longer-term concentration estimate for each chemical (most particularly the upper end of the range) is compared to the long-term comparison levels. These long-term comparison levels conservatively presume continuous (all-day, all-year) exposure over a lifetime. The analysis of the air concentrations also includes a consideration of the potential for cumulative multiple pollutant impacts.10 In general, where the monitoring results indicate estimates of longer-term average concentrations that are above the comparison levels - i.e., above the cancer-based comparison levels or notably above the noncancer-based comparison levels - we will consider the need for follow-up actions such as:
Additional monitoring of air concentrations and/or meteorology in the area,
7 While this EPA initiative will rely on EPA methodology, practices, assessments and risk policy considerations, we recognize that individual state methods, practices and policies may differ and subsequent analyses of the monitoring data by state agencies may draw additional or varying conclusions. 8 When data are available for only a portion of the period of interest (e.g., samples not collected on every day during this period), statisticians commonly calculate the 95% confidence interval around the dataset mean (or average) in order to have a conservative idea of how high or low the “true” mean may be. More specifically, this interval is the range in which the mean for the complete period of interest is expected to fall 95% of the time (95% probability is commonly used by statisticians). The interval includes an equal amount of quantities above and below the sample dataset mean. The interval that includes these quantities is calculated using a formula that takes into account the size of the dataset (i.e., the ‘n’) as well as the amount by which the individual data values vary from the dataset mean (i.e., the “standard deviation”). This calculation yields larger confidence intervals for smaller datasets as well as ones with more variable data points. For example, a dataset including {1.0, 3.0, and 5.0}, results in a mean of 3.0 and a 95% confidence interval of 3.0 +/- ~5 (or -2.0 to 8.0). For comparison purposes, a dataset including {2.5, 3 and 3.5} results in a mean of 3.0 and a 95% confidence interval of 3.0 +/- ~1.2 (or 1.8 to 4.2). The smaller variation within the data in the second set of values causes the second confidence interval to be smaller. 9 Method detection limit (MDL) is the minimum concentration of a substance that can be measured and reported with 99% confidence that the pollutant concentration is greater than zero and is determined from the analysis of a sample in a given matrix containing the pollutant. 10 As this analysis of a 2-3 month monitoring dataset is not intended to be a full risk assessment, consideration of potential multiple pollutant impacts may differ among sites. For example, in instances where no individual pollutant appears to be present above its comparison level, we will also check for the presence of multiple pollutants at levels just below their respective comparison levels (giving a higher priority to such instances).

10/18/10
5
Evaluation of potentially contributing sources to help us confirm their emissions and identify what options (regulatory and otherwise) may be available to us to achieve emissions reductions, and
Evaluation of actions being taken or planned nationally, regionally or locally that may achieve emission and/or exposure reductions. An example of this would be actions taken to address the type of ubiquitous emissions that come from mobile sources.
We have further analyzed the dataset to describe what it indicates in light of some other criteria and information commonly used in prioritizing state, local and national air toxics program activities. State, local and national programs often develop long-term monitoring datasets in order to better characterize pollutants near particular sources. The 2-3 month dataset developed under this initiative will be helpful to those programs in setting priorities for longer-term monitoring projects. The intent of this analysis is to make this 2-3 month monitoring dataset as useful as possible to state, local and national air toxics programs in their longer-term efforts to improve air quality nationally. To that end, this analysis:
Describes the air toxics measurements in terms of potential longer-term concentrations, and, as available, compares the measurements at this school to monitoring data from national monitoring programs.
Describes the meteorological data by considering conditions on sampling days as compared to those over all the days within the 2-3 month monitoring period and what conditions might be expected over the longer-term (as indicated, for example, by information from a nearby weather station).
Describes available information regarding activities and emissions at the nearby source(s) of interest, such as that obtained from public databases such as TRI and/or consultation with the local air pollution authority.
B. Chemical Concentrations We developed two types of long-term health risk-related comparison levels (summarized in Appendix A below) to address our primary objective. The primary objective is to investigate through the monitoring data collected for key pollutants at the school, whether pollutant levels measured and associated longer-term concentration estimates are elevated enough in comparison with health risk-based criteria to indicate that follow-up activities be considered. These comparison levels conservatively presume continuous (all-day, all-year) exposure over a lifetime. In developing or identifying these comparison levels, we have given priority to use of relevant and appropriate air standards and EPA risk assessment guidance and precedents.11 These levels are based upon health effects information, exposure concentrations and risk estimates developed and assessed by EPA, the U.S. Agency for Toxic Substances and Disease Registry, and the California EPA. These agencies recognize the need to account for potential differences in
11 This is described in detail in Schools Air Toxics Monitoring Activity (2009), Uses of Health Effects Information in Evaluating Sample Results.

10/18/10
6
sensitivity or susceptibility of different groups (e.g., asthmatics) or lifestages/ages (e.g., young children or the elderly) to a particular pollutant’s effects so that the resulting comparison levels are relevant for these potentially sensitive groups as well as the broader population. In addition to evaluating individual pollutants with regard to their corresponding comparison levels, we also considered the potential for cumulative impacts from multiple pollutants in cases where individual pollutant levels fall below the comparison levels but where multiple pollutant mean concentrations are within an order of magnitude of their comparison levels. Using the analysis approach described above, we analyzed the chemical concentration data (Table 1 and Figure 1) with regard to areas of interest identified below.
Nickel, the key pollutant:
Do the monitoring data indicate influence from a nearby source?
The data collected include some nickel (PM10) concentrations that are appreciably higher than concentrations commonly observed in other locations nationally.12 Additionally, as discussed in section IV.C below, on some of the days in which higher concentrations were measured, the wind information indicates that a portion of that day’s winds came from the direction of a nearby source.
Do the monitoring data indicate elevated levels that pose significant long-term health concerns?
The monitoring data for nickel do not indicate levels of significant health concern for long-term exposures.
The estimate of longer-term nickel (PM10) concentration (i.e., the upper bound of the 95 percent confidence interval on the mean of the dataset) is substantially below both of the long-term comparison levels (Table 1).13 These comparison levels are based on consideration of continuous exposure concentrations (24 hours a day, all year, over a lifetime).
12 For example, more than half of the concentrations at this site (Table 2) were higher than 75 percent of samples collected at the National Air Toxics Trends Stations (NATTS) from 2004-2008 (Appendix B). Because these NATTS sites are generally sited so as not to be influenced by specific nearby sources, EPA is using the 75th percentile point of concentrations at these sites as a benchmark for indicating potential influence from a source nearby to this school. 13 Additionally, the longer-term concentration estimate is only a few percent of the cancer-based long-term comparison level.
Key findings drawn from the information on chemical concentrations and the considerations discussed below include:
The air sampling data collected over the 2-month sampling period and the related longer-term concentration estimates, while indicating potential influence from a nearby source of nickel emissions, are below concentrations of significant concern for short- or long-term exposures.
10/18/10
7
Further, the longer-term concentration estimate is more than tenfold lower than the cancer-based comparison level, indicating the longer-term estimate is below a continuous (24 hours a day, 7 days a week) lifetime exposure concentration associated with 1-in-100,000 additional cancer risk.
Additionally, we did not identify any concerns regarding short-term exposures as each individual measurement is below the individual sample screening level for nickel (which is based on consideration of exposure all day, every day over a period ranging up to at least a couple of weeks and longer for some pollutants).11
In summary, none of the individual measurements indicate concentrations of concern for short-term exposures and the cumulative contributions of all individual measurements in the estimate of longer-term concentration do not indicate a level of significant concern for long-term exposure.
Other Air Toxics
Do the monitoring data indicate elevated levels of any other air toxics (or HAPs) that pose significant long-term health concerns?
The monitoring data show low levels of the other HAPs monitored, all which have associated longer-term concentration estimates which are below their long-term comparison levels (Appendix C). Additionally, each individual measurement for these pollutants is below the individual sample screening level11 for that pollutant.
Multiple Pollutants:
Do the data collected for the air toxics monitored indicate the potential for other monitored pollutants to be present at levels that in combination with the key pollutant levels indicate an increased potential for cumulative impacts of significant concern (e.g., that might warrant further investigation)?
The data collected for the key and other air toxics and the associated longer-term concentration estimates do not together pose significant concerns for cumulative health risk from these pollutants (Appendix C).14
C. Wind and Other Meteorological Data At each school monitored as part of this initiative, we are collecting meteorological data, minimally for wind speed and direction, during the sampling period. Additionally, we have identified the nearest National Weather Service (NWS) station at which a longer record is available.
14 We note that this initiative is focused on investigation for a school-specific set of key pollutants indicated by previous analyses (and a small set of others for which measurements are obtained in the same analysis). The combined impacts of pollutants or stressors other than those monitored in this project are of a broader area of consideration in other EPA activities. General information on additional air pollutants is available at http://www.epa.gov/air/airpollutants.html
10/18/10
8
In reviewing these data at each school in this initiative, we are considering if these data indicate that the general pattern of winds on our sampling dates are significantly different from those occurring across the full sampling period or from those expected over the longer-term. Additionally, we are noting, particularly for school sites where the measured chemical concentrations show little indication of influence from a nearby source, whether wind conditions on some portion of the sampling dates were indicative of a potential to capture contributions from the nearby “key” source in the air sample collected. The meteorological station at the Cabell County Career Technology Center collected wind speed and wind direction measurements beginning on July 7, 2009, continuing through the sampling period (August 17, 2009-October 10, 2009), and ending on March 2, 2010. As a result, on-site data for these meteorological parameters are available for all dates of sample collection, and also for a period before and after the sampling period, producing a continuous record of over seven months of on-site meteorological data. The meteorological data collected at the school site on sampling days are presented in Table 2 and Figure 2. A summary of the meteorological data collected at the school site during the sampling period are presented as a windrose in Figure 2. The nearest NWS station is at Tri-State/M.J. Ferguson Field Airport. This station is approximately 9.4 miles east-southeast of the school. Measurements taken at that station include wind, temperature, and precipitation. Wind speed and direction data collected at the Tri-State/M.J. Ferguson Field Airport NWS station have been summarized in Appendix E.
Key findings drawn from this information and the considerations discussed below include:
Both the sampling results and the on-site wind data indicate that some of the air samples were collected on days when the nearby key source was contributing to conditions at the school location.
The wind patterns at the school station (across sampling dates) are somewhat similar
to those observed across the record of on-site meteorological data during the sampling period.
Our ability to provide a confident characterization of the wind flow patterns at the
monitoring site over the long-term is limited as the NWS station in Tri-State/M.J. Ferguson Field Airport does not appear to represent the specific wind flow patterns at the school location.
Although we only have seven months of wind data at the monitoring site, the wind
pattern at the NWS station during the sampling period is generally similar to the historical long-term wind flow pattern at that location. This suggests that, on a regional scale, the 2-month sampling period may be representative of year-round wind patterns.
10/18/10
9
What is the direction of the key sources of nickel emissions in relation to the school location? The nearby industrial facilities emitting nickel into the air (described in section III
above) are both northwest of school; one facility is within one air mile and the facility is within 3.25 air miles.
Using the property boundaries of the full facilities (in lieu of information regarding the location of specific sources of nickel emissions at the facilities), we have identified an approximate range of wind directions to use in considering the potential influence of this facilities on air concentrations at the school.
This general range of wind directions (applicable to both key sources), within approximately 270 to 350 degrees, is referred to here as the expected zone of source influence (ZOI).
On days the air samples were collected, how often did wind come from the direction of
the key sources? On 7 of the 11 sampling days, the winds were originating from the expected ZOI
(Figure 2, Table 2). We additionally note that more than half of the concentrations on sampling dates
were higher than 75 percent of samples collected at 28 NATTS National Air Toxics Trends Sites from 2004-2008 (the most recently compiled period, Appendix B), also indicating that some samples were collected on days when there was a potential source contribution to air quality at the school station (Table 2).
How do wind patterns on the air monitoring days compare to those across the complete
monitoring period and what might be expected over the longer-term at the school location? Wind patterns across the air monitoring days are somewhat similar to those
observed over the record of on-site meteorological data during the sampling period, particularly with regard to the expected ZOI.
We note that wind patterns at the nearest NWS station (at Tri-State/M.J. Ferguson Field Airport) during the sampling period are generally similar to those recorded at the NWS station over the long-term (2002-2007 period, Appendix E), supporting the idea that regional meteorological patterns in the area during the sampling period were consistent with long-term patterns. However, there is some uncertainty as to whether this would also be the case at the school location as the general wind patterns at the Tri-State/M.J. Ferguson Field Airport (see below).
How do wind patterns at the school compare to those at the Tri-State/M.J. Ferguson Field
Airport station, particularly with regard to prevalent wind directions and the direction of the key source? During the sampling period for which data are available both at the school site and at
the reference NWS station (approximately 2 months), prevalent winds at the school site are predominantly from the south to southeast, while those at the NWS station are somewhat more from the south-southwest to south and north to northeast. The windroses for the two sites during the sampling period (Figure 2 and Appendix E)

10/18/10
10
show differences in wind flow patterns, most likely resulting from local terrain influences.
Are there other meteorological patterns that may influence the measured concentrations
at the school monitoring site? We did observe that the highest concentration recorded was on a day in which over
70% of the hourly wind speeds were less than 2 knots, or near calm conditions. This observation can be expected because there is less dispersion of pollutants, i.e., higher concentrations, in the presence of lower wind speeds.
V. Key Source Information
Were the sources operating as usual during the monitoring period? The nearby sources of nickel (described in section III above) each have Title V
operating permits issued by WVDEP. The nearby sources are both metals processing facilities. One facility is a hot rolled
steel products manufacturer of structural parts from scrap metal, and the other facility is a large rolling mill devoted to the production of wrought nickel and high nickel alloy products.
The facility that manufactures hot rolled steel products from scrap metal
consists of two electric arc furnaces (EAFs) rated at 20 tons per hour, a continuous caster and caster cutoff torches rated at 40 tons per hour, scrap preparation torches, and ladle pre-heaters. The manufacturing steps include melting scrap steel, casting billets, reheating and hot rolling the billets, shot blasting, welding, punching and shearing. This facility is subject to the GACT for electric arc furnaces – 40CFR63, Subpart YYYYY.
The second facility, which is a large rolling mill devoted exclusively to the production of wrought nickel and high nickel alloy products, produces ingots, slabs, plate, sheet, strip, billets, rods, wire, pipe and tubing in approximately one hundred and twenty different alloys. It incorporates some two hundred manufacturing operations which include: melting and re-melting of metals to produce alloy ingots, hot and cold rolling, forging, drawing, machining, grinding, shot blasting, pickling, annealing, and ancillary testing and byproduct recovery operations. Maximum potential to emit based on 8,760 hours per year production, and not taking full credit for un-permitted baghouses are quite large. However, actual HAP emissions are much lower based on lower production and on actual capture and control of the baghouses.
Both facilities were operating at less than historical capacity during the monitoring
period. The steel manufacturing facility was operating at approximately 73% of its historical average capacity during the monitoring period, with 11% of the total annual production occurring during the monitoring period. The wrought nickel and high nickel alloy manufacturing facility was operating at approximately 79% of its
10/18/10
11
historical average capacity during 2009, with about 10% of the total annual production that year occurring during the monitoring period.
The most recently available nickel emissions estimates for these sources (2008 TRI)
are much lower for the steel manufacturing facility and only slightly higher for the nickel alloy manufacturing facility than those used in previous modeling analyses for this area (2005 TRI).
Integrated Summary and Next Steps
A. Summary of Key Findings
1. What are the key HAPs for this school? Nickel is the key HAP for this school, identified based on emissions
information considered in identifying the school for monitoring. The ambient air concentrations on multiple days during the monitoring period indicate potential contributions from a source in the area.
2. Do the data collected at this school indicate an elevated level of concern, as
implied by information that led to identifying this school for monitoring? The levels measured and associated longer-term concentration estimates are
not as high as that suggested by the information available prior to monitoring, and are below levels of concern for long-term exposures.
3. Are there indications, e.g., from the meteorological or other data, that the sample
set may not be indicative of longer-term air concentrations? Would we expect higher (or lower) concentrations at other times of year? The data we have collected appear to reflect air concentrations during the
entire monitoring period, with no indications from the on-site meteorological data that the sampling day conditions were inconsistent with conditions overall during this period.
Based on the data collected for this site, we have no available information to determine whether generally higher (or lower) concentrations occur during other times of year. If the NWS site appears to represent windflow conditions at the school site, we can use the longer-term NWS data to determine how the other seasonal periods may differ. While the wind flow patterns at the nearest NWS station during the sampling period appear to be representative of long-term wind flow patterns at the NWS site, the wind flow patterns at this station during the sampling period are not consistent with the on-site wind flow patterns at the school. The lack of long-term meteorological data at the school location, along with our finding that the wind patterns from the nearest NWS station differ from those at the school during the sampling period, limits our ability to confidently predict longer-term wind patterns at the school (which might provide further evidence relevant to concentrations during other times of the year).

10/18/10
12
B. Next Steps for Key Pollutants
1. Based on the analysis described here, EPA will not extend air toxics monitoring at
this school. 2. The WVDEP will continue to oversee both industrial facilities through their Title
V air permit program.
VII. Figures and Tables
A. Tables
1. Cabell County Career Technology Center – Key Pollutant Analysis.
2. Cabell County Career Technology Center – Key Pollutant Concentrations and Meteorological Data.
B. Figures
1. Cabell County Career Technology Center – Key Pollutant (Nickel (PM10)) Analysis.
2. Cabell County Career Technology Center (Huntington, WV) – Nickel (PM10) Concentration and Wind Information.
VIII. Appendices
A. Summary Description of Long-term Comparison Levels.
B. National Air Toxics Trends Stations Measurements (2004-2008).
C. Analysis of Other (non-key) Air Toxics Monitored at the School and Multiple-pollutant Considerations.
D. Cabell County Career Technology Center – Pollutant Concentrations.
E. Windroses for Tri-State/M.J. Ferguson Field Airport NWS Station.

Table 1. Cabell County Career Technology Center - Key Pollutant Analysis.
Cancer-Basedb
Noncancer-Basedc
ng/m3
4.38d
0 - 9.01 420 90
ng/m3
nanograms per cubic meter
a Details regarding these values are in the technical report, Schools Air Toxics Monitoring Activity (2009) Uses of Health Effects Information.
b Air toxics for which the upper 95% confidence limit on the mean concentration is above this level will be fully discussed in the text and may be considered a
priority for potential follow-up activities, if indicated in light of the full set of information available for the site. Findings of the upper 95% confidence limit below
1% of the comparison level (i.e., where the upper 95% confidence limit is below the corresponding 1-in-1-million cancer risk based concentration) are generally
considered a low priority for follow-up activity. Situations where the summary statistics for a pollutant are below this comparison level but above 1% of this level
are fully discussed in the text of the report.c Air toxics for which the upper 95% confidence limit on the mean concentration are near or below the noncancer-based comparison level are generally of low concern
and will generally be considered a low priority for follow-up activity. Pollutants for which the 95% confidence limits extend appreciably above the noncancer-based
comparison level are fully discussed in the school-specific report and may be considered a priority for follow-up activity, if indicated in light of the full set of
information available for the site.d The mean of measurements for nickel (PM10) is the average of all sample results, which include eleven detections that ranged from 0.41 to 24.1 ng/m
3.
Nickel (PM10)
Mean of
Measurements
Long-term Comparison Levela
Units
95% Confidence
Interval on the
MeanParameter

Figure 1. Cabell County Career Technology Center - Key Pollutant (Nickel (PM10)) Analysis.
a Air toxics for which the upper 95% confidence limit on the mean concentration is above this cancer-based comparison level will be fully discussed in the text and
may be considered a priority for potential follow-up activities, if indicated in light of the full set of information available for the site. Findings of the upper 95%
confidence limit below 1% of the comparison level (i.e., where the upper 95% confidence limit is below the corresponding 1-in-1-million cancer risk based
concentration) are generally considered a low priority for follow-up activity. Situations where the summary statistics for a pollutant are below this comparison
level but above 1% of this level are fully discussed in the text of the report.b Air toxics for which the upper 95% confidence limit on the mean concentration are near or below the noncancer-based comparison level are generally of low
concern and will generally be considered a low priority for follow-up activity. Pollutants for which the 95% confidence limits extend appreciably above the
noncancer-based comparison level are fully discussed in the school-specific report and may be considered a priority for follow-up activity, if indicated in
light of the full set of information available for the site.
0
20
40
60
80
100
Co
nce
ntr
ati
on
(n
g/m
3)
Long-term noncancer-based comparison levelb = 90 ng/m
3
Nickel (PM10)
Long-term cancer-based comparison levela = 420 ng/m
3
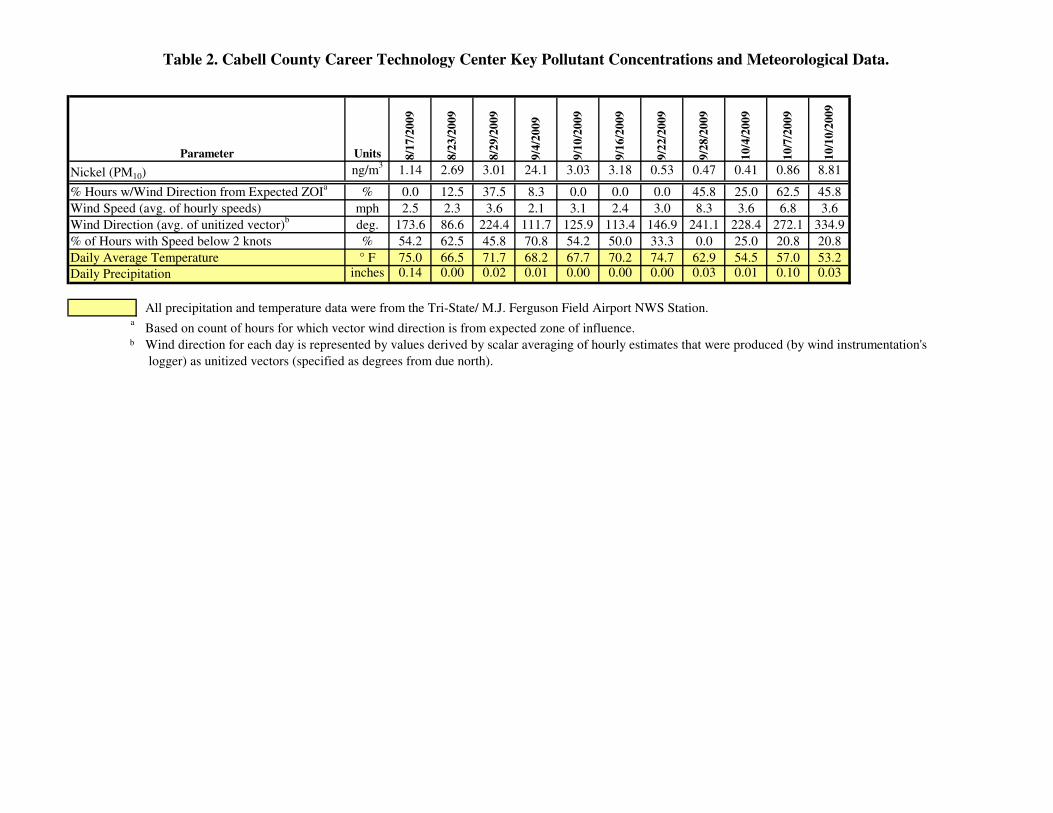
Table 2. Cabell County Career Technology Center Key Pollutant Concentrations and Meteorological Data.
Units 8/1
7/2
00
9
8/2
3/2
00
9
8/2
9/2
00
9
9/4
/20
09
9/1
0/2
00
9
9/1
6/2
00
9
9/2
2/2
00
9
9/2
8/2
00
9
10
/4/2
00
9
10
/7/2
00
9
10
/10
/20
09
ng/m3
1.14 2.69 3.01 24.1 3.03 3.18 0.53 0.47 0.41 0.86 8.81
% 0.0 12.5 37.5 8.3 0.0 0.0 0.0 45.8 25.0 62.5 45.8
mph 2.5 2.3 3.6 2.1 3.1 2.4 3.0 8.3 3.6 6.8 3.6
deg. 173.6 86.6 224.4 111.7 125.9 113.4 146.9 241.1 228.4 272.1 334.9
% 54.2 62.5 45.8 70.8 54.2 50.0 33.3 0.0 25.0 20.8 20.8
° F 75.0 66.5 71.7 68.2 67.7 70.2 74.7 62.9 54.5 57.0 53.2inches 0.14 0.00 0.02 0.01 0.00 0.00 0.00 0.03 0.01 0.10 0.03
All precipitation and temperature data were from the Tri-State/ M.J. Ferguson Field Airport NWS Station.a
Based on count of hours for which vector wind direction is from expected zone of influence.b Wind direction for each day is represented by values derived by scalar averaging of hourly estimates that were produced (by wind instrumentation's
logger) as unitized vectors (specified as degrees from due north).
Parameter
Daily Average Temperature
Nickel (PM10)
Daily Precipitation
% Hours w/Wind Direction from Expected ZOIa
Wind Speed (avg. of hourly speeds)
Wind Direction (avg. of unitized vector)b
% of Hours with Speed below 2 knots
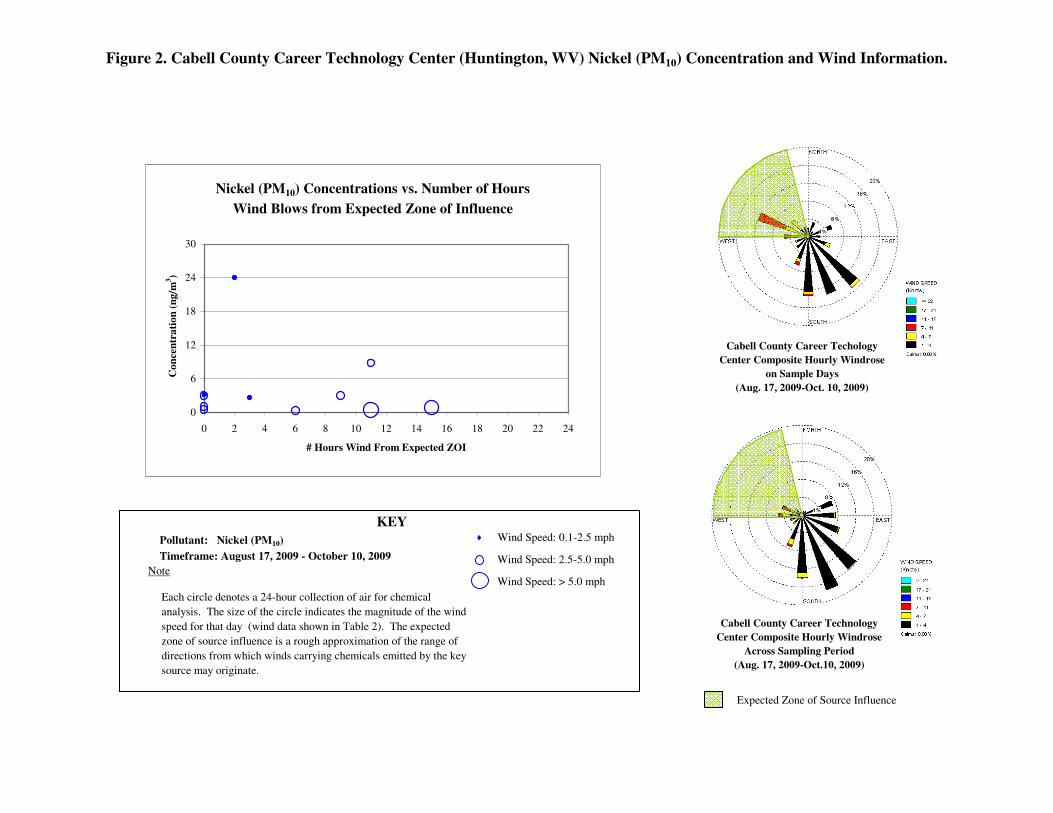
Figure 2. Cabell County Career Technology Center (Huntington, WV) Nickel (PM10) Concentration and Wind Information.
Pollutant: Nickel (PM10)
Timeframe: August 17, 2009 - October 10, 2009
Note
Each circle denotes a 24-hour collection of air for chemical
analysis. The size of the circle indicates the magnitude of the wind
speed for that day (wind data shown in Table 2). The expected
zone of source influence is a rough approximation of the range of
directions from which winds carrying chemicals emitted by the key
source may originate.
Wind Speed: 0.1-2.5 mph
Wind Speed: 2.5-5.0 mph
Wind Speed: > 5.0 mph
Expected Zone of Source Influence
KEY
Nickel (PM10) Concentrations vs. Number of Hours
Wind Blows from Expected Zone of Influence
0
6
12
18
24
30
0 2 4 6 8 10 12 14 16 18 20 22 24
# Hours Wind From Expected ZOI
Co
nce
ntr
ati
on
(n
g/m
3)
Cabell County Career Techology
Center Composite Hourly Windrose
on Sample Days
(Aug. 17, 2009-Oct. 10, 2009)
Cabell County Career Technology
Center Composite Hourly Windrose
Across Sampling Period
(Aug. 17, 2009-Oct.10, 2009)
10/18/10
A-1
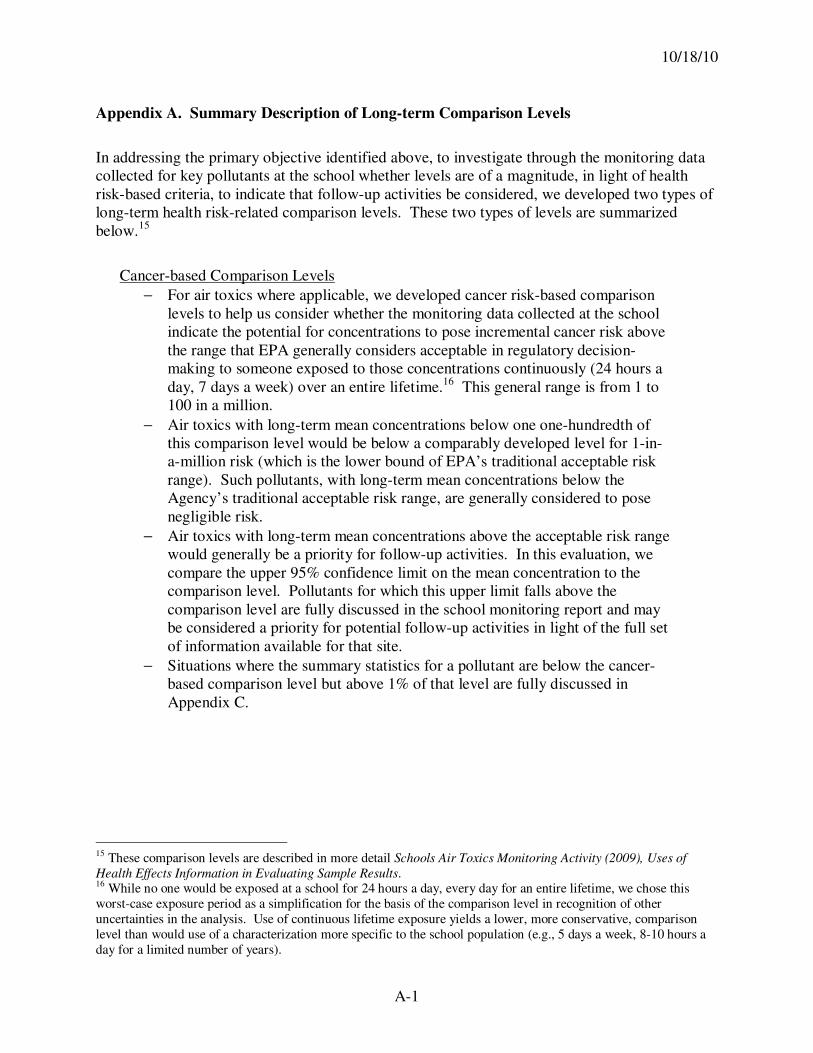
Appendix A. Summary Description of Long-term Comparison Levels
In addressing the primary objective identified above, to investigate through the monitoring data
collected for key pollutants at the school whether levels are of a magnitude, in light of health
risk-based criteria, to indicate that follow-up activities be considered, we developed two types of
long-term health risk-related comparison levels. These two types of levels are summarized
below.15
Cancer-based Comparison Levels
− For air toxics where applicable, we developed cancer risk-based comparison
levels to help us consider whether the monitoring data collected at the school
indicate the potential for concentrations to pose incremental cancer risk above
the range that EPA generally considers acceptable in regulatory decision-
making to someone exposed to those concentrations continuously (24 hours a
day, 7 days a week) over an entire lifetime.16
This general range is from 1 to
100 in a million.
− Air toxics with long-term mean concentrations below one one-hundredth of
this comparison level would be below a comparably developed level for 1-in-
a-million risk (which is the lower bound of EPA’s traditional acceptable risk
range). Such pollutants, with long-term mean concentrations below the
Agency’s traditional acceptable risk range, are generally considered to pose
negligible risk.
− Air toxics with long-term mean concentrations above the acceptable risk range
would generally be a priority for follow-up activities. In this evaluation, we
compare the upper 95% confidence limit on the mean concentration to the
comparison level. Pollutants for which this upper limit falls above the
comparison level are fully discussed in the school monitoring report and may
be considered a priority for potential follow-up activities in light of the full set
of information available for that site.
− Situations where the summary statistics for a pollutant are below the cancer-
based comparison level but above 1% of that level are fully discussed in
Appendix C.
15 These comparison levels are described in more detail Schools Air Toxics Monitoring Activity (2009), Uses of
Health Effects Information in Evaluating Sample Results. 16 While no one would be exposed at a school for 24 hours a day, every day for an entire lifetime, we chose this
worst-case exposure period as a simplification for the basis of the comparison level in recognition of other
uncertainties in the analysis. Use of continuous lifetime exposure yields a lower, more conservative, comparison
level than would use of a characterization more specific to the school population (e.g., 5 days a week, 8-10 hours a
day for a limited number of years).

10/18/10
A-2
Noncancer-based Comparison Levels
− To consider concentrations of air toxics other than lead (for which we have a
national ambient air quality standard) with regard to potential for health
effects other than cancer, we derived noncancer-based comparison levels
using EPA chronic reference concentrations (or similar values). A chronic
reference concentration (RfC) is an estimate of a long-term continuous
exposure concentration (24 hours a day, every day) without appreciable risk of
adverse effect over a lifetime.17
This differs from the cancer risk-based
comparison level in that it represents a concentration without appreciable risk
vs a risk-based concentration.
− In using this comparison level in this initiative, the upper end of the 95%
confidence limit on the mean is compared to the comparison level. Air toxics
for which this upper confidence limit is near or below the noncancer-based
comparison level (i.e., those for which longer-term average concentration
estimates are below a long-term health-related reference concentration) are
generally of low concern and will generally be considered a low priority for
follow-up activity. Pollutants for which the 95% confidence limits extend
appreciably above the noncancer-based comparison level are fully discussed
below and may be considered a priority for follow-up activity if indicated in
light of the full set of information available for the pollutant and the site.
− For lead, we set the noncancer-based comparison level equal to the level of
the recently revised national ambient air quality standard (NAAQS). It is
important to note that the NAAQS for lead is a 3-month rolling average of
lead in total suspended particles. Mean levels for the monitoring data
collected in this initiative that indicate the potential for a 3-month average
above the level of the standard will be considered a priority for consideration
of follow-up actions such as siting of a NAAQS monitor in the area.
In developing or identifying these comparison levels, we have given priority to use of relevant
and appropriate air standards and EPA risk assessment guidance and precedents. These levels
are based upon health effects information, exposure concentrations and risk estimates developed
and assessed by EPA, the U.S. Agency for Toxic Substances and Disease Registry, and the
California EPA. These agencies recognize the need to account for potential differences in
sensitivity or susceptibility of different groups (e.g., asthmatics) or lifestages/ages (e.g., young
children or the elderly) to a particular pollutant’s effects so that the resulting comparison levels
are relevant for these potentially sensitive groups as well as the broader population.
17 EPA defines the RfC as “an estimate (with uncertainty spanning perhaps an order of magnitude) of a continuous
inhalation exposure to the human population (including sensitive subgroups) that is likely to be without an
appreciable risk of deleterious effects during a lifetime. It can be derived from a NOAEL, LOAEL, or benchmark
concentration, with uncertainty factors generally applied to reflect limitations of the data used.” (Generally used in
EPA's noncancer health assessments) http://www.epa.gov/ncea/iris/help_gloss.htm#r

Appendix B. National Air Toxics Trends Stations Measurements (2004-2008).a
Pollutant Units
# Samples
Analyzed
%
Detections Maximum
Arithmetic
Meanb
Geometric
Mean
5th
Percentile
25th
Percentile
50th
Percentile
75th
Percentile
95th
Percentile
Antimony (PM10) ng/m3
2,372 94% 43.30 1.71 1.21 ND 0.60 1.13 2.17 4.33
Arsenic (PM10) ng/m3
5,076 86% 47.70 0.93 0.70 ND 0.29 0.56 1.02 2.89
Beryllium (PM10) ng/m3
4,771 64% 1.97 0.05 0.02 ND ND <0.01 0.02 0.50
Cadmium (PM10) ng/m3
4,793 85% 15.30 0.27 0.17 ND 0.05 0.13 0.29 0.94
Chromium (PM10) ng/m3
5,094 92% 172.06 2.71 1.66 ND 0.93 1.98 2.85 7.10
Cobalt (PM10) ng/m3
2,614 91% 20.30 0.28 0.18 ND 0.08 0.15 0.27 1.00
Manganese (PM10) ng/m3
4,793 99% 734.00 10.39 5.20 <0.01 2.41 4.49 9.96 33.78
Mercury (PM10) ng/m3
1,167 81% 2.07 0.07 0.04 ND 0.01 0.02 0.06 0.32
Nickel (PM10) ng/m3
4,815 80% 110.10 2.05 1.49 ND 0.74 1.44 2.50 5.74
Selenium (PM10) ng/m3
2,382 96% 13.00 1.10 0.53 <0.01 0.24 0.53 1.07 5.50
Key Pollutant
ND No results of this chemical were registered by the laboratory analytical equipment.
aThe summary statistics in this table represent the range of actual daily HAP measurement values taken at NATTS sites from 2004 through 2008. These data
were extracted from AQS in summer 2008 and 2009. During the time period of interest, there were 28 sites measuring VOCs, carbonyls, metals, and hexavalent
chromium. We note that some sites did not sample for particular pollutant types during the initial year of the NATTS Program, which was 2004. Most of the
monitoring stations in the NATTS network are located such that they are not expected to be impacted by single industrial sources. The concentrations typically
measured at NATTS sites can thus provide a comparison point useful to considering whether concentrations measured at a school are likely to have been
influenced by a significant nearby industrial source, or are more likely to be attributable to emissions from many small sources or to transported pollution from
another area. For example, concentrations at a school above the 75th percentile may suggest that a nearby industrial source is affecting air quality at the school.b
In calculations involving non-detects (ND), a value of zero is used.
10/18/10
C-1
Appendix C. Analysis of Other (non-key) Air Toxics Monitored at the School and
Multiple-pollutant Considerations.
At each school, monitoring has been targeted to get information on a limited set of key
hazardous air pollutants (HAPs).18
These pollutants are the primary focus of the monitoring
activities at a school and a priority for us based on our emissions, modeling and other
information. In analyzing air samples for these key pollutants, we have also obtained results for
some other pollutants that are routinely included with the same test method. Our consideration
of the data collected for these additional HAPs is described in the first section below. In addition
to evaluating monitoring results for individual pollutants, we also considered the potential for
cumulative impacts from multiple pollutants as described in the second section below (See Table
C-1).
Other Air Toxics (HAPs)
• Do the monitoring data indicate elevated levels of any other air toxics or hazardous air
pollutant (HAPs) that pose significant long-term health concerns?
→ Longer-term concentration estimates for the other HAPs monitored are below their
long-term comparison levels.
→ Further, for pollutants with cancer-based comparison levels, longer-term
concentration estimates for all but three (chromium, arsenic, and nickel) are more
than 100-fold lower.19
→ Additionally each individual measurement for these pollutants is below the individual
sample screening level developed for considering potential short-term exposures for
that pollutant.20
Additional Information on Three HAPs:
• The first of the three HAPs mentioned above is chromium. The comparison values for
chromium are conservatively based on the most toxic form of chromium (hexavalent
chromium, Cr+6
) which is only a fraction of the chromium in the ambient air.
Nonetheless, the longer-term concentration estimate for chromium (PM10) is well below
even these very restrictive comparison values. The mean and 95 percent upper bound on
the mean for chromium (PM10) are approximately half of the cancer-based comparison
18 Section 112(b) of the Clean Air Act identifies 189 hazardous air pollutants, three of which have subsequently been
removed from this list. These pollutants are the focus of regulatory actions involving stationary sources described
by CAA section 112 and are distinguished from the six pollutants for which criteria and national ambient air quality
standards (NAAQS) are developed as described in section 108. One of the criteria pollutants, lead, is also
represented, as lead compounds, on the HAP list. 19 For pollutants with cancer-based comparison levels, this would indicate longer-term estimates below continuous
(24 hours a day, 7 days a week) lifetime exposure concentrations associated with 10-5 and 10-6 excess cancer risk,
respectively. 20 The individual sample screening levels and their use is summarized on the website and described in detail in
Schools Air Toxics Monitoring Activity (2009), Uses of Health Effects Information in Evaluating Sample Results.

10/18/10
C-2
level. As Cr+6
is commonly only a small fraction of the chromium (PM10),21
the levels of
Cr+6
in these samples would be expected to be appreciably lower than this. A review of
information available at other sites nationally shows that the mean concentration of
chromium (PM10) at this site falls between the 75th
and the 95th
percentile of samples
collected from 2004 to 2008 (the most recently compiled period) at the NATTS
(Appendix B).
• The second HAP mentioned above is arsenic. The mean and 95 percent upper bound on
the mean arsenic (PM10) at the site are approximately 10% of the cancer-based
comparison level. The upper bound is nearly two times the mean due to a single
measurement being much different from the others (although still well below the
individual sample screening level). A review of information available at other sites
nationally shows that the mean concentration of arsenic (PM10) at this site falls between
the 75th
and 95th
percentile of samples collected from 2004 to 2008 (the most recently
compiled period) at the NATTS (Appendix B).
• The final HAP mentioned above is manganese. The mean and 95 percent upper bound on
the mean manganese (PM10) at the site are approximately 25% of the noncancer-based
comparison level. The upper bound is nearly two times the mean due to a single
measurement being much different from the others (although still well below the
individual sample screening level). A review of information available at other sites
nationally shows that the mean concentration of manganese (PM10) at this site falls
between the 50th
and 75th
percentile of samples collected from 2004 to 2008 (the most
recently compiled period) at the NATTS (Appendix B).
Multiple Pollutants
As described in the main body of the report and background materials, this initiative and the
associated analyses are focused on investigation of key pollutants for each school that were
identified by previous analyses. This focused design does not provide for the consideration of
combined impacts of pollutants or stressors other than those monitored in this project. Broader
analyses and those involving other pollutants may be the focus of other EPA activities.22
In our consideration of the potential for impacts from key pollutants at the monitored schools, we
have also considered the potential for other monitored pollutants to be present at levels that in
combination with the key pollutant levels contribute to an increased potential for cumulative
impacts. This was done in cases where estimates of longer-term concentrations for any non-key
HAPs are within an order of magnitude of their comparison levels even if these pollutant levels
fall below the comparison levels. This analysis is summarized below.
• Do the data collected for the air toxics monitored indicate the potential for other
monitored pollutants to be present at levels that in combination with the key pollutant
21 Data in EPA’s Air Quality System for locations that are not near a facility emitting hexavalent chromium indicate
hexavalent chromium concentrations to comprise less than approximately 10% of total chromium concentrations. 22 General information on additional air pollutants is available at http://www.epa.gov/air/airpollutants.html.
10/18/10
C-3
levels indicate an increased potential for cumulative impacts of significant concern (e.g.,
that might warrant further investigation)?
→ The data collected for the key and other air toxics and the associated longer-term
concentration estimates do not together pose significant concerns for cumulative
health risk from these pollutants.
• There are three HAPs monitored whose longer-term concentration estimates are
more than ten percent of their lowest comparison level: chromium (PM10),
manganese (PM10), and arsenic (PM10). The lowest comparison level for
chromium is based on carcinogenic risk to the respiratory system posed by
hexavalent chromium,23
while the comparison level for manganese and the lowest
comparison level for arsenic are based on non-carcinogenic effects to a different
system. Additionally, as noted above, hexavalent chromium is commonly a small
fraction of the total chromium (PM10) reported. With regard to arsenic (PM10)
and manganese (PM10), it can be seen that in the aggregate, their longer-term
concentration estimates comprise just half the noncancer-based comparison
levels. Taken together these considerations reduce concerns for cumulative health
risk from these pollutants.
23 The noncancer-based comparison level for chromium is much higher than the cancer-based level and is based on
risk of other effects posed to the respiratory system by hexavalent chromium in particulate form.
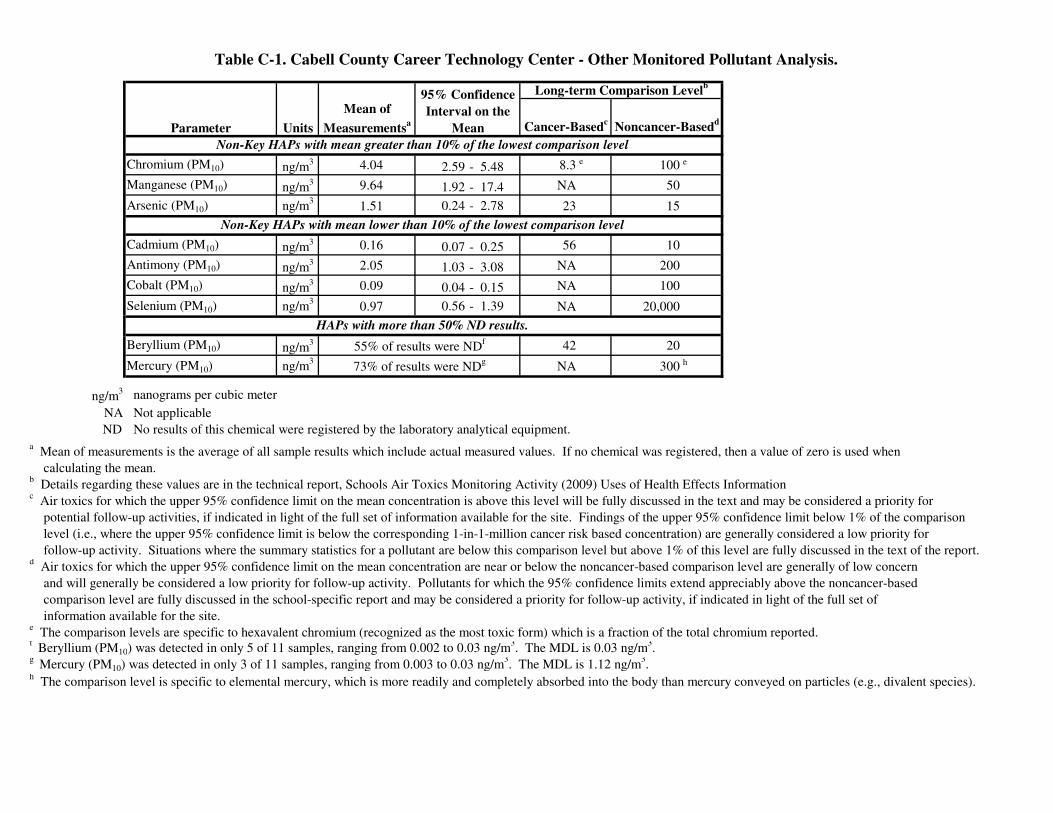
Table C-1. Cabell County Career Technology Center - Other Monitored Pollutant Analysis.
Chromium (PM10) ng/m3 4.04 2.59 - 5.48 8.3 e 100 e
Manganese (PM10) ng/m3 9.64 1.92 - 17.4 NA 50
Arsenic (PM10) ng/m3
1.51 0.24 - 2.78 23 15
Cadmium (PM10) ng/m3 0.16 0.07 - 0.25 56 10
Antimony (PM10) ng/m3 2.05 1.03 - 3.08 NA 200
Cobalt (PM10) ng/m3 0.09 0.04 - 0.15 NA 100
Selenium (PM10) ng/m3
0.97 0.56 - 1.39 NA 20,000
Beryllium (PM10) ng/m3 42 20
Mercury (PM10) ng/m3
NA 300 h
ng/m3 nanograms per cubic meter
NA Not applicable
ND No results of this chemical were registered by the laboratory analytical equipment.
a Mean of measurements is the average of all sample results which include actual measured values. If no chemical was registered, then a value of zero is used when
calculating the mean.b Details regarding these values are in the technical report, Schools Air Toxics Monitoring Activity (2009) Uses of Health Effects Information
c Air toxics for which the upper 95% confidence limit on the mean concentration is above this level will be fully discussed in the text and may be considered a priority for
potential follow-up activities, if indicated in light of the full set of information available for the site. Findings of the upper 95% confidence limit below 1% of the comparison
level (i.e., where the upper 95% confidence limit is below the corresponding 1-in-1-million cancer risk based concentration) are generally considered a low priority for
follow-up activity. Situations where the summary statistics for a pollutant are below this comparison level but above 1% of this level are fully discussed in the text of the report.d Air toxics for which the upper 95% confidence limit on the mean concentration are near or below the noncancer-based comparison level are generally of low concern
and will generally be considered a low priority for follow-up activity. Pollutants for which the 95% confidence limits extend appreciably above the noncancer-based
comparison level are fully discussed in the school-specific report and may be considered a priority for follow-up activity, if indicated in light of the full set of
information available for the site.e The comparison levels are specific to hexavalent chromium (recognized as the most toxic form) which is a fraction of the total chromium reported.
f Beryllium (PM10) was detected in only 5 of 11 samples, ranging from 0.002 to 0.03 ng/m
3. The MDL is 0.03 ng/m
3.
g Mercury (PM10) was detected in only 3 of 11 samples, ranging from 0.003 to 0.03 ng/m
3. The MDL is 1.12 ng/m
3.
h The comparison level is specific to elemental mercury, which is more readily and completely absorbed into the body than mercury conveyed on particles (e.g., divalent species).
Parameter Cancer-Basedc
Noncancer-Basedd
Long-term Comparison Levelb
73% of results were NDg
HAPs with more than 50% ND results.
Mean of
Measurementsa
95% Confidence
Interval on the
Mean
55% of results were NDf
Non-Key HAPs with mean greater than 10% of the lowest comparison level
Non-Key HAPs with mean lower than 10% of the lowest comparison level
Units

Appendix D. Cabell County Career Technology Center Pollutant Concentrations.
Parameter Units 8/1
7/2
00
9
8/2
3/2
00
9
8/2
9/2
00
9
9/4
/20
09
9/1
0/2
00
9
9/1
6/2
00
9
9/2
2/2
00
9
9/2
8/2
00
9
10
/4/2
00
9
10
/7/2
00
9
10
/10
/20
09
Nickel (PM10) ng/m3
1.14 2.69 3.01 24.1 3.03 3.18 0.53 0.47 0.41 0.86 8.81 200
Chromium (PM10) ng/m3
3.91 3.63 4.72 9.86 3.92 5.06 3.16 2.48 1.93 2.07 3.65 580b
Manganese (PM10) ng/m3
5.54 2.17 6.09 17.4 4.54 41.1 4.09 15.5 2.22 4.43 2.99 500
Arsenic (PM10) ng/m3
0.88 1.71 7.01 1.81 0.87 1.27 0.81 0.15 1.53 0.22 0.37 150
Cadmium (PM10) ng/m3
0.15 0.09 0.18 0.47 0.25 0.32 0.06 0.03 0.15 0.04 0.07 30
Antimony (PM10) ng/m3
1.82 3.38 1.23 3.50 1.06 2.26 1.02 0.48 1.53 5.60 0.70 2,000
Cobalt (PM10) ng/m3
0.14 ND 0.11 0.30 0.07 0.08 0.05 0.07 0.02 0.04 0.14 100
Selenium (PM10) ng/m3
1.18 0.63 1.17 1.64 0.96 2.34 0.65 1.10 0.24 0.59 0.22 20,000
Beryllium (PM10) ng/m3
0.03 ND 0.02 0.004 ND 0.008 ND ND 0.002 ND ND 20
Mercury (PM10) ng/m3
0.03 ND 0.005 ND ND 0.003 ND ND ND ND ND 3,000 c
Key Pollutant
ng/m3
nanograms per cubic meter
ND No results of this chemical were registered by the laboratory analytical equipment.
a The individual sample screening levels and their use is summarized on the web site and described in detail in Schools Air Toxics Monitoring Activity (2009), "Uses
of Health Effects Information in Evaluating Sample Results", see http://www.epa.gov/schoolair/pdfs/UsesOfHealthEffectsInfoinEvalSampleResults.pdf. These
screening levels are based on consideration of exposure all day, every day over a period ranging up to at least a couple of weeks, and longer for some pollutants.b
The sample screening levels are specific to hexavalent chromium (recognized as the most toxic form) which is a fraction of the total chromium reported.c
The sample screening level is specific to elemental mercury, which is more readily and completely absorbed into the body than mercury conveyed on particles
(e.g., divalent species).
Sample
Screening
Levela

Appendix E. Windroses for Tri-State/ M.J. Ferguson Field Airport NWS Station.
1 Tri-State/ M.J. Ferguson Field Airport (WBAN 03860) is 9.37 miles from Cabell County Career Technology Center.
Tri-State/ M. J. Ferguson Field Airport
NWS Station
Across Sampling Period
(Aug. 17, 2009-Oct. 10, 2009)1
Tri-State/ M. J. Ferguson Field Airport
NWS Station
Composite Hourly Windrose,
2002-20071