Embed Size (px)
Citation preview
SAS® Model Manager 14.2: User’s Guide
SAS® DocumentationJune 2017

The correct bibliographic citation for this manual is as follows: SAS Institute Inc. 2016. SAS® Model Manager 14.2: User’s Guide. Cary, NC: SAS Institute Inc.
SAS® Model Manager 14.2: User’s Guide
Copyright © 2016, SAS Institute Inc., Cary, NC, USA
All Rights Reserved. Produced in the United States of America.
For a hard copy book: No part of this publication may be reproduced, stored in a retrieval system, or transmitted, in any form or by any means, electronic, mechanical, photocopying, or otherwise, without the prior written permission of the publisher, SAS Institute Inc.
For a web download or e-book: Your use of this publication shall be governed by the terms established by the vendor at the time you acquire this publication.
The scanning, uploading, and distribution of this book via the Internet or any other means without the permission of the publisher is illegal and punishable by law. Please purchase only authorized electronic editions and do not participate in or encourage electronic piracy of copyrighted materials. Your support of others' rights is appreciated.
U.S. Government License Rights; Restricted Rights: The Software and its documentation is commercial computer software developed at private expense and is provided with RESTRICTED RIGHTS to the United States Government. Use, duplication, or disclosure of the Software by the United States Government is subject to the license terms of this Agreement pursuant to, as applicable, FAR 12.212, DFAR 227.7202-1(a), DFAR 227.7202-3(a), and DFAR 227.7202-4, and, to the extent required under U.S. federal law, the minimum restricted rights as set out in FAR 52.227-19 (DEC 2007). If FAR 52.227-19 is applicable, this provision serves as notice under clause (c) thereof and no other notice is required to be affixed to the Software or documentation. The Government’s rights in Software and documentation shall be only those set forth in this Agreement.
SAS Institute Inc., SAS Campus Drive, Cary, NC 27513-2414
June 2017
SAS® and all other SAS Institute Inc. product or service names are registered trademarks or trademarks of SAS Institute Inc. in the USA and other countries. ® indicates USA registration.
Other brand and product names are trademarks of their respective companies.
14.2-P1:mdlmgrug
SAS software may be provided with certain third-party software, including but not limited to open-source software, which is licensed under its applicable third-party software license agreement. For license information about third-party software distributed with SAS software, refer to http://support.sas.com/thirdpartylicenses.
Contents
What's New in SAS Model Manager 14.2 . . . . . . . . . . . . . . . . . . . . . . . . . . . . . . . . . . . . ixAccessibility . . . . . . . . . . . . . . . . . . . . . . . . . . . . . . . . . . . . . . . . . . . . . . . . . . . . . . . . . . . xi
PART 1 Getting Started 1
Chapter 1 • Introduction to SAS Model Manager . . . . . . . . . . . . . . . . . . . . . . . . . . . . . . . . . . . . . . . 3About Managing Models . . . . . . . . . . . . . . . . . . . . . . . . . . . . . . . . . . . . . . . . . . . . . . . . . 3Managing Preferences . . . . . . . . . . . . . . . . . . . . . . . . . . . . . . . . . . . . . . . . . . . . . . . . . . . 4Viewing Help and Documentation . . . . . . . . . . . . . . . . . . . . . . . . . . . . . . . . . . . . . . . . . . 6Model Management Process . . . . . . . . . . . . . . . . . . . . . . . . . . . . . . . . . . . . . . . . . . . . . . . 7High-Level Support Matrix by Model Score Code Type . . . . . . . . . . . . . . . . . . . . . . . . . 9
Chapter 2 • Quick Start Tutorial . . . . . . . . . . . . . . . . . . . . . . . . . . . . . . . . . . . . . . . . . . . . . . . . . . . 11Overview of the Quick Start Tutorial . . . . . . . . . . . . . . . . . . . . . . . . . . . . . . . . . . . . . . . 11Make the Tutorial Files Available . . . . . . . . . . . . . . . . . . . . . . . . . . . . . . . . . . . . . . . . . . 12Sign In . . . . . . . . . . . . . . . . . . . . . . . . . . . . . . . . . . . . . . . . . . . . . . . . . . . . . . . . . . . . . . . 13Define Data Sources . . . . . . . . . . . . . . . . . . . . . . . . . . . . . . . . . . . . . . . . . . . . . . . . . . . . 14Organize the Model Hierarchy . . . . . . . . . . . . . . . . . . . . . . . . . . . . . . . . . . . . . . . . . . . . 16Import Models . . . . . . . . . . . . . . . . . . . . . . . . . . . . . . . . . . . . . . . . . . . . . . . . . . . . . . . . 20Create Model Comparison Reports . . . . . . . . . . . . . . . . . . . . . . . . . . . . . . . . . . . . . . . . 21Create a Scoring Test . . . . . . . . . . . . . . . . . . . . . . . . . . . . . . . . . . . . . . . . . . . . . . . . . . . 23Set the Champion Model . . . . . . . . . . . . . . . . . . . . . . . . . . . . . . . . . . . . . . . . . . . . . . . . 25Monitor the Performance of a Champion Model . . . . . . . . . . . . . . . . . . . . . . . . . . . . . . 25Publish a Champion Model to the SAS Metadata Repository . . . . . . . . . . . . . . . . . . . . 29View and Search Model Inventory . . . . . . . . . . . . . . . . . . . . . . . . . . . . . . . . . . . . . . . . . 30
Chapter 3 • Managing Data Tables . . . . . . . . . . . . . . . . . . . . . . . . . . . . . . . . . . . . . . . . . . . . . . . . . 33About Managing Data Tables . . . . . . . . . . . . . . . . . . . . . . . . . . . . . . . . . . . . . . . . . . . . . 33Adding Tables Using SAS Visual Data Builder . . . . . . . . . . . . . . . . . . . . . . . . . . . . . . . 34Add Tables That Are Registered in Metadata . . . . . . . . . . . . . . . . . . . . . . . . . . . . . . . . . 34Register and Add New Tables . . . . . . . . . . . . . . . . . . . . . . . . . . . . . . . . . . . . . . . . . . . . 35Edit Table Properties and View Table Metadata . . . . . . . . . . . . . . . . . . . . . . . . . . . . . . . 35View Table Data . . . . . . . . . . . . . . . . . . . . . . . . . . . . . . . . . . . . . . . . . . . . . . . . . . . . . . . 36Filter Data in the Table View . . . . . . . . . . . . . . . . . . . . . . . . . . . . . . . . . . . . . . . . . . . . . 37Create a Table Summary . . . . . . . . . . . . . . . . . . . . . . . . . . . . . . . . . . . . . . . . . . . . . . . . . 38Delete a Table Summary . . . . . . . . . . . . . . . . . . . . . . . . . . . . . . . . . . . . . . . . . . . . . . . . . 39Add Attachments to a Table . . . . . . . . . . . . . . . . . . . . . . . . . . . . . . . . . . . . . . . . . . . . . . 40Add Comments to a Table . . . . . . . . . . . . . . . . . . . . . . . . . . . . . . . . . . . . . . . . . . . . . . . 40Remove a Table . . . . . . . . . . . . . . . . . . . . . . . . . . . . . . . . . . . . . . . . . . . . . . . . . . . . . . . 40
Chapter 4 • Managing Folders . . . . . . . . . . . . . . . . . . . . . . . . . . . . . . . . . . . . . . . . . . . . . . . . . . . . . 41Overview of Managing Folders . . . . . . . . . . . . . . . . . . . . . . . . . . . . . . . . . . . . . . . . . . . 41Create a New Folder . . . . . . . . . . . . . . . . . . . . . . . . . . . . . . . . . . . . . . . . . . . . . . . . . . . . 41Rename a Folder . . . . . . . . . . . . . . . . . . . . . . . . . . . . . . . . . . . . . . . . . . . . . . . . . . . . . . . 42Delete a Folder . . . . . . . . . . . . . . . . . . . . . . . . . . . . . . . . . . . . . . . . . . . . . . . . . . . . . . . . 42Archive and Restore Folders . . . . . . . . . . . . . . . . . . . . . . . . . . . . . . . . . . . . . . . . . . . . . 42
PART 2 Working with Models, Projects, and Portfolios 45
Chapter 5 • Working with Projects . . . . . . . . . . . . . . . . . . . . . . . . . . . . . . . . . . . . . . . . . . . . . . . . . 47Overview of Projects . . . . . . . . . . . . . . . . . . . . . . . . . . . . . . . . . . . . . . . . . . . . . . . . . . . 48Planning a Project . . . . . . . . . . . . . . . . . . . . . . . . . . . . . . . . . . . . . . . . . . . . . . . . . . . . . . 48Prerequisites for Creating Projects . . . . . . . . . . . . . . . . . . . . . . . . . . . . . . . . . . . . . . . . . 49Create a Project . . . . . . . . . . . . . . . . . . . . . . . . . . . . . . . . . . . . . . . . . . . . . . . . . . . . . . . . 50Project Properties . . . . . . . . . . . . . . . . . . . . . . . . . . . . . . . . . . . . . . . . . . . . . . . . . . . . . . 51Defining Project Input and Output Variables . . . . . . . . . . . . . . . . . . . . . . . . . . . . . . . . . 55Managing Project Versions . . . . . . . . . . . . . . . . . . . . . . . . . . . . . . . . . . . . . . . . . . . . . . . 57View Project History . . . . . . . . . . . . . . . . . . . . . . . . . . . . . . . . . . . . . . . . . . . . . . . . . . . . 59Add Attachments to a Project . . . . . . . . . . . . . . . . . . . . . . . . . . . . . . . . . . . . . . . . . . . . . 59Add Comments to a Project . . . . . . . . . . . . . . . . . . . . . . . . . . . . . . . . . . . . . . . . . . . . . . 59Lock or Unlock Project Variables . . . . . . . . . . . . . . . . . . . . . . . . . . . . . . . . . . . . . . . . . . 60Creating and Managing Templates . . . . . . . . . . . . . . . . . . . . . . . . . . . . . . . . . . . . . . . . . 60Searching for Models . . . . . . . . . . . . . . . . . . . . . . . . . . . . . . . . . . . . . . . . . . . . . . . . . . . 63
Chapter 6 • Importing Models . . . . . . . . . . . . . . . . . . . . . . . . . . . . . . . . . . . . . . . . . . . . . . . . . . . . . 67Overview of Importing Models . . . . . . . . . . . . . . . . . . . . . . . . . . . . . . . . . . . . . . . . . . . 67Import a Model from the SAS Metadata Repository . . . . . . . . . . . . . . . . . . . . . . . . . . . 69Import a Model from a SAS Package File . . . . . . . . . . . . . . . . . . . . . . . . . . . . . . . . . . . 70Import a PMML Model . . . . . . . . . . . . . . . . . . . . . . . . . . . . . . . . . . . . . . . . . . . . . . . . . 71Import Models from Local Files . . . . . . . . . . . . . . . . . . . . . . . . . . . . . . . . . . . . . . . . . . . 72Import a Model from a SAS Analytic Store File . . . . . . . . . . . . . . . . . . . . . . . . . . . . . . 74Export Models from a Project . . . . . . . . . . . . . . . . . . . . . . . . . . . . . . . . . . . . . . . . . . . . . 75Importing Models into a Folder . . . . . . . . . . . . . . . . . . . . . . . . . . . . . . . . . . . . . . . . . . . 75
Chapter 7 • Managing Model Content and Versions . . . . . . . . . . . . . . . . . . . . . . . . . . . . . . . . . . . 79Overview of Managing Model Content and Versions . . . . . . . . . . . . . . . . . . . . . . . . . . 79Set Model Properties . . . . . . . . . . . . . . . . . . . . . . . . . . . . . . . . . . . . . . . . . . . . . . . . . . . . 79Add Model User-Defined Properties . . . . . . . . . . . . . . . . . . . . . . . . . . . . . . . . . . . . . . . 81Add and Edit Model Keywords . . . . . . . . . . . . . . . . . . . . . . . . . . . . . . . . . . . . . . . . . . . 81Add Model Dependencies and View Lineage . . . . . . . . . . . . . . . . . . . . . . . . . . . . . . . . 83Add Model Files to an Existing Model . . . . . . . . . . . . . . . . . . . . . . . . . . . . . . . . . . . . . . 84Create Input and Output Variables from a SAS Code File . . . . . . . . . . . . . . . . . . . . . . . 85Map Model Variables to Project Variables . . . . . . . . . . . . . . . . . . . . . . . . . . . . . . . . . . . 86User-Defined Model Templates . . . . . . . . . . . . . . . . . . . . . . . . . . . . . . . . . . . . . . . . . . . 87Managing Model Versions . . . . . . . . . . . . . . . . . . . . . . . . . . . . . . . . . . . . . . . . . . . . . . . 88Add Attachments . . . . . . . . . . . . . . . . . . . . . . . . . . . . . . . . . . . . . . . . . . . . . . . . . . . . . . 89Add Comments . . . . . . . . . . . . . . . . . . . . . . . . . . . . . . . . . . . . . . . . . . . . . . . . . . . . . . . . 89
Chapter 8 • Working with Model Inventory . . . . . . . . . . . . . . . . . . . . . . . . . . . . . . . . . . . . . . . . . . 91Overview of Model Inventory . . . . . . . . . . . . . . . . . . . . . . . . . . . . . . . . . . . . . . . . . . . . 91Search and Filter Inventory of Models . . . . . . . . . . . . . . . . . . . . . . . . . . . . . . . . . . . . . . 91Add Model User-Defined Properties to Inventory List . . . . . . . . . . . . . . . . . . . . . . . . . 92
Chapter 9 • Working with Portfolios . . . . . . . . . . . . . . . . . . . . . . . . . . . . . . . . . . . . . . . . . . . . . . . . 95Overview of Portfolios . . . . . . . . . . . . . . . . . . . . . . . . . . . . . . . . . . . . . . . . . . . . . . . . . . 95Planning a Portfolio . . . . . . . . . . . . . . . . . . . . . . . . . . . . . . . . . . . . . . . . . . . . . . . . . . . . 96Prerequisites for Creating Portfolios . . . . . . . . . . . . . . . . . . . . . . . . . . . . . . . . . . . . . . . 97Creating a Project Control Table . . . . . . . . . . . . . . . . . . . . . . . . . . . . . . . . . . . . . . . . . . 98Create a New Portfolio . . . . . . . . . . . . . . . . . . . . . . . . . . . . . . . . . . . . . . . . . . . . . . . . . . 99Add a New Version . . . . . . . . . . . . . . . . . . . . . . . . . . . . . . . . . . . . . . . . . . . . . . . . . . . . 101Add an Input Variable . . . . . . . . . . . . . . . . . . . . . . . . . . . . . . . . . . . . . . . . . . . . . . . . . . 102Publishing Models from a Portfolio . . . . . . . . . . . . . . . . . . . . . . . . . . . . . . . . . . . . . . . 103Monitor Performance of Project Champion Models . . . . . . . . . . . . . . . . . . . . . . . . . . 107
iv Contents
Add Attachments . . . . . . . . . . . . . . . . . . . . . . . . . . . . . . . . . . . . . . . . . . . . . . . . . . . . . 110Add Comments . . . . . . . . . . . . . . . . . . . . . . . . . . . . . . . . . . . . . . . . . . . . . . . . . . . . . . . 111
PART 3 Evaluating Models and Monitoring Performance113
Chapter 10 • Scoring Models . . . . . . . . . . . . . . . . . . . . . . . . . . . . . . . . . . . . . . . . . . . . . . . . . . . . . 115Overview of Scoring Tests . . . . . . . . . . . . . . . . . . . . . . . . . . . . . . . . . . . . . . . . . . . . . . 115Create Scoring Output Tables . . . . . . . . . . . . . . . . . . . . . . . . . . . . . . . . . . . . . . . . . . . . 116Create a Scoring Test . . . . . . . . . . . . . . . . . . . . . . . . . . . . . . . . . . . . . . . . . . . . . . . . . . 118Execute a Scoring Test . . . . . . . . . . . . . . . . . . . . . . . . . . . . . . . . . . . . . . . . . . . . . . . . . 119Schedule a Scoring Test . . . . . . . . . . . . . . . . . . . . . . . . . . . . . . . . . . . . . . . . . . . . . . . . 119Scoring Model Properties . . . . . . . . . . . . . . . . . . . . . . . . . . . . . . . . . . . . . . . . . . . . . . . 120
Chapter 11 • Using Reports to Evaluate and Validate Models . . . . . . . . . . . . . . . . . . . . . . . . . . 123Overview of Model Comparison, Validation, and Summary Reports . . . . . . . . . . . . . 124Model Profile Reports . . . . . . . . . . . . . . . . . . . . . . . . . . . . . . . . . . . . . . . . . . . . . . . . . . 126Delta Reports . . . . . . . . . . . . . . . . . . . . . . . . . . . . . . . . . . . . . . . . . . . . . . . . . . . . . . . . 128Dynamic Lift Reports . . . . . . . . . . . . . . . . . . . . . . . . . . . . . . . . . . . . . . . . . . . . . . . . . . 129Interval Target Variable Report . . . . . . . . . . . . . . . . . . . . . . . . . . . . . . . . . . . . . . . . . . . 132Loss Given Default Reports . . . . . . . . . . . . . . . . . . . . . . . . . . . . . . . . . . . . . . . . . . . . . 133Probability of Default Model Validation Reports . . . . . . . . . . . . . . . . . . . . . . . . . . . . . 136Training Summary Data Set Reports . . . . . . . . . . . . . . . . . . . . . . . . . . . . . . . . . . . . . . 139Monitoring Reports . . . . . . . . . . . . . . . . . . . . . . . . . . . . . . . . . . . . . . . . . . . . . . . . . . . . 141Champion and Challenger Performance Reports . . . . . . . . . . . . . . . . . . . . . . . . . . . . . 143View Reports . . . . . . . . . . . . . . . . . . . . . . . . . . . . . . . . . . . . . . . . . . . . . . . . . . . . . . . . 145
Chapter 12 • Validating Models Using User Reports . . . . . . . . . . . . . . . . . . . . . . . . . . . . . . . . . . 147Overview of User Reports . . . . . . . . . . . . . . . . . . . . . . . . . . . . . . . . . . . . . . . . . . . . . . 147Ad Hoc Reports . . . . . . . . . . . . . . . . . . . . . . . . . . . . . . . . . . . . . . . . . . . . . . . . . . . . . . 149User-Defined Reports . . . . . . . . . . . . . . . . . . . . . . . . . . . . . . . . . . . . . . . . . . . . . . . . . . 151
Chapter 13 • Combining Reports . . . . . . . . . . . . . . . . . . . . . . . . . . . . . . . . . . . . . . . . . . . . . . . . . 161About Aggregated Reports . . . . . . . . . . . . . . . . . . . . . . . . . . . . . . . . . . . . . . . . . . . . . . 161Create an Aggregated Report . . . . . . . . . . . . . . . . . . . . . . . . . . . . . . . . . . . . . . . . . . . . 161View an Aggregated Report . . . . . . . . . . . . . . . . . . . . . . . . . . . . . . . . . . . . . . . . . . . . . 162Delete an Aggregated Report . . . . . . . . . . . . . . . . . . . . . . . . . . . . . . . . . . . . . . . . . . . . 163
Chapter 14 • Monitoring Performance of Models . . . . . . . . . . . . . . . . . . . . . . . . . . . . . . . . . . . . 165Overview of Performance Monitoring . . . . . . . . . . . . . . . . . . . . . . . . . . . . . . . . . . . . . 165Types of Performance Monitoring . . . . . . . . . . . . . . . . . . . . . . . . . . . . . . . . . . . . . . . . 167Performance Index Warnings and Alerts . . . . . . . . . . . . . . . . . . . . . . . . . . . . . . . . . . . 173Monitoring Champion Models . . . . . . . . . . . . . . . . . . . . . . . . . . . . . . . . . . . . . . . . . . . 175Creating Reports Using a Performance Definition . . . . . . . . . . . . . . . . . . . . . . . . . . . . 176Prerequisites for Editing a Performance Definition . . . . . . . . . . . . . . . . . . . . . . . . . . . 179Edit and Execute a Performance Definition . . . . . . . . . . . . . . . . . . . . . . . . . . . . . . . . . 181Schedule Performance Definitions . . . . . . . . . . . . . . . . . . . . . . . . . . . . . . . . . . . . . . . . 184View Performance Monitoring Job History . . . . . . . . . . . . . . . . . . . . . . . . . . . . . . . . . 186Manage Performance Data Sets . . . . . . . . . . . . . . . . . . . . . . . . . . . . . . . . . . . . . . . . . . 187Monitoring Performance of a Model without Score Code . . . . . . . . . . . . . . . . . . . . . . 187
Chapter 15 • Using Dashboard Reports . . . . . . . . . . . . . . . . . . . . . . . . . . . . . . . . . . . . . . . . . . . . 191Overview of Dashboard Reports . . . . . . . . . . . . . . . . . . . . . . . . . . . . . . . . . . . . . . . . . 191Create a Dashboard Report Definition . . . . . . . . . . . . . . . . . . . . . . . . . . . . . . . . . . . . . 191
Contents v
Generate Dashboard Reports . . . . . . . . . . . . . . . . . . . . . . . . . . . . . . . . . . . . . . . . . . . . 193View Dashboard Reports . . . . . . . . . . . . . . . . . . . . . . . . . . . . . . . . . . . . . . . . . . . . . . . 194Manage Dashboard Definitions . . . . . . . . . . . . . . . . . . . . . . . . . . . . . . . . . . . . . . . . . . 194Edit a Dashboard Report Definition . . . . . . . . . . . . . . . . . . . . . . . . . . . . . . . . . . . . . . . 195
Chapter 16 • Retraining Models . . . . . . . . . . . . . . . . . . . . . . . . . . . . . . . . . . . . . . . . . . . . . . . . . . 197Overview of Retraining Models . . . . . . . . . . . . . . . . . . . . . . . . . . . . . . . . . . . . . . . . . . 197Prerequisites for Retraining a Model . . . . . . . . . . . . . . . . . . . . . . . . . . . . . . . . . . . . . . 198Edit a Model Retrain Definition . . . . . . . . . . . . . . . . . . . . . . . . . . . . . . . . . . . . . . . . . . 200Execute a Model Retrain Definition . . . . . . . . . . . . . . . . . . . . . . . . . . . . . . . . . . . . . . . 202Schedule a Retrain Definition . . . . . . . . . . . . . . . . . . . . . . . . . . . . . . . . . . . . . . . . . . . . 202Viewing Retrained Models and Model Comparison Reports . . . . . . . . . . . . . . . . . . . . 203
PART 4 Deploying and Publishing Models 205
Chapter 17 • Deploying Models . . . . . . . . . . . . . . . . . . . . . . . . . . . . . . . . . . . . . . . . . . . . . . . . . . . 207Overview of Deploying Models . . . . . . . . . . . . . . . . . . . . . . . . . . . . . . . . . . . . . . . . . . 207Champion Models . . . . . . . . . . . . . . . . . . . . . . . . . . . . . . . . . . . . . . . . . . . . . . . . . . . . . 208Challenger Models . . . . . . . . . . . . . . . . . . . . . . . . . . . . . . . . . . . . . . . . . . . . . . . . . . . . 209Locking Versions . . . . . . . . . . . . . . . . . . . . . . . . . . . . . . . . . . . . . . . . . . . . . . . . . . . . . 210
Chapter 18 • Publishing Models . . . . . . . . . . . . . . . . . . . . . . . . . . . . . . . . . . . . . . . . . . . . . . . . . . 213Overview of Publishing Models . . . . . . . . . . . . . . . . . . . . . . . . . . . . . . . . . . . . . . . . . . 213Publishing Models to a SAS Channel . . . . . . . . . . . . . . . . . . . . . . . . . . . . . . . . . . . . . . 214Publishing Models to the SAS Metadata Repository . . . . . . . . . . . . . . . . . . . . . . . . . . 215Publishing Models to a Database or Hadoop . . . . . . . . . . . . . . . . . . . . . . . . . . . . . . . . 217Remove Published Models . . . . . . . . . . . . . . . . . . . . . . . . . . . . . . . . . . . . . . . . . . . . . . 226View Publish History . . . . . . . . . . . . . . . . . . . . . . . . . . . . . . . . . . . . . . . . . . . . . . . . . . 226
PART 5 Using SAS Workflow with SAS Model Manager227
Chapter 19 • Starting a Workflow and Working with Tasks . . . . . . . . . . . . . . . . . . . . . . . . . . . . 229Overview of Using Workflows . . . . . . . . . . . . . . . . . . . . . . . . . . . . . . . . . . . . . . . . . . . 229Start a New Workflow . . . . . . . . . . . . . . . . . . . . . . . . . . . . . . . . . . . . . . . . . . . . . . . . . 229Working with Workflow Tasks . . . . . . . . . . . . . . . . . . . . . . . . . . . . . . . . . . . . . . . . . . . 230
Chapter 20 • Managing Workflows . . . . . . . . . . . . . . . . . . . . . . . . . . . . . . . . . . . . . . . . . . . . . . . . 233Overview of Managing Workflows . . . . . . . . . . . . . . . . . . . . . . . . . . . . . . . . . . . . . . . 233Viewing Workflows . . . . . . . . . . . . . . . . . . . . . . . . . . . . . . . . . . . . . . . . . . . . . . . . . . . 234Set Mappings . . . . . . . . . . . . . . . . . . . . . . . . . . . . . . . . . . . . . . . . . . . . . . . . . . . . . . . . 235Working with Workflow Participants . . . . . . . . . . . . . . . . . . . . . . . . . . . . . . . . . . . . . . 236Edit Task Properties . . . . . . . . . . . . . . . . . . . . . . . . . . . . . . . . . . . . . . . . . . . . . . . . . . . 238Terminate a Workflow . . . . . . . . . . . . . . . . . . . . . . . . . . . . . . . . . . . . . . . . . . . . . . . . . 238
PART 6 Appendixes 239
vi Contents
Appendix 1 • Model Templates . . . . . . . . . . . . . . . . . . . . . . . . . . . . . . . . . . . . . . . . . . . . . . . . . . . 241
Appendix 2 • Project Tables . . . . . . . . . . . . . . . . . . . . . . . . . . . . . . . . . . . . . . . . . . . . . . . . . . . . . 253Descriptions of Project Tables . . . . . . . . . . . . . . . . . . . . . . . . . . . . . . . . . . . . . . . . . . . 253Creating Project Input and Output Tables . . . . . . . . . . . . . . . . . . . . . . . . . . . . . . . . . . 257Creating Scoring Input and Output Tables . . . . . . . . . . . . . . . . . . . . . . . . . . . . . . . . . . 259Creating a Test Table . . . . . . . . . . . . . . . . . . . . . . . . . . . . . . . . . . . . . . . . . . . . . . . . . . 260Creating a Performance Table . . . . . . . . . . . . . . . . . . . . . . . . . . . . . . . . . . . . . . . . . . . 260Using Tables from a Local or Network Drive . . . . . . . . . . . . . . . . . . . . . . . . . . . . . . . 262
Appendix 3 • PROC PSCORE and PMML Support . . . . . . . . . . . . . . . . . . . . . . . . . . . . . . . . . . . 265
Appendix 4 • R Model Support . . . . . . . . . . . . . . . . . . . . . . . . . . . . . . . . . . . . . . . . . . . . . . . . . . . 267Overview of Using R Models with SAS Model Manager . . . . . . . . . . . . . . . . . . . . . . 267Preparing R Model Files to Use with SAS/IML . . . . . . . . . . . . . . . . . . . . . . . . . . . . . . 268
Appendix 5 • Statistical Measures Used in Basel III Reports . . . . . . . . . . . . . . . . . . . . . . . . . . . 275
Recommended Reading . . . . . . . . . . . . . . . . . . . . . . . . . . . . . . . . . . . . . . . . 283Glossary . . . . . . . . . . . . . . . . . . . . . . . . . . . . . . . . . . . . . . . . . . . . . . . . . . . . . 285Index . . . . . . . . . . . . . . . . . . . . . . . . . . . . . . . . . . . . . . . . . . . . . . . . . . . . . . . . 295
Contents vii

viii Contents
What's New in SAS Model Manager 14.2
Overview
SAS Model Manager 14.2 has new features and enhancements that enable you to perform these tasks:
• import SAS analytic store models
• publish, score, monitor performance, or run reports for SAS analytic store models
• publish models to Hadoop and Teradata using single sign-on authentication by Kerberos
• run scoring tests in a High-Performance Analytics production environment
• score SAS Factory Miner models within a SAS Model Manager portfolio by using macros
• publish SAS Factory Miner models from within a SAS Model Manager portfolio to a database or Hadoop by using macros
Import SAS Analytic Store Models
You can import SAS analytic store models that are created using SAS Factory Miner or by using the HPFOREST and HPSVM procedures in Base SAS. You can use a SAS analytic store model (SASAST) file to import an analytic store model into SAS Model Manager. However, SAS analytic store models that are created by using SAS Enterprise Miner and that are in SAS package file (SPK) format are not supported in this release. For more information, see “Import a Model from a SAS Analytic Store File” on page 74.
Publish, Score, Monitor Performance, or Run Reports for SAS Analytic Store Models
You can publish, score, monitor performance, or run reports for SAS analytic store models that are located within a project. SAS analytic store models can be published only to Hadoop and Teradata. Retraining of SAS analytic store models is not supported. For more information, see the following:
ix

• publish models to a database or Hadoop
• score models
• monitor performance
• run model comparison reports
Publish Models to Hadoop and Teradata Using Single Sign-On Authentication by Kerberos
Users who are configured to use single sign-on web authentication by Kerberos can publish models to Hadoop and Teradata. For more information, see “Configure Users Authenticated by Kerberos for Publishing Models” in SAS Model Manager: Administrator’s Guide.
Run Scoring Tests in a High-Performance Analytics Production Environment
When you are creating a scoring test for a model, you can process the scoring test data in a High-Performance Analytics production environment. For more information, see “Create a Scoring Test” on page 118.
Score SAS Factory Miner Models within a SAS Model Manager Portfolio
SAS Model Manager portfolio macros enable you to score SAS Factory Miner models that are within a SAS Model Manager portfolio. For more information, see “%MM_ScorePortfolioModels Macro” in SAS Model Manager: Macro Reference.
Publish SAS Factory Miner Models from within a SAS Model Manager Portfolio to a Database or Hadoop
SAS Model Manager portfolio macros enable you to publish SAS Factory Miner models that are within a SAS Model Manager portfolio to a database or Hadoop. For more information, see “%MM_PublishPortfolioModelsDB” in SAS Model Manager: Macro Reference and “%MM_PublishPortfolioModelsHadoop” in SAS Model Manager: Macro Reference.
x SAS Model Manager
Accessibility
For information about the accessibility of this product, see Accessibility Features of SAS Model Manager 14.2.
xi

xii SAS Model Manager
Part 1
Getting Started
Chapter 1Introduction to SAS Model Manager . . . . . . . . . . . . . . . . . . . . . . . . . . . . . . . 3
Chapter 2Quick Start Tutorial . . . . . . . . . . . . . . . . . . . . . . . . . . . . . . . . . . . . . . . . . . . . . . 11
Chapter 3Managing Data Tables . . . . . . . . . . . . . . . . . . . . . . . . . . . . . . . . . . . . . . . . . . . 33
Chapter 4Managing Folders . . . . . . . . . . . . . . . . . . . . . . . . . . . . . . . . . . . . . . . . . . . . . . . 41
1

2

Chapter 1
Introduction to SAS Model Manager
About Managing Models . . . . . . . . . . . . . . . . . . . . . . . . . . . . . . . . . . . . . . . . . . . . . . . . 3
Managing Preferences . . . . . . . . . . . . . . . . . . . . . . . . . . . . . . . . . . . . . . . . . . . . . . . . . . 4About Setting Preferences . . . . . . . . . . . . . . . . . . . . . . . . . . . . . . . . . . . . . . . . . . . . . 4Global Preferences . . . . . . . . . . . . . . . . . . . . . . . . . . . . . . . . . . . . . . . . . . . . . . . . . . . 5Decision Manager Preferences . . . . . . . . . . . . . . . . . . . . . . . . . . . . . . . . . . . . . . . . . . 5SAS Preferences Manager . . . . . . . . . . . . . . . . . . . . . . . . . . . . . . . . . . . . . . . . . . . . . 5Change the Delivery Type for Alert Notifications . . . . . . . . . . . . . . . . . . . . . . . . . . . 6
Viewing Help and Documentation . . . . . . . . . . . . . . . . . . . . . . . . . . . . . . . . . . . . . . . . . 6
Model Management Process . . . . . . . . . . . . . . . . . . . . . . . . . . . . . . . . . . . . . . . . . . . . . 7
High-Level Support Matrix by Model Score Code Type . . . . . . . . . . . . . . . . . . . . . . 9
About Managing ModelsUsing SAS Model Manager, you can store models, and organize them within projects or folders, validate candidate models, assess candidate models for champion model selection, and publish and monitor champion models in a production environment, and retrain models. All model development and model maintenance personnel, including data modelers, validation testers, scoring officers, and analysts, can use SAS Model Manager.
Here are some of the services SAS Model Manager provides:
• Use a single interface to access all of your business modeling projects. All models are stored in a central, secure model repository. Models can also be accessed in one place using the model inventory list in the Inventory category.
• Track the progress of your project’s version by creating processes, definitions, and tests. You create custom processes, definitions, and tests to meet your business requirements and to match your business processes.
• Use data tables that are registered in the SAS Metadata Repository.
• Import SAS Enterprise Miner models, SAS/STAT linear models, SAS/ETS COUNTREG and SEVERITY models, models that you develop using SAS code, PMML models, and R models. You can also import a generic model and the model’s files in to a folder. You can create custom model templates for SAS code models so that SAS Model Manager knows exactly what files and metadata are associated with a model.
3

• You can schedule and run scoring tests, performance monitoring, and retraining to validate models.
• Run several reports to compare and assess candidate models. You can also write your own SAS reporting programs to run and assess candidate models. The aggregated reporting facility enables you to combine multiple reports into a single report. Dashboard reports enable you to monitor the state of projects using performance monitoring reports and can be viewed in a web browser.
• Publish models to the SAS Metadata Repository or a SAS channel. You can also publish the champion model and challenger models to a database for scoring. The SAS Scoring Accelerator is used by SAS Model Manager to publish models to a database or Hadoop.
Data tables are an integral part of the modeling process. You can use project input and output prototype tables, as well as scoring input and output prototype tables to define variables. Data tables are used for scoring, testing, and performance monitoring. Performance data can be created from your operational data, provided that it has the required structure (for example, the data contains a target variable).
You can also create multiple projects in a portfolio. Additional versions can then be created for all projects within the portfolio. Champion models for all projects within the portfolio can be monitored for performance, and published to the SAS Metadata Repository. SAS Factory Miner models can also be registered to the SAS Model Manager model repository. The SAS Factory Miner projects are managed as portfolios in SAS Model Manager. The project segments and models are available within a portfolio and can be managed from the Portfolios category within SAS Model Manager.
Any user who is registered in SAS Management Console can be assigned to a SAS Model Manager group, and can then work in SAS Model Manager. For more information, see “Configuring Users, Groups, and Roles” in SAS Model Manager: Administrator’s Guide.
Managing Preferences
About Setting PreferencesPreferences provide a way for you to customize the user interface. Preferences for each user are stored in metadata and are retained if your deployment is migrated or reconfigured.
You can set preferences in two ways:
by using the Preferences windowTo open the Preferences window, select File ð Preferences. There are two general categories of preferences: Global and Decision Manager preferences. See “Global Preferences” and “Decision Manager Preferences” on page 5 for more information.
by using SAS Preferences ManagerSAS Preferences Manager is a web application that provides a central facility for users to manage their preferences and settings. See “SAS Preferences Manager” on page 5 for more information.
4 Chapter 1 • Introduction to SAS Model Manager
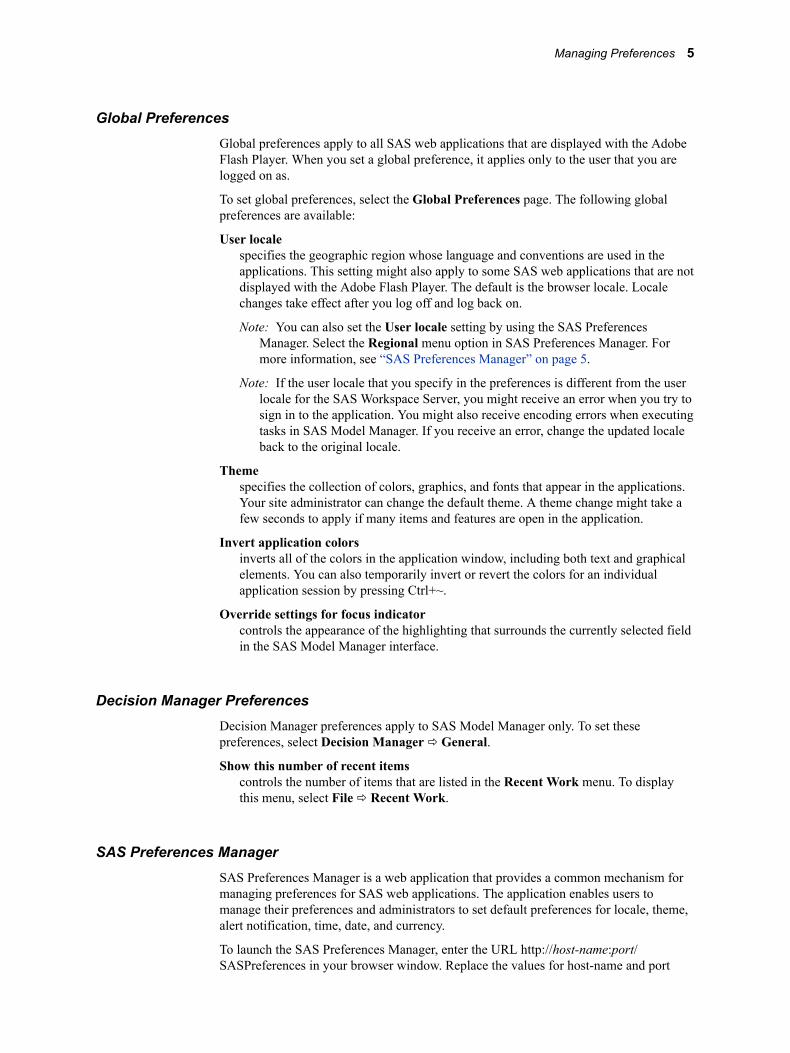
Global PreferencesGlobal preferences apply to all SAS web applications that are displayed with the Adobe Flash Player. When you set a global preference, it applies only to the user that you are logged on as.
To set global preferences, select the Global Preferences page. The following global preferences are available:
User localespecifies the geographic region whose language and conventions are used in the applications. This setting might also apply to some SAS web applications that are not displayed with the Adobe Flash Player. The default is the browser locale. Locale changes take effect after you log off and log back on.
Note: You can also set the User locale setting by using the SAS Preferences Manager. Select the Regional menu option in SAS Preferences Manager. For more information, see “SAS Preferences Manager” on page 5.
Note: If the user locale that you specify in the preferences is different from the user locale for the SAS Workspace Server, you might receive an error when you try to sign in to the application. You might also receive encoding errors when executing tasks in SAS Model Manager. If you receive an error, change the updated locale back to the original locale.
Themespecifies the collection of colors, graphics, and fonts that appear in the applications. Your site administrator can change the default theme. A theme change might take a few seconds to apply if many items and features are open in the application.
Invert application colorsinverts all of the colors in the application window, including both text and graphical elements. You can also temporarily invert or revert the colors for an individual application session by pressing Ctrl+~.
Override settings for focus indicatorcontrols the appearance of the highlighting that surrounds the currently selected field in the SAS Model Manager interface.
Decision Manager PreferencesDecision Manager preferences apply to SAS Model Manager only. To set these preferences, select Decision Manager ð General.
Show this number of recent itemscontrols the number of items that are listed in the Recent Work menu. To display this menu, select File ð Recent Work.
SAS Preferences ManagerSAS Preferences Manager is a web application that provides a common mechanism for managing preferences for SAS web applications. The application enables users to manage their preferences and administrators to set default preferences for locale, theme, alert notification, time, date, and currency.
To launch the SAS Preferences Manager, enter the URL http://host-name:port/SASPreferences in your browser window. Replace the values for host-name and port
Managing Preferences 5
based on the location of the configured SAS Web Infrastructure Platform. For more information, see “SAS Preferences Manager” in SAS Intelligence Platform: Middle-Tier Administration Guide.
Change the Delivery Type for Alert NotificationsThe default delivery type for notifications is specified in the properties for the SAS Application Infrastructure by using the Configuration Manager plug-in to SAS Management Console. For SAS 9.4, the default delivery type is My alerts portlet. You can use SAS Preferences Manager to change your default delivery type.
Note: A SAS administrator can modify the default notification type for all users. For information about modifying the default delivery type for all users, see “Configure Alert Notifications for SAS Workflow” in SAS Model Manager: Administrator’s Guide.
To specify the notification delivery preference for an individual user:
1. Enter the URL http://host-name:port/SASPreferences in your browser window to launch the SAS Preferences Manager. Replace the values for host-name and port based on the location of the configured SAS Web Infrastructure Platform.
2. Enter the user ID and password for the user account that you use to access SAS web applications.
3. Select General ð Notifications.
4. Select a format type for the e-mail notifications. The options are HTML-formatted e-mail and Plain-text e-mail.
5. Select the notification types from the Available list and click to add the selected notification types.
T I P To remove a notification type, select the type from the list and click .
6. Click Apply to update the notification settings, and click OK to save the changes.
For more information, see “SAS Preferences Manager” in SAS Intelligence Platform: Middle-Tier Administration Guide.
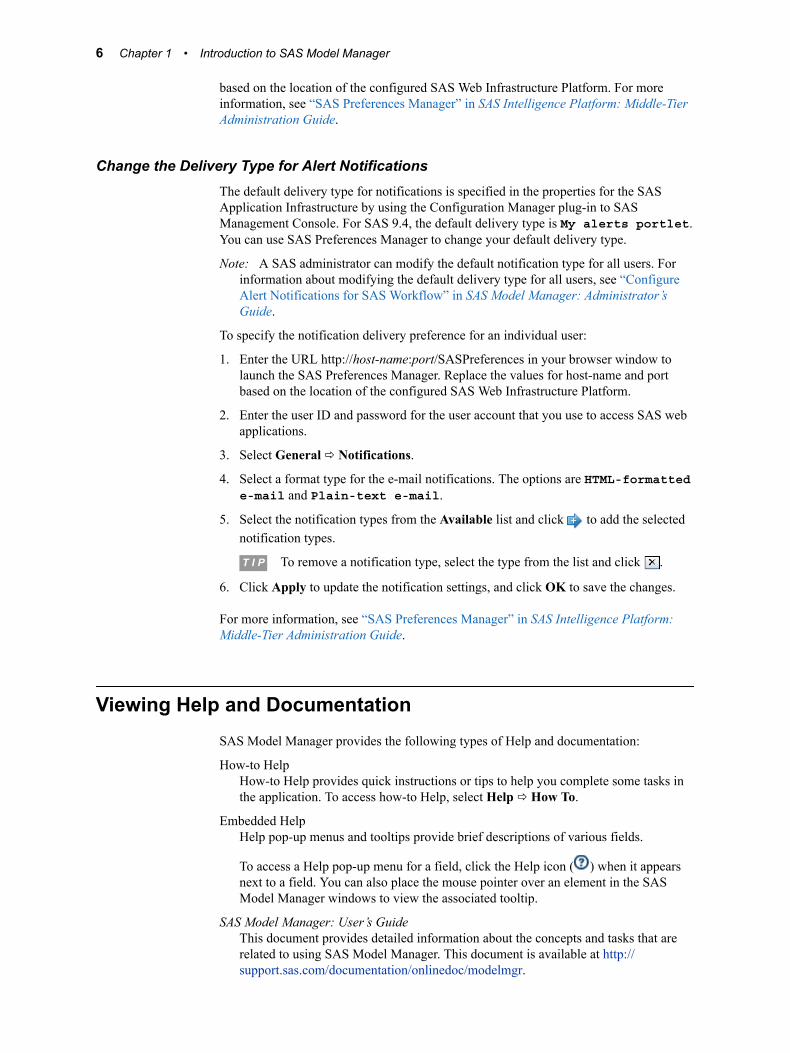
Viewing Help and DocumentationSAS Model Manager provides the following types of Help and documentation:
How-to HelpHow-to Help provides quick instructions or tips to help you complete some tasks in the application. To access how-to Help, select Help ð How To.
Embedded HelpHelp pop-up menus and tooltips provide brief descriptions of various fields.
To access a Help pop-up menu for a field, click the Help icon ( ) when it appears next to a field. You can also place the mouse pointer over an element in the SAS Model Manager windows to view the associated tooltip.
SAS Model Manager: User’s GuideThis document provides detailed information about the concepts and tasks that are related to using SAS Model Manager. This document is available at http://support.sas.com/documentation/onlinedoc/modelmgr.
6 Chapter 1 • Introduction to SAS Model Manager

SAS Model Manager: Administrator’s GuideThis document contains information about the administration tasks that are required to set up and configure the SAS Model Manager and is available at http://support.sas.com/documentation/onlinedoc/modelmgr.
Additional resources are available from the Help menu. To access these resources, select Help ð SAS on the Web.
Model Management ProcessThe following diagram illustrates the model management process:
Figure 1.1 The Model Management Process
Deliver or Publish Model
LockVersion
RegisterCandidate
Models
ValidateModel
DeclareChampion
orChallenger
Model
CreateModel
Repository
Compare Models
Retrain Models
MonitorModel
Performance
SAS Content Server
SAS Model Manager
RetireModel
Here is a summary of the model management process:
• Create Model Repository: create a secure model repository on the SAS Content Server where SAS code, input and output files, and metadata that is associated with a model can be stored.
Model Management Process 7

• Register Candidate Models: register input and output files, and then import and configure a model.
• Compare Models: perform scoring tests and create comparison reports for the models by using test data sources.
• Declare Champion or Challenger Model: declare the model as champion or challenger to use for testing and production phases of the workflow.
• Validate Model: perform scoring tests and create validation reports for the champion model and challenger models by using test data sources.
• Lock Version: lock a version when the champion model is approved for production.
• Deliver or Publish Model: publish a champion or challenger models to a SAS publish channel, to a database, or to the SAS Metadata Repository.
• Monitor Model Performance: provide comparative model performance benchmarking.
• Retrain Models: select models to retrain in response to data or market changes.
• Retire Model: retire a model from production.
Here is an example of the model management process for comparing a challenger model to the champion model to determine the best champion model:
1. Register candidate models in the version that is under development.
2. Create a Dynamic Lift report and compare the model to the champion model. Flag the model as a challenger based on the results of the Dynamic Lift report.
3. Perform scoring tests with the champion and challenger models in real time or in batch. This step can be performed outside SAS Model Manager.
4. Publish the challenger model to a database or to the SAS Metadata Repository.
5. Prepare performance data sources, which include both the actual outcome variable and predicted variable.
6. Create and execute the performance monitoring for the champion and challenger models to create reports to compare and validate the champion model and challenger models. One of the reports that is available for this comparison is the Champion and Challenger Performance report.
7. Set the challenger model as the project champion if the challenger is good enough to be promoted. Go to step 3, or consider building another model as a challenger with existing or a new input training data source.
8. Publish the new project champion model with or without a new challenger model.
8 Chapter 1 • Introduction to SAS Model Manager

High-Level Support Matrix by Model Score Code Type
Here is a high-level summary, arranged by model score code type, of the primary functions that are supported by SAS Model Manager.
Product or Tool
Model Score Code Type Importing Scoring Publishing
Performance Monitoring Reporting Retraining
Base SAS or other code editor
SAS program
Yes Yes No Yes Yes Yes
SAS Enterprise Miner
DATA step Yes Yes Yes Yes Yes Yes
PMML No No No No No No
Analytic store
Yes Yes Yes
Note: Only for Hadoop and Teradata.
Yes Yes No
Note: Applies only to SAS analytic store (SASAST) files. SAS package (SPK) files are not supported.
SAS Factory Miner
DATA step Yes Yes Yes Yes Yes No
Analytic store
Yes Yes Yes
Note: Only for Hadoop and Teradata.
Yes Yes No
SAS HPFOREST and HPSVM procedures
Analytic store
Yes Yes Yes
Note: Only for Hadoop and Teradata.
Yes Yes No
SAS/STAT linear model procedures
DATA step Yes Yes Yes Yes Yes Yes
PMML DATA step Yes Yes Yes
Note:DATA step score type only
Yes Yes No
PMML Yes No No No No No
R DATA step Yes Yes No Yes Yes Yes
High-Level Support Matrix by Model Score Code Type 9

Product or Tool
Model Score Code Type Importing Scoring Publishing
Performance Monitoring Reporting Retraining
SAS Visual Data Mining and Machine Learning modeling procedures
DATA step Yes Yes Yes Yes Yes No
Note: For more information, see Using SAS Viya Models with SAS Model Manager 14.2.
10 Chapter 1 • Introduction to SAS Model Manager

Chapter 2
Quick Start Tutorial
Overview of the Quick Start Tutorial . . . . . . . . . . . . . . . . . . . . . . . . . . . . . . . . . . . . . 11
Make the Tutorial Files Available . . . . . . . . . . . . . . . . . . . . . . . . . . . . . . . . . . . . . . . . 12About Making the Tutorial Files Available . . . . . . . . . . . . . . . . . . . . . . . . . . . . . . . 12Download the Tutorial Files . . . . . . . . . . . . . . . . . . . . . . . . . . . . . . . . . . . . . . . . . . . 12
Sign In . . . . . . . . . . . . . . . . . . . . . . . . . . . . . . . . . . . . . . . . . . . . . . . . . . . . . . . . . . . . . . 13
Define Data Sources . . . . . . . . . . . . . . . . . . . . . . . . . . . . . . . . . . . . . . . . . . . . . . . . . . . 14
Organize the Model Hierarchy . . . . . . . . . . . . . . . . . . . . . . . . . . . . . . . . . . . . . . . . . . 16Create Folders . . . . . . . . . . . . . . . . . . . . . . . . . . . . . . . . . . . . . . . . . . . . . . . . . . . . . . 16Create a Project . . . . . . . . . . . . . . . . . . . . . . . . . . . . . . . . . . . . . . . . . . . . . . . . . . . . . 17Import Project Variables . . . . . . . . . . . . . . . . . . . . . . . . . . . . . . . . . . . . . . . . . . . . . . 18Set the Project Properties . . . . . . . . . . . . . . . . . . . . . . . . . . . . . . . . . . . . . . . . . . . . . 19
Import Models . . . . . . . . . . . . . . . . . . . . . . . . . . . . . . . . . . . . . . . . . . . . . . . . . . . . . . . . 20Import a SAS Package File . . . . . . . . . . . . . . . . . . . . . . . . . . . . . . . . . . . . . . . . . . . . 20Map Model Variables to Project Variables . . . . . . . . . . . . . . . . . . . . . . . . . . . . . . . . 21
Create Model Comparison Reports . . . . . . . . . . . . . . . . . . . . . . . . . . . . . . . . . . . . . . 21Create a Model Profile Report . . . . . . . . . . . . . . . . . . . . . . . . . . . . . . . . . . . . . . . . . 21Create a Dynamic Lift Report . . . . . . . . . . . . . . . . . . . . . . . . . . . . . . . . . . . . . . . . . . 22
Create a Scoring Test . . . . . . . . . . . . . . . . . . . . . . . . . . . . . . . . . . . . . . . . . . . . . . . . . . 23
Set the Champion Model . . . . . . . . . . . . . . . . . . . . . . . . . . . . . . . . . . . . . . . . . . . . . . . 25
Monitor the Performance of a Champion Model . . . . . . . . . . . . . . . . . . . . . . . . . . . 25
Publish a Champion Model to the SAS Metadata Repository . . . . . . . . . . . . . . . . . 29
View and Search Model Inventory . . . . . . . . . . . . . . . . . . . . . . . . . . . . . . . . . . . . . . . 30
Overview of the Quick Start TutorialThis Quick Start tutorial is an introduction to some of the primary features of SAS Model Manager. The tutorial covers basic tasks that are related to model management within an enterprise computing environment. The tutorial also shows you how to validate the installation and configuration of SAS Model Manager at your site.
In this tutorial, you import models, set and publish a champion model, score models, and monitor model performance.
11
Note: In order to complete the tasks in this tutorial, your user ID must be a member of the Decision Manager Users group or must be granted equivalent permissions. Also, to complete the steps related to model management, your ID must be a member of either the Model Manager Advanced Users group or the Model Manager Administrator Users group. See “Configuring Users, Groups, and Roles” in SAS Model Manager: Administrator’s Guide for more information.
With the exception of Step 1, the steps in this tutorial are basic steps that are required to add content to the SAS Decision Manager database and model repository. In this tutorial, you complete the following steps:
1. Make the tutorial files available on the SAS Application Server.
Note: The QuickStartTutorial.zip file contains data and model files for several tutorials, including this one.
2. Sign in to SAS Model Manager.
3. Define the data source needed for the tutorial.
4. Define and create the components of the model hierarchy.
5. Import models.
6. Compare models using reports.
7. Set a champion model.
8. Create a scoring test and run model score code.
9. Monitor the performance of the champion model.
10. Publish the champion model to the SAS Metadata Repository.
Make the Tutorial Files Available
About Making the Tutorial Files AvailableThe tutorial is designed to use the SAS Metadata Repository. Before you use tables in the SAS Metadata Repository, the tutorial data sets and models must be on the SAS Application Server. An administrator who has Write access to the server and a valid SASApp user ID and password can put the tables there.
Some parts of this tutorial require files other than data sets and models, such as score code and templates. These files do not need to be registered in the SAS Metadata Repository. The drive where you extract the tutorial ZIP file must be accessible to the SAS Metadata Repository and to tutorial users. Tutorial users can also extract tutorial ZIP files to their local computers in order to access the other files.
You can define a data library and register the tables in the SAS Metadata Repository using the Data category view in SAS Model Manager.
Download the Tutorial FilesThe ZIP file QuickStartTutorial.zip contains the tutorial's data sets, models, and score code, and is available at http://support.sas.com/documentation/onlinedoc/modelmgr/. Before you begin the tutorial, extract the tutorial files to a computer that is accessible to the SAS Metadata Server and to SAS Model Manager users. If your SAS Metadata
12 Chapter 2 • Quick Start Tutorial
Server is separate from the SAS Application Server, the files must be placed on the SAS Application Server. Use WinZip to extract the files. If you are using a different extraction program, follow that program's instructions for extracting the files.
To download the files:
1. Create a folder on the server machine or a network drive to store the tutorial files. The instructions refer to this folder as <drive>.
Note: Users must have Read, Write, and Execute permissions to this folder and subfolders. You can create a group and add the tutorial users to that group to grant the permissions. For more information, see “Creating Operating System Accounts for Product Administrators and Users” in SAS Model Manager: Administrator’s Guide.
2. Save the QuickStartTutorial.zip to <drive>.
3. Open Windows Explorer to <drive>. Right-click QuickStartTutorial.zip and select Open. Click Open.
4. Click the arrow on the Unzip button to open the Unzip from WinZip File Folder window.
Note: If you are using a previous release of Windows, from the WinZip window, click the Extract button. The Extract dialog box appears.
5. Select <drive> from the Unzip to WinZip File Folder window.
Note: If you are using a previous release of Windows, in the Extract to box, select <drive> and click Extract.
You can find the data and models files for each tutorial in the respective tutorial folder (for example, <drive>\QuickStartTutorial\Data or <drive>\QuickStartTutorial\Models).
6. UNIX only: To complete the tutorial in a UNIX environment, locate the CPORT file. Files that you use to import the data sets into UNIX are located in the QuickStartTutorial.zip file. Instructions and the sample code for performing an import are provided in the Readme.txt file. In order for a transport file to be imported successfully, the encodings of the source and target SAS sessions must be compatible. Use either latin1 or UTF-8 for your SAS sessions. For more information, see “CIMPORT Problems: Importing Transport Files ” in Base SAS Procedures Guide.
Sign InTo sign in to SAS Model Manager:
1. In the address bar of your web browser, enter the URL for SAS Model Manager and press Enter. The Sign In page appears.
Note: Contact your system administrator if you need the URL for SAS Model Manager. The default URL is http://host_name:port/SASDecisionManager.
2. Enter a user ID and password. Your user ID might be case sensitive, depending on the operating system that is used to host the application server. Your password is case sensitive.
Note: To schedule jobs in a Windows environment, you must include the domain name when entering your user ID (for example, domain\myuserID).
Sign In 13
3. Click Sign In.
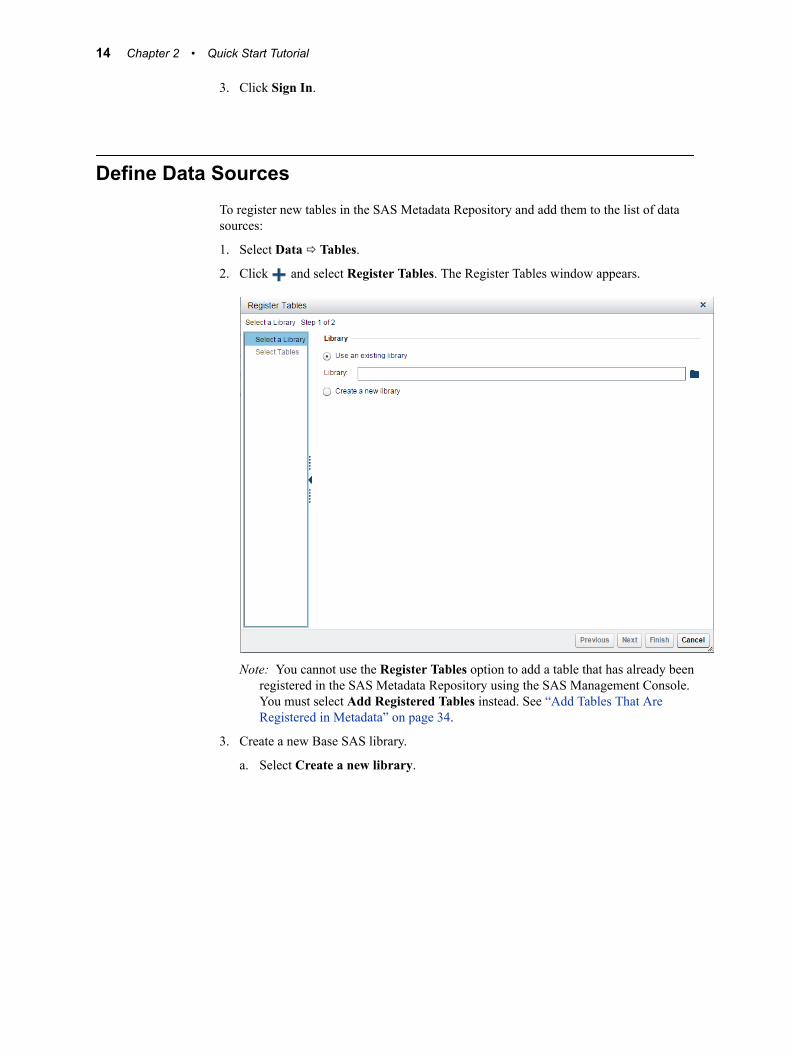
Define Data SourcesTo register new tables in the SAS Metadata Repository and add them to the list of data sources:
1. Select Data ð Tables.
2. Click and select Register Tables. The Register Tables window appears.
Note: You cannot use the Register Tables option to add a table that has already been registered in the SAS Metadata Repository using the SAS Management Console. You must select Add Registered Tables instead. See “Add Tables That Are Registered in Metadata” on page 34.
3. Create a new Base SAS library.
a. Select Create a new library.
14 Chapter 2 • Quick Start Tutorial

b. Specify QSTutorial for the name of the new library. The name cannot exceed 60 characters.
c. (Optional) Specify a description for the library.
d. Specify QSTut for the libref.
e. Specify the location for the new library. This location is the folder in the SAS Metadata Repository where the library is stored.
f. Select the server and the directory where the data tables for the quick start tutorial reside (for example, C:\QuickStartTutorial\Data).
g. Click Next.
Note: If you click Cancel at this point, a folder for the library is created in the SAS Metadata Repository, but the folder does not appear in the list of data tables.
4. Click to add all of the tables to the Selected tables list.
5. Click Finish. The new library is now available in the list of data tables.
Define Data Sources 15
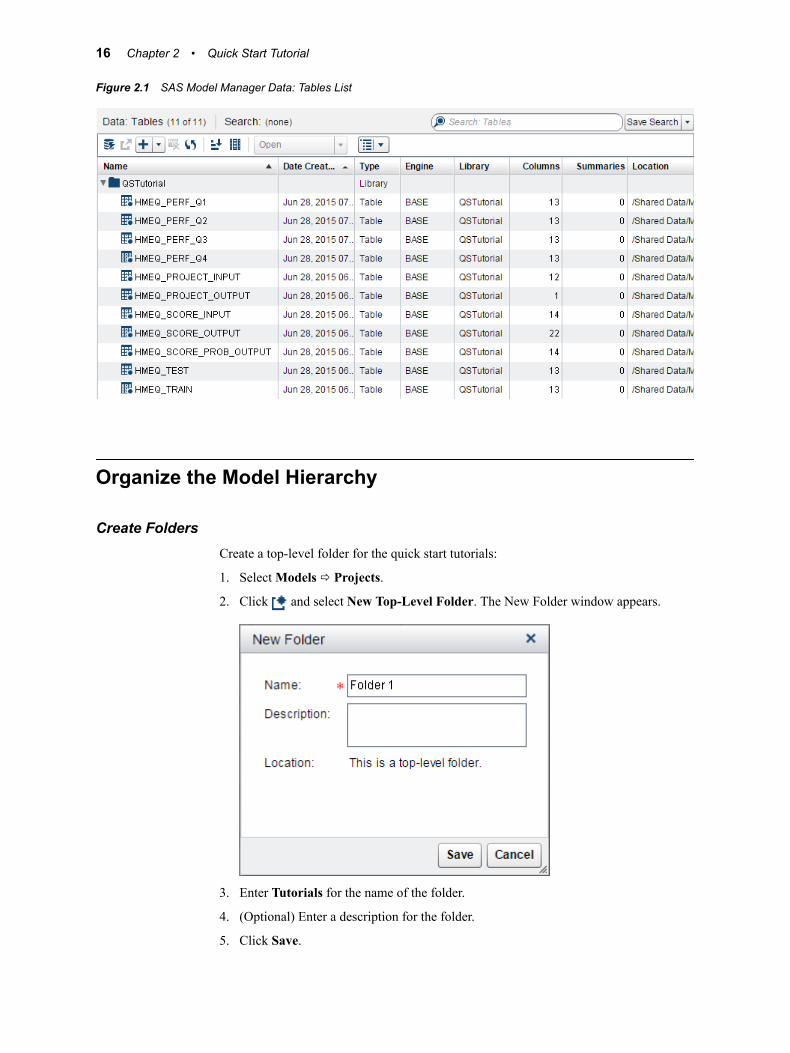
Figure 2.1 SAS Model Manager Data: Tables List
Organize the Model Hierarchy
Create FoldersCreate a top-level folder for the quick start tutorials:
1. Select Models ð Projects.
2. Click and select New Top-Level Folder. The New Folder window appears.
3. Enter Tutorials for the name of the folder.
4. (Optional) Enter a description for the folder.
5. Click Save.
16 Chapter 2 • Quick Start Tutorial

Because multiple users might want to perform the tasks in the tutorial, it is recommended that each user create their own folder in the Tutorials folder. To create a new folder:
1. Select Tutorials, click , and select New Folder. The New Folder window appears.
2. Enter a name for the folder, such as myUserID. The examples in this tutorial use the ID sasdemo.
3. (Optional) Enter a description for the folder.
4. Click Save.
See Also“Overview of Managing Folders” on page 41
Create a ProjectTo create a project:
1. Select a folder to store the new project (for example, myUserID).
2. Click and select New Project. The New Project window appears.
3. Enter HMEQ for the name of the project.
The initial version is displayed and reflects the level for sequential versions.
Organize the Model Hierarchy 17

4. Select Classification for the model function.
Note: The model function (Classification, Prediction, Segmentation, or Analytical) indicates the type of models that should be imported into the project.
5. Click Save.
See Also“Overview of Projects” on page 48
Import Project VariablesTo import project variables:
1. Select Variables ð Input and click . The Select Data Source window appears.
2. Select HMEQ_PROJECT_INPUT as the data source from the QSTutorial library. Click OK.
3. Select the Output tab and click .
4. Select the HMEQ_PROJECT_OUTPUT as the data source from the QSTutorial library and click OK.
5. Click to make the changes effective for other pages.
6. Click Yes in the warning message since you have not set a champion or challenger model yet.
18 Chapter 2 • Quick Start Tutorial
See Also“Import Variables” on page 56
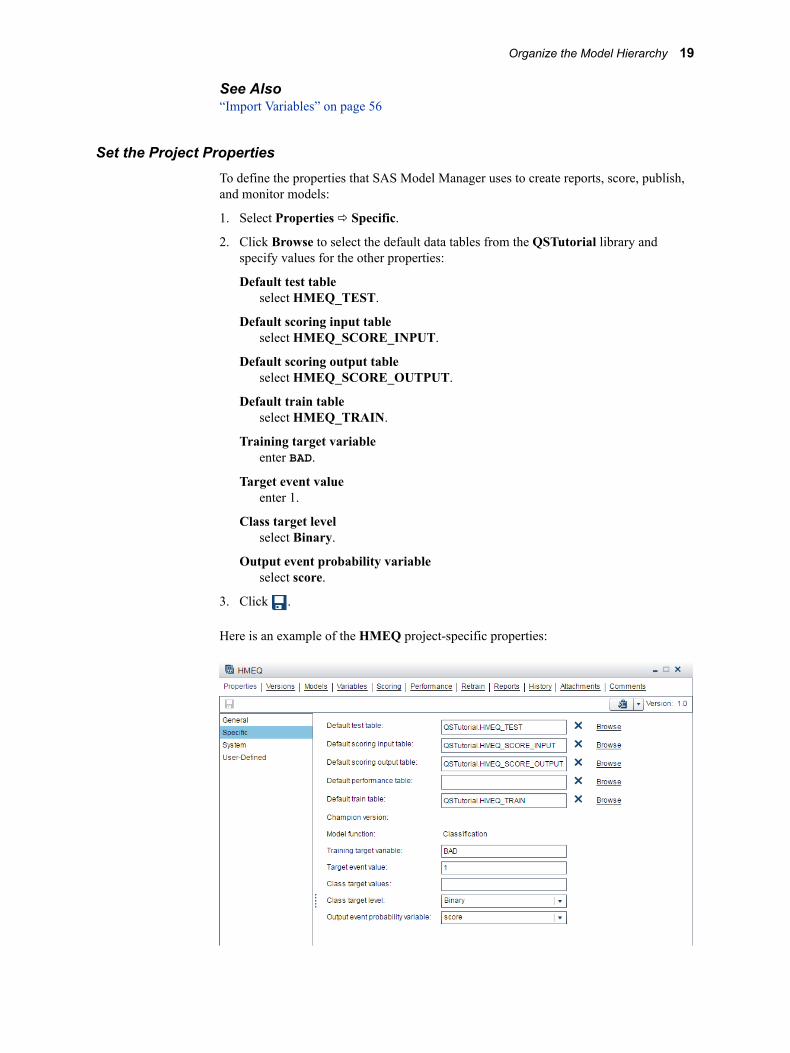
Set the Project PropertiesTo define the properties that SAS Model Manager uses to create reports, score, publish, and monitor models:
1. Select Properties ð Specific.
2. Click Browse to select the default data tables from the QSTutorial library and specify values for the other properties:
Default test tableselect HMEQ_TEST.
Default scoring input tableselect HMEQ_SCORE_INPUT.
Default scoring output tableselect HMEQ_SCORE_OUTPUT.
Default train tableselect HMEQ_TRAIN.
Training target variableenter BAD.
Target event valueenter 1.
Class target levelselect Binary.
Output event probability variableselect score.
3. Click .
Here is an example of the HMEQ project-specific properties:
Organize the Model Hierarchy 19
See Also“Project Properties” on page 51
Import Models
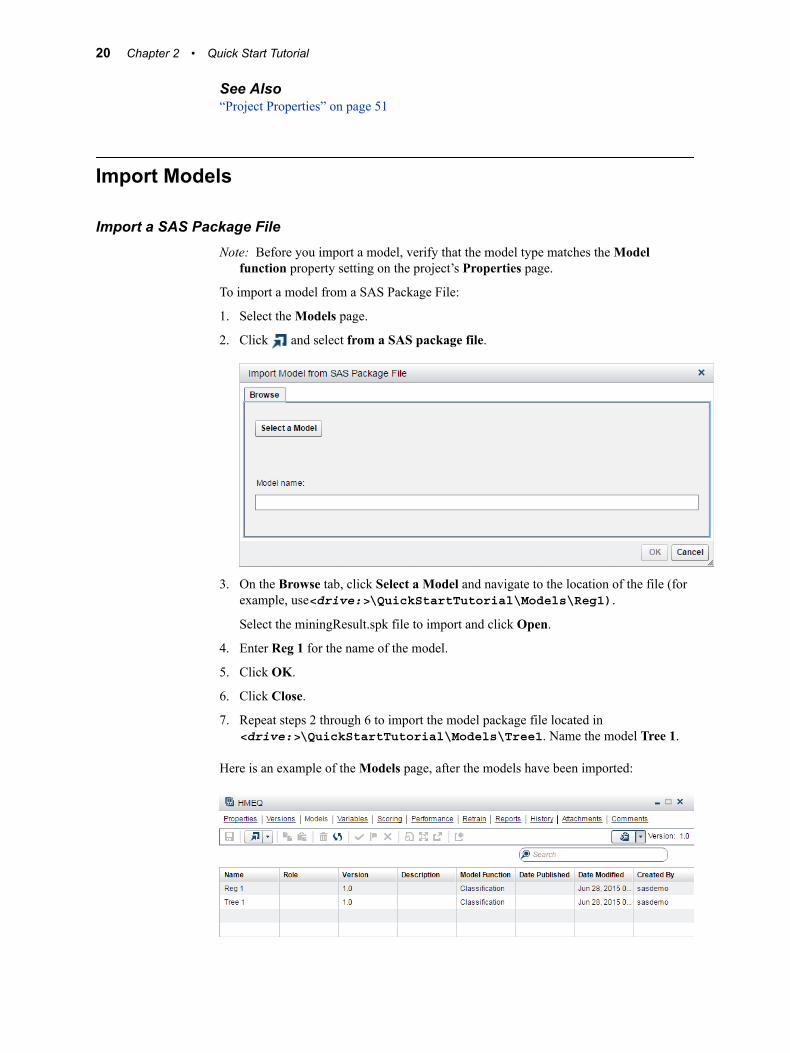
Import a SAS Package FileNote: Before you import a model, verify that the model type matches the Model
function property setting on the project’s Properties page.
To import a model from a SAS Package File:
1. Select the Models page.
2. Click and select from a SAS package file.
3. On the Browse tab, click Select a Model and navigate to the location of the file (for example, use<drive:>\QuickStartTutorial\Models\Reg1).
Select the miningResult.spk file to import and click Open.
4. Enter Reg 1 for the name of the model.
5. Click OK.
6. Click Close.
7. Repeat steps 2 through 6 to import the model package file located in <drive:>\QuickStartTutorial\Models\Tree1. Name the model Tree 1.
Here is an example of the Models page, after the models have been imported:
20 Chapter 2 • Quick Start Tutorial
See Also“Overview of Importing Models” on page 67
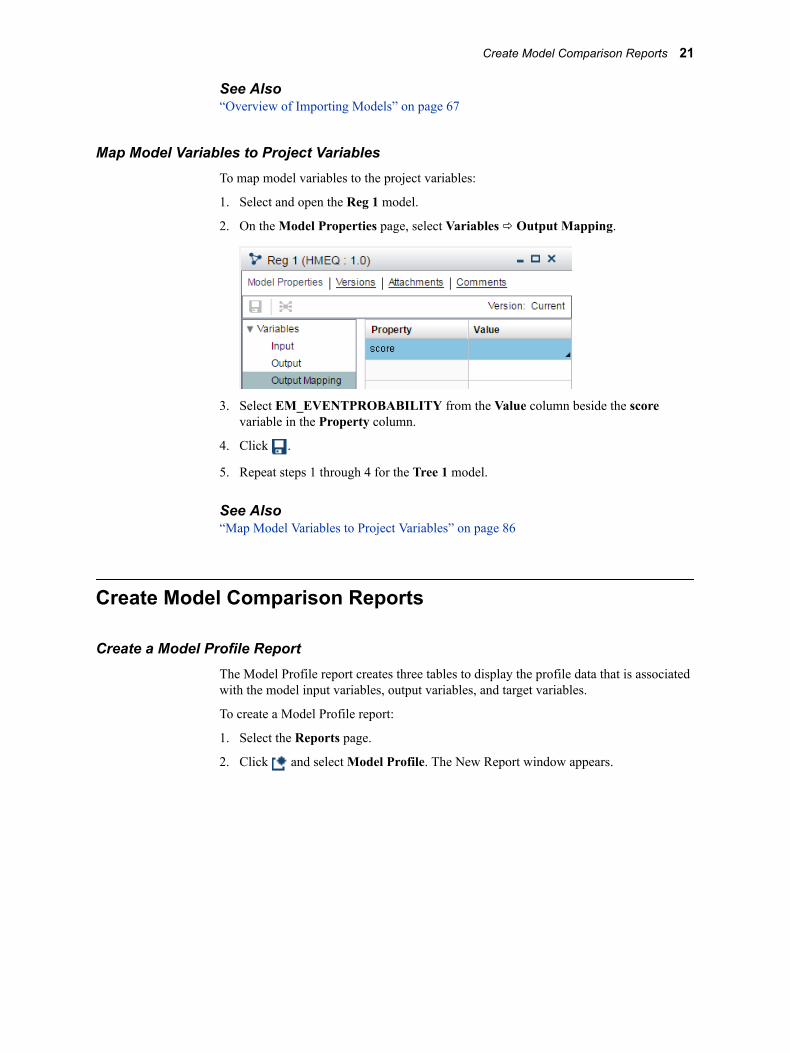
Map Model Variables to Project VariablesTo map model variables to the project variables:
1. Select and open the Reg 1 model.
2. On the Model Properties page, select Variables ð Output Mapping.
3. Select EM_EVENTPROBABILITY from the Value column beside the score variable in the Property column.
4. Click .
5. Repeat steps 1 through 4 for the Tree 1 model.
See Also“Map Model Variables to Project Variables” on page 86
Create Model Comparison Reports
Create a Model Profile ReportThe Model Profile report creates three tables to display the profile data that is associated with the model input variables, output variables, and target variables.
To create a Model Profile report:
1. Select the Reports page.
2. Click and select Model Profile. The New Report window appears.
Create Model Comparison Reports 21
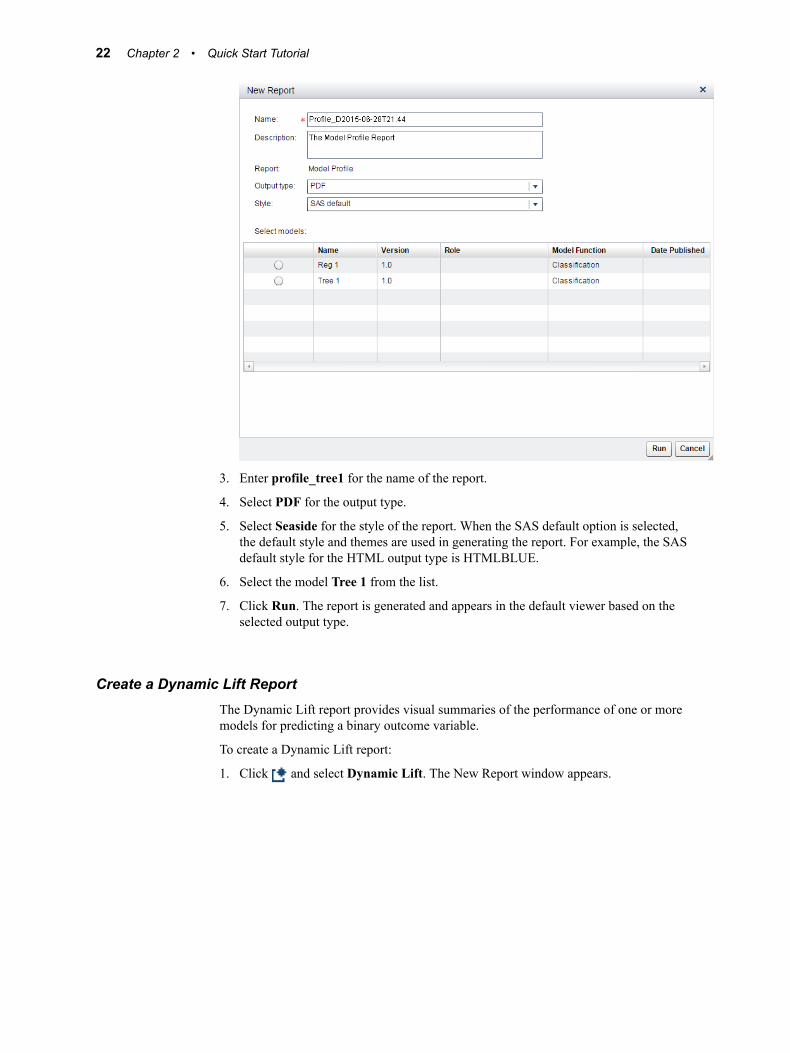
3. Enter profile_tree1 for the name of the report.
4. Select PDF for the output type.
5. Select Seaside for the style of the report. When the SAS default option is selected, the default style and themes are used in generating the report. For example, the SAS default style for the HTML output type is HTMLBLUE.
6. Select the model Tree 1 from the list.
7. Click Run. The report is generated and appears in the default viewer based on the selected output type.
Create a Dynamic Lift ReportThe Dynamic Lift report provides visual summaries of the performance of one or more models for predicting a binary outcome variable.
To create a Dynamic Lift report:
1. Click and select Dynamic Lift. The New Report window appears.
22 Chapter 2 • Quick Start Tutorial
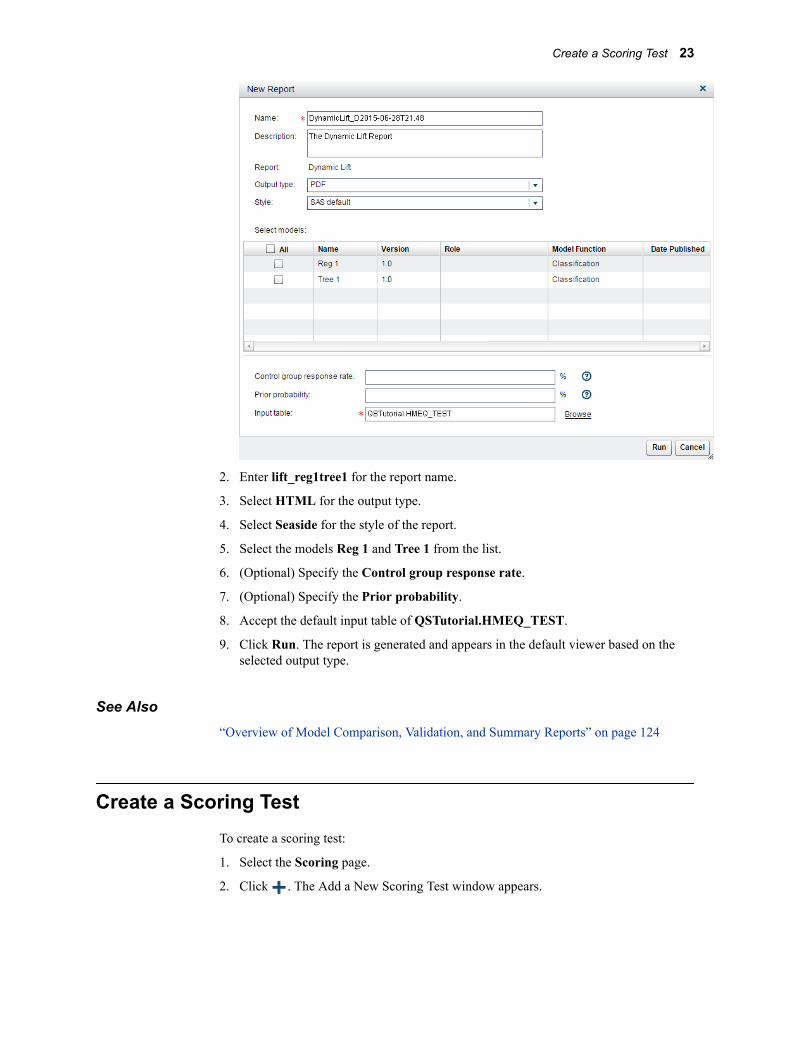
2. Enter lift_reg1tree1 for the report name.
3. Select HTML for the output type.
4. Select Seaside for the style of the report.
5. Select the models Reg 1 and Tree 1 from the list.
6. (Optional) Specify the Control group response rate.
7. (Optional) Specify the Prior probability.
8. Accept the default input table of QSTutorial.HMEQ_TEST.
9. Click Run. The report is generated and appears in the default viewer based on the selected output type.
See Also“Overview of Model Comparison, Validation, and Summary Reports” on page 124
Create a Scoring TestTo create a scoring test:
1. Select the Scoring page.
2. Click . The Add a New Scoring Test window appears.
Create a Scoring Test 23
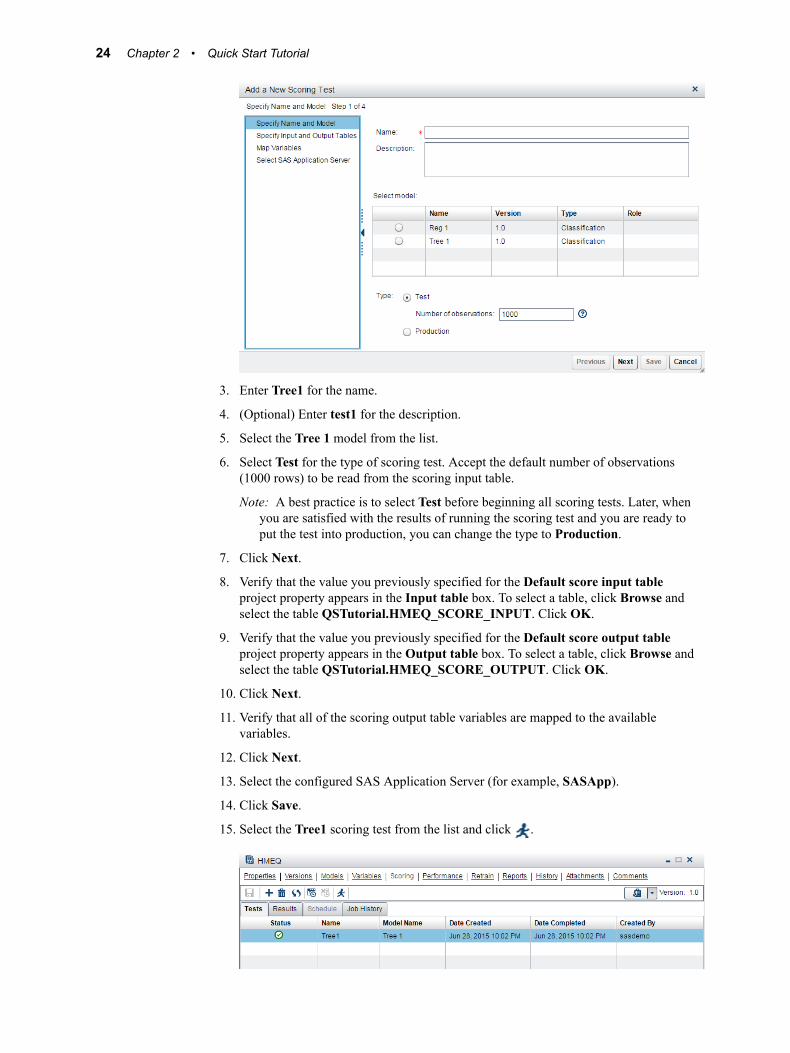
3. Enter Tree1 for the name.
4. (Optional) Enter test1 for the description.
5. Select the Tree 1 model from the list.
6. Select Test for the type of scoring test. Accept the default number of observations (1000 rows) to be read from the scoring input table.
Note: A best practice is to select Test before beginning all scoring tests. Later, when you are satisfied with the results of running the scoring test and you are ready to put the test into production, you can change the type to Production.
7. Click Next.
8. Verify that the value you previously specified for the Default score input table project property appears in the Input table box. To select a table, click Browse and select the table QSTutorial.HMEQ_SCORE_INPUT. Click OK.
9. Verify that the value you previously specified for the Default score output table project property appears in the Output table box. To select a table, click Browse and select the table QSTutorial.HMEQ_SCORE_OUTPUT. Click OK.
10. Click Next.
11. Verify that all of the scoring output table variables are mapped to the available variables.
12. Click Next.
13. Select the configured SAS Application Server (for example, SASApp).
14. Click Save.
15. Select the Tree1 scoring test from the list and click .
24 Chapter 2 • Quick Start Tutorial
16. Click the Results tab or double-click the scoring test to view the scoring test results. When the job has completed without errors, a appears in the Status column.
Note: You can check the status of a job by clicking in the Job History tab. A new record appears after the job has completed.
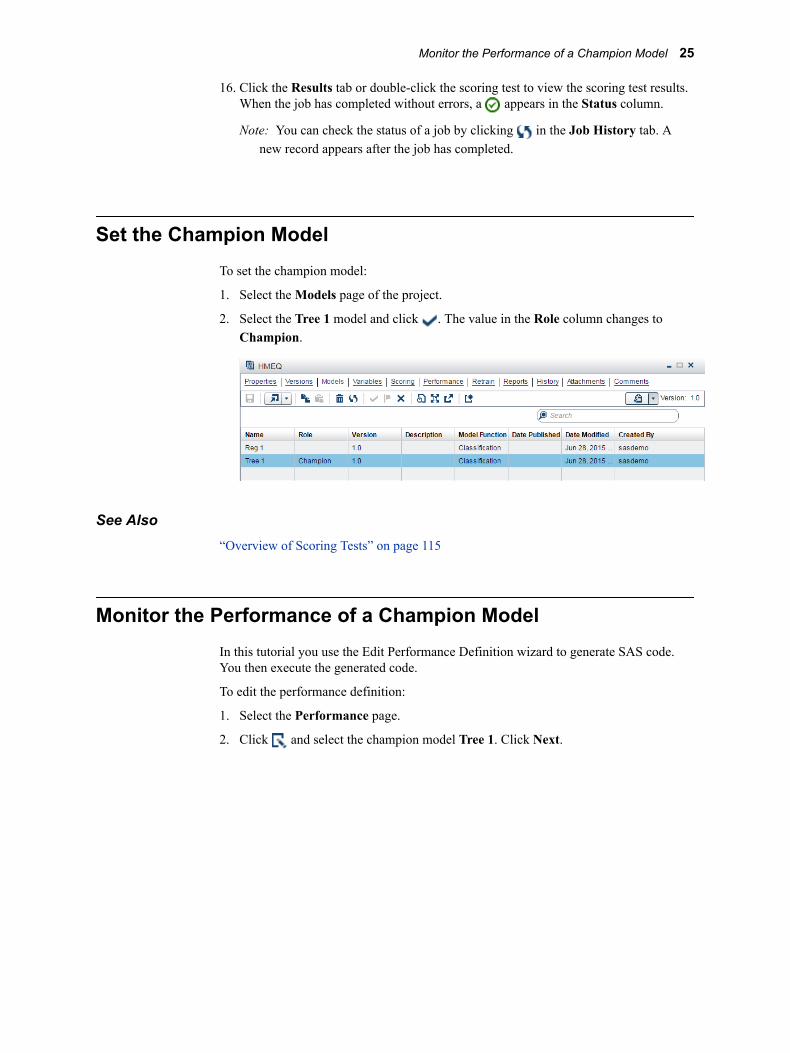
Set the Champion ModelTo set the champion model:
1. Select the Models page of the project.
2. Select the Tree 1 model and click . The value in the Role column changes to Champion.
See Also“Overview of Scoring Tests” on page 115
Monitor the Performance of a Champion ModelIn this tutorial you use the Edit Performance Definition wizard to generate SAS code. You then execute the generated code.
To edit the performance definition:
1. Select the Performance page.
2. Click and select the champion model Tree 1. Click Next.
Monitor the Performance of a Champion Model 25
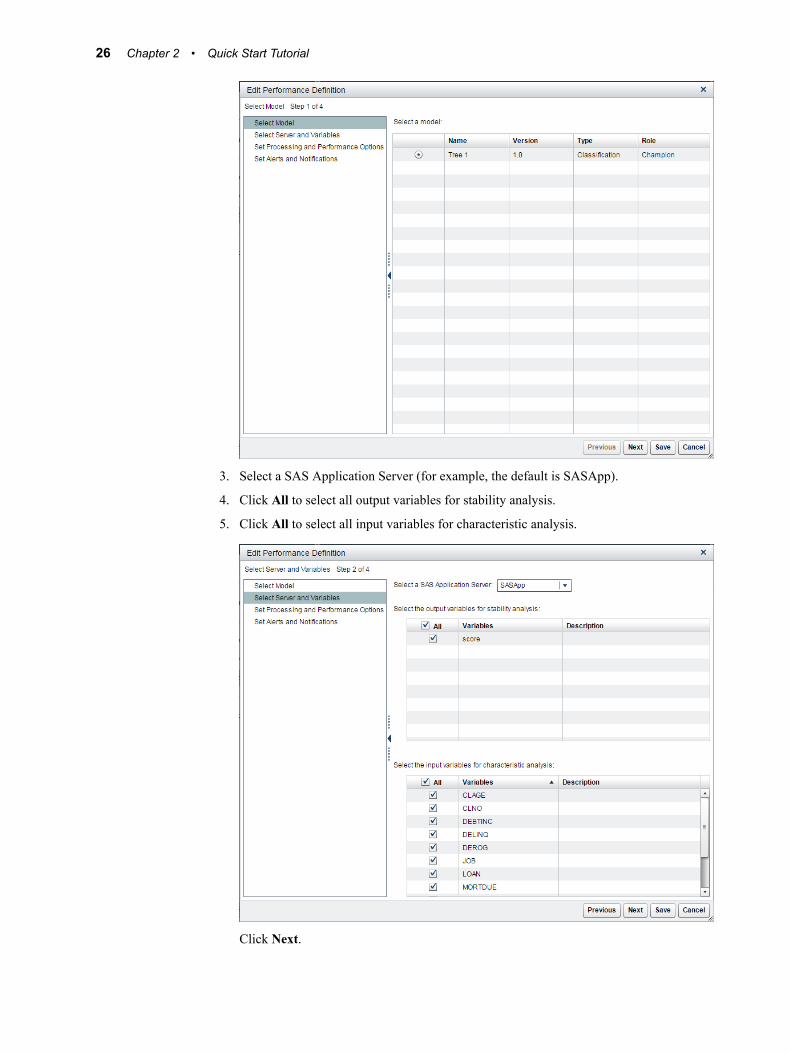
3. Select a SAS Application Server (for example, the default is SASApp).
4. Click All to select all output variables for stability analysis.
5. Click All to select all input variables for characteristic analysis.
Click Next.
26 Chapter 2 • Quick Start Tutorial

6. Select Standard configuration as the data processing method and select Run model score code to run the score code in the performance monitor job.
7. Specify the data source information.
a. Select Static data sources.
b. Click .
Note: The data table whose collection date is the earliest is set as the baseline performance data table.
c. Click the empty cell in the Data Source column.
d. Click Browse and select the HMEQ_PERF_Q1 performance data source from the QSTutorial library. Click OK.
e. Click the empty cell in the Collection Date column and click . Select the date of March 31, 2014. The date can be any date in the time period when the performance data was collected.
f. Enter the label Q1 in the Report Label column. The report label represents the time point of the performance data source. Because the report label appears in the performance charts, use a label that has not been used for another time period, is short, and is understandable.
Note: If you duplicate report labels, the results in the previous performance results are overwritten.
g. (Optional) Select a data source and click to verify that the selected input variables and target variable are included in the performance data source.
h. (Optional) Repeat the above steps to add the following performance data sources from the QSTutorial library to the performance definition.
Data Source Collection Date Report Label
HMEQ_PERF_Q2 June 30, 2014 Q2
HMEQ_PERF_Q3 September 30, 2014 Q3
HMEQ_PERF_Q4 December 31, 2014 Q4
Monitor the Performance of a Champion Model 27
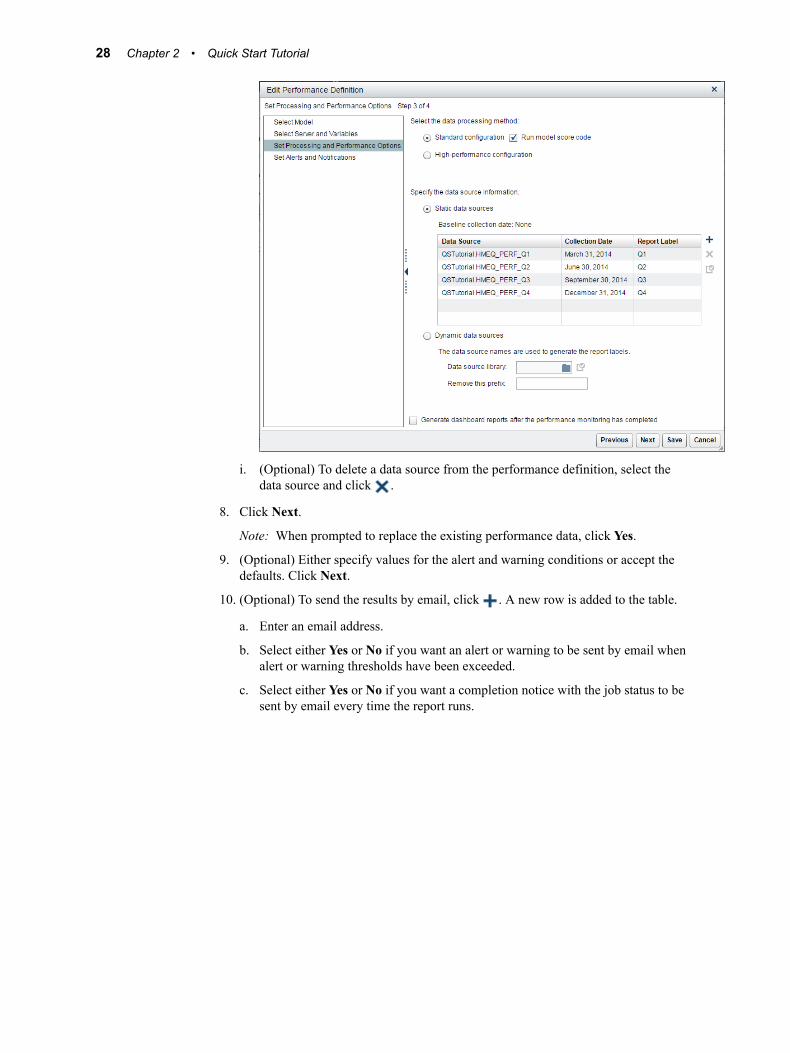
i. (Optional) To delete a data source from the performance definition, select the data source and click .
8. Click Next.
Note: When prompted to replace the existing performance data, click Yes.
9. (Optional) Either specify values for the alert and warning conditions or accept the defaults. Click Next.
10. (Optional) To send the results by email, click . A new row is added to the table.
a. Enter an email address.
b. Select either Yes or No if you want an alert or warning to be sent by email when alert or warning thresholds have been exceeded.
c. Select either Yes or No if you want a completion notice with the job status to be sent by email every time the report runs.
28 Chapter 2 • Quick Start Tutorial

11. Click Save.
12. Click .
13. After the performance monitoring has been completed, a confirmation message appears. Click Close.
14. Click the Results tab to view the performance results.
Note: You can check the status of a job by clicking in the Job History tab. A new record appears after the job has completed.
See Also“Edit and Execute a Performance Definition” on page 181
Publish a Champion Model to the SAS Metadata Repository
To publish a model to the SAS Metadata Repository:
1. Select the Models page.
2. Select the champion model Tree 1 and click .
Note: Alternatively, you can select a project from the Projects category view and click .
3. To specify a new publish name, click in the Publish Name column for a selected model.
Publish a Champion Model to the SAS Metadata Repository 29
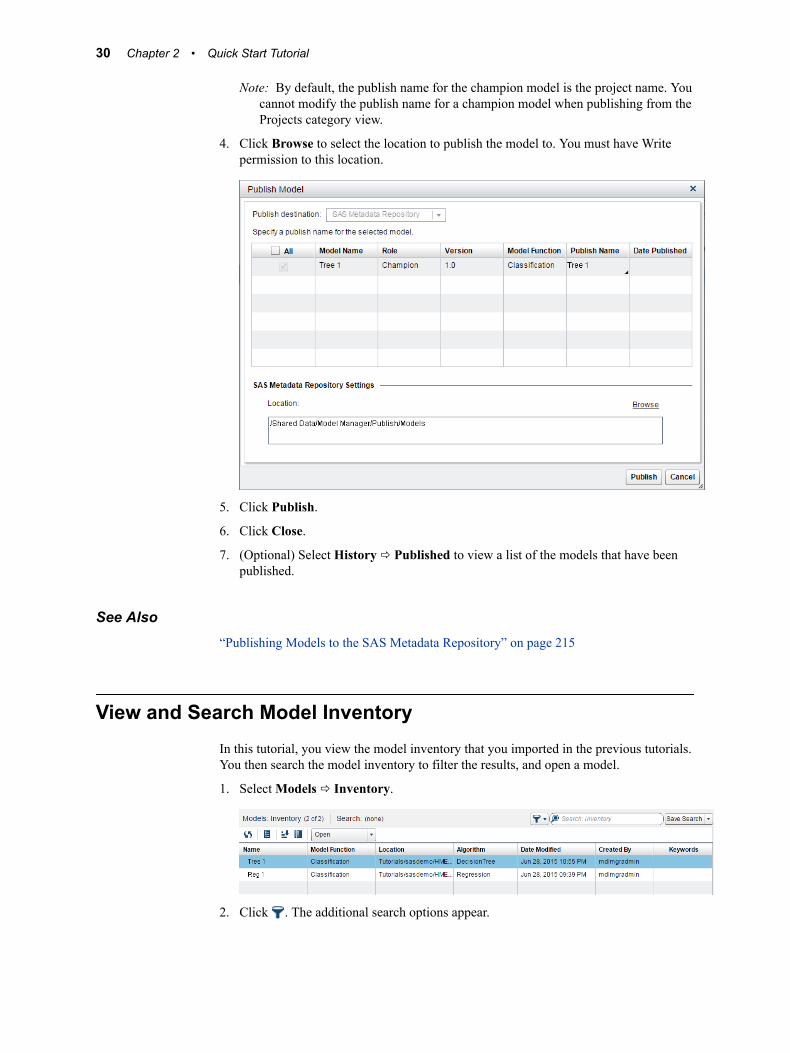
Note: By default, the publish name for the champion model is the project name. You cannot modify the publish name for a champion model when publishing from the Projects category view.
4. Click Browse to select the location to publish the model to. You must have Write permission to this location.
5. Click Publish.
6. Click Close.
7. (Optional) Select History ð Published to view a list of the models that have been published.
See Also“Publishing Models to the SAS Metadata Repository” on page 215
View and Search Model InventoryIn this tutorial, you view the model inventory that you imported in the previous tutorials. You then search the model inventory to filter the results, and open a model.
1. Select Models ð Inventory.
2. Click . The additional search options appear.
30 Chapter 2 • Quick Start Tutorial
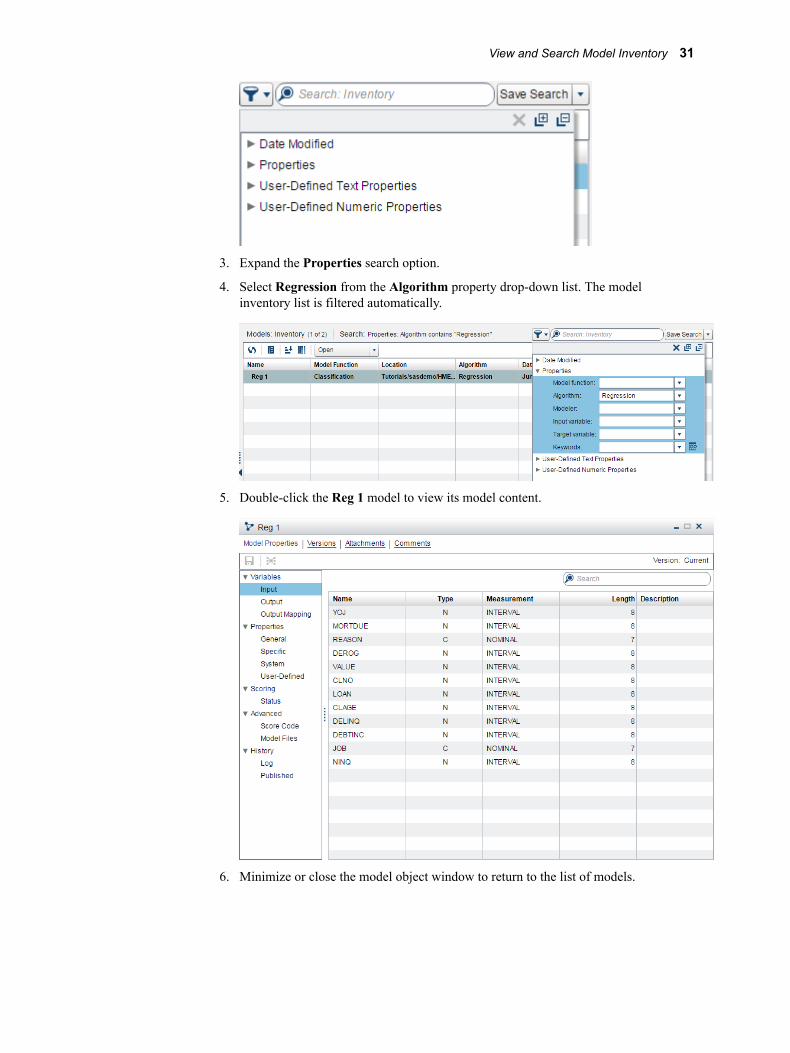
3. Expand the Properties search option.
4. Select Regression from the Algorithm property drop-down list. The model inventory list is filtered automatically.
5. Double-click the Reg 1 model to view its model content.
6. Minimize or close the model object window to return to the list of models.
View and Search Model Inventory 31

32 Chapter 2 • Quick Start Tutorial

Chapter 3
Managing Data Tables
About Managing Data Tables . . . . . . . . . . . . . . . . . . . . . . . . . . . . . . . . . . . . . . . . . . . 33
Adding Tables Using SAS Visual Data Builder . . . . . . . . . . . . . . . . . . . . . . . . . . . . . 34
Add Tables That Are Registered in Metadata . . . . . . . . . . . . . . . . . . . . . . . . . . . . . . 34
Register and Add New Tables . . . . . . . . . . . . . . . . . . . . . . . . . . . . . . . . . . . . . . . . . . . 35
Edit Table Properties and View Table Metadata . . . . . . . . . . . . . . . . . . . . . . . . . . . . 35
View Table Data . . . . . . . . . . . . . . . . . . . . . . . . . . . . . . . . . . . . . . . . . . . . . . . . . . . . . . 36
Filter Data in the Table View . . . . . . . . . . . . . . . . . . . . . . . . . . . . . . . . . . . . . . . . . . . . 37
Create a Table Summary . . . . . . . . . . . . . . . . . . . . . . . . . . . . . . . . . . . . . . . . . . . . . . . 38
Delete a Table Summary . . . . . . . . . . . . . . . . . . . . . . . . . . . . . . . . . . . . . . . . . . . . . . . 39
Add Attachments to a Table . . . . . . . . . . . . . . . . . . . . . . . . . . . . . . . . . . . . . . . . . . . . 40
Add Comments to a Table . . . . . . . . . . . . . . . . . . . . . . . . . . . . . . . . . . . . . . . . . . . . . . 40
Remove a Table . . . . . . . . . . . . . . . . . . . . . . . . . . . . . . . . . . . . . . . . . . . . . . . . . . . . . . . 40
About Managing Data TablesThe Data category enables you to manage your list of data tables from within SAS Model Manager. You can create new Base SAS libraries, add and remove tables, view table data and metadata, create and delete table summaries, and associate attachments and comments with tables. The application uses these data tables whenever it needs to access data, such as for testing, scoring, retraining, and performance monitoring of models.
You can view the list of tables by selecting Data ð Tables. There are three ways to add tables to the list.
• You can use SAS Visual Data Builder to create new tables and add them to the list. See “Adding Tables Using SAS Visual Data Builder” on page 34 for more information.
• If the table is already registered in the SAS Metadata Repository, you can add the table to the list as described in “Add Tables That Are Registered in Metadata” on page 34.
33

• If the table is not already registered in the SAS Metadata Repository, you can add a new table as described in “Register and Add New Tables” on page 35.
Note:
• SAS Model Manager cannot access tables in a SAS LASR Analytic Server instance.
• If you do not have the appropriate permissions to access a folder, then the tables and libraries are not listed in the Data category view.
• You can view tables with double-byte characters (DBCS) in the table name or in variable names, and you can use them to create summary tables. You can use them in models, model projects, and model portfolios, as well as their associated tasks. To use these tables, support for DBCS characters must be enabled as described in “Extend Support for Double-Byte Characters in Table and Variable Names” in SAS Model Manager: Administrator’s Guide.
• Special characters and blanks are not supported in table names or in variable names.
Adding Tables Using SAS Visual Data BuilderSAS Visual Data Builder enables analysts and data administrators to perform data preparation for analytics. You can design queries to perform joins, add calculated columns, and subset and sort data. Several productivity features speed the creation of columns based on common aggregation functions.
Once you design your queries, you can reuse them as subqueries for more sophisticated queries, export them as jobs for scheduling, or schedule them directly from the user interface.
The application has data import features that enable you to access data from spreadsheets, delimited files, and SAS data sets. Once you import the data, you can prepare it for analysis or join it with existing data.
The application provides a series of features that you can use to extract and transform data from multiple sources and create new data tables.
To access SAS Visual Data Builder, select Data ð Tables. Click to start SAS Visual Data Builder. For more information about SAS Visual Data Builder, click to access SAS Visual Analytics: User’s Guide and videos about using SAS Visual Data Builder.
Add Tables That Are Registered in MetadataIf a data table has already been registered in the SAS Metadata Repository, you can add it to the list of data sources. To add one or more tables:
1. Select Data ð Tables.
2. Click and select Add Registered Tables. The Choose an Item window appears.
3. Select the tables that you want to add, and click OK.
34 Chapter 3 • Managing Data Tables
Register and Add New TablesYou can create new Base SAS libraries and register tables by using SAS Model Manager. To register new tables in the SAS Metadata Repository and add them to the list of data sources:
1. Select Data ð Tables.
2. Click and select Register Tables. The Register Tables window appears.
Note: You cannot use the Register Tables option to add a table that is already registered. You must select Add Registered Tables instead. See “Add Tables That Are Registered in Metadata” on page 34.
3. Select an existing library, or create a new Base SAS library.
To use an existing library:
a. Select Use an existing library.
b. Click and select the library.
c. Click Next.
To create a new Base SAS library:
a. Select Create a new library.
b. Specify a name for the new library. The name cannot exceed 60 characters.
c. (Optional) Specify a description for the library.
d. Specify a libref. A libref is a name that SAS uses to refer to the library. Enter a unique name of eight characters or less.
e. Select the location for the new library. This location is the folder in the SAS Metadata Repository where the library is stored.
f. Select the server and the directory where the data tables reside.
g. Click Next.
Note: If you click Cancel at this point, a folder for the library is created in the SAS Metadata Repository, but the folder does not appear in the list of data tables.
4. Select the tables that you want to add to the library, and click to add the tables to the Selected tables list. Click to add all of the tables to the Selected tables list.
5. Click Finish.
Edit Table Properties and View Table MetadataThe Properties page displays table metadata. On this page, you can edit the data source name and description, and change the table associated with the data source name.
1. Select Data ð Tables.
Edit Table Properties and View Table Metadata 35
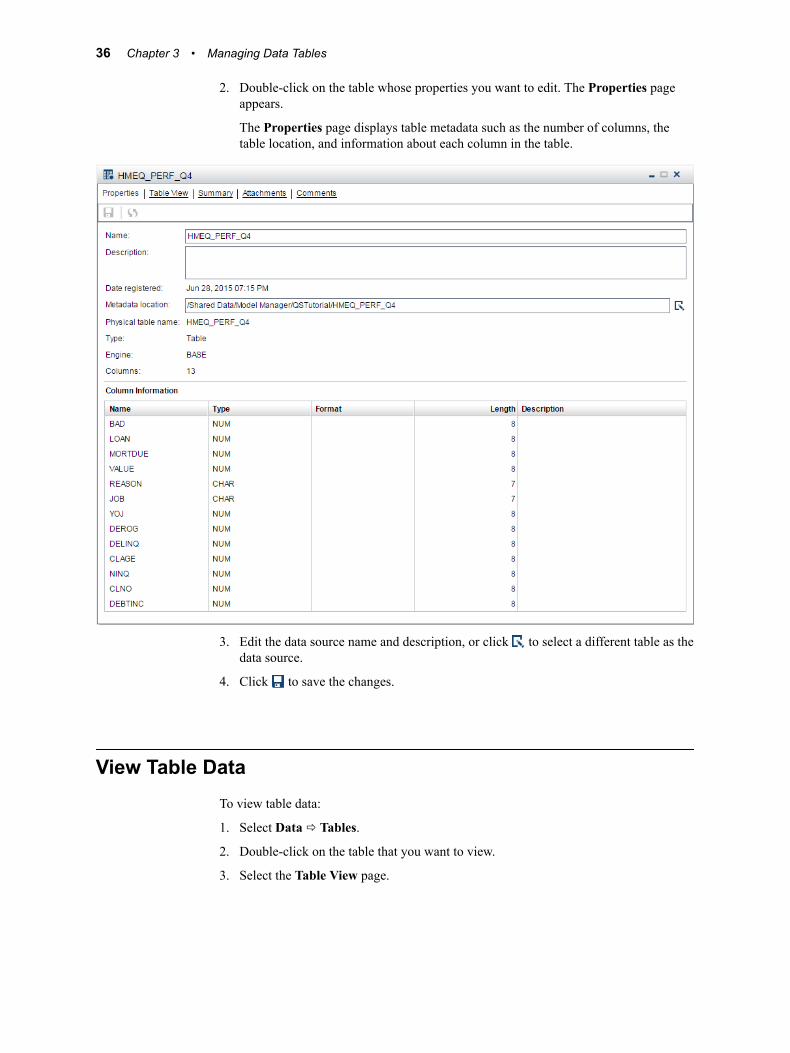
2. Double-click on the table whose properties you want to edit. The Properties page appears.
The Properties page displays table metadata such as the number of columns, the table location, and information about each column in the table.
3. Edit the data source name and description, or click to select a different table as the data source.
4. Click to save the changes.
View Table DataTo view table data:
1. Select Data ð Tables.
2. Double-click on the table that you want to view.
3. Select the Table View page.
36 Chapter 3 • Managing Data Tables
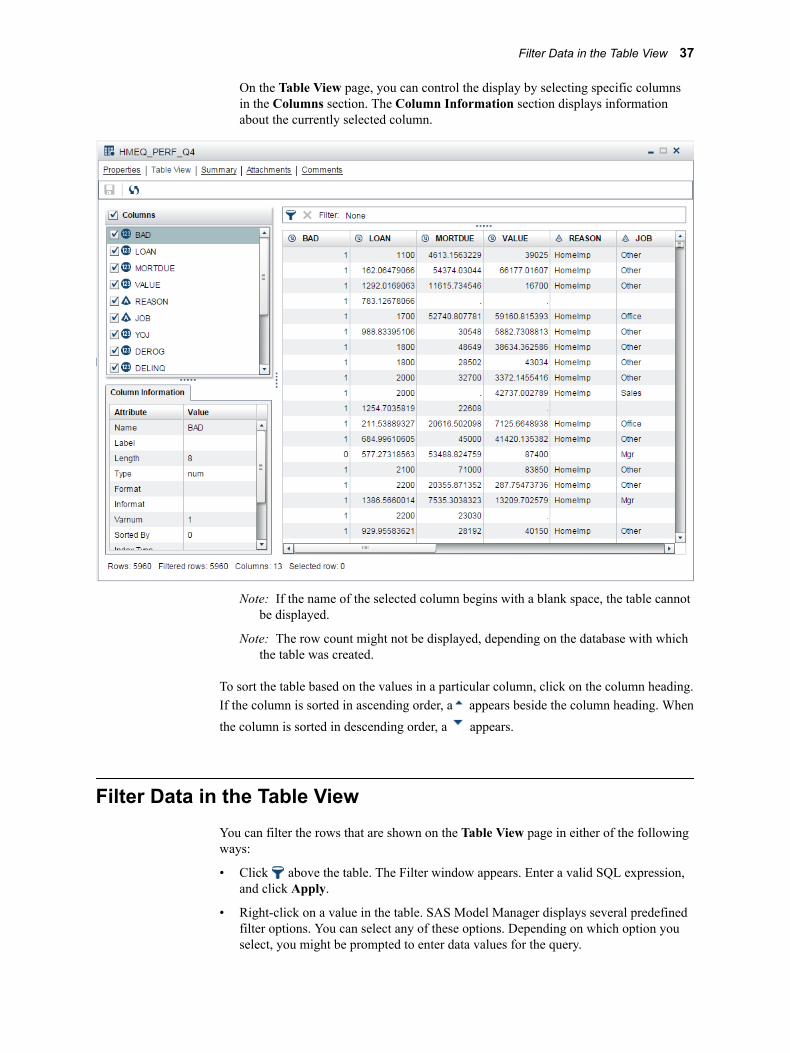
On the Table View page, you can control the display by selecting specific columns in the Columns section. The Column Information section displays information about the currently selected column.
Note: If the name of the selected column begins with a blank space, the table cannot be displayed.
Note: The row count might not be displayed, depending on the database with which the table was created.
To sort the table based on the values in a particular column, click on the column heading. If the column is sorted in ascending order, a appears beside the column heading. When the column is sorted in descending order, a appears.
Filter Data in the Table ViewYou can filter the rows that are shown on the Table View page in either of the following ways:
• Click above the table. The Filter window appears. Enter a valid SQL expression, and click Apply.
• Right-click on a value in the table. SAS Model Manager displays several predefined filter options. You can select any of these options. Depending on which option you select, you might be prompted to enter data values for the query.
Filter Data in the Table View 37
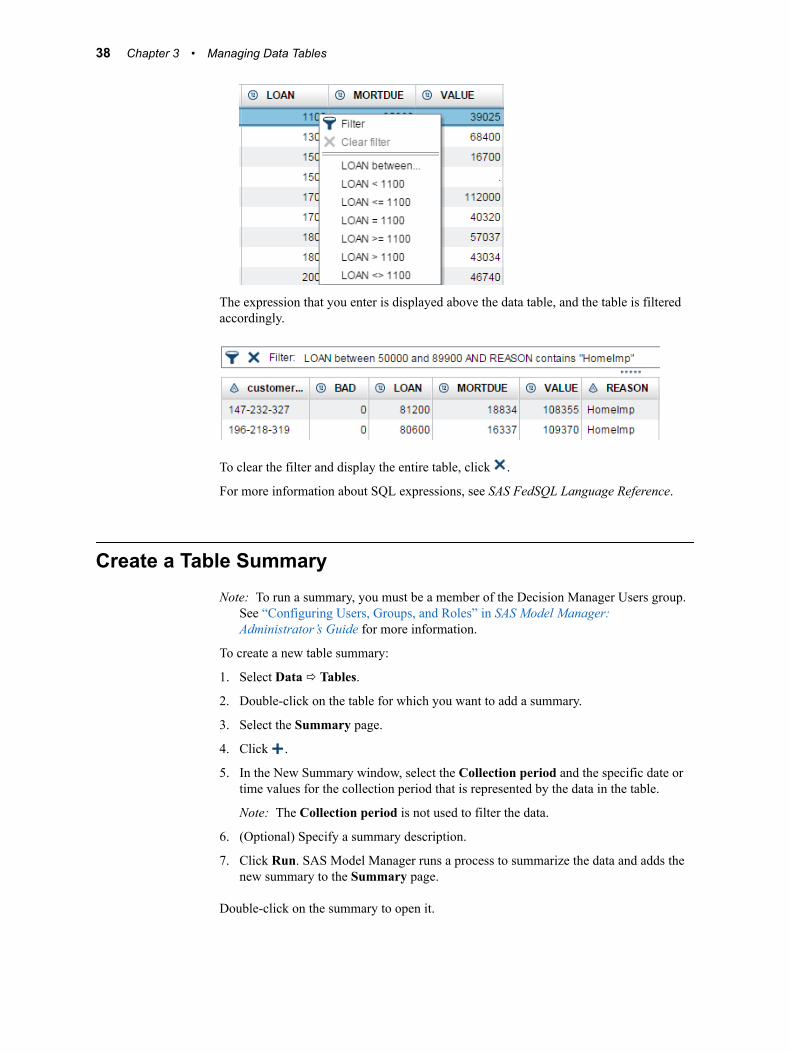
The expression that you enter is displayed above the data table, and the table is filtered accordingly.
To clear the filter and display the entire table, click .
For more information about SQL expressions, see SAS FedSQL Language Reference.
Create a Table SummaryNote: To run a summary, you must be a member of the Decision Manager Users group.
See “Configuring Users, Groups, and Roles” in SAS Model Manager: Administrator’s Guide for more information.
To create a new table summary:
1. Select Data ð Tables.
2. Double-click on the table for which you want to add a summary.
3. Select the Summary page.
4. Click .
5. In the New Summary window, select the Collection period and the specific date or time values for the collection period that is represented by the data in the table.
Note: The Collection period is not used to filter the data.
6. (Optional) Specify a summary description.
7. Click Run. SAS Model Manager runs a process to summarize the data and adds the new summary to the Summary page.
Double-click on the summary to open it.
38 Chapter 3 • Managing Data Tables
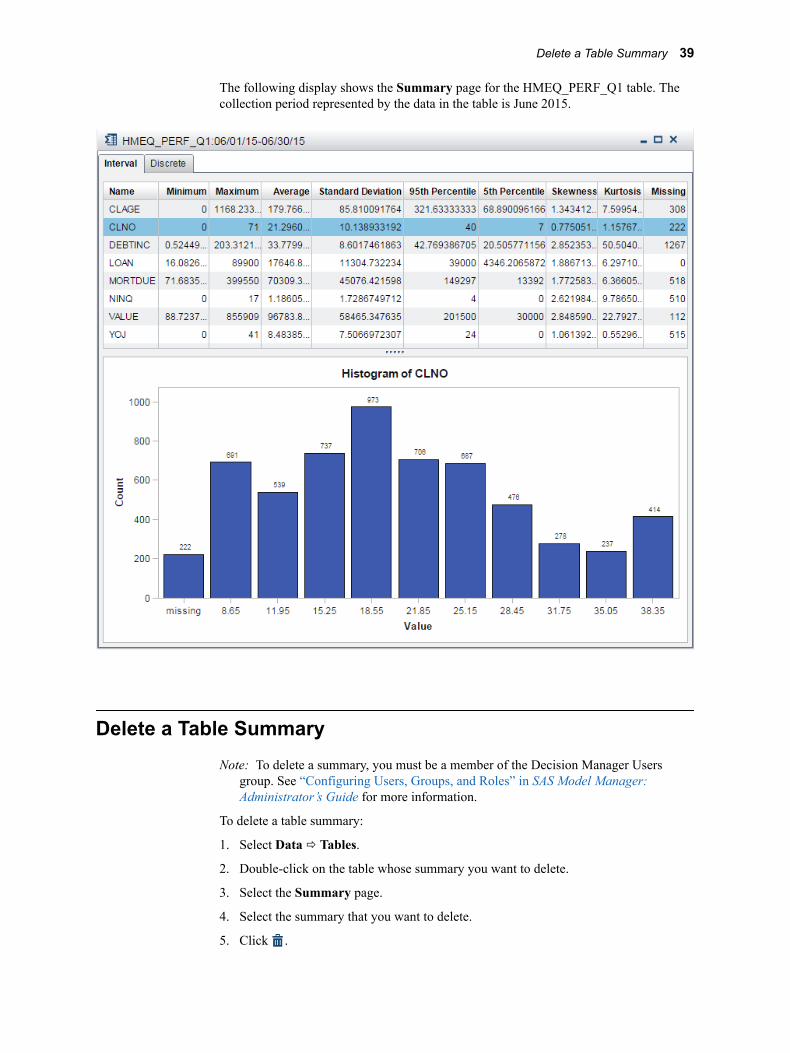
The following display shows the Summary page for the HMEQ_PERF_Q1 table. The collection period represented by the data in the table is June 2015.
Delete a Table SummaryNote: To delete a summary, you must be a member of the Decision Manager Users
group. See “Configuring Users, Groups, and Roles” in SAS Model Manager: Administrator’s Guide for more information.
To delete a table summary:
1. Select Data ð Tables.
2. Double-click on the table whose summary you want to delete.
3. Select the Summary page.
4. Select the summary that you want to delete.
5. Click .
Delete a Table Summary 39

Add Attachments to a TableTo add an attachment such as a document file or an image file:
1. Select the Attachments page.
2. Click , and select the attachment file.
3. Click .
Note: You can delete an attachment by selecting the attachment and clicking .
Add Comments to a TableYou can add new comments or reply to existing comments. To add a new comment:
1. Select the Comments page.
2. Enter a topic title and enter the comment. The topic title is required, and the field for comments does not appear until you enter the topic title.
3. (Optional) Click to add an attachment such as an image or a document.
4. Click Post.
To reply to an existing comment, enter your reply in the field immediately below the topic title for the existing comment, and click Post.
Click to see comments that have been posted by others.
To search for text in the comments, enter text in the search field at the top of the Comments page.
Remove a TableRemoving a table from the list of data sources does not delete the table from file system. To remove a table from the list of data sources:
1. Select Data ð Tables.
2. Select the table that you want to remove from the list.
3. Click .
40 Chapter 3 • Managing Data Tables
Chapter 4
Managing Folders
Overview of Managing Folders . . . . . . . . . . . . . . . . . . . . . . . . . . . . . . . . . . . . . . . . . . 41
Create a New Folder . . . . . . . . . . . . . . . . . . . . . . . . . . . . . . . . . . . . . . . . . . . . . . . . . . . 41
Rename a Folder . . . . . . . . . . . . . . . . . . . . . . . . . . . . . . . . . . . . . . . . . . . . . . . . . . . . . . 42
Delete a Folder . . . . . . . . . . . . . . . . . . . . . . . . . . . . . . . . . . . . . . . . . . . . . . . . . . . . . . . 42
Archive and Restore Folders . . . . . . . . . . . . . . . . . . . . . . . . . . . . . . . . . . . . . . . . . . . . 42
Overview of Managing FoldersIn the Projects and Portfolios category views, you can add, delete, and archive or restore folders. You must create a folder before you can create a project or portfolio. You can create subfolders within a top-level folder to organize your projects and portfolios. Designing a folder structure enables you to get summary information about the contents of the folder. This information includes the number of models, versions, and scoring tests, as well as reports for the models that contain model variables and target variables. Your folder structure could be similar to your business departmental hierarchy, or it could list individual project, portfolio, or model names.
To view the summary information, select a folder and then select Actions ð View Summary.
Create a New FolderBefore you add new projects or portfolios to manage models, you must add folders to store them in.
1. Click and select New Folder or New Top-Level Folder. The New Folder window appears.
41
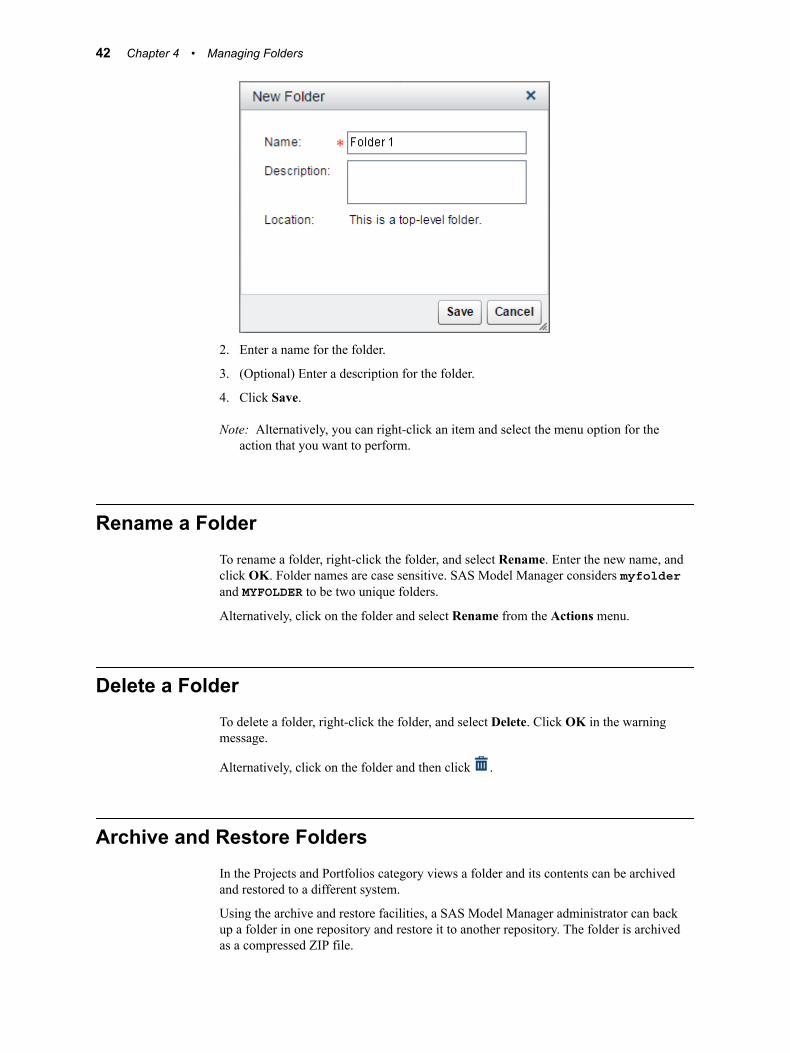
2. Enter a name for the folder.
3. (Optional) Enter a description for the folder.
4. Click Save.
Note: Alternatively, you can right-click an item and select the menu option for the action that you want to perform.
Rename a FolderTo rename a folder, right-click the folder, and select Rename. Enter the new name, and click OK. Folder names are case sensitive. SAS Model Manager considers myfolder and MYFOLDER to be two unique folders.
Alternatively, click on the folder and select Rename from the Actions menu.
Delete a FolderTo delete a folder, right-click the folder, and select Delete. Click OK in the warning message.
Alternatively, click on the folder and then click .
Archive and Restore FoldersIn the Projects and Portfolios category views a folder and its contents can be archived and restored to a different system.
Using the archive and restore facilities, a SAS Model Manager administrator can back up a folder in one repository and restore it to another repository. The folder is archived as a compressed ZIP file.
42 Chapter 4 • Managing Folders
Note: The attachments and comments at the portfolio level, project level, and model level are managed by separate services and are not stored within the portfolio, project, and model objects. Therefore, the attachments and comments are not included in the archived ZIP file.
Before you restore a folder, you should first create a folder to restore it to, since the restored projects reside at the same level that you specified. A best practice is to give the restored folder the same name as the archived ZIP file. The contents of the archived folder are restored to the new folder.
Note: All tables that are referenced within the projects and portfolios that are restored must be registered in the SAS Metadata Repository and made available to the Data ð Tables category view. For more information, see Chapter 3, “Managing Data Tables,” on page 33.
Folders cannot be restored in these situations:
• The name of the organizational folder to be restored is the same as a project name in the archived folder.
• The same archived ZIP file has already been restored in a folder on the same WebDAV server.
To archive a folder:
1. Select a folder.
2. Select Actions ð Archive.
3. Select a folder where the contents are to be saved.
4. Enter a name.
5. Click Save.
To restore a folder:
T I P Create a folder first into which to place the restored project.
1. Select a folder.
2. Select Actions ð Restore.
3. Navigate to the folder where the contents are saved.
4. Select the file.
5. Click OK.
Note: After restoring a folder, verify that the following requirements have been met:
• All scheduled jobs for scoring tests, performance, and retraining for the projects within a folder must be deleted and re-created on the system where the folder was restored.
• All user-defined templates for a model, report, and properties must exist on the system where the folders were restored. If they do not exist you must re-create the templates.
For more information, see the following topics:
• “Schedule a Scoring Test” on page 119
• “Schedule a Retrain Definition” on page 202
• “Schedule Performance Definitions” on page 184
• “Creating and Managing Templates” on page 60
Archive and Restore Folders 43

44 Chapter 4 • Managing Folders

Part 2
Working with Models, Projects, and Portfolios
Chapter 5Working with Projects . . . . . . . . . . . . . . . . . . . . . . . . . . . . . . . . . . . . . . . . . . . 47
Chapter 6Importing Models . . . . . . . . . . . . . . . . . . . . . . . . . . . . . . . . . . . . . . . . . . . . . . . . 67
Chapter 7Managing Model Content and Versions . . . . . . . . . . . . . . . . . . . . . . . . . . . 79
Chapter 8Working with Model Inventory . . . . . . . . . . . . . . . . . . . . . . . . . . . . . . . . . . . 91
Chapter 9Working with Portfolios . . . . . . . . . . . . . . . . . . . . . . . . . . . . . . . . . . . . . . . . . . 95
45

46
Chapter 5
Working with Projects
Overview of Projects . . . . . . . . . . . . . . . . . . . . . . . . . . . . . . . . . . . . . . . . . . . . . . . . . . . 48
Planning a Project . . . . . . . . . . . . . . . . . . . . . . . . . . . . . . . . . . . . . . . . . . . . . . . . . . . . . 48
Prerequisites for Creating Projects . . . . . . . . . . . . . . . . . . . . . . . . . . . . . . . . . . . . . . . 49
Create a Project . . . . . . . . . . . . . . . . . . . . . . . . . . . . . . . . . . . . . . . . . . . . . . . . . . . . . . 50
Project Properties . . . . . . . . . . . . . . . . . . . . . . . . . . . . . . . . . . . . . . . . . . . . . . . . . . . . . 51About Project Properties . . . . . . . . . . . . . . . . . . . . . . . . . . . . . . . . . . . . . . . . . . . . . . 51General Properties . . . . . . . . . . . . . . . . . . . . . . . . . . . . . . . . . . . . . . . . . . . . . . . . . . 51Specific Properties . . . . . . . . . . . . . . . . . . . . . . . . . . . . . . . . . . . . . . . . . . . . . . . . . . 52System Properties . . . . . . . . . . . . . . . . . . . . . . . . . . . . . . . . . . . . . . . . . . . . . . . . . . . 54User-Defined Properties . . . . . . . . . . . . . . . . . . . . . . . . . . . . . . . . . . . . . . . . . . . . . . 54
Defining Project Input and Output Variables . . . . . . . . . . . . . . . . . . . . . . . . . . . . . . 55About Defining Project Input and Output Variables . . . . . . . . . . . . . . . . . . . . . . . . . 55Add a New Variable . . . . . . . . . . . . . . . . . . . . . . . . . . . . . . . . . . . . . . . . . . . . . . . . . 55Delete a Variable . . . . . . . . . . . . . . . . . . . . . . . . . . . . . . . . . . . . . . . . . . . . . . . . . . . . 56Edit a Variable . . . . . . . . . . . . . . . . . . . . . . . . . . . . . . . . . . . . . . . . . . . . . . . . . . . . . . 56Copy Variables . . . . . . . . . . . . . . . . . . . . . . . . . . . . . . . . . . . . . . . . . . . . . . . . . . . . . 56Import Variables . . . . . . . . . . . . . . . . . . . . . . . . . . . . . . . . . . . . . . . . . . . . . . . . . . . . 56
Managing Project Versions . . . . . . . . . . . . . . . . . . . . . . . . . . . . . . . . . . . . . . . . . . . . . 57Overview of Project Versions . . . . . . . . . . . . . . . . . . . . . . . . . . . . . . . . . . . . . . . . . . 57Create a New Version of a Project . . . . . . . . . . . . . . . . . . . . . . . . . . . . . . . . . . . . . . 57Set the Displayed Version . . . . . . . . . . . . . . . . . . . . . . . . . . . . . . . . . . . . . . . . . . . . . 58Lock and Unlock a Project Version . . . . . . . . . . . . . . . . . . . . . . . . . . . . . . . . . . . . . 58Attach a Portable Formats File . . . . . . . . . . . . . . . . . . . . . . . . . . . . . . . . . . . . . . . . . 58View Life Cycle Status . . . . . . . . . . . . . . . . . . . . . . . . . . . . . . . . . . . . . . . . . . . . . . . 58
View Project History . . . . . . . . . . . . . . . . . . . . . . . . . . . . . . . . . . . . . . . . . . . . . . . . . . . 59
Add Attachments to a Project . . . . . . . . . . . . . . . . . . . . . . . . . . . . . . . . . . . . . . . . . . . 59
Add Comments to a Project . . . . . . . . . . . . . . . . . . . . . . . . . . . . . . . . . . . . . . . . . . . . . 59
Lock or Unlock Project Variables . . . . . . . . . . . . . . . . . . . . . . . . . . . . . . . . . . . . . . . . 60
Creating and Managing Templates . . . . . . . . . . . . . . . . . . . . . . . . . . . . . . . . . . . . . . . 60About Creating and Managing Templates . . . . . . . . . . . . . . . . . . . . . . . . . . . . . . . . 60Manage Templates . . . . . . . . . . . . . . . . . . . . . . . . . . . . . . . . . . . . . . . . . . . . . . . . . . 61Create a New Template . . . . . . . . . . . . . . . . . . . . . . . . . . . . . . . . . . . . . . . . . . . . . . . 61User-Defined Properties Template . . . . . . . . . . . . . . . . . . . . . . . . . . . . . . . . . . . . . . 62
Searching for Models . . . . . . . . . . . . . . . . . . . . . . . . . . . . . . . . . . . . . . . . . . . . . . . . . . 63
47
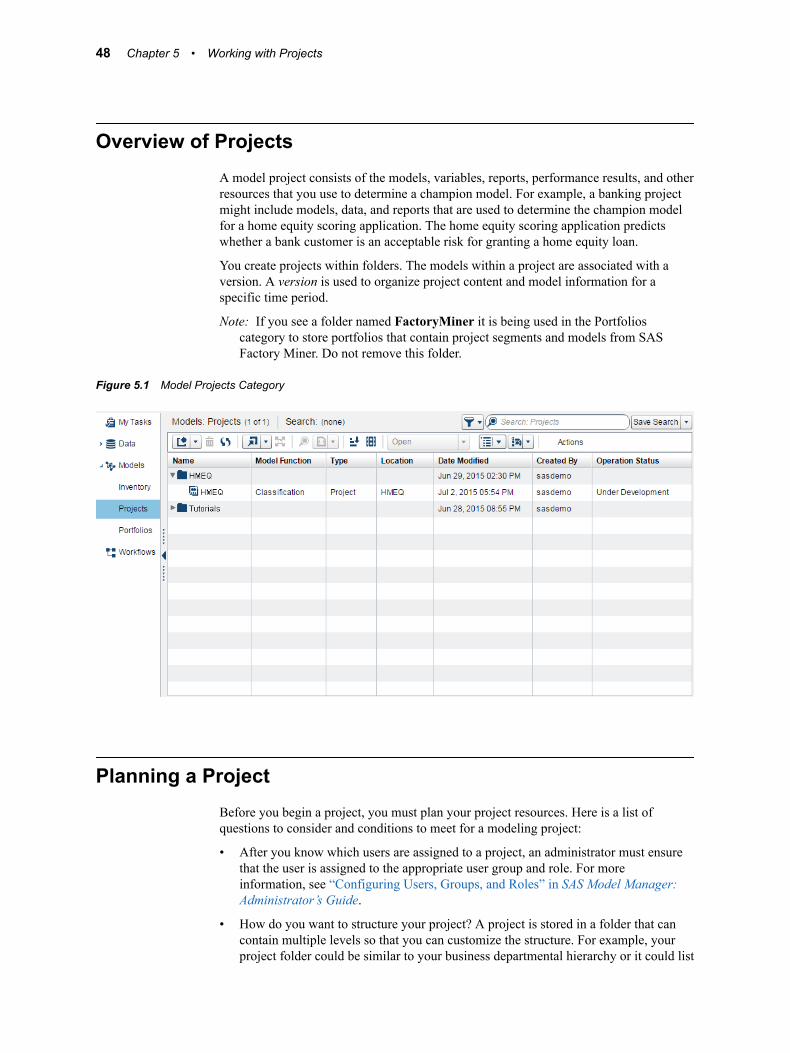
Overview of ProjectsA model project consists of the models, variables, reports, performance results, and other resources that you use to determine a champion model. For example, a banking project might include models, data, and reports that are used to determine the champion model for a home equity scoring application. The home equity scoring application predicts whether a bank customer is an acceptable risk for granting a home equity loan.
You create projects within folders. The models within a project are associated with a version. A version is used to organize project content and model information for a specific time period.
Note: If you see a folder named FactoryMiner it is being used in the Portfolios category to store portfolios that contain project segments and models from SAS Factory Miner. Do not remove this folder.
Figure 5.1 Model Projects Category
Planning a ProjectBefore you begin a project, you must plan your project resources. Here is a list of questions to consider and conditions to meet for a modeling project:
• After you know which users are assigned to a project, an administrator must ensure that the user is assigned to the appropriate user group and role. For more information, see “Configuring Users, Groups, and Roles” in SAS Model Manager: Administrator’s Guide.
• How do you want to structure your project? A project is stored in a folder that can contain multiple levels so that you can customize the structure. For example, your project folder could be similar to your business departmental hierarchy or it could list
48 Chapter 5 • Working with Projects
individual project names. For more information, see “Overview of Managing Folders” on page 41.
• What models do you want to use in the project? If the models were created using SAS Enterprise Miner, SAS/STAT, or the SAS/ETS procedures COUNTREG and SEVERITY, all model components are available when you import the model. If your model is a SAS code model that is not contained in a miningresult.spk file or a model that was created by third-party software such as R, you must ensure that you have imported all of the model component files. For more information, see “Overview of Importing Models” on page 67.
• How do you want to define your project input and output variables? When you create a project, you can import the variables using input and output prototype tables, copy the variables from an existing champion model, or define individual variables. If you use prototype tables to define the project input and output variables, the tables must be registered in the SAS Metadata Repository. For more information, see “Defining Project Input and Output Variables” on page 55.
• How do you want to track the progress of a version? The Workflows view enables you to track the progress of tasks from the version level. An authorized user can create a workflow and associate it with a version. For more information, see “Overview of Using Workflows” on page 229.
• You might have project documents that you would like to access. You can attach documents at the project or model level on the Attachments page. For more information, see “Add Attachments to a Project” on page 59.
• You might have comments that you would like others to see or respond to. You can add comments at the project or model level on the Comments page. For more information, see “Add Comments to a Project” on page 59.
• Several reports are available to help you assess candidate models. You can review the types of reports that are available and plan for which reports you want to use. Your plans might also include a custom report that you can run. For more information, see “Overview of Model Comparison, Validation, and Summary Reports” on page 124.
• After your champion model is in a production environment, you can monitor the performance of the model using your organization's performance data. For more information, see “Overview of Performance Monitoring” on page 165.
• When you define performance monitoring reports, you can set up performance index alert and warning conditions to notify users when conditions exceed the indexes. For more information, see “Performance Index Warnings and Alerts” on page 173.
Prerequisites for Creating ProjectsProjects can be created only by administrators and advanced users. Ensure that users who create projects are assigned to the group Model Manager Administrator Users or Model Manager Advanced Users in SAS Management Console.
All modeling projects require that you know the model function type before you create a project. The following model function types are available:
• Classification
• Prediction
• Segmentation
Prerequisites for Creating Projects 49

• Analytical
To determine the model function type for your project, see Table 5.1 on page 52.
If you use prototype tables to define the project input and output variables, you must create the project input and output tables and register them in the SAS Metadata Repository using the Data category view or SAS Management Console. If you use SAS Management Console, you must then add the registered tables in a library by using the Data category view to make the tables available to the application.
For more information, see the following documentation:
• “Defining Project Input and Output Variables” on page 55
• Chapter 3, “Managing Data Tables,” on page 33
Create a ProjectTo create a project:
1. Select a folder or create a new folder in which to store the new project.
2. Click and select New Project. The New Project window appears.
Note: Alternatively, you can right-click a folder and select New Project.
3. Enter a name for the project.
The initial version is displayed and reflects the level for sequential versions.
4. Select a model function (Classification, Prediction, Segmentation, or Analytical) to indicate the type of models that can be imported into the project. The location of the project is displayed.
5. Click Save.
To delete a project, select a project and then click .
Alternatively, you can right-click an item and select the menu option (Publish, Rename, or Delete) for the action that you want to perform.
50 Chapter 5 • Working with Projects
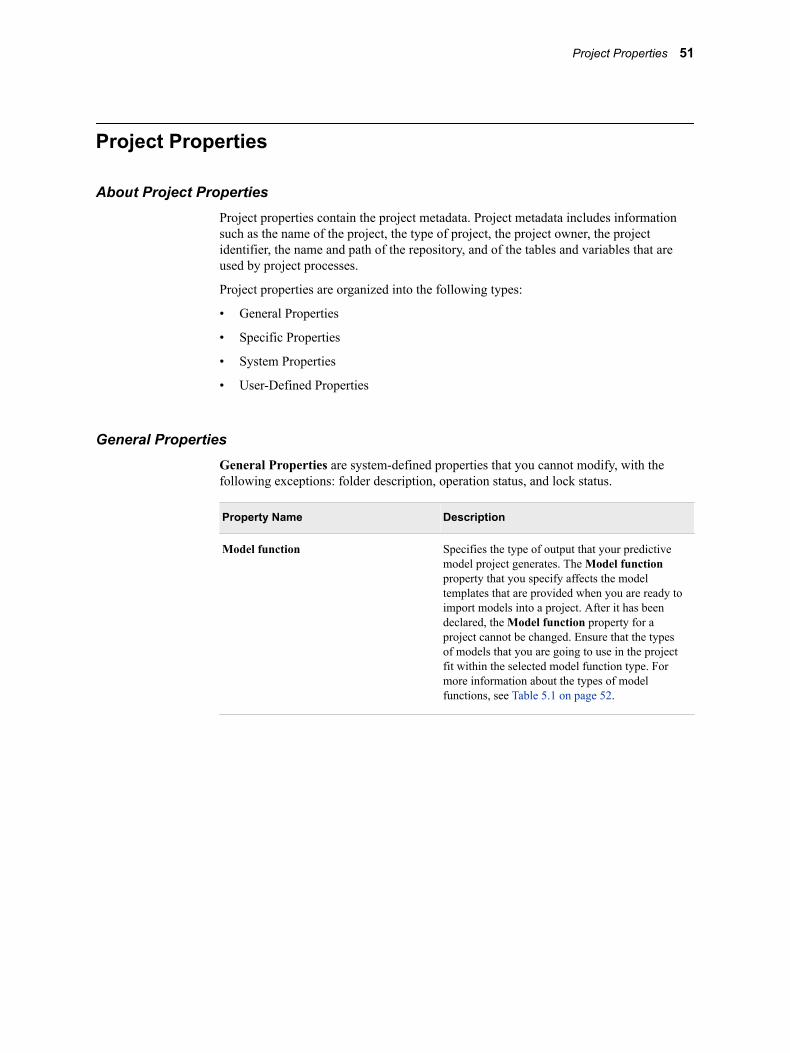
Project Properties
About Project PropertiesProject properties contain the project metadata. Project metadata includes information such as the name of the project, the type of project, the project owner, the project identifier, the name and path of the repository, and of the tables and variables that are used by project processes.
Project properties are organized into the following types:
• General Properties
• Specific Properties
• System Properties
• User-Defined Properties
General PropertiesGeneral Properties are system-defined properties that you cannot modify, with the following exceptions: folder description, operation status, and lock status.
Property Name Description
Model function Specifies the type of output that your predictive model project generates. The Model function property that you specify affects the model templates that are provided when you are ready to import models into a project. After it has been declared, the Model function property for a project cannot be changed. Ensure that the types of models that you are going to use in the project fit within the selected model function type. For more information about the types of model functions, see Table 5.1 on page 52.
Project Properties 51

Property Name Description
Operation status Specifies the current state of the project:
Under Developmentindicates that the project has started but a champion model is not yet in production.
Activeindicates that a champion model for this project is in production.
Inactiveindicates that the champion model is temporarily suspended from production.
Retiredindicates that the champion model for this project is no longer in production.
To set the status, select an option from the Operation status drop-down list.
Lock project variables Specifies that the project metadata is locked and the project definition cannot be modified. For more information, see “Lock or Unlock Project Variables” on page 60.
Table 5.1 Types of Model Functions
Model Function Description Example
Analytical Function for any model that is not Prediction, Classification, or Segmentation.
None
Classification Function for models that have target variables that contain binary, categorical, or ordinal values.
DEFAULT_RISK = {Low, Med, High}
Prediction Function for models that have interval targets with continuous values.
The score output of a prediction model could estimate the weight of a person. The output of a model would be P_Weight.
Segmentation Function for segmentation or clustering models.
Clustering models
Specific PropertiesSpecific Properties contain information about tables that are used by the project as well as various input and output variables and values that are used in scoring the models in test and production environments. This data can be added or modified after you add
52 Chapter 5 • Working with Projects
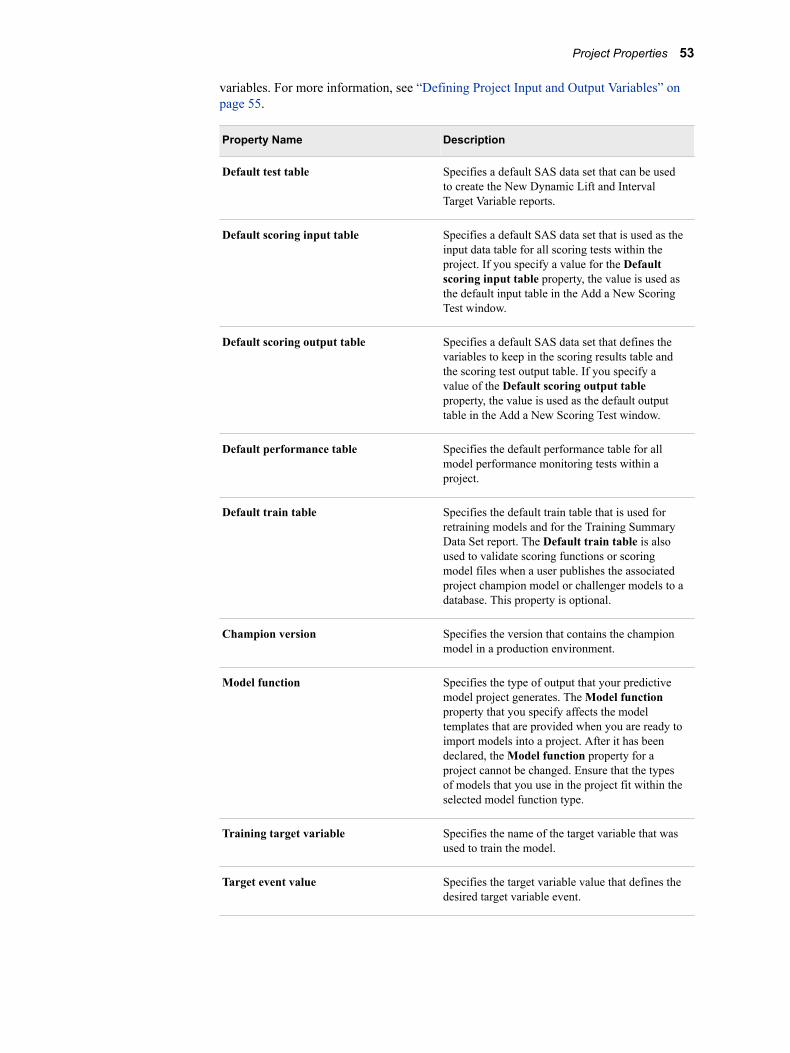
variables. For more information, see “Defining Project Input and Output Variables” on page 55.
Property Name Description
Default test table Specifies a default SAS data set that can be used to create the New Dynamic Lift and Interval Target Variable reports.
Default scoring input table Specifies a default SAS data set that is used as the input data table for all scoring tests within the project. If you specify a value for the Default scoring input table property, the value is used as the default input table in the Add a New Scoring Test window.
Default scoring output table Specifies a default SAS data set that defines the variables to keep in the scoring results table and the scoring test output table. If you specify a value of the Default scoring output table property, the value is used as the default output table in the Add a New Scoring Test window.
Default performance table Specifies the default performance table for all model performance monitoring tests within a project.
Default train table Specifies the default train table that is used for retraining models and for the Training Summary Data Set report. The Default train table is also used to validate scoring functions or scoring model files when a user publishes the associated project champion model or challenger models to a database. This property is optional.
Champion version Specifies the version that contains the champion model in a production environment.
Model function Specifies the type of output that your predictive model project generates. The Model function property that you specify affects the model templates that are provided when you are ready to import models into a project. After it has been declared, the Model function property for a project cannot be changed. Ensure that the types of models that you use in the project fit within the selected model function type.
Training target variable Specifies the name of the target variable that was used to train the model.
Target event value Specifies the target variable value that defines the desired target variable event.
Project Properties 53
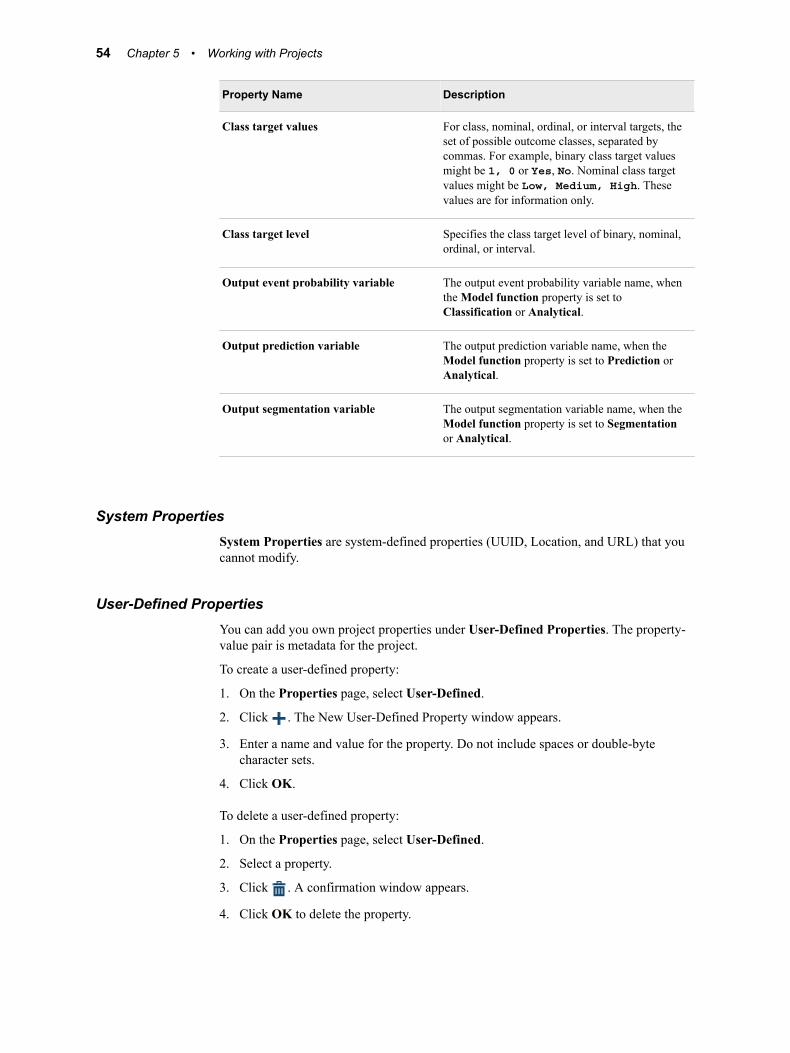
Property Name Description
Class target values For class, nominal, ordinal, or interval targets, the set of possible outcome classes, separated by commas. For example, binary class target values might be 1, 0 or Yes, No. Nominal class target values might be Low, Medium, High. These values are for information only.
Class target level Specifies the class target level of binary, nominal, ordinal, or interval.
Output event probability variable The output event probability variable name, when the Model function property is set to Classification or Analytical.
Output prediction variable The output prediction variable name, when the Model function property is set to Prediction or Analytical.
Output segmentation variable The output segmentation variable name, when the Model function property is set to Segmentation or Analytical.
System PropertiesSystem Properties are system-defined properties (UUID, Location, and URL) that you cannot modify.
User-Defined PropertiesYou can add you own project properties under User-Defined Properties. The property-value pair is metadata for the project.
To create a user-defined property:
1. On the Properties page, select User-Defined.
2. Click . The New User-Defined Property window appears.
3. Enter a name and value for the property. Do not include spaces or double-byte character sets.
4. Click OK.
To delete a user-defined property:
1. On the Properties page, select User-Defined.
2. Select a property.
3. Click . A confirmation window appears.
4. Click OK to delete the property.
54 Chapter 5 • Working with Projects
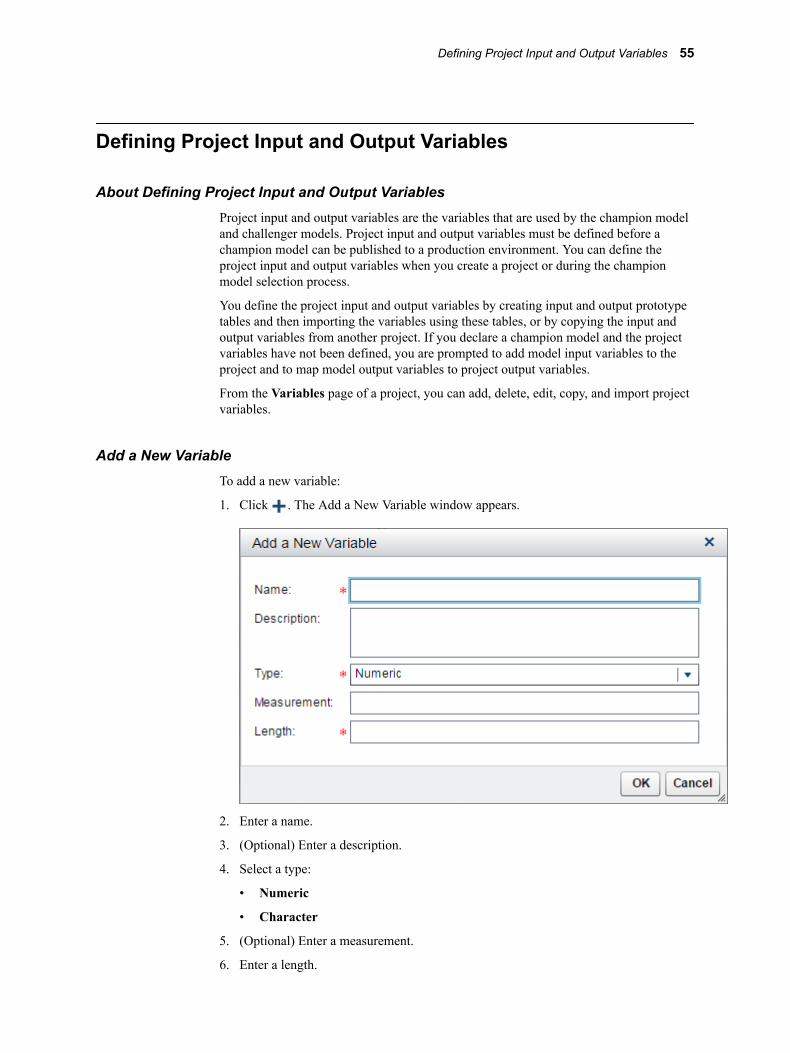
Defining Project Input and Output Variables
About Defining Project Input and Output VariablesProject input and output variables are the variables that are used by the champion model and challenger models. Project input and output variables must be defined before a champion model can be published to a production environment. You can define the project input and output variables when you create a project or during the champion model selection process.
You define the project input and output variables by creating input and output prototype tables and then importing the variables using these tables, or by copying the input and output variables from another project. If you declare a champion model and the project variables have not been defined, you are prompted to add model input variables to the project and to map model output variables to project output variables.
From the Variables page of a project, you can add, delete, edit, copy, and import project variables.
Add a New VariableTo add a new variable:
1. Click . The Add a New Variable window appears.
2. Enter a name.
3. (Optional) Enter a description.
4. Select a type:
• Numeric
• Character
5. (Optional) Enter a measurement.
6. Enter a length.
Defining Project Input and Output Variables 55
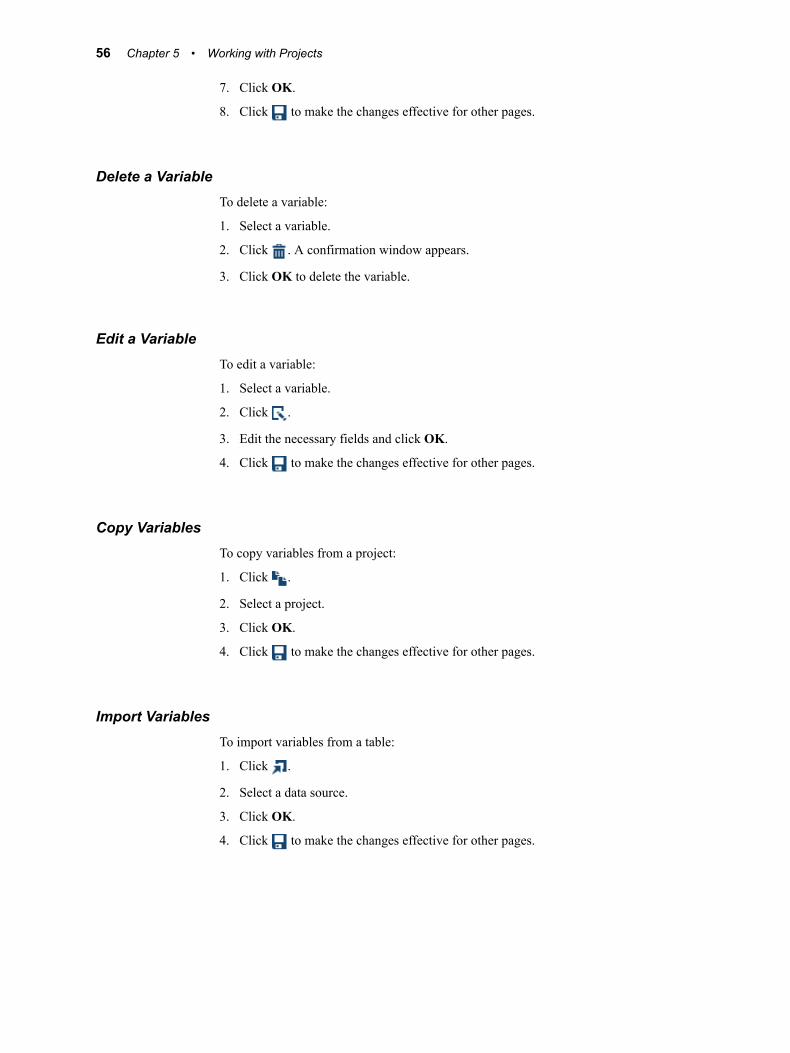
7. Click OK.
8. Click to make the changes effective for other pages.
Delete a VariableTo delete a variable:
1. Select a variable.
2. Click . A confirmation window appears.
3. Click OK to delete the variable.
Edit a VariableTo edit a variable:
1. Select a variable.
2. Click .
3. Edit the necessary fields and click OK.
4. Click to make the changes effective for other pages.
Copy VariablesTo copy variables from a project:
1. Click .
2. Select a project.
3. Click OK.
4. Click to make the changes effective for other pages.
Import VariablesTo import variables from a table:
1. Click .
2. Select a data source.
3. Click OK.
4. Click to make the changes effective for other pages.
56 Chapter 5 • Working with Projects

Managing Project Versions
Overview of Project VersionsAfter a project is created, you can view information about the project on the Versions page. An initial version is created automatically, and it functions as a time-phased container for your projects. The version is a sequential number that increments by plus one each time you add a new version. You can also specify a description for the version when adding a new one, such as a time interval for a project cycle. Your version might represent a calendar year, a retail season, or a fiscal quarter. A project can contain multiple versions. A version contains all of the candidate model resources that you need to determine a champion model as well as all champion model resources. For example, you might develop models for a scoring program that determines whether a customer is eligible for a home equity loan. The version contains all of the models, scoring tests, and reports that are used to determine the champion model. Expand Details to view more information about the project version.
Create a New Version of a ProjectTo create a new version:
1. Select the Versions page.
2. Click . The Add a New Version window appears.
3. The next sequential number appears as the new version number for the project.
4. (Optional) Enter a description for the version.
5. Click OK.
You can also delete a version if it is not the current version, or if it is locked. Select a version and click
Managing Project Versions 57

Set the Displayed VersionTo set the displayed version:
1. Select the Versions page.
2. Select a version and click , or double-click a version.
3. The icon indicates the version that is being displayed.
Lock and Unlock a Project VersionYou can enable or disable modifications of some version models properties and files. Locking a version restricts the activities that you can do with the project. You normally lock a version after you declare a champion model in preparation for deploying the champion model to a production environment.
To lock or unlock a version:
1. Select the Versions page.
2. Select a version and click to lock or unlock the version. The label Locked after the version name indicates the version that is being locked.
Attach a Portable Formats FileThe portable formats file contains the user-defined formats that are associated with the train table that was used to create a model. In order for the validation to be successful, the table that is selected at publish time to validate the model must be associated with the same user-defined formats. You must transform the user-defined formats SAS catalog into a portable formats file and attach it to the version. This action enables the user-defined formats to be published to the database with the model.
To attach a portable formats file:
1. Select the Versions page.
2. Select a version and click .
3. Navigate to the appropriate folder and select the portable formats file to attach to the selected version.
4. Click OK.
View Life Cycle StatusNote: Only life cycle content for migrated versions can be viewed.
To view the life cycle status:
1. On the Versions page of a project, select a version and expand Details.
2. Click View Life Cycle Status.
3. View the information and click OK.
58 Chapter 5 • Working with Projects
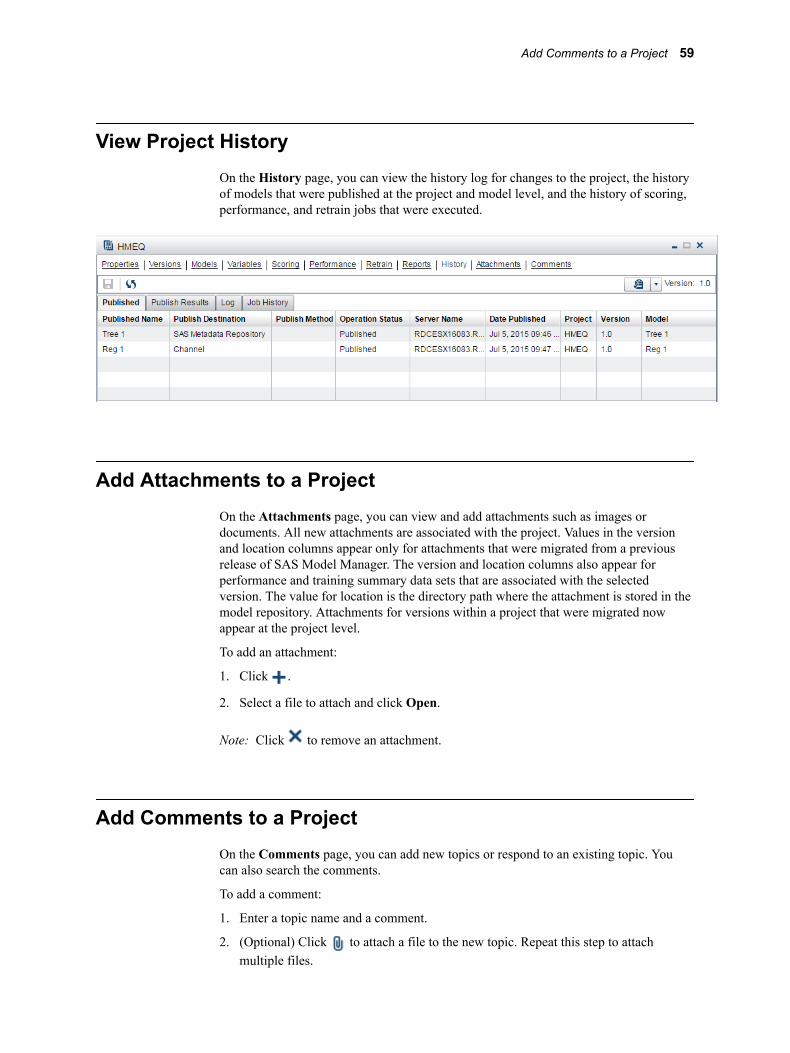
View Project HistoryOn the History page, you can view the history log for changes to the project, the history of models that were published at the project and model level, and the history of scoring, performance, and retrain jobs that were executed.
Add Attachments to a ProjectOn the Attachments page, you can view and add attachments such as images or documents. All new attachments are associated with the project. Values in the version and location columns appear only for attachments that were migrated from a previous release of SAS Model Manager. The version and location columns also appear for performance and training summary data sets that are associated with the selected version. The value for location is the directory path where the attachment is stored in the model repository. Attachments for versions within a project that were migrated now appear at the project level.
To add an attachment:
1. Click .
2. Select a file to attach and click Open.
Note: Click to remove an attachment.
Add Comments to a ProjectOn the Comments page, you can add new topics or respond to an existing topic. You can also search the comments.
To add a comment:
1. Enter a topic name and a comment.
2. (Optional) Click to attach a file to the new topic. Repeat this step to attach multiple files.
Add Comments to a Project 59

Note: You can also click Remove to remove an attachment.
3. Click Post.
Lock or Unlock Project VariablesYou cannot modify project variables that are locked for a project. Also, you cannot set a new champion or challenger model for the project.
To lock or unlock a project:
1. In the Projects category view, select a project.
2. Select Actions ð Lock Project Variables. Note that the Lock project variables check box is selected on the Properties page of the project.
3. To unlock the project, select Actions ð Lock Project Variables. Note that the Lock project variables check box is deselected on the Properties page of the project.
Note: You can also select or deselect the Lock project variables check box on the Properties page of a project.
Creating and Managing Templates
About Creating and Managing TemplatesThere are three different types of templates that you can create or edit. The template types are Model, Report, and Properties. Models are associated with a specific model template. A model template contains properties and component files that define a type of model. Report templates can be used to create user-defined reports. A report template contains report requirements such as report name and the number of required models to run the report. The properties template contains user-defined properties and values for the model and project object types. In the Projects category view, you can create a new template or manage existing templates.
Note: Only users who are in the Model Manager Administrator Users or Model Manager Advanced Users groups and who have Write permission to the WebDAV folder where the user-defined model and report templates are stored can save a new template or save changes to an existing template. For more information, see “Verify WebDAV Folder Permissions for User-Defined Templates ” in SAS Model Manager: Administrator’s Guide.
For more information about the different types of templates, see the following topics:
• “Model Templates” on page 241
• “Report Templates”
• “User-Defined Properties Template”
60 Chapter 5 • Working with Projects
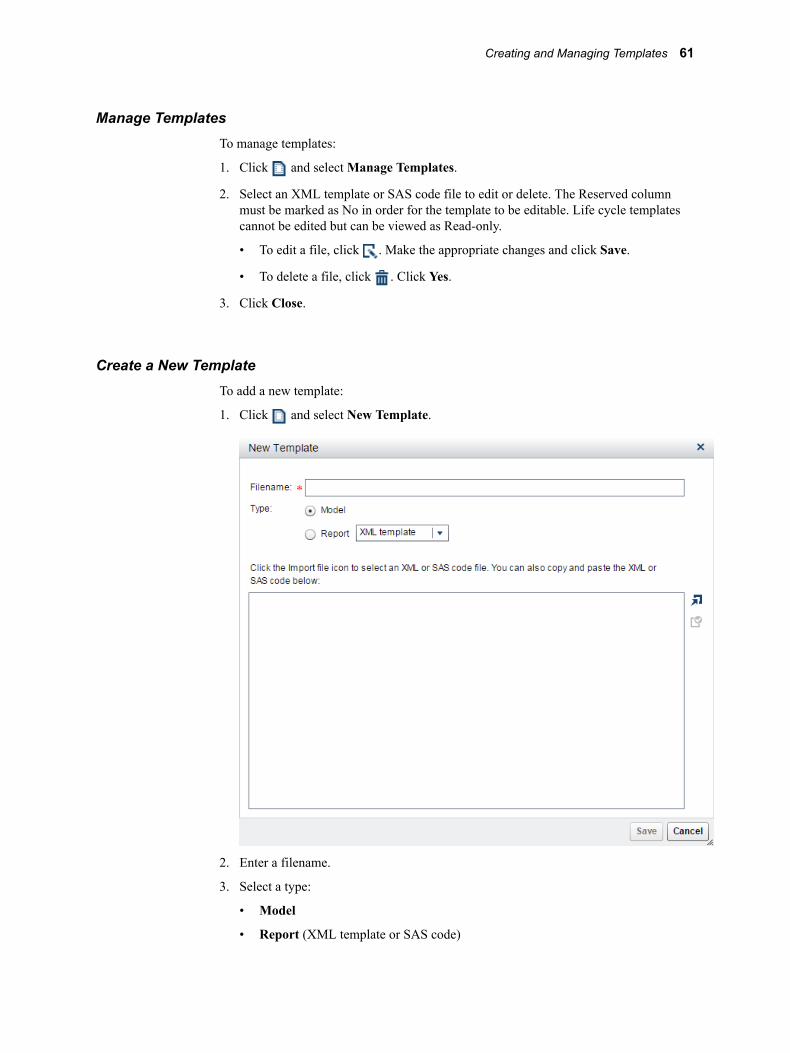
Manage TemplatesTo manage templates:
1. Click and select Manage Templates.
2. Select an XML template or SAS code file to edit or delete. The Reserved column must be marked as No in order for the template to be editable. Life cycle templates cannot be edited but can be viewed as Read-only.
• To edit a file, click . Make the appropriate changes and click Save.
• To delete a file, click . Click Yes.
3. Click Close.
Create a New TemplateTo add a new template:
1. Click and select New Template.
2. Enter a filename.
3. Select a type:
• Model
• Report (XML template or SAS code)
Creating and Managing Templates 61

4. Click to select an XML or SAS code file. You can also copy and paste the XML or SAS code in the text box.
Note: Ensure that the selected template type matches the XML content type before importing the file.
5. Click to validate the XML.
6. Click Save.
User-Defined Properties TemplateWhen you add a user-defined property using the UserDefinedProperties.xml file, you specify the name of the property, the initial value of the property, and the type of object in the model repository to which it applies. The user-defined property is created for the specified object type when the object is added to the model repository. For example, if the XML file specifies a user-defined property Due date for an object type of project, the project object has a property of Due date each time a project is created in the Projects category. User-supplied properties are not added to existing objects in the model repository.
You can specify these object types in the UserDefinedProperties.xml file:
• AnalyticalModel
• ClassificationModel
• ClusteringModel
• PredictionModel
• Project
To add user-defined properties for an object type:
1. Click and select Manage Templates.
2. Select the UserDefinedProperties.xml template and click .
62 Chapter 5 • Working with Projects
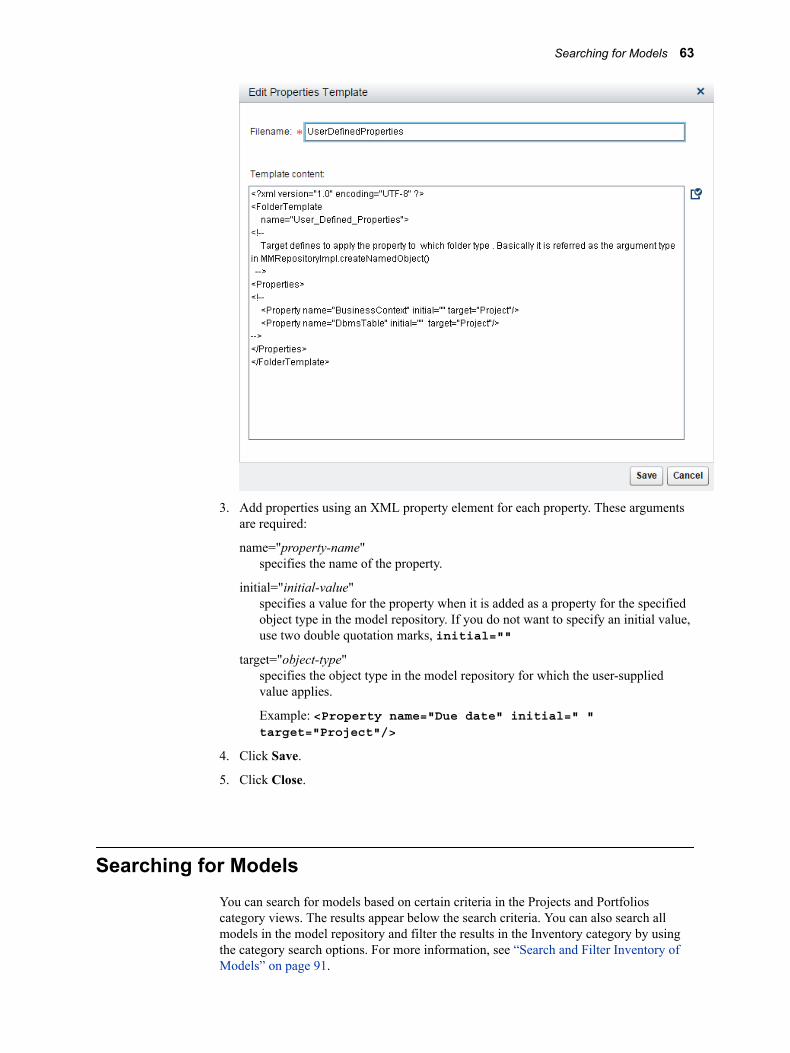
3. Add properties using an XML property element for each property. These arguments are required:
name="property-name"specifies the name of the property.
initial="initial-value"specifies a value for the property when it is added as a property for the specified object type in the model repository. If you do not want to specify an initial value, use two double quotation marks, initial=""
target="object-type"specifies the object type in the model repository for which the user-supplied value applies.
Example: <Property name="Due date" initial=" " target="Project"/>
4. Click Save.
5. Click Close.
Searching for ModelsYou can search for models based on certain criteria in the Projects and Portfolios category views. The results appear below the search criteria. You can also search all models in the model repository and filter the results in the Inventory category by using the category search options. For more information, see “Search and Filter Inventory of Models” on page 91.
Searching for Models 63

To search for models:
1. Click The default is to search All folders
2. Select a location:
• All folders searches all folders in the category view.
• Current searches only the selected object (folder, project, or portfolio) and its contents.
3. Enter a name for the model.
4. Enter an algorithm.
5. Enter an input variable. The field is case sensitive.
6. Enter a target variable. The field is case sensitive.
7. Enter a modeler.
8. Enter a user-defined key or value. The user-defined key field is case sensitive.
9. Click Search.
64 Chapter 5 • Working with Projects

10. Select a model from Search Results and click or double-click to open the model. You can view or edit the model. Click OK.
11. Click Close.
The search results display the following information:
Column Description
Project Specifies the name of the project.
Model Specifies the name of the model.
Location Specifies the location of the model.
Algorithm Specifies the name of the algorithm, such as regression or logistic, that is used by the model.
Type Specifies one of the model function types:
• Analytical
• Classification
• Prediction
• Cluster
Searching for Models 65

66 Chapter 5 • Working with Projects
Chapter 6
Importing Models
Overview of Importing Models . . . . . . . . . . . . . . . . . . . . . . . . . . . . . . . . . . . . . . . . . . 67
Import a Model from the SAS Metadata Repository . . . . . . . . . . . . . . . . . . . . . . . . 69
Import a Model from a SAS Package File . . . . . . . . . . . . . . . . . . . . . . . . . . . . . . . . . 70Import a SAS Package File . . . . . . . . . . . . . . . . . . . . . . . . . . . . . . . . . . . . . . . . . . . . 70Create SAS Package Files in SAS Enterprise Miner . . . . . . . . . . . . . . . . . . . . . . . . 70Create SAS Package Files Using the %AA_Model_Register Macro . . . . . . . . . . . . 71
Import a PMML Model . . . . . . . . . . . . . . . . . . . . . . . . . . . . . . . . . . . . . . . . . . . . . . . . 71
Import Models from Local Files . . . . . . . . . . . . . . . . . . . . . . . . . . . . . . . . . . . . . . . . . 72
Import a Model from a SAS Analytic Store File . . . . . . . . . . . . . . . . . . . . . . . . . . . . 74
Export Models from a Project . . . . . . . . . . . . . . . . . . . . . . . . . . . . . . . . . . . . . . . . . . . 75
Importing Models into a Folder . . . . . . . . . . . . . . . . . . . . . . . . . . . . . . . . . . . . . . . . . 75About Importing Models into a Folder . . . . . . . . . . . . . . . . . . . . . . . . . . . . . . . . . . . 75Import Models into a Folder . . . . . . . . . . . . . . . . . . . . . . . . . . . . . . . . . . . . . . . . . . . 75Export Models from a Folder . . . . . . . . . . . . . . . . . . . . . . . . . . . . . . . . . . . . . . . . . . 76Update Models in Folders . . . . . . . . . . . . . . . . . . . . . . . . . . . . . . . . . . . . . . . . . . . . . 77Duplicate or Move Models . . . . . . . . . . . . . . . . . . . . . . . . . . . . . . . . . . . . . . . . . . . . 77
Overview of Importing ModelsAfter you create a project, you import models into a project version on the Models page. A project can contain multiple versions. You can see only the models for the selected version on the Models page. After model evaluation, you set one of the candidate models as the champion model.
You can also import generic models into a folder from the SAS Workspace Server. For more information, see “Importing Models into a Folder” on page 75.
67
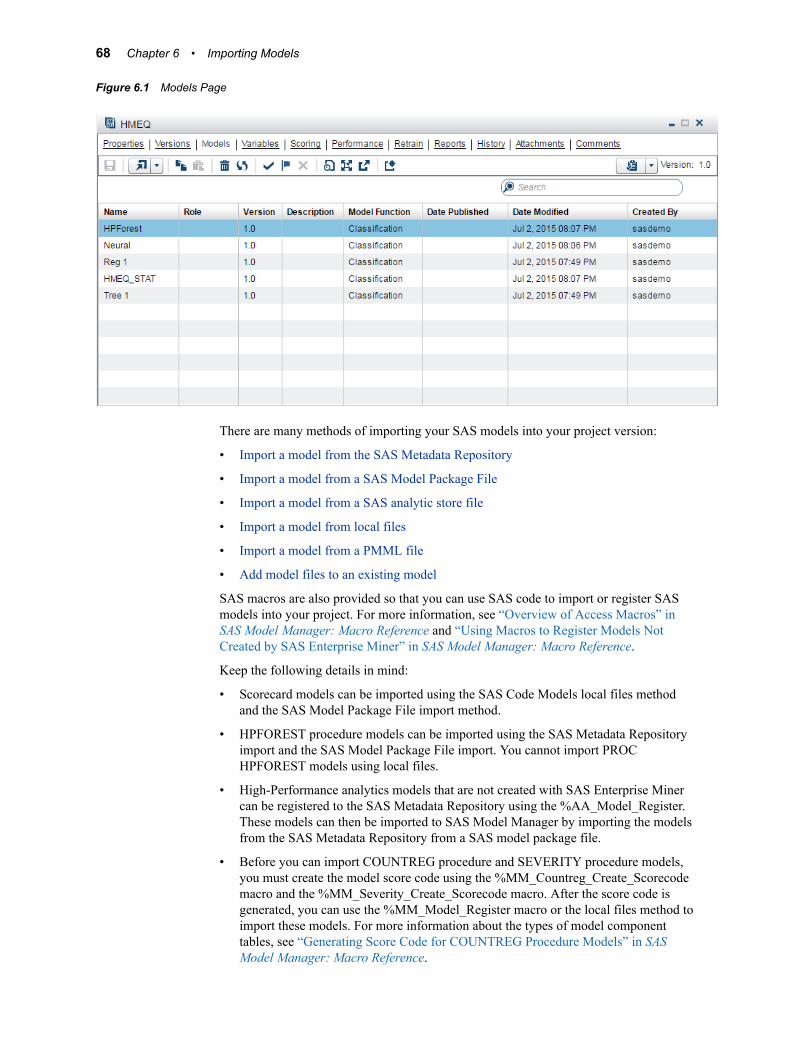
Figure 6.1 Models Page
There are many methods of importing your SAS models into your project version:
• Import a model from the SAS Metadata Repository
• Import a model from a SAS Model Package File
• Import a model from a SAS analytic store file
• Import a model from local files
• Import a model from a PMML file
• Add model files to an existing model
SAS macros are also provided so that you can use SAS code to import or register SAS models into your project. For more information, see “Overview of Access Macros” in SAS Model Manager: Macro Reference and “Using Macros to Register Models Not Created by SAS Enterprise Miner” in SAS Model Manager: Macro Reference.
Keep the following details in mind:
• Scorecard models can be imported using the SAS Code Models local files method and the SAS Model Package File import method.
• HPFOREST procedure models can be imported using the SAS Metadata Repository import and the SAS Model Package File import. You cannot import PROC HPFOREST models using local files.
• High-Performance analytics models that are not created with SAS Enterprise Miner can be registered to the SAS Metadata Repository using the %AA_Model_Register. These models can then be imported to SAS Model Manager by importing the models from the SAS Metadata Repository from a SAS model package file.
• Before you can import COUNTREG procedure and SEVERITY procedure models, you must create the model score code using the %MM_Countreg_Create_Scorecode macro and the %MM_Severity_Create_Scorecode macro. After the score code is generated, you can use the %MM_Model_Register macro or the local files method to import these models. For more information about the types of model component tables, see “Generating Score Code for COUNTREG Procedure Models” in SAS Model Manager: Macro Reference.
68 Chapter 6 • Importing Models

• SAS Model Manager can publish to a database or Hadoop the models that are associated with the DATA step score code type. Models that have a score code type of Analytic store can be published only to Hadoop and Teradata. Models that have a score code type of SAS Program, PMML, or DS2 cannot be published to a database.
• Model component table variable names must start with a letter or underscore and can contain letters, an underscore ( _ ), a hyphen ( - ), and a period ( . ). Variable names that have special characters can be used only when the SAS administrator has set the VALIDVARNAME system option to ANY. For more information, see “Valid Variable Name Options” in SAS Model Manager: Administrator’s Guide.
CAUTION:Unexpected results might occur if you import a model that was previously exported using SAS Model Manager. A best practice is to import models that were not previously exported by SAS Model Manager.
Import a Model from the SAS Metadata Repository
If your SAS Enterprise Miner 5.1 (or later) model files or your models that were created by the %AA_Model_Register macro are registered in your SAS Metadata Repository, you can import them into SAS Model Manager from the repository.
To import a model from the SAS Metadata Repository:
1. Click and select from the SAS Metadata Repository.
2. Navigate to the location of the file and select the model file to import.
3. Enter a name for the model and click OK.
Import a Model from the SAS Metadata Repository 69
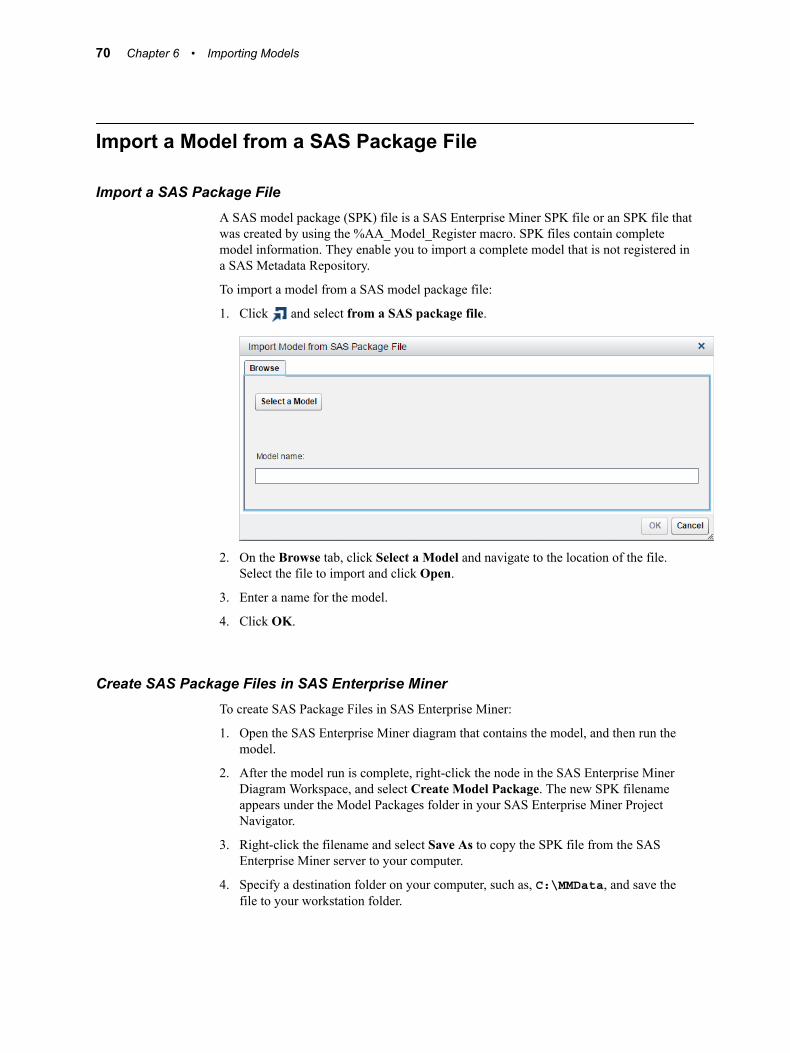
Import a Model from a SAS Package File
Import a SAS Package FileA SAS model package (SPK) file is a SAS Enterprise Miner SPK file or an SPK file that was created by using the %AA_Model_Register macro. SPK files contain complete model information. They enable you to import a complete model that is not registered in a SAS Metadata Repository.
To import a model from a SAS model package file:
1. Click and select from a SAS package file.
2. On the Browse tab, click Select a Model and navigate to the location of the file. Select the file to import and click Open.
3. Enter a name for the model.
4. Click OK.
Create SAS Package Files in SAS Enterprise MinerTo create SAS Package Files in SAS Enterprise Miner:
1. Open the SAS Enterprise Miner diagram that contains the model, and then run the model.
2. After the model run is complete, right-click the node in the SAS Enterprise Miner Diagram Workspace, and select Create Model Package. The new SPK filename appears under the Model Packages folder in your SAS Enterprise Miner Project Navigator.
3. Right-click the filename and select Save As to copy the SPK file from the SAS Enterprise Miner server to your computer.
4. Specify a destination folder on your computer, such as, C:\MMData, and save the file to your workstation folder.
70 Chapter 6 • Importing Models

Create SAS Package Files Using the %AA_Model_Register MacroThese models can be created by SAS procedures and are supported by SAS Model Manager:
• SAS/STAT item store models
• High-performance models
• SAS/ETS COUNTREG procedure models
• SAS/ETS SEVERITY procedure models
You can use the %AA_Model_Register macro to create an SPK file to contain these models. For more information, see “Overview of Access Macros” in SAS Model Manager: Macro Reference.
Import a PMML ModelPredictive Modeling Markup Language (PMML) is an XML-based standard for representing data mining results. PMML is designed to enable the sharing and deployment of data mining results between vendor applications and across data management systems. You can import PMML models that are produced by using other applications. PMML 4.2 is supported. Models that are created using PMML 4.2 support DATA step score code.
Note: If your PMML model contains variable names with blanks or special characters other than underscores, you must set the system option VALIDVARNAME=ANY to perform tasks such as scoring tests, performance monitoring, and reporting that use the score.sas file. For information about setting the VALIDVARNAME=“ANY”, see “Valid Variable Name Options” in SAS Model Manager: Administrator’s Guide.
For more information, see “PROC PSCORE and PMML Support” on page 265. If you have a license for SAS Enterprise Miner, see the topic “SAS Enterprise Miner PMML Support” in the product Help or in SAS Enterprise Miner: Reference Help available at http://support.sas.com/documentation/onlinedoc/miner/.
Note: PMML variables must be valid SAS variable names and cannot contain more than 20 characters. In addition, SAS Model Manager does not support the importing of a PMML file that contains multiple models.
To import a PMML model:
1. Click and select from a PMML file.
Import a PMML Model 71
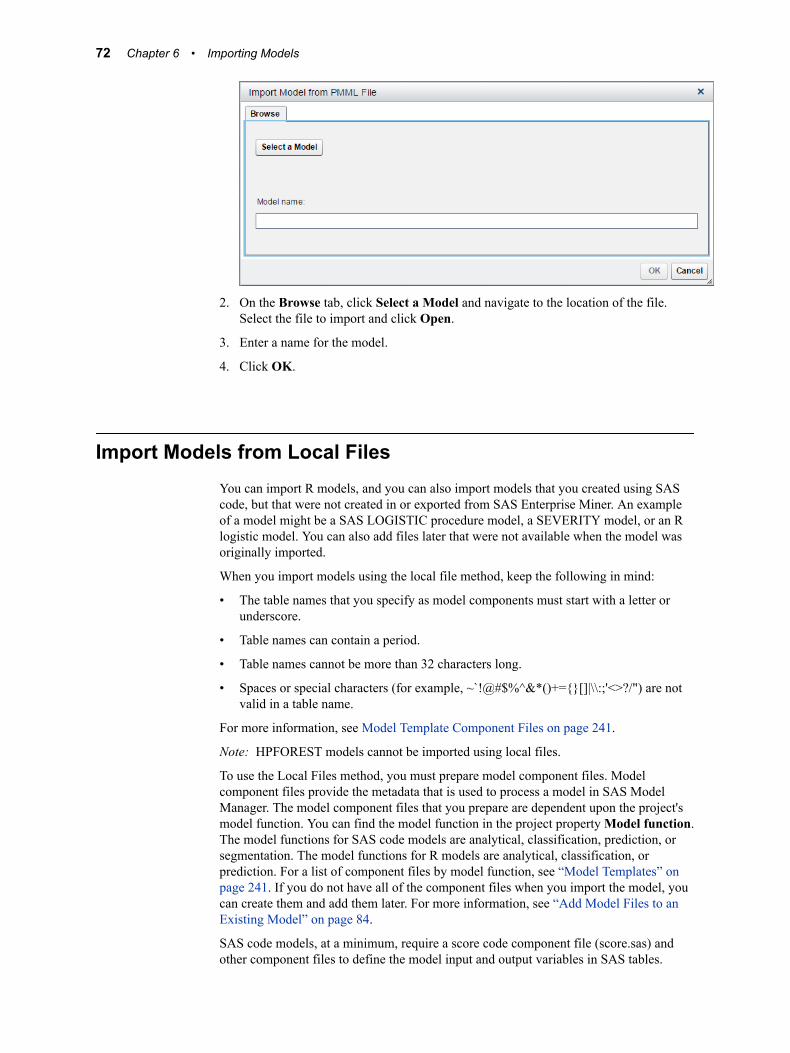
2. On the Browse tab, click Select a Model and navigate to the location of the file. Select the file to import and click Open.
3. Enter a name for the model.
4. Click OK.
Import Models from Local FilesYou can import R models, and you can also import models that you created using SAS code, but that were not created in or exported from SAS Enterprise Miner. An example of a model might be a SAS LOGISTIC procedure model, a SEVERITY model, or an R logistic model. You can also add files later that were not available when the model was originally imported.
When you import models using the local file method, keep the following in mind:
• The table names that you specify as model components must start with a letter or underscore.
• Table names can contain a period.
• Table names cannot be more than 32 characters long.
• Spaces or special characters (for example, ~`!@#$%^&*()+={}[]|\\:;'<>?/") are not valid in a table name.
For more information, see Model Template Component Files on page 241.
Note: HPFOREST models cannot be imported using local files.
To use the Local Files method, you must prepare model component files. Model component files provide the metadata that is used to process a model in SAS Model Manager. The model component files that you prepare are dependent upon the project's model function. You can find the model function in the project property Model function. The model functions for SAS code models are analytical, classification, prediction, or segmentation. The model functions for R models are analytical, classification, or prediction. For a list of component files by model function, see “Model Templates” on page 241. If you do not have all of the component files when you import the model, you can create them and add them later. For more information, see “Add Model Files to an Existing Model” on page 84.
SAS code models, at a minimum, require a score code component file (score.sas) and other component files to define the model input and output variables in SAS tables.
72 Chapter 6 • Importing Models
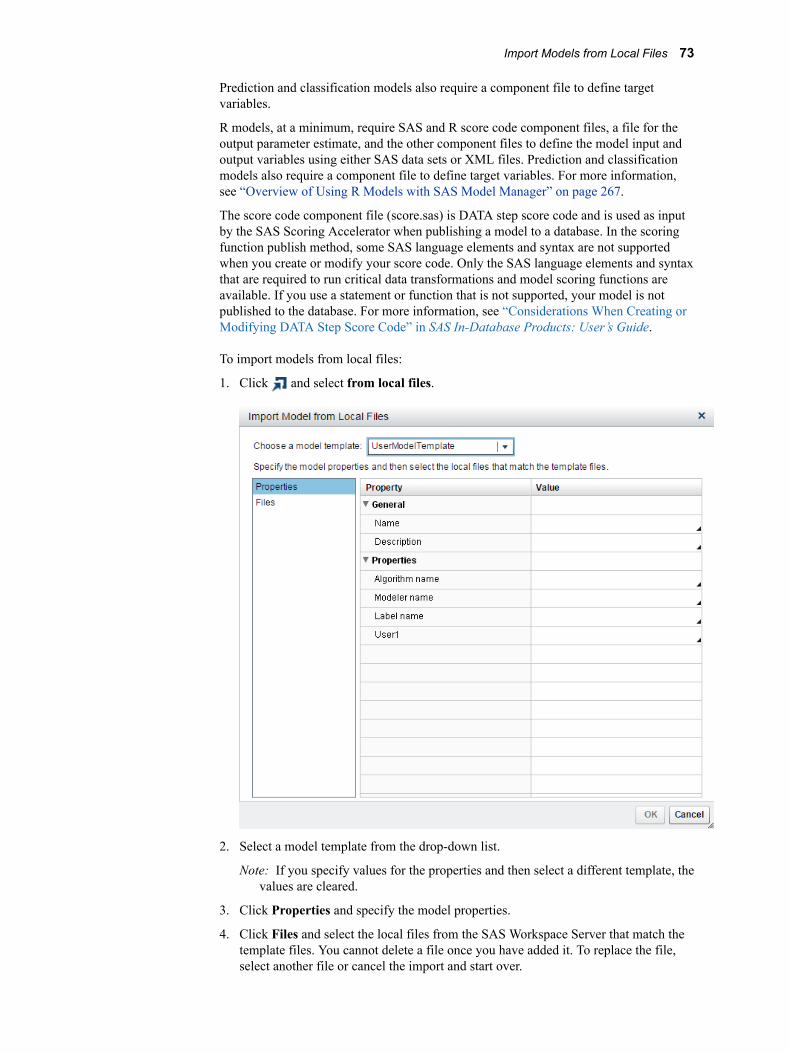
Prediction and classification models also require a component file to define target variables.
R models, at a minimum, require SAS and R score code component files, a file for the output parameter estimate, and the other component files to define the model input and output variables using either SAS data sets or XML files. Prediction and classification models also require a component file to define target variables. For more information, see “Overview of Using R Models with SAS Model Manager” on page 267.
The score code component file (score.sas) is DATA step score code and is used as input by the SAS Scoring Accelerator when publishing a model to a database. In the scoring function publish method, some SAS language elements and syntax are not supported when you create or modify your score code. Only the SAS language elements and syntax that are required to run critical data transformations and model scoring functions are available. If you use a statement or function that is not supported, your model is not published to the database. For more information, see “Considerations When Creating or Modifying DATA Step Score Code” in SAS In-Database Products: User’s Guide.
To import models from local files:
1. Click and select from local files.
2. Select a model template from the drop-down list.
Note: If you specify values for the properties and then select a different template, the values are cleared.
3. Click Properties and specify the model properties.
4. Click Files and select the local files from the SAS Workspace Server that match the template files. You cannot delete a file once you have added it. To replace the file, select another file or cancel the import and start over.
Import Models from Local Files 73
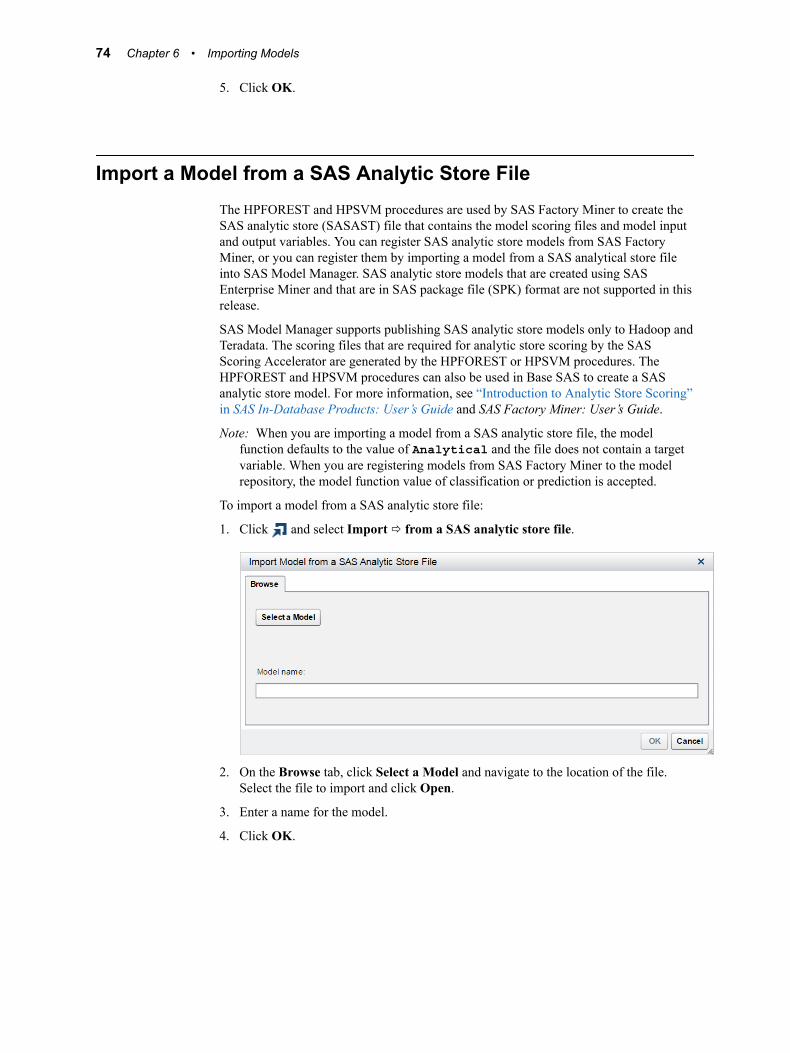
5. Click OK.
Import a Model from a SAS Analytic Store FileThe HPFOREST and HPSVM procedures are used by SAS Factory Miner to create the SAS analytic store (SASAST) file that contains the model scoring files and model input and output variables. You can register SAS analytic store models from SAS Factory Miner, or you can register them by importing a model from a SAS analytical store file into SAS Model Manager. SAS analytic store models that are created using SAS Enterprise Miner and that are in SAS package file (SPK) format are not supported in this release.
SAS Model Manager supports publishing SAS analytic store models only to Hadoop and Teradata. The scoring files that are required for analytic store scoring by the SAS Scoring Accelerator are generated by the HPFOREST or HPSVM procedures. The HPFOREST and HPSVM procedures can also be used in Base SAS to create a SAS analytic store model. For more information, see “Introduction to Analytic Store Scoring” in SAS In-Database Products: User’s Guide and SAS Factory Miner: User’s Guide.
Note: When you are importing a model from a SAS analytic store file, the model function defaults to the value of Analytical and the file does not contain a target variable. When you are registering models from SAS Factory Miner to the model repository, the model function value of classification or prediction is accepted.
To import a model from a SAS analytic store file:
1. Click and select Import ð from a SAS analytic store file.
2. On the Browse tab, click Select a Model and navigate to the location of the file. Select the file to import and click Open.
3. Enter a name for the model.
4. Click OK.
74 Chapter 6 • Importing Models
Export Models from a ProjectTo export an individual model from the Models page of a project to the SAS Workspace Server:
1. Select a model and click .
2. Select a location on the SAS Workspace Server.
Note: You cannot export a model to a location where a model with the same name already exists.
3. Click OK.
4. Click Close.
Importing Models into a Folder
About Importing Models into a FolderYou can import an individual model or multiple models at one time from the SAS Workspace Server into a folder in the model repository. The model repository folders are located on the SAS Content Server. To access the SAS Workspace Server, map a network drive to a drive on the machine where the SAS Model Manager Middle-Tier Server is running. All of the model files in the selected location are imported. The folder name is used as the model name. If you have subfolders, each subfolder is considered to be a separate model. Each folder’s contents are considered to be model files. A folder should not contain both model files and subfolders at the same level. If the top-level folder contains both, the subfolders are ignored and only one model is added with the files that are within the selected folder.
After you import models into a folder, you can also perform the following tasks:
• export one or more models
• update one or more models
• duplicate or move models
Note: These models cannot be moved or copied from a folder to a project within the user interface. When you export models from the folder level, models within a project are not included. Only models that reside directly within the selected folder are exported.
Import Models into a FolderTo import models:
1. Select a folder, click , and select Import models.
Note: Alternatively, right-click a folder and select Import Models.
Importing Models into a Folder 75
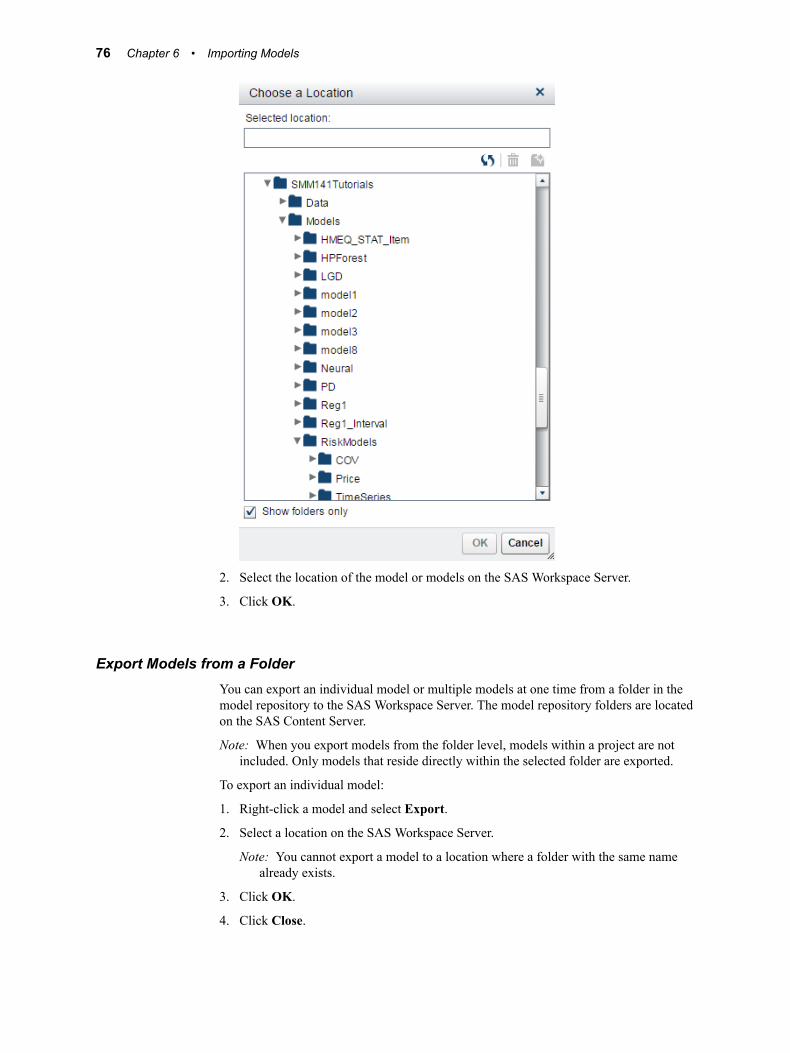
2. Select the location of the model or models on the SAS Workspace Server.
3. Click OK.
Export Models from a FolderYou can export an individual model or multiple models at one time from a folder in the model repository to the SAS Workspace Server. The model repository folders are located on the SAS Content Server.
Note: When you export models from the folder level, models within a project are not included. Only models that reside directly within the selected folder are exported.
To export an individual model:
1. Right-click a model and select Export.
2. Select a location on the SAS Workspace Server.
Note: You cannot export a model to a location where a folder with the same name already exists.
3. Click OK.
4. Click Close.
76 Chapter 6 • Importing Models
To export multiple models:
1. Right-click a folder and select Export Models.
2. Select a location on the SAS Workspace Server.
Note: You cannot export a model to a location where a folder with the same name already exists.
3. Click OK.
4. Click Close.
Update Models in FoldersYou can update an individual model or multiple models at one time in the model repository. Only models that have previously been exported to the SAS Workspace Server can be updated. The reason for this is that a properties file is exported with the model files. The properties file contains the UUIDs of the models. Both new and modified model files are included in the updates to the model. A new model version is created each time you update the model.
To update an individual model:
1. Right-click a model and select Update.
2. Select the location of the model on the SAS Workspace Server.
3. Click OK.
4. Click Close.
To update multiple models:
1. Click and select Update models.
2. Select the location of the model or models on the SAS Workspace Server.
3. Click OK.
4. Click Close.
Duplicate or Move ModelsYou can duplicate a model or move a model to another folder. When you duplicate a model that has multiple model versions, only the current model version is duplicated. When you move a model, all of the model versions are kept.
To duplicate a model:
1. Right-click a model and select Duplicate.
2. Select a location.
Importing Models into a Folder 77

3. Click Duplicate.
To move a model:
1. Right-click a model and select Move.
2. Select a location.
3. Click Move.
78 Chapter 6 • Importing Models
Chapter 7
Managing Model Content and Versions
Overview of Managing Model Content and Versions . . . . . . . . . . . . . . . . . . . . . . . . 79
Set Model Properties . . . . . . . . . . . . . . . . . . . . . . . . . . . . . . . . . . . . . . . . . . . . . . . . . . 79
Add Model User-Defined Properties . . . . . . . . . . . . . . . . . . . . . . . . . . . . . . . . . . . . . . 81
Add and Edit Model Keywords . . . . . . . . . . . . . . . . . . . . . . . . . . . . . . . . . . . . . . . . . . 81
Add Model Dependencies and View Lineage . . . . . . . . . . . . . . . . . . . . . . . . . . . . . . . 83
Add Model Files to an Existing Model . . . . . . . . . . . . . . . . . . . . . . . . . . . . . . . . . . . . 84
Create Input and Output Variables from a SAS Code File . . . . . . . . . . . . . . . . . . . 85
Map Model Variables to Project Variables . . . . . . . . . . . . . . . . . . . . . . . . . . . . . . . . . 86
User-Defined Model Templates . . . . . . . . . . . . . . . . . . . . . . . . . . . . . . . . . . . . . . . . . . 87
Managing Model Versions . . . . . . . . . . . . . . . . . . . . . . . . . . . . . . . . . . . . . . . . . . . . . . 88About Model Versions . . . . . . . . . . . . . . . . . . . . . . . . . . . . . . . . . . . . . . . . . . . . . . . 88Add a Model Version . . . . . . . . . . . . . . . . . . . . . . . . . . . . . . . . . . . . . . . . . . . . . . . . 88Set the Model Version . . . . . . . . . . . . . . . . . . . . . . . . . . . . . . . . . . . . . . . . . . . . . . . . 88
Add Attachments . . . . . . . . . . . . . . . . . . . . . . . . . . . . . . . . . . . . . . . . . . . . . . . . . . . . . 89
Add Comments . . . . . . . . . . . . . . . . . . . . . . . . . . . . . . . . . . . . . . . . . . . . . . . . . . . . . . . 89
Overview of Managing Model Content and Versions
When you open a model, you can modify the model properties, add or view model versions, add attachments, and add comments. You can open a model from the Inventory category and from the Models page of a project.
Set Model PropertiesAfter you import a model, you can specify additional property values for your imported model. On the Model Properties page, you can perform the following tasks:
• View the input and output variables, and create a scoring output table
79

• Map model output variables to project output variables
• Specify model-specific properties and user-defined properties
• View and edit score code
• View and add model files
• Create input and output variables from the score.sas file
• View the history to see a log that shows changes to the model, and to the published models
To set the model properties:
1. Select and open a model and view the Model Properties page. See the below table for what types of properties can be specified.
Model Properties Description
General On this page you can view the model name, who created it, and the dates it was created and modified. The only property that you can edit is the description. For more information, see “General Properties” on page 51.
Specific On this page you can enter information for various items. Some values are automatically populated and cannot be modified. For editable properties, click Browse, enter, or select a value. For more information, see “Specific Properties” on page 251.
System This page is a Read-only and is created after a model has been imported. The system properties for models do not require any configuration after the model is imported. For more information, see “System Properties” on page 54.
User-Defined On this page you can view the user-defined properties for a model. You can also create user-defined properties. For more information, see “User-Defined Properties” on page 54.
Factory Miner On this page you can view the SAS Factory Miner model properties.
Note: This tab only appears for SAS Factory Miner models.
2. Click .
To create a scoring output table, see “Create Scoring Output Tables” on page 116
80 Chapter 7 • Managing Model Content and Versions

Add Model User-Defined Properties1. On the Model Properties page, select Properties ð User-Defined.
2. Click . The Add User-Defined Properties window appears.
3. Click to insert a new row.
Note: Alternatively, you can click Advanced to manually specify the name and value pairs for the new properties.
4. Specify a name and data type for the property. A value for the property is optional.
5. Click OK.
6. (Optional) Select a user-defined property and click to view the history of changes for that property. Click Close.
Add and Edit Model KeywordsSelect Properties ð General to view the model keywords.
To add keywords:
1. Click . The Select Keywords window appears.
Add and Edit Model Keywords 81

2. (Optional) Click Edit Keywords to add or remove keywords from the list. The Edit Keywords window appears.
a. Click to add a keyword to the list. Enter a value for the keyword and specify a category.
b. Select a keyword and click to remove it from the list. Click Remove in the confirmation message.
c. Click OK.
3. Select one or more keywords from the list.
4. Click OK.
5. Click to save the model properties.
82 Chapter 7 • Managing Model Content and Versions

Add Model Dependencies and View LineageSelect Properties ð General to view the model dependencies.
To add model dependencies:
1. Click . The Select Dependent Models window appears.
2. Select one or more models.
3. Click OK.
4. Click to save the model properties.
5. Click to view the lineage of the model. The SAS Lineage application appears.
Add Model Dependencies and View Lineage 83

Note: For information about SAS Lineage and using the lineage viewer, select Help.
To remove model dependencies:
1. Select one or more models from the list.
2. Click .
3. Click to save the model properties.
Add Model Files to an Existing ModelSuppose you want to import a model, but you lack some of the model component files that are needed to complete a model import. The model files utility enables you to add files later that were not available when the model was originally imported.
To add a local file to an existing model:
1. Select and open a model.
2. On the Model Properties page, select Advanced ð Model Files.
3. Click .
4. Select a row and click Browse to select the local files that match the template files.
Note: Not all files must be specified. You can specify one or more.
84 Chapter 7 • Managing Model Content and Versions
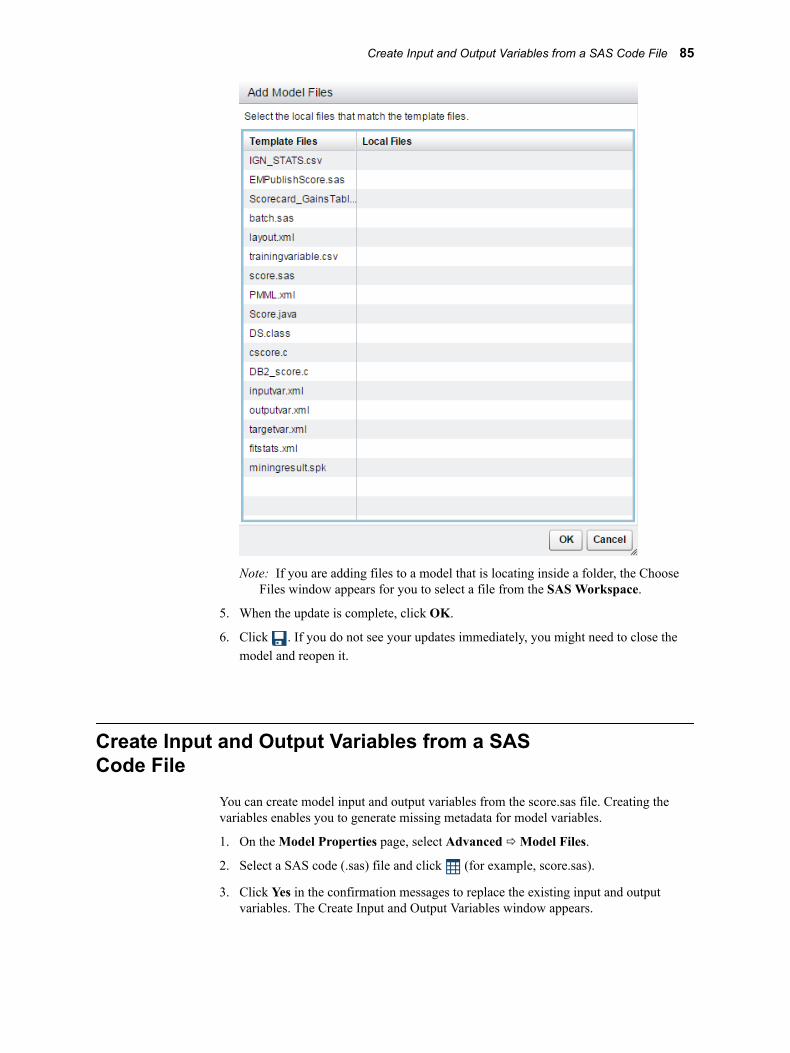
Note: If you are adding files to a model that is locating inside a folder, the Choose Files window appears for you to select a file from the SAS Workspace.
5. When the update is complete, click OK.
6. Click . If you do not see your updates immediately, you might need to close the model and reopen it.
Create Input and Output Variables from a SAS Code File
You can create model input and output variables from the score.sas file. Creating the variables enables you to generate missing metadata for model variables.
1. On the Model Properties page, select Advanced ð Model Files.
2. Select a SAS code (.sas) file and click (for example, score.sas).
3. Click Yes in the confirmation messages to replace the existing input and output variables. The Create Input and Output Variables window appears.
Create Input and Output Variables from a SAS Code File 85

Note: If a champion is already set, you might receive another message indicating that the champion and challenger models will be cleared. Also, if you add new variables that are not project variables, you are prompted to add the model variables to the project variables when setting the model as the champion.
4. Select input variables that you want to add as output variables for the model.
5. Click OK. The inputvar.xml and outputvar.xml model files are generated.
Map Model Variables to Project VariablesAfter a model has been imported and the remaining model properties are set on the Model Properties page, you must map the model output variables to the project output variables. For more information about project input and output tables, see Defining Project Input and Output Variables on page 55.
To map model variables to project variables:
1. Select and open a model.
2. Select Model Properties ð Output Mapping.
3. Click the box in the Value column beside the variable in the Property column to display project variables.
86 Chapter 7 • Managing Model Content and Versions

4. Select a model output variable.
5. Repeat steps 3 and 4 for each model variable that requires mapping.
6. Click .
User-Defined Model TemplatesWhen you import a SAS code model or R model, you must define the component files to be used in the model and specify the properties for the model. SAS Model Manager provides model templates that you can use as an example to create your own model template. You can define model component files and specify system and user properties for your model template. The model templates that are included cannot be modified. For a list of the component files that must be created for the different model types, see “Model Template Component Files” on page 242. For a list of properties, see “Specific Properties” on page 251.
Note: Only users who are in the Model Manager Administrator Users or Model Manager Advanced Users groups and who have Write permission to the WebDAV folder where the user-defined templates are stored can save a new template or save changes to an existing template. For more information, see “Verify WebDAV Folder Permissions for User-Defined Templates ” in SAS Model Manager: Administrator’s Guide.
Several sample user template XML files are included with the installation package and are available to be used as a starting point for creating your own model template. For more information, see “Creating and Managing Templates” on page 60.
User-Defined Model Templates 87
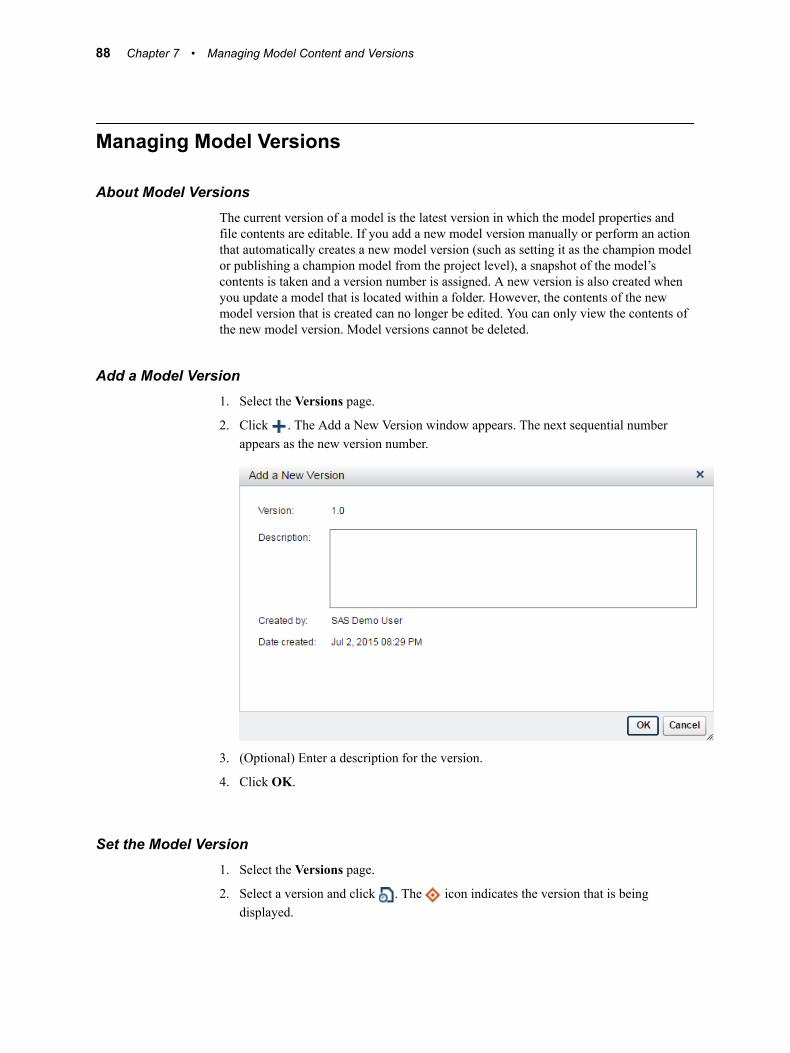
Managing Model Versions
About Model VersionsThe current version of a model is the latest version in which the model properties and file contents are editable. If you add a new model version manually or perform an action that automatically creates a new model version (such as setting it as the champion model or publishing a champion model from the project level), a snapshot of the model’s contents is taken and a version number is assigned. A new version is also created when you update a model that is located within a folder. However, the contents of the new model version that is created can no longer be edited. You can only view the contents of the new model version. Model versions cannot be deleted.
Add a Model Version1. Select the Versions page.
2. Click . The Add a New Version window appears. The next sequential number appears as the new version number.
3. (Optional) Enter a description for the version.
4. Click OK.
Set the Model Version1. Select the Versions page.
2. Select a version and click . The icon indicates the version that is being displayed.
88 Chapter 7 • Managing Model Content and Versions
Add AttachmentsYou can view and add attachments such as images or documents. Attachments can be added at the object-level for portfolios, projects, and models.
To add an attachment:
1. Select the Attachments page.
2. Click .
3. Select a file to attach and click Open.
Note: Click to remove an attachment.
See Also“Add Attachments to a Project” on page 59
Add CommentsYou can add new topics or respond to an existing topic. You can also search the comments. Comments can be added at the object-level for portfolios, projects, and models.
To add a comment:
1. Select the Comments page
2. Enter a topic name and a comment.
3. (Optional) Click to attach a file to the new topic. Repeat this step to attach multiple files.
Note: You can also click Remove to remove an attachment.
4. Click Post.
See Also“Add Comments to a Project” on page 59
Add Comments 89

90 Chapter 7 • Managing Model Content and Versions

Chapter 8
Working with Model Inventory
Overview of Model Inventory . . . . . . . . . . . . . . . . . . . . . . . . . . . . . . . . . . . . . . . . . . . 91
Search and Filter Inventory of Models . . . . . . . . . . . . . . . . . . . . . . . . . . . . . . . . . . . . 91
Add Model User-Defined Properties to Inventory List . . . . . . . . . . . . . . . . . . . . . . . 92
Overview of Model InventoryThe Inventory category enables you to access all of the models in the model repository in one place, whether they are located in a folder, portfolio, or project. You can also filter the search results by date modified, keywords, model properties, and user-defined properties. You can add user-defined properties as columns in the list in order to display the values for each model.
Search and Filter Inventory of ModelsIn addition to entering search terms in the search box, you can filter the search results by date modified, keywords, model properties, and user-defined properties.
1. Select Models ð Inventory.
2. In the search box, enter the search terms that you want to include in the new search.
3. Click . The additional search options appear.
91

4. Expand one or more search options and specify values to filter the search results. The model inventory list is filtered automatically.
For example, select Regression from the Algorithm property drop-down list.
5. (Optional) Save your search.
Note: You cannot modify an existing search, but you can create a new one and replace the old one.
a. Click Save Search. The Save Search window appears.
b. In the Save Search window, enter the name of the new search or enter the same name as the saved search that you want to update.
c. (Optional) Enter a description.
d. Click Save.
e. In the confirmation window, click Yes to replace the existing search.
Add Model User-Defined Properties to Inventory List
You can add user-defined properties as columns to the list. The values of the properties are displayed for each model.
To add user-defined properties to the list:
1. Click .
92 Chapter 8 • Working with Model Inventory
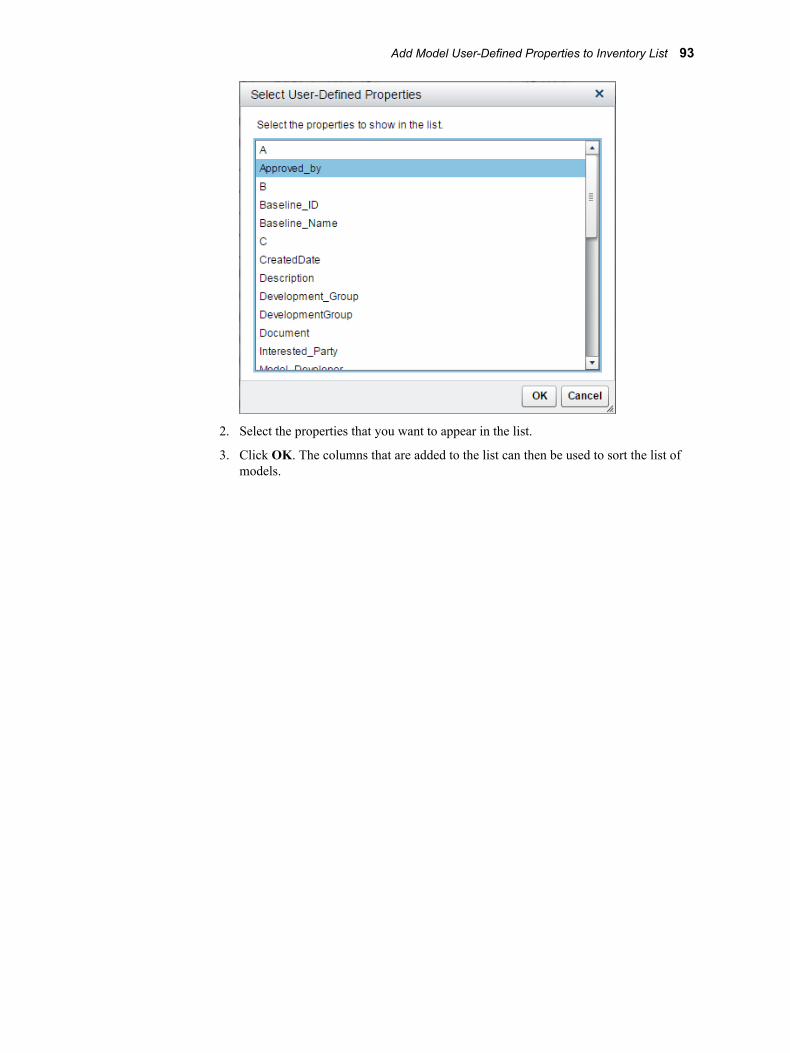
2. Select the properties that you want to appear in the list.
3. Click OK. The columns that are added to the list can then be used to sort the list of models.
Add Model User-Defined Properties to Inventory List 93

94 Chapter 8 • Working with Model Inventory

Chapter 9
Working with Portfolios
Overview of Portfolios . . . . . . . . . . . . . . . . . . . . . . . . . . . . . . . . . . . . . . . . . . . . . . . . . 95
Planning a Portfolio . . . . . . . . . . . . . . . . . . . . . . . . . . . . . . . . . . . . . . . . . . . . . . . . . . . 96
Prerequisites for Creating Portfolios . . . . . . . . . . . . . . . . . . . . . . . . . . . . . . . . . . . . . 97
Creating a Project Control Table . . . . . . . . . . . . . . . . . . . . . . . . . . . . . . . . . . . . . . . . 98
Create a New Portfolio . . . . . . . . . . . . . . . . . . . . . . . . . . . . . . . . . . . . . . . . . . . . . . . . . 99
Add a New Version . . . . . . . . . . . . . . . . . . . . . . . . . . . . . . . . . . . . . . . . . . . . . . . . . . . 101
Add an Input Variable . . . . . . . . . . . . . . . . . . . . . . . . . . . . . . . . . . . . . . . . . . . . . . . . 102
Publishing Models from a Portfolio . . . . . . . . . . . . . . . . . . . . . . . . . . . . . . . . . . . . . 103About Publishing Models . . . . . . . . . . . . . . . . . . . . . . . . . . . . . . . . . . . . . . . . . . . . 103Publishing Project Champion Models . . . . . . . . . . . . . . . . . . . . . . . . . . . . . . . . . . 103Publish Champion and Challenger Models . . . . . . . . . . . . . . . . . . . . . . . . . . . . . . 104Remove Published Models from a Database . . . . . . . . . . . . . . . . . . . . . . . . . . . . . 107
Monitor Performance of Project Champion Models . . . . . . . . . . . . . . . . . . . . . . . . 107
Add Attachments . . . . . . . . . . . . . . . . . . . . . . . . . . . . . . . . . . . . . . . . . . . . . . . . . . . . 110
Add Comments . . . . . . . . . . . . . . . . . . . . . . . . . . . . . . . . . . . . . . . . . . . . . . . . . . . . . . 111
Overview of PortfoliosSAS Model Manager enables you to create a portfolio in the model repository. You use a portfolio to manage multiple projects and models in one place. From a portfolio level, you can create multiple projects from a control table and then add new versions or new input variables to all projects within the portfolio. After you set the champion model for each project, you can monitor the performance of the champion models for all projects and publish the champion models to the SAS Metadata Repository.
Portfolios are also created when you use SAS Factory Miner to register projects to the model repository. The portfolios contain the project segments and models from the SAS Factory Miner project. For more information about how to register SAS Factory Miner project segments and models, see SAS Factory Miner: User’s Guide
Note: Because of how portfolios and projects are created in the SAS Model Manager model repository, SAS Factory Miner project names, model names, and segment variable values cannot contain special characters. That is, only alphanumeric
95

characters, the underscore, and the hyphen are allowed. Users are unable to register models when special characters are encountered.
Here are the tasks that can be performed for a portfolio:
• Create a portfolio
• Add a new version
• Add an input variable to all projects
• Publish project champion models
• Monitor performance of project champion models
Planning a PortfolioBefore you begin a portfolio, you must plan your portfolio resources. Here are questions to consider and conditions to meet for modeling projects within a portfolio:
• After you know which users are assigned to the projects within a portfolio, a SAS Model Manager administrator must ensure that the user is assigned to the appropriate user group and role. For more information, see “Configuring Users, Groups, and Roles” in SAS Model Manager: Administrator’s Guide.
• How do you want to structure the projects within the portfolio? A portfolio is an object within a folder. The Portfolios category view enables multiple levels of folders so that you can customize how you structure the portfolios. For more information, see Chapter 4, “Managing Folders,” on page 41.
• What models do you want to use in each project of the portfolio? If the models were created using SAS Enterprise Miner, SAS/STAT, or the SAS/ETS procedures COUNTREG and SEVERITY, all model components are available to SAS Model Manager when you import the model. Only models that are contained in an SPK file can be imported. At least one SPK file must be prepared for each project and the SPK files should be placed in the same location. If your model is a SAS code model or a PMML model that is not contained in an SPK file, you must import it separately into the desired project within the portfolio, after the portfolio is created. You must also ensure that you have imported all of the model component files. For more information, see “Import Models from Local Files” on page 72 and “Import a PMML Model” on page 71.
• What model function do you want to use in each project of the portfolio?
96 Chapter 9 • Working with Portfolios
SAS Model Manager has several model function types:
• Classification
• Prediction
• Segmentation
• Analytical
After the model function is specified for the portfolio, the Model function property for a project cannot be changed. Ensure that the types of models that you are going to use in each project of the portfolio fit within the selected model function type. For more information, see Table 5.1 on page 52.
• How do you want to define your project input and output variables? When you create a portfolio, you can import the variables using input and output prototype tables. The project variables are set for each project within the portfolio. The prototype tables must be registered in the SAS Metadata Repository. Tables that were registered using the SAS Management Console must also be made available in the Data category view before you create the portfolio. For more information, see “Defining Project Input and Output Variables” on page 55.
• What method do you want to use to track the progress of a version? The Workflows and My Tasks category views enable you to track the progress of tasks from the version level for each individual project within a portfolio. An authorized user can create a workflow and associate it with a version. For more information, see “Overview of Using Workflows” on page 229.
• When you publish project champion models from a portfolio to the SAS Metadata Repository, you must specify a location in which to store the models. You might need to create a folder in the SAS Metadata Repository, if one does not already exist. For more information, see “Publishing Models from a Portfolio” on page 103.
• After your project champion models are in a production environment, you can monitor the performance of the project champion models within a portfolio in SAS Model Manager using your organization's operational data. If you use SAS Model Manager to monitor performance of projects within a portfolio, you must first prepare performance tables using the operational data and then register the tables in the SAS Metadata Repository using the Data category view. Tables that are registered to the SAS Metadata Repository using SAS Management Console must also be made available to the Data category view. For more information, see “Creating a Performance Table” on page 260.
• When you run performance monitoring reports, you can set up performance index alert and warning conditions to notify users if conditions exceed the indexes. For more information, see “Performance Index Warnings and Alerts” on page 173.
Prerequisites for Creating PortfoliosAfter you have planned the projects and models that you want to have in your portfolio, you must create a project control table that contains the segment identifiers, projects, and models. The project control table can then be used to create a hierarchy of your portfolio.
Portfolios can be created only by authorized users who have the capability to access the Portfolios category. Ensure that users who create portfolios are assigned to the group Model Manager Administrator Users or Model Manager Advanced Users in SAS Management Console.
Prerequisites for Creating Portfolios 97
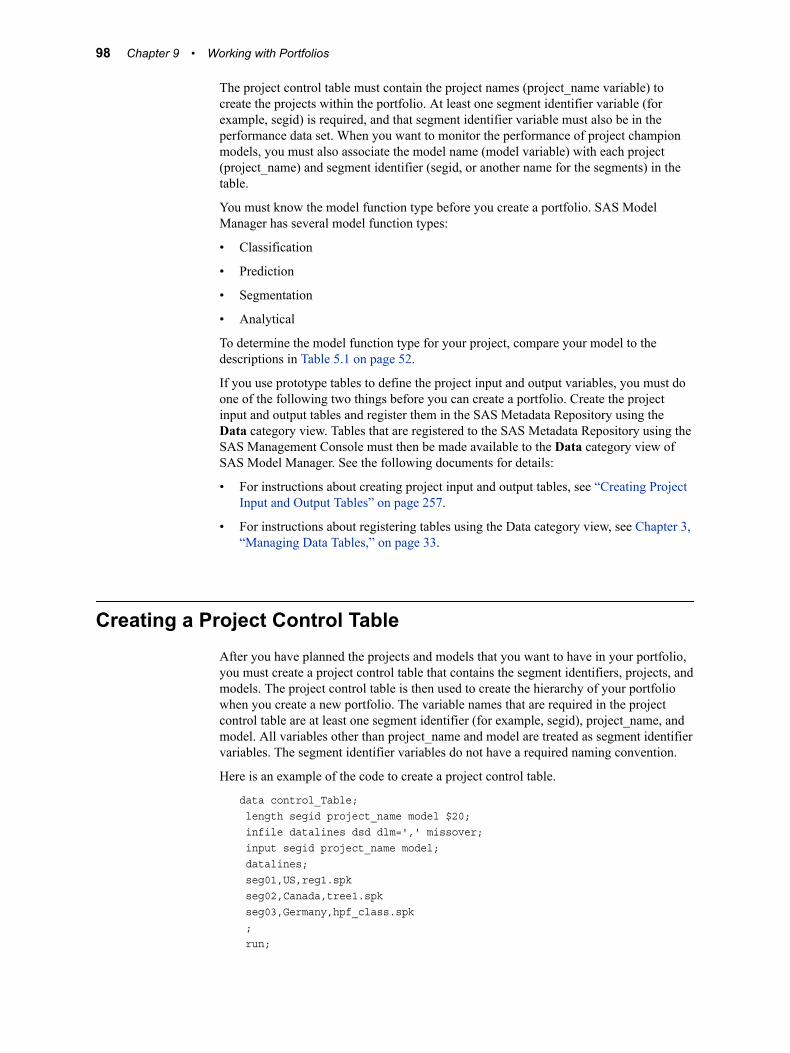
The project control table must contain the project names (project_name variable) to create the projects within the portfolio. At least one segment identifier variable (for example, segid) is required, and that segment identifier variable must also be in the performance data set. When you want to monitor the performance of project champion models, you must also associate the model name (model variable) with each project (project_name) and segment identifier (segid, or another name for the segments) in the table.
You must know the model function type before you create a portfolio. SAS Model Manager has several model function types:
• Classification
• Prediction
• Segmentation
• Analytical
To determine the model function type for your project, compare your model to the descriptions in Table 5.1 on page 52.
If you use prototype tables to define the project input and output variables, you must do one of the following two things before you can create a portfolio. Create the project input and output tables and register them in the SAS Metadata Repository using the Data category view. Tables that are registered to the SAS Metadata Repository using the SAS Management Console must then be made available to the Data category view of SAS Model Manager. See the following documents for details:
• For instructions about creating project input and output tables, see “Creating Project Input and Output Tables” on page 257.
• For instructions about registering tables using the Data category view, see Chapter 3, “Managing Data Tables,” on page 33.
Creating a Project Control TableAfter you have planned the projects and models that you want to have in your portfolio, you must create a project control table that contains the segment identifiers, projects, and models. The project control table is then used to create the hierarchy of your portfolio when you create a new portfolio. The variable names that are required in the project control table are at least one segment identifier (for example, segid), project_name, and model. All variables other than project_name and model are treated as segment identifier variables. The segment identifier variables do not have a required naming convention.
Here is an example of the code to create a project control table.
data control_Table; length segid project_name model $20; infile datalines dsd dlm=',' missover; input segid project_name model; datalines; seg01,US,reg1.spk seg02,Canada,tree1.spk seg03,Germany,hpf_class.spk ; run;
98 Chapter 9 • Working with Portfolios
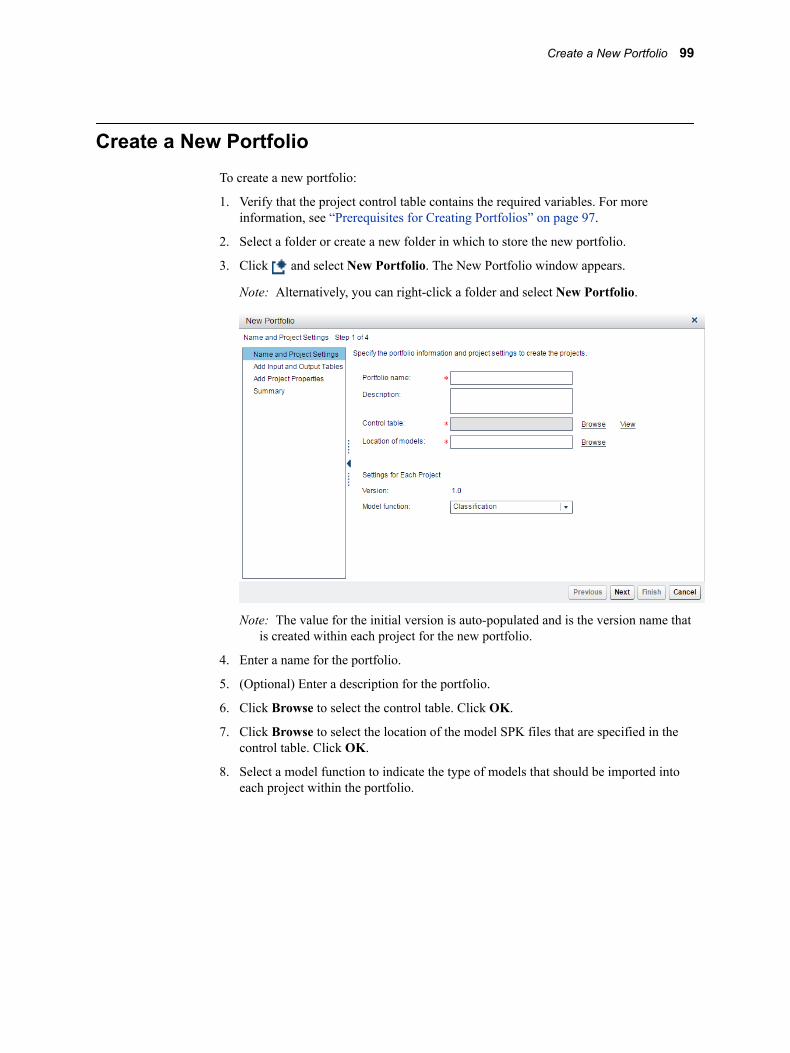
Create a New PortfolioTo create a new portfolio:
1. Verify that the project control table contains the required variables. For more information, see “Prerequisites for Creating Portfolios” on page 97.
2. Select a folder or create a new folder in which to store the new portfolio.
3. Click and select New Portfolio. The New Portfolio window appears.
Note: Alternatively, you can right-click a folder and select New Portfolio.
Note: The value for the initial version is auto-populated and is the version name that is created within each project for the new portfolio.
4. Enter a name for the portfolio.
5. (Optional) Enter a description for the portfolio.
6. Click Browse to select the control table. Click OK.
7. Click Browse to select the location of the model SPK files that are specified in the control table. Click OK.
8. Select a model function to indicate the type of models that should be imported into each project within the portfolio.
Create a New Portfolio 99
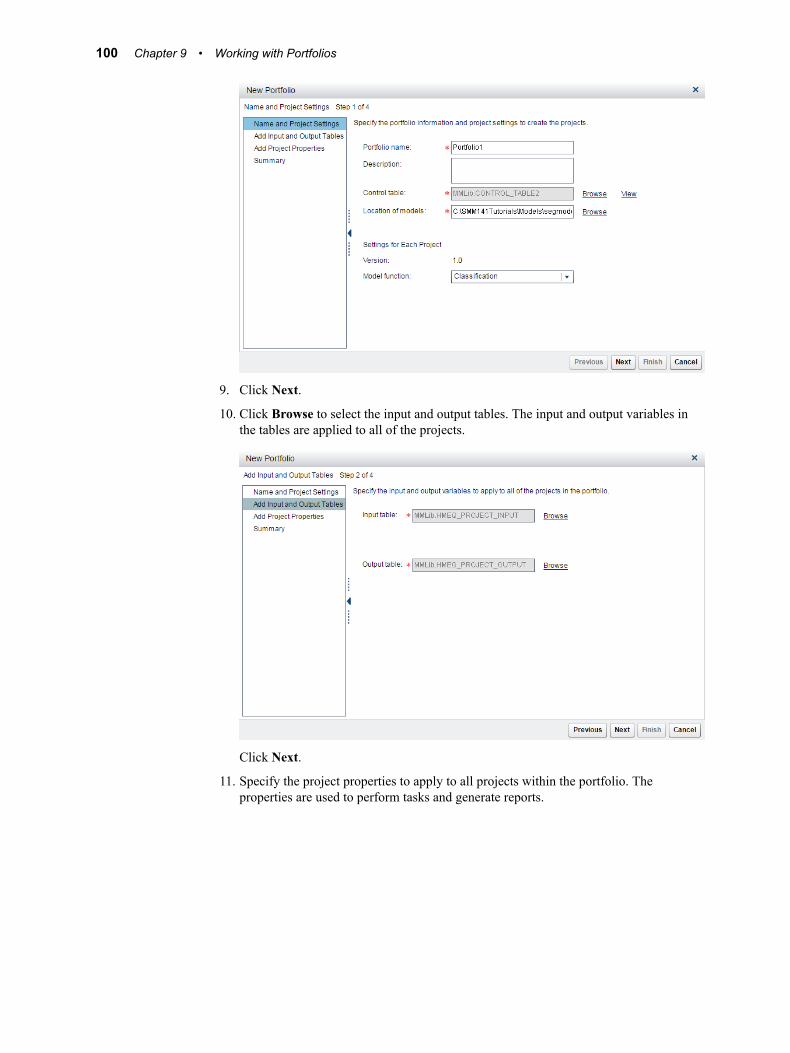
9. Click Next.
10. Click Browse to select the input and output tables. The input and output variables in the tables are applied to all of the projects.
Click Next.
11. Specify the project properties to apply to all projects within the portfolio. The properties are used to perform tasks and generate reports.
100 Chapter 9 • Working with Portfolios
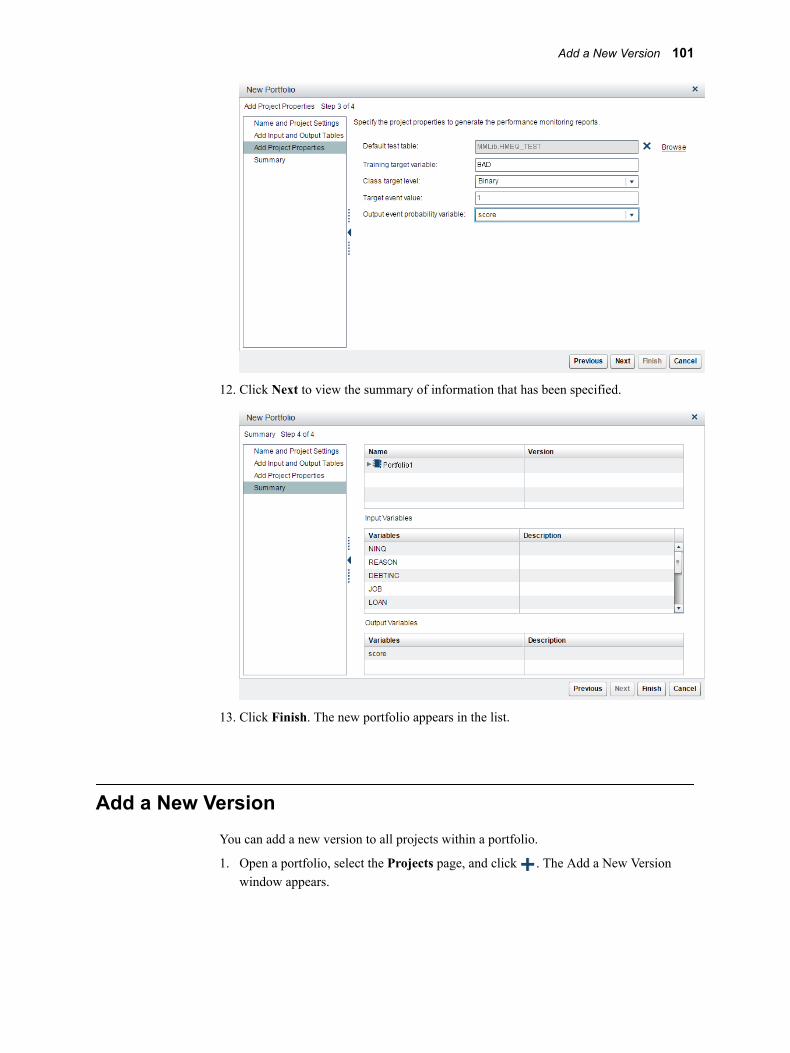
12. Click Next to view the summary of information that has been specified.
13. Click Finish. The new portfolio appears in the list.
Add a New VersionYou can add a new version to all projects within a portfolio.
1. Open a portfolio, select the Projects page, and click . The Add a New Version window appears.
Add a New Version 101
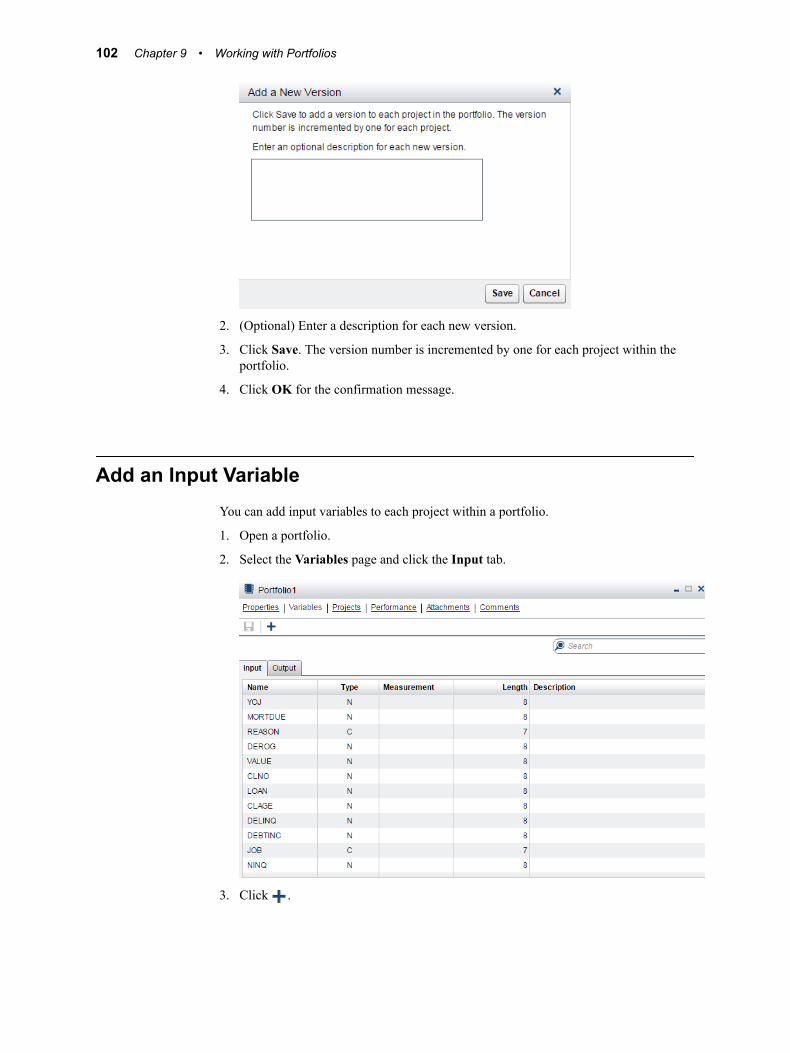
2. (Optional) Enter a description for each new version.
3. Click Save. The version number is incremented by one for each project within the portfolio.
4. Click OK for the confirmation message.
Add an Input VariableYou can add input variables to each project within a portfolio.
1. Open a portfolio.
2. Select the Variables page and click the Input tab.
3. Click .
102 Chapter 9 • Working with Portfolios

4. Enter a name.
5. (Optional) Enter a description.
6. Select a type.
7. (Optional) Enter a measurement.
8. Enter a length.
9. Click OK. The input variable is added to the portfolio and to all projects within the portfolio.
Publishing Models from a Portfolio
About Publishing ModelsTo publish the champion models and challenger models for projects within a portfolio, you must have already set the models that you want to publish as project champion models or challengers. SAS Model Manager examines the projects and always publishes the champion models. When the champion model for a project changes and you publish the model again to the same location, the scoring application automatically uses the latest score code. In the Portfolios category view, when you select a portfolio, you only can publish the project champion models to the SAS Metadata Repository. When you open a portfolio, the Projects page offers you the option of publishing a project champion model and its challengers to the SAS Metadata Repository, a SAS Channel, and to a configured database or Hadoop.
Note: SAS Model Manager cannot publish R models. SAS analytic store models within a project segment can be published only to Hadoop and Teradata. Publishing SAS analytic store models to the SAS Metadata Repository is not supported.
To verify that a champion model has been assigned to all of the projects within a portfolio that you want to publish. Open a project and select Properties ð Specific. The Champion version property contains the name of the champion version. For more information, see “Champion Models” on page 208.
Publishing Project Champion ModelsIn the Portfolios category view, you can publish the champion models for projects within a portfolio to the SAS Metadata Repository.
Publishing Models from a Portfolio 103
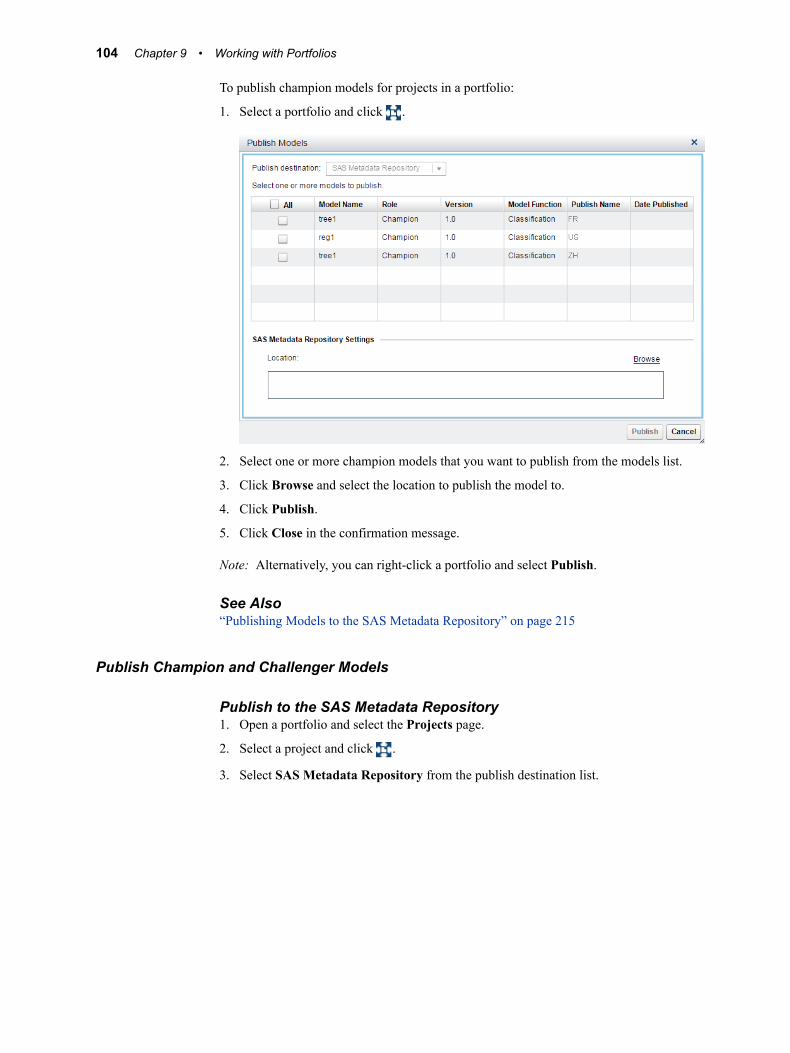
To publish champion models for projects in a portfolio:
1. Select a portfolio and click .
2. Select one or more champion models that you want to publish from the models list.
3. Click Browse and select the location to publish the model to.
4. Click Publish.
5. Click Close in the confirmation message.
Note: Alternatively, you can right-click a portfolio and select Publish.
See Also“Publishing Models to the SAS Metadata Repository” on page 215
Publish Champion and Challenger Models
Publish to the SAS Metadata Repository1. Open a portfolio and select the Projects page.
2. Select a project and click .
3. Select SAS Metadata Repository from the publish destination list.
104 Chapter 9 • Working with Portfolios
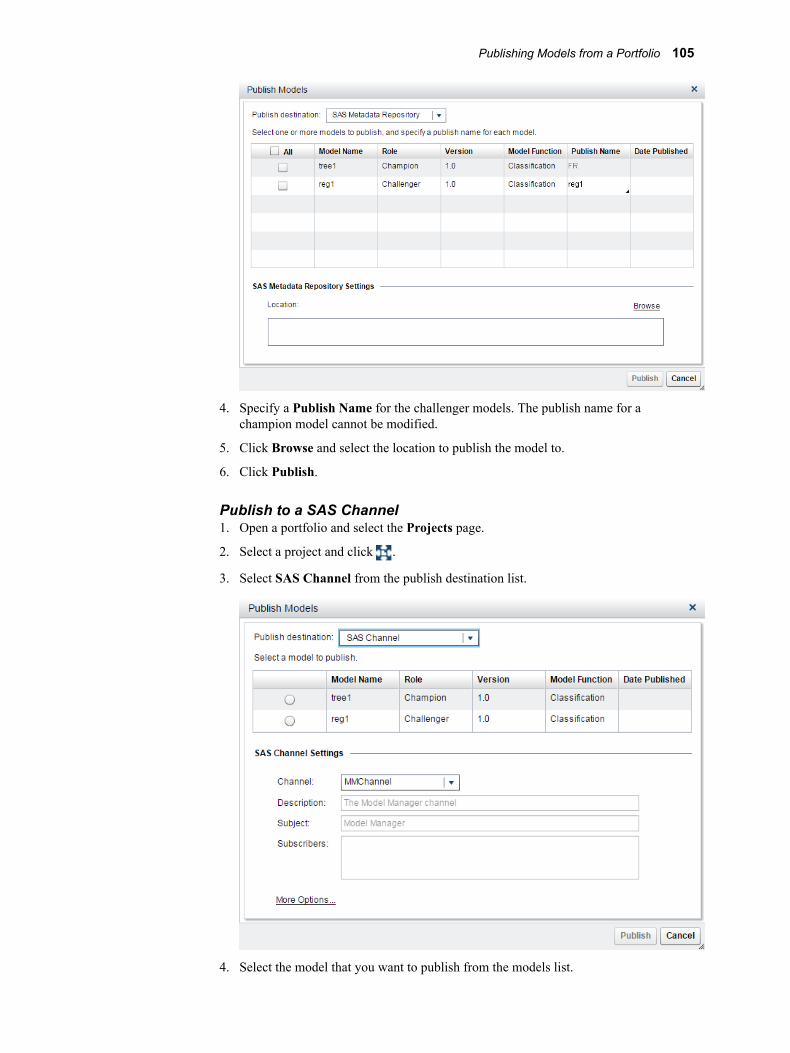
4. Specify a Publish Name for the challenger models. The publish name for a champion model cannot be modified.
5. Click Browse and select the location to publish the model to.
6. Click Publish.
Publish to a SAS Channel1. Open a portfolio and select the Projects page.
2. Select a project and click .
3. Select SAS Channel from the publish destination list.
4. Select the model that you want to publish from the models list.
Publishing Models from a Portfolio 105
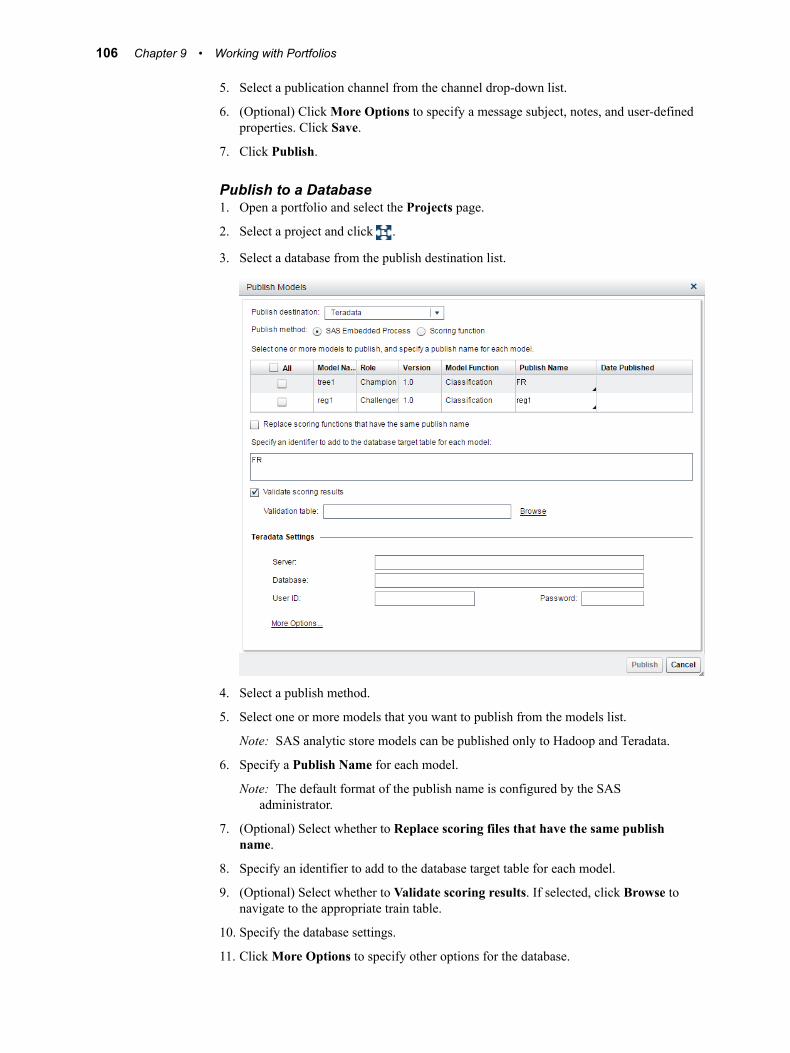
5. Select a publication channel from the channel drop-down list.
6. (Optional) Click More Options to specify a message subject, notes, and user-defined properties. Click Save.
7. Click Publish.
Publish to a Database1. Open a portfolio and select the Projects page.
2. Select a project and click .
3. Select a database from the publish destination list.
4. Select a publish method.
5. Select one or more models that you want to publish from the models list.
Note: SAS analytic store models can be published only to Hadoop and Teradata.
6. Specify a Publish Name for each model.
Note: The default format of the publish name is configured by the SAS administrator.
7. (Optional) Select whether to Replace scoring files that have the same publish name.
8. Specify an identifier to add to the database target table for each model.
9. (Optional) Select whether to Validate scoring results. If selected, click Browse to navigate to the appropriate train table.
10. Specify the database settings.
11. Click More Options to specify other options for the database.
106 Chapter 9 • Working with Portfolios
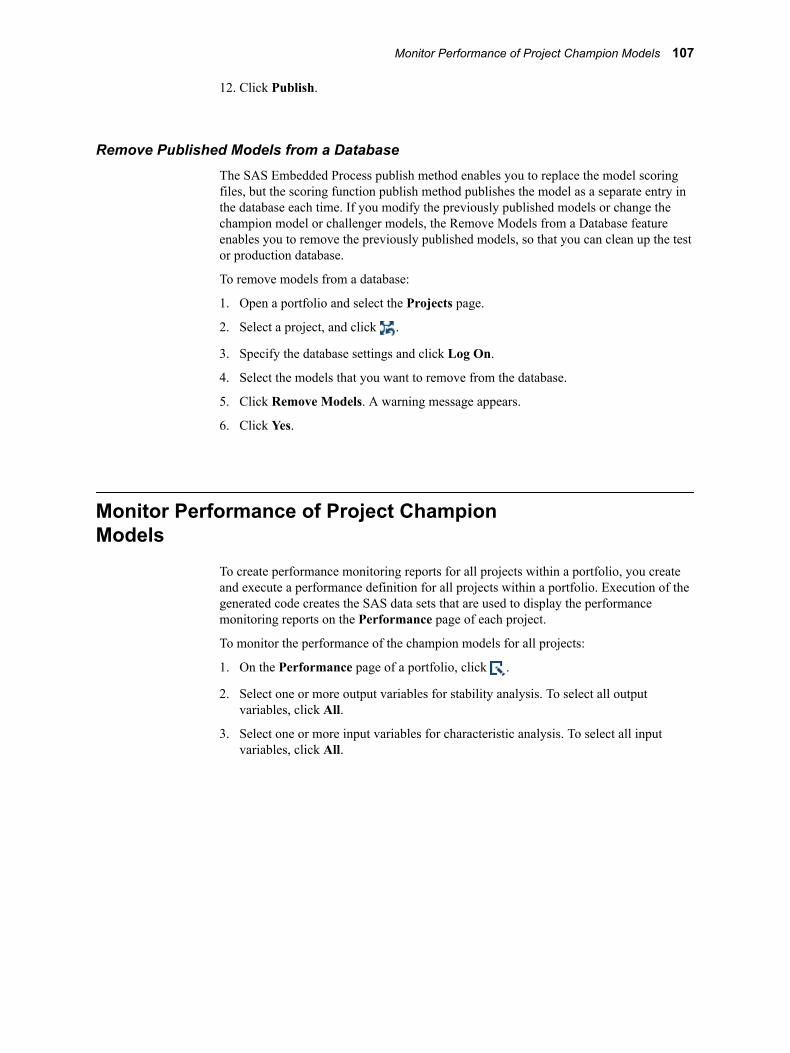
12. Click Publish.
Remove Published Models from a DatabaseThe SAS Embedded Process publish method enables you to replace the model scoring files, but the scoring function publish method publishes the model as a separate entry in the database each time. If you modify the previously published models or change the champion model or challenger models, the Remove Models from a Database feature enables you to remove the previously published models, so that you can clean up the test or production database.
To remove models from a database:
1. Open a portfolio and select the Projects page.
2. Select a project, and click .
3. Specify the database settings and click Log On.
4. Select the models that you want to remove from the database.
5. Click Remove Models. A warning message appears.
6. Click Yes.
Monitor Performance of Project Champion Models
To create performance monitoring reports for all projects within a portfolio, you create and execute a performance definition for all projects within a portfolio. Execution of the generated code creates the SAS data sets that are used to display the performance monitoring reports on the Performance page of each project.
To monitor the performance of the champion models for all projects:
1. On the Performance page of a portfolio, click .
2. Select one or more output variables for stability analysis. To select all output variables, click All.
3. Select one or more input variables for characteristic analysis. To select all input variables, click All.
Monitor Performance of Project Champion Models 107
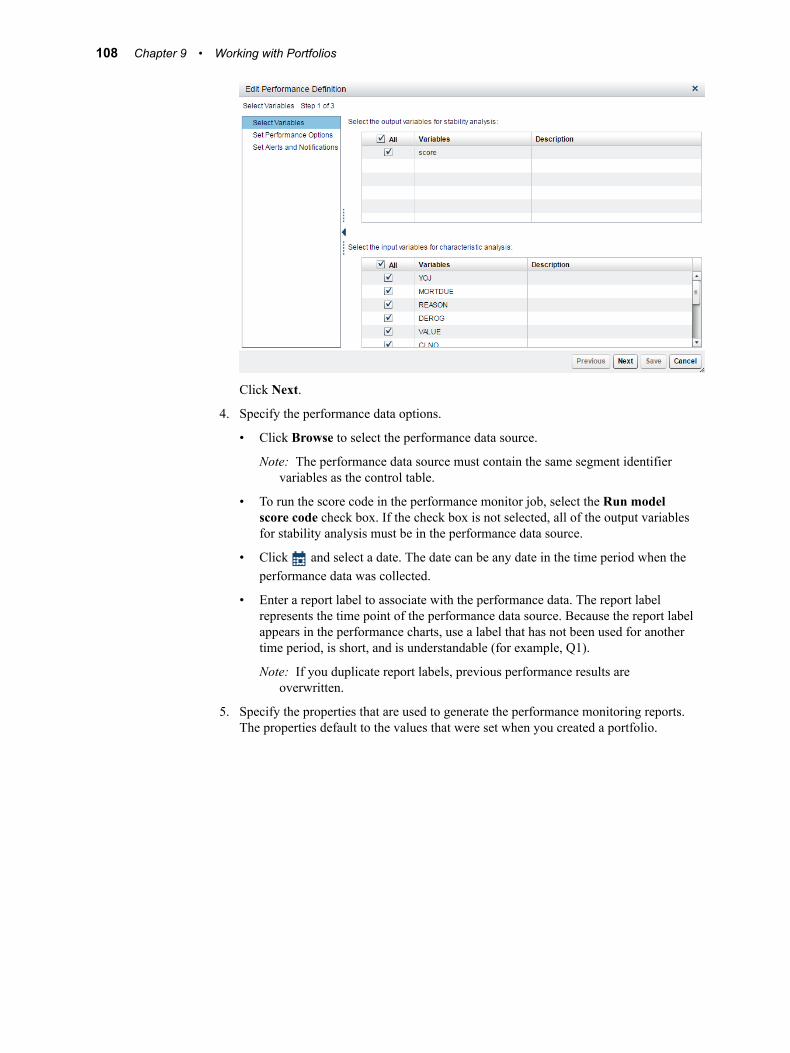
Click Next.
4. Specify the performance data options.
• Click Browse to select the performance data source.
Note: The performance data source must contain the same segment identifier variables as the control table.
• To run the score code in the performance monitor job, select the Run model score code check box. If the check box is not selected, all of the output variables for stability analysis must be in the performance data source.
• Click and select a date. The date can be any date in the time period when the performance data was collected.
• Enter a report label to associate with the performance data. The report label represents the time point of the performance data source. Because the report label appears in the performance charts, use a label that has not been used for another time period, is short, and is understandable (for example, Q1).
Note: If you duplicate report labels, previous performance results are overwritten.
5. Specify the properties that are used to generate the performance monitoring reports. The properties default to the values that were set when you created a portfolio.
108 Chapter 9 • Working with Portfolios
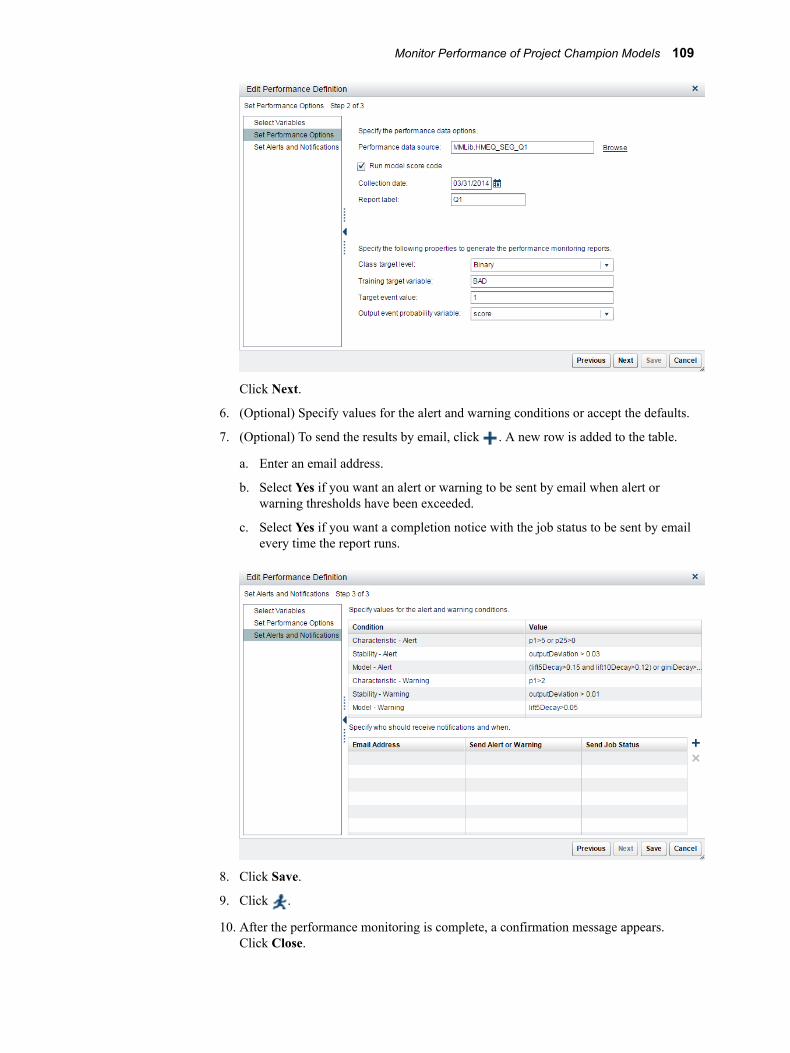
Click Next.
6. (Optional) Specify values for the alert and warning conditions or accept the defaults.
7. (Optional) To send the results by email, click . A new row is added to the table.
a. Enter an email address.
b. Select Yes if you want an alert or warning to be sent by email when alert or warning thresholds have been exceeded.
c. Select Yes if you want a completion notice with the job status to be sent by email every time the report runs.
8. Click Save.
9. Click .
10. After the performance monitoring is complete, a confirmation message appears. Click Close.
Monitor Performance of Project Champion Models 109
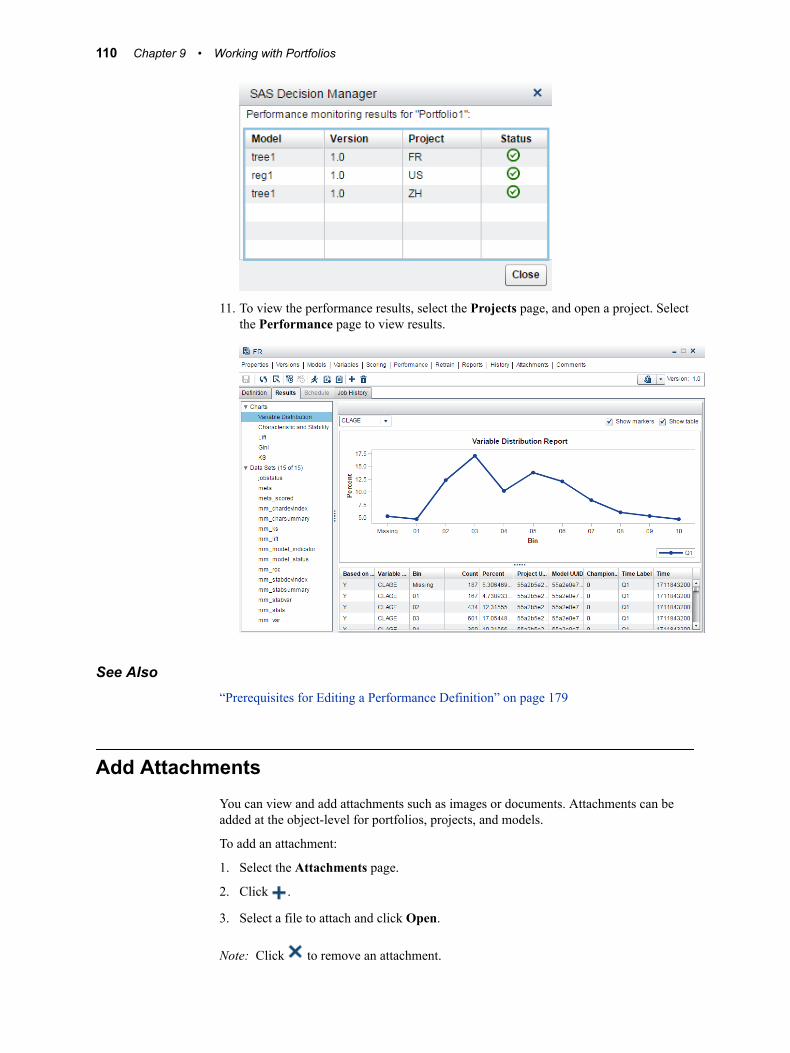
11. To view the performance results, select the Projects page, and open a project. Select the Performance page to view results.
See Also“Prerequisites for Editing a Performance Definition” on page 179
Add AttachmentsYou can view and add attachments such as images or documents. Attachments can be added at the object-level for portfolios, projects, and models.
To add an attachment:
1. Select the Attachments page.
2. Click .
3. Select a file to attach and click Open.
Note: Click to remove an attachment.
110 Chapter 9 • Working with Portfolios
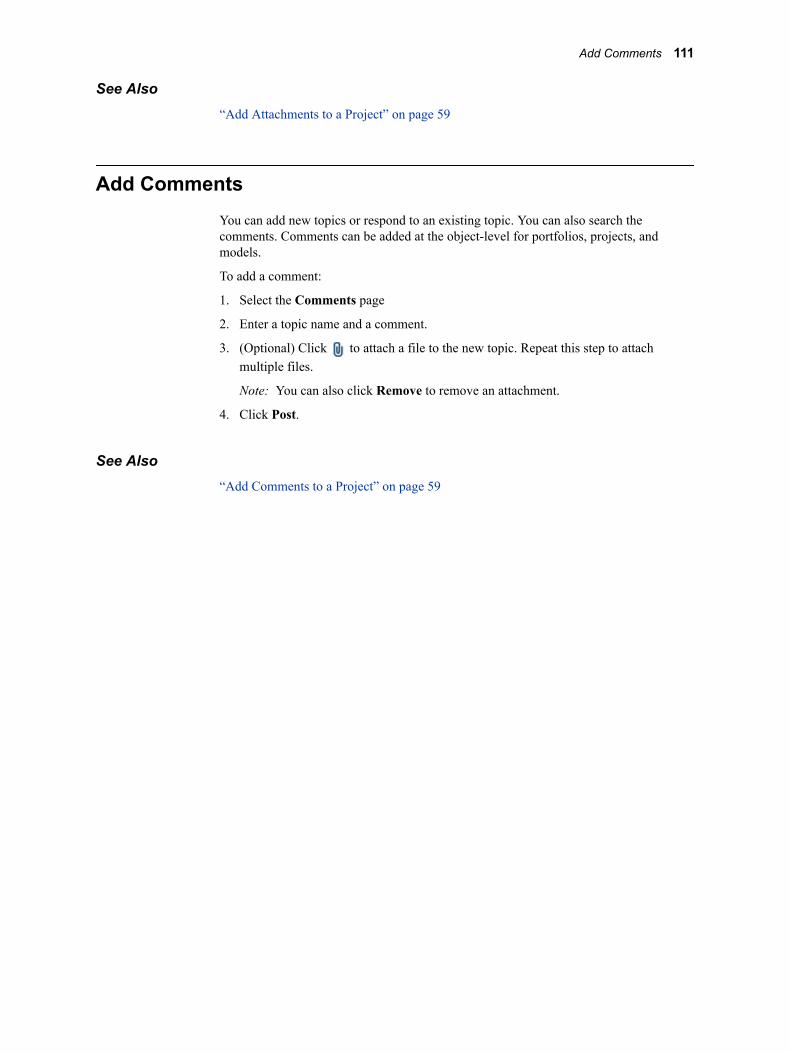
See Also“Add Attachments to a Project” on page 59
Add CommentsYou can add new topics or respond to an existing topic. You can also search the comments. Comments can be added at the object-level for portfolios, projects, and models.
To add a comment:
1. Select the Comments page
2. Enter a topic name and a comment.
3. (Optional) Click to attach a file to the new topic. Repeat this step to attach multiple files.
Note: You can also click Remove to remove an attachment.
4. Click Post.
See Also“Add Comments to a Project” on page 59
Add Comments 111

112 Chapter 9 • Working with Portfolios

Part 3
Evaluating Models and Monitoring Performance
Chapter 10Scoring Models . . . . . . . . . . . . . . . . . . . . . . . . . . . . . . . . . . . . . . . . . . . . . . . . . 115
Chapter 11Using Reports to Evaluate and Validate Models . . . . . . . . . . . . . . . . . 123
Chapter 12Validating Models Using User Reports . . . . . . . . . . . . . . . . . . . . . . . . . . 147
Chapter 13Combining Reports . . . . . . . . . . . . . . . . . . . . . . . . . . . . . . . . . . . . . . . . . . . . . 161
Chapter 14Monitoring Performance of Models . . . . . . . . . . . . . . . . . . . . . . . . . . . . . . 165
Chapter 15Using Dashboard Reports . . . . . . . . . . . . . . . . . . . . . . . . . . . . . . . . . . . . . . 191
Chapter 16Retraining Models . . . . . . . . . . . . . . . . . . . . . . . . . . . . . . . . . . . . . . . . . . . . . . 197
113

114

Chapter 10
Scoring Models
Overview of Scoring Tests . . . . . . . . . . . . . . . . . . . . . . . . . . . . . . . . . . . . . . . . . . . . . 115
Create Scoring Output Tables . . . . . . . . . . . . . . . . . . . . . . . . . . . . . . . . . . . . . . . . . . 116What Is a Scoring Output Table? . . . . . . . . . . . . . . . . . . . . . . . . . . . . . . . . . . . . . . 116Create a Scoring Output Table . . . . . . . . . . . . . . . . . . . . . . . . . . . . . . . . . . . . . . . . 117
Create a Scoring Test . . . . . . . . . . . . . . . . . . . . . . . . . . . . . . . . . . . . . . . . . . . . . . . . . 118
Execute a Scoring Test . . . . . . . . . . . . . . . . . . . . . . . . . . . . . . . . . . . . . . . . . . . . . . . . 119
Schedule a Scoring Test . . . . . . . . . . . . . . . . . . . . . . . . . . . . . . . . . . . . . . . . . . . . . . . 119
Scoring Model Properties . . . . . . . . . . . . . . . . . . . . . . . . . . . . . . . . . . . . . . . . . . . . . . 120Scoring Test Properties . . . . . . . . . . . . . . . . . . . . . . . . . . . . . . . . . . . . . . . . . . . . . . 120Result Set Properties . . . . . . . . . . . . . . . . . . . . . . . . . . . . . . . . . . . . . . . . . . . . . . . . 121
Overview of Scoring TestsThe purpose of a scoring test is to run the score code of a model and produce scoring results that you can use for scoring accuracy and performance analysis. The scoring test uses data from a scoring test input table to generate the scoring test output table. The following types of score code for a model can be imported: analytic store, DATA step fragment, and ready-to-run SAS code.
If your environment has its own means of executing the score code, then your use of the SAS Model Manager scoring tests is mostly limited to testing the score code. Otherwise, you can use the scoring tests both to test your score code and execute it in a production environment. Scoring results for a model in a test environment are stored on the SAS Content Server. Scoring results for a model in a production environment are written to the location that the output table metadata specifies. In Windows, the scoring test output table in a SAS library must have Modify, Read and Execute, Read, and Write security permissions. For more information, see “Configuring Users, Groups, and Roles” in SAS Model Manager: Administrator’s Guide.
CAUTION:Executing a scoring test in production mode overwrites the scoring test output table, which might result in a loss of data.
You create a new scoring test in the Scoring page of your project.
115

These are the tests that you perform as part of the scoring test workflow:
• Before creating a scoring test, you must create and register scoring test input and output tables. For more information, see “Create Scoring Output Tables” on page 116.
• When a new scoring test is successfully created, the scoring test is selected on the Scoring page. The scoring test displays the various scoring test information. For more information, see “Create a Scoring Test” on page 118.
• Before you execute the scoring test, it is recommended that you verify the scoring test output variable mappings on the Scoring Output Table view. For more information, “Create Scoring Output Tables” on page 116.
• To execute a scoring test, you can select and run a test. For more information, see “Execute a Scoring Test” on page 119.
• To run a scoring test at a scheduled time, you can specify the date, time and frequency that you want the scoring test to run. For more information, see “Schedule a Scoring Test” on page 119.
• After the successful execution of the scoring test, you can view the results on the Results tab. For more information, see “Execute a Scoring Test” on page 119.
Create Scoring Output Tables
What Is a Scoring Output Table?A scoring output table is a SAS data set that contains the data from executing a scoring test. The scoring output table cannot be a database table. You can provide a scoring output table or you can create a scoring output table definition using SAS Model Manager. When you create a scoring test, you specify either the scoring output table that you provide or the scoring test output definition as the scoring test output table. A SAS data set that you provide as a scoring output table must be registered in the SAS Metadata Repository and made available to SAS Model Manager in the Data category view.
You can create a scoring output table definition by using the Create Scoring Output Table function directly from the model. You select variables from a scoring test input table as well as variables from the model’s output. The variables in the input variables table are variables from the scoring test input table when one is specified for the Default scoring input table property on the Model Properties page for the selected model, or on the Project Properties page for the project that contains the selected model. Otherwise, the input variables table is empty. The output variables that appear are model
116 Chapter 10 • Scoring Models
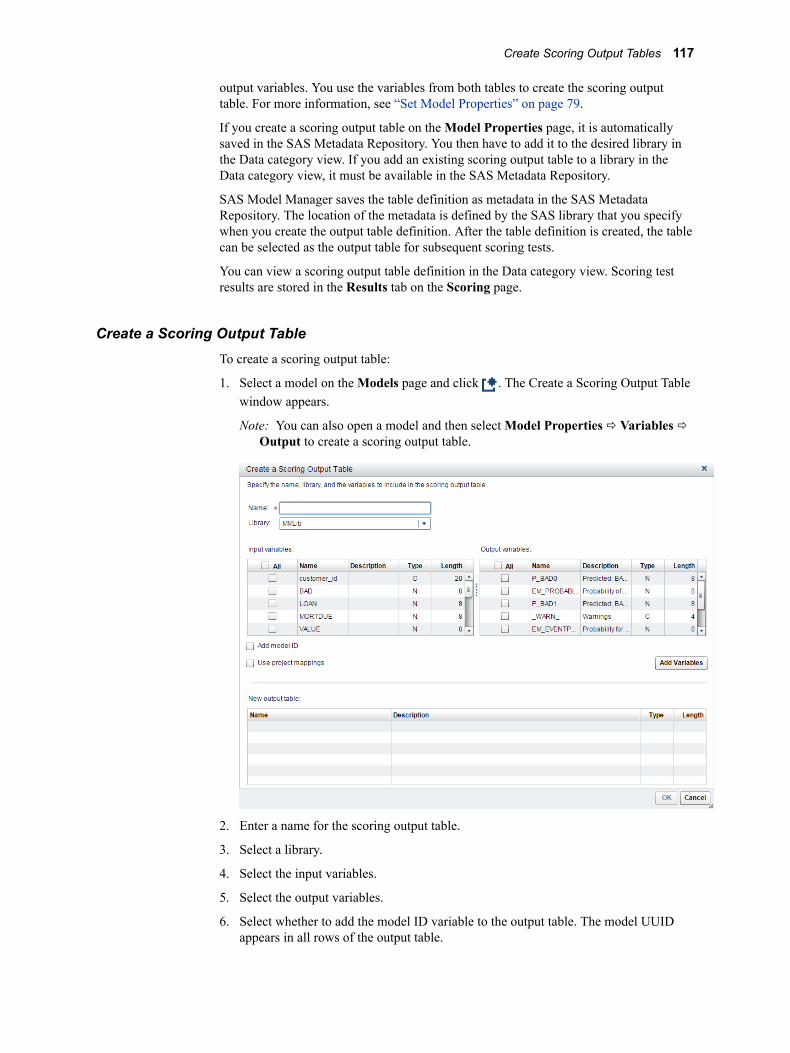
output variables. You use the variables from both tables to create the scoring output table. For more information, see “Set Model Properties” on page 79.
If you create a scoring output table on the Model Properties page, it is automatically saved in the SAS Metadata Repository. You then have to add it to the desired library in the Data category view. If you add an existing scoring output table to a library in the Data category view, it must be available in the SAS Metadata Repository.
SAS Model Manager saves the table definition as metadata in the SAS Metadata Repository. The location of the metadata is defined by the SAS library that you specify when you create the output table definition. After the table definition is created, the table can be selected as the output table for subsequent scoring tests.
You can view a scoring output table definition in the Data category view. Scoring test results are stored in the Results tab on the Scoring page.
Create a Scoring Output TableTo create a scoring output table:
1. Select a model on the Models page and click . The Create a Scoring Output Table window appears.
Note: You can also open a model and then select Model Properties ð Variables ð Output to create a scoring output table.
2. Enter a name for the scoring output table.
3. Select a library.
4. Select the input variables.
5. Select the output variables.
6. Select whether to add the model ID variable to the output table. The model UUID appears in all rows of the output table.
Create Scoring Output Tables 117
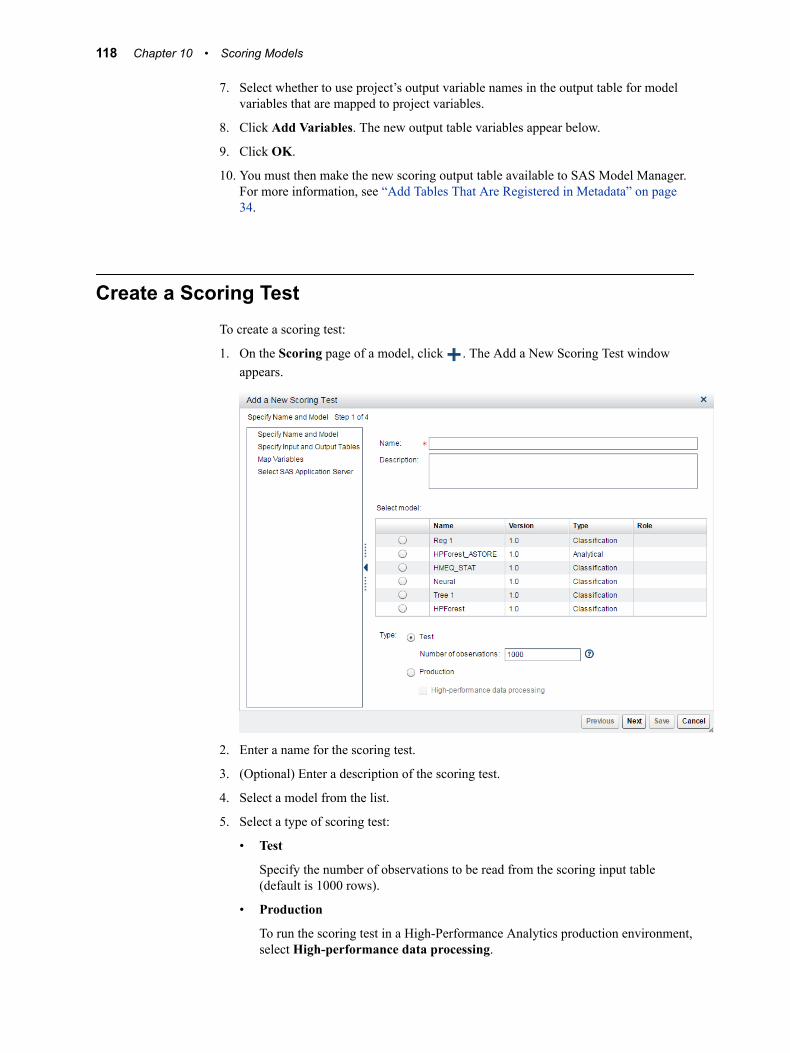
7. Select whether to use project’s output variable names in the output table for model variables that are mapped to project variables.
8. Click Add Variables. The new output table variables appear below.
9. Click OK.
10. You must then make the new scoring output table available to SAS Model Manager. For more information, see “Add Tables That Are Registered in Metadata” on page 34.
Create a Scoring TestTo create a scoring test:
1. On the Scoring page of a model, click . The Add a New Scoring Test window appears.
2. Enter a name for the scoring test.
3. (Optional) Enter a description of the scoring test.
4. Select a model from the list.
5. Select a type of scoring test:
• Test
Specify the number of observations to be read from the scoring input table (default is 1000 rows).
• Production
To run the scoring test in a High-Performance Analytics production environment, select High-performance data processing.
118 Chapter 10 • Scoring Models
Note: A best practice is to select Test before beginning all scoring tests. Later, when you are satisfied with the results of running the scoring test and you are ready to put the test into production, you can change the type to Production.
6. Click Next.
7. Specify an Input table. Use the default scoring input table that is set on the Properties page of a project, or select a new input table. To select a table, click Browse and select a table. Click OK.
8. Specify an Output table. To select a table, click Browse and select a table. Click OK.
9. Click Next.
10. For each scoring output variable, select an available variable. The scoring output variables are mapped automatically if their names match those in the Available Variables column.
11. Click Next.
12. Select a SAS Application Server from the list.
13. Click Save.
Execute a Scoring TestTo execute a scoring test:
1. Select a scoring test from the list and click .
2. Click the Results tab or double-click the scoring test to view the scoring test results.
Note: You can check the status of a job by clicking and then selecting the Tests tab, the Results tab, or the Job History tab.
Schedule a Scoring TestInstead of executing a scoring test, you can schedule a scoring test to run on a particular date and time. You can also schedule how often you want the scoring test to run. Advanced settings enable you to set the scheduling server, the batch server to run the scoring test, and the location of the scoring results.
Before you can schedule a scoring test, your user ID and password must be made available to the SAS Metadata Repository. You must also sign in to SAS Model Manager using your full user credentials that were specified for your user account in SAS Management Console. For user accounts where a Microsoft Windows user ID is specified, you must enter your user ID in the format of domain\userID. Contact your system administrator to add or update your password, and to determine the correct user credentials for your account.
Note: You must have already created a scoring test before you can schedule a job to run the scoring test.
CAUTION:
Schedule a Scoring Test 119
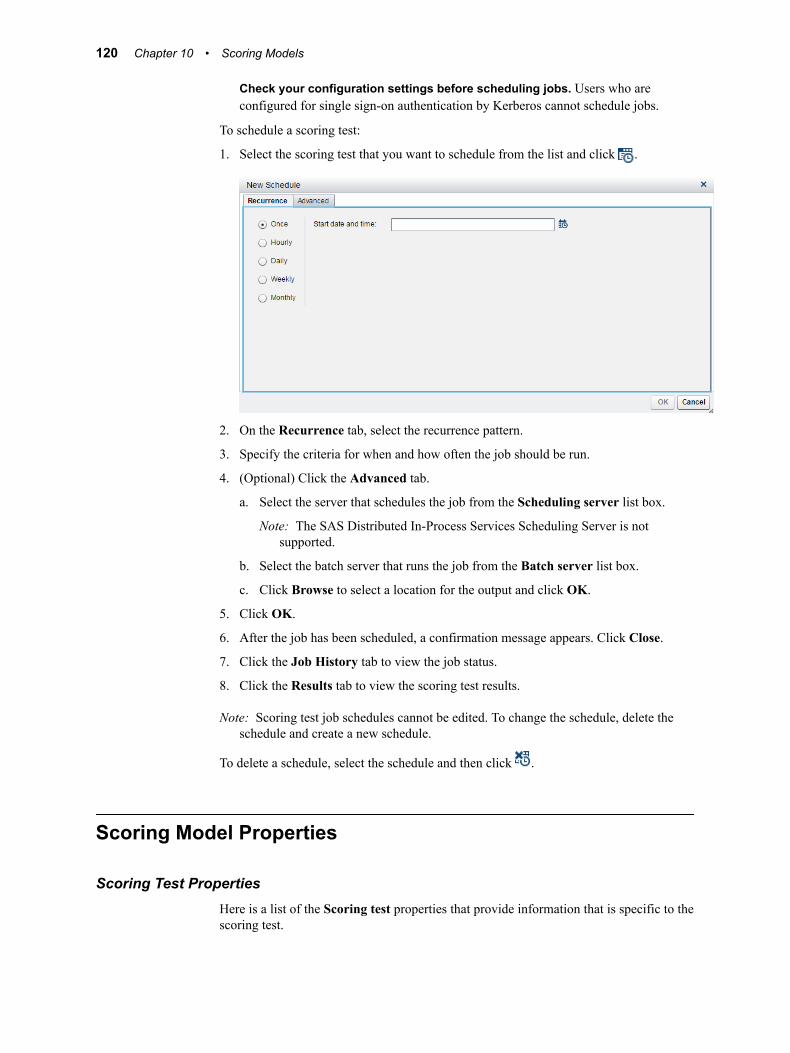
Check your configuration settings before scheduling jobs. Users who are configured for single sign-on authentication by Kerberos cannot schedule jobs.
To schedule a scoring test:
1. Select the scoring test that you want to schedule from the list and click .
2. On the Recurrence tab, select the recurrence pattern.
3. Specify the criteria for when and how often the job should be run.
4. (Optional) Click the Advanced tab.
a. Select the server that schedules the job from the Scheduling server list box.
Note: The SAS Distributed In-Process Services Scheduling Server is not supported.
b. Select the batch server that runs the job from the Batch server list box.
c. Click Browse to select a location for the output and click OK.
5. Click OK.
6. After the job has been scheduled, a confirmation message appears. Click Close.
7. Click the Job History tab to view the job status.
8. Click the Results tab to view the scoring test results.
Note: Scoring test job schedules cannot be edited. To change the schedule, delete the schedule and create a new schedule.
To delete a schedule, select the schedule and then click .
Scoring Model Properties
Scoring Test PropertiesHere is a list of the Scoring test properties that provide information that is specific to the scoring test.
120 Chapter 10 • Scoring Models
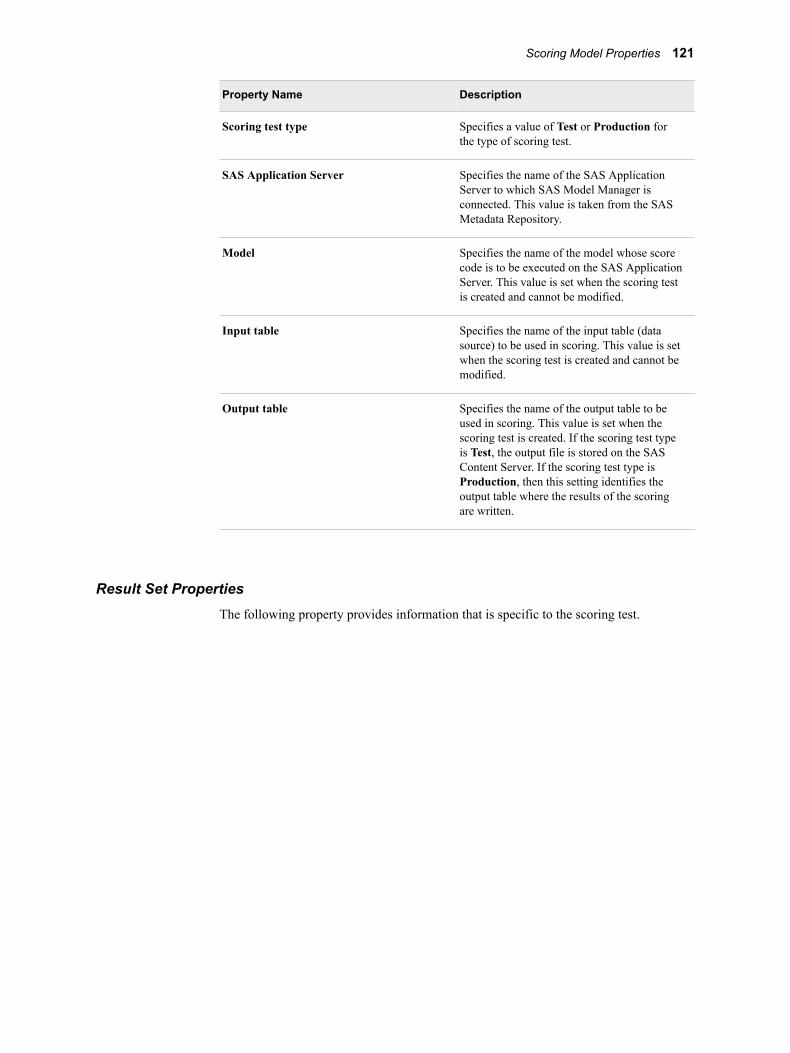
Property Name Description
Scoring test type Specifies a value of Test or Production for the type of scoring test.
SAS Application Server Specifies the name of the SAS Application Server to which SAS Model Manager is connected. This value is taken from the SAS Metadata Repository.
Model Specifies the name of the model whose score code is to be executed on the SAS Application Server. This value is set when the scoring test is created and cannot be modified.
Input table Specifies the name of the input table (data source) to be used in scoring. This value is set when the scoring test is created and cannot be modified.
Output table Specifies the name of the output table to be used in scoring. This value is set when the scoring test is created. If the scoring test type is Test, the output file is stored on the SAS Content Server. If the scoring test type is Production, then this setting identifies the output table where the results of the scoring are written.
Result Set PropertiesThe following property provides information that is specific to the scoring test.
Scoring Model Properties 121

Property Name Description
Number of observations When Scoring test type is set to Test, this property specifies how many observations are to be read from the scoring test input table. This setting enables you to limit the number of records that are written to the scoring test output table on the SAS Content Server in order to reduce operation costs. If a value is not specified, the default value of 1000 rows is used for the number of observations.
When Scoring test type is set to Production, this property specifies how many observations are to be read from the scoring test input table and displayed when you select Result Set from the Results tab. The default value is 0, indicating that there is no limit. This value cannot be changed in SAS Model Manager. The administrator can modify the value by using SAS Management Console. For more information, see SAS Model Manager: Administrator’s Guide.
122 Chapter 10 • Scoring Models
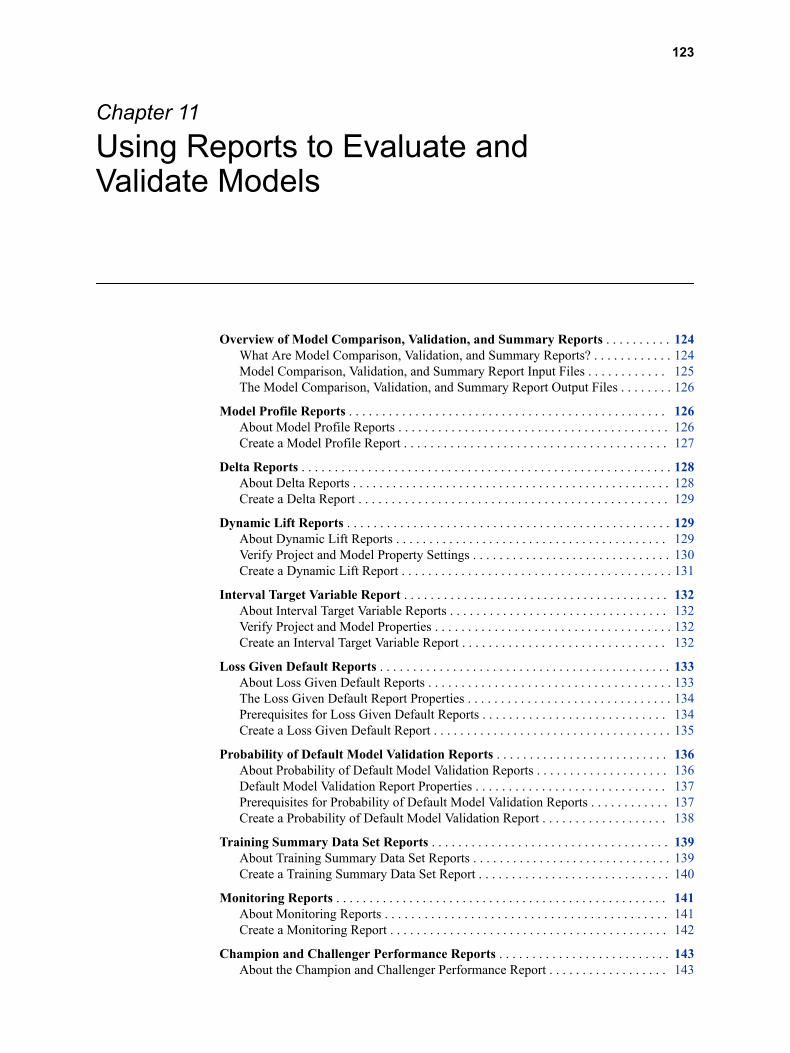
Chapter 11
Using Reports to Evaluate and Validate Models
Overview of Model Comparison, Validation, and Summary Reports . . . . . . . . . . 124What Are Model Comparison, Validation, and Summary Reports? . . . . . . . . . . . . 124Model Comparison, Validation, and Summary Report Input Files . . . . . . . . . . . . 125The Model Comparison, Validation, and Summary Report Output Files . . . . . . . . 126
Model Profile Reports . . . . . . . . . . . . . . . . . . . . . . . . . . . . . . . . . . . . . . . . . . . . . . . . 126About Model Profile Reports . . . . . . . . . . . . . . . . . . . . . . . . . . . . . . . . . . . . . . . . . 126Create a Model Profile Report . . . . . . . . . . . . . . . . . . . . . . . . . . . . . . . . . . . . . . . . 127
Delta Reports . . . . . . . . . . . . . . . . . . . . . . . . . . . . . . . . . . . . . . . . . . . . . . . . . . . . . . . . 128About Delta Reports . . . . . . . . . . . . . . . . . . . . . . . . . . . . . . . . . . . . . . . . . . . . . . . . 128Create a Delta Report . . . . . . . . . . . . . . . . . . . . . . . . . . . . . . . . . . . . . . . . . . . . . . . 129
Dynamic Lift Reports . . . . . . . . . . . . . . . . . . . . . . . . . . . . . . . . . . . . . . . . . . . . . . . . . 129About Dynamic Lift Reports . . . . . . . . . . . . . . . . . . . . . . . . . . . . . . . . . . . . . . . . . 129Verify Project and Model Property Settings . . . . . . . . . . . . . . . . . . . . . . . . . . . . . . 130Create a Dynamic Lift Report . . . . . . . . . . . . . . . . . . . . . . . . . . . . . . . . . . . . . . . . . 131
Interval Target Variable Report . . . . . . . . . . . . . . . . . . . . . . . . . . . . . . . . . . . . . . . . 132About Interval Target Variable Reports . . . . . . . . . . . . . . . . . . . . . . . . . . . . . . . . . 132Verify Project and Model Properties . . . . . . . . . . . . . . . . . . . . . . . . . . . . . . . . . . . . 132Create an Interval Target Variable Report . . . . . . . . . . . . . . . . . . . . . . . . . . . . . . . 132
Loss Given Default Reports . . . . . . . . . . . . . . . . . . . . . . . . . . . . . . . . . . . . . . . . . . . . 133About Loss Given Default Reports . . . . . . . . . . . . . . . . . . . . . . . . . . . . . . . . . . . . . 133The Loss Given Default Report Properties . . . . . . . . . . . . . . . . . . . . . . . . . . . . . . . 134Prerequisites for Loss Given Default Reports . . . . . . . . . . . . . . . . . . . . . . . . . . . . 134Create a Loss Given Default Report . . . . . . . . . . . . . . . . . . . . . . . . . . . . . . . . . . . . 135
Probability of Default Model Validation Reports . . . . . . . . . . . . . . . . . . . . . . . . . . 136About Probability of Default Model Validation Reports . . . . . . . . . . . . . . . . . . . . 136Default Model Validation Report Properties . . . . . . . . . . . . . . . . . . . . . . . . . . . . . 137Prerequisites for Probability of Default Model Validation Reports . . . . . . . . . . . . 137Create a Probability of Default Model Validation Report . . . . . . . . . . . . . . . . . . . 138
Training Summary Data Set Reports . . . . . . . . . . . . . . . . . . . . . . . . . . . . . . . . . . . . 139About Training Summary Data Set Reports . . . . . . . . . . . . . . . . . . . . . . . . . . . . . . 139Create a Training Summary Data Set Report . . . . . . . . . . . . . . . . . . . . . . . . . . . . . 140
Monitoring Reports . . . . . . . . . . . . . . . . . . . . . . . . . . . . . . . . . . . . . . . . . . . . . . . . . . 141About Monitoring Reports . . . . . . . . . . . . . . . . . . . . . . . . . . . . . . . . . . . . . . . . . . . 141Create a Monitoring Report . . . . . . . . . . . . . . . . . . . . . . . . . . . . . . . . . . . . . . . . . . 142
Champion and Challenger Performance Reports . . . . . . . . . . . . . . . . . . . . . . . . . . 143About the Champion and Challenger Performance Report . . . . . . . . . . . . . . . . . . 143
123

Verify Performance Data and Model Status . . . . . . . . . . . . . . . . . . . . . . . . . . . . . . 144Create a Champion and Challenger Performance Report . . . . . . . . . . . . . . . . . . . . 144
View Reports . . . . . . . . . . . . . . . . . . . . . . . . . . . . . . . . . . . . . . . . . . . . . . . . . . . . . . . . 145
Overview of Model Comparison, Validation, and Summary Reports
What Are Model Comparison, Validation, and Summary Reports?The SAS Model Manager model comparison, validation, and summary reports are tools that you can use to evaluate and compare the candidate models in a version or across versions to help you select and approve the champion model that moves to production status. The model comparison reports are analytical tools that project managers, statisticians, and analysts can use to assess the structure, performance, and resilience of candidate models. The model validation reports use statistical measures to validate the stability, performance, and calibration of risk models and parameters. The training summary data set report creates frequency and distribution charts that summarize the train table variables.
The reports present information about a number of attributes that can affect model performance. Together, the reports provide qualified information that can serve as the analytical basis for choosing and monitoring a champion model.
Here is a description of the comparison reports:
Model Profile ReportFor a single model, this report displays the profile data that is associated with input, output, and target variables. Profile data includes the variable name, type, length, label, SAS format, measurement level, and role.
Delta ReportThis report compares the profile data for two models and notes the differences.
Dynamic Lift ReportThe Dynamic Lift report provides visual summaries of the performance of one or more models for predicting a binary outcome variable.
Interval Target Variable ReportThe Interval Target Variable report creates two plots for you to view the actual versus predicted values for a model and the actual versus residual values for a model. Interval Target Variable report can be created only for prediction models.
The following are the Basel III model validation reports:
Loss Given Default ReportThe Loss Given Default (LGD) report calculates the amount that might be lost in an investment and calculates the economic or regulatory capital for Basel III compliance.
Probability of Default Model Validation ReportThe Probability of Default (PD) Validation report estimates the probability of defaulting on a debt that is owed. Probability of default is used to calculate economic or regulatory capital for Basel III compliance.
The model validation reports use statistical measures that report on these model validation measures:
124 Chapter 11 • Using Reports to Evaluate and Validate Models
• The model stability measures track the change in distribution for the modeling data and scoring data.
• The model performance measures check the model’s ability to distinguish between accounts that have not defaulted and accounts that have defaulted, as well as report on the relationship between actual default probability and predicted default probability.
• The model calibration measures check the accuracy of the selected models for the LGD and PD reports by comparing the correct quantification of the risk components with the available standards.
This is the train table data set summary report:
Training Summary Data Set ReportThe Training Summary Data Set report creates frequency and distribution charts for a training data set.
After you execute a performance definition, you can generate performance monitoring results and compare the champion and challenger models:
Monitoring ReportAfter you execute a performance definition, SAS Model Manager stores the output data sets in the project folder. You can format the performance monitoring results and then view the performance monitoring results report.
Champion and Challenger ReportAfter you execute a performance definition for the champion model, you can execute a performance definition for the challenger model using the same performance data sets. You can then create a Champion and Challenger Performance report that compares the performance of the two models.
You create the reports using the New Report window that you start from a project’s Reports page.
Model Comparison, Validation, and Summary Report Input FilesSAS Model Manager uses a test table as the input table for the Dynamic Lift report and the Interval Target Variable report.
Before you can create a Dynamic Lift report or the Interval Target Variable report, make sure that a test table has been added to the SAS Metadata Repository and registered in the Data Tables category or SAS Management Console. The test table can be viewed in the Data Tables category view. Then, specify the test table in the project property Default test table.
You specify the input table for validation reports in the New Report window. The input file for the validation reports can contain only input variables or it can contain input and output variables. If the input table contains input and output variables, the report generation does not need to run a scoring test to obtain the output variables.
When you create a train table summary report, the train table or specified input table is used to create the training summary data sets. The train table must be available in the SAS Metadata Repository. The train table must then be specified in the project property for the Default train table.
Overview of Model Comparison, Validation, and Summary Reports 125
The Model Comparison, Validation, and Summary Report Output Files
The Reports page stores the model comparison, validation, and summary report output files in the Model Evaluation tab. The name of the report is the value of the Name box that you specified in the New Report window.
Each time you create a report, these files are generated:
• the report in either HTML, PDF, or RTF format
Note: The Loss Given Default and Probability of Default Model Validation reports can be created only in PDF format.
• taskCode.log
• taskCode.sas
Here is a description of the model comparison output files:
Report File Description
report-name.html This file is the report output in HTML format.
report-name.pdf This file is the report output in PDF format.
report-name.rtf This file is the report output in RTF format.
taskCode.log This file is the log file that contains messages from running the SAS code to create the report.
taskCode.sas This file is the SAS code that is used to create the report.
After you create a report, you can view the report from the Reports page.
Note: If you are configured for single sign-on web authentication and you try to view a report, the report is downloaded to your local drive. To view an HTML report, you must unzip the file.
Model Profile Reports
About Model Profile ReportsA Model Profile report displays the profile data that is associated with the model input variables, output variables, and target variables. The report creates three tables, one each for the model input, output, and target variables.
Here is a description of the model profile data:
Profile Data Description
Name The name of the variable.
126 Chapter 11 • Using Reports to Evaluate and Validate Models
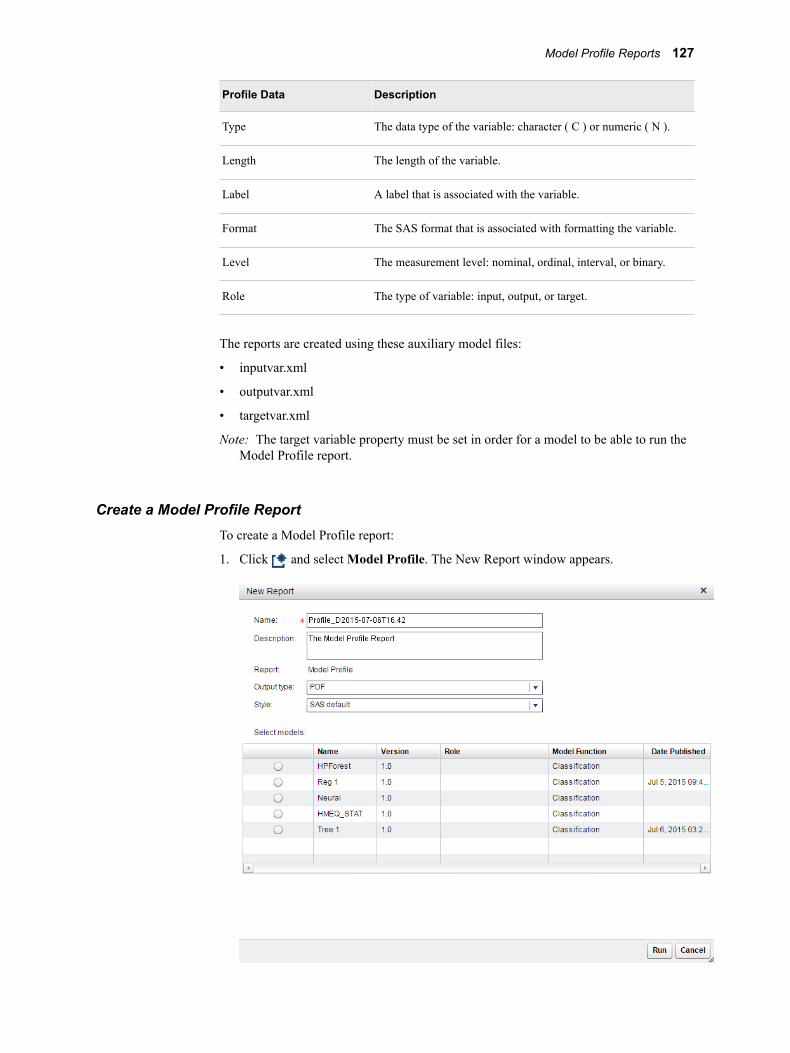
Profile Data Description
Type The data type of the variable: character ( C ) or numeric ( N ).
Length The length of the variable.
Label A label that is associated with the variable.
Format The SAS format that is associated with formatting the variable.
Level The measurement level: nominal, ordinal, interval, or binary.
Role The type of variable: input, output, or target.
The reports are created using these auxiliary model files:
• inputvar.xml
• outputvar.xml
• targetvar.xml
Note: The target variable property must be set in order for a model to be able to run the Model Profile report.
Create a Model Profile ReportTo create a Model Profile report:
1. Click and select Model Profile. The New Report window appears.
Model Profile Reports 127

2. Enter a name and description if you do not want to use the default values.
3. Select an output type. The default is PDF.
4. Select a style for the report. When the SAS default option is selected, the default style and themes are used in generating the report. For example, the SAS default style for the HTML output type is HTMLBLUE.
5. From the list, select the model that you want to include in the report.
6. Click Run. The report is generated and appears in the default viewer for the selected output type.
See Also“View Reports” on page 145
Delta Reports
About Delta ReportsA Delta report compares the input, output, and target variable attributes for each of the variables that are used to score two candidate models. Delta reports display the differences in the variables of competing candidate models. The report output is a table that groups the variables by the variable name. For each variable, the reports lists the attribute value for each model and whether the attribute value is the same or different from the other attribute values.
Here is a description of each of the columns in the output of a Delta report:
Column Description
Role Specifies the function that a variable performs in determining a score code.
Name Specifies the name of the variable that is being compared.
Variable Attribute Specifies the name of the variable attribute that is being compared.
Model Name-1 Contains the value of the attribute for the first model.
Model Name-2 Contains the value of the attribute for the second model.
Difference Specifies an X if the value of the variable attribute is different from the value of the variable attributes in the other model. If the value of the variable attribute is the same, this column is blank.
128 Chapter 11 • Using Reports to Evaluate and Validate Models
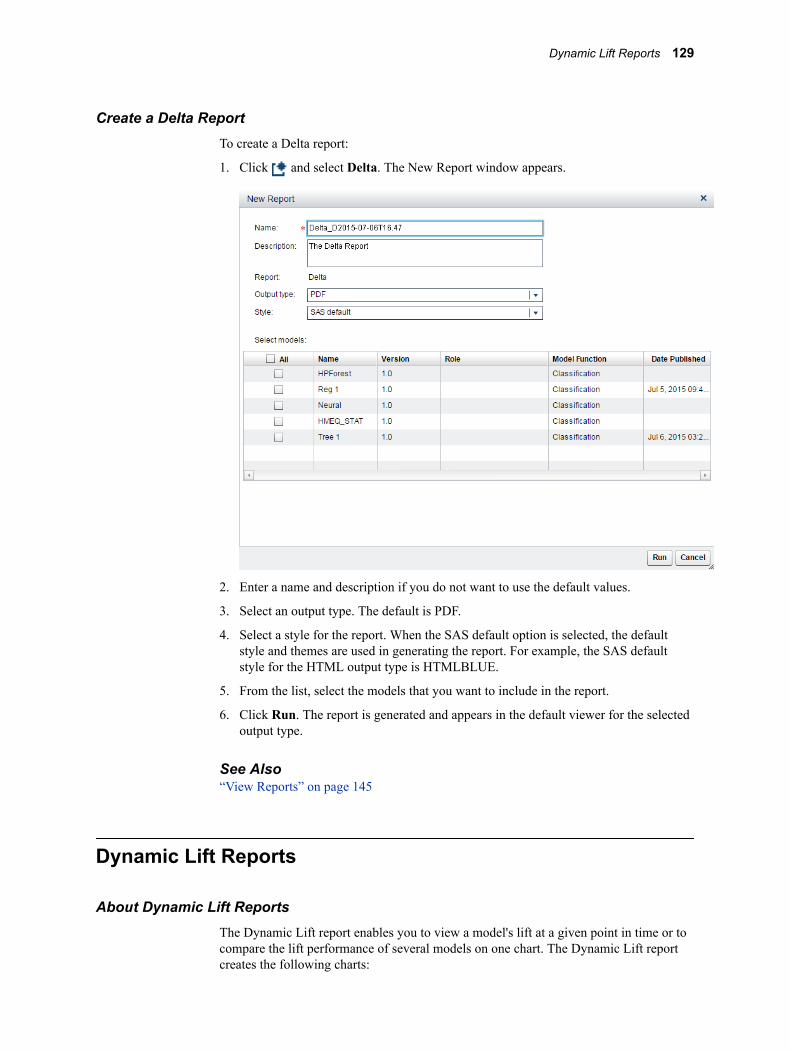
Create a Delta ReportTo create a Delta report:
1. Click and select Delta. The New Report window appears.
2. Enter a name and description if you do not want to use the default values.
3. Select an output type. The default is PDF.
4. Select a style for the report. When the SAS default option is selected, the default style and themes are used in generating the report. For example, the SAS default style for the HTML output type is HTMLBLUE.
5. From the list, select the models that you want to include in the report.
6. Click Run. The report is generated and appears in the default viewer for the selected output type.
See Also“View Reports” on page 145
Dynamic Lift Reports
About Dynamic Lift ReportsThe Dynamic Lift report enables you to view a model's lift at a given point in time or to compare the lift performance of several models on one chart. The Dynamic Lift report creates the following charts:
Dynamic Lift Reports 129
• Lift
• Cumulative Lift
• Percent Response
• Cumulative Percent Response
• Captured Response
• Cumulative Captured Response
A Dynamic Lift report can be created only for classification models with a binary target.
The charts that are created for a Dynamic Lift report are also created in the Monitoring Report, which creates multiple types of model comparison reports. Before you can create a Dynamic Lift report, certain project and model property settings must be set.
For models that are created with PMML 4.2, the Valid variable name option in SAS Management Console must be set to Yes by a SAS Model Manager administrator. In addition, the PMML variable names cannot be more than 20 characters. For more information, see SAS Model Manager: Administrator’s Guide.
Verify Project and Model Property Settings
Verify Project PropertiesSelect the project name and verify that the following project properties are set:
Training target variableSpecifies the name of the target variable that was used to train the model. The model must have the same training target variable as the project.
Target event valueSpecifies the value for the desired target variable event or state. For example, if a model predicts when RESPONSE=YES, then the target event value is YES.
Output event probability variableSpecifies the name of the output event’s probability variable.
Verify Model PropertiesFor each model in the Dynamic Lift report, open the model and verify the following properties on the Model Properties page:
Properties
Property Description
Target variable Specifies the name of the target variable. For example, if a model predicts when RESPONSE=YES, then the target variable is RESPONSE.
Score code type Specifies whether the score code type is Analytic store, DS2, DATA step, PMML, or SAS program.
Note: Dynamic Lift reports are not applicable to models whose Score code type property has a value of PMML or DS2. A Dynamic Lift report can be created for a PMML model that was created using PMML 4.2 and whose Score code type is DATA step.
130 Chapter 11 • Using Reports to Evaluate and Validate Models
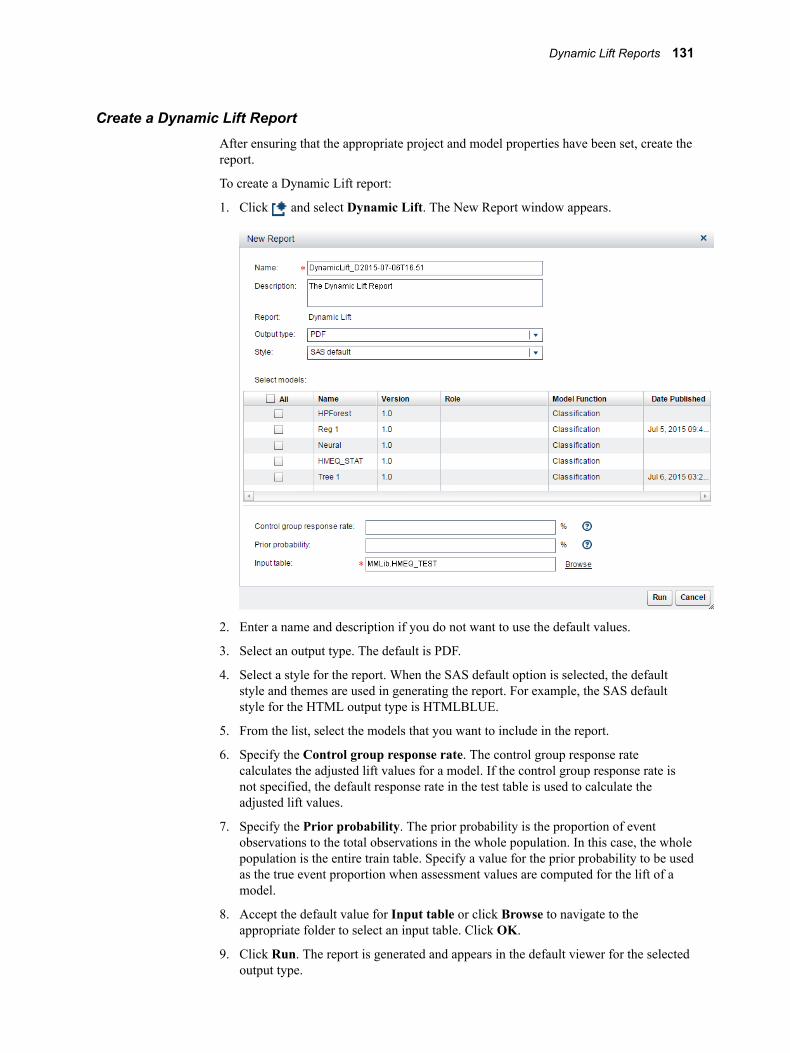
Create a Dynamic Lift ReportAfter ensuring that the appropriate project and model properties have been set, create the report.
To create a Dynamic Lift report:
1. Click and select Dynamic Lift. The New Report window appears.
2. Enter a name and description if you do not want to use the default values.
3. Select an output type. The default is PDF.
4. Select a style for the report. When the SAS default option is selected, the default style and themes are used in generating the report. For example, the SAS default style for the HTML output type is HTMLBLUE.
5. From the list, select the models that you want to include in the report.
6. Specify the Control group response rate. The control group response rate calculates the adjusted lift values for a model. If the control group response rate is not specified, the default response rate in the test table is used to calculate the adjusted lift values.
7. Specify the Prior probability. The prior probability is the proportion of event observations to the total observations in the whole population. In this case, the whole population is the entire train table. Specify a value for the prior probability to be used as the true event proportion when assessment values are computed for the lift of a model.
8. Accept the default value for Input table or click Browse to navigate to the appropriate folder to select an input table. Click OK.
9. Click Run. The report is generated and appears in the default viewer for the selected output type.
Dynamic Lift Reports 131
See Also“View Reports” on page 145
Interval Target Variable Report
About Interval Target Variable ReportsThe Interval Target Variable report creates two plots for you to view the actual versus predicted values for a model and the actual versus residual values for a model. The Interval Target Variable report can be created only for prediction models. Before you can create an Interval Target Variable report, certain project and model property settings must be set.
Verify Project and Model PropertiesBefore you can run an Interval Target Variable report, you must set the following project properties:
Default test tableSpecifies a test table that is registered in the SAS Metadata Repository. You can view the table in the Data category view. The test table must contain the target variable, as well as values for the variables that are defined by the project input variables.
Training target variableSpecifies the name of the target variable that was used to train the model. The model must have the same training target variable as the project.
Output prediction variableSpecifies the name of the output prediction variable.
To verify the model mapping, select and open the model from the Models page. Select Model Properties ð Variables to verify that the model variables are mapped to the project variables. If the variable names are the same, you do not need to map the variables. If they are not mapped, for each project variable, select the project variable and select a variable name.
Create an Interval Target Variable ReportYou must have a prediction model with an interval target variable in order to create the Interval Target Variable report. After ensuring that the appropriate project properties have been set and the model mapping is set, create the report.
To create an Interval Target Variable report:
1. Click and select Interval Target Variable. The New Report window appears.
132 Chapter 11 • Using Reports to Evaluate and Validate Models
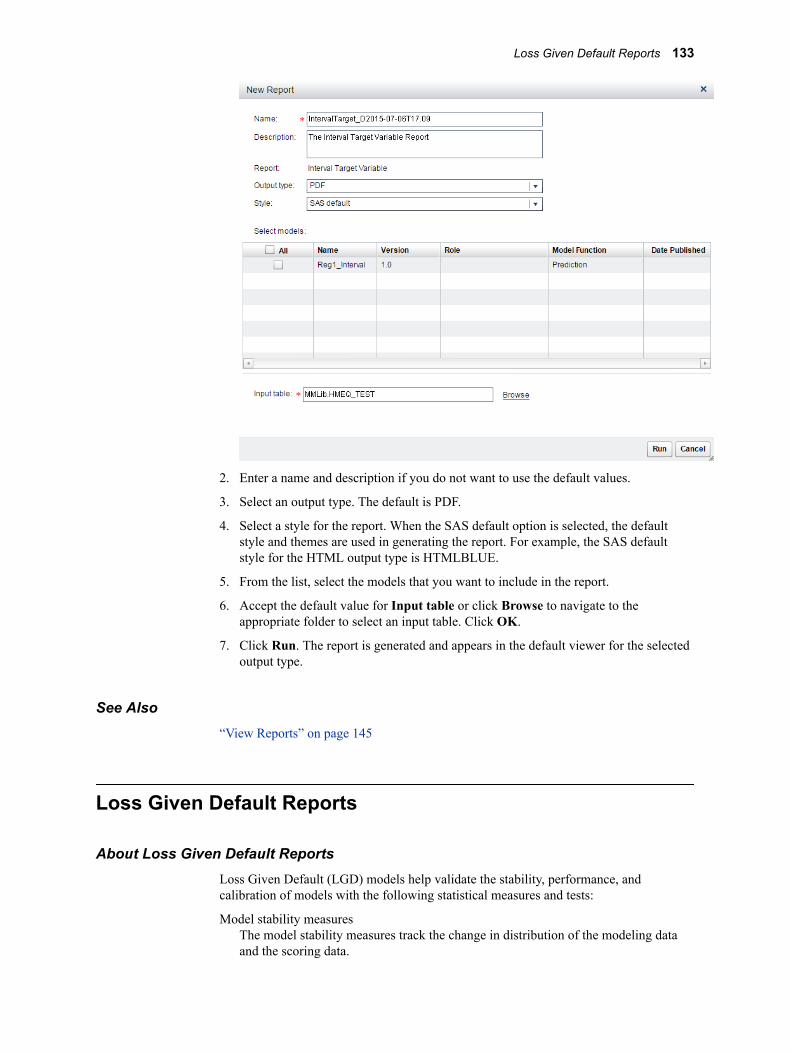
2. Enter a name and description if you do not want to use the default values.
3. Select an output type. The default is PDF.
4. Select a style for the report. When the SAS default option is selected, the default style and themes are used in generating the report. For example, the SAS default style for the HTML output type is HTMLBLUE.
5. From the list, select the models that you want to include in the report.
6. Accept the default value for Input table or click Browse to navigate to the appropriate folder to select an input table. Click OK.
7. Click Run. The report is generated and appears in the default viewer for the selected output type.
See Also“View Reports” on page 145
Loss Given Default Reports
About Loss Given Default ReportsLoss Given Default (LGD) models help validate the stability, performance, and calibration of models with the following statistical measures and tests:
Model stability measuresThe model stability measures track the change in distribution of the modeling data and the scoring data.
Loss Given Default Reports 133
Model performance measuresThe model performance measures report this information:
• The model’s ability to discriminate accounts that have defaulted with those that have not defaulted. The score difference between the accounts that default and those that do not helps determine the cut-off score, which is used to predict whether a credit exposure is a default.
• The relationship between the actual default probability and the predicted probability. This information is used to understand a model’s performance over a period of time.
Model calibration measuresThe model calibration measures check the accuracy of the LGD models by comparing the correct quantification of the risk components with the available standards.
For a description of the statistical measures, see “Statistical Measures Used in Basel III Reports” on page 275.
The Loss Given Default Report PropertiesIn order to create the reports, SAS Model Manager must know the input and output variables for the model. The input table can contain only input variables, or it can contain input and output variables. If the input table contains only input variables, a scoring test must be run to obtain the output variable. If the input table contains the input and output variables, no scoring is necessary. You specify whether a scoring test must be run by setting the Run score code property in the New Report window. If the input table contains the input and output variables, the value of the Run score code can be No. If the input table contains only input variables, the Run score code property must be set to Yes.
The report properties require the names of the variables from the input and output tables in order to map these variables to variables that are used to create the reports. The LGD report properties map these variables:
Time period variable
specifies the variable that is used to indicate a time period. The first time period begins with 1 and typically increments by 1. The default is period.
Time label variable
(optional) specifies a label for the time period. If this variable exists in the input table, the report output contains a table that maps time periods to time labels.
Actual variable
specifies the actual LGD variable. The default is lgd.
Predicted variable
specifies the output prediction variable that is used only if scoring for the report is not performed by SAS Model Manager. If the report scoring is done by SAS Model Manager, this variable should be excluded by the input data set. The default is p_lgd.
Pool variable specifies the variable that names pool IDs. The default is pool_id.
Prerequisites for Loss Given Default ReportsBefore you run an LGD report, select the project name and verify that the following project properties are set:
134 Chapter 11 • Using Reports to Evaluate and Validate Models

Training target variableSpecifies the name of the target variable that was used to train the model. The model must have the same training target variable as the project.
Model functionSpecifies the type of model function. For an LGD report, the model function must be Prediction.
Class target levelSpecifies an Interval class target level.
Output prediction variableSpecifies the name of the output prediction variable.
Create a Loss Given Default ReportTo create a Loss Given Default report:
1. Click and select Loss Given Default. The New Report window appears.
2. Enter a name and description if you do not want to use the default values.
Note: The default output type is PDF.
3. From the list, select the model that you want to include in the report.
4. Select an Input table. Click Browse to navigate to the appropriate folder. Select an input table and click OK. The table can contain only input variables or it can contain input and output variables.
Loss Given Default Reports 135
5. Select whether to run the score code. If the input table contains only input variables, set Run score code to Yes. If the input table contains input and output variables, set Run score code to No.
6. The Time period variable specifies the variable from the input table whose value is a number that represents the development period. This value is numeric. The time period for PD reports begin with 1. The default is period.
7. (Optional) In the Time label variable field, enter the variable from the input table that is used for time period labels. When you specify the time label variable, the report appendix shows the mapping of the time period to the time label.
8. Click More Options to set the following:
Actual variableSpecifies the actual LGD variable. The default is lgd.
Predicted variableSpecifies the project scoring output variable. If the scoring for the LGD report is performed outside SAS Model Manager, the input data set must include this variable. If the scoring for the LGD report is done by SAS Model Manager, the input data set should not include this variable. The default is p_lgd.
Pool variableSpecifies the variable from the input table that is used to identify a two-character pool identifier. The default is pool_id.
Note: The variable names that you specify can be user-defined variables. A variable mapping feature maps the user-defined variables to required variables.
9. Click Run. The report is generated and appears in the default viewer for the selected output type.
See Also“View Reports” on page 145
Probability of Default Model Validation Reports
About Probability of Default Model Validation ReportsProbability of Default (PD) models help validate the stability, performance, and calibration of models with the following statistical measures and tests:
Model stability measuresThe model stability measures track the change in distribution of the modeling data and the scoring data.
Model performance measuresThe model performance measures report this information:
• The model’s ability to discriminate accounts that have defaulted with those that have not defaulted. The score difference between the accounts that default and those that do not helps determine the cut-off score, which is used to predict whether a credit exposure is a default.
• The relationship between the actual default probability and the predicted probability. This information is used to understand a model’s performance over a period of time.
136 Chapter 11 • Using Reports to Evaluate and Validate Models
Model calibration measuresThe model calibration measures check the accuracy of the PD model by comparing the correct quantification of the risk components with the available standards.
For a description of the statistical measures, see “Statistical Measures Used in Basel III Reports” on page 275.
Default Model Validation Report PropertiesIn order to create the reports, SAS Model Manager must know the input and output variables for the model. To run the reports, the New Report window requires the name of an input table. The input table can contain only input variables, or it can contain input and output variables. If the input table contain only input variables only, a scoring test must be run to obtain the output variable. If the input table contains the input and output variables, no scoring is necessary. You specify whether a scoring test must be run by setting the Run score code property in the New Report window. If the input table contains the input and output variables, the value of the Run score code can be No. If the input table contains only input variables, the Run score code property must be set to Yes.
The report properties require the names of the variables from the input and output tables in order to map these variables to variables that are used to create the reports. The report properties map these variables:
Time period variable
specifies the variable that is used to indicate a time period. The first time period begins with 1 and typically increments by 1. The default is period.
Time label variable
(optional) specifies a label for the time period. If this variable exists in the input table, the report output contains a table that maps time periods to time labels.
Scorecard bin variable
specifies the scoring output variable that names the scorecard bins. The input table must include this variable if scoring for the PD report is performed outside SAS Model Manager. If scoring is done by SAS Model Manager, do not include this variable in the input data set. The default is scorecard_bin.
Scorecard points variable
specifies the scoring output variable that names the scorecard points. The input table must include this variable if scoring for the PD report is performed outside SAS Model Manager. If scoring is done by SAS Model Manager, do not include this variable in the input data set. The default is scorecard_points.
Cut-off value specifies the variable that is used to derive whether a credit exposure is a default. The cut-off value is also used to compute accuracy, sensitivity, specificity, precision, and error rate measures. You can use the score difference between accounts that default on loans and those that do not default on loans to determine the cut-off value. The default is 100.
Prerequisites for Probability of Default Model Validation ReportsBefore you can create a Probability of Default Model Validation report, verify that the following project settings are specified and that the output variables have been mapped:
Probability of Default Model Validation Reports 137

Training target variableSpecifies the name of the target variable that was used to train the model. The model must have the same training target variable as the project.
Class target levelSpecifies a Binary class target level.
Output event probability variableSpecifies the name of the output event probability variable.
Model functionSpecifies the type of model function. The model function must be Classification in order to create a PD report.
Create a Probability of Default Model Validation ReportTo create a Probability of Default Model Validation report:
1. Click and select Probability of Default Model Validation. The New Report window appears.
2. Enter a name and description if you do not want to use the default values.
Note: The default output type is PDF.
3. From the list, select the model that you want to include in the report.
4. Click Browse to navigate to the appropriate folder and select an input table and click OK. The table can contain only input variables or both input and output variables.
138 Chapter 11 • Using Reports to Evaluate and Validate Models
Note: When a scoring input table for a PD report contains data and one or more time periods do not contain default or non-default loan information, these time periods are not used to calculate the PD measurements. In a chart, time periods that are not used to calculate the PD measurements are represented with dashed lines.
5. Select whether to run the score code. If the input table contains only input variables, set Run score code to Yes. If the input table contains input and output variables, set Run score code to No.
6. The Time period variable specifies the variable from the input table whose value is a number that represents the development period. This value is numeric. The time period for PD reports begin with 1. The default is period.
7. (Optional) In the Time label variable field, enter the variable from the input table that is used for time period labels. When you specify the time label variable, the report appendix shows the mapping of the time period to the time label.
8. Click More Options to set the following:
Scorecard bin variableSpecifies the variable from the input table that contains the scorecard bins. If the scoring job for the PD report is run outside SAS Model Manager, the scorecard bin variable must be a variable in the input table. If scoring is done within SAS Model Manager, do not include the variable in the input table. The default is scorecard_bin.
Scorecard points variableSpecifies the variable that contains the scorecard points. If the scoring job for the PD report is run outside SAS Model Manager, the scorecard points variable must be a variable in the input table. If scoring is done within SAS Model Manager, do not include the variable in the input table. The default is scorecard_points.
Cut-off valueSpecifies the maximum value that can be used to derive the predicted event and to further compute accuracy, sensitivity, specificity, precision, and error rate. The default is 100.
9. Click Run. The report is generated and appears in the default viewer for the selected output type.
See Also“View Reports” on page 145
Training Summary Data Set Reports
About Training Summary Data Set ReportsA Training Summary Data Set report creates frequency and distribution charts that summarize the train table variables. Using the default train table, SAS Model Manager generates data sets that contain numeric and character variable summaries, and variable distributions. These data sets are used to create the summary report. Before you can create the report, you must generate the training summary data sets.
Training Summary Data Set Reports 139
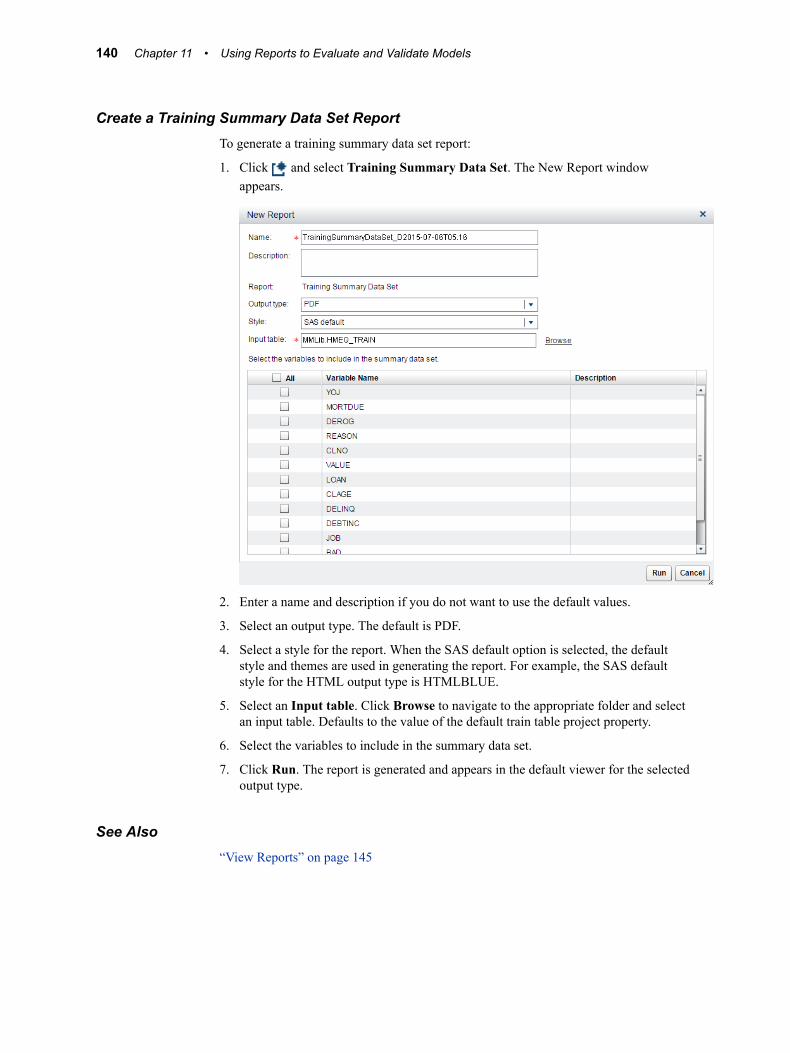
Create a Training Summary Data Set ReportTo generate a training summary data set report:
1. Click and select Training Summary Data Set. The New Report window appears.
2. Enter a name and description if you do not want to use the default values.
3. Select an output type. The default is PDF.
4. Select a style for the report. When the SAS default option is selected, the default style and themes are used in generating the report. For example, the SAS default style for the HTML output type is HTMLBLUE.
5. Select an Input table. Click Browse to navigate to the appropriate folder and select an input table. Defaults to the value of the default train table project property.
6. Select the variables to include in the summary data set.
7. Click Run. The report is generated and appears in the default viewer for the selected output type.
See Also“View Reports” on page 145
140 Chapter 11 • Using Reports to Evaluate and Validate Models
Monitoring Reports
About Monitoring ReportsAfter you execute a performance definition or run the %MM_RunReports() macro in production mode, as a batch job, SAS Model Manager stores the output data sets on the SAS Content Server. You can view the performance monitoring results on the Performance Results tab or on the Attachments page.
When you create monitoring reports using the New Report window, the report creates the following charts:
Assessment chartsAssessment charts summarize the utility that you can expect by using the respective models, as compared to using only baseline information. Assessment charts can present a model's lift at a given point in time or the sequential lift performance of a model's lift over time. A monitoring report creates the following assessment charts:
• Lift
• Cumulative Lift
• Percent Response
• Cumulative Percent Response
• Captured Response
• Cumulative Captured Response
• Actual versus Predicted for prediction models
• Actual versus Residual for prediction models
• Population Stability Trend for prediction models
Assessment charts are created for the Monitoring Report.
Lift Trend chartA Lift Trend chart displays the cumulative lift of the champion model, over time.
Gini - ROC chartSensitivity is the proportion of true positive events, and specificity is the proportion of true negative events. The Gini - ROC chart plots Sensitivity on the Y axis and 1 - Specificity on the X axis.
Gini - Trend ChartWhen the Gini - ROC chart is created, the Gini index for each ROC curve is also created. The Gini index represents the area under the ROC curve and is a benchmark statistic that can be used to summarize the predictive accuracy of a model. The Gini - Trend chart plots a model's Gini index scores over time, and these are used to monitor model degradation over time.
KS ChartThe KS chart uses the Kolmogorov-Smirnov statistic to measure the maximum vertical separation, or deviation between the cumulative distributions of events and non-events.
Monitoring Reports 141
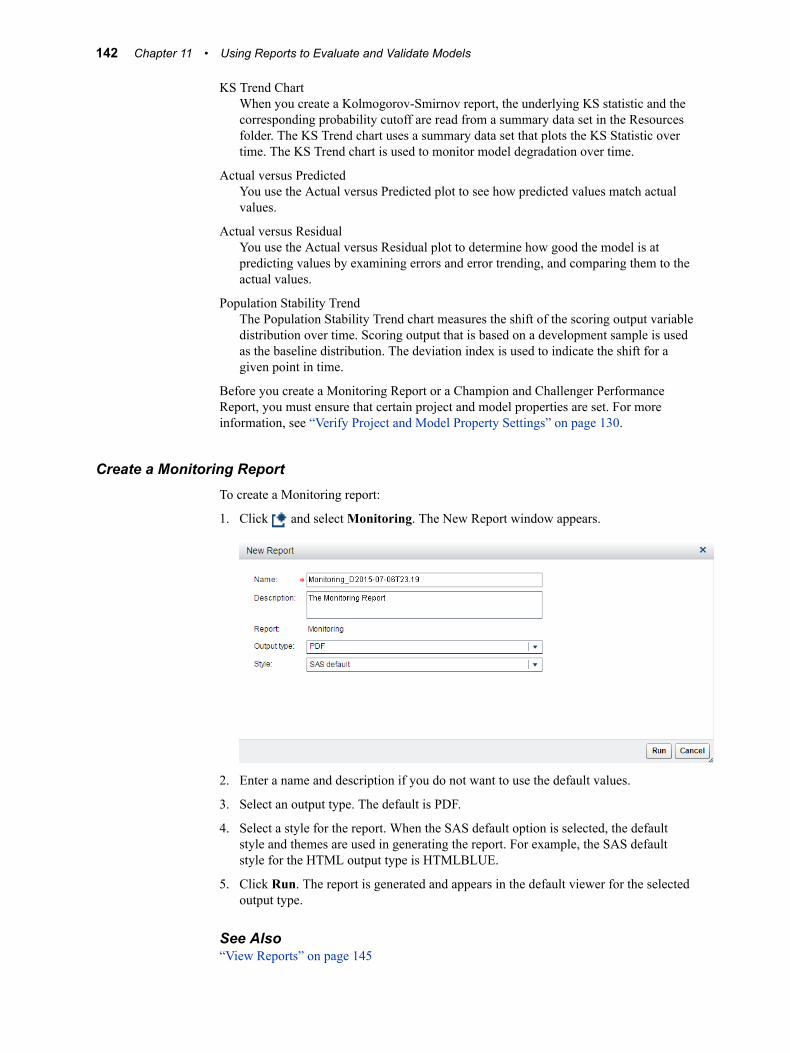
KS Trend ChartWhen you create a Kolmogorov-Smirnov report, the underlying KS statistic and the corresponding probability cutoff are read from a summary data set in the Resources folder. The KS Trend chart uses a summary data set that plots the KS Statistic over time. The KS Trend chart is used to monitor model degradation over time.
Actual versus PredictedYou use the Actual versus Predicted plot to see how predicted values match actual values.
Actual versus ResidualYou use the Actual versus Residual plot to determine how good the model is at predicting values by examining errors and error trending, and comparing them to the actual values.
Population Stability TrendThe Population Stability Trend chart measures the shift of the scoring output variable distribution over time. Scoring output that is based on a development sample is used as the baseline distribution. The deviation index is used to indicate the shift for a given point in time.
Before you create a Monitoring Report or a Champion and Challenger Performance Report, you must ensure that certain project and model properties are set. For more information, see “Verify Project and Model Property Settings” on page 130.
Create a Monitoring ReportTo create a Monitoring report:
1. Click and select Monitoring. The New Report window appears.
2. Enter a name and description if you do not want to use the default values.
3. Select an output type. The default is PDF.
4. Select a style for the report. When the SAS default option is selected, the default style and themes are used in generating the report. For example, the SAS default style for the HTML output type is HTMLBLUE.
5. Click Run. The report is generated and appears in the default viewer for the selected output type.
See Also“View Reports” on page 145
142 Chapter 11 • Using Reports to Evaluate and Validate Models
Champion and Challenger Performance Reports
About the Champion and Challenger Performance ReportAfter you execute a performance definition for the champion model, you can execute a performance definition for the challenger model using the same performance data sets. SAS Model Manager updates the output data sets with the performance data for the challenger model. You can create a Champion and Challenger Performance report that compares the performance of the two models.
The Champion and Challenger Performance report contains these charts:
Number of Predictors Exceeding Deviation ThresholdThis characteristic report creates a chart for each index that exceeds a deviation threshold (either 0.1 or 0.25) as indicated in the define performance definition. The characteristic report detects shifts in the distribution of input variables over time.
Lift Trend ChartA Lift Trend chart displays the cumulative lift of the champion model over time.
Gini - TrendWhen the Gini - ROC Chart is created, the Gini index for each ROC curve is also created. The Gini coefficient represents the area under the ROC curve and is a benchmark statistic that can be used to summarize the predictive accuracy of a model. The Gini - Trend Chart plots a model's Gini index scores over time, and these are used to monitor model degradation over time.
Gini - ROC ChartSensitivity is the proportion of true positive events, and specificity is the proportion of true negative events. The Gini - ROC Chart plots Sensitivity on the Y axis and 1 - Specificity on the X axis.
KS Trend ChartWhen you create a Kolmogorov-Smirnov report, the KS statistic and the corresponding probability cutoff are computed for each Kolmogorov-Smirnov table. The KS Trend Chart uses a summary data set that plots the KS Statistic and the probability cutoff values over time. The KS Trend Chart is used to monitor model degradation over time.
KS ChartThe KS Chart uses the Kolmogorov-Smirnov statistic to measure the maximum vertical separation, or deviation between the cumulative distributions of events and non-events.
Score HistogramThe Score Histogram compares the scoring result distribution at different time periods using a histogram.
Score Distribution Line PlotThe Score Distribution Line Plot compares the scoring result distribution at different time periods using a line plot.
Before you create a Champion and Challenger Performance report, verify the performance data and model status.
Champion and Challenger Performance Reports 143

Verify Performance Data and Model StatusBefore you can create a Champion and Challenger Performance report:
1. Select the Models page and verify that a champion model has been set. The champion model is designated as Champion in the Role column. If a champion has not been set, select a model from the list, and click to set the model as the project champion model.
2. Ensure that a challenger model is flagged. The challenger model is designated as Challenger in the Role column. If it is not, select a model from the list, and click to flag a model as a challenger to the project champion model.
3. Verify that performance monitoring data is available for the champion model and the challenger model. Performance monitoring results must exist for the same performance data using the same time periods and data labels. Navigate to Performance ð Results ð Data Sets and select the file jobstatus.sas7bdat. The Content tab displays performance monitoring status data.
a. Verify that the UUIDs for the champion and challenger models are in the Model UUID column.
b. Using the name column and the time column, verify that matching date labels exist for the champion and challenger models for each type of report. If there are multiple date labels for a model for any given report, SAS Model Manager uses the most recent job.
Create a Champion and Challenger Performance ReportTo create a champion and challenger performance report:
1. Click and select Champion and Challenger Performance. The New Report window appears.
2. Enter a name and description if you do not want to use the default values.
3. Select an output type. The default is PDF.
4. Select a style for the report. When the SAS default option is selected, the default style and themes are used in generating the report. For example, the SAS default style for the HTML output type is HTMLBLUE.
144 Chapter 11 • Using Reports to Evaluate and Validate Models
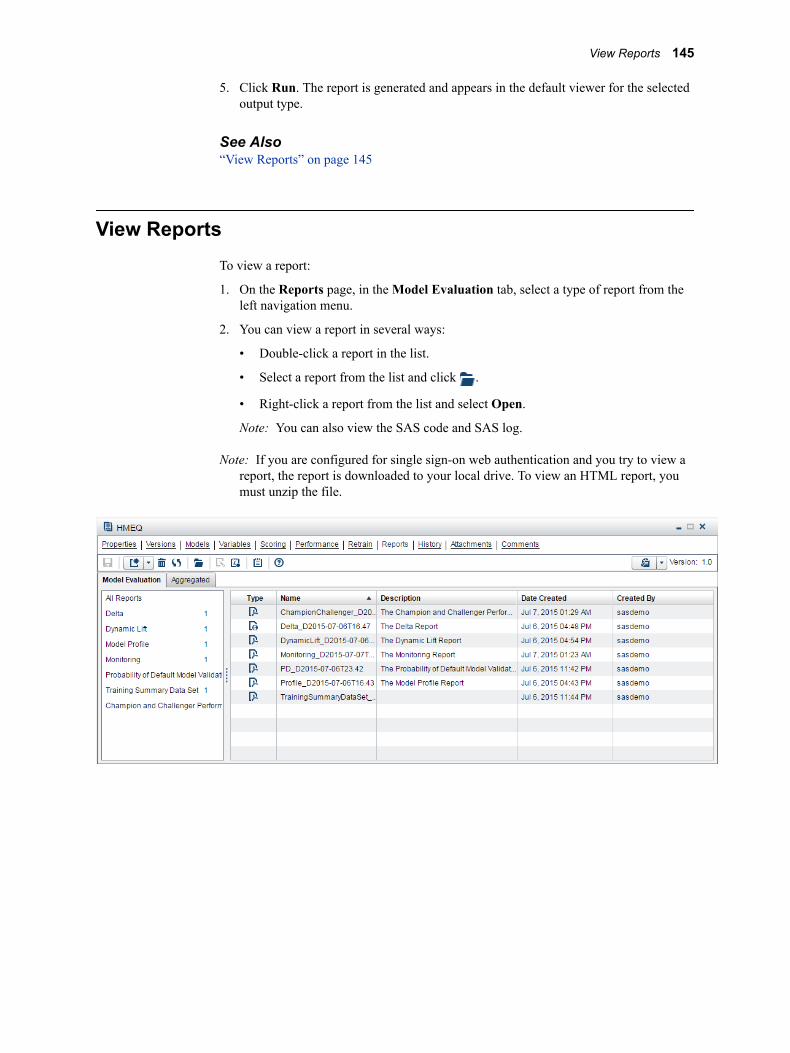
5. Click Run. The report is generated and appears in the default viewer for the selected output type.
See Also“View Reports” on page 145
View ReportsTo view a report:
1. On the Reports page, in the Model Evaluation tab, select a type of report from the left navigation menu.
2. You can view a report in several ways:
• Double-click a report in the list.
• Select a report from the list and click .
• Right-click a report from the list and select Open.
Note: You can also view the SAS code and SAS log.
Note: If you are configured for single sign-on web authentication and you try to view a report, the report is downloaded to your local drive. To view an HTML report, you must unzip the file.
View Reports 145

146 Chapter 11 • Using Reports to Evaluate and Validate Models

Chapter 12
Validating Models Using User Reports
Overview of User Reports . . . . . . . . . . . . . . . . . . . . . . . . . . . . . . . . . . . . . . . . . . . . . 147Ad Hoc Reports and User-Defined Reports . . . . . . . . . . . . . . . . . . . . . . . . . . . . . . 147Comparison of Ad Hoc and User-Defined Reports . . . . . . . . . . . . . . . . . . . . . . . . 148Output Created by User Reports . . . . . . . . . . . . . . . . . . . . . . . . . . . . . . . . . . . . . . . 148
Ad Hoc Reports . . . . . . . . . . . . . . . . . . . . . . . . . . . . . . . . . . . . . . . . . . . . . . . . . . . . . . 149Overview of Ad Hoc Reports . . . . . . . . . . . . . . . . . . . . . . . . . . . . . . . . . . . . . . . . . 149Create an Ad Hoc Report . . . . . . . . . . . . . . . . . . . . . . . . . . . . . . . . . . . . . . . . . . . . 149Example Ad Hoc Report . . . . . . . . . . . . . . . . . . . . . . . . . . . . . . . . . . . . . . . . . . . . . 150
User-Defined Reports . . . . . . . . . . . . . . . . . . . . . . . . . . . . . . . . . . . . . . . . . . . . . . . . . 151Overview of User-Defined Reports . . . . . . . . . . . . . . . . . . . . . . . . . . . . . . . . . . . . 151Create a User-Defined Report . . . . . . . . . . . . . . . . . . . . . . . . . . . . . . . . . . . . . . . . . 151Defining Macro Variables for a User-Defined Report . . . . . . . . . . . . . . . . . . . . . . 152Upload SAS Programs to the SAS Content Server . . . . . . . . . . . . . . . . . . . . . . . . 152Report Templates . . . . . . . . . . . . . . . . . . . . . . . . . . . . . . . . . . . . . . . . . . . . . . . . . . 153Edit a SAS Program on the SAS Content Server . . . . . . . . . . . . . . . . . . . . . . . . . . 156Delete a SAS Program from the SAS Content Server . . . . . . . . . . . . . . . . . . . . . . 156Run a User-Defined Report . . . . . . . . . . . . . . . . . . . . . . . . . . . . . . . . . . . . . . . . . . 156Example User-Defined Report . . . . . . . . . . . . . . . . . . . . . . . . . . . . . . . . . . . . . . . . 157
Overview of User Reports
Ad Hoc Reports and User-Defined ReportsUser reports are SAS programs that you create and import to SAS Model Manager so that you can customize reports to meet your business requirements. The ad hoc report enables you to develop, test, and run your report within SAS Model Manager. The user-defined report can be developed either within or external to SAS Model Manager. It requires a SAS program and the associated auxiliary files to be installed in a directory that is available to SAS Model Manager. Using ad hoc reports, you modify and submit your code from the SAS Editor within the Create an Ad Hoc Report window.
A user-defined report is a report that is available for reporting on all models in SAS Model Manager. The user-defined report requires three files to be installed in your server's file structure:
• a SAS program to create the report
147

• a report template XML file that specifies the report requirements, such as report name and the number of required models to run the report
• a SAS program file that lists the SAS Model Manager global macro variables and macros that are used in your report
After you have these three files, you use the Manage Templates function to upload the files to the SAS Content Server.
The ad hoc report can be used to develop, test, and debug user-defined reports. When your ad hoc report is ready for a production environment, you can create the report template XML file and the macro file, and install the three files in the user-defined report file structure.
Comparison of Ad Hoc and User-Defined Reports
Report Difference Ad Hoc Report User-Defined Report
Version An ad hoc report is defined and can be run only under the version where it was created.
A user-defined report can be run under any project version.
Report template An ad hoc report does not require a template.
A user-defined report requires a template to define the report parameters.
Report results Each time an ad hoc report is run, the existing report is overwritten.
Each time a user-defined report is run, a new report is created on the Reports page.
Location of SAS files used to generate the report
The ad hoc report SAS program is stored on the Reports page for the version where it was created.
The user-defined report SAS files are uploaded to the SAS Content Server.
Output Created by User ReportsThe first time you create a report, SAS Model Manager creates a report on the Reports page.
Each time you create a new ad hoc report, the following files are created:
• the report in either HTML, PDF, or RTF format
• smm_userCode.sas
• taskCode.log
• taskCode.sas
Each time you create a new user-defined report, the following files are created:
• the report in either HTML, PDF, or RTF format
• taskCode.log
• taskCode.sas
CAUTION:
148 Chapter 12 • Validating Models Using User Reports

The wizard overwrites the output files if an output file of the same name already exists.
Here is a description of the ad hoc report output files:
Report File Description
report-name.html This file is the report output in HTML format.
report-name.pdf This file is the report output in PDF format.
report-name.rtf This file is the report output in RTF format.
smm_userCode.sas This file contains the SAS program report code that was submitted in the Create an Ad Hoc Report window.
taskCode.log This file is the log file that contains messages from running the SAS code to create the report.
taskCode.sas This file is the SAS code that is used to create the report. The file contains the user-defined report code as well as code that was generated by SAS Model Manager to create the report.
You can see the contents of these files by selecting them on the Reports page. You can also see the taskCode.sas file and the taskCode.log files.
Ad Hoc Reports
Overview of Ad Hoc ReportsTo create an ad hoc report, you must first write a SAS report program. When the report code is ready, you copy your code to the SAS Editor tab in the Create an Ad Hoc Report window. You then submit your program. Unlike the user-defined report, the ad hoc report does not require auxiliary files to be uploaded to the SAS Content Server.
To create your report output in either HTML, PDF, or RTF, or to specify a style other than the default style for your report, you modify your report with code that is provided by SAS and that enables you to specify the report output format and style. The code that you need to add to your program is included in the steps to create an ad hoc program.
If you find an error in your report code, you must delete the report in the project, fix your code in your source file, and submit the code in the Create an Ad Hoc Report window again.
Create an Ad Hoc ReportTo create an ad hoc report, you must first create a SAS program. Test your program in SAS before you run your program as an ad hoc report. After the code runs successfully, you can create the ad hoc report.
Ad Hoc Reports 149
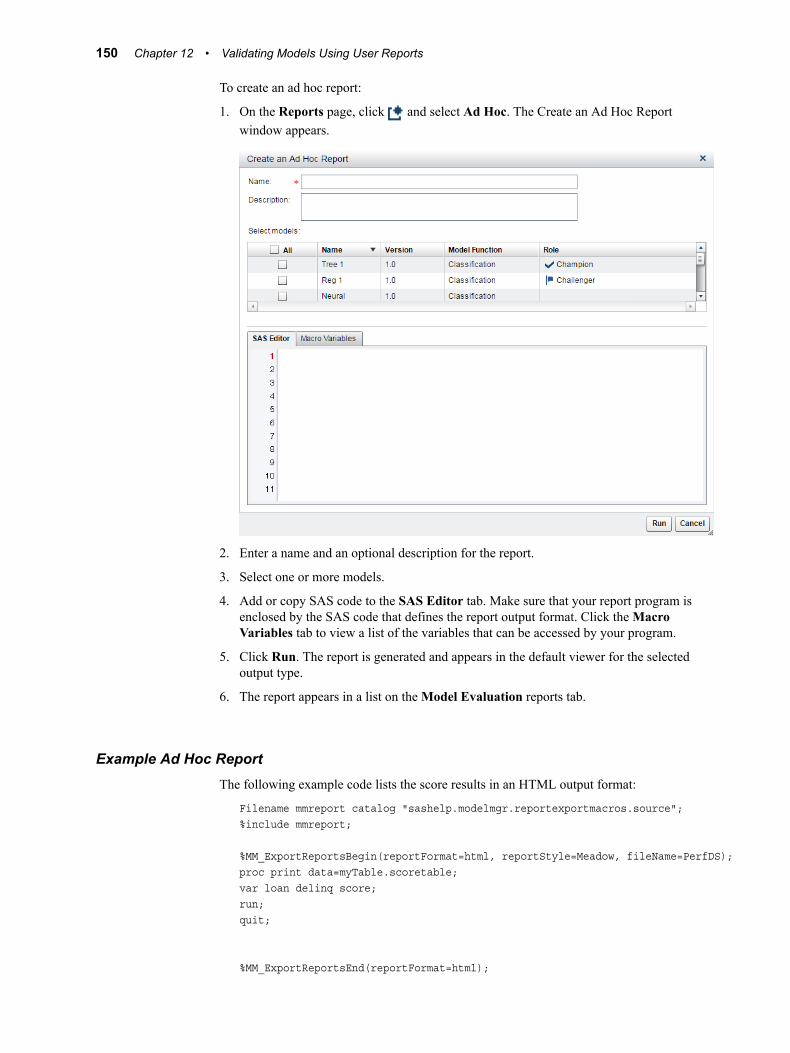
To create an ad hoc report:
1. On the Reports page, click and select Ad Hoc. The Create an Ad Hoc Report window appears.
2. Enter a name and an optional description for the report.
3. Select one or more models.
4. Add or copy SAS code to the SAS Editor tab. Make sure that your report program is enclosed by the SAS code that defines the report output format. Click the Macro Variables tab to view a list of the variables that can be accessed by your program.
5. Click Run. The report is generated and appears in the default viewer for the selected output type.
6. The report appears in a list on the Model Evaluation reports tab.
Example Ad Hoc ReportThe following example code lists the score results in an HTML output format:
Filename mmreport catalog "sashelp.modelmgr.reportexportmacros.source";%include mmreport;
%MM_ExportReportsBegin(reportFormat=html, reportStyle=Meadow, fileName=PerfDS); proc print data=myTable.scoretable;var loan delinq score;run;quit;
%MM_ExportReportsEnd(reportFormat=html);
150 Chapter 12 • Validating Models Using User Reports
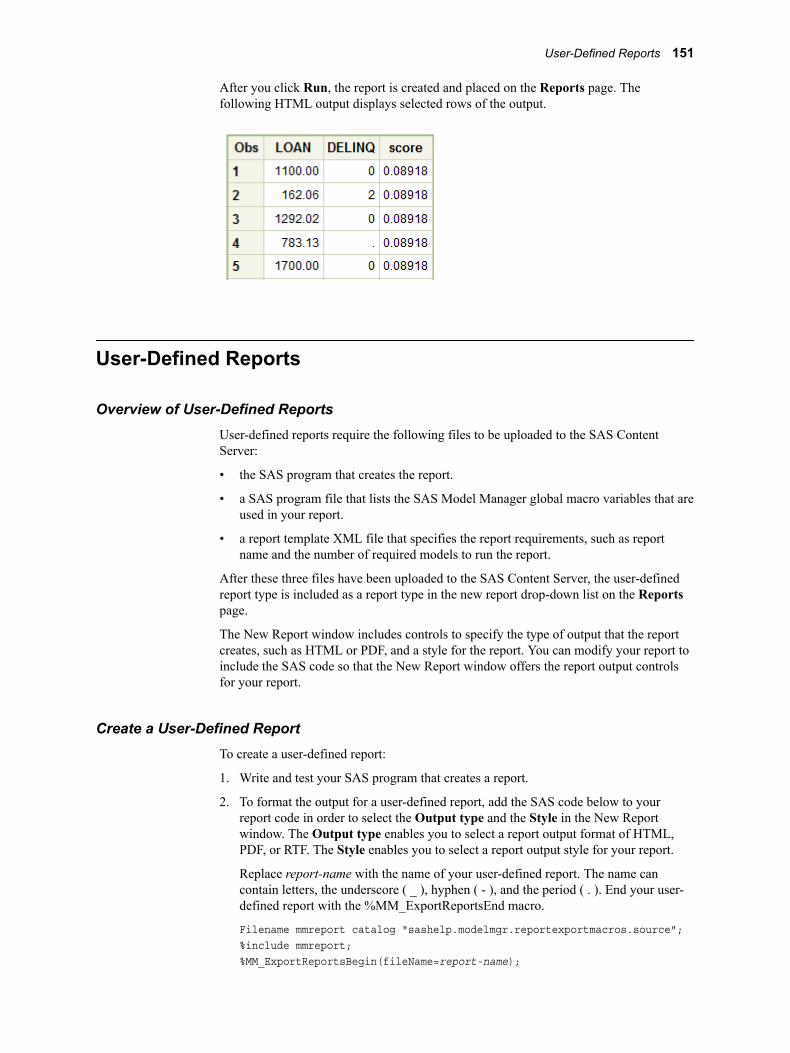
After you click Run, the report is created and placed on the Reports page. The following HTML output displays selected rows of the output.
User-Defined Reports
Overview of User-Defined ReportsUser-defined reports require the following files to be uploaded to the SAS Content Server:
• the SAS program that creates the report.
• a SAS program file that lists the SAS Model Manager global macro variables that are used in your report.
• a report template XML file that specifies the report requirements, such as report name and the number of required models to run the report.
After these three files have been uploaded to the SAS Content Server, the user-defined report type is included as a report type in the new report drop-down list on the Reports page.
The New Report window includes controls to specify the type of output that the report creates, such as HTML or PDF, and a style for the report. You can modify your report to include the SAS code so that the New Report window offers the report output controls for your report.
Create a User-Defined ReportTo create a user-defined report:
1. Write and test your SAS program that creates a report.
2. To format the output for a user-defined report, add the SAS code below to your report code in order to select the Output type and the Style in the New Report window. The Output type enables you to select a report output format of HTML, PDF, or RTF. The Style enables you to select a report output style for your report.
Replace report-name with the name of your user-defined report. The name can contain letters, the underscore ( _ ), hyphen ( - ), and the period ( . ). End your user-defined report with the %MM_ExportReportsEnd macro.
Filename mmreport catalog "sashelp.modelmgr.reportexportmacros.source";%include mmreport;%MM_ExportReportsBegin(fileName=report-name);
User-Defined Reports 151

… your-user—defined-code …%MM_ExportReportsEnd;
3. In the report XML file, add this SAS program name to the FILENAME= argument of the <Code> element (for example, <Code filename="myUserReport.sas"/>). For more information, see “Report Templates” on page 153.
For an example of a report, see “Example User-Defined Report” on page 157.
Defining Macro Variables for a User-Defined ReportExecuting a user-defined report requires a SAS program that lists the report code’s macro variables. If you do not have macro variables in your report, create a SAS program file with a comment in it. This file is required.
Here is an example program to define macro variables:
%let _MM_User=miller;%let _MM_Password=Rumpillstillskin3;
In the report XML file, add this SAS program name to the FILENAME= argument of the <PreCode> element (for example, <PreCode filename="myMacroDefs.sas"/>). For more information, see “Report Templates” on page 153.
For an example of a macro variable program, see “Example User-Defined Report” on page 157.
For a list of macro variables, see “Macro Variables” in SAS Model Manager: Macro Reference.
Upload SAS Programs to the SAS Content ServerAfter you have the two SAS programs for your user report, follow these steps to upload them to the SAS Content Server:
1. From the Projects category view, click , and select New Template.
152 Chapter 12 • Validating Models Using User Reports
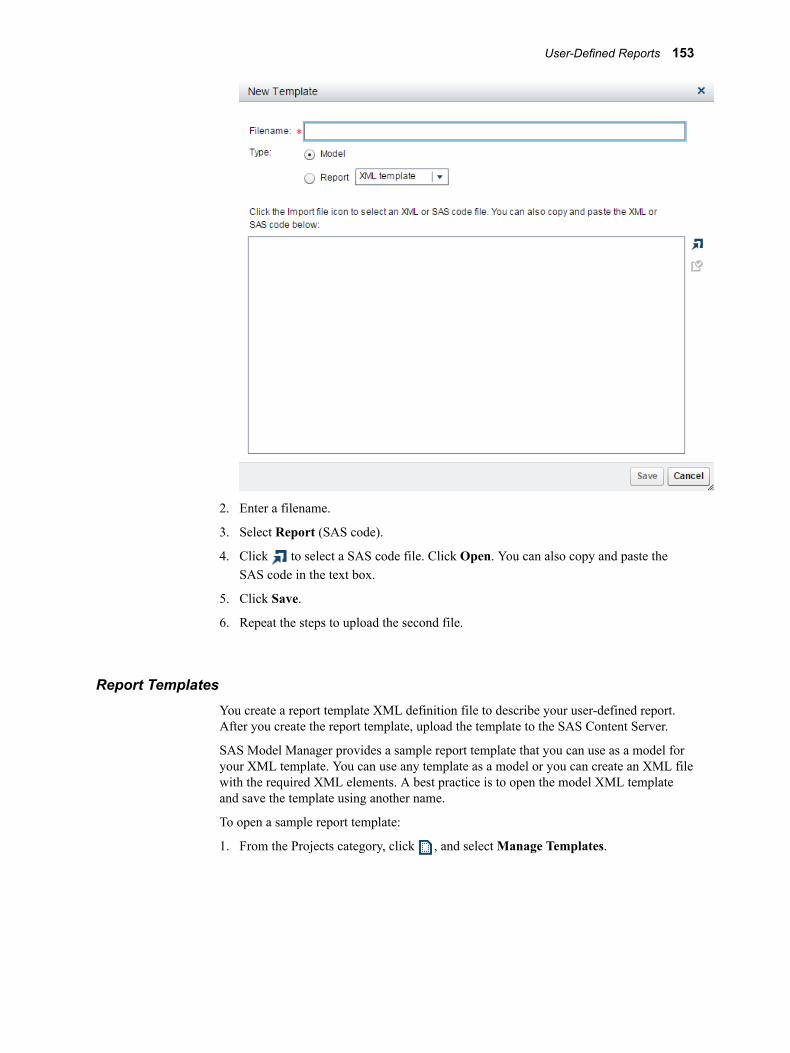
2. Enter a filename.
3. Select Report (SAS code).
4. Click to select a SAS code file. Click Open. You can also copy and paste the SAS code in the text box.
5. Click Save.
6. Repeat the steps to upload the second file.
Report TemplatesYou create a report template XML definition file to describe your user-defined report. After you create the report template, upload the template to the SAS Content Server.
SAS Model Manager provides a sample report template that you can use as a model for your XML template. You can use any template as a model or you can create an XML file with the required XML elements. A best practice is to open the model XML template and save the template using another name.
To open a sample report template:
1. From the Projects category, click , and select Manage Templates.
User-Defined Reports 153
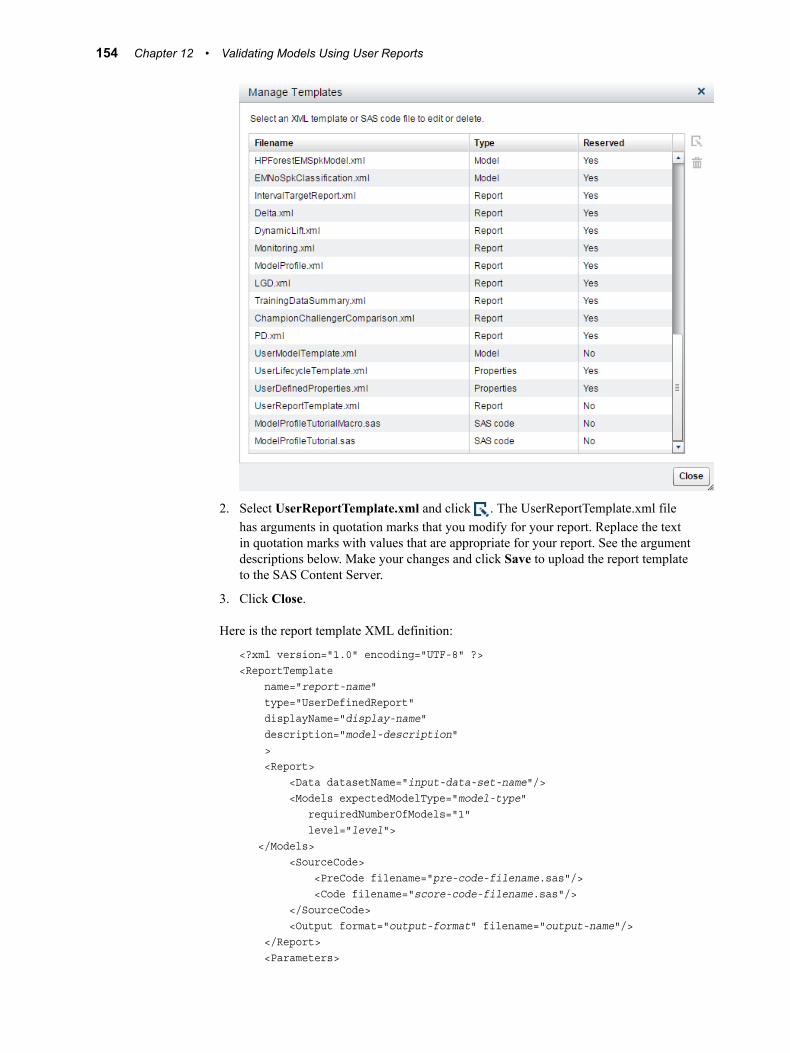
2. Select UserReportTemplate.xml and click . The UserReportTemplate.xml file has arguments in quotation marks that you modify for your report. Replace the text in quotation marks with values that are appropriate for your report. See the argument descriptions below. Make your changes and click Save to upload the report template to the SAS Content Server.
3. Click Close.
Here is the report template XML definition:
<?xml version="1.0" encoding="UTF-8" ?><ReportTemplate name="report-name" type="UserDefinedReport" displayName="display-name" description="model-description" > <Report> <Data datasetName="input-data-set-name"/> <Models expectedModelType="model-type" requiredNumberOfModels="1" level="level"> </Models> <SourceCode> <PreCode filename="pre-code-filename.sas"/> <Code filename="score-code-filename.sas"/> </SourceCode> <Output format="output-format" filename="output-name"/> </Report> <Parameters>
154 Chapter 12 • Validating Models Using User Reports
<Parameter name="parameter-name" value="parameter-value" /> </Parameters></ReportTemplate>
<ReportTemplate> element arguments
name="report-name"specifies the name of the report. The characters @ \ / * % # & $ ( ) ! ? < > ^ + ~ ` = { } [ ] | ; : ‘ " cannot be used in the name.
displayName="display-name"specifies the name of the report that is displayed in the Report section of the New Report window.
description="model-description"specifies a description of the report that is displayed at the bottom of the New Report window when the report is selected in the window.
<Report> element arguments
<Data datasetName="input-data-set-name"/>specifies the name of a data source data set that is used for input to the report. The data set must be in the form libref.filename. You can use the following global macro variables as a value for input-data-set-name as long as the value of the macro variable is in the form of libref.filename:
• &_MM_InputLib
• &_MM_OutputLib
• &_MM_PerformanceLib
• &_MM_TestLib
• &_MM_TrainLib
<ModelsexpectedModelType="model-type"requiredNumberOfModels="number-of-models"level="level"></Models>
specifies information about the model.
expectedModelType="model-type"specifies the model type.
Valid values: ANALYTICAL, CLASSIFICATION, PREDICTION, SEGMENTATION, ANY
requiredNumberOfModels="number-of-models"specifies the number of models that are processed in this report.
level="folder"specifies where the report is to obtain a list of models. If folder is VERSION, the report creates a list of models in the version. If folder is PROJECT, the report creates a list of models from all versions in the project.
Valid values: VERSION, PROJECT
<SourceCode><PreCode filename="pre-code-filename.sas"/><Code filename="report-code-filename.sas"/></SourceCode>
specifies the files that are used to execute the report.
User-Defined Reports 155
<PreCode filename="pre-code-filename.sas"/>specifies the name of the SAS program that contains macro variable definitions.
<Code filename="report-code-filename.sas"/>specifies the name of the SAS program that creates the report.
<Output format="output-format" filename="output-report-name"/>specifies the output format arguments:
format="output-format"specifies the format of the report output.
Valid values: HTML, PDF, or RTF
filename="output-report-name"specifies the name of the output report.
<Parameters> Element Argument
<Parameter name="parameter-name" value="parameter-value" />This element is not used. It is reserved for future use.
Edit a SAS Program on the SAS Content ServerTo edit the program after the file has been uploaded to the SAS Content Server:
1. Click and select Manage Templates.
2. Select an XML template, SAS code file, or user-defined properties template to edit. In order for the template to be editable, the Reserved column must be marked as No. Life cycle templates cannot be edited but can be viewed.
3. Click . Make your changes and click Save.
4. Click Close.
Delete a SAS Program from the SAS Content ServerDeleting a User Report SAS Content Server is a two-step process. You must delete the SAS program and the report template.
To delete a user report:
1. Click and select Manage Templates.
2. Select an XML template, SAS code file, or user-defined properties template to delete. The Reserved column must be marked as No to delete a file. The user-defined properties template file cannot be deleted.
3. Click . A confirmation window appears.
4. Click Yes to delete the file.
5. Click Close.
Run a User-Defined ReportTo run a user-defined report:
1. Click and select your user-defined report. The New Report window appears.
156 Chapter 12 • Validating Models Using User Reports
2. Enter a name and description if you do not want to use the default values.
3. Select an output type. The default is PDF.
4. Select a style for the report. When the SAS default option is selected, the default style and themes are used in generating the report. For example, the SAS default style for the HTML output type is HTMLBLUE.
5. From the list, select the models that you want to include in the report.
6. Click Run. The report is generated and appears in the default viewer for the selected output type.
See Also“View Reports” on page 145
Example User-Defined Report
Overview of the Example User-Defined ReportThe example user-defined report categorizes scoring values into score ranges and then graphs the results. The program name is Score Range Report. The following SAS programs and report template file are required to create this report:
• The SAS report program is the file ScoreRange.sas
• The SAS program file that contains macro variables is ScoreRangeMacro.sas
• The report template XML file is ScoreRangeTemplate.xml
SAS Report ProgramHere is the SAS code for a user-defined report to categorize score codes:
filename mmreport catalog "sashelp.modelmgr.reportexportmacros.source";%include mmreport;
%MM_ExportReportsBegin(fileName=scoreRange);
options NOmprint NOdate;%let _MM_PosteriorVar=P_1;
proc format; value score low - 400 = '400 and Below' 401 - 450 = '401 - 450' 451 - 500 = '451 - 500' 501 - 550 = '501 - 550' 551 - 600 = '551 - 600' 601 - 650 = '601 - 650' 651 - 700 = '651 - 700' 701 - 750 = '701 - 750' 751 - 800 = '751 - 800' 801 - high= '801 and Above';run;quit;
User-Defined Reports 157
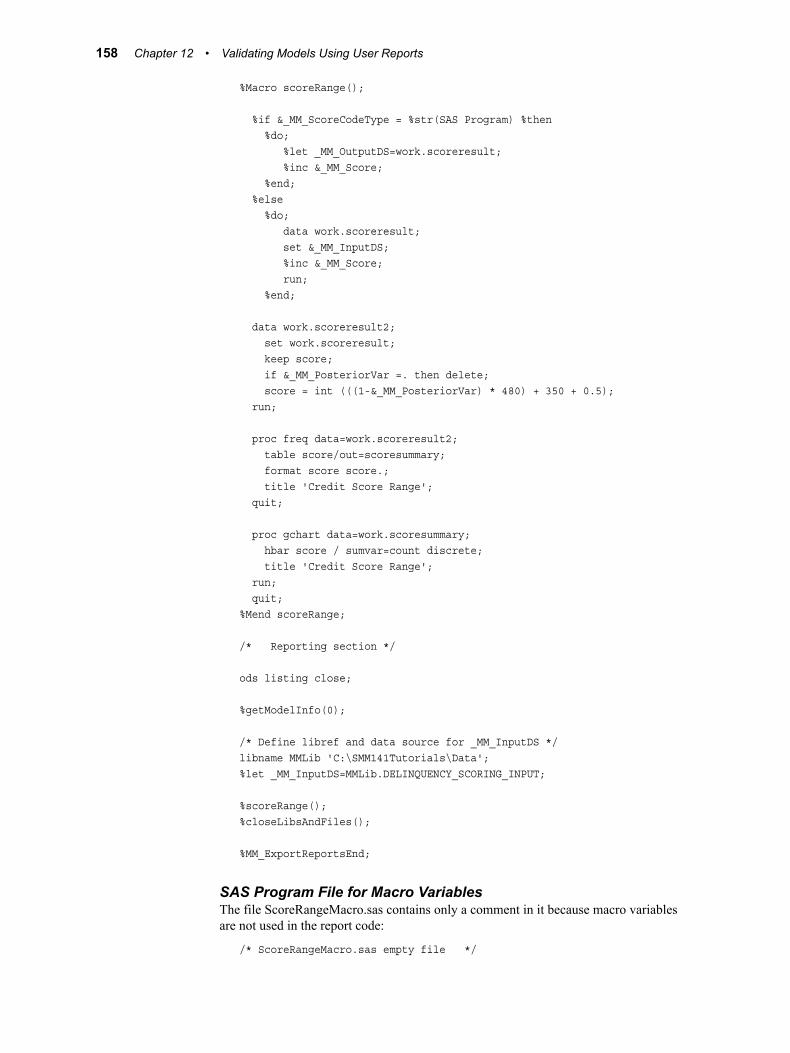
%Macro scoreRange();
%if &_MM_ScoreCodeType = %str(SAS Program) %then %do; %let _MM_OutputDS=work.scoreresult; %inc &_MM_Score; %end; %else %do; data work.scoreresult; set &_MM_InputDS; %inc &_MM_Score; run; %end;
data work.scoreresult2; set work.scoreresult; keep score; if &_MM_PosteriorVar =. then delete; score = int (((1-&_MM_PosteriorVar) * 480) + 350 + 0.5); run;
proc freq data=work.scoreresult2; table score/out=scoresummary; format score score.; title 'Credit Score Range'; quit;
proc gchart data=work.scoresummary; hbar score / sumvar=count discrete; title 'Credit Score Range'; run; quit;%Mend scoreRange;
/* Reporting section */
ods listing close;
%getModelInfo(0);
/* Define libref and data source for _MM_InputDS */libname MMLib 'C:\SMM141Tutorials\Data';%let _MM_InputDS=MMLib.DELINQUENCY_SCORING_INPUT;
%scoreRange();%closeLibsAndFiles();
%MM_ExportReportsEnd;
SAS Program File for Macro VariablesThe file ScoreRangeMacro.sas contains only a comment in it because macro variables are not used in the report code:
/* ScoreRangeMacro.sas empty file */
158 Chapter 12 • Validating Models Using User Reports
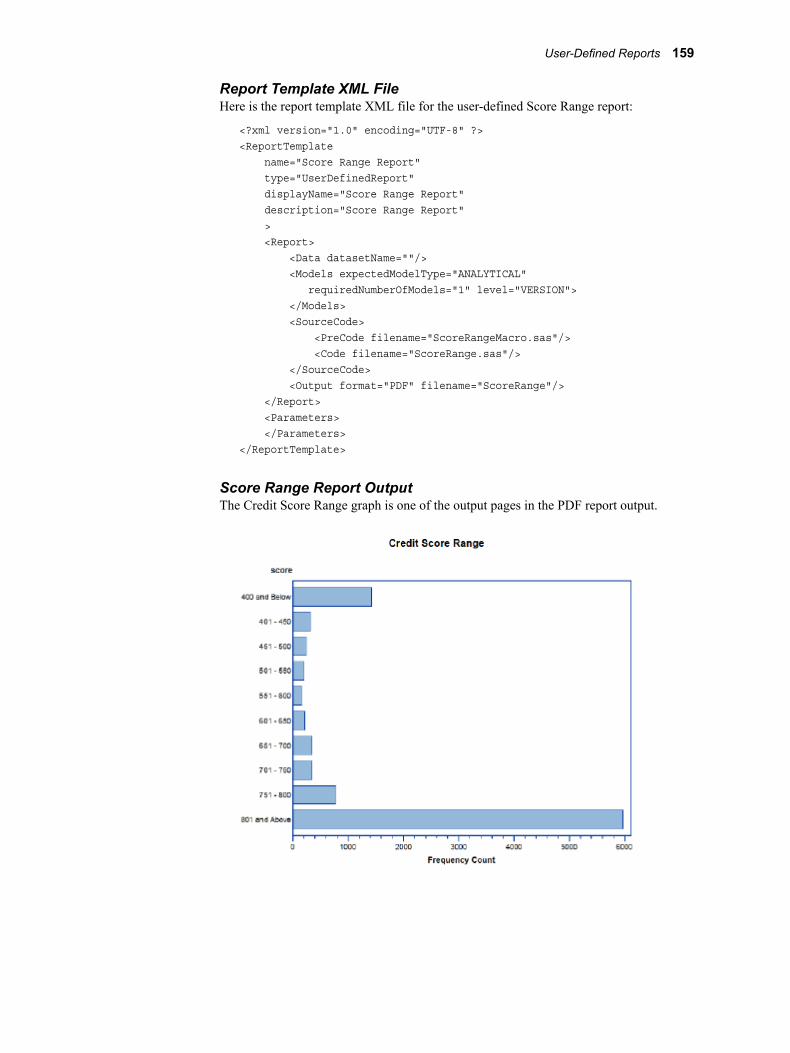
Report Template XML FileHere is the report template XML file for the user-defined Score Range report:
<?xml version="1.0" encoding="UTF-8" ?><ReportTemplate name="Score Range Report" type="UserDefinedReport" displayName="Score Range Report" description="Score Range Report" > <Report> <Data datasetName=""/> <Models expectedModelType="ANALYTICAL" requiredNumberOfModels="1" level="VERSION"> </Models> <SourceCode> <PreCode filename="ScoreRangeMacro.sas"/> <Code filename="ScoreRange.sas"/> </SourceCode> <Output format="PDF" filename="ScoreRange"/> </Report> <Parameters> </Parameters></ReportTemplate>
Score Range Report OutputThe Credit Score Range graph is one of the output pages in the PDF report output.
User-Defined Reports 159

160 Chapter 12 • Validating Models Using User Reports

Chapter 13
Combining Reports
About Aggregated Reports . . . . . . . . . . . . . . . . . . . . . . . . . . . . . . . . . . . . . . . . . . . . 161
Create an Aggregated Report . . . . . . . . . . . . . . . . . . . . . . . . . . . . . . . . . . . . . . . . . . 161
View an Aggregated Report . . . . . . . . . . . . . . . . . . . . . . . . . . . . . . . . . . . . . . . . . . . . 162
Delete an Aggregated Report . . . . . . . . . . . . . . . . . . . . . . . . . . . . . . . . . . . . . . . . . . . 163
About Aggregated ReportsSAS Model Manager administrators and advanced users can combine multiple reports from the Reports page to create a single, aggregated report. Using reports that reside in the Reports page, you select the reports that you want in your aggregated report. The format of the report can be PDF, HTML, or RTF. Aggregated reports are stored on the Aggregated tab.
Ad hoc reports, Loss Given Default (LGD) reports, and Probability of Default Model Validation (PD) reports cannot be added to an aggregated report.
Create an Aggregated ReportNote: To create an aggregated report, you must have existing reports on the Reports
page.
To create an aggregated report:
1. On the Aggregated tab on the Reports page, click . The New Aggregated Report window appears.
161
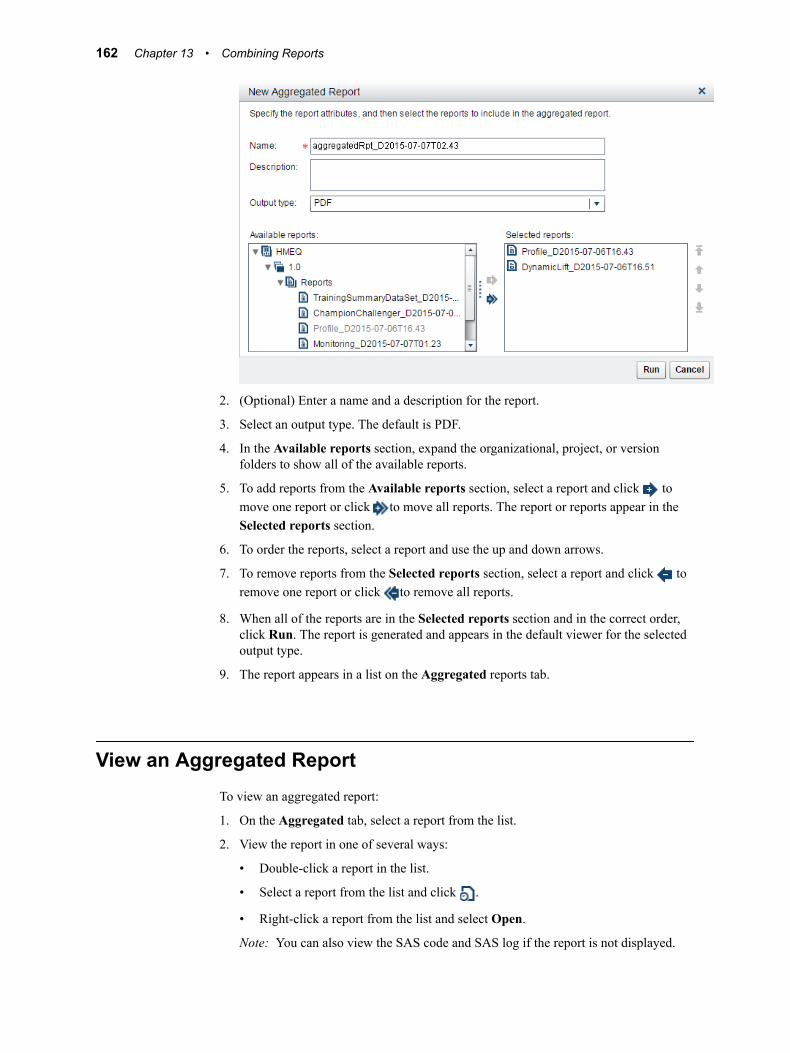
2. (Optional) Enter a name and a description for the report.
3. Select an output type. The default is PDF.
4. In the Available reports section, expand the organizational, project, or version folders to show all of the available reports.
5. To add reports from the Available reports section, select a report and click to move one report or click to move all reports. The report or reports appear in the Selected reports section.
6. To order the reports, select a report and use the up and down arrows.
7. To remove reports from the Selected reports section, select a report and click to remove one report or click to remove all reports.
8. When all of the reports are in the Selected reports section and in the correct order, click Run. The report is generated and appears in the default viewer for the selected output type.
9. The report appears in a list on the Aggregated reports tab.
View an Aggregated ReportTo view an aggregated report:
1. On the Aggregated tab, select a report from the list.
2. View the report in one of several ways:
• Double-click a report in the list.
• Select a report from the list and click .
• Right-click a report from the list and select Open.
Note: You can also view the SAS code and SAS log if the report is not displayed.
162 Chapter 13 • Combining Reports
Note: If you are configured for single sign-on web authentication and you try to view a report, the report is downloaded to your local drive. To view an HTML report, you must unzip the file.
Delete an Aggregated ReportTo delete an aggregated report:
1. On the Aggregated tab, select a report from the list.
2. You can delete the report in one of several ways:
• To delete a file, click . Confirm the deletion.
• Right-click a report from the list and select Delete. Confirm the deletion.
Delete an Aggregated Report 163

164 Chapter 13 • Combining Reports

Chapter 14
Monitoring Performance of Models
Overview of Performance Monitoring . . . . . . . . . . . . . . . . . . . . . . . . . . . . . . . . . . . 165
Types of Performance Monitoring . . . . . . . . . . . . . . . . . . . . . . . . . . . . . . . . . . . . . . 167Overview of the Types of Performance Monitoring . . . . . . . . . . . . . . . . . . . . . . . . 167Summary Results . . . . . . . . . . . . . . . . . . . . . . . . . . . . . . . . . . . . . . . . . . . . . . . . . . 168Data Composition Reports . . . . . . . . . . . . . . . . . . . . . . . . . . . . . . . . . . . . . . . . . . . 168Model Monitoring Reports . . . . . . . . . . . . . . . . . . . . . . . . . . . . . . . . . . . . . . . . . . . 171
Performance Index Warnings and Alerts . . . . . . . . . . . . . . . . . . . . . . . . . . . . . . . . . 173
Monitoring Champion Models . . . . . . . . . . . . . . . . . . . . . . . . . . . . . . . . . . . . . . . . . 175
Creating Reports Using a Performance Definition . . . . . . . . . . . . . . . . . . . . . . . . . 176Overview of Creating Reports Using a Performance Definition . . . . . . . . . . . . . . 176Determine How to Use the Performance Data Sets . . . . . . . . . . . . . . . . . . . . . . . . 177
Prerequisites for Editing a Performance Definition . . . . . . . . . . . . . . . . . . . . . . . . 179Overview of Prerequisites . . . . . . . . . . . . . . . . . . . . . . . . . . . . . . . . . . . . . . . . . . . . 179Ensure That Champion and Challenger Models Are Set . . . . . . . . . . . . . . . . . . . . 179Ensure That the Champion Model Function and Class Target Level Are Valid . . . 179Ensure That the Performance Data Source Is Available . . . . . . . . . . . . . . . . . . . . . 180Ensure That Project and Model Properties Are Set . . . . . . . . . . . . . . . . . . . . . . . . 180Map Model and Project Output Variables . . . . . . . . . . . . . . . . . . . . . . . . . . . . . . . 180
Edit and Execute a Performance Definition . . . . . . . . . . . . . . . . . . . . . . . . . . . . . . . 181
Schedule Performance Definitions . . . . . . . . . . . . . . . . . . . . . . . . . . . . . . . . . . . . . . 184
View Performance Monitoring Job History . . . . . . . . . . . . . . . . . . . . . . . . . . . . . . . 186
Manage Performance Data Sets . . . . . . . . . . . . . . . . . . . . . . . . . . . . . . . . . . . . . . . . 187
Monitoring Performance of a Model without Score Code . . . . . . . . . . . . . . . . . . . 187
Overview of Performance MonitoringTo ensure that a champion model in a production environment is performing efficiently, you can collect performance data that has been created by the model at intervals that are determined by your organization. A performance data set is used to assess model prediction accuracy. It includes all of the required input variables as well as one or more actual target variables. For example, you might want to create performance data sets monthly or quarterly and then use SAS Model Manager to create a performance definition that includes each time interval. After you create and execute the performance
165

definition on the Performance page, you can view the performance data through report charts in SAS Model Manager. These report charts give a graphical representation of the model's performance. SAS Model Manager also enables you to create performance monitoring reports in PDF, HTML, and RTF output formats from the Reports page.
Note: Performance monitoring is designed to work only with a project that is associated with a classification model function and has a binary target, or with a prediction model function and has an interval target. Only models that are associated with the classification and prediction model types and that are set as champion and challenger models can be monitored for performance.
The following types of output for performance monitoring are available:
• Summaries of the types of information in project folders such as the number of models, model age distribution, input variables, and target variables.
• Reports that detect and quantify shifts in the distribution of variable values over time that occur in input data and scored output data.
• Performance monitoring reports that evaluate the predicted and actual target values for a champion model at multiple points in time.
You can create the performance monitoring output, except for summaries, using either of the following methods:
• On the Performance page, generate the SAS code that creates the performance output and then execute the generated code.
• Write your own SAS program using the report creation macros that are provided with SAS Model Manager and submit your program as a batch job. You can run your
166 Chapter 14 • Monitoring Performance of Models
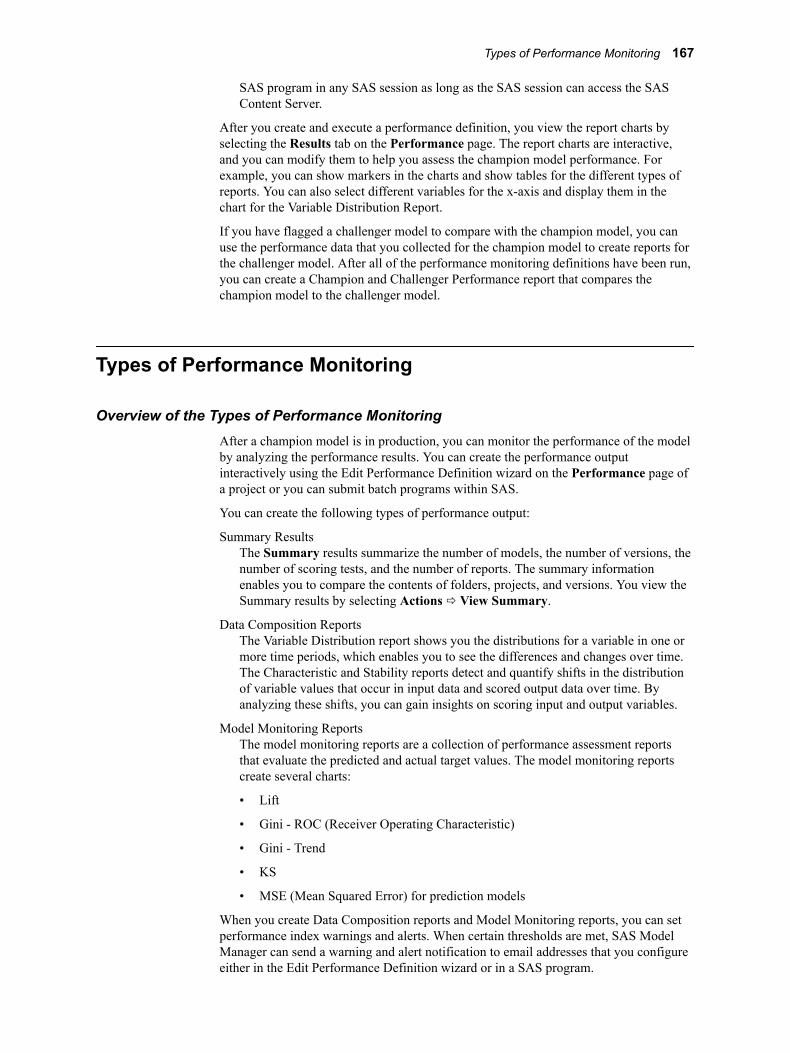
SAS program in any SAS session as long as the SAS session can access the SAS Content Server.
After you create and execute a performance definition, you view the report charts by selecting the Results tab on the Performance page. The report charts are interactive, and you can modify them to help you assess the champion model performance. For example, you can show markers in the charts and show tables for the different types of reports. You can also select different variables for the x-axis and display them in the chart for the Variable Distribution Report.
If you have flagged a challenger model to compare with the champion model, you can use the performance data that you collected for the champion model to create reports for the challenger model. After all of the performance monitoring definitions have been run, you can create a Champion and Challenger Performance report that compares the champion model to the challenger model.
Types of Performance Monitoring
Overview of the Types of Performance MonitoringAfter a champion model is in production, you can monitor the performance of the model by analyzing the performance results. You can create the performance output interactively using the Edit Performance Definition wizard on the Performance page of a project or you can submit batch programs within SAS.
You can create the following types of performance output:
Summary ResultsThe Summary results summarize the number of models, the number of versions, the number of scoring tests, and the number of reports. The summary information enables you to compare the contents of folders, projects, and versions. You view the Summary results by selecting Actions ð View Summary.
Data Composition ReportsThe Variable Distribution report shows you the distributions for a variable in one or more time periods, which enables you to see the differences and changes over time. The Characteristic and Stability reports detect and quantify shifts in the distribution of variable values that occur in input data and scored output data over time. By analyzing these shifts, you can gain insights on scoring input and output variables.
Model Monitoring ReportsThe model monitoring reports are a collection of performance assessment reports that evaluate the predicted and actual target values. The model monitoring reports create several charts:
• Lift
• Gini - ROC (Receiver Operating Characteristic)
• Gini - Trend
• KS
• MSE (Mean Squared Error) for prediction models
When you create Data Composition reports and Model Monitoring reports, you can set performance index warnings and alerts. When certain thresholds are met, SAS Model Manager can send a warning and alert notification to email addresses that you configure either in the Edit Performance Definition wizard or in a SAS program.
Types of Performance Monitoring 167

You view the Data Composition reports and the Model Monitoring reports on the Results tab on the Performance page.
Summary ResultsThe Summary results summarizes the contents of different folders and projects.
The contents of the Summary results is dynamic and is updated according to the selected project. The scope of the information that is reported is defined by the collection of folders and objects that exist beneath the folder that is selected.
To view the Summary results, select Actions ð View Summary.
Use the following sections to evaluate and compare the contents of the project:
General Use the General section to browse the number of models, the number of versions, and the number of scoring tests.
Summary of ReportsUse the Summary of Reports section to browse the number of reports that are available on the Reports page for the selected object.
Model Target Variable ReportUse the Model Target Variable Report to see the frequency with which target variables are used in the models that exist for the selected object. Each unique model target variable is reported, listing the number of models that use that variable as a target variable.
Model Input Variable ReportUse the Model Input Variable Report to see the frequency with which input variables are used in the models for a folder or project. Each unique model input variable is reported, listing the number of models that use that variable as an input variable.
Data Composition Reports
Variable Distribution ReportSelect the Results tab on the Performance page to view the Variable Distribution report. The variable distribution chart is a graphical representation of distributions over a period of time for the selected variable. Each line plot represents the data for a specific period of time. The Y-axis is the percentage of observations in a bin that is proportional to the total count.
To change the variable that appears in the chart, select a variable from the drop-down list.
Here is an example of a Variable Distribution report. By placing the cursor over a point in the chart, you can view the data for that point.
168 Chapter 14 • Monitoring Performance of Models
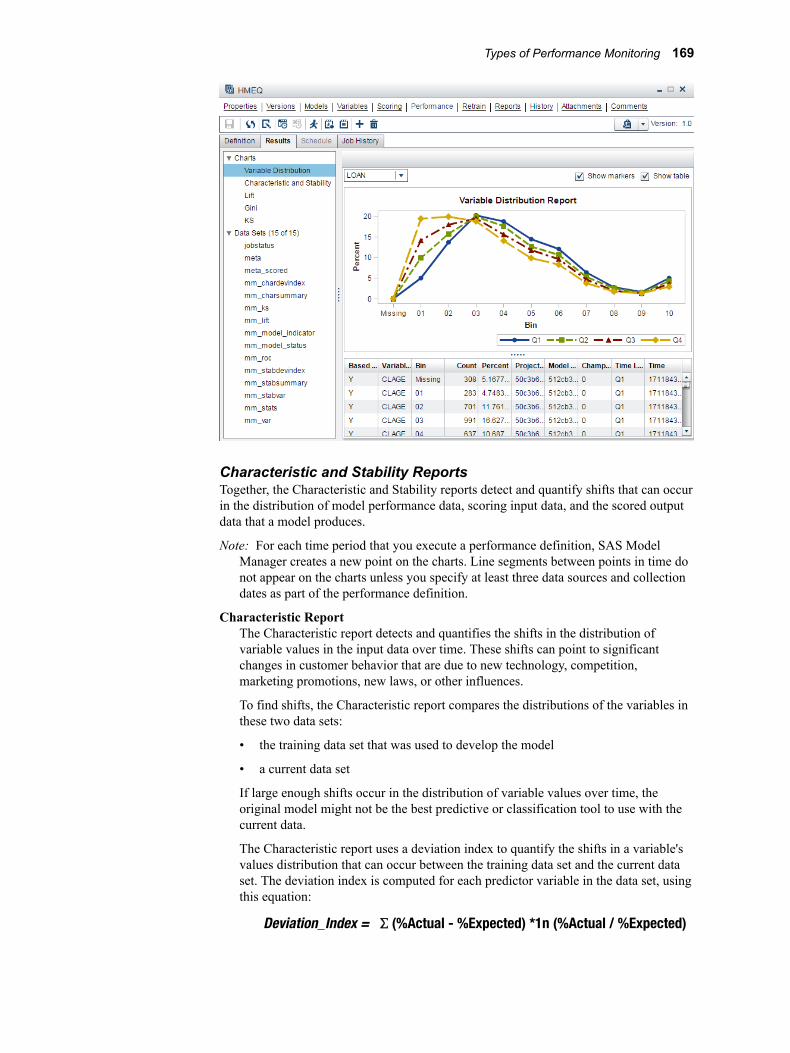
Characteristic and Stability ReportsTogether, the Characteristic and Stability reports detect and quantify shifts that can occur in the distribution of model performance data, scoring input data, and the scored output data that a model produces.
Note: For each time period that you execute a performance definition, SAS Model Manager creates a new point on the charts. Line segments between points in time do not appear on the charts unless you specify at least three data sources and collection dates as part of the performance definition.
Characteristic ReportThe Characteristic report detects and quantifies the shifts in the distribution of variable values in the input data over time. These shifts can point to significant changes in customer behavior that are due to new technology, competition, marketing promotions, new laws, or other influences.
To find shifts, the Characteristic report compares the distributions of the variables in these two data sets:
• the training data set that was used to develop the model
• a current data set
If large enough shifts occur in the distribution of variable values over time, the original model might not be the best predictive or classification tool to use with the current data.
The Characteristic report uses a deviation index to quantify the shifts in a variable's values distribution that can occur between the training data set and the current data set. The deviation index is computed for each predictor variable in the data set, using this equation:
Deviation_Index = Σ (%Actual - %Expected) *1n (%Actual / %Expected)
Types of Performance Monitoring 169

Numeric predictor variable values are placed into bins for frequency analysis. Outlier values are removed to facilitate better placement of values and to avoid scenarios that can aggregate most observations into a single bin.
If the training data set and the current data set have identical distributions for a variable, the variable's deviation index is equal to 0. A variable with a deviation index value that is P1>2 is classified as having a mild deviation. The Characteristic report uses the performance measure P1 to count the number of variables that receive a deviation index value that is greater than 0.1.
A variable that has a deviation index value that is P1>5 or P25>0 is classified as having a significant deviation. A performance measure P25 is used to count the number of variables that have significant deviations, or the number of input variables that receive a deviation index score value that is greater than or equal to 0.25.
Stability ReportThe Stability report evaluates changes in the distribution of scored output variable values as models score data over time, and detects and quantifies shifts in the distribution of output variable values in the data that is produced by the models. If an output variable from the training data set and the output variable from the current data set have identical distributions, then that output variable's deviation index is equal to 0. An output variable with a deviation index value that is greater than 0.10 and less than 0.25 is classified as having a mild deviation. A variable that has a deviation index value that is greater than 0.30 is classified as having a significant deviation. Too much deviation in predictive variable output can indicate that model tuning, retraining, or replacement might be necessary.
Here is an example of Characteristic and Stability reports. By placing the cursor over a point in the chart, you can view the data for that point.
170 Chapter 14 • Monitoring Performance of Models
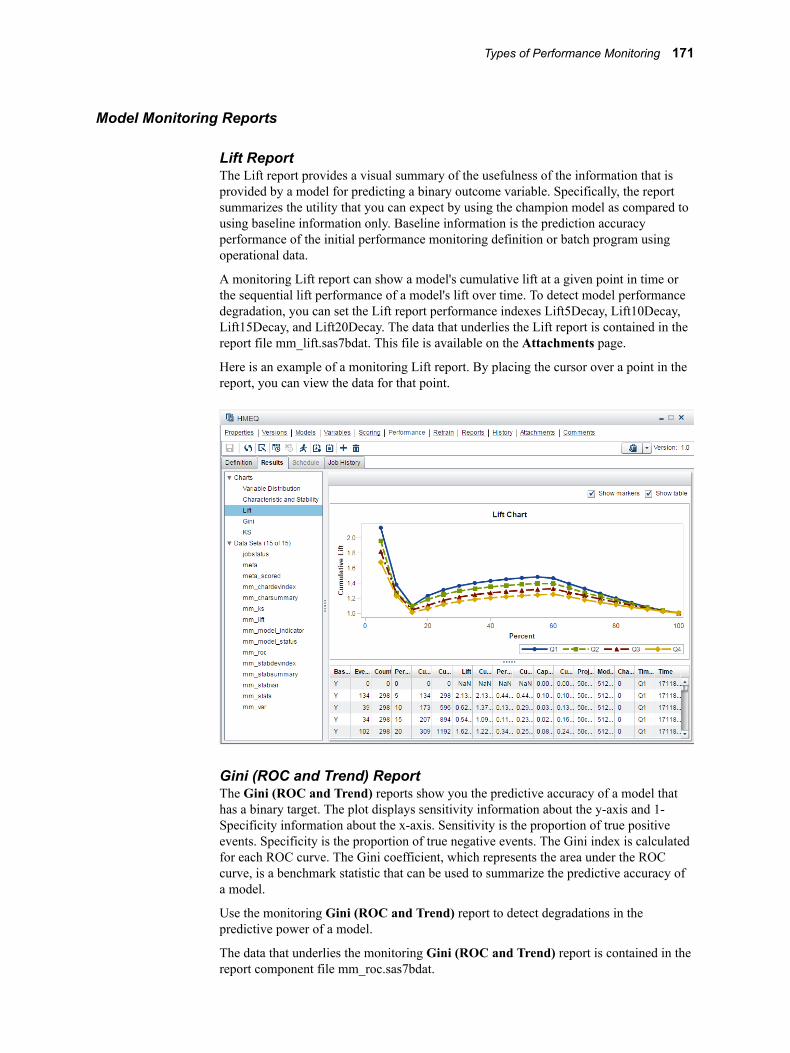
Model Monitoring Reports
Lift ReportThe Lift report provides a visual summary of the usefulness of the information that is provided by a model for predicting a binary outcome variable. Specifically, the report summarizes the utility that you can expect by using the champion model as compared to using baseline information only. Baseline information is the prediction accuracy performance of the initial performance monitoring definition or batch program using operational data.
A monitoring Lift report can show a model's cumulative lift at a given point in time or the sequential lift performance of a model's lift over time. To detect model performance degradation, you can set the Lift report performance indexes Lift5Decay, Lift10Decay, Lift15Decay, and Lift20Decay. The data that underlies the Lift report is contained in the report file mm_lift.sas7bdat. This file is available on the Attachments page.
Here is an example of a monitoring Lift report. By placing the cursor over a point in the report, you can view the data for that point.
Gini (ROC and Trend) ReportThe Gini (ROC and Trend) reports show you the predictive accuracy of a model that has a binary target. The plot displays sensitivity information about the y-axis and 1-Specificity information about the x-axis. Sensitivity is the proportion of true positive events. Specificity is the proportion of true negative events. The Gini index is calculated for each ROC curve. The Gini coefficient, which represents the area under the ROC curve, is a benchmark statistic that can be used to summarize the predictive accuracy of a model.
Use the monitoring Gini (ROC and Trend) report to detect degradations in the predictive power of a model.
The data that underlies the monitoring Gini (ROC and Trend) report is contained in the report component file mm_roc.sas7bdat.
Types of Performance Monitoring 171

The following chart is an example of a monitoring Gini (ROC and Trend) report. By placing the cursor over a point in the chart, you can view the data for that point.
KS ReportThe KS report contains the Kolmogorov-Smirnov (KS) test plots for models with a binary target. The KS statistic measures the maximum vertical separation, or deviation between the cumulative distributions of events and non-events. This trend report uses a summary data set that plots the KS statistic and the KS probability cutoff values over time.
Use the KS report to detect degradations in the predictive power of a model. To scroll through a successive series of KS performance depictions, select a time interval from the Time Interval list box. If model performance is declining, it is indicated by the decreasing distances between the KS plot lines.
To detect model performance degradation, you can set the ksDecay performance index in the KS report.
The data that underlies the KS chart is contained in the report component file mm_ks.sas7bdat.
The following report is an example of a KS report. By placing the cursor over a point in the chart, you can view the data for that point.
172 Chapter 14 • Monitoring Performance of Models

Mean Squared Error ReportThe Mean Squared Error (MSE) report checks the accuracy of a prediction model with an interval target by comparing the estimation derived from the test data and the actual outcomes that are associated with the test data for different time periods.
The following report is an example of an MSE report.
Performance Index Warnings and AlertsThe production model performance reports use performance measurement thresholds to benchmark and gauge the performance of a predictive model. When one of the
Performance Index Warnings and Alerts 173

performance measurements exceeds one or more specified indexes or thresholds, warning and alert events occur. When warning or alert events occur, warning and alert notifications are automatically sent by email to recipients whose email address is configured either in the Edit Performance Definition wizard or in the batch program that runs the reports.
Use the following assignment statements to set warning and alert conditions:
alertCondition='alert-condition';warningCondition='warning-condition';
Note: The condition must be enclosed in quotation marks if you use SAS code to create the report. An error occurs if you enclose the condition in quotation marks in the Edit Performance Definition wizard.
The following indexes and thresholds can be configured in either the Edit Performance Definition wizard or in a batch program that creates the report specifications:
Characteristic reportYou can configure the thresholds for the performance indexes P1 and P25. The P1 and P25 indexes represent the count of input variables with deviation index scores exceeding 0.1 and 0.25, respectively. Here is an example of alert and warning thresholds:
alertCondition='p1>5 or p25>0';warningCondition='p1>2';
Stability reportYou can configure output deviation index scores for a model's output variable. The output deviation index scores represent the deviation levels in the distribution of the model's scored output variables. Here is an example of alert and warning thresholds:
alertCondition='outputDeviation>0.03';warningCondition='outputDeviation>0.01';
Model Assessment reportsFor the Lift, Gini (ROC and Trend), and KS reports, you can configure threshold values for the following decay statistics.
lift5Decay is the lift performance decay based on the top 5% of the target population of interest from time A to time B.
lift10Decay is the lift performance decay based on the top 10% of the target population of interest from time A to time B.
lift15Decay is the lift performance decay based on the top 15% of the target population of interest from time A to time B.
lift20Decay is the lift performance decay based on the top 20% of the target population of interest from time A to time B.
giniDecay is the performance decay of the Gini index from time A to time B.
ksDecay is the performance decay of the KS statistic from time A to time B.
For the prediction model MSE report, you can configure the mseDecay statistic threshold values. The mseDecay statistic is the performance decay of the MSE statistic from time A to time B.
Here is an example of alert and warning thresholds:
alertCondition='(lift5Decay>0.15 and lift10Decay>0.12)
174 Chapter 14 • Monitoring Performance of Models
or giniDecay>0.1 or ksDecay>0.1';warningCondition='lift5Decay>0.05';
Monitoring Champion ModelsYour project plan might include a schedule to monitor the champion model performance, or your plan might require that you monitor the performance at any time. For each time period that you monitor the champion model, you take a snapshot of the data for that time period and use that data as the performance data source for creating the monitoring reports.
You can create monitoring reports by creating and executing a performance definition, or you can submit batch programs to create the reports. Both methods require the same information. Both methods can process one or more performance data sources. When you create a performance definition, you can specify one or more data sources to process. When you use a batch program, you use a separate DATA step to process each data source.
If you run batch programs, you can find example programs in the sashelp.modelmgr.source catalog. These reports’ filenames are reportexamplex, where x is a number from 1 to 4.
The following table lists the definitions that are required to create performance reports:
Definition
Reports Created by Using the Edit Performance Definition Wizard
Reports Created Using SAS Programs That Run in Batch
Create a folder structure for report files
The folder structure is inherent in the Project. No action is necessary.
Create a folder structure on a local drive of the SAS Model Manager server.
Obtain performance data The performance data is one or more SAS data sets that are a snapshot of model output. They can be registered in SAS Management Console or they can be accessed by using a libref that has been defined by using the Edit Start-up Code window.
The performance data is used to assess model prediction accuracy. It includes all of the required scoring input variables as well as one or more actual target variables. You can store performance data sets anywhere as long as they can be accessed by the SAS session that runs the batch program. The data sets do not need to be registered with SAS Management Console.
Ensure access to the champion or challenger model
This process is performed by the Edit Performance Definition wizard. No action is necessary.
Run the %MM_GetModels() macro to extract the champion model in a channel to a local drive of the SAS Model Manager server.
Monitoring Champion Models 175

Definition
Reports Created by Using the Edit Performance Definition Wizard
Reports Created Using SAS Programs That Run in Batch
Map model and project output variables.
Map the model and project output variables using the Project Tree.
Map the model and project output variables using the Project Tree.
Define report specifications The report specification are derived from project data and input that you specify in the Edit Performance Definition wizard. The wizard generates the SAS code to create the performance reports.
Write the following DATA steps:
• mm_jobs.project
• mm_jobs.emailaddr
• mm_jobs.reportdef
• mm_jobs.jobtime
Specify the report execution operational environment
The operational environment is known to SAS Model Manager. No action is necessary.
Define the required macro variables that are used by the %MM_RunReports() macro.
Run the reports Execute the code from the Performance page that was generated by the Edit Performance Definition wizard or schedule the performance definition from the Performance page. The data sets that underlie the monitoring reports are stored in the Results tab.
Create a DATA step that points to the performance data sets and execute the %MM_RunReports() macro. The data sets that underlie the monitoring reports are stored in the Results tab when the reports are created in production mode. In Test mode, the monitoring reports data sets reside in the location specified in the mm_jobs.project data set.
View the reports Select the Performance page for the champion model to view the reports.
Select the Performance page for the champion model to view the reports.
Creating Reports Using a Performance Definition
Overview of Creating Reports Using a Performance DefinitionYou define and execute a performance definition for a project. The model that you monitor is either the project champion model or a challenger model that is flagged in any version for the project. The process of creating performance reports is a two-step process. First, you run the Edit Performance Definition wizard to generate the code that creates the performance data results. Then, you execute the generated code. You can execute the code immediately, or you can schedule a date and time at which the definition is to run. Information about performance definitions is recorded and can be viewed on the Results tab of the Performance page.
176 Chapter 14 • Monitoring Performance of Models
To create performance reports:
• Ensure that one or more performance data sources are registered using SAS Management Console or that a libref has been defined for the location where the performance data sets are stored.
• Ensure that all prerequisites have been completed.
• Run the Edit Performance Definition wizard to generate the SAS code that creates the performance reports.
• Execute the generated code or schedule when the generated code is to be executed.
• To view the reports, select the Results tab on the Performance page.
Determine How to Use the Performance Data SetsBefore you run the Edit Performance Definition wizard, the performance data sets must be registered in the SAS Metadata Repository. You can register the data sets in the Data category view or you can add tables to an existing library that have already been registered using SAS Management Console. For each project, you can set up your environment to use the performance data source that is most appropriate for your business process. Here are two methods of collecting performance data:
• Method 1: You periodically take a snapshot of an operational data set to create a performance data set. Each time you take a snapshot, you give the performance data set a new name. Each performance data set must be registered in the SAS Metadata Repository and it must be available in the Data category view. You can create and execute a performance monitoring definition each time you take a snapshot, or you can create a performance monitoring definition to execute multiple performance data sets in the same definition. The best practice is to use the dynamic data sources in the performance definition.
• Method 2: You take a snapshot of the operational data set to create a performance data set over time, and you reuse the same name for each performance data set every time you take a snapshot. You register the performance data set in the SAS Metadata Repository only once. The performance data set must be available in the Data category view. Each time you take a snapshot, you replace the performance data set at the location where the performance data set is registered.
When you run the Edit Performance Definition wizard, the name of the performance data source does not change. The Default performance table project property is not populated in the Edit Performance Definition wizard. You modify only the Collection Date and Report Label columns in the table.
The following table summarizes the definitions that are performed if performance reports are run after six months or for reports that are run every month. Use this definition and example table to help you determine how you want to name your performance data sets and your performance data sources.
Creating Reports Using a Performance Definition 177
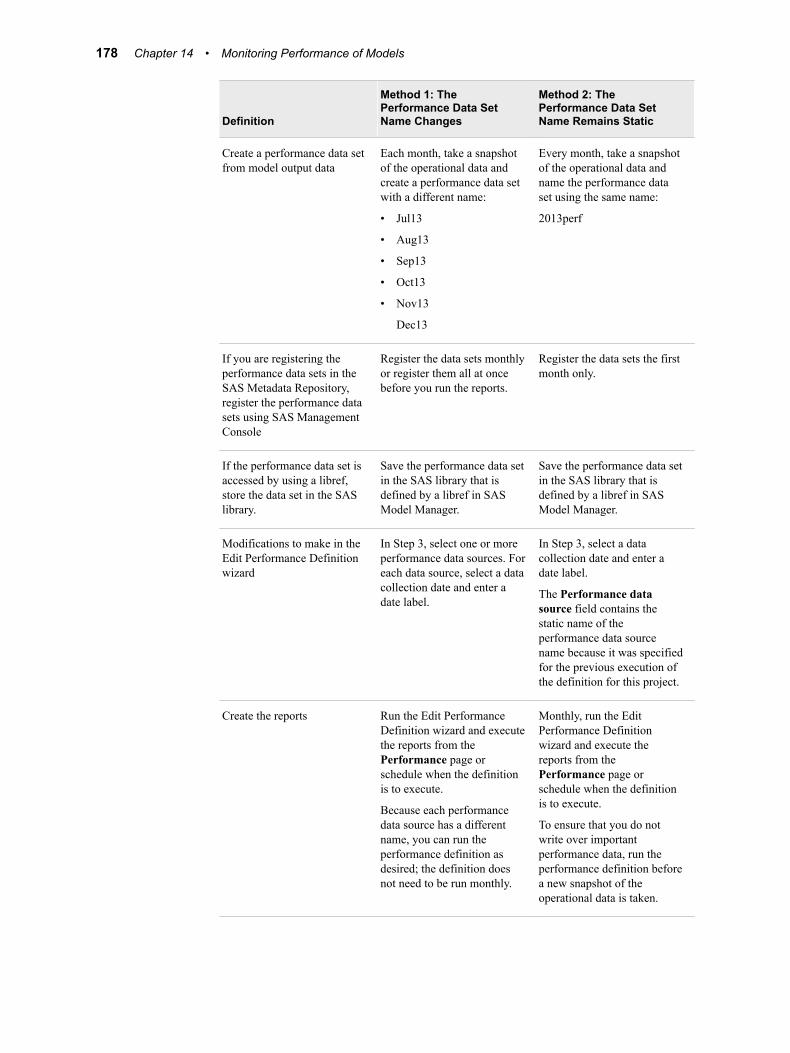
Definition
Method 1: The Performance Data Set Name Changes
Method 2: The Performance Data Set Name Remains Static
Create a performance data set from model output data
Each month, take a snapshot of the operational data and create a performance data set with a different name:
• Jul13
• Aug13
• Sep13
• Oct13
• Nov13
Dec13
Every month, take a snapshot of the operational data and name the performance data set using the same name:
2013perf
If you are registering the performance data sets in the SAS Metadata Repository, register the performance data sets using SAS Management Console
Register the data sets monthly or register them all at once before you run the reports.
Register the data sets the first month only.
If the performance data set is accessed by using a libref, store the data set in the SAS library.
Save the performance data set in the SAS library that is defined by a libref in SAS Model Manager.
Save the performance data set in the SAS library that is defined by a libref in SAS Model Manager.
Modifications to make in the Edit Performance Definition wizard
In Step 3, select one or more performance data sources. For each data source, select a data collection date and enter a date label.
In Step 3, select a data collection date and enter a date label.
The Performance data source field contains the static name of the performance data source name because it was specified for the previous execution of the definition for this project.
Create the reports Run the Edit Performance Definition wizard and execute the reports from the Performance page or schedule when the definition is to execute.
Because each performance data source has a different name, you can run the performance definition as desired; the definition does not need to be run monthly.
Monthly, run the Edit Performance Definition wizard and execute the reports from the Performance page or schedule when the definition is to execute.
To ensure that you do not write over important performance data, run the performance definition before a new snapshot of the operational data is taken.
178 Chapter 14 • Monitoring Performance of Models
Prerequisites for Editing a Performance Definition
Overview of PrerequisitesBefore you edit a Performance Definition, the environment must be set appropriately as follows:
• Ensure that the champion model is set or the challenger model is flagged.
• Ensure that the champion or challenger model is within a project that is associated with a classification model function and has a binary target, or that is associated with a prediction model function and has an interval target.
• Ensure that the champion or challenger model contains a score.sas file. If the performance data set contains the predicted values, the score.sas file can be empty. For more information, “Monitoring Performance of a Model without Score Code” on page 187.
• Ensure that the performance data sets for the time period that you want to monitor are registered in SAS Management Console or that a libref has been defined for the SAS library where the performance data sets are saved.
• Ensure that the appropriate project and model properties are set.
After the environment is set, you can run the Edit Performance Definition wizard.
Ensure That Champion and Challenger Models Are SetThe Edit Performance Definition wizard generates report code for the champion model in the champion version.
You can determine the champion version and the champion model by looking for the icon next to the champion version name and the champion model name on the Versions page. The status is also indicated in the Role column on the Models page.
If the champion model is not set, select a model and click or right-click the champion model name and select Set as Champion. The icon appears next to the champion model name and the version for the champion model.
You can determine the challenger model by looking at the Role column on the Models page. View the number of challengers on the Details view of the Versions page.
If the challenger model is not set, click or right-click the challenger model name and select Flag as Challenger.
Ensure That the Champion Model Function and Class Target Level Are Valid
Performance monitoring is valid only for a project that is associated with a classification model function and has a binary target, or for a prediction model function that has an interval target. You should define only performance definitions for classification and prediction models. The champion model must either have a function type of classification and must contain a binary target, or have a function type of prediction and must contain an interval target.
Prerequisites for Editing a Performance Definition 179

From the Projects category view, select the champion model name and verify that the Model function property in the specific properties section is set to Classification or Prediction. For models that are created using SAS Enterprise Miner, verify that Class target level is set to BINARY for a classification model or to INTERVAL for a prediction model.
Ensure That the Performance Data Source Is AvailableThe Edit Performance Definition wizard requires that the performance data be registered in the SAS Metadata Repository. You can register the data sets in the Data category view or you can add tables to an existing library that have already been registered using SAS Management Console.
If your performance table is not available for selection, contact your administrator to add the table to the Data Library Manager using SAS Management Console. For more information, see the SAS Model Manager: Administrator's Guide.
Ensure That Project and Model Properties Are SetSeveral properties must be defined in order to generate the model performance reports. Verify that the appropriate project and model properties are set. Here is a list of properties.
Classification Project Properties
• Training target variable
• Target event value
• Class target level
• Output event probability variable
Prediction Project Properties
• Training target variable
• Class target level
• Output prediction variable
Model Properties
• Score code type
Map Model and Project Output VariablesIn order to create the model performance reports, you must map the model output variable to the project output variable if the corresponding project variable and the model variable have different names.
To map the model variables to the project variables:
1. Select and open a model.
2. Select Model Properties ð Output Mapping.
3. Click the box in the Value column beside the variable in the Property column to display a list of project variables.
4. Select a model output variable.
5. Repeat steps 3 and 4 for each model variable that requires mapping.
180 Chapter 14 • Monitoring Performance of Models

6. Click .
Edit and Execute a Performance DefinitionTo create the monitoring reports, you specify a performance definition to generate SAS code. You then execute the generated code or create a schedule to execute the generated code on a specific day and time. Execution of the generated code creates the SAS data sets that are used to display reports: either the monitoring reports from the version Performance page, or the Monitoring report or Champion and Challenger Performance report that you create from the New Report window.
To edit the performance definition:
1. Click and select a champion or challenger model. Click Next.
2. Select a SAS Application Server.
3. Select one or more output variables for stability analysis. To select all output variables, click All.
4. Select one or more input variables for characteristic analysis. To select all input variables, click All. Click Next.
Edit and Execute a Performance Definition 181
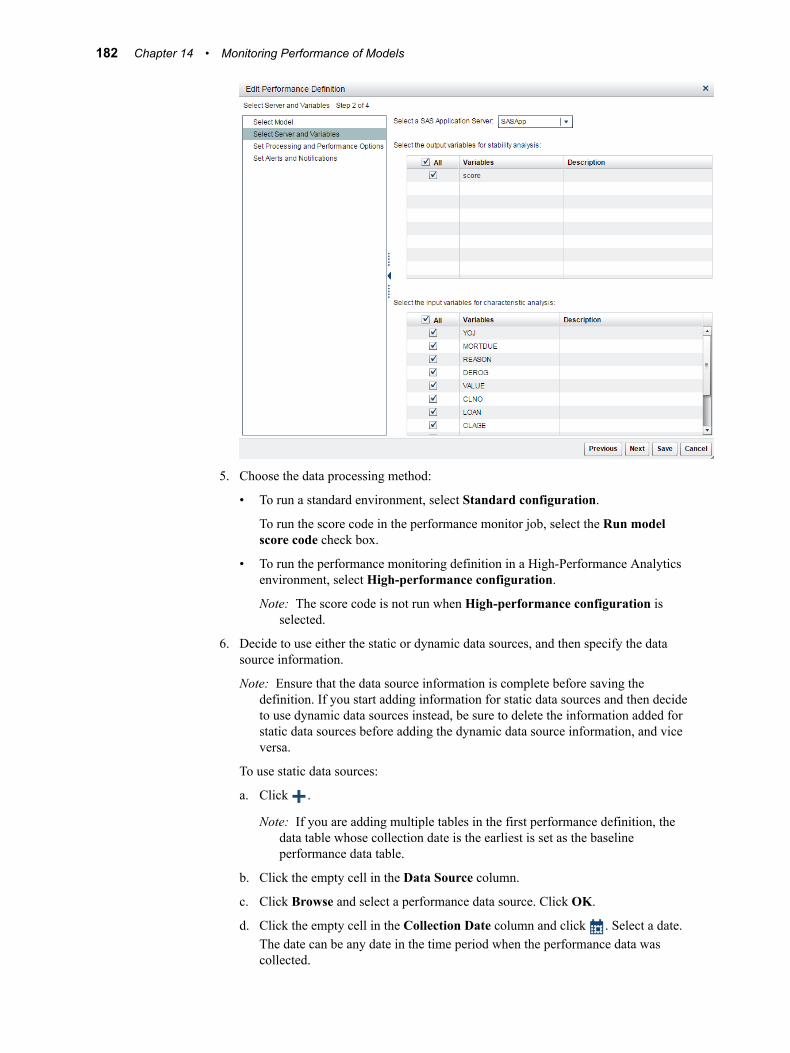
5. Choose the data processing method:
• To run a standard environment, select Standard configuration.
To run the score code in the performance monitor job, select the Run model score code check box.
• To run the performance monitoring definition in a High-Performance Analytics environment, select High-performance configuration.
Note: The score code is not run when High-performance configuration is selected.
6. Decide to use either the static or dynamic data sources, and then specify the data source information.
Note: Ensure that the data source information is complete before saving the definition. If you start adding information for static data sources and then decide to use dynamic data sources instead, be sure to delete the information added for static data sources before adding the dynamic data source information, and vice versa.
To use static data sources:
a. Click .
Note: If you are adding multiple tables in the first performance definition, the data table whose collection date is the earliest is set as the baseline performance data table.
b. Click the empty cell in the Data Source column.
c. Click Browse and select a performance data source. Click OK.
d. Click the empty cell in the Collection Date column and click . Select a date. The date can be any date in the time period when the performance data was collected.
182 Chapter 14 • Monitoring Performance of Models
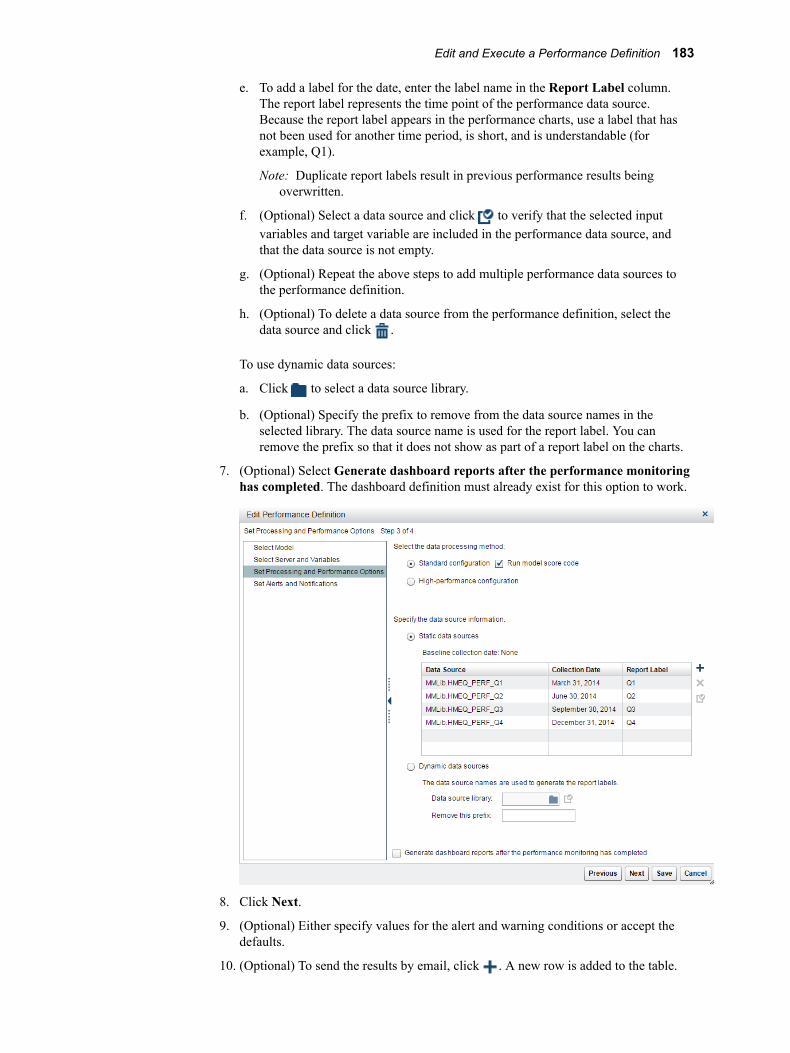
e. To add a label for the date, enter the label name in the Report Label column. The report label represents the time point of the performance data source. Because the report label appears in the performance charts, use a label that has not been used for another time period, is short, and is understandable (for example, Q1).
Note: Duplicate report labels result in previous performance results being overwritten.
f. (Optional) Select a data source and click to verify that the selected input variables and target variable are included in the performance data source, and that the data source is not empty.
g. (Optional) Repeat the above steps to add multiple performance data sources to the performance definition.
h. (Optional) To delete a data source from the performance definition, select the data source and click .
To use dynamic data sources:
a. Click to select a data source library.
b. (Optional) Specify the prefix to remove from the data source names in the selected library. The data source name is used for the report label. You can remove the prefix so that it does not show as part of a report label on the charts.
7. (Optional) Select Generate dashboard reports after the performance monitoring has completed. The dashboard definition must already exist for this option to work.
8. Click Next.
9. (Optional) Either specify values for the alert and warning conditions or accept the defaults.
10. (Optional) To send the results by email, click . A new row is added to the table.
Edit and Execute a Performance Definition 183
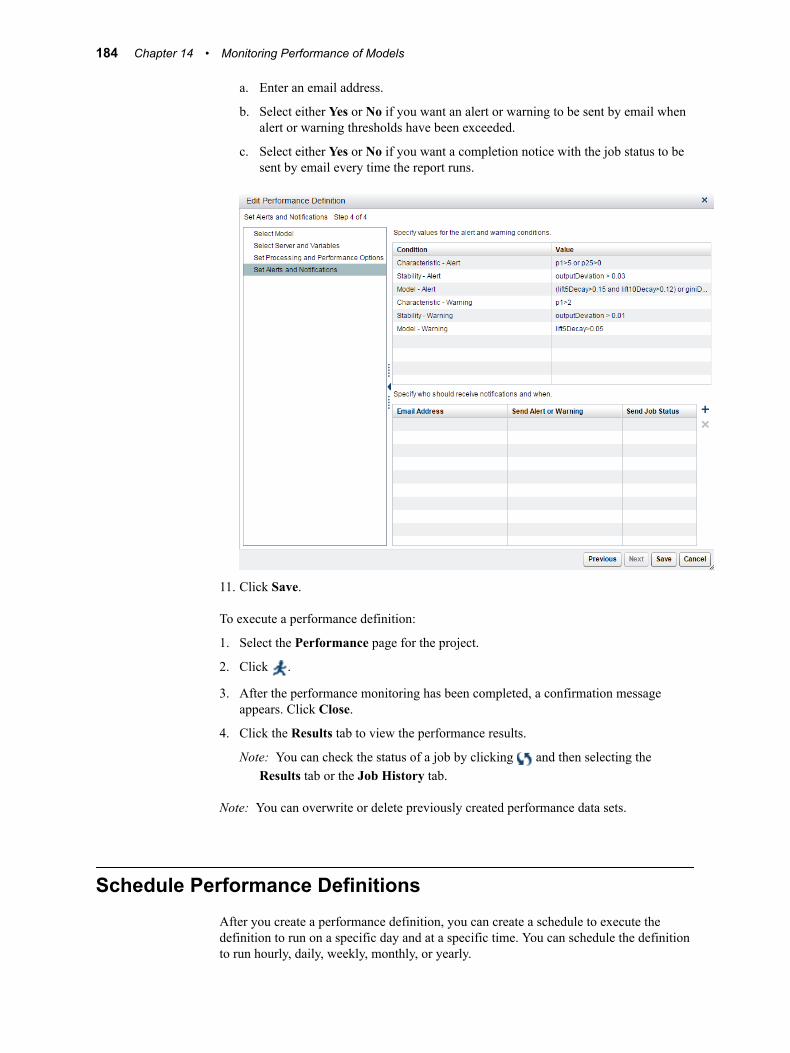
a. Enter an email address.
b. Select either Yes or No if you want an alert or warning to be sent by email when alert or warning thresholds have been exceeded.
c. Select either Yes or No if you want a completion notice with the job status to be sent by email every time the report runs.
11. Click Save.
To execute a performance definition:
1. Select the Performance page for the project.
2. Click .
3. After the performance monitoring has been completed, a confirmation message appears. Click Close.
4. Click the Results tab to view the performance results.
Note: You can check the status of a job by clicking and then selecting the Results tab or the Job History tab.
Note: You can overwrite or delete previously created performance data sets.
Schedule Performance DefinitionsAfter you create a performance definition, you can create a schedule to execute the definition to run on a specific day and at a specific time. You can schedule the definition to run hourly, daily, weekly, monthly, or yearly.
184 Chapter 14 • Monitoring Performance of Models
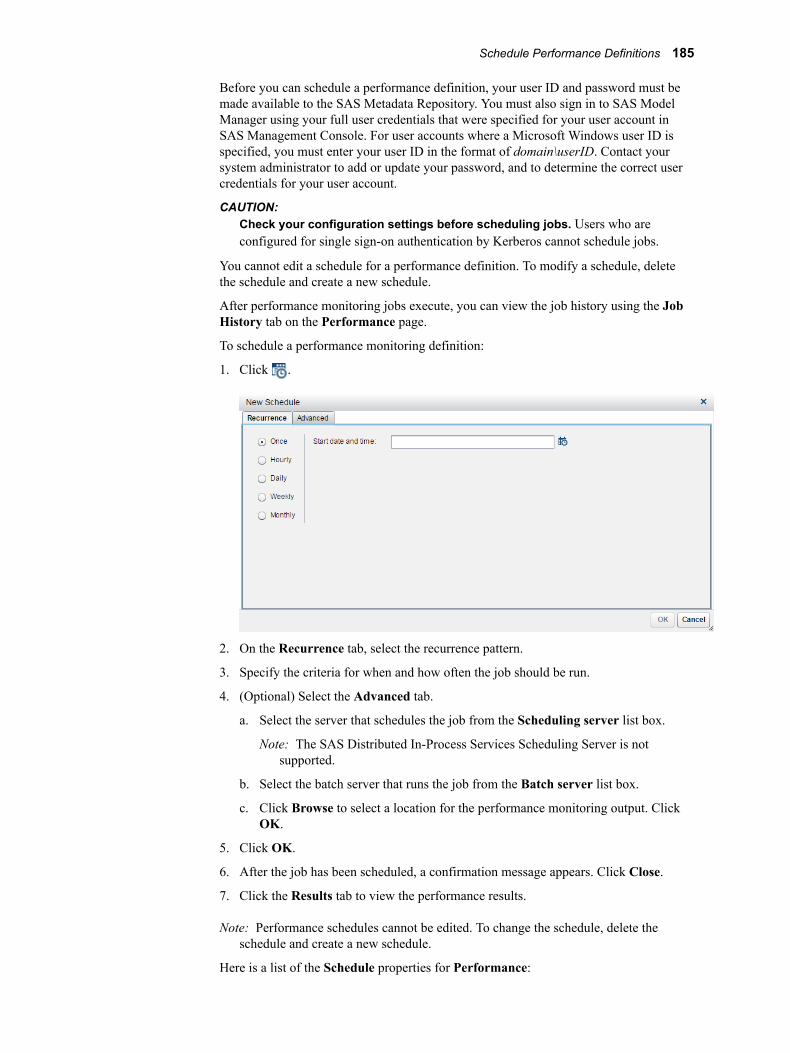
Before you can schedule a performance definition, your user ID and password must be made available to the SAS Metadata Repository. You must also sign in to SAS Model Manager using your full user credentials that were specified for your user account in SAS Management Console. For user accounts where a Microsoft Windows user ID is specified, you must enter your user ID in the format of domain\userID. Contact your system administrator to add or update your password, and to determine the correct user credentials for your user account.
CAUTION:Check your configuration settings before scheduling jobs. Users who are configured for single sign-on authentication by Kerberos cannot schedule jobs.
You cannot edit a schedule for a performance definition. To modify a schedule, delete the schedule and create a new schedule.
After performance monitoring jobs execute, you can view the job history using the Job History tab on the Performance page.
To schedule a performance monitoring definition:
1. Click .
2. On the Recurrence tab, select the recurrence pattern.
3. Specify the criteria for when and how often the job should be run.
4. (Optional) Select the Advanced tab.
a. Select the server that schedules the job from the Scheduling server list box.
Note: The SAS Distributed In-Process Services Scheduling Server is not supported.
b. Select the batch server that runs the job from the Batch server list box.
c. Click Browse to select a location for the performance monitoring output. Click OK.
5. Click OK.
6. After the job has been scheduled, a confirmation message appears. Click Close.
7. Click the Results tab to view the performance results.
Note: Performance schedules cannot be edited. To change the schedule, delete the schedule and create a new schedule.
Here is a list of the Schedule properties for Performance:
Schedule Performance Definitions 185
Property Name Description
Job Name Specifies the name of the performance monitoring definition. This name cannot be changed.
Location Specifies the location of the performance monitoring definition in the SAS Metadata Repository.
Scheduling Server Specifies the name of the server that schedules the job for the performance monitoring definition.
Batch Server Specifies the name of the server that executes the job for the performance monitoring definition.
Recurrence Specifies how often the scheduled job for the performance monitoring definition is to be executed.
SAS Application Server Specifies the name of the SAS Application Server where the performance monitoring definition is to be executed.
To delete a schedule, select the schedule and then click .
View Performance Monitoring Job HistoryUse the Job History tab on the Performance page to verify whether a performance monitoring task was run. The performance monitoring job appears on the Job History tab only after the job has begun.
To view the job history of a performance monitoring task:
1. Select a project and click the Performance page.
2. Click the Job History tab. A table appears that lists the performance monitoring jobs that have been executed.
Here is a description of the columns in the job history table:
Job Nameis the name of the performance monitoring task.
Job Statusspecifies whether the job status is Running or Completed.
Execution Statusshows a green indicator for a successful job execution. A yellow indicator shows that the performance monitoring task ran with warnings. A red indicator shows that the performance monitoring task ran with errors.
186 Chapter 14 • Monitoring Performance of Models

Date Startedis the date and time that the performance monitoring task started.
Date Completedis the date and time that the performance monitoring task ended.
Logis the revision number for the SAS log.
Outputis the revision number for the job output.
SAS Codeis the revision number for the performance monitoring task program.
Manage Performance Data SetsAfter a performance monitoring task has run, the summary data sets reside on the Results tab on the Performance page.
To add a performance data set:
1. Click the Results tab.
2. Click .
3. Navigate to the location of the data set and select the file to add.
4. Click Open.
Note: Fifteen tables are shown for the classification model function and thirteen are shown for the prediction model function. The table name must be the same as one of the shown tables; otherwise the uploaded table cannot be displayed. Tables with the same name are overwritten.
To delete the performance data sets:
1. Click the Results tab.
2. Click . Confirm the deletion.
Monitoring Performance of a Model without Score Code
If you want to monitor the performance of a model for which you no longer have the score code, you can import a model without SAS score code. If the performance data set contains the predicted values, the score.sas file can be empty.
To monitor the performance of a model without score code:
1. Prepare the following model files:
• XML file that defines the model input variables (inputvar.xml)
• XML file that defines the model output variables (outputvar.xml)
• XML file that defines the model target variables (targetvar.xml)
Monitoring Performance of a Model without Score Code 187
• empty SAS score code file (score.sas)
2. Select Models ð Projects
3. Create a project that has a model function type of Classification or Prediction. You can skip this step if you have already created a project.
4. Open a project and verify that the project properties are set.
a. If it is a project that has a model function property value of Classification, verify that the following project properties are set:
• Training target variable (for example, bad)
• Target event value (for example, 1)
• Class target level as Binary
• Output event probability variable (for example, score)
b. If it is a project that has a model function property value of Prediction, verify that the following project properties are set:
• Training target variable (for example, lgd)
• Class target level as Interval
• Output prediction variable (for example, p_lgd)
5. Select the Models page.
6. Click and select from local files.
Note: If the model already exists, you can open a model to add model files to an existing model. For more information, see “Add Model Files to an Existing Model” on page 84.
7. Navigate to the folder on your computer that contains the component files for your model.
8. Select a classification or prediction template from the Choose a model template list.
9. Enter a text value in the model Name field.
10. Click Properties and specify the model properties.
11. Click Files and select the local files from the SAS Workspace Server that match the template files. You cannot delete a file after you have added it. To replace the file, select another file or cancel the import and start over. The following files are required:
• inputvar.xml
• outputvar.xml
• targetvar.xml
• score.sas
Note: The filenames that you created for the model do not have to match the template filenames. However, the file contents must meet the file property requirements. For more information, see “Model Template Component Files” on page 242 or “Model Template Component Files” on page 242.
12. Click OK.
13. Open the model and set the model-specific properties. The value for the Score code type property must be set to DATA step or Analytic store.
188 Chapter 14 • Monitoring Performance of Models
14. Expand Variables and select Output Mapping in order to set the output variable mappings for the model. Select a value for each variable and click .
15. Click to close the model.
16. Select the model and click to set as the champion model. For more information, see “Ensure That Champion and Challenger Models Are Set” on page 179.
17. Before defining performance, verify that the performance data set is registered in the SAS Metadata Repository and is available in the Data category view. Make sure that the data set contains the following variables:
• model input variables
Note: You must have the variable columns in the table, but the values can be missing.
• target variable
• prediction variables
• variables for characteristic analysis
18. Edit a project’s performance definition on the Performance page. Specify the performance data set that contains the predicted values. Also, be sure to clear the Run model score code option for the Data Processing Method section of the Edit Performance Definition wizard. For more information, see “Edit and Execute a Performance Definition” on page 181.
Monitoring Performance of a Model without Score Code 189

190 Chapter 14 • Monitoring Performance of Models
Chapter 15
Using Dashboard Reports
Overview of Dashboard Reports . . . . . . . . . . . . . . . . . . . . . . . . . . . . . . . . . . . . . . . . 191
Create a Dashboard Report Definition . . . . . . . . . . . . . . . . . . . . . . . . . . . . . . . . . . . 191
Generate Dashboard Reports . . . . . . . . . . . . . . . . . . . . . . . . . . . . . . . . . . . . . . . . . . 193
View Dashboard Reports . . . . . . . . . . . . . . . . . . . . . . . . . . . . . . . . . . . . . . . . . . . . . . 194
Manage Dashboard Definitions . . . . . . . . . . . . . . . . . . . . . . . . . . . . . . . . . . . . . . . . . 194
Edit a Dashboard Report Definition . . . . . . . . . . . . . . . . . . . . . . . . . . . . . . . . . . . . . 195
Overview of Dashboard ReportsThe SAS Model Manager dashboard can provide reports that show the overall state of projects that are being monitored. The dashboard reports are produced from existing performance monitoring reports. For each project, you can define dashboard report indicators by creating a dashboard report definition. The dashboard report definition is used to create the dashboard reports. You view the dashboard reports through the Dashboard menu. These reports are generated in HTML.
Note: The dashboard reports can be defined and generated only by SAS Model Manager administrators and advanced users.
Create a Dashboard Report DefinitionTo create a new dashboard definition:
1. Click and select New Definition. The New Dashboard Definition window appears.
191
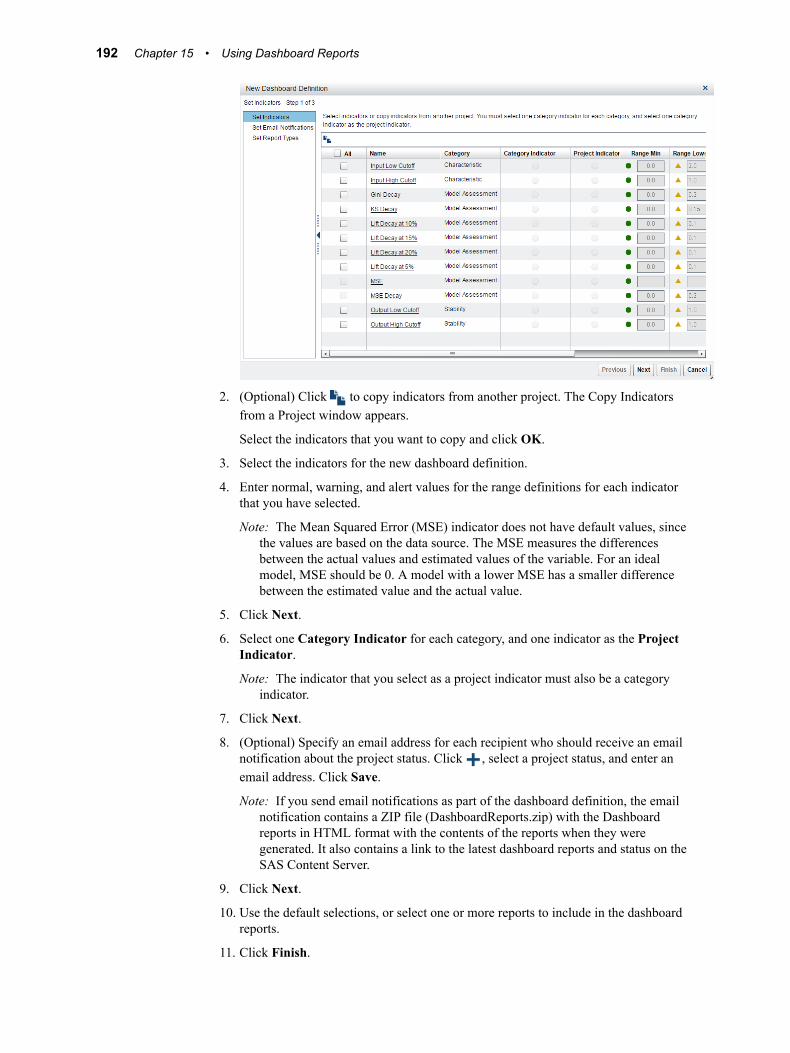
2. (Optional) Click to copy indicators from another project. The Copy Indicators from a Project window appears.
Select the indicators that you want to copy and click OK.
3. Select the indicators for the new dashboard definition.
4. Enter normal, warning, and alert values for the range definitions for each indicator that you have selected.
Note: The Mean Squared Error (MSE) indicator does not have default values, since the values are based on the data source. The MSE measures the differences between the actual values and estimated values of the variable. For an ideal model, MSE should be 0. A model with a lower MSE has a smaller difference between the estimated value and the actual value.
5. Click Next.
6. Select one Category Indicator for each category, and one indicator as the Project Indicator.
Note: The indicator that you select as a project indicator must also be a category indicator.
7. Click Next.
8. (Optional) Specify an email address for each recipient who should receive an email notification about the project status. Click , select a project status, and enter an email address. Click Save.
Note: If you send email notifications as part of the dashboard definition, the email notification contains a ZIP file (DashboardReports.zip) with the Dashboard reports in HTML format with the contents of the reports when they were generated. It also contains a link to the latest dashboard reports and status on the SAS Content Server.
9. Click Next.
10. Use the default selections, or select one or more reports to include in the dashboard reports.
11. Click Finish.
192 Chapter 15 • Using Dashboard Reports
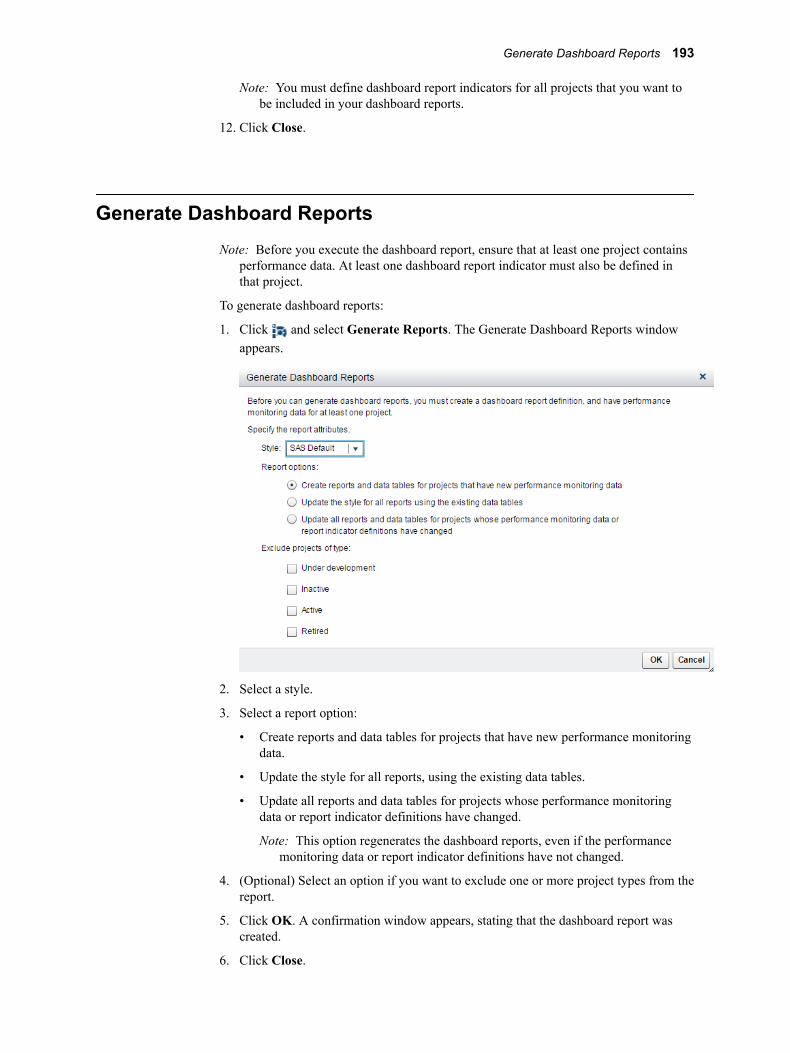
Note: You must define dashboard report indicators for all projects that you want to be included in your dashboard reports.
12. Click Close.
Generate Dashboard ReportsNote: Before you execute the dashboard report, ensure that at least one project contains
performance data. At least one dashboard report indicator must also be defined in that project.
To generate dashboard reports:
1. Click and select Generate Reports. The Generate Dashboard Reports window appears.
2. Select a style.
3. Select a report option:
• Create reports and data tables for projects that have new performance monitoring data.
• Update the style for all reports, using the existing data tables.
• Update all reports and data tables for projects whose performance monitoring data or report indicator definitions have changed.
Note: This option regenerates the dashboard reports, even if the performance monitoring data or report indicator definitions have not changed.
4. (Optional) Select an option if you want to exclude one or more project types from the report.
5. Click OK. A confirmation window appears, stating that the dashboard report was created.
6. Click Close.
Generate Dashboard Reports 193

View Dashboard ReportsTo view the dashboard reports:
1. Click and select View Reports. A web page displays all of the dashboard reports for each project that has a dashboard definition.
2. Select a project name or status link to view the associated dashboard report.
3. Select a link from the report column to view the report details.
Note: If you are configured for single sign-on web authentication and you try to view a report, the report is downloaded to your local drive. To view an HTML report, you must unzip the file.
Manage Dashboard Definitions1. Click and select Manage Definitions. The Manage Dashboard Definitions
window appears.
2. Select a definition to edit or delete.
To edit a definition, click .The Edit Dashboard Definition window appears. Make your changes. Click Finish.
To delete a definition, click .A confirmation message appears. Click OK to confirm the definition.
3. Click Close.
194 Chapter 15 • Using Dashboard Reports

Edit a Dashboard Report DefinitionTo edit a dashboard definition for a specific project:
1. Select a project, click , and select Edit Definition. The Edit Dashboard Definition window appears.
2. Make your changes. Click Finish.
3. Click Close.
Edit a Dashboard Report Definition 195

196 Chapter 15 • Using Dashboard Reports
Chapter 16
Retraining Models
Overview of Retraining Models . . . . . . . . . . . . . . . . . . . . . . . . . . . . . . . . . . . . . . . . . 197
Prerequisites for Retraining a Model . . . . . . . . . . . . . . . . . . . . . . . . . . . . . . . . . . . . 198
Edit a Model Retrain Definition . . . . . . . . . . . . . . . . . . . . . . . . . . . . . . . . . . . . . . . . 200
Execute a Model Retrain Definition . . . . . . . . . . . . . . . . . . . . . . . . . . . . . . . . . . . . . 202
Schedule a Retrain Definition . . . . . . . . . . . . . . . . . . . . . . . . . . . . . . . . . . . . . . . . . . 202
Viewing Retrained Models and Model Comparison Reports . . . . . . . . . . . . . . . . . 203
Overview of Retraining ModelsYou can retrain models to respond to data and market changes. Retraining models enables you to update out-of-date models and improve model performance. When you edit a model retrain definition, you can select multiple models to be retrained at the same time. The retrain definition for a model includes the destination version and training data source. The destination version is an existing version or new version that is associated with the selected project and stores the retrained model information.
The training data source contains new data for retraining the selected models. You can also specify a location to store the comparison reports and retrain results. When you select the models to include in the comparison report, you can use the training data source or select a different data source to compare the performance of the new models. You can also specify the report options, including the name, format, and style of the comparison report. Email notifications can also be specified as part of a model retrain definition and are sent after you execute a model retrain definition.
By default, the champion model for the selected project is selected for retrain. If the Register new trained model option was selected after you execute a model retrain definition, the new models are registered to the destination version. The comparison report is available on the Results tab of the Retrain page. The definition is executed on the SAS Application Server that is specified. The report folder is stored on the SAS Content Server.
197

Note: Only R models and those that were created with SAS Enterprise Miner, SAS/STAT, and SAS/ETS can be retrained. SAS Factory Miner models and SAS Viya models that were created with SAS Visual Data Mining and Machine Learning modeling procedures cannot be retrained in SAS Model Manager. Also note this: if a SAS model package (SPK) file was created with the Model Comparison node in SAS Enterprise Miner, the SPK file contains the score code for the best model and the training code for all of the models that were part of the model comparison. Therefore, when you are retraining the model in SAS Model Manager, be aware that the algorithm that is used for the retrained model could be different.
To retrain a model:
• Ensure that all prerequisites have been completed
• Edit the model retrain definition for a project to generate the SAS code that retrains models
• Execute the generated SAS code
• View the new models and comparison report
Prerequisites for Retraining a ModelBefore you can retrain a model, complete the following prerequisites:
• If you want to retrain the project champion model, ensure that the champion model is set. For more information, see “Champion Models” on page 208.
• Verify that the training data set that you want to use as the training data source has been registered in the SAS Metadata Repository, and is available in the Data category view.
• Verify that the appropriate project and model properties are set:
198 Chapter 16 • Retraining Models
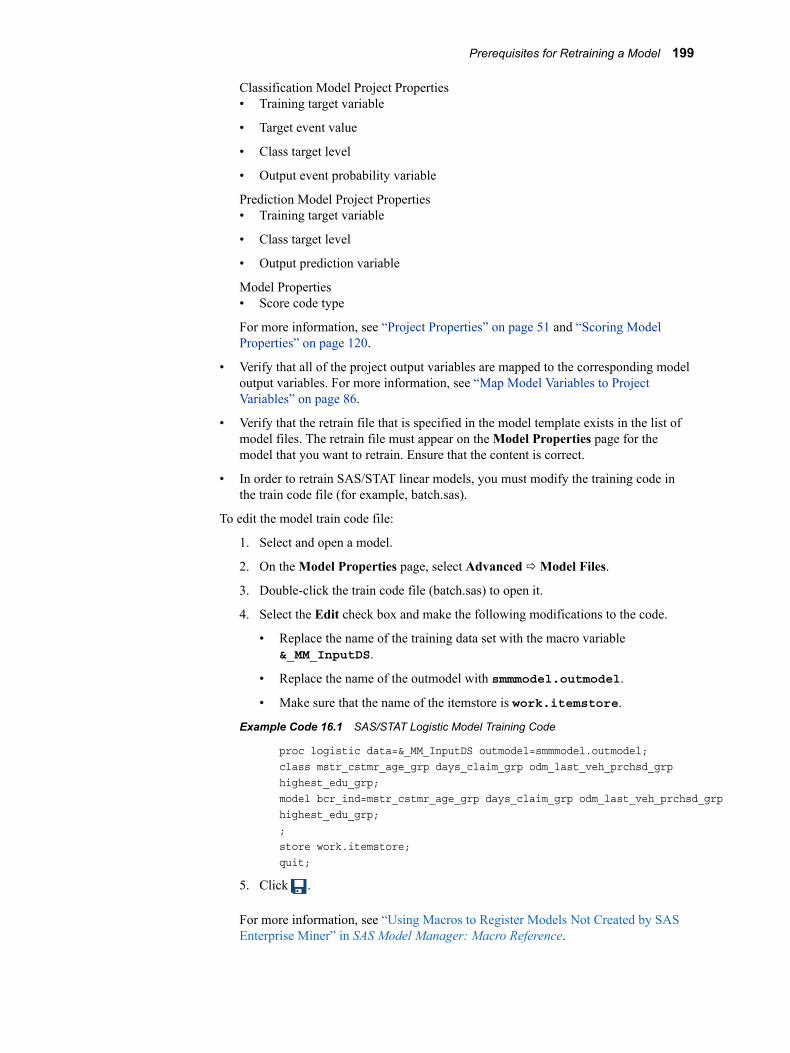
Classification Model Project Properties• Training target variable
• Target event value
• Class target level
• Output event probability variable
Prediction Model Project Properties• Training target variable
• Class target level
• Output prediction variable
Model Properties• Score code type
For more information, see “Project Properties” on page 51 and “Scoring Model Properties” on page 120.
• Verify that all of the project output variables are mapped to the corresponding model output variables. For more information, see “Map Model Variables to Project Variables” on page 86.
• Verify that the retrain file that is specified in the model template exists in the list of model files. The retrain file must appear on the Model Properties page for the model that you want to retrain. Ensure that the content is correct.
• In order to retrain SAS/STAT linear models, you must modify the training code in the train code file (for example, batch.sas).
To edit the model train code file:
1. Select and open a model.
2. On the Model Properties page, select Advanced ð Model Files.
3. Double-click the train code file (batch.sas) to open it.
4. Select the Edit check box and make the following modifications to the code.
• Replace the name of the training data set with the macro variable &_MM_InputDS.
• Replace the name of the outmodel with smmmodel.outmodel.
• Make sure that the name of the itemstore is work.itemstore.
Example Code 16.1 SAS/STAT Logistic Model Training Code
proc logistic data=&_MM_InputDS outmodel=smmmodel.outmodel;class mstr_cstmr_age_grp days_claim_grp odm_last_veh_prchsd_grphighest_edu_grp;model bcr_ind=mstr_cstmr_age_grp days_claim_grp odm_last_veh_prchsd_grphighest_edu_grp;;store work.itemstore;quit;
5. Click .
For more information, see “Using Macros to Register Models Not Created by SAS Enterprise Miner” in SAS Model Manager: Macro Reference.
Prerequisites for Retraining a Model 199
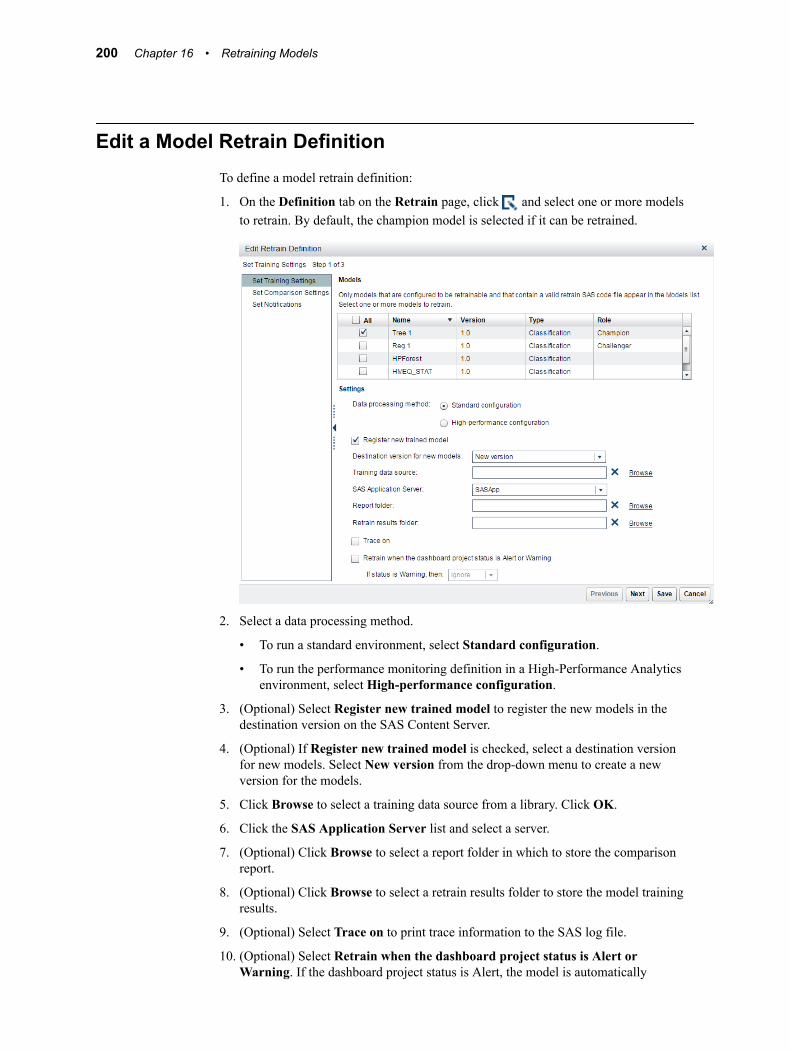
Edit a Model Retrain DefinitionTo define a model retrain definition:
1. On the Definition tab on the Retrain page, click and select one or more models to retrain. By default, the champion model is selected if it can be retrained.
2. Select a data processing method.
• To run a standard environment, select Standard configuration.
• To run the performance monitoring definition in a High-Performance Analytics environment, select High-performance configuration.
3. (Optional) Select Register new trained model to register the new models in the destination version on the SAS Content Server.
4. (Optional) If Register new trained model is checked, select a destination version for new models. Select New version from the drop-down menu to create a new version for the models.
5. Click Browse to select a training data source from a library. Click OK.
6. Click the SAS Application Server list and select a server.
7. (Optional) Click Browse to select a report folder in which to store the comparison report.
8. (Optional) Click Browse to select a retrain results folder to store the model training results.
9. (Optional) Select Trace on to print trace information to the SAS log file.
10. (Optional) Select Retrain when the dashboard project status is Alert or Warning. If the dashboard project status is Alert, the model is automatically
200 Chapter 16 • Retraining Models
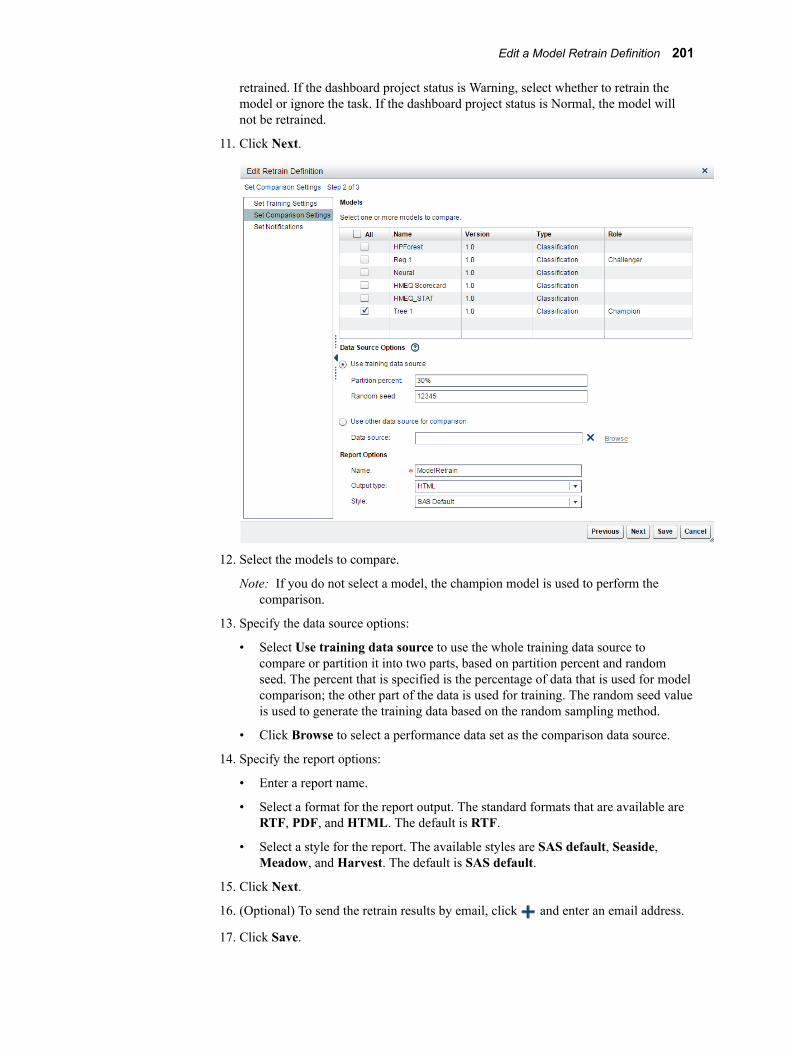
retrained. If the dashboard project status is Warning, select whether to retrain the model or ignore the task. If the dashboard project status is Normal, the model will not be retrained.
11. Click Next.
12. Select the models to compare.
Note: If you do not select a model, the champion model is used to perform the comparison.
13. Specify the data source options:
• Select Use training data source to use the whole training data source to compare or partition it into two parts, based on partition percent and random seed. The percent that is specified is the percentage of data that is used for model comparison; the other part of the data is used for training. The random seed value is used to generate the training data based on the random sampling method.
• Click Browse to select a performance data set as the comparison data source.
14. Specify the report options:
• Enter a report name.
• Select a format for the report output. The standard formats that are available are RTF, PDF, and HTML. The default is RTF.
• Select a style for the report. The available styles are SAS default, Seaside, Meadow, and Harvest. The default is SAS default.
15. Click Next.
16. (Optional) To send the retrain results by email, click and enter an email address.
17. Click Save.
Edit a Model Retrain Definition 201

Execute a Model Retrain DefinitionThe prerequisites for retraining a model must be completed and a model retrain definition must exist before you can execute a model retrain definition.
To execute a model retrain definition:
1. Click .
2. After the models are retrained, a confirmation message appears. Click Close.
3. Click the Results tab to view the results.
Note: You can check the status of a job by clicking and then selecting the Results tab or the Job History tab.
Schedule a Retrain DefinitionAfter you create a retrain definition, you can create a schedule to execute the definition to run on a specific day and at a specific time. You can schedule the definition to run hourly, daily, weekly, monthly, or yearly.
Before you can schedule a retrain definition, your user ID and password must be made available to the SAS Metadata Repository. You must also sign in to SAS Model Manager using your full user credentials that were specified for your user account in SAS Management Console. For user accounts where a Microsoft Windows user ID is specified, you must enter your user ID in the format of domain\userID. Contact your system administrator to add or update your password, and to determine the correct user credentials for your account.
CAUTION:Check your configuration settings before scheduling jobs. Users who are configured for single sign-on authentication by Kerberos cannot schedule jobs.
You cannot edit a schedule for a retrain definition. To modify a schedule, delete the schedule and create a new schedule.
After retrain jobs execute, you can view the job history using the Job History tab on the Retrain page.
To schedule a retrain definition:
1. On the Retrain page, click .
202 Chapter 16 • Retraining Models
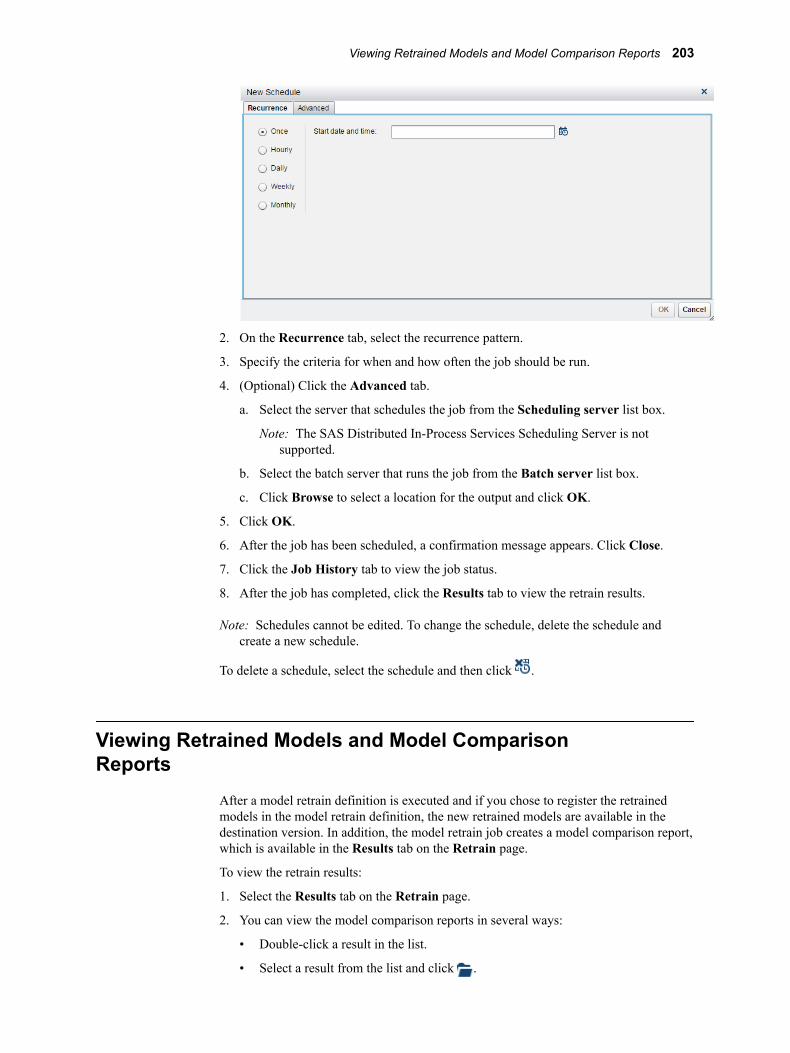
2. On the Recurrence tab, select the recurrence pattern.
3. Specify the criteria for when and how often the job should be run.
4. (Optional) Click the Advanced tab.
a. Select the server that schedules the job from the Scheduling server list box.
Note: The SAS Distributed In-Process Services Scheduling Server is not supported.
b. Select the batch server that runs the job from the Batch server list box.
c. Click Browse to select a location for the output and click OK.
5. Click OK.
6. After the job has been scheduled, a confirmation message appears. Click Close.
7. Click the Job History tab to view the job status.
8. After the job has completed, click the Results tab to view the retrain results.
Note: Schedules cannot be edited. To change the schedule, delete the schedule and create a new schedule.
To delete a schedule, select the schedule and then click .
Viewing Retrained Models and Model Comparison Reports
After a model retrain definition is executed and if you chose to register the retrained models in the model retrain definition, the new retrained models are available in the destination version. In addition, the model retrain job creates a model comparison report, which is available in the Results tab on the Retrain page.
To view the retrain results:
1. Select the Results tab on the Retrain page.
2. You can view the model comparison reports in several ways:
• Double-click a result in the list.
• Select a result from the list and click .
Viewing Retrained Models and Model Comparison Reports 203

Note: You can also view the SAS code and SAS log.
Note: If you are configured for single sign-on web authentication and you try to view a report, the report is downloaded to your local drive. To view an HTML report, you must unzip the file.
204 Chapter 16 • Retraining Models
Part 4
Deploying and Publishing Models
Chapter 17Deploying Models . . . . . . . . . . . . . . . . . . . . . . . . . . . . . . . . . . . . . . . . . . . . . . 207
Chapter 18Publishing Models . . . . . . . . . . . . . . . . . . . . . . . . . . . . . . . . . . . . . . . . . . . . . . 213
205

206

Chapter 17
Deploying Models
Overview of Deploying Models . . . . . . . . . . . . . . . . . . . . . . . . . . . . . . . . . . . . . . . . . 207
Champion Models . . . . . . . . . . . . . . . . . . . . . . . . . . . . . . . . . . . . . . . . . . . . . . . . . . . . 208About Champion Models . . . . . . . . . . . . . . . . . . . . . . . . . . . . . . . . . . . . . . . . . . . . 208Requirements for a Champion Model . . . . . . . . . . . . . . . . . . . . . . . . . . . . . . . . . . . 208Set a Champion Model . . . . . . . . . . . . . . . . . . . . . . . . . . . . . . . . . . . . . . . . . . . . . . 208Clear a Champion Model . . . . . . . . . . . . . . . . . . . . . . . . . . . . . . . . . . . . . . . . . . . . 209
Challenger Models . . . . . . . . . . . . . . . . . . . . . . . . . . . . . . . . . . . . . . . . . . . . . . . . . . . 209About Challenger Models . . . . . . . . . . . . . . . . . . . . . . . . . . . . . . . . . . . . . . . . . . . . 209Flag a Challenger Model . . . . . . . . . . . . . . . . . . . . . . . . . . . . . . . . . . . . . . . . . . . . 209Clear a Challenger Model . . . . . . . . . . . . . . . . . . . . . . . . . . . . . . . . . . . . . . . . . . . . 210
Locking Versions . . . . . . . . . . . . . . . . . . . . . . . . . . . . . . . . . . . . . . . . . . . . . . . . . . . . . 210About Locking Versions . . . . . . . . . . . . . . . . . . . . . . . . . . . . . . . . . . . . . . . . . . . . . 210Lock a Version . . . . . . . . . . . . . . . . . . . . . . . . . . . . . . . . . . . . . . . . . . . . . . . . . . . . 210Unlock a Version . . . . . . . . . . . . . . . . . . . . . . . . . . . . . . . . . . . . . . . . . . . . . . . . . . . 211
Overview of Deploying ModelsThe goal of a modeling project is to identify a champion model that a scoring application uses to predict an outcome. SAS Model Manager provides tools to evaluate candidate models, declare champion models, and inform your scoring officer that a predictive model is ready for validation or production.
To deploy a model, you might use the following scenario:
1. Identify the model that outperforms other candidate models and declare this model to be the project champion model. You can also flag challenger models for the champion model.
2. Test and validate the model before you declare the model ready for production.
3. Lock the champion version for the project to prevent changes to the champion model.
4. Publish the champion model and challenger models (optional) so that you can deploy them to a production environment.
207
Champion Models
About Champion Models
The champion model is the best predictive model that is chosen from a pool of candidate models. Before you identify the champion model, you can evaluate the structure, performance, and resilience of candidate models. When a champion model is ready for production scoring, you set the model as the champion model. The project version that contains the champion model becomes the champion version for the project. A check mark appears next to the version on the Versions page. You can publish the champion model to a database, the SAS Metadata Repository, and a SAS channel.
Requirements for a Champion ModelBefore you identify a model as the champion, perform the following tasks:
• Register at least one model.
• Verify that the model is active. If the model expiration date has passed, you cannot set the model as a champion model.
Note: However, an authorized user can reset the expiration date to a later date in order to set the champion model. To reset the expiration date, select the Model Properties page for the model.
You might use the following criteria to identify a champion model:
• model comparison reports that validate and assess the candidate models.
• business decision rules. For example, you might use a decision tree model because of difficulty interpreting results from a neural network model even when the neural network model outperforms the decision tree model.
• regulatory requirements, such as when the champion model should exclude certain specific attributes (age or race).
You can flag and publish a challenger model specifically for the purpose of comparison with the champion model. For example, your champion model for a production environment might omit restricted attributes during operational scoring because of regulatory requirements. You can use a challenger model that includes the restricted attributes in the development environment to evaluate its prediction power against the prediction of the champion model. Then you can determine the amount of predictive power that is lost because of the regulatory requirements.
Set a Champion ModelTo set a champion model:
• On the Models page of a project, select a model and click to set the model as the project champion model. The value in the Role column changes to Champion.
Note: Alternatively, you can right-click a model and select Set as champion.
208 Chapter 17 • Deploying Models

Clear a Champion ModelTo clear a champion model:
• On the Models page of a project, select a model that is marked as Champion, and click to clear a flagged champion model.
Note: Alternatively, you can right-click a model that is marked as Champion and select Clear.
Challenger Models
About Challenger ModelsYou use challenger models to test the strength of champion models. The champion model for a project can have one or more challenger models. A model can be flagged as a challenger model only after a champion model for the project has been selected. A challenger model can be flagged in any version of a project.
Verify that the model is active. If the model expiration date has passed, you cannot set the model as a challenger model.
Note: An authorized user can reset the expiration date to a later date so that it is possible to set the challenger model.
To compare a challenger model to a champion model, you can create and run performance monitoring tasks for the champion model and any challenger models. Then, using the performance data, you can create a Champion and Challenger Performance report. You can also compare challenger models to the champion model using other reports such as the Delta report and Dynamic Lift report that are available through the Reports page. For more information, see “Champion and Challenger Performance Reports” on page 143.
Note: The batch programs for performance monitoring do not support creating challenger model performance reports.
Challenger models can be published to a database, the SAS Metadata Repository, or to a SAS channel that contains the champion model. They can also be published by themselves. If testing determines that the challenger model is the better model, you can replace the champion model by setting the challenger model as the champion model.
Flag a Challenger ModelTo flag a challenger model:
• On the Models page of a project, select a model and click to flag a model as a challenger to the project champion model. The value in the Role column changes to Challenger.
Note: Alternatively, you can right-click a model and select Flag as challenger.
Challenger Models 209
Clear a Challenger ModelTo clear a challenger model:
• On the Models page of a project, select a model that is marked as Challenger, and click to clear a flagged challenger model.
Note: Alternatively, you can right-click a model that is marked as Challenger and select Clear. Challenger models can also be cleared when the champion model is cleared or replaced.
Locking Versions
About Locking VersionsYou must be a SAS Model Manager administrator to lock and unlock a version. Administrators can lock a project version to prevent users from modifying some properties and files for the version’s models. The champion version can be locked when the project champion model is approved for production or is pending approval. After a project version is locked, users cannot perform the following tasks:
• import, delete, or copy and paste a model
• rename a model
• change the champion model
• flag a model as a challenger
SAS Model Manager administrators remain authorized to perform these activities. If the champion model is not deployed to an operational environment, then an administrator can unlock a version so that users can change the models. Advanced users can still modify the Attachments, Reports, and Scoring pages after a version is locked.
When the champion model has been used in production scoring, you must unlock the model if you want to change the contents of the champion version. However, use caution in modifying the version content. If the model UUID and revision number for the score code in production scoring environments are always recorded, then you can modify a version even after the version is deployed to production environment.
If you attempt to delete a project that contains a locked version, SAS Model Manager displays a message indicating that you cannot delete a project that contains locked versions. An administrator must unlock the versions before the project can be deleted.
Lock a VersionLocking a version restricts the activities that you can do with the project. You normally lock a version after you declare a champion model in preparation for deploying the champion model to a production environment.
To lock a version:
1. Open a project and select the Versions page.
2. Select a version and click to lock the version. The label Locked appears after the version name.
210 Chapter 17 • Deploying Models
Unlock a VersionIf changes to a model are required after the version is locked, a SAS Model Manager administrator can unlock the version.
To unlock a version:
1. Open a project and select the Versions page.
2. Select a version and click to unlock the version.
For more information about versions, see “Lock and Unlock a Project Version” on page 58.
Locking Versions 211

212 Chapter 17 • Deploying Models

Chapter 18
Publishing Models
Overview of Publishing Models . . . . . . . . . . . . . . . . . . . . . . . . . . . . . . . . . . . . . . . . . 213
Publishing Models to a SAS Channel . . . . . . . . . . . . . . . . . . . . . . . . . . . . . . . . . . . . 214
Publishing Models to the SAS Metadata Repository . . . . . . . . . . . . . . . . . . . . . . . . 215About Publishing Models to the SAS Metadata Repository . . . . . . . . . . . . . . . . . 215Publish Project Champion and Challenger Models to the SAS
Metadata Repository . . . . . . . . . . . . . . . . . . . . . . . . . . . . . . . . . . . . . . . . . . . . . . 216Publish a Model to the SAS Metadata Repository . . . . . . . . . . . . . . . . . . . . . . . . . 216
Publishing Models to a Database or Hadoop . . . . . . . . . . . . . . . . . . . . . . . . . . . . . . 217About Publishing Models to a Database or Hadoop . . . . . . . . . . . . . . . . . . . . . . . . 217Prerequisites for Publishing to a Database or Hadoop . . . . . . . . . . . . . . . . . . . . . . 217Make User-Defined Formats Available When Publishing Models to a Database . 219How to Publish Models to a Database or Hadoop . . . . . . . . . . . . . . . . . . . . . . . . . 219Descriptions of Database Settings . . . . . . . . . . . . . . . . . . . . . . . . . . . . . . . . . . . . . 224
Remove Published Models . . . . . . . . . . . . . . . . . . . . . . . . . . . . . . . . . . . . . . . . . . . . . 226
View Publish History . . . . . . . . . . . . . . . . . . . . . . . . . . . . . . . . . . . . . . . . . . . . . . . . . 226
Overview of Publishing ModelsSAS Model Manager provides a comprehensive publishing environment for model delivery that supports sharing performance and scoring data. SAS Model Manager publishes models to different channels, and to the SAS Metadata Repository. SAS Model Manager can also publish classification, prediction, and segmentation (cluster) models that have the score code type of DATA step to a database or Hadoop. Models that have a score code type of analytic store can be published only to Hadoop and Teradata. Application software, such as SAS Data Integration Studio or SAS Enterprise Guide, enables you to access models through the SAS Metadata Server and to submit on-demand and batch scoring jobs.
SAS Model Manager publishes models to defined publication channels. Authorized users who subscribe to a channel can choose to receive email notifications when updated models are ready to deploy to testing or production scoring servers, and are published to a publication channel. From a publication channel, you can extract and validate the scoring logic, deploy champion models to a production environment, and monitor the performance of your models.
213

Models can also be published from the Models page. You can publish champion and challenger models from a model project to the SAS Metadata Repository. The publish history of models can be viewed on the Models page and on the Published tab on the History page. You can also remove models that have been published to a database.
Publishing Models to a SAS ChannelSAS Model Manager uses the SAS Publishing Framework to publish models to defined channels. The SAS Publishing Framework notifies subscribers of the publication channel when the models are delivered. You can publish models in the Projects category view. SAS Model Manager creates a SAS package (SPK) file for the model in a publication channel. A user who subscribes to the publication channel can choose to receive email that includes the SAS package as an attachment.
Note: Before you can deploy a model to a publications channel, a SAS administrator must configure the publication channel in SAS Management Console to publish models as archive (binary .SPK) files to a persistent store location. The archive persistent store location is specified as a physical file location, an FTP server, an HTTP server, or a path in WebDAV.
The Report attribute for a file element in a model template indicates whether SAS Model Manager includes a file in the SAS package. You use the SAS Package Reader or a file archiver and compression utility, such as WinZip, to view the contents of the SPK file. SAS Model Manager provides SAS macro programs to extract published models and deploy the models on testing and production scoring servers. The SAS package might contain additional files, depending on the number of file elements in the model template that have a Report attribute.
Note: The REF file contains the URL for a folder location in the project, such as http://MMServer:7980/SASContentServer/repository/default/ModelManager/MMRoot/organizational folder/project/version/Models/model_name/score.sas.
To publish a model to a channel:
1. Select a project and click .
2. Select SAS Channel from the publish destination list.
3. Select the model that you want to publish from the models list.
4. Select a publication channel from the channel drop-down list.
214 Chapter 18 • Publishing Models

5. (Optional) Click More Options to specify a message subject, notes, and user-defined properties. Click Save.
6. Click Publish.
Publishing Models to the SAS Metadata Repository
About Publishing Models to the SAS Metadata RepositorySAS Model Manager publishes a model by creating a MiningResults object in the SAS Metadata Repository. You can use the model information in the MiningResults object to set up a scoring environment. A scoring application can use SAS Data Integration Studio or SAS Enterprise Guide to access the metadata and run a batch job or stored process that executes the score code. SAS Real-Time Decision Manager can also read the metadata and use it in that process environment. Therefore, when you publish a project champion model, challenger model, or other models (with proper configuration), the scoring application always uses the most current champion model. The project champion and challenger models can be published from the project level and only the project champion models can be published from the portfolio level.
Note: SAS Model Manager cannot publish R models.
Publishing Models to the SAS Metadata Repository 215
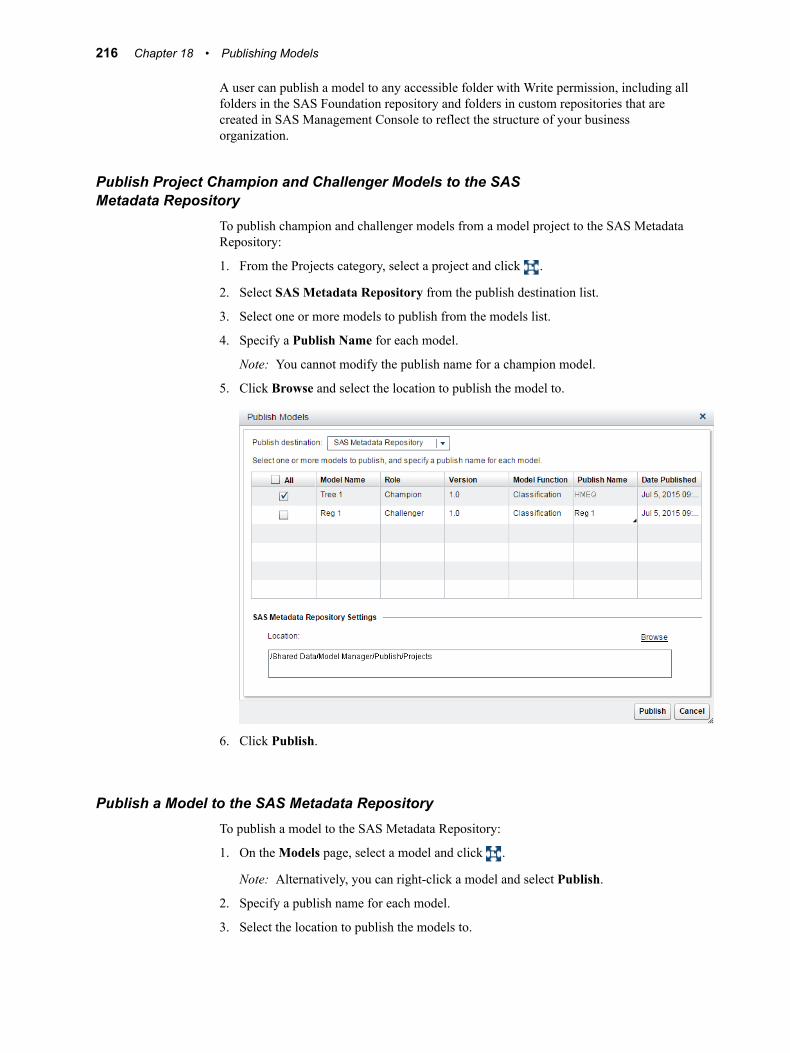
A user can publish a model to any accessible folder with Write permission, including all folders in the SAS Foundation repository and folders in custom repositories that are created in SAS Management Console to reflect the structure of your business organization.
Publish Project Champion and Challenger Models to the SAS Metadata Repository
To publish champion and challenger models from a model project to the SAS Metadata Repository:
1. From the Projects category, select a project and click .
2. Select SAS Metadata Repository from the publish destination list.
3. Select one or more models to publish from the models list.
4. Specify a Publish Name for each model.
Note: You cannot modify the publish name for a champion model.
5. Click Browse and select the location to publish the model to.
6. Click Publish.
Publish a Model to the SAS Metadata RepositoryTo publish a model to the SAS Metadata Repository:
1. On the Models page, select a model and click .
Note: Alternatively, you can right-click a model and select Publish.
2. Specify a publish name for each model.
3. Select the location to publish the models to.
216 Chapter 18 • Publishing Models

4. Click Publish.
Publishing Models to a Database or Hadoop
About Publishing Models to a Database or HadoopSAS Model Manager enables you to publish the project champion model and challenger models that are associated with the DATA Step score code type to a configured database. SAS Model Manager uses the SAS Scoring Accelerator and SAS/ACCESS interface to the database to publish models to the database or Hadoop Distributed File System (HDFS). The Scoring Accelerator takes the models from SAS Model Manager and translates them into scoring files or functions that can be deployed inside the database. After the scoring functions are published using the SAS/ACCESS interface to the database, the functions extend the database’s SQL language and can be used in SQL statements such as other database functions. After the scoring files are published, they are used by the SAS Embedded Process to run the scoring model.
If the scoring function publish method is chosen, the scoring metadata tables in the database are populated with information about the project and pointers to the scoring function. This feature enables users to review descriptions and definitions of the published model. The audit logs track the history of the model's usage and any changes that are made to the scoring project.
For more information about the SAS Scoring Accelerator, see the SAS In-Database Technology page available at http://support.sas.com.
Prerequisites for Publishing to a Database or HadoopThe following prerequisites must be completed before users can publish a model scoring function using the scoring function publish method, or publish a model’s scoring files using the SAS Embedded Process publish method:
Publishing Models to a Database or Hadoop 217
• The user must have the proper authorization to publish approved models from SAS Model Manager to the database or HDFS for SAS In-Database scoring.
Note: When using the SAS Embedded Process publish method to publish models from SAS Model Manager to a Teradata database, you must have a user database with the appropriate user permissions in order to validate the scoring results. For more information, see “Teradata Permissions for Publishing Formats and Scoring Models” in SAS In-Database Products: Administrator’s Guide.
Note: If your system is configured for Kerberos authentication, each user must have a valid Kerberos ticket. Also, you must complete post-installation configuration steps to enable users to publish models from the SAS Model Manager application. For more information, see “Configure Users Authenticated by Kerberos for Publishing Models” in SAS Model Manager: Administrator’s Guide.
• The champion model for the project must be set.
• A predictive (classification or prediction), analytical, or segmentation model must have been selected for production scoring deployment via SAS Model Manager.
SAS Model Manager can publish models to a database or Hadoop when they are associated with the DATA step score code type. Models that have a score code type of Analytic store can be published only to Hadoop and Teradata. Models that have a score code type of SAS Program, PMML, or DS2 cannot be published to a database.
The score code component file (score.sas) is DATA step score code and is used as input by the SAS Scoring Accelerator when publishing a model to a database. When you use the scoring function publish method, some SAS language elements and syntax are not supported when you create or modify your score code. Only the SAS language elements and syntax that are required to run critical data transformations and model scoring functions are available. If you use a statement or function that is not supported, an error occurs and your model is not published to the database. For more information, see “Considerations When Creating or Modifying DATA Step Score Code” in SAS In-Database Products: User’s Guide.
The SAS Scoring Accelerator requires three files when you are publishing a SAS analytic store model. The files are score.sas, score.sasast, and score.xml. The score.xml file is generated at publish time by SAS Model Manager. For more information, see “Introduction to Analytic Store Scoring” in SAS In-Database Products: User’s Guide.
• A database must have been configured to install scoring functions or model scoring files.
• If the model contains user-defined formats, a file that contains the user-defined formats must be attached to the version and stored in a format catalog.
• The following prerequisites are only for the scoring function publish method.
• (Optional) A project user-defined property DbmsTable is defined for the champion version of the project from which to publish the scoring function.
Note: The DbmsTable property must be defined if you plan to use a scoring application or SQL code to score your model.
• The JDBC driver must be accessible from the middle-tier server when using the scoring function publish method.
• The scoring function metadata tables are required in the target database if the Metadata usage option is enables in SAS Management Console.
218 Chapter 18 • Publishing Models
Make User-Defined Formats Available When Publishing Models to a Database
In order to publish models with user-defined formats to a database, you must make the user-defined formats available to SAS Model Manager.
To make the user-defined formats available for publishing:
1. Translate the user-defined formats SAS catalog (formats.sas7bcat) that was created with the model into a formats.cport file.
Here is an example:
filename tranfile "C:\formats.cport";libname source "C:\myformats"; proc cport library=source file=tranfile memtype=catalog;run;quit;
2. Attach the formats.cport file to the version that contains the project champion model or challenger models. For more information, see “Attach a Portable Formats File” on page 58.
3. Send a request to the SAS administrator and ask them to either put the user-defined formats catalog (formats.sas7bcat) in the \\SASConfigDirectory\Lev1\SASApp\SASEnvironment\SASFormats directory or add the LIBNAME definition for the formats library to the \\SASConfigDirectory\Lev1\SASApp\appserver_autoexec_usermods file.
Here is an example of a LIBNAME definition:
libname mylib "C:\myformats";options fmtsearch = (mylib.formats);
How to Publish Models to a Database or HadoopTo publish a model to a database:
1. Select a project and click .
Publishing Models to a Database or Hadoop 219
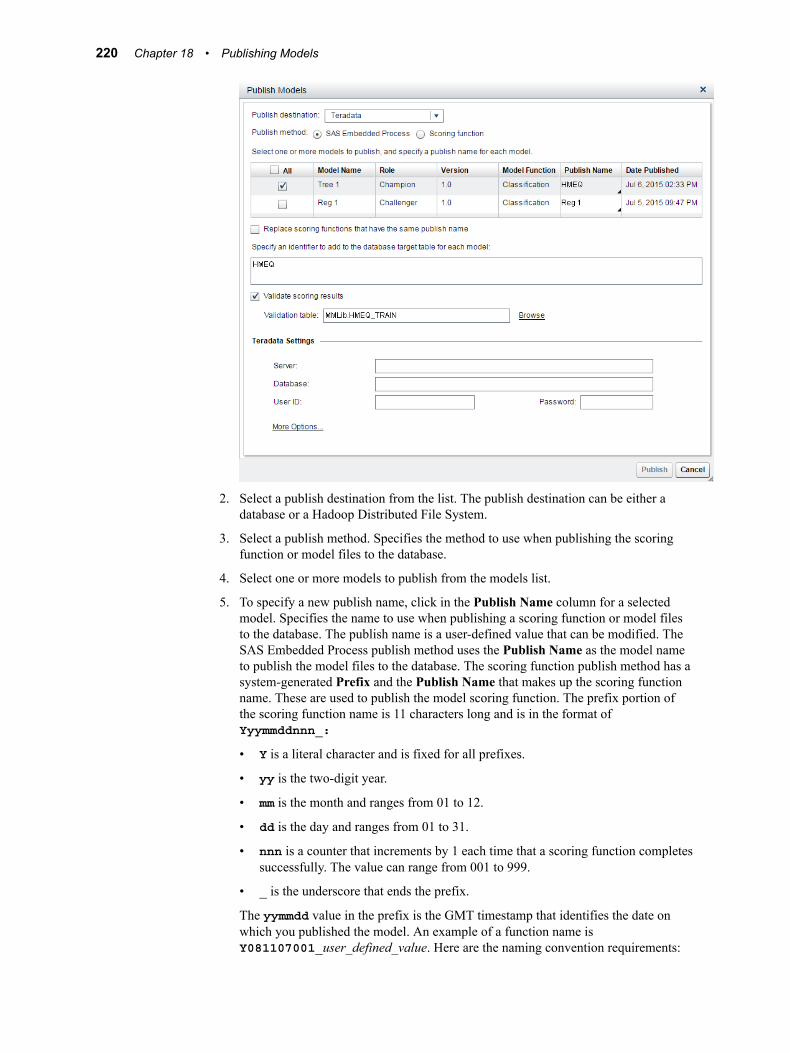
2. Select a publish destination from the list. The publish destination can be either a database or a Hadoop Distributed File System.
3. Select a publish method. Specifies the method to use when publishing the scoring function or model files to the database.
4. Select one or more models to publish from the models list.
5. To specify a new publish name, click in the Publish Name column for a selected model. Specifies the name to use when publishing a scoring function or model files to the database. The publish name is a user-defined value that can be modified. The SAS Embedded Process publish method uses the Publish Name as the model name to publish the model files to the database. The scoring function publish method has a system-generated Prefix and the Publish Name that makes up the scoring function name. These are used to publish the model scoring function. The prefix portion of the scoring function name is 11 characters long and is in the format of Yyymmddnnn_:
• Y is a literal character and is fixed for all prefixes.
• yy is the two-digit year.
• mm is the month and ranges from 01 to 12.
• dd is the day and ranges from 01 to 31.
• nnn is a counter that increments by 1 each time that a scoring function completes successfully. The value can range from 001 to 999.
• _ is the underscore that ends the prefix.
The yymmdd value in the prefix is the GMT timestamp that identifies the date on which you published the model. An example of a function name is Y081107001_user_defined_value. Here are the naming convention requirements:
220 Chapter 18 • Publishing Models
Here are the naming convention requirements for the publish name:
• The user-defined value is case insensitive. The maximum length of alphanumeric characters is determined by the database type and publish method that is selected. No spaces are allowed. An underscore is the only special character that can be included in the publish name.
• The recommended maximum lengths of the publish name for the scoring function publish method are the following:
• 19 alphanumeric characters for Teradata
• 32 alphanumeric characters for Netezza, Greenplum, and DB2
UNIX SpecificsThe publish name (user-defined) portion of the function name in an AIX environment has a maximum length of 16 alphanumeric characters for Teradata.
• The recommended maximum length of the publish name for the SAS Embedded Process publish method is 32 alphanumeric characters for all database types. The database types that are currently supported by SAS Model Manager are Teradata, Oracle, Greenplum, and DB2.
The value of the publish name is validated against the target database, when the option Replace scoring files that have the same publish name is not selected for the SAS Embedded Process publish method. If the publish name is not unique, an error message is displayed.
Note: The default format of the publish name is configured by the SAS administrator.
6. (Optional) Select whether to Replace scoring files that have the same publish name. Specifies to replace the model scoring files that have the same publish name when you are using the SAS Embedded Process publish method. The value of the publish name is validated against the target database when this option is not selected. If the publish name is not unique, an error message is displayed.
7. Specify an identifier to add to the database target table for each model. Specifies the value of the identifier that is added to each model in the database so that the Database administrator or other users can query the database. The default value is the project name. This option is available only for the SAS Embedded Process publish method.
8. (Optional) Select whether to Validate scoring results. Specifies to validate the scoring results when publishing a model scoring function or model scoring files. This option creates a benchmark scoring result on the SAS Workspace Server using the DATA Step score code. The scoring input data set is used to create an equivalent database table. Scoring is performed using the new scoring function or model scoring files and database table. The scoring results are then compared. If selected, click Browse to navigate to the appropriate training table. The default train table that is specified in the properties of the published model is used by default.
Note: When using the SAS Embedded Process publish method to publish models from SAS Model Manager to a Teradata database, your user database must have the appropriate user permissions to validate the scoring results. For more information, see “Teradata Permissions for Publishing Formats and Scoring Models” in SAS In-Database Products: Administrator’s Guide.
9. Specify the database settings.
Note: For Hadoop and Teradata, when you are using the SAS Embedded Process publish method, the User ID and Password settings are hidden if your system is configured for Kerberos authentication. For Netezza, when you are publishing
Publishing Models to a Database or Hadoop 221
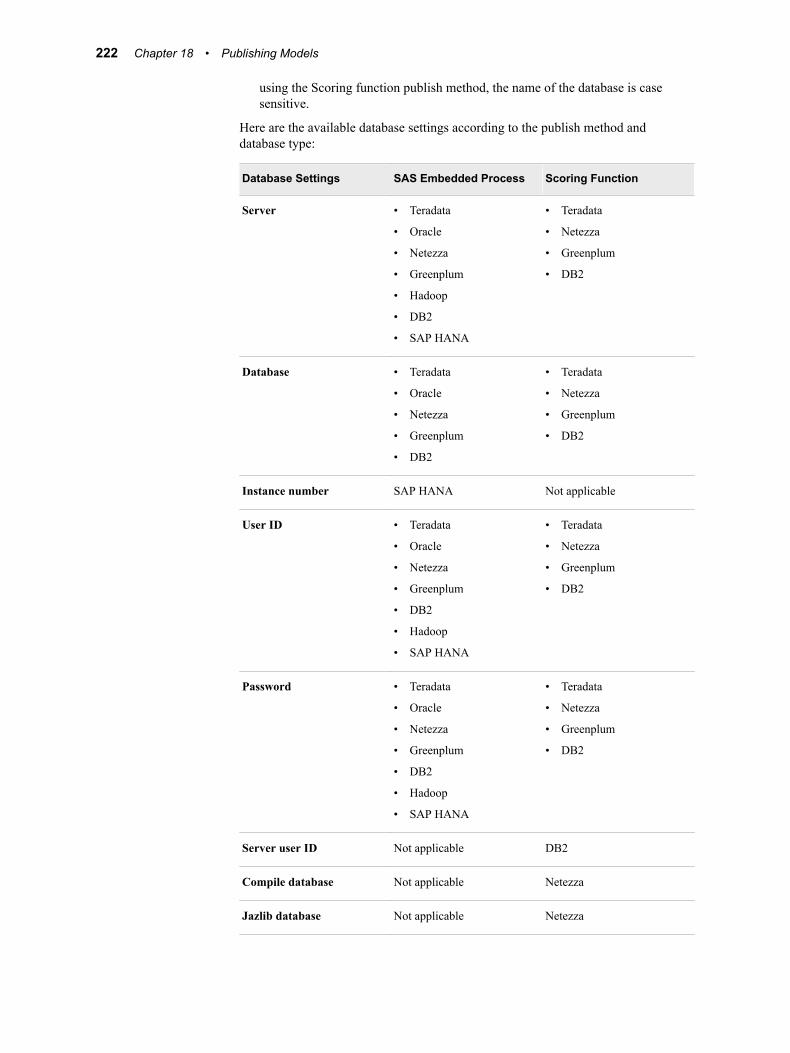
using the Scoring function publish method, the name of the database is case sensitive.
Here are the available database settings according to the publish method and database type:
Database Settings SAS Embedded Process Scoring Function
Server • Teradata
• Oracle
• Netezza
• Greenplum
• Hadoop
• DB2
• SAP HANA
• Teradata
• Netezza
• Greenplum
• DB2
Database • Teradata
• Oracle
• Netezza
• Greenplum
• DB2
• Teradata
• Netezza
• Greenplum
• DB2
Instance number SAP HANA Not applicable
User ID • Teradata
• Oracle
• Netezza
• Greenplum
• DB2
• Hadoop
• SAP HANA
• Teradata
• Netezza
• Greenplum
• DB2
Password • Teradata
• Oracle
• Netezza
• Greenplum
• DB2
• Hadoop
• SAP HANA
• Teradata
• Netezza
• Greenplum
• DB2
Server user ID Not applicable DB2
Compile database Not applicable Netezza
Jazlib database Not applicable Netezza
222 Chapter 18 • Publishing Models
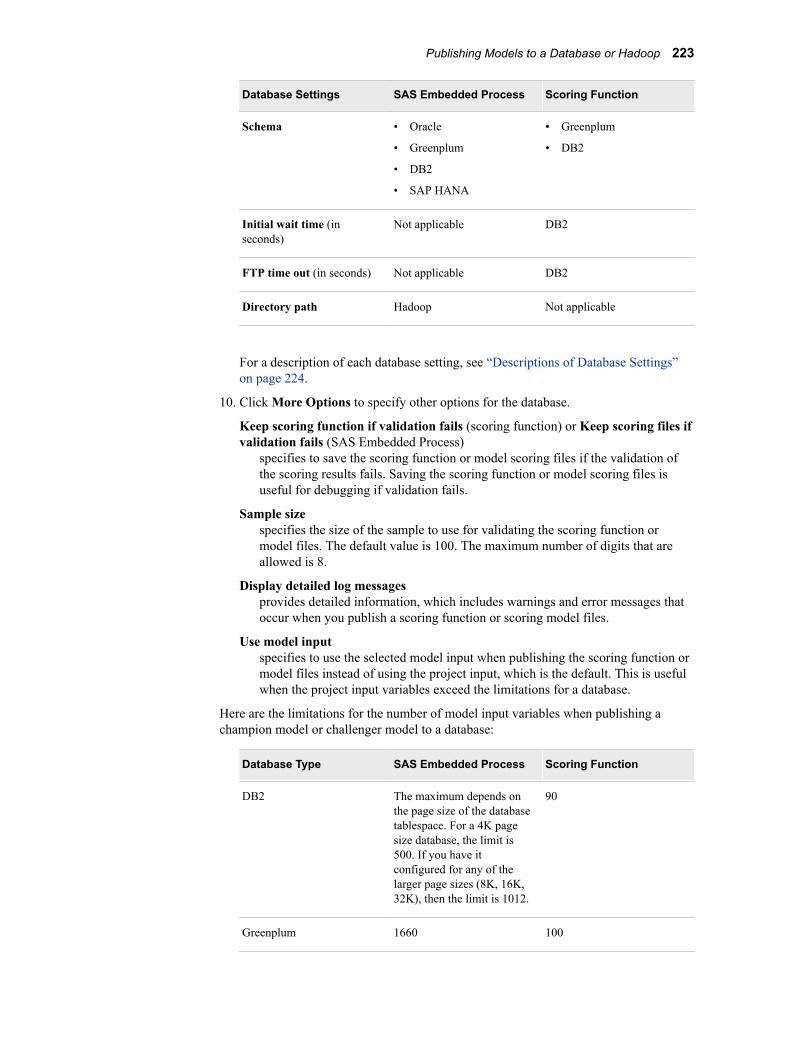
Database Settings SAS Embedded Process Scoring Function
Schema • Oracle
• Greenplum
• DB2
• SAP HANA
• Greenplum
• DB2
Initial wait time (in seconds)
Not applicable DB2
FTP time out (in seconds) Not applicable DB2
Directory path Hadoop Not applicable
For a description of each database setting, see “Descriptions of Database Settings” on page 224.
10. Click More Options to specify other options for the database.
Keep scoring function if validation fails (scoring function) or Keep scoring files if validation fails (SAS Embedded Process)
specifies to save the scoring function or model scoring files if the validation of the scoring results fails. Saving the scoring function or model scoring files is useful for debugging if validation fails.
Sample sizespecifies the size of the sample to use for validating the scoring function or model files. The default value is 100. The maximum number of digits that are allowed is 8.
Display detailed log messagesprovides detailed information, which includes warnings and error messages that occur when you publish a scoring function or scoring model files.
Use model inputspecifies to use the selected model input when publishing the scoring function or model files instead of using the project input, which is the default. This is useful when the project input variables exceed the limitations for a database.
Here are the limitations for the number of model input variables when publishing a champion model or challenger model to a database:
Database Type SAS Embedded Process Scoring Function
DB2 The maximum depends on the page size of the database tablespace. For a 4K page size database, the limit is 500. If you have it configured for any of the larger page sizes (8K, 16K, 32K), then the limit is 1012.
90
Greenplum 1660 100
Publishing Models to a Database or Hadoop 223
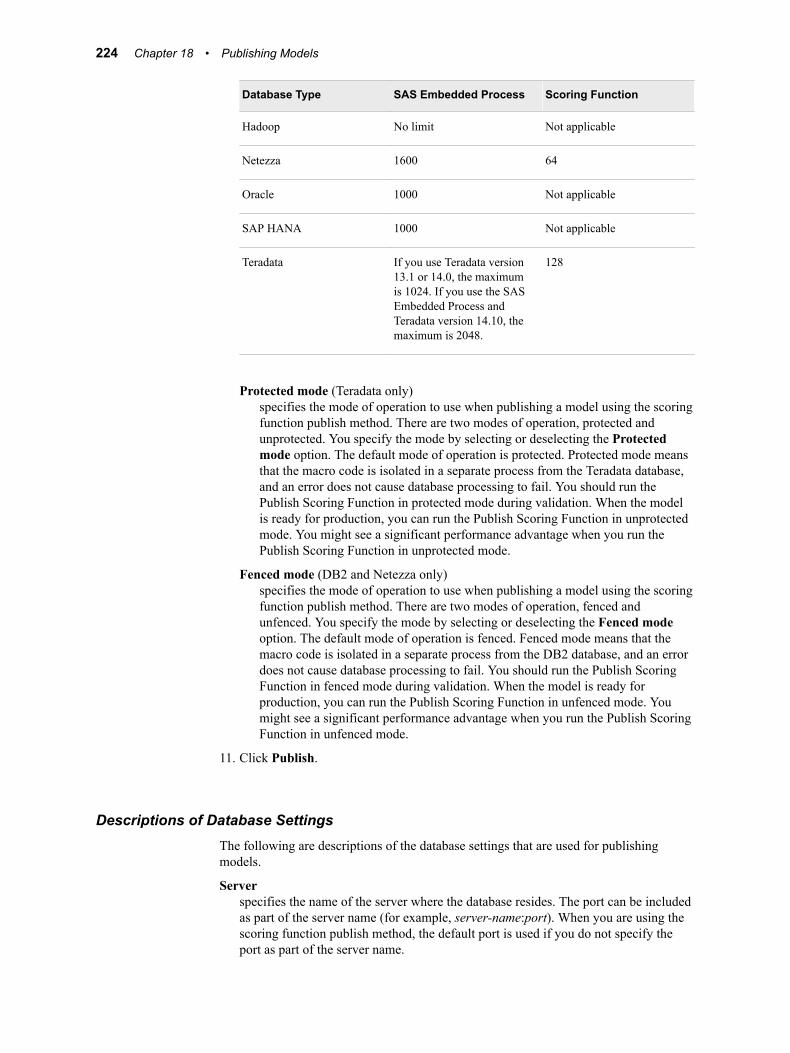
Database Type SAS Embedded Process Scoring Function
Hadoop No limit Not applicable
Netezza 1600 64
Oracle 1000 Not applicable
SAP HANA 1000 Not applicable
Teradata If you use Teradata version 13.1 or 14.0, the maximum is 1024. If you use the SAS Embedded Process and Teradata version 14.10, the maximum is 2048.
128
Protected mode (Teradata only)specifies the mode of operation to use when publishing a model using the scoring function publish method. There are two modes of operation, protected and unprotected. You specify the mode by selecting or deselecting the Protected mode option. The default mode of operation is protected. Protected mode means that the macro code is isolated in a separate process from the Teradata database, and an error does not cause database processing to fail. You should run the Publish Scoring Function in protected mode during validation. When the model is ready for production, you can run the Publish Scoring Function in unprotected mode. You might see a significant performance advantage when you run the Publish Scoring Function in unprotected mode.
Fenced mode (DB2 and Netezza only)specifies the mode of operation to use when publishing a model using the scoring function publish method. There are two modes of operation, fenced and unfenced. You specify the mode by selecting or deselecting the Fenced mode option. The default mode of operation is fenced. Fenced mode means that the macro code is isolated in a separate process from the DB2 database, and an error does not cause database processing to fail. You should run the Publish Scoring Function in fenced mode during validation. When the model is ready for production, you can run the Publish Scoring Function in unfenced mode. You might see a significant performance advantage when you run the Publish Scoring Function in unfenced mode.
11. Click Publish.
Descriptions of Database SettingsThe following are descriptions of the database settings that are used for publishing models.
Serverspecifies the name of the server where the database resides. The port can be included as part of the server name (for example, server-name:port). When you are using the scoring function publish method, the default port is used if you do not specify the port as part of the server name.
224 Chapter 18 • Publishing Models
Note: The port must be included as part of the server name for SAP HANA SPS09 or higher. For SAP HANA SPS08, you must use the instance number setting instead of adding the port to the server name.
Databasespecifies the name of the database.
Note: For Netezza, the name of the database is case sensitive if you are publishing models using the Scoring function publish method.
User IDspecifies the user identification that is required to access the database.
Note: For Hadoop or Teradata, this setting is hidden if your system is configured for Kerberos authentication.
Passwordspecifies the password that is associated with the User ID.
Note: For Hadoop or Teradata, this setting is hidden if your system is configured for Kerberos authentication.
Server user ID (DB2 only)specifies the user ID for SAS SFTP. This value enables you to access the machine on which you have installed the DB2 database. If you do not specify a value for Server user ID, the value of User ID is used as the user ID for SAS SFTP.
Schema (Greenplum, Oracle, and DB2)specifies the schema name for the database. The schema name is owned by the user that is specified in the User ID field. The schema must be created by your database administrator.
Initial wait time (DB2 only)specifies the initial wait time in seconds for SAS SFTP to parse the responses and complete the SFTP –batch file process.
Default: 15 seconds
FTP time out (DB2 only)specifies the time-out value in seconds if SAS SFTP fails to transfer the files.
Default: 120 seconds
Compile database (Netezza only)specifies the name of the database where the SAS_COMPILEUDF function is published.
Default: SASLIB
See Also: For more information about publishing the SAS_COMPILEUDF function, see the SAS In-Database Products: Administrator’s Guide.
Jazlib database (Netezza only)specifies the name of the database where the SAS 9.3 Formats Library for Netezza is published.
Default: SASLIB
Instance number (SAP HANA only)specifies the instance number.
Note: The instance number must be used for SAP HANA SPS08, instead of adding the port to the server name. For SAP HANA SPS09 or higher the port must be included as part of the server name and the instance number is ignored.
Publishing Models to a Database or Hadoop 225

Directory path (Hadoop only)specifies the directory path for the server.
Remove Published ModelsThe SAS Embedded Process publish method enables you to replace the model scoring files, but the scoring function publish method publishes the model as a separate entry in the database each time. The Remove Published Models feature enables you to remove previously published models, so that you can clean up the test or production database. If you modify the previously published models or change the champion model or challenger models after you have published models to a database or Hadoop, you can remove them to clean up the database for future publishing of models.
To remove published models:
1. Select Actions ð Remove Published Models.
2. Select the publish destination and then specify the database or Hadoop settings. Click Log On.
3. Select the models that you want to remove from the database.
4. Click Remove Models. A warning message appears.
5. Click Yes.
View Publish HistoryTo view the publish history of a model, select the Models page. To view the publish history of all models, select the Published tab on the History page. All models that have been published to a SAS Channel, to the SAS Metadata Repository, and to a database are displayed. Select a model from the list to view the full publish details.
To view the full publish details for a model:
1. Open a model and select the Model Properties tab.
2. Select History ð Published to view the publish history.
To view the full publish details for all models:
1. Open a project and select the History page.
2. Select the Published tab to view the publish history.
226 Chapter 18 • Publishing Models
Part 5
Using SAS Workflow with SAS Model Manager
Chapter 19Starting a Workflow and Working with Tasks . . . . . . . . . . . . . . . . . . . . 229
Chapter 20Managing Workflows . . . . . . . . . . . . . . . . . . . . . . . . . . . . . . . . . . . . . . . . . . . 233
227

228
Chapter 19
Starting a Workflow and Working with Tasks
Overview of Using Workflows . . . . . . . . . . . . . . . . . . . . . . . . . . . . . . . . . . . . . . . . . . 229
Start a New Workflow . . . . . . . . . . . . . . . . . . . . . . . . . . . . . . . . . . . . . . . . . . . . . . . . 229
Working with Workflow Tasks . . . . . . . . . . . . . . . . . . . . . . . . . . . . . . . . . . . . . . . . . 230
Overview of Using WorkflowsSAS Model Manager uses the Workflows and My Tasks category views to use SAS Workflow. A workflow is a copy of a workflow template. A workflow can be used to track the progress of objects, such as model projects at the version level. An authorized user can use SAS Workflow Studio to define workflow templates and to make them available to SAS Model Manager for use. Workflow templates contain the set of tasks, participants, policies, statuses, and data objects that comprise a business task. The status that you select when completing a task determines the next task in the workflow.
All users can access the My Tasks category view. By default, only users that are in the Decision Manager Common Administrators group can access the Workflows category view.
For more information about user permissions, see SAS Model Manager: Administrator’s Guide.
Start a New WorkflowWhen you start a new workflow, it is associated with the selected version of a project. For a specific version, only one workflow can be in progress at a time. To start another workflow for the same version, you must first complete the in-progress workflow, or terminate the in-progress workflow process.
1. Open a project.
2. Click on the right-side of the object toolbar.
229
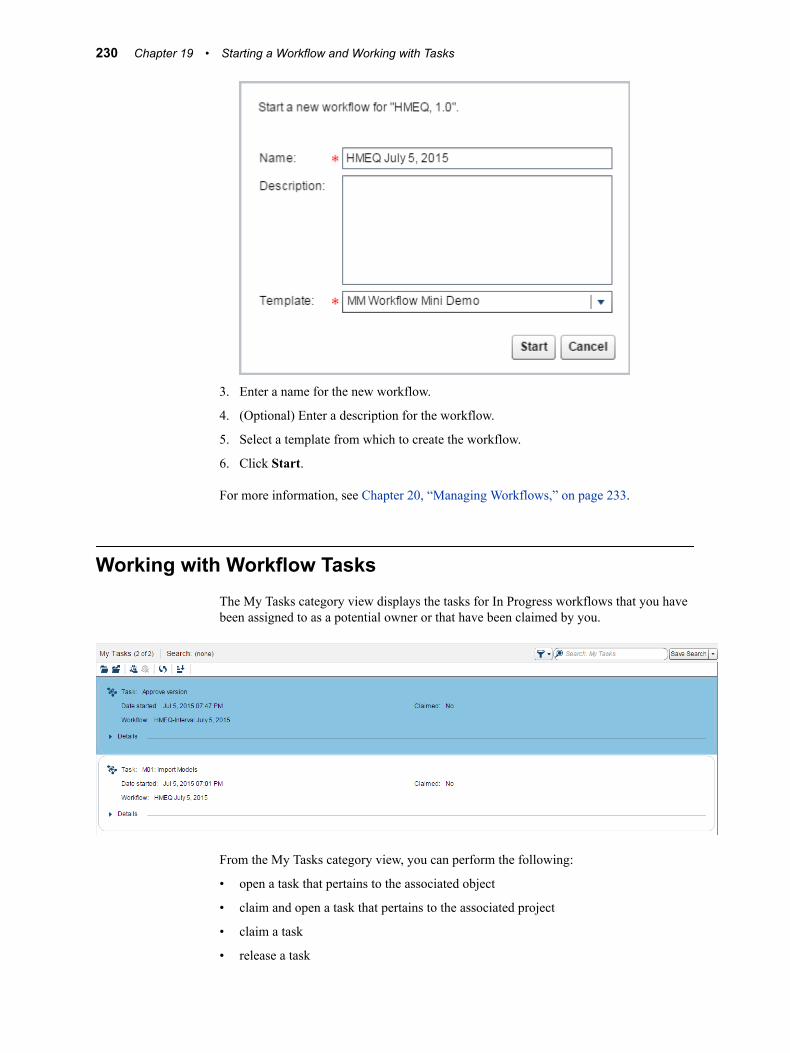
3. Enter a name for the new workflow.
4. (Optional) Enter a description for the workflow.
5. Select a template from which to create the workflow.
6. Click Start.
For more information, see Chapter 20, “Managing Workflows,” on page 233.
Working with Workflow TasksThe My Tasks category view displays the tasks for In Progress workflows that you have been assigned to as a potential owner or that have been claimed by you.
From the My Tasks category view, you can perform the following:
• open a task that pertains to the associated object
• claim and open a task that pertains to the associated project
• claim a task
• release a task
230 Chapter 19 • Starting a Workflow and Working with Tasks
• view the task details and workflow diagram
To complete a task:
1. Select a task and click in order to open the associated project and perform the task.
2. Navigate through the project’s pages to perform the steps for the current task.
3. Click .
4. Select an action to take for the selected task. The actions that are available are the status values for the task in the workflow.
5. Click Done. The workflow process continues to the next task.
Note: Only a business administrator who has access to the Workflows category can release a task that has been claimed by another participant. For more information, see “Release a Task” on page 237.
Working with Workflow Tasks 231

232 Chapter 19 • Starting a Workflow and Working with Tasks

Chapter 20
Managing Workflows
Overview of Managing Workflows . . . . . . . . . . . . . . . . . . . . . . . . . . . . . . . . . . . . . . 233
Viewing Workflows . . . . . . . . . . . . . . . . . . . . . . . . . . . . . . . . . . . . . . . . . . . . . . . . . . . 234
Set Mappings . . . . . . . . . . . . . . . . . . . . . . . . . . . . . . . . . . . . . . . . . . . . . . . . . . . . . . . . 235
Working with Workflow Participants . . . . . . . . . . . . . . . . . . . . . . . . . . . . . . . . . . . . 236Assign Participants to Tasks . . . . . . . . . . . . . . . . . . . . . . . . . . . . . . . . . . . . . . . . . . 236Remove Participants from a Task . . . . . . . . . . . . . . . . . . . . . . . . . . . . . . . . . . . . . . 237Release a Task . . . . . . . . . . . . . . . . . . . . . . . . . . . . . . . . . . . . . . . . . . . . . . . . . . . . . 237
Edit Task Properties . . . . . . . . . . . . . . . . . . . . . . . . . . . . . . . . . . . . . . . . . . . . . . . . . . 238
Terminate a Workflow . . . . . . . . . . . . . . . . . . . . . . . . . . . . . . . . . . . . . . . . . . . . . . . . 238
Overview of Managing WorkflowsSAS Model Manager can be used to manage workflows. You can create new workflows, view workflows, and interact with tasks that are associated with a workflow. If a user is assigned to the workflow role of business administrator, they can influence the progress of a task by actions such as assigning a task, or releasing the task that is claimed by another user, as well as specify values for properties to share information with other users. After the workflow templates are made available, an application administrator can set the object mappings using the Workflows category view. Each workflow consists of tasks.
Note: By default, only users that are in the Decision Manager Common Administrators group can access the Workflows category view.
Select Workflows to view a list of available workflows.
233
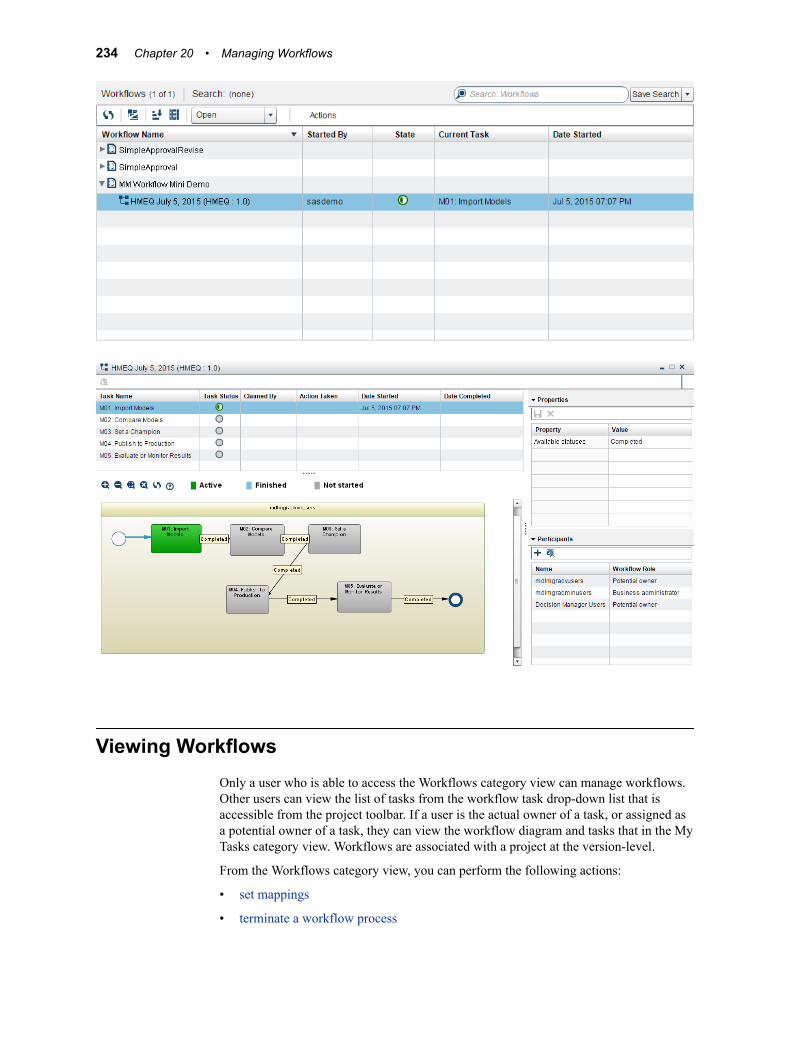
Viewing WorkflowsOnly a user who is able to access the Workflows category view can manage workflows. Other users can view the list of tasks from the workflow task drop-down list that is accessible from the project toolbar. If a user is the actual owner of a task, or assigned as a potential owner of a task, they can view the workflow diagram and tasks that in the My Tasks category view. Workflows are associated with a project at the version-level.
From the Workflows category view, you can perform the following actions:
• set mappings
• terminate a workflow process
234 Chapter 20 • Managing Workflows
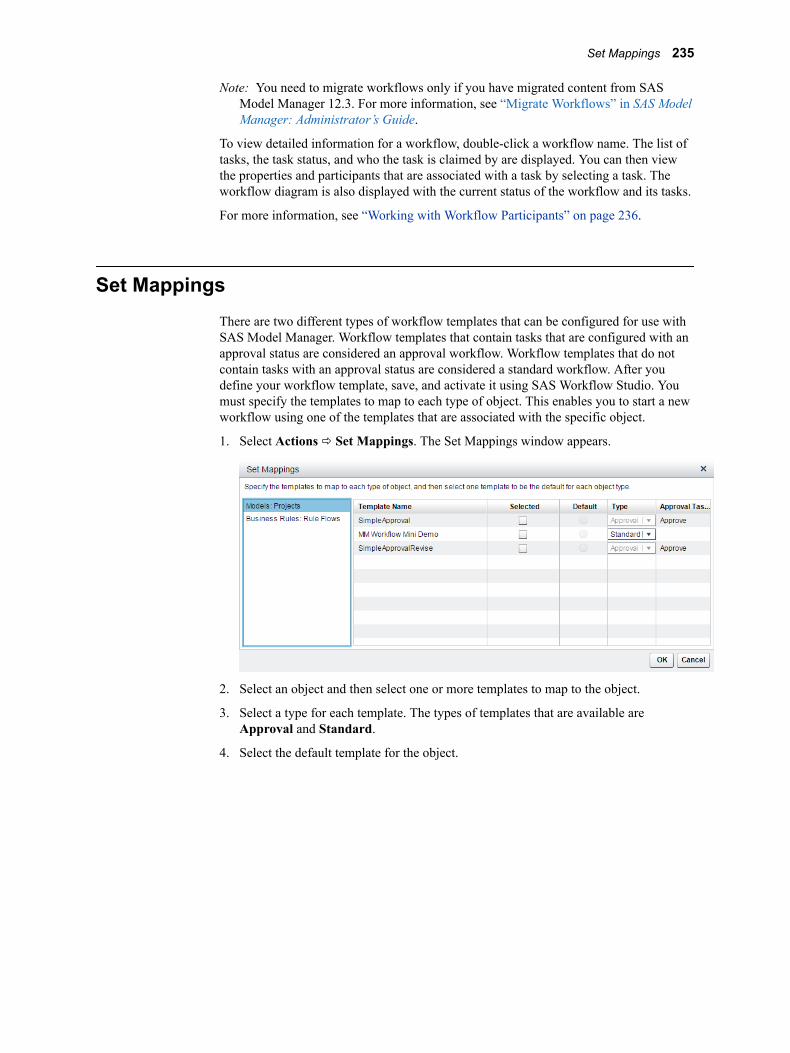
Note: You need to migrate workflows only if you have migrated content from SAS Model Manager 12.3. For more information, see “Migrate Workflows” in SAS Model Manager: Administrator’s Guide.
To view detailed information for a workflow, double-click a workflow name. The list of tasks, the task status, and who the task is claimed by are displayed. You can then view the properties and participants that are associated with a task by selecting a task. The workflow diagram is also displayed with the current status of the workflow and its tasks.
For more information, see “Working with Workflow Participants” on page 236.
Set MappingsThere are two different types of workflow templates that can be configured for use with SAS Model Manager. Workflow templates that contain tasks that are configured with an approval status are considered an approval workflow. Workflow templates that do not contain tasks with an approval status are considered a standard workflow. After you define your workflow template, save, and activate it using SAS Workflow Studio. You must specify the templates to map to each type of object. This enables you to start a new workflow using one of the templates that are associated with the specific object.
1. Select Actions ð Set Mappings. The Set Mappings window appears.
2. Select an object and then select one or more templates to map to the object.
3. Select a type for each template. The types of templates that are available are Approval and Standard.
4. Select the default template for the object.
Set Mappings 235
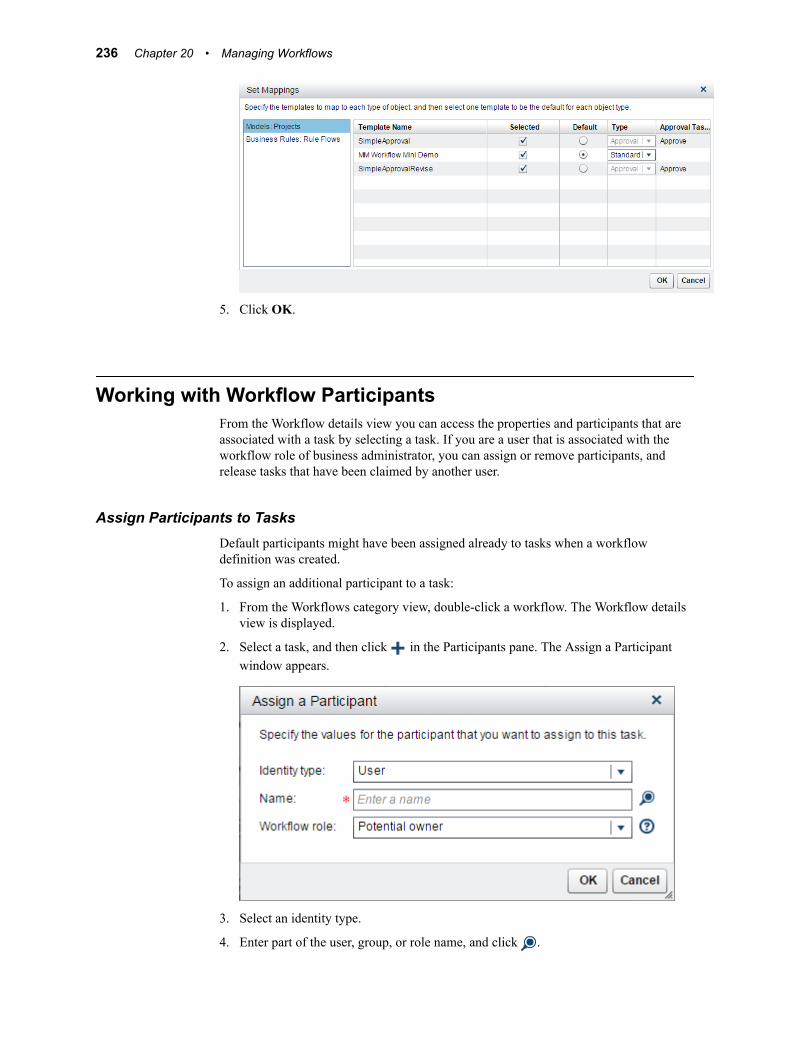
5. Click OK.
Working with Workflow ParticipantsFrom the Workflow details view you can access the properties and participants that are associated with a task by selecting a task. If you are a user that is associated with the workflow role of business administrator, you can assign or remove participants, and release tasks that have been claimed by another user.
Assign Participants to TasksDefault participants might have been assigned already to tasks when a workflow definition was created.
To assign an additional participant to a task:
1. From the Workflows category view, double-click a workflow. The Workflow details view is displayed.
2. Select a task, and then click in the Participants pane. The Assign a Participant window appears.
3. Select an identity type.
4. Enter part of the user, group, or role name, and click .
236 Chapter 20 • Managing Workflows
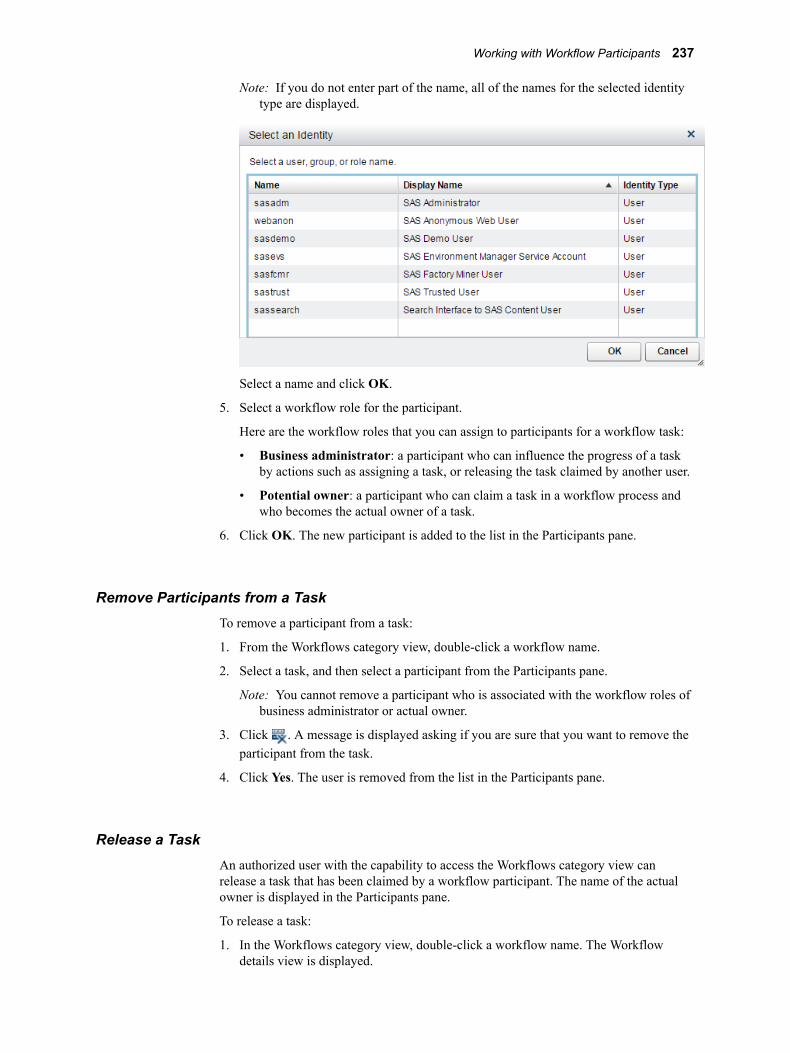
Note: If you do not enter part of the name, all of the names for the selected identity type are displayed.
Select a name and click OK.
5. Select a workflow role for the participant.
Here are the workflow roles that you can assign to participants for a workflow task:
• Business administrator: a participant who can influence the progress of a task by actions such as assigning a task, or releasing the task claimed by another user.
• Potential owner: a participant who can claim a task in a workflow process and who becomes the actual owner of a task.
6. Click OK. The new participant is added to the list in the Participants pane.
Remove Participants from a TaskTo remove a participant from a task:
1. From the Workflows category view, double-click a workflow name.
2. Select a task, and then select a participant from the Participants pane.
Note: You cannot remove a participant who is associated with the workflow roles of business administrator or actual owner.
3. Click . A message is displayed asking if you are sure that you want to remove the participant from the task.
4. Click Yes. The user is removed from the list in the Participants pane.
Release a TaskAn authorized user with the capability to access the Workflows category view can release a task that has been claimed by a workflow participant. The name of the actual owner is displayed in the Participants pane.
To release a task:
1. In the Workflows category view, double-click a workflow name. The Workflow details view is displayed.
Working with Workflow Participants 237

2. Select a task name, and click . The Claimed By value for the selected task is cleared.
Edit Task PropertiesA task can contain properties. Properties that are editable display a triangular icon in the bottom right corner of the property value in the data grid.
To edit the properties for a task:
1. From the Workflows category view, open a workflow, and select a task. The properties that are associated with the task are displayed to the right in the Properties pane.
2. Click on the property value, and then enter a value or change the existing value.
3. To save the changes to the properties, click .
If you do not want to save the changes to the properties, click .
Terminate a WorkflowWhen you terminate a workflow process, all tasks that have not yet been completed are changed to a state of Terminated. After you terminate a workflow process, it cannot be restarted. However, you can start a new workflow for the same version.
To terminate a workflow:
1. From the Workflows category view, select a workflow name and click .
2. Click Yes to terminate the selected workflow.
238 Chapter 20 • Managing Workflows

Part 6
Appendixes
Appendix 1Model Templates . . . . . . . . . . . . . . . . . . . . . . . . . . . . . . . . . . . . . . . . . . . . . . . 241
Appendix 2Project Tables . . . . . . . . . . . . . . . . . . . . . . . . . . . . . . . . . . . . . . . . . . . . . . . . . . 253
Appendix 3PROC PSCORE and PMML Support . . . . . . . . . . . . . . . . . . . . . . . . . . . . . 265
Appendix 4R Model Support . . . . . . . . . . . . . . . . . . . . . . . . . . . . . . . . . . . . . . . . . . . . . . . . 267
Appendix 5Statistical Measures Used in Basel III Reports . . . . . . . . . . . . . . . . . . . 275
239

240
Appendix 1
Model Templates
What Is a Model Template?Models that you import into SAS Model Manager are associated with a specific model template. A model template has properties and component files that define a type of model. SAS Model Manager processes four types of models: analytical, classification, prediction, and segmentation. You can create your own model template if your model requires files other than those named in the SAS Model Manager templates.
A model template is an XML file that has three sections. The General section names and describes the model template. The Properties section provides properties to name the model algorithm, the modeler, and a model label. The Files section contains the component files that can be used in the template for that model function type. You associate your component file with the appropriate model template component file. Your component file filenames do not need to be the same name as the filenames in the model template.
Model templates provide you with a way to define metadata about your own model. Most users do not need to write model templates because SAS Model Manager delivers a list of model templates that handle SAS Enterprise Miner models as well as analytical, prediction, classification, and segmentation models. However, you can write your own model templates if the model templates that are provided do not satisfy your requirements. For more information, see “Creating and Managing Templates” on page 60.
Model TypesSAS Model Manager provides model templates for analytical, classification, prediction, and segmentation models.
Model Type Description
Analytical The Analytical model template is the most generic template that is designed for models whose model function does not fall in the prediction, classification, and segmentation category.
241

Model Type Description
Classification You use the Classification model template if your model is a prediction model that has a categorical, ordinal, or binary target, or if your model is a LOGISTIC procedure regression model. Examples of classification models are models that might classify a loan applicant as Approved or Not Approved, or models that might assess a potential customer's risk of default as Low, Medium, or High.
Prediction The Prediction model template is used for predictive models. Predictive models declare in advance the outcome of an interval target. A model that assigns a numeric credit score to an applicant is an example of a prediction model.
Segmentation The Segmentation model template is used for segmentation or cluster models that are written in SAS code. Segmentation models are unsupervised models that have no target variable. A segmentation or cluster model is designed to identify and form segments, or clusters, of individuals or observations that share some affinity for an attribute of interest. The output from a segmentation model is a set of cluster IDs. R models cannot have segmentation model function.
Model Template Component FilesHere is a list of the component files that are associated with the model templates:
Filename Analytical Classification Prediction Segmentation
IGN_STATS.csv on page 244
— — —
EMPublishScore.sas on page 244
— — —
Scorecard_GainsTable.csv on page 244
— — —
score.sas on page 244
modelinput.sas7bdat on page 244
modeloutput.sas7bdat on page 244
target.sas7bdat on page 245
— —
inputvar.xml on page 245
outputvar.xml on page 246
242 Appendix 1 • Model Templates
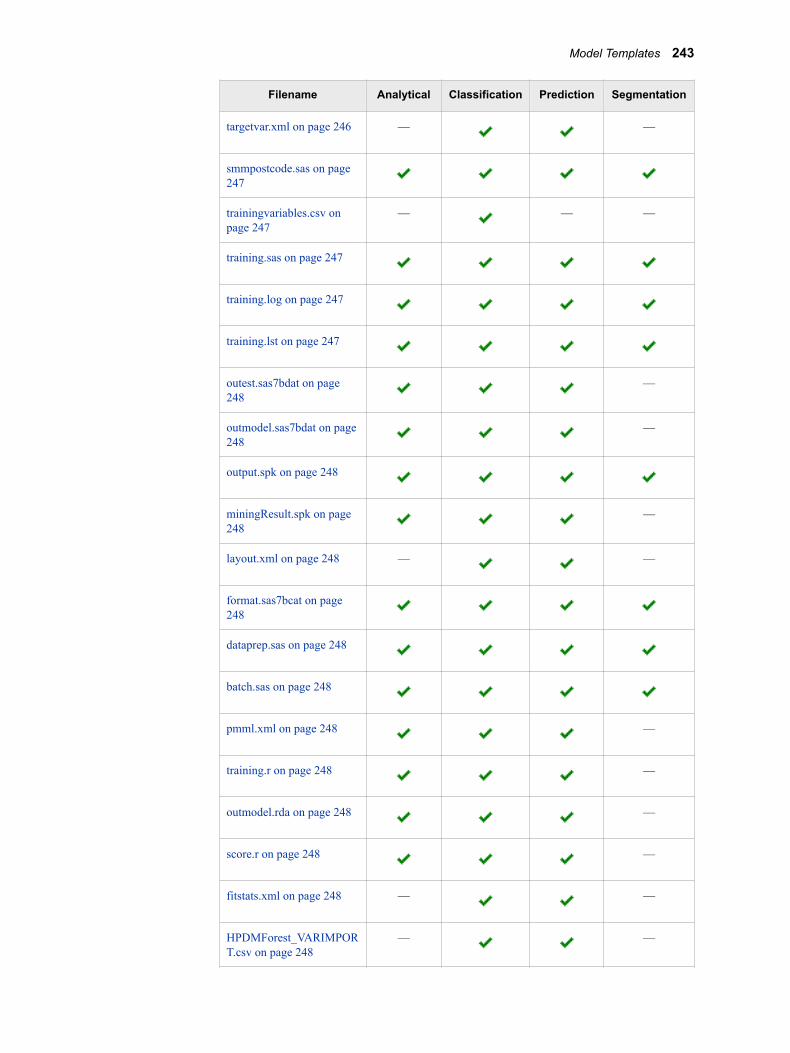
Filename Analytical Classification Prediction Segmentation
targetvar.xml on page 246 — —
smmpostcode.sas on page 247
trainingvariables.csv on page 247
— — —
training.sas on page 247
training.log on page 247
training.lst on page 247
outest.sas7bdat on page 248
—
outmodel.sas7bdat on page 248
—
output.spk on page 248
miningResult.spk on page 248
—
layout.xml on page 248 — —
format.sas7bcat on page 248
dataprep.sas on page 248
batch.sas on page 248
pmml.xml on page 248 —
training.r on page 248 —
outmodel.rda on page 248 —
score.r on page 248 —
fitstats.xml on page 248 — —
HPDMForest_VARIMPORT.csv on page 248
— —
Model Templates 243

Filename Analytical Classification Prediction Segmentation
HPDMForest_ITERATION.csv on page 248
— —
outmdlfile.bin on page 248 — —
IGN_STATS.csvThe value of IGN_STAT.csv is the name of a file whose values are separated by commas, and whose values are bin definitions for input variables. This is a component file that is generated by SAS Enterprise Miner for a scorecard model and is not needed for SAS code models.
EMPublishScore.sasThe value of EMPublishScore.sas is the name of a SAS code file that is used to change input variables into bins and is a component of a SAS Enterprise Miner scorecard model. This file is needed to define a performance task. This file is not needed for SAS code models.
Scorecard_GainsTable.csvThis file includes the bin score definitions and is not used in reporting by SAS Model Manager. The file's content can be viewed by users.
score.sasThe value of score.sas is the name of a filename for the SAS score code for the model.
For R models, this file transforms a scoring data set to an R data frame.
The score.sas file is DATA step score code and is used as input by the SAS Scoring Accelerator when publishing a model to a database. When you are using the scoring function publish method, some SAS language elements and syntax are not supported when you create or modify your score code. Only the SAS language elements and syntax that are required to run critical data transformations and model scoring functions are available. If you use a statement or function that is not supported, an error occurs and your model is not published to the database. For more information, see “Considerations When Creating or Modifying DATA Step Score Code” in SAS In-Database Products: User’s Guide.
modelinput.sas7bdatThe value of modelinput.sas7bdat is the name of a sample data set that is used to create an inputvar.xml file for the model if one does not exist. When no inputvar.xml file exists for the model, SAS Model Manager creates the inputvar.xml file using the variable name and attributes in the modelinput.sas7bdat file. Observation values are not used. Therefore, the sample data set can have no observations or it can have any number of observations. If an inputvar.xml is specified in the model template, modelinput.sas7bdat is ignored.
When you import a SAS code model, the data set that you used to test your score code can be used as the value for the modelinput.sas7bdat file.
Note: If the same variables appear in your modelinput.sas7bdat file and your modeloutput.sas7bdat file, when you import the model, SAS Model Manager removes the duplicate variables in the outputvar.xml file.
modeloutput.sas7bdatThe value of modeloutput.sas7bdat is the name of a sample data set that is used to create an outputvar.xml file for the model if one does not exist. When no outputvar.xml file exists for the model, SAS Model Manager creates the
244 Appendix 1 • Model Templates
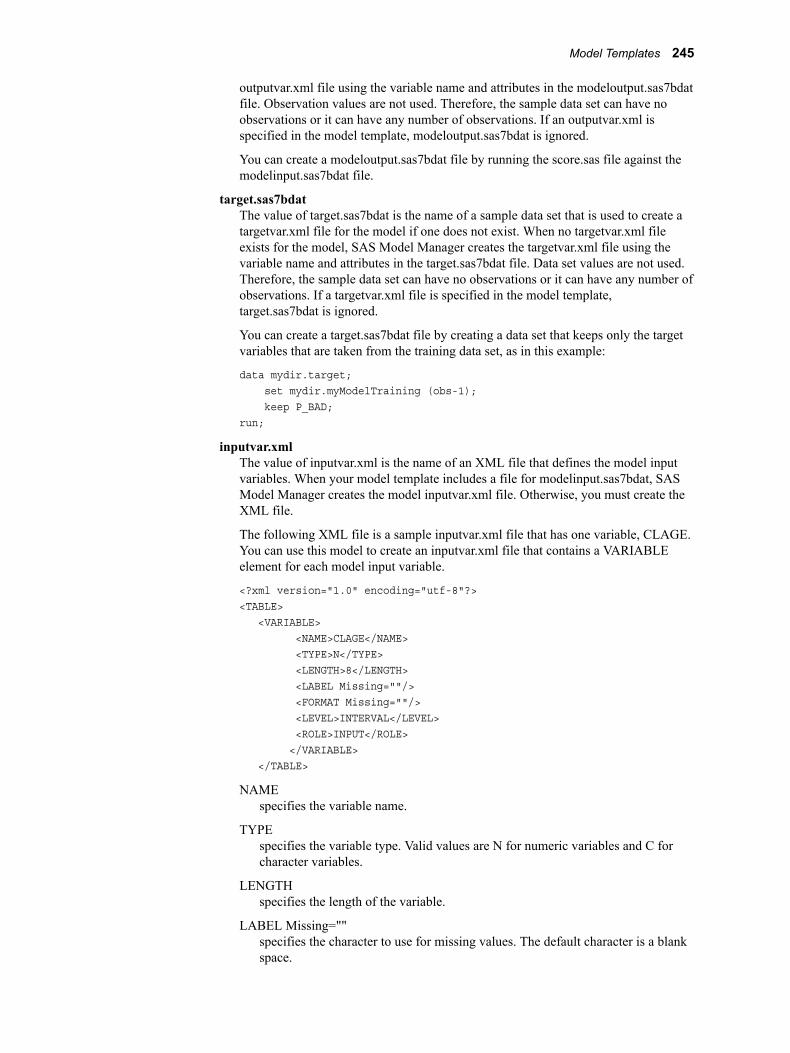
outputvar.xml file using the variable name and attributes in the modeloutput.sas7bdat file. Observation values are not used. Therefore, the sample data set can have no observations or it can have any number of observations. If an outputvar.xml is specified in the model template, modeloutput.sas7bdat is ignored.
You can create a modeloutput.sas7bdat file by running the score.sas file against the modelinput.sas7bdat file.
target.sas7bdatThe value of target.sas7bdat is the name of a sample data set that is used to create a targetvar.xml file for the model if one does not exist. When no targetvar.xml file exists for the model, SAS Model Manager creates the targetvar.xml file using the variable name and attributes in the target.sas7bdat file. Data set values are not used. Therefore, the sample data set can have no observations or it can have any number of observations. If a targetvar.xml file is specified in the model template, target.sas7bdat is ignored.
You can create a target.sas7bdat file by creating a data set that keeps only the target variables that are taken from the training data set, as in this example:
data mydir.target; set mydir.myModelTraining (obs-1); keep P_BAD;run;
inputvar.xmlThe value of inputvar.xml is the name of an XML file that defines the model input variables. When your model template includes a file for modelinput.sas7bdat, SAS Model Manager creates the model inputvar.xml file. Otherwise, you must create the XML file.
The following XML file is a sample inputvar.xml file that has one variable, CLAGE. You can use this model to create an inputvar.xml file that contains a VARIABLE element for each model input variable.
<?xml version="1.0" encoding="utf-8"?><TABLE> <VARIABLE> <NAME>CLAGE</NAME> <TYPE>N</TYPE> <LENGTH>8</LENGTH> <LABEL Missing=""/> <FORMAT Missing=""/> <LEVEL>INTERVAL</LEVEL> <ROLE>INPUT</ROLE> </VARIABLE> </TABLE>
NAMEspecifies the variable name.
TYPEspecifies the variable type. Valid values are N for numeric variables and C for character variables.
LENGTHspecifies the length of the variable.
LABEL Missing=""specifies the character to use for missing values. The default character is a blank space.
Model Templates 245
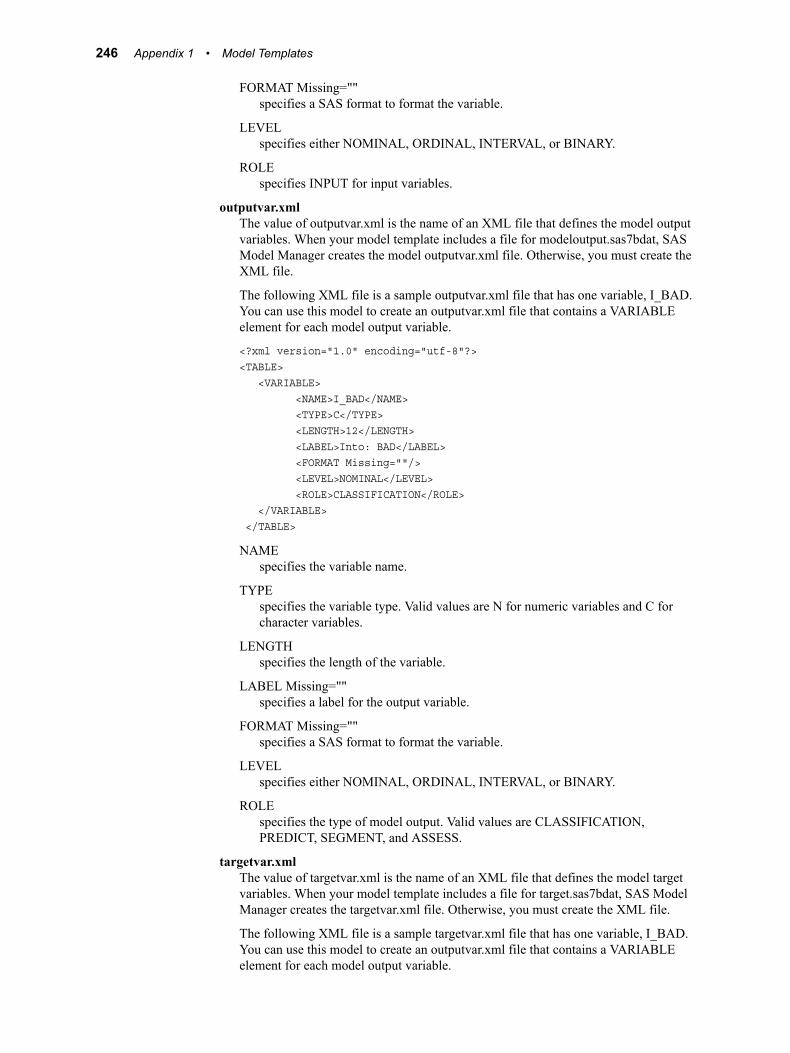
FORMAT Missing=""specifies a SAS format to format the variable.
LEVELspecifies either NOMINAL, ORDINAL, INTERVAL, or BINARY.
ROLEspecifies INPUT for input variables.
outputvar.xmlThe value of outputvar.xml is the name of an XML file that defines the model output variables. When your model template includes a file for modeloutput.sas7bdat, SAS Model Manager creates the model outputvar.xml file. Otherwise, you must create the XML file.
The following XML file is a sample outputvar.xml file that has one variable, I_BAD. You can use this model to create an outputvar.xml file that contains a VARIABLE element for each model output variable.
<?xml version="1.0" encoding="utf-8"?><TABLE> <VARIABLE> <NAME>I_BAD</NAME> <TYPE>C</TYPE> <LENGTH>12</LENGTH> <LABEL>Into: BAD</LABEL> <FORMAT Missing=""/> <LEVEL>NOMINAL</LEVEL> <ROLE>CLASSIFICATION</ROLE> </VARIABLE> </TABLE>
NAMEspecifies the variable name.
TYPEspecifies the variable type. Valid values are N for numeric variables and C for character variables.
LENGTHspecifies the length of the variable.
LABEL Missing=""specifies a label for the output variable.
FORMAT Missing=""specifies a SAS format to format the variable.
LEVELspecifies either NOMINAL, ORDINAL, INTERVAL, or BINARY.
ROLEspecifies the type of model output. Valid values are CLASSIFICATION, PREDICT, SEGMENT, and ASSESS.
targetvar.xmlThe value of targetvar.xml is the name of an XML file that defines the model target variables. When your model template includes a file for target.sas7bdat, SAS Model Manager creates the targetvar.xml file. Otherwise, you must create the XML file.
The following XML file is a sample targetvar.xml file that has one variable, I_BAD. You can use this model to create an outputvar.xml file that contains a VARIABLE element for each model output variable.
246 Appendix 1 • Model Templates

<?xml version="1.0" encoding="utf-8"?><TABLE> <VARIABLE> <NAME>BAD</NAME> <TYPE>N</TYPE> <LENGTH>8</LENGTH> <LABEL>Missing=””/> <FORMAT Missing=""/> <LEVEL>BINARY</LEVEL> <ROLE>TARGET</ROLE> </VARIABLE> </TABLE>
NAMEspecifies the variable name.
TYPEspecifies the variable type. Valid values are N for numeric variables and C for character variables.
LENGTHspecifies the length of the variable.
LABEL Missing=""specifies a label for the target variable.
FORMAT Missing=""specifies a SAS format to format the variable.
LEVELspecifies either NOMINAL, ORDINAL, INTERVAL, or BINARY.
ROLEspecifies TARGET for the role of the variable..
smmpostcode.sasSAS Model Manager creates this file to document the mapping that the user specified between the model variables and the project variables.
trainingvariables.csvThis optional file contains a list of the training variables.
training.sasThis file is the optional SAS code that was used to train the model that you are importing. If at some time, SAS Model Manager reporting utilities detect a shift in the distribution of model input data values or a drift in the model's predictive capabilities, the training.sas code can be used to retrain the model on the newer data. If it is not available at import time, the training.sas code can be added at a later point using the Add Local Files feature.
training.logThis file is the optional log file that was produced when the model that you are importing was trained. The information in the optional SAS training log can be helpful if the model must be retrained in the future.
training.lstThis file is the optional text output that is produced when the training.sas code is run. The information in the optional SAS training.lst table can be helpful if the model must be retrained in the future.
Model Templates 247
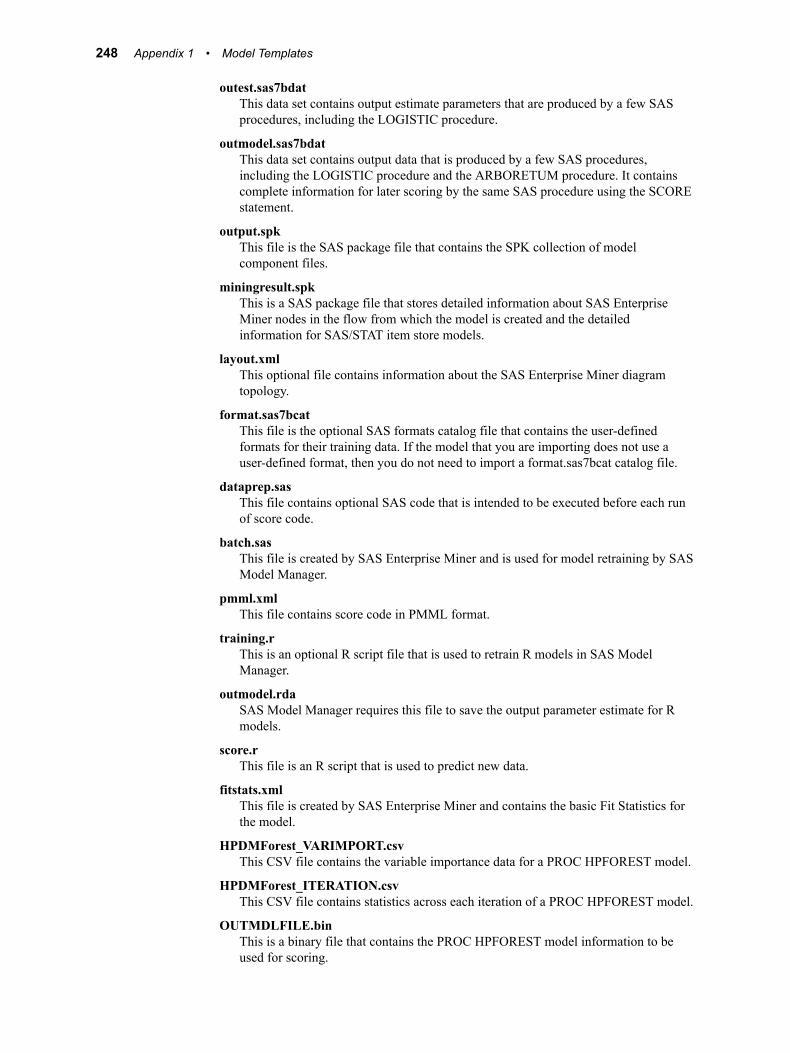
outest.sas7bdatThis data set contains output estimate parameters that are produced by a few SAS procedures, including the LOGISTIC procedure.
outmodel.sas7bdatThis data set contains output data that is produced by a few SAS procedures, including the LOGISTIC procedure and the ARBORETUM procedure. It contains complete information for later scoring by the same SAS procedure using the SCORE statement.
output.spkThis file is the SAS package file that contains the SPK collection of model component files.
miningresult.spkThis is a SAS package file that stores detailed information about SAS Enterprise Miner nodes in the flow from which the model is created and the detailed information for SAS/STAT item store models.
layout.xmlThis optional file contains information about the SAS Enterprise Miner diagram topology.
format.sas7bcatThis file is the optional SAS formats catalog file that contains the user-defined formats for their training data. If the model that you are importing does not use a user-defined format, then you do not need to import a format.sas7bcat catalog file.
dataprep.sasThis file contains optional SAS code that is intended to be executed before each run of score code.
batch.sasThis file is created by SAS Enterprise Miner and is used for model retraining by SAS Model Manager.
pmml.xmlThis file contains score code in PMML format.
training.rThis is an optional R script file that is used to retrain R models in SAS Model Manager.
outmodel.rdaSAS Model Manager requires this file to save the output parameter estimate for R models.
score.rThis file is an R script that is used to predict new data.
fitstats.xmlThis file is created by SAS Enterprise Miner and contains the basic Fit Statistics for the model.
HPDMForest_VARIMPORT.csvThis CSV file contains the variable importance data for a PROC HPFOREST model.
HPDMForest_ITERATION.csvThis CSV file contains statistics across each iteration of a PROC HPFOREST model.
OUTMDLFILE.binThis is a binary file that contains the PROC HPFOREST model information to be used for scoring.
248 Appendix 1 • Model Templates
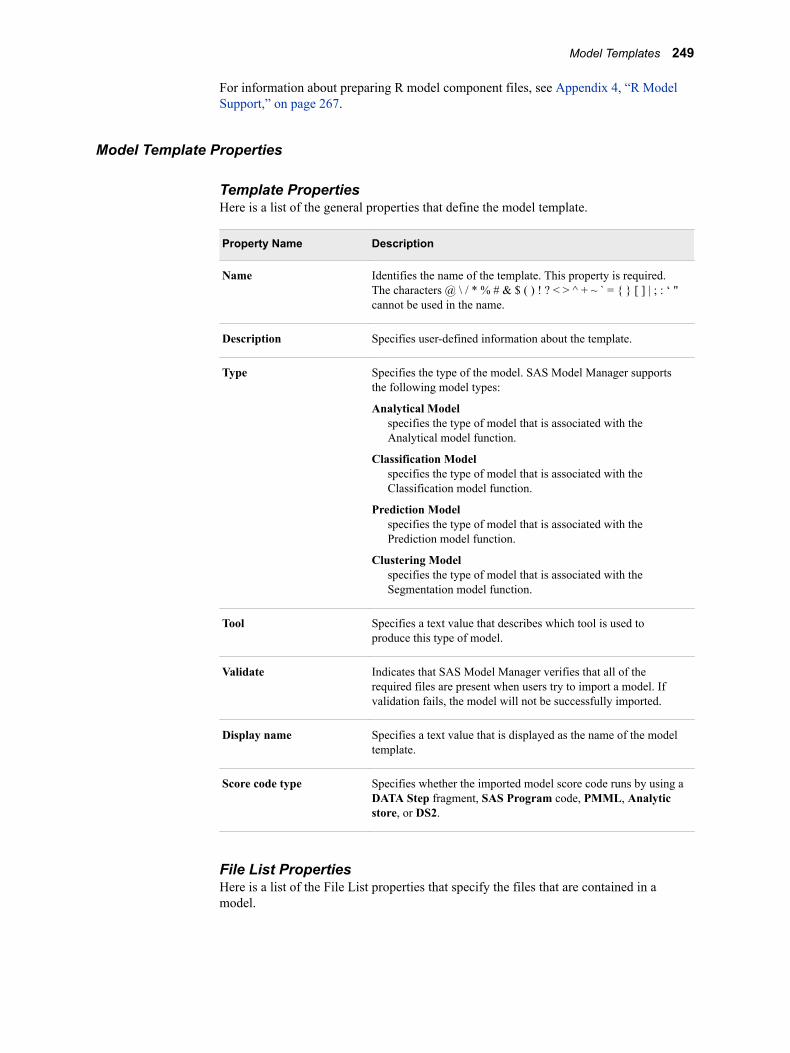
For information about preparing R model component files, see Appendix 4, “R Model Support,” on page 267.
Model Template Properties
Template PropertiesHere is a list of the general properties that define the model template.
Property Name Description
Name Identifies the name of the template. This property is required. The characters @ \ / * % # & $ ( ) ! ? < > ^ + ~ ` = { } [ ] | ; : ‘ " cannot be used in the name.
Description Specifies user-defined information about the template.
Type Specifies the type of the model. SAS Model Manager supports the following model types:
Analytical Modelspecifies the type of model that is associated with the Analytical model function.
Classification Modelspecifies the type of model that is associated with the Classification model function.
Prediction Modelspecifies the type of model that is associated with the Prediction model function.
Clustering Modelspecifies the type of model that is associated with the Segmentation model function.
Tool Specifies a text value that describes which tool is used to produce this type of model.
Validate Indicates that SAS Model Manager verifies that all of the required files are present when users try to import a model. If validation fails, the model will not be successfully imported.
Display name Specifies a text value that is displayed as the name of the model template.
Score code type Specifies whether the imported model score code runs by using a DATA Step fragment, SAS Program code, PMML, Analytic store, or DS2.
File List PropertiesHere is a list of the File List properties that specify the files that are contained in a model.
Model Templates 249

Property Name Definition
Name Identifies the name of the file. This property is required.
Description Specifies user-defined information about the file.
Required When it is selected, indicates that the file is a required component file of the model that must be imported before using the model.
Report When it is selected, indicates that the file is to be included in a SAS package file when a model is published to a channel.
Type Specifies a file whose type is text or binary.
Fileref Specifies an eight-character (or fewer) SAS file reference to refer to this file in score.sas code. The fileref is assigned by SAS Model Manager when a SAS job is submitted.
Note: All user-defined models must have three files.
• score.sas is the model's score code.
• modelinput.sas7bdat is a SAS data set whose variables are used by the model score code. The contents of the data set is not used by SAS Model Manager.
• modeloutput is a resulting data set when a user runs score.sas against modelinput.sas7bdat. The data set provides output variables that the model creates after a scoring test is executed. The contents of the data set is not used by SAS Model Manager.
System and User PropertiesHere is a list of the system-defined and user-defined properties for a model template. Users can set these properties when they import a model.
Property Name Description
Name Identifies the name of the property. This is a required field.
Description Specifies user-defined information about the property.
Type Specifies a property whose type is String or Date.
Edit Indicates that the property can be modified when importing a model or after the model is imported.
Required Indicates that the property is required.
Initial value Specifies a text string for the initial value for the property.
Display name Specifies a text value that is displayed as the name of the property.
250 Appendix 1 • Model Templates
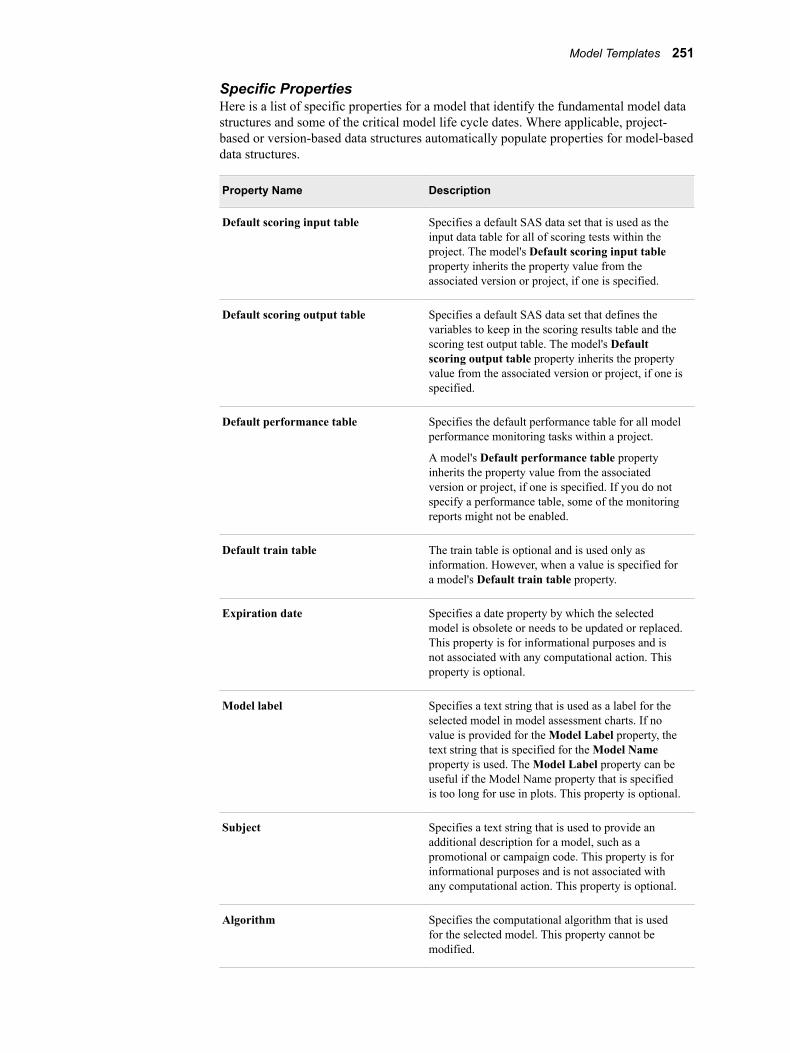
Specific PropertiesHere is a list of specific properties for a model that identify the fundamental model data structures and some of the critical model life cycle dates. Where applicable, project-based or version-based data structures automatically populate properties for model-based data structures.
Property Name Description
Default scoring input table Specifies a default SAS data set that is used as the input data table for all of scoring tests within the project. The model's Default scoring input table property inherits the property value from the associated version or project, if one is specified.
Default scoring output table Specifies a default SAS data set that defines the variables to keep in the scoring results table and the scoring test output table. The model's Default scoring output table property inherits the property value from the associated version or project, if one is specified.
Default performance table Specifies the default performance table for all model performance monitoring tasks within a project.
A model's Default performance table property inherits the property value from the associated version or project, if one is specified. If you do not specify a performance table, some of the monitoring reports might not be enabled.
Default train table The train table is optional and is used only as information. However, when a value is specified for a model's Default train table property.
Expiration date Specifies a date property by which the selected model is obsolete or needs to be updated or replaced. This property is for informational purposes and is not associated with any computational action. This property is optional.
Model label Specifies a text string that is used as a label for the selected model in model assessment charts. If no value is provided for the Model Label property, the text string that is specified for the Model Name property is used. The Model Label property can be useful if the Model Name property that is specified is too long for use in plots. This property is optional.
Subject Specifies a text string that is used to provide an additional description for a model, such as a promotional or campaign code. This property is for informational purposes and is not associated with any computational action. This property is optional.
Algorithm Specifies the computational algorithm that is used for the selected model. This property cannot be modified.
Model Templates 251
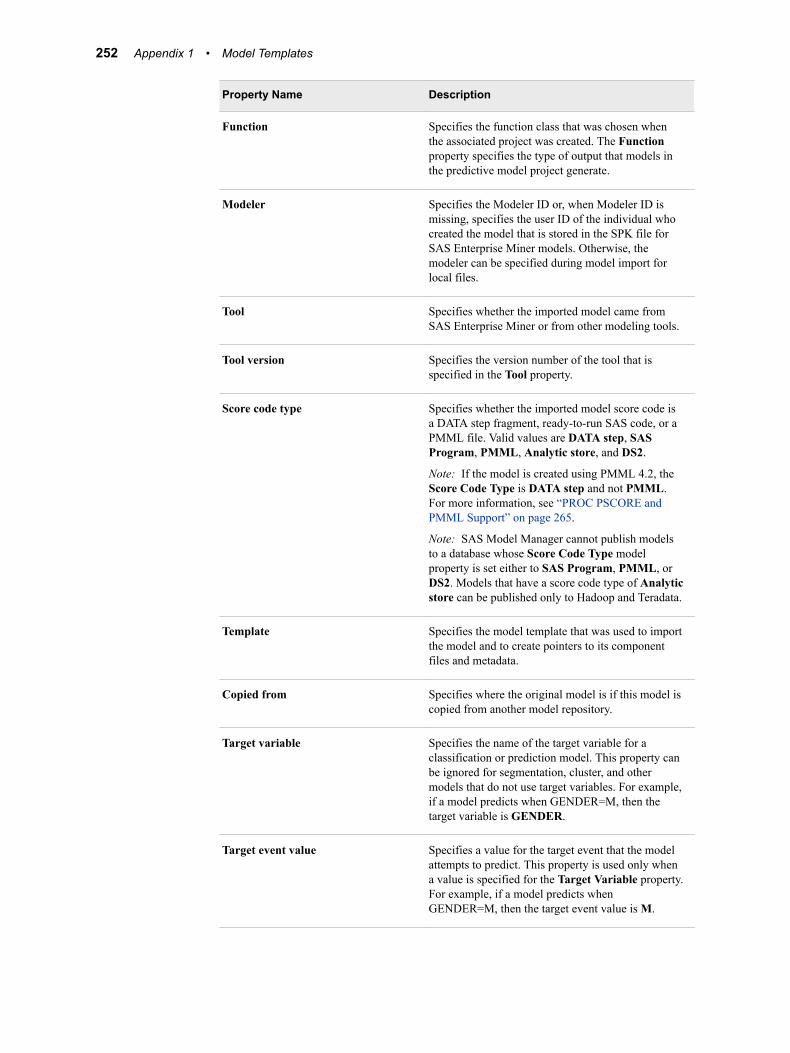
Property Name Description
Function Specifies the function class that was chosen when the associated project was created. The Function property specifies the type of output that models in the predictive model project generate.
Modeler Specifies the Modeler ID or, when Modeler ID is missing, specifies the user ID of the individual who created the model that is stored in the SPK file for SAS Enterprise Miner models. Otherwise, the modeler can be specified during model import for local files.
Tool Specifies whether the imported model came from SAS Enterprise Miner or from other modeling tools.
Tool version Specifies the version number of the tool that is specified in the Tool property.
Score code type Specifies whether the imported model score code is a DATA step fragment, ready-to-run SAS code, or a PMML file. Valid values are DATA step, SAS Program, PMML, Analytic store, and DS2.
Note: If the model is created using PMML 4.2, the Score Code Type is DATA step and not PMML. For more information, see “PROC PSCORE and PMML Support” on page 265.
Note: SAS Model Manager cannot publish models to a database whose Score Code Type model property is set either to SAS Program, PMML, or DS2. Models that have a score code type of Analytic store can be published only to Hadoop and Teradata.
Template Specifies the model template that was used to import the model and to create pointers to its component files and metadata.
Copied from Specifies where the original model is if this model is copied from another model repository.
Target variable Specifies the name of the target variable for a classification or prediction model. This property can be ignored for segmentation, cluster, and other models that do not use target variables. For example, if a model predicts when GENDER=M, then the target variable is GENDER.
Target event value Specifies a value for the target event that the model attempts to predict. This property is used only when a value is specified for the Target Variable property. For example, if a model predicts when GENDER=M, then the target event value is M.
252 Appendix 1 • Model Templates

Appendix 2
Project Tables
Descriptions of Project Tables . . . . . . . . . . . . . . . . . . . . . . . . . . . . . . . . . . . . . . . . . . 253Project Control Tables . . . . . . . . . . . . . . . . . . . . . . . . . . . . . . . . . . . . . . . . . . . . . . 253Project Input Tables . . . . . . . . . . . . . . . . . . . . . . . . . . . . . . . . . . . . . . . . . . . . . . . . 254Project Output Tables . . . . . . . . . . . . . . . . . . . . . . . . . . . . . . . . . . . . . . . . . . . . . . . 254Scoring Input Tables . . . . . . . . . . . . . . . . . . . . . . . . . . . . . . . . . . . . . . . . . . . . . . . . 255Scoring Output Tables . . . . . . . . . . . . . . . . . . . . . . . . . . . . . . . . . . . . . . . . . . . . . . 255Train Tables . . . . . . . . . . . . . . . . . . . . . . . . . . . . . . . . . . . . . . . . . . . . . . . . . . . . . . 256Test Tables . . . . . . . . . . . . . . . . . . . . . . . . . . . . . . . . . . . . . . . . . . . . . . . . . . . . . . . 256Performance Tables . . . . . . . . . . . . . . . . . . . . . . . . . . . . . . . . . . . . . . . . . . . . . . . . 256
Creating Project Input and Output Tables . . . . . . . . . . . . . . . . . . . . . . . . . . . . . . . 257Create a Project Input Table . . . . . . . . . . . . . . . . . . . . . . . . . . . . . . . . . . . . . . . . . . 257Create a Project Output Table . . . . . . . . . . . . . . . . . . . . . . . . . . . . . . . . . . . . . . . . . 258
Creating Scoring Input and Output Tables . . . . . . . . . . . . . . . . . . . . . . . . . . . . . . . 259About Scoring Input and Output Tables . . . . . . . . . . . . . . . . . . . . . . . . . . . . . . . . . 259Create a Scoring Input Table . . . . . . . . . . . . . . . . . . . . . . . . . . . . . . . . . . . . . . . . . 259Create a Scoring Output Table . . . . . . . . . . . . . . . . . . . . . . . . . . . . . . . . . . . . . . . . 260
Creating a Test Table . . . . . . . . . . . . . . . . . . . . . . . . . . . . . . . . . . . . . . . . . . . . . . . . . 260
Creating a Performance Table . . . . . . . . . . . . . . . . . . . . . . . . . . . . . . . . . . . . . . . . . . 260About Performance Tables . . . . . . . . . . . . . . . . . . . . . . . . . . . . . . . . . . . . . . . . . . . 260Naming a Performance Table for Use with the Edit
Performance Definition Wizard . . . . . . . . . . . . . . . . . . . . . . . . . . . . . . . . . . . . . . 261Create a Performance Table . . . . . . . . . . . . . . . . . . . . . . . . . . . . . . . . . . . . . . . . . . 261
Using Tables from a Local or Network Drive . . . . . . . . . . . . . . . . . . . . . . . . . . . . . 262About Using Tables from a Local or Network Drive . . . . . . . . . . . . . . . . . . . . . . . 262Edit Start-Up Code . . . . . . . . . . . . . . . . . . . . . . . . . . . . . . . . . . . . . . . . . . . . . . . . . 263Delete a Libref . . . . . . . . . . . . . . . . . . . . . . . . . . . . . . . . . . . . . . . . . . . . . . . . . . . . 263
Descriptions of Project Tables
Project Control TablesA project control table is a data set that contains the projects, models, and segments that are used to create the structure of the projects within a portfolio. The project control table must at least contain a project variable with the name of project_name. If you want to monitor the performance of the champion models within a portfolio, then the project
253
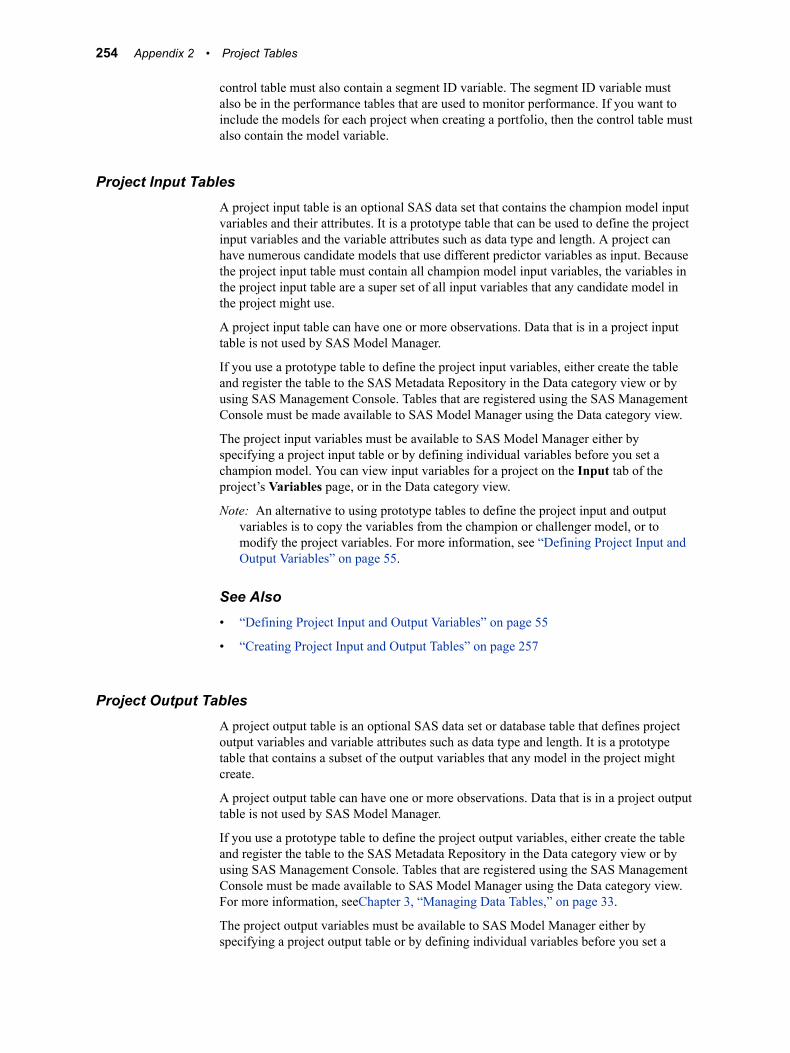
control table must also contain a segment ID variable. The segment ID variable must also be in the performance tables that are used to monitor performance. If you want to include the models for each project when creating a portfolio, then the control table must also contain the model variable.
Project Input TablesA project input table is an optional SAS data set that contains the champion model input variables and their attributes. It is a prototype table that can be used to define the project input variables and the variable attributes such as data type and length. A project can have numerous candidate models that use different predictor variables as input. Because the project input table must contain all champion model input variables, the variables in the project input table are a super set of all input variables that any candidate model in the project might use.
A project input table can have one or more observations. Data that is in a project input table is not used by SAS Model Manager.
If you use a prototype table to define the project input variables, either create the table and register the table to the SAS Metadata Repository in the Data category view or by using SAS Management Console. Tables that are registered using the SAS Management Console must be made available to SAS Model Manager using the Data category view.
The project input variables must be available to SAS Model Manager either by specifying a project input table or by defining individual variables before you set a champion model. You can view input variables for a project on the Input tab of the project’s Variables page, or in the Data category view.
Note: An alternative to using prototype tables to define the project input and output variables is to copy the variables from the champion or challenger model, or to modify the project variables. For more information, see “Defining Project Input and Output Variables” on page 55.
See Also• “Defining Project Input and Output Variables” on page 55
• “Creating Project Input and Output Tables” on page 257
Project Output TablesA project output table is an optional SAS data set or database table that defines project output variables and variable attributes such as data type and length. It is a prototype table that contains a subset of the output variables that any model in the project might create.
A project output table can have one or more observations. Data that is in a project output table is not used by SAS Model Manager.
If you use a prototype table to define the project output variables, either create the table and register the table to the SAS Metadata Repository in the Data category view or by using SAS Management Console. Tables that are registered using the SAS Management Console must be made available to SAS Model Manager using the Data category view. For more information, seeChapter 3, “Managing Data Tables,” on page 33.
The project output variables must be available to SAS Model Manager either by specifying a project output table or by defining individual variables before you set a
254 Appendix 2 • Project Tables

champion model. You can view output variables for a project on the Output tab of the project’s Variables page or in the Data category view.
Note: An alternative to using prototype tables to define the project input and output variables is to copy the variables from the champion or challenger model, or to modify the project variables. For more information, see “Defining Project Input and Output Variables” on page 55.
See Also• “Defining Project Input and Output Variables” on page 55
• “Creating Project Input and Output Tables” on page 257
Scoring Input TablesA scoring input table is a SAS data set that contains the input data that is used in a scoring test.
Before you can create a scoring test, you must create a scoring input table and register it in the SAS Metadata Repository in the Data category view or by using SAS Management Console. Tables that are registered using the SAS Management Console must be made available to SAS Model Manager using the Data category view. In SAS Model Manager, you can view scoring input tables in the Data category view.
See Also“Creating Scoring Input and Output Tables” on page 259
Scoring Output TablesA scoring output table is used by a scoring test to define the variables for the scoring results table.
Depending on the mode in which a scoring test is run, the scoring output table can be a prototype table or a physical data table. A scoring test can run in test mode, which is the default mode, or it can run in production mode. In both test mode and production mode, a scoring test output table is used by the scoring test to define the structure of the scoring results table. When the scoring test runs, it creates a scoring results table. In test mode, the scoring results table is stored in the SAS Model Manager model repository or on a local or network drive. You can view the scoring results table on the Results tab of the Scoring page for a project. The scoring output table in the SAS Metadata Repository or on a local or network drive is not updated in test mode. In production mode, the contents of the scoring output table in the SAS Metadata Repository or the local or network drive are replaced by the contents of the scoring results table. The scoring results table is not stored in the SAS Model Manager model repository or on a local or network drive.
Before you can create a scoring test, the scoring output table must be added and accessible from the Data category view. To add the scoring output table to SAS Model Manager, perform one the following actions:
• Add the table manually by creating the table. Then, register the table in the SAS Metadata Repository in the Data category view or by using SAS Management Console.
• Use the Create a Scoring Output Table feature that is available from the toolbar on the project’s Models page. When you use the Create a Scoring Output Table window, SAS Model Manager creates the table in the library that is specified in the Library
Descriptions of Project Tables 255

box. The table is registered in the SAS Metadata Repository and is available in the Data category view.
You can view scoring output tables in the Data category view.
See Also“Creating Scoring Input and Output Tables” on page 259
Train TablesA train table is used to build predictive models. Whether your predictive models are created using SAS Enterprise Miner or you created SAS code models, you used a train table to build your predictive model. SAS Model Manager uses this same train table. The train table must be registered in the SAS Metadata Repository and accessible to SAS Model Manager in the Data category view.
You specify a train table as a version-level property. When you define the train table at the version level, the table can be used to build all predictive models that are defined on the Models page for a project.
In SAS Model Manager, train tables are used for information purposes only with one exception. SAS Model Manager uses train tables to validate scoring results immediately after you publish a scoring function or model scoring files, and if the Validate scoring results box is selected when you publish scoring functions or model scoring files to a database.
Note: A train table cannot contain an input variable name that starts with an underscore.
For information about registering a train table using the Data category view, see Chapter 3, “Managing Data Tables,” on page 33.
Test TablesA test table is used to create the Dynamic Lift report and the Interval Target Variable report that can be used to identify the champion model. Test tables are typically a subset of a train table, and they are identical in table structure to the corresponding train table. Update test tables by creating a new subset of the corresponding train table.
To view test tables in SAS Model Manager, the tables must be registered in the SAS Metadata Repository. In SAS Model Manager, you can view test tables in the Data category view.
After a test table is added to SAS Model Manager, you can specify the table in the Default test table field in the project properties.
For information about registering test tables using the Data category view, see Chapter 3, “Managing Data Tables,” on page 33.
See Also“Creating a Test Table” on page 260
Performance TablesA performance table is a SAS data set that is used as the input table for each SAS Model Manager performance definition. A performance definition is used to monitor a champion model's performance by comparing the observed target variable values with the predicted target variable values. A performance table is a sampling of operational
256 Appendix 2 • Project Tables

data that is taken at a single point in time. Each time you run a performance definition, you use a new performance table to take a new sampling of the operational data. For example, a champion model is deployed to a production environment for the first time in March 2013. You might want to take a new sampling of the operational data in June 2013, September 2013, and January 2014. These new tables are performance tables in the context of SAS Model Manager.
To view a performance table in SAS Model Manager, you must register the tables in the SAS Metadata Repository using the Data category view or by using SAS Management Console. You can view performance tables in the Data category view. After a performance table is registered, you can specify the table in the Default performance table field in the project properties. The default performance table value at the project level is the default value for the Performance data source field in the Edit Performance Definition wizard.
Note: If you run SAS Model Manager report macros outside of SAS Model Manager to monitor a champion model's performance, the macros cannot access the performance tables in SAS Model Manager to create model performance monitoring reports.
See Also“Creating a Performance Table” on page 260
See Also“Remove a Table” on page 40
Creating Project Input and Output Tables
Create a Project Input TableYou can create a project input table either from the train table that you used to develop your model, or you can define the project variables in a DATA step. The project input table must include the input variables that are used by the champion model. Therefore, if you have several candidate models for your project, make sure that all candidate model input variables are included in the project input table. If you create the project input table from the train table, be sure to exclude the target variable from the project input table.
Here is one method that you can use to create the project input table from the train table. Use the SET statement to specify the train table and the DROP or KEEP statements to specify the variables from the train table that you want in the project input table. You can drop the target variable or keep all variables except the target variable.
This DATA step creates the project input table from the train table and drops the target variable Bad:
data hmeqtabl.invars; set hmeqtabl.training (obs=1); drop bad;run;
This DATA step creates the project input table from the train table and keeps all variables except for the target variable Bad:
data hmeqtabl.invars; set hmeqtabl.training (obs=1);
Creating Project Input and Output Tables 257

keep mortdue reason delinq debinc yoj value ninq job clno derog clag loan;run;
You can also create the project input table using the LENGTH statement to specify the variables and their type and length. You could also specify the LABEL, FORMAT, or INFORMAT statements, or the ATTRIB statement to specify additional variable attributes. The following DATA step uses the LENGTH statement to specify the project input variables in the table:
data hmeqtabl.invars; length mortdue 8 reason $7 delinq 8 debinc 8 yoj 8 value 8 ninq 8 job $7 clno 8 derog 8 clag 8 loan 8;run;
If you find that you need to modify the project input variables after you have created a project input table, you can use the project’s Variables page to modify the project variables. For more information, see “Defining Project Input and Output Variables” on page 55.
See Also• SAS 9.4 Statements: Reference
• SAS 9.4 Language Reference: Concepts
Create a Project Output TableYou can create a project output table either from the train table that you used to develop your model, or you can define the project variables in a DATA step. The project output table includes only output variables that are created or modified by the champion model. Therefore, if you have several candidate models for your project, you must make sure that all project output variables are mapped to the champion model output variables.
To create the project output table using the training table, use the SET statement to specify the training table, and use the KEEP statement to specify the variables from the training table that you want in the project output table. The following DATA step creates the project output table Hmeqtabl.Outvars:
data hmeqtabl.outvars; set hmeqtabl.training (obs=1); %include "c:\temp\score.sas"; keep score;run;
The following DATA step creates the same project output table using the LENGTH statement to specify the output variable and its type and variable length:
data hmeqtabl.outvars; length score 8;run;
If you find that you need to modify the project output variables after you have created a project output table, you can use the project’s Variables page to modify the project variables. For more information, see “Defining Project Input and Output Variables” on page 55.
258 Appendix 2 • Project Tables

Creating Scoring Input and Output Tables
About Scoring Input and Output TablesThe scoring input table is a data table whose input is used by the scoring test to score a single model. The scoring input table must contain the variables and input data for the variables that the model requires. Typically, a scoring table is identical to its corresponding train table except that the target variables in the train table are not included in the scoring table.
A scoring output table contains the data that is produced when you execute a scoring test. You can provide a scoring output table or you can create a scoring output table definition in SAS Model Manager. When a scoring test is executed, SAS Model Manager uses the scoring output table definition to create the scoring output table. The name of the scoring output table definition is used as the name of the scoring output table.
You can create a scoring output table definition by using the Create a Scoring Output Table function on the Models page. In the Create a Scoring Output Table window, you select variables from a scoring input table as well as variables from the model’s output. The variables in the Input Variables table are variables from the scoring input table if one is specified for the Default scoring input table property for a project or model property. Otherwise, the Input Variables table is empty. The Output Variables that appear in the window are model output variables. You use the variables from both tables to create the scoring output table.
SAS Model Manager saves the table definition as metadata in the SAS Metadata Repository. The location of the metadata is defined by the SAS library that you specify when you create the output table definition. After SAS Model Manager creates the table definition, the table can be selected as the output table for subsequent scoring tests.
A SAS Model Manager scoring test can run in test mode, which is the default mode, or it can run in production mode. When the test runs, it populates a scoring output table. In test mode, the scoring output table is stored in the SAS Model Manager model repository. You view the table under the scoring test on the project’s Scoring page. In production mode, if the scoring output table is a table that you provided, that table is updated. If you created a scoring test output definition, the scoring output table is located in the designated SAS library that you specified when you created the table definition in the Create a Scoring Output Table window. The production scoring output table is not stored in the SAS Model Manager repository.
Create a Scoring Input TableThis DATA step creates a scoring test input table from customer data, keeping 500 rows from the train table:
data hmeqtabl.scorein; set hmeqtabl.customer (obs=500); keep mortdue reason delinq debinc yoj value ninq job clno derog clage loan;run;
Creating Scoring Input and Output Tables 259
Create a Scoring Output TableYou can create a scoring output table using the Create a Scoring Output Table window that you open from the project’s Models page. The Create a Scoring Output Table window enables you to select the variables that you want to include in your scoring output table. If the library that you select in the Create a Scoring Output Table window is a folder in the SAS Metadata Repository, SAS Model Manager registers the table in the repository. You can view the table in the Data category view of SAS Model Manager. For information, see “Create Scoring Output Tables” on page 116.
You can also create a scoring output table using a DATA step to keep or drop variables from the train table.
The input variables that you might want to keep in the output data set are key variables for the table. Key variables contain unique information that distinguishes one row from another. An example would be a customer ID number.
This DATA step keeps the input variable CLNO, the client number, which is the key variable, and the output variable SCORE:
data hmeqtabl.scoreout; length clno 8 score 8;run;
Creating a Test TableThe test table is used during model validation by the Dynamic Lift report. You can create a test table by taking a sampling of rows from the original train table, updated train table, or any model validation table that is set aside at model training time. This DATA step randomly selects approximately 25% of the train table to create the test table:
data hmeqtabl.test; set hmeqtabl.train; if ranuni(1234) < 0.25;run;
See Also“Create a Dynamic Lift Report” on page 131
Creating a Performance Table
About Performance TablesHere are the requirements for a performance table:
• the input variables that you want reported in a Characteristic report
• if you have score code:
• all input variables that are used by the champion model or challenger models
• all output variables that are used by the champion model or challenger models
260 Appendix 2 • Project Tables
• if you have no score code:
• the actual value of the dependent variable and the predicted score variable
• all output variables that you want reported in a Stability Report
You create a performance table by taking a sampling of data from an operational data mart. Make sure that your sampling of data includes the target or response variables. The data that you sample must be prepared by using your extract, transform, and load business processes. When this step is complete, you can then use that data to create your performance table.
As part of the planning phase, you can determine how often you want to sample operational data to monitor the champion model performance. Ensure that the operational data that you sample and prepare represents the period that you want to monitor. For example, to monitor a model that determines whether a home equity loan could be bad, you might want to monitor the model every six months. To do this, you would have two performance tables a year. The first table might represent the data from January through June, and the second table might represent the data from July through December.
Here is another example. You might want to monitor the performance of a champion model that predicts the delinquency of credit card holders. In this case, you might want to monitor the champion model more frequently, possibly monthly. You would need to prepare a performance table for each month in order to monitor this champion model.
In addition to planning how often you sample the operational data, you can also plan how much data to sample and how to sample the data. Examples in this section show you two methods of sampling data and naming the performance tables. You can examine the sampling methods to determine which might be best for your organization.
Naming a Performance Table for Use with the Edit Performance Definition Wizard
The Edit Performance Definition wizard is a graphical interface to assist you in creating a performance definition to monitor the champion model performance. When you run the Edit Performance Definition wizard, you specify a performance table that has been registered to the SAS Metadata Repository. When you create a performance table, you can collect and name the performance table using a method that is most suitable for your business process.
See Also“Overview of Performance Monitoring” on page 165
Create a Performance TableYou can use the following DATA steps as examples to create your performance tables.
This DATA step creates a performance table using 5,000 sequential observations from the operational data:
data hmeqtabl.perform; set hmeqop.JulDec (firstobs=12001 obs=17000);run;
This DATA step creates a performance table from operational data for the past six months of the year. The IF statement creates a random sampling of approximately 10% of the operational data:
Creating a Performance Table 261

data hmeqtabl.perform; set hmeqop.JulDec; if ranuni(1234) < 0.1;run;
Using Tables from a Local or Network Drive
About Using Tables from a Local or Network DriveIf you have migrated or upgraded from a previous release of SAS Model Manager, the start-up code that enabled you to use tables from the local SAS Workspace Server or network drive is still available. In SAS Model Manager 14.2, you can no longer define a libref to use tables on a local or network drive. Also, in SAS Model Manager 14.2, tables must be registered in the SAS Metadata Repository and accessible in the Data category view. If the libref was defined before you migrated or upgraded, you can use the local or network tables to complete these SAS Model Manager tasks:
• Create a project
• Create projects from a control table
• Specify project input and output variables
• Create a scoring test
• Create a model retrain definition
• Create reports
• Create a performance definition
The start-up code that was migrated can be viewed using the Edit Start-up Code window. You can access this window from the Actions menu on the toolbar in the Projects and Portfolios category views.
Here is an example LIBNAME statement:
libname SalesLib 's:\sales\2013\october';
262 Appendix 2 • Project Tables

Edit Start-Up CodeTo edit the start-up code:
1. Select Actions ð Edit Start-up Code. The Edit Start-up Code window appears.
2. Enter the SAS code.
3. Click Run Now.
4. Click the Log tab to see the SAS log.
5. Click OK. The SAS code is saved in the Edit Start-up Code window.
Note: If you save the code without running it by clicking OK, the code automatically runs the next time the middle-tier server starts.
Delete a LibrefTo delete a libref:
1. Select Actions ð Edit Start-up Code
2. Type libname libref clear.
3. Click Run Now.
Using Tables from a Local or Network Drive 263

264 Appendix 2 • Project Tables
Appendix 3
PROC PSCORE and PMML Support
OverviewPMML is an XML markup language that was developed to exchange predictive and statistical models between modeling systems and scoring platforms. Users can import the majority of standard-compliant PMML models and score them within a SAS environment via the SAS PSCORE procedure.
PROC PSCORE FunctionalityThe SAS PSCORE procedure generates SAS DATA step score code that is functionally equivalent to the PMML model. The generated score code can be executed on all platforms that are supported by SAS to score the data sets. You can submit the score code in SAS Enterprise Miner via the Program Editor, SAS Enterprise Miner Project code, or within a SAS Enterprise Miner Process Flow Diagram, via the SAS Code node. However, the SAS Enterprise Miner UI environment is not necessary to run the score code.
Supported VersionsPROC PSCORE currently supports the use of PMML 4.2. Earlier versions of PMML are not supported for use with PROC PSCORE.
Supported PMML ModelsPROC PSCORE supports the following types of PMML models:
• Regression
• Trees
• Neural Networks
• Clustering models
• Scorecard
• Vector Machine
• Naïve Bayes
• Baseline models
The following models are supported on an experimental basis:
• Time Series
265

• General Regression
Requirements for PROC PSCOREIn order to use PROC PSCORE, you must have SAS 9 or later, a well formed PMML modeling file, and Write access to the output directory for the DATA step score file. A SAS Enterprise Miner license is not necessary to run PROC PSCORE.
PROC PSCORE UsagePROC PSCORE PMML FILE = “<full-pathname-of-PMML-file>" DS FILE = "<full-pathname-of-output-DS-file>"
PROC PSCORE Example/*Run the PSCORE procedure on a generated PMML file*/
PROC PSCORE PMML FILE = "C:\temp\heart_pmml1.xml" DS FILE = "C:\temp\ds_heart_score.sas"; run;
266 Appendix 3 • PROC PSCORE and PMML Support
Appendix 4
R Model Support
Overview of Using R Models with SAS Model Manager . . . . . . . . . . . . . . . . . . . . 267
Preparing R Model Files to Use with SAS/IML . . . . . . . . . . . . . . . . . . . . . . . . . . . . 268Build an R Model . . . . . . . . . . . . . . . . . . . . . . . . . . . . . . . . . . . . . . . . . . . . . . . . . . 268Prepare an R Model Template File . . . . . . . . . . . . . . . . . . . . . . . . . . . . . . . . . . . . . 269Prepare R Model Component Files . . . . . . . . . . . . . . . . . . . . . . . . . . . . . . . . . . . . . 270
Overview of Using R Models with SAS Model Manager
R is a freely available language and environment for statistical computing and graphics. Using the open architecture of SAS Model Manager, you can register and import R models. SAS Model Manager requires a model template file and model component files that are created specifically for R models.
The following SAS components are required to use R models in SAS Model Manager:
• Ensure that the installed R language version is 2.13.0 or later.
• SAS/IML. You must license SAS/IML because the IML procedure is required to export SAS data sets to R and to submit R code.
• The RLANG system option. You must set this system option.
• The R language and SAS/IML must be installed on the same machine where the SAS Model Manager server is installed.
SAS Model Manager supplies three R model templates that you can use, or you can create your own template as well. The R model templates that are provided by SAS Model Manager support the analytic, classification, and prediction model functions. The segmentation model function is not supported for R models.
After the model component files are registered, you can perform all SAS Model Manager functions except for exporting an R model to the SAS Metadata Repository.
To use R models in SAS Model Manager, do the following tasks:
1. Ensure that the RLANG system option is set. To have the RLANG system option set when SAS starts, have your site administrator add the RLANG system option to the SAS configuration file.
2. Build an R model. For more information, see “Build an R Model” on page 268.
267
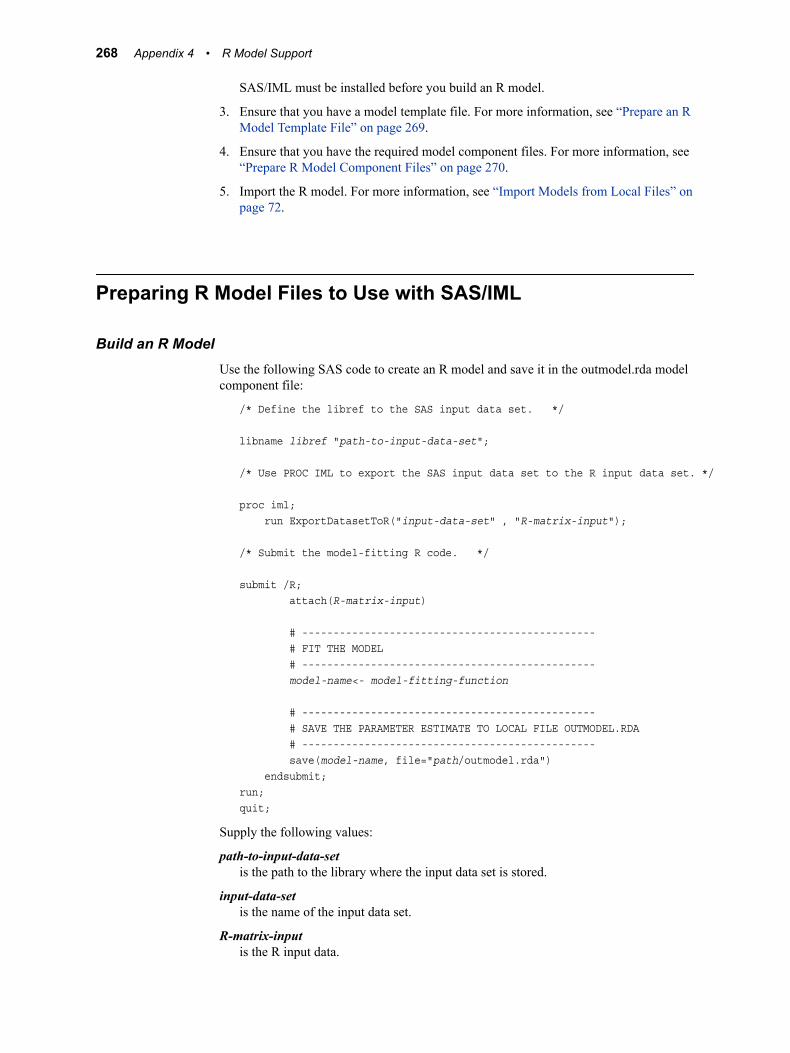
SAS/IML must be installed before you build an R model.
3. Ensure that you have a model template file. For more information, see “Prepare an R Model Template File” on page 269.
4. Ensure that you have the required model component files. For more information, see “Prepare R Model Component Files” on page 270.
5. Import the R model. For more information, see “Import Models from Local Files” on page 72.
Preparing R Model Files to Use with SAS/IML
Build an R ModelUse the following SAS code to create an R model and save it in the outmodel.rda model component file:
/* Define the libref to the SAS input data set. */
libname libref "path-to-input-data-set";
/* Use PROC IML to export the SAS input data set to the R input data set. */
proc iml; run ExportDatasetToR("input-data-set" , "R-matrix-input"); /* Submit the model-fitting R code. */
submit /R; attach(R-matrix-input)
# ----------------------------------------------- # FIT THE MODEL # ----------------------------------------------- model-name<- model-fitting-function
# ----------------------------------------------- # SAVE THE PARAMETER ESTIMATE TO LOCAL FILE OUTMODEL.RDA # ----------------------------------------------- save(model-name, file="path/outmodel.rda") endsubmit;run;quit;
Supply the following values:
path-to-input-data-setis the path to the library where the input data set is stored.
input-data-setis the name of the input data set.
R-matrix-inputis the R input data.
268 Appendix 4 • R Model Support
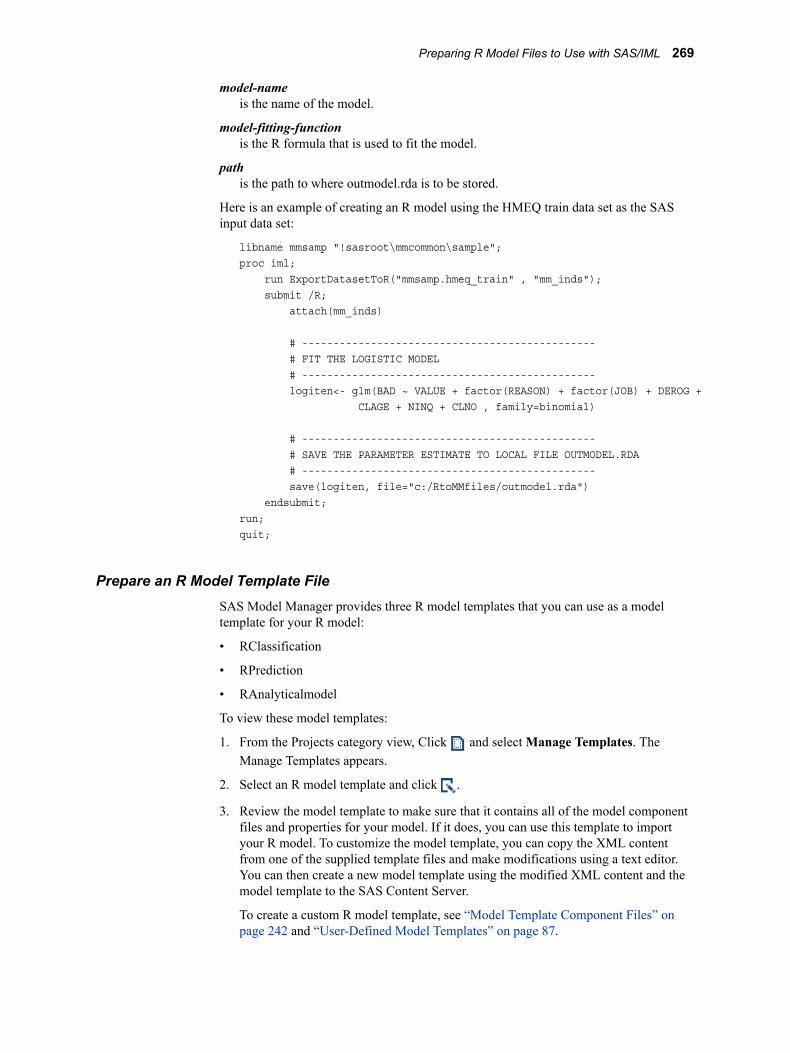
model-nameis the name of the model.
model-fitting-functionis the R formula that is used to fit the model.
pathis the path to where outmodel.rda is to be stored.
Here is an example of creating an R model using the HMEQ train data set as the SAS input data set:
libname mmsamp "!sasroot\mmcommon\sample";proc iml; run ExportDatasetToR("mmsamp.hmeq_train" , "mm_inds"); submit /R; attach(mm_inds)
# ----------------------------------------------- # FIT THE LOGISTIC MODEL # ----------------------------------------------- logiten<- glm(BAD ~ VALUE + factor(REASON) + factor(JOB) + DEROG + CLAGE + NINQ + CLNO , family=binomial)
# ----------------------------------------------- # SAVE THE PARAMETER ESTIMATE TO LOCAL FILE OUTMODEL.RDA # ----------------------------------------------- save(logiten, file="c:/RtoMMfiles/outmodel.rda") endsubmit;run;quit;
Prepare an R Model Template FileSAS Model Manager provides three R model templates that you can use as a model template for your R model:
• RClassification
• RPrediction
• RAnalyticalmodel
To view these model templates:
1. From the Projects category view, Click and select Manage Templates. The Manage Templates appears.
2. Select an R model template and click .
3. Review the model template to make sure that it contains all of the model component files and properties for your model. If it does, you can use this template to import your R model. To customize the model template, you can copy the XML content from one of the supplied template files and make modifications using a text editor. You can then create a new model template using the modified XML content and the model template to the SAS Content Server.
To create a custom R model template, see “Model Template Component Files” on page 242 and “User-Defined Model Templates” on page 87.
Preparing R Model Files to Use with SAS/IML 269
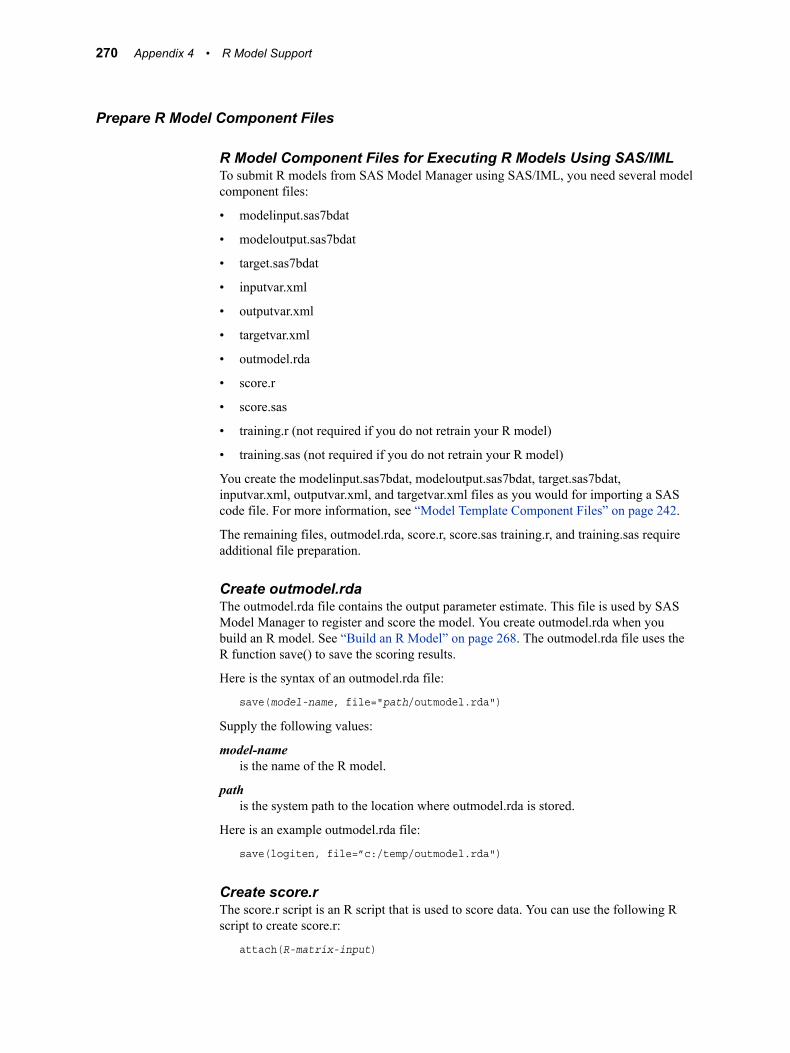
Prepare R Model Component Files
R Model Component Files for Executing R Models Using SAS/IMLTo submit R models from SAS Model Manager using SAS/IML, you need several model component files:
• modelinput.sas7bdat
• modeloutput.sas7bdat
• target.sas7bdat
• inputvar.xml
• outputvar.xml
• targetvar.xml
• outmodel.rda
• score.r
• score.sas
• training.r (not required if you do not retrain your R model)
• training.sas (not required if you do not retrain your R model)
You create the modelinput.sas7bdat, modeloutput.sas7bdat, target.sas7bdat, inputvar.xml, outputvar.xml, and targetvar.xml files as you would for importing a SAS code file. For more information, see “Model Template Component Files” on page 242.
The remaining files, outmodel.rda, score.r, score.sas training.r, and training.sas require additional file preparation.
Create outmodel.rdaThe outmodel.rda file contains the output parameter estimate. This file is used by SAS Model Manager to register and score the model. You create outmodel.rda when you build an R model. See “Build an R Model” on page 268. The outmodel.rda file uses the R function save() to save the scoring results.
Here is the syntax of an outmodel.rda file:
save(model-name, file="path/outmodel.rda")
Supply the following values:
model-nameis the name of the R model.
pathis the system path to the location where outmodel.rda is stored.
Here is an example outmodel.rda file:
save(logiten, file=”c:/temp/outmodel.rda")
Create score.rThe score.r script is an R script that is used to score data. You can use the following R script to create score.r:
attach(R-matrix-input)
270 Appendix 4 • R Model Support

# -----------------------------------------------# LOAD THE OUTPUT PARAMETER ESTIMATE FROM FILE OUTMODEL.RDA # -----------------------------------------------load('&_mm_scorefilesfolder/outmodel.rda')
# -----------------------------------------------# SCORE THE MODEL# -----------------------------------------------score<- predict(model-name, type="response", newdata=R-matrix-input)
# -----------------------------------------------# MERGING PREDICTED VALUE WITH MODEL INPUT VARIABLES# -----------------------------------------------mm_outds <- cbind(R-matrix-input, score)
Supply the following values:
R-matrix-inputis the name of the input R matrix file that you specified in the ExportDatasetToR function in the IML procedure. See “Build an R Model” on page 268.
scoreis the output variable. The value for score must match the output variable that is defined in modeloutput.sas7bdat and outputvar.xml.
model-nameis the name of the R model. The value of model-name must match the R save function model-name argument that is specified in the outmodel.rda file.
Here is an example score.r file:
attach(mm_inds)
# -----------------------------------------------# LOAD THE OUTPUT PARAMETER ESTIMATE FROM FILE OUTMODEL.RDA # -----------------------------------------------load('&_mm_scorefilesfolder/outmodel.rda')
# -----------------------------------------------# PREDICT# -----------------------------------------------score<- predict(logiten, type="response", newdata=mm_inds)
# -----------------------------------------------# MERGE THE PREDICTED VALUE WITH MODEL INPUT VARIABLES# -----------------------------------------------mm_outds <- cbind(mm_inds, score)
Create score.sasThe score.sas program defines the score test information in a data set and calls the %mmbatch macro. When you submit the %mmbatch macro, the task mm_r_model_train_main completes the following tasks:
• transforms a scoring data set to an R data frame
• generates and submits R code for scoring
• transforms the scored output to a SAS data set for reporting in SAS Model Manager
Here is the score.sas program:
Preparing R Model Files to Use with SAS/IML 271
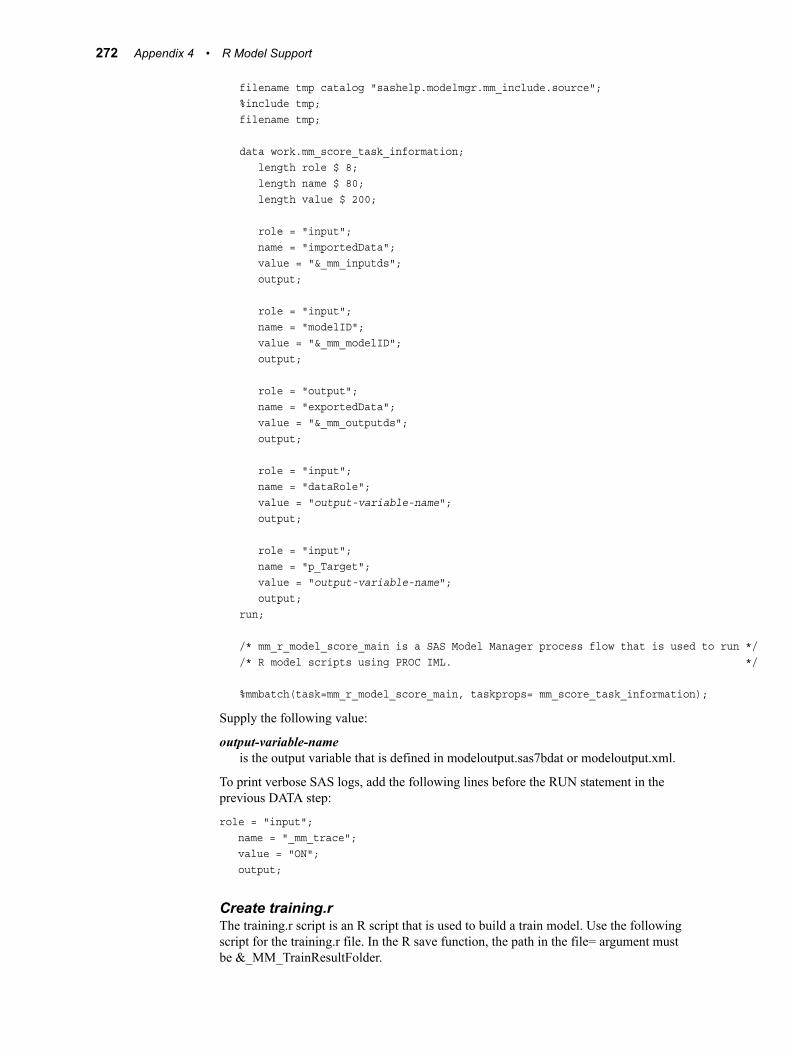
filename tmp catalog "sashelp.modelmgr.mm_include.source";%include tmp;filename tmp;
data work.mm_score_task_information; length role $ 8; length name $ 80; length value $ 200;
role = "input"; name = "importedData"; value = "&_mm_inputds"; output;
role = "input"; name = "modelID"; value = "&_mm_modelID"; output;
role = "output"; name = "exportedData"; value = "&_mm_outputds"; output;
role = "input"; name = "dataRole"; value = "output-variable-name"; output;
role = "input"; name = "p_Target"; value = "output-variable-name"; output;run;
/* mm_r_model_score_main is a SAS Model Manager process flow that is used to run *//* R model scripts using PROC IML. */
%mmbatch(task=mm_r_model_score_main, taskprops= mm_score_task_information);
Supply the following value:
output-variable-nameis the output variable that is defined in modeloutput.sas7bdat or modeloutput.xml.
To print verbose SAS logs, add the following lines before the RUN statement in the previous DATA step:
role = "input"; name = "_mm_trace"; value = "ON"; output;
Create training.rThe training.r script is an R script that is used to build a train model. Use the following script for the training.r file. In the R save function, the path in the file= argument must be &_MM_TrainResultFolder.
272 Appendix 4 • R Model Support

You can use the following script to create training.r:
attach(R-matrix-input)
# -----------------------------------------------# FIT THE LOGISTIC MODEL # -----------------------------------------------model-name<- model-fitting-function
# -----------------------------------------------# SAVE THE OUTPUT PARAMETER ESTIMATE TO LOCAL FILE OUTMODEL.RDA # -----------------------------------------------save(model-name, file="&_MM_TrainResultFolder/outmodel.rda")
Supply the following values:
R-matrix-inputis the name of the R matrix that is specified in the ExportMatrixToR function that is used to build a model using the IML procedure.
model-nameis the name of the R model.
model-fitting-functionis an R model fitting function, such as lm() or glm().
Here is an example training.r R script to build the HMEQ R train model:
attach(mm_inds)
# -----------------------------------------------# FIT THE LOGISTIC MODEL # -----------------------------------------------logiten<- glm(BAD ~ VALUE + factor(REASON) + factor(JOB) + DEROG + CLAGE + NINQ + CLNO , family=binomial)
# -----------------------------------------------# SAVE THE OUTPUT PARAMETER ESTIMATE TO LOCAL FILE OUTMODEL.RDA # -----------------------------------------------save(logiten, file="&_MM_TrainResultFolder/outmodel.rda")
Create training.sasIf you do not need to retrain your R model in SAS Model Manager, you do not need this file.
The training.sas program defines the train task information in a data set and calls the %mmbatch macro. When you submit the %mmbatch macro, the task mm_r_model_train_main completes the following tasks:
• transforms a training data set to an R data frame
• generates and submits R code for training
• registers the training output parameter estimate file in SAS Model Manager
Here is the training.sas file:
filename tmp catalog "sashelp.modelmgr.mm_include.source";%include tmp;filename tmp;
data work.mm_train_task_information;
Preparing R Model Files to Use with SAS/IML 273
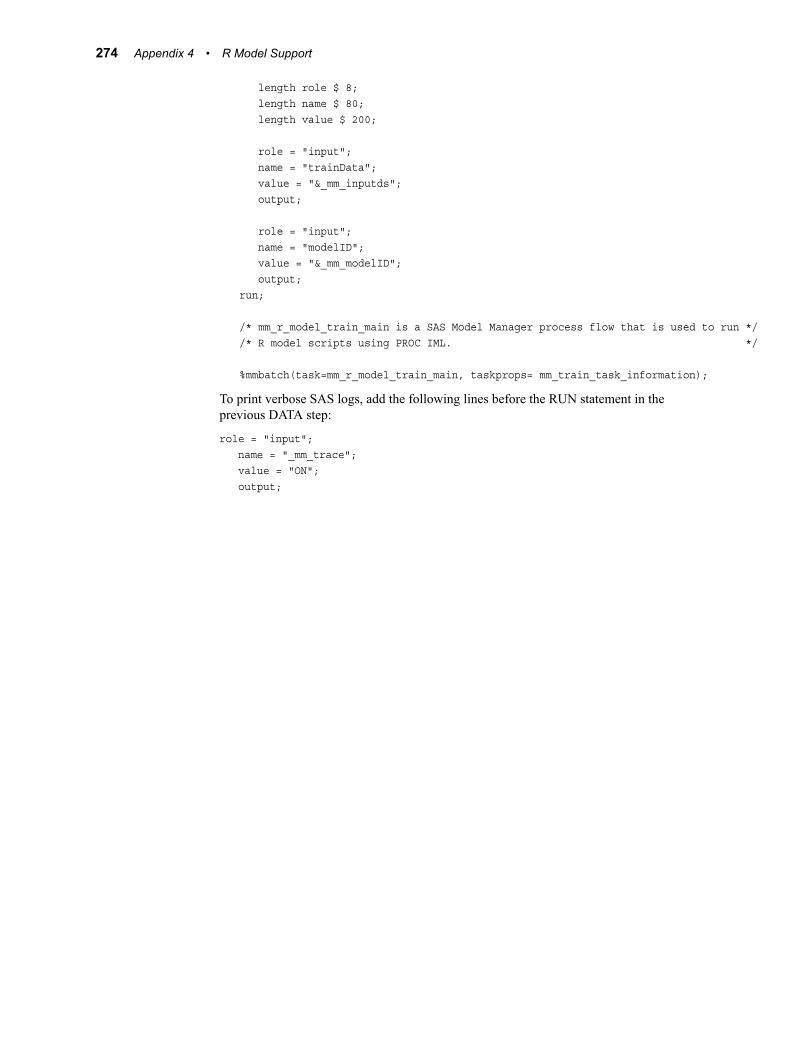
length role $ 8; length name $ 80; length value $ 200;
role = "input"; name = "trainData"; value = "&_mm_inputds"; output;
role = "input"; name = "modelID"; value = "&_mm_modelID"; output;run;
/* mm_r_model_train_main is a SAS Model Manager process flow that is used to run *//* R model scripts using PROC IML. */
%mmbatch(task=mm_r_model_train_main, taskprops= mm_train_task_information);
To print verbose SAS logs, add the following lines before the RUN statement in the previous DATA step:
role = "input"; name = "_mm_trace"; value = "ON"; output;
274 Appendix 4 • R Model Support

Appendix 5
Statistical Measures Used in Basel III Reports
Overview of Statistical Measures Used for Basel III ReportsSAS Model Manager Basel III reports use several statistical measures to validate the stability, performance, and calibration for the two key types of Basel III risk models: the Probability of Default (PD) model and the Loss Given Default (LGD) model.
The statistical measures for model validation are grouped into three categories:
Category Description
Model Stability Tracks the change in distribution of the modeling data and scoring data.
Model Performance • Measures the ability of a model to discriminate between customers with accounts that have defaulted, and customers with accounts that have not defaulted. The score difference between non-default and default accounts helps determine the required cutoff score. The cutoff score helps predict whether a credit exposure is a default account.
• Measures the relationship between the actual default probability and the predicted default probability. This helps you understand the performance of a model over a time period.
Model Calibration Checks the accuracy of the PD and LGD models by comparing the correct quantification of the risk components with the available standards.
The sections that follow describe the measures, statistics, and tests that are used to create the PD and LGD reports.
Model Stability MeasureThe following table describes the model stability measure that is used to create the PD report and the LGD reports.
275

Measure DescriptionPD Report
LGD Report
System Stability Index (SSI)
SSI monitors the score distribution over a time period.
Yes Yes
Model Performance Measures and StatisticsThe following table describes the model performance measures that are used to create the PD and LGD reports.
Measure DescriptionPD Report
LGD Report
Accuracy Accuracy is the proportion of the total number of predictions that were correct.
Yes No
Accuracy Ratio (AR) AR is the summary index of Cumulative Accuracy Profile (CAP) and is also known as Gini coefficient. It shows the performance of the model that is being evaluated by depicting the percentage of defaulted accounts that are captured by the model across different scores.
Yes Yes
Area Under Curve (AUC)
AUC can be interpreted as the average ability of the rating model to accurately classify non-default accounts and default accounts. It represents the discrimination between the two populations. A higher area denotes higher discrimination. When AUC is 0.5, it means that non-default accounts and default accounts are randomly classified, and when AUC is 1, it means that the scoring model accurately classifies non-default accounts and default accounts. Thus, the AUC ranges between 0.5 and 1.
Yes No
Bayesian Error Rate (BER)
BER is the proportion of the whole sample that is misclassified when the rating system is in optimal use. For a perfect rating model, the BER has a value of zero. A model's BER depends on the probability of default. The lower the BER, and the lower the classification error, the better the model.
Yes No
D Statistic The D Statistic is the mean difference of scores between default accounts and non-default accounts, weighted by the relative distribution of those scores.
Yes No
Error Rate The Error Rate is the proportion of the total number of incorrect predictions.
Yes No
276 Appendix 5 • Statistical Measures Used in Basel III Reports
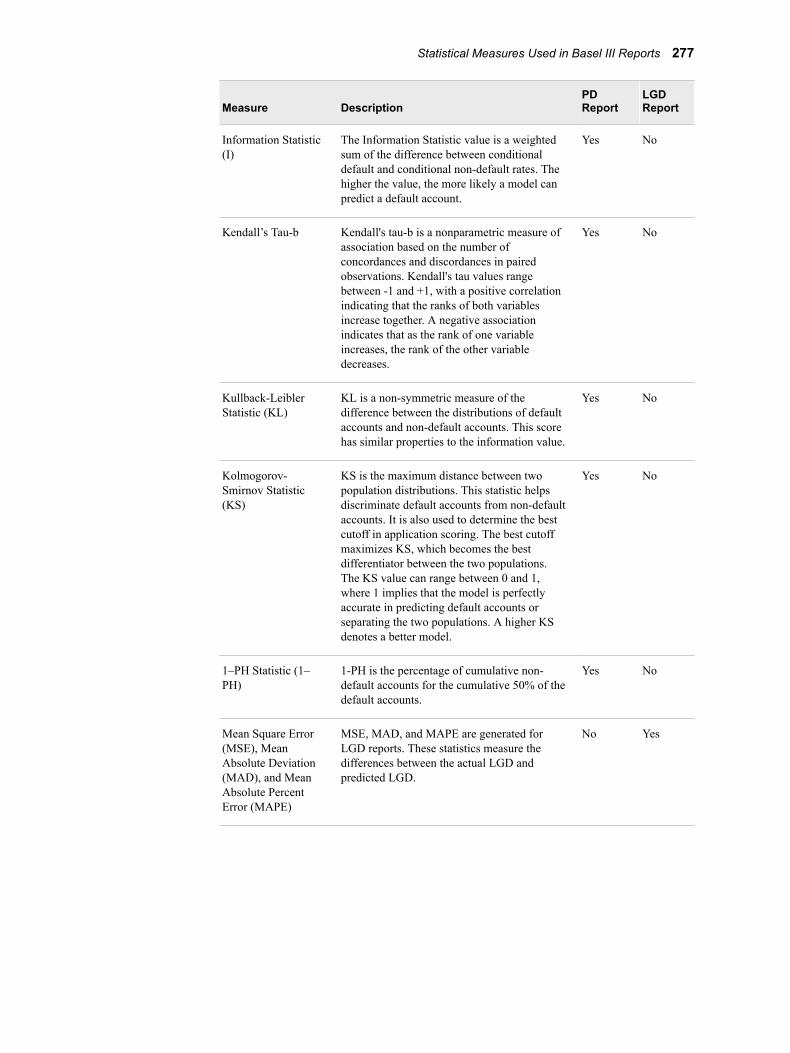
Measure DescriptionPD Report
LGD Report
Information Statistic (I)
The Information Statistic value is a weighted sum of the difference between conditional default and conditional non-default rates. The higher the value, the more likely a model can predict a default account.
Yes No
Kendall’s Tau-b Kendall's tau-b is a nonparametric measure of association based on the number of concordances and discordances in paired observations. Kendall's tau values range between -1 and +1, with a positive correlation indicating that the ranks of both variables increase together. A negative association indicates that as the rank of one variable increases, the rank of the other variable decreases.
Yes No
Kullback-Leibler Statistic (KL)
KL is a non-symmetric measure of the difference between the distributions of default accounts and non-default accounts. This score has similar properties to the information value.
Yes No
Kolmogorov-Smirnov Statistic (KS)
KS is the maximum distance between two population distributions. This statistic helps discriminate default accounts from non-default accounts. It is also used to determine the best cutoff in application scoring. The best cutoff maximizes KS, which becomes the best differentiator between the two populations. The KS value can range between 0 and 1, where 1 implies that the model is perfectly accurate in predicting default accounts or separating the two populations. A higher KS denotes a better model.
Yes No
1–PH Statistic (1–PH)
1-PH is the percentage of cumulative non-default accounts for the cumulative 50% of the default accounts.
Yes No
Mean Square Error (MSE), Mean Absolute Deviation (MAD), and Mean Absolute Percent Error (MAPE)
MSE, MAD, and MAPE are generated for LGD reports. These statistics measure the differences between the actual LGD and predicted LGD.
No Yes
Statistical Measures Used in Basel III Reports 277
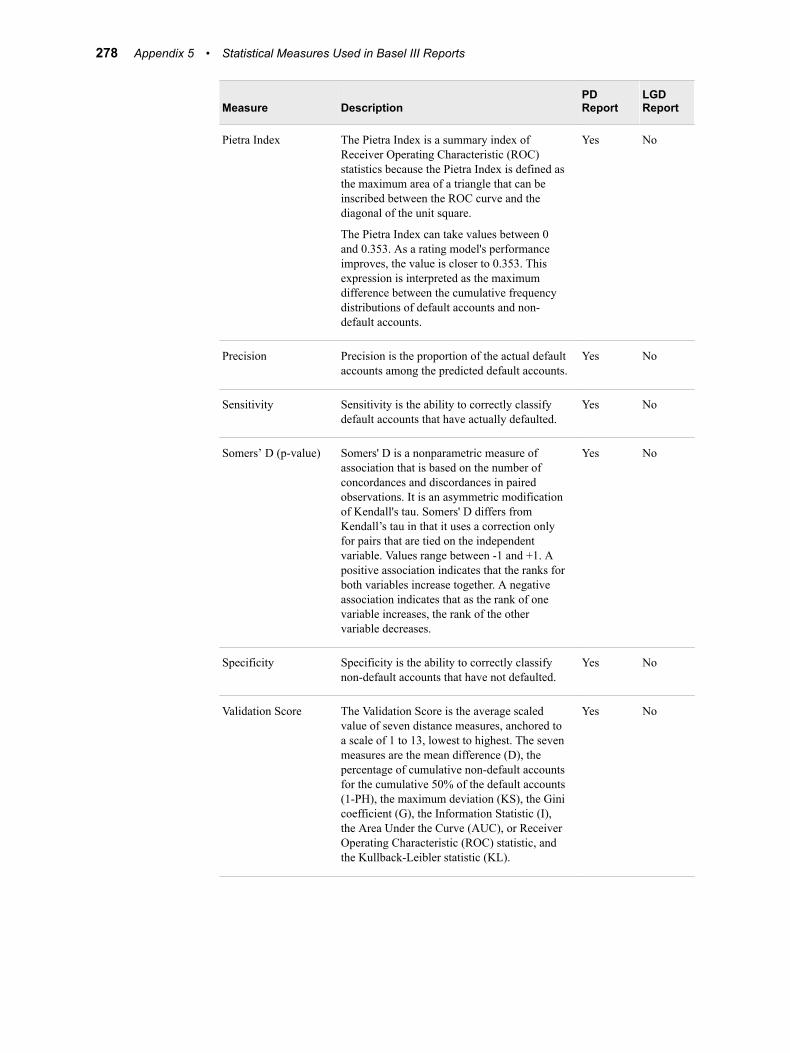
Measure DescriptionPD Report
LGD Report
Pietra Index The Pietra Index is a summary index of Receiver Operating Characteristic (ROC) statistics because the Pietra Index is defined as the maximum area of a triangle that can be inscribed between the ROC curve and the diagonal of the unit square.
The Pietra Index can take values between 0 and 0.353. As a rating model's performance improves, the value is closer to 0.353. This expression is interpreted as the maximum difference between the cumulative frequency distributions of default accounts and non-default accounts.
Yes No
Precision Precision is the proportion of the actual default accounts among the predicted default accounts.
Yes No
Sensitivity Sensitivity is the ability to correctly classify default accounts that have actually defaulted.
Yes No
Somers’ D (p-value) Somers' D is a nonparametric measure of association that is based on the number of concordances and discordances in paired observations. It is an asymmetric modification of Kendall's tau. Somers' D differs from Kendall’s tau in that it uses a correction only for pairs that are tied on the independent variable. Values range between -1 and +1. A positive association indicates that the ranks for both variables increase together. A negative association indicates that as the rank of one variable increases, the rank of the other variable decreases.
Yes No
Specificity Specificity is the ability to correctly classify non-default accounts that have not defaulted.
Yes No
Validation Score The Validation Score is the average scaled value of seven distance measures, anchored to a scale of 1 to 13, lowest to highest. The seven measures are the mean difference (D), the percentage of cumulative non-default accounts for the cumulative 50% of the default accounts (1-PH), the maximum deviation (KS), the Gini coefficient (G), the Information Statistic (I), the Area Under the Curve (AUC), or Receiver Operating Characteristic (ROC) statistic, and the Kullback-Leibler statistic (KL).
Yes No
278 Appendix 5 • Statistical Measures Used in Basel III Reports
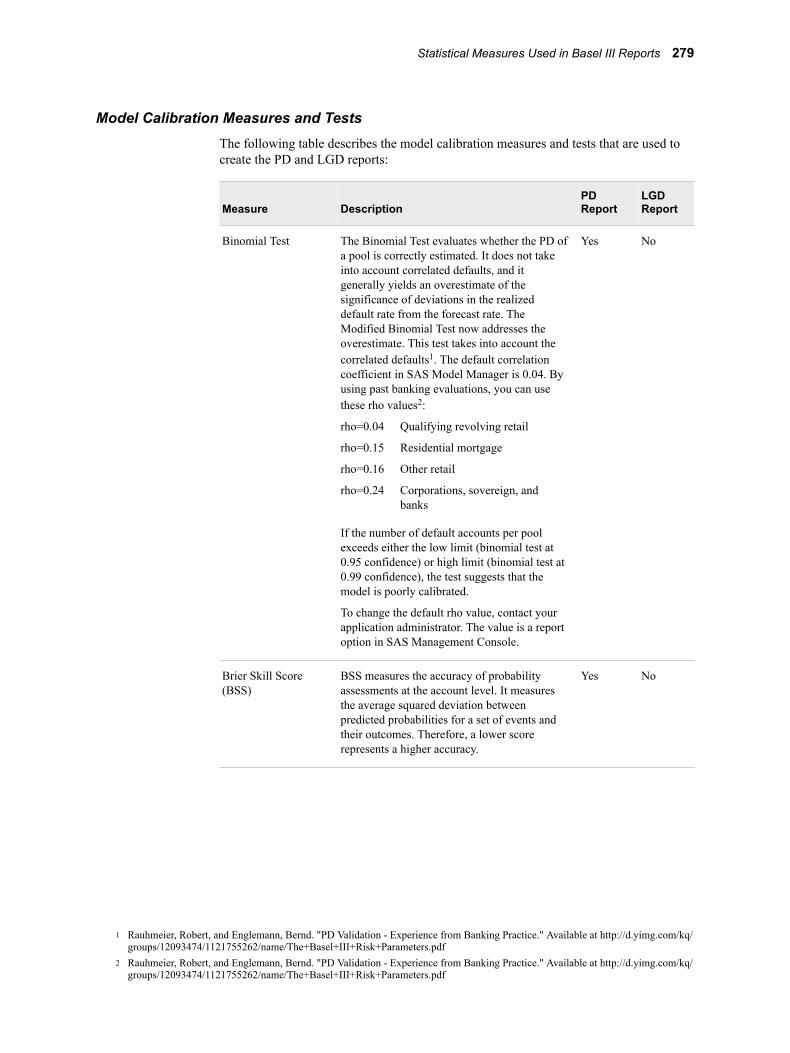
Model Calibration Measures and TestsThe following table describes the model calibration measures and tests that are used to create the PD and LGD reports:
Measure DescriptionPD Report
LGD Report
Binomial Test The Binomial Test evaluates whether the PD of a pool is correctly estimated. It does not take into account correlated defaults, and it generally yields an overestimate of the significance of deviations in the realized default rate from the forecast rate. The Modified Binomial Test now addresses the overestimate. This test takes into account the correlated defaults1. The default correlation coefficient in SAS Model Manager is 0.04. By using past banking evaluations, you can use these rho values2:
rho=0.04 Qualifying revolving retail
rho=0.15 Residential mortgage
rho=0.16 Other retail
rho=0.24 Corporations, sovereign, and banks
If the number of default accounts per pool exceeds either the low limit (binomial test at 0.95 confidence) or high limit (binomial test at 0.99 confidence), the test suggests that the model is poorly calibrated.
To change the default rho value, contact your application administrator. The value is a report option in SAS Management Console.
Yes No
Brier Skill Score (BSS)
BSS measures the accuracy of probability assessments at the account level. It measures the average squared deviation between predicted probabilities for a set of events and their outcomes. Therefore, a lower score represents a higher accuracy.
Yes No
1 Rauhmeier, Robert, and Englemann, Bernd. "PD Validation - Experience from Banking Practice." Available at http://d.yimg.com/kq/groups/12093474/1121755262/name/The+Basel+III+Risk+Parameters.pdf
2 Rauhmeier, Robert, and Englemann, Bernd. "PD Validation - Experience from Banking Practice." Available at http://d.yimg.com/kq/groups/12093474/1121755262/name/The+Basel+III+Risk+Parameters.pdf
Statistical Measures Used in Basel III Reports 279
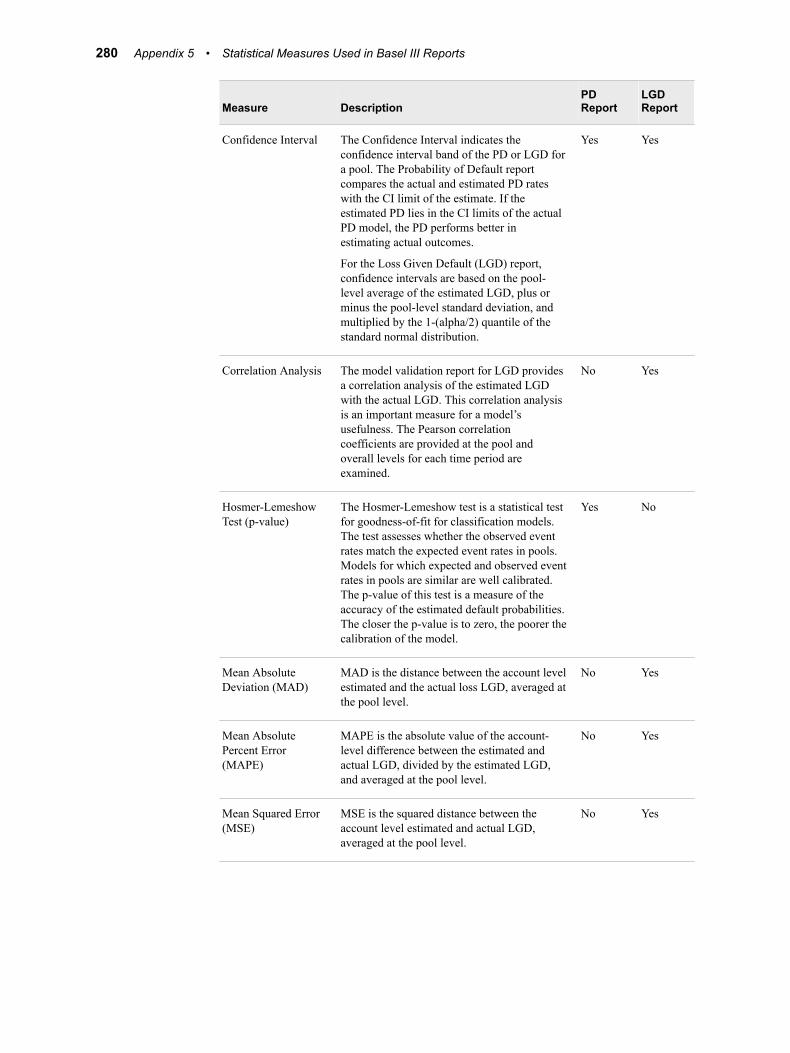
Measure DescriptionPD Report
LGD Report
Confidence Interval The Confidence Interval indicates the confidence interval band of the PD or LGD for a pool. The Probability of Default report compares the actual and estimated PD rates with the CI limit of the estimate. If the estimated PD lies in the CI limits of the actual PD model, the PD performs better in estimating actual outcomes.
For the Loss Given Default (LGD) report, confidence intervals are based on the pool-level average of the estimated LGD, plus or minus the pool-level standard deviation, and multiplied by the 1-(alpha/2) quantile of the standard normal distribution.
Yes Yes
Correlation Analysis The model validation report for LGD provides a correlation analysis of the estimated LGD with the actual LGD. This correlation analysis is an important measure for a model’s usefulness. The Pearson correlation coefficients are provided at the pool and overall levels for each time period are examined.
No Yes
Hosmer-Lemeshow Test (p-value)
The Hosmer-Lemeshow test is a statistical test for goodness-of-fit for classification models. The test assesses whether the observed event rates match the expected event rates in pools. Models for which expected and observed event rates in pools are similar are well calibrated. The p-value of this test is a measure of the accuracy of the estimated default probabilities. The closer the p-value is to zero, the poorer the calibration of the model.
Yes No
Mean Absolute Deviation (MAD)
MAD is the distance between the account level estimated and the actual loss LGD, averaged at the pool level.
No Yes
Mean Absolute Percent Error (MAPE)
MAPE is the absolute value of the account-level difference between the estimated and actual LGD, divided by the estimated LGD, and averaged at the pool level.
No Yes
Mean Squared Error (MSE)
MSE is the squared distance between the account level estimated and actual LGD, averaged at the pool level.
No Yes
280 Appendix 5 • Statistical Measures Used in Basel III Reports

Measure DescriptionPD Report
LGD Report
Normal Test The Normal Test compares the normalized difference of predicted and actual default rates per pool with two limits estimated over multiple observation periods. This test measures the pool stability over time. If a majority of the pools lie in the rejection region, to the right of the limits, then the pooling strategy should be revisited.
Yes No
Observed versus Estimated Index
The observed versus estimated index is a measure of closeness of the observed and estimated default rates. It measures the model's ability to predict default rates. The closer the index is to zero, the better the model performs in predicting default rates.
Yes No
Traffic Lights Test The Traffic Lights Test evaluates whether the PD of a pool is underestimated, but unlike the binomial test, it does not assume that cross-pool performance is statistically independent. If the number of default accounts per pool exceeds either the low limit (Traffic Lights Test at 0.95 confidence) or high limit (Traffic Lights Test at 0.99 confidence), the test suggests the model is poorly calibrated.
Yes No
Statistical Measures Used in Basel III Reports 281

282 Appendix 5 • Statistical Measures Used in Basel III Reports

Recommended Reading
Here is the recommended reading list for this title:
• SAS Model Manager: Administrator’s Guide
• SAS In-Database Products: User’s Guide
• SAS Factory Miner: User’s Guide
For a complete list of SAS publications, go to sas.com/store/books. If you have questions about which titles you need, please contact a SAS Representative:
SAS BooksSAS Campus DriveCary, NC 27513-2414Phone: 1-800-727-0025Fax: 1-919-677-4444Email: [email protected] address: sas.com/store/books
283

284 Recommended Reading

Glossary
analytical modela statistical model that is designed to perform a specific task or to predict the probability of a specific event.
attributeSee variable attribute.
backtestinga procedure for monitoring the quality of behavioral and application scoring models. Backtesting validates the accuracy of the model's predictions.
baselinethe initial performance prediction against which the output data from later tasks is compared.
bina grouping of predictor variable values that is used for frequency analysis.
candidate modela predictive model that evaluates a model's predictive power as compared with the champion model's predictive power.
challenger modela model that is compared and assessed against a champion model for the purpose of replacing the champion model in a production scoring environment.
champion modelthe best predictive model that is chosen from a pool of candidate models in a data mining environment.
characteristic reporta report that detects and quantifies shifts in the distribution of input variables over time in data that is used to create predictive models.
classification modela predictive model that has a categorical, ordinal, or binary target.
285

clustering modela model in which data sets are divided into mutually exclusive groups in such a way that the observations for each group are as close as possible to one another, and different groups are as far as possible from one another.
component filea file that defines a predictive model. Component files can be SAS programs or data sets, XML files, log files, SPK files, or CSV files.
data model trainingthe process of building a predictive model from data.
data objectan object that holds the business data that is required to execute workflow tasks.
data setSee SAS data set.
data source (source)a table, view, or file from which you will extract information. Sources can be in any format that SAS can access, on any supported hardware platform. The metadata for a source is typically an input to a job.
DATA stepin a SAS program, a group of statements that begins with a DATA statement and that ends with either a RUN statement, another DATA statement, a PROC statement, or the end of the job. The DATA step enables you to read raw data or other SAS data sets and to create SAS data sets.
DATA step fragmenta block of SAS code that does not begin with a DATA statement. In SAS Model Manager, all SAS Enterprise Miner models use DATA step fragments in their score code.
delta reporta report that compares the input and output variable attributes for each of the variables that are used to score two candidate models.
dynamic lift reporta graphical report that plots the sequential lift performance of one or more models over time, against test data.
file referenceSee fileref.
fileref (file reference)a name that is temporarily assigned to an external file or to an aggregate storage location such as a directory or a folder. The fileref identifies the file or the storage location to SAS. See also libref.
formatSee SAS format.
Gini coefficienta benchmark statistic that is a measure of the inequality of distribution, and that can be used to summarize the predictive accuracy of a model.
286 Glossary
holdout dataa portion of the historical data that is set aside during model development. Holdout data can be used as test data to benchmark the fit and accuracy of the emerging predictive model.
identitySee metadata identity.
indexSee SAS index.
informatSee SAS informat.
inner joina join between two tables that returns all of the rows in one table that have one or more matching rows in the other table.
input variablea variable that is used in a data mining process to predict the value of one or more target variables.
Kolmogorov-Smirnov charta chart that shows the measurement of the maximum vertical separation, or deviation between the cumulative distributions of events and non-events.
library referenceSee libref.
libref (library reference)a SAS name that is associated with the location of a SAS library. For example, in the name MYLIB.MYFILE, MYLIB is the libref, and MYFILE is a file in the SAS library.
life cycle phasea collection of milestones that complete a major step in the process of selecting and monitoring a champion model. Typical life cycle phases include development, test, production, and retire.
logistic regressiona form of regression analysis in which the target variable (response variable) represents a binary-level, categorical, or ordinal-level response.
macro variable (symbolic variable)a variable that is part of the SAS macro programming language. The value of a macro variable is a string that remains constant until you change it.
metadatadescriptive data about data that is stored and managed in a database, in order to facilitate access to captured and archived data for further use.
metadata identity (identity)a metadata object that represents an individual user or a group of users in a SAS metadata environment. Each individual and group that accesses secured resources on a SAS Metadata Server should have a unique metadata identity within that server.
Glossary 287
milestonea collection of tasks that complete a significant event. The significant event can occur either in the process of selecting a champion model, or in the process of monitoring a champion model that is in a production environment.
model assessmentthe process of determining how well a model predicts an outcome.
model functionthe type of statistical model, such as classification, prediction, or segmentation.
model input variable reportreports the frequencies that input variables are used in the models for an organizational folder, a project, or a version.
model profile reportreports the profile data that is associated with the model input variables, output variables, and target variables.
model scoring (scoring)the process of applying a model to new data in order to compute outputs.
model target variable reporta report that indicates the frequency in which target variables are used in the models that exist in the selected folder.
monitoring reporta report that consists of assessment charts, a ROC chart, a Gini Trend chart, a KS (Kolmogorov-Smirnov) chart, and a KS trend chart that can be used to compare the model performance curves of several candidate models.
neural networkany of a class of models that usually consist of a large number of neurons, interconnected in complex ways and organized into layers. Examples are flexible nonlinear regression models, discriminant models, data reduction models, and nonlinear dynamic systems.
observationa row in a SAS data set. All of the data values in an observation are associated with a single entity such as a customer or a state. Each observation contains either one data value or a missing-value indicator for each variable.
packageSee SAS package.
participanta user, group, or role that is assigned to a task. These users, groups, and roles are defined in SAS metadata and are mapped to standard roles for the workflow.
performance tablea table that contains response data that is collected over a period of time. Performance tables are used to monitor the performance of a champion model that is in production.
PFDSee process flow diagram.
288 Glossary
PMMLSee Predictive Modeling Markup Language.
policya workflow element that associates event-driven logic with a task or subflow. Policies are usually triggered automatically by an event such as a status change or a timer event.
prediction modela model that predicts the outcome of an interval target.
Predictive Modeling Markup Language (PMML)an XML based standard for representing data mining results for scoring purposes. It enables the sharing and deployment of data mining results between applications and across data management systems.
process flow diagram (PFD)a graphical sequence of interconnected symbols that represent an ordered set of steps or tasks that, when combined, form a workflow designed to yield an analytical result.
production models aging reportreports the number and the aging distribution of champion models.
profile datainformation that consists of the model name, type, length, label, format, level, and role.
projecta collection of models, SAS programs, data tables, scoring tests, performance data, and reporting documents.
project treea hierarchical structure made up of folders and nodes that are related to a single folder or node one level above it and to zero, one, or more folders or nodes one level below it.
propertyany of the characteristics of a component that collectively determine the component's appearance and behavior. Examples of types of properties are attributes and methods.
publication channel (SAS publication channel)an information repository that has been established using the SAS Publishing Framework and that can be used to publish information to users and applications. See also publish.
publishto deliver electronic information to one or more destinations. These destinations can include message queues, publication channels, and so on.
Publishing Frameworka component of SAS Integration Technologies that enables both users and applications to publish SAS files (including data sets, catalogs, and database views), and other digital content to a variety of destinations. The Publishing Framework also provides tools that enable both users and applications to receive and process published information.
Glossary 289

receiver operating characteristic (ROC)the name given to a chart used in signal detection theory to plot the sensitivity, or true positive rate, against the false positive rate (1 − specificity, or 1 − true negative rate) of binary data values. An ROC chart is used to assess a model's predictive performance.
ROCSee receiver operating characteristic.
SAS code modela SAS program or a DATA step fragment that computes output values from input values. An example of a SAS code model is the LOGISTIC procedure.
SAS Content Servera server that stores digital content (such as documents, reports, and images) that is created and used by SAS client applications. To interact with the server, clients use WebDAV-based protocols for access, versioning, collaboration, security, and searching.
SAS data set (data set)a file whose contents are in one of the native SAS file formats. There are two types of SAS data sets: SAS data files and SAS data views.
SAS format (format)a type of SAS language element that is used to write or display data values according to the data type: numeric, character, date, time, or timestamp.
SAS index (index)a component of a SAS data set that enables SAS to access observations in the SAS data set quickly and efficiently. The purpose of SAS indexes is to optimize WHERE-clause processing and to facilitate BY-group processing.
SAS informat (informat)a type of SAS language element that is used to read data values according to the data's type: numeric, character, date, time, or timestamp.
SAS Metadata Repositorya container for metadata that is managed by the SAS Metadata Server. See also SAS Metadata Server.
SAS Metadata Servera multi-user server that enables users to read metadata from or write metadata to one or more SAS Metadata Repositories.
SAS Model Manager repositorya location in the SAS Content Server where SAS Model Manager data is stored, organized, and maintained.
SAS package (package)a container for data that has been generated or collected for delivery to consumers by the SAS Publishing Framework. Packages can contain SAS files, binary files, HTML files, URLs, text files, viewer files, and metadata.
SAS publication channelSee publication channel.
290 Glossary
SAS variable (variable)a column in a SAS data set or in a SAS data view. The data values for each variable describe a single characteristic for all observations (rows). See also macro variable.
scoringSee model scoring.
scoring functiona user-defined function that is created by the SAS Scoring Accelerator from a scoring model and that is deployed inside the database.
scoring input tablea table that contains the variables and data that are used as input in a scoring test.
scoring output tablea table that contains the output variables and data that result from performing a scoring test. Before executing a scoring test, the scoring output table defines the variables to keep as the scoring results.
scoring testa workflow that executes a model's score code.
segmentation modela model that identifies and forms segments, or clusters, of individual observations that are associated with an attribute of interest.
sourceSee data source.
stability reporta graphical report that detects and quantifies shifts in the distribution of output variables over time in data that is produced by a model.
subscribera recipient of information that is published to a SAS publication channel.
swimlanea workflow diagram element that enables you to group tasks that are assigned to the same participant.
symbolic variableSee macro variable.
target event valuefor binary models, the value of a target variable that a model attempts to predict. In SAS Model Manager, the target event value is a property of a model.
target variablea variable whose values are known in one or more data sets that are available (in training data, for example) but whose values are unknown in one or more future data sets (in a score data set, for example). Data mining models use data from known variables to predict the values of target variables.
taskSee workflow task.
Glossary 291

task statusthe outcome of a task in a workflow. The status of a task (for example, Started, Canceled, Approved) is typically used to trigger the next task.
test tablea SAS data set that is used as input to a model that tests the accuracy of a model's output.
training datadata that contains input values and target values that are used to train and build predictive models.
universally unique identifier (UUID)a number that is used to uniquely identify information in distributed systems without significant central coordination. There are 32 hexadecimal characters in a UUID, and these are divided into five groups with hyphens between them as follows: 8-4-4-4-12. Altogether the 16-byte (128-bit) canonical UUID has 36 characters (32 alphanumeric characters and 4 hyphens). For example: 123e4567-e89b-12d3-a456-426655440000
user-defined reporta customized report. The customized report is a SAS program and its auxiliary files and is stored on the workspace server that is used by SAS Model manager. User-defined reports are accessible from the New Reports wizard.
UUIDSee universally unique identifier.
variableSee SAS variable.
variable attribute (attribute)any of the following characteristics that are associated with a particular variable: name, label, format, informat, data type, and length.
WebDAV serveran HTTP server that supports the collaborative authoring of documents that are located on the server. The server supports the locking of documents, so that multiple authors cannot make changes to a document at the same time. It also associates metadata with documents in order to facilitate searching. The SAS business intelligence applications use this type of server primarily as a report repository. Common WebDAV servers include the Apache HTTP Server (with its WebDAV modules enabled), Xythos Software's WebFile Server, and Microsoft Corporation's Internet Information Server (IIS).
workflowa series of tasks, together with the participants and the logic that is required to execute the tasks. A workflow includes policies, status values, and data objects.
workflow definitiona workflow template that has been uploaded to the server and activated. Workflow definitions are used by the SAS Workflow Engine to create new workflow instances.
workflow instancea workflow that is running in the SAS Workflow Engine. After a workflow template is uploaded to the server and activated, client applications can use the template to
292 Glossary

create and run a new copy of the workflow definition. Each new copy is a workflow instance.
workflow task (task)a workflow element that associates executable logic with an event such as a status change or timer event.
workflow templatea model of a workflow that has been saved to an XML file.
Glossary 293

294 Glossary
Index
Aad hoc reports 147, 149
compared with user-defined reports 148creating 149example 150
aggregated reports 161create 161delete 163view 162
alert notificationsconfiguring for workflows 6
analytical modelspecifying for model import 249
archive 42Assessment Charts 141attachments 59, 89, 110
Bbackup folders
See archive
Cchallenger model 209Champion and Challenger Performance
report 143champion model 208champion models
deploying 208requirements for 208setting 208
Characteristic reportsperformance index warnings and alerts
174classification model
specifying for model import 249clustering model
specifying for model import 249colors, application window preference 5comments 59, 89, 111component files
model templates 242
DDashboard report
create 191edit 195generate 193manage 194overview 191view 194
Data Composition reports 167, 168Stability report 167, 168
data setsperformance data sets 177performance tables 256project control tables 253project input tables 254project output tables 254scoring input tables 255
data source tableslocal or network drive 262
data sourcesperformance table 260project input table 257project output table 257scoring test input tables 259scoring test output tables 259test table 260
databaseprerequisites for publishing 217
database settingsdescriptions 224
Delta report 128deploying models 207
champion models 208duplicating or moving models 77Dynamic Lift report 129Dynamic Lift reports
creating test tables 260verifying model properties 130verifying project properties 130
EEdit Performance Definition wizard
295
naming performance tables for use with261
exporting modelsfrom a folder 76from a project 75
Ffocus indicator, preference 5folders
archive 42create 41deleting 42duplicate or move models 77export models 76import models 75manage 41rename 42restore 42update models 77
GGini plots 171Gini Trend Chart 141, 143
Iimporting models
into a folder 75local files 72mapping variables 86model properties 79overview 67PMML models 71SAS code models 72SAS Metadata Repository 69SAS Model Package file 70
Interval Target Variable report 132
KKolmogorov-Smirnov (KS) plots 172KS Chart 141, 143KS reports 172KS Trend Chart 142, 143
Llibref 262librefs
R model 268user-defined report 155
life cycle status 58Lift Trend chart 141, 143locale, preference 5
lock or unlock version 58lock/unlock project 60lock/unlock version 210locking
versions 210Loss Given Default report 133
Mmacro variables
defining for user-defined reports 152global 155
manageproject versions 57workflows 233
modeladd dependencies 83add files 84add keywords 81add user-defined properties 81add version 88attachments 89, 110comments 89, 111create variables from SAS code file 85manage versions 88set properties 79set version 88user-defined templates 87view lineage 83
Model Assessment reportsperformance index warnings and alerts
174model component files
R model 270SAS package file 248specifying for model import 72
model deploychallenger 209champion 208lock version 210overview 207
Model Input Variable Report 168model inventory
add model user-defined properties 92overview 91
Model Monitoring reports 167, 171KS reports 172monitoring Gini (ROC and Trend)
reports 171monitoring Lift reports 171
Model Profile report 126model retrain
edit 200execute 202overview 197prerequisites 198
296 Index
schedule 202view 203
Model Target Variable Report 168model templates
component files 242File List properties 249properties 249system and user properties 250template properties 249
modelssearch 63search and filter results 91
models publishdatabase 217history 226overview 213remove 226SAS channel 214SAS metadata repository 215
monitoring Lift reports 171monitoring performance 107Monitoring report 141Monitoring reports 141
creating 107, 142, 144monitoring ROC & Gini reports 171
Nnaming performance tables 261
Ppackage files
creating 70performance data sets 187
creating performance reports 177performance definition 179
edit 181execute 181
performance monitoringalerts 173champion model 175Data Composition reports 168job history 186overview 165performance data sets 187performance index 173prerequisites 179process 175reports 176schedule 184Summary results 168types 167warnings 173
performance monitoring reportsData Composition reports 167
Model Monitoring reports 167, 171Monitoring reports 141Summary reports 167
performance reportscreating 107performance data sets and 177
performance tables 256, 260creating 260naming for use with Edit Performance
Definition wizard 261PMML models 71
support 265portable format files 58portfolio
add a new version 101add an input variable 102attachments 89, 110comments 89, 111create 99publishing champion models 103publishing models 104publishing models to a database 106publishing models to a SAS Channel
105remove published models from database
107portfolios 95
See also monitoring performancecreating a control table 98planning 96prerequisites for creating 97search for models 63
prediction modelspecifying for model import 249
preferencesglobal 5SAS Model Manager preferences 5SAS Preferences Manager 5setting 4
Probability of Default report 136project
comments 89, 111project control tables 253project history 59project input tables 254
creating 257project output tables 254
creating 258project tables 253
performance tables 256project control tables 253project input tables 254project output tables 254scoring input tables 255scoring output tables 255test tables 256
Index 297
train tables 256project variables 55project versions
manage 57projects
attachments 59comments 59create 50history 59lock/unlock 60overview 48planning 48prerequisites 49properties 51search for models 63templates 60variables 55
propertiesBasel II 134, 137Dynamic Lift reports 130Loss Given Default (LGD) 134, 137model template properties 249Probability of Default (PD) 134, 137
prototype tablesproject input tables 254project output tables 254scoring output tables 255scoring test output tables 259
PSCORE procedure 265publishing
project champion models 103publishing models 213
database settings 224publishing models to a database 217publishing models to a SAS channel 214publishing models to a SAS metadata
repository 215
RR models
building 268model component files 270model template file 269using in SAS Model Manager 267
report templatesfor user-defined reports 153
reports 167, 168ad hoc reports 147aggregated reports 161Champion and Challenger Performance
report 143Dashboard report 191Data Composition reports 167, 168Delta report 128Dynamic Lift report 129
Interval Target Variable report 132KS reports 172Loss Given Default prerequistes 134Loss Given Default report 133Model Assessment reports 174Model Input Variable Report 168Model Monitoring reports 167, 171Model Profile report 126Model Target Variable Report 168monitoring Lift reports 171Monitoring report 141Monitoring reports 141monitoring ROC & Gini reports 171overview 124Probability of Default prerequisites 137Probability of Default report 136Stability reports 167, 168Summary of Reports 168Summary reports 167Training Summary Data Set report 139user-defined reports 147view 145
restore 42retrain models 197ROC Chart 141, 143ROC plots 171
SSAS code models
importing 72SAS Model Package (spk) File 70SAS Preferences Manager 5SAS programs
delete from SAS Content Server 156edit on SAS Content Server 156upload to SAS Content Server 152user-defined report 151, 152
scoring input tables 255creating 259
scoring modelsexecute scoring test 119output table 116overview 115properties 120schedule scoring test 119scoring test 118
scoring output table 116scoring output tables 255
adding to SAS Model Manager 255creating 259
scoring test 118, 119scoring test input tables 259scoring test output tables 259Stability reports 167, 168
overview 169
298 Index

performance index warnings and alerts174
start-up codedelete libref 263edit 263
Summary of Reports 168Summary reports 167Summary results 168
Ttables
local or network drive 262templates 60
report templates 153test tables 256
creating 260theme, preference 5train tables 256Training Summary Data Set report 139tutorial
make files available 12organize model hierarchy 16
tutorialsdefine data sources 14sign in 13
Uunlock or lock version 58unlock/lock project 60unlocking
versions 211user reports
ad hoc 147output created by 148user-defined 147
user-defined model templates 87user-defined reports 147, 151
compared with ad hoc reports 148creating 151
example 157macro variables 152report template for 153running 156
Vversions
creating 101displayed 58life cycle status 58lock or unlock 58locking 210manage 57new 57overview 57portable format files 58unlocking 211
Wworkflow
assign participant 236participants 236release task 237remove participant 237start 229tasks 230terminate 238
Workflow 229workflow participant
assign 236remove 237
workflow taskedit properties 238release 237
workflowsalert notifications 6manage 233view 234
Index 299

300 Index