Embed Size (px)
Citation preview

Modeling Signalized Traffic Intersections Using SAS Simulation Studio
Leow Soo Kar
Department of Financial Mathematics and Statistics
Sunway University
1

Contents
.
Introduction. Case study. SAS Simulation Studio. Modeling the signalized traffic junctions using SAS Simulation
Studio. Results. Summary. Conclusion.
2

Traffic congestion is a never-ending problem for road users in cities & urban areas.
Increasing volume of road vehicles vs decreasing size of roads.
These have posed many challenges to the Traffic Management and City Authorities to provide satisfactory solutions.
Introduction
3

Problem.
Road junctions often create the worst traffic congestions.
Solution.
Traffic Lights.
Installing traffic lights are not sufficient.
Solution – Simulation : VISSIM, CORSIM, SUMO, SIMTraffic, etc.
Introduction
4

Introduction
In this paper, we describe how we can use SAS Simulation Studio to build a simulation model to study some of these factors in order to plan and design better timing of the signals to provide smooth and safe flow of traffic.
We use Sunway’s entrance road junction as a real study case.
5

Entrance road to Sunway University
As an example we present the signal timing plan that is currently implemented in the 3-way intersection of the entrance road into Sunway University.
TABLE I shows the signal timing plan. The traffic streams that are allowed to proceed during the phases of the signal timing plan are depicted in Fig. 4.
6

The simulations were carried out for 2 peak periods (7.30 – 9.30 am and 5.00 – 7.00 pm) during a whole day.
TABLE III shows the timing plan used from for the morning and evening peak periods
Case Study - Sunway University 3-way intersection
7
TABLE IV gives the mean inter-arrival times (in sec.) of vehicles arriving at the junctions used in the simulations for both peak periods
Case Study - Sunway University 3-way intersection
8
SAS Simulation Studio
Simulation Studio is a SAS software package that uses object-oriented discrete-event simulation to model and analyze systems.
It has a user friendly graphical interface and uses base blocks to build the simulation model.
Each block has well-defined and specialized functionalities and communicates with each other via ports.
9

Some Base Blocks in SAS Simulation Studio
Entity block -- generates entities, e.g. arrivals
Number holder block -- to store values
Queue block -- storage of entities
Server block -- to provide resource - server
Formula block -- define expressions/formulae
Numeric block -- to generate random variates
Delay block -- to delay entity in system
Valve block -- controls the flow of entities in system
10

Modeling the traffic signal in Simulation Studio
The traffic signal is modeled using a server block together with a flow control block and formula block.
For simplicity, we model a traffic signal with only two phases, (red and green).
Fig. 1 shows a traffic signal with a cycle time of 60 sec. consisting of a 40 sec. red phase and a 20 sec. green phase.
Fig. 1
11

Numeric block 1 and the Entity Block generate the cycle length of the traffic signal
Flow Control Block and Formula Block regulate the red and green phases.
The Entity Block generates a 60 sec. traffic signal cycle by generating an entity to enter the Server Block once every 60 sec.
The Server Block serves the entity for a constant 40 sec. service time representing the duration of the red phase. The busy or idle state of the server represents the red or green phase of the signal.
The Formula Block then passes the busy/idle state value of the server to the Flow Control Block which blocks (red phase) or allows (green phase) vehicles to pass through.
Modeling the traffic signal in Simulation Studio
12

Basically two types of road intersections.
3-way intersection.
4-way intersection.
In order for traffic to flow in an orderly fashion at these intersections, a well-coordinated traffic signal is a necessary condition but is not sufficient to optimize waiting time.
How these traffic signals are coordinated will depend on the type of intersection, terrain, traffic volume and many other factors.
Modeling the traffic signal in Simulation Studio
13

Basic 3-way intersection Typically, the 3-way intersection has 4 sets of signal lights as shown in figure
below.
Six traffic streams are identified in the figure
SL coming from South Road turning left into West Road
SR, turning right into East Road
ES is traffic stream from East Road proceeding straight through to West Road
EL, turning left into South Road
WS is traffic stream from West Road proceeding straight through to East Road without signal control
WR is traffic turning right into South Road.
14

Timing plan
Coordination of the traffic signals in the timing plan in Simulation Studio is achieved by setting the appropriate start time in the Entity Block of the traffic signal.
For example, Fig. 3 shows a timing plan for Traffic Signal A and B together with the simulation models of the traffic signals.
In Signal A, the start time of Entity Block A is set at 0 while the start time of Entity Block B in Signal B is set at 40. With this setting, the timing of the red/green phases of the signals will be coordinated
15

Modeling 3-way intersection in Simulation Studio
The next figure shows the simulation model of the South Road junction in Simulation Studio. Arrivals are generated in the compound block labeled South Junction and a Formula Block and a Switch Block are used to divert vehicles to turn left to the SL signal light or to turn right to the SR signal light based on the probabilities pSL or pSR
The compound blocks labeled SL Signal and SR Signal simulate the SL and SR traffic lights respectively. Vehicles leaving the SL and SR Signal blocks exit to the WestRd and EastRd blocks respectively.
South Road junction
16

Modeling 3-way intersection in Simulation Studio
Fig. 5: Simulation Model of South Road junction of a 3-way intersection in Simulation Studio
17
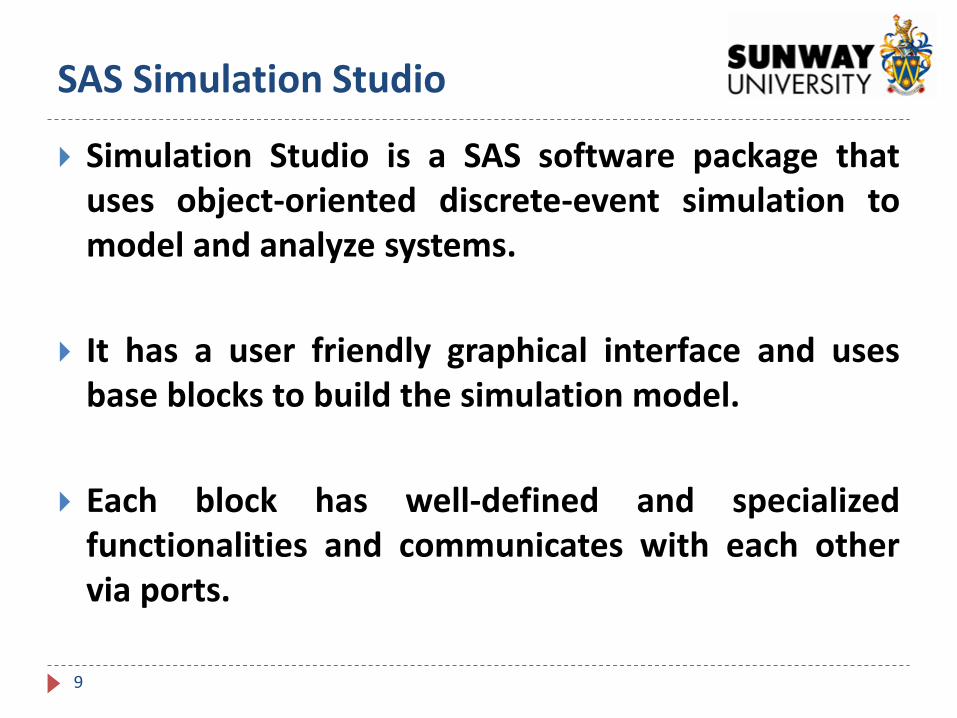
West Road junction
Simulation Model of West Road junction of a 3-way intersection in Simulation Studio
18

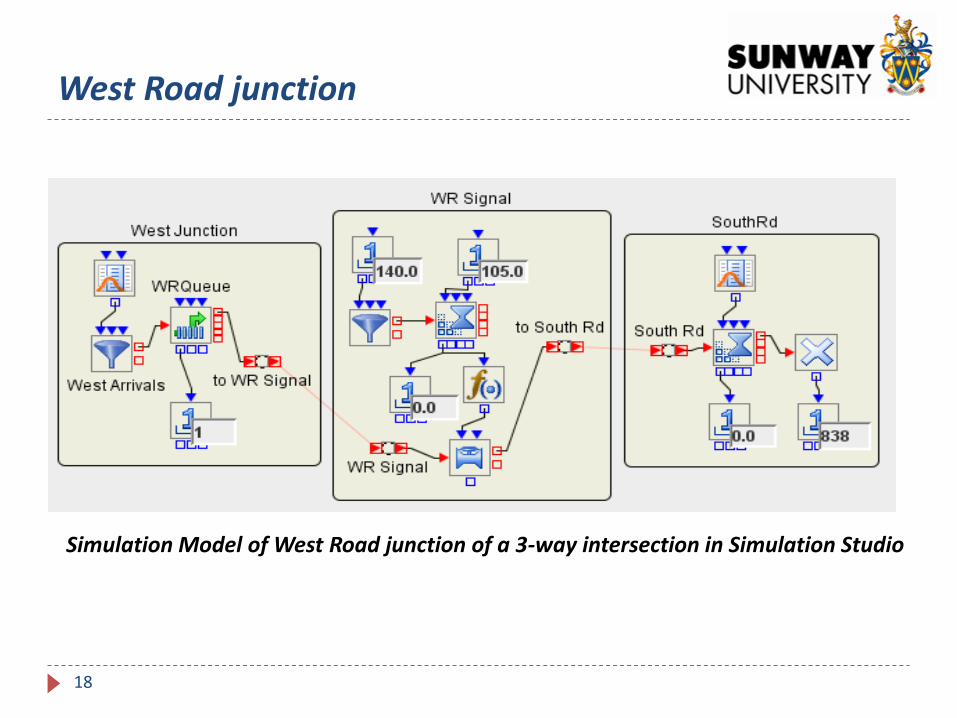
East Road junction
Simulation Model of East Road junction of a 3-way intersection in Simulation Studio
19

Simulation results
Simulation of the Sunway University 3-way intersection for both peak periods with the current signal timing plan was carried out with 10 replications.
TABLE V shows average queue length and average waiting time for each of the traffic streams. These results are consistent with observed data.
20
Simulation results
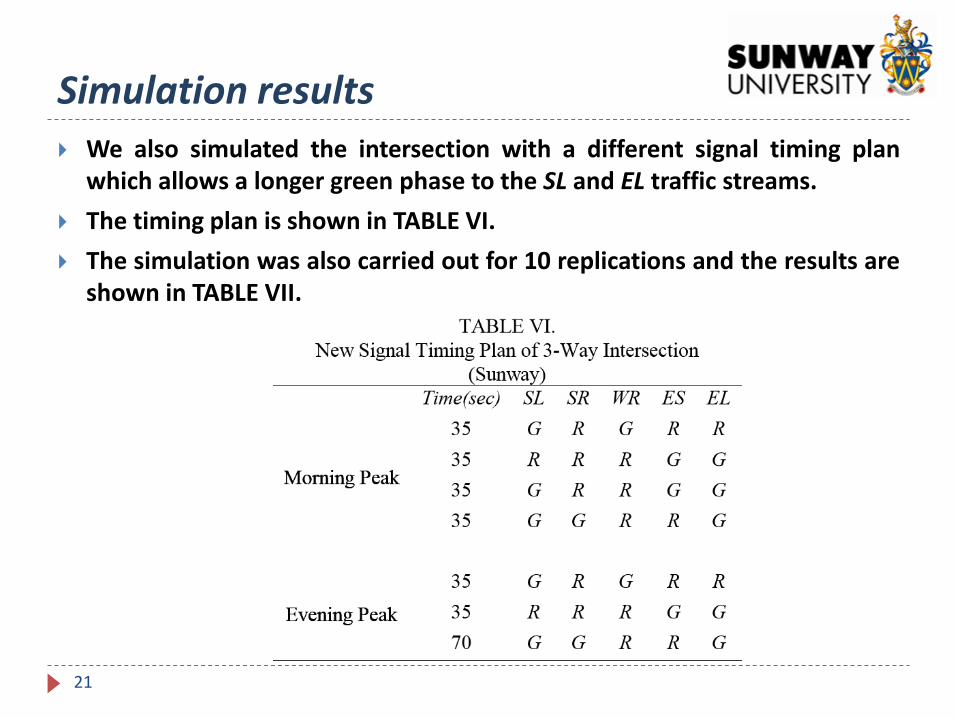
We also simulated the intersection with a different signal timing plan which allows a longer green phase to the SL and EL traffic streams.
The timing plan is shown in TABLE VI.
The simulation was also carried out for 10 replications and the results are shown in TABLE VII.
21

Simulation results
Average Queue Length and Waiting Time for new timing plan
22

Summary
From the results in TABLE V and VII we can see that the average queue length and waiting times for EL and SL traffic streams are considerably reduced for the new timing plan while the values for the other 3 streams remain the same.
23

Conclusion
In this paper, we have used SAS Simulation Studio, a non specialized simulation software to model and simulate signalized traffic intersections.
A case study is also presented and the results obtained are consistent with observed data.
This showed that the model can be used as basic units to build more complex models of signalized traffic systems.
In the near future, a wider case study consisting of a complex road and signalized traffic system around the university will be investigated.
24