Embed Size (px)
Citation preview

Staff Support at UH ManoaA Comparative Analysis
Sang-Hyop Lee, Carl Bonham, and Archie Gatchalian
UH Planning DayDecember 4, 2006

Summary
The UH Manoa Student to Faculty Ratio is slightly lower than that of our Peers and all Public Doctoral Research Extensive Universities (DREU).
Yet, the ratio of Staff to Faculty or Staff to Students is substantially lower for UHM than for its Peers or all DREU.
The gap between UHM and its peers widened dramatically after the 1995 early retirement program. (see for exxample)
Some staff categories experienced declines of more than 50% between 1995 and 1997 attributable to the early retirement program.

Summary
The staffing gap between Manoa and its Peers is largest for the executive, administrative, managerial category and the skilled crafts category.
The gap is smallest for technical paraprofessional staff.
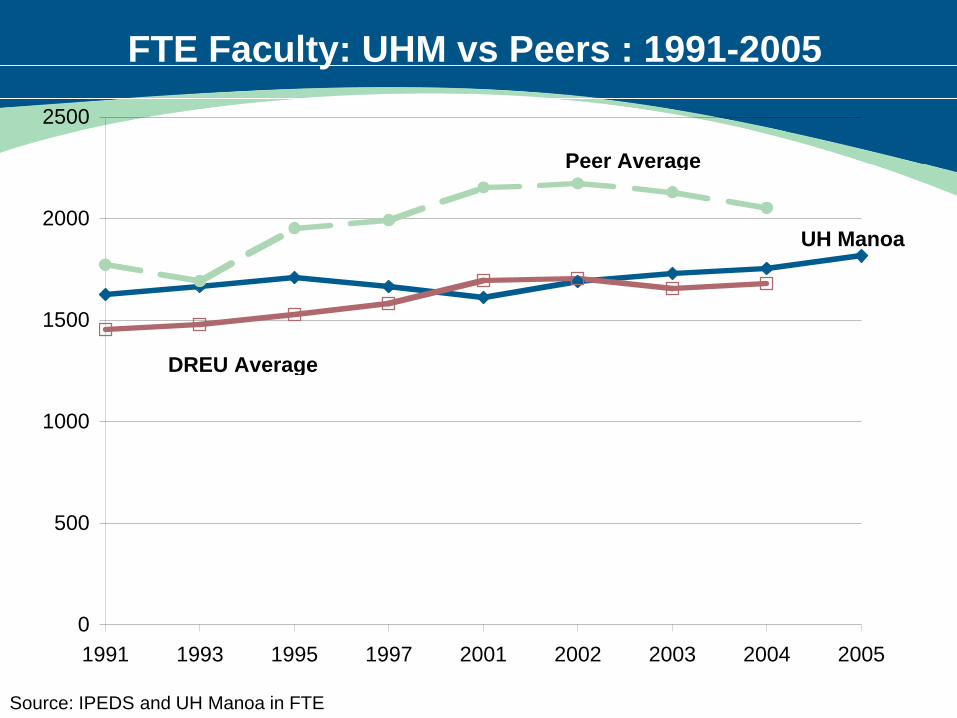
FTE Faculty: UHM vs Peers : 1991-2005
Source: IPEDS and UH Manoa in FTE
0
500
1000
1500
2000
2500
1991 1993 1995 1997 2001 2002 2003 2004 2005
Peer Average
DREU Average
UH Manoa

FTE Enrollment: UHM vs Peers : 1991-2005
Source: IPEDS and UH Manoa in FTE
0
5000
10000
15000
20000
25000
30000
1991 1993 1995 1997 2001 2002 2003 2004 2005
Peer Average
DREU Average
UH Manoa

FTE Staff: UHM vs Peers : 1991-2005
Source: IPEDS and UH Manoa in FTE
0
1000
2000
3000
4000
5000
6000
7000
8000
1991 1993 1995 1997 2001 2002 2003 2004 2005
Peer Average
DREU Average
UH Manoa

FTE Staff & Faculty: UHM vs DREU: 2004
Source: IPEDS and UH Manoa in FTE
1755
2484
78
1199
289
529
53
335
1681
4565
346
1978
494
934
308
586
0 1000 2000 3000 4000 5000
FTE Faculty
FTE Staff
Executive/Admin/Managerial
Other Professional
Technical/Paraprofessional
Clerical/Secretarial
Skilled Crafts
Service/Maintenance
UH Manoa Public DREU Average

FTE Staff & Faculty: UHM vs Peers: 2004
Source: IPEDS and UH Manoa in FTE
1755
2484
78
1199
289
529
53
335
2053
6449
447
2464
779
1495
427
899
0 1000 2000 3000 4000 5000 6000 7000
FTE Faculty
FTE Staff
Executive/Admin/Managerial
Other Professional
Technical/Paraprofessional
Clerical/Secretarial
Skilled Crafts
Service/Maintenance
UH Manoa Peer Average

Student to Faculty Ratio: 1991-2005
Source: data from IPEDS and UH Manoa, all numbers or FTE
0
2
4
6
8
10
12
14
16
1991 1993 1995 1997 2001 2002 2003 2004 2005
Peer Average
DREU Average
UH Manoa

Ratio of Staff to Faculty: 2004
Source: IPEDS and UH Manoa in FTE
1.41
0.04
0.68
0.16
0.30
0.03
0.19
3.14
0.22
1.20
0.38
0.73
0.21
0.44
0.0 0.5 1.0 1.5 2.0 2.5 3.0 3.5
Total
Executive/Admin/Managerial
Other Professional
Technical/Paraprofessional
Clerical/Secretarial
Skilled Crafts
Service/Maintenance
UH Manoa UHM Peer Average

Ratio of Staff to Enrollment: 2004
Source: IPEDS and UH Manoa in FTE
0.15
0.00
0.07
0.02
0.03
0.00
0.02
0.27
0.02
0.10
0.03
0.06
0.02
0.04
0.0 0.1 0.1 0.2 0.2 0.3 0.3
Total
Executive/Admin/Managerial
Other Professional
Technical/Paraprofessional
Clerical/Secretarial
Skilled Crafts
Service/Maintenance
UH Manoa UHM Peer Average

Ratio of Total Staff to Faculty: 1991-2005
Source: IPEDS and UH Manoa in FTE
0.00
0.50
1.00
1.50
2.00
2.50
3.00
3.50
4.00
1991 1993 1995 1997 2001 2002 2003 2004 2005
Peer Average
DREU Average
UH Manoa

Ratio of Total Staff to Enrollment: 1991-2005
Source: IPEDS and UH Manoa in FTE
0.00
0.05
0.10
0.15
0.20
0.25
0.30
0.35
1991 1993 1995 1997 2001 2002 2003 2004 2005
Peer Average
DREU Average
UH Manoa

Ratio of Executive, Administrative, Managerial Staff to Faculty: 1991-2005
Source: IPEDS and UH Manoa in FTE
0.00
0.05
0.10
0.15
0.20
0.25
0.30
1991 1993 1995 1997 2001 2002 2003 2004 2005
Peer Average
DREU Average
UH Manoa

Ratio of Other Professional (Support/Service) Staff to Faculty: 1991-2005
Source: IPEDS and UH Manoa in FTE
0.00
0.20
0.40
0.60
0.80
1.00
1.20
1.40
1991 1993 1995 1997 2001 2002 2003 2004 2005
Peer Average
DREU Average
UH Manoa

Ratio of Technical & Paraprofessional Staff to Faculty: 1991-2005
Source: IPEDS and UH Manoa in FTE
0.00
0.10
0.20
0.30
0.40
0.50
0.60
1991 1993 1995 1997 2001 2002 2003 2004 2005
Peer Average
DREU Average
UH Manoa

Ratio of Clerical & Secretarial Staff to Faculty: 1991-2005
Source: IPEDS and UH Manoa in FTE
0.00
0.10
0.20
0.30
0.40
0.50
0.60
0.70
0.80
0.90
1.00
1991 1993 1995 1997 2001 2002 2003 2004 2005
Peer Average
DREU Average
UH Manoa

Ratio of Skilled Crafts Staff to Faculty: 1991-2005
Source: IPEDS and UH Manoa in FTE
0.00
0.02
0.04
0.06
0.08
0.10
0.12
0.14
0.16
0.18
0.20
1991 1993 1995 1997 2001 2002 2003 2004 2005
Peer Average
DREU Average
UH Manoa

Ratio of Service/Maintenance Staff to Faculty: 1991-2005
Source: IPEDS and UH Manoa in FTE
0.00
0.10
0.20
0.30
0.40
0.50
0.60
1991 1993 1995 1997 2001 2002 2003 2004 2005
Peer Average
DREU Average
UH Manoa

Data
All data is from • UH Manoa office of Human Resources• Integrated Postsecondary Education Data System
(http://nces.ed.gov/ipeds/)UH Manoa Peer groupUniversity of California-Davis, Colorado State University, University of Georgia, Iowa State University, University of Kentucky, Louisiana State Univ & Ag & Mech & Hebert Laws Ctr, University of Missouri-Columbia, University of North Carolina-Chapel Hill, Oregon State University, The University of Tennessee, University of Utah, and University of Virginia-Main Campus.
Data
DREU Average is the average of all 4-year public universities classified as Doctoral/Research-Extensive Universities (DREU) by the Carnegie Foundation.
DREU institutions are defined as• Institutions that typically offer a wide range of baccalaureate
programs, and are committed to graduate education through the doctorate.
• They award 50 or more doctoral degrees per year across at least 15 disciplines.

IPEDS Staff Definitions
Executive, Administrative, Managerial Staff• Included in this category are employees holding titles such as: top
executives; chief executives; general and operations managers; computer and information systems managers; financial managers; human resources managers; purchasing managers; presidents, vice presidents (including assistants and associates); deans, directors and dept. heads (including assistants and associates) if their principal activity is administrative and not primarily instruction, research or public service…
Other Professional Staff• Included in this category are all employees holding titles such as business
operations specialists; human resources, training, and labor relations specialists; management analysts; accountants and auditors; budget analysts; computer specialists; computer programmers; computer software engineers; computer support specialists; database administrators; network and computer systems administrators …; counselors, social workers, and other community and social service specialists; librarians, curators, and archivists; museum technicians and conservators; athletes, coaches etc.........(more examples in IPEDS)

IPEDS Staff Definitions
Technical & Paraprofessional Staff• Includes persons who perform some of the duties of a professional in a supportive
role, which usually requires less formal training and/or experience than normally required for professional status. Included in this category are among others: mathematical technicians; agricultural and food science technicians; geological and petroleum technicians; paralegals and legal assistants; health technologists and technicians; licensed practical and licensed vocational nurses; healthcare support occupations …
Clerical & Secretarial• Includes personnel who are responsible for internal and external communications,
recording and retrieval of data (other than computer programmer) and/or information and other paperwork required in an office. Also includes such occupational titles such as bill and account collectors;bookkeeping, accounting, and auditing clerks; payroll and timekeeping clerks; procurement clerks; file clerks; clerical library assistants; human resources assistants, except payroll and timekeeping; secretaries and administrative assistants; computer operators; data entry and information processing workers; desktop publishers; mail clerks and mail machine operators(except postal service); office clerks (general); office machine operators (except computer); and proofreaders and copy markers. …

IPEDS Staff Definitions
Skilled Crafts • Includes occupational titles such as welders, cutters, solderers and
brazers; printers; cabinetmakers and bench carpenters; plant and system operators; stationary engineers and boiler operators; medical, dental, and ophthalmic laboratory technicians; painting workers; photographic process workers and processing machine operators; and etchers and engravers….
Service/Maintenance Staff• Includes titles such as law enforcement workers; parking enforcement
workers; police officers; security guards; lifeguards; cooks and food preparation workers; food and beverage serving workers; other food preparation and serving related workers; building cleaning and pest control workers; grounds maintenance workers; electrical and electronic equipment mechanics; installers and repairers; electricmotor, power tool, and related repairers; vehicle and mobile equipment mechanics, installers, and repairers; heating, air conditioning, and refrigeration mechanics and installers; motor vehicle operators; and parking lot attendants. …