Embed Size (px)
Citation preview

Sandi GulbransenUniversity of Utah Health Care
Frank A. DrewsUniversity of Utah
Center for Human Factors in Patient Safety VA Salt Lake City Health Care System
Informatics, Decision-Enhancement, and Surveillance Center
Elements of an Agile Safety Culture in Health Care

Socio-Technical Systems Safety
Culture of Safety Components
Safety Space Perspectives on improvement
Principles of process improvement Task analysis and improvement in task performance
Take away

Socio-Technical Systems
Socio-Technical System (STS) Core Idea: Systems have technical and social components
Technical system Machinery, processes, procedures
Social system People and their habitual attitudes, values, behavioral styles and
relationships

Socio-Technical Systems
How to strengthen a socio-technical system? Resilience Engineering
Resilience “The ability of a system to adjust its functioning prior, during, and past
changes and disturbances to maintain operation” Hollnagel, 2011
Assumptions Performance conditions are underspecified; constant adjustment to
changing conditions is required Safety and productivity are not independent

Safety and Safety Culture
What is safety? Safety as the absence of accidents, incidents, injuries,
illnesses? Problem: What causes these events?
What is within our control, and what is not? (e.g. I can control how I drive but I cannot control how others drive).
Definition by International Organization for Standardization (ISO): “Safety is freedom from unacceptable risk.”
Issue of risk vs. uncertainty
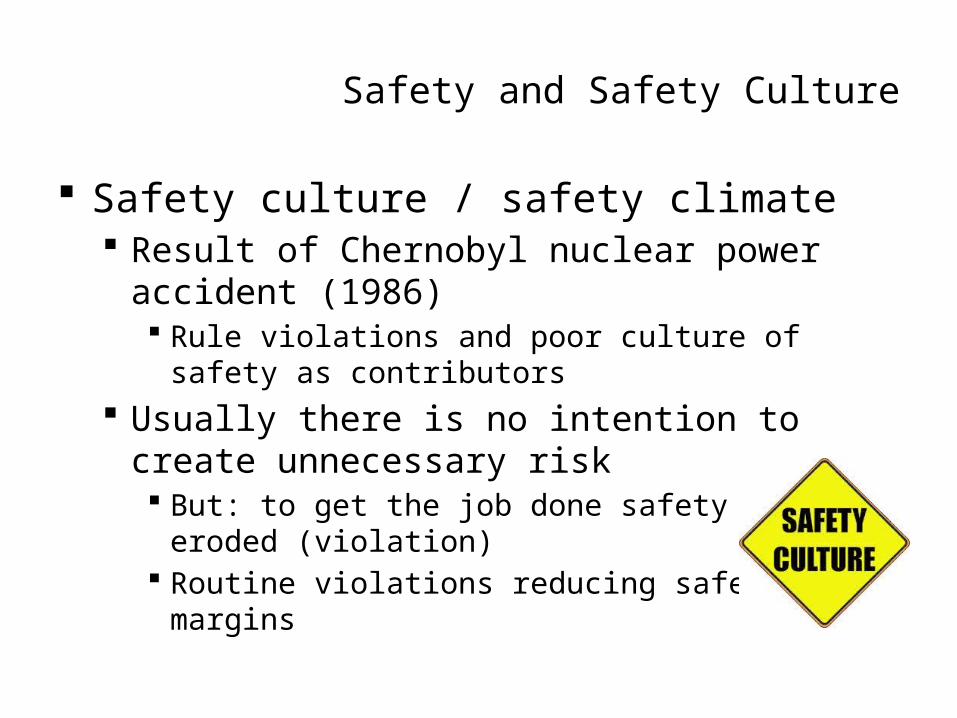
Safety culture / safety climate Result of Chernobyl nuclear power accident (1986)
Rule violations and poor culture of safety as contributors Usually there is no intention to create unnecessary risk
But: to get the job done safety is eroded (violation) Routine violations reducing safety margins
Safety and Safety Culture

Safety Culture
Commitment Competence Cognizance
Safety and Safety Culture

Commitment Motivation to stay safe even under management changes Resources with regard to quantity and quality
Competence The technical competence to improve safety Safety information system
Cognizance Correct awareness of the threats to the organization
Safety and Safety Culture

Safety space Continuum from resilient to brittle organizations
resilient brittle
Safety and Safety Culture

Over time organizations move in safety space Position in the safety space is a function of the number of
negative outcomes Resilient organizations suffer fewer negative outcomes
Drifting towards the brittle region increases the likelihood of accidents
Public and/or regulatory pressures result in improvements of safety Moving towards the resilient region has also contrary forces
Safety initiatives may run out of steam There is a diminishing return for safety improvements
Safety and Safety Culture

How to increase resilience? Learning
Knowing what has happened Ability to address the factual
Responding Knowing what to do Responding to regular and irregular disruptions Ability to address the actual

Anticipating How to anticipate threats, developments and opportunities Ability to address the potential
Monitoring Knowing what to look for, i.e., what can become a threat in the future Focus on what happens in the environment, but also what happens in
the system Ability to address the critical

Learning(factual)
Monitoring(critical)
Anticipating (potential)
Responding(actual)
Abilities required for resilience

Examples from two perspectives Macro perspective
Principles of process improvement Example: Joint replacement
Micro perspective Task Analysis / improvement of task performance
Examples: Kit development using Adherence Engineering; ICU Display Design

Value Management System (VMS):Toward a Learning Health System
Sandi GulbransenUniversity of Utah Health Care
March 20, 2014

Outline
Value Management System (VMS) Principles of Lean and ISO 9001:2008 Use case VMS as Virtuous Cycle

Data
Process
Clinical
Patient

Today
Make the best decisions with the most complete information available – but our best information has gaps.
Tomorrow
Make the best decisions with a better understanding of our key processes and how they are performing.
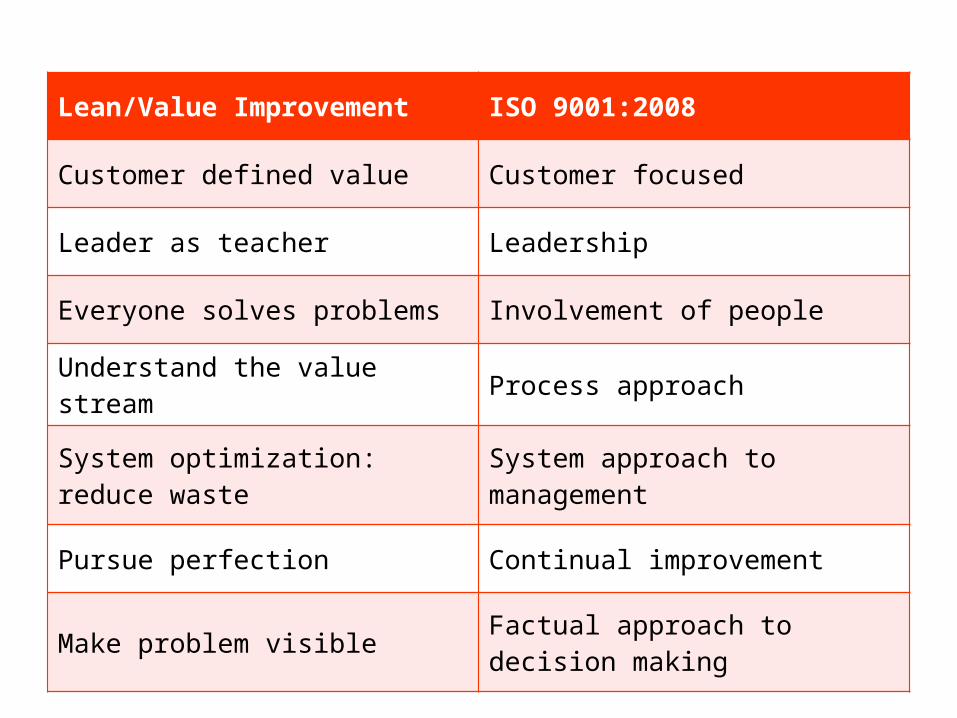
Lean/Value Improvement ISO 9001:2008
Customer defined value Customer focused
Leader as teacher Leadership
Everyone solves problems Involvement of people
Understand the value stream Process approach
System optimization:reduce waste System approach to management
Pursue perfection Continual improvement
Make problem visible Factual approach to decision making

1. Document
What we do
2. Record
What we did
3. Audit
How well we do it
4. Non conformity
What didn’t work
5. Correct or Prevent
The fix

Joint Replacement:Value Driven Care Process
Physician Lead: Chris Pelt, MDSponsor: Charles Saltzman, MD
Multidisciplinary Team:NursingPhysical TherapyAmbulatory ClinicCase ManagementValue EngineeringDecision SupportEDWQuality & Patient Safety

PoliciesProceduresGuidelinesBylaws
+=Daily Activity
Chart Activity
DAILY WORK
DOCUMENTWhat we do
RECORDWhat we did
Joint Replacement Care ProcessPatient Information
Early MobilizationIncomplete Discharge Orders

+=
>
DAILY WORK AUDITHow well we do it
INTERNAL AUDITS
EXTERNAL AUDITS
No specific audits

= +
>
IDENTIFYNON-
CONFORMITYWhat didn’t work
INTERNAL AUDITS
EXTERNAL AUDITS
INTERNAL AUDITS X X X X
AUDITHow well we do it
Opportunity for Improvement

Early Mobilization Prioritized – Change of PT ShiftsUpdated discharge order setPatient Selection pre-op re: post op
SNF, Rehab, HH
= +
>
REPORT
INTERNAL AUDITS
EXTERNAL AUDITS
CORRECTThe fix

= +
>
PREVENT PREVENTHow we keep itFrom happening
INTERNAL AUDITS
EXTERNAL AUDITS
CORRECTThe fix
Perfect Care Metric - VMS

Perfect Care Composite: Joint Replacement
National Metrics Local Metrics
30 day readmission Early mobility
8 SCIP measures ED visit within 90 days
35 HAC/PSI metrics Discharge unit
Anesthesia technique

ResultsPatient Care and Average Cost

Interpret
Assemble
Analyze
Change
Feedback
Virtuous Cycles1

InterpretIdentify nonconformityor preventive action
AssembleIdentify change for sustained improvement
AnalyzeMonitor process performanceMetrics and drivers
ChangeBest practices – internal and external
FeedbackFind opportunityMake it easy to do the right thing

Agility
Understanding of key processes Metrics that will drive change Actionable information at POC Extensible to other organizations
Reactive Proactive
ProjectsPDSA cycles
Lean ManagementVirtuous cycles
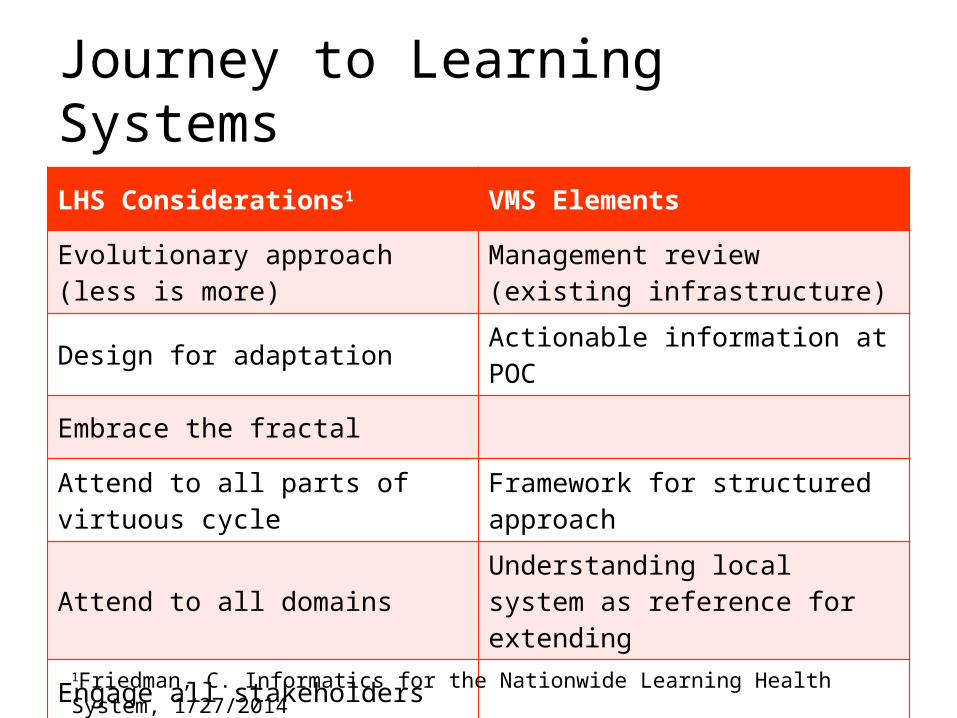
Journey to Learning Systems
LHS Considerations1 VMS Elements
Evolutionary approach (less is more)
Management review (existing infrastructure)
Design for adaptation Actionable information at POC
Embrace the fractal
Attend to all parts of virtuous cycle Framework for structured approach
Attend to all domains Understanding local system as reference for extending
Engage all stakeholders
1Friedman, C. Informatics for the Nationwide Learning Health System, 1/27/2014

There is a way to do it better – find it.
-Thomas Edison

Frank A. DrewsUniversity of Utah
Center for Human Factors in Patient Safety VA Salt Lake City Health Care System
Informatics, Decision-Enhancement, and Surveillance Center
WithAaron Angelovic, Jonathan Bakdash,
Alexa Doig, Brittany Mallin
Task analysis and
improvement in task performance

Adherence and Violations
Procedure violations Common problem in many industries Routine violations
Person perceives an alternative, more efficient way to perform task Lack of feedback External (social) pressures reinforce routine violations
Violation producing conditions Perceived low likelihood of detection Inconvenience Time pressure

Design for Adherence
Central line maintenance: A trivial task? Maintenance requires more than 25 steps
Breakdowns in maintenance can result in central line associated bloodstream infection (CLABSI)

Design for Adherence
Adherence Engineering to reduce Violations

A procedure: Central line maintenance Status quo
Current equipment does not support clinicians Opportunity to redesigning the task / equipment based on
Human Factors
Design for Adherence

Building an alternative Integrating checklist into equipment to support adherence to
best practices Applying AE principles
Multi step approach Involvement of Infusion Team Members / Physicians Involvement of Manufacturer Involvement of HF Engineers Iterative design and evaluation process
Virtuous cycle
Design for Adherence

New Kit
Non-Sterile Portion
Sterile PortionSmall size

Results
Clinical data CLABSI rates
Pre-intervention CLABSI rate: 3.23 / 1000 patient line days
Post-intervention CLABSI rate: 0 / 1000 patient line days
Incident rate ratio = 0 (95% CI:0-0.63; p<.01)

Results
Best Practice Odds Ratio / 95% CI Significance
Hand Sanitization 4.86 2.45-9.62
p < .0001
Chlorhexidine Scrub Duration
7.62.26-25.59
p < .0001
Anti-Microbial Bandage Application
0.70.14-3.57
p = .69
Catheter Hub Disinfection
7.854.14-14.9
p < .0001
Pre-intervention n = 107, Post-intervention n = 85

Design for Adherence
Discussion Clear improvement in adherence to best practices Fewer item omissions / errors Reduction in CLABSI

Development of a
Patient Monitor for Critical Care

ICU display
Two step approach Semi-structured interviews with ICU nurses
Goal: Understanding the limitations of current displays
Design Involvement of nurses, physicians, cognitive
psychologists Iterative design process
Evaluation study

Interviews to inform design
Interview Focus on experience with current displays
Confusing variables Missing information Error Relevance of trend information Patient variability Usability
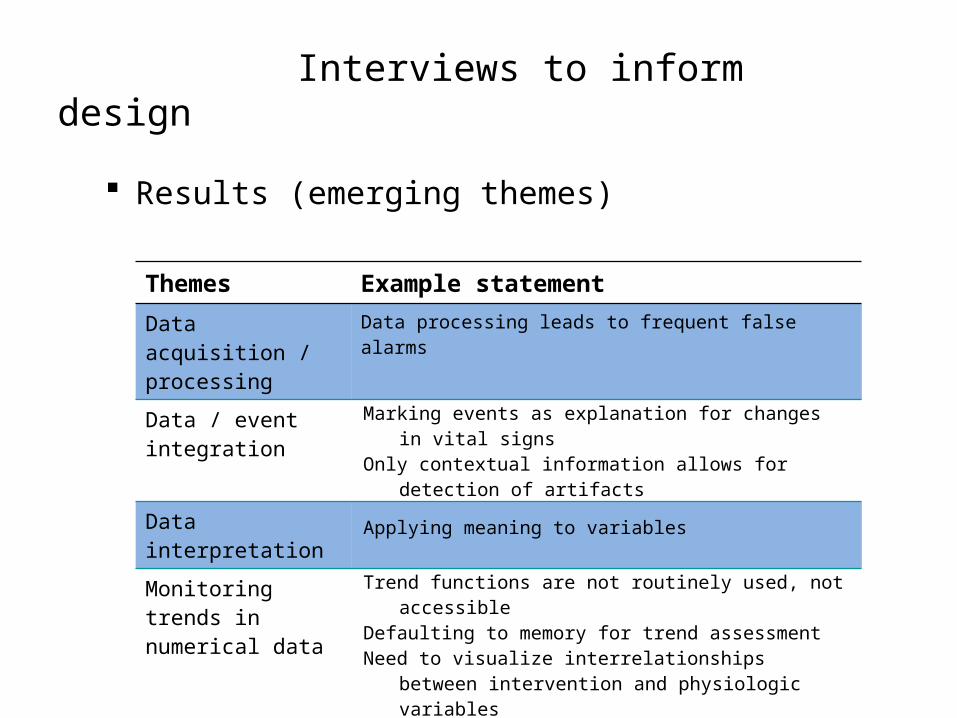
Results (emerging themes)
Themes Example statement
Data acquisition / processing
Data processing leads to frequent false alarms
Data / event integration Marking events as explanation for changes in vital signsOnly contextual information allows for detection of artifacts
Data interpretation Applying meaning to variables
Monitoring trends in numerical data
Trend functions are not routinely used, not accessibleDefaulting to memory for trend assessmentNeed to visualize interrelationships between intervention and
physiologic variables
Usability issues Small font sizeColor coding of variables is not consistentCables should be color coded for ease of use and troubleshooting
Interviews to inform design

Discussion Current monitor equipment does not support
integrated patient assessment Slow, piecemeal-wise processing Increases cognitive load
Information needs are not met Trend information not immediately available High information access costs
Interviews to inform design
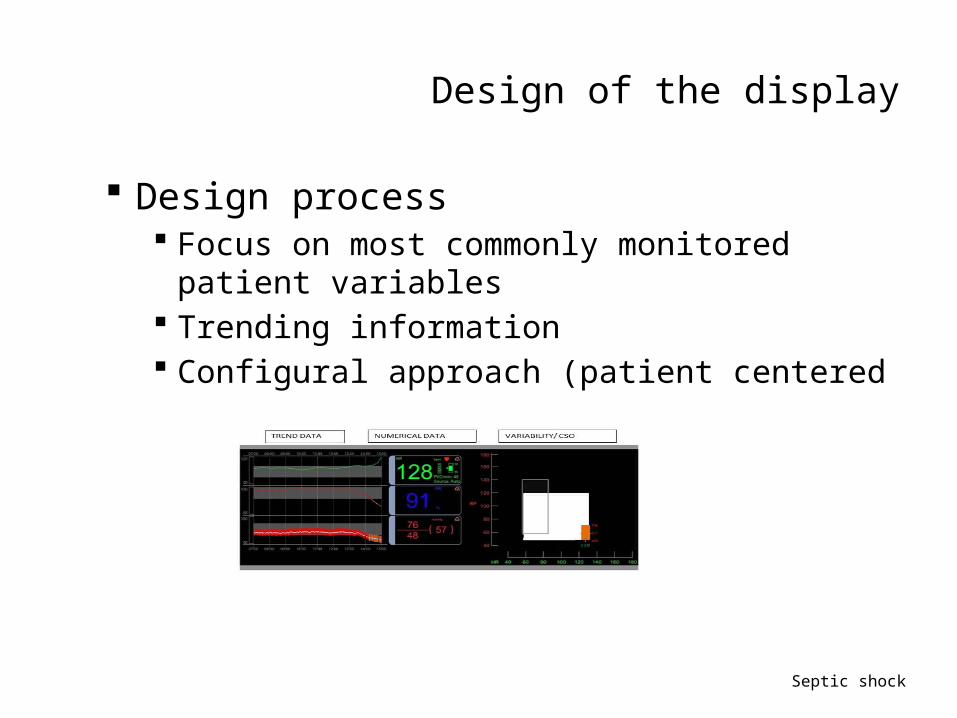
Design process Focus on most commonly monitored patient
variables Trending information Configural approach (patient centered variability)
Septic shock
Design of the display

Study Design IV:
Display (configural vs. traditional display) 4 scenarios (Septic shock, pulmonary embolism, early sepsis,
normal)
DV: Time for nursing diagnosis Percentage of correct diagnoses Percentage of trend data being accessed in traditional display
condition
Participants 40 ICU nurses (25 female)
Evaluating the display

Results (Time to diagnosis) Significant
differences for all scenarios but early sepsis
Evaluating the display

Results (Percentage correct diagnoses) Significant
differences for for septic shock and pulmonary embolism; trend for stable
Evaluating the display
Discussion Configural display leads to
Improvement in time for diagnosis Improvement in quality of diagnosis
Up to 24 % improvement in correct diagnoses
Nurses appear not to use trend information if not readily available
Evaluating the display

Summary
To facilitate the development of a agile safety culture there is a need for both perspectives Macro perspective
Operations perspective Micro perspective
Perspective on human performance
Sustainable safety improvement only with both in tandem Learning is only possible if we allow for it
Continuous effort, continuous change Responsive


![Dr Graham Gulbransen - GP CME North/Fri_Room9_1630... · 2/110 Graham Gulbransen, FRNZCGP, FAChAM • General Practitioner, Kingsland • Ex-Senior Medical Officer [1996 –2012],](https://img.dokumen.tips/doc/110x75/5f9f1d502e27ac0dfd053267/dr-graham-gulbransen-gp-northfriroom91630-2110-graham-gulbransen-frnzcgp.jpg)