Embed Size (px)
Citation preview

SAN JUAN RIVER WATER QUALITY EXCEEDENCES TABLES

Table G-1.-Comparison of New Mexico standards with sample results at approximate 250 cfs flows at the Archuleta, New Mexico, USGS gage
Physical standards for reach 20.6.4.405
Sample values
during Low Flow Test July 9-15,
2001
High quality Wildlife cold water habitat Irrigation Livestock
fishery standard standard standard
Median historical values low flows
(number of samples)
Conductivity (umhos/cm)
Water temp. ("C)
Turbidity
Dissolved oxmen
c400
c20 c20
10 NTU
c6.0
Exceedences of standards
306
12.8
1.4
Parameters
255 (1 1) 0
4.14 (1 1) 0
6.6 (8 ) 1
Streamflow (cfs) I I I I I
Total ammonia (mg/L)
Arsenic diss. (ug/L)
Barium diss. (ug/L)
264 I 260 (1 1) I
see regs
150 100 200
Chromium diss. (ug/L)
Cobalt diss. (ug/L)
HD(76.5) 1 00 1000
50 1000
8.45 I 10.8 (11) I 0
ND
<loo
ND
PH I 6.6-8.8 I 6.6-8.8 I I I
14 (4)
No Data 0
7.5 (8 ) 0
0 8.0 I 7.81 (11) I
Molybdenum diss. (ug/L)
Nickel diss. (ug/L)
Fecal coliform #/lo0 mL I 200 I I I 2000 I
1000
HD(53.8)
4 1 1.5(6) I 0
I Total organic carbon (mg/L) I c7 I No Data
0.08(4)
ND 5 (9)
No Data I 64 (n=4) I I 750 I 5000 Boron diss. (ug/L) I I I c5 I No Data I 0
Beryllium (ug/L) I I 5.3 I I I No Data
No Data
No Data
c5 No Data
Cadmium diss. (ug/L) I I HD(2.3) I I 10 I 50
Copper diss. (ug/L) I I HD(9.3) I I 200 I 500 1 I 5 (8 ) I 0
Lead diss. (uglL) I I HD(2.6) I I 5000 I 100 ~ I 1 (9) I 0
Manganese diss. (uglL) I I I I I
G-1

Table G-1.-Comparison of New Mexico standards with sample results at approximate 250 cfs flows at the Archuleta, New Mexico, USGS gage
Notes: For data below detection levels, the value used to calculate the median value was f i the detection limit. ND is not detected as reported by the laboratory doing the analysis; n is the number of samples taken; diss is dissolved; TREC Total Recoverable Concentration; T is total; Median value is given due to skewness of much of the data; Hardness- dependent standards were calculated with average hardness value. Chronic standards are presented here because generally these are lower values; in some cases there are no chronic standards, only acute. The exceedence column indicates where samples exceeded the standard listed here. Additional checks against the acute standard were not performed for this analysis because this is intended to be only a general comparison of standards along the mainstem of the San Juan River.
G-2
at the
Physical standards Marginal Warm for reach cold water water
Parameters 20.6.4.401 fishery fishery
Streamflow (cfs)
Water temp. ("C) <32.2 <32.2
Dissolved oxygen <6.0 <5.0
PH 6.6-9.0 6.6-9.0 6.6-9.0
Fecal coliform (#/I00 mL) 400
Total ammonia (mg/L) see regs see regs
Arsenic diss. (uglL) 150
Boron diss. (ug/L)
Beryllium (ug/L) 5.3 5.3
Cadmium diss. (ug/L) HD(3.7) HD(3.7)
Chromium diss. (uglL) HD(128.6) HD(128.6)
Cobalt diss. (uglL)
Copper diss. (uglL) HD(15.9) HD(15.9)
Lead diss. (uglL) HD(5.2) HD(5.2)
Molybdenum diss. (uglL)
Nickel diss (uglL) HD(91.9) HD(91.9)
Silver diss. (uglL) HD (11 HD (11
Zinc diss. (uglL) HD(208.9) HD(208.9)
Aluminum diss. (uglL) 87 87
acute) acute)
G-3
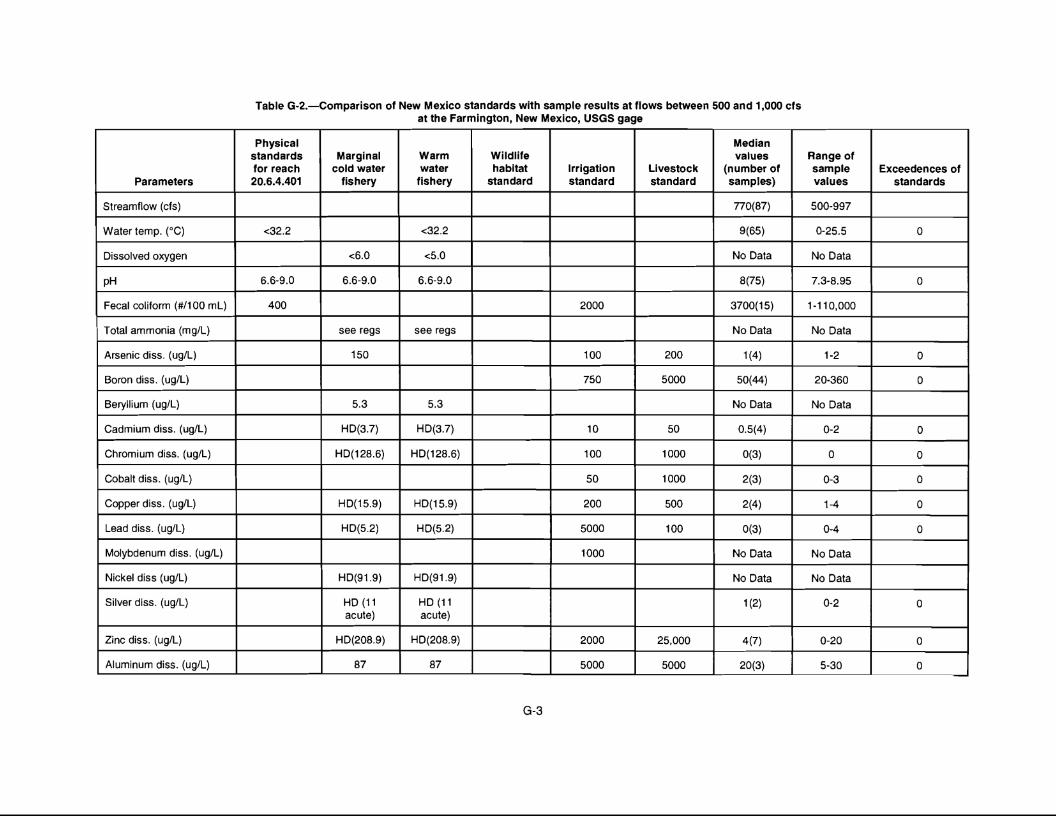
Farmington, New Mexico, USGS gage
Median Wildlife values Range of habitat Irrigation Livestock (number of sample Exceedences of
standard standard standard samples) values standards
770(87) 500-997
9(65) 0-25.5 0
No Data No Data
8(75) 7.3-8.95 0
1-1 10,000
No Data No Data
2000 3700( 15)
100 200 1(4) 1-2 0
750 5000 50(44) 20-360 0
No Data No Data
10 50 0.5(4) 0-2 0
100 1000 O(3) 0 0
50 1000 2(3) 0-3 0
200 500 2(4) 1-4 0
5000 100 O(3) 0-4 0
1000 No Data No Data
No Data No Data
l(2) 0-2 0
2000 25,000 4(7) 0-20 0
5000 5000 20(3) 5-30 0

Table G-2.-Comparison of New Mexico standards with sample results at flows between 500 and 1,000 cfs at the Farmington, New Mexico, USGS gage
Physical standards Marginal for reach cold water
Aluminum diss. (ug/L)
Selenium diss. (ug/L) I I Selenium total (ug/L) 5TREC
Vanadium (ug/L)
Hardness (mg/L) I I Cyanide (ug/L) 5.2
Total chlorine residual 11 (WL)
Total DDT (ug/L) I I Total PCBs (ug/L)
Mercury diss (ug/L) 0.012T
Radium226+228 (pCi/L) I I Tritium (pCi/L)
Total gross alpha (pCi/L)
Wildlife w:r water 1 habitat fishery standard
5TREC 5TREC * 11
l1 I I
I 0.001
0.014 +
Median values Range of
standard values
130 I 50 I l(7) I 0.5-1
1 I I I
100 1 00 No Data No Data
I 196(65) I 130.4-486.1 I No Data No Data
No Data No Data
I I No Data
No Data No Data
1 OT 0.5(3)D 0.1 -0.5
20,000 No Data No Data
15 No Data No Data
Exceedences of
0 1 I
i I
3 I
Notes: For data below detection levels, the value used to calculate the median value was Yi the detection limit. ND is not detected as reported by the laboratory doing the analysis; n is the number of samples taken; diss is dissolved; TREC Total Recoverable Concentration; T is total; Median value is given due to skewness of much of the data; Hardness- dependent standards were calculated with median hardness value. Chronic standards are presented here because generally these are lower values; in some cases there are no chronic standards, only acute. The exceedence column indicates where samples exceeded the standard listed here. Additional checks against the acute standard were not performed for this analysis because this is intended to be only a general comparison of standards along the mainstem of the San Juan River.
G-4
I SN
(0C)O I 2o'o-soo'o
0 I 062-09
I SN
0 E'PC-1'9 I 9L.8-8'L
t (0E)O S'92-20'0
I SN
I SN
(OO2)E OLS-0 1
(piepueis) sanieA spiepueis 40 aldwes t saauapaaaxa lo a6ueu
S

UMUT UMUT UMUT warm water wildlife Rec sec CO aquatic co co
Parameters aquatic life ecology contact life warm 1 Rec l a agriculture
Radon (pCi/L) 150
Tritium (pCilL) 20,000
Aluminum (uglL) 87
Median values Range of Exceedences
(number of sample of standards samples) values (standard)
NS NS
NS NS
15(4) 0-20 0

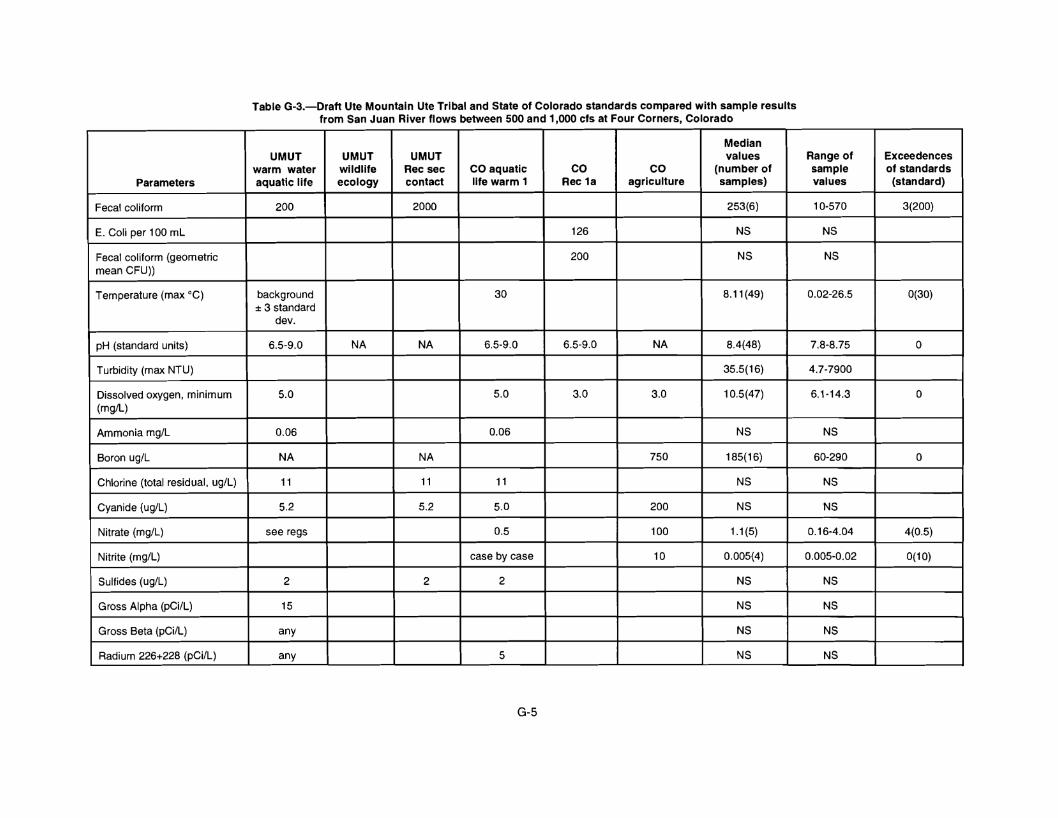
Table G-3.-Draft Ute Mountain Ute Tribal and State of Colorado standards compared with sample results from San Juan River flows between 500 and 1,000 cfs at Four Corners, Colorado
Uranium (ug/L)
Vanadium (ug/L)
Parameters
narrative
UMUT warm water
aquatic life
Silver (ug/L) I HD(20.6 acute)
Thallium (ug/L) I Uranium (pCi/L) I 40
Zinc (ug/L) I 47
Hardness (mg/L) I
UMUT wildlife ecology
UMUT Rec sec contact
CO aquatic life warm 1
HD(1.6)
15
40
HD(4244)
H D(262.9)
Median values Range of
(number of sample samples) values
NS NS
NS NS I I I
3.6(3) 3-7.4 I I I 0.5(7) I 0-6
2000 9(7) 4-30
257(30) 21 5-340
Notes: NCNS - No current numeric standard; HD - hardness dependent; TREC - Total Recoverable; NS - no sample; T - total; D - dissolved
Exceedences of standards (standard)
0
0
Median value is given due to skewness of much of the data. Where the sample result was reported as less than the detection limit, one half the detection limit was used to calculate the median. Hardness-dependent standards were calculated with the median value which generally resulted in a lower standard. Chronic standards are presented here because generally they are lower; in some cases there are no chronic standards, only acute which is noted on the table. The exceedence column indicates where samples exceeded the standard listed here. Additional checks against the acute standards were not performed for this analysis because this is intended to be only a general comparison of standards.
G-7
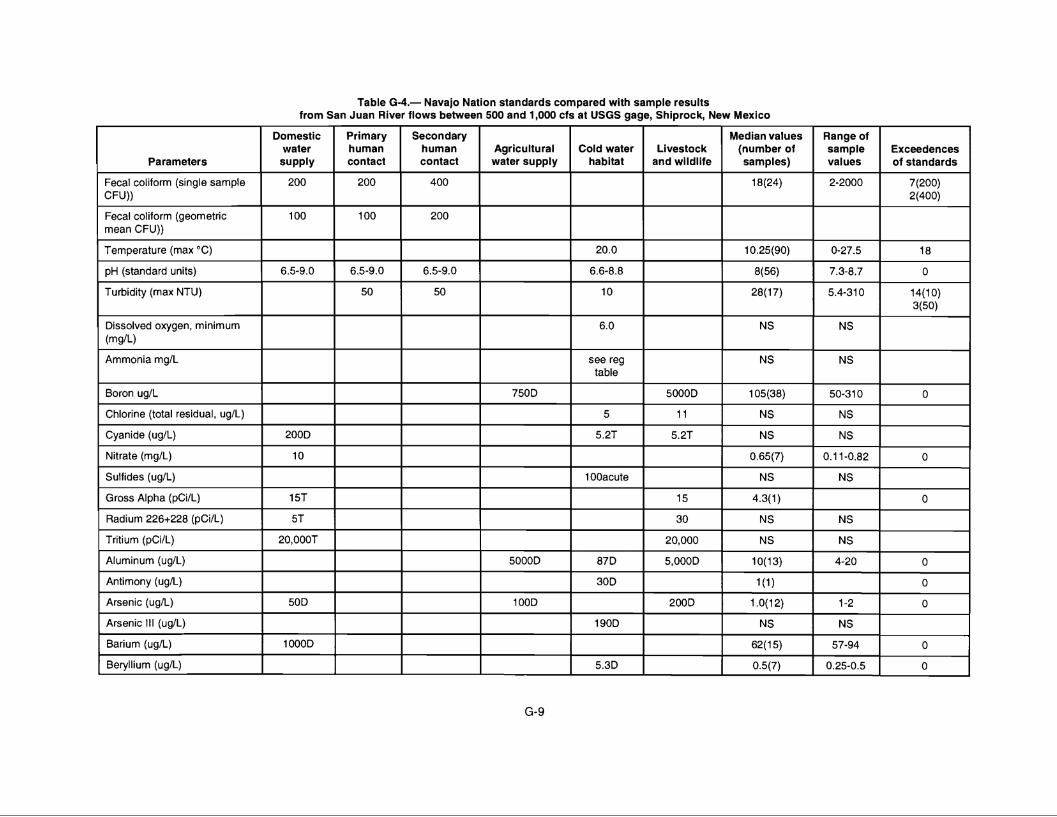
Table G-4.- Navajo Nation standards compared with sample results from San Juan River flows between 500 and 1,000 cfs at USGS gage, Shiprock, New Mexico
Secondary human contact
Agricultural water supply
Nitrate (mg/L)
Sulfides (ug/L)
Gross Alpha (pCi/L)
10 0.65(7) 0.1 1-0.82 0
1 OOacute NS NS
15T 15 4.3(1) 0
Primary human contact
Cold water Livestock habitat and wildlife + Domestic
water supply
200
Median values (number of samples)
18(24)
Range of sample values
2-2000
Exceedences of standards
7(200) 2(400)
Parameters
Fecal coliform (geometric mean CFU))
200 400 I
100 100 2oo I
I Temperature (max "C) I I I I I 10.25(90) I 0-27.5 I 18
I pH (standard units) I 6.5-9.0 I 6.5-9.0 6.5-9.0 I 7.3-8.7
14(10) I I 50 I Turbidity (max NTU)
50 I 28( 17)
see reg I table
I
NS I Dissolved oxygen, minimum
Ammonia mg/L NS I
I 5000D I 105(38) 50-310 I 0
I Chlorine (total residual, ug/L) I I I I 1 5 I l l I NS I N S 1
I Cyanide (ug/L) I 200D I I I I 5.2T I 5.2T I NS I NS I
I Radium 226+228 (pCi/L) I 5T I I I I I 30 I NS I NS I I Tritium (pCi/L) I 20,000T I I I I I 20,000 I NS I NS I
G-9

Table G-4.- Navajo Nation standards compared with sample results from San Juan River flows between 500 and 1,000 cfs at USGS gage, Shiprock, New Mexico
Notes: HD - hardness dependant; NS - no sample; T - total; D - dissolved; NS - no sample; Median value is given due to skewness of much of the data.
Hardness-dependent standards were calculated with the median hardness value which generally resulted in a lower standard. Due to space concerns, chronic standards are presented here because generally these are lower values; in some cases there are no chronic standards only acute. The exceedence column indicates where samples exceeded the standard listed here. Additional checks against the acute standard were not performed for this analysis because this is intended to be only a general comparison of standards along the mainstem of the San Juan River.
G-10

Domestic Recreation source 1 C 28
Aquatic Median values wildlife (number of
38 Agricultural 4 samples) Domestic Recreation source 1 C 28 r Aquatic Median values Range of
wildlife (number of sample Exceedences 38 Agricultural 4 samples) values of standards 3 Parameters
I I I I
Domestic 1 Rec:egtion source 1 C
Aquatic Median values
38 Agricultural 4 samples) I wildlife (number of
5000 5000
2000 200
NS NS
26(22) 1-230 1 single sample single
samples
5000 5000
2000 200
NS
26(22) single sample
5000 5000
2000 200
NS
26(22) single sample
Total
pH (standard units)
Turbidity (NTU increase)
Dissolved oxygen, minimum (mglL) 1 day average
6.5-9.0 6.5-9.0 6.5-9.0 6.5-9.0 8.3(62) 7.2-8.6
+10 +10 56( 19) 1-2000
5.013.0 1 O(50) 6.36-1 2.9
Ammonia mglL
Boron uglL
see reg table 0.055(4) 0.025-0.06
750D NS NS
Fluoride (mglL)
Total suspended solids (mglL)
Total dissolved solids (mglL)
1.4-2.4 NS NS
90 90 NS NS
1200 NS NS
Hydrogen sulfide (uglL)
BOD (mg/L)
Cyanide (ug/L)
2 NS NS
5 5 5 NS NS
700 5.2 NS NS
Nitrate (mg/L)
Gross Alpha (pCi/L)
Gross Beta (pCilL)
10 4 4 0.44(4) 0.12-0.66
15 15 15 NS NS
50 50 50 NS NS
Range of sample values
Range of sample values
Exceedences of standards Exceedences of standards Parameters
coliform (geometric mean CFU) NS NS
1-230 single
samples
Total coliform (geometric mean CFU)
coliform (geometric mean CFU) 1 I Fecal coliform (geometric mean CFU) 1-230 single
samples
1
I I
27 I 10.6(78) I 0-30 I ~
3 I Temperature (max "C)
Chlorine (total residual, uglL) 1 11 NS
G-11

Lead (ug/L)
Mercury (ug/L)
Molybdenum (ug/L)
Nickel (ug/L)
Selenium (ug/L)
G-12
50D HD(14.1) 5000D 0.1-10
0.14 0.01 2 0.1 D(29) 0-0.1 29
1 OD NS NS
610 HD(424) lO(17) 1-50
1 OD 5D 50D 1 D(28) 0.5-5D 2T(25) 0.4-4T
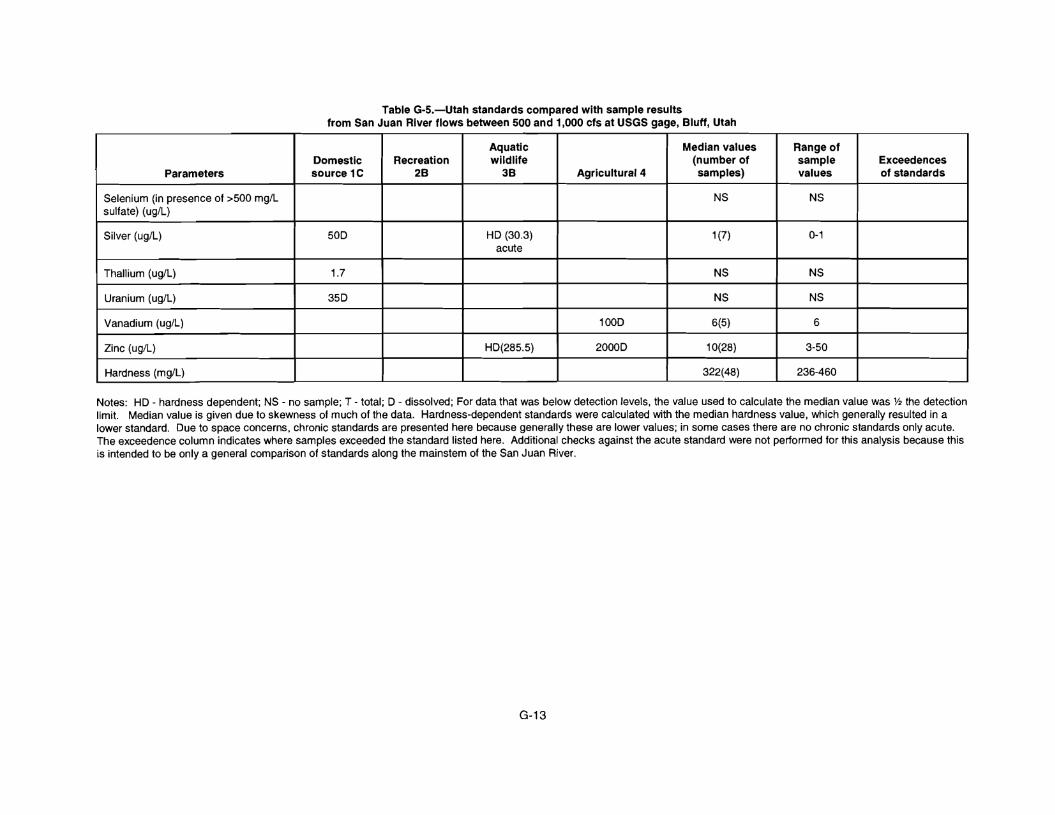
Table G-5.-Utah standards compared with sample results from San Juan River flows between 500 and 1,000 cfs at USGS gage, Bluff, Utah
~ Vanadium (uglL) I I I
Parameters
Thallium (uglL)
Uranium (uglL)
Domestic source 1 C
1.7
35D
I Selenium (in presence of >500 mglL sulfate) (uglL)
Zinc (ug/L)
Hardness (mglL)
Recreation ti HD(285.5)
Aquatic wildlife
38
~
I 50D I Silver (uglL) HD (30.3) acute
Agricultural 4
1 OOD
2000D
Median values Range of (number of sample samples) values
NS 1 - l(7) I 0-1
NS I NS
NS I NS
1 O(28)
322(48) 236-460
Exceedences of standards
Notes: HD - hardness dependent; NS - no sample; T - total; D - dissolved; For data that was below detection levels, the value used to calculate the median value was % the detection limit. Median value is given due to skewness of much of the data. Hardness-dependent standards were calculated with the median hardness value, which generally resulted in a lower standard. Due to space concerns, chronic standards are presented here because generally these are lower values; in some cases there are no chronic standards only acute. The exceedence column indicates where samples exceeded the standard listed here. Additional checks against the acute standard were not performed for this analysis because this is intended to be only a general comparison of standards along the mainstem of the San Juan River.
G-13