Embed Size (px)
Citation preview

Trussell Technologies, Inc. • Pasadena • San Diego • Oakland 1
San Elijo Water Reclamation Facility Chlorine Contact Basin Tracer Study Final Report
Date: August 26, 2010 Prepared for: San Elijo Joint Powers Authority Michael Thornton, P.E. General Manager Prepared by: Trussell Technologies, Inc. Gordon Williams, Ph.D. Brett Faulkner Shane Trussell, Ph.D., P.E.
EXECUTIVE SUMMARY
The San Elijo Joint Powers Authority (SEJPA) is in the process of expanding the San Elijo Water Reclamation Facility (SEWRF) by adding 0.5 MGD of reverse osmosis (RO) membrane treatment capacity. RO membranes are being added to reduce the recycled water salinity, while expanding the peak flow capacity from the existing 2.48 MGD to a peak flow of 3.0 MGD. As required by the California Department of Public Health (CDPH), a chlorine contact basin must be able to provide a modal contact time of at least 90 minutes when producing disinfected recycled water. Trussell Technologies was hired by the SEJPA to assist in performing contact basin tracer studies to determine (1) the maximum allowable flow rate, and (2) modal contact times at various flow rates and the corresponding required chlorine residuals. In April 2009, a modal contact time of 98 minutes was demonstrated during a tracer test at flow rate of 3.02 MGD (Trussell Technologies, 2009). After the first test, it was decided that three additional tests would be completed such that (1) an engineer from CDPH could be present during testing to observe that the protocol is followed, and (2) minimum chlorine residual requirements could be determined for flow rates less than 3.02 MGD. A tracer study protocol was submitted to CDPH on April 9, 2010 (Trussell Technologies, 2010), which followed the same procedures that were used in the April 2009 test. Rhodamine WT dye was spiked into the chlorine contact basin as a pulse and dye concentrations were measured in the contact basin effluent. Effluent samples were collected at frequencies of up to every 30 to 60 seconds as the dye concentration in the contact basin effluent started to peak. Fluorescence was measured onsite using a handheld fluorometer. An engineer from CDPH (Alan Tell) was present at the San Elijo Water Reclamation Facility to observe the tracer study at 2.60 MGD.

SEJPA – Chlorine Contact Basin Tracer Study (August 2010)
Trussell Technologies, Inc. • Pasadena • San Diego • Oakland 2
Three addition tests were conducted in April 2010 at flow rates of 0.84, 1.72, and 2.60 MGD. The testing conditions, data, and findings from these tests are document in this report. Results from the 2009 test at 3.02 MGD are also included in this analysis for comparative purposes. All tracer tests were completed successfully, where dye recoveries exceeded 90% and modal contact times exceeded 90 minutes in all tests. The modal contact times from the 0.84, 1.72, 2.60, and 3.02 MGD tests were 221, 166, 114, and 98 minutes, respectively. The results from the 2009 test at 3.02 MGD fit well with the test results from the 1.72 and 2.60 MGD tests completed in 2010. This fit indicates that the hydraulics through the chlorine contact basin do not change much in the 1.72 to 3.02 MGD flow range. The dye concentration profile from the 0.84 MGD test was different from the other three tests, indicating that at flows less than 1.72 MGD, short-circuiting increases through the SEWRF contact basin. The modal contact time at 0.84 MGD is still more than double the 90 minutes required by the California Water Recycling Criteria. The actual maximum capacity of the SEWRF chlorine contact basin allowable under the California Water Recycling Criteria exceeds 3.02 MGD, as the modal contact time provided at this flow exceeds 90 minutes. However, because CDPH does not allow extrapolation of results from tracer tests, the flow rate through the SEWRF chlorine contact basin should be limited to 3.02 MGD at this time. At this maximum flow, a minimum chlorine residual of 4.60 mg/L should be met. The minimum chlorine residual required for various flows in the range of 0.84 and 3.02 MGD can be determined using Figure 8 in this report. For flow rates less than 0.84 MGD (the minimum flow tested) the chlorine residual should be at minimum 2.1 mg/L.

SEJPA – Chlorine Contact Basin Tracer Study (August 2010)
Trussell Technologies, Inc. • Pasadena • San Diego • Oakland 3
1. BACKGROUND
The San Elijo Joint Powers Authority (SEJPA) is in the process of adding a reverse osmosis (RO) membrane system to decrease the total dissolved solids (TDS) of the final product water and expand the overall capacity of the San Elijo Water Reclamation Facility (SEWRF). Currently, the SEWRF is permitted to produce a maximum flow of 2.48 MGD and SEJPA is planning to expand the product flow by 0.54 MGD (to 3.02 MGD). Before constructing additional disinfection capacity, SEJPA decided to evaluate the actual capacity of the existing chlorine contact basin (CCB). The existing CCB receives flow from tertiary granular-media filters. Sodium hypochlorite is dosed into the process flow as it enters the rapid mix chamber. The water then flows through the four-pass chlorine contact basin, where each channel has a length to width ratio of 10:1 (88 ft long by 8.83 ft width). The CCB effluent weir, which is at a fixed height, sets the water level in the channel. The design sidewater depth is 8.83 ft. The water level varies slightly as a function of flow rate, but because of the fixed weir, remains constant at any given flow (higher water level at higher flows; see Table 1). Thus the theoretical volume varies slightly with flow, and is approximately 215,000 to 220,000 gallons for flows tested in this study and theoretical hydraulic residence times are 367, 180, 122, and 105 minutes, for flow rates of 0.84, 1.72, 2.60, and 3.10 MGD, respectively. The California Title-22 water recycling regulations require that when using chlorine disinfection to produce “disinfected tertiary recycled water”, the CT (chlorine residual multiplied by the modal contact time) must be at least 450 mg/L-min and the modal contact time be at least 90 min (based on peak dry weather design flow; CCR 2009). The modal contact time, as defined by the California Water Recycling Criteria (CCR 2009), is:
“…the amount of time elapsed between the time that a tracer, such as salt or dye, is injected into the influent at the entrance to a chamber and the time that the highest concentration of tracer is observed in the effluent from the chamber.”
The first test to determine the capacity of the SEWRF CCB was performed on April 22, 2009 at a flow rate of 3.02 MGD. The tracer test used a pulse addition of rhodamine WT dye, following the same approach used for the tracer tests described in this report. The peak dye concentration was observed at 99 minutes after dye addition, and using the “n-1” approach for determining the modal contact time, the modal contact time was 98 minutes. The results from this study were reported to the California Department of Public Health (CDPH) in September 2009 (Trussell Technologies, 2009). CDPH notified SEJPA that additional tests at other flow rates would be needed to (1) allow an engineer from CDPH to be present during the test to observe that the protocol is followed, and (2) determine minimum required chlorine residuals for flows less than 3.02 MGD.

SEJPA – Chlorine Contact Basin Tracer Study (August 2010)
Trussell Technologies, Inc. • Pasadena • San Diego • Oakland 4
2. TRACER STUDY PROCEDURE
Three additional tracer tests were completed between April 20 and April 22, 2010, at flow rates of 0.84, 1.72, and 2.60 MGD. A test protocol was submitted to the CDPH for review on April 9, 2010 (Trussell Tech 2010) and a representative from CDPH (Alan Tell) was present at the tracer test on April 20, 2010. After being present at the April 20, 2010 test, CDPH was satisfied that the protocol was being followed and did not require being present for the subsequent tests. Select photographs from the 2010 tracer tests are shown in Figure 1.
Figure 1 – Photographs from 2010 SEJPA tracer studies, showing (A) TigerMag flow meter, (B) bird’s eye view of CCB effluent weir and sampling location (with sample stick), (C) rapid mix chamber seconds after rhodamine WT spike, and (D) CCB basin as viewed from the top (concrete cover).
A
C
B
D

SEJPA – Chlorine Contact Basin Tracer Study (August 2010)
Trussell Technologies, Inc. • Pasadena • San Diego • Oakland 5
As detailed in the test protocol, rhodamine WT dye was used as the tracer and injected as a pulse. Grab samples were collected at frequencies ranging from 30 seconds to 5 minutes, depending on concentration of dye exiting the CCB; as the dye concentration started to peak, the sample collection frequency increased. Samples were analyzer within 5 minutes of sample collection using the Aquafluor handheld fluorometer (Turner Designs, Sunnyvale, CA; see Trussell Technologies, 2009 for additional details). Background fluorescence was monitored prior to each tracer test and was subtracted from the raw fluorescence measurements. The flow through the chlorine contact basin was determined using the filter feed magnetic flow meter (TigerMag FM655; calibrated on April 12, 2010) and subtracting off the near-constant backwash rate (82-86 gpm). To avoid distributing the recycled water during the tracer tests, a temporary bypass pump was installed to pump water from the CCB effluent wet-well to unused aeration and clarifier basins. The water produced during the test was eventually discharged through the ocean outfall. The only deviation from the protocol was during the low-flow test, where samples were collected between 2 and 10 minutes apart (with one sample at 745 min taken after 15 minutes). The sample frequency was slowed down due to the lower flow rate. This changed was discussed with the CDPH engineer (Alan Tell) the day before the low-flow test. This change did not diminish the resolution relative to the other tests, because the low-flow was less than half the next highest flow. There was one noteworthy incident during the low-flow tracer test, when at 585 minutes into the test, a plant control system shutdown the flow to the chlorine contact basin. The flow was restored within 11 minutes. This event did not diminish the validity of the test because the disruption occurred after the modal contact time and more than 90% of the dye was recovered. This is discussed further in the tracer test results section. 3. TRACER STUDY RESULTS AND ANALYSIS
Three additional tracers tests were performed to determine chlorine residual requirements at various operating flows applicable to the SEWRF. This section details the operating conditions, tracer test results, and the chlorine residual requirements for various flows through the SEWRF CCB. For the purpose of comparison, the results from the previously reported 2009 tracer test at 3.02 MGD are also included in this section. 3.1. OVERVIEW OF TESTING CONDITIONS
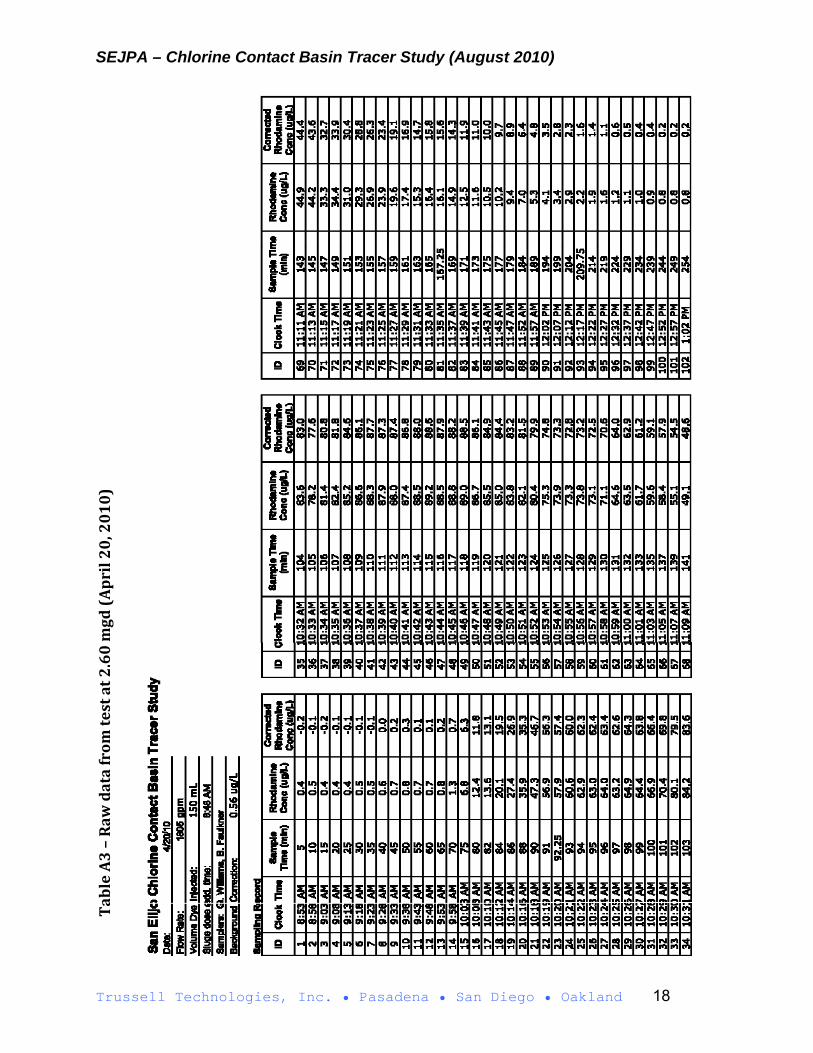
A summary of the conditions for all tracer tests in shown in Table 1. The three 2010 SEJPA tracer tests were conducted on three consecutives days (April 20, 21, and 22). The raw fluorescence data are shown in the Appendix (Tables A1, A2, and A3). The tertiary flow rate was maintained nearly constant in all tests, with the flow rate staying within + 0.5% of the average flow at all times (probability plots in Appendix; Figure A1). The water level was periodically measured during each test (Appendix Table A8) and remained unchanged for all measurements at a given flow. The consistency of the water level was due to the tight flow control and the fixed effluent weir level.

SEJPA – Chlorine Contact Basin Tracer Study (August 2010)
Trussell Technologies, Inc. • Pasadena • San Diego • Oakland 6
Table 1 – Summary of testing conditions for tracer tests�
Parameter Units 0.84 MGD 1.72 MGD 2.60 MGD 3.02 MGD
Date 4/21/10 4/22/10 4/20/10 4/22/09
Chlorine shut off time 4:15 AM N/A1 6:45 AM 10:07 AM
Start time 7:05 AM 8:09 AM 8:49 AM 11:09 AM
Stop time 8:12 PM 2:15 PM 12:59 PM 2:30 PM
Test Duration min 787 366 250 201
Water level at start ft 9.0 9.1 9.2 9.2
Water level at finish ft 9.0 9.1 9.2 9.2
Average Turbidity NTU 1.2 1.2 1.1 1.5
Average Cl2 residual2 mg/L 0.1 0.1 0.1 0.6
Temperature at test start3 °C 21.3 21.3 22.5 20.3
Temperature at test completion3 °C 21.4 22.4 22.8 23.1 Pulse addition time sec 10 10 10 44
Volume rhodamine WT dye added mL 150 150 150 150
Mass of active rhodamine added g 36.0 36.0 36.0 36.0
Mass of active rhodamine recovered g 32.7 34.3 34.4 33.2
Tracer recovery efficiency % 90.8% 95.4% 95.6% 92.2%4
1 No chlorine was added between tests on April 21 and April 22, 2010. 2 Values averaged from the leading edge of the tracer curve to the test completion (i.e. only for the water that had dye in it) 3 As measured at the chlorine contact basin effluent. 4 After the pulse addition in the first test, residual dye remaining in the graduated cylinder was not rinsed out into the rapid mix chamber, resulting in the (a) shorter addition time and (b) lower dye recovery. The graduated cylinder was rinsed and added to the rapid mix within 10 seconds for the 2010 test. The water quality was acceptable in terms of avoiding inference with the fluorescence measurements. The turbidity of the test water was less than 2 NTU for all of 2010 tests, and only exceeded 2 NTU during 1 minute of the 2009 test. Consistent with the protocol, the chlorine addition was turned off at least one hour prior to adding the rhodamine WT dye. The chloramine residual in the tracer water was on average less than 1 mg/L, which was low enough as to not avoid degradation of the rhodamine WT fluorescence during the test (Deaner, 1973)1. Plots of turbidity and chlorine residual are plotted along with the effluent dye concentration versus time in the Appendix (Figures A2 through A5). 3.2. TRACER TEST RESULTS
The tracer test profiles from all the tracer tests are provided in Figures 2 through 5. The plots of dye concentration versus time for flows of 1.72, 2.60, and 3.02 all share a similar profile that indicates dispersion and mixing were relatively low in the contact basin and the baffling efficiency was high. The lowest-flow test at 0.84 MGD had a
1 Deaner (1973) reported that with free-chlorine residual of 11 mg/L, no reduction in rhodamine WT fluorescence was measured over 4 hour time period. For rhodamine WT, the first measurable effects of chlorine show up at CT values of ~4000 mg/L-min. The highest CT exposure during any of the tests was <180 mg/L-min.

SEJPA – Chlorine Contact Basin Tracer Study (August 2010)
Trussell Technologies, Inc. • Pasadena • San Diego • Oakland 7
distinctly different profile from the other three tests at higher flow rates, where, relative to the other tests, the peak dye concentration and baffling efficiency were lower, and the tail on the dye curve was longer. The raw data from the 2010 tests are shown in the Appendix (raw data from the 2009 test can be found in Trussell Technologies, 2009).
Low-Flow Test (0.84 MGD) The low-flow test began at 7:05AM on April 21, 2010. The leading edge was detected at 180 minutes into the test, and the concentration of the dye rapidly increased until the peak concentration of 63.1 g/L was detected at 223 minutes into the test (Figure 2). During this point in the test, grab samples were being collected every 2 minutes, so the modal contact time was 221 min (using the CDPH “n-1” method for determining the modal contact). The low-flow tracer test lasted another 9.5 hours after the peak concentration was observed, until the dye concentrations in the water exiting the basin was near background levels. A total of 132 samples were collected after the dye was spiked.
Figure 2 – Rhodamine dye curve from lowest flow tracer test at 0.84 MGD (4/21/10)
As previously mentioned, at 585 minutes into the low-flow test, flow to the CCB was stopped. An automated controls system shutdown flow to the CCB, because water demands could be met with the water in the recycled water storage. It took 11 minutes to bypass the control and returned the flow to normal. During that period, only 46% of the flow that was expected to go through the chlorine contact basin actually did. This was during the tail end of the tracer test, and the mixing induced by the rapid flow changes caused an immediate increase in the dye concentration (see the late hump on
SEJPA – Chlorine Contact Basin Tracer Study (August 2010)
Trussell Technologies, Inc. • Pasadena • San Diego • Oakland 8
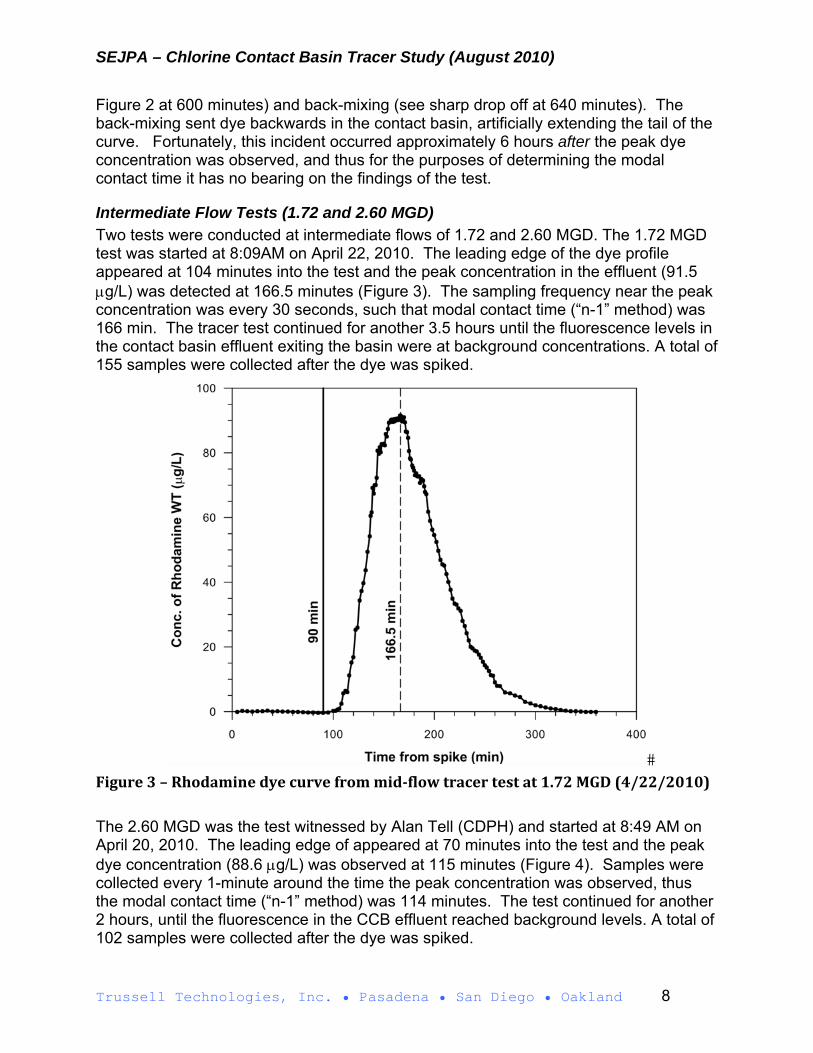
Figure 2 at 600 minutes) and back-mixing (see sharp drop off at 640 minutes). The back-mixing sent dye backwards in the contact basin, artificially extending the tail of the curve. Fortunately, this incident occurred approximately 6 hours after the peak dye concentration was observed, and thus for the purposes of determining the modal contact time it has no bearing on the findings of the test.
Intermediate Flow Tests (1.72 and 2.60 MGD) Two tests were conducted at intermediate flows of 1.72 and 2.60 MGD. The 1.72 MGD test was started at 8:09AM on April 22, 2010. The leading edge of the dye profile appeared at 104 minutes into the test and the peak concentration in the effluent (91.5 g/L) was detected at 166.5 minutes (Figure 3). The sampling frequency near the peak concentration was every 30 seconds, such that modal contact time (“n-1” method) was 166 min. The tracer test continued for another 3.5 hours until the fluorescence levels in the contact basin effluent exiting the basin were at background concentrations. A total of 155 samples were collected after the dye was spiked.
�
Figure 3 – Rhodamine dye curve from mid‐flow tracer test at 1.72 MGD (4/22/2010)
The 2.60 MGD was the test witnessed by Alan Tell (CDPH) and started at 8:49 AM on April 20, 2010. The leading edge of appeared at 70 minutes into the test and the peak dye concentration (88.6 g/L) was observed at 115 minutes (Figure 4). Samples were collected every 1-minute around the time the peak concentration was observed, thus the modal contact time (“n-1” method) was 114 minutes. The test continued for another 2 hours, until the fluorescence in the CCB effluent reached background levels. A total of 102 samples were collected after the dye was spiked.

SEJPA – Chlorine Contact Basin Tracer Study (August 2010)
Trussell Technologies, Inc. • Pasadena • San Diego • Oakland 9
�
Figure 4 – Rhodamine dye curve from mid‐flow tracer test at 2.60 MGD (4/20/2010)
Figure 5 – Rhodamine dye curve from tracer test at 3.02 MGD (4/22/2009; from Trussell Technologies, 2009)

SEJPA – Chlorine Contact Basin Tracer Study (August 2010)
Trussell Technologies, Inc. • Pasadena • San Diego • Oakland 10
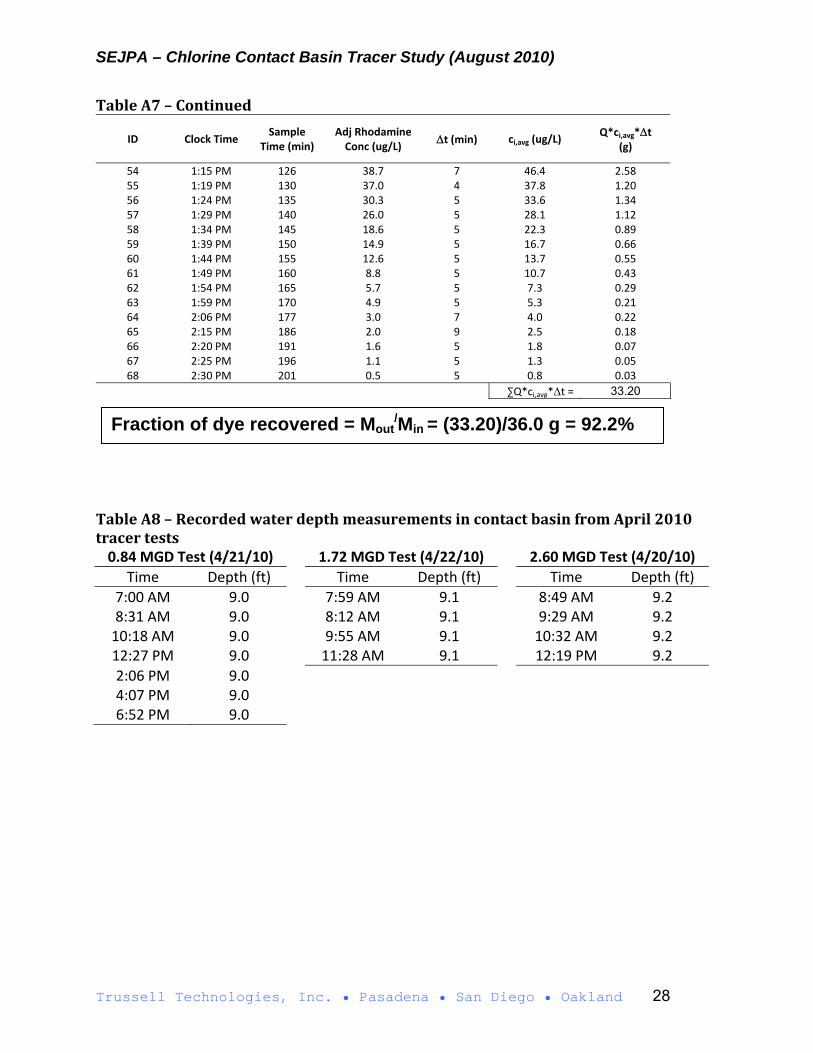
Maximum Flow Test (3.02 MGD) The highest rate test was conducted on April 22, 2009 and was discussed in an earlier report submitted to CDPH (Trussell Technologies, 2009). The results from that test are repeated here for comparative purposes (Figure 5). After the leading edge was detected (at 66 min), sampling frequency increased to every 2 min and eventually to every 1 min. The maximum dye concentration (82.6 ug/L) was observed 99 minutes after dye injection. Thus, the modal contact time (using the “n-1” method) was 98 minutes. Sampling and measurements continued until the fluorescence readings returned to background levels. A total of 68 samples were collected after the dye was spiked. 3.3. RHODAMINE DYE RECOVERY AND QA/QC
The same mass of rhodamine WT dye was added in all tests (150 mL of 20% active dye, which is 36.0 grams of active rhodamine). The fraction of tracer recovered was calculated for both tracer tests using the following equation:
Mout
Min
Qci,avgti
all i
Min
Where Mout/Min
is the fraction of tracer recovered, Q is the flow rate during the tracer test, ci,avg is the average concentration between two consecutive samples, ti
is the elapsed time between those two sample points, and Min
is the total mass of tracer injected. At least 90% of the dye injected must be recovered for a tracer study to be considered reliable (AwwaRF, 1996). For all of the SEWRF tracer studies, the dye recoveries exceeded 90%: recoveries of 90.8%, 95.4%, 95.6% and 92.2%, were calculated for the 0.84, 1.72, 2.60, and 3.02 MGD tests, respectively (Table 1). The calculations used to determine the dye recovery for all four tests are shown the Appendix (Tables A4, A5, A6, and A7). The recovery during the 0.84 MGD test was less than the others, most likely due to the previously discussed flow disruption 6 hours into the test, which caused the remaining dye in the basin to mix backwards in the basin. Continuing the test for another six hours would have likely increased the dye recovery by a few percent. The Aquafluor handheld fluorometer was calibrated in the morning prior to the start of the each tracer test using two-points for calibration (standard for Turner Designs fluorometers; calibration standards of 0 ug/L and 120 ug/L were prepared in the lab using DI water and the same stock rhodamine WT dye used in the spike). For all tests, it was verified that the calibration was in the linear range of the instrument by measuring diluted concentrations of the rhodamine standard at the time of calibration (Table 2 and Figure 6)2. The concentrations observed during the tracer test were all within the linear range of the fluorometer.
2 Calibration data from 3.02 MGD test used different dilutions and were presented in Trussell Technologies (2009): expected concentrations of 120, 60, 30, and 0 g/L were observed as 119.8, 59.2, 20.3, and 0.0 g/L.

SEJPA – Chlorine Contact Basin Tracer Study (August 2010)
Trussell Technologies, Inc. • Pasadena • San Diego • Oakland 11
Table 2 – Fluorometer calibration data from 2010 tracer tests2
Overall dilution factor
(μg/L)
Expected Concentration
(μg/L)
Calibration Check (μg/L)
4/20/10 (2.60 MGD)
4/21/10 (0.84 MGD)
4/22/10 (1.72 MGD)
2.0x10⁶ 120 119.6 119.6 119.7
3.0x10⁶ 80 82.6 81.6 80.5
9.0x10⁶ 40 42.9 42.4 42.1
0 0 0.2 0.1 0.0
Figure 6 – Fluorometer calibration and linear range verification
3.4. COMPARISON BETWEEN TEST FLOW RATES
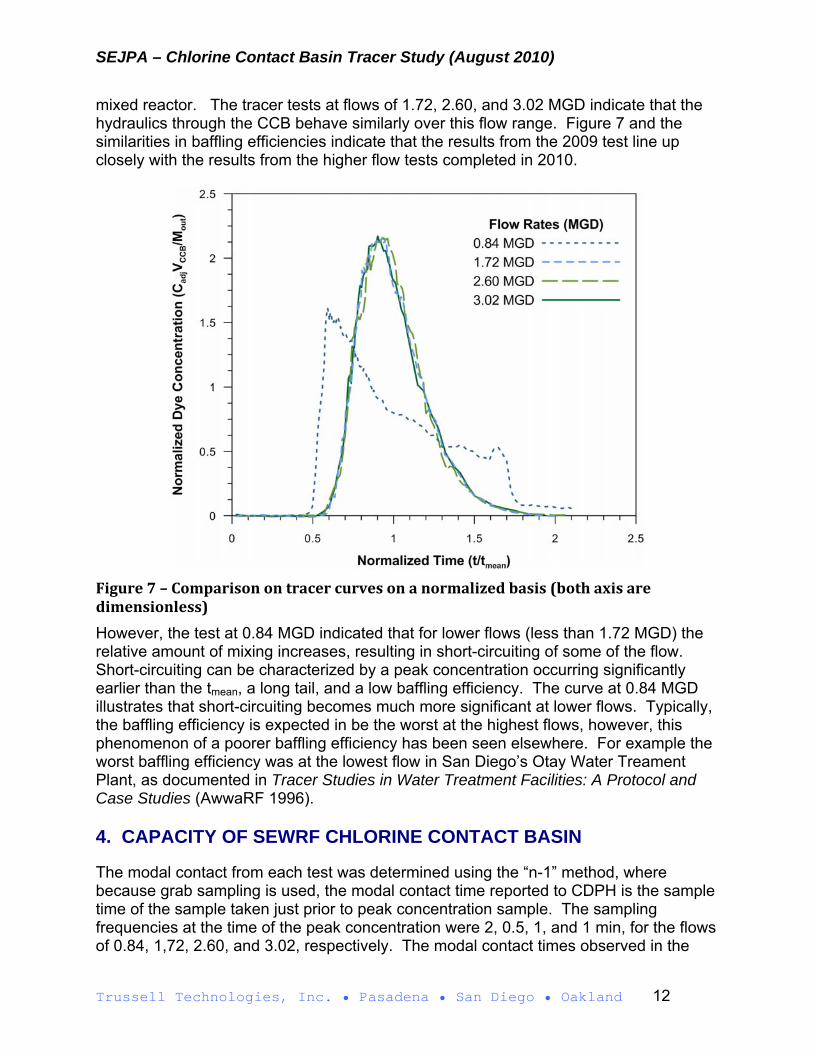
The results from all four tests were normalized and are plotted together in Figure 7. The sample time (t) was normalized by the mean residence time observed in the basin (tmean), and the dye concentration (Cadj) was normalized by multiplying valves by the observed volume of the basin (VCCB) and dividing by the total mass of dye recovered (Mout). The index of modal contact time (i.e. baffling efficiency), which is calculated by dividing the modal time (tmodal) by tmean, were 0.58, 0.93, 0.93, and 0.89 for flows of 1.72, 2.60, and 3.02 MGD, respectively. In Figure 7, the narrower the curve and greater, the more the reactor is behaving like an ideal plug flow, whereas an earlier peak and greater spread of data indicates a more
SEJPA – Chlorine Contact Basin Tracer Study (August 2010)
Trussell Technologies, Inc. • Pasadena • San Diego • Oakland 12
mixed reactor. The tracer tests at flows of 1.72, 2.60, and 3.02 MGD indicate that the hydraulics through the CCB behave similarly over this flow range. Figure 7 and the similarities in baffling efficiencies indicate that the results from the 2009 test line up closely with the results from the higher flow tests completed in 2010.
Figure 7 – Comparison on tracer curves on a normalized basis (both axis are dimensionless)
However, the test at 0.84 MGD indicated that for lower flows (less than 1.72 MGD) the relative amount of mixing increases, resulting in short-circuiting of some of the flow. Short-circuiting can be characterized by a peak concentration occurring significantly earlier than the tmean, a long tail, and a low baffling efficiency. The curve at 0.84 MGD illustrates that short-circuiting becomes much more significant at lower flows. Typically, the baffling efficiency is expected in be the worst at the highest flows, however, this phenomenon of a poorer baffling efficiency has been seen elsewhere. For example the worst baffling efficiency was at the lowest flow in San Diego’s Otay Water Treament Plant, as documented in Tracer Studies in Water Treatment Facilities: A Protocol and Case Studies (AwwaRF 1996). 4. CAPACITY OF SEWRF CHLORINE CONTACT BASIN
The modal contact from each test was determined using the “n-1” method, where because grab sampling is used, the modal contact time reported to CDPH is the sample time of the sample taken just prior to peak concentration sample. The sampling frequencies at the time of the peak concentration were 2, 0.5, 1, and 1 min, for the flows of 0.84, 1,72, 2.60, and 3.02, respectively. The modal contact times observed in the

SEJPA – Chlorine Contact Basin Tracer Study (August 2010)
Trussell Technologies, Inc. • Pasadena • San Diego • Oakland 13
SEWRF tracer tests along with the corresponding minimum chlorine residuals required to achieve a 450 mg/L-min CT are summarized in Table 3. A curve of the required chlorine residual to meet the 450 mg/L-min CT requirement as a function to CCB flow is shown in Figure 8.
Table 3 –Minimum chlorine residual required to meet a 450 mg/L‐min CT at various SEWRF flow rates�
CCB Flow Rate (MGD) Modal Contact Time (min) Minimum Cl2 Residual (mg/L)
0.84 221 2.04
1.72 166 2.72
2.60 114 3.95
3.02 98 4.60
Figure 8 – Curve of minimum chlorine residual required to meet a 450 mg/L‐min CT value between SEWRF flow rates of 0.84 to 3.02 MGD.

SEJPA – Chlorine Contact Basin Tracer Study (August 2010)
Trussell Technologies, Inc. • Pasadena • San Diego • Oakland 14
5. CONCLUSIONS
SEJPA successfully completed four tracer tests studying the SEWRF chlorine contact basin at flow rates of 0.84, 1.72, 2.60, and 3.02 MGD (summary results shown in Table 3). The following conclusions can be drawn from these tests:
The modal contact time at 3.02 MGD was 98 minutes, but because CDPH does not allow extrapolation of results from tracer tests, the maximum allowable flow rate through the SEWRF CCB, as determined by these tests, is 3.02 MGD. At this flow, a minimum chlorine residual of 4.6 mg/L must be met.
Because the results of the test cannot be extrapolated, a minimum chlorine residual of 2.1 mg/L should be maintained at flows less than 0.84 MGD.
The actual maximum capacity of the SEWRF chlorine contact basin allowable under the California Water Recycling Criteria (meeting a minimum 90 minute modal contact time) exceeds 3.02 MGD, and slightly higher flows may be allowable through further tracer tests at higher flow rates.
Results from the 2009 test at 3.02 MGD fit well with the results from the 2010 tests (see Figures 7 and 8).
The hydraulic behavior of flow through the SEWRF CCB is consistent in the 1.72 to 3.02 MGD flow range.
At flows less than 1.72 MGD, the amount of short-circuiting increases. The minimum chlorine residual required for various flows in the range of 0.84
and 3.02 MGD can be determined using Figure 8.
6. REFERENCES
California Code of Regulations (CCR 2009), Title-22, Division 4, Chapter 3, Water Recycling Criteria §60301
Deaner, D.G. (1973). “Effect of chlorine on fluorescent dyes.” Journal of Water Pollution
Control Federation. 45(3) pp. 507-514. Teefy, S. (AWWARF 1996). Tracer Studies in Water Treatment Facilities: A Protocol
and Case Studies. American Water Works Association Research Foundation (AWWARF).
Trussell Technologies (2009). “San Elijo Water Reclamation Facility Chlorine Contact
Basin Tracer Study August 2009.” Prepared for the San Eljio Joint Powers Authority. Submitted to CDPH (Sean Sterchi) on September 4, 2009.
Trussell Technologies (2010). “San Elijo Water Reclamation Facility Chlorine Contact
Basin Tracer Study Protocol.” Prepared for the San Eljio Joint Powers Authority. Submitted to CDPH (Sean Sterchi) on April 9, 2010.
SEJPA – Chlorine Contact Basin Tracer Study (August 2010)
Trussell Technologies, Inc. • Pasadena • San Diego • Oakland 15
US Environmental Protection Agency (USEPA 1991). Guidance manual for compliance with the filtration and disinfection requirements for public water systems using surface water sources. Washington, D.C., March 1991 Edition.
7. APPENDIX – RAW DATA AND FACILITY CONDITIIONS DATA
Tables of raw data (Tables A1 - A3) Chlorine Contact Basin Water Depth Measurements (Table A8) Calculations of the mass of tracer dye recovered (Tables A4 – A7) Flow rate probability plots (Figure A1) Turbidity and chlorine residual data (Figures A2 – A5)

SEJPA – Chlorine Contact Basin Tracer Study (August 2010)
Trussell Technologies, Inc. • Pasadena • San Diego • Oakland 16
Table A1 – Raw data from test at 0.84 mgd (April 21, 2010)

SEJPA – Chlorine Contact Basin Tracer Study (August 2010)
Trussell Technologies, Inc. • Pasadena • San Diego • Oakland 17
Table A2 – Raw data from test at 1.72 mgd (April 22, 2010)
SEJPA – Chlorine Contact Basin Tracer Study (August 2010)
Trussell Technologies, Inc. • Pasadena • San Diego • Oakland 18
Table A3 – Raw data from test at 2.60 mgd (April 20, 2010)

SEJPA – Chlorine Contact Basin Tracer Study (August 2010)
Trussell Technologies, Inc. • Pasadena • San Diego • Oakland 19
Table A4 – Calculation of dye recovery for 0.84 MGD test on April 21, 2010
ID Clock Time Sample
Time (min) Adj Rhodamine Conc (ug/L)
t (min)ci,avg (ug/L)
Q*ci,avg*t (g)
1 7:11 AM 6 0.0 ‐‐ ‐‐ ‐‐ 2 7:27 AM 22 0.2 ‐‐ ‐‐ ‐‐ 3 7:35 AM 30 0.0 ‐‐ ‐‐ ‐‐ 4 7:50 AM 45 0.1 ‐‐ ‐‐ ‐‐ 5 8:05 AM 60 0.0 ‐‐ ‐‐ ‐‐ 6 8:21 AM 76 0.0 ‐‐ ‐‐ ‐‐ 7 8:35 AM 90 0.0 ‐‐ ‐‐ ‐‐ 8 8:50 AM 105 0.0 ‐‐ ‐‐ ‐‐ 9 9:05 AM 120 0.1 ‐‐ ‐‐ ‐‐ 10 9:20 AM 135 0.1 ‐‐ ‐‐ ‐‐ 11 9:35 AM 150 0.0 ‐‐ ‐‐ ‐‐ 12 9:50 AM 165 0.0 ‐‐ ‐‐ ‐‐ 13 10:05 AM 180 0.9 5 0.5 0.01 14 10:12 AM 187.5 2.8 7.5 1.9 0.03 15 10:20 AM 195 14.1 7.5 8.5 0.14 16 10:25 AM 200 26.3 5 20.2 0.22 17 10:30 AM 205 32.6 5 29.5 0.33 18 10:35 AM 210 37.8 5 35.2 0.39 19 10:40 AM 215 46.6 5 42.2 0.47 20 10:42 AM 217 55.2 2 50.9 0.23 21 10:44 AM 219 60.0 2 57.6 0.26 22 10:46 AM 221 61.6 2 60.8 0.27 23 10:48 AM 223 63.1 2 62.3 0.28 24 10:50 AM 225 61.1 2 62.1 0.28 25 10:52 AM 227 59.4 2 60.2 0.27 26 10:54 AM 229 61.6 2 60.5 0.27 27 10:56 AM 231 61.7 2 61.6 0.27 28 10:58 AM 233 59.4 2 60.5 0.27 29 11:00 AM 235 58.4 2 58.9 0.26 30 11:02 AM 237 59.2 2 58.8 0.26 31 11:04 AM 239 59.0 2 59.1 0.26 32 11:06 AM 241 58.0 2 58.5 0.26 33 11:08 AM 243 59.2 2 58.6 0.26 34 11:10 AM 245 60.4 2 59.8 0.27 35 11:12 AM 247 60.2 2 60.3 0.27 36 11:14 AM 249 59.2 2 59.7 0.26 37 11:16 AM 251 58.8 2 59.0 0.26 38 11:18 AM 253 57.0 2 57.9 0.26 39 11:20 AM 255 57.1 2 57.0 0.25 40 11:22 AM 257 55.5 2 56.3 0.25 41 11:24 AM 259 54.8 2 55.2 0.24 42 11:26 AM 261 55.5 2 55.2 0.24 43 11:28 AM 263 55.5 2 55.5 0.25 44 11:30 AM 265 55.2 2 55.4 0.25 45 11:32 AM 267 54.4 2 54.8 0.24 46 11:34 AM 269 53.9 2 54.2 0.24 47 11:36 AM 271 53.6 2 53.7 0.24 48 11:38 AM 273 52.8 2 53.2 0.24 49 11:40 AM 275 52.9 2 52.9 0.23 50 11:42 AM 277 53.2 2 53.1 0.24 51 11:44 AM 279 52.2 2 52.7 0.23 52 11:46 AM 281 51.3 2 51.8 0.23 53 11:48 AM 283 50.2 2 50.8 0.23

SEJPA – Chlorine Contact Basin Tracer Study (August 2010)
Trussell Technologies, Inc. • Pasadena • San Diego • Oakland 20
Table A4 – Continued
ID Clock Time Sample
Time (min) Adj Rhodamine Conc (ug/L)
t (min)ci,avg (ug/L)
Q*ci,avg*t (g)
54 11:50 AM 285 49.8 2 50.0 0.22 55 11:52 AM 287 49.1 2 49.5 0.22 56 11:54 AM 289 48.2 2 48.6 0.22 57 11:56 AM 291 48.7 2 48.5 0.21 58 11:58 AM 293 47.6 2 48.2 0.21 59 12:00 PM 295 46.1 2 46.8 0.21 60 12:02 PM 297 45.5 2 45.8 0.20 61 12:04 PM 299 45.2 2 45.3 0.20 62 12:06 PM 301 45.3 2 45.2 0.20 63 12:08 PM 303 44.2 2 44.8 0.20 64 12:10 PM 305 43.9 2 44.0 0.20 65 12:12 PM 307 44.6 2 44.2 0.20 66 12:14 PM 309 43.6 2 44.1 0.20 67 12:16 PM 311 43.4 2 43.5 0.19 68 12:18 PM 313 42.6 2 43.0 0.19 69 12:20 PM 315 41.7 2 42.2 0.19 70 12:22 PM 317 42.2 2 42.0 0.19 71 12:24 PM 319 41.5 2 41.9 0.19 72 12:26 PM 321 40.4 2 41.0 0.18 73 12:28 PM 323 39.4 2 39.9 0.18 74 12:30 PM 325 39.1 2 39.3 0.17 75 12:32 PM 327 37.5 2 38.3 0.17 76 12:34 PM 329 37.7 2 37.6 0.17 77 12:35 PM 330 38.2 1 37.9 0.08 78 12:40 PM 335 36.3 5 37.2 0.41 79 12:45 PM 340 35.6 5 36.0 0.40 80 12:50 PM 345 35.3 5 35.4 0.39 81 12:55 PM 350 35.3 5 35.3 0.39 82 1:00 PM 355 33.6 5 34.4 0.38 83 1:05 PM 360 32.4 5 33.0 0.37 84 1:10 PM 365 31.7 5 32.0 0.36 85 1:15 PM 370 31.6 5 31.6 0.35 86 1:20 PM 375 31.4 5 31.5 0.35 87 1:25 PM 380 30.9 5 31.2 0.35 88 1:30 PM 385 30.7 5 30.8 0.34 89 1:35 PM 390 30.7 5 30.7 0.34 90 1:40 PM 395 30.8 5 30.7 0.34 91 1:45 PM 400 30.3 5 30.5 0.34 92 1:50 PM 405 30.1 5 30.2 0.33 93 1:55 PM 410 29.4 5 29.7 0.33 94 2:00 PM 415 29.3 5 29.3 0.33 95 2:05 PM 420 29.4 5 29.4 0.33 96 2:15 PM 430 28.2 10 28.8 0.64 97 2:25 PM 440 27.4 10 27.8 0.62 98 2:35 PM 450 26.3 10 26.8 0.60 99 2:45 PM 460 24.4 10 25.3 0.56 100 2:55 PM 470 24.5 10 24.4 0.54 101 3:05 PM 480 22.9 10 23.7 0.53 102 3:15 PM 490 20.9 10 21.9 0.49 103 3:25 PM 500 21.0 10 20.9 0.46 104 3:35 PM 510 21.0 10 21.0 0.47 105 3:45 PM 520 20.8 10 20.9 0.46 106 3:55 PM 530 21.4 10 21.1 0.47

SEJPA – Chlorine Contact Basin Tracer Study (August 2010)
Trussell Technologies, Inc. • Pasadena • San Diego • Oakland 21
Table A4 – Continued
ID Clock Time Sample
Time (min) Adj Rhodamine Conc (ug/L)
t (min) ci,avg (ug/L) Q*ci,avg*t
(g)
107 4:05 PM 540 21.0 10 21.2 0.47 108 4:15 PM 550 19.7 10 20.4 0.45 109 4:25 PM 560 19.7 10 19.7 0.44 110 4:35 PM 570 18.5 10 19.1 0.42 111 4:45 PM 580 17.4 10 18.0 0.40 112 4:55 PM 590 17.7 10 17.6 0.39 113 5:04 PM 599 16.7 9 17.2 0.34 114 5:15 PM 610 20.3 11 18.5 0.45 115 5:25 PM 620 20.9 10 20.6 0.46 116 5:35 PM 630 18.8 10 19.9 0.44 117 5:45 PM 640 16.8 10 17.8 0.40 118 5:55 PM 650 7.5 10 12.1 0.27 119 6:05 PM 660 4.8 10 6.1 0.14 120 6:15 PM 670 3.3 10 4.1 0.09 121 6:25 PM 680 3.2 10 3.3 0.07 122 6:35 PM 690 3.0 10 3.1 0.07 123 6:45 PM 700 3.4 10 3.2 0.07 124 6:55 PM 710 3.0 10 3.2 0.07 125 7:05 PM 720 2.8 10 2.9 0.06 126 7:15 PM 730 2.7 10 2.8 0.06 127 7:30 PM 745 2.9 15 2.8 0.09 128 7:35 PM 750 2.6 5 2.8 0.03 129 7:45 PM 760 2.4 10 2.5 0.06 130 7:55 PM 770 2.2 10 2.3 0.05 131 8:05 PM 780 2.6 10 2.4 0.05 132 8:15 PM 790 2.3 10 2.4 0.05
∑Q*ci,avg*t = 32.92
*At 4:50PM on 4/21/2010 the valve to the chlorine contact basin started to close due to programming in the SCADA system that shuts down the recycled water system when recycled water demands and being met and the reservoir is full. Flow was restored to the target flow by 5:01PM. Over this 11 minute period, 3000 gallons exited the chlorine contact basin, but in the Table 5 calculations, it was assumed that 6446 gallons exited the contact basin. The average adjusted rhodamine concentration during this time was 17.2 g/L. Thus, the above calculations over estimated the mass of dye recovered by 3446 gallons with 17.2 g/L, or 0.22 g of rhodamine. Thus the total amount of dye recovered was 32.79 grams or 90.8% of the dye.
Fraction of dye recovered = Mout/Min = (32.92 g -0.22 g)/36.0 g = 90.8%

SEJPA – Chlorine Contact Basin Tracer Study (August 2010)
Trussell Technologies, Inc. • Pasadena • San Diego • Oakland 22
Table A5 – Calculation of dye recovery for 1.72 MGD test on April 22, 2010
ID Clock Time Sample Time
(min) Adj Rhodamine Conc
(ug/L) t (min)
ci,avg (ug/L)
Q*ci,avg*t (g)
1 8:14 AM 5 ‐0.1 ‐‐ ‐‐ ‐‐ 2 8:19 AM 10 0.2 ‐‐ ‐‐ ‐‐ 3 8:24 AM 15 0.1 ‐‐ ‐‐ ‐‐ 4 8:29 AM 20 0.0 ‐‐ ‐‐ ‐‐ 5 8:34 AM 25 0.1 ‐‐ ‐‐ ‐‐ 6 8:39 AM 30 0.1 ‐‐ ‐‐ ‐‐ 7 8:44 AM 35 0.3 ‐‐ ‐‐ ‐‐ 8 8:49 AM 40 0.0 ‐‐ ‐‐ ‐‐ 9 8:54 AM 45 0.1 ‐‐ ‐‐ ‐‐ 10 8:59 AM 50 0.0 ‐‐ ‐‐ ‐‐ 11 9:04 AM 55 0.0 ‐‐ ‐‐ ‐‐ 12 9:09 AM 60 ‐0.1 ‐‐ ‐‐ ‐‐ 13 9:14 AM 65 ‐0.1 ‐‐ ‐‐ ‐‐ 14 9:19 AM 70 ‐0.2 ‐‐ ‐‐ ‐‐ 15 9:24 AM 75 ‐0.3 ‐‐ ‐‐ ‐‐ 16 9:29 AM 80 ‐0.3 ‐‐ ‐‐ ‐‐ 17 9:34 AM 85 ‐0.4 ‐‐ ‐‐ ‐‐ 18 9:39 AM 90 ‐0.4 ‐‐ ‐‐ ‐‐ 19 9:44 AM 95 ‐0.3 ‐‐ ‐‐ ‐‐ 20 9:49 AM 100 0.2 ‐‐ ‐‐ ‐‐ 21 9:51 AM 102 0.2 ‐‐ ‐‐ ‐‐ 22 9:53 AM 104 0.6 2 0.4 0.00 23 9:55 AM 106 0.9 2 0.7 0.01 24 9:57 AM 108 2.4 2 1.7 0.02 25 9:59 AM 110 5.6 2 4.0 0.04 26 10:01 AM 112 6.4 2 6.0 0.05 27 10:03 AM 114 6.1 2 6.2 0.06 28 10:05 AM 116 11.2 2 8.7 0.08 29 10:07 AM 118 15.2 2 13.2 0.12 30 10:09 AM 120 16.9 2 16.0 0.15 31 10:11 AM 122 25.3 2 21.1 0.19 32 10:13 AM 124 25.9 2 25.6 0.23 33 10:15 AM 126 34.4 2 30.2 0.27 34 10:17 AM 128 37.3 2 35.8 0.32 35 10:19 AM 130 39.7 2 38.5 0.35 36 10:21 AM 132 43.6 2 41.7 0.38 37 10:23 AM 134 49.5 2 46.5 0.42 38 10:25 AM 136 54.2 2 51.8 0.47 39 10:26 AM 137 60.6 1 57.4 0.26 40 10:27 AM 138 61.6 1 61.1 0.28 41 10:28 AM 139 69.1 1 65.4 0.30 42 10:29 AM 140 67.4 1 68.3 0.31 43 10:30 AM 141 70.1 1 68.7 0.31 44 10:31 AM 142 70.0 1 70.0 0.32 45 10:32 AM 143 72.3 1 71.2 0.32 46 10:33 AM 144 80.6 1 76.4 0.35 47 10:34 AM 145 79.7 1 80.1 0.36 48 10:35 AM 146 81.7 1 80.7 0.37 49 10:36 AM 147 80.2 1 80.9 0.37 50 10:37 AM 148 82.7 1 81.5 0.37 51 10:38 AM 149 82.5 1 82.6 0.37 52 10:39 AM 150 82.8 1 82.7 0.37 53 10:40 AM 151 82.3 1 82.5 0.37

SEJPA – Chlorine Contact Basin Tracer Study (August 2010)
Trussell Technologies, Inc. • Pasadena • San Diego • Oakland 23
Table A5 – Continued
ID Clock Time Sample Time
(min) Adj Rhodamine Conc
(ug/L) t (min)
ci,avg (ug/L)
Q*ci,avg*t (g)
54 10:41 AM 152 85.8 1 84.1 0.38 55 10:42 AM 153 85.0 1 85.4 0.39 56 10:43 AM 154 87.3 1 86.2 0.39 57 10:44 AM 155 89.3 1 88.3 0.40 58 10:45 AM 156 89.4 1 89.4 0.40 59 10:46 AM 157 90.1 1 89.8 0.41 60 10:47 AM 158 90.3 1 90.2 0.41 61 10:48 AM 159 89.5 1 89.9 0.41 62 10:49 AM 160 90.3 1 89.9 0.41 63 10:50 AM 161 89.8 1 90.1 0.41 64 10:51 AM 162 90.1 1 90.0 0.41 65 10:52 AM 163 90.6 1 90.4 0.41 66 10:53 AM 164 90.1 1 90.3 0.41 67 10:53 AM 164.5 90.4 0.5 90.2 0.20 68 10:54 AM 165 90.7 0.5 90.6 0.21 69 10:54 AM 165.5 90.2 0.5 90.5 0.21 70 10:55 AM 166 91.4 0.5 90.8 0.21 71 10:55 AM 166.5 91.5 0.5 91.5 0.21 72 10:56 AM 167 91.3 0.5 91.4 0.21 73 10:56 AM 167.5 90.9 0.5 91.1 0.21 74 10:57 AM 168 89.7 0.5 90.3 0.20 75 10:57 AM 168.5 89.9 0.5 89.8 0.20 76 10:58 AM 169 90.0 0.5 90.0 0.20 77 10:58 AM 169.5 89.9 0.5 90.0 0.20 78 10:59 AM 170 91.0 0.5 90.4 0.20 79 11:00 AM 171 89.4 1 90.2 0.41 80 11:01 AM 172 86.6 1 88.0 0.40 81 11:02 AM 173 86.4 1 86.5 0.39 82 11:03 AM 174 84.6 1 85.5 0.39 83 11:04 AM 175 80.6 1 82.6 0.37 84 11:05 AM 176 78.3 1 79.4 0.36 85 11:06 AM 177 77.9 1 78.1 0.35 86 11:07 AM 178 76.1 1 77.0 0.35 87 11:08 AM 179 75.4 1 75.8 0.34 88 11:09 AM 180 74.6 1 75.0 0.34 89 11:10 AM 181 73.1 1 73.8 0.33 90 11:11 AM 182 73.6 1 73.4 0.33 91 11:12 AM 183 72.8 1 73.2 0.33 92 11:13 AM 184 72.7 1 72.8 0.33 93 11:14 AM 185 72.7 1 72.7 0.33 94 11:15 AM 186 70.7 1 71.7 0.32 95 11:16 AM 187 71.9 1 71.3 0.32 96 11:17 AM 188 71.6 1 71.7 0.32 97 11:18 AM 189 71.4 1 71.5 0.32 98 11:19 AM 190 69.6 1 70.5 0.32 99 11:20 AM 191 67.9 1 68.8 0.31 100 11:21 AM 192 67.2 1 67.5 0.31 101 11:23 AM 194 61.8 2 64.5 0.58 102 11:25 AM 196 59.0 2 60.4 0.55 103 11:27 AM 198 56.2 2 57.6 0.52 104 11:29 AM 200 54.6 2 55.4 0.50 105 11:31 AM 202 52.5 2 53.5 0.48 106 11:33 AM 204 49.7 2 51.1 0.46

SEJPA – Chlorine Contact Basin Tracer Study (August 2010)
Trussell Technologies, Inc. • Pasadena • San Diego • Oakland 24
Table A5 – Continued
ID Clock Time Sample
Time (min) Adj Rhodamine Conc (ug/L)
t (min) ci,avg (ug/L) Q*ci,avg*t
(g)
107 11:35 AM 206 46.9 2 48.3 0.44 108 11:37 AM 208 45.5 2 46.2 0.42 109 11:39 AM 210 45.2 2 45.4 0.41 110 11:41 AM 212 42.5 2 43.8 0.40 111 11:43 AM 214 40.1 2 41.3 0.37 112 11:45 AM 216 37.6 2 38.9 0.35 113 11:47 AM 218 34.9 2 36.3 0.33 114 11:49 AM 220 33.4 2 34.2 0.31 115 11:51 AM 222 33.1 2 33.2 0.30 116 11:53 AM 224 31.9 2 32.5 0.29 117 11:55 AM 226 31.1 2 31.5 0.29 118 11:57 AM 228 28.0 2 29.6 0.27 119 11:59 AM 230 26.4 2 27.2 0.25 120 12:01 PM 232 24.2 2 25.3 0.23 121 12:03 PM 234 22.0 2 23.1 0.21 122 12:05 PM 236 20.0 2 21.0 0.19 123 12:07 PM 238 19.6 2 19.8 0.18 124 12:09 PM 240 18.9 2 19.2 0.17 125 12:11 PM 242 18.6 2 18.7 0.17 126 12:13 PM 244 17.6 2 18.1 0.16 127 12:15 PM 246 16.6 2 17.1 0.16 128 12:17 PM 248 15.4 2 16.0 0.14 129 12:19 PM 250 14.3 2 14.9 0.13 130 12:21 PM 252 13.6 2 14.0 0.13 131 12:23 PM 254 12.5 2 13.1 0.12 132 12:25 PM 256 11.3 2 11.9 0.11 133 12:27 PM 258 11.1 2 11.2 0.10 134 12:29 PM 260 9.0 2 10.1 0.09 135 12:31 PM 262 8.0 2 8.5 0.08 136 12:34 PM 265 7.8 3 7.9 0.11 137 12:39 PM 270 5.9 5 6.9 0.16 138 12:44 PM 275 5.6 5 5.8 0.13 139 12:49 PM 280 5.0 5 5.3 0.12 140 12:54 PM 285 4.4 5 4.7 0.11 141 12:59 PM 290 3.0 5 3.7 0.08 142 1:04 PM 295 2.5 5 2.8 0.06 143 1:09 PM 300 2.0 5 2.3 0.05 144 1:14 PM 305 1.6 5 1.8 0.04 145 1:19 PM 310 1.2 5 1.4 0.03 146 1:24 PM 315 0.9 5 1.1 0.02 147 1:29 PM 320 0.8 5 0.9 0.02 148 1:34 PM 325 0.5 5 0.7 0.02 149 1:39 PM 330 0.3 5 0.4 0.01 150 1:44 PM 335 0.1 5 0.2 0.00 151 1:49 PM 340 0.1 5 0.1 0.00 152 1:54 PM 345 0.0 5 0.1 0.00 153 1:59 PM 350 0 5 0 0.00 154 2:04 PM 355 0 5 0 0.00 155 2:09 PM 360 0 5 0 0.00
∑Q*ci,avg*t = 34.34
Fraction of dye recovered = Mout/Min = (34.34)/36.0 g = 95.4%

SEJPA – Chlorine Contact Basin Tracer Study (August 2010)
Trussell Technologies, Inc. • Pasadena • San Diego • Oakland 25
Table A6 – Calculation of dye recovery for 2.60 MGD test on April 20, 2010
ID Clock Time Sample Time
(min) Adj Rhodamine Conc
(ug/L) t (min)
ci,avg (ug/L)
Q*ci,avg*t (g)
1 8:53 AM 5 ‐0.2 ‐‐ ‐‐ ‐‐ 2 8:58 AM 10 ‐0.1 ‐‐ ‐‐ ‐‐ 3 9:03 AM 15 ‐0.2 ‐‐ ‐‐ ‐‐ 4 9:08 AM 20 ‐0.1 ‐‐ ‐‐ ‐‐ 5 9:13 AM 25 ‐0.1 ‐‐ ‐‐ ‐‐ 6 9:18 AM 30 ‐0.1 ‐‐ ‐‐ ‐‐ 7 9:23 AM 35 ‐0.1 ‐‐ ‐‐ ‐‐ 8 9:28 AM 40 0.0 ‐‐ ‐‐ ‐‐ 9 9:33 AM 45 0.2 ‐‐ ‐‐ ‐‐ 10 9:38 AM 50 0.3 ‐‐ ‐‐ ‐‐ 11 9:43 AM 55 0.1 ‐‐ ‐‐ ‐‐ 12 9:48 AM 60 0.1 ‐‐ ‐‐ ‐‐ 13 9:53 AM 65 0.2 ‐‐ ‐‐ ‐‐ 14 9:58 AM 70 0.7 5 0.5 0.02 15 10:03 AM 75 6.3 5 3.5 0.12 16 10:08 AM 80 11.8 5 9.0 0.31 17 10:10 AM 82 13.1 2 12.4 0.17 18 10:12 AM 84 19.5 2 16.3 0.22 19 10:14 AM 86 26.9 2 23.2 0.32 20 10:16 AM 88 35.3 2 31.1 0.42 21 10:18 AM 90 46.7 2 41.0 0.56 22 10:19 AM 91 56.3 1 51.5 0.35 23 10:20 AM 92.25 57.4 1.25 56.9 0.49 24 10:21 AM 93 60.0 0.75 58.7 0.30 25 10:22 AM 94 62.3 1 61.2 0.42 26 10:23 AM 95 62.4 1 62.4 0.43 27 10:24 AM 96 63.4 1 62.9 0.43 28 10:25 AM 97 62.6 1 63.0 0.43 29 10:26 AM 98 64.3 1 63.5 0.43 30 10:27 AM 99 63.8 1 64.1 0.44 31 10:28 AM 100 66.4 1 65.1 0.44 32 10:29 AM 101 69.8 1 68.1 0.47 33 10:30 AM 102 79.5 1 74.7 0.51 34 10:31 AM 103 83.6 1 81.6 0.56 35 10:32 AM 104 83.0 1 83.3 0.57 36 10:33 AM 105 77.6 1 80.3 0.55 37 10:34 AM 106 80.8 1 79.2 0.54 38 10:35 AM 107 81.8 1 81.3 0.56 39 10:36 AM 108 84.6 1 83.2 0.57 40 10:37 AM 109 86.1 1 85.3 0.58 41 10:38 AM 110 87.7 1 86.9 0.59 42 10:39 AM 111 87.3 1 87.5 0.60 43 10:40 AM 112 87.4 1 87.4 0.60 44 10:41 AM 113 86.8 1 87.1 0.60 45 10:42 AM 114 88.0 1 87.4 0.60 46 10:43 AM 115 88.6 1 88.3 0.60 47 10:44 AM 116 87.9 1 88.3 0.60 48 10:45 AM 117 88.2 1 88.1 0.60 49 10:46 AM 118 88.5 1 88.4 0.60 50 10:47 AM 119 86.1 1 87.3 0.60 51 10:48 AM 120 84.9 1 85.5 0.58 52 10:49 AM 121 84.4 1 84.6 0.58 53 10:50 AM 122 83.2 1 83.8 0.57

SEJPA – Chlorine Contact Basin Tracer Study (August 2010)
Trussell Technologies, Inc. • Pasadena • San Diego • Oakland 26
Table A6 – Continued
ID Clock Time Sample
Time (min) Adj Rhodamine Conc (ug/L)
t (min) ci,avg (ug/L) Q*ci,avg*t
(g)
54 10:51 AM 123 81.5 1 82.4 0.56 55 10:52 AM 124 79.9 1 80.7 0.55 56 10:53 AM 125 74.8 1 77.3 0.53 57 10:54 AM 126 73.3 1 74.0 0.51 58 10:55 AM 127 72.8 1 73.0 0.50 59 10:56 AM 128 73.2 1 73.0 0.50 60 10:57 AM 129 72.5 1 72.9 0.50 61 10:58 AM 130 70.6 1 71.6 0.49 62 10:59 AM 131 64.0 1 67.3 0.46 63 11:00 AM 132 62.9 1 63.5 0.43 64 11:01 AM 133 61.2 1 62.0 0.42 65 11:03 AM 135 59.1 2 60.1 0.82 66 11:05 AM 137 57.9 2 58.5 0.80 67 11:07 AM 139 54.5 2 56.2 0.77 68 11:09 AM 141 48.6 2 51.5 0.70 69 11:11 AM 143 44.4 2 46.5 0.63 70 11:13 AM 145 43.6 2 44.0 0.60 71 11:15 AM 147 32.7 2 38.2 0.52 72 11:17 AM 149 33.9 2 33.3 0.45 73 11:19 AM 151 30.4 2 32.1 0.44 74 11:21 AM 153 28.8 2 29.6 0.40 75 11:23 AM 155 26.3 2 27.5 0.38 76 11:25 AM 157 23.4 2 24.9 0.34 77 11:27 AM 159 19.1 2 21.2 0.29 78 11:29 AM 161 16.9 2 18.0 0.25 79 11:31 AM 163 14.7 2 15.8 0.22 80 11:33 AM 165 15.8 2 15.3 0.21 81 11:35 AM 167.25 15.6 2.25 15.7 0.24 82 11:37 AM 169 14.3 1.75 14.9 0.18 83 11:39 AM 171 11.9 2 13.1 0.18 84 11:41 AM 173 11.0 2 11.5 0.16 85 11:43 AM 175 10.0 2 10.5 0.14 86 11:45 AM 177 9.7 2 9.8 0.13 87 11:47 AM 179 8.9 2 9.3 0.13 88 11:52 AM 184 6.4 5 7.6 0.26 89 11:57 AM 189 4.8 5 5.6 0.19 90 12:02 PM 194 3.5 5 4.2 0.14 91 12:07 PM 199 2.8 5 3.2 0.11 92 12:12 PM 204 2.3 5 2.6 0.09 93 12:17 PM 209.75 1.6 5.75 2.0 0.08 94 12:22 PM 214 1.4 4.25 1.5 0.04 95 12:27 PM 219 1.1 5 1.2 0.04 96 12:32 PM 224 0.6 5 0.8 0.03 97 12:37 PM 229 0.5 5 0.6 0.02 98 12:42 PM 234 0.4 5 0.5 0.02 99 12:47 PM 239 0.4 5 0.4 0.01 100 12:52 PM 244 0.2 5 0.3 0.01 101 12:57 PM 249 0.2 5 0.2 0.01 102 1:02 PM 254 0.2 5 0.2 0.01
∑Q*ci,avg*t = 34.41
Fraction of dye recovered = Mout/Min = (34.41)/36.0 g = 95.6%

SEJPA – Chlorine Contact Basin Tracer Study (August 2010)
Trussell Technologies, Inc. • Pasadena • San Diego • Oakland 27
Table A7 – Calculation of dye recovery for 3.02 MGD test on April 22, 2009
ID Clock Time Sample
Time (min) Adj Rhodamine Conc (ug/L)
t (min)ci,avg (ug/L)
Q*ci,avg*t (g)
1 11:12 AM 3 0.3 ‐‐ ‐‐ ‐‐ 2 11:17 AM 8 0.1 ‐‐ ‐‐ ‐‐ 3 11:21 AM 12 0.0 ‐‐ ‐‐ ‐‐ 4 11:26 AM 17 ‐0.1 ‐‐ ‐‐ ‐‐ 5 11:31 AM 22 ‐0.2 ‐‐ ‐‐ ‐‐ 6 11:36 AM 27 ‐0.2 ‐‐ ‐‐ ‐‐ 7 11:41 AM 32 ‐0.2 ‐‐ ‐‐ ‐‐ 8 11:46 AM 37 ‐0.1 ‐‐ ‐‐ ‐‐ 9 11:51 AM 42 ‐0.2 ‐‐ ‐‐ ‐‐ 10 11:56 AM 47 ‐0.2 ‐‐ ‐‐ ‐‐ 11 12:01 PM 52 ‐0.2 ‐‐ ‐‐ ‐‐ 12 12:06 PM 57 ‐0.1 ‐‐ ‐‐ ‐‐ 13 12:11 PM 62 1.2 ‐‐ ‐‐ ‐‐ 14 12:15 PM 66 2.8 4 2.0 0.06 15 12:19 PM 70 8.6 4 5.7 0.18 16 12:22 PM 73 15.5 3 12.0 0.29 17 12:24 PM 75 19.0 2 17.2 0.27 18 12:26 PM 77 26.7 2 22.9 0.36 19 12:28 PM 79 40.5 2 33.6 0.53 20 12:29 PM 80 41.5 1 41.0 0.33 21 12:30 PM 81 39.1 1 40.3 0.32 22 12:31 PM 82 48.26 1 43.7 0.35 23 12:32 PM 83 49.81 1 49.0 0.39 24 12:33 PM 84 56.63 1 53.2 0.42 25 12:34 PM 85 59.16 1 57.9 0.46 26 12:35 PM 86 64.87 1 62.0 0.49 27 12:36 PM 87 68.03 1 66.4 0.53 28 12:37 PM 88 67.47 1 67.7 0.54 29 12:38 PM 89 70.78 1 69.1 0.55 30 12:39 PM 90 71.75 1 71.3 0.57 31 12:40 PM 91 72.71 1 72.2 0.57 32 12:41 PM 92 72.72 1 72.7 0.58 33 12:42 PM 93 79.55 1 76.1 0.61 34 12:43 PM 94 79.86 1 79.7 0.63 35 12:44 PM 95 79.52 1 79.7 0.63 36 12:45 PM 96 79.78 1 79.6 0.63 37 12:46 PM 97 80.35 1 80.1 0.64 38 12:47 PM 98 81.02 1 80.7 0.64 39 12:48 PM 99 82.65 1 81.8 0.65 40 12:49 PM 100 80.93 1 81.8 0.65 41 12:50 PM 101 80.94 1 80.9 0.64 42 12:51 PM 102 79.46 1 80.2 0.64 43 12:52 PM 103 78.24 1 78.8 0.63 44 12:53 PM 104 78.42 1 78.3 0.62 45 12:54 PM 105 77.31 1 77.9 0.62 46 12:55 PM 106 75.11 1 76.2 0.61 47 12:56 PM 107 74.04 1 74.6 0.59 48 12:58 PM 109 69.95 2 72.0 1.14 49 1:00 PM 111 68.73 2 69.3 1.10 50 1:02 PM 113 64.82 2 66.8 1.06 51 1:04 PM 115 60.83 2 62.8 1.00 52 1:06 PM 117 58.84 2 59.8 0.95 53 1:08 PM 119 54.00 2 56.4 0.90
SEJPA – Chlorine Contact Basin Tracer Study (August 2010)
Trussell Technologies, Inc. • Pasadena • San Diego • Oakland 28
Table A7 – Continued
ID Clock Time Sample
Time (min) Adj Rhodamine Conc (ug/L)
t (min) ci,avg (ug/L) Q*ci,avg*t
(g)
54 1:15 PM 126 38.7 7 46.4 2.58 55 1:19 PM 130 37.0 4 37.8 1.20 56 1:24 PM 135 30.3 5 33.6 1.34 57 1:29 PM 140 26.0 5 28.1 1.12 58 1:34 PM 145 18.6 5 22.3 0.89 59 1:39 PM 150 14.9 5 16.7 0.66 60 1:44 PM 155 12.6 5 13.7 0.55 61 1:49 PM 160 8.8 5 10.7 0.43 62 1:54 PM 165 5.7 5 7.3 0.29 63 1:59 PM 170 4.9 5 5.3 0.21 64 2:06 PM 177 3.0 7 4.0 0.22 65 2:15 PM 186 2.0 9 2.5 0.18 66 2:20 PM 191 1.6 5 1.8 0.07 67 2:25 PM 196 1.1 5 1.3 0.05 68 2:30 PM 201 0.5 5 0.8 0.03
∑Q*ci,avg*t = 33.20
Table A8 – Recorded water depth measurements in contact basin from April 2010 tracer tests 0.84 MGD Test (4/21/10) 1.72 MGD Test (4/22/10) 2.60 MGD Test (4/20/10)
Time Depth (ft) Time Depth (ft) Time Depth (ft)
7:00 AM 9.0 7:59 AM 9.1 8:49 AM 9.2 8:31 AM 9.0 8:12 AM 9.1 9:29 AM 9.2 10:18 AM 9.0 9:55 AM 9.1 10:32 AM 9.2 12:27 PM 9.0 11:28 AM 9.1 12:19 PM 9.2
2:06 PM 9.0 4:07 PM 9.0 6:52 PM 9.0
Fraction of dye recovered = Mout/Min = (33.20)/36.0 g = 92.2%

SEJPA – Chlorine Contact Basin Tracer Study (August 2010)
Trussell Technologies, Inc. • Pasadena • San Diego • Oakland 29
Figure A1 –Flow probability plots for tracer tests (A) 0.84 MGD, (B) 1.72 MGD, (3) 2.60 MGD
A
B
C

SEJPA – Chlorine Contact Basin Tracer Study (August 2010)
Trussell Technologies, Inc. • Pasadena • San Diego • Oakland 30
Figure A2 – Turbidity and chlorine residual during the 0.84 MGD tracer test
Figure A3 – Turbidity and chlorine residual during the 1.70 MGD tracer test

SEJPA – Chlorine Contact Basin Tracer Study (August 2010)
Trussell Technologies, Inc. • Pasadena • San Diego • Oakland 31
Figure A4 – Turbidity and chlorine residual during the 2.60 MGD tracer test
Figure A5 – Turbidity and chlorine residual during the 3.02 MGD tracer test