Embed Size (px)
Citation preview

Ricardo Jorge da Silva Carreira
DEVELOPMENT OF NEW METHODOLOGIES IN
SAMPLE TREATMENT FOR PROTEOMICS WORKFLOW
BASED ON ENZYMATIC PROBE SONICATION
TECHNOLOGY AND MASS SPECTROMETRY
Doctoral Thesis
Faculdade de Ciências e Tecnologia – Universidade Nova de Lisboa
Lisboa 2011


Ricardo Jorge da Silva Carreira
DEVELOPMENT OF NEW METHODOLOGIES IN
SAMPLE TREATMENT FOR PROTEOMICS WORKFLOW
BASED ON ENZYMATIC PROBE SONICATION
TECHNOLOGY AND MASS SPECTROMETRY
Thesis submitted to the Universidade Nova de Lisboa,
Faculdade de Ciências e Tecnologia, for the degree of
Doctor of Philosophy in Biochemistry
Lisboa
2011

Title:
Development of new methodologies in sample treatment for proteomics workflow based on enzymatic
probe sonication technology and mass spectrometry
Author:
Ricardo Jorge da Silva Carreira
Supervisor:
José Luis Capelo Martínez, PhD
Co-supervisors:
Isabel Moura, PhD
Kamal Mansinho, MD
This thesis was Approved by Unanimity by the following evaluation committee:
Isabel Moura, PhD, FCT-UNL (Portugal)
Ana Coelho, PhD, ITQB-UNL (Portugal)
Gilberto Igrejas, PhD, UTAD (Portugal)
Carlos Lodeiro, PhD, FCOU-UVigo (Spain)
Florentino Riverola, PhD, ESEI-UVigo (Spain)
Mário Diniz, PhD, FCT-UNL (Portugal)
José Luis Capelo Martínez, PhD, FCOU-UVigo (Spain)
© Ricardo Jorge da Silva Carreira
ISBN (Hardcover): 978-989-20-2367-0
ISBN (PDF): 978-989-20-2375-5
ISBN (CD-ROM): 978-989-20-2376-2
Lisboa, 2011

The suppression of uncomfortable ideas may be common in religion and politics, but it is not the path
to knowledge; it has no place in the endeavor of science.
Carl Sagan, in Cosmos


Acknowledgments
v
ACKNOWLEDGMENTS
During the last four years I have been working in this project. Yet, I would not have finished it without
the help of many people and institutions, to whom I am deeply grateful, in particular:
Prof. José Luis Capelo, my thesis adviser, for his guidance throughout this work, and also for his
friendship, support and motivation to surmount all the difficulties I have found during this project.
Prof. Isabel Moura and Dr. Kamal Mansinho, my thesis co-advisers, for their suggestions and support.
Prof. Carlos Lodeiro and Prof. Mário Diniz, senior members of the Bioscope team, for their wise
advices, unconditional help and friendship.
All the members of the Bioscope team, particularly Gonçalo Vale and Marco Galésio, my work
colleagues and good friends. It has been a pleasure to work with you during the last years. Thank you
for your support and advices, and thank you for all the joy and good mood we shared daily at the
laboratory. I also acknowledge Hugo Santos, Elisabete Oliveira, Bruno Pedras and the former
members of the Bioscope research group who helped me during the first years of the project: Raquel
Rial, Artur Moro and Francisco Cordeiro.
Universidade Nova de Lisboa, particularly the Chemistry Department of the Faculdade de Ciências e
Tecnologia, for giving me the chance to access and use their technical, material and human resources.
Portuguese Goverment, in particular Fundação para a Ciência e a Tecnologia, for financial support
through the doctoral grant SFRH/BD/28563/2006.
And now in Portuguese:
Aos meus amigos, João, Nuno, Pedro, André João, Tiago, Nuno Faria, Marco, André Caseiro e André
Gaspar, por todos os momentos de “descompressão” e alegria e por me lembrarem que há outra vida
fora do laboratório.
A toda a minha família, avós, tios e primos, mas em especial os meus pais Helena e Jorge, e ao meu
irmão João. Por todos os valores que me transmitiram, pela vossa presença e ajuda incondicional em
qualquer momento, e pela educação que me proporcionaram, o meu eterno agradecimento.
Finalmente, uma palavra especial para uma pessoa muito especial. A ti, Íris, com quem tenho
partilhado tristezas e alegrias durante os últimos anos. Obrigado por estares sempre a meu lado.


Abstract
vii
ABSTRACT
In 1994, Marc Wilkins coined the word “Proteome” to define the protein product of the genome, and
the word “Proteomics” to describe the science that studies the proteome. Since then, boosted by the
development of soft ionization technologies, mass spectrometry and analytical and bioinformatic tools,
proteomics has become one of most important and popular scientific fields for the large scale study of
complex protein systems. Nowadays, the wide range of proteomics applications include not only the
study of biological functions, but also the understanding of changes in cellular regulation mechanisms
caused by disease states, biomarker identification for disease diagnosis and development of new drugs
or therapeutic approaches. To achieve these goals, most proteomics studies rely on different but
complementary tools, such as: two-dimensional gel electrophoresis, chromatographic separation
methods, mass spectrometry, stable isotope labeling approaches for protein quantitation, and software
for data collection and analysis. However, despite the many technological advances, the procedures
used for protein identification and quantitation are still complex, lengthy and laborious. One of the
most important steps in any protein identification or quantitation experiment is the digestion, or
hydrolysis, of proteins. This crucial step is traditionally performed with proteases, such as trypsin,
during 12 to 48 h. Over the years, many techniques have been used to optimize the sample treatment
procedures in proteomics, particularly the protein enzymatic digestion stage. The most popular are
microwave energy, high-pressure reactors, micro-reactors and immobilized enzymes.
In 2005, ultrasonic energy was used for the first time to enhance protein enzymatic digestion in
proteomics workflow. Promising results were obtained: the protein digestion time was reduced from
12 h to only 120 s. Yet, many aspects regarding the application of the ultrasonic energy to the
digestion of proteins with enzymes still remain unclear and not fully comprehended.
The major objective of this dissertation was the development and optimization of protocols relying on
ultrasonic energy to enhance protein identification and quantitation by matrix-assisted laser
desorption/ionization time-of-flight mass spectrometry (MALDI-TOF-MS). With this intention,
different ultrasonic devices, such as the ultrasonic bath, the ultrasonic probe and the sonoreactor, were
used to enhance several steps of the traditional procedures for protein identification by peptide mass
fingerprinting (PMF), and protein quantitation by 18
O isotopic labeling. Among the different variables
assessed throughout this work, the most important were: (i) ultrasound amplitude; (ii) ultrasonication
volume; (iii) ultrasonication time; (iv) ultrasound frequency; (v) ultrasonic probe diameter; (vi) protein
concentration threshold; and (vii) enzyme-to-protein ratio.
In the first part of this study, the experiments were focused on the application of ultrasonic energy to
the in-gel protein enzymatic digestion for PMF identification. Different proteins were separated by
one-dimensional gel electrophoresis and the corresponding gel bands were processed according to the

Abstract
viii
already established procedures. Protein digestion with trypsin was carried out with different ultrasonic
devices: the ultrasonic probe and the sonoreactor. The results showed that confident protein
identification was achieved after only 60 or 120 s of protein digestion with ultrasound. The number of
peptides matching the protein sequence and the percentage of sequence coverage were equivalent to
the classic overnight (12 h) procedure. Furthermore, the threshold for confident identification with the
ultrasonic approach was the same than the classic sample treatment: 0.06 µg of protein. The best
operating conditions for the ultrasonic probe were: 100 µL of sample volume; 1 mm or 0.5 mm of
probe diameter; and 70 % of ultrasonication amplitude. For the sonoreactor, best operating conditions
were 50 % of amplitude in the continuous mode. Since it reduces cross-contamination between
samples, provides higher sample throughput and clear MALDI-TOF-MS spectra, the sonoreactor is the
recommended ultrasonic device to perform in-gel protein enzymatic digestion. These results were
confirmed after the identification of standard proteins, and identification of proteins from the complex
proteome of the sulfate reducing bacteria Desulfovibrio desulfuricans.
Once the protein digestion conditions were optimized, the application of ultrasound was extended to
other steps of the sample treatment for protein identification in gel-based approaches. An ultrasonic
bath, an ultrasonic probe and a sonoreactor were used to accelerate the gel washing steps and the
protein reduction and alkylation reactions. The results showed that with the above mentioned
ultrasonic equipments the total time needed to perform the classic procedure could be reduced from 80
to 90 %. In addition, the sample handling was also drastically simplified. The identification of proteins
from complex biological samples (Desulfovibrio desulfuricans G20, Desulfuvibrio gigas NCIB 9332,
and Desulfuvibrio desulfuricans ATCC 27774) was successfully performed as proof of the procedure.
The last part of this dissertation presents the results obtained for the application of ultrasonic energy in
the 18
O-isotopic labeling procedure for protein quantitation. First, ultrasound was applied to the direct
labeling approach, where protein digestion and 18
O-labeling occur simultaneously. In this case, the
sonoreactor was the ultrasonic device that produced the best results: a reduction in the labeling
reaction time from 24 – 48 h to only 15 min was achieved without compromising the labeling
efficiency. However, when applied to a complex protein sample, such as human plasma, this
technology failed in promoting efficient double 18
O-incorporation, compromising protein quantitation.
Finally, the optimization of the decoupled 18
O-labeling procedure was also performed. In this
approach, the enzymatic digestion and the labeling reaction are performed in different steps and
conditions. It was found that the total time necessary to complete the first part of this procedure,
comprising protein denaturation, reduction, alkylation and digestion, could be reduced to only 8 min
under the influence of an ultrasonic field. Interestingly, the results obtained suggest that the labeling
reaction in the decoupled procedure cannot be accelerated or improved with ultrasound, neither with
the ultrasonic probe nor with the sonoreactor.

Resumo
ix
RESUMO
Em 1994, Marc Wilkins inventou a palavra “Proteoma” para definir o conjunto das proteínas
expressadas pelo genoma, e a palavra “Proteómica” para descrever o ramo da ciência que estuda o
proteoma. Desde então, graças ao desenvolvimento de novas tecnologias de ionização e análise por
espectrometria de massa, e ferramentas bioinformáticas, a proteómica tornou-se no mais importante
ramo da ciência para o estudo em larga escala de sistemas complexos de proteínas. Actualmente, as
aplicações da proteómica são vastas e contemplam não só o estudo de funções biológicas, como
também o estudo de modificações nos mecanismos de regulação celular provocados por doenças, e
ainda a identificação de biomarcadores para diagnóstico e desenvolvimento de novos medicamentos.
Contudo, apesar dos avanços tecnológicos alcançados, os procedimentos utilizados para identificação
e quantificação de proteínas são complexos, extensos e muito trabalhosos. Uma das etapas mais
importantes nestes procedimentos é a hidrólise das proteínas, normalmente efectuada na presença de
enzimas proteolíticas, como a tripsina, durante 12 a 48 h. Com o objectivo de reduzir o tempo de
digestão enzimática e optimizar outras etapas nos procedimentos de identificação e quantificação de
proteínas, diferentes tecnologias têm sido testadas. Destacam-se entre as mais importantes: a energia
de microondas, reactores de alta-pressão, micro-reactores e imobilização de enzimas em suportes
específicos.
Em 2005, a energia de ultra-sons foi pela primeira utilizada para acelerar a reacção de digestão
enzimática em estudos de proteómica. Foram obtidos resultados interessantes e promissores: a
utilização de ultra-sons permitiu reduzir de 12 h para apenas 120 s o tempo de digestão enzimática.
Porém, muitos parâmetros relacionados com a aplicação de ultra-sons ficaram por testar e explicar.
A presente dissertação tem como objectivo o desenvolvimento e optimização de procedimentos para
identificação e quantificação rápida de proteínas por espectrometria de massa, nomeadamente por
matrix-assisted laser desorption/ionization time-of-flight mass spectrometry (MALDI-TOF-MS),
utilizando tecnologia de ultra-sons. Assim, vários aparelhos de ultra-sons, tais como o banho de ultra-
sons, sonda de ultra-sons e sonoreactor, foram utilizados na optimização de procedimentos de
identificação de proteínas por espectrometria de massa, e na optimização de procedimentos de
quantificação de proteínas através de marcação com oxigénio 18, um isótopo não radioactivo de
oxigénio. Entre os vários parâmetros testados, destacam-se: (i) amplitude de ultra-sons; (ii) tempo de
ultra-sonicação; (iii) volume de ultra-sonicação; (iv) frequência de ultra-sons; (v) diâmetro da sonda
de ultra-sons; (vi) concentração de proteína; e (vii) razão enzima:proteína.
Na primeira parte deste trabalho foi aplicada energia de ultra-sons à digestão enzimática de proteínas
em gel de electroforese para identificação por espectrometria de massa (PMF). Várias proteínas foram
separadas em gel de electroforese de uma dimensão, e as bandas de gel correspondentes a cada uma

Resumo
x
foram processadas de acordo com os procedimentos tradicionais. A digestão enzimática foi efectuada
com sonda de ultra-sons ou com o sonoreactor. Os resultados obtidos mostram que é possível
identificar com confiança proteínas após 60 ou 120 s de digestão enzimática com ultra-sons. O número
de péptidos identificados para cada proteína foi equivalente entre o procedimento clássico (digestão
durante 12 h) e acelerado com ultra-sons. A quantidade mínima de proteína necessária para obter
identificação com confiança foi igual em ambos os procedimentos: 0.06 µg por poço de gel. Para a
sonda de ultra-sons os melhores resultados foram obtidos nas seguintes condições: 100 µL de volume
de amostra; 1 ou 0.5 mm de diâmetro da sonda de ultra-sons; e amplitude de ultra-sonicação de 70 %.
Para o sonoreactor os melhores resultados foram obtidos com 50 % de amplitude de ultra-sons em
modo contínuo. O sonoreactor foi o aparelho escolhido para efectuar a digestão rápida de proteínas em
estudos posteriores devido a vários factores: a ultra-sonicação é efectuada em recipientes fechados,
reduzindo a contaminação entre amostras; e por outro lado o número de amostras que podem ser
processadas em simultâneo é superior à sonda de ultra-sons. Os resultados obtidos foram validados
após aplicação a amostras reais provenientes da bactéria Desulfovibrio desulfuricans.
Uma vez optimizadas as condições para a digestão rápida de proteínas, foi aplicada energia de ultra-
sons em várias etapas do tratamento de amostra para identificação de proteínas separadas por
electroforese em gel. Foram utilizados o banho de ultra-sons, o sonoreactor e a sonda de ultrasons,
para acelerar as etapas de lavagem do gel, e as reacções de redução e alquilação de proteínas. Os
resultados obtidos mostram que, utilizando energia de ultra-sons, o tempo total necessário para
processar as amostras pode ser reduzido cerca de 80 a 90 % em comparação o procedimento
tradicional. Além disso, o tratamento de amostra é também drasticamente simplificado. O novo
procedimento foi testado em amostras de proteínas provenientes das bactérias Desulfovibrio
desulfuricans G20, Desulfuvibrio gigas NCIB 9332 e Desulfuvibrio desulfuricans ATCC 27774. Em
todos os casos as proteínas foram identificadas com confiança.
A parte final desta dissertação apresenta os resultados relativos à aplicação de ultra-sons no
procedimento de marcação isotópica com 18
O para quantificação de proteínas. Primeiro, foram
utilizados ultra-sons no procedimento em que a marcação isotópica ocorre durante a digestão
enzimática de proteínas. Verificou-se que o tempo de marcação com 18
O pode ser reduzido de 12 – 48
h para apenas 15 min com sonoreactor, sem comprometer a eficiência da reacção. Contudo, quando o
procedimento acelerado foi aplicado a uma amostra complexa de proteínas de plasma humano, a
percentagem de péptidos marcados com dois átomos de 18
O foi inferior ao procedimento clássico.
Finalmente, foi optimizado o procedimento em que as reacções de digestão e marcação isotópica de
proteínas são efectuadas separadamente e em condições diferentes. Os resultados obtidos mostram que
a primeira parte deste procedimento, que compreende a redução, alquilação e digestão de proteínas,
pode ser efectuada em apenas 8 min com ultra-sons. Quanto à reacção de marcação isotópica,
verificou-se que a energia de ultra-sons não produziu qualquer efeito nos resultados obtidos.

Abbreviations
xi
ABBREVIATIONS
ACN Acetonitrile
Ambic Ammonium bicarbonate
AQUA Absolute quantitation (with stable isotope labeled synthetic peptides)
B Magnetic sector (mass analyzer)
BSA Bovine serum albumin
CA Carrier ampholytes
α-CHCA α-Cyano-4-hydroxycinnamic acid
CI Chemical ionization
CID Collision induced dissociation
CNBr Cyanogen bromide
2DE Two dimensional electrophoresis
DIGE Difference gel electrophoresis
1D-PAGE One dimensional polyacrylamide gel electrophoresis
2D-PAGE Two dimensional polyacrylamide gel electrophoresis
DHB Dihydroxybenzoic acid
DTT DL-Dithiothreitol
ECD Electron capture dissociation
EI Electron ionization
EPS Enzymatic probe sonication
ESI Electrospray ionization
ESI-MS Electrospray ionization mass spectrometry
ETD Electron transfer dissociation
FA Formic acid
FEE Continuous free flow electrophoresis
FT-ICR Fourier transform ion cyclotron resonance
HIFU High intensity focused ultrasound
HPLC High performance liquid chromatography
IAA Iodoacetamide
ICAT Isotope coded affinity tag
ICR Ion cyclotron resonance (mass analyzer)
IEF Isoelectric focusing
IT Ion trap (mass analyzer)
iTRAQ Isobaric tag for relative and absolute quantitation
IMERs Immobilized enzyme reactors
IPG Immobilized pH gradients
IR Infrared radiation

Abbreviations
xii
LC Liquid chromatography
LCM Laser capture microdissection
LC-MS Liquid chromatography mass spectrometry
LC-MS/MS Liquid chromatography tandem mass spectrometry
LIT Linear ion trap (mass analyzer)
MALDI Matrix-assisted laser desorption/ionization
MALDI-TOF-MS Matrix-assisted laser desorption/ionization time-of-flight mass spectrometry
MAPED Microwave assisted protein enzymatic digestion
MDLC Multi dimensional liquid chromatography
MS Mass spectrometry
MS/MS Tandem mass spectrometry
MudPIT Multi dimensional protein identification technology
MW Molecular mass
OT Orbitrap (mass analyzer)
pI Isoelectric point
PMF Peptide mass fingerprinting
PSD Post source decay
Q Quadrupole (mass analyzer)
QIT Quadrupole ion trap (mass analyzer)
QqQ Triple quadrupole (mass analyzer)
Qq-TOF Quadrupole time-of-flight (mass analyzer)
RP Reverse phase
RT Room temperature
SA Sinapinic acid
SCX Strong cation exchange
SDS Sodium dodecyl sulfate
SDS-PAGE Sodium dodecyl sulfate polyacrylamide gel electrophoresis
SEM Secondary electron multiplier
SIL Stable isotope labeling
SILAC Stable isotope labeling by amino acids in cell culture
SRM Selected reaction monitoring
TCA Trichloroacetic acid
TFA Trifluoroacetic acid
TOF Time-of-flight (mass analyzer)
UE Ultrasonic energy
UP Ultrasonic probe
USB Ultrasonic bath
UTR Sonoreactor

Table of contents
xiii
TABLE OF CONTENTS
Acknowledgments ................................................................................................................................... v
Abstract ................................................................................................................................................. vii
Resumo ................................................................................................................................................... ix
Abbreviations ......................................................................................................................................... xi
Table of contents .................................................................................................................................. xiii
Index of figures .................................................................................................................................... xix
Index of tables ................................................................................................................................... xxvii
PART I .................................................................................................................................................... 1
Chapter I - General introduction ............................................................................................................ 3
I.1. Proteomics ................................................................................................................................ 5
I.1.1. A new era in protein science .............................................................................................. 5
I.1.2. Top-down versus Bottom-up proteomics ........................................................................... 6
I.1.3. Analytical proteomics ........................................................................................................ 7
I.1.3.1. Two-dimensional gel electrophoresis ......................................................................... 7
I.1.3.2. Liquid chromatography separation – shotgun proteomics .......................................... 9
I.1.4. Protein digestion strategies .............................................................................................. 10
I.1.4.1. In-gel protein digestion ............................................................................................. 12
I.1.4.2. In-solution protein digestion ..................................................................................... 14
I.1.4.3. Protein digestion with immobilized enzymes ........................................................... 15
I.1.4.4. New technologies to improve protein digestion procedures ..................................... 16
I.1.4.4.1. Microwave Energy ............................................................................................. 16
I.1.4.4.2. Heating ............................................................................................................... 16
I.1.4.4.3. Mixed organic – aqueous solvents ..................................................................... 17
I.1.4.4.4. Ultrasonic Energy .............................................................................................. 17
I.1.4.4.5. Infrared Energy .................................................................................................. 18
I.2. Protein quantitation ................................................................................................................. 19
I.2.1. Gel-based quantitation: difference gel electrophoresis (DIGE) ....................................... 20
I.2.2. Mass spectrometry-based quantitation ............................................................................. 21
I.2.2.1. 15
N-metabolic labeling .............................................................................................. 22
I.2.2.2. Stable isotope labeling by amino acids in cell culture (SILAC) ............................... 22
I.2.2.3. Isotope-coded affinity tag (ICAT) ............................................................................ 24
I.2.2.4. Isobaric tag for relative and absolute quantitation (iTRAQ)..................................... 25
I.2.2.5 Enzymatic 18
O-labeling .............................................................................................. 27

Table of contents
xiv
I.2.2.6. Label-free quantitation .............................................................................................. 31
I.2.2.7. Absolute quantitation of proteins .............................................................................. 31
I.3. Mass Spectrometry .................................................................................................................. 34
I.3.1. Basic principles ................................................................................................................ 34
I.3.2. Soft ionization technologies ............................................................................................. 37
I.3.2.1. Electrospray ionization (ESI) .................................................................................... 37
I.3.2.2. Matrix-assisted laser desorption ionization (MALDI) .............................................. 39
I.3.3. Protein identification by mass spectrometry .................................................................... 42
I.3.3.1. Peptide mass fingerprinting (PMF) for protein identification ................................... 43
I.3.3.2. Protein identification by tandem mass spectrometry ................................................. 44
I.4. Ultrasound ............................................................................................................................... 46
I.4.1. Fundamentals ................................................................................................................... 46
I.4.2. Ultrasonic devices ............................................................................................................ 49
I.4.2.1. Ultrasonic bath .......................................................................................................... 50
I.4.2.2. Ultrasonic probe ........................................................................................................ 51
I.4.2.3. Cup horn reactors ...................................................................................................... 52
I.4.3. Enzymatic digestion with ultrasound ............................................................................... 53
I.5. General objectives and thesis outline ...................................................................................... 55
I.6. References ............................................................................................................................... 57
PART II ................................................................................................................................................. 71
Chapter II - New findings for in-gel digestion accelerated by high intensity focused ultrasound for
protein identification by matrix-assisted laser desorption/ionization time-of-flight mass spectormetry
............................................................................................................................................................... 73
II.1. Abstract .................................................................................................................................. 75
II.2. Introduction ............................................................................................................................ 76
II.3. Experimental .......................................................................................................................... 77
II.3.1. Apparatus ........................................................................................................................ 77
II.3.2. Standards and reagents .................................................................................................... 79
II.3.3. Sample treatment ............................................................................................................ 79
II.3.4. Protein samples from complex mixtures ......................................................................... 79
II.3.5. Matrix formulation .......................................................................................................... 80
II.3.6. MALDI-TOF-MS analysis .............................................................................................. 80
II.4. Results and discussion ........................................................................................................... 80
II.5. Conclusions ............................................................................................................................ 87
II.6. Acknowledgments ................................................................................................................. 89
II.7. References .............................................................................................................................. 89

Table of contents
xv
Chapter III - Sonoreactor-based technology for fast high-throughput enzymatic digestion of proteins
............................................................................................................................................................... 91
III.1. Abstract ................................................................................................................................ 93
III.2. Introduction .......................................................................................................................... 94
III.3. Experimental Section ........................................................................................................... 95
III.3.1. Apparatus ...................................................................................................................... 95
III.3.2. Standards and reagents .................................................................................................. 95
III.3.3. Sample treatment ........................................................................................................... 96
III.3.4. MALDI-TOF-MS Analysis ........................................................................................... 96
III.3.5. Protein samples from complex mixtures ....................................................................... 98
III.4. Results and discussion .......................................................................................................... 98
III.4.1. Optimization of the sonoreactor performance ............................................................... 98
III.4.2. Proof of the Procedure ................................................................................................... 99
III.5. Conclusions ........................................................................................................................ 100
III.6. Acknowledgments .............................................................................................................. 100
III.7. References .......................................................................................................................... 100
III.8. Supporting Information ...................................................................................................... 102
Chapter IV - Simplifying sample handling for protein identification by peptide mass fingerprint using
matrix-assisted laser desorption/ionization time-of-flight mass spectormetry .................................... 105
IV.1. Abstract .............................................................................................................................. 107
IV.2. Introduction ........................................................................................................................ 108
IV.3. Experimental ...................................................................................................................... 108
IV.3.1. Apparatus .................................................................................................................... 109
IV.3.2. Standards and reagents ................................................................................................ 109
IV.3.3. Sample treatment ......................................................................................................... 109
IV.3.4. MALDI-TOF-MS analysis .......................................................................................... 110
IV.3.5. Protein samples from complex mixtures ..................................................................... 110
IV.4. Results and discussion ....................................................................................................... 112
IV.4.1. Ultrasound effect on the washing steps ....................................................................... 113
IV.4.2. Ultrasound effect on the reduction and alkylation steps ............................................. 116
IV.4.3. Ultrasound effect on the washing, reduction and alkylation steps .............................. 118
IV.4.4. Ultrasound effect on the trypsin diffusion process into the gel ................................... 121
IV.4.5. Proof of the procedure ................................................................................................. 123
IV.5. Conclusions ........................................................................................................................ 123
IV.6. Acknowledgments .............................................................................................................. 124
IV.7. References .......................................................................................................................... 125

Table of contents
xvi
PART III .............................................................................................................................................. 127
Chapter V - Ultrasonic energy as a new tool for fast isotopic 18
O-labeling of proteins for mass
spectrometry-based techniques: preliminary results ............................................................................ 129
V.1. Abstract ................................................................................................................................ 131
V.2. Introduction ......................................................................................................................... 132
V.3. Experimental ........................................................................................................................ 133
V.3.1. Apparatus ...................................................................................................................... 133
V.3.2. Materials and Reagents ................................................................................................. 133
V.3.3. Sample treatment .......................................................................................................... 134
V.3.4. MALDI-TOF-MS analysis ........................................................................................... 134
V.3.5. Isotopic peak deconvolution ......................................................................................... 136
V.4. Results and discussion ......................................................................................................... 136
V.4.1. The isotopic labeling and the deconvolution problem .................................................. 136
V.4.2. Influence of the sample treatment on the 18
O-labeling (16
O/18
O) .................................. 138
V.4.3. Influence of the sample treatment on the double 18
O-labeling degree (18
O1/18
O2) ........ 141
V.4.4. Application to further proteins ...................................................................................... 143
V.5. Future prospects ................................................................................................................... 143
V.6. Conclusions ......................................................................................................................... 144
V.7. Acknowledgments ............................................................................................................... 144
V.8. References ........................................................................................................................... 145
Chapter VI - Ultrasonic-based protein quantitation by 18
O-labeling: optimization and comparison
between different procedures............................................................................................................... 147
VI.1. Abstract .............................................................................................................................. 149
VI.2. Introduction ........................................................................................................................ 150
VI.3. Experimental ...................................................................................................................... 151
VI.3.1. Apparatus..................................................................................................................... 151
VI.3.2. Standards and reagents ................................................................................................ 151
VI.3.3. Sample treatment ......................................................................................................... 152
VI.3.3.1. Protein digestion/labeling ..................................................................................... 152
VI.3.3.2. Enzyme-to-protein ratio effect on the 18
O-labeling reaction ................................ 152
VI.3.3.3. 18
O-labeling in low concentration protein samples .............................................. 152
VI.3.3.4. 18
O-labing of proteins from human plasma .......................................................... 153
VI.3.4. MALDI-TOF-MS analysis .......................................................................................... 153
VI.3.5. Deconvolution of MALDI mass spectra ...................................................................... 153
VI.4. Results and discussion ........................................................................................................ 154
VI.4.1. 18
O-lalebing with direct ultrasonication ...................................................................... 155

Table of contents
xvii
VI.4.2. 18
O-lalebing with UTR ................................................................................................ 157
VI.4.3. Influence of enzyme-to-protein ratio on the 18
O-labeling reaction ............................. 160
VI.4.4. Influence of sample concentration on the 18
O-labeling of proteins ............................. 162
VI.4.5. Ultrasound-based 18
O-labeling of proteins from human plasma ................................. 165
VI.5. Conclusions ........................................................................................................................ 167
VI.6. Acknowledgements ............................................................................................................ 168
VI.7. References .......................................................................................................................... 168
Chapter VII - Can ultrasonic energy efficiently speed 18
O-labeling of proteins ............................... 171
VII.1. Abstract ............................................................................................................................. 173
VII.2. Introduction ...................................................................................................................... 174
VII.3. Experimental ..................................................................................................................... 174
VII.4. Results and discussion ...................................................................................................... 175
VII.5. Conclusions ...................................................................................................................... 179
VII.6. Acknowledgments ............................................................................................................ 179
VII.7. References ........................................................................................................................ 179
PART IV .............................................................................................................................................. 181
Chapter VIII - Conclusions and future prospects .............................................................................. 183
VIII.1. Conclusions ..................................................................................................................... 185
VIII.2. Final remarks and future prospects ................................................................................. 187


Index of figures
xix
INDEX OF FIGURES
Figure I.1: Common bottom-up approaches for protein identification by mass spectrometry. ......... 6
Figure I.2: Overview of quantitative methodologies used in proteomics studies. (Adapted from Lau
et al. [126]) ..................................................................................................................... 19
Figure I.3: DIGE workflow for protein quantitation. Different protein samples, labeled with
different fluorescent cyanine dyes (Cy2, Cy3 and Cy5), are pooled together and
separated by 2D-PAGE. The resulting gel is revealed with different excitation
wavelengths, and the difference between the intensities of the cyanine dyes in a
particular protein spot is measured by image-analysis software to obtain the relative
abundance of the protein. ............................................................................................... 20
Figure I.4: SILAC workflow for protein quantitation by MS. Cells are grown on culture media
enriched with either heavy labeled or natural abundance amino acids. Then, the samples
are combined and after protein extraction and digestion the peptides are separated by
liquid chromatography and analyzed by mass spectrometry. Sample quantitation is
obtained from the extracted ion chromatograms for the heavy- and light-labeled peptide
forms. (adapted from Kline et al. [144]) ........................................................................ 23
Figure I.5: Overview of the ICAT methodology for protein quantitation through MS. a) ICAT
workflow. Proteins from different samples are isolated, tagged with the heavy or light
ICAT reagents at the cysteinyl residues, and pooled together. After protein digestion,
the tagged peptides are isolated by avidin affinity chromatography and analyzed by MS.
Quantitation is obtained by measuring the relative intensity between the labeled peptide
pairs, and protein identification is achieved by tandem-MS. b) Structure of the original
ICAT reagent. The reagent consists of a biotin affinity tag used to isolate the chemically
modified peptides; a linker group in which the stable isotopes are incorporated; and an
iodoacetamide reactive group with specificity towards cysteine residues. (adapted from
Kline et al. [144] and Gygi et al. [154]). ....................................................................... 25
Figure I.6: Overview of the iTRAQ methodology for protein quantitation by MS. a) Structure of
the iTRAQ reagent. The reagent consists of three groups with distinct functions: the
peptide reactive group (red), a NHS ester with specificity towards the N-terminus of
every peptide and ε-amine groups of lysine residues; the balancer group (blue); and the
reporter group (green), which is used for peptide quantitation. The reporter group mass
varies from 114-117 Da, while the complementary balance group mass varies from 31-
28 Da. Together, these groups form the isobaric tag with 145 Da. b) Workflow of the

Index of figures
xx
iTRAQ labeling method. Proteins form different samples are isolated, digested to
peptides and chemically modified with an isobaric tag. The samples are mixed and
analyzed by MS. Peptides are analyzed by tandem-MS for protein identification and
quantitation, which is calculated from the ratios between the intensities of the different
reporter groups. (adapted from Boehm et al. [162] and Kline et al. [144]) ................... 27
Figure I.7: Schematic representation of the 18
O-labeling reaction. This is a two step reaction: (1) in
the first step, one 18
O-atom from the buffered media is incorporated at the peptide C-
terminus during protein digestion with trypsin, corresponding to a mass increment of +
2 Da; (2) the second step consists in an enzymatic catalyzed reversible reaction, in
which the peptide incorporates a second 18
O-atom, resulting in a total mass increment of
+ 4 Da. (adapted from Yao et al. [179]) ......................................................................... 28
Figure I.8: Complete 18
O-labeling versus variable 18
O-labeling. a) Mass spectrum obtained for a
mixture of unlabeled (blue) and completely 18
O-labeled (green) peptide samples – no
isotope overlapping is observed. b) Mass spectrum obtained for a mixture of unlabeled
(blue) and variable 18
O-labeled (green) peptide samples – overlapping between isotope
clusters from different samples occurs, introducing error in the quantitation process. .. 29
Figure I.9: Comprehensive scheme of two common procedures for protein quantitation by 18
O-
labeling. a) Direct labeling procedure. After protein denaturation, reduction and
alkylation, the samples are diluted with 18
O- or 16
O-enriched buffer for enzymatic
digestion with trypsin. The reaction is performed at pH 8.5, during ca. 12 h at 37ºC.
Finally, the labeled peptides from different samples are mixed and analyzed by MS.
Quantitation is obtained by measuring the ratio between the relative intensities of 18
O-
and 16
O-labeled peptides. b) Decoupled labeling procedure. After protein denaturation,
reduction, alkylation and enzymatic digestion in natural abundance aqueous media at
pH 8.5, the samples are dried or lyophilized. The peptides are resuspended in 18
O- or
16O-enriched buffer and the labeling reaction proceeds with trypsin at pH = 6.75, during
ca. 18 h at 37ºC. The samples are finally pooled together for MS analysis, and the
quantitation is obtained by measuring the ratio between the relative intensities of 18
O-
and 16
O-labeled peptides. ................................................................................................ 30
Figure I.10: Basic diagram of a mass spectrometer. (adapted from Gross, J. H. [198]) .................... 35
Figure I.11: Schematic representation of linear and reflectron time-of-flight mass analyzers. a)
Linear TOF: ions are separated in a field-free drift tube according to their m/z value;
heavier ions move slower than lighter ions and arrive later at the detector. b) Refletron
TOF: the ions are reflected to another detector by an electrical potential applied at the
end of the flight tube. The resolution is improved by increasing the flight distance

Index of figures
xxi
available for ion separation. Furthermore, faster ions penetrate deeper in the reflectron
field than slower ions of the same m/z, which result in ion focusing and higher
resolution. (adapted from Lane, C. S. [260]) ................................................................. 42
Figure I.12: Sound frequency ranges. (from Mason et al. [288]) ...................................................... 47
Figure I.13: Schematic representation of cavitation bubble development and collapse. a) The
cavitation bubble grows in successive expansion and compression cycles until it reaches
an unstable size and collapses. (from Castro et al. [290]) b) When cavitation occurs near
a solid surface the bubble assumes a non-spherical shape and micro-jets of liquid are
formed and directed towards the solid with velocities of nearly 400 km/h, causing
mechanical erosion and disruption of the solid surface. ................................................ 48
Figure II.1: Classic sample treatment along with the intended effects of each step used for protein
identification by PMF. Reduction and alkylation steps are performed between steps 8
and 9 to increase the sequence coverage. ....................................................................... 78
Figure II.2: MALDI-TOF mass spectra of BSA acquired in the reflectron positive ion mode.
Spectrum a): classical treatment without reduction and alkylation. Spectrum b): HIFU
treatment without reduction and alkylation. Spectrum c): classical treatment with
reduction and alkylation. Spectrum d): HIFU treatment with reduction and alkylation. 83
Figure II.3: Number of matched peptides and percentage of sequence coverage obtained for the
proteins studied (n = 2). The search engine used was MASCOT. 1) Classic sample
treatment without reduction and alkylation. 2) Classic sample treatment with reduction
and alkylation. 3) HIFU sample treatment without reduction and alkylation. 4) HIFU
sample treatment with reduction and alkylation. HIFU conditions: 2 min ultrasonication
time; 70 %ultrasonication amplitude; 0.5 mm sonotrode diameter. Trypsin
concentration: 3.6 µg/mL. Amount of protein analyzed: 1.7 µg of glycogen
phosphorylase b (Phos.); 2.1 µg of BSA; 3.7 µg of ovalbumin; 2.1 µg of carbonic
anhydrase (Car. Anhy.); 2.0 µg of trypsin inhibitor (Trp. Inhib.); 2.9 µg of α-
lactalbumin (α-lactal). (See text for details) ................................................................... 85
Figure II.4: SDS-PAGE of a complex protein mixture obtained from the sulfate reducing bacteria
Desulfovibrio desulfuricans ATCC 27774. .................................................................... 87
Figure II.5: Multiple alignment of adenylylsulfate reductase (APS reductase) alpha subunit from
Desulfovibrio desulfuricans ATCC 27774 and related organisms. Dd27k: APS
reductase from Desulfovibrio desulfuricans ATCC 27774 (Q9L767). Dvulg: APS
reductase from Desulfovibrio vulgaris Hildenborough (DVU0847). DdG20: APS
reductase from Desulfovibrio desulfuricans G20 (Dde1110). (*) identity; (:) strongly

Index of figures
xxii
similar; (·) weakly similar. Red amino acids: peptides identified in the UniProt2006
database with the PROTEIN PROSPECTOR. ............................................................... 88
Figure III.1: Comparison between the ultrasonic energy provided by common probes, baths and the
sonoreactor. Reprinted with permission from Hielscher Ultrasonics
(http://www.hielscher.com). ........................................................................................... 95
Figure III.2: Comprehensive scheme of the sample treatment procedure. ......................................... 97
Figure III.3: Effect of the amount of trypsin on the in-gel protein digestion procedure with the
sonoreactor. Slices of SDS-PAGE gel with 0.5 µg of α-lactalbumin were digested with
a) 375 ng, or b) 100 ng of trypsin in the sonoreactor, during 60 s. Operating conditions:
continuous mode; 70 % amplitude. .............................................................................. 102
Figure III.4: Effect of the digestion time on the sequence coverage (%) obtained for α-lactalbumin
(0.5 µg) and BSA (0.5 µg), after in-gel protein digestion with the sonoreactor procedure
and analysis by MALDI-TOF-MS. Sonoreactor operating conditions: continuous mode;
70 % amplitude. ............................................................................................................ 102
Figure III.5: Effect of the ultrasound amplitude on the sequence coverage (%) and number of
matched peptides obtained for α-lactalbumin (0.5 µg) and BSA (0.5 µg), after in-gel
protein digestion with the sonoreactor (continuous mode; 60 s of ultrasonication). .... 103
Figure III.6: MALDI-TOF-MS spectra obtained for α-lactalbumin after in-gel digestion with the
sonoreactor (continuous mode; 50 % amplitude; 60 s of ultrasonication). a) 1 µg of α-
lactalbumin. b) 0.1 µg of α-lactalbumin. c) 0.05 µg of α-lactalbumin. ........................ 104
Figure IV.1: Classic sample treatment for in-gel protein digestion. ................................................. 111
Figure IV.2: Comprehensive scheme of the several sample treatments studied. The ultrasonic energy
was provided by an ultrasonic bath (35 kHz, 60 % ultrasonication amplitude, 5 min
ultrasonication time); a sonoreactor (24 kHz, 50 % ultrasonication amplitude, 2 min
ultrasonication time); and an ultrasonic probe (30 kHz, 50 % ultrasonication amplitude,
2 min ultrasonication time, 0.5 mm sonotrode diameter). See text for further details. 114
Figure IV.3: Ultrasound effect on the washing procedure (n = 2). The ultrasonic energy was provided
by an ultrasonic bath (35 kHz, 60 % ultrasonication amplitude, 5 min ultrasonication
time); a sonoreactor (24 kHz, 50 % ultrasonication amplitude, 2 min ultrasonication
time); and an ultrasonic probe (30 kHz, 50 % ultrasonication amplitude, 2 min
ultrasonication time, 0.5 mm sonotrode diameter). See Figure IV.2a) for number
identification. ................................................................................................................ 116

Index of figures
xxiii
Figure IV.4: Ultrasound effect on the reduction and alkylation procedure (n = 2). The ultrasonic
energy was provided by an ultrasonic bath (35 kHz, 60 % ultrasonication amplitude, 5
min ultrasonication time); a sonoreactor (24 kHz, 50 % ultrasonication amplitude, 2 min
ultrasonication time); and an ultrasonic probe (30 kHz, 50 % ultrasonication amplitude,
2 min ultrasonication time, 0.5 mm sonotrode diameter). See Figure IV.2b) for letter
identification. ............................................................................................................... 117
Figure IV.5: Ultrasound effect on the washing, reduction and alkylation steps in the in-gel protein
digestion procedure. Ultrasonic energy was from an ultrasonic bath operating at 35 kHz,
60 % ultrasonication amplitude, during 5 min (n = 2). ................................................ 119
Figure IV.6: Influence of the ultrasonic enhanced procedure on the MALDI-TOF mass spectra
obtained for BSA and α-lactalbumin after in-gel enzymatic digestion. a) BSA mass
spectrum obtained after protein digestion with the classic protocol. b) BSA mass
spectrum obtained after protein digestion with the ultrasonic enhanced protocol. c) α-
lactalbumin mass spectrum obtained after protein digestion with the classic protocol. d)
α-lactalbumin mass spectrum obtained after protein digestion with the ultrasonic
enhanced protocol. The washing, reduction and alkylation steps were accelerated with
the ultrasonic bath (35 kHz, 60 % ultrasonication amplitude, 5 min ultrasonication
time). ............................................................................................................................ 120
Figure IV.7: Effect of ultrasonic energy on the washing, reduction and alkylation steps for the in-gel
digestion of low amounts of protein, ranging from 0.5 and 0.01 µg (n = 2). Ultrasonic
bath parameters: 35 kHz, 60 % ultrasound amplitude; 5 min ultrasonication time. .... 121
Figure IV.8: Mass spectra obtained for BSA (0.5 µg) after sonoreactor digestion with and without gel
incubation with trypsin, on ice, during 60 min. a) Protein digestion with the sonoreactor
(2 min; 50 % ultrasonication amplitude) after incubation with trypsin on ice during 60
min. b) Protein digestion with the sonoreactor (8 min; 50 % ultrasonication amplitude)
without gel incubation with trypsin on ice. .................................................................. 122
Figure IV.9: SDS-PAGE analysis of the protein mixtures used as proof of the procedure. Three
protein bands were selected for PMF identification: D. desulfuricans G20, ca. 15 kDa;
D. gigas NCIB 9332, ca. 50 kDa; D. desulfuricans ATCC27774, ca. 40 kDa. ........... 123
Figure V.1: Comprehensive scheme of the 18
O-isotopic labeling sample treatment. ...................... 135
Figure V.2: Reflectron positive ion mode MALDI-TOF mass spectra of the peptide fragment
(YLYEIAR)H+ obtained in the tryptic digest of BSA. a) Overnight digestion in 100 %
H216
O buffer solution at 37ºC (ca. 12 h). b) Overnight digestion in 95 % atom H218
O
buffer solution at 37ºC (ca. 12 h). c) Ultrasonic bath digestion in 95 % atom H218
O

Index of figures
xxiv
buffer solution at 60ºC (35 kHz frequency; 70 % amplitude; 30 min); d) Ultrasonic bath
digestion in 95 % atom H218
O buffer solution at 60ºC (130 kHz frequency; 70 %
amplitude; 15 min); e) Ultrasonic bath digestion in 95 % atom H218
O buffer solution at
60ºC (130 kHz frequency; 70 % amplitude; 30 min); f) Water bath digestion in 95 %
atom H218
O buffer solution at 60ºC (30 min). .............................................................. 137
Figure VI.1: Complete 18
O-labeling vs. variable 18
O-labeling. a) Complete 18
O-labeling: theoretical
MALDI-TOF mass spectrum of a mixture (1:1) of the unlabeled (927 m/z) and the
double labeled (931 m/z) peptide (YLYEIAR)H+ from BSA. b) Variable
18O-labeling:
theoretical MALDI-TOF mass spectrum of a mixture (1:1) of the unlabeled (927 m/z)
and the single (929 m/z) and double labeled (931 m/z) peptide (YLYEIAR)H+ from
BSA. ............................................................................................................................. 154
Figure VI.2: Effect of the enzyme-to-protein ratio (E:P) on the MALDI-TOF mass spectra obtained
after protein 18
O-labeling with different amounts of trypsin. a) 1:120 w/w (trypsin – 0.5
µg); b) 1:80 w/w (trypsin – 0.75 µg); c) 1:60 w/w (trypsin – 1.0 µg); d) 1:40 w/w
(trypsin – 1.5 µg); e) 1:30 w/w (trypsin – 2.0 µg). ....................................................... 162
Figure VI.3: Effect of sample concentration on the a) labeling degree (18
O2 %) and b) labeling
efficiency (18
Ototal %). Aliquots of BSA 2.5 µg were labeled with increasing amounts of
trypsin during 12 h (overnight) at 37 ºC, and 15 min with the sonoreactor (50 %
amplitude). A) Overnight labeling with 0.0625 µg of trypsin; B) sonoreactor labeling
with 0.0625 µg of trypsin; C) overnight labeling with 0.125 µg of trypsin; D)
sonoreactor labeling with 0.125 µg of trypsin; E) overnight labeling with 0.375 µg of
trypsin; F) sonoreactor labeling with 0.375 µg of trypsin; G) overnight labeling with
0.75 µg of trypsin; H) sonoreactor labeling with 0.75 µg of trypsin. (n=3) ................. 164
Figure VI.4: 18
O-labeling of complex protein samples from human plasma. Spectra a) and b)
correspond to the overnight protein digestion at 37ºC with trypsin in 16
O- and 18
O-
enriched buffer, respectively. Spectra c) and d) correspond to protein digestion with the
sonoreactor (15 min; 50 % amplitude) in 16
O- and 18
O-enriched buffer (for details, see
section VI.3.3.4). .......................................................................................................... 165
Figure VI.5: 18
O-labeling of complex protein samples from human plasma. Comparison between: a)
18O-labeling efficiency (
18Ototal %); and b)
18O-labeling degree (
18O2 % ) obtained with
the overnight (12 h; 37 ºC) and the sonoreactor (15 min; 50 % amplitude)
methodologies. (n = 3).................................................................................................. 166
Figure VII.1: a) And b) show the influence of time and ultrasonic energy on the double 18
O-
incorporation (18
O2 %) through the most intense peptides obtained after MALDI-TOF-

Index of figures
xxv
MS analysis of BSA (15 μg) and (b) α-lactalbumin (15 μg), respectively. Different
labeling procedures were used: (i) overnight labeling at 37ºC (6 + 6 h); ultrasonication
with the sonoreactor at 50 % amplitude during (ii) (2.5 + 2.5) min; (iii) 5 min
(continuous); (iv) (5 + 5) min; (v) (15 + 15) min; (vi) 30 min (continuous); and labeling
without ultrasound at RT during (vii) (2.5 + 2.5 min); (viii) (5 + 5) min; and (ix) (15 +
15) min. c) Comparison of the labeling degree efficiency, calculated as the ratio
between peptides labeled with one 18
O (18
O1) and peptides labeled with two 18
O (18
O2),
obtained for BSA (15 μg) after ultrasonication with different ultrasonic devices and
without ultrasonic energy: (i) no-ultrasound at 37ºC overnight (6 + 6 h); (ii) sonoreactor
at 50 % amplitude during (2.5 + 2.5 min); (iii) no-ultrasound at RT during (2.5 + 2.5
min); (iv) ultrasonic probe at 10 % amplitude during (2 + 2) min. d) And e) report the
comparison between 18
O-labeled human plasma peptides with the following different
methods: (i) overnight (O) at 37ºC (6 + 6 h); (ii) sonoreactor (U) at 50 % amplitude (5 +
5 min or 15 + 15); and (iii) no-ultrasound (N) at RT (5 + 5 min or 15 + 15 min). *
Peptide not present in the spectra. For all experiments three replicates were performed
(n = 3). .......................................................................................................................... 176
Figure VII.2: MALDI mass spectra of Human plasma samples (~ 40 μg) labeled with 18
O using the
following treatment/conditions: lyophilized human plasma from Sigma was dissolved in
1 mL of phosphate-buffered saline (PBS; pH = 7.2) and then aliquots of 40 µL were
precipitated overnight with 5 volumes of cold acetone. The samples were centrifuged at
10 000 x g, for 30 min (4ºC); the supernatant was removed and the pellet was air dried.
The pellet was dissolved in 40 μL of ammonium bicarbonate 25 mM/ acetonitrile 50 %
(v/v) and ultrasonicated in the sonoreactor (50 % amplitude) during 1 minute to promote
protein denaturation. Reduction and alkylation were performed with DTT (10 mM) and
IAA (50 mM), respectively, in the sonoreactor (50 % amplitude) for 1 minute (each
reaction). Protein digestion was performed during 5 min (2.5 + 2.5 min) in the
sonoreactor (50 % amplitude) with proteomics grade trypsin (1:20 (w/w) enzyme-to-
protein ratio). Formic acid was added to 1 % to stop the enzymatic digestion and the
samples were concentrated to 10 μL in the vacuum centrifuge. Sample cleaning was
performed before the labeling reaction with C18 reversed-phase ZipTip®. After cleaning
the samples, the reagents used in the labeling reaction – CaCl2 (50 mM); NH4CH3COO
(100 mM); acetonitrile 20 % (v/v); and proteomics grade trypsin (1:20 (w/w) enzyme-
to-protein ratio) were added. The peptides were dried again and finally dissolved in
H218
O (97% atom abundance) or in H216
O. Five labeling methods were tested: a)
overnight – 12 h (6+ 6 h) at 37 ºC; b) ultrasonication with the sonoreactor – 10 min (5 +
5 min) at 50 % amplitude; c) ultrasonication with the sonoreactor – 30 min (15 + 15
min) at 50 % amplitude; d) without ultrasonication - 10 min (5 + 5 min) at RT; and e)
without ultrasonication - 30 min (15 + 15 min) at RT . The labeling reaction was

Index of figures
xxvi
stopped by adding TFA to 1 % and the peptides were analyzed by MALDI-TOF-MS.
...................................................................................................................................... 178

Index of tables
xxvii
INDEX OF TABLES
Table I.1: Comparison between 2D-PAGE and MudPIT methodologies for protein separation. .. 11
Table I.2: Overview of the most important SIL methodologies for relative or absolute protein
quantitation by mass spectrometry. ................................................................................ 33
Table I.3: Overview of the main characteristics of different mass analyzers available. (adapted
from Gross, J. H. [198] and Hoffmann et al. [200]) ...................................................... 36
Table I.4: Common soft ionization techniques used in proteomics: ESI & MALDI. .................... 38
Table I.5: Example of common matrix compounds used for MALDI-MS analysis. ..................... 41
Table I.6: Websites with popular search engines and databases used for protein identification by
mass spectrometry. ......................................................................................................... 43
Table I.7: Overview of the major characteristics of different ultrasonic devices used throughout
this work: ultrasonic bath, ultrasonic probe, and sonoreactor. ....................................... 50
Table II.1: Influence of the ultrasonication volume on the (i) number of matched peptides and (ii)
coverage (%) for the in-gel protein enzymatic digestion (n = 2). Proteins were separated
by SDS-PAGE and digested with trypsin by the HIFU procedure. Quantity of protein
analyzed: 1.7 µg of glycogen phosphorylase b; 2.1µg of BSA; 3.7 µg of ovalbumin; 2.1
µg of carbonic anhydrase. HIFU conditions: 2 min ultrasonication time; 70
%ultrasonication amplitude; 0.5 mm sonotrode diameter. Trypsin concentration: 14.4
µg /mL. Protein reduction with DTT and alkylation with IAA were not performed in the
sample treatment. (See Figure II.1 for details) ............................................................... 82
Table II.2: Influence of temperature on the (i) number of matched peptides and (ii) sequence
coverage (%) obtained for the in-gel enzymatic digestion of 1.05 µg of BSA (n =2).
Protein was separated by SDS-PAGE and digested with trypsin by the HIFU procedure.
HIFU conditions: 2 min ultrasonication time; 70 %ultrasonication amplitude; 0.5 mm
sonotrode diameter. Trypsin concentration: 14.4 µg /mL. Protein reduction with DTT
and alkylation with IAA were not performed in the sample treatment. (See Figure II.1
for details) ...................................................................................................................... 84
Table II.3: Influence of sonotrode diameter on the (i) number of matched peptides and (ii) sequence
coverage (%) obtained for the in-gel enzymatic digestion of proteins (n=2). Proteins
were separated by SDS-PAGE and digested with trypsin by the HIFU procedure. HIFU
conditions: 2 min ultrasonication time; 70 %ultrasonication amplitude. Trypsin

Index of tables
xxviii
concentration: 3.6 µg /mL. Quantity of protein analyzed: 1.7 µg of glycogen
phosphorylase b; 2.1µg of BSA; 3.7 µg of ovalbumin; 2.1 µg of carbonic anhydrase; 2.0
µg of trypsin inhibitor; 2.9 µg of α-lactalbumin. Neither protein reduction with DTT nor
alkylation with IAA was performed in the sample treatment. (See Figure II.1 for
details). ........................................................................................................................... 84
Table II.4: Influence of protein concentration on the (i) number of matched peptides and (ii)
sequence coverage obtained for the in-gel enzymatic digestion of proteins (n=2). The
protein was separated by SDS-PAGE and digested with trypsin by the HIFU procedure.
HIFU conditions: 2 min ultrasonication time; 70 %ultrasonication amplitude; 0.5 mm
sonotrode diameter. Trypsin concentration: 3.6 µg /mL. ............................................... 86
Table IV.1: Characteristics and parameters of the ultrasonic devices used for the acceleration of
washing, reduction and alkylation steps. ...................................................................... 113
Table IV.2: Comparison of the sequence coverage (%) and number of matched peptides obtained
with the classic sample treatment and the ultrasonic enhanced procedure for proteins
from a complex mixture from different sulfate reducing bacteria (n = 2). ................... 124
Table V.1: Theoretical vs. experimental isotopic distribution for the tryptic peptide fragment
(YLYEIAR)H+ from BSA digestion. ........................................................................... 137
Table V.2: 16
O/18
O ratios of different peptides obtained from the tryptic digestion of BSA,
ovalbumin and α-lactalbumin (900 pmol each protein), in the presence of 95 % H218
O.
Different labeling methods were used in this experimental: overnight (12 h); ultrasonic
bath (35 kHz; 70 % amplitude, 60ºC, 15 and 30 min); ultrasonic bath (130 kHz; 70 %
amplitude, 60ºC, 15 and 30 min); water bath (60ºC, 15 and 30 min). Values were
obtained after MALDI-TOF-MS analysis in the reflectron positive ion mode (n=2). . 139
Table V.3: 18
O1/18
O2 ratios of different peptides obtained from the tryptic digestion of BSA,
ovalbumin and α-lactalbumin (900 pmol each protein), in the presence of 95 % H218
O.
Different labeling methods were used in this experimental: overnight (12 h); ultrasonic
bath (35 kHz; 70 % amplitude, 60ºC, 15 and 30 min); ultrasonic bath (130 kHz; 70 %
amplitude, 60ºC, 15 and 30 min); water bath (60ºC, 15 and 30 min). Values were
obtained after MALDI-TOF-MS analysis in the reflectron positive ion mode (n=2). . 142
Table VI.1: Percentage of double 18
O incorporation (18
O2) at the peptide’s C-terminus. BSA (60 µg)
digestion/labeling with trypsin was performed during 12 h (overnight) and with
different ultrasonic devices: (i) ultrasonic bath (USB 130 kHz) operating at 70 %
amplitude and 60ºC; (ii) ultrasonic probe (UP) operating at 50 % amplitude and
equipped with a 0.5 mm sonotrode; (iii) sonoreactor (UTR) operating at 50 %

Index of tables
xxix
amplitude. The ultrasonication time was comprised between 30 s and 30 min. The five
most intense mass peaks were considered: 927.49 m/z – (YLYEIAR)H+; 1001.59 m/z –
(ALKAWSVAR)H+; 1439.81 m/z – (RHPEYAVSVLLR)H
+; 1479.80 m/z –
(LGEYGFQNALIVR)H+; 1639.94 m/z – (KVPQVSTPTLVEVSR)H
+. (n=3) ........... 155
Table VI.2: Percentage of total 18
O-incorporation (18
Ototal) at the peptide’s C-terminus. BSA (60 µg)
digestion/labeling with trypsin was performed during 12 h (overnight) and with
different ultrasonic devices: (i) ultrasonic bath (USB 130 kHz) operating at 70 %
amplitude and 60ºC; (ii) ultrasonic probe (UP) operating at 50% amplitude and
equipped with a 0.5 mm sonotrode; (iii) sonoreactor (UTR) operating at 50% amplitude.
The ultrasonication time was comprised between 30 s and 30 min. The five most intense
mass peaks were considered: 927.49 m/z – (YLYEIAR)H+; 1001.59 m/z –
(ALKAWSVAR)H+; 1439.81 m/z – (RHPEYAVSVLLR)H
+; 1479.80 m/z –
(LGEYGFQNALIVR)H+; 1639.94 m/z – (KVPQVSTPTLVEVSR)H
+. (n=3) ........... 158
Table VI.3: Percentage of double 18
O-incorporation (18
O2 %) and total 18
O-incorporation (18
Ototal %)
in different peptides from ovalmunin and α-lactalbumim. The labeling reaction was
performed during 12 h (overnight) and with different ultrasonic devices: (i) 30 min with
the ultrasonic bath (USB 130 kHz) operating at 70 % amplitude and 60ºC; and (ii) 15
and 30 min with the sonoreactor (UTR) operating at 50 % amplitude. The most intense
peptides considered for ovalbumin were: (VYLPR)H+ – 647.39 m/z;
(HIATNAVLFFGR)H+ – 1345.74 m/z; (GGLEPINFQTAADQAR)H
+ – 1687.84 m/z;
and for α-lactalbumim: (CEVFR)H+ – 710.33 m/z; (VGINYWLAHK)H
+ – 1200.65 m/z.
(n=3) ............................................................................................................................. 159
Table VI.4: Effect of the enzyme-to-protein ratio (E:P) on the labeling efficiency (18
Ototal %) and
labeling degree (18
O2 %). Aliquots of BSA (60 µg) were labeled during 15 min with the
sonoreactor (50 % amplitude) in the presence of H218
O and trypsin. Different E:P ratios
were used: (i) 1:120 w/w (trypsin – 0.5 µg); (ii) 1:80 w/w (trypsin – 0.75 µg); (iii) 1:60
w/w (trypsin – 1.0 µg); (iv) 1:40 w/w (trypsin – 1.5 µg); (v) 1:30 w/w (trypsin – 2.0
µg). The five most intense mass peaks were considered: 927.49 m/z – (YLYEIAR)H+;
1001.59 m/z – (ALKAWSVAR)H+; 1439.81 m/z – (RHPEYAVSVLLR)H
+; 1479.80
m/z – (LGEYGFQNALIVR)H+; 1639.94 m/z – (KVPQVSTPTLVEVSR)H
+. (n=3) . 161
Table VI.5: Effect of the sample concentration on the labeling efficiency (18
Ototal %) and labeling
degree (18
O2 %). Aliquots of BSA: (i) 2.5 µg; (ii) 5 µg; (iii) 15 µg; (iv) 30 µg; and (v)
60 µg were labeled during 15 min with the sonoreactor (50 % amplitude) in the
presence of H218
O and trypsin. A constant enzyme-to-protein ratio was used in this
experiment: 1:40 w/w. The five most intense mass peaks were considered: 927.49 m/z –
(YLYEIAR)H+; 1001.59 m/z – (ALKAWSVAR)H
+; 1439.81 m/z –

Index of tables
xxx
(RHPEYAVSVLLR)H+; 1479.80 m/z – (LGEYGFQNALIVR)H
+; 1639.94 m/z –
(KVPQVSTPTLVEVSR)H+. (n=3) ............................................................................. 163

1
PART I


Chapter I
3
Chapter I
GENERAL INTRODUCTION


Chapter I
5
I.1. Proteomics
I.1.1. A new era in protein science
The word “Proteome” was introduced for the first time by Marc Wilkins in 1994 during the scientific
meeting “2D electrophoresis: from protein maps to genomes” held at Siena, Italy [1, 2]. In 1995, the
first papers using this new term were published and defined the proteome as “the protein product of
the genome” [3, 4]. At the same time the word “Proteomics” appeared, in analogy with “Genomics”, to
describe the scientific field that studies the proteome using a wide range of separation, analytical and
bioinformatic tools to characterize and measure the result of gene expression at one time, under
specific conditions, in a cell, tissue or organism [5, 6]. Unlike the genome, which is identical in all
cells and tissues of an individual, the proteome is a dynamic entity that varies with the type of cells
and their physiological state [7]. To fully understand the complexity of the term proteome, one can
look to the Homo sapiens example: the human genome encodes 20 000 – 25 000 protein-coding genes,
but the number of different proteins expressed in humans is estimated to be around 1 000 000 [8]. The
large number and variety of expressed proteins is due to chemical modifications, known as post-
translational modifications, which happen after protein synthesis. Glycosylation, phosphorylation,
acetylation, methylation, and ubiquitylation are some examples of post-translational modifications.
The extent and diversity of these modifications in proteins is directly related with their function,
regulatory mechanisms and external factors [9, 10]. Furthermore, the protein abundance dynamic
range, which covers more than 5 orders of magnitude, makes the study of the proteome a humongous
task [6].
Since the definition of the concept 15 years ago, proteomics has become a very important discipline
among the scientific community with multiple applications. Unlike the classical protein biochemistry
science, which studies individual proteins emphasizing on structural, function and complete sequence
analysis, proteomics investigates complex biological systems to understand the relation between
different proteins and their distinct functions within large networks [11]. By studying these complex
systems at the proteome level, scientists can obtain better knowledge about biological functions,
understand the changes in cellular regulation mechanisms caused by disease states, identify disease
biomarkers and develop new drugs or therapeutic approaches [7, 12]. To achieve this kind of complex
information, proteomics relies on a number of different but complementary tools, such as: two-
dimensional gel electrophoresis (2DE), chromatographic separation methods, mass spectrometry
(MS), stable isotope labeling approaches for protein quantitation, and software for data collection and
analysis. Some of the most important methodologies and advances within the proteomics field will be
addressed in the next sections.

General Introduction
6
I.1.2. Top-down versus Bottom-up proteomics
The identification of proteins in proteomics can be performed at the protein level or at the peptide
level. The first approach is named as “top-down” while the second is known as “bottom-up”
proteomics.
In top-down proteomics, after protein purification, the intact protein ions are introduced in a mass
spectrometer and fragmented in the gas phase [13]. Normally, this is accomplished with powerful
mass analyzers, such as the Fourier transform ion cyclotron resonance (FT-ICR), which can provide
high-resolution mass spectra of large proteins, usually unit mass resolution, and fragment intact
proteins with high-mass accuracy [14]. The use of high resolution mass spectrometry is imperative to
obtain virtually the entire protein sequence and to characterize post-translational modifications, which
are stable when the ion fragmentation occurs at the protein level [15, 16]. Yet, some limitations
hamper the widespread use of this approach: (i) the MS spectra produced can be very complex and
hard to interpret due to the multiple charged product ions, which difficult the determination of the
correct fragment masses; (ii) high resolution mass analyzers like FT-ICR or the orbitrap are very
expensive; (iii) the fragmentation mechanisms of proteins are less understood than the correspondent
peptide forms [14-16].
Figure I.1: Common bottom-up approaches for protein identification by mass spectrometry.
Contrasting with the former protein identification approach, in bottom-up proteomics the proteins are
hydrolyzed into peptides for mass spectrometry identification. The most used bottom-up strategies are
depicted in Figure I.1. The first methodology entails protein separation by 2DE and then digestion
with proteases, normally trypsin. In the second approach, also known as “shotgun” proteomics, the
mixture of proteins is enzymatically digested to complex mixtures of peptides, which are separated by
chromatographic techniques. The final step in both procedures is peptide analysis by MS or tandem-
MS (MS/MS) [16, 17]. Protein identification is accomplished by comparison between the peptide
mass values obtained and the theoretical mass values present in dedicated databases.
Proteinmixture
MassSpectrometry
Proteins
Complex peptidemixture
Peptides
Separation
Digestion
Peptides
Identification
Bioinformatics

Chapter I
7
Bottom-up proteomics is currently the most used approach for protein identification due to several
reasons: (i) it can be easily automated; (ii) several MS technologies are available from different
companies, compatible with different sample treatment procedures; and (iii) the databases for data
analysis are easily accessible. However, unlike the top-down approach, bottom-up proteomics does not
provide information on the entire protein sequence, because only a part of the digested peptides is
identified. Moreover, information regarding post-translational modifications is often lost, which limits
the ability to distinguish between protein isoforms [14, 16, 17].
I.1.3. Analytical proteomics
The complex nature of the proteome demands the use of different analytical technologies to obtain the
global picture of the cellular state [18]. Most proteomics workflow use MS for protein profiling
through a bottom-up approach. However, MS analysis of complex biological samples generates
incomprehensible data due to the enormous amount of proteins present in different abundance levels
with a dynamic range higher than 5 orders of magnitude, and in different forms with diverse post-
translational modifications [19]. Therefore, a reduction in the complexity of these protein mixtures is
crucial to obtain good and reliable MS results. This is generally achieved through fractionation and
separation techniques such as: two-dimensional gel electrophoresis (2DE) and liquid chromatography
(LC) [19-24].
I.1.3.1. Two-dimensional gel electrophoresis
Electrophoresis is defined as the movement of charged molecules under an electrical field towards the
opposite charged electrode. Due to their varying charges and masses, different molecules move with
different velocities and became separated into single fractions [25].
During the first years, most proteomics studies relied on 2DE for protein separation from complex
samples [22, 26]. Yet, this technology had been developed years before by 3 independent scientists.
O’Farrel reported in 1975 the development of a high resolution and sensitive technique for the analysis
of complex biological samples, which he successfully used to resolve a great number of proteins
(1100) from a complex E. coli sample, combining separation by isoelectric focusing in the first
dimension with sodium dodecyl sulfate polyacrylamide gel electrophoresis (SDS-PAGE) in the second
dimension [27]. During the same year, Klose reported the protein mapping of mouse tissues with high
resolution and reproducibility by a similar methodology [28]; and Sheele used slab gel isoelectric
focusing and a gradient SDS-PAGE for the characterization of secreted proteins from a guinea pig
pancreas [29]. The fundamental concept of this technique is the separation of complex mixtures based
on two independent protein characteristics: the isoelectric point (pI) and the molecular mass (MW).

General Introduction
8
Proteins are first separated according to their net charge by isoelectric focusing (IEF). In the second
dimension, proteins are separated by SDS-PAGE according to the molecular mass [27-29].
In the first procedures developed for two-dimensional polyacrylamide gel electrophoresis (2D-PAGE),
the IEF was performed in polyacrylamide tube gels with pH gradients produced by amphoteric
compounds in liquid form, carrier ampholytes (CA). When an electrical field is applied to these small
ionisable molecules they migrate according to their isoelectric point and a pH gradient is generated
[30]. However, the lack of IEF reproducibility due to (i) the instability of the pH gradient; (ii) the
batch-to-batch variability of the CA mixtures; and (iii) the technical difficulties in transferring the
proteins from the tube gel to the second dimension SDS-PAGE gel, hampered the exchange of 2D-
PAGE data between different laboratories and the widespread use of this technique [11, 19].
Meanwhile, some technical limitations were overcome by the introduction of immobilized pH
gradients (IPG) for IEF [31], allowing higher resolution in the separation process, higher loading and
buffering capacity, and improved reproducibility of the 2D maps [32]. The original IPGs used acidic
or basic buffering groups (Immobiline) covalently linked to the polyacrylamide gel to generate the
desired pH gradient, between pH 3 and 10 [31]. Currently, in most 2D-PAGE experiments the IEF is
performed with commercially available IPG strips in variable lengths and with different pH ranges
[33].
With the current 2D-PAGE methodologies thousands of proteins can be resolved and visualized at the
same time on a single 2D gel, providing a global view of the proteome at a particular time. Important
information on the molecular mass and isoelectric point of the proteins can be obtained, and relative
quantitation can be performed by gel comparison. In addition, proteins with post-translational
modifications can be easily detected and image analysis can be used to select specific protein spots for
MS analysis. Last but not least, this is a relatively low-cost technology accessible to most proteomics
laboratories [19, 33]. Nevertheless, this separation tool has some important limitations: (i) it is labor
intensive; (ii) has low throughput and reproducibility issues; (iii) most hydrophobic and membrane
proteins are difficult to analyze by IEF; (iv) co-migrating spots can produce incorrect quantitative
measurements; (v) low-abundance proteins are under-represented and most of the time they cannot be
detected due to the limited detection range of the staining reagents used for protein visualization [19,
33-35]. Despite these limitations, 2D-PAGE is still an essential tool for protein separation in many
proteomics studies and projects [36].
The introduction of narrow range IPGs and sample pre-fractionation techniques improved 2D-PAGE
resolution and the ability to detect low-abundance proteins [33, 37]. While the wide range IPGs (pH 3-
10) provide a general overview of the proteome, narrow range IPGs generally cover 1 pH unit per strip
(e.g. pH 4-5; pH 5-6) and can seriously increase the resolution of the 2D-PAGE separations [30, 37,
38]. Sample pre-fractionation techniques are also used to improve the representation of low abundant

Chapter I
9
proteins in 2D-PAGE through the simplification of crude samples. There are different pre-
fractionation methods available and their application depends on type of sample [1, 36, 39, 40].
Subcellular fractionation [41-43], differential solubilization [44-47], chromatography techniques [48-
51], continuous free-flow electrophoresis (FFE) [52-54], laser capture microdissection (LCM) [55-57],
the Rotofor system [58, 59], high-abundance protein depletion [60, 61] and the Protein Equalizer™
Technology [62, 63] (disclaimer: specific company, products and equipment names are given to
provide useful information; their mention does not imply recommendation or endorsement by the
author) are only a few examples among the different pre-fractionation methods available.
Nevertheless, it must be stressed that the pre-fractionation approaches have some reproducibility
issues and additional variability might be introduced in the analysis [37].
I.1.3.2. Liquid chromatography separation – shotgun proteomics
Proteomics methodologies based on liquid chromatography separations, also known as “shotgun”
proteomics, were developed as an alternative to the established 2D-PAGE approach, which has
important limitations in the analysis of membrane proteins, proteins with extreme pIs and low
abundance proteins [64-67]. The general procedure in shotgun proteomics is based on the enzymatic
digestion of a complex mixture of proteins into a mixture of peptides, which is then separated by high-
performance liquid chromatography (HPLC) and analyzed by tandem mass spectrometry (MS/MS)
[68, 69]. However, the complexity of the peptide mixture formed after protein digestion is so great that
it cannot be completely resolved in a single chromatography run before the MS analysis. This
limitation produces reproducibility problems and a reduction on the number of identified proteins, due
to the high amount of co-eluting peptides that enter into the mass spectrometer at a rate exceeding the
rate of the MS/MS analysis [65, 68]. This problem was overcome by the introduction of
multidimensional liquid chromatography (MDLC) [64-66, 68-71]. MDLC separations rely on coupling
two or more chromatographic separation dimensions to increase (i) the peak capacity, i.e. separation
resolving power; (ii) the dynamic concentration range and sensitivity to detect low abundance
proteins; and (iii) sample throughput [65, 70]. There are many MDLC approaches, with different
combinations of chromatographic techniques for peptide separation, but most procedures use reverse
phase (RP) liquid chromatography as the last separation dimension. This is due to the efficiency in the
resolution of complex mixtures of peptides and the compatibility of the solvent systems used for
peptide elution and the electrospray ionization for mass spectrometry [64, 65].
One of the most common MDLC approaches is the Multidimensional Protein Identification
Technology (MudPIT), developed in late 1990’s at the Yates group [72-74]. This approach was
successfully used to study the yeast proteome, allowing the identification of 1484 proteins in a single
run [73]. Briefly, this technology is based on a two-dimensional chromatographic separation in a
single biphasic microcapillary column packed with a strong cation-exchange (SCX) resin, and a C18

General Introduction
10
reverse phase. In the first dimension the separation is based on the electrostatic interactions between
different charged peptides and the SCX resin, and in the second dimension the separation occurs due
to the hydrophobic interactions between peptides and RP packing material. First, the acidified peptide
mixture is loaded into the SCX phase and eluted with increasing salt gradient buffers to the RP part of
the column. Then, the salts are washed off with a specific buffer, and the peptides are eluted with a
reversed-phase gradient buffer directly into the MS analyzer. The end of the capillary column is
tapered and is also used as the electrospray needle for peptide ionization. Finally, the MS/MS spectra
obtained for the different peptides is matched against mass spectrometry databases derived from the
genome of the organism being studied by bioinformatic algorithms [73, 74]. As an alternative to the
described biphasic columns, triphasic columns were introduced for MudPIT analysis [75]. These
columns, packed with an extra RP material prior to the SCX phase, allow the online analysis of high
salt concentration samples without previous offline desalting.
According to Wolters et al., the MudPIT technology has a dynamic range of 10 000:1 and is suitable
for the analysis of a great variety of proteins: low abundance proteins, proteins with extreme pI or
MW, hydrophobic proteins and membrane proteins [74]. Nevertheless, MudPIT presents also some
limitations, such as: (i) the processing time of a biological sample can be as high as 30 h; (ii)
experimental costs associated with the analysis time and the high grade solvents used; (iii) column
clogging due to sample impurities; and (iv) peptide co-elution, which hampers correct protein
identification and decreases reproducibility [69, 76, 77]. Even though, MudPIT is a valuable and
important tool for proteomics studies and has been used in different works: proteome analysis of
different bacteria, plants, membrane proteins studies and quantitative experiments [76].
MDLC was developed to overcome some important limitations of the 2D-PAGE methodology.
However, these technologies are not competitors; instead, they are complementary tools which provide
different but important information to understand complex proteome systems. Table I.1 summarizes
the main differences, the advantages and the limitations of the MudPIT and 2D-PAGE methodologies.
I.1.4. Protein digestion strategies
Most proteomics studies rely on peptide analysis by mass spectrometry for protein identification and
quantitation due to several reasons: (i) intact protein MS measurements are less accurate and less
sensitive than the corresponding peptide analysis; (ii) large hydrophobic proteins are difficult to
analyze; and (iii) fragmentation of intact protein ions produces multiple charged fragments and very
complex spectra [11]. Therefore, protein digestion procedures are used to produce a specific pool of
peptides from single proteins, or from complex mixtures of proteins, which is then analyzed by MS.
To obtain good and reproducible results, proteins should be hydrolyzed at specific positions and the
peptide fragments produced should have more than 6 amino acids to avoid multiple matches in

Chapter I
11
database searches, and less than 20 residues to improve MS/MS analysis [11]. Protein digestion can be
accomplished through enzymatic reactions or by chemical reagents, such as cyanogen bromide
(CNBr) or acid solutions [78, 79]. The choice of the method used for protein digestion depends on the
type of protein, on the protein sequence and on the objective of the work.
CNBr cleaves proteins in acid medium at the C-terminus of methionine, except when threonine or
serine residues are the next amino acids in the sequence [80]. However, due to the low frequency of
methionine residues in proteins, the reaction with CNBr generates a low number of large peptide
fragments (MW > 2000 Da) which do not provide useful sequence MS data [11, 81]. One way to
improve the CNBr chemical digestion of proteins is by coupling this procedure with enzymatic
digestions [81].
Table I.1: Comparison between 2D-PAGE and MudPIT methodologies for protein separation.
2D-PAGE MudPIT
Separation target
Complex protein mixtures Complex peptide mixtures
1st dimension
IEF separation based on the pI of proteins SCX chromatography separation based on the
charge of the peptides
2nd dimension
SDS-PAGE separation based on the MW of
proteins
Separation by RP chromatography based on the
hydrophobic character of the peptides.
Advantages
High resolving power (thousands of proteins/gel)
pI and MW information
Relative quantitation by direct comparison
between different gels
Parallel gel runs – reduces the analysis time
Image analysis
Separation of protein isoforms – information on
post-translational modifications
Identification of thousands of proteins in a single
run
Identification of membrane proteins and proteins
with extreme pI and MW
Minimal sample loss
Reduced sample handling
Automation
Disadvantages
Dynamic range – limits the detection sensitivity
Low sample capacity
Analysis of membrane proteins and extreme pI
and MW proteins
Low-throughput
Automation problems
Protein co-migration affects protein identification
and relative quantitation
Labor intensive
Dynamic range – limits the detection sensitivity
MS duty-cycle – MS/MS analysis rate limits the
peptide detection
Ion suppression of low abundance peptides
Column clogging due to sample impurities
Peptide co-elution compromises quantitation and
identification
Expensive reagents and maintenance
Long analysis time

General Introduction
12
Acid hydrolysis digestion is another example of a chemical protein digestion. Is this approach the
peptide fragments are rapidly obtained after protein hydrolysis with hydrochloric acid (HCl) or
trifluoroacetic acid (TFA). Yet, the MS data obtained is not suitable for protein identification by
database search due to the nonspecific cleavage products [82-85]. The problem of nonspecific
cleavages can be overcome by using dilute formic acid (FA), which specifically cleaves the peptide
bond at the C-terminal group of aspartyl amino acid [86, 87].
Enzymatic digestion of proteins with proteases produces a reproducible pool of peptides suitable for
MS analysis. This feature makes this the preferred and most popular method to obtain the peptide
fragments for protein identification [79, 88]. Different proteases are available for protein digestion.
The main differences between them are related with the optimal operating conditions and the cleavage
sites on the protein sequence [89]. The temperature and the pH of the buffer significantly affect the
enzymatic activity and must be controlled and optimized to obtain the best enzymatic performance
[79]. For instance: Asp-N has an optimal pH between 6 and 8.5 and hydrolyses the peptide bond at
the amino side of aspartate residues; Glu-C cleaves at the carboxyl side of glutamate and aspartate
residues in sodium phosphate buffer, and only at glutamate residues when ammonium acetate or
ammonium bicarbonate is used; and Lys-C works best at pH 8.5 and cleaves specifically at the
carboxyl side of lysine residues, except when this residue is followed by a proline [11, 90]. Generally,
only one enzyme is used for protein digestion, but it has also been reported the use of multiple
proteases to improve protein identification and characterization [91]. Trypsin is the most used protease
in MS-based proteomics studies, due to several factors: (i) high specificity, since it hydrolyses the
peptide bond at the C-terminus of lysine and arginine residues, except when a proline follows in the
sequence [92, 93]; (ii) the peptides produced have basic residues at the C-terminus (arginine and
lysine) which make them easily ionisable in the mass spectrometer [88]; and (iii) the mass range of the
obtained peptides, between 800 and 4000 Da, provides excellent MS and MS/MS data [79, 93].
In general, protein enzymatic digestion can be performed by three different approaches: (i) in-gel
digestion; (ii) in-solution digestion; and (iii) digestion with immobilized enzymes [78, 79, 94]. Each
one of these approaches, as well as other new methodologies for protein digestion, will be addressed in
the next sections.
I.1.4.1. In-gel protein digestion
This approach is used to hydrolyze proteins after separation by 1D or 2D-PAGE [95]. There are
different procedures available, but most of them comprise the same steps and are equally tedious and
time-consuming [96-98]. Moreover, the numerous sample handling steps make this methodology
prone to contamination, normally by keratins present in human skin, textiles and dust. Therefore
special measures should be taken when handling electrophoresis gels and samples: powder free gloves

Chapter I
13
must always be used during sample processing, and the laboratory material, such as pipettes, tips,
tubes and flasks, should be stored in a dust-free environment [98].
The general protocol for protein digestion is as follows [76, 79, 96]:
First step – gel staining. After protein separation by gel electrophoresis, the polyacrylamide gel is
stained to locate the proteins that will be analyzed. There are different staining reagents, each one with
different detection limits and specificities, but the most common are the Coomassie Brilliant Blue
(CBB), sliver nitrate, and fluorescent dyes like Sypro® Ruby, Sypro® Orange and Sypro® Red [99].
Second step – protein excision. The excess of staining is removed from the gel, and the proteins are
located. The bands or spots from 1D or 2D-PAGE, respectively, are excised and transferred to
individual tubes for enzymatic digestion.
Third step – washing, reduction and alkylation. The gel pieces are washed with mixed buffer
solutions and organic solvents to remove the remaining staining reagents and other contaminants. If
the protein sample was not previously reduced and alkylated, then, a series of additional steps must be
performed before digestion. First, proteins are denatured by the reduction of disulfide bonds between
cysteine residues with DL-dithiothreitol (DTT), during ca. 25 min at 37ºC. To prevent protein
renaturation, a further reaction with iodoacetamide (IAA), at room temperature during 30 min, is
performed. This introduces a modification at cysteine residues, carbamidomethylation, and prevents
the formation of disulfide bonds.
Fourth step – protein digestion. In this step the gel piece is incubated with trypsin at 37ºC during 4 to
12 h. This is a critical step and several parameters need to be optimized to obtain a good protein
digestion yield: (i) the enzyme-to-protein ratio should be controlled to maximize the digestion
efficiency and, at the same time, reduce enzyme autolysis; (ii) the buffer concentration, composition
and pH; and the (iii) reaction temperature must be controlled and adjusted to the optimal enzymatic
conditions to guarantee the best enzymatic activity.
Fifth step – peptide extraction. The reaction media is acidified with FA or TFA to stop the enzymatic
digestion. Then, the supernatant containing the digested peptides is removed to another tube, and
additional peptides are extracted from the gel with a 50 % acetonitrile/0.1 % TFA solution. After the
extraction step, the supernatant and the extraction solutions are combined and analyzed by MS, or
stored frozen for further analysis.
The major drawbacks of this approach are related with: (i) laborious sample handling; (ii) low
throughput; (iii) low protein digestion yield; and (iv) extended analysis time [78].

General Introduction
14
I.1.4.2. In-solution protein digestion
This procedure is normally used to digest complex mixtures of proteins in shotgun proteomics
experiments. As previously referred for the in-gel digestion protocols, also in this case special
measures should be taken to avoid sample contamination. Despite some variations due to the type of
samples analyzed, in-solution digestion procedures share the same basic steps [76, 78, 100].
First step – sample preparation. To obtain large digestion yields from whole cell extracts, the sample
must be homogeneous and contaminant free. Protein precipitation methods, with trichloroacetic acid
(TCA) or acetone, are normally used to remove nucleic acid contaminants, lipids and salts from
biological samples. After precipitation, proteins are solubilized in a suitable buffer. Generally, organic
solvents, like acetonitrile, or chaotropic agents, such as urea or thiourea, are used for protein
solubilization and denaturation [76].
Second step – reduction and alkylation. Denatured proteins have their tertiary structure disrupted,
which facilitates the access of the protease to cleavage sites that otherwise would be concealed in the
native form of the protein. To obtain complete protein denaturation, disulfide bonds between cysteine
residues must be disrupted. As for in-gel digestion, DTT and IAA are normally used to reduce and
alkylate cysteine amino acids, preventing protein renaturation [100]. The reaction with DTT is
performed for 50 min at 60ºC, and alkylation with IAA is carried out at room temperature, in dark,
during ca. 35 min. However, special care must be taken with buffers containing urea. Urea exists in
equilibrium with isocyanic acid in solution. Isocyanic acid reacts with the side chains of lysine
residues introducing a chemical modification known as carbamylation. This reaction is very slow at
room temperature but is accelerated when the temperature rises above 40ºC [1]. Hence, the
temperature should be carefully controlled and maintained below 40ºC if urea buffers are used.
Third step – protein digestion. In general, proteolysis is performed during 12 to 24 h. To guarantee
that protein digestion is not compromised by a deficient enzymatic activity, three main variables need
to be controlled: (i) the buffer pH; (ii) the buffer concentration; and (iii) the reaction temperature.
Trypsin as an optimal pH between 7 and 8, and an optimal temperature of 37ºC. However, its activity
is deeply affected by the buffer composition. Urea buffers with a concentration of 8 M are normally
used for protein solubilization, but the activity of trypsin is very low under these conditions. Hence,
when trypsin is used for proteolysis, the sample should be diluted to reduce urea concentration below
2 M. Other approaches use Lys-C to digest proteins in 8 M urea buffers and after sample dilution to 2
M the digestion is carried out with trypsin [76, 78].

Chapter I
15
Fourth step – peptide analysis. The reaction media is acidified with FA or TFA to pH 2 – 3 to stop
the enzymatic digestion. The complex mixture of peptides is finally separated and desalted by MDLC
and analyzed by MS.
In-solution digestion is suitable for on-line applications and the sample handling is easier than the
previous described in-gel approach. Yet, there are some drawbacks: (i) time-consuming enzymatic
digestion; (ii) protein modifications, such as carbamylation, introduce variability; (iii) enzyme
autolysis products may introduce background noise in MS analysis [78, 79].
I.1.4.3. Protein digestion with immobilized enzymes
In this approach the proteolysis occurs when the protein solution pass through solid supports with
immobilized enzymes, also known as immobilized enzyme reactors (IMERs). The reduction of
enzyme autolysis products, the increase of the enzyme-to-protein ratio and the reduction in the
digestion time are the main advantages of this methodology over the traditional in-solution or in-gel
digestion procedures [94, 101-103].
Enzymes can be immobilized in different supporting materials. The most usual are immobilization in
silica monolithic supports, in synthetic polymers, in chromatographic stationary phases, in magnetic
beads, and in microfluidic chips [101, 103]. Each one of these materials has particular properties,
which affect the performance of the proteolytic reaction [78].
One of the greatest advances introduced by IMERs was the automation and the reduction in sample
handling with on-line digestion approaches. The enzyme, normally trypsin, is immobilized in a
column and buffered solutions of proteins are eluted with a reduced flow rate to allow the enzymatic
digestion [101]. For example, the procedure developed by Craft et al. uses an automated HPLC system
with a trypsin packed column coupled to a mass spectrometer for on-column digestion and direct
analysis of the peptide fragments [104]. Immobilized trypsin cartridges, or columns, are available from
different companies. The Poroszyme® immobilized trypsin cartridge, which can be connected directly
to an LC-MS system, is available from Applied Biosystems, and it is claimed that complete and
automated digestions can be obtained in 5 min [105]. Sigma-Aldrich offers another alternative, the
Trypsin Spin Columns, which digest proteins in 15 min [106]. Yet, the high cost and the sample
preparation procedure before protein digestion present some limitations to the use of these products
[78, 79, 94]. Recently, reports were made on the development of a device with immobilized trypsin
that completes protein digestion in only 1 min: the DigesTip [107]. The DigesTip is a typical pipette
tip with an immobilized trypsin cartridge. Protein digestion is performed simply by aspiration and
release of the protein sample through the pipette tip, for 1 min, in repetitive cycles. This seems a

General Introduction
16
promising approach for protein digestion, but more applications and studies are necessary to prove its
full potential.
I.1.4.4. New technologies to improve protein digestion procedures
The identification and quantitation of proteins for proteome characterization is the main goal of most
proteomics studies. Traditionally, sample preparation procedures for MS identification are the
bottleneck of most protein profiling studies, and hamper the rapid identification of proteins. The
classical procedures addressed in the previous sections are tedious, labor-intensive and generally have
low-throughput [79, 94]. Protein digestion is normally emphasized as the limiting step for protein
identification and numerous technologies have been developed to improve the enzymatic digestion.
Microwave energy; heating; mixed organic-aqueous solvents; ultrasound; and infrared energy are
some examples of new methodologies developed to accelerate protein digestion.
I.1.4.4.1. Microwave Energy
Microwave energy has been used not only to enhance the enzymatic digestion, but also to improve
other time-consuming steps, such as protein reduction and alkylation. The mechanism responsible for
microwave catalysis is not well understood yet, but the main principle of this technique is related with
the agitation of polar molecules in an electrical field to generate heat [108]. Pramanik et al. were the
first to report the use of microwave energy to accelerate in-solution enzymatic digestion. They claimed
that protein digestion could be achieved in only 12 min with the same yield as the 6 h common
reaction [109]. Furthermore, nonspecific cleavage products were not observed and the digested
proteins were identified with sequence coverage higher than 80 %. In-gel protein digestion can also be
accelerated with microwave energy from overnight (ca. 12 h) to only 5 min [110]. In a different work,
Sun et al. developed a procedure, which they named “Microwave-Assisted Protein Preparation and
Enzymatic Digestion” (MAPED). They applied microwave energy not only to in-solution and in-gel
digestion procedures, but also to protein reduction and alkylation, and they were able to reduce the
total sample treatment time from almost 20 h to only 25 min [111]. Microwave methodologies are
easy to perform and provide high-throughput protein analysis. Yet, a number of variables need to be
optimized to obtain good results: (i) temperature; (ii) irradiation energy; and (iii) irradiation time [79,
108].
I.1.4.4.2. Heating
Havlis et al. reported in 2003 a new method for protein digestion based on heating the reaction media
[112]. Nevertheless, the increase of temperature per se does not mean that the enzyme reaction rate is
improved, because enzymes have an optimal operating temperature. Because the optimal temperature

Chapter I
17
of trypsin is ca. 37ºC, they used a modified version of the enzyme – reductive methylated trypsin,
which as an optimal catalytic activity between 50 and 60ºC. This modification makes the enzyme
more stable at higher temperatures and less prone to autolysis, which means that a higher enzyme-to-
protein ratio can be used. Finally, they claimed that in-gel proteolysis can be performed in 30 min at
58ºC, after incubation with modified trypsin during 60 min in an ice bath. The digestion yield obtained
was ca. 75 % of the classic overnight reaction yield [98, 112]. In another approach, Turapov et al.
were able to digest native proteins in a small volume (3 µL) in only 5 min [113]. Using a PCR-type
thermocycler to gradually increase the temperature of the reaction medium from 49 to 55ºC, they
improved protein identification results. Yet, this procedure was not tested in the digestion of complex
protein samples, and therefore further tests should be performed to prove the efficiency of this
approach.
I.1.4.4.3. Mixed organic – aqueous solvents
In this approach, methanol-water, acetone-water, and acetonitrile-water solvent systems were used to
digest proteins in-solution with trypsin at 37ºC [114]. The amino acid sequence coverage obtained
with the mixture of solvents, after 1 h of proteolysis, was always higher than with the aqueous buffer.
Curiously, it was reported that the pool of peptides generated is solvent dependant. The authors also
tested the digestion procedure with proteolysis resistant proteins, as myoglobin and chicken
ovalbumin, and found that myoglobin is efficiently digested in 5 min in 80 % acetonitrile solution.
This is a promising approach, especially for the digestion of hydrophobic or membrane proteins, since
buffers with chaotropic agents like urea, which may denature trypsin, are avoided. Lin et al. used
mixed organic – aqueous solvents and microwave energy to accelerate in-solution enzymatic digestion
of proteins, without previous reduction and alkylation [115]. They improved the digestion efficiency
using solvents containing acetonitrile, methanol or chloroform, heated during 10 min in a commercial
microwave oven. Furthermore, it was reported that the activity of the enzyme decreases with the
increasing methanol content of the solvent. In contrast, they found that the enzyme activity was
improved by increasing the acetonitrile percentage in the solvent system.
I.1.4.4.4. Ultrasonic Energy
In 2005, López-Ferrer et al. introduced the high-intensity focused ultrasound (HIFU) technology to
accelerate protein digestion [116]. Using an ultrasonic probe, the authors successfully digested BSA
and lysozyme in 40 and 60 s with, respectively, in-solution or in-gel approaches. Moreover, HIFU
digestion of complex protein samples in 60 s was also assessed and compared with the classic
overnight proteolysis. The authors reported similar MS spectra between both approaches, but the
number of identified peptides was slightly higher with the overnight digestion, and the number of
peptides with missed cleavage sites was higher for the HIFU protocol. Even though, the same proteins
General Introduction
18
were identified with both the HIFU and the overnight procedure. This method drastically reduces the
digestion time of proteins; it is economic, easy to handle and adaptable to on-line procedures.
However, a number of variables must be optimized to obtain the best ultrasound performance: (i)
ultrasonication power; (i) ultrasonication amplitude; (iii) ultrasonication time; (iv) temperature; (v)
enzyme-to-protein ratio; (vi) sample volume; and (vii) probe diameter [79]. The optimization of these
parameters, as well as the assessment of other ultrasonic technologies, is one of the main tasks
included in this dissertation and will be addressed in the next chapters.
I.1.4.4.5. Infrared Energy
Over the last 2 years a number of papers have been published claiming that protein digestion can be
achieved within 5 min with infrared radiation (IR). Wang et al. first reported the use of infrared energy
to obtain peptide digests in only 5 min from proteins in solution [117]. Briefly, after protein
denaturation in boiling water, trypsin was added to a protein solution of BSA, myoglobin or lyzozyme,
and the samples were irradiated with an IR lamp during 5 min at a controlled temperature of 37ºC. In
general, the results achieved in terms of amino acid sequence coverage were higher when IR was used,
instead of the common 12 h enzymatic digestion. Similar results were reported when IR energy was
applied to the digestion of proteins in solution with chymotrypsin [118]; to the digestion of proteins in
gel with trypsin [119], and protein digestion with immobilized enzymes [120]. Finally, an interesting
approach in which proteolysis is accomplished in 5 min directly on the MALDI plate was also
reported, and the results obtained were similar to the 12 h digestion [121]. Despite these promising
results, the authors did not test any of the developed procedures in whole proteome samples.
Therefore, the applicability of these approaches to large scale proteomics studies remains unclear, and
further validation is necessary.

Chapter I
19
I.2. Protein quantitation
The information about the relative or absolute expression of proteins in a cell, body fluid, tissue or
organism, is essential to understand and characterize the dynamics of the proteome. For example, the
measurement of changes in protein concentration helps to identify disease biomarkers and the
distinction between healthy and disease states [122-125]. There are two types of quantitative
information: (i) absolute quantitation, which provides information on the exact amount of proteins
present in the sample; and (ii) relative quantitation, which measures the differences in protein
abundances between a sample and a control, and determines if a protein is up- or down-regulated
[126-128]. Generally, the quantitative information is achieved through gel-based approaches or by
mass spectrometry-based methodologies [128-133]. Figure I.2 schematically presents the different
methodologies used to measure protein abundance in proteomics experiments.
Figure I.2: Overview of quantitative methodologies used in proteomics studies. (Adapted from Lau et
al. [126])
Quantitative proteomics
Gel-based quantitation
DIGE
Mass spectrometry-based quantitation
Relative quantitation
Label-free
Spectral counting
Peak area measurements
Stable isotope labeling
In-vivo
Metabolic labeling
SILAC15N-labeling
In-vitro
Chemical labeling
ICAT
iTRAQ
Enzymatic labeling
18O-labeling
Absolute quantitation
AQUA

General Introduction
20
I.2.1. Gel-based quantitation: difference gel electrophoresis (DIGE)
In the classical gel-based quantitative approach, complex mixtures of proteins are separated in
different 2D-PAGE experiments and, after gel staining, the protein distribution pattern is analyzed
with imaging software. Then, the relative abundance of each protein is obtained by comparison
between the intensities of the protein spots in different 2D gels [134, 135]. However, the variability
found in the protein separation pattern due to fluctuations in temperature, differences in pH, electrical
fields and in the polymerization of the polyacrylamide gel, poses major limitations to the comparison
of protein spots from different gels, affecting the reproducibility of the quantitation procedure [136,
137]. To overcome these limitations, Unlu et al. developed the difference gel electrophoresis (DIGE).
This method allows the separation of more than one sample in a single polyacrylamide gel, eliminating
gel to gel variability, which improves protein quantitation results [138]. Figure I.3 describes the
general DIGE workflow. In the first step, two or three different protein samples are labeled with
different fluorescent cyanine dyes, known as Cy2, Cy3 and Cy5 dyes. Next, the different samples are
pooled together and separated on the same 2D-PAGE experiment. Finally, the gel is revealed by
fluorescence imaging: the 2D-PAGE gel is scanned at different wavelengths, which correspond to the
excitation wavelengths of the specific dyes. The difference between the intensities of the cyanine dyes
in a particular protein spot is measured by image-analysis software, and the protein relative abundance
is obtained [136-138].
Figure I.3: DIGE workflow for protein quantitation. Different protein samples, labeled with different
fluorescent cyanine dyes (Cy2, Cy3 and Cy5), are pooled together and separated by 2D-PAGE. The
resulting gel is revealed with different excitation wavelengths, and the difference between the
intensities of the cyanine dyes in a particular protein spot is measured by image-analysis software to
obtain the relative abundance of the protein.
According to Minden et al., the development of different dyes relied upon 4 main principles: (i)
distinct fluorescent characteristics; (ii) similar molecular mass; (iii) each dye must be specifically
linked to a particular amino acid; and (iv) the charge of the amino acid linked to the dye must remain
Cy2
Cy3
Cy5
Mix labeled samples
Protein separation 2D-electrophoresis
Different samples labeled with different
cyanine dyesImage with different
excitation wavelengthsImage analysis
Protein quantitation

Chapter I
21
unaltered [137]. The different set of dyes can be lysine- or cysteine-reactive. Since the relative ratio of
lysine residues in proteins is high, lysine-reactive dyes are used in a minimal labeling approach, which
means that only 1 in 20 proteins is actually labeled in a single lysine residue. This prevents protein
precipitation due to the hydrophobic character introduced when the dye is linked to multiple lysine
amino acids. Conversely, the lower ratio of cysteine amino acids in proteins, as well as the
zwitterionic character of the cysteine-reactive dyes, allows the labeling of every cysteine residues in
all proteins, increasing the sensitivity of the method. This is known as saturation labeling approach
[136, 137].
The DIGE methodology has a number of advantages over traditional gel-to-gel comparison, as
explained before. However, this technology presents also some drawbacks [132, 137]: (i) expensive
equipment, software and reagents; (ii) the labeling reaction has to be performed under rigorous
conditions to avoid the formation of different labeled protein species, and to prevent protein
precipitation due to the hydrophobic character of the dye; (iii) the introduction of a dye in the protein
structure causes molecular mass differences between labeled and unlabeled proteins, especially in
minimal labeling approaches; (iv) it is almost impossible to know where the cyanine dye is attached in
a protein so, different peptide mass patterns might be generated, hampering MS protein identification;
and (v) the different extinction coefficients of the dyes can introduce variability problems in protein
quantitation. Even though, the DIGE methodology as proven its value in may proteomics studies and
applications, such as the study of protein expression in different organisms, tissues, body fluids and
sub-cellular proteomes [137].
I.2.2. Mass spectrometry-based quantitation
Mass spectrometry-based quantitation approaches are influenced by the chemical and physical
properties of proteins and peptides ions, such as: (i) different charge states; (ii) amino acid
composition; (iii) different molecular mass; (iv) post-translational modifications; and (v) the presence
of buffer salts and other contaminants [130, 139]. These variables affect the ionization efficiency of
the different peptides, resulting in different mass peak intensities even in peptides from the same
protein [135]. Therefore, protein quantitation has to be performed by comparison between the same
peptide mass-to-charge ratios (m/z) from different samples. The best way to overcome these
limitations, is to introduce an internal standard with similar chemical and ionization properties [139].
This is normally accomplished by labeling different protein samples with stable isotopes, through
stable isotope labeling (SIL) methodologies [122, 140]. In this approach, a light- or heavy-isotope tag
is introduced in the protein or peptide from different samples and then, the heavy and light-labeled
peptides are mixed together and analyzed by mass spectrometry. The quantitative information is
obtained by measuring the ratio between the peak intensities of the light- and heavy-peptide forms,
which present distinct mass values due to the mass difference introduced by the isotopic tag [135].

General Introduction
22
SIL can be achieved by distinct approaches (Figure I.2): (i) the in-vitro approach involves the
introduction of the isotope tag before, or after protein digestion, through a chemical or enzymatic
reaction; (ii) the in-vivo approach involves the introduction of the stable isotope label at the protein
level during cell growth [141-145]. Yet, a number of conditions have to be ensured to obtain accurate
quantitative measurements: (i) the chemical properties of the peptides must not be altered by the
introduction of the isotope label to guarantee an equal behavior between different peptide forms in
subsequent separation steps; (ii) the ionization efficiency of different labeled peptide forms must
remain unaltered to ensure that the relative quantitation is not affected by differences in the ionization
behavior upon mass spectrometry analysis; (iii) a minimal mass difference of 4 Da between the heavy
and light peptide forms must be obtained to prevent the overlap between isotopic patterns from
different labeled peptides in the mass spectra [135, 146, 147]. An overview of some important SIL
methodologies is given at the end of this section in Table I.2. The following sections describe some of
the most used SIL methodologies, as well as the label-free and absolute quantitation approaches.
I.2.2.1. 15
N-metabolic labeling
This methodology is based on the metabolic incorporation of 14
N or 15
N stable isotopes into proteins
during cell growth [122, 128, 133]. In 1999, Oda et al. described the quantitation of phosphopeptides
from yeast using this whole-cell stable isotope labeling approach [148]. Briefly, two different cell
cultures are grown in different cell culture media: one composed of natural abundance 14
N-glucose and
the other composed of 15
N-labeled glucose. After the appropriate growing period, every amino acid
within the cell is labeled with 14
N or 15
N. This allows the discrimination between different labeled
peptide species by mass spectrometry, and relative protein quantitation is achieved by measuring the
ratios between the relative intensities of the mass peaks of the 14
N and 15
N labeled peptides [148]. The
greatest advantage of this methodology relies in the early stage of isotope labeling: the different
samples are labeled during cell growth and then combined before sample treatment for MS analysis.
This way, variability and errors related with the sample handling procedure are reduced, since the
labeled and non-labeled proteins are processed as a unique sample [133]. However, there are some
limitations in this approach: (i) expensive reagents; (ii) the cells have to be compatible and able to
grow in isotopically enriched media; (iii) the labeling depends on the amino acid sequence of the
peptide; (iv) the mass shift introduced in peptides with unknown sequences cannot be predicted; and
(v) difficult interpretation of the mass spectra and lack of appropriate software for analysis [128, 129].
I.2.2.2. Stable isotope labeling by amino acids in cell culture (SILAC)
Stable isotope labeling by amino acids in cell cultures (SILAC) is a metabolic labeling methodology
developed by Ong et al. to overcome the limitations of 15
N metabolic labeling [149]. The main
difference between these two approaches is related with the cell culture media. The SILAC

Chapter I
23
methodology uses essential amino acids labeled with different heavy stable isotopes, which are added
to the cell culture media and incorporated into the proteins during cell growth [149-151]. The most
common heavy labeled amino acids in SILAC are the 13
C6-arginine and the 13
C6-lysine, which have a
mass difference of + 6 Da to the normal arginine or lysine residues. Other amino acids, like the
isotopically enriched leucine and methionine have also been used with success [151]. In general, only
essential amino acids that provide a minimum mass difference to the unlabeled samples of 4 Da should
be chosen [151]. The general SILAC workflow, depicted in Figure I.4, is similar to the 15
N-labeling
approach. Briefly, different cells are cultured in different heavy or light media, containing heavy-
labeled or natural isotope abundance essential amino acids, respectively. After a minimum of five cell
doublings it is expected that more than 97 % of the proteins have incorporated the heavy-labeled
amino acid. Finally, the different labeled samples are mixed, processed and analyzed by MS [151,
152].
Figure I.4: SILAC workflow for protein quantitation by MS. Cells are grown on culture media
enriched with either heavy labeled or natural abundance amino acids. Then, the samples are combined
and after protein extraction and digestion the peptides are separated by liquid chromatography and
analyzed by mass spectrometry. Sample quantitation is obtained from the extracted ion
chromatograms for the heavy- and light-labeled peptide forms. (adapted from Kline et al. [144])
The main advantages of the SILAC methodology are also related with the early stage of protein
labeling, which allows the different labeled samples to be mixed even before cell lysis. Thus, all
sources of variability and error introduced by fractionation, purification and mass spectrometry
procedures are excluded, because both sets of proteins are affected in the same extent. Moreover,
unlike the 15
N-labeling, the labeling is uniform and the mass differences depend only on the amino
acid selected for protein labeling. Therefore, the mass differences between heavy- and light-labeled
peptides are already known before peptide identification, which simplifies the quantitation
process[152]. Finally, no significant effect on the cell growth rates, or morphology, caused by the
presence of heavy-labeled amino acids in the culture media has been reported [151]. Some limitations,
however, can also be referred: (i) this method requires living cells, which exclude the application to
body fluids, clinical tissues and cells that do not grow in the required media for SILAC; (ii) eukaryotes

General Introduction
24
can metabolically convert arginine to proline residues, introducing error in the quantitation; (iii) it is a
time-consuming technique; (iv) the isotope labeled amino acids are very expensive reagents; and (v)
the large amount of data obtained complicates the interpretation of the results [141, 153]. Despite
these limitations, SILAC has been used with success in different studies, such as: the identification of
protein biomarkers; analysis of signaling pathways; subcellular proteomics and cell signaling
dynamics studies [152].
I.2.2.3. Isotope-coded affinity tag (ICAT)
Unlike the previous in-vivo labeling approaches, in which the isotope label is metabolically introduced
into the proteins during cell growth, the isotope-coded affinity tag (ICAT) methodology introduces the
heavy isotope tag through a chemical reaction between specific reagents and reactive sites on a
protein, or peptide. This methodology was first described by Gygi et al. to study the effect of different
carbon sources on protein expression in Saccharomyces cerevisiae [154]. The ICAT procedure for
protein quantitation comprises several steps (Figure I.5a). First, proteins from control and experiment
samples are isolated, denatured and reduced. Then, the cysteinyl residues side chains are tagged with
the heavy or light form of the ICAT reagent and the samples are combined and enzymatically
digested. Finally, the modified peptides are isolated by avidin affinity chromatography and quantified
by MS analysis [154-156]. The original ICAT reagent (Figure I.5b) is composed of three functional
elements [154]: (i) a thiol reactive group that specifically reacts with the reduced cysteine amino acid
side chain; (ii) a light- or heavy-labeled polyether linker with either 8 hydrogen atoms (H8) or 8
deuterium atoms (2H8), respectively; and (iii) an affinity tag, the biotinyl group, which allows the
selective recovery of the labeled peptides by avidin affinity chromatography.
The ICAT approach for protein quantitation has several advantages over the previous metabolic
labeling strategies: (i) compatibility with the analysis of body fluids, tissues and cell samples grown in
different conditions; (ii) the reaction between the ICAT reactive group and the cysteine residues is
highly specific and tolerant to the presence of salts, detergents and chaotropes; (iii) the presence of a
biotin group in the ICAT reagent, and the possibility to isolate labeled peptides through affinity
chromatography, allows the reduction of the sample complexity [155]. However, because the
quantitation is only based on peptides containing cysteine residues, proteins without cysteine amino
acids cannot be quantified. Another drawback is related with the large size of the ICAT tag, which
compromises peptide identification and fragmentation by mass spectrometry. Furthermore, the
presence of deuterium atoms in the polyether linker affect the retention time of the heavy-labeled
peptides when they are separated by reversed-phase chromatography [155, 157].
Over the last years some technical advances have been introduced to overcome the ICAT limitations
[156-158]. The most important development was the introduction of an acid-cleavable bond between

Chapter I
25
the biotin group and the isotope labeled linker, and the use of 13
C instead of 2H in the polyether labeled
chain [159]. The acid-cleavable bond allows the removal of the biotin affinity tag before the MS
analysis, improving the MS and MS/MS performance. The substitution of 2H by
13C heavy isotopes in
the labeled tag prevents the occurrence of different chromatographic retention times between heavy-
and light-labeled samples, improving the quantitation accuracy. These new ICAT reagents are known
as cleavable ICAT (cICAT).
Figure I.5: Overview of the ICAT methodology for protein quantitation through MS. a) ICAT
workflow. Proteins from different samples are isolated, tagged with the heavy or light ICAT reagents
at the cysteinyl residues, and pooled together. After protein digestion, the tagged peptides are isolated
by avidin affinity chromatography and analyzed by MS. Quantitation is obtained by measuring the
relative intensity between the labeled peptide pairs, and protein identification is achieved by tandem-
MS. b) Structure of the original ICAT reagent. The reagent consists of a biotin affinity tag used to
isolate the chemically modified peptides; a linker group in which the stable isotopes are incorporated;
and an iodoacetamide reactive group with specificity towards cysteine residues. (adapted from Kline et
al. [144] and Gygi et al. [154]).
I.2.2.4. Isobaric tag for relative and absolute quantitation (iTRAQ)
The isobaric tag for relative and absolute quantitation (iTRAQ) methodology, developed in 2004 by
Ross et al., is another example of a chemical isotope labeling approach [160]. Unlike the ICAT, this is

General Introduction
26
a multiplexed methodology, since it allows the comparison of multiple samples (more than 2) in the
same experiment, thanks to the particular characteristics of the tagging reagents. The iTRAQ reagents
consist of 3 groups with distinct functions (Figure I.6a): (i) a peptide reactive group based on a N-
hydroxy succinimide ester (NHS-ester), which reacts specifically with the N-terminus of every peptide
and ε-amine groups of lysine residues; (ii) a carbonyl balance group; and (iii) a reporter group based
on N-methylpiperazine [160]. The reporter group and the balance group form the isobaric tag with a
constant mass of 145 Da. Since these two groups are labeled with different proportions of 13
C, 15
N and
18O stable isotopes, their individual masses are not constant: the reporter group mass varies between
114 and 117 Da while the mass of the balance group ranges between 31 and 28 Da. Therefore, the
reporter and the balance group are combined in such a way that the mass of the isobaric tag remains
constant in all iTRAQ reagents.
In the iTRAQ strategy (Figure I.6b), proteins from different samples are isolated, reduced, alkylated
and enzymatically digested into peptides. Each set of peptides is then labeled with one of the four
isotopically labeled tags, mixed together and analyzed by MS. Since the iTRAQ reagents are isobaric,
the different labeled peptides cannot be distinguished in the initial MS scan. However, when the
peptides are analyzed by MS/MS, the tagging reagent is fragmented and the single charged reporter
groups, with masses from 114 to 117 Da, are detected. The relative abundance of the peptides is
calculated from the intensities of each reporter ion and, at the same time, the peptide sequence can be
determined from the MS/MS spectra [160, 161]. The analysis of MS data is generally performed with
different available software tools [122, 127, 162]. In addition, because the iTRAQ reagents are
deuterium free, the retention time of the different labeled peptides is not affected during liquid
chromatographic separations. Recently, the use of 8-plex iTRAQ reagents has been reported [127,
163]. These reagents allow the simultaneous comparison of 8 different samples. The reporter ion
masses are from 113 to 119 Da and 121 Da. The mass at 120 is not used to avoid the overlapping with
the mass from phenylalanine immonium ions (120.08 Da).
The capacity to analyze multiple samples at the same time (up to 8 samples) represents one of the
greatest advantages of this methodology. Additionally, all tryptic peptides are labeled, which increases
the confidence level in quantitation and protein identification. The main disadvantages are related with
the complex and laborious procedures necessary to obtain reproducible and robust results, and with the
expensive reagents required [127]. Wu et al. compared the performance of the DIGE, ICAT and
iTRAQ quantitation approaches [164]. The authors concluded that, even though the iTRAQ labeling
methodology was more prone to errors in the isolation of the precursor ion for quantitation, this
technique was the most sensitive of the three, followed by ICAT which was found to be more sensitive
than DIGE.

Chapter I
27
Figure I.6: Overview of the iTRAQ methodology for protein quantitation by MS. a) Structure of the
iTRAQ reagent. The reagent consists of three groups with distinct functions: the peptide reactive
group (red), a NHS ester with specificity towards the N-terminus of every peptide and ε-amine groups
of lysine residues; the balancer group (blue); and the reporter group (green), which is used for peptide
quantitation. The reporter group mass varies from 114-117 Da, while the complementary balance
group mass varies from 31-28 Da. Together, these groups form the isobaric tag with 145 Da. b)
Workflow of the iTRAQ labeling method. Proteins form different samples are isolated, digested to
peptides and chemically modified with an isobaric tag. The samples are mixed and analyzed by MS.
Peptides are analyzed by tandem-MS for protein identification and quantitation, which is calculated
from the ratios between the intensities of the different reporter groups. (adapted from Boehm et al.
[162] and Kline et al. [144])
I.2.2.5 Enzymatic 18
O-labeling
The 18
O-labeling of proteins was introduced by Sprinson et al. in 1951 [165] and it was used for the
first time as a quantitative approach by Desiderio et al. in 1983 [166] for the quantitation of opioid
pentapeptides. Since then it has been used in many proteomics studies, such as: quantitation of
proteins from viruses [167]; protein expression in liver diseases related with hepatitis-C virus infection

General Introduction
28
[168]; cellular processes affected by anthrax lethal toxins [169]; effect of culture conditions on the
protein expression of oral pathogens associated with chronic periodontitis [170]; in cancer related
studies [171-175]; and also as an approach for absolute protein quantitation [176]. This methodology
has several advantages, which make it one the most versatile SIL methodologies used in protein
quantitation: (i) the procedure is straightforward and only requires the presence of 18
O enriched water
(H218
O) and an enzyme; (ii) every peptide is labeled, except the original C-terminal peptide; (iii) can
be adapted and applied to any kind of protein sample, including clinical samples and post-
translationally modified proteins; (iv) compatibility with peptide fractionation methodologies; (v) can
be used in proteins separated by gel electrophoresis; and (v) increased sensitivity, since it can be
applied to proteins at the femtomol level [177, 178].
Figure I.7: Schematic representation of the 18
O-labeling reaction. This is a two step reaction: (1) in
the first step, one 18
O-atom from the buffered media is incorporated at the peptide C-terminus during
protein digestion with trypsin, corresponding to a mass increment of + 2 Da; (2) the second step
consists in an enzymatic catalyzed reversible reaction, in which the peptide incorporates a second 18
O-
atom, resulting in a total mass increment of + 4 Da. (adapted from Yao et al. [179])
In the enzymatic labeling approach, the isotopic tag, which in this case is the heavy stable 18
O isotope,
is introduced into the peptide C-terminus during the hydrolysis of the amide peptide bond. The
labeling reaction is a two step reaction (Figure I.7) [178-181]. In the first step, one 18
O atom from 18
O-
enrinched water (H218
O) buffer is incorporated during the enzymatic hydrolysis of the peptide bond. If
the reaction is performed in > 95 % H218
O media, almost all the peptides will be labeled with one 18
O
atom at the C-terminal carboxyl group. The second step, known as carboxyl oxygen exchange
reaction, is a reversible reaction in which the enzyme forms an ester intermediate with the newly

Chapter I
29
formed peptide and catalyzes the incorporation of the second 18
O atom. Unlike the peptide bond
hydrolysis reaction, which requires only one cycle for the incorporation of the 18
O atom, the carboxyl
oxygen exchange reaction requires several cycles to achieve a complete double labeling of all
peptides. It was estimated that at least 5 esterification cycles are necessary to obtain an 18
O
incorporation of 98 % [181].
Figure I.8: Complete 18
O-labeling versus variable 18
O-labeling. a) Mass spectrum obtained for a
mixture of unlabeled (blue) and completely 18
O-labeled (green) peptide samples – no isotope
overlapping is observed. b) Mass spectrum obtained for a mixture of unlabeled (blue) and variable
18O-labeled (green) peptide samples – overlapping between isotope clusters from different samples
occurs, introducing error in the quantitation process.
The efficiency of the second labeling reaction depends not only on the percentage of 18
O-water in the
buffer media [182], but also on (i) the labeling time; (ii) the enzyme chosen for proteolysis [179, 183,
184]; (iii) the pH of the reaction [182, 185]; (iv) the peptide sequence [182, 183]; and (v) the extent of
the back exchange reaction [182, 185]. This creates a major problem for protein quantitation through
18O-labeling: the variable
18O-incorporation into each peptide [181]. As previously referred, for
accurate quantitation measurements a minimum mass gap of 4 Da between the native and the heavy
labeled peptides should be obtained to avoid overlapping between isotopic clusters of the different
species. Therefore, in a perfect 18
O-labeling experiment where all peptides in one sample are double
labeled, quantitation is based only on the measurement of the unlabeled (16
O) and the double labeled
(18
O2) relative intensities of the peptides (Figure I.8a). Though, in most experiments, the incorporation
of 18
O occurs with a variable degree, meaning that two species of labeled peptides co-exist in the
sample: single labeled peptides (18
O1) that produce a mass shift of + 2 Da; and double labeled peptides
(18
O2), which are displaced + 4 Da to the native peptides. Consequently, when the labeled peptides are
mixed with the unlabeled sample for MS analysis, spectra with a complex isotopic pattern will be
obtained (Figure I.8b). In this case, protein quantitation is based on the peak intensities of the 16
O, 18
O1
and 18
O2 peptide species. Yet, the deconvolution of these kinds of spectra for correct assignment of the
relative mass peak intensities is not an easy task, being generally performed with software tools and
complex algorithms [186-188]. All the variables affecting the efficiency of the 18
O-labeling reaction,

General Introduction
30
as well as the most recent strategies to control and optimize them, were recently and extensively
reviewed by Fenselau et al. [178], Miyagi et al. [181] and Capelo et al. [189].
Figure I.9: Comprehensive scheme of two common procedures for protein quantitation by 18
O-
labeling. a) Direct labeling procedure. After protein denaturation, reduction and alkylation, the
samples are diluted with 18
O- or 16
O-enriched buffer for enzymatic digestion with trypsin. The reaction
is performed at pH 8.5, during ca. 12 h at 37ºC. Finally, the labeled peptides from different samples
are mixed and analyzed by MS. Quantitation is obtained by measuring the ratio between the relative
intensities of 18
O- and 16
O-labeled peptides. b) Decoupled labeling procedure. After protein
denaturation, reduction, alkylation and enzymatic digestion in natural abundance aqueous media at pH
8.5, the samples are dried or lyophilized. The peptides are resuspended in 18
O- or 16
O-enriched buffer
and the labeling reaction proceeds with trypsin at pH = 6.75, during ca. 18 h at 37ºC. The samples are
finally pooled together for MS analysis, and the quantitation is obtained by measuring the ratio
between the relative intensities of 18
O- and 16
O-labeled peptides.
18O-Labeling can be achieved through different procedures (Figure I.9) [189]. In the direct labeling
approach [182], after the reduction and alkylation steps, the proteins are digested with trypsin in H216
O
or H218
O enriched buffer at pH 7 – 8.5. The main advantage of this procedure is its simplicity, because
it consists on a simple enzymatic digestion, carried out in an isotopic enriched media. In the decoupled
labeling procedure [173, 190] the proteins are reduced, alkylated and enzymatically digested in natural

Chapter I
31
abundance aqueous media at pH 7 – 8.5. Then, the mixture of peptides formed is dried or lyophilized.
At last, the peptides are dissolved in 18
O-enriched buffer with trypsin, and the labeling reaction occurs
at pH 5 – 6.75. This is a more elaborate and time-consuming procedure, but increased labeling
efficiencies are obtained, because the enzymatic and labeling reactions are performed at their optimal
pH values and the digested peptides are dissolved in a higher 18
O content buffer before the labeling
reaction. Yet, both procedures have a common limiting step, which is the time-consuming labeling
reaction: normally, the peptides are digested/labeled during 24 to 48 h. In the last years, several
technologies, such as microwave energy, high-pressure systems, immobilized enzymes and ultrasonic
energy, have been used not only to accelerate the labeling reaction, but also to improve the labeling
efficiency and the quantitative measurements [189]. The optimization and development of new
strategies for 18
O-labeling is one of the main tasks of the present work, and therefore this will be
addressed in dedicated chapters throughout the dissertation.
I.2.2.6. Label-free quantitation
The label-free methodologies for protein quantitation are relatively inexpensive techniques, compared
to the cost of SIL reagents, and can be applied to virtually any biological sample. There are two main
strategies for label-free protein quantitation: (i) peak area measurements and (ii) spectral counting
[127, 130, 191]. In the first approach, after LC-MS/MS analysis, the mass spectrometric area of a
peptide ion detected within a specific interval of time is normalized, integrated and compared with the
ion abundance obtained for the same peptide in different experiments. The second approach, spectral
counting, is based on the premise that more abundant proteins and peptides produce more MS/MS
spectra than the low abundance counterparts. In this case, the relative quantitation is based on the
spectral counts obtained for a specific peptide in different experiments [191].
Although these may seem simple and easy-to-perform approaches for protein quantitation, these
methodologies are less accurate than the SIL techniques due to important issues: (i) the accuracy of the
methodology, and the potential to quantify low abundance proteins, is reduced by ion suppression
effects between different samples; (ii) each sample has to be individually analyzed, introducing
variability in the quantitation measurement; (iii) all the data need to be normalized to obtain accurate
measures between different experiments, which is generally a challenging task; and (iv) the spectral
counting approaches assume that every protein has the same response in an mass spectrometer
analyzer and do not account for differences in ionization efficiency [127, 141, 191].
I.2.2.7. Absolute quantitation of proteins
Conversely to the previous methodologies that provide relative quantitation data between two or more
samples, in this approach the objective is to obtain information on the precise amount of a protein, or
General Introduction
32
proteins, in a sample. There are two ways of performing absolute quantitation: (i) the samples are
spiked with a known amount of a stable isotope labeled synthetic peptide and, after MS analysis, the
spectral intensities of the endogenous peptides are plotted in a calibration curve with known amounts
of the standard peptide; or (i) by selected reaction monitoring (SRM), in which the intensities of the
precursor/fragment ion pairs of the heavy-labeled standard and the target peptides are monitored, and
compared against each other [127, 192].
In 2003, Gygi et al. proposed a new methodology for absolute quantitation of proteins, which they
named AQUA [193]. In the AQUA workflow a synthetic heavy-labeled peptide, with a similar
structure to a peptide produced during the proteolysis of a specific protein, is added to a complex
sample before the enzymatic digestion. Then, the samples are separated by liquid chromatography and
analyzed by SRM in a mass spectrometer. Absolute protein quantitation is obtained after comparing
the abundance of the native peptide with the abundance of the AQUA internal standard, [193, 194]. In
the AQUA approach, the selection of the peptide standard is crucial, because the chemical properties
and ionization efficiencies of the standard and native peptides must be as similar as possible, to reduce
the variability of the experiment. One of the most important drawbacks of this approach is related with
sample losses that occur before mixing the sample with the internal standard, leading to inaccurate
quantitation results. Another practical issue is how to determine the correct amount of synthetic
peptides that must be added, knowing that the protein abundance has a great variation within a sample
[141].

Chapter I
33
Table I.2: Overview of the most important SIL methodologies for relative or absolute protein
quantitation by mass spectrometry.
Metabolic labeling Chemical Labeling Enzymatic
Labeling
Spiking with
labeled
standards
15N-labeling SILAC ICAT iTRAQ
18O-labeling AQUA
Quantitation
nature Relative Relative Relative Relative Relative Absolute
Sample type
Mammalian and
microorganisms
cell culture
Mammalian and
microorganisms
cell culture
Any sample Any sample Any sample Any sample
Labeling target Proteins (all
nitrogen atoms)
Proteins
(selected amino
acids)
Proteins
(cysteine
residues)
Peptides
(N-terminus;
lysine side
chain)
Peptide
(C-terminus) Standard peptide
Time of labeling During cell
growth
During cell
growth
Before protein
digestion
After protein
digestion
During protein
digestion
Before MS
analysis
Quantitation
stage MS MS MS MS/MS MS MS
Sample number 2 2 - 5 2 2 – 8 2 ≥ 2
Advantages
Earliest
incorporation of
the labeling tag
Earliest
incorporation of
the labeling tag
Uniform
labeling
Reproducibility
Applicable to all
types of sample
Complex
samples are
simplified
Applicable to all
types of samples
Large number of
peptides
identified per
sample
Up to 8 samples
can be analyzed
at the same time
Applicable to all
types of sample
Labeling of all
peptides
Reduced cost
Easy to
implement
Applicable to all
types of sample
Absolute
quantitation
Disadvantages
Not applicable
to human
samples
Variable
labeling
depending on
the peptide
sequence
Only suited for
samples
compatible with
isotopically
enriched culture
media
Not applicable
to tissue samples
Expensive
reagents
Not applicable
to human
samples
Only suited for
samples
compatible with
isotopically
enriched culture
media
Not applicable
to tissue samples
Proline to
arginine
rearrangements
Expensive
reagents
Limited to the
analysis of
proteins with
cysteines
Loss of
information on
peptides with no
cysteine residues
Only fragmented
peptides can be
quantified
Expensive
reagents
Variable
labeling degree
Time-consuming
incubation time
Lack of software
for data analysis
One labeled
synthetic peptide
of known
concentration is
needed for each
quantified
peptide
Quantitation
based only on
one or two
peptides per
protein
Expensive
reagents

General Introduction
34
I.3. Mass Spectrometry
Mass spectrometry (MS) foundations lead us to the beginning of the XX century when Sir Joseph J.
Thomson, who was awarded the Nobel Prize in Physics in 1906 for the discovery of the electron,
developed an instrument to measure the masses of charged atoms [195]. The development and
improvement of new MS instruments during the following decades allowed the discovery of new
isotopes and the determination of their relative abundances, which proved to be of extreme importance
for the identification and isolation of 235
U isotopes during the Manhattan Project, in World War II.
Since then, mass spectrometers became commercially available, helping the outspread of MS as an
important analytical tool [195, 196].
The success of MS is related with different features: it is one the most versatile analytical techniques,
being applicable to all elements and to a wide range of samples and materials; the sensitivity of some
MS technologies allows the detection of samples in the zeptomole (10-21
) range; and, with the
information provided, the structure of most classes of compounds can be determined [197]. In the next
sections the fundamentals of MS, the soft ionization techniques that boosted proteomics and the most
important protein identification methods by MS are described.
I.3.1. Basic principles
Mass spectrometry analysis deals with ionized molecules because ions are easier to manipulate than
neutral molecules. Hence, the first step of a MS experiment consists in the production of gas phase
ions from the sample. Then, the ionized molecules are separated by their mass-to-charge ratio (m/z) in
a mass analyzer, and finally, the different ions are measured and the signal generated is amplified and
recorded as a mass spectrum, where the relative ion intensity (ordinate) is plotted against the m/z value
(abscissa) [197, 198]. The unit of mass used is the unified atomic mass (u), defined as 1/12 of the mass
of one 12
C atom, normally represented by the term Dalton (Da) [199].
The analysis of the charged atoms or molecules is performed with a mass spectrometer, in different
but sequential parts, as depicted in Figure I.10. First, the sample inlet introduces the sample into the
ion source. Depending on the type of sample and ionization method, the sample can be introduced
directly into the ionization chamber, as in MALDI-TOF, or via a chromatographic interface, like the
LC-MS [197, 199]. Once inside the ion source the sample is ionized, generally by electron ejection or
electron capture, protonation or deprotonation, or by adduct formation [200]. The first ionization
methods, electron ionization (EI) and chemical ionization (CI), were developed mainly for the analysis
of organic compounds. These very energetic techniques cause broad molecular fragmentation, and are
only suitable for the ionization of volatile and thermostable samples [201]. The development of new

Chapter I
35
technologies, like electrospray and atmospheric pressure ionization, which are used to analyze liquid
samples, or plasma desorption and matrix-assisted laser desorption/ionization that are mostly used to
ionize solid samples into the gas phase, permitted the analysis of proteins, peptides and polymers.
Nowadays, several methods for sample ionization are easily accessible and their use depends on both
the type of sample, and the mass spectrometer available [202]. An extensive description of these
methods can be found in the books of Hoffman and Stroobant [200], J. Gross [198], and references
cited therein. The most important ionization methods used in proteomics are electrospray ionization
(ESI) and matrix-assisted laser desorption/ionization (MALDI), which are described in sections I.3.2.1
and I.3.2.2, respectively.
Figure I.10: Basic diagram of a mass spectrometer. (adapted from Gross, J. H. [198])
After sample ionization, the ions are directed into the mass analyzer, where they are separated
according to their m/z ratio using appropriate electric fields, magnetic fields, or both [203]. The
principle of separation varies with the type of mass analyzer and the ions can be distinguished by the
differences on their momentum, velocity and kinetic energy [197, 203]. Several mass analyzers are
currently available, each one with different features, advantages and limitations. The better known are
the quadrupoles (Q) and magnetic sectors (B), time-of-flight (TOF), ion cyclotron resonance (ICR),
ion traps (IT) and more recently the orbitrap (OT) [197, 198, 200]. The choice of the mass analyzer
depends not only on the objective of the work, but also on their intrinsic characteristics, such as: (i)
mass range, i.e. the maximum m/z value detected; (ii) resolution, which is the ability to distinguish
between ions with a small m/z difference; (iii) mass accuracy, which represents the difference between
the measured m/z and the theoretical m/z value, usually expressed in parts per million (ppm); (iv) ion
transmission, i.e. the ratio between the number of ions that reach the detector and the number of ions
entering the analyzer; and (v) scanning speed, which is the time needed by the mass analyzer to scan a
particular mass range and produce a mass spectrum [200, 203]. An overview of the most important
features and differences between the referred mass analyzers is given in Table I.3.
Another important aspect in the choice of the mass analyzer is the ability to perform tandem mass
spectrometry (MS/MS). In MS/MS the precursor ion is selected and fragmented into characteristic
secondary ions, known as product ions, which can be used for structural or sequencing studies [204,
205]. There are different ways to obtain ion fragmentation: (i) metastable or spontaneous
fragmentation; (ii) collision induced dissociation (CID), which occurs when the parent ion collides
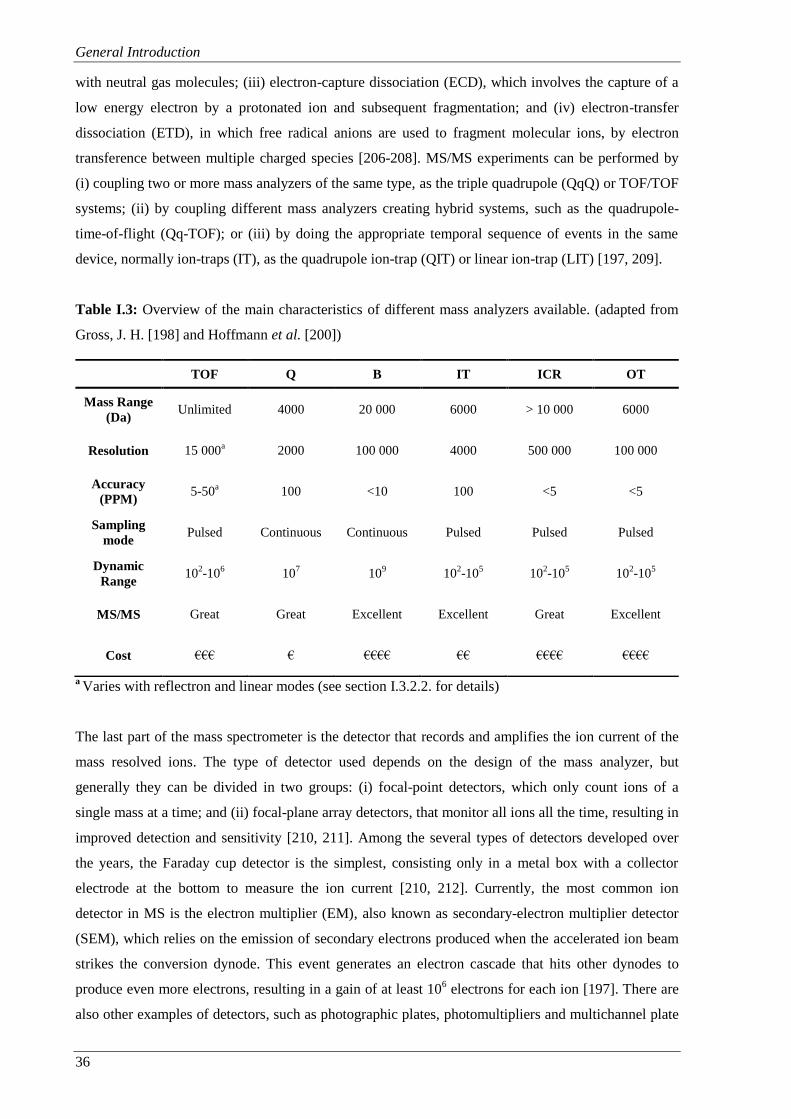
General Introduction
36
with neutral gas molecules; (iii) electron-capture dissociation (ECD), which involves the capture of a
low energy electron by a protonated ion and subsequent fragmentation; and (iv) electron-transfer
dissociation (ETD), in which free radical anions are used to fragment molecular ions, by electron
transference between multiple charged species [206-208]. MS/MS experiments can be performed by
(i) coupling two or more mass analyzers of the same type, as the triple quadrupole (QqQ) or TOF/TOF
systems; (ii) by coupling different mass analyzers creating hybrid systems, such as the quadrupole-
time-of-flight (Qq-TOF); or (iii) by doing the appropriate temporal sequence of events in the same
device, normally ion-traps (IT), as the quadrupole ion-trap (QIT) or linear ion-trap (LIT) [197, 209].
Table I.3: Overview of the main characteristics of different mass analyzers available. (adapted from
Gross, J. H. [198] and Hoffmann et al. [200])
a Varies with reflectron and linear modes (see section I.3.2.2. for details)
The last part of the mass spectrometer is the detector that records and amplifies the ion current of the
mass resolved ions. The type of detector used depends on the design of the mass analyzer, but
generally they can be divided in two groups: (i) focal-point detectors, which only count ions of a
single mass at a time; and (ii) focal-plane array detectors, that monitor all ions all the time, resulting in
improved detection and sensitivity [210, 211]. Among the several types of detectors developed over
the years, the Faraday cup detector is the simplest, consisting only in a metal box with a collector
electrode at the bottom to measure the ion current [210, 212]. Currently, the most common ion
detector in MS is the electron multiplier (EM), also known as secondary-electron multiplier detector
(SEM), which relies on the emission of secondary electrons produced when the accelerated ion beam
strikes the conversion dynode. This event generates an electron cascade that hits other dynodes to
produce even more electrons, resulting in a gain of at least 106 electrons for each ion [197]. There are
also other examples of detectors, such as photographic plates, photomultipliers and multichannel plate
TOF Q B IT ICR OT
Mass Range
(Da) Unlimited 4000 20 000 6000 > 10 000 6000
Resolution 15 000a 2000 100 000 4000 500 000 100 000
Accuracy
(PPM) 5-50
a 100 <10 100 <5 <5
Sampling
mode Pulsed Continuous Continuous Pulsed Pulsed Pulsed
Dynamic
Range 10
2-10
6 10
7 10
9 10
2-10
5 10
2-10
5 10
2-10
5
MS/MS Great Great Excellent Excellent Great Excellent
Cost €€€ € €€€€ €€ €€€€ €€€€

Chapter I
37
detectors, which are described in detail in dedicated bibliography [197, 210]. Ideally, a MS detector
should have the following characteristics: (i) wide mass-range and mass independent response; (ii) low
noise level; (iii) simultaneous detection; (iv) short recovery time and fast response; and also (v) high
saturation level and a wide dynamic range [210].
Finally, the ion source, the analyzer and the detector, operate under high vacuum conditions during
mass analysis. The vacuum system allows ions to move through different parts of the mass
spectrometer without colliding with air molecules. Normally, the pressure at the ion source is
maintained between 10-4
and 10-8
torr, although atmospheric pressure can also be used. At the mass
analyzer the pressure is usually lower than 10-8
torr [197, 198].
I.3.2. Soft ionization technologies
Mass spectrometry is currently an indispensable and fundamental tool in the proteomics field for the
rapid and accurate analysis of proteins, with high sensitivity and reproducibility [213-215]. The
development of soft ionization techniques allowed the ionization of large, polar, nonvolatile and
thermally unstable biomolecules without affecting their integrity, and deeply contributed for the
growth of MS as an essential tool for large scale proteomics studies [216-218]. ESI and MALDI, both
introduced in late 1980s, are presently the most used soft ionization techniques for the analysis of
proteins and peptides, but they have also been used in many other applications, as carbohydrate and
lipid analysis, and pharmacokinetic screening and drug discovery studies [219]. The main differences
between the two techniques are described in Table I.4.
I.3.2.1. Electrospray ionization (ESI)
ESI appeared in 1968 when Dole et al. [220] applied electrospray to ionize a dilute solution of
polystyrene into nitrogen at atmospheric pressure [221]. In 1984, the Fenn’s group improved the
technique and developed the first ESI-MS apparatus, which they used to analyze small molecular mass
ions [222, 223]. Finally, in 1988, the first papers reporting the use of electrospray to produce multiple
charged protein ions followed by MS analysis were published by Fenn and coworkers [224, 225].
Over the years, ESI increased in popularity and became an essential tool in most proteomics
laboratories. The importance of Fenn’s achievements was further recognized by the Nobel Academy,
who awarded him the Nobel Prize in Chemistry in 2002 [195].
The ionization mechanism in ESI is complex. Briefly, the samples are dissolved in polar and volatile
solvents (H2O, CH3OH, or CH3CN) and passed through a narrow stainless steel capillary at a reduced
flow rate (1-10 µL/min). High electrical potential, generally between 3 - 6 kV, is applied at the tip of
the capillary and the solution is nebulized into small charged droplets. This process is normally
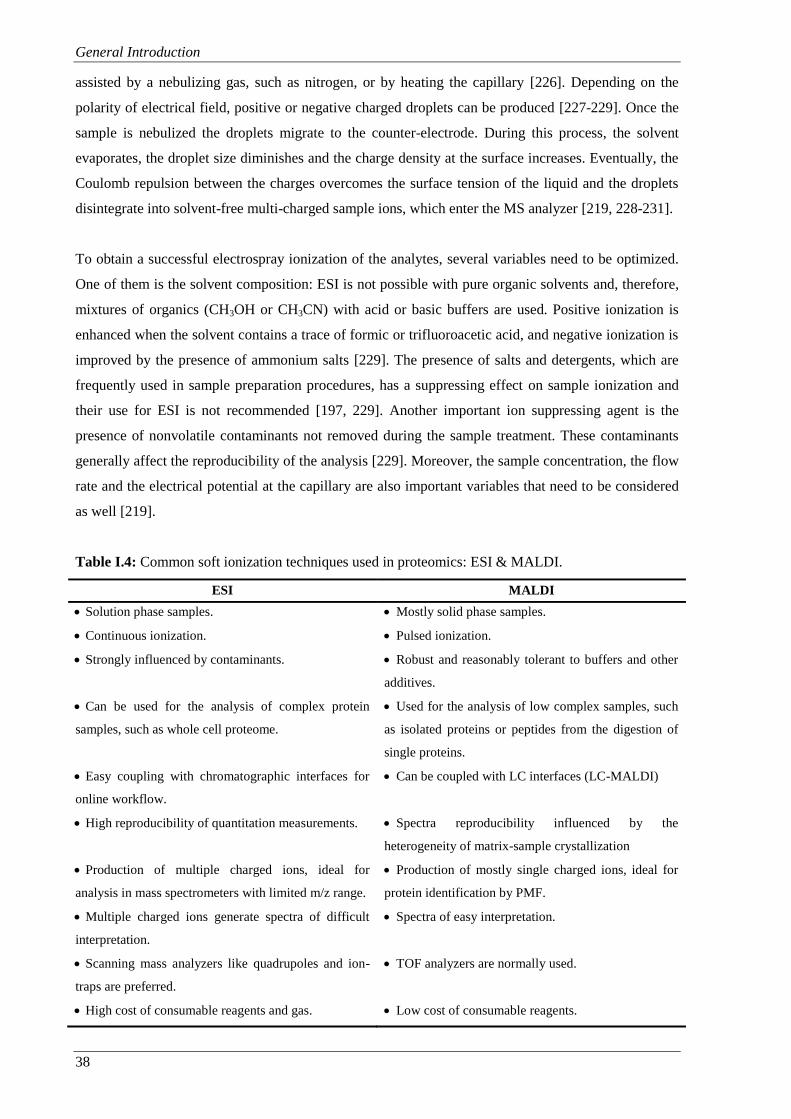
General Introduction
38
assisted by a nebulizing gas, such as nitrogen, or by heating the capillary [226]. Depending on the
polarity of electrical field, positive or negative charged droplets can be produced [227-229]. Once the
sample is nebulized the droplets migrate to the counter-electrode. During this process, the solvent
evaporates, the droplet size diminishes and the charge density at the surface increases. Eventually, the
Coulomb repulsion between the charges overcomes the surface tension of the liquid and the droplets
disintegrate into solvent-free multi-charged sample ions, which enter the MS analyzer [219, 228-231].
To obtain a successful electrospray ionization of the analytes, several variables need to be optimized.
One of them is the solvent composition: ESI is not possible with pure organic solvents and, therefore,
mixtures of organics (CH3OH or CH3CN) with acid or basic buffers are used. Positive ionization is
enhanced when the solvent contains a trace of formic or trifluoroacetic acid, and negative ionization is
improved by the presence of ammonium salts [229]. The presence of salts and detergents, which are
frequently used in sample preparation procedures, has a suppressing effect on sample ionization and
their use for ESI is not recommended [197, 229]. Another important ion suppressing agent is the
presence of nonvolatile contaminants not removed during the sample treatment. These contaminants
generally affect the reproducibility of the analysis [229]. Moreover, the sample concentration, the flow
rate and the electrical potential at the capillary are also important variables that need to be considered
as well [219].
Table I.4: Common soft ionization techniques used in proteomics: ESI & MALDI.
ESI MALDI
Solution phase samples.
Continuous ionization.
Strongly influenced by contaminants.
Can be used for the analysis of complex protein
samples, such as whole cell proteome.
Easy coupling with chromatographic interfaces for
online workflow.
High reproducibility of quantitation measurements.
Production of multiple charged ions, ideal for
analysis in mass spectrometers with limited m/z range.
Multiple charged ions generate spectra of difficult
interpretation.
Scanning mass analyzers like quadrupoles and ion-
traps are preferred.
High cost of consumable reagents and gas.
Mostly solid phase samples.
Pulsed ionization.
Robust and reasonably tolerant to buffers and other
additives.
Used for the analysis of low complex samples, such
as isolated proteins or peptides from the digestion of
single proteins.
Can be coupled with LC interfaces (LC-MALDI)
Spectra reproducibility influenced by the
heterogeneity of matrix-sample crystallization
Production of mostly single charged ions, ideal for
protein identification by PMF.
Spectra of easy interpretation.
TOF analyzers are normally used.
Low cost of consumable reagents.

Chapter I
39
One of the most important achievements for ESI was the development of miniaturized ionization
sources, such as micro-ESI [232] and nano-ESI [233, 234], which allow a significant reduction of the
flow rate to the nL/min level. The introduction of these technologies permitted the analysis of low
concentrated samples with increased sensitivity, and the reduction in the wasted sample volume [218,
219]. Another feature that contributed to the popularity of ESI is the possibility of coupling ionization
with liquid chromatography and capillary electrophoresis separation techniques, for online
applications [235].
I.3.2.2. Matrix-assisted laser desorption ionization (MALDI)
In 1985, Karas et al. published the first paper regarding the use of an organic matrix to enhance the
ionization of amino acids by laser desorption. This method, which they named “Matrix-Assisted Laser
Desorption”, was MALDI’s official debut [236]. The first application of laser desorption ionization for
protein analysis by MS was made by Tanaka et al., in 1988 [237]. In Tanaka’s methodology, proteins
are first dissolved in a suspension of ultra fine metal powder and glycerol and then ionized after laser
irradiation. At the same time, Karas and Hillenkamp reported a method for protein analysis by laser
desorption ionization, in which a UV-light absorbing organic matrix was mixed in large excess with
the analytes [238]. For his achievements, Tanaka received the 2002 Nobel Prize in Chemistry,
alongside with John Fenn who developed ESI-MS. However, due to its ease of use and higher
sensitivity, it was the MALDI technology developed by Karas and Hillenkamp that prevailed in the
MS community [195]. The most important characteristics that drove MALDI into a leading technique
for protein analysis by MS are: (i) capability to analyze biological samples without extensive
purification, since MALDI is relatively tolerant to buffers, salts, chelating agents, chaotropic agents
and some detergents; (ii) accurate mass measurements with high sensitivity, usually in the pmol range;
(iii) most classes of proteins can be analyzed, on the condition that they can be dissolved in suitable
solvents; (iv) fast analysis speed; (v) ability to measure biomolecules with molecular masses over 100
kDa; (vi) production of primarily single charged ions, which simplifies spectra interpretation; and (vii)
capability to perform molecular imaging in tissue samples [217, 239].
Unlike ESI, MALDI is a discontinuous ionization technique in which ions are produced by laser
pulses. In brief, the sample is mixed with an excess of a matrix compound and applied onto a MALDI
probe where co-crystallization of matrix and analyte molecules occurs. Then, the probe is introduced
into the ionization chamber and the sample is irradiated with a laser beam, usually from a nitrogen
laser with a wavelength of 337 nm. When the laser irradiates the sample, the energy is absorbed by the
matrix as heat. The rapid heating of matrix molecules results in the sublimation of the crystals and
expansion of both matrix and intact analyte molecules into the gas phase [240-242]. The ionization
process in MALDI is not fully understood, but different ionization mechanisms have been proposed
[243-247]. Two of the most popular models are (i) the photochemical ionization model and (ii) the

General Introduction
40
pseudo proton transfer model [217, 248]. The first model assumes that photoionized matrix molecules
transfer charge to the neutral analyte molecules during collision events in the plume formed after
desorption, while the latter model assumes that analyte molecules become charged during
crystallization. Sample ionization in MALDI is also influenced by different parameters, such as: laser
wavelength, pulse duration, crystallization conditions and type of matrix [243, 245]. Actually, due to
these parameters, most of the spectra generated by MALDI have variable noise level, variable peak
intensity, variable baseline, and suffer from shot-to-shot and sample-to-sample reproducibility issues.
Therefore, multiple spectra from the same sample, but from different regions on the target surface, are
usually acquired and added, or averaged, to minimize variability and generate a representative
spectrum of the sample [249].
As explained before, MALDI matrices have a crucial influence on the ionization process. Overall, a
number of properties need to be fulfilled for a compound to be considered an acceptable matrix: (i)
ability to form crystals incorporating the analyte; (ii) high molar absorptivity at the laser’s wavelength;
(iii) the matrix should promote the analyte ionization without chemically modifying it; (iv) solubility
in the same solvent as the sample; (v) the matrix should be volatile enough to vaporize when shot by
the laser, but sufficiently stable to remain unaltered in the vacuum system of the mass spectrometer;
and (vi) should minimize fragmentation and adduct formation with analyte molecules [250-252].
Currently, several matrix compounds are available to be used with different types of samples, such as
proteins, peptides, carbohydrates, synthetic polymers or nucleic acids (Table I.5) [248, 252, 253].
Traditionally, the most popular matrices in proteomics applications are small organic acids, like α-
cyano-4-hydroxycinnamic acid (α-CHCA) for peptide analysis, and sinapinic acid (SA) or 2,5-
dihydroxybenzoic acid (DHB) for protein analysis [216, 241, 253]. The main difference between these
matrices is related with the amount of energy transferred to the analytes during desorption and
ionization processes. Hence, the matrix can be classified either as “hot” or “cold”, depending on the
propensity to induce higher or lower fragmentation in the analyte molecules. For instance, α-CHCA is
“hotter” than SA or DHB and therefore is used in most peptide MS/MS analysis, where fragmentation
is required. On the other hand, the “colder” DHB and SA matrices are used when large molecules,
such as intact proteins, are analyzed [243, 245, 254].
Besides the type of matrix used, which must be compatible with the analyte, also the sample and
matrix preparation procedures influence the ionization by MALDI [255]. Chait et al. reported that
peptide ionization with α-CHCA is highly dependent on matrix solution conditions, such as the pH
and the solvent system, and on the rate of matrix and sample co-crystallization [256]. When the
crystallization process is fast, smaller crystals are formed and the incorporation of the analytes into the
crystalline lattice is more homogeneous than that obtained with a slower process [249]. Sample purity
is also a very important variable to be considered, because the presence of salts, buffers and
detergents, which are very useful in sample preparation procedures, compromise the ionization

Chapter I
41
efficiency in MALDI. Hence, desalting procedures must be used before the analysis. ZipTip®
cleaning is one of the most used desalting procedures for MALDI applications. Briefly, the peptide or
protein solution is passed through a C18 resin packed in a pipette tip; peptides and proteins are
adsorbed, washed, and finally eluted with a suitable solvent system for MALDI [257].
Table I.5: Example of common matrix compounds used for MALDI-MS analysis.
Matrix Major applications
2,5-Dihydroxybenzoic acid (DHB) Proteins, peptides, polymers and carbohydrates.
3,5-Dimethoxy-4-hydroxycinnamic acid
(Sinapinic acid, SA) Proteins, peptides.
α-Cyano-4-hydroxycinnamic acid
(4-HCCA or CHCA) Peptides.
2-(4’-Hydroxy-phenylazo)benzoic acid
(HABA) Polymers, carbohydrates.
Nicotinic acid Proteins, peptides.
3-Hydroxypicolinic acid (HPA) Oligonucleotides
1,8,9-Trihydroxyantracene (Dithranol) Synthetic polymers
Some of the most important parameters and variables of the MALDI technique have been addressed
over the last paragraphs. However, to analyze the ions produced, a suitable mass analyzer must be
coupled to the MALDI source. The time-of-flight (TOF) mass spectrometer is by far the most common
type of analyzer used to measure ions in MALDI [248]. This is one of the simplest mass analyzers,
characterized by its excellent mass accuracy, high resolution and high sensitivity. Moreover, TOF
systems analyze all the ionic species produced and have a theoretical unlimited mass range, which is
particularly suited and compatible with the MALDI pulsed ionization process, and with the analysis of
large single charged ions [248, 251]. In a MALDI-TOF-MS system, the ions produced by the laser
beam are accelerated by an electrical potential (ca. 20 kV) into a field-free drift tube, where they travel
until the detector, at the end of the flight tube. The m/z ratio is determined by measuring the time
needed for ions to move from the source to the detector [258, 259]. Generally, smaller ions are faster
than larger ions and need less time to travel the entire fight tube length. Yet, some variables can
compromise the mass resolution obtained: (i) the surface from which the molecules are desorbed may
have an irregular shape, making ions with the same mass to depart for the TOF from different
positions; and (ii) the difference in the kinetic energy of ions with the same mass affects their initial
velocity and, consequently, the time at which they are detected [260]. With the introduction of delayed
extraction and the reflectron TOF mode, these problems were overcome and the analysis resolution
was improved. The delayed extraction mode [261-263] consists in introducing a time delay
(nanoseconds range) between ionization and extraction to the TOF analyzer. By allowing the ions to
“cool down” before acceleration into the analyzer, this process reduces the differences in the kinetic

General Introduction
42
energy of ions with the same mass, and the temporal spread in the analyzer is reduced. In the
reflectron mode [258] the amount of time a ion needs to reach the detector is increased, not by
increasing the physical length of the flight tube, but by reflecting the ions to another detector (Figure
I.11). As a result, ions with higher velocity, i.e. high kinetic energy, penetrate the reflectron deeper
and travel a longer path than less energetic ions of the same mass. This leads to ion focusing and
higher resolution, but sometimes with expense of sensitivity due to ion loss [241, 242].
Figure I.11: Schematic representation of linear and reflectron time-of-flight mass analyzers. a) Linear
TOF: ions are separated in a field-free drift tube according to their m/z value; heavier ions move
slower than lighter ions and arrive later at the detector. b) Refletron TOF: the ions are reflected to
another detector by an electrical potential applied at the end of the flight tube. The resolution is
improved by increasing the flight distance available for ion separation. Furthermore, faster ions
penetrate deeper in the reflectron field than slower ions of the same m/z, which result in ion focusing
and higher resolution. (adapted from Lane, C. S. [260])
I.3.3. Protein identification by mass spectrometry
Since the introduction of soft ionization technologies, mass spectrometry has become the primary
method for protein identification. Actually, most of the MS approaches for protein identification rely
on the analysis of peptides from protein enzymatic digestion, rather than intact protein mass
measurements, because peptides are easier to handle and the sensitivity of the mass spectrometer is

Chapter I
43
higher for peptides than for proteins [88, 264] (see section I.1.4. for further details). In general, protein
identification is achieved by one of the following strategies, or by the combination of both: (i) peptide
mass fingerprinting (PMF); or (ii) peptide fragmentation by MS/MS [265, 266]. Even though, protein
identification would not be possible without the development of protein databases, algorithms and
other bioinformatic tools for comprehensive MS data analysis [267-269]. Some of the most popular
computational resources used in proteomics are listed in Table I.6.
Table I.6: Websites with popular search engines and databases used for protein identification by mass
spectrometry.
Name Website
Sea
rch
En
gin
es
Mascot1 http://www.matrixscience.com/
ProteinProspector1 http://prospector.ucsf.edu/
SEQUEST2 http://fields.scripps.edu/sequest/
ProFound3 http://prowl.rockefeller.edu/
ExPASy Proteomics tools3 http://expasy.org/tools/
Da
tab
ase
s Swiss-Prot3 http://www.expasy.org/sprot/
NCBInr3 http://www.ncbi.nlm.nih.gov/protein
GenPept3 http://bioweb.pasteur.fr/databases/local/banquesdetail.html#genpept
1 Semi-public (free web access but with limited functionality);
2 Commercial (distributed by Thermo
Finningan); 3 Public access.
I.3.3.1. Peptide mass fingerprinting (PMF) for protein identification
Protein identification by peptide mass fingerprint was first reported in 1993 by a number of different
groups [270-274]. This is perhaps the fastest and simplest method for protein identification. In a
typical PMF experiment, proteins are first separated by 1D- or 2D-electrophoresis and digested with a
specific protease to produce a unique pool of peptides for each protein. Generally, trypsin is the
selected enzyme because it is stable, highly active and very specific, cleaving proteins at the carboxyl-
terminal side of lysine and arginine amino acids [264]. Furthermore, due to the presence of arginine
and lysine basic residues at the C-terminus, the peptides are easily protonated and ionized [266]. Then,
the pool of peptides produced is analyzed by MS, usually by MALDI-TOF-MS, and a unique peptide
mass fingerprint is obtained for each protein [275]. The MALDI-TOF mass spectra are recorded above
500 Da to avoid interference and ion suppression caused by matrix peaks, and below 4000 Da, which
is commonly the upper limit of the molecular mass for tryptic peptides [254]. However, it is rare to
find mass peaks corresponding to every peptide in a mass spectrum because MALDI is a competitive
process in which the ionization efficiency is peptide dependant, and strongly influenced by the
General Introduction
44
presence of other analytes or contaminants [248, 276]. It was also reported that peptides with arginine
at the C-terminus are preferentially ionized in MALDI than lysine C-terminal peptides, and therefore
possess a higher intensity in the mass spectrum [277].
Finally, using search algorithms like the ones listed in Table I.6, the PMF is matched against databases
that contain theoretical masses calculated by in silico digestion of the protein in the same conditions as
the proteolytic method used in the experiment. The results obtained are ranked according to the
number of peptides matching the protein sequence, and rely on several variables: (i) the mass accuracy
and resolution of the instrument; (ii) the size of the database used; (iii) the presence of isobaric
peptides from enzymatic digestion of unseparated proteins, which may produce false positive results;
(iv) the presence of protein modifications, which change the molecular mass of the peptide; (v) the
presence and of non-cleaved sites (missed cleavages) in the peptide sequence; and (vi) the presence of
contaminant masses from human keratin peptides, trypsin autolysis peptides, matrix adduct peaks and
other non-assigned masses [216, 235, 265]. A protein is considered to be identified with confidence by
PMF if 10 – 20 % of the sequence is covered, and the identification score is higher than a statistically
pre-defined value [254, 266]. Obviously, PMF is only successful if the analyzed protein already exists
in the databases. In addition, this methodology is not suited for the analysis of complex protein
samples without previous separation, because it would not be possible to determine which peptide
belongs to each protein [235].
I.3.3.2. Protein identification by tandem mass spectrometry
Protein identification by MS/MS relies on the fragmentation of peptide ions in the gas phase, to
produce structural information about the peptide sequences. Since this information is more specific
and restrict than the peptide mass alone, it can be used to improve the confidence level of the PMF
results, or when PMF identification was not successful at all [254]. Peptide fragmentation can be
performed by post source decay (PSD) in a simple MALDI-TOF system, or by dissociation methods,
usually CID, in IT, Qq-TOF, QqQ or TOF/TOF mass spectrometers [265, 278] (see section I.3.1. for
details). In PSD analysis, peptide fragmentation occurs after the ionization process by high energy
collision between peptide ions and matrix ions, usually from “hot” matrices. Next, the fragments
produced are separated and analyzed in a reflectron TOF mass spectrometer [279-282]. Though, high
energetic collisions generate a mixture of ions from the peptide backbone and side chain
fragmentation, producing complex spectra of difficult interpretation. In addition, PSD is a time-
consuming method, difficult to control, and less efficient and less reproducible than other MS/MS
strategies [265, 283]. Therefore, most MS/MS data is obtained by low energy CID. In this case,
peptide fragmentation occurs primarily at the amide bond between amino acids, and two types of ions
are produced: the b ions, when the charge is retained by N-terminal peptide fragment; and y ions,
when the charge is retained by the C-terminal fragment [205, 264, 278].

Chapter I
45
The information obtained by MS/MS can be used for protein identification by different approaches: (i)
database searching, also known as peptide fragment fingerprinting, where experimental data is
compared and correlated with theoretically peptide sequences derived from proteins present in
databases; (ii) de novo sequencing, in which the amino acid sequence is directly derived from the
fragment mass spectra; and (iii) peptide sequence tagging, where a partially interpreted short sequence
from the mass spectra is used for database searching [267, 278, 284, 285]. Of course, there are also
some variables that influence the results obtained and need to be considered [88, 264]. First, data
quality is strongly influenced by the mass spectrometer characteristics, such as resolution, accuracy
and sensitivity. Second, the peptide bonds do not have the same tendency to fragment under specific
CID conditions. And finally, the results obtained are also highly dependent on the database and search
algorithms used. Consequently, some journals are adopting a number of restrict conditions not only for
publication of PMF data, but also for MS/MS data [286].

General Introduction
46
I.4. Ultrasound
“Ultrasound is defined as sound of a frequency that is too high for the human ear to detect – i.e. it is
inaudible” [287].
The properties of ultrasound have been used in many different fields with different objectives.
Applications of ultrasonic energy can be found in (i) medicine (e.g. ultrasonic imaging, dentistry); (ii)
industry (e.g. cleaning and emulsification processes); (iii) engineering (e.g. plastic and metal welding,
drilling); (iv) military (e.g. the sound navigation and ranging system, SONAR); (v) biology (e.g. cell
disruption, homogenization procedures); and (iv) in chemistry (e.g. organic synthesis, analytical
chemistry) [288, 289]. Usually, the application of ultrasound in chemistry is known as sonochemistry.
Sonochemistry provides a number of benefits over traditional approaches: the increase of reaction
rates; reduction of sample treatment time in some methodologies; and initiation of reactions without
the need of additives [288]. Regarding analytical chemistry, many different processes assisted by
ultrasonic energy have been reported over the years. Cleaning, degassing, atomization, digestion,
acceleration of enzymatic reactions, homogenization, nebulization, extraction of organic and inorganic
compounds, filtration and aggregation of particles are only some examples thoroughly described in the
works of Priego-Capote and Luque de Castro [289-292] and Capelo et al. [293, 294].
In the following sections, the basic concepts of ultrasonic irradiation and the most used ultrasonic
devices in analytical chemistry are briefly described. In addition, since the main objective of the
present dissertation relies on the application of ultrasonic energy for the enhancement of protein
enzymatic digestion, and other steps in sample treatment procedures for proteomics workflow, the
combination of ultrasound and enzymatic digestion is emphasized.
I.4.1. Fundamentals
By definition, the frequency of ultrasound is higher than the detectable frequencies by the human
hearing. While the human audible range lies between 20 Hz to 20 kHz, ultrasound covers a wider
range of frequencies, from 20 kHz to the GHz range (Figure I.12) [288]. This large interval of
frequencies is normally divided in two regions: (i) low-frequency region, from 20 to 100 kHz, which
provides high-power ultrasound that is normally used in sonochemistry applications, such as synthesis
and catalysis; and (ii) the high-frequency region, from 2 MHz to GHz range, which provides low-
power ultrasound and is typically used for diagnostic purposes, like medical imaging [288].
Ultrasonic energy propagates through gas, solid, or liquid media by a series of compression and
expansion waves, producing molecular vibration motion that is transmitted between adjacent

Chapter I
47
molecules. In liquid media, the compression cycle generates positive pressure, pushing molecules
together, while the expansion cycle produces a negative pressure that pulls molecules apart. The
repetition of these cycles generates tiny bubbles, known as cavitation bubbles, filled with solvent and
vapor, which repeatedly grow and compress (Figure I.13a). Eventually, these bubbles will reach an
unstable size, where they cannot absorb more ultrasonic energy, and compressive implosion will occur
by a phenomenon known as cavitation [288, 295, 296]. According to the Hot-Spot theory [297, 298],
the violent and rapid collapse of the cavitation bubble creates a localized hot-spot with extreme
pressures and temperatures, around 1000 atm and 5000ºC, respectively. However, due to the small size
of the cavitation bubble, compared to the volume of the liquid media, the generated heat rapidly
dissipates. It is estimated that the heating and cooling rates are as high as 1010
K/s [299-302]. These
extreme conditions transform cavitation bubbles into high energy micro-reactors, which can be used to
improve catalytic reactions, increase reactivity, and change the surface morphology in solids [296,
300]. For example, when the cavitation occurs near to a solid surface, the cavity bubble assumes a
non-spherical shape and, because the implosion occurs asymmetrically, micro-jets of liquid are formed
and directed towards the solid at velocities close to 400 km/h (Figure I.13b), causing mechanical
erosion and disruption of the solid surface [295, 303]. Moreover, the ultrasonication of liquid media
increases the mass transfer processes in heterogeneous systems, and produces highly reactive radical
species, which can be used to enhance chemical reactions. For instance, the extreme conditions
produced during cavitation when ultrasound is applied to water generate highly reactive species, as
hydroxyl radicals, hydrogen atoms and hydrogen peroxide, which can react with other compounds
present in the system [299, 300].
Figure I.12: Sound frequency ranges. (from Mason et al. [288])
The cavitation phenomenon entails three different stages: (i) nucleation, i.e. formation of the bubble;
(ii) bubble growth; and (iii) implosion [300, 304]. These stages are conditioned by a number of
factors, such as: (i) ultrasound frequency; (ii) temperature; (iii) applied pressure; (iv) solvent; (v)
ultrasound intensity; and the (vi) type of gas present in the media [288, 290, 305]. A brief explanation
of each one of these factors, and their effect on cavitation is provided below.

General Introduction
48
Figure I.13: Schematic representation of cavitation bubble development and collapse. a) The
cavitation bubble grows in successive expansion and compression cycles until it reaches an unstable
size and collapses. (from Castro et al. [290]) b) When cavitation occurs near a solid surface the bubble
assumes a non-spherical shape and micro-jets of liquid are formed and directed towards the solid with
velocities of nearly 400 km/h, causing mechanical erosion and disruption of the solid surface.
(i) Ultrasound frequency. The production of cavitation bubbles and the intensity of cavitation effects
decrease with the increasing frequency of the ultrasonic wave. At higher frequencies, the expansion
and compression cycles are very short to allow the growth of the cavitation bubble, and the bubble
collapse with enough energy to cause liquid disruption. Therefore, most sonochemical reactions are
performed by applying frequencies from 20 to 50 kHz.
(ii) Temperature. The cavitation effects are facilitated by lower temperatures. As the temperature of
the liquid media increases, the vapor pressure inside the cavitation bubble also increases. Thus, when
cavitation occurs, the shockwave from the implosion is cushioned and the heat generated is dissipated
by the presence extra vapor inside the bubble.
(iii) Applied pressure. When the external pressure is increased, the sonochemical effects of the cavity
bubble implosion are also improved. However, higher ultrasound intensity has to be applied to the
liquid media to obtain cavitation, because the pressure increment promotes the dissolution of gas
molecules in the liquid, reducing the number of nucleation sites available for bubble formation.
(iv) Solvent. Solvent viscosity, surface tension and vapor pressure are also important factors. As
previously explained, the higher the vapor pressure, the lower the cavitation intensity. However, the
formation of cavitation bubbles is facilitated by high vapor pressures due to the increased number of
nucleation sites provided by a higher amount of vapor. Regarding viscosity and surface tension, the

Chapter I
49
production of cavitation bubbles is hampered in solvents where the cohesive forces are larger, i.e. high
viscosity and increased surface tension, because more energy is required to break these forces and
form the cavitation bubble. Yet, the effects of cavitation are increased in solvents with high-surface
tension and viscosity.
(v) Ultrasound intensity. The ultrasonication intensity, or acoustic power, is directly proportional to
the square of the wave amplitude. In general, the increase of ultrasound intensity enhances the
cavitation effects. However, if the intensity applied to a system is higher than the required to produce
efficient cavitation, a number of different problems may arise. For example, the transducer material
that provides ultrasound can break, or loose contact with the liquid due to the formation of large
cavitation bubbles near the surface of the transducer, reducing the ultrasonication efficiency. This is
generally referred as ultrasound decoupling phenomenon.
(vi) Gas present in the solvent. The presence of a gas in the liquid media produces a higher number of
nucleation spots and reduces the cavitation threshold, i.e. the intensity required to obtain effective
cavitation. The nature and properties of the gas are also important. For example, gases with low
thermal conductivity properties cannot dissipate the heat formed during the bubble implosion, which
results in the increase of the cavitation effect.
Finally, the ultrasonication of liquid media can produce two types of cavitation: transient cavitation
and stable cavitation [288, 290]. The transient cavitation occurs when the ultrasonic intensity applied
to the system exceeds 10 W/cm2. These cavitation bubbles only exist for a short period of time and
they are responsible for the most violent cavitation phenomena. In general, most of the chemical and
physical effects produced by ultrasound are related with transient cavitation. Conversely, stable
cavitation is generated at lower ultrasound intensities. Stable cavitation bubbles are formed during
many expansion and compression cycles, and they are mostly filled with gas, which softens the
cavitation implosion and decreases the cavitational effects in the surrounding medium [305].
I.4.2. Ultrasonic devices
Ultrasonic energy can be provided by different ultrasound devices, such as ultrasonic baths, horns or
probes. These devices are equipped with powerful transducers that convert either electrical or
mechanical energy into vibrations, which are transferred to the medium in the form of an ultrasonic
wave [288]. Three main types of ultrasound transducers are available: (i) gas-driven transducers,
which are used in whistles and sirens; (ii) liquid-driven transducers that generate ultrasound by the
motion of liquids into confined chambers; and (iii) electromechanical transducers, which are the main
type of transducers used in analytical devices, as the ultrasonic bath or the ultrasonic probe [288, 290].
Among electromechanical transducers, the magnetostrictive and piezoelectric transducers are the most

General Introduction
50
common to produce ultrasound. In magnetostrictive transducers, short pulses of a magnetic field are
applied in a metal to induce modifications in its shape. Nickel, for example, reduces size when a
magnetic field is applied, and returns to the original size when the magnetic field is removed. Thus,
the metal vibration induced by the magnetic pulse, applied at a given frequency, is transmitted to the
media as an ultrasonic wave [288]. On the other hand, in piezoelectric transducers different electric
voltages are used to induce structural changes in crystals (e.g. quartz) and ceramics, producing
ultrasound [288].
The most common ultrasonic devices used for analytical applications are ultrasonic baths, ultrasonic
probes and cup horn reactors [294, 296]. These devices are all based on electromechanical transducers.
A brief description of each one is provided in the following sections, and an overview of the main
advantages and disadvantages is given in Table I.7.
Table I.7: Overview of the major characteristics of different ultrasonic devices used throughout this
work: ultrasonic bath, ultrasonic probe, and sonoreactor.
Ultrasonic bath Ultrasonic probe Sonoreactor
Sample throughput High Low Medium
Sample handling Low High Low
Thermostat Yes No No
Operating frequency 35 kHz – 130 kHz 20 kHz – 30 kHz 20 kHz – 30 kHz
Intensity Low High Medium
Cost € €€€ €€€
Advantages
Available in most
laboratories;
No special adaptation is
required for the reaction
vials.
High ultrasonic power;
Ultrasonic amplitude
control.
Higher ultrasonic power
than the cleaning bath;
Higher throughput than
the probe system.
No cross-contamination.
Disadvantages
Reduced power;
Ultrasonication effects
depend on the vial
position in the bath.
Sample overheating;
Cross-contamination;
Tip erosion.
Lower ultrasonic power
than the probe system;
Limited sample volume.
I.4.2.1. Ultrasonic bath
Ultrasonic cleaning baths are easily available, relatively inexpensive, and perhaps the most common
ultrasonic apparatus present in chemical laboratories. The ultrasonic energy provided is generally of
low intensity, 1 to 5 W/cm2, and the operating frequencies are around 40 kHz [293, 294].
A normal
ultrasonic bath consists in a stainless steel tank with piezoelectric transducers located at the base. The

Chapter I
51
number and type of transducers are directly related with the intensity of ultrasound provided by the
equipment [288]. Operating this ultrasonic device is very simple and straightforward, but a number of
variables must be considered: (i) the size of the bath and the position of reaction vessel inside the tank
affect the intensity of the ultrasonic energy transmitted to the reaction media, creating reproducibility
issues; (ii) the temperature inside the tank increase with the ultrasonication time and is difficult to
control, since most ultrasonication baths do not have thermostats; and (iii) the ultrasound frequency
varies with the equipment, and must be considered when comparing results obtained from different
baths [288].
Many applications of the ultrasonic bath have been reported over the years. Extraction of metal
elements from biological samples; extraction of organic compounds, such as pesticides, polymers and
pollutants; and the improvement of methodologies for analytical chemistry, are some examples of the
wide range of applications of this device [293, 306].
More recently, the ultrasonic cleaning bath was reported as a valuable tool for proteomics applications.
The enhancement and improvement of sample processing for protein identification [307], and protein
quantitation by 18
O-labeling [308] with the ultrasonic bath was performed in our laboratory as part of
this dissertation.
The ultrasonic bath used throughout this work has specific characteristics, which make it one of the
most advanced equipments of the genera, namely: (i) two different operating frequencies, 35 and 130
kHz; (ii) ultrasound intensity regulation, from 10 to 100 %; (iii) thermostat, for temperature control;
(iv) timer; and (v) three different operating modes to regulate how the ultrasound frequency is applied
to the bath [294].
I.4.2.2. Ultrasonic probe
The ultrasonic power provided by an ultrasonic probe varies from 50 to 500 W/cm2, with operating
frequencies from 20 to 30 kHz. It is at least 100 times higher than the ultrasound intensity of an
ultrasonic bath [302, 306]. In general, the design of this kind of equipments consists simply in
attaching a probe, also known as sonic horn, to a piezoelectric transducer. The probes, generally made
of a titanium alloy, amplify the vibration of the piezoelectric transducer and transfer the ultrasonic
energy directly into the liquid medium [288].
Even though the ultrasonic probe is the most reliable source of ultrasound, several factors must be
considered when performing ultrasonication with this equipment. First, the ultrasound intensity and
performance are largely dependent on the shape, length and diameter of the probe [288]. Nowadays,
probes with different specifications are commercially available, and must be chosen according to the

General Introduction
52
desired effect and objective of the work. Second, during ultrasonication, the temperature of the liquid
media increases and its physical characteristics may change, causing the decoupling of the probe and
the decrease of cavitation efficiency, and aerosol formation inside the container. Therefore, the
reaction vial must be refrigerated during the ultrasonication procedure, or pulses of ultrasound must be
applied to avoid sample overheating [294]. The shape of the reaction vial is another important variable
affecting the efficiency of the probe: the vials must have a conical form to ensure a more effective
energy transfer [309]. Finally, special care must be taken to avoid sample contamination, because
ultrasonication is performed in an open reactor, and the probe, if not efficiently decontaminated
between experiments, may introduce contaminants in samples [290].
The ultrasonic probe has been used in many and different works [293, 306], but one of the most recent
and promising applications is the use of the ultrasonic probe to accelerate enzymatic digestion [116,
310, 311] and 18
O-labeling of proteins [312, 313]. Much of this work was developed in this
dissertation, and the results are reported throughout the next chapters.
Recent advances in the ultrasonic probe technology have introduced the silica glass probes, spiral
probes and multi-probes [294]. The multi-probe systems provide higher sample throughput, while the
spiral probes provide uniform ultrasonic energy across the entire surface, and are especially useful for
ultrasound application in lengthy and thin reaction vials. Glass probes are mainly used for metal trace
analysis, because they are less prone erosion and, therefore, metal contaminants resulting from the
erosion of the probe, as in metal alloy probes, are not introduced in the sample.
I.4.2.3. Cup horn reactors
The sonoreactor technology, available from Hielscher Ultrasonics (www.hielscher.com), is a powerful
cup horn reactor. The sonoreactor can be regarded as a small ultrasonic bath, since it provides indirect
ultrasonication of samples. Unlike the ultrasonic probe, that delivers ultrasound directly into the liquid
media, the ultrasonic waves generated by the sonoreactor have to cross the walls of the reaction vessel,
resulting in a lower ultrasonic power, compared to the probe system [294]. However, it is claimed by
the manufacturers that the ultrasonic energy provided is 50 times higher than a normal ultrasonic bath.
The main advantage of this system is the possibility to perform high-intensity ultrasonication in closed
vials, which prevents cross contamination and allows the ultrasonication of hazardous samples.
Furthermore, the sample throughput is higher than the ultrasonic probe.
This equipment was used for the first time in proteomics applications during the work developed in
this dissertation. Promising results were obtained, namely, the reduction of protein enzymatic
digestion time from 24 h to only 1 min [314], and the improvement of protein 18
O-labeling [313, 315].
These results are described in detail over the next chapters.

Chapter I
53
I.4.3. Enzymatic digestion with ultrasound
Ultrasonic energy has been used for many applications in analytical chemistry, among which the
enhancement of protein enzymatic digestion. The main variables affecting enzymatic digestion of
proteins with ultrasound are related with ultrasonication parameters, such as the acoustic frequency,
and intensity; and parameters directly associated with the enzyme stability and activity, like the
temperature and pH of the buffer [316]. The effect of ultrasonic energy in enzymes is not fully
understood yet, but some studies reported that the activity of the enzyme could be controlled by
inducing changes in its structure with ultrasound [317]. However, there is no general consensus in
whether ultrasonic energy is responsible for the activation or inactivation of enzymes.
Several studies reported the enhancement of enzymatic reactions with ultrasound. Barton et al. studied
the effect of ultrasonic energy from an ultrasonic bath on the activities of α-amylase and
amyloglucosidase, and found that the reaction rates of these enzymes increased in the presence of
ultrasonic irradiation [318]. These results were justified with the temperature increment, and the
improvement of mixing/diffusion of reagents caused by ultrasonic energy. In 2000, Ozbek et al.
reported the effects of ultrasound on the stability of several enzymes, and concluded that the alkaline
phosphatase stability was not affected by ultrasound, while some enzymes, such as alcohol
dehydrogenase and malate dehydrogenase, appeared to be inactivated with increasing ultrasonic power
[319]. Capelo et al. used an ultrasonic probe, enzymatic probe sonication (EPS), to enhance the
activity of protease XIV and subtilisin for the determination and speciation of Se in biological
samples, and concluded that the catalytic activity of these enzymes could be improved, even when the
selenium extraction was performed in non-buffered solutions [320]. This new methodology allowed
total recovery of Se compounds from yeast in only 15 s. Another example of enzymatic digestion
improvement with ultrasound was described by Siwek et al., when they used pronase E, combined
with ultrasonic energy, to hydrolyze Antarctic krill for the extraction of Se organic compounds [321].
The authors obtained a quantitative extraction yield in only 15 min with ultrasound from an ultrasonic
probe, compared to the 24 h incubation at 37ºC without ultrasound. Finally, in a recent study Jian et al.
used ultrasonic energy to accelerate the enzymatic hydrolysis of the untanned solid leather waste
[322]. The authors obtained an increment of ca. 40 % in the skin degradation to soluble proteins when
ultrasound was used, compared to the normal procedure with no ultrasound, and showed that
ultrasonic energy has a negligible effect on the activity of alkaline protease form Bacillus
licheniformis [322].
On the other hand, reports describing the ultrasound inactivation of proteins were also made by
different scientists. Ovsianko et al. studied the effect of ultrasound on the activation of serine
proteases, and found that the increment of ultrasonic intensity promote a considerable decrease in the
proteolytic activity of a mixture of chymotrypsinogen and trypsinogen [323]. The ultrasound effects

General Introduction
54
on the structure and function of trypsin were described in 2004 by Tian et al. [324]. The authors
reported that the activity of trypsin decreased when the ultrasound power increased from 100 to 500
W, and when the ultrasonication time increased from 1 to 20 min. According to them, the reason for
trypsin inactivation depends mainly on two factors: (i) the water-air interface generated by cavitation,
which contributed to the modification of the molecular conformation, due to hydrophobic interaction
and hydrogen bond disruption; and (ii) the free radicals, shock wave and shear force produced by
cavitation, which damaged the molecular structure of trypsin [324]. In a different work, Vale et al.
described the inactivation of protease XIV with increasing ultrasonication time [325]. They found that
with 30 s of ultrasonication the enzyme activity is not affected; 60 s of ultrasonication makes the
activity decrease 20 %; and with 120 s of ultrasound irradiation the enzyme is completely inactivated.
As can be seen, different reports, and sometimes contradicting ones, have been published about the
enhancement of enzymatic digestions with ultrasonic energy. Also, most of the referred studies are
related with applications of ultrasound for metal extraction and speciation from biological samples,
environmental remediation and food processing. In 2005, for the first time, López-Ferrer et al.
introduced the high-intensity focused ultrasound (HIFU) technology to enhance protein digestion
[116], as previously described in section I.1.4.4.4. Since then, many papers and results were published
describing different applications of ultrasound technology in proteomics workflow, and the
optimization of variables and conditions for rapid protein quantitation and identification. Part of that
work was performed during the last 4 years and is described in this dissertation, over the following
chapters.

Chapter I
55
I.5. General objectives and thesis outline
The main objective of this dissertation was the development and optimization of methodologies for
rapid protein identification and quantitation by MALDI-TOF-MS. These two items are of major
importance for the proteomics community, since they are the basis of any proteomics study. However,
the procedures generally used are time-consuming, labor-intensive, and error-prone due to the several
steps involved.
Recently, ultrasonic energy appeared as a promising tool to enhance protein enzymatic digestion, a
crucial step in any proteomics workflow. Yet, the application of ultrasound in the sample treatment
procedure for protein identification is new and needs further refinement. Hence, experiments were
conducted with the objective to understand and optimize the parameters related with the application of
ultrasonic energy, not only in protein identification procedures, but also in protein quantitation studies
by 18
O-isotopic labeling. The results obtained are described throughout this dissertation in different but
complementary parts and chapters, as follows:
Part I – Chapter I
An evaluation of the state of the art regarding the most important methods for protein identification
and quantitation is provided. The most significant achievements in mass spectrometry technologies for
proteomics, particularly MALDI-TOF-MS, were reviewed. In addition, the basic principles of
ultrasound, the major ultrasonic devices and applications of ultrasonic energy in the enhancement of
enzymatic reactions were also surveyed.
Part II – Application of ultrasonic energy to protein identification procedures
Chapter II
This chapter describes the application of ultrasound provided by an ultrasonic probe (high intensity
focused ultrasound) to the enhancement of in-gel protein enzymatic digestion. Several variables were
evaluated and optimized: (i) sample volume; (ii) probe diameter; (iii) protein denaturation; (iv)
incubation time with trypsin in an ice bath; (v) enzyme concentration; and (vi) protein concentration.
Chapter III
In chapter III, the in-gel protein enzymatic digestion with a sonoreactor equipment was evaluated. This
device has several advantages over the ultrasonic probe, but the ultrasound intensity is lower. Different

General Introduction
56
parameters were assessed and optimized: (i) enzyme-to-protein ratio; (ii) enzymatic digestion time;
(iii) ultrasound amplitude; and (iv) protein concentration.
Chapter IV
Results regarding the application of the ultrasonic bath, the sonoreactor and the ultrasonic probe to
different steps of the procedure for protein identification, after protein separation by gel
electrophoresis, are presented. The gel washing steps, the reduction and alkylation reactions were
accelerated with ultrasonic energy, and the sample treatment procedure was drastically simplified. The
new procedure was validated and applied to the identification of proteins from three different sulfate
reducing bacteria.
Part III – Application of ultrasonic energy to protein quantitation procedures
Chapter V
Protein quantitation by 18
O-labeling was enhanced with ultrasonic energy provided by an ultrasonic
bath. Different ultrasonication frequencies and labeling times were assessed. The results obtained with
the optimized ultrasonication conditions were compared with the results obtained in the same
conditions but with no ultrasound, and with the results obtained by the classic sample treatment.
Chapter VI
This chapter describes the optimization of the direct 18
O-labeling procedure with the ultrasonic probe
and the sonoreactor. Several variables were studied, such as: (i) labeling reaction time; (ii) enzyme-to-
protein ratio; and (iii) sample concentration. Protein samples from human plasma were labeled with
the new ultrasonic procedure.
Chapter VII
In chapter VII, the robustness of ultrasonic energy to accelerate the isotopic labeling of proteins by the
18O-decoupled procedure was evaluated. The sonoreactor and the ultrasonic probe were selected for
this study. The results were validated after the application of the optimized procedure to protein
samples from human plasma.
Part IV – Chapter VIII
The last chapter describes the general conclusions of this work and the future prospects.

Chapter I
57
I.6. References
[1] M.R. Wilkins, R.D. Appel, K.L. Williams, D.F. Hochstrasser, Proteome Reserach: Concepts,
Technology and Application, 2nd ed., Springer-Verlag, Berlin, 2007.
[2] M.R. Wilkins, C. Pasquali, R.D. Appel, K. Ou, O. Golaz, J.C. Sanchez, J.X. Yan, A.A. Gooley, G.
Hughes, I. HumpherySmith, K.L. Williams, D.F. Hochstrasser, Bio-Technology, 14 (1996) 61-65.
[3] V.C. Wasinger, S.J. Cordwell, A. Cerpapoljak, J.X. Yan, A.A. Gooley, M.R. Wilkins, M.W.
Duncan, R. Harris, K.L. Williams, I. Humpherysmith, Electrophoresis, 16 (1995) 1090-1094.
[4] M.R. Wilkins, J.C. Sanchez, A.A. Gooley, R.D. Appel, I. HumpherySmith, D.F. Hochstrasser,
K.L. Williams, Biotechnology and Genetic Engineering Reviews, 13 (1996) 19-50.
[5] M. Traini, A.A. Gooley, K. Ou, M.R. Wilkins, L. Tonella, J.C. Sanchez, D.F. Hochstrasser, K.L.
Williams, Electrophoresis, 19 (1998) 1941-1949.
[6] N.L. Anderson, N.G. Anderson, Electrophoresis, 19 (1998) 1853-1861.
[7] L.A. Huber, Nature Reviews Molecular Cell Biology, 4 (2003) 74-80.
[8] F.S. Collins, E.S. Lander, J. Rogers, R.H. Waterston, Int Human Genome Sequencing Consortium,
Nature, 431 (2004) 931-945.
[9] C. Choudhary, M. Mann, Nat. Rev. Mol. Cell Biol., 11 (2010) 427-439.
[10] O.N. Jensen, Nature Reviews Molecular Cell Biology, 7 (2006) 391-403.
[11] D.C. Liebler, Introduction to Proteomics: tools for the New Biology, 1st ed., Humana Press Inc.,
New Jersey, 2002.
[12] A. Abbott, Nature, 402 (1999) 715-720.
[13] N.L. Kelleher, H.Y. Lin, G.A. Valaskovic, D.J. Aaserud, E.K. Fridriksson, F.W. McLafferty,
Journal of the American Chemical Society, 121 (1999) 806-812.
[14] B. Bogdanov, R.D. Smith, Mass Spectrom. Rev., 24 (2005) 168-200.
[15] N.L. Kelleher, Anal. Chem., 76 (2004) 196A-203A.
[16] T. Wehr, LC GC North America, 24 (2006) 1004.
[17] A.E. Speers, C.C. Wu, Chemical Reviews, 107 (2007) 3687-3714.
[18] A. Pandey, M. Mann, Nature, 405 (2000) 837-846.
[19] T. Rabilloud, A.R. Vaezzadeh, N. Potier, C. Lelong, E. Leize-Wagner, M. Chevallet, Mass
Spectrom. Rev., 28 (2009) 816-843.
[20] H. Zhu, M. Bilgin, M. Snyder, Annu. Rev. Biochem., 72 (2003) 783-812.
[21] S.D. Patterson, R.H. Aebersold, Nature Genet., 33 (2003) 311-323.
[22] T.J. Griffin, D.R. Goodlett, R. Aebersold, Current Opinion in Biotechnology, 12 (2001) 607-612.
[23] S.D. Patterson, Current Opinion in Biotechnology, 11 (2000) 413-418.
[24] R.C. Panicker, S. Chattopadhaya, S.Q. Yao, Anal. Chim. Acta, 556 (2006) 69-79.
[25] R. Westermeier, Electrophoresis in Practice, 4th ed., Wiley-VHC, Weinheim, 2005.
[26] J.E. Celis, P. Gromov, Current Opinion in Biotechnology, 10 (1999) 16-21.
[27] P.H. Ofarrell, J. Biol. Chem., 250 (1975) 4007-4021.

General Introduction
58
[28] J. Klose, Humangenetik, 26 (1975) 231-243.
[29] G.A. Scheele, J. Biol. Chem., 250 (1975) 5375-5385.
[30] G.L. Corthals, V.C. Wasinger, D.F. Hochstrasser, J.C. Sanchez, Electrophoresis, 21 (2000) 1104-
1115.
[31] B. Bjellqvist, K. Ek, P.G. Righetti, E. Gianazza, A. Gorg, R. Westermeier, W. Postel, Journal of
Biochemical and Biophysical Methods, 6 (1982) 317-339.
[32] A. Gorg, C. Obermaier, G. Boguth, A. Harder, B. Scheibe, R. Wildgruber, W. Weiss,
Electrophoresis, 21 (2000) 1037-1053.
[33] S. Beranova-Giorgianni, Trac-Trends in Analytical Chemistry, 22 (2003) 273-281.
[34] S.P. Gygi, G.L. Corthals, Y. Zhang, Y. Rochon, R. Aebersold, Proceedings of the National
Academy of Sciences of the United States of America, 97 (2000) 9390-9395.
[35] D. Penque, Proteom. Clin. Appl., 3 (2009) 155-172.
[36] G.B. Smejkal, A. Lazarev, Separation Methods in Proteomics, 1st ed., Taylor and Francis, Boca
Raton, FL, USA, 2006.
[37] S.J. Fey, P.M. Larsen, Current Opinion in Chemical Biology, 5 (2001) 26-33.
[38] A. Gorg, W. Weiss, M.J. Dunn, Proteomics, 4 (2004) 3665-3685.
[39] T. Stasyk, L.A. Huber, Proteomics, 4 (2004) 3704-3716.
[40] P.G. Righetti, A. Castagna, P. Antonioli, E. Boschetti, Electrophoresis, 26 (2005) 297-319.
[41] C. Pasquali, I. Fialka, L.A. Huber, Journal of Chromatography B-Analytical Technologies in the
Biomedical and Life Sciences, 722 (1999) 89-102.
[42] D.J. Gauthier, C. Lazure, Expert Review of Proteomics, 5 (2008) 603-617.
[43] L.A. Huber, K. Pfaller, I. Vietor, Circ.Res., 92 (2003) 962-968.
[44] M.P. Molloy, B.R. Herbert, B.J. Walsh, M.I. Tyler, M. Traini, J.C. Sanchez, D.F. Hochstrasser,
K.L. Williams, A.A. Gooley, Electrophoresis, 19 (1998) 837-844.
[45] R. Henningsen, B.L. Gale, K.M. Straub, D.C. DeNagel, Proteomics, 2 (2002) 1479-1488.
[46] A.L. Foucher, B. Papadopoulou, M. Ouellette, J. Proteome Res., 5 (2006) 1741-1750.
[47] Y. Ramos, Y. Garcia, A. Llopiz, L. Castellanos-Serra, Anal. Biochem., 377 (2008) 134-140.
[48] P.G. Righetti, A. Castagna, B. Herbert, F. Reymond, J.S. Rossier, Proteomics, 3 (2003) 1397-
1407.
[49] M. Fountoulakis, H. Langen, S. Evers, C. Gray, B. Takacs, Electrophoresis, 18 (1997) 1193-1202.
[50] M. Fountoulakis, B. Takacs, Protein Expression and Purification, 14 (1998) 113-119.
[51] K. Karlsson, N. Cairns, G. Lubec, M. Fountoulakis, Electrophoresis, 20 (1999) 2970-2976.
[52] K. Hannig, Electrophoresis, 3 (1982) 235-243.
[53] K. Hannig, Journal of Chromatography, 159 (1978) 183-191.
[54] H. Zischka, G. Weber, P.J.A. Weber, A. Posch, R.J. Braun, D. Buhringer, U. Schneider, M.
Nissum, T. Meitinger, M. Ueffing, C. Eckerskorn, Proteomics, 3 (2003) 906-916.
[55] R.E. Banks, M.J. Dunn, M.A. Forbes, A. Stanley, D. Pappin, T. Naven, M. Gough, P. Harnden,
P.J. Selby, Electrophoresis, 20 (1999) 689-700.

Chapter I
59
[56] R.A. Craven, N. Totty, P. Harnden, P.J. Selby, R.E. Banks, Am. J. Pathol., 160 (2002) 815-822.
[57] A.R. Shekouh, C.C. Thompson, W. Prime, F. Campbell, J. Hamlett, C.S. Herrington, N.R.
Lemoine, T. Crnogorac-Jurcevic, M.W. Buechler, H. Friess, J.P. Neoptolemos, S.R. Pennington, E.
Costello, Proteomics, 3 (2003) 1988-2001.
[58] M. Bier, Electrophoresis, 19 (1998) 1057-1063.
[59] H.X. Wang, M.T. Kachman, D.R. Schwartz, K.R. Cho, D.M. Lubman, Electrophoresis, 23 (2002)
3168-3181.
[60] V. Polaskova, A. Kapur, A. Khan, M.P. Molloy, M.S. Baker, Electrophoresis, 31 (2010) 471-482.
[61] S.W. Tam, J. Pirro, D. Hinerfeld, Expert Review of Proteomics, 1 (2004) 411-420.
[62] P.G. Righetti, E. Boschetti, L. Lomas, A. Citterio, Proteomics, 6 (2006) 3980-3992.
[63] E. Boschetti, P.G. Righetti, Proteomics, 9 (2009) 1492-1510.
[64] M.L. Fournier, J.M. Gilmore, S.A. Martin-Brown, M.P. Washburn, Chemical Reviews, 107
(2007) 3654-3686.
[65] A. Motoyama, J.R. Yates, Anal. Chem., 80 (2008) 7187-7193.
[66] L.J. Liao, D.B. McClatchy, J.R. Yates, Neuron, 63 (2009) 12-26.
[67] S. Matallana-Surget, B. Leroy, R. Wattiez, Expert Review of Proteomics, 7 (2010) 5-7.
[68] M.R. Roe, T.J. Griffin, Proteomics, 6 (2006) 4678-4687.
[69] X. Zhang, A.Q. Fang, C.P. Riley, M. Wang, F.E. Regnier, C. Buck, Anal. Chim. Acta, 664 (2010)
101-113.
[70] P. Horvatovich, B. Hoekman, N. Govorukhina, R. Bischoff, J. Sep. Sci., 33 (2010) 1421-1437.
[71] H. Malerod, E. Lundanes, T. Greibrokk, Anal. Methods, 2 (2010) 110-122.
[72] A.J. Link, J. Eng, D.M. Schieltz, E. Carmack, G.J. Mize, D.R. Morris, B.M. Garvik, J.R. Yates,
Nature Biotechnology, 17 (1999) 676-682.
[73] M.P. Washburn, D. Wolters, J.R. Yates, Nature Biotechnology, 19 (2001) 242-247.
[74] D.A. Wolters, M.P. Washburn, J.R. Yates, Anal. Chem., 73 (2001) 5683-5690.
[75] W.H. McDonald, R. Ohi, D.T. Miyamoto, T.J. Mitchison, J.R. Yates, International Journal of
Mass Spectrometry, 219 (2002) 245-251.
[76] J. Hagen, Proteomics Sample Preparation, 1st ed., Wiley-VHC, Verlag, GmbH, 2008.
[77] J. Malmstrom, H. Lee, R. Aebersold, Current Opinion in Biotechnology, 18 (2007) 378-384.
[78] B. Canas, C. Pineiro, E. Calvo, D. Lopez-Ferrer, J.M. Gallardo, J. Chromatogr. A, 1153 (2007)
235-258.
[79] D. Lopez-Ferrer, B. Canas, J. Vazquez, C. Lodeiro, R. Rial-Otero, I. Moura, J.L. Capelo, Trac-
Trends in Analytical Chemistry, 25 (2006) 996-1005.
[80] R. Kaiser, L. Metzka, Anal. Biochem., 266 (1999) 1-8.
[81] T.T.T. Quach, N. Li, D.P. Richards, J. Zheng, B.O. Keller, L. Li, J. Proteome Res., 2 (2003) 543-
552.
[82] H.Y. Zhong, Y. Zhang, Z.H. Wen, L. Li, Nature Biotechnology, 22 (2004) 1291-1296.

General Introduction
60
[83] H.Y. Zhong, S.L. Marcus, L. Li, Journal of the American Society for Mass Spectrometry, 16
(2005) 471-481.
[84] S. Swatkoski, S.C. Russell, N. Edwards, C. Fenselau, Anal. Chem., 78 (2006) 181-188.
[85] L.H. Lo, T.L. Huang, J. Shiea, Rapid Communications in Mass Spectrometry, 23 (2009) 589-598.
[86] A.Q. Li, R.C. Sowder, L.E. Henderson, S.P. Moore, D.J. Garfinkel, R.J. Fisher, Anal. Chem., 73
(2001) 5395-5402.
[87] L. Hua, T.Y. Low, S.K. Sze, Proteomics, 6 (2006) 586-591.
[88] M.A. Baldwin, Mol. Cell. Proteomics, 3 (2004) 1-9.
[89] J.K. McDonald, Histochemical Journal, 17 (1985) 773-785.
[90] Sigma-Aldrich, in: Protease ProfilerTM
Kit (PP0500), Technical Bulletin.
[91] D.L. Swaney, C.D. Wenger, J.J. Coon, J. Proteome Res., 9 (2010) 1323-1329.
[92] J. Rodriguez, N. Gupta, R.D. Smith, P.A. Pevzner, J. Proteome Res., 7 (2008) 300-305.
[93] J.V. Olsen, S.E. Ong, M. Mann, Mol. Cell. Proteomics, 3 (2004) 608-614.
[94] J.L. Capelo, R. Carreira, M. Diniz, L. Fernandes, M. Galesio, C. Lodeiro, H.M. Santos, G. Vale,
Anal. Chim. Acta, 650 (2009) 151-159.
[95] J. Rosenfeld, J. Capdevielle, J.C. Guillemot, P. Ferrara, Anal. Biochem., 203 (1992) 173-179.
[96] J.T. Stults, D. Arnott, Biological Mass Spectrometry, 402 (2005) 245-289.
[97] V. Soskic, J. Godovac-Zimmermann, Proteomics, 1 (2001) 1364-1367.
[98] A. Shevchenko, H. Tomas, J. Havlis, J.V. Olsen, M. Mann, Nature Protocols, 1 (2006) 2856-
2860.
[99] I. Miller, J. Crawford, E. Gianazza, Proteomics, 6 (2006) 5385-5408.
[100] K.F. Medzihradszky, In-solution digestion of proteins for mass spectrometry, in: Mass
Spectrometry: Modified Proteins and Glycoconjugates, Elsevier Academic Press Inc, San Diego,
2005, pp. 50-65.
[101] G. Massolini, E. Calleri, J. Sep. Sci., 28 (2005) 7-21.
[102] J. Ma, L. Zhang, Z. Liang, W. Zhang, Y. Zhang, J. Sep. Sci., 30 (2007) 3050-3059.
[103] A. Monzo, E. Sperling, A. Guttman, Trac-Trends in Analytical Chemistry, 28 (2009) 854-864.
[104] D. Craft, L. Li, Anal. Chem., 77 (2005) 2649-2655.
[105] Applied-Biosystems, in: Poroszyme® Immobilized Trypsin Cartridge - User Manual.
[106] Sigma-Aldrich, in: Trypsin Spin Columns, Proteomics Grade (TT0010), Technical Bulletin.
[107] R. Marangoni, R. Chiarini, G. Iannone, M. Salerno, Proteomics, 8 (2008) 2165-2167.
[108] J.R. Lill, E.S. Ingle, P.S. Liu, V. Pham, W.N. Sandoval, Mass Spectrom. Rev., 26 (2007) 657-
671.
[109] B.N. Pramanik, U.A. Mirza, Y.H. Ing, Y.H. Liu, P.L. Bartner, P.C. Weber, M.K. Bose, Protein
Sci., 11 (2002) 2676-2687.
[110] H.F. Juan, S.C. Chang, H.C. Huang, S.T. Chen, Proteomics, 5 (2005) 840-842.
[111] W. Sun, S.J. Gao, L.J. Wang, Y. Chen, S.Z. Wu, X.R. Wang, D.X. Zheng, Y.H. Gao, Mol. Cell.
Proteomics, 5 (2006) 769-776.

Chapter I
61
[112] J. Havlis, H. Thomas, M. Sebela, A. Shevchenko, Anal. Chem., 75 (2003) 1300-1306.
[113] O.A. Turapov, G.V. Mukamolova, A.R. Bottrill, M.K. Pangburn, Anal. Chem., 80 (2008) 6093-
6099.
[114] W.K. Russell, Z.Y. Park, D.H. Russell, Anal. Chem., 73 (2001) 2682-2685.
[115] S.S. Lin, C.H. Wu, M.C. Sun, C.M. Sun, Y.P. Ho, Journal of the American Society for Mass
Spectrometry, 16 (2005) 581-588.
[116] D. Lopez-Ferrer, J.L. Capelo, J. Vazquez, J. Proteome Res., 4 (2005) 1569-1574.
[117] S. Wang, L.Y. Zhang, P.Y. Yang, G. Chen, Proteomics, 8 (2008) 2579-2582.
[118] S. Wang, T. Liu, L.Y. Zhang, G. Chen, J. Proteome Res., 7 (2008) 5049-5054.
[119] H.M. Bao, T. Liu, X. Chen, G. Chen, J. Proteome Res., 7 (2008) 5339-5344.
[120] H.M. Bao, T. Lui, L.Y. Zhang, G. Chen, Proteomics, 9 (2009) 1114-1117.
[121] S. Wang, H.M. Bao, L.Y. Zhang, P.Y. Yang, G. Chen, Anal. Chem., 80 (2008) 5640-5647.
[122] S. Putz, J. Reinders, Y. Reinders, A. Sickmann, Expert Review of Proteomics, 2 (2005) 381-
392.
[123] J.C. Smith, J.P. Lambert, F. Elisma, D. Figeys, Anal. Chem., 79 (2007) 4325-4343.
[124] R. Chaerkady, A. Pandey, Annual Review of Pathology-Mechanisms of Disease, 3 (2008) 485-
498.
[125] S. Pan, R. Aebersold, R. Chen, J. Rush, D.R. Goodlett, M.W. McIntosh, J. Zhang, T.A.
Brentnall, J. Proteome Res., 8 (2009) 787-797.
[126] K.W. Lau, A.R. Jones, N. Swainston, J.A. Siepen, S.J. Hubbard, Proteomics, 7 (2007) 2787-
2799.
[127] M.H. Elliott, D.S. Smith, C.E. Parker, C. Borchers, J. Mass Spectrom., 44 (2009) 1637-1660.
[128] S.E. Ong, M. Mann, Nat. Chem. Biol., 1 (2005) 252-262.
[129] W. Yan, S.S. Chen, Brief. Funct. Genomics Proteomics, 4 (2005) 27-38.
[130] W.X. Schulze, B. Usadel, Quantitation in Mass-Spectrometry-Based Proteomics, in: Annual
Review of Plant Biology, Vol 61, Annual Reviews, Palo Alto, 2010, pp. 491-516.
[131] J.J. Moresco, M.Q. Dong, J.R. Yates, Am. J. Clin. Nutr., 88 (2008) 597-604.
[132] M. Hamdan, P.G. Righetti, Mass Spectrom. Rev., 21 (2002) 287-302.
[133] J. Lill, Mass Spectrom. Rev., 22 (2003) 182-194.
[134] B. Moritz, H.E. Meyer, Proteomics, 3 (2003) 2208-2220.
[135] R.D. Unwin, C.A. Evans, A.D. Whetton, Trends Biochem. Sci., 31 (2006) 473-484.
[136] R. Marouga, S. David, E. Hawkins, Analytical and Bioanalytical Chemistry, 382 (2005) 669-
678.
[137] J.S. Minden, S.R. Dowd, H.E. Meyer, K. Stuhler, Electrophoresis, 30 (2009) S156-S161.
[138] M. Unlu, M.E. Morgan, J.S. Minden, Electrophoresis, 18 (1997) 2071-2077.
[139] H. Steen, A. Pandey, Trends Biotechnol., 20 (2002) 361-364.
[140] M. Abu-Farha, F. Elisma, H.J. Zhou, R.J. Tian, H. Zhou, M.S. Asmer, D. Figeys, Anal. Chem.,
81 (2009) 4585-4599.

General Introduction
62
[141] M. Bantscheff, M. Schirle, G. Sweetman, J. Rick, B. Kuster, Anal. Bioanal. Chem., 389 (2007)
1017-1031.
[142] A. Iliuk, J. Galan, W.A. Tao, Anal. Bioanal. Chem., 393 (2009) 503-513.
[143] R.L. Gant-Branum, T.J. Kerr, J.A. McLean, Analyst, 134 (2009) 1525-1530.
[144] K.G. Kline, M.R. Sussman, Protein Quantitation Using Isotope-Assisted Mass Spectrometry, in:
Annual Review of Biophysics, Vol 39, Annual Reviews, Palo Alto, 2010, pp. 291-308.
[145] S. Sechi, Y. Oda, Curr. Opin. Chem. Biol., 7 (2003) 70-77.
[146] M.J. MacCoss, D.L. Matthews, Anal. Chem., 77 (2005) 295A-302A.
[147] T.J. Griffin, R. Aebersold, J. Biol. Chem., 276 (2001) 45497-45500.
[148] Y. Oda, K. Huang, F.R. Cross, D. Cowburn, B.T. Chait, Proc. Natl. Acad. Sci. U. S. A., 96
(1999) 6591-6596.
[149] S.E. Ong, B. Blagoev, I. Kratchmarova, D.B. Kristensen, H. Steen, A. Pandey, M. Mann, Mol.
Cell. Proteomics, 1 (2002) 376-386.
[150] S.E. Ong, L.J. Foster, M. Mann, Methods, 29 (2003) 124-130.
[151] S.E. Ong, M. Mann, Nat. Protoc., 1 (2006) 2650-2660.
[152] M. Mann, Nat. Rev. Mol. Cell Biol., 7 (2006) 952-958.
[153] D. Van Hoof, M.W.H. Pinkse, D.W.V. Oostwaard, C.L. Mummery, A.J.R. Heck, J. Krijgsveld,
Nat. Methods, 4 (2007) 677-678.
[154] S.P. Gygi, B. Rist, S.A. Gerber, F. Turecek, M.H. Gelb, R. Aebersold, Nat. Biotechnol., 17
(1999) 994-999.
[155] S.P. Gygi, R. Aebersold, Curr. Opin. Chem. Biol., 4 (2000) 489-494.
[156] M.B. Goshe, R.D. Smith, Curr. Opin. Biotechnol., 14 (2003) 101-109.
[157] W.A. Tao, R. Aebersold, Curr. Opin. Biotechnol., 14 (2003) 110-118.
[158] M.R. Flory, T.J. Griffin, D. Martin, R. Aebersold, Trends Biotechnol., 20 (2002) S23-S29.
[159] E.C. Yi, X.J. Li, K. Cooke, H. Lee, B. Raught, A. Page, V. Aneliunas, P. Hieter, D.R. Goodlett,
R. Aebersold, Proteomics, 5 (2005) 380-387.
[160] P.L. Ross, Y.L.N. Huang, J.N. Marchese, B. Williamson, K. Parker, S. Hattan, N. Khainovski,
S. Pillai, S. Dey, S. Daniels, S. Purkayastha, P. Juhasz, S. Martin, M. Bartlet-Jones, F. He, A.
Jacobson, D.J. Pappin, Mol. Cell. Proteomics, 3 (2004) 1154-1169.
[161] A.C. Gingras, M. Gstaiger, B. Raught, R. Aebersold, Nat. Rev. Mol. Cell Biol., 8 (2007) 645-
654.
[162] A.M. Boehm, S. Putz, D. Altenhofer, A. Sickmann, M. Falk, BMC Bioinformatics, 8 (2007).
[163] A. Pierce, R.D. Unwin, C.A. Evans, S. Griffiths, L. Carney, L. Zhang, E. Jaworska, C.F. Lee, D.
Blinco, M.J. Okoniewski, C.J. Miller, D.A. Bitton, E. Spooncer, A.D. Whetton, Mol. Cell. Proteomics,
7 (2008) 853-863.
[164] W.W. Wu, G.H. Wang, S.J. Baek, R.F. Shen, J. Proteome Res., 5 (2006) 651-658.
[165] D.B. Sprinson, D. Rittenberg, Nature, 167 (1951) 484-484.
[166] D.M. Desiderio, M. Kai, Biomedical Mass Spectrometry, 10 (1983) 471-479.

Chapter I
63
[167] X.D. Yao, A. Freas, J. Ramirez, P.A. Demirev, C. Fenselau, Anal. Chem., 73 (2001) 2836-2842.
[168] D.L. Diamond, J.M. Jacobs, B. Paeper, S.C. Proll, M.A. Gritsenko, R.L. Carithers, A.M. Larson,
M.M. Yeh, D.G. Camp, R.D. Smith, M.G. Katze, Hepatology, 46 (2007) 649-657.
[169] J.F. Kuhn, P. Hoerth, S.T. Hoehn, T. Preckel, K.B. Tomer, Electrophoresis, 27 (2006) 1584-
1597.
[170] C.S. Ang, P.D. Veith, S.G. Dashper, E.C. Reynolds, Proteomics, 8 (2008) 1645-1660.
[171] B.L. Hood, D.A. Lucas, G. Kim, K.C. Chan, J. Blonder, H.J. Issaq, T.D. Veenstra, T.P. Conrads,
I. Pollet, A. Karsan, J. Am. Soc. Mass Spectrom., 16 (2005) 1221-1230.
[172] K.J. Brown, C. Fenselau, J. Proteome Res., 3 (2004) 455-462.
[173] L. Zang, D.P. Toy, W.S. Hancock, D.C. Sgroi, B.L. Karger, J. Proteome Res., 3 (2004) 604-612.
[174] B.L. Hood, M.M. Darfler, T.G. Guiel, B. Furusato, D.A. Lucas, B.R. Ringeisen, I.A. Sesterhenn,
T.P. Conrads, T.D. Veenstra, D.B. Krizman, Mol. Cell. Proteomics, 4 (2005) 1741-1753.
[175] A.J. Patwardhan, E.F. Strittmatter, G.C. David, R.D. Smith, M.G. Pallavicini, Proteomics, 6
(2006) 2903-2915.
[176] O.A. Mirgorodskaya, Y.P. Kozmin, M.I. Titov, R. Korner, C.P. Sonksen, P. Roepstorff, Rapid
Commun. Mass Spectrom., 14 (2000) 1226-1232.
[177] C. Fenselau, Journal of Chromatography B-Analytical Technologies in the Biomedical and Life
Sciences, 855 (2007) 14-20.
[178] C. Fenselau, X.D. Yao, J. Proteome Res., 8 (2009) 2140-2143.
[179] X.D. Yao, C. Afonso, C. Fenselau, J. Proteome Res., 2 (2003) 147-152.
[180] S. Julka, F. Regnier, J. Proteome Res., 3 (2004) 350-363.
[181] M. Miyagi, K.C.S. Rao, Mass Spectrom. Rev., 26 (2007) 121-136.
[182] Stewart, II, T. Thomson, D. Figeys, Rapid Commun. Mass Spectrom., 15 (2001) 2456-2465.
[183] M. Schnolzer, P. Jedrzejewski, W.D. Lehmann, Electrophoresis, 17 (1996) 945-953.
[184] K.J. Reynolds, X.D. Yao, C. Fenselau, J. Proteome Res., 1 (2002) 27-33.
[185] R. Niles, H.E. Witkowska, S. Allen, S.C. Hall, S.J. Fisher, M. Hardt, Anal. Chem., 81 (2009)
2804-2809.
[186] K.L. Johnson, D.C. Muddiman, J. Am. Soc. Mass Spectrom., 15 (2004) 437-445.
[187] C.J. Mason, T.M. Therneau, J.E. Eckel-Passow, K.L. Johnson, A.L. Oberg, J.E. Olson, K.S.
Nair, D.C. Muddiman, H.R. Bergen, Mol. Cell. Proteomics, 6 (2007) 305-318.
[188] A. Ramos-Fernandez, D. Lopez-Ferrer, J. Vazquez, Mol. Cell. Proteomics, 6 (2007) 1274-1286.
[189] J.L. Capelo, R.J. Carreira, L. Fernandes, C. Lodeiro, H.M. Santos, J. Simal-Gandara, Talanta, 80
(2010) 1476-1486.
[190] A. Staes, H. Demol, J. Van Damme, L. Martens, J. Vandekerckhove, K. Gevaert, J. Proteome
Res., 3 (2004) 786-791.
[191] K. Podwojski, M. Eisenacher, M. Kohl, M. Turewicz, H.E. Meyer, J. Rahnenfuhrer, C. Stephan,
Expert Review of Proteomics, 7 (2010) 249-261.
[192] R. Chaerkady, A. Pandey, Proteomics Clinical Applications, 1 (2007) 1080-1089.

General Introduction
64
[193] S.A. Gerber, J. Rush, O. Stemman, M.W. Kirschner, S.P. Gygi, Proc. Natl. Acad. Sci. U. S. A.,
100 (2003) 6940-6945.
[194] D.S. Kirkpatrick, S.A. Gerber, S.P. Gygi, Methods, 35 (2005) 265-273.
[195] J. Griffiths, Analytical Chemistry, 80 (2008) 5678-5683.
[196] F.W. McLafferty, Proceedings of the National Academy of Sciences of the United States of
America, 105 (2008) 18088-18089.
[197] C. Dass, Fundamentals of Contemporary Mass Spectrometry, 1st ed., John Wiley & Sons, Inc.,
Hoboken, New Jersey (USA), 2007.
[198] J.H. Gross, Mass Spectrometry: A Textbook, 1st ed., Springer-Verlag Berlin, Heidelberg
(Germany), 2004.
[199] R. Sleeman, J.F. Carter, Mass Spectrometry: Overview, in: Encyclopedia of Analytical Science,
Elsevier Academic Press, 2005, pp. 337-344.
[200] E.d. Hoffmann, V. Stroobant, Mass Spectrometry: Principles and Applications, 3rd ed., John
Wiley & Sons Ltd, Chichester (England), 2007.
[201] A.G. Harrison, R.J. Cotter, Methods in Enzymology, 193 (1990) 3-37.
[202] D.J. Harvey, Mass Spectrometry: Ionization Methods Overview, in: Encyclopedia of Analytical
Science, Elsevier Academic Press, 2005, pp. 350-359.
[203] K.R. Jennings, G.G. Dolnikowski, Methods in Enzymology, 193 (1990) 37-61.
[204] J.H. Futrell, International Journal of Mass Spectrometry, 200 (2000) 495-508.
[205] P. Hernandez, M. Muller, R.D. Appel, Mass Spectrom. Rev., 25 (2006) 235-254.
[206] A.K. Shukla, J.H. Futrell, J. Mass Spectrom., 35 (2000) 1069-1090.
[207] J.J. Coon, J.E.P. Syka, J. Shabanowitz, D.F. Hunt, Biotechniques, 38 (2005) 519-523.
[208] J.J. Coon, Analytical Chemistry, 81 (2009) 3208-3215.
[209] B. Domon, R. Aebersold, Science, 312 (2006) 212-217.
[210] D.W. Koppenaal, C.J. Barinaga, M.B. Denton, R.P. Sperline, G.M. Hieftje, G.D. Schilling, F.J.
Andrade, J.H. Barnes, Analytical Chemistry, 77 (2005) 418A-427A.
[211] G.D. Schilling, F.J. Andrade, J.H. Barnes, R.P. Sperline, M.B. Denton, C.J. Barinaga, D.W.
Koppenaal, G.M. Hieftje, Analytical Chemistry, 79 (2007) 7662-7668.
[212] S. Evans, Methods in Enzymology, 193 (1990) 61-86.
[213] R. Aebersold, M. Mann, Nature, 422 (2003) 198-207.
[214] X.M. Han, A. Aslanian, J.R. Yates, Curr. Opin. Chem. Biol., 12 (2008) 483-490.
[215] T. Nilsson, M. Mann, R. Aebersold, J.R. Yates, A. Bairoch, J.J.M. Bergeron, Nature Methods, 7
(2010) 681-685.
[216] B. Canas, D. Lopez-Ferrer, A. Ramos-Fernandez, E. Camafeita, E. Calvo, Brief Funct Genomic
Proteomic, 4 (2006) 295-320.
[217] C.H. Chen, Analytica Chimica Acta, 624 (2008) 16-36.
[218] J.R. Yates, C.I. Ruse, A. Nakorchevsky, Annu. Rev. Biomed. Eng., 11 (2009) 49-79.

Chapter I
65
[219] R.B. Cole, Electrospray and MALDI Mass Spectrometry: Fundamentals, Instrumentation,
Practicalities, and Biological Applications, 2nd ed., John Wiley & Sons, Inc., Hoboken, New Jersey
(USA), 2010.
[220] M. Dole, L.L. Mack, R.L. Hines, J. Chem. Phys., 49 (1968) 2240-2249.
[221] J. Fenn, J Biomol Tech, 13 (2002) 101-118.
[222] M. Yamashita, J.B. Fenn, J. Phys. Chem., 88 (1984) 4451-4459.
[223] M. Yamashita, J.B. Fenn, J. Phys. Chem., 88 (1984) 4671-4675.
[224] C.K. Meng, M. Mann, J.B. Fenn, Z. Phys. D-Atoms Mol. Clusters, 10 (1988) 361-368.
[225] J.B. Fenn, M. Mann, C.K. Meng, S.F. Wong, C.M. Whitehouse, Science, 246 (1989) 64-71.
[226] R.D. Smith, J.A. Loo, C.G. Edmonds, C.J. Barinaga, H.R. Udseth, Analytical Chemistry, 62
(1990) 882-899.
[227] C.G. Edmonds, R.D. Smith, Methods in Enzymology, 193 (1990) 412-431.
[228] R. Bakhtiar, R.W. Nelson, Biochemical Pharmacology, 59 (2000) 891-905.
[229] W.M.A. Niessen, Mass Spectrometry: Electrospray, in: Encyclopedia of Analytical Science,
Elsevier Academic Press, 2005, pp. 373-379.
[230] S.A. Hofstadler, R. Bakhtiar, R.D. Smith, J. Chem. Educ., 73 (1996) A82-A88.
[231] P. Kebarle, U.H. Verkerk, Mass Spectrom. Rev., 28 (2009) 898-917.
[232] M.R. Emmett, R.M. Caprioli, Journal of the American Society for Mass Spectrometry, 5 (1994)
605-613.
[233] M.S. Wilm, M. Mann, International Journal of Mass Spectrometry, 136 (1994) 167-180.
[234] M. Wilm, M. Mann, Analytical Chemistry, 68 (1996) 1-8.
[235] R. Aebersold, D.R. Goodlett, Chem. Rev., 101 (2001) 269-295.
[236] M. Karas, D. Bachmann, F. Hillenkamp, Analytical Chemistry, 57 (1985) 2935-2939.
[237] K. Tanaka, H. Waki, Y. Ido, S. Akita, Y. Yoshida, T. Yoshida, T. Matsuo, Rapid Commun.
Mass Spectrom., 2 (1988) 151-153.
[238] M. Karas, F. Hillenkamp, Analytical Chemistry, 60 (1988) 2299-2301.
[239] R.C. Beavis, B.T. Chait, Matrix-assisted laser desorption ionization mass-spectrometry of
proteins, in: High Resolution Separation and Analysis of Biological Macromolecules, Pt A, Academic
Press Inc, San Diego, 1996, pp. 519-551.
[240] J.T. Stults, Current Opinion in Structural Biology, 5 (1995) 691-698.
[241] J.K. Lewis, J. Wei, G. Siuzdak, Matrix-assisted Laser Desorption/Ionization Mass Spectrometry
in Peptide and Protein Analysis, in: Encyclopedia of Analytical Chemistry, John Wiley & Sons Ltd,
Chichester, 2000, pp. 5880-5894.
[242] A. El-Aneed, A. Cohen, J. Banoub, Appl. Spectrosc. Rev., 44 (2009) 210-230.
[243] R. Zenobi, R. Knochenmuss, Mass Spectrom. Rev., 17 (1998) 337-366.
[244] M. Karas, R. Kruger, Chem. Rev., 103 (2003) 427-439.
[245] K. Dreisewerd, Chem. Rev., 103 (2003) 395-425.
[246] R. Knochenmuss, R. Zenobi, Chem. Rev., 103 (2003) 441-452.

General Introduction
66
[247] R. Knochenmuss, Analyst, 131 (2006) 966-986.
[248] F. Hillenkamp, J. Peter-Katalinic, MALDI-MS A Practical Guide to Instrumentation, Methods
and Applications, 1st ed., Wiley-VHC, Weinheim, Germany, 2007.
[249] M.W. Duncan, H. Roder, S.W. Hunsucker, Briefings in Functional Genomics & Proteomics, 7
(2008) 355-370.
[250] F. Hillenkamp, M. Karas, Methods in Enzymology, 193 (1990) 280-295.
[251] D.C. Muddiman, R. Bakhtiar, S.A. Hofstadler, R.D. Smith, J. Chem. Educ., 74 (1997) 1288-
1292.
[252] D.J. Harvey, Mass Spectrometry: Matrix-Assisted Laser Desorption/Ionization, in:
Encyclopedia of Analytical Science, Elsevier Academic Press, 2005, pp. 386-397.
[253] S. Batoy, E. Akhmetova, S. Miladinovic, J. Smeal, C.L. Wilkins, Appl. Spectrosc. Rev., 43
(2008) 485-550.
[254] M. Mann, R.C. Hendrickson, A. Pandey, Annual Review of Biochemistry, 70 (2001) 437-473.
[255] M. Kussmann, E. Nordhoff, H. RahbekNielsen, S. Haebel, M. RosselLarsen, L. Jakobsen, J.
Gobom, E. Mirgorodskaya, A. KrollKristensen, L. Palm, P. Roepstorff, J. Mass Spectrom., 32 (1997)
593-601.
[256] S.L. Cohen, B.T. Chait, Analytical Chemistry, 68 (1996) 31-37.
[257] M.G. Pluskal, Nature Biotechnology, 18 (2000) 104-105.
[258] B.A. Mamyrin, International Journal of Mass Spectrometry, 206 (2001) 251-266.
[259] M. Guilhaus, Mass Spectrometry: Time-of-Flight, in: Encyclopedia of Analytical Science,
Elsevier Academic Press, 2005, pp. 412-423.
[260] C.S. Lane, Cellular and Molecular Life Sciences, 62 (2005) 848-869.
[261] M.L. Vestal, P. Juhasz, S.A. Martin, Rapid Commun. Mass Spectrom., 9 (1995) 1044-1050.
[262] R.M. Whittal, L. Li, Analytical Chemistry, 67 (1995) 1950-1954.
[263] R.S. Brown, J.J. Lennon, Analytical Chemistry, 67 (1995) 1998-2003.
[264] H. Steen, M. Mann, Nat. Rev. Mol. Cell Biol., 5 (2004) 699-711.
[265] T. Liu, M.E. Belov, N. Jaitly, W.J. Qian, R.D. Smith, Chem. Rev., 107 (2007) 3621-3653.
[266] G.P. McMahon, Mass Spectrometry: Peptides and Proteins, in: Encyclopedia of Analytical
Science, Elsevier Academic Press, 2005, pp. 501-509.
[267] A.I. Nesvizhskii, O. Vitek, R. Aebersold, Nature Methods, 4 (2007) 787-797.
[268] J. Reinders, U. Lewandrowski, J. Moebius, Y. Wagner, A. Sickmann, Proteomics, 4 (2004)
3686-3703.
[269] D. Fenyo, R.C. Beavis, Mass Spectrom. Rev., 27 (2008) 1-19.
[270] W.J. Henzel, T.M. Billeci, J.T. Stults, S.C. Wong, C. Grimley, C. Watanabe, Proceedings of the
National Academy of Sciences of the United States of America, 90 (1993) 5011-5015.
[271] P. James, M. Quadroni, E. Carafoli, G. Gonnet, Biochemical and Biophysical Research
Communications, 195 (1993) 58-64.
[272] M. Mann, P. Hojrup, P. Roepstorff, Biological Mass Spectrometry, 22 (1993) 338-345.

Chapter I
67
[273] D.J.C. Pappin, P. Hojrup, A.J. Bleasby, Curr. Biol., 3 (1993) 327-332.
[274] J.R. Yates, S. Speicher, P.R. Griffin, T. Hunkapiller, Analytical Biochemistry, 214 (1993) 397-
408.
[275] N.D. Padliya, T.D. Wood, Analytica Chimica Acta, 627 (2008) 162-168.
[276] R. Kratzer, C. Eckerskorn, M. Karas, F. Lottspeich, Electrophoresis, 19 (1998) 1910-1919.
[277] E. Krause, H. Wenschuh, P.R. Jungblut, Analytical Chemistry, 71 (1999) 4160-4165.
[278] R.G. Sadygov, D. Cociorva, J.R. Yates, Nature Methods, 1 (2004) 195-202.
[279] B. Spengler, D. Kirsch, R. Kaufmann, E. Jaeger, Rapid Commun. Mass Spectrom., 6 (1992)
105-108.
[280] R. Kaufmann, B. Spengler, F. Lutzenkirchen, Rapid Commun. Mass Spectrom., 7 (1993) 902-
910.
[281] R. Kaufmann, D. Kirsch, B. Spengler, Int. J. Mass Spectrom. Ion Process., 131 (1994) 355-385.
[282] B. Spengler, J. Mass Spectrom., 32 (1997) 1019-1036.
[283] D. Suckau, A. Resemann, M. Schuerenberg, P. Hufnagel, J. Franzen, A. Holle, Anal. Bioanal.
Chem., 376 (2003) 952-965.
[284] J.R. Yates, Electrophoresis, 19 (1998) 893-900.
[285] J. Seidler, N. Zinn, M.E. Boehm, W.D. Lehmann, Proteomics, 10 (2010) 634-649.
[286] S. Carr, R. Aebersold, M. Baldwin, A. Burlingame, K. Clauser, A. Nesvizhskii, Mol. Cell.
Proteomics, 3 (2004) 531-533.
[287] T.J. Mason, Prog. Biophys. Mol. Biol., 93 (2007) 166-175.
[288] T.J. Mason, J.P. Lorimer, Applied Sonochemistry: Uses of Power Ultrasound in Chemistry and
Processing, 1st ed., Wiley-VCH, Weinheim, 2002.
[289] F.P. Capote, M.D.L. de Castro, Anal. Bioanal. Chem., 387 (2007) 249-257.
[290] M.D.L. de Castro, F.P. Capote, Analytical Applications of Ultrasound, 1st ed., Elsevier,
Amsterdam, 2007.
[291] F. Priego-Capote, L. de Castro, Trac-Trends in Analytical Chemistry, 23 (2004) 644-653.
[292] M.D.L. de Castro, F. Priego-Capote, Talanta, 72 (2007) 321-334.
[293] J.L. Capelo, A.M. Mota, Curr. Anal. Chem., 1 (2005) 193-201.
[294] H.M. Santos, J.L. Capelo, Talanta, 73 (2007) 795-802.
[295] K.S. Suslick, S.E. Skrabalak, Sonocatalysis, in: Handbook of Heterogeneous Catalysis, Wiley-
VHC, Weinheim, 2008.
[296] T.J. Mason, Chem. Soc. Rev., 26 (1997) 443-451.
[297] K.S. Suslick, D.A. Hammerton, R.E. Cline, J. Am. Chem. Soc., 108 (1986) 5641-5642.
[298] Y.T. Didenko, W.B. McNamara, K.S. Suslick, J. Am. Chem. Soc., 121 (1999) 5817-5818.
[299] K.S. Suslick, Sci. Am., 260 (1989) 80-86.
[300] K.S. Suslick, Science, 247 (1990) 1439-1445.

General Introduction
68
[301] K.S. Suslick, Y. Didenko, M.M. Fang, T. Hyeon, K.J. Kolbeck, W.B. McNamara, M.M.
Mdleleni, M. Wong, Philosophical Transactions of the Royal Society of London Series a-
Mathematical Physical and Engineering Sciences, 357 (1999) 335-353.
[302] K.S. Suslick, Sonochemistry, in: Kirk-Othmer Encyclopedia of Chemical Technology, J. Wiley
& Sons, New York, 1998.
[303] T.J. Mason, A.J. Cobley, J.E. Graves, D. Morgan, Ultrason. Sonochem., (2010) In press,
doi:10.1016/j.ultsonch.2010.1005.1008.
[304] J.P. Lorimer, T.J. Mason, Chem. Soc. Rev., 16 (1987) 239-274.
[305] B. Toukoniitty, J.P. Mikkola, D.Y. Murzin, T. Salmi, Applied Catalysis a-General, 279 (2005)
1-22.
[306] J.L. Capelo, C. Maduro, C. Vilhena, Ultrason. Sonochem., 12 (2005) 225-232.
[307] F.M. Cordeiro, R.J. Carreira, R. Rial-Otero, M.G. Rivas, I. Moura, J.L. Capelo, Rapid Commun.
Mass Spectrom., 21 (2007) 3269-3278.
[308] R.J. Carreira, R. Rial-Otero, D. Lopez-Ferrer, C. Lodeiro, J.L. Capelo, Talanta, 76 (2008) 400-
406.
[309] J.L. Capelo, M.M. Galesio, G.M. Felisberto, C. Vaz, J.C. Pessoa, Talanta, 66 (2005) 1272-1280.
[310] R.J. Carreira, F.M. Cordeiro, A.J. Moro, M.G. Rivas, R. Rial-Otero, E.M. Gaspar, I. Moura, J.L.
Capelo, J. Chromatogr. A, 1153 (2007) 291-299.
[311] H.M. Santos, R. Carreira, M.S. Diniz, M.G. Rivas, C. Lodeiro, J.J.G. Moura, J.L. Capelo,
Talanta, 81 (2010) 55-62.
[312] D. Lopez-Ferrer, T.H. Heibeck, K. Petritis, K.K. Hixson, W. Qian, M.E. Monroe, A.
Mayampurath, R.J. Moore, M.E. Belov, D.G. Camp, R.D. Smith, J. Proteome Res., 7 (2008) 3860-
3867.
[313] R.J. Carreira, C. Lodeiro, M.S. Diniz, I. Moura, J.L. Capelo, Proteomics, 9 (2009) 4974-4977.
[314] R. Rial-Otero, R.J. Carreira, F.M. Cordeiro, A.J. Moro, L. Fernandes, I. Moura, J.L. Capelo, J.
Proteome Res., 6 (2007) 909-912.
[315] R.J. Carreira, C. Lodeiro, M. Reboiro-Jato, D. Glez-Pena, F. Fdez-Riverola, J.L. Capelo,
Talanta, 82 (2010) 587-593.
[316] P. Bermejo, J.L. Capelo, A. Mota, Y. Madrid, C. Camara, Trac-Trends in Analytical Chemistry,
23 (2004) 654-663.
[317] E.V. Rokhina, P. Lens, J. Virkutyte, Trends Biotechnol., 27 (2009) 298-306.
[318] S. Barton, C. Bullock, D. Weir, Enzyme. Microb. Technol., 18 (1996) 190-194.
[319] B. Ozbek, K.O. Ulgen, Process Biochem., 35 (2000) 1037-1043.
[320] J.L. Capelo, P. Ximenez-Embun, Y. Madrid-Albarran, C. Camara, Anal. Chem., 76 (2004) 233-
237.
[321] M. Siwek, A.B. Noubar, J. Bergmann, B. Niemeyer, B. Galunsky, Anal. Bioanal. Chem., 384
(2006) 244-249.
[322] J. Song, W.Y. Tao, W.Y. Chen, Journal of Cleaner Production, 16 (2008) 591-597.

Chapter I
69
[323] S.L. Ovsianko, E.A. Chernyavsky, V.T. Minchenya, I.E. Adzerikho, V.M. Shkumatov, Ultrason.
Sonochem., 12 (2005) 219-223.
[324] M.T. Zhong, X.W. Ming, P.W. Su, Q.K. Ju, Ultrason. Sonochem., 11 (2004) 399-404.
[325] G. Vale, S. Pereira, A. Mota, L. Fonseca, J.L. Capelo, Talanta, 74 (2007) 198-205.


71
PART II


Chapter II
73
Chapter II
NEW FINDINGS FOR IN-GEL DIGESTION ACCELERATED
BY HIGH INTENSITY FOCUSED ULTRASOUND FOR
PROTEIN IDENTIFICATION BY MATRIX-ASSISTED LASER
DESORPTION/IONIZATION TIME-OF-FLIGHT MASS
SPECTROMETRY
Published in:
R. J. Carreira, F. M. Cordeiro, A. J. Moro, M. G. Rivas, R. Rial-Otero, E. M. Gaspar, I.
Moura, J. L. Capelo
Journal of Chromatography A, 2007, 1153, 291–299


Chapter II
75
II.1. Abstract
New findings regarding the sample treatment based on high-intensity focused ultrasound (HIFU) for
protein digestion after polyacrylamide gel electrophoresis separation are presented. The following
variables were studied: (i) sample volume; (ii) sonotrode diameter; (iii) protein denaturation before
enzymatic digestion; (iv) cooling; (v) enzyme concentration; and (vi) protein concentration. Results
show that confident protein identification could be achieved after protein separation by gel
electrophoresis through peptide mass fingerprint (PMF) in a volume as low as 25 µL. The time needed
was less than 2 min and no cooling was necessary. The importance of the sonotrode diameter was
negligible. On the other hand, protein denaturation before ultrasonication was a trade-off for the
success of the procedure here described. The protein coverage increased from 5 to 30 %, and the
number of peptides matching the proteins was also increased in a percentage ranging 10 – 100 % when
protein reduction and alkylation were performed before enzymatic digestion with the classical
overnight treatment, or the proposed HIFU procedure. The minimum amount of protein that can be
identified using the HIFU sample treatment by matrix-assisted laser desorption ionization time-of-
flight mass spectrometry (MALDI-TOF-MS) was 0.06 µg. The lower concentration of trypsin
successfully used to obtain an adequate protein digestion was 3.6 µg/mL.

New findings for in-gel enzymatic digestion of proteins accelerated by HIFU
76
II.2. Introduction
Proteins used as biomarkers are changing (i) disease screening/treatment and (ii) strategies for
developing new drugs [1]. In addition, emerging applications of protein biomarkers such as bacterial
or virus identification [2-4] can help significantly to reduce morbidity and mortality across the globe.
Furthermore, protein biomarkers discovery can help governments to beat bioterrorism since bacteria
are the common weapons used by bioterrorists. Protein biomarkers identification can actually be
accomplished by three different strategies: (i) proteins are separated and isolated by gel
electrophoresis and then subjected to enzymatic digestion in situ in the gel to form a pool of peptides
that are used later to identify the proteins [5]; (ii) mixtures of proteins are digested in-solution using
enzymes and later the peptides produced are separated by liquid chromatography and used to identify
the proteins [6]; and (iii) the solution containing the protein mixture is separated in a chromatographic
column, then the isolated proteins are passed through a column packed with immobilized enzyme and
the peptides formed are used for protein identification [7]. Identification of protein biomarkers can be
performed with the peptides obtained through one of the three approaches described above by liquid
chromatography-tandem mass spectrometry (LC-MS/MS) [8]. Yet, the Achilles Heel of LC-MS/MS is
the high cost of the analysis. An alternative to LC-MS/MS is matrix assisted laser
desorption/ionization time-of-flight mass spectrometry (MALDI-TOF-MS), which can be routinely
used in conjunction with the first aforementioned sample treatment for protein identification, this is,
the in-gel enzymatic protein digestion. In addition, the second and third sample treatments also
described above can be used with MALDI-TOF-MS in conjunction with preparative chromatography.
In MALDI-TOF-MS, the samples are sublimated and ionized from a crystalline matrix [3, 9] and then
accelerated by electric potentials into a mass analyzer. Protein identification is obtained by comparison
between the experimental mass values from the peptides produced after protein digestion and those
produced by the in silico, theoretical, digestion, which are included in a particular database. In most
cases, the pool of peptides formed after protein enzymatic digestion is enough for unambiguous
protein identification. This methodology is known as peptide mass fingerprinting (PMF) [10]. The
PMF of any protein is identified using special search programs, known as search engines, such as the
MASCOT [http://www.matrixscience.com/search_form_select.html], or the PROTEIN
PROSPECTOR [http://prospector.ucsf.edu/].
Modern protocols for in-gel protein digestion have been drastically changed after the introduction of
high-intensity focused ultrasound (HIFU) to enhance the enzymatic activity. This is a recent developed
technology in phase of internationalization [8, 11]. With the HIFU methodology enzymatic protein
digestion is performed in seconds, while former approaches needed from 4 to 12 h to complete the
enzymatic process. Although the HIFU methodology has proven its efficiency in many ways, it is still
a novel procedure that deserves to be further investigated.

Chapter II
77
As can be seen in Figure II.1, the classic sample treatment for protein identification is tedious and
time-consuming. The first approach for the application of HIFU to protein identification procedures
based on PMF was focused on the reduction of the enzymatic digestion time from overnight to
seconds [8]. For simplification of the sample handling with HIFU, the elimination of the reduction and
alkylation steps, which are performed during 1 h to facilitate protein digestion, was evaluated.
In the present work, different variables such as: (i) ultrasonication amplitude; (ii) ultrasonication
power; and (iii) total sample volume [12-14] are investigated, but this time without performing the
alkylation and reduction steps in the treatment for protein identification by MALDI-TOF-MS.
Furthermore, recent achievements suggest that even the shape of the sample container can affect
effectiveness of ultrasonication [15]. We demonstrate that a minimum volume is necessary to obtain
the best performance with the HIFU sample treatment and that the alkylation and reduction steps
cannot be suppressed. Furthermore, the importance of variables such as probe diameter is highlighted.
Finally, the parameters studied were tested on a biological sample, and the adenylylsulfate reductase
alpha subunit from Desulfovibrio desulfuricans ATCC 27774 was identified from a complex protein
mixture.
II.3. Experimental
II.3.1. Apparatus
Gel electrophoresis was performed with a Bio-Rad (Hercules, CA, USA) model Powerpac basic
following the manufacturer’s instructions. Protein digestion was performed in safe-lock tubes of 0.5
mL from Eppendorf (Hamburg, Germany). A vacuum concentrator centrifuge from UniEquip
(Martinsried, Germany) model UNIVAPO 100H with a refrigerated vacuum pump model Unijet II
was used for (i) sample drying and (ii) sample concentration. Biogen Cientifica (Madrid, Spain)
centrifuges and vortex models Sky Line and Spectrafuge Mini were used throughout the sample
treatment, when necessary. An ultrasonic cell disruptor from Hielscher Ultrasonics (Teltow, Germany)
model UP 50H was used to accelerate enzymatic protein digestions. An ultrasonic bath from Elma
(Singen, Germany), model Transsonic TI-H-5, was used to help peptide and protein solubilization. An
incubator from P-Selecta (Barcelona, Spain) was used to perform classical protein enzymatic
digestions. A Simplicity™ 185 from Millipore (Milan, Italy) was used to obtain Milli-Q water
throughout all the experiments.

New findings for in-gel enzymatic digestion of proteins accelerated by HIFU
78
Figure II.1: Classic sample treatment along with the intended effects of each step used for protein
identification by PMF. Reduction and alkylation steps are performed between steps 8 and 9 to increase
the sequence coverage.

Chapter II
79
II.3.2. Standards and reagents
A protein mixture containing glycogen phosphorylase b (97 kDa), bovine serum albumin (BSA; 66
kDa), ovalbumin (45 kDa), carbonic anhydrase (30 kDa), trypsin inhibitor (20.1 kDa) and α-
lactalbumin (14.4 kDa), was purchased from Amersham Biosciences (Buckinghamshire, UK, part
number 17-0446-01). BSA (> 97 %) and trypsin proteomics grade were purchased from Sigma
(Steinheim, Germany). All proteins were used without further purification. α-Cyano-4-
hydroxycinnamic acid (α-CHCA) puriss for MALDI-MS from Fluka (Buchs, Switzerland) was used
as MALDI matrix and Sequazyme Peptide Mass Standards Kit (part number P2-3143-00) from PE
Biosystems (Foster City, USA) was used as mass calibration standard for MALDI-TOF-MS.
The following reagents were used for gel preparation and protein digestion: methanol, acetonitrile,
iodoacetamide (IAA) and DL-dithiothreitol (DTT) (99 %) were purchased from Sigma; formic acid
for mass spectrometry, acetic acid (> 99.5 %), ammonium bicarbonate (> 99.5 %) were from Fluka;
bromophenol blue, glycine, glycerol and trifluoroacetic acid (TFA, 99 %) were from Riedel-de Haën
(Seelze, Germany); coomassie blue R-250, β-mercaptoethanol (> 99 %), sodium dodecyl sulfate
(SDS) from Merck (Darmstadt, Germany); and α,α,α-tris-(hydroxymethyl)methylamine +
tris(hydroxymethyl)aminomethane (Tris-HCl), ultrapure grade from Aldrich (Steinheim, Germany).
II.3.3. Sample treatment
Protein samples between 3.7 and 0.06 µg were dissolved in sample buffer for SDS-polyacrylamide gel
electrophoresis (PAGE) [16]. Since protocols for protein identification require many different steps,
the classic sample treatment used throughout this work is schematically depicted in Figure II.1 along
with the intended effects of each individual step. The classic sample treatment for protein digestion
differs from the HIFU protocol in the incubation time necessary for the enzymatic digestion: overnight
versus 2 min, respectively. HIFU was performed with the 0.5 mm or 1 mm sonotrode at 70 % of
amplitude.
II.3.4. Protein samples from complex mixtures
Desulfovibrio desulfuricans ATCC 27774 was cultured in lactate-nitrate medium as described
previously by Liu and Peck [17]. The cell culture was centrifuged during 30 min at 3000 x g to
separate the cells from the medium. The pellet was resuspended in 10 mM Tris–HCl (1 mL buffer/ 1
mg cells), pH 7.6, and ruptured in a French press at 9000 psi. The bacterial extract was centrifuged at
19 000 x g during 30 min and ultracentrifuged at 180 000 x g during 60 min. The soluble extract
obtained was subjected to an anionic exchange column (DEAE 52, Whatman). The fraction eluted
between 100 and 250 mM Tris–HCl was analyzed. Two aliquots containing 0.9 µg of total protein

New findings for in-gel enzymatic digestion of proteins accelerated by HIFU
80
were run in a 12.5 % polyacrylamide gel and then, in-gel digestion of the protein observed at ca. 75
kDa was performed with the HIFU protocol. HIFU was performed with the 0.5 mm sonotrode
diameter at 70 % of amplitude during 2 min.
II.3.5. Matrix formulation
Prior to MALDI-TOF-MS analysis the sample was mixed with the matrix solution. α-CHCA matrix
was used throughout this work and was prepared as follows: 10 mg of α-CHCA were dissolved in 1
mL of 50 % acetonitrile/ 0.1 % TFA solution. Then, 10 µL of the aforementioned matrix solution were
mixed with 10 µL of sample and the mixture was stirred in a vortex during 30 s. One microliter of
each sample was spotted onto the 100 well MALDI-TOF-MS sample plate and allowed to dry.
II.3.6. MALDI-TOF-MS analysis
A MALDI-TOF-MS instrument (Applied Biosystems, Foster City, USA) model Voyager DE-PRO™
Biospectrometry™ Workstation, equipped with a nitrogen laser radiating at 337 nm was used to obtain
the peptide mass fingerprints. MALDI mass spectra were acquired as recommended by the
manufacturer. Measurements were performed in the reflectron positive ion mode, with 20 kV of
accelerating voltage, 75.1 % grid voltage, and 0.002 % guide wire with a delay time of 140 ns. Two
close-external calibrations were performed with the monoisotopic peaks of des-Arg1-Bradykinin
(904.4681m/z), Angiotensin I (1296.6853 m/z), Glu1-Fibrino-peptide B (1570.6774 m/z), and
Neurotensin (1672.9175 m/z). Mass spectrometry analysis of each sample was based on the average of
500 laser shots. Peptide mass fingerprints were searched with the MASCOT and PROTEIN
PROSPECTOR search engines with the following parameters: (i) for MASCOT; variable
modifications: oxidation (M); fixed modifications: carbamidomethyl (C); (ii) for PROTEIN
PROSPECTOR; cys modified by: unmodified/carbamidomethylation; MW of protein: all; possible
modifications mode: oxidation of M. For both search engines, the Swiss-Prot database, one missed
cleavage, and a peptide tolerance up to 100 ppm after close-external calibration were used. A match
was considered successful when the protein identification score was the highest and was outside of the
random interval.
II.4. Results and discussion
The handling of the HIFU technology is complicated and requires minimum skills, otherwise non-
desired reactions involving radicals caused by the cavitation phenomena will take place [18]. The
ultrasonic waves crossing a liquid induce the generation, growth, oscillation, splitting and implosion of
numerous tiny gas bubbles named cavitation bubbles. When a cavitation bubble collapses near the
surface of a solid, such as the gel containing proteins, micro-jets of solvent propagate toward the

Chapter II
81
surface at velocities higher than 100 ms−1
. This phenomenon has important consequences in the
performance of the enzymatic treatment. On the one hand, pitting and mechanical erosion of the gel
surface results in gel rupture and, as consequence, in a decrease of the gel size. Hence, the total area of
the gel exposed to the solvent is higher, and zones that otherwise were not exposed are now subjected
to the direct enzymatic action. On the other hand, research on ultrasonic applications for medicine and
drug delivery had estimated a pressure around 60 MPa at the tip of the probe, generated by the
cavitation bubble collapse, which means that liquid jets may act as microsyringes, helping the enzyme
to penetrate inside the gel and improving the enzymatic digestion [19]. Nevertheless, the inherent
advantages of HIFU may be at the same time its drawbacks. Thus, when a liquid is under the influence
of an ultrasonic field an aerosol is formed and small drops of liquid spread through the walls of the
container. When a large volume is ultrasonicated the aerosol formation is not a problem, since the
amount of liquid dispersed is negligible. However, when a small volume is used, such as the one in
this procedure, 25 µL, aerosol formation becomes an important problem, since a considerable fraction
of the liquid is deposited over the walls of the container and therefore, is not affected by ultrasound.
Bearing in mind the aforementioned problem, two different volumes were assessed to study the
enhancement of enzymatic digestion with HIFU: 100 µL and 25 µL. Trypsin concentration was kept
constant during this set of experiments at 14.4 µg/mL. Neither reduction nor alkylation was performed
in the sample treatment. The handling of both volumes was slightly different. The higher volume
allowed continuous ultrasonication for at least 2 min. After the first 60 s, ultrasonication was stopped
during 1 min to avoid excess sample heating. The manipulation of the smallest volume, 25 µL, was
troublesome and it was performed as follows: ultrasonication was applied in intervals of 20 s, and
stopped due to the excessive spread of liquid towards the eppendorf walls making ultrasonication
impossible. To overcome this problem, the eppendorf was closed after each 20 s of ultrasonication and
centrifuged during 5 s, allowing the gel piece to be covered again with the buffer media. This
procedure was repeated during a total ultrasonication time of 2 min. Results are shown in Table II.1.
As can be seen, the number of matched peptides and the sequence coverage obtained are slightly
higher when the sample treatment with HIFU was applied in a total volume of 100 µL. This trend was
not observed for carbonic anhydrase, in which the sequence coverage was slightly lower with a
volume of 100 µL. It must be stressed that protein identification was possible regardless of the sample
volume used, which indicates the effectiveness of the sample treatment when applied in either 25 µL
or 100 µL. It must also be pointed out that the number of peptides obtained was virtually the same for
both the classic method and the HIFU approach, as shown in Figure II.2. This is an important result,
because it shows that the number of missed cleavages was similar with both procedures (data not
shown). A missed cleavage occurs when the enzyme fails one cleavage site between two amino acid
residues in the polypeptide chain. Furthermore, the sample treatment can drastically affect the PMF
score and sequence coverage for a given protein digest [20]. So, it must be emphasized that our results
were almost the same regardless the sample treatment used: the classic or the HIFU methodology.

New findings for in-gel enzymatic digestion of proteins accelerated by HIFU
82
Table II.1: Influence of the ultrasonication volume on the (i) number of matched peptides and (ii)
coverage (%) for the in-gel protein enzymatic digestion (n = 2). Proteins were separated by SDS-
PAGE and digested with trypsin by the HIFU procedure. Quantity of protein analyzed: 1.7 µg of
glycogen phosphorylase b; 2.1µg of BSA; 3.7 µg of ovalbumin; 2.1 µg of carbonic anhydrase. HIFU
conditions: 2 min ultrasonication time; 70 %ultrasonication amplitude; 0.5 mm sonotrode diameter.
Trypsin concentration: 14.4 µg /mL. Protein reduction with DTT and alkylation with IAA were not
performed in the sample treatment. (See Figure II.1 for details)
Protein V
(µL)
Peptides
used for
PMF
Intensity
MASCOT PROSPECTOR
Score Coverage
(%)
Matched
Peptides Score
Coverage
(%)
Matched
Peptides
Phosphorylase b 25 37 1.8E5 78 12 13 3305 22 20
100 43 2.4E5 256 33 27 1.4E16 39 29
Albumin 25 29 2.8E5 108 21 12 1.3E06 21 12
100 26 9.8E4 172 24 16 2.0E06 24 16
Ovalbumin 25 28 8.3E4 90 30 8 1.1E09 38 12
100 36 9.4E4 108 36 10 1.3E10 40 14
Carbonic
anhydrase
25 35 2.9E5 203 59 14 1.4E14 59 18
100 28 2.6E5 142 54 10 4.2E09 55 12
Concerning the sequence coverage obtained for the proteins studied, as shown in Table II.1, the results
were lower than expected, below 50 % with the exception of carbonic anhydrase. In addition, α-
lactalbumin was not identified neither using the classic protocol nor using the HIFU procedure (data
not shown). This fact can be explained with the absence of some sample treatment steps, such as (i)
the reduction with DTT and (ii) the alkylation with IAA, which are usually performed in the sample
treatment to break protein disulfide bonds and facilitate the enzymatic performance. These steps were
omitted to assess the ultrasonic efficiency in the sample treatment. As we will see later, when
reduction and alkylation were included in the procedure the sequence coverage was improved, in some
cases by a factor of two (Figure II.3).
Regarding the temperature influence in the sample treatment, no changes were observed in the
efficiency of the procedure when the ultrasonication was performed at room temperature or in an ice
bath. In this set of experiments, neither protein reduction nor protein alkylation was done and HIFU
was performed in a volume of 25 µL and 100 µL. These experiments were carried out with 1.05 µg of
BSA. As can be seen in Table II.2, the number of peptides matching the sequence of BSA was almost
the same regardless the sample treatment used, i.e. with or without the ice bath (test t, P = 0.05). In
addition, the differences in the sequence coverage values obtained as consequence of the changes in
the sample volume were also not significant (test t, P = 0.05). Moreover, the number of matching

Chapter II
83
peptides and the percentage of sequence coverage were virtually the same with both search engines
used: MASCOT or PROTEIN PROSPECTOR.
Figure II.2: MALDI-TOF mass spectra of BSA acquired in the reflectron positive ion mode.
Spectrum a): classical treatment without reduction and alkylation. Spectrum b): HIFU treatment
without reduction and alkylation. Spectrum c): classical treatment with reduction and alkylation.
Spectrum d): HIFU treatment with reduction and alkylation.

New findings for in-gel enzymatic digestion of proteins accelerated by HIFU
84
Table II.2: Influence of temperature on the (i) number of matched peptides and (ii) sequence coverage
(%) obtained for the in-gel enzymatic digestion of 1.05 µg of BSA (n =2). Protein was separated by
SDS-PAGE and digested with trypsin by the HIFU procedure. HIFU conditions: 2 min ultrasonication
time; 70 %ultrasonication amplitude; 0.5 mm sonotrode diameter. Trypsin concentration: 14.4 µg /mL.
Protein reduction with DTT and alkylation with IAA were not performed in the sample treatment. (See
Figure II.1 for details)
Sample volume
(µL) Ice Bath
Peptides used
for PMF
MASCOT PROSPECTOR
Matched
Peptides
Coverage
(%)
Matched
Peptides
Coverage
(%)
25 Yes 32 ± 2 13 ± 1 22 ± 2 13 ± 1 22 ± 2
25 No 33 ± 1 14 ± 1 24 ± 1 14 ± 1 24 ± 1
100 Yes 32 ± 1 14 ± 1 23 ± 2 14 ± 1 23 ± 1
100 No 36 ± 3 14 ± 1 23 ± 2 14 ± 1 23 ± 1
Table II.3: Influence of sonotrode diameter on the (i) number of matched peptides and (ii) sequence
coverage (%) obtained for the in-gel enzymatic digestion of proteins (n=2). Proteins were separated by
SDS-PAGE and digested with trypsin by the HIFU procedure. HIFU conditions: 2 min ultrasonication
time; 70 %ultrasonication amplitude. Trypsin concentration: 3.6 µg /mL. Quantity of protein analyzed:
1.7 µg of glycogen phosphorylase b; 2.1µg of BSA; 3.7 µg of ovalbumin; 2.1 µg of carbonic
anhydrase; 2.0 µg of trypsin inhibitor; 2.9 µg of α-lactalbumin. Neither protein reduction with DTT
nor alkylation with IAA was performed in the sample treatment. (See Figure II.1 for details).
Protein
1 mm tip diameter 0.5 mm tip diameter Classic treatment
Coverage
(%)
Matched
Peptides
Coverage
(%)
Matched
Peptides
Coverage
(%)
Matched
Peptides
Phosphorylase b 28 ± 2 20 ± 3 28 ± 2 20 ± 3 26 ± 1 21 ± 1
BSA 15 ± 2 12 ± 2 21 ± 1 13 ± 1 19 ± 1 14 ± 1
Ovalbumin 40 ± 3 9 ± 1 40 ± 3 9 ± 1 33 ± 1 9 ± 1
Carbonic anhydrase 41 ± 2 13 ± 2 45 ± 1 7 ± 1 50 ± 5 9 ± 1
Trypsin inhibitor 26 ± 2 6 ± 2 35 ± 2 9 ± 2 34 ± 3 9 ± 3
α-lactalbumin - - - - - -
As far as trypsin is concerned, two concentration values were used during the enzymatic digestion to
study the robustness of the procedure: (i) 14.4 µg/mL and (ii) 3.6 µg/mL. The results obtained were
similar and protein identification was possible using the HIFU methodology with both concentrations
(data not shown). Therefore, further experiments were performed with the lower concentration of
trypsin, 3.6 µg/mL.

Chapter II
85
With regard to the probe diameter, it must be highlighted that for the same amplitude setting in the
ultrasonic processor (range: 20 – 100 %), the ultrasound intensity achieved depends on the probe
diameter, which means that when working with the same theoretical percentage of amplitude, 70 % in
this case, the intensity of the cavitation phenomena will be different with the 0.5 mm or the 1 mm
probe. In fact, each probe diameter is designed for a specific working volume: (i) for the 0.5 mm
sonotrode a volume ranging from 10 to 500 µL; and (ii) for the 1 mm sonotrode a volume ranging
from 100 to 5000 µL. Therefore we chose a sample volume of 100 µL to check the performance of
both sonotrodes in the enhancement of the enzymatic reaction. Results are presented in Table II.3 and,
as can be seen, both the sequence coverage and the number of matched peptides were similar for the
treatments with (i) the 1 mm sonotrode; (ii) the 0.5 mm sonotrode; and (iii) the classic procedure. This
means that both sonotrodes can be used. In addition, Table II.3 also shows that the information
obtained with the ultrasonic treatment was similar to the one achieved with the classic sample
treatment. However, it must be kept in mind that for sample volumes lower than 100 µL only the 0.5
mm sonotrode should be used.
Figure II.3: Number of matched peptides and percentage of sequence coverage obtained for the
proteins studied (n = 2). The search engine used was MASCOT. 1) Classic sample treatment without
reduction and alkylation. 2) Classic sample treatment with reduction and alkylation. 3) HIFU sample
treatment without reduction and alkylation. 4) HIFU sample treatment with reduction and alkylation.
HIFU conditions: 2 min ultrasonication time; 70 %ultrasonication amplitude; 0.5 mm sonotrode
diameter. Trypsin concentration: 3.6 µg/mL. Amount of protein analyzed: 1.7 µg of glycogen
phosphorylase b (Phos.); 2.1 µg of BSA; 3.7 µg of ovalbumin; 2.1 µg of carbonic anhydrase (Car.
Anhy.); 2.0 µg of trypsin inhibitor (Trp. Inhib.); 2.9 µg of α-lactalbumin (α-lactal). (See text for
details)

New findings for in-gel enzymatic digestion of proteins accelerated by HIFU
86
As stated above, protein enzymatic digestion is facilitated when reduction and alkylation is
implemented in the sample treatment, because breaking protein disulfide bonds between cysteinyl
residues disrupts the protein structure and reveals cleavage sites that otherwise would not be accessible
to the enzyme. Reduction and alkylation treatments were not performed in a first approach to assess
the effectiveness of ultrasonication. However, when the sample procedure was repeated again, this
time with reduction and alkylation steps, the protein coverage raised from 5 to 30 %, depending on the
protein, as shown in Figure II.3. In addition, the number of peptides matching the protein also
increased in a percentage between 10 and 100 %. It must be stressed that confident identification of α-
lactalbumin was only achieved when the reduction and alkylation steps were performed. Hence,
although confident identification was possible for most proteins studied without protein reduction and
alkylation, performing these steps is recommended when using the HIFU technology for the in-gel
enzymatic digestion, to increase the sequence coverage and attain unambiguous protein identification.
In addition, different amounts of BSA were used to study the minimum quantity of protein necessary
to obtain a confident identification with the ultrasonic and the classic sample treatments. In this case
the reduction and alkylation steps were included in the procedure. Results presented in Table II.4 show
that the minimum quantity of BSA identified in our conditions with both methodologies was 0.06 µg.
Lower amounts of BSA were also tested, but the results were negative with both the classic and HIFU
approaches. It is remarkable that the ultrasonic treatment also performs well at low protein
concentrations, being as effective as the classic treatment.
Table II.4: Influence of protein concentration on the (i) number of matched peptides and (ii) sequence
coverage obtained for the in-gel enzymatic digestion of proteins (n=2). The protein was separated by
SDS-PAGE and digested with trypsin by the HIFU procedure. HIFU conditions: 2 min ultrasonication
time; 70 %ultrasonication amplitude; 0.5 mm sonotrode diameter. Trypsin concentration: 3.6 µg /mL.
BSA (µg)
Classic sample treatment HIFU sample treatment
Matched
Peptides Coverage (%)
Matched
Peptides Coverage (%)
0.50 29 ± 1 50 ± 4 24 ± 3 41 ± 6
0.12 23 ± 2 39 ± 3 27 ± 1 50 ± 3
0.06 22 ± 2 36 ± 2 27 ± 2 43 ± 2
To test if this protein identification methodology is suitable for application in complex mixtures, the
identification of a protein obtained from the sulfate reducing bacteria Desulfovibrio desulfuricans
ATCC 27774 was attempted. After purification in an anionic exchange column, over expression of this
protein was observed by SDS-PAGE at approximately 75 kDa (Figure II.4) and in-gel digestion
accelerated by HIFU (0.5 mm sonotrode diameter, 70 % amplitude and 2 min of ultrasonication time)
followed by MALDI-TOF-MS analysis, was carried out on these bands. Reduction and alkylation

Chapter II
87
steps were included in the sample treatment. The protein was correctly identified in the UniProt2006
database using the PROTEIN PROSPECTOR search engine with 21 % of sequence coverage for the
adenylylsulfate reductase alpha subunit from Desulfovibrio desulfuricans. Since the sequence of this
protein is already known, alignment with homologous proteins was carried out using the CLUSTALW
program (CLUSTALW: improving the sensitivity of progressive multiple sequence alignment through
sequence weighting, position-specific gap penalties and weight matrix choice) [21] and the peptides
recognized by PROTEIN PROSPECTOR were identified. As can be seen in Figure II.5, correct
alignment was achieved with Desulfovibrio vulgaris Hildenborough and Desulfovibrio desulfuricans
G20.
Figure II.4: SDS-PAGE of a complex protein mixture obtained from the sulfate reducing bacteria
Desulfovibrio desulfuricans ATCC 27774.
II.5. Conclusions
Volumes as low as 25 µL can be used to perform in-gel enzymatic protein digestion accelerated by
HIFU for protein identification by peptide mass fingerprint. However, the sample handling for such
low volumes is time-consuming. When possible, a sample volume of 100 µL is recommended since
the procedure is handled with less manipulation steps. It must be also considered that the higher the
volume to be treated the higher the amount of enzyme required, which is an expensive chemical. So, it
is up to the analyst to decide whether time or money is the best item to be considered.

New findings for in-gel enzymatic digestion of proteins accelerated by HIFU
88
Figure II.5: Multiple alignment of adenylylsulfate reductase (APS reductase) alpha subunit from
Desulfovibrio desulfuricans ATCC 27774 and related organisms. Dd27k: APS reductase from
Desulfovibrio desulfuricans ATCC 27774 (Q9L767). Dvulg: APS reductase from Desulfovibrio
vulgaris Hildenborough (DVU0847). DdG20: APS reductase from Desulfovibrio desulfuricans G20
(Dde1110). (*) identity; (:) strongly similar; (·) weakly similar. Red amino acids: peptides identified in
the UniProt2006 database with the PROTEIN PROSPECTOR.

Chapter II
89
Regarding the sonotrode diameter, the results here presented show that this variable is not a
determining factor to obtain good results. The only precaution is to carefully inspect if the diameter of
the probe is the adequate one for the volume which will be ultrasonicated.
As far as temperature concerns, due to the ultrasonication times used, shorter than 2 min, the sample
treatment can be performed at room temperature with no risk of sample overheating.
Concerning the minimum amount of protein necessary for the enzymatic digestion with the HIFU
technology and for a confident PMF identification after MALDI-TOF-MS analysis, the results showed
that this threshold is same as with the classic sample treatment: 0.06 µg. Furthermore, the lowest
amount of trypsin needed to obtain an adequate protein digestion in our conditions with the HIFU
technology was 3.6 µg/mL.
Finally, the identification of the adenylylsulfate reductase alpha subunit from a complex mixture
obtained from the sulfate reducing bacteria Desulfovibrio desulfuricans ATCC 27774 demonstrates
that: (a) the parameters tested on standard samples can also be applied to biologic samples and (b) the
method provides important advances for fast protein identification.
II.6. Acknowledgments
R. J. Carreira and F. M. Cordeiro acknowledge the doctoral grants SFRH/BD/28563/2006 and
SFRH/BD/28295/2006; and R. Rial-Otero acknowledges the post-doctoral grant
SFRH/BPD/23072/2005, from FCT (Fundação para a Ciência e a Tecnologia), from Portugal. J. L.
Capelo acknowledges the MALDI-TOF-MS service of the Chemistry Department in the Universidade
Nova de Lisboa (http://www.dq.fct.unl.pt/eggebap/) for their helpful assistance and valuable
suggestions. The research findings here reported are protected by international laws under patent
pending PCT/IB2006/052314 and PT 103 303.
II.7. References
[1] M. Baker, Scientist 18 (2005) 14.
[2] P.A. Demirev, A.B. Feldman, J.S. Lin, J. Hopkins apl Tech. D. 25 (2004) 27.
[3] M.J. Stump, G. Black, A. Fox, K.F. Fox, C.E. Turick, M.Matthews, J. Sep. Sci. 28 (2005) 1642.
[4] D.H. Chace, Chem. Rev. 101 (2001) 445.
[5] A. Shevchenko, M. Wilm, O. Vorm, M. Mann, Anal. Chem. 68 (1996) 850.
[6] A.J. Link, J. Eng, D.M. Schieltz, E. Carmack, G.J.Mize, D.R. Morris, B.M. Garvik, J.R. Yates,
Nat. Biotechnol. 17 (1999) 676.

New findings for in-gel enzymatic digestion of proteins accelerated by HIFU
90
[7] Y.L.F. Hsieh, H.Q. Wang, C. Elicone, J. Mark, S.A. Martin, F. Regnier, Anal. Chem. 68 (1996)
455.
[8] D. Lopez-Ferrer, J.L. Capelo, J. Vazquez, J. Proteome Res. 4 (2005) 1569.
[9] M. Karas, F. Hillenkamp, Anal. Chem. 60 (1988) 2299.
[10] W.J. Henzel, T.M. Billeci, T. Wong, C. GrimLey, C. Watanabe, Proc. Natl. Acad. Sci. U.S.A. 90
(1993) 5011.
[11] Patent Request Port. No. 103303.
[12] J.L. Capelo, P. Ximenez-Embun, Y. Madrid-Albarrán, C. Camara, Trends Anal. Chem. 23 (2004)
331.
[13] J.L. Capelo, C. Maduro, C. Vilhena, Ultrason. Sonochem. 12 (2005) 225.
[14] J.L. Capelo, A. Mota, Curr. Anal. Chem. 2 (2005) 193.
[15] J.L. Capelo, M.M. Galesio, G.M. Felisberto, C. Vaz, J. Costa Pessoa, Talanta 66 (2005) 1272.
[16] U.K. Laemmli, Nature 227 (1950) 680.
[17] M.C. Liu, H.D. Peck, J. Biol. Chem. 256 (1981) 13159.
[18] T.J. Mason, Sonochemistry, Oxford University Press, Oxford, UK, 1999, Chapters 1 and 3.
[19] M. Postema, A. Wamel, C.T. Lancee, N. Jong, Ultrasound Med. Biol. 30 (2004) 827.
[20] N.D. Padliya, T.D. Wood, Proteomics 4 (2004) 466.
[21] J.D. Thomson, D.G. Higgins, T.J. Gibson, Nucl. Acids Res. 22 (1994) 4673.

Chapter III
91
Chapter III
SONOREACTOR-BASED TECHNOLOGY FOR FAST HIGH-
THROUGHPUT ENZYMATIC DIGESTION OF PROTEINS
Published in:
R. Rial-Otero, R. J. Carreira, F. M. Cordeiro, A. J. Moro, L. Fernandes, I. Moura, J. L. Capelo
Journal of Proteome Research, 2007, 6, 909–912


Chapter III
93
III.1. Abstract
Fast (120 s) and high-throughput (more than six samples at once) in-gel trypsin digestion of proteins
using the sonoreactor technology has been accomplished. Successful protein identification was
obtained after analysis by matrix-assisted laser desorption/ionization time-of-flight mass spectrometry,
MALDI-TOF-MS. Specific identification of the adenylylsulfate reductase alpha subunit from a
complex protein mixture from Desulfovibrio desulfuricans ATCC 27774 was performed as a proof of
the procedure. The new sample treatment is of easy implementation, saves time and money, and can
be adapted to online procedures and robotic platforms.

Sonoreactor-based technology for fast high-throughput enzymatic digestion of proteins
94
III.2. Introduction
Rapid protein identification is nowadays an issue of primary importance for the medical, biochemical,
and analytical communities. For instance, protein biomarker discovery for medical diagnostic or for
pharmacological purposes is becoming one of the hottest subjects among many researchers [1].
The sample handling for protein identification through enzymatic digestion is a complex and time-
consuming procedure with many different steps that have to be carefully performed to obtain reliable
results. The whole procedure can take as long as 4-12 h, since the protein enzymatic digestion is
typically performed overnight. Therefore, new analytical methodologies have recently emerged with
the objective of making protein digestion as fast and confident as possible [2]. The current procedures
used to accelerate enzymatic kinetics for protein digestion are mainly based on (1) microwave energy,
named microwave-assisted protein enzymatic digestion, MAPED [3, 4], or on (2) ultrasonic energy,
the high-intensity focused ultrasound, HIFU [5, 6]. There are remarkable differences between these
two approaches [2], and the HIFU is the fastest one: 30 s versus 20 min for an in-solution or an in-gel
protein digestion using trypsin [2].
Technological improvements in sonochemistry have been accomplished during the last years, and a
new device is now available for researchers, the sonoreactor [7] (disclaimer: specific company,
product, and equipment names are given to provide useful information; their mention does not imply
recommendation or endorsement by the authors). This instrument offers some advantages over the
ultrasonic probe and the ultrasonic bath since it combines their benefits but not their drawbacks. A
comparison between the ultrasonic energy provided by common probes, baths, and the sonoreactor is
provided in Figure III.1, where it can be seen that the ultrasonic energy generated by the sonoreactor is
lower than the ultrasonic probe but higher than the energy produced by a common ultrasonic bath.
This is critical, because it allows in-gel protein digestion without the gel degradation that occurs when
an ultrasonic probe is used. Gel degradation may limit the applicability of the in-gel HIFU
methodology for protein identification by electrospray ionization tandem mass spectrometry, ESI-
MS/MS, since the solutions obtained after ultrasonication of the gel piece may be excessively viscous
to be used with ESI systems. Furthermore, common ultrasonic probes only allow one sample to be
treated at a time, whereas the sonoreactor technology offers high sample throughput, since many
samples can be treated at once.
In the present work, we report on the application of the sonoreactor technology to the fast and high-
throughput protein identification by peptide mass fingerprint, PMF, after in-gel enzymatic digestion
and MALDI-TOF-MS analysis. In addition, the new sample treatment was successfully used in the
identification of the adenylylsulfate reductase alpha subunit from a complex protein mixture from
Desulfovibrio desulfuricans ATCC 27774.

Chapter III
95
Figure III.1: Comparison between the ultrasonic energy provided by common probes, baths and the
sonoreactor. Reprinted with permission from Hielscher Ultrasonics (http://www.hielscher.com).
III.3. Experimental Section
III.3.1. Apparatus
Gel electrophoresis was performed with a Bio-Rad (Hercules, CA, USA) model Powerpac basic
following the manufacturer’s instructions. Protein digestion was performed in 0.5 mL safe-lock tubes
from Eppendorf (Hamburg, Germany). A vacuum concentrator centrifuge from UniEquip
(Martinsried, Germany) model UNIVAPO 100H with a refrigerated vacuum pump model Unijet II
was used for (1) sample drying and (2) sample concentration. Biogen Cientifica (Madrid, Spain)
centrifuges and vortex models Sky Line and Spectrafuge Mini were used throughout the sample
treatment, when necessary. A sonoreactor model UTR200 from Hielscher Ultrasonics (Teltow,
Germany) was used to accelerate enzymatic protein digestions. An ultrasonic bath from Elma (Singen,
Germany), model Transsonic TI H-5, was used to help in peptide and protein solubilization. A
Simplicity™ 185 from Millipore (Milan, Italy) was used to obtain Milli-Q water throughout all the
experiments.
III.3.2. Standards and reagents
A standard protein mixture of glycogen phosphorylase b (97 kDa), bovine serum albumin (BSA; 66
kDa), ovalbumin (45 kDa), carbonic anhydrase (30 kDa), trypsin inhibitor (20.1 kDa), and α-
lactalbumin (14.4 kDa) was purchased from Amersham Biosciences (Buckinghamshire, United
Kingdom, part number 17-0446-01). α-Lactalbumin from bovine milk (≥ 85 %), BSA (> 97 %) and
trypsin proteomics grade, were purchased from Sigma (Steinheim, Germany). All materials were used
without further purification. α-Cyano-4-hydroxycinnamic acid (α-CHCA) puriss for MALDI-MS from
Fluka (Buchs, Switzerland) was used as MALDI matrix. ProteoMass™ Peptide MALDI-MS
Calibration Kit (MSCAL2) from Sigma was used as mass calibration standard for MALDI-TOF-MS.

Sonoreactor-based technology for fast high-throughput enzymatic digestion of proteins
96
The following reagents were used for gel preparation and protein digestion: methanol, acetonitrile,
iodoacetamide (IAA), and DL-dithiothreitol (DTT) (99 %) were purchased from Sigma; formic acid
for mass spectrometry, acetic acid (> 99.5 %), and ammonium bicarbonate (> 99.5 %) were from
Fluka; bromophenol blue, glycine, glycerol, and trifluoroacetic acid (TFA, 99 %) were from Riedel-
de-Haën (Seelze, Germany); coomassie blue R-250, β-mercaptoethanol (> 99 %), and sodium dodecyl
sulfate (SDS) were from Merck (Darmstadt, Germany); α,α,α-tris-(hydroxymethyl)methylamine and
tris(hydroxymethyl)aminomethane (Tris-HCl), ultrapure grade, were from Aldrich (Steinheim,
Germany); and ammonium persulfate (PSA) and N,N,N′,N′-tetramethylethylenodiamine (TEMED)
were from Sigma (Steinheim, Germany).
III.3.3. Sample treatment
Protein samples ranging from 0.06 to 3.7 µg were dissolved in sample buffer for sodium dodecyl
sulfate polyacrylamide gel electrophoresis, SDS-PAGE. The protein spots in the SDS-PAGE were
excised and treated according to the protocol in Figure III.2. After washing, reduction, alkylation, and
drying steps, the gel slices were incubated with trypsin (0.37 µg) in an ice bath during 45 min to help
rehydration and trypsin diffusion into the gel. In-gel protein digestion was performed with the
sonoreactor operating at 50 % amplitude during 60 s (digestion volume: 25 µL). Protein digestion was
stopped after the addition of 15 µL of formic acid 5 %. Finally, the samples were dried in a vacuum
concentrator centrifuge and then resuspended with 10 µL of formic acid 0.3 %.
III.3.4. MALDI-TOF-MS Analysis
A MALDI-TOF-MS model Voyager DE-PRO™ Biospectrometry™ Workstation equipped with a
nitrogen laser radiating at 337 nm from Applied Biosystems (Foster City, United States) was used for
the mass spectrometry analysis of the protein digests. MALDI mass spectra were acquired as
recommended by the manufacturer. The α-CHCA matrix used throughout this work was prepared as
follows: 10 mg of α-CHCA were dissolved in 1 mL of 50 % acetonitrile/ 0.1 % TFA solution. Then,
10 µL of the aforementioned matrix solution were mixed with 10 µL of sample and the mixture was
stirred in a vortex during 30 s. One microliter of each sample was spotted onto the 100 well MALDI-
TOF-MS sample plate and allowed to dry.
Measurements were performed in the reflectron positive ion mode, with 20 kV of accelerating voltage,
75.1 % of grid voltage, 0.002 % of guide wire, and a delay time of 140 ns. Two close external
calibrations were performed with the monoisotopic peaks from bradykinin, angiotensin II, P14R, and
ACTH peptide fragments (m/z: 757.3997, 1046.5423, 1533.8582, and 2465.1989, respectively). Mass
spectral analysis of each sample was based on the average of 500 laser shots. Peptide mass fingerprints
were searched with the MASCOT and PROTEIN PROSPECTOR search engines with the following

Chapter III
97
parameters: (1) database: SwissProt; (2) protein molecular mass (MW): all; (3) one missed cleavage;
(4) fixed modifications: carbamidomethylation (C); (5) variable modifications: oxidation (M); (6)
peptide tolerance up to 100 ppm after close-external calibration. A match was considered successful
when the protein identification score was the highest value and outside of the random interval.
Figure III.2: Comprehensive scheme of the sample treatment procedure.

Sonoreactor-based technology for fast high-throughput enzymatic digestion of proteins
98
III.3.5. Protein samples from complex mixtures
Desulfovibrio desulfuricans ATCC 27774 was cultured in lactate-nitrate medium [8]. To separate the
cells from the medium, the culture was centrifuged 30 min at 3000 x g. The pellet was resuspended in
10 mM Tris-HCl (1 mL buffer/ 1 mg cells), pH 7.6, and ruptured in a French press at 9000 psi. The
bacterial extract was centrifuged at 19 000 x g during 30 min and then ultracentrifuged at 180 000 x g
during 60 min. The soluble extract obtained was subjected to an anionic exchange column (DEAE 52,
Whatman). The fraction eluted between 100 and 250 mM Tris-HCl was analyzed. Four aliquots
containing 0.9 µg of total protein were run in a 12.5% SDS-PAGE gel, and in-gel digestion of the
protein observed at ca. 75 kDa was performed in the sonoreactor.
III.4. Results and discussion
III.4.1. Optimization of the sonoreactor performance
To test the suitability of the sonoreactor technology for in-gel protein digestion, the following
parameters were optimized: (1) trypsin/protein ratio; (2) digestion time; (3) sonoreactor amplitude, and
(4) protein concentration.
(1) Trypsin/Protein Ratio. Slices of SDS-PAGE gel with 0.5 µg of α-lactalbumin were digested with
decreasing concentrations of trypsin ranging from 0.6 µM to 0.008 µM. In-gel digestion (25 µL) was
performed with the sonoreactor operating in the continuous mode at 70 % amplitude during 60 s.
Confident protein identification was only obtained when 0.6 µM (375 ng in 25 µL) of trypsin was
used. When lower amounts of trypsin were used, confident identification was not achieved (see Figure
III.3 in III.8. Supporting Information). The optimum trypsin concentration is consistent with the one
previously obtained for the HIFU procedure [5, 6], and suggests that the cavitation phenomena [9]
produced by the ultrasonic energy assists and enhances in-gel enzymatic digestion, although the
enzyme concentration is still an important variable in the proteolysis reaction.
(2) Digestion Time. To optimize the digestion time, different pieces of SDS-PAGE gel with 0.5 µg of
α-lactalbumin and BSA were digested in the sonoreactor, in duplicate, with 0.6 µM of trypsin at 70 %
amplitude. The digestion time was comprised between 30 and 180 s. As can be seen in Figure III.4 (in
III.8. Supporting Information), confident identification of BSA was possible with all the
ultrasonication times tested and no differences were observed in the number of matched peptides or
sequence coverage percentage. Regarding α-lactalbumin, a minimum digestion time of 60 s was
required for its confident identification, out of the random region, and no differences were observed
between the ultrasonication times of 60, 120, and 180 s. These data suggest that the time needed to
perform enzymatic digestion with the sonoreactor can be slightly higher than the HIFU procedure,

Chapter III
99
which is consistent with the differences in the ultrasonic power produced by the sonoreactor and the
ultrasonic probe, as previously explained.
(3) Sonoreactor Amplitude. To optimize the sonoreactor amplitude, slices of SDS-PAGE gel with 0.5
µg of α-lactalbumin and BSA were digested, in duplicate, with 0.6 µM of trypsin during 60 s in the
continuous mode. The operating amplitudes ranged from 25 % to 90 %. Interestingly, different results
were obtained for each protein. On the one hand, the number of matched peptides and the sequence
coverage percentage were virtually the same for BSA with all the amplitude values tested, as shown in
Figure III.5 (in III.8. Supporting Information). On the other hand, for α-lactalbumin the number of
matched peptides and the sequence coverage (%) decreased as the amplitude increased. For this
reason, 50 % was chosen as the optimum amplitude for protein digestion in the sonoreactor.
(4) Protein Concentration. To evaluate the minimum concentration of protein needed to obtain a
confident PMF identification, samples ranging from 0.01 to 5 µg were dissolved in sample buffer for
SDS-PAGE, and the protein bands were submitted to the ultra-fast in-gel protein digestion procedure
with the sonoreactor. Protein identification was only possible for the protein samples equal or higher
than 0.1 µg with a trypsin concentration of 0.6 µM (see Figure III.6 in III.8. Supporting Information).
Higher quantity of trypsin was not tried.
Finally, when the sonoreactor procedure was applied with the optimized conditions, as described
above, to gels containing BSA or α-lactalbumin in the absence of trypsin, no evidence of protein
digestion products was observed, which indicates that this ultrasonic treatment does not change protein
integrity per se (data not shown).
III.4.2. Proof of the Procedure
Proof of the procedure for specific protein identification using (1) protein separation from a complex
mixture, (2) sonoreactor proteolytic digestion, and (3) protein identification by MALDI-TOF-MS was
performed with samples from the sulfate reducing bacteria Desulfovibrio desulfuricans ATCC 27774
as follows: after anionic exchange column, over expression of a protein was observed by SDS-PAGE
at approximately 75 kDa. The in-gel protein digestion with the sonoreactor protocol (continuous
mode, 50 % amplitude and 60 s of ultrasonication time), followed by MALDI-TOF-MS analysis, was
performed on the gel bands containing the over expressed protein. Reduction and alkylation steps were
included in the sample treatment. The protein was identified with confidence as adenylylsulfate
reductase alpha subunit in the UniProt2006 database using the Protein Prospector search engine: 15
peptides matched the protein sequence with 21 % coverage.

Sonoreactor-based technology for fast high-throughput enzymatic digestion of proteins
100
III.5. Conclusions
The developed method based on the sonoreactor technology for ultrafast high-throughput in-gel
protein digestion represents an important advance in the proteomics field. This method is faster than
the classical in-gel protein digestion protocol and also faster than the in-gel protein digestion with
common ultrasonic probes, since it allows the simultaneous digestion of six samples in 1 or 2 min.
Furthermore, similar results were obtained when this method was compared with the HIFU protocol
[6] in terms of number of matched peptides and sequence coverage but, as a general role, lower
standard deviations and clear MALDI-TOF mass spectra were obtained when the sonoreactor was
used. This fact may be related with a better homogeneity in the operation conditions during the
ultrasonication step and also with the lower gel degradation. Therefore, the new methodology
represents a good alternative to the classic and HIFU protocols.
The optimization experiments demonstrate that the best sonoreactor conditions for protein digestion
are: 50 % ultrasound amplitude and 1 min of ultrasonication time. The ultrasonication time, when
necessary, can be increased. With this procedure, the minimum amount of protein necessary to obtain
confident identification by PMF after MALDI-TOF-MS analysis was 0.1 µg.
Finally, the identification of the adenylylsulfate reductase alpha subunit from a complex mixture
obtained from the sulfate reducing bacteria Desulfovibrio desulfuricans ATCC 27774 demonstrates
that (a) the parameters tested on standard samples can be also applied to complex biologic samples;
and (b) the method provides important advances in protocols for fast protein identification.
III.6. Acknowledgments
R. Rial-Otero acknowledges the post-doctoral grant SFRH/BPD/23072/2005 from FCT (Fundação
para a Ciência e a Tecnologia) from Portugal. R. J. Carreira and F. M. Cordeiro acknowledge the
doctoral grants SFRH/BD/28563/2006 and SFRH/BD/28295/2006 from FCT. Dr. J. L. Capelo
acknowledges the MALDI-TOF-MS service of the Chemistry Department in the Universidade Nova
de Lisboa (http://www.dq.fct.unl.pt/eggebap/) for their helpful assistance and valuable suggestions.
The research findings here reported are protected by international laws under patent pending
PCT/IB2006/052314 and PT 103 303.
III.7. References
[1] Calvo, K. R; Lotta, L. A.; Petricoin, E. F. Biosci. Rep. 2005, 25, 107.
[2] López-Ferrer, D.; Cañas, B.; Vázquez, J.; Lodeiro, C.; Rial-Otero, R.; Moura, I.; Capelo, J. L.
TrAC, Trends Anal. Chem. [Online] 2006, DOI:10.1016/j.trac.2006.05.015.

Chapter III
101
[3] Pramanik, B. N.; Mirza, U. A.; Ing, Y. H.; Liu, Y. H.; Bartner, P. L.; Weber, P. C., Bose, M. K.
Protein Sci. 2002, 11, 2676.
[4] Juan, H. F.; Chang, S. C.; Huang, H. C.; Chen, S. T. Proteomics 2005, 635, 840.
[5] López-Ferrer, D.; Capelo, J. L.; Vázquez, J. J. Proteome Res. 2005, 4, 1569-1574.
[6] Carreira, R. J.; Cordeiro, F. M.; Moro, A. J.; Rivas, M. G.; Rial-Otero, R.; Gaspar, E. M.; Moura,
I.; Capelo J. L. J. Chromatogr., A 2006, DOI:10.1016/j.chroma.2006.09.078.
[7] Hielscher Ultrasound Technology; http://www.hielscher.com/ultrasonics/utr2_p.htm (accessed July
2006).
[8] Liu, M. C.; Peck, H.D., Jr. J. Biol. Chem. 1981, 256, 13159-13164.
[9] Mason, T. J. Sonochemistry; Oxford University Press: New York, 1999.

Sonoreactor-based technology for fast high-throughput enzymatic digestion of proteins
102
III.8. Supporting Information
Figure III.3: Effect of the amount of trypsin on the in-gel protein digestion procedure with the
sonoreactor. Slices of SDS-PAGE gel with 0.5 µg of α-lactalbumin were digested with a) 375 ng, or
b) 100 ng of trypsin in the sonoreactor, during 60 s. Operating conditions: continuous mode; 70 %
amplitude.
Figure III.4: Effect of the digestion time on the sequence coverage (%) obtained for α-lactalbumin
(0.5 µg) and BSA (0.5 µg), after in-gel protein digestion with the sonoreactor procedure and analysis
by MALDI-TOF-MS. Sonoreactor operating conditions: continuous mode; 70 % amplitude.

Chapter III
103
Figure III.5: Effect of the ultrasound amplitude on the sequence coverage (%) and number of
matched peptides obtained for α-lactalbumin (0.5 µg) and BSA (0.5 µg), after in-gel protein digestion
with the sonoreactor (continuous mode; 60 s of ultrasonication).

Sonoreactor-based technology for fast high-throughput enzymatic digestion of proteins
104
Figure III.6: MALDI-TOF-MS spectra obtained for α-lactalbumin after in-gel digestion with the
sonoreactor (continuous mode; 50 % amplitude; 60 s of ultrasonication). a) 1 µg of α-lactalbumin. b)
0.1 µg of α-lactalbumin. c) 0.05 µg of α-lactalbumin.
Chapter IV
105
Chapter IV
SIMPLIFYING SAMPLE HANDLING FOR PROTEIN
IDENTIFICATION BY PEPTIDE MASS FINGERPRINT USING
MATRIX-ASSISTED LASER DESORPTION/IONIZATION
TIME-OF-FLIGHT MASS SPECTROMETRY
Published in:
F. M. Cordeiro, R. J. Carreira, R. Rial-Otero, M. G. Rivas, I. Moura, J. L. Capelo
Rapid Communications in Mass Spectrometry, 2007, 21, 3269–3278


Chapter IV
107
IV.1. Abstract
An ultrasonic bath, an ultrasonic probe and a sonoreactor were used to speed up the reactions involved
in each step of the sample handling procedure for in-gel protein identification by peptide mass
fingerprint, PMF, using matrix-assisted laser desorption/ionization time-of-flight mass spectrometry
(MALDI-TOF-MS). The following steps were successfully accelerated using ultrasonic energy: gel
washing, protein reduction, and protein alkylation. As a result, a reduction comprising 80 % to 90 %
of the total time used in the classic approach was achieved. In addition, sample handling was also
drastically simplified. The number of peptides identified and the protein sequence coverage obtained
with the new procedure were similar to those obtained with the traditional sample treatment for the
following standard proteins: glycogen phosphorylase b, BSA, ovalbumin, carbonic anhydrase, trypsin
inhibitor and α-lactalbumin. Finally, as a proof of the procedure, specific proteins were identified from
complex mixtures obtained from three different sulfate reducing bacteria: Desulfovibrio desulfuricans
G20, Desulfuvibrio gigas NCIB 9332, and Desulfuvibrio desulfuricans ATCC 27774.

Simplifying the sample handling for protein identification by PMF
108
IV.2. Introduction
Nowadays, one of the most common methods used for protein identification is known as peptide mass
fingerprint (PMF). The classic sample treatment for protein identification by PMF includes several
steps. Frequently, proteins are first separated from a complex mixture, using gel electrophoresis based
methodologies. Then, the gel band containing the protein is excised and submitted to enzymatic
digestion, usually with trypsin. Finally, after mass spectrometry (MS) analysis, generally by matrix-
assisted laser desorption/ionization time-of-flight (MALDI-TOF) [1, 2], protein identification is
achieved by comparing the mass values of the pool of peptides obtained from protein digestion, with
the peptide masses produced by the theoretical (in silico) digestion of the proteins included in a
particular database [3].
The classic in-gel protein digestion methodology is as exhausting procedure with numerous single
steps. Modern protocols for in-gel protein digestion have been drastically changed after the
introduction of ultrasonic devices, such as the ultrasonic probe or the sonoreactor, to enhance
enzymatic activity [4-6]. The use of these ultrasonic devices allowed protein enzymatic digestion to be
performed in seconds (60 - 120 s), while former approaches needed from 4 to 12 h to complete the
enzymatic process. This is a recently developed technology in the phase of internationalization [7].
However, in spite of the important advance achieved with the application of ultrasound to speed up the
tryptic digestion, the time consumed during the preceding steps of the protocol is currently its main
limitation. Prior to enzymatic digestion, the gel piece must be washed with water to remove
contaminants and with acetonitrile for dehydration and removal of the staining agents. Then, proteins
are submitted to reduction and alkylation to facilitate the following enzymatic digestion. Finally,
another washing step is required. The total time involved in these steps is about 3 h. Some of these
stages, such as gel excision or gel washing, can be performed by commercial robots allowing the
reduction of the operator’s work. However, the elevated cost of these equipments is an important
limitation for small laboratories. Therefore, in these cases, simplification of the operator’s work is
crucial.
The main objective of this study was to reduce sample handling and the total time necessary for in-gel
protein digestion in each step of the procedure. This way, different commercial ultrasonic devices, an
ultrasonic bath, an ultrasonic probe and a sonoreactor, were used to accelerate the physical and
chemical processes which take place during washing, reduction and alkylation procedures.
IV.3. Experimental

Chapter IV
109
IV.3.1. Apparatus
Gel electrophoresis was performed with a model PowerPac Basic (Bio-Rad, Hercules, CA, USA)
following the manufacturer’s instructions. The image of the gel after staining was acquired in a Gel
Doc 2000 from Bio-Rad. Protein digestion was performed in 0.5 mL safe-lock tubes (Eppendorf,
Hamburg, Germany). A model UNIVAPO 100H vacuum concentrator centrifuge (UniEquip,
Martinsried, Germany) with a model Unijet II refrigerated vacuum pump was used for (i) sample
drying and (ii) sample concentration. A Spectrafuge minicentrifuge (Labnet, Madrid, Spain) and a Sky
Line minicentrifuge-vortex (ELMI, Riga, Latvia) were used throughout the sample treatment, when
necessary. A Simplicity™ 185 (Millipore, Milan, Italy) was used to obtain Milli-Q water throughout
the experiment. Different ultrasonic devices were tested: a Transsonic TI-H-5 ultrasonic bath (Elma,
Singen, Germany); an UTR200 sonoreactor (Hielscher Ultrasonics, Teltow, Germany); and an UP
100H ultrasonic probe (Hielscher Ultrasonics).
IV.3.2. Standards and reagents
A standard protein mixture of glycogen phosphorylase b (97 kDa), bovine serum albumin (BSA) (66
kDa), ovalbumin (45 kDa), carbonic anhydrase (30 kDa), trypsin inhibitor (20.1 kDa) and α-
lactalbumin (14.4 kDa) was purchased from Amersham Biosciences (Buckinghamshire, UK, part
number 17-0446-01). α-Lactalbumin from bovine milk (≥ 85 %), BSA (> 97 %) and trypsin
proteomics grade, were purchased from Sigma (Steinheim, Germany). All materials were used without
further purification. α-Cyano-4-hydroxycinnamic acid (α-CHCA) puriss for MALDI-MS (Fluka,
Buchs, Switzerland) was used as MALDI matrix. The ProteoMass™ Peptide MALDI-MS Calibration
Kit (MSCAL2) from Sigma was used as mass calibration standard for MALDI-TOF-MS.
The following reagents were used for gel preparation and protein digestion: methanol, acetonitrile,
iodoacetamide (IAA) and DL-dithiothreitol (DTT, 99 %) (Sigma); formic acid for mass spectrometry,
acetic acid (> 99.5 %) and ammonium bicarbonate (> 99.5 %) (Fluka); bromophenol blue, glycine,
glycerol and trifluoroacetic acid (TFA, 99 %) (Riedel-de-Haën, Seelze, Germany); Coomasie blue R-
250, β-mercaptoethanol (> 99 %) and sodium dodecyl sulfate (SDS) (Merck, Darmstadt, Germany);
and α,α,α-tris(hydroxymethyl)methylamine + tris(hydroxymethyl)aminomethane (Tris-HCL),
ultrapure grade, (Aldrich, Steinheim, Germany).
IV.3.3. Sample treatment
Protein samples from 0.5 to 3.7 µg were dissolved in 5 µL of water and 5 µL of sample buffer (5 mL
Tris-Base [0.5M]/ 8 mL SDS [10%]/ 1 mL β-mercaptoethanol/ 2 mL glycerol/ 4 mg bromophenol blue

Simplifying the sample handling for protein identification by PMF
110
to a final volume of 20 mL in water) for sodium dodecyl sulfate polyacrylamide gel electrophoresis
(SDS-PAGE) (12.5 %, 0.5 mm thickness). After gel electrophoresis (65 min, 120 V, 400 mA), the gel
was stained with Coomassie blue R-250 and distained for identification of the protein bands. Then, the
protein bands were excised from the gel and treated according to the classic protocol schematized in
Figure IV.1. After washing, reduction, alkylation and drying steps, the gel pieces were incubated with
trypsin (375 ng in 25 µL) in an ice bath, during 60 min, for rehydration and diffusion of the enzyme
into the gel. In-gel protein digestion was performed in a sonoreactor operating at 50 % amplitude
during 2 min [6]. The activity of trypsin was stopped after the addition of 20 µL of formic acid (5 %,
v/v). Finally, the samples were evaporated to dryness in a vacuum concentrator centrifuge and then
resuspended in 10 µL of formic acid (0.3 %, v/v).
Prior to MALDI-TOF-MS analysis, the sample was mixed in a 1:1 ratio with α-CHCA matrix and
stirred in a vortex for 30 s. MALDI matrix was prepared as follows: 10 mg of α-CHCA were dissolved
in 1 mL of 50 % acetonitrile/ 0.1 % TFA solution. Finally, 1 µL of each sample was hand-spotted onto
the MALDI-TOF-MS sample plate and allowed to dry.
IV.3.4. MALDI-TOF-MS analysis
A MALDI-TOF-MS model Voyager DE-PRO™ Biospectrometry™ Workstation equipped with a
nitrogen laser radiating at 337 nm (Applied Biosystems, Foster City, USA) was used for mass
spectrometry analysis of the protein digests.
Measurements were performed in the reflectron positive ion mode, with a 20 kV of accelerating
voltage, 75.1 % grid voltage, 0.002 % guide wire and a delay time of 100 ns. Two close external
calibrations were performed with the monoisotopic peaks from bradykinin, angiotensin II, P14R and
ACTH peptide fragments (m/z: 757.3997, 1046.5423, 1533.8582 and 2465.1989, respectively). Mass
spectral analysis of each sample was based on the average of 500 laser shots. Peptide mass fingerprints
were identified in the MASCOT [8] and PROTEIN PROSPECTOR [9] search engines with the
following parameters: (i) Database: SwissProt. 2006; (ii) molecular mass (MW) of protein: all; (iii)
one missed cleavage; (iv) fixed modifications: carbamidomethylation (C); (v) variable modifications:
oxidation (M); (vi) peptide tolerance up to 150 ppm. A match was considered successful when the
protein identification score was the first and outside of the random interval.
IV.3.5. Protein samples from complex mixtures
As proof of the procedure, different proteins were identified from complex mixtures obtained from
three sulfate-reducing bacteria: Desulfovibrio desulfuricans G20, Desulfuvibrio gigas NCIB 9332, and
Desulfuvibrio desulfuricans ATCC 27774.

Chapter IV
111
Desulfovibrio desulfuricans G20 was grown under anaerobic conditions in Postgate C medium. Cells
were collected at the end of the logarithmic phase by centrifugation at 8000 x g during 15 min at 4ºC
(Beckman Avanti™ J-25 centrifuge). The periplasmatic fraction was obtained following the protocol
described by Brondino et al. [10]. Then, using the protocols described in the former sections, a protein
of approximately 15 kDa was identified after SDS-PAGE of an aliquot containing 8.4 ± 0.5 µg of total
protein.
Figure IV.1: Classic sample treatment for in-gel protein digestion.

Simplifying the sample handling for protein identification by PMF
112
Desulfuvibrio gigas NCIB 9332 was cultured under anaerobic conditions in lactate-sulfate medium
and collected by centrifugation at 8000 x g during 15 min at 4ºC. Soluble extract was obtained as
described by Almendra et al. [11] and loaded into an anion-exchange column (DEAE 52, Whatman)
equilibrated with 10 mM Tris-HCl, pH 7.6. A 50 kDa protein present in the fraction eluting between
250 and 300 mM Tris-HCl was identified. The total amount of the protein analyzed was 2.9 ± 0.3 µg.
Desulfovibrio desulfuricans ATCC 27774 was cultured in lactate-nitrate medium as described
previously by Liu and Peck [12]. The culture was centrifuged during 30 min at 3000 x g to separate
the cells from the medium. The pellet was resuspended in 10mM Tris-HCl, pH 7.6 (1 mL buffer/1 mg
cells), and ruptured in a French press at 9000 psi. The bacterial extract was centrifuged at 19 000 x g
during 30 min and ultracentrifuged at 180 000 x g during 60 min. The soluble extract obtained was
loaded into an anion-exchange column (DEAE 52, Whatman) for separation. A total protein amount of
4.7 ± 0.2 µg contained in the eluting fraction at 250 mM Tris-HCl was analyzed by SDS-PAGE and a
protein of approximately 40 kDa was identified.
IV.4. Results and discussion
The following ultrasonic devices, an ultrasonic bath, an ultrasonic probe, and a sonoreactor, were used
to test the efficiency of ultrasound in the enhancement of different steps of the in-gel protein digestion
protocol. The performance of each ultrasonic device is different and can be related with the different
ways in which ultrasound is transmitted. In fact, their ultrasonic power follows this order: ultrasonic
probe, 15 W; sonoreactor, 0.5 W; and ultrasonic bath, 0.01 W. These differences make each system
appropriate for different functions, and not all of them can be used for the same purpose. For instance,
the ultrasonic probe must be carefully used, because the ultrasonic energy produced can degrade the
gel piece containing the protein, introducing contaminants into the buffer solution. These contaminants
can difficult the analysis by MALDI-TOF-MS or LC-MS/MS [5]. The main characteristics and
parameters regarding the ultrasonic devices used in this work are described in Table IV.1. The
ultrasonication times and amplitudes used were chosen according to our previous experience [4-6]. As
a general rule, short times, 2 and 5 min, were selected because the goal of this work was the reduction
of the total time of the sample treatment. The ultrasonication amplitudes were selected to make gel
degradation as low as possible. For the aforementioned reason, 50 % was the ultrasonication amplitude
used for the sonoreactor and ultrasonic probe, while 60 % was selected for the ultrasonic bath, the
device with the lower ultrasonic energy output. The classic sample treatment is presented in Figure
IV.1. The following steps were identified as targets:
(i) Washing step. In the classic approach the gel is washed three times with water followed by three
times with acetonitrile. With the ultrasonic procedure the gel was washed once with water and once

Chapter IV
113
with acetonitrile, both times under the influence of an ultrasonic field. Ultrasonic bath (5 min),
sonoreactor (2 min) and ultrasonic probe (2 min) were tested for this purpose.
(ii) Reduction step. The classic procedure uses two steps of 10 and 15 min, respectively, which were
substituted by a unique ultrasonication step of 2 min using the sonoreactor or the ultrasonic probe, and
5 min for the ultrasonic bath.
(iii) Alkylation step. The classic procedure has only one step in which alkylation is performed during
35 min. The ultrasonic approach was also performed in a single step but only for 2 min with the probe
and the sonoreactor, and 5 min with the bath.
(iv) Trypsin diffusion into the gel. In the classic method the gel pieces are incubated on ice, before
digestion, during 60 min with trypsin. It was investigated if it was possible to omit this step using the
ultrasonic sample treatment.
Gel bands containing 0.5 µg of α-lactalbumin or BSA were processed according to the protocol in
Figure IV.1, and enzymatically digested, in duplicate, with the sonoreactor with 0.6 µM of trypsin
(375 ng in 25 µL) at 50 % amplitude during 2 min, according to a previous method developed by our
group [6].
Table IV.1: Characteristics and parameters of the ultrasonic devices used for the acceleration of
washing, reduction and alkylation steps.
Ultrasonic devices Samples processed
at once
Amplitude
(%)
Ultrasonication
time (min)
Gel
degradation
Ultrasonic bath (35 kHz) > 6 60 5 Low
Sonoreactor (24 kHz) ≤ 6 50 2 Medium
Ultrasonic probe (30 kHz; 0.5 mm) 1 50 2 High
IV.4.1. Ultrasound effect on the washing steps
The washing steps (steps 5, 6, 9 and 10 in Figure IV.1) were performed by cleaning the gel piece with
water followed by a second cleaning step with acetonitrile, as stated above. The effect of each
ultrasonic device in the washing procedure was assessed, and the investigation was performed as
follows (see Figure IV.2a).

Simplifying the sample handling for protein identification by PMF
114
Figure IV.2: Comprehensive scheme of the several sample treatments studied. The ultrasonic energy
was provided by an ultrasonic bath (35 kHz, 60 % ultrasonication amplitude, 5 min ultrasonication
time); a sonoreactor (24 kHz, 50 % ultrasonication amplitude, 2 min ultrasonication time); and an
ultrasonic probe (30 kHz, 50 % ultrasonication amplitude, 2 min ultrasonication time, 0.5 mm
sonotrode diameter). See text for further details.

Chapter IV
115
(i) First assay. Cleaning with water was carried out in one single step accelerated with the sonoreactor
(2 min), the ultrasonic probe (2 min) or with the ultrasonic bath (5 min). The next washing step was
performed with acetonitrile by the classic approach: three times comprising centrifugation and stirring.
In Figure IV.3, the results obtained with the ultrasonic bath correspond to number 2; number 3 for the
sonoreactor; and 4 for the ultrasonic probe. As can be seen, the number of matched peptides and the
sequence coverage (%) for both proteins using any of the ultrasonic devices tested were similar to the
ones obtained with the classic protocol, corresponding to number 1 in Figure IV.3. A lower number of
matched peptides and sequence coverage were obtained with the sonoreactor. It must be stressed,
however, that longer ultrasonication times for the sonoreactor were not tested, since the results
achieved with the bath and the probe were satisfactory.
(ii) Second assay. The washing step with water was performed by the classic procedure, three times
with centrifugation and agitation. The following cleaning step with acetonitrile was accelerated with
the sonoreactor or the ultrasonic probe (2 min), or with the ultrasonic bath (5 min). In Figure IV.3, the
ultrasonic bath results correspond to number 5; number 6 for the sonoreactor; and 7 for the probe. The
trend observed for the number of matched peptides and for the protein sequence coverage was similar
to the one obtained in the first assay.
(iii) Third assay. The water and acetonitrile washing steps were accelerated with the sonoreactor or the
ultrasonic probe (2 min), or with the ultrasonic bath (5 min). In Figure IV.3, number 8 corresponds to
the results obtained with the ultrasonic bath; 9 to the sonoreactor; and 10 to the ultrasonic probe. As
can be seen, when the water and acetonitrile washing steps were accelerated with ultrasound, the
number of matched peptides was similar to the result obtained with the classic approach. The protein
sequence coverage was also similar, even slightly better. Remarkably, the effectiveness of the
ultrasonic bath, the probe and the sonoreactor for this purpose was analogous.
Therefore, it was concluded that the washing procedure can be accelerated with ultrasonic energy,
without protein degradation, in one single step with water, followed by another single step with
acetonitrile. In addition, contaminants were removed and no gel degradation was observed.
Furthermore, the number of matched peptides and sequence coverage were similar or even better than
the results obtained with the classic protocol. Considering that the washing procedure has to be
performed before and after the reduction and alkylation steps, the total sample handling time was
reduced from ca. 90 min to 20 min using the ultrasonic bath. The reduction is even higher, from 90
min to 8 min, using the sonoreactor or the ultrasonic probe. However, the number of samples that can
be processed at the same time with the ultrasonic bath is higher than with the sonoreactor or the
ultrasonic probe. Another important aspect to be referred is that not only is time saved, but also sample
handling is simplified.

Simplifying the sample handling for protein identification by PMF
116
Figure IV.3: Ultrasound effect on the washing procedure (n = 2). The ultrasonic energy was provided
by an ultrasonic bath (35 kHz, 60 % ultrasonication amplitude, 5 min ultrasonication time); a
sonoreactor (24 kHz, 50 % ultrasonication amplitude, 2 min ultrasonication time); and an ultrasonic
probe (30 kHz, 50 % ultrasonication amplitude, 2 min ultrasonication time, 0.5 mm sonotrode
diameter). See Figure IV.2a) for number identification.
IV.4.2. Ultrasound effect on the reduction and alkylation steps
Reduction and alkylation steps are normally performed to break protein disulfide bonds between
cysteine residues and facilitate the enzymatic digestion. Hence, in the classic procedure, prior to
protein digestion, cysteine residues are reduced using DL-dithiothreitol (DTT) during 10 min at 60ºC,
plus 15 min at room temperature. Then, the thiol groups of the cysteine residues are blocked with
iodoacetamide (IAA) during 35 min in the dark at room temperature [13].
Once it was confirmed that the washing procedures could be rapidly completed with ultrasonic energy,
the reduction and alkylation steps (steps 7 and 8 in Figure IV.1) were also submitted to the influence
of ultrasound (see Figure IV.2b). Like in the washing procedure, this study was performed gradually,
trying to avoid protein degradation and minimize gel deterioration. The classic procedure was always
carried out for result comparison.

Chapter IV
117
(i) First assay. Reduction with DTT was performed in one single step accelerated with the sonoreactor
(2 min), the ultrasonic probe (2 min) or with the ultrasonic bath (5 min). In this assay, the alkylation
step with IAA was performed by the classic procedure, i.e. 35 min at room temperature in darkness. In
Figure IV.4, letter B corresponds to the results obtained with the ultrasonic bath; letter C to the
sonoreactor; and D to the ultrasonic probe. As can be seen, the number of matched peptides and the
protein sequence coverage obtained for both proteins was similar to the results obtained with the
classic procedure, letter A.
(ii) Second assay. Reduction with DTT was performed with the classic protocol, i.e. 10 min at 60ºC
plus 15 min at room temperature, while the alkylation step was performed during 2 min with the
sonoreactor or the probe, or in 5 min with the ultrasonic bath. In Figure IV.4, letters E, F and G
correspond to the results obtained with the bath, the sonoreactor and the probe sample treatment,
respectively. As can be seen, the results were similar between the ultrasound enhanced procedure and
the classic procedure, letter A.
Figure IV.4: Ultrasound effect on the reduction and alkylation procedure (n = 2). The ultrasonic
energy was provided by an ultrasonic bath (35 kHz, 60 % ultrasonication amplitude, 5 min
ultrasonication time); a sonoreactor (24 kHz, 50 % ultrasonication amplitude, 2 min ultrasonication
time); and an ultrasonic probe (30 kHz, 50 % ultrasonication amplitude, 2 min ultrasonication time,
0.5 mm sonotrode diameter). See Figure IV.2b) for letter identification.

Simplifying the sample handling for protein identification by PMF
118
(iii) Third assay. Once it was demonstrated that the reduction and alkylation steps could be accelerated
without protein degradation and non-desired collateral reactions, caused by the cavitation effects of
ultrasonic energy, the third assay was to perform reduction and alkylation both with ultrasonic energy.
In Figure IV.4, letters H, I and J correspond to the results achieved with the bath, the sonoreactor and
the probe, respectively. As may be seen, the number of matched peptides and percentage of sequence
coverage for both proteins was similar to the results obtained with the classic protocol, letter A.
Hence, it was concluded that protein reduction and alkylation can be performed with ultrasonic
energy, in such a way that the sample treatment time was reduced from 60 min to 10 min using the
ultrasonic bath, or 4 min using the sonoreactor or the ultrasonic probe. Neither the number of matched
peptides nor the protein sequence coverage percentage was affected by the ultrasonication process.
Again, it must be noticed that not only was time saved, but also the sample handling was simplified.
IV.4.3. Ultrasound effect on the washing, reduction and alkylation steps
As previously demonstrated, ultrasonic devices are a good alternative to accelerate and simplify the
washing, reduction and alkylation steps in the sample treatment for in-gel protein enzymatic digestion.
So, the next step was to investigate if ultrasonic energy could be applied to all the referred steps at the
same time without compromising protein identification. A mixture of standard proteins was used with
this purpose. Protein molecular masses were comprised between 14.4 and 97 kDa as follows: glycogen
phosphorylase b, 97 kDa; BSA, 66 kDa; ovalbumin, 45 kDa; carbonic anhydrase, 30 kDa; trypsin
inhibitor, 20.1 kDa; and α-lactalbumin, 14.4 kDa. The proteins were separated by SDS-PAGE and the
gel bands were submitted to the in-gel protein digestion procedure schematized in Figure IV.1, where
the washing, reduction and alkylation steps were accelerated with ultrasound as described above.
Digestion of the same mixture of standard proteins by the classic protocol was also performed. The
ultrasonic device selected was the ultrasonic bath (35 kHz, 60 % ultrasonication amplitude, 5 min
ultrasonication time) due to its higher throughput, compared to the sonoreactor and the ultrasonic
probe. Results presented in Figure IV.5 confirm that the acceleration and simplification of the sample
treatment with ultrasonic energy is a valid approach. The number of matched peptides and the protein
sequence coverage obtained for the proteins studied was virtually the same with either the classic or
the ultrasonic procedure. In addition, the protein identification score obtained was always the highest
score and was always outside of the random region.
MALDI-TOF mass spectra obtained for BSA and α-lactalbumin with the classic and ultrasonic
procedures are presented in Figure IV.6. As can be seen, the peptides formed, and their intensity, are
essentially the same regardless of the sample treatment used. In addition, the background of the
spectra is similar, which indicates that no interfering gel degradation products were formed during the
ultrasonication process.

Chapter IV
119
Figure IV.5: Ultrasound effect on the washing, reduction and alkylation steps in the in-gel protein
digestion procedure. Ultrasonic energy was from an ultrasonic bath operating at 35 kHz, 60 %
ultrasonication amplitude, during 5 min (n = 2).
A major concern for in-gel protein digestion is the sensitivity of the method. Any method capable of
reducing the sample preparation time needs to prove that the sensitivity is not compromised.
Therefore, the identification of protein samples raging from 0.5 - 0.01 µg was attempted. BSA,
ovalbumin, carbonic anhydrase, and α-lactalbumin protein standards with different concentrations
were separated by SDS-PAGE and the corresponding gel bands were processed according to the in-gel
protein digestion procedure schematized in Figure IV.1. The washing, reduction and alkylation steps
were accelerated with ultrasound as described above. To increase the sensitivity of the method, the
buffer solution containing the peptides was collected after enzymatic digestion, and the remaining
peptides were extracted from the gel as follows: 25 µL of a 50 % acetonitrile/ 0.1 % TFA solution
were added to the gel and ultrasonicated in the sonoreactor during 2 min (amplitude 50 %). The
extraction solution was added to the digestion solution, evaporated to dryness and finally redissolved

Simplifying the sample handling for protein identification by PMF
120
in 10 µL of 0.3% formic acid. This extraction step was repeated twice. Protein digestion by the classic
protocol was also performed for result comparison. As can be seen in Figure IV.7, the protein
sequence coverage and the number of matched peptides decrease with the decreasing amount of
protein used for enzymatic digestion. However, all the protein standards were identified with
confidence with both the ultrasonic and classic methods, even when low amounts of protein, such as
0.1 µg, were used. Only BSA was correctly identified with both approaches when 0.01 µg of protein
was used. Based on these results, the proposed ultrasonic method can be considered a good alternative
to the classic protocol also when low amounts of protein are analyzed.
Figure IV.6: Influence of the ultrasonic enhanced procedure on the MALDI-TOF mass spectra
obtained for BSA and α-lactalbumin after in-gel enzymatic digestion. a) BSA mass spectrum obtained
after protein digestion with the classic protocol. b) BSA mass spectrum obtained after protein
digestion with the ultrasonic enhanced protocol. c) α-lactalbumin mass spectrum obtained after protein
digestion with the classic protocol. d) α-lactalbumin mass spectrum obtained after protein digestion
with the ultrasonic enhanced protocol. The washing, reduction and alkylation steps were accelerated
with the ultrasonic bath (35 kHz, 60 % ultrasonication amplitude, 5 min ultrasonication time).

Chapter IV
121
Figure IV.7: Effect of ultrasonic energy on the washing, reduction and alkylation steps for the in-gel
digestion of low amounts of protein, ranging from 0.5 and 0.01 µg (n = 2). Ultrasonic bath parameters:
35 kHz, 60 % ultrasound amplitude; 5 min ultrasonication time.
IV.4.4. Ultrasound effect on the trypsin diffusion process into the gel
After washing, reduction and alkylation steps, the gel band is dehydrated and the trypsin solution is
added and left in an ice bath during 60 min (see step 11 in Figure IV.1) for enzyme diffusion into the
gel at low temperatures to avoid trypsin autolysis. Then, the buffer solution is added and the enzymatic
protein digestion is performed using the sonoreactor, as depicted in steps 12 and 13 in Figure IV.1.
Since ultrasonic energy increases the enzymatic activity and facilitates the diffusion of the enzyme
into the gel, the 60 min ice bath step could possibly be reduced or even suppressed using ultrasound
instead. Therefore, gel slices with α-lactalbumin and BSA (0.5 µg) were digested with trypsin in the
sonoreactor at 50 % of amplitude during 4 and 8 min without the previous ice bath step. It must be
referred that the water bath in the sonoreactor was refrigerated during the procedure to guarantee a
constant temperature in the ultrasonication process. When the slow gel rehydration step using the
trypsin solution was replaced by ultrasonication with the sonoreactor during 4 min, none of the
proteins were identified. As a consequence, a longer ultrasonication time was tested, 8 min, in which
BSA was correctly identified. Nevertheless, the protein sequence coverage (63 ± 3 %) and the number

Simplifying the sample handling for protein identification by PMF
122
of matched peptides (43 ± 1) were lower than the results obtained when the gel rehydration on ice was
performed. In addition, α-lactalbumin was not identified. The MALDI-TOF mass spectra obtained for
BSA following both procedures were different, as can be seen in Figure IV.8. Hence, when the slow
trypsin diffusion into the gel was replaced by ultrasonication with the sonoreactor, m/z fragments are
located in the low mass range (< 1600 Da), as can be seen in Figure IV.8b). In contrast, when the
digestion was completed by the classic procedure, peptide fragments had a higher molecular mass (>
1400 Da, Figure IV.8a), and a better protein sequence coverage was obtained. Regarding α-
lactalbumin, only four of the predicted peptides for this protein were observed with lower intensity
than expected (data not shown). Furthermore, high intensity peaks corresponding to trypsin autolysis
(842 and 1045 Da) were detected (data not shown).
Figure IV.8: Mass spectra obtained for BSA (0.5 µg) after sonoreactor digestion with and without gel
incubation with trypsin, on ice, during 60 min. a) Protein digestion with the sonoreactor (2 min; 50 %
ultrasonication amplitude) after incubation with trypsin on ice during 60 min. b) Protein digestion with
the sonoreactor (8 min; 50 % ultrasonication amplitude) without gel incubation with trypsin on ice.

Chapter IV
123
IV.4.5. Proof of the procedure
The identification of proteins from complex mixtures obtained from three different organisms was
performed as proof of the procedure. Protein mixtures were separated by SDS-PAGE as shown in
Figure IV.9. Gel bands containing a 15 kDa protein present in the periplasm of the Desulfovibrio
desulfuricans G20, together with two proteins present in the soluble extract of Desulfovibrio gigas and
Desulfovibrio desulfuricans ATCC 27774, at 50 and 40 kDa, respectively, were excised. The gel slices
were treated according to the classic sample treatment protocol for in-gel protein digestion as shown in
Figure IV.1, and the ultrasonic accelerated procedure, i.e. washing, reduction and alkylation steps
accelerated with an ultrasonic bath (35 kHz, 60 % ultrasonication amplitude, 5 min ultrasonication
time). Proteins were correctly identified with both procedures, and their respective sequence coverage
and number of matched peptides are summarized in Table IV.2.
Figure IV.9: SDS-PAGE analysis of the protein mixtures used as proof of the procedure. Three
protein bands were selected for PMF identification: D. desulfuricans G20, ca. 15 kDa; D. gigas NCIB
9332, ca. 50 kDa; D. desulfuricans ATCC27774, ca. 40 kDa.
IV.5. Conclusions
The time-consuming and tedious sample handling for protein identification by PMF has been revised
with the introduction of ultrasonic energy in the different steps of the sample treatment. The total time
was reduced ca. 85 % without compromising the protein sequence coverage or the number of matched

Simplifying the sample handling for protein identification by PMF
124
peptides. In addition, the sample handling was also drastically simplified. Furthermore, no background
increment was observed in the MALDI spectra. The acceleration of the different stages in the sample
treatment for protein identification by PMF can be performed, with similar results, using any of the
following ultrasonic devices: bath, probe or sonoreactor. However, the ultrasonic bath offers higher
sample throughput and so it is the recommended device for speeding up the sample handling by PMF.
We also tried to simplify the step comprising trypsin diffusion into the gel prior to protein enzymatic
digestion, but no satisfactory results were obtained.
Finally, the new sample treatment using ultrasonic energy was successfully applied for the
identification of proteins from complex mixtures of three different sulfate reducing bacteria,
demonstrating that: (a) the parameters tested on standard samples can also be applied to biological
samples; and (b) the method provides important advances for fast protein identification.
Table IV.2: Comparison of the sequence coverage (%) and number of matched peptides obtained with
the classic sample treatment and the ultrasonic enhanced procedure for proteins from a complex
mixture from different sulfate reducing bacteria (n = 2).
Classic protocol Ultrasonic bath
Protein Database Mascot
score
Sequence
coverage %
(X ± SD)
Matched
peptides
(X ± SD)
Mascot
score
Sequence
coverage %
(X ± SD)
Matched
peptides
(X ± SD)
Sulfite reductase (EC 1.8.99.1),
Desulfovibrio desulfuricans MSDB 97 ± 6 40.0 ± 1.4 17.5 ± 3.5 108 ± 1 42.5 ± 3.5 20.5 ± 0.7
Zinc resistance-associated
protein precursor, Desulfovibrio
desulfuricans (strain G20)
MSDB 131 ± 8 37.5 ± 6.4 13.5 ± 0.7 126 ± 13 46.5 ± 2.1 13.0
Sulfite reductase, dissimilatory-
type alpha subunit
(EC 1.8.99.3) (Desulfoviridin
alpha subunit) (hydrogen
sulfite reductase alpha subunit)
SwissProt 81 ± 14 47.8 ± 2.5 15.1 ± 0.7 82 ± 1 56.1 ± 4.3 21.0 ± 2.8
IV.6. Acknowledgments
R. Rial-Otero and M.G. Rivas acknowledge the Fundação para a Ciência e a Tecnologia (FCT,
Portugal) for the post-doctoral grants SFRH/BPD/23072/2005 and SFRH/BPD/29577/2006,
respectively. R. J. Carreira and F. M. Cordeiro acknowledge the doctoral grants
SFRH/BD/28563/2006 and SFRH/BD/28295/2006 from FCT. Dr. J. L. Capelo acknowledges the
MALDI-TOF-MS service of the Chemistry Department of the New University of Lisbon

Chapter IV
125
(http://www.dq.fct.unl.pt/maldi) for their helpful assistance and valuable suggestions. The research
findings reported here are protected by international laws under patent pending PCT/IB2006/052314
and PT 103 303.
IV.7. References
[1] Henzel WJ, Billeci TM, Wong T, Grimley C, Watanabe C. Proc. Natl. Acad. Sci. USA 1993; 90:
5011.
[2] Karas M, Hillenkamp F. Anal. Chem. 1988; 60: 2299.
[3] Stump MJ, Black G, Fox A, Fox KF, Turick CE, Matthews M. J. Sep. Sci. 2005; 28: 1642.
[4] Lopez-Ferrer D, Capelo JL, Vazquez J. J. Proteome Res. 2005; 4:1569.
[5] Carreira RJ, Cordeiro FM, Moro AJ, Rivas MG, Rial-Otero R, Gaspar EM, Moura I, Capelo JL. J.
Chromatogr. A 2007; 1153:291.
[6] Rial-Otero R, Carreira RJ, Cordeiro FM, Moro AJ, Fernandes L, Moura I, Capelo JL. J. Proteome
Res. 2007; 6: 909.
[7] Patents Pending PCT/IB2006/052314 and PT 103 303.
[8] Available: http:/ /www.matrixscience.com/search_form_select.html.
[9] Available: http:/ /prospector.ucsf.edu/.
[10] Brondino CD, Passeggi MC, Caldeira J, Almendra MJ, Feio MJ, Moura JJ, Moura I. J. Biol.
Inorg. Chem. 2004; 9: 145.
[11] Almendra MJ, Brondino CD, Gavel O, Pereira AS, Tavares P, Bursakov S, Duarte R, Caldeira J,
Moura JJ, Moura I. Biochemistry 1999; 38: 16366.
[12] Liu MC, Peck HD Jr. J. Biol. Chem. 1981; 256: 13159.
[13] López-Ferrer D, Cañas B, Vázquez J, Lodeiro C, Rial-Otero R, Moura I, Capelo JL. Trac-Trends
Anal. Chem. 2006; 6: 909.


127
PART III


Chapter V
129
Chapter V
ULTRASONIC ENERGY AS A NEW TOOL FOR FAST
ISOTOPIC 18O-LABELING OF PROTEINS FOR MASS
SPECTROMETRY-BASED TECHNIQUES:
PRELIMINARY RESULTS
Published in:
R. J. Carreira, R. Rial-Otero, D. López-Ferrer, C. Lodeiro, J. L. Capelo
Talanta, 2008, 76, 400–406


Chapter V
131
V.1. Abstract
Preliminary results regarding fast isotopic labeling of proteins with 18
O, combined with matrix assisted
laser desorption/ionization time-of-flight mass spectrometry analysis, are presented. Similar 16
O/18
O
isotopic labeling ratios were found for the overnight procedure (12 h) and the new fast ultrasonic
procedure (30 min) for the BSA, ovalbumin and α-lactalbumin proteins. The procedure, however,
failed to promote double 18
O isotopic labeling for the proteins ovalbumin and α-lactalbumin. Two
different ultrasonication frequencies, 35 kHz and 130 kHz, were studied with two different
ultrasonication times of 15 min and 30 min. The best results were obtained with the procedure
comprising 130 kHz of ultrasonication frequency and 30 min of ultrasonication time. For comparative
purposes the overnight isotopic 18
O-labeling procedure was performed. In addition, the new fast
isotopic labeling procedure was also studied without ultrasonication, in a water bath at 60ºC.

Ultrasonic energy as a new tool for fast isotopic 18
O-labeling of proteins: preliminary results
132
V.2. Introduction
Protein quantitation is an essential tool for proteomics and system biology studies, since it helps to
understand the function of biological processes, to quantify protein post-translational modifications or
to identify diagnosis or prognosis biomarkers, and to develop new drugs [1-3].
Relative or absolute protein quantitation can be obtained through mass spectrometry, MS, techniques.
MS-based protein quantitative methods can be traced back to the MS stable isotope labeling absolute
measurements [4], but after different improvements in the area MS-based strategies for protein
relative/absolute quantitation are currently divided into four different approaches, as follows [5]: (i) in
the chemical or “tagging” approach proteins react with a chemical reagent in a specific site; (ii) in the
biological/metabolic approach cells are cultured in media enriched with essential amino acids
containing stable isotopes, which are incorporated into the proteins during the cellular growth; (iii) in
the enzymatic incorporation approach the protein cleavage is carried out in 18
O-water and 18
O is
incorporated into the C-terminus of peptides; and (iv) in the internal standard approach a known
quantity of an isotopically-labeled synthetic peptide is added to the protein digest as internal standard.
The use of 18
O-water for isotopic labeling in protein quantitation has its origins in the work of
Sprinson and Rittenberg [6]. Enzymatic labeling with 18
O during proteolysis cleavage can be used for
relative or absolute quantitation [5, 7]. In this process, depending on the enzyme used, one or two
oxygen atoms from the solvent (H218
O) are incorporated into the peptide C-terminus. For relative
quantitation, one set of proteins is cleaved in 18
O-water while the other is hydrolyzed in 16
O-water.
Then, both samples are mixed in equal proportions to ensure that any variation that may occur in
further sample treatment steps (e.g. loss of peptides) is equivalent between them, maintaining this way
a constant ratio between the two. Relative quantitation is achieved by the measuring the ratios
obtained between the intensities of the mass peaks corresponding to the labeled and unlabeled peptides
[8]. Absolute quantitation can also be performed with 18
O enzymatic labeling by using standard
curves. These curves are done by plotting the protein concentration vs. the ratio obtained between the
intensity of a characteristic peptide from the protein, and the intensity of an external synthetic peptide
used as internal standard, which is also labeled during the protein enzymatic cleavage or later. The
internal standard is added in a fixed quantity to the sample. After MS analysis, the ratio of the
endogenous to the synthetic peptide is measured, and the absolute amount of the endogenous peptide
can be calculated [9, 10]. Enzymatic labeling with 18
O-water has the following advantages: (i) easy
labeling procedures; (ii) all peptides present in the sample are labeled; and (iii) it requires only the
presence of 18
O-water, avoiding extra-reagents or synthetic steps.
Some drawbacks, however, inherent to this type of labeling need to be overcome. Systematic studies
have shown that different types of proteolytic enzymes incorporate different levels of 18
O from water

Chapter V
133
during digestion [5]. Ideally, the incorporation of two 18
O (18
O2), i.e. a mass shift of 4 Dalton (Da),
would be the minimum required to obtain appreciable m/z changes in the mass spectrum between
labeled and unlabeled samples, avoiding the 13
C interference or isotopic peak overlapping. The
incorporation of a single 18
O (18
O1), yields a mass increment between each sample of only 2 Da, which
is not adequate to produce an appreciable change in m/z, especially for multiply charged species.
Furthermore, the procedure for isotopic labeling is a time-consuming approach which can take from
12 to 48 h.
Ultrasonic energy has been used in chemistry to speed up the kinetics of chemical reactions [11, 12].
Remarkably, ultrasonic energy has been recently reported as a tool for the acceleration of enzymatic
protein digestion from overnight (12 h) to only a few min [13, 14]. However, the potential of
ultrasonic energy to accelerate the 18
O enzymatic labeling process and to increase the ratio of 18
O-
incorporation into the peptides is still unknown.
In this work we report our preliminary results regarding the acceleration of the enzymatic 18
O isotopic
labeling reaction with ultrasonic energy. With this goal, 18
O-labeling with ultrasonic energy provided
by an ultrasonic bath at 60ºC was studied. The influence of the ultrasonic frequency was also studied
by using 35 kHz and 130 kHz ultrasonic transducers. In addition, for comparative purposes the
overnight labeling and labeling in water at 60ºC with no ultrasound were also performed.
V.3. Experimental
V.3.1. Apparatus
Protein digestion/labeling was carried out in 0.5 mL safe-lock tubes from Eppendorf (Hamburg,
Germany). A minicentrifuge, model Spectrafuge-mini, from Labnet (Madrid, Spain), and a
minicentrifuge-vortex, model Sky Line, from ELMI (Riga, Latvia) were used throughout the sample
treatment, when necessary. Milli-Q natural abundance (H216
O) water was obtained from a SimplicityTM
185 from Millipore (Milan, Italy). An ultrasonic bath, model Transsonic TI-H-5, from Elma (Singen,
Germany) with temperature and amplitude control was used.
V.3.2. Materials and Reagents
Bovine serum albumin, BSA (66 kDa, > 97 %), α-lactalbumin (14.4 kDa, ≥ 85 %), ovalbumin (45
kDa), and trypsin (proteomics grade) used in all experiments, were purchased from Sigma (Steinheim,
Germany). Protein reduction and alkylation were performed, respectively, with DL-dithiothreitol
(DTT, 99 %) and iodoacetamide (IAA) from Sigma. The following reagents were used during sample

Ultrasonic energy as a new tool for fast isotopic 18
O-labeling of proteins: preliminary results
134
digestion/labeling: ammonium bicarbonate buffer (AmBic, pH 8.5, ≥ 99.5 %) and formic acid (FA, 98
%) from Fluka (Buchs, Switzerland); H218
O (95 atom %) from ISOTEC™ (Miamisburg, OH, USA).
α-Cyano-4-hydroxycinnamic acid (α-CHCA, ≥ 99.0 %), acetonitrile (99.9 %) and trifluoroacetic acid
(TFA, 99 %) were from Fluka, Sigma-Aldrich and Riedel-de Haën (Seelze, Germany), respectively.
ProteoMass™ Peptide MALDI-MS calibration kit (MSCAL2) from Sigma was used as mass
calibration standard for MALDI-TOF-MS.
V.3.3. Sample treatment
A stock solution of BSA, ovalbumin and α-lactalbumin (100 pmol/µL) was prepared in AmBic (100
mM) using natural abundance water. Reduction was performed with DTT (10 mM) at 37ºC for 1 h and
alkylation was performed with IAA (50 mM) at room temperature (RT) during 45 min in the darkness.
Then aliquots (10 µL) of the protein solution were diluted to 100 µL with AmBic (100 mM) prepared
in natural abundance water or in 95 % 18
O-enriched water. Trypsin (2 %, v/v) was added to these
solutions to a final concentration of 0.47 pmol/µL. The substrate to enzyme ratio was 20:1 (mol/mol).
Different digestion and labeling procedures were tested: (i) overnight/labeling (12 h) digestion at
37ºC; (ii) digestion/labeling at 60ºC in an ultrasonic bath (70 % of ultrasonication amplitude and 35
kHz of ultrasonication frequency) during 15 or 30 min; (iii) digestion/labeling at 60ºC in an ultrasonic
bath (70 % of ultrasonication amplitude and 130 kHz of ultrasonication frequency) for during 15 or 30
min; and (iv) digestion/labeling at 60º C during 15 and 30 min with no ultrasound. To stop the
enzymatic digestion/labeling reactions, 5 µL of formic acid (50 %, v/v) were added. A comprehensive
scheme of the sample treatment is presented in Figure V.1.
V.3.4. MALDI-TOF-MS analysis
Prior to MALDI-TOF-MS analysis, the samples were mixed in a 1:1 ratio with the α-CHCA (10
µg/µL) matrix solution prepared in 50 % acetonitrile/ 0.1 % TFA. Then, 1 µL of each sample was
hand-spotted onto a stainless steel MALDI-TOF-MS plate and allowed to dry.
MALDI mass spectra were obtained with a Voyager DE-PRO™ Biospectrometry™ Workstation
model from Applied Biosystems (Foster City, USA), equipped with a nitrogen laser radiating at 337
nm. Measurements were carried out in the reflectron positive ion mode, with 20 kV of accelerating
voltage, 75.1 % of grid voltage, 0.002 % of guide wire and a delay time of 100 ns. Two close external
calibrations were performed with the monoisotopic peaks of the bradykinin, angiotensin II, P14R and
ACTH peptide fragments (m/z [M+H]+: 757.3997, 1046.5423, 1533.8582 and 2465.1989,
respectively). 500 laser shots were summed per spectrum. The spectra analysis was performed with the
Data Explorer™ software (version 4.0) from Applied Biosystems.

Chapter V
135
The following search engines were used to identify the obtained peptide mass fingerprints: MASCOT
[http://www.matrixscience.com/search_form_select.html] and PROTEIN PROSPECTOR
[http://prospector.ucsf.edu/]. Search parameters: (i) Database: SwissProt. 2006; (ii) molecular mass
(MW) of protein: all; (iii) one missed cleavage; (iv) fixed modifications: carbamidomethylation (C);
(v) variable modifications: oxidation (M), 18
O1 and 18
O2 label (C-term); (vi) peptide tolerance up to
150 ppm. If the protein identification score is located out of the random region and the protein scores
first, then a match is considered successful.
Figure V.1: Comprehensive scheme of the 18
O-isotopic labeling sample treatment.

Ultrasonic energy as a new tool for fast isotopic 18
O-labeling of proteins: preliminary results
136
V.3.5. Isotopic peak deconvolution
Isotopic peak deconvolution was performed with the deisotope function of the Data Explorer™
software (version 4.0) from Applied Biosystems. This function is an advanced peak filtering method
that uses a deisotoping algorithm to determine the relative abundance of multiple components with
overlapping isotope distributions [15]. The deisotope function reduces the spectrum to a centroided
plot by deconvolution of the monoisotopic peaks from the peak list. For each peak in the spectrum, the
software inspects the peak list for the higher theoretical masses and areas associated with additional
expected peaks in a theoretical isotopic cluster. Moreover, to test the correct applicability of this
function, the mathematical algorithm for deconvolution described by Yao and coworkers [16] was also
used in the first steps of this work, and the results were compared.
V.4. Results and discussion
V.4.1. The isotopic labeling and the deconvolution problem
Figure V.2 presents the MALDI-TOF-MS spectra of the peptide fragment (YLYEIAR)H+ (m/z = 927
Da) obtained from the tryptic digestion of BSA under the conditions briefly described in the caption of
the figure (for further details refer to the sample treatment section). The peptide (YLYEIAR)H+ is
used throughout this manuscript for explanation purposes because the best isotopic labeling was
obtained with this peptide. As referred in the introduction section, the incorporation of one 18
O (18
O1)
yields a mass increment for each isotopic peak of 2 Da while the incorporation of two 18
O (18
O2) yields
a mass increment of 4 Da (see Figure V.2a and Figure V.2b). To avoid isotopic peak overlapping, 100
% of 18
O2- labeling should be achieved. The difference in the isotopic pattern due to the variable
labeling and its consequences for spectra interpretation can be easily explained through Figure V.2,
spectra a – c. Spectrum a, corresponds to the BSA overnight digestion in 16
O-water and the isotopic
pattern is similar to the natural isotopic distribution, as showed in Table V.1, with the following main
m/z peaks being obtained: 927, 928 and 929 Da. Ideally, the isotopic labeling should incorporate two
18O, resulting in a mass increment of 4 Da for each mass peak. Therefore, the following main m/z
peaks should be expected in a complete (100 %) 18
O2-labeling: 931 Da (= 927 + 4), 932 Da (= 928 +
4), and 933 Da (= 929 + 4). Experimentally, however, this does not occur because the double oxygen
incorporation yield is not 100 %. This is the reason why spectrum b (Figure V.2) presents mass peaks
at 929 Da and 930 Da, which would not be present in a complete 18
O2-labeling reaction. The mass
peak at 929 Da observed in Figure V.2 b refers to the single labeled peptide signal (YLYEIAR)H+
(927 + 2 Da) plus the contribution of the isotope cluster from the unlabeled peptide. The mass peak at
931 Da corresponds to the double labeled peptide signal (YLYEIAR)H+ (927 + 4) plus the
contribution from the isotope cluster of single labeled peptides (929 + 2). Since there is no way to
know the number unlabeled, single labeled or double labeled peptides, it is necessary to use

Chapter V
137
complicated mathematical procedures for spectra deconvolution [7-9]. To better understand this
problem, consider spectra d – f present in Figure V.2, were different intensities for the mass peaks 929
and 931Da were obtained for the same sample and the same concentration, as a result of the different
conditions used in the isotopic labeling reaction. This indicates that different degrees of labeling
(single or double) are obtained as a function of the sample treatment.
Figure V.2: Reflectron positive ion mode MALDI-TOF mass spectra of the peptide fragment
(YLYEIAR)H+ obtained in the tryptic digest of BSA. a) Overnight digestion in 100 % H2
16O buffer
solution at 37ºC (ca. 12 h). b) Overnight digestion in 95 % atom H218
O buffer solution at 37ºC (ca. 12
h). c) Ultrasonic bath digestion in 95 % atom H218
O buffer solution at 60ºC (35 kHz frequency; 70 %
amplitude; 30 min); d) Ultrasonic bath digestion in 95 % atom H218
O buffer solution at 60ºC (130 kHz
frequency; 70 % amplitude; 15 min); e) Ultrasonic bath digestion in 95 % atom H218
O buffer solution
at 60ºC (130 kHz frequency; 70 % amplitude; 30 min); f) Water bath digestion in 95 % atom H218
O
buffer solution at 60ºC (30 min).
Table V.1: Theoretical vs. experimental isotopic distribution for the tryptic peptide fragment
(YLYEIAR)H+ from BSA digestion.
Mass (m/z)
[M+H+]
Theoretical isotopic
distributiona
Experimental
isotopic distributionb
Mass (m/z)
after 18
O1 incorporation
Mass (m/z)
after 18
O2 incorporation
927 100.0 100 929 931
928 53.8 54.1 930 932
929 16.6 15.6 931 933
930 3.7 3.4 932 934
a Isotopic distribution calculated with the isotopic calculator function of the Data Explorer™ software
(version 4.0) from Applied Biosystems.
b Experimental ratios obtained for overnight digested BSA samples. Values were acquired with a
MALDI-TOF-MS system in the reflectron positive ion mode (n=2).

Ultrasonic energy as a new tool for fast isotopic 18
O-labeling of proteins: preliminary results
138
V.4.2. Influence of the sample treatment on the 18
O-labeling (16
O/18
O)
The proteolytic 18
O-labeling method can be performed by two different approaches, as described
below. In the first approach, named as “direct labeling”, the 18
O-labeling occurs at the same time than
enzymatic digestion [8, 9]. This means that the enzymatic cleavage is performed in 18
O-water,
normally at the pH recommended by the companies (pH = 8.5) to obtain the best enzymatic efficiency.
The second approach, named as “decoupled procedure”, was first reported by Yao et al. [17], and
briefly, the labeling process is completed in two steps, as follows: first, the enzymatic digestion is
performed in 16
O-water, at the enzyme’s optimal pH and then, after 16
O-water evaporation, the labeling
process occurs in 18
O-water at a lower pH (5-6). The 18
O-labeling decoupled process is based on recent
literature, which suggests that to obtain almost complete 18
O-labeling, the pH of the labeling reaction
should be shifted toward acidic pHs, instead of performing the reaction at the optimal pH of the
enzyme [7]. Although, the decoupled procedure has the advantage of separating the digestion and
labeling steps, allowing their conditions to be individually optimized, in our experiments we decided
to use the direct labeling approach as mentioned above, since it was expected a smaller technical
variation due to the reduced number of sample handling steps. In addition, the development of on-line
approaches for mass spectrometry is facilitated because the direct labeling is performed in one single
step.
The 18
O-labeling process can be divided into two chemical reactions, as follows.
(i) First reaction: amide bond cleavage.
(ii) Second reaction: carboxyl oxygen exchange.
The first experiments were carried out to study the influence of ultrasonic energy on the total
enzymatic labeling of peptides with 18
O. The ratio 16
O/18
O refers to the amount of 18
O incorporated in
the labeling process, no matter the type of labeling (single or double). Table V.2 shows the 16
O/18
O
ratios of different peptides obtained from the tryptic digestion of BSA using the different sample
treatments studied in this work.
Concerning the overnight protocol (12 h), the 18
O-incorporation yield obtained for all the BSA
peptides (Table V.2) was higher than 95 % (16
O/18
O ratios lower than 0.05).

Chapter V
139
Table V.2: 16
O/18
O ratios of different peptides obtained from the tryptic digestion of BSA, ovalbumin
and α-lactalbumin (900 pmol each protein), in the presence of 95 % H218
O. Different labeling methods
were used in this experimental: overnight (12 h); ultrasonic bath (35 kHz; 70 % amplitude, 60ºC, 15
and 30 min); ultrasonic bath (130 kHz; 70 % amplitude, 60ºC, 15 and 30 min); water bath (60ºC, 15
and 30 min). Values were obtained after MALDI-TOF-MS analysis in the reflectron positive ion mode
(n=2).
Protein Peptide Fragment [M+H]
+
(m/z)
Overnight
(12 h)
US bath
35 kHz
US bath
130 kHz
Water
bath Time
BSA
(YLYEIAR)H+ 927.49 0.01 0.02
0.07 0.01 0.03 ± 0.01 0.04 0.00 15 min
0.05 0.00 0.02 ± 0.01 0.03 0.03 30 min
(ALKAWSVAR)H+ 1001.59 a
0.08 0.02 0.03 ± 0.04 0.06 0.01 15 min
0.06 0.03 0.06 ± 0.05 0.05 0.03 30 min
(RHPEYAVSVLLR)H+ 1439.82 0.04 0.01
0.11 0.02 0.05 ± 0.02 0.08 0.01 15 min
0.11 0.02 0.06 ± 0.01 0.07 0.01 30 min
(LGEYGFQNALIVR)H+ 1479.80 0.04 0.01
0.31 0.05 0.08 ± 0.01 0.12 0.02 15 min
0.23 0.06 0.11 ± 0.04 0.13 0.01 30 min
(KVPQVSTPTLVEVSR)H+ 1639.94 0.03 0.02
0.11 0.03 0.08 ± 0.00 0.11 0.02 15 min
0.08 0.03 0.08 ± 0.02 0.06 0.05 30 min
Ovalbumin
(VYLPR)H+ 647.39 0.02 ± 0.02
b
0.09 ± 0.00
b 30 min
(HIATNAVLFFGR)H+ 1345.74 0.03 ± 0.01 0.13 ± 0.01
(GGLEPINFQTAADQAR)H+ 1687.84 0.07 ± 0.06 0.11 ± 0.01
(ELINSWVESQTNGIIR)H+ 1858.97 0.19 ± 0.17 0.15 ± 0.01
(LYAEERYPILPEYLQCVK)H+ 2284.17 0.08 ± 0.03 0.15 ± 0.02
α-Lactalbumin
(CEVFR)H+ 710.33 0.03 ± 0.00
b
0.14 ± 0.01
b 30 min
(VGINYWLAHK)H+ 1200.65 0.04 ± 0.03 0.14 ± 0.03
(EQLTKCEVFR)H+ 1309.66 a 0.14 ± 0.01
(ILDKVGINYWLAHK)H+ 1669.94 0.09 ± 0.07 0.17 ± 0.01
a Peptide not present in the spectra. This peptide has a missed cleavage.
b Experimental was not performed.
Regarding 18
O-incorporation yield obtained with the ultrasonic bath at 130 kHz of ultrasonication
frequency at 60ºC, and with the water bath at 60ºC (no ultrasonication), data in Table V.2 show that
similar results were obtained with both methods: a labeling efficiency of ca 90 % (16
O/18
O ratios lower
than 0.13). In addition, the yields of incorporation were close to the ones obtained by the overnight
protocol. For the peptides with higher mass values labeling results obtained were slightly worst, but
the labeling efficiency was still ≥ 90 %.

Ultrasonic energy as a new tool for fast isotopic 18
O-labeling of proteins: preliminary results
140
As far as the sample treatment with 35 kHz of ultrasonication frequency at 60ºC concerns, data in
Table V.2 suggests a relation between the labeling efficiency and the ultrasonication frequency.
Hence, the 18
O-incorporation was worse than the one obtained with the same time and the same
temperature, but with a higher ultrasonication frequency of 130 kHz.
On the overall, for the aforementioned treatments, the labeling efficiency was not the same for all
peptides. It seems that the labeling yield is related with the peptide size. Therefore, as presented in
Table V.2, labeling efficiencies lower than 90 % (16
O/18
O ratios higher than 0.11) were obtained for
the peptides (RHPEYAVSVLLR)H+, (LGEYGFQNALIVR)H
+ and (KVPQVSTPTLVEVSR)H
+, with
mass peaks of 1439, 1479 and 1639 m/z, respectively. On the other hand, labeling efficiencies higher
than 90 % (16
O/18
O ratios lower than 0.11) were obtained for the peptides (YLYEIAR)H+ and
(ALKAWSVAR)H+ with masses of 927 and 1001 m/z, respectively. Interesting, this problem was not
observed when the labeling process was performed overnight. This fact suggests that the time range
(15 min and 30 min) selected to speed up the enzymatic digestion and labeling reaction with
ultrasound, or heating at 60ºC, was not enough to increase the reaction rates of the enzymatic process.
A further explanation can be suggested, considering that the labeling yields were similar for the
ultrasonic process at 130 kHz of ultrasonication frequency at 60ºC, and for the water bath at 60ºC. So,
although different authors have suggested that ultrasonication can accelerate the enzymatic reactions,
little attention has been given to the type of device used to perform such treatment, which can be an
ultrasonic bath, like in this work, or an ultrasonic probe [18, 19]. Thus, for a given volume of solution,
the ultrasonic intensity obtained with an ultrasonic bath is 100 times lower than the ultrasonic intensity
obtained with an ultrasonic probe [20]. The low 18
O-labeling yields, obtained with the ultrasonication
treatment for the higher mass peptides, can be related to the low ultrasonication intensity of the
ultrasonic bath. In this case, the 16
O/18
O labeling yield observed for the ultrasonic bath sample
treatment can be linked to the temperature at which the labeling reaction was performed, rather than
the ultrasonic energy. In fact, the labeling ratios for the sample treatment with the 130 kHz ultrasonic
bath at 60ºC and with the water bath at 60ºC, without ultrasonication, were similar for all BSA
peptides. Nevertheless, as we will see below, the 18
O1/18
O2 labeling efficiencies obtained with both
methods were completely different.
Another interesting finding was the relation between the different isotopic labeling yields and the
frequency of ultrasound used, as referred previously. The ultrasonic bath used in this work provides
ultrasound with two different ultrasonication frequencies: 35 kHz and 130 kHz. As can be seen in
Table V.2, the results obtained with the ultrasonic bath operating at 130 kHz and 60ºC are similar to
the overnight protocol for all the BSA peptides considered, but the labeling yield achieved with 35
kHz of ultrasonication frequency was lower, specially for the peptide (LGEYGFQNALIVR)H+. The
explanation can be as follows: when ultrasonic energy is provided to a liquid media, an effect known
as cavitation occurs. This effect is responsible for the generation of small gas bubbles, which grow in

Chapter V
141
successive cycles, according to the frequency of ultrasound, and collapse violently when they reach an
unstable size. The temperature and pressure near the collapse point can reach values up to 5000ºC and
1000 atm respectively [21]. This energy is transmitted to the liquid media and the mass transfer
processes are enhanced in a more effective manner than when only heat is used. Two types of
cavitation can be produced by ultrasound: transient cavitation and stable cavitation. Most of the
physical and chemical effects produced by ultrasound are associated with the collapse of transient
cavitation bubbles [21], which are dominant at lower frequencies, i.e. 35 kHz. However, as the
frequency increases, so it does the fraction of stable cavitation bubbles formed. As the ratio between
transient to stable cavitation bubbles changes, the sonochemical effects are altered. Therefore, we
hypothesize that the worst performance of the enzymatic labeling at lower frequencies (i.e. 35 kHz) is
directly linked with the increasing number of transient cavitation bubbles formed.
V.4.3. Influence of the sample treatment on the double 18
O-labeling degree (18
O1/18
O2)
One of the major issues regarding the application of 18
O-labeling to quantitative proteomics is the
variable 18
O-incorporation into the peptide C-terminus [7-9]. This variability is related with the nature
of the two reactions involved in the 18
O-labeling process: the amide bond hydrolysis and the carboxyl
oxygen exchange reaction. While in the first reaction one 18
O atom is incorporated by the peptide
during the enzymatic digestion, at least five cycles of the second reaction are necessary to obtain an
18O2-incorporation yield of ca. 98.5 % [7]. This reaction is extremely slow under the common
conditions used, leading to variable exchange within the timeframe of the proteolytic reaction [17].
The cavitation phenomena generated by ultrasonic energy enhances both labeling reactions, but in the
second reaction the forward and backward processes are probably both accelerated. It must also be
referred that dedicated literature suggests that when ultrasound is applied for a short period of time,
the enzymatic reactions are accelerated, while longer ultrasonication periods promote the inactivation
of the enzyme [18]. Therefore, the control of the carboxyl oxygen exchange reaction (second reaction)
is critical to overcome the 18
O-incorporation variability. Table V.3 presents data regarding the single
to double labeling ratios (18
O1/18
O2) obtained for BSA with the different sample treatments studied. As
can be seen, the 18
O1/18
O2 labeling ratio follows the same pattern than the 16
O/18
O ratio. This means
that the best results were obtained with the overnight protocol: 18
O1/18
O2 ratio lower than 0.35,
corresponding to double (18
O2) incorporation higher than 75 %. Regarding the other sample treatments
studied, only the acceleration with the 130 kHz ultrasonic bath at 60ºC accomplished relative success.
It is remarkable that the water bath at 60ºC, although capable of producing 16
O/18
O labeling ratios
similar to the 130 kHz ultrasonic bath at 60ºC, failed in promoting double 18
O incorporation.
As far as the peptide size is concerned, the double labeling with the overnight protocol, or with the 130
kHz ultrasonic bath at 60ºC, were the most robust procedures, with similar results: the peptides
(YLYEIAR)H+ and (ALKAWSVAR)H
+ (m/z = 927 and 1001, respectively) were double labeled with

Ultrasonic energy as a new tool for fast isotopic 18
O-labeling of proteins: preliminary results
142
a yield higher than 70 % (18
O1/18
O2 ratio lower than 0.43). Nevertheless, for the peptides
(RHPEYAVSVLLR)H+, (LGEYGFQNALIVR)H
+ and (KVPQVSTPTLVEVSR)H
+ (m/z = 1439,
1479 and 1639, respectively) a double labeling efficiency of ca. 70 % was achieved with the overnight
protocol, while lower double labeling yields were obtained with the ultrasonic protocol (130 kHz and
60ºC).
Table V.3: 18
O1/18
O2 ratios of different peptides obtained from the tryptic digestion of BSA,
ovalbumin and α-lactalbumin (900 pmol each protein), in the presence of 95 % H218
O. Different
labeling methods were used in this experimental: overnight (12 h); ultrasonic bath (35 kHz; 70 %
amplitude, 60ºC, 15 and 30 min); ultrasonic bath (130 kHz; 70 % amplitude, 60ºC, 15 and 30 min);
water bath (60ºC, 15 and 30 min). Values were obtained after MALDI-TOF-MS analysis in the
reflectron positive ion mode (n=2).
Protein Peptide Fragment [M+H]
+
(m/z)
Overnight
(12 h)
US bath
35 kHz
US bath
130 kHz
Water
bath Time
BSA
(YLYEIAR)H+ 927.49 0.32 0.04
1.30 0.16 0.41 ± 0.05 0.80 0.08 15 min
0.80 0.23 0.42 ± 0.01 0.51 0.19 30 min
(ALKAWSVAR)H+ 1001.59 a 1.50 0.33 0.40 ± 0.03 0.12 0.38 15 min
0.83 0.18 0.32 ± 0.09 0.55 0.07 30 min
(RHPEYAVSVLLR)H+ 1439.82 0.29 0.05
4.33 0.61 0.77 ± 0.07 1.42 0.02 15 min
2.11 0.84 0.76 ± 0.01 0.84 0.48 30 min
(LGEYGFQNALIVR)H+ 1479.80 0.34 0.04
3.51 0.27 1.15 ± 0.04 1.33 0.23 15 min
2.59 0.30 1.21 ± 0.26 1.09 0.21 30 min
(KVPQVSTPTLVEVSR)H+ 1639.94 0.30 0.00
24.21 2.17 3.61 ± 0.18 7.77 5.37 15 min
21.07 17.47 3.06 ± 0.13 2.63 1.03 30 min
Ovalbumin
(VYLPR)H+ 647.39 0.36 ± 0.06
b
2.12 ± 0.30
b 30 min
(HIATNAVLFFGR)H+ 1345.74 0.45 ± 0.07 3.89 ± 0.37
(GGLEPINFQTAADQAR)H+ 1687.84 0.52 ± 0.06 3.18 ± 0.48
(ELINSWVESQTNGIIR)H+ 1858.97 1.02 ± 0.93 c
(LYAEERYPILPEYLQCVK)H+ 2284.17 0.90 ± 0.87 c
α-Lactalbumin
(CEVFR)H+ 710.33 0.31 ± 0.03
b
19.38 ± 3.66
b 30 min
(VGINYWLAHK)H+ 1200.65 0.39 ± 0.21 32.25 ± 1.34
(EQLTKCEVFR)H+ 1309.66 a 37.53 ± 13.50
(ILDKVGINYWLAHK)H+ 1669.94 5.98 ± 0.43 c
a Peptide not present in the spectra. This peptide has a missed cleavage.
b Experimental was not performed.
c Double labeled peptide was not identified in the MALDI mass spectra.

Chapter V
143
It was also observed for the 130 kHz ultrasonic bath that the double labeling efficiency decreased as
the peptide mass increased. Other authors have also referred that different peptides may exhibit
different labeling efficiencies [7]. The reasons for the aforementioned fact, however, are not well
understood yet. For instance, Mirgorodskaya et al. [9] reported similar 18
O1/18
O2 ratios for peptide
fragments with masses comprised between 1050.5 and 1385.6 m/z from a RNase tryptic digest, while
Stewart et al. [8] have found 18
O1/18
O2 ratios comprised between 25 % and 80 %, as a function of the
peptide type.
V.4.4. Application to further proteins
To evaluate the efficiency of the ultrasonic procedure at 60ºC and 130 kHz, α-lactalbumin and
ovalbumin were submitted to the ultrasound developed procedure during 30 min. In addition, the
overnight procedure was also performed for comparative purposes. Results are presented in Table V.2
and Table V.3 for the 16
O/18
O and 18
O1/18
O2 labeling ratios, respectively.
Regarding ovalbumin, the labeling efficiency (16
O /18
O) was similar with both procedures. For the
overnight procedure the labeling efficiency was comprised between 84 % and 98 % (16
O/18
O ratio
between 0.19 and 0.02), while for the ultrasonic procedure the incorporation was comprised between
87 % and 92 % (16
O/18
O ratio between 0.15 and 0.09). This means that the sample treatment time
necessary to perform the isotopic labeling can be reduced from ca. 12 h to 30 min when
ultrasonication is used. However, the ultrasonication treatment failed in promoting double 18
O-
incorporation. As presented in Table V.3, for the overnight procedure the double labeling efficiency
was comprised between 50 % and 73 %, (18
O1/18
O2 ratio between 1 and 0.36), while for the ultrasonic
process the double incorporation was comprised between 20 % and 32 % (18
O1/18
O2 ratio between 4
and 2.1).
Concerning α-lactalbumin, the 18
O-labeling efficiency (Table V.2) for the overnight procedure was
comprised between 65 % and 97 % (16
O/18
O ratio comprised between 0.54 and 0.03), while for the
ultrasonic procedure the labeling efficiency was comprised between 85 % and 88 % (16
O/18
O ratio
comprised between 0.17 and 0.14). However, the ultrasonication treatment was almost non-effective in
promoting the double oxygen incorporation (Table V.3). The best double incorporation was for the
peptide fragment (CEVFR)H+, and it was as poor as 5 % (
18O1/
18O2 ratio higher than 19). The double
incorporation for the same peptide with the overnight protocol was 76 % (18
O1/18
O2 ratio = 0.31).
V.5. Future prospects
Overall, the possibility of speeding up 18
O isotopic labeling from 12-48 h to 30 min using an 130 kHz
ultrasonication bath is a reliable approach, that deserves further investigation due to the importance of

Ultrasonic energy as a new tool for fast isotopic 18
O-labeling of proteins: preliminary results
144
protein quantitation in biomarker discovery and clinical diagnosis. It is clear, from the data presented
here, that ultrasonication can accelerate the 18
O-labeling, but it seems to fail in promoting the double
18O-incorporation (
18O2). However this drawback seems to be protein dependant. In addition, for the
same protein, when ultrasonication is used, the double 18
O-incorporation is also peptide dependant.
Therefore, further research needs to be carried out, focusing on the following variables: (i) regarding
ultrasonic energy, it is necessary to establish if the ultrasonic frequency is a parameter of major
importance; (ii) it is also essential to test other ultrasonic devices, such as the sonoreactor or the
ultrasonic probe. Preliminary results obtained in our laboratory suggest that important differences in
the 18
O-labeling efficiency can be achieved, depending on the ultrasonic device used to enhance the
labeling process. Finally, the protein variable must be assessed and the sample treatment must be
studied, linking the ultrasonic efficiency to the physical and chemical characteristics of the protein. In
addition, special attention must be paid to the 18
O-incorporation as a function of the type of peptide.
V.6. Conclusions
Our preliminary results demonstrate that ultrasonic energy has great potential to enhance the
enzymatic isotope labeling of peptides with 18
O. The time needed to perform the isotopic labeling can
be reduced from 12-48 h to 30 min, using a 130 kHz ultrasonic bath at 60ºC, with similar results to the
ones obtained with the overnight protocol, depending on the protein.
Similar 16
O /18
O ratios were obtained for BSA, ovalbumin and α-lactalbumin with the ultrasonic
(ultrasonic bath, 130 kHz, 70 % amplitude, 30 min) and overnight procedures. However, the 18
O1/18
O2
labeling ratios obtained with the ultrasonic procedure were considered acceptable only for BSA.
The ultrasound frequency (35 kHz vs. 130 kHz) was found to be a critical parameter on the
performance of the ultrasonic bath in the labeling process. This finding is essential to re-think
ultrasonic applications in the analytical laboratory for proteomics purposes. It must be referred that
most ultrasonic devices used at present, work at low frequencies such as 20 kHz, 22 kHz, 30 kHz or 35
kHz.
Further research work is being carried out in our laboratory to elucidate the key parameters on this
new methodology, including the use of different ultrasonic devices with different operating
frequencies.
V.7. Acknowledgments
R. Rial-Otero and R.J. Carreira acknowledge the postdoctoral grant SFRH/BPD/23072/2005 and the
doctoral grant SFRH/BD/28563/2006, respectively, from FCT (Fundação para a Ciência e a

Chapter V
145
Tecnologia) from Portugal. Dr. J. L. Capelo acknowledges the MALDI-TOF-MS service of the
Chemistry Department of the New University of Lisbon (http://www.dq.fct.unl.pt/maldi) for their
helpful assistance and valuable suggestions. The research findings here reported are protected by
international laws under patent pending PCT/IB2006/052314 and PT 103 303. FCT is also
acknowledged for financial support under the project POCI/ QUI/55519/2004 FCT-FEDER.
V.8. References
[1] M. Hamdam, P. G. Righetti, Mass Spectrom. Rev. 21 (2002) 287-302.
[2] S. Sechi, Y. Oda, Curr. Opin. Chem. Biol. 7 (2003) 70-77.
[3] W. W. Wu, G. Wang, S. J. Baek, R. F. Shen, J. Proteome. Res. 5 (2006) 651-658.
[4] A. P. De Leenheer, L. M. Thienpont, Mass Spectrom. Rev. 11 (1992) 249-307.
[5] M. Bantscheff, M. Schirle, G. Sweetman, J. Rick, Bernhard Kuster, Anal. Bioanal. Chem. 389
(2007) 1017-1031.
[6] D. B. Sprinson and D. Rittenberg, Nature 167 (1951) 484.
[7] M. Miyagi, K. C. S. Rao, Mass Spectrom. Rev. 26 (2007) 121-136.
[8] I. I. Stewart, T. Thomson, D. Figeys, Rapid Commun. Mass Spectrom. 15 (2001) 2456-2465.
[9] O. A. Mirgorodskaya, Y. P. Kozmin, M. I. Titov, R. Korner, C. P. Sonksen, P. Roepstorff, Rapid
Commun. Mass Spectrom. 14 (2000) 1226-1232.
[10] Y. Oda, K. Huang, F. R. Cross, D. Cowburn, B. T. Chait, PNAS 96 (1999) 6591-6596.
[11] P. Bermejo, J. L. Capelo, A. Mota, Y. Madrid and C. Cámara, Trac-Trend Anal. Chem. 23 (2004)
654-663.
[12] C. Fernandez, Antonio C. L. Conceição, R. Rial-Otero, C. Vaz, J. L. Capelo, Anal. Chem. 78
(2006) 2494-2499.
[13] D. López-Ferrer, J. L. Capelo, J. Vázquez, J. Proteom. Res. 4 (2005) 169-1574.
[14] R. Rial-Otero, R. J. Carreira, F. M. Cordeiro, A. J. Moro, M. G. Rivas, L. Fernandez, I. Moura, J.
L. Capelo, J. Proteom. Res. 6 (2007) 909-912.
[15] Data Explorer software user’s guide, section 3, pag 45-47.
[16] X. Yao, A. Freas, J. Ramirez, P. A. Demirev, C. Fenselau, Anal. Chem. 73 (2001) 2836.
[17] X. Yao, C. Afonso, C. Fenselau, J. Proteom. Res. 2 (2003) 147-152.
[18] M. M. R. Talukder, M. M. Zaman, Y. Hayashi, J. C. Wu, T. Kawanishi, Biocat Biotrans 24
(2006) 189-194.
[19] E. Bracey, R. A. Stenning, B. E. Brooker, Enzyme Microb. Technol. 22 (1998) 147-151.
[20] H. M Santos, J. L. Capelo, Talanta 73 (2007) 795-802.
[21] T. J. Mason, Sonochemistry, Oxford University Press, Oxford, UK, 1999.


Chapter VI
147
Chapter VI
ULTRASONIC-BASED PROTEIN QUANTITATION BY 18O-
LABELING: OPTIMIZATION AND COMPARISON BETWEEN
DIFFERENT PROCEDURES
Published in:
R. J. Carreira, M. S. Diniz, J. L. Capelo
Rapid Communications in Mass Spectrometry, 2011, 25, 75–87


Chapter VI
149
VI.1. Abstract
Herein we report results regarding the optimization and comparison between different ultrasonic-based
procedures for protein quantitation by the direct 18
O-labeling approach. The labeling procedure was
evaluated using different proteins, different ultrasonic devices and different reaction times: from 30 s
to 10 min with the ultrasonic probe and from 30 s to 30 min with the sonoreactor. Variables such as
the enzyme-to-protein ratio and protein concentration were also assessed. The results show that it is
possible to accelerate the labeling reaction from 12 h to only 15 min with the sonoreactor without
compromising the labeling efficiency. A larger variation in the double labeling yield was obtained
among different peptides, but the values for the smaller peptides were similar to the ones achieved
with the classic methodology. These findings were further confirmed by labeling a complex protein
mixture from human plasma. It was also found that the labeling reaction is affected by the sample
concentration, even when performed with the classic overnight procedure.

Ultrasonic-based protein quantitation by 18
O-labeling: comparison between different procedures
150
VI.2. Introduction
The proteome of a living organism is the result of gene expression, but unlike the genome, it is highly
dynamic and influenced by cellular conditions and physiological states. To study the protein
components of biological systems we need to obtain not only information about the presence or
absence of proteins (qualitative information), but we also need to infer about the protein expression
level (quantitative information) [1].
Mass spectrometry (MS) is nowadays an essential technique in the proteomics field and, when coupled
with stable isotopic labeling (SIL) methods, MS can provide us important quantitative information [2-
5]. There are several SIL methodologies, e.g.: stable isotope labeling by amino acids in cell culture
(SILAC) [6], isotope-coded affinity tags (ICAT) [7], and isobaric tag for relative and absolute
quantitation (iTRAQ) [8]; but the 18
O enzymatic labeling of proteins is one of the most commonly
used methods, because it is a relatively cheap technique, easy to perform and versatile [9-13].
In the normal 18
O-labeling workflow one sample is labeled in 18
O-enriched water, while the other is
labeled in natural abundance 16
O-water. Then, the two samples are mixed and analyzed by MS.
Finally, the relative abundance of each sample is calculated based on the relative intensities of the
“light” and “heavy” labeled peptides provided by the mass spectrum [14]. The labeling reaction occurs
during the hydrolysis of the peptide bond and, depending on the enzyme and on the reaction
conditions, one or two 18
O-atoms from the H218
O-enriched medium are incorporated at the C-terminal
carboxyl group of the peptide [9]. Trypsin can catalyze the incorporation of two 18
O-atoms, resulting
in the ideal mass shift of + 4 Da for the labeled peptide fragment, which is the minimum mass gap
required to avoid naturally occurring isotopic interferences (e.g. 13
C, 15
N, 34
S) or isotopic overlapping
between labeled and unlabeled species in the mass spectrum. There are two main approaches for the
18O isotopic labeling of proteins: (i) the direct labeling procedure, where the isotopic labeling occurs
during the enzymatic digestion in H218
O buffered medium; or (ii) the post-digestion approach, the
decoupled procedure, where the proteins are first digested in H216
O buffered medium, dried and then
labeled in H218
O in the presence of trypsin [15]. The post-digestion approach has the advantage of
consuming less H218
O, an expensive reagent, and provides better 18
O conversion at the C-terminus of
the peptide, increasing the labeling efficiency. However, the procedures used with this approach are
generally longer, more elaborate and labor-intensive than the direct labeling protocols [16]. Due to
these disadvantages, and because the direct labeling is performed in one single step, which minimizes
technical variations and facilitates on-line approaches for MS protein quantitation, we choose this
strategy for protein labeling in this study.
Despite the advantages of 18
O-labeling over other labeling techniques, there are also some drawbacks
that can affect the labeling efficiency, such as: (i) variable 18
O-incorporation, i.e. single or double 18
O-

Chapter VI
151
incorporation at the peptide’s C-terminus; and (ii) back-exchange reaction, i.e. the post-labeling
exchange of 18
O from the peptide’s C-terminal carboxyl group with 16
O from medium contamination
with residual H216
O. To improve the double 18
O-labeling and diminish the effect of the back-exchange
reaction in the labeling efficiency, several reaction parameters, such as (i) the pH of the labeling
reaction, (ii) the H216
O/H218
O ratio and (iii) the residual enzymatic activity, need to be optimized and
controlled [12, 13, 17-19]. The time-consuming labeling reaction, 12 to 48 h, also creates a hurdle for
the application of this methodology to a wider range of protein quantitation experiments.
Ultrasonic energy has been used in proteomics methodologies to enhance protein enzymatic digestion
from overnight to min [20, 21]. More recently, we reported the application of ultrasonic energy to
accelerate the 18
O-labeling procedure with promising results. Several proteins were labeled in only 30
min in an ultrasonic bath (USB) and 16
O/18
O ratios similar to the classical approach (12 h labeling)
were obtained. However, acceptable 18
O1/18
O2 ratios were only obtained for BSA [22].
In this work, the application of direct ultrasonication with the ultrasonic probe and indirect
ultrasonication with the sonoreactor (UTR) to enhance the enzymatic 18
O-labeling reaction is
compared and reported. The influence of the type of ultrasonic device, the ultrasonication time, the
protein concentration and the enzyme concentration in the labeling efficiency, and in the 18
O
incorporation degree, were assessed, and compared to the results previously obtained with the classical
approach (overnight labeling) and with the ultrasonic bath [22].
VI.3. Experimental
VI.3.1. Apparatus
Protein digestion/labeling was performed in 0.5 mL safe-lock tubes (Eppendorf, Hamburg, Germany).
A minicentrifuge-vortex model Sky Line (ELMI, Riga, Latvia), and a minicentrifuge model
Spectrafuge-mini (Labnet, Madrid, Spain) were used during the sample treatment. Milli-Q natural
abundance (H216
O) water was obtained from a Simplicity™ 185 model (Millipore, Milan, Italy). A
UTR200 sonoreactor (200 watts, 24 kHz) and a UP100H ultrasonic probe (100 watts, 30 kHz, 0.5 mm
probe diameter) from Hielscher Ultrasonics (Teltow, Germany) were used to accelerate enzymatic
protein digestion/labeling.
VI.3.2. Standards and reagents
Bovine serum albumin, BSA (66 kDa, > 97 %), α-lacatlbumin (14.4 kDa, ≥ 85 %), ovalbumin (45
kDa), human plasma (lyophilized powder) and trypsin (proteomics grade) used throughout the
experiment were from Sigma (Steinheim, Germany) as well as the DL-dithiothreitol (DTT, 99 %) and

Ultrasonic-based protein quantitation by 18
O-labeling: comparison between different procedures
152
iodoacetamide (IAA) used for protein reduction and alkylation, respectively. Ammonium bicarbonate
buffer (AmBic, pH 8.5, ≥ 99.5 %) and formic acid (FA, ~ 98 %) were from Fluka (Buchs,
Switzerland), and the H218
O (95 atom %) used for protein isotopic labeling was from ISOTEC™
(Miamisburg, OH, USA). α-Cyano-4-hydroxycinnamic acid (α-CHCA, ≥ 99.0 %), acetonitrile (99.9
%) and trifluoroacetic acid (TFA, 99 %) were from Fluka, Sigma-Aldrich and Riedel-de Haën (Seelze,
Germany), respectively. ProteoMass™ Peptide MALDI-MS calibration kit (MSCAL2) from Sigma
was used as mass calibration standard for MALDI-TOF-MS.
VI.3.3. Sample treatment
VI.3.3.1. Protein digestion/labeling
Protein digestion/labeling was performed as previously described [22]. Briefly, stock solutions of
BSA, ovalbumin and α-lactalbumin (100 pmol/µL) were prepared in Ambic (100 mM) using natural
abundance water. The protein samples were reduced with DTT (10 mM), during 1 h at 37 ºC, and
alkylated with IAA (50 mM), in the dark at room temperature, during 45 min. Aliquots of 10 µL were
diluted to 100 µL with AmBic (100 mM) prepared in natural abundance water, or in 95 % 18
O-
enriched water. Trypsin (2 µL) was added to the samples to a final concentration of 0.47 pmol/µL and
the enzymatic digestion/labeling was accelerated with: (i) ultrasonic probe (50 % of amplitude with a
0.5 mm probe), during 30, 60, 120, 300 s and 10 min; (ii) sonoreactor (UTR) (50 % amplitude) during
30, 60, 120, 300 s, and 10, 15 and 30 min. The enzymatic reaction was stopped after the addition of 5
µL of formic acid (50 %, v/v). Three replicates were performed for every experiment (n = 3).
VI.3.3.2. Enzyme-to-protein ratio effect on the 18
O-labeling reaction
The sample treatment before protein digestion/labeling was performed like described in the previous
section. Following protein reduction and alkylation, aliquots of 10 µL of BSA (60 µg) were diluted to
100 µL with AmBic (100 mM) prepared in natural abundance water, or in 95 % 18
O-enriched water.
After the addition of 2 µL of trypsin the reaction was performed during 15 min in the sonoreactor (50
% amplitude). Different enzyme-to-protein (E:P) ratios were used for protein digestion/labeling: (i)
1:120 w/w (trypsin – 0.5 µg); (ii) 1:80 w/w (trypsin – 0.75 µg); (iii) 1:60 w/w (trypsin – 1.0 µg); (iv)
1:40 w/w (trypsin – 1.5 µg); (v) 1:30 w/w (trypsin – 2.0 µg). Formic acid (50 %, v/v, 5 µL) was added
to stop the enzymatic digestion.
VI.3.3.3. 18
O-labeling in low concentration protein samples
Protein reduction and alkylation was performed as described above. BSA samples of 2.5; 5; 15; 30 and
60 µg were digested/labeled in 100 µL of AmBic (100 mM) prepared in natural abundance water, or in

Chapter VI
153
95 % 18
O-enriched water. The E:P ratio used throughout this experimental was always 1:40 (w/w)
except for the 2.5 µg samples, which were also digested/labeled with different E:P ratios: 1:40 w/w
(trypsin – 0.0625 µg); 1:20 w/w (trypsin – 0.125 µg); 1:6.7 w/w (trypsin – 0.375 µg); and 1:3.3 w/w
(trypsin – 0.75 µg). The enzymatic reaction was performed in 15 min with the sonoreactor (50 %
amplitude), and stopped after the addition of 5 µL of formic acid (50 %, v/v).
VI.3.3.4. 18
O-labing of proteins from human plasma
Lyophilized human plasma was dissolved in 1 mL of phosphate-buffered saline (PBS, pH 7.2).
Aliquots of 100 µL were precipitated overnight at -20 ºC with 5 volumes of cold acetone. The samples
were then centrifuged at 10 000 x g during 30 min (4 ºC); the supernatant was discarded and the pellet
resuspended in 50 µL of Ambic 100 mM. Protein reduction and alkylation were performed as
described above, and then aliquots of 10 µL were diluted to 100 µL with AmBic (100 mM) prepared
in natural abundance water, or in 95 % 18
O-enriched water. Trypsin (1 µg) was added and the
enzymatic digestion/labeling reaction allowed to proceed for 15 min in the sonoreactor at 50 %
amplitude, or overnight at 37 ºC. The enzymatic reaction was stopped after the addition of 5 µL of
formic acid (50 %, v/v). All the experiments were performed in replicates of three (n = 3).
VI.3.4. MALDI-TOF-MS analysis
Before MS analysis, the samples were mixed in a 1:1 ratio with the α-CHCA matrix solution (10
µg/µL) prepared in 50 % acetonitrile/ 0.1 % TFA. Each sample (1 µL) was hand-spotted onto a
MALDI-TOF-MS stainless steel 96-well plate and allowed to dry. The mass spectra were obtained
with a Voyager DE-PRO™ Biospectrometry™ Workstation (Applied Biosystems, Foster City, USA),
equipped with a nitrogen laser radiating at 337 nm. Measurements were carried out in the reflectron
positive ion mode, with an accelerating voltage of 20 kV, 75.1 % of grid voltage, 0.002 % of guide
wire and a delay time of 100 ns. The monoisotopic peaks of bradykinin, angiotensin II, P14R and
ACTH peptide fragments (m/z [M+H]+: 757.3997, 1046.5423, 1533.8582 and 2465.1989,
respectively) were used for the external calibration of the mass spectra. A total of 500 laser shots were
summed per spectrum.
VI.3.5. Deconvolution of MALDI mass spectra
The mass spectra deconvolution was performed with the Data Explorer™ software (version 4.0) from
Applied Biosystems. This software has an advanced peak filtering method, the deisotope function, that
uses a deisotoping algorithm to determine the relative abundance of multiple components with
overlapping isotope distributions [23]. The deisotope function deconvolutes the mass spectra and
reduces the isotopic cluster to a centroided plot composed of the monoisotopic peaks from the peak

Ultrasonic-based protein quantitation by 18
O-labeling: comparison between different procedures
154
list. Additionally, to evaluate this function, the mathematical algorithm for deconvolution described by
Yao and coworkers [24] was also used in the first steps of this work, and the results were compared.
VI.4. Results and discussion
The 18
O-labeling reaction can incorporate one or two 18
O atoms at the terminal carboxylic group of the
peptide, shifting the mass value of the naturally occurring isotope distribution by + 2 or + 4 Da. Figure
VI.1 presents two theoretical cases which can occur when performing protein 18
O-labeling
quantitation. Spectrum a) represents the theoretical result obtained when the labeling reaction is
complete and all the peptides are double labeled. In this case, when the labeled sample is mixed with
the unlabeled control sample, there is no isotope overlapping in the mass spectrum between the two
peptide forms. Therefore protein relative quantitation can simply be done by measuring the relative
intensities of the monoisotopic peaks of each peptide. In case b) the labeling reaction was incomplete
and a mixture of single and double labeled peptides is generated, producing an isotopic overlap
between the non-labeled control sample and labeled sample. The variable 18
O-incorporation affects the
measuring of the relative abundances of the peptide and increases the error in the calculation of the
correct 16
O/18
O peptide ratios [3, 11, 13]. Therefore, when performing 18
O-labeling it is important to
consider not only the labeling efficiency (18
Ototal %), which measures the percentage of both single and
double labeled peptides, but also the labeling degree (18
O2 %) which measures the percentage of
double labeled peptides.
Figure VI.1: Complete 18
O-labeling vs. variable 18
O-labeling. a) Complete 18
O-labeling: theoretical
MALDI-TOF mass spectrum of a mixture (1:1) of the unlabeled (927 m/z) and the double labeled (931
m/z) peptide (YLYEIAR)H+ from BSA. b) Variable
18O-labeling: theoretical MALDI-TOF mass
spectrum of a mixture (1:1) of the unlabeled (927 m/z) and the single (929 m/z) and double labeled
(931 m/z) peptide (YLYEIAR)H+ from BSA.

Chapter VI
155
Table VI.1: Percentage of double 18
O incorporation (18
O2) at the peptide’s C-terminus. BSA (60 µg)
digestion/labeling with trypsin was performed during 12 h (overnight) and with different ultrasonic
devices: (i) ultrasonic bath (USB 130 kHz) operating at 70 % amplitude and 60ºC; (ii) ultrasonic probe
(UP) operating at 50 % amplitude and equipped with a 0.5 mm sonotrode; (iii) sonoreactor (UTR)
operating at 50 % amplitude. The ultrasonication time was comprised between 30 s and 30 min. The
five most intense mass peaks were considered: 927.49 m/z – (YLYEIAR)H+; 1001.59 m/z –
(ALKAWSVAR)H+; 1439.81 m/z – (RHPEYAVSVLLR)H
+; 1479.80 m/z –
(LGEYGFQNALIVR)H+; 1639.94 m/z – (KVPQVSTPTLVEVSR)H
+. (n=3)
18O2 %
[M+H]+
(m/z)
Ultrasonication Time Method
30 sec 60 sec 120 sec 300 sec 10 min 15 min 30 min 12h
927.49
- - - - - - - 75.61 ± 2.30 Overnight*
- - - - - 70.88 ± 2.56 70.57 ± 0.53 - USB 130 kHz*
42.88 ± 4.32 48.97 ± 12.08 63.91 ± 6.99 61.29 ± 2.76 51.81 ± 5.37 - - - UP
45.98 ± 7.69 47.72 ± 2.23 58.50 ± 4.90 63.66 ± 3.25 73.17 ± 1.04 74.75 ± 0.01 74.10 ± 0.36 - UTR
1001.59
- - - - - - - ** Overnight*
- - - - - 71.67 ± 1.57 75.67 ± 5.34 - USB 130 kHz*
29.47 ± 1.86 40.78 ± 13.83 59.09 ± 9.80 58.97 ± 3.30 56.17 ± 7.77 - - - UP
33.99 ± 5.48 37.82 ± 2.96 54.48 ± 5.78 62.73 ± 3.77 75.12 ± 5.82 71.72 ± 10.03 ** - UTR
1439.81
- - - - - - - 77.75 ± 3.28 Overnight*
- - - - - 56.60 ± 2.18 56.73 ± 0.20 - USB 130 kHz*
9.03 ± 3.22 16.12 ± 12.57 34.35 ± 13.04 29.94 ± 7.23 29.48 ± 1.64 - - - UP
14.97 ± 7.31 15.13 ± 1.95 30.36 ± 1.50 35.42 ± 6.51 60.89 ± 0.30 69.86 ± 1.97 72.29 ± 1.98 - UTR
1479.80
- - - - - - - 74.70 ± 2.02 Overnight*
- - - - - 46.63 ± 0.88 45.62 ± 5.38 - USB 130 kHz*
24.31 ± 3.55 13.17 ± 2.06 30.52 ± 6.73 23.11 ± 4.84 17.45 ± 3.09 - - - UP
34.72 ± 3.59 22.26 ± 1.76 27.85 ± 3.12 31.41 ± 1.96 52.18 ± 0.29 58.63 ± 5.79 66.92 ± 1.17 - UTR
1639.94
- - - - - - - 76.73 ± 0.01 Overnight*
- - - - - 21.72 ± 0.86 24.67 ± 0.78 - USB 130 kHz*
** ** 12.59 ± 4.11 15.52 ± 12.09 ** - - - UP
** ** 9.44 ± 2.23 10.38 ± 8.15 30.30 ± 4.67 41.12 ± 2.48 42.61 ± 2.07 - UTR
* Results previously obtained for the overnight and USB 130 kHz digestion/labeling were used for
comparative purposes [22].
** Peptide not present in the spectra.
VI.4.1. 18
O-lalebing with direct ultrasonication
The ultrasonic probe provides ultrasonic energy directly into the reaction media and the ultrasound
intensity is at least 1500 times higher than that provided by the ultrasonic bath [25]. Previous studies
reported the use of direct ultrasonication to accelerate the 18
O-labeling reaction in a post-digestion
approach with similar results to the ones obtained with the conventional protocols [26]. However,
despite accelerating the enzymatic reactions to only a few min, this workflow still remains tedious and
long due to the several drying steps required, which increase sample losses and preclude on-line

Ultrasonic-based protein quantitation by 18
O-labeling: comparison between different procedures
156
labeling approaches. Therefore, to assess the ultrasonic probe effect on peptide 18
O-labeling by the
direct labeling approach, aliquots of BSA (60 µg) were digested in the presence of H218
O and trypsin
(1 µg) with a 0.5 mm sonotrode. The ultrasonication time was between 30 s and 10 min.
Table VI.1 presents the labeling degree results (18
O2 %) obtained for several BSA peptides after
ultrasonication with the ultrasonic probe (UP). In general, the labeling degree increased with the
ultrasonication time reaching a maximum value for t = 120 s, and no improvement was achieved when
ultrasonication was performed during 5 and 10 min. In fact, the ultrasonication of liquid media with
the ultrasonic probe during long periods of time (> 2 min) leads to sample overheating and aerosol
formation, diminishing ultrasonication efficiency [27]. In addition, in a previous study developed by
our group, we demonstrated that 30 s of ultrasonication with the ultrasonic probe does not affect the
enzyme’s activity, but after 60 s the activity decreases ca. 20 % (casein hydrolysis with protease XIV).
An ultrasonication time of 120 s led to the complete inactivation of the enzyme [28]. The results
obtained also show that the double 18
O-labeling yield decreased with the increasing mass of the
peptide fragment. The smallest peptide fragment considered in this study (YLYEIAR)H+ – 927 m/z
was double labeled with an efficiency of 63.9 % (t = 120 s), while the larger peptide
(KVPQVSTPTLVEVSR)H+ – 1639 m/z presented a double labeling efficiency of only 12.6 % for the
same ultrasonication time. Considering that the oxygen exchange rate is dependent on the peptide size,
sequence and type of amino-acid [29], it is possible that the ultrasonic energy provided by the
ultrasonic probe was not sufficient to enhance the different reaction rates during the short reaction
times tested here, since when the labeling reaction was performed during 12 h at 37ºC the double
labeling yield was ca. 76 % for all the peptides [22].
Concerning the isotopic labeling efficiency (Table VI.2), i.e. the percentage of peptides labeled with at
least one 18
O (18
Ototal %), the results show that the best performance was obtained for t = 120 s and t =
300 s, and no significant improvement was achieved when ultrasonication was performed during 10
min. The percentage of single or double labeled peptides was higher than 90 % for all peptides, except
fragment (LGEYGFQNALIVR)H+ – 1479 m/z with a labeling efficiency below 85 % for all the
ultrasonication times tested. These results are closer to the values obtained with the USB, with a
labeling efficiency higher than 92 % for all peptides, but they are still below the values obtained by the
classic methodology (overnight labeling), with labeling efficiencies higher than 96 % [22]. This is
probably due to the fact that the labeling reaction is a two step reaction. In the first step the enzyme
forms an ester intermediate with the peptide, and during the hydrolysis of the amide bond the first 18
O
from the medium is incorporated at the terminal carboxyl group. During the second step of the
reaction, also known as carboxyl exchange reaction, the enzyme forms another ester intermediate with
the peptide terminal carboxyl group and, after a series of esterification and hydrolysis cycles, the
peptide will be double labeled [29]. Unfortunately, the rates of the carboxyl oxygen exchange reaction
are much lower than the peptide bond hydrolysis, which lead to the variable 18
O incorporation when

Chapter VI
157
short reaction times are used. It is also important to stress that the carboxyl exchange reaction is a
reversible reaction; therefore, the ultrasonic energy not only accelerates the 16
O-exchange from the
peptide’s carboxyl group with 18
O from the medium, but also enhances the reverse reaction. The
results presented in Table VI.1 and Table VI.2 also suggest a complex relation between ultrasonic
energy and the first and second 18
O-incorporation. It seems that these reactions can be enhanced with
ultrasonic energy of low intensity, such as the one provided by the ultrasonic bath and the sonoreactor.
Yet, a system like the ultrasonic probe, 30 times more intense than the sonoreactor and 1500 times
more intense than the ultrasonic bath, seems to produce uncontrolled effects which compromise an
effective 18
O-incorporation, especially the double 18
O-incorporation. The nature of these effects
remains unclear.
VI.4.2. 18
O-lalebing with UTR
The sonoreactor (UTR) can be defined as a high-intensity ultrasonic bath [25]. Even though the
ultrasonic energy generated by the sonoreactor is 30 times less intense than the one provided by the
ultrasonic probe, several advantages make this device suitable for proteomics workflow, such as: (i)
sample ultrasonication in sealed vials, which prevents cross-contamination between samples; (ii) no
aerosol formation, which improves bio safety when working with hazard samples from pathogenic
bacteria and viruses; (iii) lower sample volume is needed for ultrasonication; (iv) high throughput,
since many samples can be treated at once unlike common ultrasonic probes [21, 25]
The efficiency of the sonoreactor was first evaluated using BSA as a protein model. The results in
Table VI.1 show that the percentage of double labeled peptides (18
O2) increased with the
ultrasonication time. For the time range between 30 and 120 s the percentage of double labeled
peptides obtained with the sonoreactor was similar to the one achieved with the ultrasonic probe.
However, better results were obtained with the sonoreactor when BSA was labeled during 5 min and
10 min, especially for the largest peptides. This is in agreement with the data presented before for the
ultrasonic probe, where it was said that the lack of improvement in the labeling degree efficiency for
larger ultrasonication times could be related to aerosol formation, sample overheating and unexpected
reactions caused by the high ultrasound intensity provided by the probe. When ultrasonication is
performed with the sonoreactor the aerosol formation is insignificant and the temperature of the water
bath can be controlled. In addition the ultrasound intensity provided is 30 times lower than the one
obtained with the ultrasonic probe. Therefore, no sample overheating or spreading through the walls of
the container occurs, and the ultrasonic efficiency is maintained during the process. Regarding the
larger ultrasonication times tested, 15 and 30 min, the 18
O-labeling degree obtained with the
sonoreactor was higher than when the ultrasonic bath was used, and for the smallest peptide
fragments, (YLYEIAR)H+ – 927 m/z; (ALKAWSVAR)H
+ – 1001 m/z; and (RHPEYAVSVLLR)H
+ –

Ultrasonic-based protein quantitation by 18
O-labeling: comparison between different procedures
158
1439 m/z, the percentages of double 18
O-incorporation were higher and close to the values obtained
with the classic overnight protocol (76 %).
Table VI.2: Percentage of total 18
O-incorporation (18
Ototal) at the peptide’s C-terminus. BSA (60 µg)
digestion/labeling with trypsin was performed during 12 h (overnight) and with different ultrasonic
devices: (i) ultrasonic bath (USB 130 kHz) operating at 70 % amplitude and 60ºC; (ii) ultrasonic probe
(UP) operating at 50% amplitude and equipped with a 0.5 mm sonotrode; (iii) sonoreactor (UTR)
operating at 50% amplitude. The ultrasonication time was comprised between 30 s and 30 min. The
five most intense mass peaks were considered: 927.49 m/z – (YLYEIAR)H+; 1001.59 m/z –
(ALKAWSVAR)H+; 1439.81 m/z – (RHPEYAVSVLLR)H
+; 1479.80 m/z –
(LGEYGFQNALIVR)H+; 1639.94 m/z – (KVPQVSTPTLVEVSR)H
+. (n=3)
18Ototal %
[M+H]+
(m/z)
Ultrasonication Time Method
30 sec 60 sec 120 sec 300 sec 10 min 15 min 30 min 12h
927.49
- - - - - - - 98.55 ± 1.80 Overnight*
- - - - - 97.53 ± 0.54 97.60 ± 1.29 - USB 130 kHz*
92.85 ± 0.33 93.59 ± 1.90 96.07 ± 1.10 96.44 ± 0.19 94.19 ± 1.76 - - - UP
93.54 ± 0.47 92.27 ± 0.23 95.57 ± 1.02 96.56 ± 0.22 97.54 ± 0.01 98.66 ± 0.01 99.23 ± 1.09 - UTR
1001.59
- - - - - - - ** Overnight*
- - - - - 96.93 ± 3.36 94.40 ± 4.33 - USB 130 kHz*
89.76 ± 0.81 92.25 ± 3.06 95.95 ± 2.32 95.36 ± 0.95 91.52 ± 2.66 - - - UP
89.28 ± 0.67 89.19 ± 0.51 93.85 ± 0.59 96.46 ± 0.08 95.75 ± 6.01 97.12 ± 4.08 ** - UTR
1439.81
- - - - - - - 96.35 ± 0.50 Overnight*
- - - - - 95.50 ± 1.86 94.64 ± 1.02 - USB 130 kHz*
88.44 ± 1.14 89.75 ± 1.94 91.36 ± 2.12 90.10 ± 0.87 89.31 ± 0.49 - - - UP
86.97 ± 1.60 88.21 ± 0.35 91.67 ± 1.10 91.90 ± 1.42 95.73 ± 0.13 97.45 ± 0.64 96.42 ± 2.67 - UTR
1479.80
- - - - - - - 96.60 ± 0.84 Overnight*
- - - - - 93.02 ± 0.97 90.21 ± 2.88 - USB 130 kHz*
61.05 ± 2.50 66.21 ± 8.17 80.90 ± 8.77 82.38 ± 7.10 85.04 ± 2.92 - - - UP
68.52 ± 7.87 77.39 ± 2.66 82.77 ± 0.03 88.33 ± 0.78 93.22 ± 2.85 93.17 ± 1.29 97.34 ± 0.13 - UTR
1639.94
- - - - - - - 99.80 ± 0.29 Overnight*
- - - - - 92.61 ± 0.21 92.52 ± 2.11 - USB 130 kHz*
** ** 90.64 ± 1.51 93.08 ± 1.67 ** - - - UP
** ** 89.49 ± 5.59 89.81 ± 0.33 95.76 ± 5.99 93.25 ± 0.63 96.23 ± 5.34 - UTR
* Results previously obtained for the overnight and USB 130 kHz digestion/labeling were used for
comparative purposes [22].
** Peptide not present in the spectra.
The efficiency of the 18
O-labeling reaction (single and double labeling) also increased with the
ultrasonication time (Table VI.2). Like before, the results obtained with the sonoreactor between 30 s
and 5 min were similar to the ones obtained with the ultrasonic probe, but with 10 min of
ultrasonication the labeling efficiency was higher for the sonorector. As previously referred, this result
suggests that the labeling reaction is more effective when ultrasonic energy of low intensity is used.

Chapter VI
159
This conclusion is confirmed by the data obtained with the sonoreactor and the ultrasonic bath. These
devices, which provide low intensity ultrasonic energy, can accelerate the labeling reaction to the same
levels as the overnight process (12 h) in just 15 min.
Table VI.3: Percentage of double 18
O-incorporation (18
O2 %) and total 18
O-incorporation (18
Ototal %) in
different peptides from ovalmunin and α-lactalbumim. The labeling reaction was performed during 12
h (overnight) and with different ultrasonic devices: (i) 30 min with the ultrasonic bath (USB 130 kHz)
operating at 70 % amplitude and 60ºC; and (ii) 15 and 30 min with the sonoreactor (UTR) operating at
50 % amplitude. The most intense peptides considered for ovalbumin were: (VYLPR)H+ – 647.39
m/z; (HIATNAVLFFGR)H+ – 1345.74 m/z; (GGLEPINFQTAADQAR)H
+ – 1687.84 m/z; and for α-
lactalbumim: (CEVFR)H+ – 710.33 m/z; (VGINYWLAHK)H
+ – 1200.65 m/z. (n=3)
18O2 % 18
Ototal %
Protein [M+H]+
(m/z) Overnight*
USB
130 kHz* UTR Overnight*
USB
130 kHz* UTR
Time
(min)
Ovalbumin
647.39 73.45 ± 3.49
- 65.42 ± 10.55 97.65 ± 1.58
- 98.68 ± 1.18 15
32.19 ± 3.07 69.78 ± 1.46 91.67 ± 0.06 99.24 ± 0.11 30
1345.74 68.86 ± 3.45
- 57.37 ± 5.71 97.15 ± 1.16
- 95.24 ± 1.71 15
20.50 ± 1.53 66.16 ± 2.74 88.29 ± 0.90 96.59 ± 0.18 30
1687.84 65.96 ± 2.53
- 71.60 ± 2.33 93.44 ± 5.21
- 96.41 ± 0.82 15
24.06 ± 2.76 71.08 ± 0.18 89.92 ± 1.16 98.07 ± 0.47 30
α-Lactalbumim
710.33 76.12 ± 1.48
- 27.77 ± 0.11 97.05 ± 0.44
- 90.90 ± 0.08 15
4.99 ± 0.89 30.17 ± 1.16 87.67 ± 0.51 91.95 ± 0.60 30
1200.65 71.34 ± 1.02
- 15.87 ± 1.25 96.30
- 90.43 ± 0.43 15
3.01 ± 0.12 24.02 ± 0.14 87.79 ± 2.27 90.40 ± 0.98 30
* Results previously obtained for the overnight and USB 130 kHz digestion/labeling were used for
comparative purposes [22].
Additional proteins were 18
O-labeled to assess the efficiency of the UTR technology. Therefore,
aliquots of ovalbumin and α-lactalbumin were labeled in the presence of H218
O and trypsin during 15
and 30 min. The ultrasonication times chosen were based on the best labeling degree and efficiency
obtained for BSA. As can be seen in Table VI.3, for the most intense peptides of ovalbumin the
labeling efficiency (18
Ototal) was between 96 and 99 % for both 15 and 30 min of ultrasonication. In
addition, the labeling efficiency obtained in only 15 min with the sonoreactor was higher than that
obtained during 30 min with the ultrasonic bath, and it was equal or higher than that obtained with the
classic overnight reaction, which was between 93 and 97 %. In terms of the double labeled peptides
yield (18
O2), the results were mostly the same, regardless of the ultrasonication time applied: for
peptide (VYLPR)H+ – 647.39 m/z, the double labeling yield was between 65 % and 70 % with 15 and
Ultrasonic-based protein quantitation by 18
O-labeling: comparison between different procedures
160
30 min, respectively; and for the largest peptide (GGLEPINFQTAADQAR)H+ – 1687.84 m/z the
double labeling yield was 71 % with both reaction times, which is higher than the yield obtained with
the classic method, 66 %.
Concerning the labeling efficiency (18
Ototal) obtained for α-lactalbumin, the results show that at least 90
% of the peptides were labeled with one or two 18
O-atoms for both 15 and 30 min of ultrasonication,
while with the ultrasonic bath a labeling efficiency of 87 % was obtained after 30 min. However, in
this case the results were below the classic overnight procedure with a labeling efficiency of ca. 97 %.
As far as the double 18
O-incorporation is concerned, the sonoreactor performed much better than the
ultrasonic bath by promoting the 18
O-double incorporation in 30 % of α-lactalbumin’s (CEVFR)H+
(710.33 m/z) peptide, whereas the results obtained with the ultrasonic bath for the same peptide were 6
times lower: 5 % of double 18
O-incorporation during 30 min of ultrasonication. However, the
sonoreactor results were still lower than the ones obtained with the classic overnight methodology for
which 71 to 76 % of the peptides were double 18
O-labeled.
VI.4.3. Influence of enzyme-to-protein ratio on the 18
O-labeling reaction
The double 18
O-incorporation at the terminal carboxylic group of the peptide is essential to obtain
mass spectra free from isotopic overlap between unlabeled and labeled species, improving the
precision and accuracy of the protein quantitation method. To achieve a complete double 18
O-labeling,
the carboxyl oxygen exchange reaction must be accelerated and controlled. This can be performed by
several different approaches, such as: (i) decreasing the pH of the enzyme-catalyzed carboxyl oxygen
exchange reaction from 8.5, the optimal pH for trypsin proteolytic activity, to pH between 5 and 6,
where trypsin presents the best catalytic activity regarding the carboxyl oxygen exchange reaction [15,
30]; (ii) or by performing the carboxyl oxygen exchange in aqueous solutions with organic solvents
[31]. Despite providing promising results, these techniques rely on the post-digestion labeling
approach, where the sample is first digested in natural abundance water media, then dried and finally
labeled in an appropriate buffer enriched with 18
O-water. Due to the extra drying steps introduced, this
method demands higher sample handling and time, is not suitable for on-line approaches and the
results may be affected by a higher technical variation. Another way to increase the yield of the double
labeling is to use a higher enzyme-to-protein (E:P) ratio, although this might be a problem due to
enzyme autolysis, because of the ion suppression effect caused by enzyme peptides over the protein
peptides in the mass spectra. The use of calcium salts to improve trypsin’s activity and prevent
autolysis has been reported [32, 33], but this implicates an extra step to remove the salts before MS
analysis to avoid interferences with peptide ionization. Immobilized trypsin can also be used as an
alternative to overcome the problem of back-exchange and enzyme autolysis [16, 34], but the cost of
this reagent may be discouraging to some laboratories.

Chapter VI
161
Table VI.4: Effect of the enzyme-to-protein ratio (E:P) on the labeling efficiency (18
Ototal %) and
labeling degree (18
O2 %). Aliquots of BSA (60 µg) were labeled during 15 min with the sonoreactor
(50 % amplitude) in the presence of H218
O and trypsin. Different E:P ratios were used: (i) 1:120 w/w
(trypsin – 0.5 µg); (ii) 1:80 w/w (trypsin – 0.75 µg); (iii) 1:60 w/w (trypsin – 1.0 µg); (iv) 1:40 w/w
(trypsin – 1.5 µg); (v) 1:30 w/w (trypsin – 2.0 µg). The five most intense mass peaks were considered:
927.49 m/z – (YLYEIAR)H+; 1001.59 m/z – (ALKAWSVAR)H
+; 1439.81 m/z –
(RHPEYAVSVLLR)H+; 1479.80 m/z – (LGEYGFQNALIVR)H
+; 1639.94 m/z –
(KVPQVSTPTLVEVSR)H+. (n=3)
E:P ratio [Trypsin (µg)]
18O2 %
[M+H]+ (m/z) 1:120 [0.5] 1:80 [0.75] 1:60 [1.0] 1:40 [1.5] 1:30 [2.0]
927.49 50.46 ± 1.86 70.63 ± 2.08 74.75 ± 0.01 75.43 ± 0.51 72.63 ± 1.28
1001.59 58.98 ± 6.70 76.03 ± 2.13 71.72 ± 10.03 * *
1439.81 24.19 ± 3.52 52.22 ± 0.22 69.86 ± 1.97 69.05 ± 1.96 68.90 ± 1.26
1479.80 23.15 ± 1.69 45.44 ± 3.40 58.63 ± 5.79 64.51 ± 0.18 58.61 ± 1.62
1639.94 6.74 ± 2.22 19.02 ± 1.45 41.12 ± 2.48 40.38 ± 7.54 42.71 ± 3.02
18
OTotal %
927.49 93.56 ± 0.08 97.59 ± 2.49 98.66 ± 0.01 95.90 ± 2.52 97.39 ± 0.17
1001.59 93.54 ± 4.30 100 97.12 ± 4.08 * *
1439.81 90.64 ± 1.20 95.93 ± 1.43 97.45 ± 0.64 97.61 ± 1.32 95.63 ± 1.02
1479.80 78.35 ± 7.88 94.31 ± 0.51 93.17 ± 1.29 96.78 ± 0.85 92.38 ± 0.83
1639.94 83.79 ± 3.40 92.51 ± 0.38 93.25 ± 0.63 95.53 ± 1.22 92.23 ± 2.32
*Peptide not present in the spectra.
To further evaluate the combined effect of ultrasound and different E:P ratios, aliquots of BSA (60 µg)
were labeled during 15 min with the sonoreactor in the presence of H218
O and different amounts of
trypsin. The E:P ratio varied between 1:120 and 1:30 (w/w). As can be seen in Table VI.4, the lowest
labeling efficiency (18
Ototal %) was obtained when only 0.5 µg (1:120 w/w E:P ratio) of trypsin was
used. In this case the labeling efficiency varied from 80 %, for the two larger peptides (1479 and 1639
m/z), to 93 % for the smallest peptide (927 m/z). When other E:P ratios were used the labeling
efficiencies obtained with each ratio were similar among them: between 96 % and 98 % for the
smaller peptides - 927, 1001 and 1439 m/z; and between 93 % and 96 % for the largest peptides 1479
and 1639 m/z. Regarding the double 18
O-incorporation (18
O2 %) yield, the worst performance was
obtained with the lowest amount of trypsin (0.5 µg): 50 % of the (YLYEIAR)H+ – 927 m/z peptides
were double labeled with 15 min of ultrasonication, while the classical overnight labeling
methodology achieved a double labeling yield of 75 % for the same peptide. Focusing on peptide
fragments (YLYEIAR)H+ – 927 m/z; and (LGEYGFQNALIVR)H
+ – 1479 m/z, results show that the
double labeling degree increased with the amount of enzyme, reaching a maximum when 1/40 (w/w)
E:P ratio was used: 75 % and 65 %, respectively. For these peptides no improvement in the double
incorporation yield was obtained when the E:P ratio was raised to 1:30 (w/w). Regarding peptide

Ultrasonic-based protein quantitation by 18
O-labeling: comparison between different procedures
162
fragments (RHPEYAVSVLLR)H+ – 1439 m/z; and (KVPQVSTPTLVEVSR)H
+ –1639 m/z, the
labeling degree obtained also increased with the amount of trypsin, but no significant differences were
found when the E:P ratio varied from 1:60 to 1:30 (w/w). In addition, no significant interference from
trypsin autolysis peptides was found in the mass spectra of the samples labeled with a higher quantity
of trypsin (Figure VI.2). Overall, the best results were obtained when the E:P ratio was 1:40 (w/w),
which is in the range of the recommended E:P ratios by Sigma-Aldrich® for the in-solution protein
digestion: between 1:100 and 1:20 (w/w) [35].
Figure VI.2: Effect of the enzyme-to-protein ratio (E:P) on the MALDI-TOF mass spectra obtained
after protein 18
O-labeling with different amounts of trypsin. a) 1:120 w/w (trypsin – 0.5 µg); b) 1:80
w/w (trypsin – 0.75 µg); c) 1:60 w/w (trypsin – 1.0 µg); d) 1:40 w/w (trypsin – 1.5 µg); e) 1:30 w/w
(trypsin – 2.0 µg).
VI.4.4. Influence of sample concentration on the 18
O-labeling of proteins
When the sample concentration decreases the probability of having protein and enzyme molecules
colliding with each other and establishing bonds also decreases, which may compromise protein

Chapter VI
163
digestion/18
O-labeling. Thus, the ultrasound effect on the isotopic labeling reaction of low
concentration protein samples was evaluated: BSA samples ranging from 2.5 µg and 60 µg were 18
O-
labeled during 15 min with the sonoreactor in the presence of trypsin, using an E:P ratio of 1:40 (w/w),
which was previously found to be the best E:P ratio. The results in Table VI.5 show that the labeling
efficiency (18
Ototal) and the yield of double labeled peptides (18
O2) were higher when the protein
concentration used was 0.6 µg/µL (60 µg of BSA). Regarding the smallest BSA peptide,
(YLYEIAR)H+ – 927 m/z, the variation of the labeling efficiency was between 94 % and 96 % for the
lowest (0.025 µg/µL) and highest (0.6 µg/µL) protein concentration samples, respectively. Yet, the
variation obtained in the percentage of double labeled peptides between the two protein samples was
much higher: 25 % of the peptides were double labeled in the 0.025 µg/µL BSA samples, in contrast
with the 75 % yield obtained when 0.6 µg/µL of BSA was used. The same pattern was observed for
the other peptides: the labeling efficiency and the labeling degree increased with the increasing sample
concentration.
Table VI.5: Effect of the sample concentration on the labeling efficiency (18
Ototal %) and labeling
degree (18
O2 %). Aliquots of BSA: (i) 2.5 µg; (ii) 5 µg; (iii) 15 µg; (iv) 30 µg; and (v) 60 µg were
labeled during 15 min with the sonoreactor (50 % amplitude) in the presence of H218
O and trypsin. A
constant enzyme-to-protein ratio was used in this experiment: 1:40 w/w. The five most intense mass
peaks were considered: 927.49 m/z – (YLYEIAR)H+; 1001.59 m/z – (ALKAWSVAR)H
+; 1439.81
m/z – (RHPEYAVSVLLR)H+; 1479.80 m/z – (LGEYGFQNALIVR)H
+; 1639.94 m/z –
(KVPQVSTPTLVEVSR)H+. (n=3)
BSA (µg)
18O2 %
[M+H]+ (m/z) 2.5 5 15 30 60
927.49 25.23 ± 3.57 32.55 ± 0.88 61.48 ± 2.79 72.69 ± 1.67 75.43 ± 0.51
1001.59 25.60 ± 2.15 27.06 ± 3.69 67.98 ± 0.56 86.48 ± 6.60 *
1439.81 13.00 ± 0.44 8.26 ± 2.54 38.89 ± 0.02 54.19 ± 4.51 69.05 ± 1.96
1479.80 15.35 ± 12.92 8.80 ± 1.22 34.72 ± 2.03 48.67 ± 2.55 64.51 ± 0.18
1639.94 * * 5.77 ± 1.16 18.17 ± 10.28 40.38 ± 7.54
18
OTotal %
927.49 94.15 ± 0.11 92.39 ± 0.03 96.77 ± 0.55 98.35 ± 0.35 95.90 ± 2.52
1001.59 89.29 ± 3.45 91.48 ± 0.48 97.51 ± 1.07 100.00 *
1439.81 90.05 ± 7.44 92.29 ± 1.80 92.31 ± 0.08 95.25 ± 0.65 97.61 ± 1.32
1479.80 86.04 ± 4.48 83.17 ± 1.77 87.50 ± 2.63 95.48 ± 1.10 96.78 ± 0.85
1639.94 * * 90.74 ± 2.52 91.89 ± 0.80 95.53 ± 1.22
*Peptide not present in the spectra.

Ultrasonic-based protein quantitation by 18
O-labeling: comparison between different procedures
164
Figure VI.3: Effect of sample concentration on the a) labeling degree (18
O2 %) and b) labeling
efficiency (18
Ototal %). Aliquots of BSA 2.5 µg were labeled with increasing amounts of trypsin during
12 h (overnight) at 37 ºC, and 15 min with the sonoreactor (50 % amplitude). A) Overnight labeling
with 0.0625 µg of trypsin; B) sonoreactor labeling with 0.0625 µg of trypsin; C) overnight labeling
with 0.125 µg of trypsin; D) sonoreactor labeling with 0.125 µg of trypsin; E) overnight labeling with
0.375 µg of trypsin; F) sonoreactor labeling with 0.375 µg of trypsin; G) overnight labeling with 0.75
µg of trypsin; H) sonoreactor labeling with 0.75 µg of trypsin. (n=3)
These results suggest that the ultrasonic energy provided by the sonoreactor is suitable for the
enhancement of the peptide bond hydrolysis, but not for the acceleration of the carboxyl oxygen
exchange reaction in low concentration protein samples. Thus, to achieve a better double labeling
yield at the low concentration range with only 15 min of ultrasonication, we increased the E:P ratios
from 1:40 w/w (trypsin - 0.0625 µg) to 1:3.33 w/w (trypsin - 0.75 µg) in the isotopic labeling of 2.5 µg
of BSA. The overnight labeling reaction was also performed for comparative purposes. The results in
Figure VI.3a) show that the percentage of double 18
O-incorporation (18
O2) obtained with the
sonoreactor (15 min) increased with the E:P ratio. Yet, a labeling yield higher than 70 % was only
achieved for the smallest peptides, 927 m/z and 1001 m/z, when the E:P ratio was 1:3.3 (w/w).
Interestingly, the results achieved with the 12 h labeling method also presented some variation,
especially for the larger peptides. Considering peptides (LGEYGFQNALIVR)H+ – 1479 m/z; and
(KVPQVSTPTLVEVSR)H+ –1639 m/z, the labeling efficiency (
18Ototal %) was between 92 and 98 %,
but the double labeling yield (18
O2 %) was only superior to 70 % for E:P ratios higher than 1:6.7
(w/w). It is important to note that these E:P ratios are much higher than the recommended ones [35].

Chapter VI
165
Therefore, when working with samples of low protein concentration, the peptides chosen for protein
quantitation are of special importance, as well as the total time for labeling. In order to achieve the
maximum double 18
O-incorporation yield, the reaction time must probably be increased beyond the 12
h, if no ultrasonication is used, or smaller peptides should be chosen for protein quantitation. Protein
concentration strategies, as protein precipitation or ultrafiltration methods, may also be used in
complex samples to increase protein concentration.
Figure VI.4: 18
O-labeling of complex protein samples from human plasma. Spectra a) and b)
correspond to the overnight protein digestion at 37ºC with trypsin in 16
O- and 18
O-enriched buffer,
respectively. Spectra c) and d) correspond to protein digestion with the sonoreactor (15 min; 50 %
amplitude) in 16
O- and 18
O-enriched buffer (for details, see section VI.3.3.4).
VI.4.5. Ultrasound-based 18
O-labeling of proteins from human plasma
The labeling procedure reported in this manuscript was further tested in a complex protein sample
from human plasma. As we were only interested in studying the labeling efficiency, protein
identification was not performed. Thus, after precipitation with cold acetone, protein aliquots of 10 µL
in ammonium bicarbonate (100 mM, pH 7.5 – 8.5) were reduced, alkylated and finally labeled with
trypsin in 18
O- or 16
O-enriched buffer by two different methods: (i) overnight (37ºC); and (ii) in the
sonoreactor during 15 min (50 % amplitude), which was previously found to be the best ultrasonic

Ultrasonic-based protein quantitation by 18
O-labeling: comparison between different procedures
166
enhanced 18
O-labeling method. Regarding the number of peptides obtained with the different
procedures, 181 peptides were labeled with the overnight method, 177 peptides were labeled with the
sonoreactor and, from these peptides, 122 were common to both methods. The remaining peptides,
which were characteristic to each method, had a relative intensity below 15 %. Furthermore, as can be
seen in Figure VI.4, the background noise and baseline in the mass spectra obtained with the different
labeling methods were similar.
Figure VI.5: 18
O-labeling of complex protein samples from human plasma. Comparison between: a)
18O-labeling efficiency (
18Ototal %); and b)
18O-labeling degree (
18O2 % ) obtained with the overnight
(12 h; 37 ºC) and the sonoreactor (15 min; 50 % amplitude) methodologies. (n = 3)
Regarding the labeling efficiency for the most intense peptides, the results obtained were similar
between the two methodologies tested and showed that all the peptides were labeled with at least one
18O-atom in a percentage higher than 90 % when the sonoreactor methodology was used (Figure
VI.5a). These results are also very close to the best results previously obtained for the standard
proteins. However, as far as the labeling degree is concerned (Figure VI.5b), the results presented a
larger variation between different peptides, as obtained for α-lactalbumin when the accelerated
procedure was used. In fact, only the peptide corresponding to 1623 m/z was double labeled with a
similar percentage to the overnight procedure: ca. 88 %. Peptides corresponding to 927, 960 and 1467
m/z presented double labeling percentages higher than 50 %, but lower than the double labeling yield
0
20
40
60
80
100
927 960 1160 1226 1342 1467 1623 1639 1752 1910
% 18
O2
Overnight Sonoreactor
0
20
40
60
80
100
% 18
Oto
tal
Peptide Mass (m/z)
a)
b)

Chapter VI
167
of 85 % obtained with the overnight methodology. This is probably related with the presence of
multiple proteins with different characteristics, some of them more efficiently digested with trypsin
than others. It must be also noticed that peptides corresponding to 1160, 1226 and 1342 m/z were
present in the mass spectra of the ultrasonicated samples with a lower relative intensity, compared to
the mass spectra of the overnight labeled samples. Actually, if we exclude these peptides, it is possible
to confirm the trend observed for the standard protein samples: the higher the peptide mass, the lower
the percentage of double 18
O-incorporation.
VI.5. Conclusions
The results obtained show that the ultrasonic probe is capable of accelerating the labeling reaction
from 12 h, the classic overnight methodology, to only 120 s without compromising the labeling
efficiency. Yet, the labeling degree, i.e. the percentage of double 18
O-labeled peptides was lower than
that obtained with the classic methodology, especially for larger peptides. It was also found that the
use of an ultrasonic probe is not recommended for the acceleration of the labeling reaction when the
ultrasonication time is higher than 120 s, at least with the conditions here reported, because the aerosol
formation, sample overheating and uncontrolled secondary reactions, that occur during ultrasonication
at high intensities, compromise the 18
O double incorporation at the carboxyl group of the peptide.
Regarding the sonoreactor, the results obtained from 30 to 120 s were similar to the ones obtained with
the direct ultrasonication method, but in contrast to the ultrasonic probe, as the ultrasonication time
increased, higher labeling efficiencies and higher double labeling yields were obtained. Furthermore,
the sonoreactor technology has some advantages over the ultrasonic probe: (i) it provides indirect and
less intense ultrasonic energy, preventing aerosol formation; (ii) no sample overheating occurs,
because the temperature of the water bath where ultrasonication takes place can be controlled; and last
but not least, (iii) the ultrasonication is performed in sealed vials, preventing sample contamination.
The results achieved for the labeling degree (18
O2 %) in just 15 min of ultrasonication were similar to
the ones obtained previously with the overnight methodology. This was further confirmed with the
labeling results obtained for ovalbumin.
When the ultrasonication was performed with different enzyme-to-protein (E:P) ratios the results
showed that the labeling efficiency and the labeling degree were best with an E:P ratio of 1:40 (w/w).
However, for low concentration protein samples, higher E:P ratios were required to obtain an
acceptable double labeling yield, even when the classic methodology was performed.
Our results demonstrate that the isotopic labeling reaction can be performed in simple protein samples
in only 15 min, in a direct labeling approach using indirect ultrasonication provided by the
sonoreactor. No intermediate drying steps are required in this procedure, which facilitate on-line

Ultrasonic-based protein quantitation by 18
O-labeling: comparison between different procedures
168
approaches for protein quantitation. In addition, the sonoreactor has a higher sample throughput than
the ultrasonic probe, which minimizes the sample treatment time and simplifies the overall workflow.
However, when applied to a complex protein sample such as human plasma, this technology did not
promote efficient double 18
O-incorporation, compromising protein quantitation. Therefore, in the
presence of this type of samples two approaches can be used: (i) the decoupled labeling procedure in
which peptides are double labeled in percentages higher than 95 % [36]; or (ii) mathematical
algorithms that measure the effective 18
O-incorporation rate due to variable enzyme substrate
specificity during the labeling reaction and correct for the 18
O abundance [37, 38].
VI.6. Acknowledgements
Ricardo J. Carreira acknowledges the doctoral grant SRFH/BD/28563/2006 from FCT (Fundação para
a Ciência e a Tecnologia) of Portugal. The University of Vigo is acknowledged for financial support
under projects INOU/UVIGO/K919/2009 and INOU/UVIGO/K914/2009. Xunta de Galicia, Spain, is
acknowledged by the Isidro Parga Pondal Program (J. L. Capelo) and for financial support given under
project 09CSA043383PR. Mário S. Diniz acknowledges program Ciência 2008 from FCT/MCTES.
VI.7. References
[1] MacCoss MJ, Matthews DL. Anal. Chem. 2005; 77: 295A.
[2] Deleenheer AP, Thienpont LM. Mass Spectrom. Rev. 1992; 11: 249.
[3] Ong SE, Mann M. Nat. Chem. Biol. 2005; 1: 252.
[4] Sechi S, Oda Y. Curr. Opin. Chem. Biol. 2003; 7: 70.
[5] Bantscheff M, Schirle M, Sweetman G, Rick J, Kuster B. Anal. Bioanal. Chem. 2007; 389: 1017.
[6] Ong SE, Blagoev B, Kratchmarova I, Kristensen DB, Steen H, Pandey A, Mann M. Mol. Cell.
Proteomics 2002; 1: 376.
[7] Gygi SP, Rist B, Gerber SA, Turecek F, Gelb MH, Aebersold R. Nat. Biotechnol. 1999; 17: 994.
[8] Ross PL, Huang YLN, Marchese JN, Williamson B, Parker K, Hattan S, Khainovski N, Pillai S,
Dey S, Daniels S, Purkayastha S, Juhasz P, Martin S, Bartlet-Jones M, He F, Jacobson A, Pappin DJ.
Mol. Cell. Proteomics 2004; 3: 1154.
[9] Schnolzer M, Jedrzejewski P, Lehmann WD. Electrophoresis 1996; 17: 945.
[10] Yao XD, Freas A, Ramirez J, Demirev PA, Fenselau C. Anal. Chem. 2001; 73: 2836.
[11] Miyagi M, Rao KCS. Mass Spectrom. Rev. 2007; 26: 121.
[12] Fenselau C, Yao XD. J. Proteome Res. 2009; 8: 2140.
[13] Ye X, Luke B, Andresson T, Blonder J. Brief. Funct. Genomics Proteomics 2009; 8: 136.
[14] Patwardhan AJ, Strittmatter EF, David GC, Smith RD, Pallavicini MG. Proteomics 2006; 6:
2903.
[15] Zang L, Toy DP, Hancock WS, Sgroi DC, Karger BL. J. Proteome Res. 2004; 3: 604.

Chapter VI
169
[16] Capelo JL, Carreira RJ, Fernandes L, Lodeiro C, Santos HM, Simal-Gandara J. Talanta 2010; 80:
1476.
[17] Stewart, II, Thomson T, Figeys D. Rapid Commun. Mass Spectrom. 2001; 15: 2456.
[18] Storms HF, van der Heijden R, Tjaden UR, van der Greef J. Rapid Commun. Mass Spectrom.
2006; 20: 3491.
[19] Angel PM, Orlando R. Anal. Biochem. 2006; 359: 26.
[20] Lopez-Ferrer D, Capelo JL, Vazquez J. J. Proteome Res. 2005; 4: 1569.
[21] Rial-Otero R, Carreira RJ, Cordeiro FM, Moro AJ, Fernandes L, Moura I, Capelo JL. J. Proteome
Res. 2007; 6: 909.
[22] Carreira RJ, Rial-Otero R, Lopez-Ferrer D, Lodeiro C, Capelo JL. Talanta 2008; 76: 400.
[23] Data Explorer Software User's Guide, Version 4.0, Vol. section 3, Applied Biosystems.
[24] Yao XD, Freas A, Ramirez J, Demirev PA, Fenselau C. Anal. Chem. 2004; 76: 2675.
[25] Santos HM, Capelo JL. Talanta 2007; 73: 795.
[26] Lopez-Ferrer D, Heibeck TH, Petritis K, Hixson KK, Qian W, Monroe ME, Mayampurath A,
Moore RJ, Belov ME, Camp DG, Smith RD. J. Proteome Res. 2008; 7: 3860.
[27] Carreira RJ, Cordeiro FM, Moro AJ, Rivas MG, Rial-Otero R, Gaspar EM, Moura I, Capelo JL.
J. Chromatogr. A 2007; 1153: 291.
[28] Vale G, Pereira S, Mota A, Fonseca L, Capelo JL. Talanta 2007; 74: 198.
[29] Julka S, Regnier F. J. Proteome Res. 2004; 3: 350.
[30] Staes A, Demol H, Van Damme J, Martens L, Vandekerckhove J, Gevaert K. J. Proteome Res.
2004; 3: 786.
[31] Blonder J, Hale ML, Chan KC, Yu LR, Lucas DA, Conrads TP, Zhou M, Popoff MR, Issaq HJ,
Stiles BG, Veenstra TD. J. Proteome Res. 2005; 4: 523.
[32] Sipos T, Merkel JR. Biochemistry 1970; 9: 2766.
[33] Papaleo E, Fantucci P, De Gioia L. J. Chem. Theory Computation 2005; 1: 1286.
[34] Sevinsky JR, Brown KJ, Cargile BJ, Bundy JL, Stephenson JL. Anal. Chem. 2007; 79: 2158.
[35] Technical Bulletin - Product Code T6567, Sigma-Aldrich.
[36] Carreira RJ, Lodeiro C, Diniz MS, Moura I, Capelo JL. Proteomics 2009; 9: 4974.
[37] Eckel-Passow JE, Oberg AL, Therneau TM, Mason CJ, Mahoney DW, Johnson KL, Olson JE,
Bergen HR. Bioinformatics 2006; 22: 2739.
[38] Mason CJ, Therneau TM, Eckel-Passow JE, Johnson KL, Oberg AL, Olson JE, Nair KS,
Muddiman DC, Bergen HR. Mol. Cell. Proteomics 2007; 6: 305.


Chapter VII
171
Chapter VII
CAN ULTRASONIC ENERGY EFFICIENTLY SPEED 18O-
LABELING OF PROTEINS?
Published in:
R. J. Carreira, C. Lodeiro, M. S. Diniz, I. Moura, J. L. Capelo
Proteomics, 2009, 9, 1–4


Chapter VII
173
VII.1. Abstract
We report in this work on the robustness of ultrasonic energy as a tool to accelerate the isotopic
labeling of proteins using the 18
O-decoupled procedure. The first part of the decoupled procedure,
comprising protein denaturation, reduction, alkylation and digestion, was performed in 8 min under
the influence of an ultrasonic field. The second part, the isotopic labeling, was performed with and
without the use of ultrasonic energy. Our results clearly demonstrate that the 18
O-isotopic labeling in
the decoupled procedure cannot be accelerated using ultrasonic energy.

Can ultrasonic energy efficiently speed 18
O-labeling of proteins?
174
VII.2. Introduction
Protein quantitation using isotopic labeling of peptides with 18
O has recently recalled the attention of
the proteomics scientific community, due to its almost perfect characteristics to be used in differential
protein expression and relative protein quantitation studies [1].
18O-labeling of proteins can be performed by two different approaches [2]. On the one hand, the
protein enzymatic digestion and the labeling process are completed at the same time. On the other
hand, the protein cleavage and the labeling reactions are carried out in different steps; this procedure is
named as decoupled 18
O-labeling.
Ultrasonic energy (UE) has recently emerged as a powerful tool in sample treatment for proteomics
[3–7]. Furthermore, it has been demonstrated that UE can reduce the sample treatment time for protein
identification through MS techniques, namely by peptide mass fingerprint, from 12 - 24 h to 8 min [7].
Notably, not only time is saved, but also the handling is simplified since there is no need of high salt
concentrations or chaotropic agents. Moreover, UE has been applied to speed up the sample treatment
for 18
O-labeling in both the decoupled and direct approaches [4, 8].
We demonstrate in the present work that in the 18
O-labeling decoupled procedure UE is only worthy to
speed up the protein enzymatic digestion, and it is ineffective in the enhancement of the labeling
process.
VII.3. Experimental
Protein digestion and labeling was performed using the materials and reagents as described elsewhere
[4–7]. The Sonoreactor, model UTR 200, from Hielscher Ultrasonics (Teltow, Germany) and the
ultrasonic multi-probe from Branson Ultrasonics (Danbury, CT, USA), model SLPe (150 W, 40 kHz
ultrasonic frequency, 1 mm probe diameter), equipped with a multi-probe detachable horn (model
4c15) were used as UE sources.
Digestion of proteins was performed with a urea-free procedure, as previously described by our group
with minor modifications [7]. Briefly, a stock solution of BSA or α-lactalbumin was prepared in
ammonium bicarbonate buffer (25 mM, pH 8.25) using natural abundance water, and then mixed with
acetonitrile (ACN) in a 1:1 ratio. To speed up the process, protein denaturation, reduction (DTT 10
mM) and alkylation (IAA 50 mM) were performed with UE (sonoreactor, 50 % ultrasonication
amplitude, 1 min ultrasonication time). Aliquots of 5 µL, corresponding to 15 µg of protein, were
diluted to a final volume of 20 µL with ammonium bicarbonate (12.5 mM). Trypsin was added (1:20
(w/w) enzyme-to-protein ratio) to a final volume of 24 µL and the protein solutions were
Chapter VII
175
ultrasonicated with the sonoreactor during two intervals of 2.5 min at 50 % amplitude. To stop the
enzymatic reaction, 2 µL of formic acid (50 %, v/v) were added. Finally, the samples were dried by
vacuum centrifugation. For the 18
O-labeling, the dried digested peptides were dissolved in 10 µL of
calcium chloride (50 mM) and 10 µL of ACN (20 % , v/v)/ ammonium acetate (100 mM, pH 6.75)
with proteomics grade trypsin in a 1:40 or 1:20 (w/w) enzyme-to-protein ratio. Then, the samples were
dried again, and after evaporation the dried samples were dissolved in 10 mL of natural abundance
water or 97 % 18
O-enriched water. Then, the digested peptides were labeled during 12 h (6 + 6 h) at
37ºC with the addition of a second amount of trypsin (1:40 (w/w) enzyme-to-protein ratio) after the
first 6 h, or labeled with UE using the sonoreactor at 50 % amplitude, with different ultrasonication
time: (i) (2.5 + 2.5 min); (ii) 5 min (continuous); (iii) (5 + 5 min); (iv) (15 + 15 min); and (v) 30 min
(continuous). A second amount of trypsin (1:40 (w/w) enzyme-to-protein ratio) was always added to
the samples after the first ultrasonication period, except when continuous ultrasonication was
performed (ii and v), where trypsin (1:20 (w/w) enzyme-to-protein ratio) was added once, before the
labeling reaction. The total amount of trypsin added was the same in all experiments. For comparative
purposes an ultrasonic multi-probe was also used at 10 % amplitude during (2 + 2 min) to accelerate
the labeling reaction (trypsin was added twice). Furthermore, a set of experiments where no UE was
used to accelerate the labeling reaction was also performed at room temperature (RT): (i) (2.5 + 2.5
min); (ii) (5 + 5 min); and (iii) (15 + 15 min). In all experiments trypsin was added twice (1:40 (w/w)
enzyme-to-protein ratio) as explained before. The labeling reaction was stopped by adding TFA to 1 %
(v/v) final concentration.
MALDI-TOF-MS spectra were obtained with a Voyager DE-PRO™ Biospectrometry™ Workstation
model from Applied Biosystems (Foster City, CA, USA), equipped with a nitrogen laser radiating at
337 nm using the conditions described elsewhere [4–7].
Isotopic peak deconvolution was performed with the deisotope function of the Data Explorer™
software (version 4.0) from Applied Biosystems [9]. To test the applicability of this function, the
mathematical algorithm for deconvolution described by Yao et al. [10] was also used in the first steps
of this work to calculate the 16
O/18
O ratios, and the results were compared.
VII.4. Results and discussion
Protein enzymatic digestion was done in 16
O water, which was then removed by drying the sample in a
vacuum centrifuge. The samples were dried to avoid the interference of any H216
O in the following
labeling step with 18
O. The labeling reaction time was comprised between 5 min and overnight (12 h).
Data presented in Figure VII.1a) with the percentage of double 18
O-incorporation in BSA peptides
with the most intense peaks, shows that the double labeling of BSA peptides was achieved very
quickly: in 5 min most of the peptides were double labeled in a percentage higher than 90%.

Can ultrasonic energy efficiently speed 18
O-labeling of proteins?
176
Figure VII.1: a) And b) show the influence of time and ultrasonic energy on the double 18
O-
incorporation (18
O2 %) through the most intense peptides obtained after MALDI-TOF-MS analysis of
BSA (15 μg) and (b) α-lactalbumin (15 μg), respectively. Different labeling procedures were used: (i)
overnight labeling at 37ºC (6 + 6 h); ultrasonication with the sonoreactor at 50 % amplitude during (ii)
(2.5 + 2.5) min; (iii) 5 min (continuous); (iv) (5 + 5) min; (v) (15 + 15) min; (vi) 30 min (continuous);
and labeling without ultrasound at RT during (vii) (2.5 + 2.5 min); (viii) (5 + 5) min; and (ix) (15 +
15) min. c) Comparison of the labeling degree efficiency, calculated as the ratio between peptides
labeled with one 18
O (18
O1) and peptides labeled with two 18
O (18
O2), obtained for BSA (15 μg) after
ultrasonication with different ultrasonic devices and without ultrasonic energy: (i) no-ultrasound at
37ºC overnight (6 + 6 h); (ii) sonoreactor at 50 % amplitude during (2.5 + 2.5 min); (iii) no-ultrasound
at RT during (2.5 + 2.5 min); (iv) ultrasonic probe at 10 % amplitude during (2 + 2) min. d) And e)
report the comparison between 18
O-labeled human plasma peptides with the following different
methods: (i) overnight (O) at 37ºC (6 + 6 h); (ii) sonoreactor (U) at 50 % amplitude (5 + 5 min or 15 +
15); and (iii) no-ultrasound (N) at RT (5 + 5 min or 15 + 15 min). * Peptide not present in the spectra.
For all experiments three replicates were performed (n = 3).

Chapter VII
177
When the labeling reaction was performed with ultrasonic energy no improvement was obtained. The
same set of experiments was repeated with α-lactalbumin. For this protein, the effect of UE on the
double labeling efficiency can be easily understood by looking to the peptides VGINYWLAHK
([M+H]+: 1200.65 m/z) and ILDKVGINYWLAHK ([M+H]
+: 1669.94 m/z) in Figure VII.1b). The
double oxygen incorporation results obtained with an ultrasonication time of (2.5 + 2.5 min) were
similar to the values obtained with the same reaction time at RT without ultrasonication. In addition,
no differences were found concerning the yields of double 18
O-incorporation when other labeling
times were tested, with and without the use of UE, (data not shown). Hence, performing isotopic
labeling in a decoupled procedure using UE [8] does not produce any improvement, at least for the
conditions here reported. To further confirm this conclusion, a set of experiments using BSA was
carried out using an ultrasonic probe instead of the sonoreactor as proposed by Ferrer et al. [8].
Results presented in Figure VII.1c) show conclusively that there were no differences when the
labeling reaction was performed with or without the use of an ultrasonic probe in (2 + 2 min). In other
words, in the decoupled procedure the use of UE in the labeling step is ineffective. It must be referred
however, that UE is a powerful tool when the isotopic labeling is performed during protein digestion,
as demonstrated by Carreira et al. [4].
Additional corroboration of our conclusion was obtained by labeling Human plasma (Sigma), ca. 40
µL. The plasma was dissolved in ammonium bicarbonate (25 mM) after acetone precipitation. Each
sample was digested with 2 µg of trypsin in 5 min using the sonoreactor technology. Then, all samples
were concentrated to 10 µL and cleaned with zip-tip to eliminate salts from biological origin, which
could interfere with the labeling reaction or subsequent analysis. Finally, the samples were dried,
dissolved in 18
O water and labeled with and without UE as described in the caption of Figure VII.2.
After careful inspection and comparison between the MALDI spectra of labeled and unlabeled
samples, as shown in Figure VII.1d) and e), 182 ± 1 (n = 3) labeled peptides were found for the
overnight procedure; 171 ± 2 (n = 3, 10 min) and 176 ± 2 (n = 3, 30 min) labeled peptides were
obtained with the ultrasonic method; and the following labeled peptides at RT (no ultrasonication):
181 ± 1 (n = 3, 10 min) and 181 ± 3 (n = 3, 30 min). Concerning the 16
O/18
O-labeling efficiency and
the double 18
O-incorporation (18
O1/18
O2), we found that ca. 98% of all peptides were single or double
labeled, and the percentage of double 18
O-incorporation was higher than 90%. However, the classic
overnight 18
O-labeling performed better, since the intensities of the mass peaks observed in the
MALDI spectra were generally higher, compared to the accelerated protocols, as can be seen in Figure
VII.2. Even though, it must be emphasized that the results achieved in only 10 min of labeling were
good, since a considerable number of labeled peptides was obtained, most of them with good
intensities. In any case, for 10 or 30 min of labeling reaction, no improvements on the yields of the
labeled peptides neither on their intensities were observed when ultrasonication was used, comparing
to the results obtained for the same time with no ultrasonication.

Can ultrasonic energy efficiently speed 18
O-labeling of proteins?
178
Figure VII.2: MALDI mass spectra of Human plasma samples (~ 40 μg) labeled with 18
O using the
following treatment/conditions: lyophilized human plasma from Sigma was dissolved in 1 mL of
phosphate-buffered saline (PBS; pH = 7.2) and then aliquots of 40 µL were precipitated overnight
with 5 volumes of cold acetone. The samples were centrifuged at 10 000 x g, for 30 min (4ºC); the
supernatant was removed and the pellet was air dried. The pellet was dissolved in 40 μL of ammonium
bicarbonate 25 mM/ acetonitrile 50 % (v/v) and ultrasonicated in the sonoreactor (50 % amplitude)
during 1 minute to promote protein denaturation. Reduction and alkylation were performed with DTT
(10 mM) and IAA (50 mM), respectively, in the sonoreactor (50 % amplitude) for 1 minute (each
reaction). Protein digestion was performed during 5 min (2.5 + 2.5 min) in the sonoreactor (50 %
amplitude) with proteomics grade trypsin (1:20 (w/w) enzyme-to-protein ratio). Formic acid was
added to 1 % to stop the enzymatic digestion and the samples were concentrated to 10 μL in the
vacuum centrifuge. Sample cleaning was performed before the labeling reaction with C18 reversed-
phase ZipTip®. After cleaning the samples, the reagents used in the labeling reaction – CaCl2 (50 mM);
NH4CH3COO (100 mM); acetonitrile 20 % (v/v); and proteomics grade trypsin (1:20 (w/w) enzyme-
20
40
60
80
100 1.3E+4a)
677.41
931.54
1915.01
2091.94
2631.44
1471.90
20
40
60
80
100 1.1E+4b)
677.37931.47
1023.55
1471.78
1903.93
2060.02
2590.0720
40
60
80
1001.4E+4c)
677.53
931.69
1023.79
1472.11
1903.31
2060.44
2590.61
500 1000 1500 2000 2500 3000
1.4E+4e)
20
40
60
80
1001471.80
931.49
677.38
1023.57
1903.93
2060.032590.07
d) 1.0E+4
20
40
60
80
100
677.45
931.58
1023.66
1471.92
1904.04
2060.16
2590.21
500 1000 1500 2000 2500 3000500 1000 1500 2000 2500 3000
Mass (m/z)
Inte
ns
ity
(%
)

Chapter VII
179
to-protein ratio) were added. The peptides were dried again and finally dissolved in H218
O (97% atom
abundance) or in H216
O. Five labeling methods were tested: a) overnight – 12 h (6+ 6 h) at 37 ºC; b)
ultrasonication with the sonoreactor – 10 min (5 + 5 min) at 50 % amplitude; c) ultrasonication with
the sonoreactor – 30 min (15 + 15 min) at 50 % amplitude; d) without ultrasonication - 10 min (5 + 5
min) at RT; and e) without ultrasonication - 30 min (15 + 15 min) at RT . The labeling reaction was
stopped by adding TFA to 1 % and the peptides were analyzed by MALDI-TOF-MS.
VII.5. Conclusions
This work clearly demonstrates the great potential of UE to enhance the procedure for protein
18O-
labeling, but only when applied to the following steps in the first part of the 18
O-decoupled procedure:
(i) protein denaturation, (ii) protein reduction, (iii) protein alkylation and (iv) protein digestion. Our
results do not validate the data previously reported in literature [8] and suggest that the labeling
reaction in the decoupled procedure cannot be accelerated or improved with ultrasound, neither with
an ultrasonic probe nor with the sonoreactor.
VII.6. Acknowledgments
R. J. Carreira acknowledges the doctoral grant SFRH/BD/28563/2006, from FCT (Fundação para a
Ciência e a Tecnologia) from Portugal. Dr. José-Luis Capelo-Martínez and Dr. Carlos Lodeiro
acknowledge Xunta de Galicia (Spain) for the program Isidro Parga Pondal. The research findings
here reported are protected under patent pending PCT/IB2006/052314 and PT 103 303. FCT is also
acknowledged for financial support under the project POCI/QUI/55519/2004 FCT-FEDER.
VII.7. References
[1] Gevaert, K., Impens, F., Ghesquiere, B., Van Damme, P. et al., Stable isotopic labeling in
proteomics. Proteomics 2008, 8, 4873–4885.
[2] Miyagi, M., Rao, K. C. S., Proteolytic 18
O-labeling strategies for quantitative proteomics. Mass
Spectrom. Rev. 2007, 26, 121–136.
[3] López-Ferrer, D., Capelo, J. L., Vázquez, J., Ultra fast trypsin digestion of proteins by high
intensity focused ultrasound. J. Proteome Res. 2005, 4, 1569–1574.
[4] Carreira, R. J., Rial-Otero, R., López-Ferrer, D., Lodeiro, C., Capelo, J. L., Ultrasonic energy as a
new tool for fast isotopic 18
O labeling of proteins for mass spectrometry based techniques: preliminary
results. Talanta 2008, 76, 400–406.
[5] Rial-Otero, R., Carreira, R. J., Cordeiro, F. M., Moro, A. J. et al., Sonoreactor-based technology
for fast high-throughput proteolytic digestion of proteins. J. Proteome Res. 2007, 6, 909–912.

Can ultrasonic energy efficiently speed 18
O-labeling of proteins?
180
[6] Cordeiro, F. M., Carreira, R. J., Rial-Otero, R., Rivas, M. G. et al., Simplifying sample handling
for protein identification by peptide mass fingerprint using matrix-assisted laser desorption/ionization
time-of-flight mass spectrometry. Rapid Commun. Mass Spectrom. 2007, 21, 3269–3278.
[7] Santos, H. M., Mota, C., Lodeiro, C., Moura, I. et al., An improved clean sonoreactor-based
method for protein identification by mass spectrometry-based techniques. Talanta 2008, 77, 870–875.
[8] López-Ferrer, D., Heibeck, T. H., Petritis, K., Hixson, K. K. et al., Rapid Sample processing for
LC-MS-based quantitative proteomics using high intensity focused ultrasound. J. Proteome Res. 2008,
7, 3860–3867.
[9] Data Explorer™ Software User Guide, Section 3, 45–47.
[10] Yao, X., Freas, A., Ramirez, J., Demirev, P. A., Fenselau, C., Proteolytic 18
O-labeling for
comparative proteomics: model studies with two serotypes of adenovirus. Anal. Chem. 2001, 73,
2836–2842.

181
PART IV


Chapter VIII
183
Chapter VIII
CONCLUSIONS AND FUTURE PROSPECTS


Chapter VIII
185
VIII.1. Conclusions
New ultrasonic-based procedures for rapid protein identification and quantitation by mass
spectrometry have been developed. Ultrasonic energy was successfully used to enhance, improve and
simplify different stages of the typical sample treatment workflow for protein identification and 18
O-
labeling for protein quantitation.
Protein enzymatic digestion is the crucial step of any peptide mass fingerprinting experiment for
protein identification, and it is usually performed during 12 h. Hence, ultrasonic energy was first
applied to this stage, specifically to in-gel protein digestion. Different ultrasonic devices, such as the
ultrasonic probe and the sonoreactor, were used, and the following operating conditions were studied
and successfully optimized: (i) sample volume; (ii) sonotrode diameter; (iii) ultrasound amplitude; (iv)
ultrasonication time; (v) protein denaturation; (vi) protein concentration; (vii) cooling; and (viii)
enzyme concentration.
As far as the ultrasonic probe is concerned, the results showed that protein digestion can be carried out
in 120 s, in a sample volume as low as 25 µL. When possible, 100 µL should be used instead, to avoid
aerosol formation and extra manipulation steps. The diameter of the probe was not a critical parameter
to obtain good results, but it should be chosen in accordance with the sample volume. In addition, due
to the short ultrasonication time used for protein digestion, there is no risk of sample overheating.
Regarding the minimum amount of protein necessary to obtain confident identification, the threshold
was the same as for the classic sample treatment: 0.06 µg (quantity of BSA used for enzymatic
digestion). Finally, it was also found that, to obtain confident protein identification, the reduction and
alkylation procedures cannot be omitted in the sample treatment even when ultrasound is used to
accelerate the enzymatic reaction.
Successful protein identification was also obtained after 60 s of enzymatic digestion in the sonoreactor
at 50 % amplitude. Besides being faster than the classic sample treatment, the sonoreactor
methodology is also faster than the common ultrasonic probe procedure, since it allows the
simultaneous digestion of 6 samples. Moreover, because the ultrasound intensity is lower than the one
provided by the probe, the ultrasonication time can be increased without increasing gel degradation,
and without compromising protein identification. At last, it must be highlighted the sonoreactor
technology performs ultrasonication in closed vials, which reduces contamination between samples
and allows the application of this procedure to hazardous biological samples. Moreover, sample
contamination with metals, as in the case of the ultrasonic probe, is avoided. Due to the
aforementioned reasons, the sonoreactor is the recommended ultrasonic device for protein digestion.

Conclusions and Future Prospects
186
The application of ultrasonic energy was also tested in other stages of the gel-based workflow for
protein identification, namely: protein reduction, alkylation and gel washing steps. The total time
needed to perform those steps was reduced ca. 85 %. Furthermore, the sample handling was drastically
simplified. The results obtained, i.e. the number of identified peptides and percentage of protein
sequence coverage, were similar between the ultrasonic bath, the sonoreactor and ultrasonic probe.
Yet, the ultrasonic bath provides higher sample throughput and therefore, it is the recommended
apparatus enhance protein reduction, protein alkylation and the gel washing steps. The new procedure
for protein identification by PMF was successfully validated in complex biological samples from
sulfate reducing bacteria: Desulfovibrio desulfuricans G20, Desulfuvibrio gigas NCIB 9332, and
Desulfuvibrio desulfuricans ATCC 27774
For the optimization of the direct labeling procedure, different ultrasonic devices were used: an
ultrasonic bath, an ultrasonic probe and a sonoreactor. Regarding the ultrasonic bath, the best results
were obtained in 30 min with an ultrasound frequency of 130 kHz, a bath temperature of 60ºC, and 70
% of amplitude. The labeling efficiency (16
O /18
O) obtained in these conditions was equivalent to the
classic sample treatment, but the labeling degree (18
O1/18
O2) was only acceptable for BSA. A water
bath at 60ºC, with no ultrasonication, was also tested for comparative purposes and the results
obtained, i.e. labeling efficiency and labeling degree, were lower than the ultrasonic bath procedure.
As far as the ultrasonic probe is concerned, the labeling efficiency was not compromised and the best
results were obtained after 120 s. Yet, the labeling degree was lower than that obtained with the classic
methodology, especially for larger peptides. Overall, the best conditions were achieved with the
sonoreactor, using an enzyme-to-protein ratio of 1:40 (w/w), and 50 % of ultrasound amplitude during
15 min. It was also found that the labeling efficiency and labeling degree vary with the sample
concentration and the type of peptide. The sonoreactor procedure was further tested in a complex
protein sample from human plasma, but acceptable double 18
O-incorporation results were not
obtained. Hence, in the presence of complex samples like this, two approaches are recommended: (i)
the decoupled labeling procedure, in which peptides are double labeled in percentages higher than 95
%; or (ii) mathematical algorithms that measure the effective 18
O-incorporation rate and correct for the
18O abundance, due to the variable enzyme-substrate specificity during the labeling reaction.
Finally, interesting results were obtained when ultrasonic energy was applied to the decoupled 18
O-
labeling procedure. A significant simplification and reduction of the sample treatment time was
accomplished in the first part of the decoupled procedure: the total time used for protein denaturation,
reduction, alkylation and digestion was reduced from 12 h to only 8 min with the sonoreactor, at 50 %
of ultrasound amplitude. However, the results obtained in the second part of the procedure, comprising
protein 18
O-labeling, do not validate previously published data by other authors. The labeling reaction
was assessed with and without ultrasonic energy, and the results obtained with both approaches were

Chapter VIII
187
equivalent to the ones obtained with the classic methodology. These results were confirmed when a
complex protein sample, from human plasma, was processed with the described sample treatment.
VIII.2. Final remarks and future prospects
Proteomics has experienced an enormous growth and innumerous developments since it was
introduced in early 1990’s, and nowadays its applications span different areas of knowledge, from
fundamental systems biology, to clinical diagnosis. Over the years, different technologies and
methodologies have been developed, most of them related with protein separation, quantitation and
mass spectrometry analysis. Yet, most of these technological advances and improvements are not
implemented in many small laboratories, because the technology is not easily accessible, or because it
is too expensive.
The procedures developed throughout this dissertation rely on ultrasonic energy for rapid protein
identification and quantitation. The ultrasonic devices used are easily accessible from different
companies, and most of them are available in the common laboratory: the ultrasonic bath, for instance,
is present in almost all laboratories, and can be used for different tasks; and the ultrasonic probe is also
common and used most of the times for cell disruption in biological samples. Furthermore, the
developed methodologies are simple, easy to perform, minimize the sample handling, can be used for
on-line approaches, and save time and money.
However, despite the significant reduction and simplification of the sample treatment achieved with
the new ultrasonic-based procedures, the handling still needs to be done by humans. Therefore, one of
the most interesting applications of this work would be the development of ultrasound robotic
platforms. Robots equipped with multi-ultrasonic probes, or with a sonoreactor-like bath, could be
used to perform all the tedious sample handling for protein identification or quantitation, allowing the
researcher to be focused on more important tasks, such as data analysis and interpretation of the
results. Furthermore, the variability in the results would be largely decreased by automated systems.
Ultrasonic energy has proven its efficiency to enhance protein digestion with trypsin. Yet, different
proteases, or combinations of proteases, are sometimes used for the digestion of complex protein
samples. Thus, it would be interesting to evaluate the efficiency and effect of ultrasound when applied
to protein digestion with different proteases. Moreover, it would be also very important to test the
application of ultrasonic energy in on-line approaches, particularly MudPIT approaches
Another interesting application would be the analysis of complex biological samples for rapid
detection of pathogenic micro-organisms. This would be useful not only in pandemic situations, which
require the rapid identification of the infectious agent, but also to identify the biological agents used in

Conclusions and Future Prospects
188
biological warfare and terror, which demand a rapid response from governments to minimize the risk
for civilians.