Embed Size (px)
Citation preview
A Discovery Proteomics Workflow for the Elucidation of Prostate Cancer Biomarkers
Application Note
Authors
Claire Tonry and Stephen Pennington School of Medicine, UCD Conway Institute University College Dublin
Mark Sartain and Christine Miller Agilent Technologies, Inc. Santa Clara, California, USA
IntroductionIn biological systems, the host microenvironment is profoundly altered during tumor growth, and this includes becoming hypoxic due to insufficient blood supply. The hypoxic microenvironment correlates with increased tumor aggressiveness, invasiveness, and resistance to clearance [1]. In addition to other effects, the deprivation of molecular oxygen under hypoxic conditions may modulate the tumor cell proteome, leading to alterations in cell proliferation, and dynamics of the cell cycle [2]. Given the importance of androgen-regulated proteins, it is anticipated that further characterization of the role of hypoxia and androgen sensitivity may provide further insight into the mechanisms that drive aggressive, cellular hypertrophy/tumor growth [3].
This application note specifically demonstrates the LC/MS-based discovery portion of a clinical research workflow to comprehensively compare the proteome of androgen-independent and androgen-sensitive cell lines under both hypoxic and normoxic conditions, to identify potential protein biomarkers that may be indicative of important changes within the cellular microenvironment that drive abnormal cellular growth.
2
Sample preparation for nano LC-MS/MS analysisWhole cell lysates were prepared for nano LC-MS/MS analysis according to the filter-aided sample preparation (FASP) method described by Wisniewski; et al. [4]. Briefly, 50 μg of cell lysate protein were reduced through boiling (95 °C for 5 minutes) with DTT in a final concentration of 0.1 M. Then, 200 μL of UA buffer (8 M urea, 0.1 M Tris-HCL, pH 8.5) was added to each sample, and samples were transferred to 30,000 MWCO Vivacon 500 spin filters (Sartorius) and centrifuged at 14,000 g for 40 minutes at 21 °C. Bound proteins were alkylated by incubating the spin filters for 5 minutes in 0.05 M iodoacetamide (IAA), followed by centrifugation at 14,000 g for 30 minutes at 21 °C. Spin filter membranes were then washed three times by adding UB (8 M urea, 0.1 M Tris/HCL, pH 8.0) and centrifuging at 14,000 g for 40 minutes at 21 °C. For maximum protein identification, sample protein was digested with both Lys-C (Wako Chemicals GmbH) and trypsin (Promega) enzymes. Proteins were initially digested overnight with Lys-C (enzyme:substrate 1:50) in a wet chamber. Digestion was completed by a 3-hour incubation with trypsin (enzyme:substrate 1:100) in a thermomixer set to 37 °C and 600 rpm. Digestion was stopped by acidifying the samples through the addition of trifluoroacetic acid (TFA) to a final concentration of 1 %. Peptide material from digested cell lysates were purified using C18 resin ZipTips (Millipore). Each ZipTip contains C18 resin packed into a 10-µL pipette tip with a loading capacity of 5 μg protein/peptide per tip. This allows for purification of peptide material of molecular weight between 0–50 kDa. For purification of cellular peptides, the C18 resin was activated with 10 µL of acetonitrile (x10). The resin was then equilibrated by pipetting 10 µL of 0.5 % trifluoroacetic acid (TFA) (x10). Peptides were then bound to the resin by pipetting 15 µL of digested sample through the resin (x10). Bound peptides were eluted into fresh Eppendorf tubes in 25 µL of Elution Buffer (70 % acetonitrile, 0.1 % TFA) (x2). To ensure maximum yield of purified peptide for nano LC-MS/MS analysis, this process was repeated four times for each sample. Eluted peptides were dried down under vacuum for approximately 1 hour at 30 °C, and resuspended in 30 µL of Buffer A (3 % ACN, 0.1 % formic acid) to allow for ~3 μg of peptide per 5-µL injection on the Agilent 6550 Q-TOF mass spectrometer.
Methods
Cell cultureThe PCa cell lines LNCaP, LNCaP-abl (abl), and LNCaP-abl-Hof (Hof) were gifted to the Irish Prostate Cancer Research Consortium, Dublin, Ireland from the laboratory of Professor Helmut Klocker (Department of Urology, University of Innsbruck, Austria). Culturing the above cell lines was conducted in a Class II laminar flow cabinet. Cells were maintained in T175 cm2 flasks with ventilation (Sarstedt) in a 5 % CO2-humidified atmosphere at 37 °C. LNCaP cells were maintained in Advance RPMI 1640 media (GIBCO Life Technologies), and supplemented with 10 % fetal calf serum (FCS) (Sigma-Aldrich), 2 μM/mL L-glutamine (GIBCO Life Technologies), 50 unit/mL penicillin, and 50 μg/mL streptomycin (GIBICO Life Technologies). Abl and Hof cells were maintained in Advance RPMI 1640 media supplemented with 10 % charcoal stripped FCS (Sigma-Aldrich), 2 μM/mL L-glutamine (GIBCO Life Technologies), 50 unit/mL penicillin, and 50 μg/mL streptomycin (GIBICO Life Technologies). Cell media were changed every 3–4 days.
Simulation of hypoxia in PCa cell linesLNCaP, Abl, and Hof cell lines were seeded into 10 cm2 culture dishes and grown to 70–80 % confluence. For each cell line, medium was removed and replaced with appropriate medium supplemented with 1 mM dimethyloxaloglycine (DMOG; Cambridge Bioscience) or 1 mM dimethyl sulfoxide (DMSO; Sigma Aldrich) as a control. Cells were incubated in treated media for either 8 or 24 hours prior to cell lysis. For each cell line, three biological replicates were performed for each time point.
3
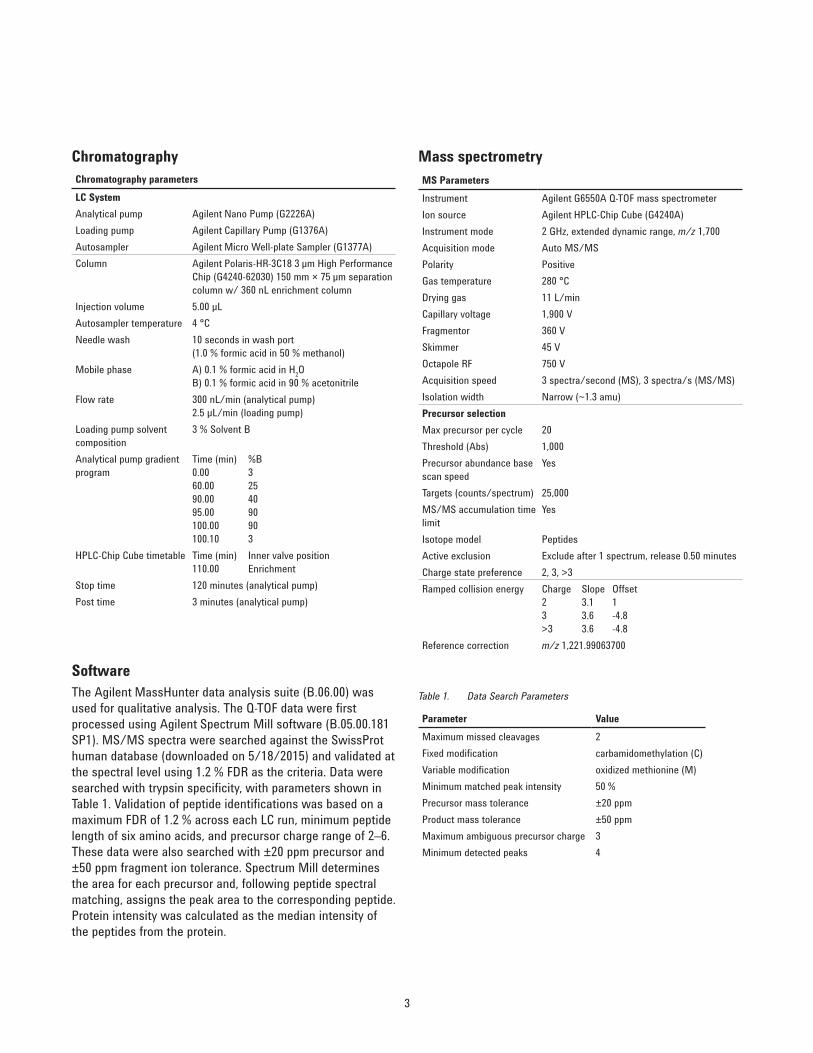
Chromatography parametersLC SystemAnalytical pump Agilent Nano Pump (G2226A)Loading pump Agilent Capillary Pump (G1376A)Autosampler Agilent Micro Well-plate Sampler (G1377A)Column Agilent Polaris-HR-3C18 3 µm High Performance
Chip (G4240-62030) 150 mm × 75 µm separation column w/ 360 nL enrichment column
Injection volume 5.00 µLAutosampler temperature 4 °CNeedle wash 10 seconds in wash port
(1.0 % formic acid in 50 % methanol)Mobile phase A) 0.1 % formic acid in H2O
B) 0.1 % formic acid in 90 % acetonitrileFlow rate 300 nL/min (analytical pump)
2.5 µL/min (loading pump)Loading pump solvent composition
3 % Solvent B
Analytical pump gradient program
Time (min) %B 0.00 3 60.00 25 90.00 40 95.00 90 100.00 90 100.10 3
HPLC-Chip Cube timetable Time (min) Inner valve position 110.00 Enrichment
Stop time 120 minutes (analytical pump)Post time 3 minutes (analytical pump)
MS ParametersInstrument Agilent G6550A Q-TOF mass spectrometerIon source Agilent HPLC-Chip Cube (G4240A)Instrument mode 2 GHz, extended dynamic range, m/z 1,700Acquisition mode Auto MS/MSPolarity PositiveGas temperature 280 °CDrying gas 11 L/minCapillary voltage 1,900 VFragmentor 360 VSkimmer 45 VOctapole RF 750 VAcquisition speed 3 spectra/second (MS), 3 spectra/s (MS/MS)Isolation width Narrow (~1.3 amu)Precursor selectionMax precursor per cycle 20Threshold (Abs) 1,000Precursor abundance base scan speed
Yes
Targets (counts/spectrum) 25,000MS/MS accumulation time limit
Yes
Isotope model PeptidesActive exclusion Exclude after 1 spectrum, release 0.50 minutesCharge state preference 2, 3, >3Ramped collision energy Charge Slope Offset
2 3.1 1 3 3.6 -4.8 >3 3.6 -4.8
Reference correction m/z 1,221.99063700
Chromatography Mass spectrometry
SoftwareThe Agilent MassHunter data analysis suite (B.06.00) was used for qualitative analysis. The Q-TOF data were first processed using Agilent Spectrum Mill software (B.05.00.181 SP1). MS/MS spectra were searched against the SwissProt human database (downloaded on 5/18/2015) and validated at the spectral level using 1.2 % FDR as the criteria. Data were searched with trypsin specificity, with parameters shown in Table 1. Validation of peptide identifications was based on a maximum FDR of 1.2 % across each LC run, minimum peptide length of six amino acids, and precursor charge range of 2–6. These data were also searched with ±20 ppm precursor and ±50 ppm fragment ion tolerance. Spectrum Mill determines the area for each precursor and, following peptide spectral matching, assigns the peak area to the corresponding peptide. Protein intensity was calculated as the median intensity of the peptides from the protein.
Parameter ValueMaximum missed cleavages 2Fixed modification carbamidomethylation (C)Variable modification oxidized methionine (M)Minimum matched peak intensity 50 %Precursor mass tolerance ±20 ppmProduct mass tolerance ±50 ppmMaximum ambiguous precursor charge 3Minimum detected peaks 4
Table 1. Data Search Parameters
4
Protein intensity results were imported into Agilent Mass Profiler Professional software (MPP) version B.14.8 for differential analysis. MPP parameters were as follows: Normalization: none; Baseline: z-transform; Filter by Abundance: Greater than or equal to 2 and present in 66 % of 1 in 6 conditions.
Differential results were mapped to pathways using the Pathway Architect module in MPP. The source for pathways was KEGG, and averaged results were used for mapping.
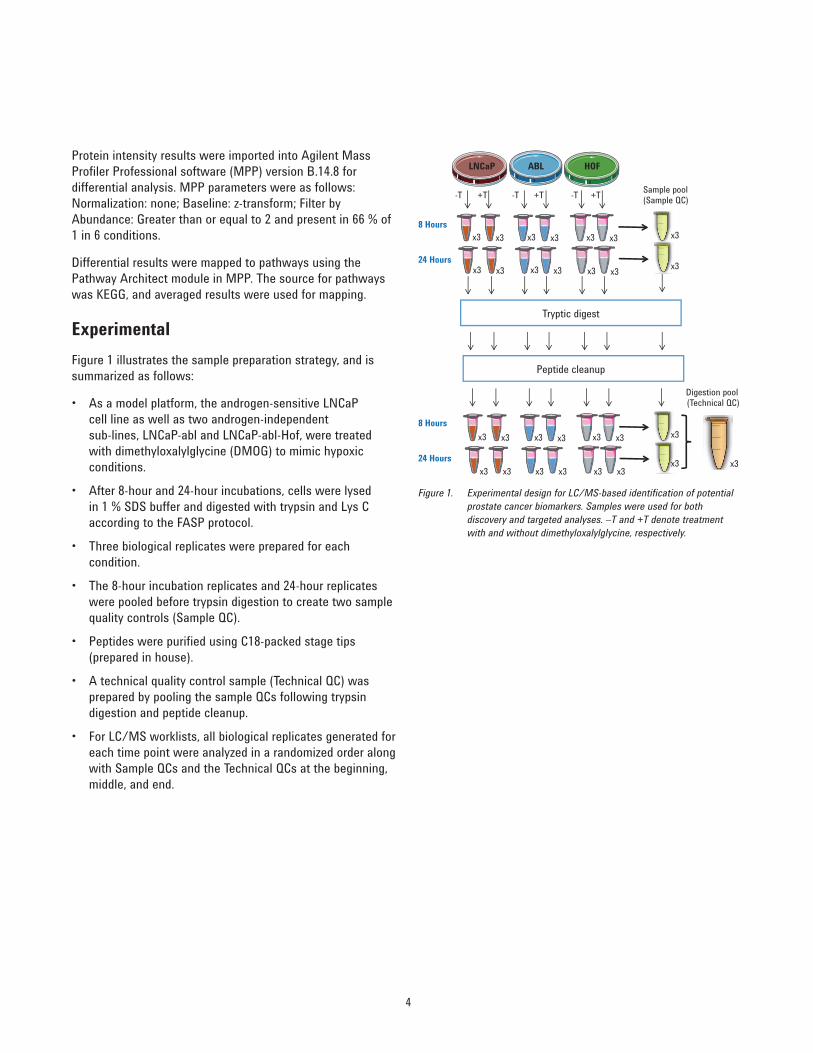
ExperimentalFigure 1 illustrates the sample preparation strategy, and is summarized as follows:
• As a model platform, the androgen-sensitive LNCaP cell line as well as two androgen-independent sub-lines, LNCaP-abl and LNCaP-abl-Hof, were treated with dimethyloxalylglycine (DMOG) to mimic hypoxic conditions.
• After 8-hour and 24-hour incubations, cells were lysed in 1 % SDS buffer and digested with trypsin and Lys C according to the FASP protocol.
• Three biological replicates were prepared for each condition.
• The 8-hour incubation replicates and 24-hour replicates were pooled before trypsin digestion to create two sample quality controls (Sample QC).
• Peptides were purified using C18-packed stage tips (prepared in house).
• A technical quality control sample (Technical QC) was prepared by pooling the sample QCs following trypsin digestion and peptide cleanup.
• For LC/MS worklists, all biological replicates generated for each time point were analyzed in a randomized order along with Sample QCs and the Technical QCs at the beginning, middle, and end.
LNCaP ABL HOF
-T -T -T +T +T +T
8 Hours
24 Hours
Sample pool(Sample QC)
Digestion pool(Technical QC)
Tryptic digest
Peptide cleanup
x3
x3
x3
x3 x3
8 Hours
24 Hours
x3 x3
x3 x3
x3 x3
x3 x3
x3 x3
x3 x3
x3 x3
x3 x3
x3 x3
x3 x3
x3 x3
x3 x3
Figure 1. Experimental design for LC/MS-based identification of potential prostate cancer biomarkers. Samples were used for both discovery and targeted analyses. –T and +T denote treatment with and without dimethyloxalylglycine, respectively.
5
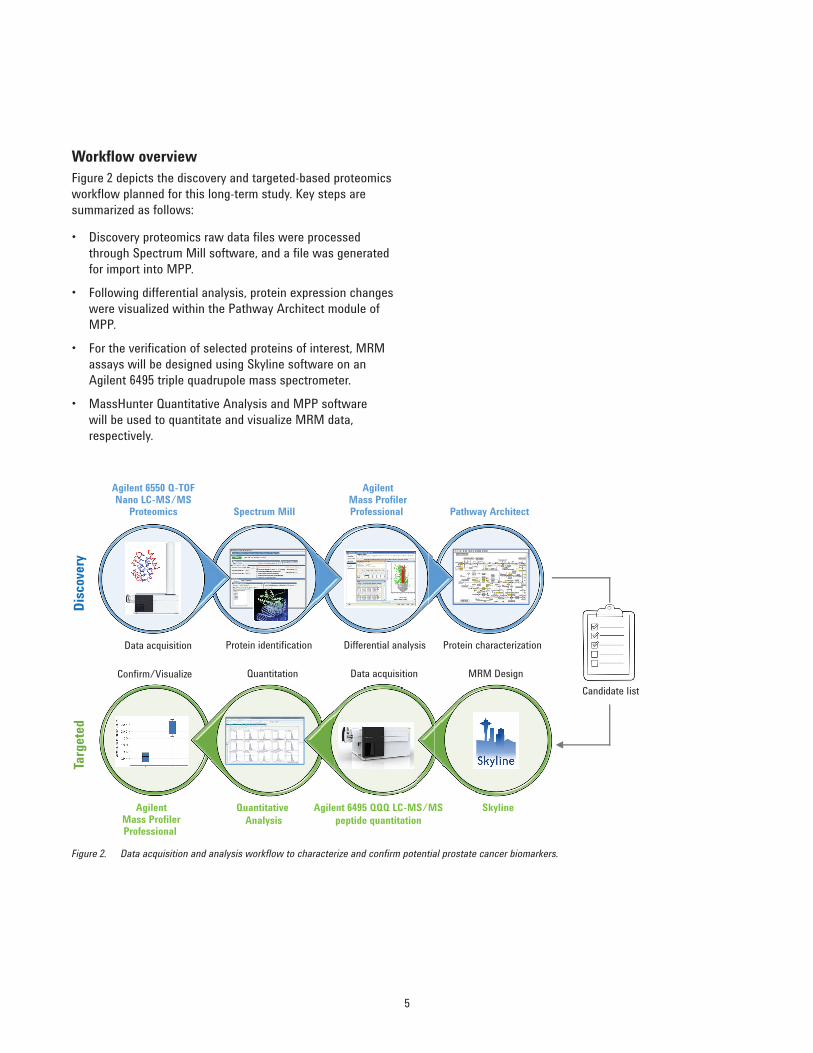
Workflow overviewFigure 2 depicts the discovery and targeted-based proteomics workflow planned for this long-term study. Key steps are summarized as follows:
• Discovery proteomics raw data files were processed through Spectrum Mill software, and a file was generated for import into MPP.
• Following differential analysis, protein expression changes were visualized within the Pathway Architect module of MPP.
• For the verification of selected proteins of interest, MRM assays will be designed using Skyline software on an Agilent 6495 triple quadrupole mass spectrometer.
• MassHunter Quantitative Analysis and MPP software will be used to quantitate and visualize MRM data, respectively.
Figure 2. Data acquisition and analysis workflow to characterize and confirm potential prostate cancer biomarkers.
Spectrum Mill
AgilentMass ProfilerProfessional
AgilentMass ProfilerProfessional
Agilent 6550 Q-TOFNano LC-MS/MS
Proteomics Pathway Architect
Data acquisition Protein identification Differential analysis Protein characterization
Quantitative Analysis
Agilent 6495 QQQ LC-MS/MSpeptide quantitation
Skyline
Confirm/Visualize Quantitation Data acquisition MRM Design
Disc
over
yTa
rget
ed
Candidate list
6
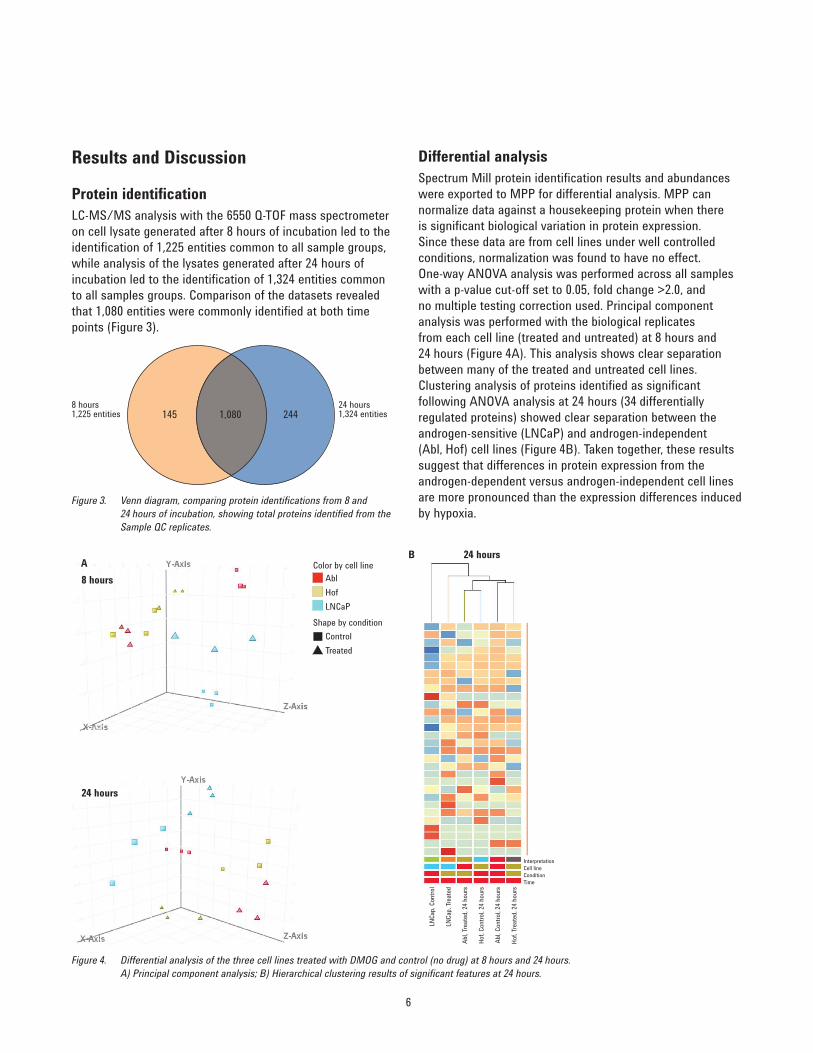
Differential analysisSpectrum Mill protein identification results and abundances were exported to MPP for differential analysis. MPP can normalize data against a housekeeping protein when there is significant biological variation in protein expression. Since these data are from cell lines under well controlled conditions, normalization was found to have no effect. One-way ANOVA analysis was performed across all samples with a p-value cut-off set to 0.05, fold change >2.0, and no multiple testing correction used. Principal component analysis was performed with the biological replicates from each cell line (treated and untreated) at 8 hours and 24 hours (Figure 4A). This analysis shows clear separation between many of the treated and untreated cell lines. Clustering analysis of proteins identified as significant following ANOVA analysis at 24 hours (34 differentially regulated proteins) showed clear separation between the androgen-sensitive (LNCaP) and androgen-independent (Abl, Hof) cell lines (Figure 4B). Taken together, these results suggest that differences in protein expression from the androgen-dependent versus androgen-independent cell lines are more pronounced than the expression differences induced by hypoxia.
Results and Discussion
Protein identificationLC-MS/MS analysis with the 6550 Q-TOF mass spectrometer on cell lysate generated after 8 hours of incubation led to the identification of 1,225 entities common to all sample groups, while analysis of the lysates generated after 24 hours of incubation led to the identification of 1,324 entities common to all samples groups. Comparison of the datasets revealed that 1,080 entities were commonly identified at both time points (Figure 3).
8 hours1,225 entities
24 hours1,324 entities145 1,080 244
Figure 3. Venn diagram, comparing protein identifications from 8 and 24 hours of incubation, showing total proteins identified from the Sample QC replicates.
Figure 4. Differential analysis of the three cell lines treated with DMOG and control (no drug) at 8 hours and 24 hours. A) Principal component analysis; B) Hierarchical clustering results of significant features at 24 hours.
A8 hours
24 hours
B 24 hours
AblColor by cell line
Shape by condition
HofLNCaP
ControlTreated
InterpretationCell lineCondition
LNCa
p, Co
ntro
l
LNCa
p, T r
eate
d
Abl, T
reat
ed, 2
4 ho
urs
Hof,
Cont
rol, 2
4 ho
urs
Abl, C
ontro
l, 24
hour
s
Hof,
Trea
ted,
24 h
ours
Time
7
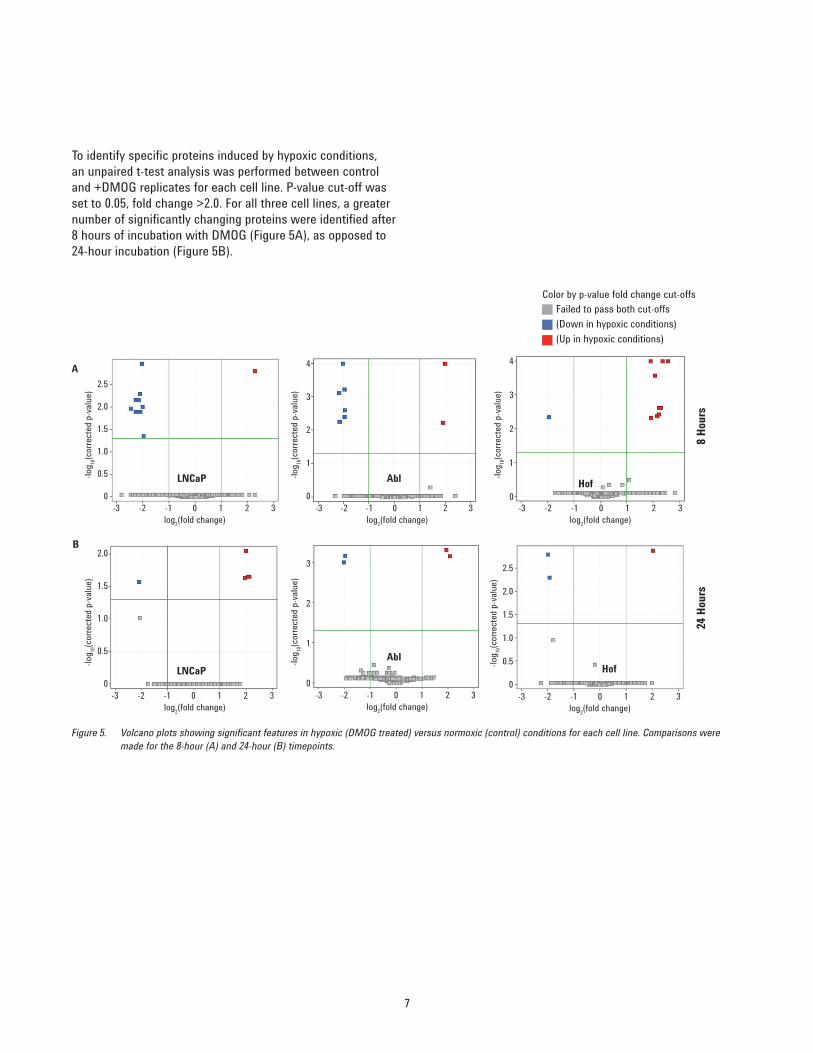
To identify specific proteins induced by hypoxic conditions, an unpaired t-test analysis was performed between control and +DMOG replicates for each cell line. P-value cut-off was set to 0.05, fold change >2.0. For all three cell lines, a greater number of significantly changing proteins were identified after 8 hours of incubation with DMOG (Figure 5A), as opposed to 24-hour incubation (Figure 5B).
Figure 5. Volcano plots showing significant features in hypoxic (DMOG treated) versus normoxic (control) conditions for each cell line. Comparisons were made for the 8-hour (A) and 24-hour (B) timepoints.
LNCaP Abl Hof
A2.5
2.0
1.5
1.0
0.5
0-3 -2 -1 0
log2(fold change)
-log 10
(cor
rect
ed p
-valu
e)
1 2 3
2.5
2.0
1.5
1.0
0.5
0-3 -2 -1 0
log2(fold change)
-log 10
(cor
rect
ed p
-valu
e)
1 2 3
2.0
1.5
1.0
0.5
0-3 -2 -1 0
log2(fold change)
-log 10
(cor
rect
ed p
-valu
e)
1 2 3
4
3
2
1
0-3 -2 -1 0
log2(fold change)
-log 10
(cor
rect
ed p
-valu
e)
1 2 3
3
2
1
0-3 -2 -1 0
log2(fold change)
-log 10
(cor
rect
ed p
-valu
e)
1 2 3
4
3
2
1
0-3 -2 -1 0
log2(fold change)
-log 10
(cor
rect
ed p
-valu
e)1 2 3
B
8 Ho
urs
24 H
ours
LNCaPAbl
Hof
(Up in hypoxic conditions)(Down in hypoxic conditions)Failed to pass both cut-offs
Color by p-value fold change cut-offs
8
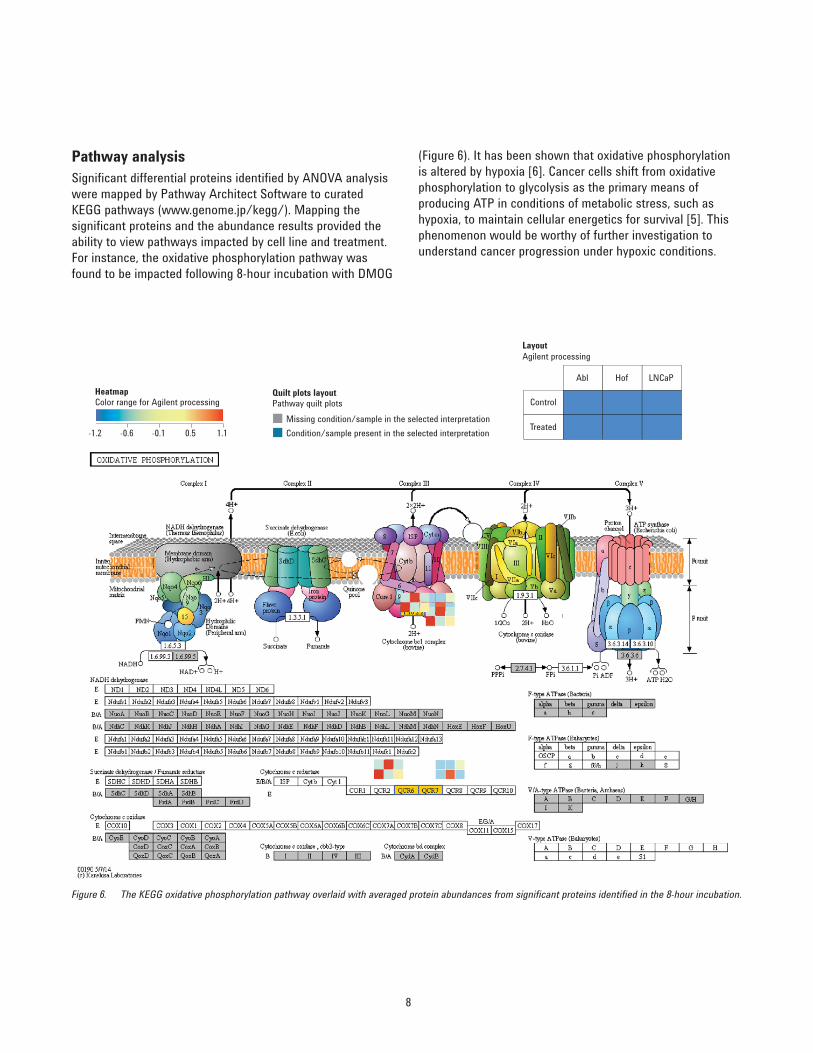
Pathway analysisSignificant differential proteins identified by ANOVA analysis were mapped by Pathway Architect Software to curated KEGG pathways (www.genome.jp/kegg/). Mapping the significant proteins and the abundance results provided the ability to view pathways impacted by cell line and treatment. For instance, the oxidative phosphorylation pathway was found to be impacted following 8-hour incubation with DMOG
HeatmapColor range for Agilent processing
-1.2 -0.6 -0.1 0.5 1.1
Quilt plots layoutPathway quilt plots
Missing condition/sample in the selected interpretationCondition/sample present in the selected interpretation
Agilent processingLayout
Control
Abl Hof LNCaP
Treated
Figure 6. The KEGG oxidative phosphorylation pathway overlaid with averaged protein abundances from significant proteins identified in the 8-hour incubation.
(Figure 6). It has been shown that oxidative phosphorylation is altered by hypoxia [6]. Cancer cells shift from oxidative phosphorylation to glycolysis as the primary means of producing ATP in conditions of metabolic stress, such as hypoxia, to maintain cellular energetics for survival [5]. This phenomenon would be worthy of further investigation to understand cancer progression under hypoxic conditions.
9
References1. A. Fraga, et al. “Hypoxia and Prostate Cancer
Aggressiveness: A Tale with Many Endings” Clin. Genitourin Cancer [Internet]. Elsevier Inc.; 13, 295–301 (2015). doi: 10.1016/j.clgc.2015.03.006
2. L. Harrison, K. Blackwell. “Hypoxia and anemia: factors in decreased sensitivity to radiation therapy and chemotherapy?” Oncologist [Internet], 9 Suppl 5, 31–40 (2004). doi: 10.1634/theoncologist.9-90005-31
3. L. Yin, Q. Hu, R. W. Hartmann. “Recent progress in pharmaceutical therapies for castration-resistant prostate cancer” Int. J. Mol. Sci. [Internet]. [cited 2014 Jun 3]; 14, 13958–78 (2013). doi: 10.3390/ijms140713958
4. J. R. Wisniewski, et al. “Universal sample preparation method for proteome analysis” Nature Methods, 6(5), 359-62 (2009). doi: 10.1038/nmeth.1322
5. K. E. Allison, B. L. Coomber, B. W. Bridle. “Metabolic Reprogramming in the Tumour Microenvironment: a Hallmark Shared by Cancer Cells and T Lymphocytes” Immunology, 1–10 (2017). https://doi.org/10.1111/imm.12777
6. P. Sontakke, et al. “Hypoxia-like signatures induced by BCR-ABL potentially alter the glutamine uptake for maintaining oxidative phosphorylation” PLoS ONE, 11(4), 1–16 (2016). https://doi.org/10.1371/journal.pone.0153226
ConclusionsThis application note introduces a discovery-to-targeted workflow to identify potential cancer biomarkers with Q-TOF-based label-free shotgun proteomics.
The results shown focused on the discovery phase, where Agilent Mass Profiler Professional software identified significant differential proteins between relevant cancer cell lines and growth conditions. To add biological context, these differential proteins were mapped onto biological pathways and visualized with Agilent Pathway Architect software. Targeted experiments to confirm these differential proteins through peptide MRM-based quantitation are currently underway.

www.agilent.com/chemFor Research Use Only. Not for use in diagnostic procedures.
Agilent shall not be liable for errors contained herein or for incidental or consequential damages in connection with the furnishing, performance, or use of this material.
Information, descriptions, and specifications in this publication are subject to change without notice.
© Agilent Technologies, Inc., 2017 Printed in the USA November 20, 2017 5991-8448EN