Embed Size (px)
Citation preview

8/3/2019 Sample N.U
http://slidepdf.com/reader/full/sample-nu 1/36
ANNEXURE C
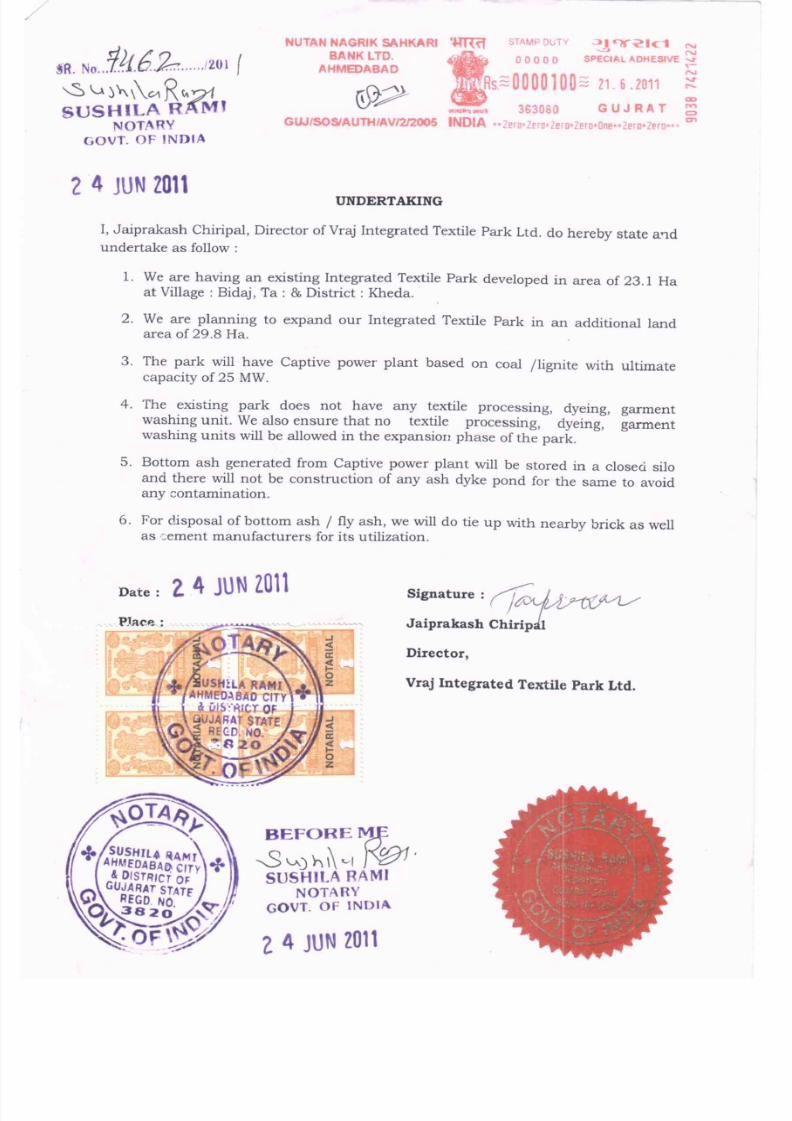
DULY NOTARIZED
UNDERTAKING
8/3/2019 Sample N.U
http://slidepdf.com/reader/full/sample-nu 2/36
8/3/2019 Sample N.U
http://slidepdf.com/reader/full/sample-nu 3/36
ANNEXURE D
CGWA PERMISSION FOR
PHASE 1
8/3/2019 Sample N.U
http://slidepdf.com/reader/full/sample-nu 4/36

8/3/2019 Sample N.U
http://slidepdf.com/reader/full/sample-nu 5/36
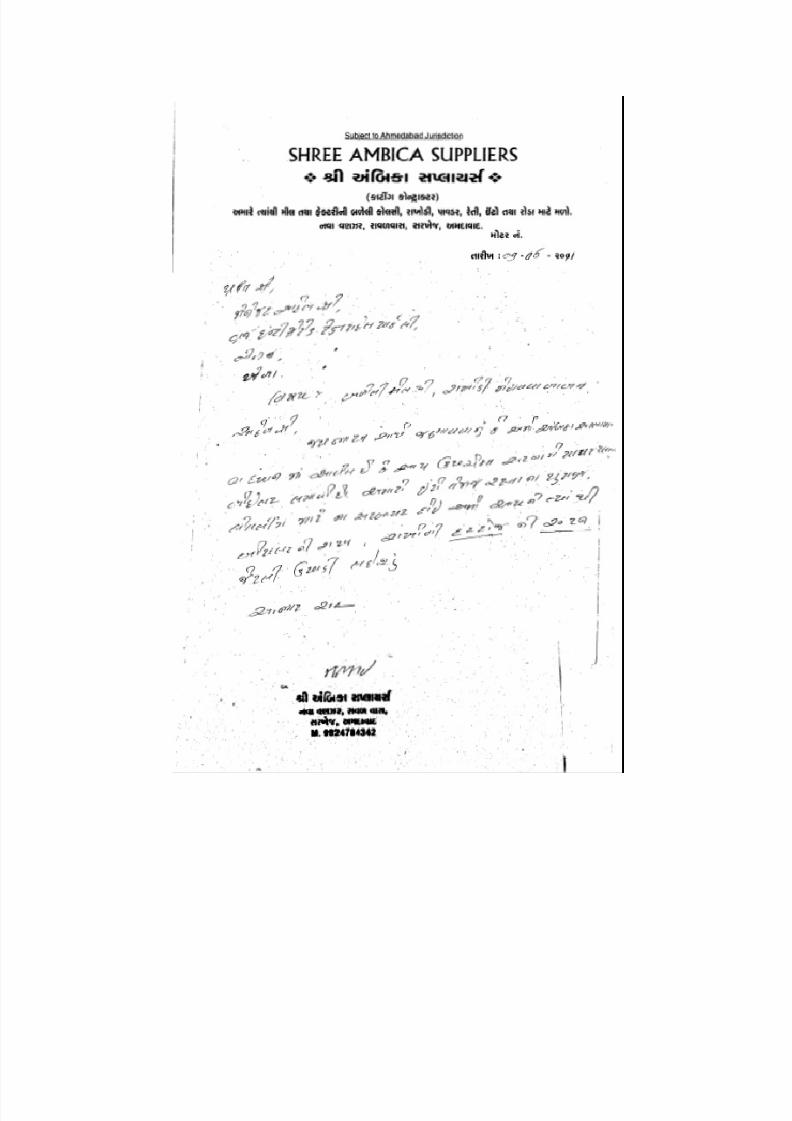
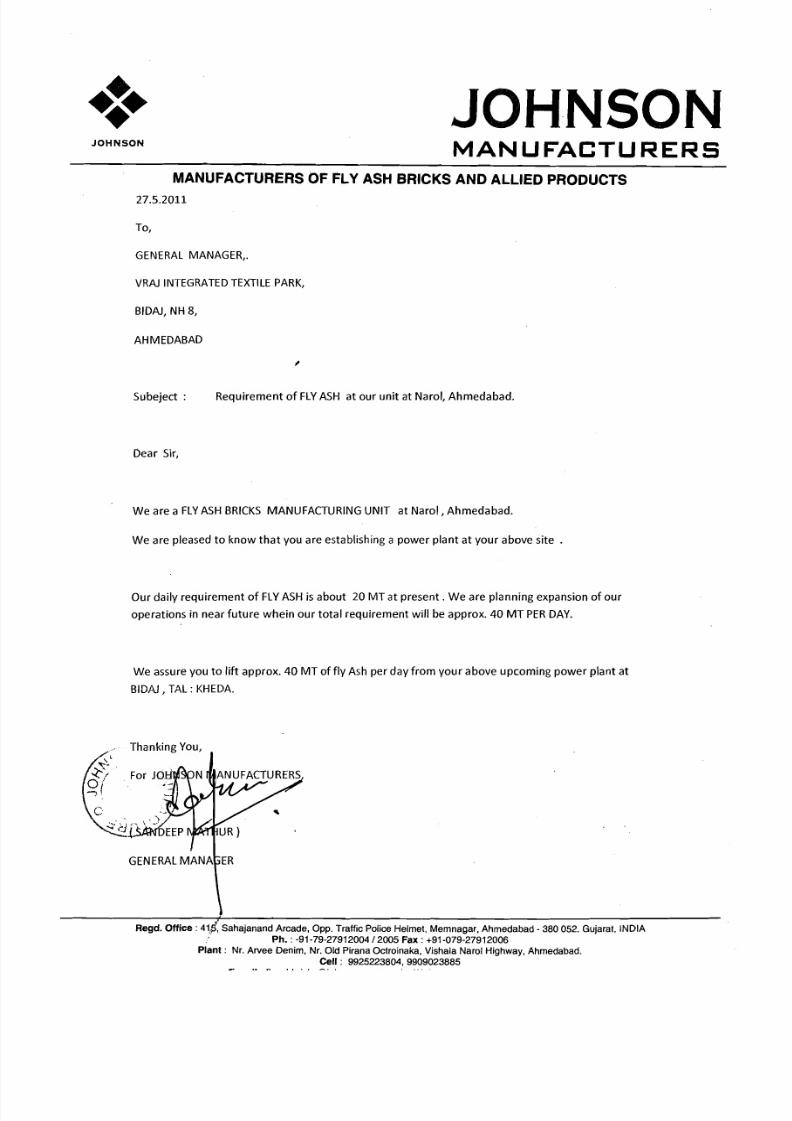
ANNEXURE E
COPY OF AGREEMENT
WITH BRICK
MANUFACTURER
8/3/2019 Sample N.U
http://slidepdf.com/reader/full/sample-nu 6/36
8/3/2019 Sample N.U
http://slidepdf.com/reader/full/sample-nu 7/36
8/3/2019 Sample N.U
http://slidepdf.com/reader/full/sample-nu 8/36
ANNEXURE F
GEOL HYDROLOGY
STUDY REPORT
8/3/2019 Sample N.U
http://slidepdf.com/reader/full/sample-nu 9/36
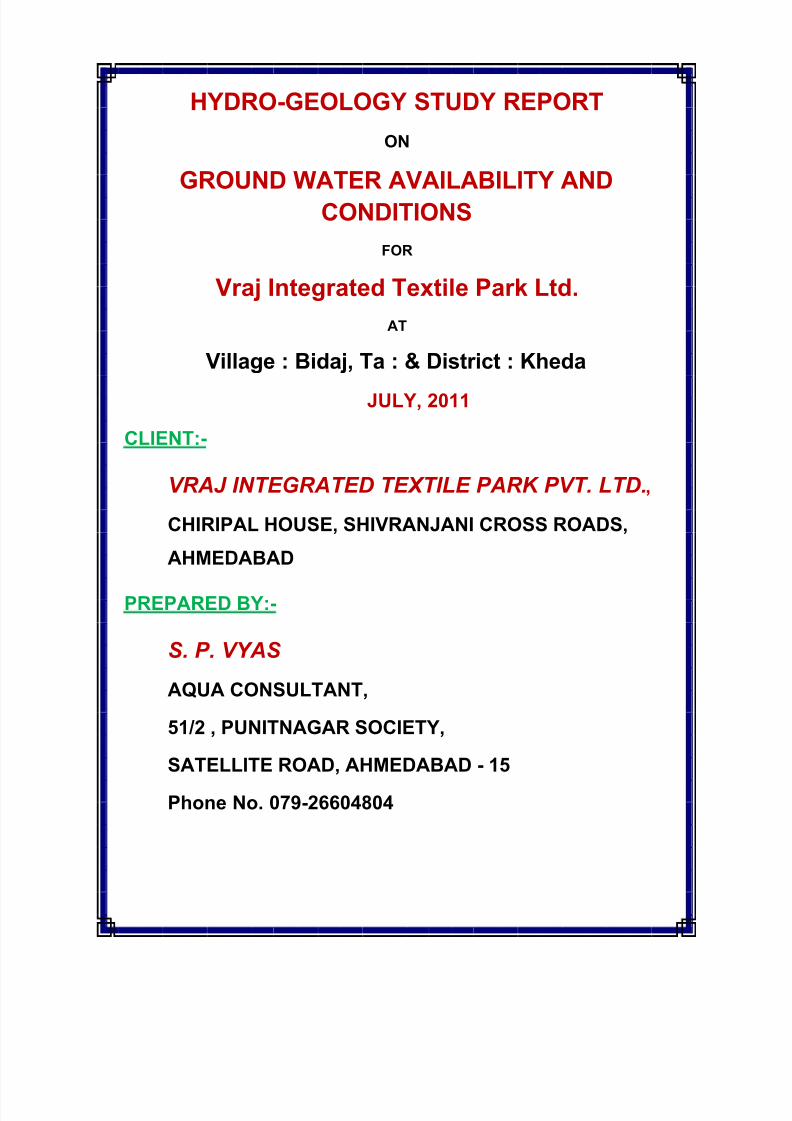
HYDRO-GEOLOGY STUDY REPORT
ON
GROUND WATER AVAILABILITY AND
CONDITIONS
FOR
Vraj Integrated Textile Park Ltd.
AT
Village : Bidaj, Ta : & District : Kheda
JULY, 2011 CLIENT:-
VRAJ INTEGRATED TEXTILE PARK PVT. LTD.,
CHIRIPAL HOUSE, SHIVRANJANI CROSS ROADS,
AHMEDABAD
PREPARED BY:-
S. P. VYAS
AQUA CONSULTANT,
51/2 , PUNITNAGAR SOCIETY,
SATELLITE ROAD, AHMEDABAD - 15
Phone No. 079-26604804
8/3/2019 Sample N.U
http://slidepdf.com/reader/full/sample-nu 10/36
HYDROLOGICAL REPORT FOR VRAJ INTEGRATED TEXTILE PARK LTD. (VITPL)
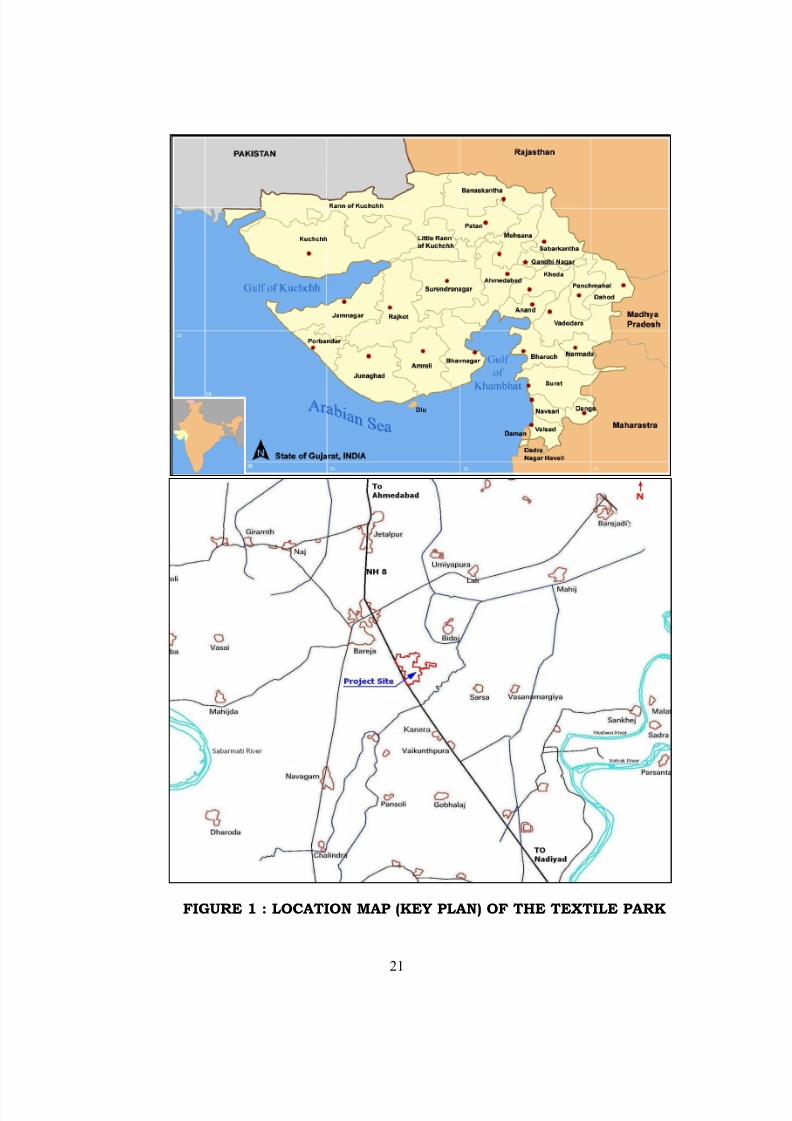
1. Introduction
This industrial Park for Textile Industry is located at Village Bidaj,
Dist. Kheda, Gujarat. It falls between north Longitude 72° 72°
Air Port and 20 km from Railway Station. The site is adjacent to
National Highway No. 8. The location map is attached as Figure 1.
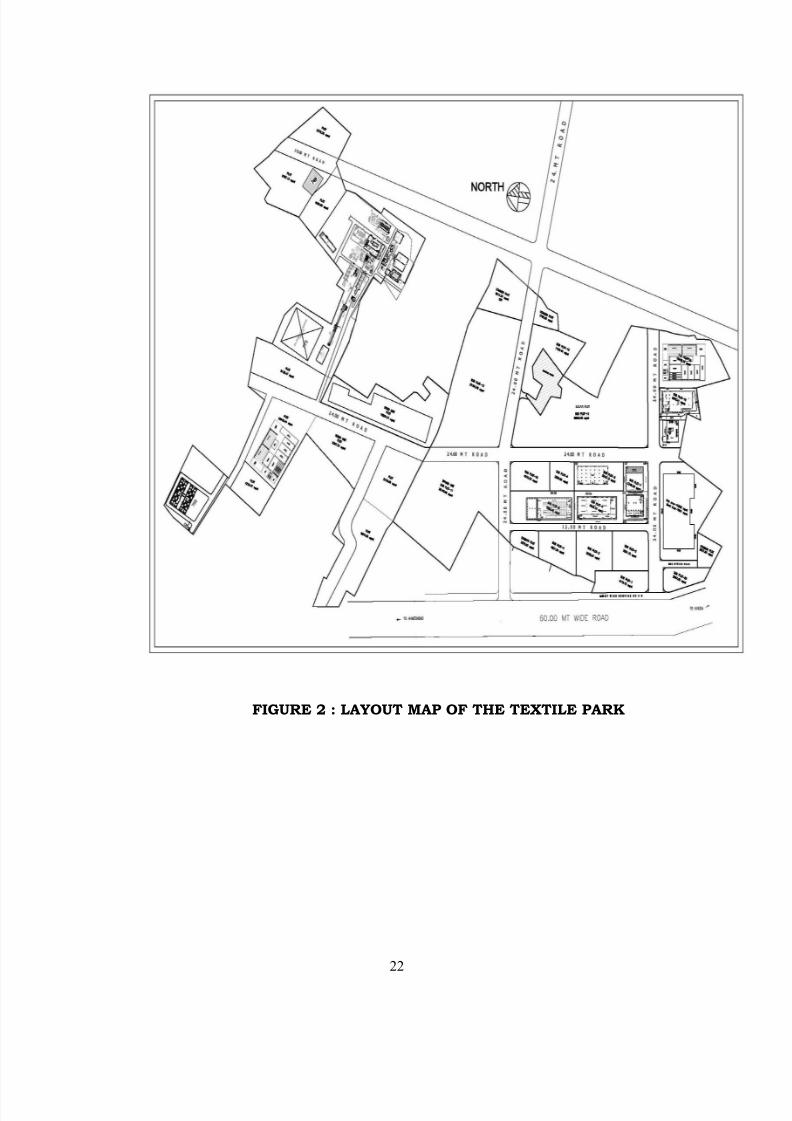
The park will have facilities for Spinning, Weaving,
Garmenting/Knitting, Sizing, Yarn Dying, Wrapping, Packing,
Finishing, Technical textile, POY. The park will also have CPP of 25MW, which will be operated on Coal / Lignite as a fuel. The total area
of the park is @ 50.45 Ha at the ultimate. The proposed layout the
entire park area (@52.45Ha) is attached as Figure 2.
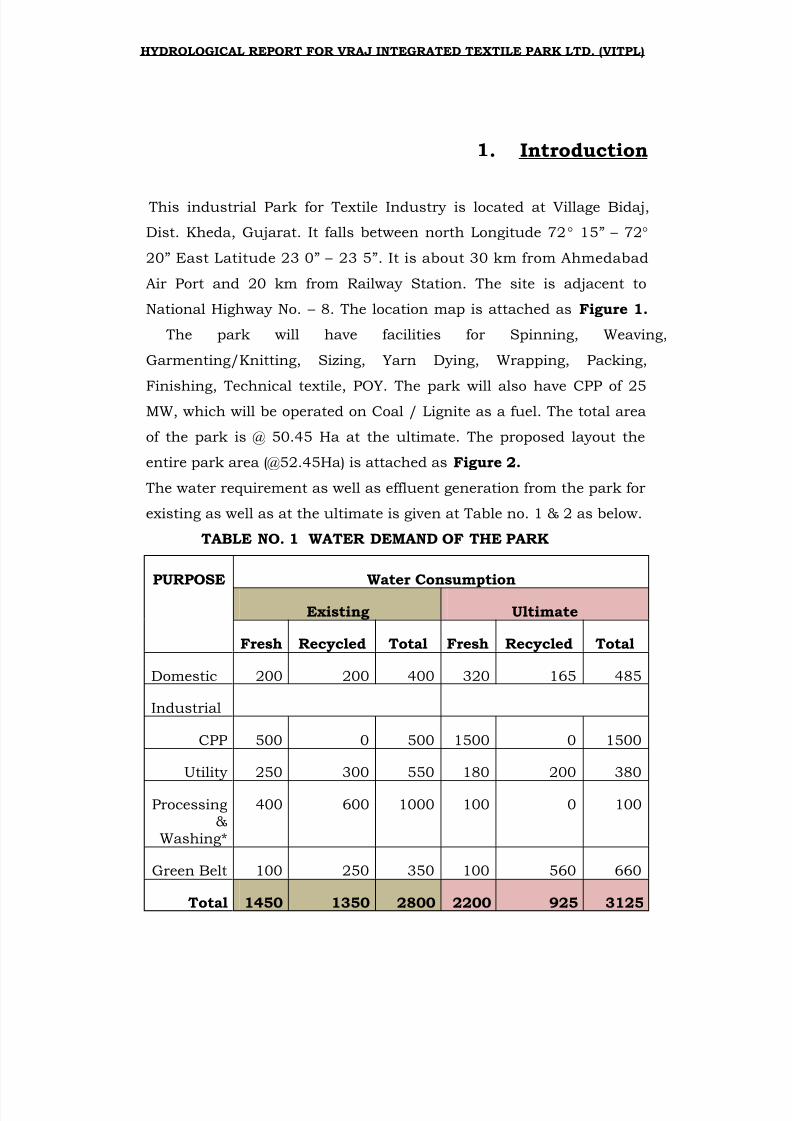
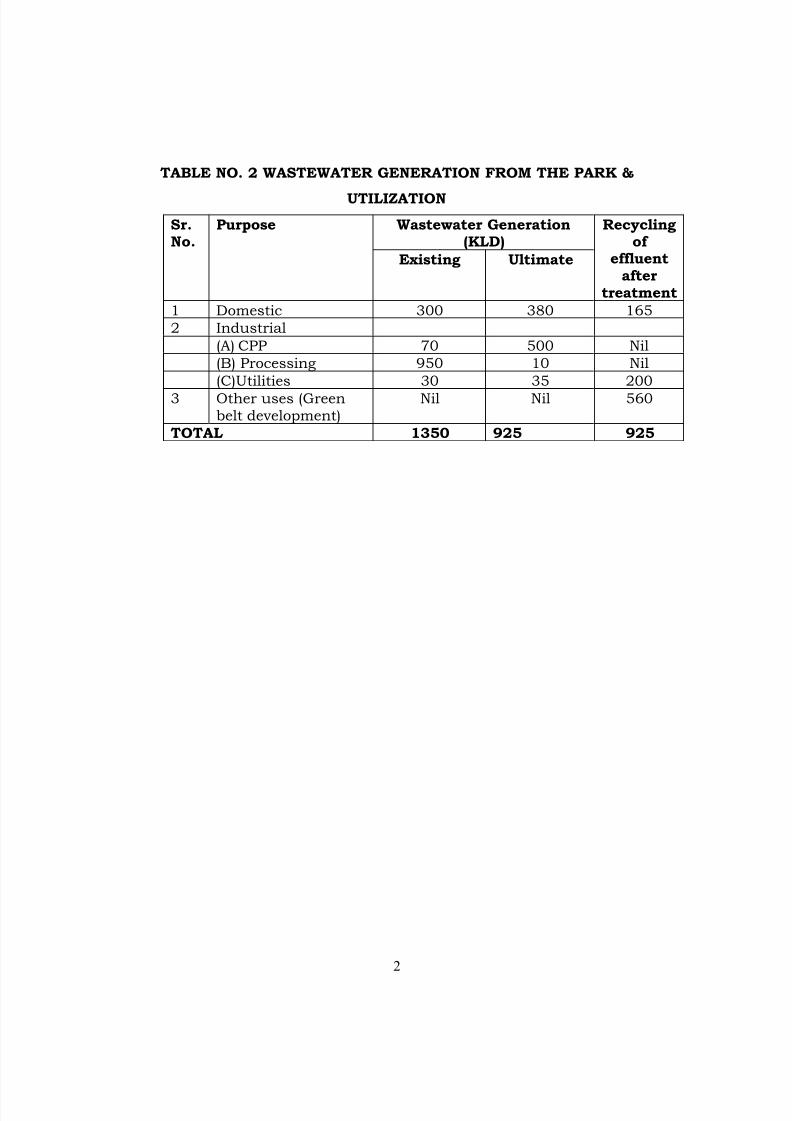
The water requirement as well as effluent generation from the park for
existing as well as at the ultimate is given at Table no. 1 & 2 as below.
TABLE NO. 1 WATER DEMAND OF THE PARK
PURPOSE Water Consumption
Existing Ultimate
Fresh Recycled Total Fresh Recycled Total
Domestic 200 200 400 320 165 485
Industrial
CPP 500 0 500 1500 0 1500
Utility 250 300 550 180 200 380
Processing&
Washing*
400 600 1000 100 0 100
Green Belt 100 250 350 100 560 660
Total 1450 1350 2800 2200 925 3125
8/3/2019 Sample N.U
http://slidepdf.com/reader/full/sample-nu 11/36
2
TABLE NO. 2 WASTEWATER GENERATION FROM THE PARK &
UTILIZATION
Sr.No.
Purpose Wastewater Generation(KLD)
Recyclingof
effluentafter
treatment
Existing Ultimate
1 Domestic 300 380 165
2 Industrial
(A) CPP 70 500 Nil
(B) Processing 950 10 Nil
(C)Utilities 30 35 200
3 Other uses (Greenbelt development)
Nil Nil 560
TOTAL 1350 925 925
8/3/2019 Sample N.U
http://slidepdf.com/reader/full/sample-nu 12/36
3
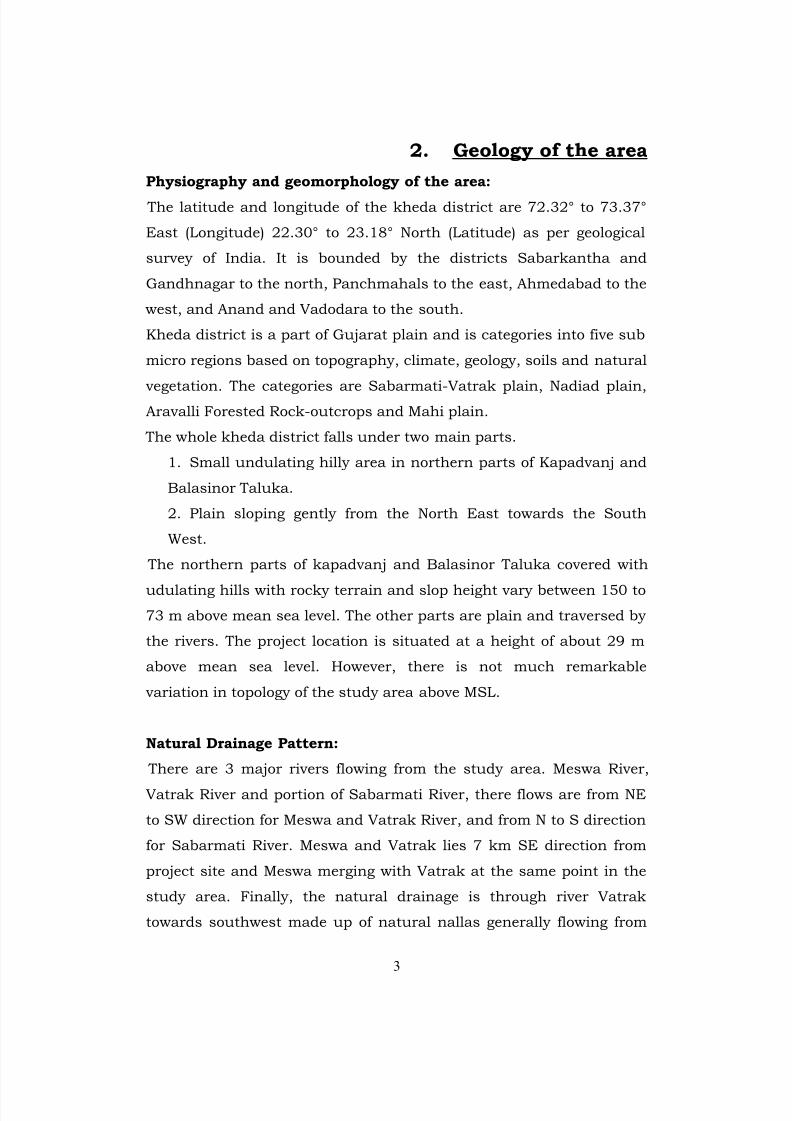
2. Geology of the area
Physiography and geomorphology of the area:
The latitude and longitude of the kheda district are 72.32° to 73.37°
East (Longitude) 22.30° to 23.18° North (Latitude) as per geological
survey of India. It is bounded by the districts Sabarkantha and
Gandhnagar to the north, Panchmahals to the east, Ahmedabad to the
west, and Anand and Vadodara to the south.
Kheda district is a part of Gujarat plain and is categories into five sub
micro regions based on topography, climate, geology, soils and natural
vegetation. The categories are Sabarmati-Vatrak plain, Nadiad plain,Aravalli Forested Rock-outcrops and Mahi plain.
The whole kheda district falls under two main parts.
1. Small undulating hilly area in northern parts of Kapadvanj and
Balasinor Taluka.
2. Plain sloping gently from the North East towards the South
West.
The northern parts of kapadvanj and Balasinor Taluka covered with
udulating hills with rocky terrain and slop height vary between 150 to
73 m above mean sea level. The other parts are plain and traversed by
the rivers. The project location is situated at a height of about 29 m
above mean sea level. However, there is not much remarkable
variation in topology of the study area above MSL.
Natural Drainage Pattern:
There are 3 major rivers flowing from the study area. Meswa River,
Vatrak River and portion of Sabarmati River, there flows are from NE
to SW direction for Meswa and Vatrak River, and from N to S direction
for Sabarmati River. Meswa and Vatrak lies 7 km SE direction from
project site and Meswa merging with Vatrak at the same point in the
study area. Finally, the natural drainage is through river Vatrak
towards southwest made up of natural nallas generally flowing from
8/3/2019 Sample N.U
http://slidepdf.com/reader/full/sample-nu 13/36
4
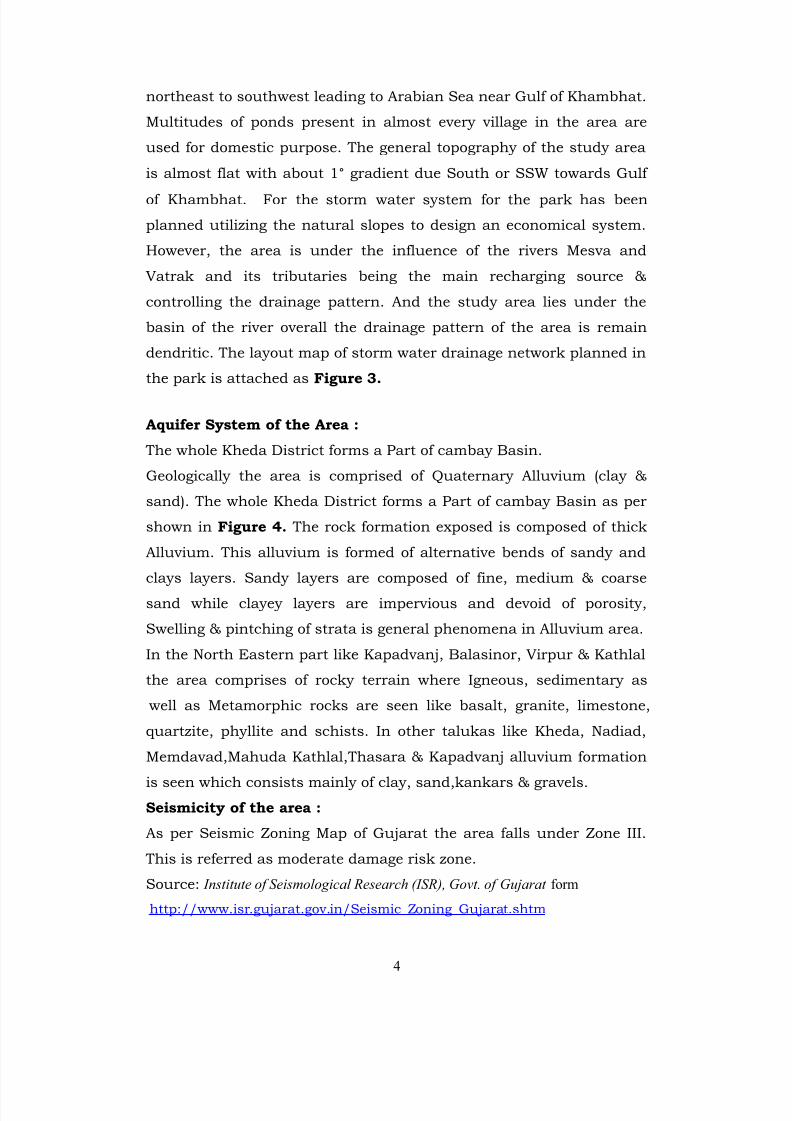
northeast to southwest leading to Arabian Sea near Gulf of Khambhat.
Multitudes of ponds present in almost every village in the area are
used for domestic purpose. The general topography of the study area
is almost flat with about 1° gradient due South or SSW towards Gulf
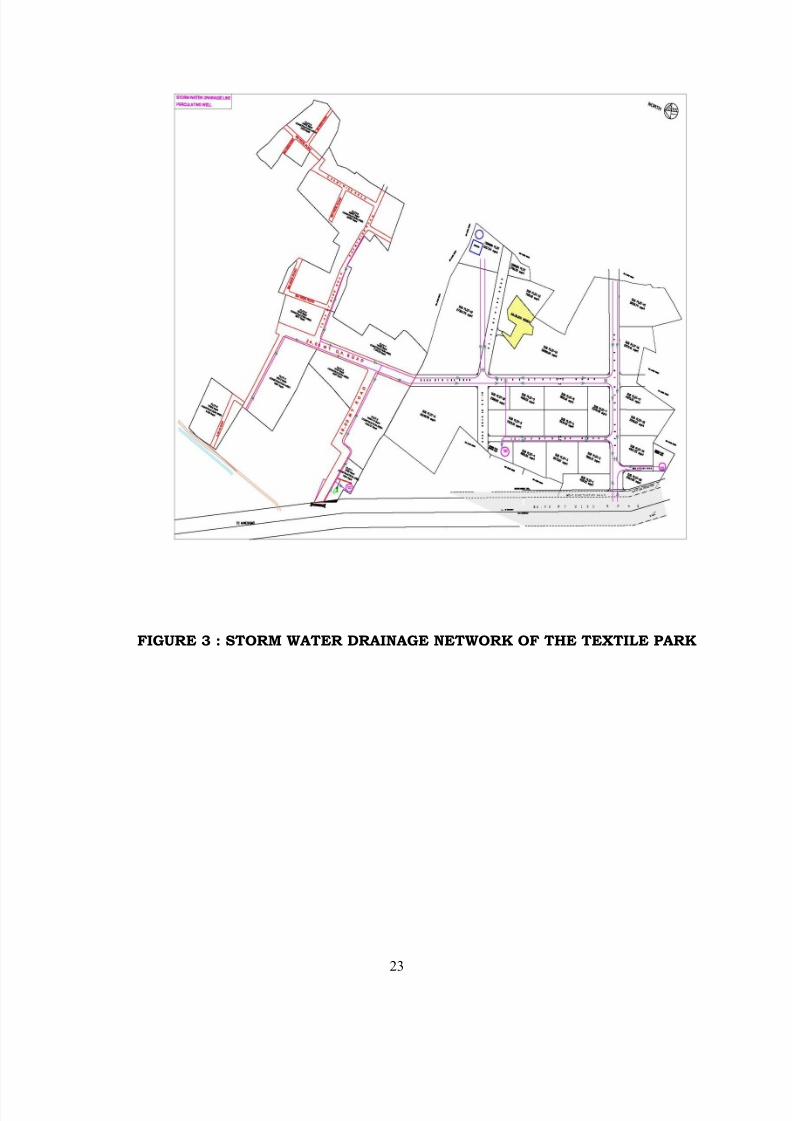
of Khambhat. For the storm water system for the park has been
planned utilizing the natural slopes to design an economical system.
However, the area is under the influence of the rivers Mesva and
Vatrak and its tributaries being the main recharging source &
controlling the drainage pattern. And the study area lies under the
basin of the river overall the drainage pattern of the area is remain
dendritic. The layout map of storm water drainage network planned in
the park is attached as Figure 3.
Aquifer System of the Area :
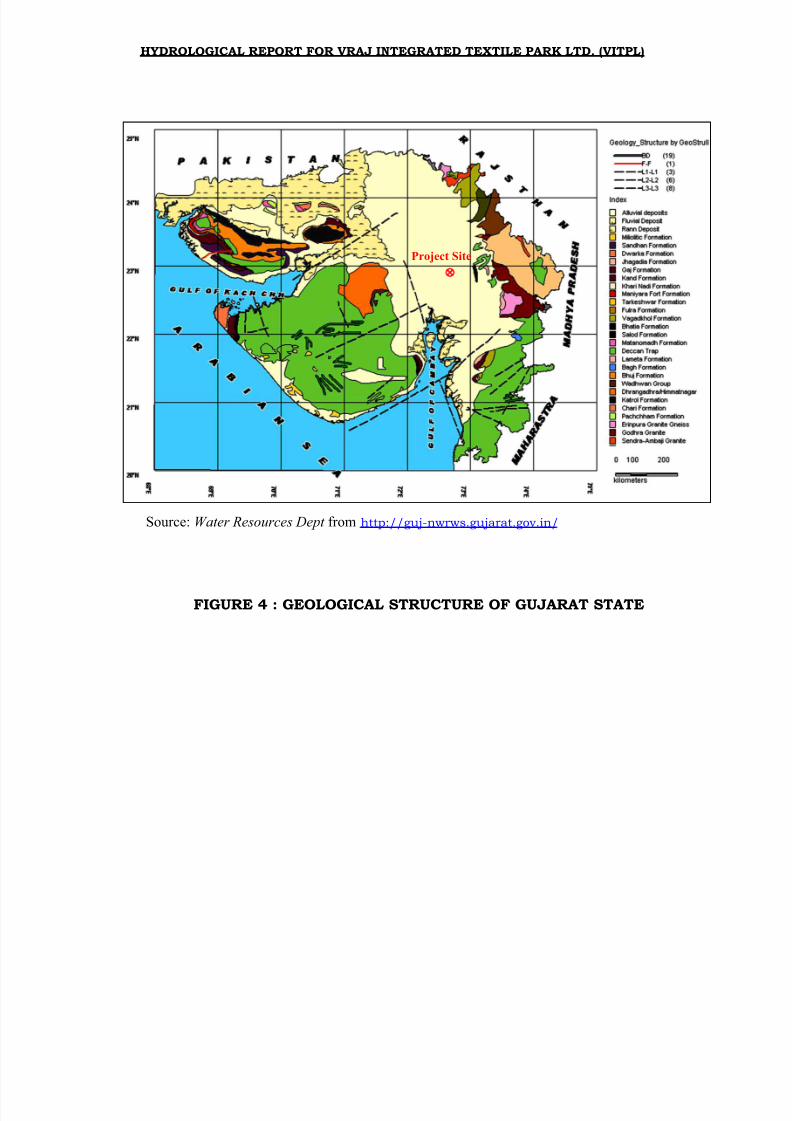
The whole Kheda District forms a Part of cambay Basin.
Geologically the area is comprised of Quaternary Alluvium (clay &
sand). The whole Kheda District forms a Part of cambay Basin as per
shown in Figure 4. The rock formation exposed is composed of thick
Alluvium. This alluvium is formed of alternative bends of sandy and
clays layers. Sandy layers are composed of fine, medium & coarse
sand while clayey layers are impervious and devoid of porosity,
Swelling & pintching of strata is general phenomena in Alluvium area.
In the North Eastern part like Kapadvanj, Balasinor, Virpur & Kathlal
the area comprises of rocky terrain where Igneous, sedimentary as
well as Metamorphic rocks are seen like basalt, granite, limestone,
quartzite, phyllite and schists. In other talukas like Kheda, Nadiad,
Memdavad,Mahuda Kathlal,Thasara & Kapadvanj alluvium formation
is seen which consists mainly of clay, sand,kankars & gravels.Seismicity of the area :
As per Seismic Zoning Map of Gujarat the area falls under Zone III.
This is referred as moderate damage risk zone.
Source: Institute of Seismological Research (ISR), Govt. of Gujarat form
http://www.isr.gujarat.gov.in/Seismic_Zoning_Gujarat.shtm
8/3/2019 Sample N.U
http://slidepdf.com/reader/full/sample-nu 14/36
5
Geo-hydrology of the area :
Ground water occurs under Confined state in sandy stratus of the
alluvium. These sandy stratums are porous & Permeable and have
huge thickness and large horizontal extensions. It contains lot of
ground water which is extracted by drilling deep tube wells. Main
source of ground water recharge is rainfall. About 20% of rainfall good
as percolation in to underground aquifers while rest goes as ran off in
depression areas situates nearby and as evaporation losses. In these
sandy strata certain upper beds are yielding sweet waters. While
certain beds situated at depth are yielding saline water. During
drilling of Tube well, Electro logging of pilot hole is carried out which
decides saline and fresh water bearing strata for deciding pipe
assembly in the deep Tube wells.
Hydrology of the study area :
Hydrological Parameters
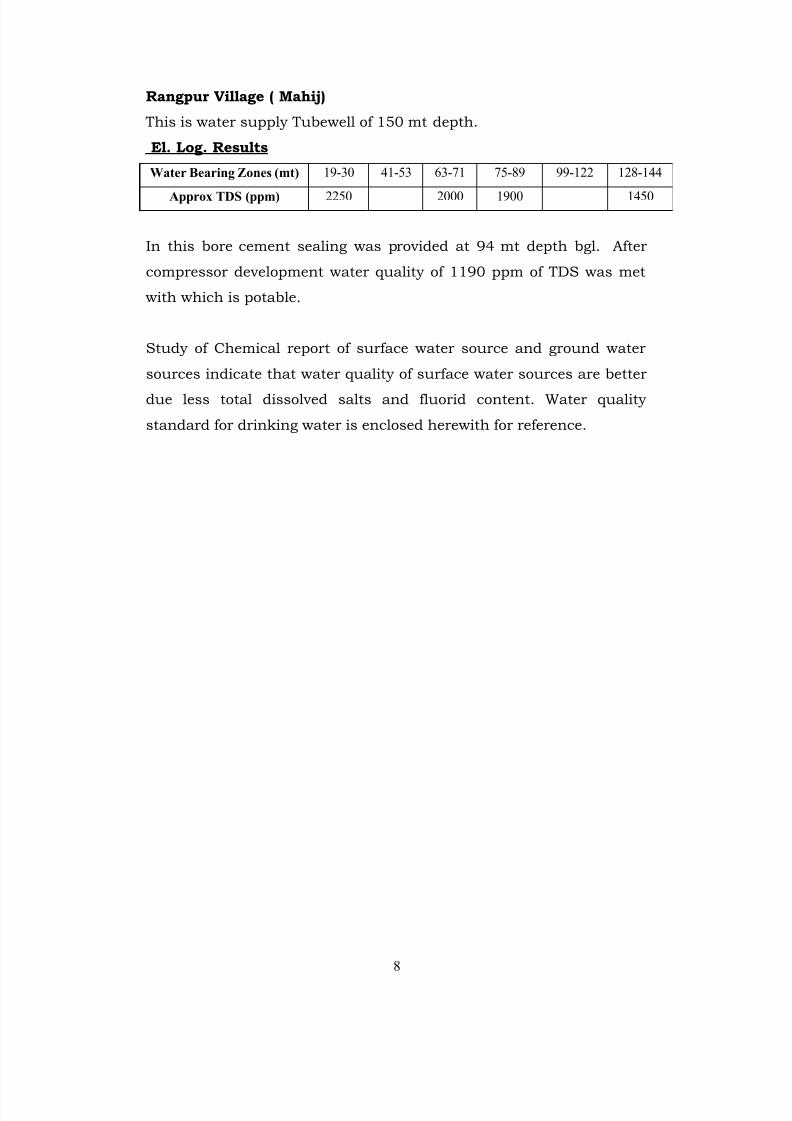
Temperature:
The area is classified as moderate to subtropical humid. The year is
divided into four seasons which as under.Season Dec -Feb Mar -May Jul - Sep Oct - Nov
Classification Dry HotSouth-West
monsoonPost Monsoon
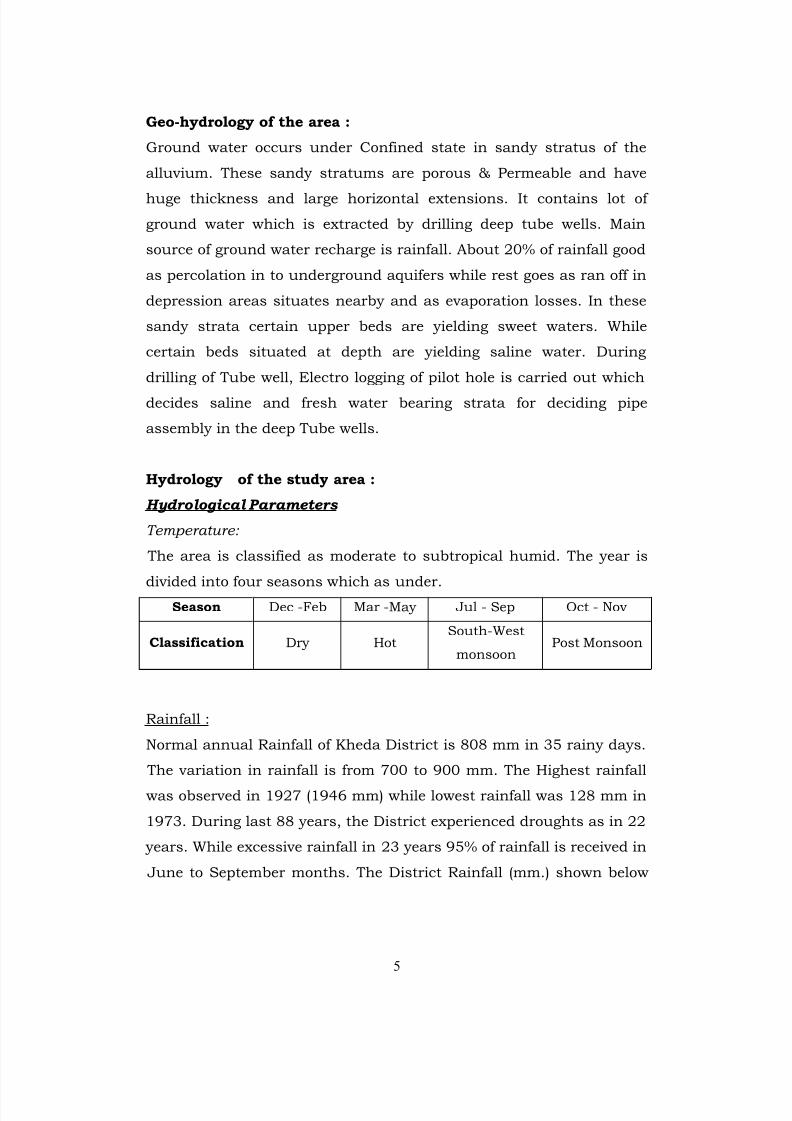
Rainfall :
Normal annual Rainfall of Kheda District is 808 mm in 35 rainy days.
The variation in rainfall is from 700 to 900 mm. The Highest rainfall
was observed in 1927 (1946 mm) while lowest rainfall was 128 mm in
1973. During last 88 years, the District experienced droughts as in 22
years. While excessive rainfall in 23 years 95% of rainfall is received in
June to September months. The District Rainfall (mm.) shown below
8/3/2019 Sample N.U
http://slidepdf.com/reader/full/sample-nu 15/36
6
in Table 3 is the arithmetic averages of Rainfall of Stations under the
District Kheda.
Table 3 District Rainfall (mm.) For Last Five Years
Year Jan Feb Mar Apr May Jun Jul Aug Sep Oct Nov Dec2006 0.0 0.0 0.6 0.0 0.0 59.5 616.4 643.9 91.4 0.7 0.0 0.0
2007 0.0 0.0 0.0 0.0 0.0 64.1 513.6 385.5 180.7 0.0 0.0 0.0
2008 0.0 0.0 0.0 0.0 0.0 35.9 207.0 313.5 201.5 0.0 0.0 0.2
2009 0.0 0.0 0.0 0.0 0.0 1.7 285.0 144.8 3.0 13.6 2.8 0.0
2010 0.0 0.0 0.0 0.0 0.0 21.9 264.8 408.6 117.3 0.0 33.8 0.6
(Source: IMD data)
Evaporation:
During the year, the evaporation increases from January and reaches
to its maximum value in may. During monsoon season, it decreasessharply and is minimum in August.
Water Levels:
Ground Water is generally occurs in confined condition. Due to
availabilities of porosity & permeability aquifers forms a big
underground reservoir. Ground water generally follows the topography
of the area Piezometric levels (S.W.L.) in the T/Well ranges from 30 mt
to 40 mt bgl and P.W.L. is about 60 to 80 mt bgl and drawdown is
about 20 mt to 40 mt bgl with av discharge of 50,000 LPH to 80,000
LPH.
Existing Wells and Tube wells in the Area :
Ground water occurs in the recent alluvium and under unconfined &
confined state. Unconfined aquifers are tapped by open wells and
Hand Pump Bores or Dug-cum-bore wells.
Shallow unconfined aquifers are tapped by dug wells & dug cum bore
wells and water level ranges from 8 mt to 20 mt. bgl. The shallow
deeper unconfined aquifers are tapped by dug-cum bore wells which
range from 20 mt to 80 mt depth. This aquifer comparatively has
saline Ground water. Hand pumps gives discharge of 500 to 1000
ltr/Hr. of water. Open wells are 20 to 40 mt depths and operated by
diesel engine AV yield of DCB wells is 150 m3 /day. The fluctuation
8/3/2019 Sample N.U
http://slidepdf.com/reader/full/sample-nu 16/36
7
of water level is about 1.5 mt to 2.0 mt in unconfined strata as
revealed from pre-monsoon and post monsoon water level
measurements
Deep Tube well tap confined aquifer ranging in depth from 115 mt to
225 mt. This is highly productive aquifer and tapped by number of
Tube wells for irrigation purposes. El. Logging details of three private
Tubewell situated nearby is as following. In this aquifer Ground water
occurs under confined condition.
Number of irrigation Tubewells have been drilled for irrigation and
water supply purposes by the Direct Rotary drilling Rig. The results of
such Tubewells indicate that these Tube yield sweet water
This clearly indicates water quality of sub surface confined aquifers as
bellow.
FOLLOWING DATA HAS BEEN OBTAINED FROM THE SECONDARY
SOURCES :
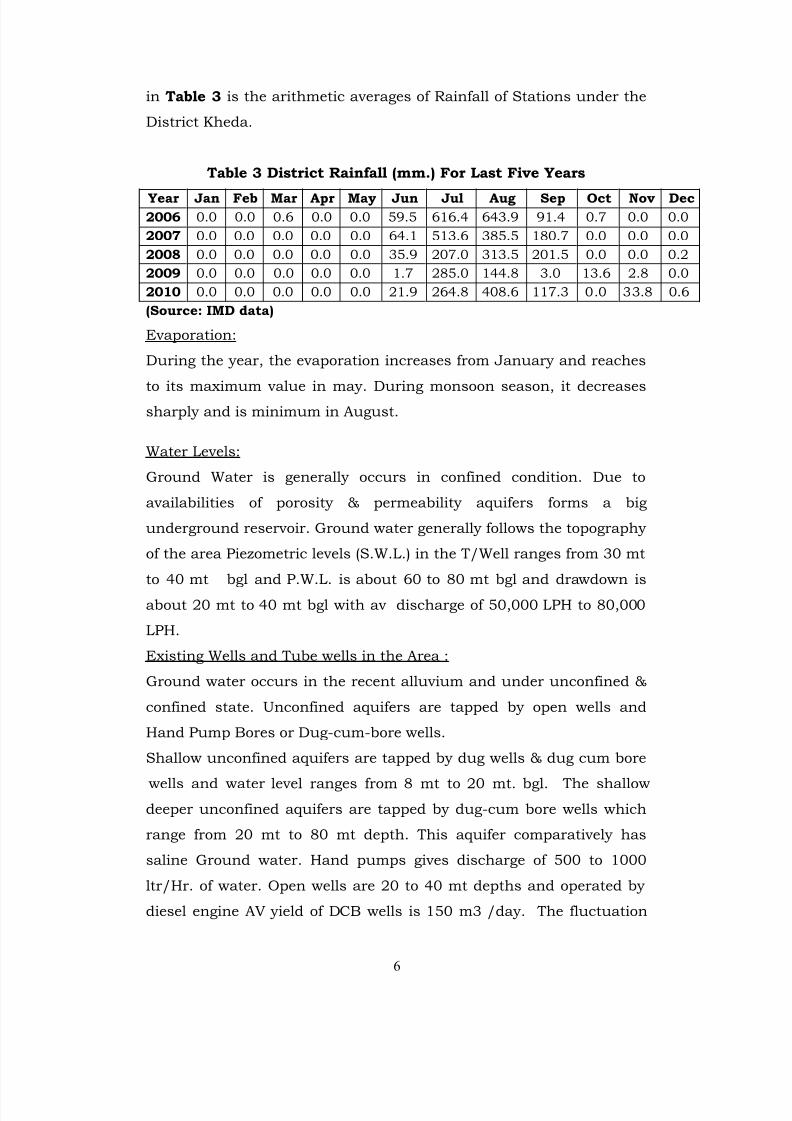
Village Bidaj
This is water supply Tubewell of 150 mt depth.
El. Log Results
Water Bearing Zones (mt) 29-43 47-55 69-83 87-109 115-127 131-145
Approx TDS (ppm) 1600 1700 1500 1600
No Cement sealing was provided as upper strata are also sweet. After
compressor development, water quality of 1596 ppm of TDS was
encountered which is suateble for drinking purposes
Village Mahij
This is water supply Tubewell of 180 mt depth.
El. Log Results
Water Bearing Zones (mt) 33-57 59-73 81-93 97-115 129-147 14-169
Approx TDS (ppm) 3200 2100 1275
After compressor development water quality of 1334 ppm, TDS was
metwith which was found potable.
8/3/2019 Sample N.U
http://slidepdf.com/reader/full/sample-nu 17/36
8
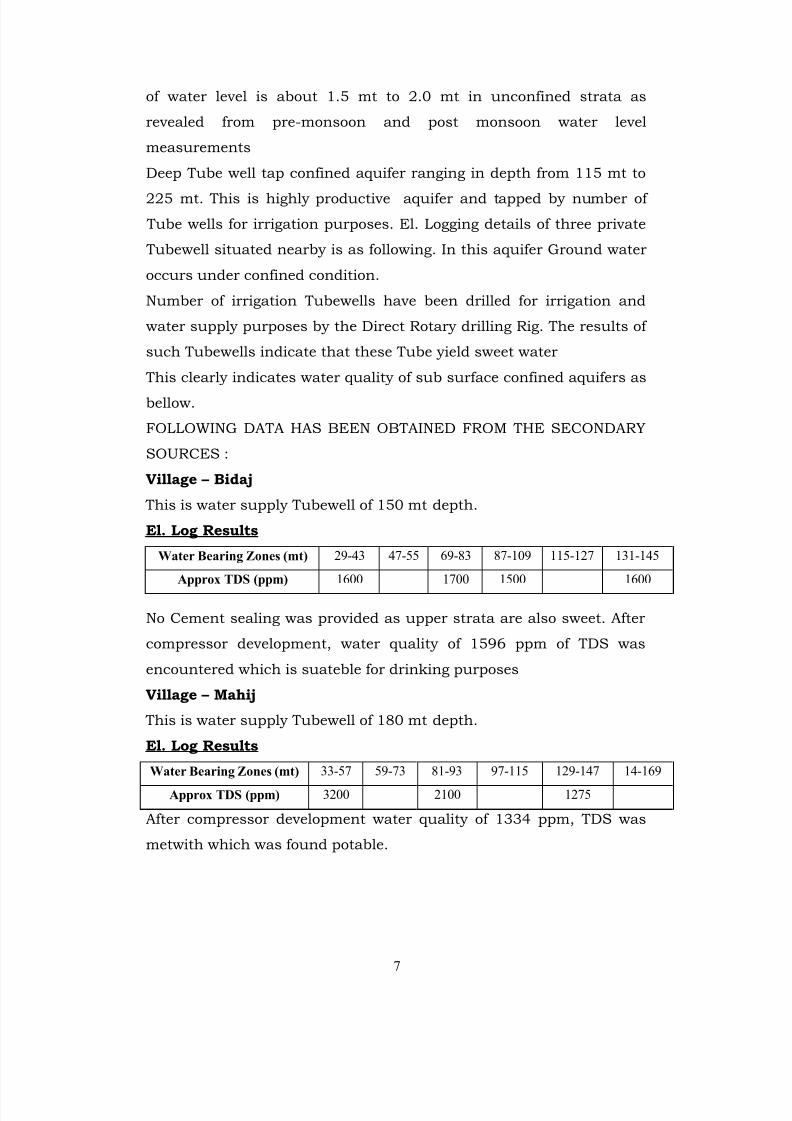
Rangpur Village ( Mahij)
This is water supply Tubewell of 150 mt depth.
El. Log. Results
Water Bearing Zones (mt) 19-30 41-53 63-71 75-89 99-122 128-144
Approx TDS (ppm) 2250 2000 1900 1450
In this bore cement sealing was provided at 94 mt depth bgl. After
compressor development water quality of 1190 ppm of TDS was met
with which is potable.
Study of Chemical report of surface water source and ground water
sources indicate that water quality of surface water sources are better
due less total dissolved salts and fluorid content. Water quality
standard for drinking water is enclosed herewith for reference.
8/3/2019 Sample N.U
http://slidepdf.com/reader/full/sample-nu 18/36
9
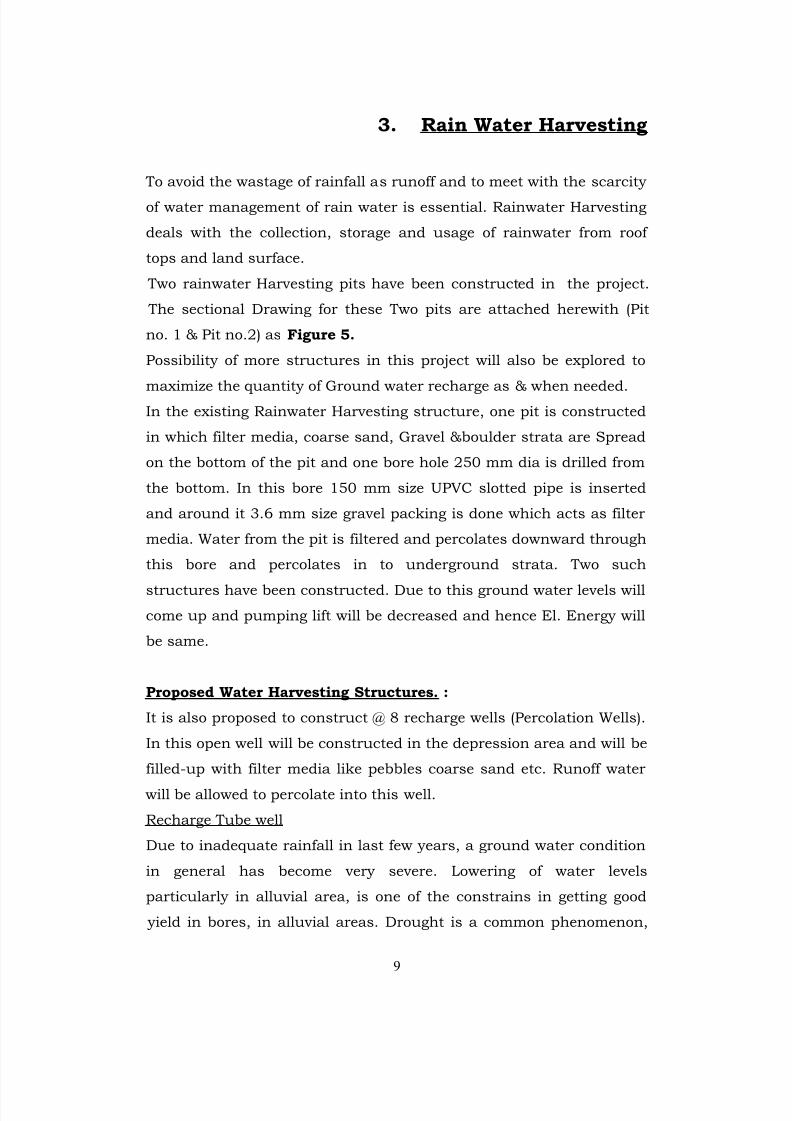
3. Rain Water Harvesting
To avoid the wastage of rainfall as runoff and to meet with the scarcity
of water management of rain water is essential. Rainwater Harvesting
deals with the collection, storage and usage of rainwater from roof
tops and land surface.
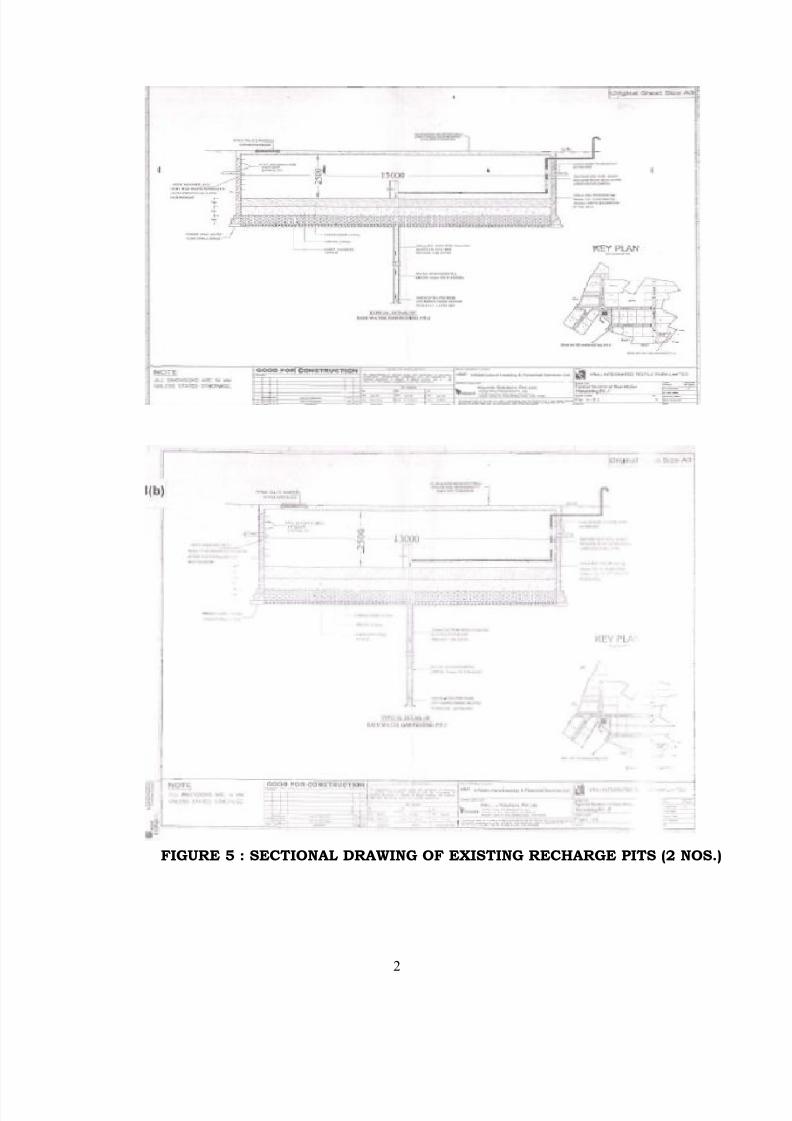
Two rainwater Harvesting pits have been constructed in the project.
The sectional Drawing for these Two pits are attached herewith (Pit
no. 1 & Pit no.2) as Figure 5.
Possibility of more structures in this project will also be explored to
maximize the quantity of Ground water recharge as & when needed.In the existing Rainwater Harvesting structure, one pit is constructed
in which filter media, coarse sand, Gravel &boulder strata are Spread
on the bottom of the pit and one bore hole 250 mm dia is drilled from
the bottom. In this bore 150 mm size UPVC slotted pipe is inserted
and around it 3.6 mm size gravel packing is done which acts as filter
media. Water from the pit is filtered and percolates downward through
this bore and percolates in to underground strata. Two such
structures have been constructed. Due to this ground water levels will
come up and pumping lift will be decreased and hence El. Energy will
be same.
Proposed Water Harvesting Structures. :
It is also proposed to construct @ 8 recharge wells (Percolation Wells).
In this open well will be constructed in the depression area and will be
filled-up with filter media like pebbles coarse sand etc. Runoff water
will be allowed to percolate into this well.
Recharge Tube well
Due to inadequate rainfall in last few years, a ground water condition
in general has become very severe. Lowering of water levels
particularly in alluvial area, is one of the constrains in getting good
yield in bores, in alluvial areas. Drought is a common phenomenon,
8/3/2019 Sample N.U
http://slidepdf.com/reader/full/sample-nu 19/36
10
which has resulted in the over drawal of ground water resources. This
had made the water levels to decline speedily and deterioration of
ground water quality. To save further deterioration of ground water
quality and declining of water levels, water harvesting project are
required to be taken up to harvest the rain water for artificial
recharging the ground water reservoirs.
It has been generally observed that the area comprises of alluvial
formation is more favourable for ground water development as well as
recharge compared to the hard rock area. This is due to higher degree
of porosity and permeability, which acts as good water bearing
aquifer. The water bearing characteristic of alluvial area is controlled
by grain size, shape, degree of assortment and degree of cementation,
which comprises the formation.
Construction of the recharge Tube Wells to allow the rain water
impounded in percolation tanks and check dam to percolate in into
the ground water reservoir, so that the depleted aquifer gets recharged
directly as other wise it would have taken long time to percale down to
the present ground water level.
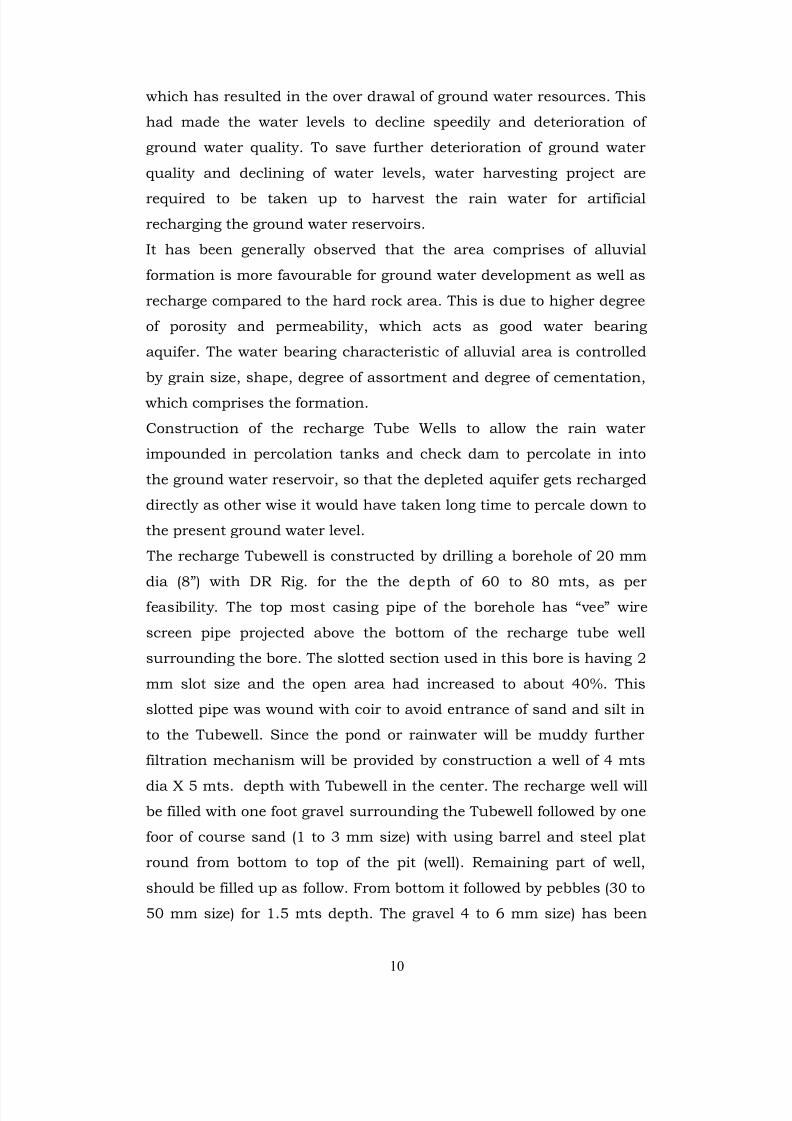
The recharge Tubewell is constructed by drilling a borehole of 20 mm
pth of 60 to 80 mts, as per
screen pipe projected above the bottom of the recharge tube well
surrounding the bore. The slotted section used in this bore is having 2
mm slot size and the open area had increased to about 40%. This
slotted pipe was wound with coir to avoid entrance of sand and silt in
to the Tubewell. Since the pond or rainwater will be muddy further
filtration mechanism will be provided by construction a well of 4 mts
dia X 5 mts. depth with Tubewell in the center. The recharge well will
be filled with one foot gravel surrounding the Tubewell followed by one
foor of course sand (1 to 3 mm size) with using barrel and steel plat
round from bottom to top of the pit (well). Remaining part of well,
should be filled up as follow. From bottom it followed by pebbles (30 to
50 mm size) for 1.5 mts depth. The gravel 4 to 6 mm size) has been
8/3/2019 Sample N.U
http://slidepdf.com/reader/full/sample-nu 20/36
11
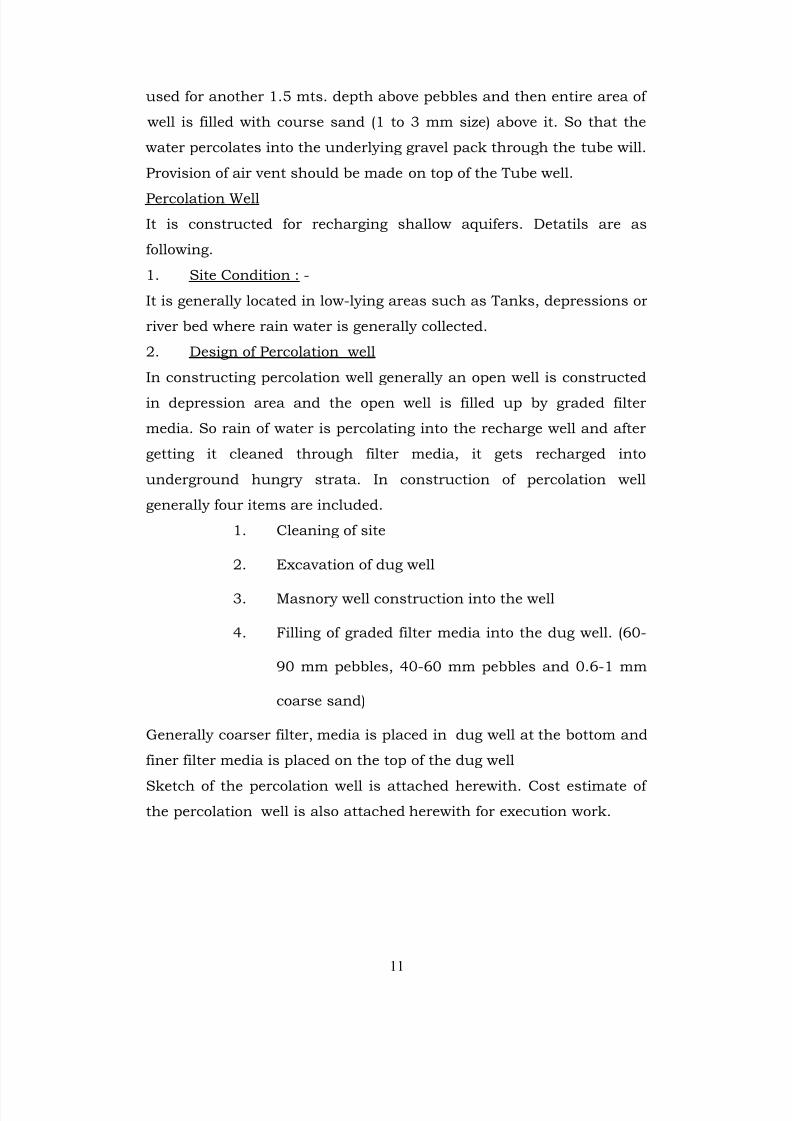
used for another 1.5 mts. depth above pebbles and then entire area of
well is filled with course sand (1 to 3 mm size) above it. So that the
water percolates into the underlying gravel pack through the tube will.
Provision of air vent should be made on top of the Tube well.
Percolation Well
It is constructed for recharging shallow aquifers. Detatils are as
following.
1. Site Condition : -
It is generally located in low-lying areas such as Tanks, depressions or
river bed where rain water is generally collected.
2. Design of Percolation well
In constructing percolation well generally an open well is constructed
in depression area and the open well is filled up by graded filter
media. So rain of water is percolating into the recharge well and after
getting it cleaned through filter media, it gets recharged into
underground hungry strata. In construction of percolation well
generally four items are included.
1. Cleaning of site
2. Excavation of dug well
3. Masnory well construction into the well
4. Filling of graded filter media into the dug well. (60-
90 mm pebbles, 40-60 mm pebbles and 0.6-1 mm
coarse sand)
Generally coarser filter, media is placed in dug well at the bottom and
finer filter media is placed on the top of the dug well
Sketch of the percolation well is attached herewith. Cost estimate of
the percolation well is also attached herewith for execution work.
8/3/2019 Sample N.U
http://slidepdf.com/reader/full/sample-nu 21/36
12
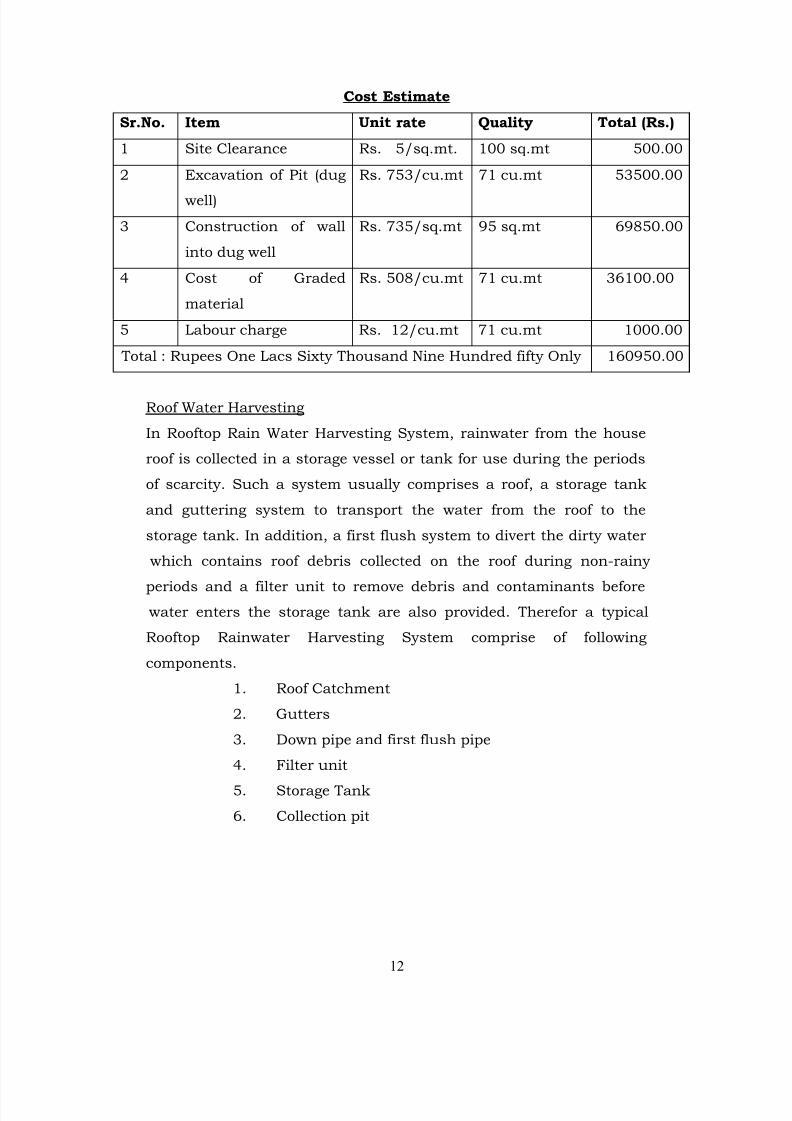
Cost Estimate
Sr.No. Item Unit rate Quality Total (Rs.)
1 Site Clearance Rs. 5/sq.mt. 100 sq.mt 500.00
2 Excavation of Pit (dug
well)
Rs. 753/cu.mt 71 cu.mt 53500.00
3 Construction of wall
into dug well
Rs. 735/sq.mt 95 sq.mt 69850.00
4 Cost of Graded
material
Rs. 508/cu.mt 71 cu.mt 36100.00
5 Labour charge Rs. 12/cu.mt 71 cu.mt 1000.00
Total : Rupees One Lacs Sixty Thousand Nine Hundred fifty Only 160950.00
Roof Water Harvesting
In Rooftop Rain Water Harvesting System, rainwater from the house
roof is collected in a storage vessel or tank for use during the periods
of scarcity. Such a system usually comprises a roof, a storage tank
and guttering system to transport the water from the roof to the
storage tank. In addition, a first flush system to divert the dirty water
which contains roof debris collected on the roof during non-rainy
periods and a filter unit to remove debris and contaminants before water enters the storage tank are also provided. Therefor a typical
Rooftop Rainwater Harvesting System comprise of following
components.
1. Roof Catchment
2. Gutters
3. Down pipe and first flush pipe
4. Filter unit
5. Storage Tank
6. Collection pit
8/3/2019 Sample N.U
http://slidepdf.com/reader/full/sample-nu 22/36
13
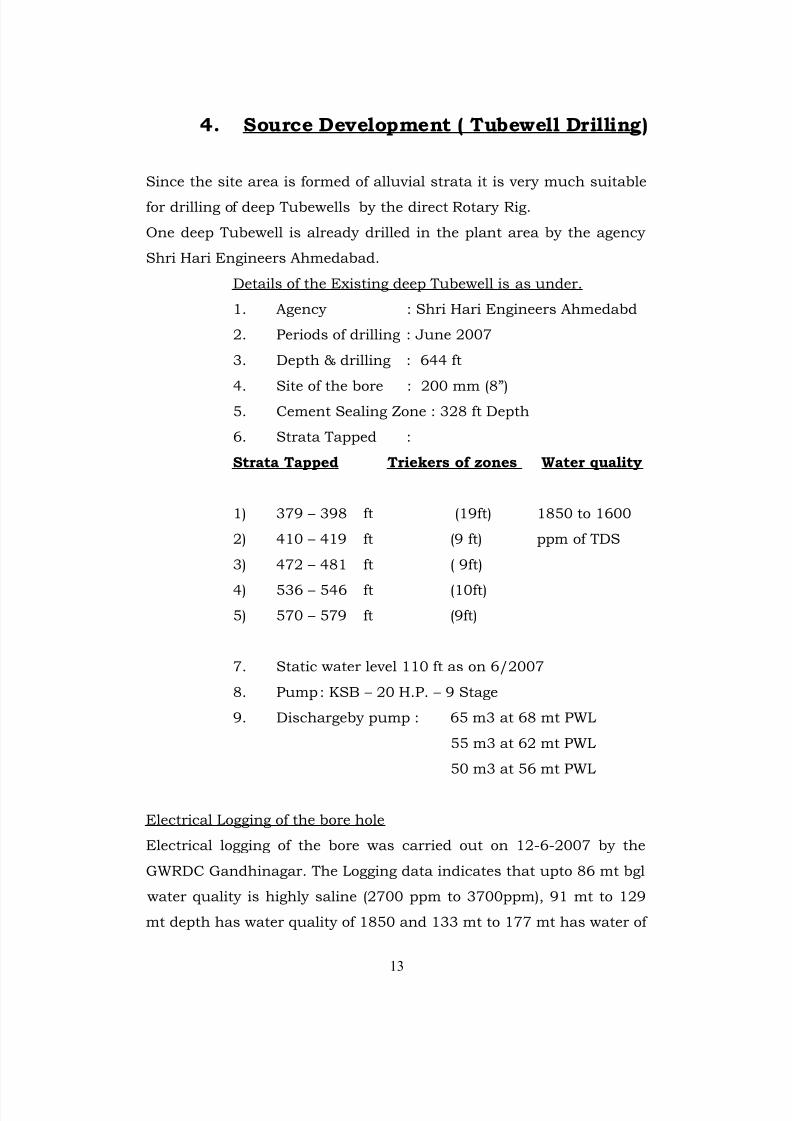
4. Source Development ( Tubewell Drilling)
Since the site area is formed of alluvial strata it is very much suitable
for drilling of deep Tubewells by the direct Rotary Rig.
One deep Tubewell is already drilled in the plant area by the agency
Shri Hari Engineers Ahmedabad.
Details of the Existing deep Tubewell is as under.
1. Agency : Shri Hari Engineers Ahmedabd
2. Periods of drilling : June 2007
3. Depth & drilling : 644 ft
4. Site of the bore 5. Cement Sealing Zone : 328 ft Depth
6. Strata Tapped :
Strata Tapped Triekers of zones Water quality
1) 379 398 ft (19ft) 1850 to 1600
2) 410 419 ft (9 ft) ppm of TDS
3) 472 481 ft ( 9ft)
4) 536 546 ft (10ft)
5) 570 579 ft (9ft)
7. Static water level 110 ft as on 6/2007
8. Pump : KSB 20 H.P. 9 Stage
9. Dischargeby pump : 65 m3 at 68 mt PWL
55 m3 at 62 mt PWL
50 m3 at 56 mt PWL
Electrical Logging of the bore hole
Electrical logging of the bore was carried out on 12-6-2007 by the
GWRDC Gandhinagar. The Logging data indicates that upto 86 mt bgl
water quality is highly saline (2700 ppm to 3700ppm), 91 mt to 129
mt depth has water quality of 1850 and 133 mt to 177 mt has water of
8/3/2019 Sample N.U
http://slidepdf.com/reader/full/sample-nu 23/36
14
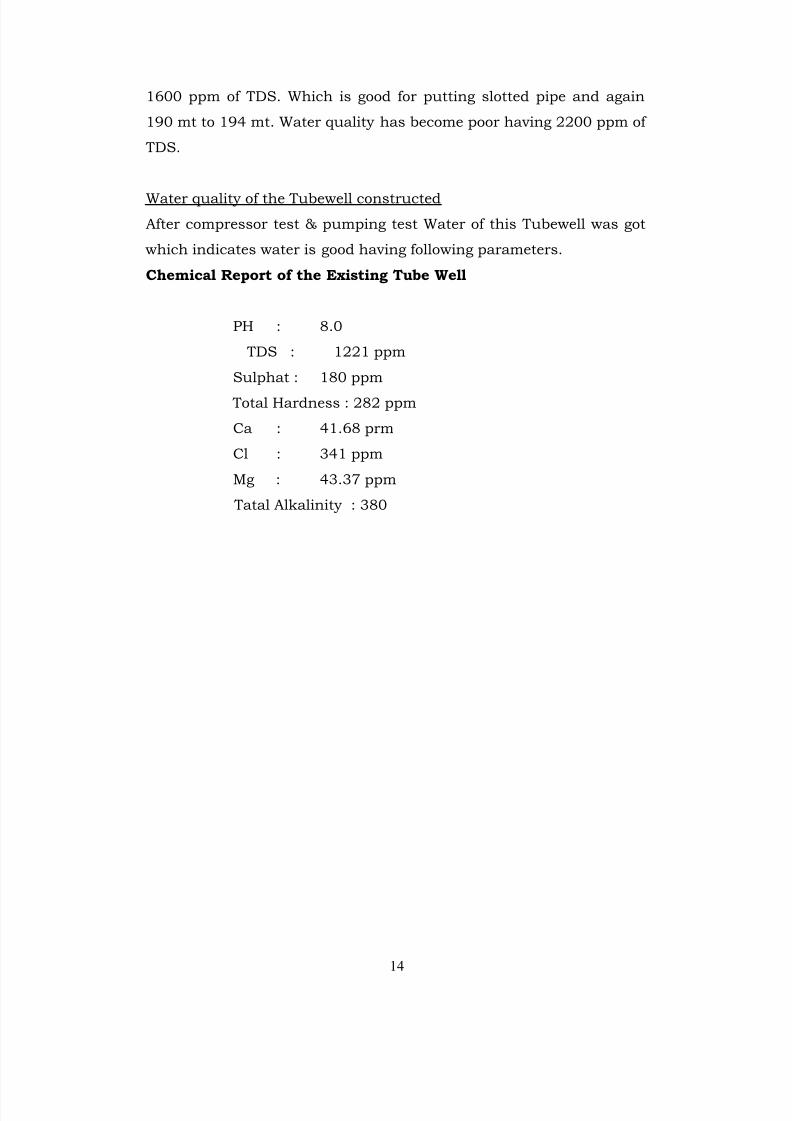
1600 ppm of TDS. Which is good for putting slotted pipe and again
190 mt to 194 mt. Water quality has become poor having 2200 ppm of
TDS.
Water quality of the Tubewell constructed
After compressor test & pumping test Water of this Tubewell was got
which indicates water is good having following parameters.
Chemical Report of the Existing Tube Well
PH : 8.0
TDS : 1221 ppm
Sulphat : 180 ppm
Total Hardness : 282 ppm
Ca : 41.68 prm
Cl : 341 ppm
Mg : 43.37 ppm
Tatal Alkalinity : 380
8/3/2019 Sample N.U
http://slidepdf.com/reader/full/sample-nu 24/36
15
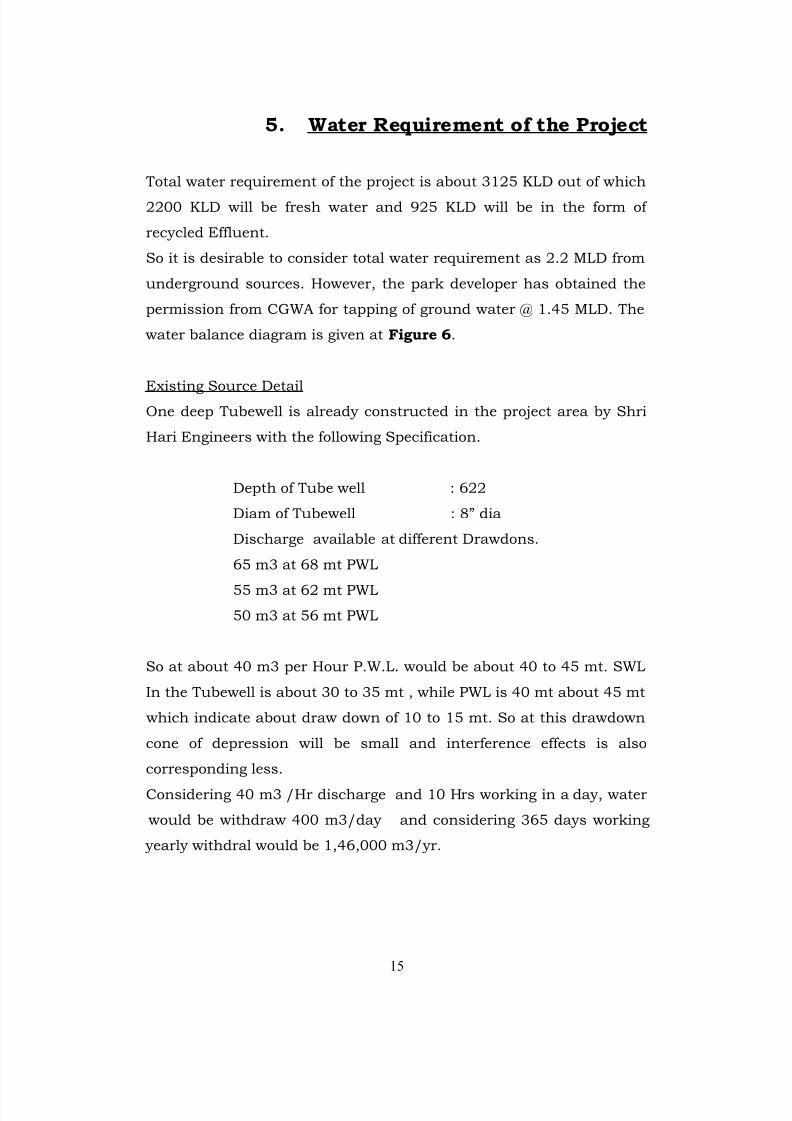
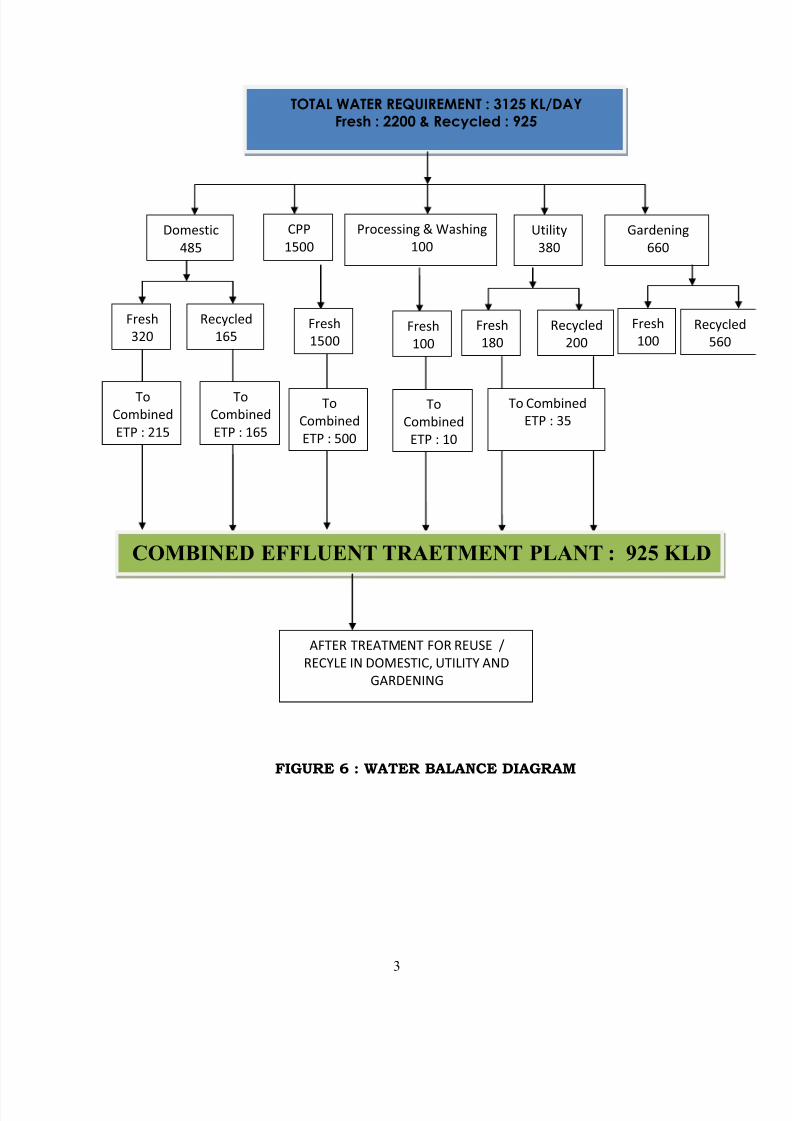
5. Water Requirement of the Project
Total water requirement of the project is about 3125 KLD out of which
2200 KLD will be fresh water and 925 KLD will be in the form of
recycled Effluent.
So it is desirable to consider total water requirement as 2.2 MLD from
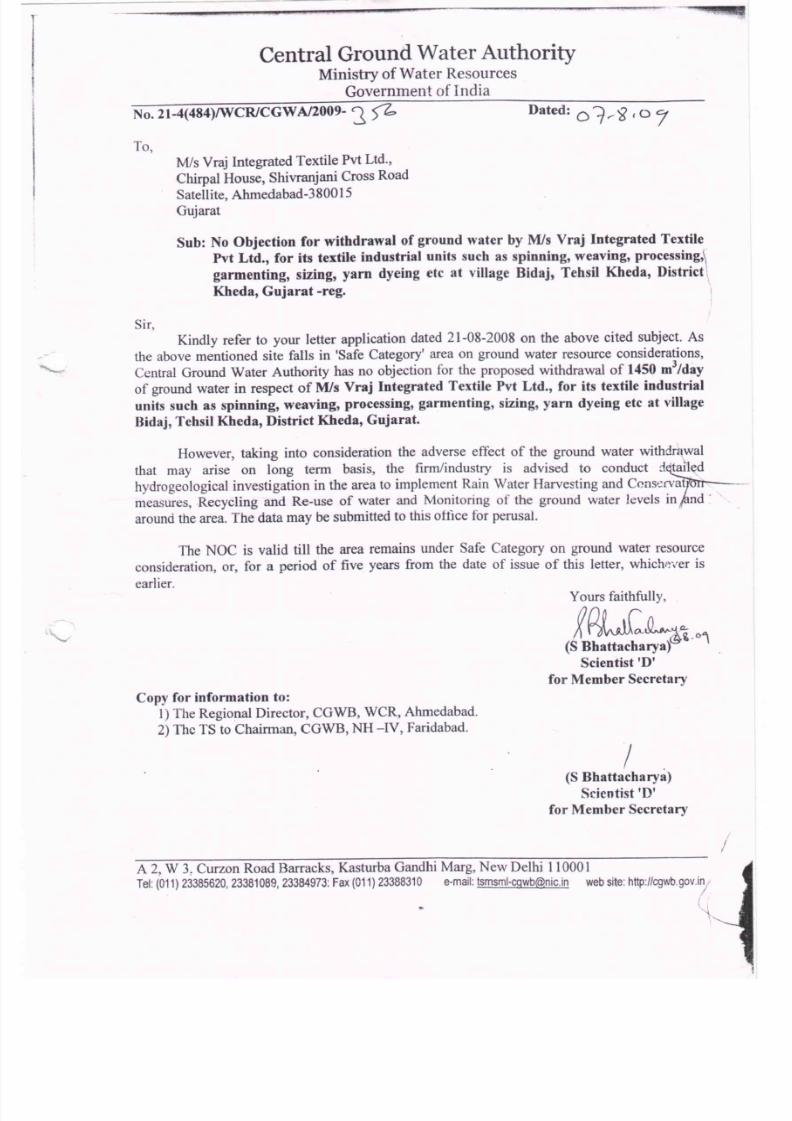
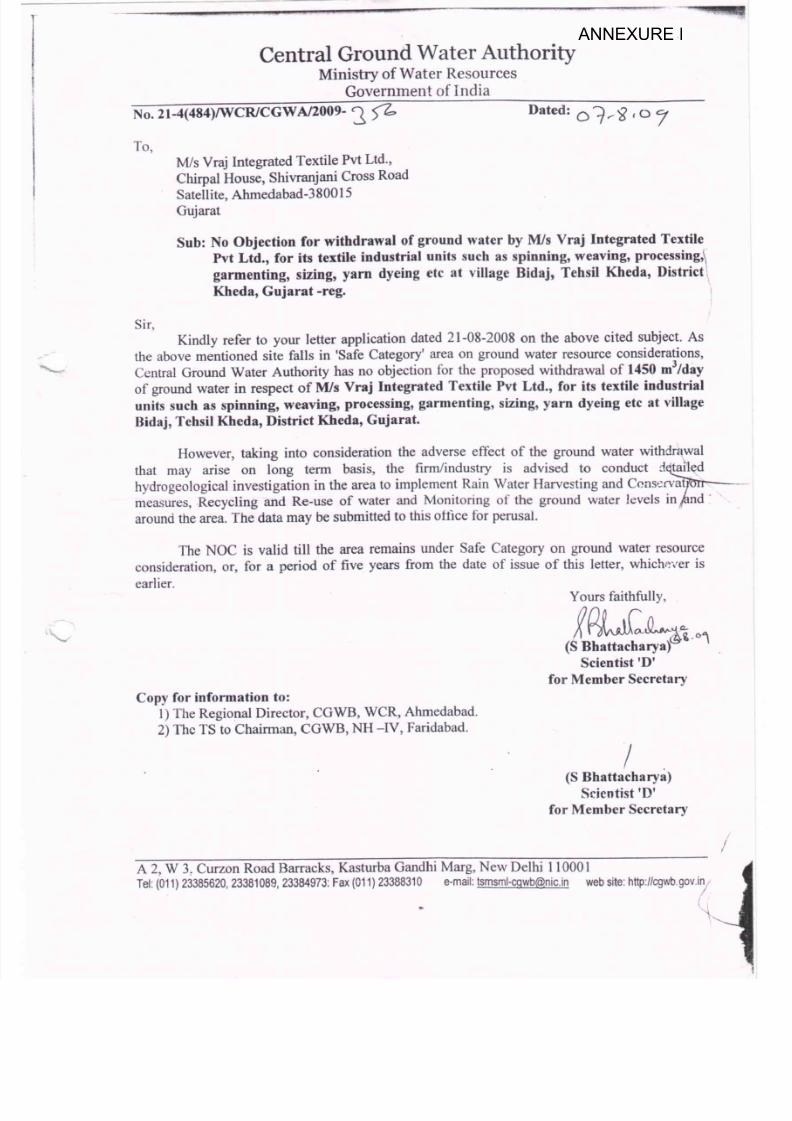
underground sources. However, the park developer has obtained the
permission from CGWA for tapping of ground water @ 1.45 MLD. The
water balance diagram is given at Figure 6.
Existing Source DetailOne deep Tubewell is already constructed in the project area by Shri
Hari Engineers with the following Specification.
Depth of Tube well : 622
Diam of Tubewell
Discharge available at different Drawdons.
65 m3 at 68 mt PWL
55 m3 at 62 mt PWL
50 m3 at 56 mt PWL
So at about 40 m3 per Hour P.W.L. would be about 40 to 45 mt. SWL
In the Tubewell is about 30 to 35 mt , while PWL is 40 mt about 45 mt
which indicate about draw down of 10 to 15 mt. So at this drawdown
cone of depression will be small and interference effects is also
corresponding less.
Considering 40 m3 /Hr discharge and 10 Hrs working in a day, water
would be withdraw 400 m3/day and considering 365 days working
yearly withdral would be 1,46,000 m3/yr.
8/3/2019 Sample N.U
http://slidepdf.com/reader/full/sample-nu 25/36
16
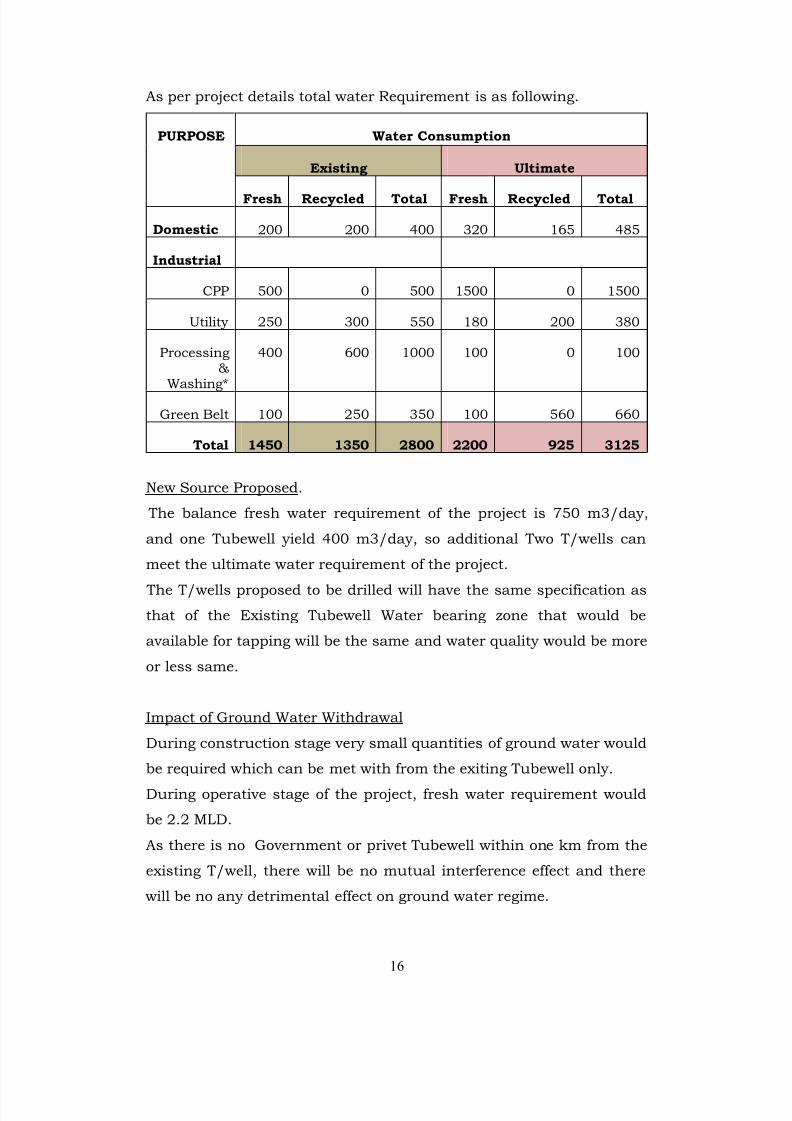
As per project details total water Requirement is as following.
PURPOSE Water Consumption
Existing Ultimate
Fresh Recycled Total Fresh Recycled Total
Domestic 200 200 400 320 165 485
Industrial
CPP 500 0 500 1500 0 1500
Utility 250 300 550 180 200 380
Processing&
Washing*
400 600 1000 100 0 100
Green Belt 100 250 350 100 560 660
Total 1450 1350 2800 2200 925 3125
New Source Proposed.
The balance fresh water requirement of the project is 750 m3/day,
and one Tubewell yield 400 m3/day, so additional Two T/wells can
meet the ultimate water requirement of the project.
The T/wells proposed to be drilled will have the same specification as
that of the Existing Tubewell Water bearing zone that would be
available for tapping will be the same and water quality would be more
or less same.
Impact of Ground Water Withdrawal
During construction stage very small quantities of ground water would
be required which can be met with from the exiting Tubewell only.
During operative stage of the project, fresh water requirement would
be 2.2 MLD.
As there is no Government or privet Tubewell within one km from the
existing T/well, there will be no mutual interference effect and there
will be no any detrimental effect on ground water regime.
8/3/2019 Sample N.U
http://slidepdf.com/reader/full/sample-nu 26/36
17
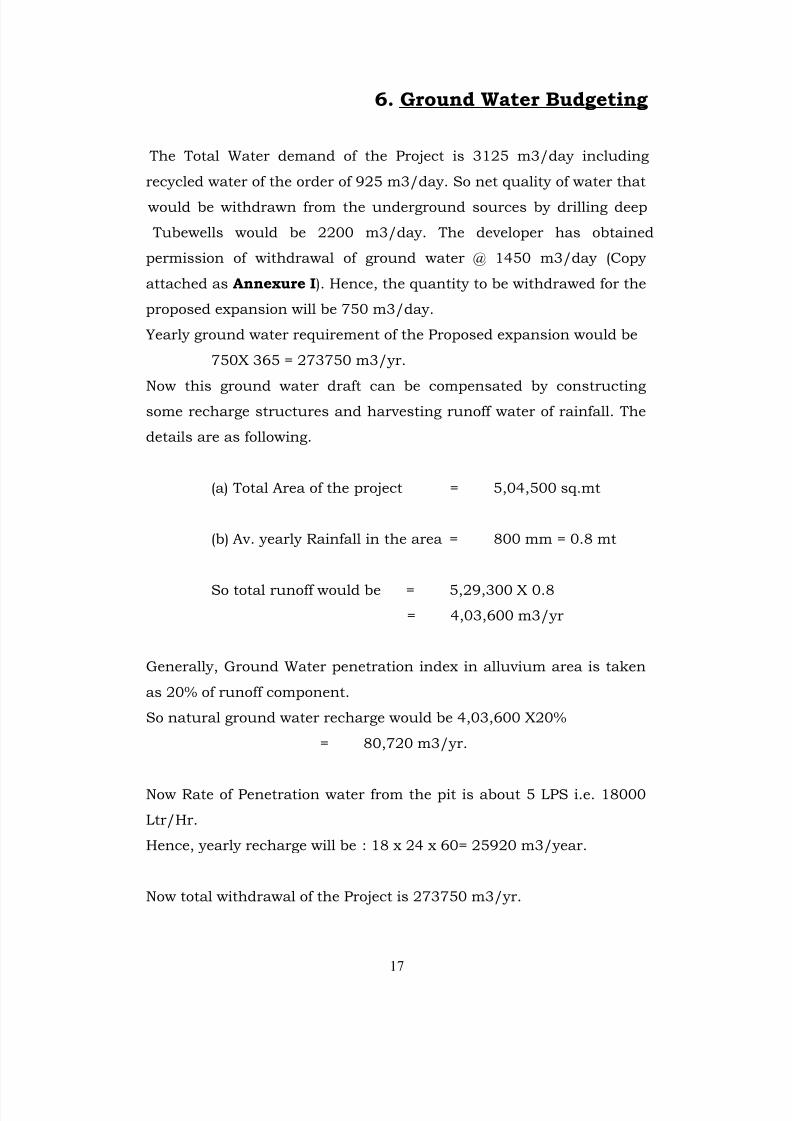
6. Ground Water Budgeting
The Total Water demand of the Project is 3125 m3/day including
recycled water of the order of 925 m3/day. So net quality of water that
would be withdrawn from the underground sources by drilling deep
Tubewells would be 2200 m3/day. The developer has obtained
permission of withdrawal of ground water @ 1450 m3/day (Copy
attached as Annexure I). Hence, the quantity to be withdrawed for the
proposed expansion will be 750 m3/day.
Yearly ground water requirement of the Proposed expansion would be
750X 365 = 273750 m3/yr.
Now this ground water draft can be compensated by constructingsome recharge structures and harvesting runoff water of rainfall. The
details are as following.
(a) Total Area of the project = 5,04,500 sq.mt
(b) Av. yearly Rainfall in the area = 800 mm = 0.8 mt
So total runoff would be = 5,29,300 X 0.8
= 4,03,600 m3/yr
Generally, Ground Water penetration index in alluvium area is taken
as 20% of runoff component.
So natural ground water recharge would be 4,03,600 X20%
= 80,720 m3/yr.
Now Rate of Penetration water from the pit is about 5 LPS i.e. 18000
Ltr/Hr.
Hence, yearly recharge will be : 18 x 24 x 60= 25920 m3/year.
Now total withdrawal of the Project is 273750 m3/yr.
8/3/2019 Sample N.U
http://slidepdf.com/reader/full/sample-nu 27/36
18
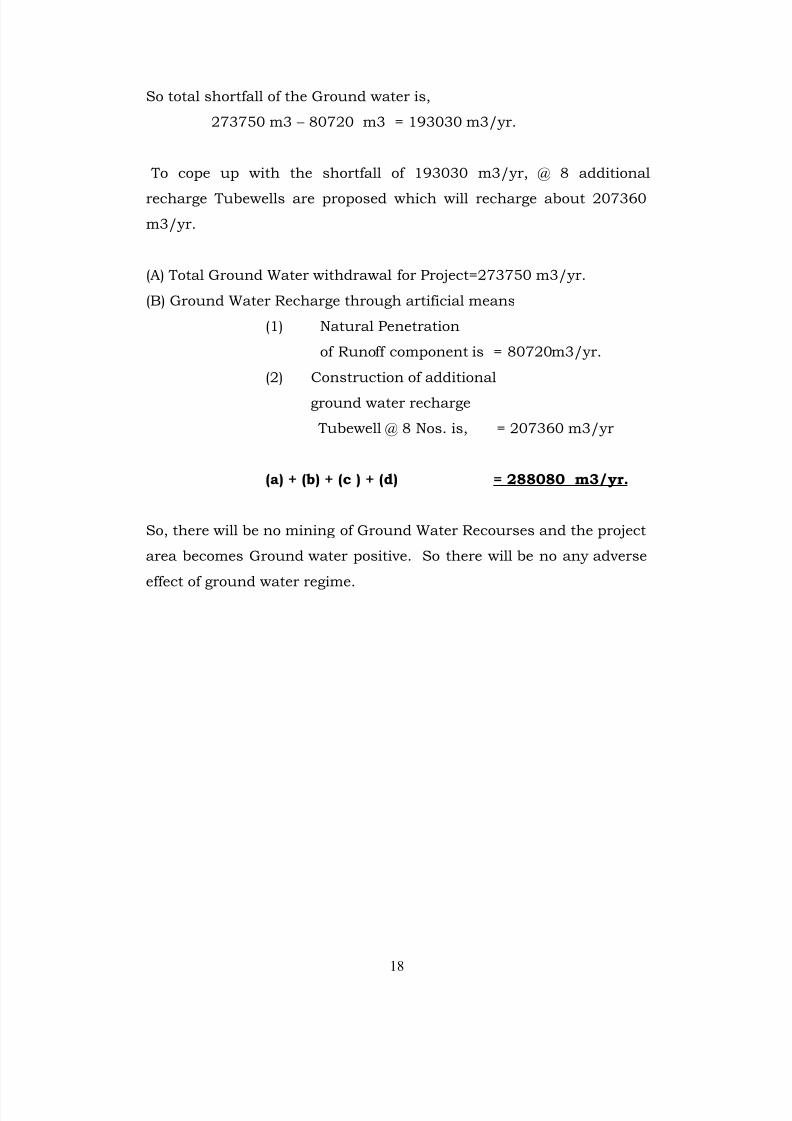
So total shortfall of the Ground water is,
273750 m3 80720 m3 = 193030 m3/yr.
To cope up with the shortfall of 193030 m3/yr, @ 8 additional
recharge Tubewells are proposed which will recharge about 207360
m3/yr.
(A) Total Ground Water withdrawal for Project=273750 m3/yr.
(B) Ground Water Recharge through artificial means
(1) Natural Penetration
of Runoff component is = 80720m3/yr.
(2) Construction of additional
ground water recharge
Tubewell @ 8 Nos. is, = 207360 m3/yr
(a) + (b) + (c ) + (d) = 288080 m3/yr.
So, there will be no mining of Ground Water Recourses and the project
area becomes Ground water positive. So there will be no any adverse
effect of ground water regime.
8/3/2019 Sample N.U
http://slidepdf.com/reader/full/sample-nu 28/36
19
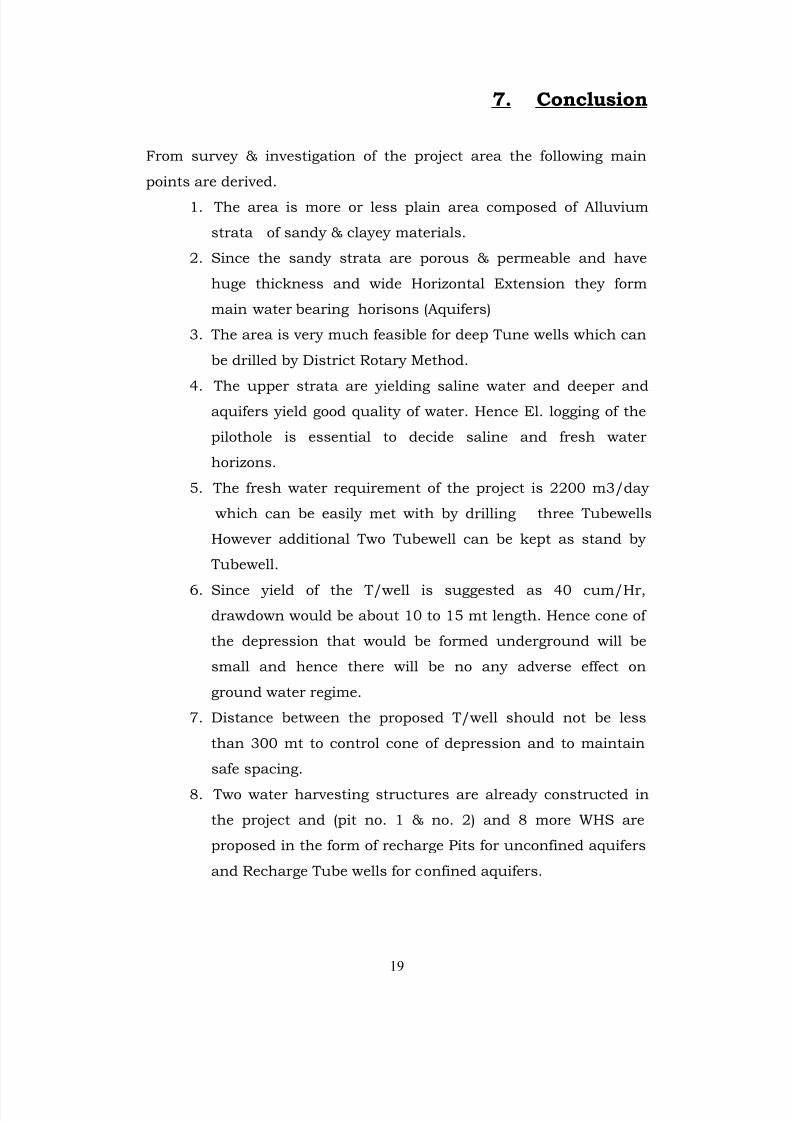
7. Conclusion
From survey & investigation of the project area the following main
points are derived.
1. The area is more or less plain area composed of Alluvium
strata of sandy & clayey materials.
2. Since the sandy strata are porous & permeable and have
huge thickness and wide Horizontal Extension they form
main water bearing horisons (Aquifers)
3. The area is very much feasible for deep Tune wells which can
be drilled by District Rotary Method.
4. The upper strata are yielding saline water and deeper andaquifers yield good quality of water. Hence El. logging of the
pilothole is essential to decide saline and fresh water
horizons.
5. The fresh water requirement of the project is 2200 m3/day
which can be easily met with by drilling three Tubewells
However additional Two Tubewell can be kept as stand by
Tubewell.
6. Since yield of the T/well is suggested as 40 cum/Hr,
drawdown would be about 10 to 15 mt length. Hence cone of
the depression that would be formed underground will be
small and hence there will be no any adverse effect on
ground water regime.
7. Distance between the proposed T/well should not be less
than 300 mt to control cone of depression and to maintain
safe spacing.
8. Two water harvesting structures are already constructed in
the project and (pit no. 1 & no. 2) and 8 more WHS are
proposed in the form of recharge Pits for unconfined aquifers
and Recharge Tube wells for confined aquifers.
8/3/2019 Sample N.U
http://slidepdf.com/reader/full/sample-nu 29/36
20
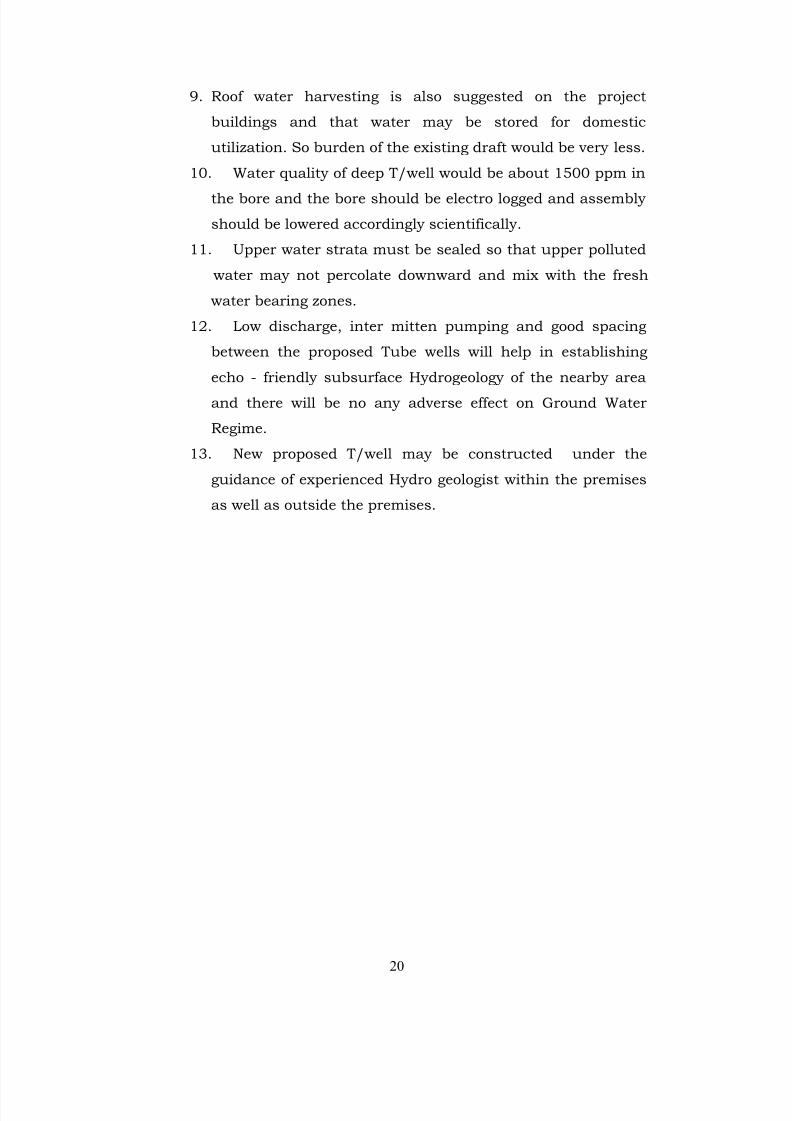
9. Roof water harvesting is also suggested on the project
buildings and that water may be stored for domestic
utilization. So burden of the existing draft would be very less.
10. Water quality of deep T/well would be about 1500 ppm in
the bore and the bore should be electro logged and assembly
should be lowered accordingly scientifically.
11. Upper water strata must be sealed so that upper polluted
water may not percolate downward and mix with the fresh
water bearing zones.
12. Low discharge, inter mitten pumping and good spacing
between the proposed Tube wells will help in establishing
echo - friendly subsurface Hydrogeology of the nearby area
and there will be no any adverse effect on Ground Water
Regime.
13. New proposed T/well may be constructed under the
guidance of experienced Hydro geologist within the premises
as well as outside the premises.
8/3/2019 Sample N.U
http://slidepdf.com/reader/full/sample-nu 30/36
21
FIGURE 1 : LOCATION MAP (KEY PLAN) OF THE TEXTILE PARK
8/3/2019 Sample N.U
http://slidepdf.com/reader/full/sample-nu 31/36
22
FIGURE 2 : LAYOUT MAP OF THE TEXTILE PARK
8/3/2019 Sample N.U
http://slidepdf.com/reader/full/sample-nu 32/36
23
FIGURE 3 : STORM WATER DRAINAGE NETWORK OF THE TEXTILE PARK
8/3/2019 Sample N.U
http://slidepdf.com/reader/full/sample-nu 33/36
HYDROLOGICAL REPORT FOR VRAJ INTEGRATED TEXTILE PARK LTD. (VITPL)
Source: Water Resources Dept from http://guj-nwrws.gujarat.gov.in/
Project Site
FIGURE 4 : GEOLOGICAL STRUCTURE OF GUJARAT STATE
8/3/2019 Sample N.U
http://slidepdf.com/reader/full/sample-nu 34/36
2
FIGURE 5 : SECTIONAL DRAWING OF EXISTING RECHARGE PITS (2 NOS.)
8/3/2019 Sample N.U
http://slidepdf.com/reader/full/sample-nu 35/36
3
Domestic
485
Gardening
660
CPP
1500
Processing & Washing
100
Utility
380
Fresh
320
Recycled
165Fresh
180
Recycled
200
Fresh
100
Recycled
560Fresh
100
Fresh
1500
ToCombined
ETP : 165
ToCombined
ETP : 215
To
Combined
ETP : 500
To
Combined
ETP : 10
To Combined
ETP : 35
COMBINED EFFLUENT TRAETMENT PLANT : 925 KLD
AFTER TREATMENT FOR REUSE /
RECYLE IN DOMESTIC, UTILITY AND
GARDENING
TOTAL WATER REQUIREMENT : 3125 KL/DAY
Fresh : 2200 & Recycled : 925
FIGURE 6 : WATER BALANCE DIAGRAM
8/3/2019 Sample N.U
http://slidepdf.com/reader/full/sample-nu 36/36
ANNEXURE I