Embed Size (px)
Citation preview

applied sciences
Article
Salt and Pepper Noise Removal for Image UsingAdaptive Pulse-Coupled Neural Network Optimizedby Grey Wolf Optimization and BidimensionalEmpirical Mode Decomposition
Min Cui 1, Yicheng Wu 2 , Chenguang Wang 3, Xiaochen Liu 1 and Chong Shen 1,*1 National Key Laboratory for Electronic Measurement Technology, School of Instrument and Electronics,
North University of China, Taiyuan 030051, China; [email protected] (M.C.);[email protected] (X.L.)
2 College of Mechatronic Engineering, North University of China, Taiyuan 030051, China;[email protected]
3 School of Information and Communication Engineering, North University of China, Taiyuan 030051, China;[email protected]
* Correspondence: [email protected]; Tel.: +86-0351-3922457
Received: 28 August 2018; Accepted: 13 October 2018; Published: 18 October 2018�����������������
Abstract: Aimed at the problem of poor noise reduction effect and parameter uncertainty ofpulse-coupled neural network (PCNN), a hybrid image denoising method, using an adaptive PCNNthat has been optimized by grey wolf optimization (GWO) and bidimensional empirical modedecomposition (BEMD), is presented. The BEMD is used to decompose the original image intomultilayer image components. After a GWO is run to complete PCNN parameter optimization,an adaptive PCNN filter method is used to remediate the polluted noise points that correspond tothe different image components, from which a reconstruction of the denoised image componentscan then be obtained. From an analysis of the image denoising results, the main advantages of theproposed method are as follows: (i) the method effectively solves the deficiencies that arise fromthe critical PCNN parameter determination issue; (ii) the method effectively overcomes the problemof high-intensity noise effects by providing a more targeted and efficient noise reduction process;(iii) when using this method, the noise points are isolated, and the original pixel points are restoredwell, which can lead to preservation of image detail information. When compared with traditionalimage denoising process algorithms, the proposed method can yield a better noise suppressioneffect, based on indicators including analysis of mutual information (MI), structural similarity(SSIM), the peak signal-to-noise ratio (PSNR) and the standard deviation (STD). The feasibility andapplicability of the proposed denoising algorithm are also demonstrated experimentally.
Keywords: image de-nosing; pulsed-couple neural network; grey wolf optimization; bidimensionalempirical mode decomposition
1. Introduction
The recent boom in the development of digital technology and multimedia communicationshas seen digital image analysis methods for nonlinear and nonstationary data receive widespreadattention. In digital image processing and analysis in particular, image noise is an important researchtopic for many different application fields, such as image transmission, image matching, targetdetection, and remote sensing. However, a wide variety of interference types can disrupt the analysisprocess. In interference preclusion processes, the existence of noise inevitably leads to image quality
Appl. Sci. 2018, 8, 1977; doi:10.3390/app8101977 www.mdpi.com/journal/applsci

Appl. Sci. 2018, 8, 1977 2 of 20
degradation, which results in blurring and distortion of valid pixels. Therefore, for digital images,the visual pixel quality must be guaranteed using reliable and effective approaches. Consequently,noise reduction measures are indispensable to maintaining high recognition accuracy and preservingvalid pixels for image analysis [1,2]. To review the existing research works, based on sparse andredundant representations over trained dictionaries, the Bayesian treatment applying K-SVD canyield a state-of-the-art denoising performance [3]. As the digital implementation of new mathematicaltransformation, the curvelet transform can outperform wavelet methods in image denoising andcertain image reconstruction problems [4]. The sparse 3-D transform-domain collaborative filtering canyield a satisfying image denoising effect as a novel image strategy [5]. Block matching 3D denoising(BM3D) is an excellent single-image denoising method [6], and BM3D is a well-engineered algorithmwhich can achieve the state-of-the-art denoising performance with a plain multi-layer perceptron(MLP) [7]. The pulse-coupled neural network (PCNN) has been studied very extensively. As aneffective nonlinear digital data analysis method, it is well capable of isolating noisy pixel points andeliminating high-intensity noise during image processing [8]. In this paper, we are committed to thestudy of noise reduction effect of PCNN and make improvements to the PCNN method.
Initially inspired by the visual cortexes of cats, the PCNN was progressively developed based onsynchronous dynamic neuronal activity [9]. From analysis of the acting mechanism, PCNNs actuallyhave the functional characteristics of neuron-specific linear addition, bioelectric pulse transmissionthrough ion channels, nonlinear modulation, and synchronous pulse release [10]. In current digitalimage processing, PCNNs can be applied to many aspects, including image fusion, image segmentation,and feature extraction. Xie et al. [11] applied a memristor-based circuit implementation of a PCNNwith dynamic threshold generators in the digital image processing field. Ding et al. [12] combineda PCNN with the nonsubsampled contourlet (NSCT) model to overcome the coefficients selectionproblem for the NSCT sub-band that provided an innovative image fusion method based on an imagegradient motivation. Yang et al. [13] presented a multifocus image fusion method that was based onrobust sparse representation (RSR) and an adaptive PCNN.
Many researchers have also conducted relevant studies on image denoising. Deng et al. [14]introduced an adaptive denoising multilayered PCNN for application to salt and pepper noiseremoval. Zhu et al. [15] researched a memristive PCNN (M-PCNN) for medical image denoisingprocesses, which makes the network have a biological function. Bai et al. [16] applied particle swarmoptimization (PSO) to the implementation of PCNN parameter optimization. Shen et al. [17,18]proposed an innovative genetic ant colony algorithm (GACA)-based combination with the PCNNapproach to accomplish good quality image denoising. As a preprocessing digital image noisereduction method, the PCNN has several issues that must be resolved to achieve better results.The PCNN is a complex model system that included an input system and a feedback system. In manycases, the predefined network parameters mean that the researchers must try to select suitableparameters, many times, contemporaneously, in response to different input images. To addressthe above issues, many methods, including simplified models and intelligent swarm models, are usedto improve the image denoising performance. Wu et al. [19] proposed a simplified PCNN methodwith adaptive parameters that was excellent in terms of both visual appearance and parametersetting. He et al. [20] applied a cuckoo search (CS) algorithm based on a simple PCNN model toa multi-parameter optimization problem. Xu et al. [21] introduced a quantum-behaved particle swarmoptimization (QPSO) model to optimize the PCNN model with good effect.
It should be pointed out that the existing related optimization algorithms that are introducedfor setting PCNN parameters have several common disadvantages that must be resolved, includingcomplex search mechanisms, easy relapse into local optimum behavior, and low generalizationcapabilities. In addition, the fitness functions of these optimization methods must be modified topromote both search efficiency and generalization ability. A fast and accurate parameter optimizationis a hot issue that needs to be resolved in PCNN, which is also a major content of this paper. Moreover,analysis of whole image denoising processes shows that the optimized PCNN combined with filtering
Appl. Sci. 2018, 8, 1977 3 of 20
can produce a particular noise reduction effect. However, when faced with high-intensity noise,the entire noise reduction process becomes challenging [22]. Some of the noise will always be left overand will affect image clarity and detail recognition. Furthermore, in the current situation, most noisesuppression methods that play a good role in low intensity noise include conventional filters suchas a single median filter. How to settle the contaminated complicated characteristics and incompletenoise suppression puzzles caused by high-intensity noise are hot spot research topics. Additionally,in the field of image noise reduction, how to keep as much image detail as possible and restore theoriginal image information for use, are also major problems.
Motivated by the above analysis, we focus on the improvement of the noise reduction effect ofPCNN images denoising. To overcome the limitation of the existing PCNN parameter optimizationproblem and meet better noise reduction requirements, an adaptive PCNN model in which the PCNNparameters are optimized using the grey wolf optimization (GWO) algorithm to address the parameterissues described above. As a meta-heuristic optimization technique, the GWO has merits that includesimplicity, flexibility, a derivation-free mechanism, and avoidance of local optima [23]. Under itsleadership hierarchy and hunting mechanism, the GWO is capable of filtering, completing iterationand optimization of a series of parameters [24]. At the same time, the GWO provides high convergencespeeds and high optimization accuracy. After the Experiments, GWO is applicable to challengingproblems with unknown search spaces [25]. Furthermore, for high-intensity noise suppression, furtherresearch about bidimensional empirical mode decomposition (BEMD) is introduced in an innovativeway. BEMD is actually very widely used in image processing, such as image denoising, and isan extension of Huang’s empirical mode decomposition (EMD) method [26]. The high-intensitycontaminated noise will be very concentrated and dense in the polluted image. BEMD is appliedto decompose the heavily contaminated image into several bidimensional intrinsic mode functions(BIMFs). In this way, high-intensity noise can be dispersed into smaller components, and use of theBEMD effectively accomplishes an image-adapted decomposition procedure to provide image-noiseseparation. The decomposed image components are then more compatible with the processingconditions required for the optimized PCNN method. In fact, there are many denoising algorithmsthat are two steps and similar to the PCNN method, where the first step isolates noisy pixels and thesecond one suppresses the noise. For example, Salim [27] introduced a non-linear complex diffusionprocess (NLCDP) technique in the tBEMD domains, where the tBEMD is an adjusted BEMD methodbuilt on Student’s probability density function (PDF). The tBEMD-NLCDP method has an advantageover the traditional BEMD method. The main contributions in this paper are summarized as follows.
Committed to PCNN image noise reduction research, an adaptive PCNN method that is combinedwith the GWO and BEMD algorithms is developed, which has significant benefits for use in imagedenoising. But its parameters are difficult to determine which limits its practical application. GWOalgorithm is firstly proposed to resolve PCNN parameter issues, which can adaptively optimizeparameters exactly, with a global optimal solution and rapid convergence. Through a process ofcontinuous hierarchy screening and multiple iterations, the optimized parameters can have highaccuracy via the experimental verification and will enhance the PCNN’s denoising performancewell. The PCNN application isolates the noisy pixels and the noise-polluted image can be processedmore easily. Therefore, a subsequent filter, such as a median filter, can yield better denoising results.Importantly, BEMD will be applied to decompose the raw heavily polluted image into differentcomponents. This step is significant, solving the problem of a one-time direct processing, whichmakes it difficult to reduce the high-intensity image noise thoroughly. The decomposed high andlow-frequency components are then denoised using the optimized PCNN filter method. For importantnovelties, the GWO intelligent algorithm is the first proposed to apply intelligent optimizationscreening to parameters, which solves the key parameter problem accurately. BEMD applicationmakes the denoising progress more targeted according to the different component conditions.The self-adaptive determination optimized PCNN parameters will make the noise suppression progressfascinating while it is assisted.

Appl. Sci. 2018, 8, 1977 4 of 20
The proposed BEMD-GWO-PCNN denoising method is mainly applied to complete offline imageprocessing. The method effectively improves the effectiveness of parameter optimization and greatlyaccelerates the parameter optimization operating speed. Application of BEMD remedies the previousdeficiencies of insufficient suppression of high-intensity noise by making the denoising process morespecific. The image reconstruction results can finish excellent extraction, preservation of image details,and good noise suppression performance. In this paper, the existing other PCNN based noise reductionmethods are compared with our proposed method. In terms of parameter optimization efficiency andactual noise reduction effects, the proposed method applied to image denoising is superior. Accordingto our evaluation indicators, the proposed BEMD-GWO-PCNN method is shown to be feasible and tobe more accurate than other conventional and PCNN-based denoising methods.
The article is organized as follows: Section 2 is the description of adaptive PCNN combined withGWO and BEMD; Section 3 is the experimental results and analysis; And the last section providesconclusions and challenges for future research.
2. Adaptive PCNN Combined with GWO and BEMD
2.1. Introduction of Intrinsic Mode Functions
Unlike the traditional integral transform techniques, EMD is a multi-scale partial wave analysismethod. However, BEMD offers higher frequency resolution and more accurate timing of nonlinearand nonstationary signal events. After a sifting process is applied to the input signal, the intrinsicmode functions (IMFs) can be obtained. The IMF components can be defined using two conditions:(1) the number of extrema and the number of zero-crossings should either be equal or differ only by nomore than one; (2) at each point, the mean of the defined envelope through the local maxima and theenvelope that is defined by the local minima must be zero. Then, the decomposed result of the IMFsdenoted by mi and the residue rare as shown:
s =n
∑i=1
mi + r (1)
where s is defined as the input signal, n demonstrates the number of the IMFs.The IMF components represent each of the frequencies of the local data and thus correspond to
both high-frequency and low-frequency data. The residue function component represents the tendencyof the original image. The exact results of the IMFs constitute the BEMD [28].
2.2. Theories of the BEMD
As a data driven method, the BEMD is developed based on envelope analysis and a sifting process,and can decompose complex signals into a number of components that have the local characteristicsof the input source image [29]. The number of BIMFs is determined by the image data itself, wheredifferent images correspond to different numbers of BIMFs after decomposition. A BIMF must meettwo constraints: (1) the local mean of the original bidimensional signals must be symmetrical and themean is zero; and (2) the maximum of the BIMF is positive, while the minimum is negative [30].
The local BIMF frequencies range from high to low order when they are extracted layer-by-layer.The image signal energy is mainly concentrated in the low-frequency region; in contrast, the interferingnoise is mostly located in the high-frequency region. The local BIMF frequencies include strongphysical contrast information, including highlight edges of the source images, and the line andzone boundaries [31]. Each BIMF component contains different frequency coefficients, and thehigh—frequency coefficients are in a lower order. The residue function image contains thelow-frequency information of the source image, for which the grey-level distribution and the gradientinformation are smooth. The BEMD method can then effectively extract the various details andedges of the source image. From the perspective of the primary function, the BEMD can generatedifferent primary functions gi adaptively, corresponding to different source image characteristics.

Appl. Sci. 2018, 8, 1977 5 of 20
BEMD differs from Fourier transforms and wavelet decomposition, which have functions gis that arepredetermined [32]. In this work, we have adapted BEMD to decompose a raw image into severalBIMFs and residue images through an interpolation and envelope operation. The image BEMDdecomposition result f (x1, y1) of u× v neighboring pixels is as shown below:
f (x1, y1) =v
∑l=1
cl(x1, y1) + rv(x1, y1) (2)
where cl(x1, y1) represents the decomposed l-th components, and rv(x1, y1) is the residue or trendterm. The basic decomposition process steps of BEMD are as follows:
(a) Initialize the raw image and set the pending image f (x2, y2), where rl(x2, y2) = f (x2, y2).(b) If z = 1, set hlz(x2, y2) = rl(x2, y2); otherwise, set hl+1(x2, y2) = rl , and l = l + 1.(c) Calculate the maximum spectrum value plz and the minimum spectrum values qlz corresponding
to vlz(x2, y2).(d) Interpolate the calculated maximum spectrum plz and the minimum spectrum values qlz draw the
upper envelope umax(x2, y2) of hlz(x2, y2), and draw the lower envelop nmin(x2y2) of hlz(x2, y2).(e) Calculate the mean envelope vlz(x2, y2) of hlz(x2, y2) using the following formula:
vlz(x2, y2) =umax(x2, y2) + nmin(x2, y2)
2(3)
(f) Set hl(z+1)(x2, y2) to be the partial information of the source image, which can be calculatedusing (4):
hl(z+1)(x2, y2) = hlz(x2, y2)− vlz(x2, y2) (4)
(g) Check whether the characteristics of hl(z+1)(x2, y2) satisfy the BIMF properties; use the standarddeviation (STD) between hz+1 and hz as the stopping criterion from (5). It can be used todetermine whether hl(z+1)(x2, y2) meets the BIMF characteristics from two consecutive siftingresults. Limitation of the size of the STD allows a criterion for stopping of the sifting process tobe determined. From prior experience, the STD value can generally be set in the 0.2–0.3 range.
SD =∑u
x2=1 ∑vy2=1
∣∣∣hl(z+1)(x2, y2)− hlz(x2, y2)∣∣∣2
∑ux2=1 ∑v
y2=1|hlz(x2, y2)|(5)
(h) If the STD is less than a specified threshold and hl(z+1)(x2, y2) does not meet the stop condition,then set l = l + 1 and return to step c) until the sifting process condition is met. If hl(z+1)(x2, y2)
reaches the stop condition, then cl(x2, y2) = hl(z+1)(x2, y2) and rl+1 = rl − hl(x2, y2); l = l + 1.
Initially, the decomposition performs a preliminary pre-denoising treatment of the compositeimage signal. The decomposed components are specific to a single spectral component that hasstabilized features and lower disturbances. The decomposition result enables reduction of thecomplexity of image analysis with heavy noise. Therefore, the application of BEMD primarily ensuresthe accuracy of the analysis with the illusion of heavy noise elimination. BEMD thus appears to be animpressive option for achieving more practical noise reduction in the final processed image.
2.3. Implementing the PCNN Theory
Eckhorn [33] proposed the pulse-coupled neural network, which is a third-generation artificialneural network with wide application potential. In 1999, Johnson [34] used circuit theory to introducethe PCNN model more specifically, which was subsequently widely applied in various imageprocessing fields. Today, the continuous development of the PCNN model has given it incomparablesuperiority over the other current image denoising methods. There are two notable features of PCNN

Appl. Sci. 2018, 8, 1977 6 of 20
in the form of the global coupling and pulsed synchronization of the neurons [35]. In image processing,a PCNN is a single layer two-dimensional array of laterally linked neurons. Each neuron in thenetwork corresponds strictly to one pixel only in an input image and receives the intensity of thatcorresponding pixel as an external stimulus. Each neuron also connects with its neighboring neuronsand receives local stimuli from them. The PCNN model (Figure 1) is composed of three parts: thedendritic tree of the coupled linking subsystem, the modulation subsystem, and the pulse generator ofthe dynamic threshold subsystem and the firing subsystem.
Figure 1. The structure of the simplified Pulse Coupled Neural Network.
The surrounding outputs of the PCNN in the last iteration can be obtained using the linkingcompartment, while the initial output of the PCNN is set to zero [36]. For the input stimulus,the feeding compartment is applied at the corresponding location. Overall, the dendritic tree isdefined mathematically as shown below:
Fij[c] = Iij (6)
Lij[c] = VL∑k,l
WijklY[c− 1] (7)
where Fij[c] represents the feeding input compartment of neuron (i, j) and Lij[c] is the linkingcompartment. Iij is the external stimulus of neuron (i, j) and VL is a normalizing constant. wijkldenotes the weighted coefficient of neurons (k, l) to (i, j), which is the reciprocal of the Euclideandistance and is defined as shown in (8) [9]:
Wijkl =1√
(i− k)2 + (k− l)2(8)
The stimuli from the dendritic tree are applied to the modulation subsystem, and the modulationprocess can be described as shown in (9) below.
uij[c] = Fij[c]{
1 + βT Lij[c]}
(9)
where βT is the linking strength factor between synapses, and uij[c] denotes the internal state ofthe neuron.
Next, the threshold Eij[c], which represents the dynamical threshold, is generally set to zero.In each iteration, the threshold Eij[c] will be shown as follows:
Eij[c] = e−αTEij[c− 1] + VTYij[c] (10)
where αT is the exponential decay time constant, and νT is the intrinsic voltage constant of Eij[c].

Appl. Sci. 2018, 8, 1977 7 of 20
Finally, the internal state Uij[c] must be compared with that of the dynamic threshold Eij[c], andthe pulse output Yij[c] can be obtained subsequently using the firming subsystem:
Yij[c] =
{1, Uij(c) > E[c− 1],0, Uij(c) ≤ E[c− 1],
(11)
The neuron’s pulse generator includes a step function generator and a threshold signal generator.The threshold input at each time step is updated using the form of an exponential decay. At each step,the neuron output Yij[c] is set as 1, which means it can be fired. The internal activity Uij[c] is greaterthan the threshold function Eij[c]. The neuron output Yij[c] is then reset to zero when Uij[c] is less thanEij[c]. Thus, in a single time step, the pulse generator produces a single pulse at its output wheneverthe values of Uij[c] exceed those of Eij[c].
The linking parameter βT is taken on as a global variable. αT and νT are critical parameters thatcan easily affect the PCNN processing treatment. In this work, we initialize the weighted coefficientWijkl as [0.707 1 0.707, 1 0 1, 0.707 1 0.707] based on prior work from the empirical selection [17], whilethe significant parameter optimization problem of αT , βT and νT of the PCNN when applied to imagenoise elimination is the ground-breaking core of this paper.
The PCNN has characteristics that include a capture feature and a synchronization release pulse,which are appropriate for image denoising, image segmentation and similar processes. In this paper,the high- and low-frequency domain images are denoised using the optimized PCNN methods.In allusion to heavy noise disturbance, the noise reduction mechanism of the PCNN is also introduced.
2.4. Noise Reduction Mechanism of PCNN
In the PCNN model, each neuron corresponds to a single image pixel, and the excitation of oneneuron causes excitation of neighboring pixels with similar gray values; these responses are calledsynchronization release pulse characteristics [37]. Through application of these characteristics, a varietyof the image processing methods mentioned above can be realized.
In this work, all of the neurons adopt the same connection behavior. The brightness information ofevery pixel will be input to the corresponding neurons. Every neuron will then be connected with theneurons in a 3× 3 neighboring region. The state of a neuron (i.e., firing or extinguishing) is dependenton the output of the firing system. The Fij[c] of every neuron corresponds to the highlight of thepixel points. Lij[c] is equal to the sum of the output responses from the 3× 3 neighboring neurons inchannel L.
To overcome the noise disturbance and recover the detailed information as far as possible, noiseelimination is necessary. By adjusting the brightness values of the image pixels, contaminated imagescan, to a certain extent, be recovered [38]. In most cases, the brightness values of the contaminatedpixels differ from those of the neighboring normal pixels. Therefore, the outputs of noisy pixels differfrom those of normal pixels. Based on the output states of each neuron and its neighboring neurons (i.e.,ignited or unignited), the brightness values of the corresponding pixels are adjusted. The consequentimprovement in the pixel values can eliminate the noise and promote detail preservation performance.
When the neuron output values are considered, the corresponding pixel brightness valueswill be declined when one neuron is ignited but most of its neighboring neurons are unignited;the corresponding pixel brightness values will increase when one neuron misfires, but most neighboringneurons do fire. In other cases, the brightness values will not change. Therefore, through application ofthe PCNN, the ignited matrix of the raw image can be obtained. From this perspective, the simplifiedPCNN model can locate the isolated noisy pixels accurately and suppress these isolated noisy pixelpoints. In the actual denoising process, the PCNN processing acts as the pre-processing procedure,and a filter operation is often used on the isolated pixels to achieve an improved noise reduction effect.In general, median filtering can be applied to the isolated points using the marked difference betweenthe ignited pixels and the normal pixels. Many experiments have shown that the combination of the

Appl. Sci. 2018, 8, 1977 8 of 20
PCNN and a median filter is practical. A table showing the PCNN noise reduction algorithm withconventional random parameters (COR-PCNN; Algorithm 1) is introduced here in detail. From themodel and the associated mechanism analysis, the parameters play a critical role in the PCNN treatment.In this study, we invested considerable effort in optimization of the critical parameters αT, βT and νT,which performed well in our proposed GWO strategy.
Algorithm 1 PCNN Noise Reduction Algorithm
Boundary treatment:Generate edge-symmetric extension, make the original image(m, n) change into (m + 6, n + 6);Initialize the PCNN parameters:Initialize αT , βt, νT and Wijkl the number of pass N,step length ∆t;Keep each pixel in an unignited condition;Contaminated points detection and treatment:Calculate every neuron Lij[c] values in 3× 3 neighboring region using Equation (7);adjust the threshold Lij[c] using Equation (10); calculate the neuron internal modulation signal Lij[c] usingEquation (9);if a neuron (i, j) is ignited in 3× 3 neighbor region and more than 4 adjacent neurons are unignited, the (i, j)pixels brightness will decline an ∆t end;if a neuron (i, j) is unignited in 3× 3 neighbor region and more than 4 adjacent neurons are ignited, the (i, j)pixels brightness will increase an ∆t end;Otherwise the pixels brightness values of the (i, j) will not change end;Compare the Uij[c] e values and Eij[c] values, record the neuron output, ignited or unignited;N = N − 1, if return to contaminated points detection and treatment end;
The time decay parameter αT affects the operation efficiency directly and determines the numberof iterations required in a cycle; VT determines the conditions that must be issued only once in theiterative calculations. βT has a major impact on restoration of the image. Therefore, we propose use ofthe GWO intelligent optimization algorithm to solve this complex nonlinear problem.
2.5. GWO Algorithm
Over recent decades, meta-heuristic optimization techniques, which are inspired by relatedphysical phenomena, animal behavior or evolutionary concepts, have become increasingly popular [39].Inspired by the behavior of grey wolves, the Grey Wolf Optimization (GWO) algorithm is a newmeta-heuristics method. The tracking processes of grey wolves when encircling and attacking preyare the main steps in the numerical pattern of the GWO algorithm [40]. The GWO mimics theleadership hierarchy and the hunting mechanism of grey wolves in nature very well. The intelligentgrey wolf optimizer was proposed by Mirjalili [41] and can perform appropriate trade-offs betweenthe exploration and exploitation abilities of the algorithm. In solving complex benchmark functions,the GWO can be implemented effectively to address complex multivariate optimization problems.In the simulation of the leadership hierarchy, the grey wolves involve four types, designated α, β, δ
and ω [42]. The hierarchy and relationships of the grey wolves and their corresponding duties aredescribed in detail in Figure 2.

Appl. Sci. 2018, 8, 1977 9 of 20
Figure 2. The social hierarchy and responsibilities of the grey wolf.
In the GWO, the optimal solution to the problem is considered to be the prey and first threebest solutions are regarded as α, β and δ, respectively. Other than the three solutions mentionedabove, ω must follow the three dominant wolves and holds the rest of the candidate solutions [43].The initial stage of the GWO algorithm in the hunting process is encircling the prey. The mathematicalformulation used to mimic the encircling process is given as follows:
→D =
[→C ·→x p(t)−
→x (t)
](12)
→X(t + 1) =
→x p(t)−
→A ·→D (13)
where t indicates the current iteration,→x p and
→x are the position vectors of the grey wolves and a grey
wolf, respectively. The vectors→A and
→C are calculated as follows:
→A = 2 ·→a ·→e 1 −
→a (14)
→C = 2 ·→e 2 (15)
where→e 1 and
→e 2 are random vectors in [0, 1], and
→a is a motion vector acting as a variable that
decreases linearly from 2 to 0 over the iteration process. Depending on the random vectors→e 1 and
→e 2
position updating can be performed randomly over the search domain.We assume that α, β and δ all have better knowledge about the potential location of the prey.
Therefore, the other grey wolves represented by ω are obliged to update their positions based onthe best three positions obtained to date [44]. The grey hunting characteristic can then be presentednumerically as follows:
→Da =
∣∣∣∣→C1 ·→Xa −
→X∣∣∣∣
→Dβ =
∣∣∣∣→C2 ·→Xβ −
→X∣∣∣∣
→Dδ =
∣∣∣∣→C3 ·→Xδ −
→X∣∣∣∣
(16)
→X1 =
→Xα −
→A1 ·
→Dα
→X2 =
→Xβ −
→A2 ·
→Dβ
→X3 =
→Xδ −
→A3 ·
→Dδ
(17)
→X(t + 1) =
→X1 +
→X2 +
→X3
3(18)

Appl. Sci. 2018, 8, 1977 10 of 20
The best three initial solutions are considered, and the residual solutions are eliminated, and thus
the average measure of the three best solutions is provided by→X. The hunting process is terminated
only after the prey is attacked and the prey should pause its movement. If→A < 1, the attack process
will be finished, but if→A > 1, the grey wolves are diverted and move towards a better prey. Here,
→a represents the linear variable and the random vectors
→e 1 and
→e 2 are selected arbitrarily [45]. A table
containing the GWO algorithm [41] is introduced in detail below (Algorithm 2).
Algorithm 2 Grey Wolf Optimization Algorithm
Initialize the grey wolf population number Yi (i = 1, 2, . . . , n) and max number of iterations N:Initialize random parameter vectors a, A, and C;Calculate the function fitness of each set of parametersYa = the best search agent; Yβ = the second-best search agent; Yδ = the third best agent;Keep each pixel in an unignited condition;While (t < N)for each search agentupdate the position of the current search agent by Equation (17)
end forupdate a, A, and C; calculate the fitness of all search agents; update Ya, Yβ and Yδ;t = t + 1;end while; return Ya.
In this paper, the GWO is applied innovatively to solve for the optimal solution conditions forPCNN parameter optimization. Its outstanding global search capability and high convergence speedmean that the GWO is capable of yielding an excellent optimization performance.
2.6. The Proposed BEMD-GWO-PCNN Algorithm
Unlike most artificial neural networks, the PCNN does not require training at all. The PCNNparameters have a critical effect on denoising performance, which means that the PCNN limits itselfconsiderably. We have engaged in numerous experiments to explore the parameter optimizationproblem. As we discovered previously, αT , βT and νT are the key parameters for a guaranteeddenoising effect. The GWO therefore comes in handy in meeting the exact parameter optimizationdemands. The GWO algorithm begins optimization by generating a set of random solutions to act asthe first population. The optimized α, β and δ solutions are saved. Through encircling the prey, hunting,attacking and searching for the prey, the optimized parameters go through exploration iterations andavoidance of local optima. Using a combination of the PCNN effect assessment with the optimizationcriteria of GWO, the fitness function [17] is given as shown below:
h = 10 · log(
2552
θ
)(19)
θ = 10 · log
[‖S−Y‖2
M · N
](20)
where h is the fitness value acting as the judgement criterion; θ is regarded as the mean square errorvalue; S is the raw input image; Y is the noise-reduced image; ‖S−Y‖ is the p-norm of the matrixS−Y, and p = 2. M and N are the dimensions of the original image.
Each set of optimized parameters must be able to withstand the trials of the objective function.The set of parameters with the highest function fitness values is obtained after the screening process.
BEMD can be applied to obtain a series of mode components. The valid components shouldbe reserved as far as possible and heavy noise disturbances, such as salt and pepper noise, must be

Appl. Sci. 2018, 8, 1977 11 of 20
suppressed effectively. The BIMF, and residue obtained, all pass through the noise reduction processvia the PCNN filter with optimized parameters. In this paper, the peak signal-to-noise ratio (PSNR),the mutual information (MI), the structural similarity (SSIM), and the standard deviation (STD) [21]are used as the evaluation indexes and are defined as follows:
MSE =1
m · nm−1
∑i=0
n−1
∑j=0
[I(i, j)− K(i, j)]2
(21)
PSNR = 10 · log10
[MAXI
2
MSE
](22)
where M and N are the dimensions of the original image; I(i, j) is the raw image; and K(i, j) is thenoise-reduced image
SSIM(x, y) =
(2µxµy + c1
)(2σxy + c2
)(µx2 + µy2 + c1
)(µx2 + µy2 + c2
) (23)
where µx and µy are the average values of x and y, µx2 and µy
2 are the variances of x and y, respectively,and σxy is the covariance of x and y.
STD =
√√√√ 1N − 1
N
∑i=1
(→E i −
→E)2
(24)
where→E is the average of the samples
→E1,→E2, . . .
→En.
MI(X; Y) = ∑xIX
∑yIY
p(x, y) · logP(x, y)
P(x)P(y)(25)
where p(x, y) is the joint distribution of the random variables (x, y), and M(X; Y) is the relative entropyof p(x, y) and p(x)p(y).
The STD represents the degree of distribution of the image’s pixel gray level, and a higher STDrepresents higher contrast. The SSIM can be used to describe the similarities in the structures of twoimages, which can reflect the degree of recovery of the original valid image. The MI represents theamount of information on the original valid image that is contained in the noise-reduced image [21].
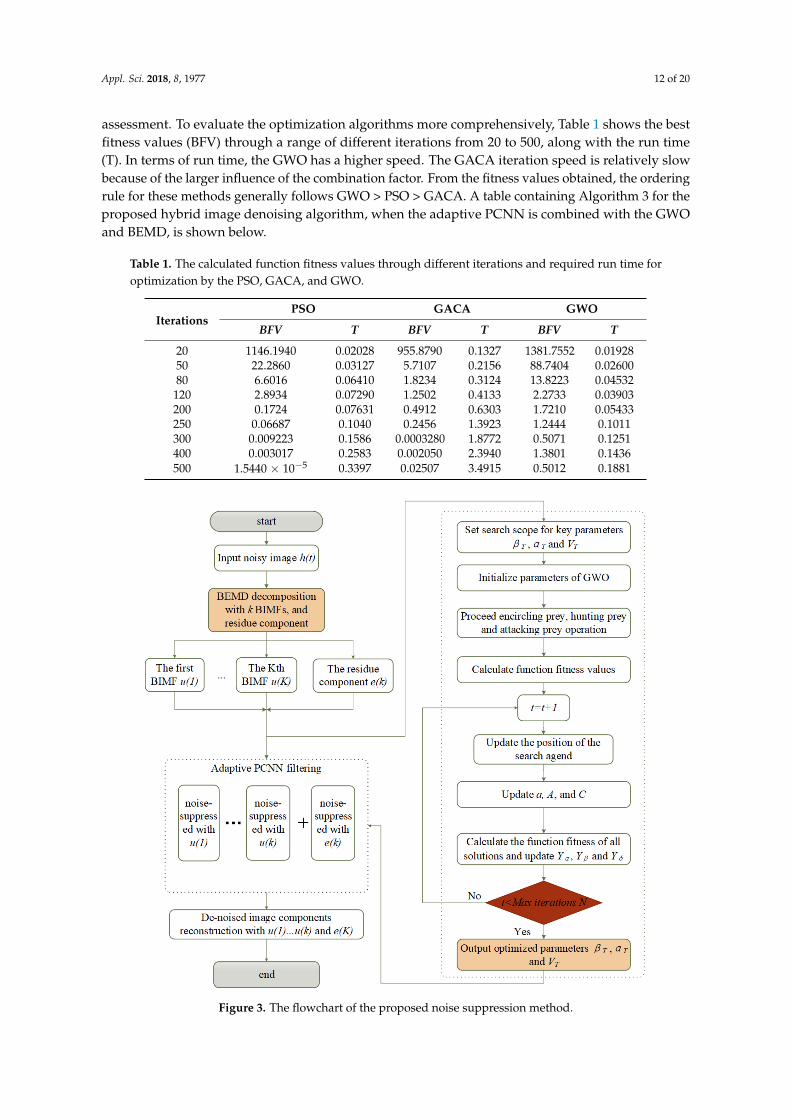
In this work, to provide further improvement in the accuracy of the search, the PCNN parametersare taken from pre-set ranges [17], where αT and βT are both in the range between [0, 1.00], and VT isset over the range from 0 to 300.000. The maximum number of iterations N = 30, the search agentnumber search Agent = 20, and the number of variables dim = 3 in the GWO algorithm. Using optimizedparameters, the PCNN is used to perform component purification. Finally, the signal obtained containsthe valid components of the original image. A detailed flowchart (shown in Figure 3) of the proposednoise elimination method is provided. To test the convergence rate of the GWO algorithm, a test fittingfunction is provided, and the whole search space from the 3D surface plot (Figure 4a) that correspondsto the function is shown, where x1, x2 ∈ [−100, 100], and the number of step = 2. The iteration numberis set at 500. The GWO convergence curve is presented in Figure 4b, where the vertical coordinatesrepresent the best fitness values selected by calculation of the tested function in the population regionsearch. To demonstrate the GWO convergence advantages, we also applied two current methods,which are the GACA [17] and PSO algorithms [16], for comparison. As shown in Figure 4b, the numberof iterations is set as 500 times, in order to conveniently and more clearly compare the convergenceresults. The iterative curves tell us that the GWO algorithm can complete convergence quicker than thePSO algorithm and is capable of accomplishing global search optimization in the curve trend analysis.The GACA has an unsatisfactory convergence delay performance, requiring excessively high iterationnumbers, while the calculated function fitness value distribution is irregular, which also affects the
Appl. Sci. 2018, 8, 1977 12 of 20
assessment. To evaluate the optimization algorithms more comprehensively, Table 1 shows the bestfitness values (BFV) through a range of different iterations from 20 to 500, along with the run time(T). In terms of run time, the GWO has a higher speed. The GACA iteration speed is relatively slowbecause of the larger influence of the combination factor. From the fitness values obtained, the orderingrule for these methods generally follows GWO > PSO > GACA. A table containing Algorithm 3 for theproposed hybrid image denoising algorithm, when the adaptive PCNN is combined with the GWOand BEMD, is shown below.
Table 1. The calculated function fitness values through different iterations and required run time foroptimization by the PSO, GACA, and GWO.
IterationsPSO GACA GWO
BFV T BFV T BFV T
20 1146.1940 0.02028 955.8790 0.1327 1381.7552 0.0192850 22.2860 0.03127 5.7107 0.2156 88.7404 0.0260080 6.6016 0.06410 1.8234 0.3124 13.8223 0.04532
120 2.8934 0.07290 1.2502 0.4133 2.2733 0.03903200 0.1724 0.07631 0.4912 0.6303 1.7210 0.05433250 0.06687 0.1040 0.2456 1.3923 1.2444 0.1011300 0.009223 0.1586 0.0003280 1.8772 0.5071 0.1251400 0.003017 0.2583 0.002050 2.3940 1.3801 0.1436500 1.5440 × 10⁻⁵ 0.3397 0.02507 3.4915 0.5012 0.1881
Figure 3. The flowchart of the proposed noise suppression method.

Appl. Sci. 2018, 8, 1977 13 of 20
Figure 4. (a) The 3D surface plot of the tested function in the parameter space: Y = sum(ans((x + 0.5))∧2),x1, x2 ∈ [−100, 100], step = 2; (b) the calculated convergence curve through 500 iterations of the greywolf optimization (GWO), genetic ant colony algorithm (GACA), and particle swarm optimization(PSO) method.
Algorithm 3 The Adaptive PCNN Optimized by the GWO and BEMD Algorithm
BEMD decomposition:Input raw image dfGenerate decomposed BIMF uk and residue rk.Boundary treatment:Generate edge-symmetric extension, make the original image (m, n) change into (m + 6, n + 6);Initialize the PCNN parameters:Initialize αT , βT , vT and Wijkl the number of pass N, step length ∆t;GWO algorithm implement:Keep each pixel in an unignited condition;Obtained optimized αT , βT and νTContaminated points detection and treatment in PCNN:Calculate every neuron Lij[n] values in 3× 3 neighboring region using Equation (7) adjust the threshold usingEquation (10); calculate the neuron internal modulation signal Eij[n] using Equation (9);if a neuron (i, j) is ignited in 3× 3 neighbor region and more than 4 adjacent neurons are unignited, the (i, j)pixels brightness will decline an ∆t end;if a neuron (i, j) is unignited in 3× 3 neighbor region and more than 4 adjacent neurons are ignited, the (i, j)pixels brightness will increase a ∆t end;Otherwise the pixels brightness values of the (i, j) won’t change end;Compare the uij[n] values and Eij[n] values, record the neuron output, ignited or unignited;N = N − 1, if N 6= 0, return to contaminated points detection and treatmentFiltering processing:For further noise reduction, apply median filter to the treated imageend;Otherwise, end.Reconstruct each component uk and rk, and obtain the final denoising image
3. Experimental Results and Analysis
The effectiveness of the proposed PCNN-BEMD when combined with the GWO method canbe verified experimentally. The best parameters for the PCNN can be obtained from GWO, fromwhich noise separation can be obtained and a pre-denoising process can be completed; then, a median

Appl. Sci. 2018, 8, 1977 14 of 20
filter will be applied for noise reduction. The BEMD is performed within the PCNN to improveits performance.
The experimental implementation results (Figures 5 and 6) for the proposed method are validated.The original Lena image and the Pepper image are in JPG format and the original image sizes are3× 512× 512 and 3× 750× 1020, respectively. The images were both conducted gray processing inadvance then are preprocessed by decomposition using the BEMD. Consequently, the decomposedBIMFs and the corresponding residues can be presented. The original images have salt and peppernoise superimposed on them with density δ2 = 0.05, i.e., the percentage of the image area that containsthe noise value. Based on observation of the polluted image, the original outlines and the details ofthese images cannot be distinguished clearly because of the noise interference. BIMFs 1 and 2 containnumerous noise points, such as the irregular black and white clouds of points. The residue containsa relatively small number of noise points, while also containing plentiful original details of both theimage and the main frame. Therefore, each component should be purified using the PCNN filter.
Figure 5. Results of decomposition by bidimensional empirical mode decomposition (BEMD) for theraw Lena image: (a) the original image, (b) the noise polluted image, (c) the decomposed bidimensionalintrinsic mode function (BIMF) 1, (d) the decomposed BIMF 2, (e) the residue.
Figure 6. Results of decomposition by BEMD for the raw Pepper image: (a) the original image, (b) thenoise polluted image, (c) the decomposed BIMF 1, (d) the decomposed BIMF 2, (e) the residue.
Before PCNN filtering, the optimal parameters must be determined using the GWO. After therelevant calculation processes for the encircling, hunting and attacking operators, the values of αT ,βT , and vT that correspond to each component are presented (Table 2). Obviously, the parametersare different for each image component. However, there are no significant data rules betweenthese parameters.
Using the calculated parameters above, optimized PCNN filtering is applied to the noise-pollutedLena and Pepper images for denoising. The noise suppression results for BIMFs 1 to 2 and the residue

Appl. Sci. 2018, 8, 1977 15 of 20
(Figures 7d–i and 8d–i) show that the heavy salt and pepper noise is eliminated. The valid image detailsare extracted effectively, and the image outlines and edges are recovered well. Finally, the reconstructedimages (Figures 7d and 8d) with the decomposed components enable detailed comparison of thenoise suppression effects of the different denoising methods, including the median filter, the particleswarm optimization method (PSO-PCNN), the conventional random PCNN (COR-PCNN) method,the genetic ant colony algorithm (GACA-PCNN) and the non-linear complex diffusion processtechnique (NLCDP) in the tBEMD domains (tBEMD-NLCDP). Observations indicate that our proposedBEMD-GWO-PCNN approach more than matches the other methods. When compared with theoriginal images, the experimentally reconstructed images show a good performance in terms of therecovery of image details. However, the other methods appear to have processing blur or certainamounts of residual noise.
Table 2. The experimentally obtained optimal parameters data for each decomposed componentcorresponding to the Lena and Pepper image.
ModeLena Pepper
αT1 βT1 VT1 αT2 βT2 VT2
BIMF1 0.107 0.260 273.858 0.0318 0.0344 229.263BIMF2 0.0594 0.423 119.719 0.338 0.730 256.035
Residue 0.125 0.784 222.941 0.229 0.497 100.000
Figure 7. Lena image: (a–c) the noise-suppression BIMF 1 to 2 and the residue, (d) The proposed BEMD-GWO-pulse-coupled neural network (PCNN) reconstruction image, (e) median filter, (f) PSO-PCNNmethod, (g) GACA-PCNN, (h) conventional random parameters (COR)-PCNN, (i) tBEMD-non-linearcomplex diffusion process (NLCDP).
Appl. Sci. 2018, 8, 1977 16 of 20
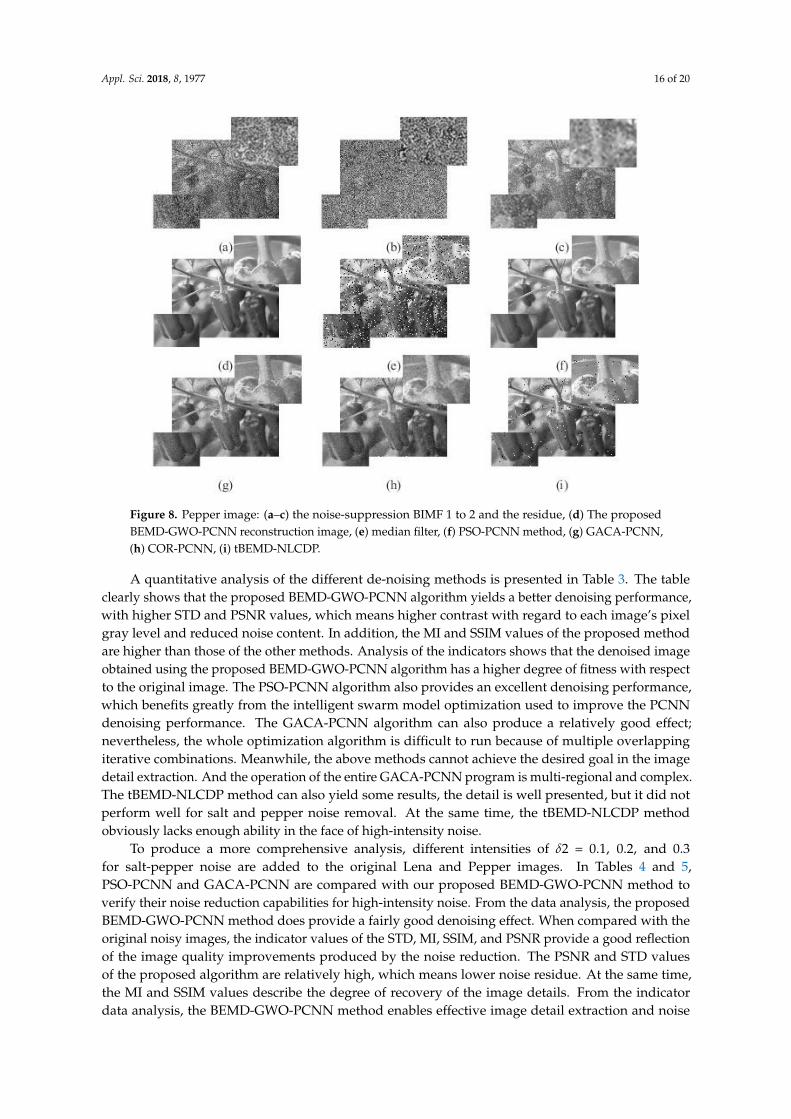
Figure 8. Pepper image: (a–c) the noise-suppression BIMF 1 to 2 and the residue, (d) The proposedBEMD-GWO-PCNN reconstruction image, (e) median filter, (f) PSO-PCNN method, (g) GACA-PCNN,(h) COR-PCNN, (i) tBEMD-NLCDP.
A quantitative analysis of the different de-noising methods is presented in Table 3. The tableclearly shows that the proposed BEMD-GWO-PCNN algorithm yields a better denoising performance,with higher STD and PSNR values, which means higher contrast with regard to each image’s pixelgray level and reduced noise content. In addition, the MI and SSIM values of the proposed methodare higher than those of the other methods. Analysis of the indicators shows that the denoised imageobtained using the proposed BEMD-GWO-PCNN algorithm has a higher degree of fitness with respectto the original image. The PSO-PCNN algorithm also provides an excellent denoising performance,which benefits greatly from the intelligent swarm model optimization used to improve the PCNNdenoising performance. The GACA-PCNN algorithm can also produce a relatively good effect;nevertheless, the whole optimization algorithm is difficult to run because of multiple overlappingiterative combinations. Meanwhile, the above methods cannot achieve the desired goal in the imagedetail extraction. And the operation of the entire GACA-PCNN program is multi-regional and complex.The tBEMD-NLCDP method can also yield some results, the detail is well presented, but it did notperform well for salt and pepper noise removal. At the same time, the tBEMD-NLCDP methodobviously lacks enough ability in the face of high-intensity noise.
To produce a more comprehensive analysis, different intensities of δ2 = 0.1, 0.2, and 0.3for salt-pepper noise are added to the original Lena and Pepper images. In Tables 4 and 5,PSO-PCNN and GACA-PCNN are compared with our proposed BEMD-GWO-PCNN method toverify their noise reduction capabilities for high-intensity noise. From the data analysis, the proposedBEMD-GWO-PCNN method does provide a fairly good denoising effect. When compared with theoriginal noisy images, the indicator values of the STD, MI, SSIM, and PSNR provide a good reflectionof the image quality improvements produced by the noise reduction. The PSNR and STD valuesof the proposed algorithm are relatively high, which means lower noise residue. At the same time,the MI and SSIM values describe the degree of recovery of the image details. From the indicatordata analysis, the BEMD-GWO-PCNN method enables effective image detail extraction and noise

Appl. Sci. 2018, 8, 1977 17 of 20
reduction. In the Lena and Pepper images, the PSO-PCNN, GACA-PCNN, tBEMD-NLCDP methodand BEMD-GWO-PCNN methods all performed well. However, multiple experiments demonstratedthat our method is more feasible and provides superior performance to the GACA-PCNN PSO-PCNN,and tBEMD-NLCDP methods. In fact, our method has shown that the noise interference is welleliminated, and that the extraction of the image stripe details is well completed. At the sametime, the PSO-PCNN, GACA-PCNN and tBEMD-NLCDP method lacks enough ability in the face ofhigh-intensity noise, whose performances are relatively weak.
Table 3. Results from an experimental evaluation comparing indicator values of standard deviation(STD), mutual information (MI), structural similarity index measurement (SSIM) and peak signal tonoise ratio (PSNR) of the unprocessed images with those from different noise reduction methods.
ResultsLena Pepper
STD MI SSIM PSNR STD MI SSIM PSNR
Unprocessed image 28.042 0.679 0.109 13.853 5.684 1.436 0.106 10.241BIMF 1 0.187 0.643 −0.107 6.581 5.671 0.100 −0.015 5.671BIMF 2 14.619 0.078 0.034 6.840 7.241 0.413 0.023 5.685Residue 36.361 1.305 0.186 15.749 11.029 1.644 0.286 15.357
BEMD-GWO-PCNN 53.316 2.368 0.788 23.159 17.774 4.262 0.607 21.774GACA-PCNN 50.006 1.804 0.599 19.532 15.685 3.240 0.596 18.029COR-PCNN 45.612 1.689 0.414 16.925 12.684 2.165 0.387 17.963PSO-PCNN 48.469 1.971 0.683 20.007 15.357 2.514 0.439 20.684
Median filter 45.348 1.718 0.442 19.078 10.685 2.023 0.326 17.033tBEMD-NLCDP 47.366 1.793 0.527 20.223 15.388 2.854 0.546 18.003
Table 4. Comparison of the adaptive PCNN combined with BEMD method with other current denoisingmethods corresponding to different noise intensity values δ in Lena.
Lena Noise Image PSO-PCNN GACA-PCNN tBEMD-NLCDP BEMD-GWO-PCNN
δ2 = 0.1
STD1 38.874 46.596 43.899 42.191 46.626MI1 1.612 2.877 1.983 2.487 3.147
SSIM1 0.170 0.817 0.957 0.612 0.955PSNR1 15.343 28.153 33.426 27.143 34.691
δ2 = 0.2
STD2 35.421 38.945 46.937 36.487 54.672MI2 1.588 2.799 1.819 3.218 4.097
SSIM2 0.0905 0.577 0.682 0.0667 0.806PSNR2 12.329 16.807 22.292 15.398 29.642
δ2 = 0.3
STD3 32.709 42.861 45.364 41.315 48.498MI3 1.097 2.614 1.864 2.446 2.695
SSIM3 0.0605 0.726 0.592 0.782 0.793PSNR3 10.576 20.265 23.680 18.346 26.359
Table 5. Comparison of the adaptive PCNN combined with BEMD method with other current denoisingmethods corresponding to different noise intensity values δ in Pepper.
Pepper Noise Image PSO-PCNN GACA-PCNN tBEMD-NLCDP BEMD-GWO-PCNN
δ2 = 0.1
STD1 45.605 51.573 48.157 49.253 51.685MI1 1.703 2.403 1.961 2.381 2.515
SSIM1 0.0427 0.854 0.701 0.861 0.906PSNR1 15.246 32.224 26.358 30.269 32.362
δ2 = 0.2
STD2 42.539 50.633 45.078 44.328 51.954MI2 1.634 2.090 2.177 1.933 2.386
SSIM2 0.0272 0.855 0.502 0.724 0.878PSNR2 12.274 24.009 28.086 27.913 29.966
δ2 = 0.3
STD3 40.205 50.552 52.705 49.251 53.256MI3 1.607 2.426 1.945 1.837 2.432
SSIM3 0.0903 0.562 0.596 0.514 0.709PSNR3 10.566 23.823 20.817 22.037 24.108
Appl. Sci. 2018, 8, 1977 18 of 20
4. Conclusions
With the aim of image noise suppression, an adaptive PCNN method optimized using the GWOand BEMD has been presented in this paper. Practical application of the proposed hybrid denoisingalgorithm has been achieved and yielded a better effect than other existing image denoising methods.In the proposed de-noising method, the PCNN filter is used for image denoising, while the GWO andBEMD are used as auxiliary algorithms to improve PCNN’s noise reduction effects. To solve the criticalproblem of the parameter optimization issue, the GWO has been applied to global optimization throughscreening and iteration processes to derive optimized parameters. As a conclusion, the proposedmethod can be targeted more effectively to eliminate each decomposed component when BEMD isused, and the decomposed components have been treated differently by the PCNN filtering withspecific critical parameters.
Analyses of the denoising performance in the face of high-intensity noise has indicated that thefaster parameter optimization convergence speed and better effects make it superior to other parameteroptimization algorithms. The experimental outcomes analysis in the Pepper and Lena images haveprovided evidence for the effectiveness of the proposed BEMD-GWO-PCNN algorithm in image noisesuppression applications. A higher PSNR value has represented the more valid statics preservation,which corresponds to more noise removal. Furthermore, our adopted indicators STD, MI, and SSIM are,in a high-level meaning, a closer degree to the size and distribution of the original image pixel points.
However, as the accuracy and effectiveness of our algorithms increase significantly, the runningcomplexity will increase slightly. In the future, we hope that we can further improve the convergencespeed and accuracy level of the algorithm in order to keep refined. In this paper, we only addresssalt and pepper noise suppression. Thus, it is necessary to promote the suppression of other noise.Additionally, how to realize real-time image noise reduction and reduce the operation running time asmuch as possible, are also topics to be studied carefully.
Author Contributions: M.C. and Y.W. contributed equally to this paper. Conceptualization, M.C.; Software, Y.W.;Validation, C.W.; Formal Analysis, X.L.; Funding Acquisition, C.S.
Funding: This work was supported in part by the National Natural Science Foundation of China (61603353,51705477, 51575500), and the Shanxi Province Science Foundation for Youths (201601D021067), and ResearchProject Supported by Shanxi Scholarship Council of China (2015-082) and the Fund for Shanxi “1331 Project” KeySubjects Construction. We thank David MacDonald, from Liwen Bianji, Edanz Editing China (www.liwenbianji.cn/ac), for editing the English text of a draft of this manuscript.
Conflicts of Interest: The authors declare no conflict of interest.
References
1. Wang, H.; Xiao, X.; Peng, X.Y.; Liu, Y.; Zhao, W. Improved image denoising algorithm based on superpixelclustering and sparse representation. Appl. Sci. 2017, 7, 436. [CrossRef]
2. Zhu, Z.; Jiang, J.L.; Zhang, X.G. Impulse noise filter via spatial global outlier measurement. J. Electron.Imaging 2015, 24, 053008. [CrossRef]
3. Elad, M.; Aharon, M. Image denoising via sparse and redundant representations over learned dictionaries.IEEE Trans. Image Process. 2006, 15, 3736–3745. [CrossRef] [PubMed]
4. Starck, J.L.; Candès, E.J.; Donoho, D.L. The curvelet transform for image denoising. IEEE Trans. Image Process.2002, 11, 670–684. [CrossRef] [PubMed]
5. Dabov, K.; Foi, A.; Katkovnik, V.; Karen, E. Image denoising by sparse 3-D transform-domain collaborativefiltering. IEEE Trans. Image Process. 2007, 16, 2080–2095. [CrossRef] [PubMed]
6. Burger, H.C.; Schuler, C.J.; Harmeling, S. Image denoising: Can plain neural networks compete withBM3D? In Proceedings of the 2012 IEEE Conference on Computer Vision and Pattern Recognition (CVPR),Providence, RI, USA, 16–21 June 2012; pp. 2392–2399.
7. Li, Y.J.; Zhang, J.W.; Wang, M.N. Improved BM3D denoising method. IET Image Process. 2017, 11, 1197–1204.[CrossRef]

Appl. Sci. 2018, 8, 1977 19 of 20
8. Xu, X.; Wang, G.; Ding, S.; Cheng, Y.; Wang, X. Pulse-coupled neural networks and parameter optimizationmethods. Neural Comput. Appl. 2017, 28, 671–681. [CrossRef]
9. Zhang, D.; Nishimura, T.H. Pulse coupled neural network based anisotropic diffusion method for 1/f noisereduction. Math. Comput. Model. 2010, 52, 2085–2096. [CrossRef]
10. Wang, Z.B.; Ma, Y.D.; Cheng, F.Y.; Yang, L. Review of pulse-coupled neural networks. Image Vis. Comput.2010, 28, 5–13. [CrossRef]
11. Xie, X.D.; Wen, S.P.; Zeng, Z.Z.; Huang, T. Memristor-based circuit implementation of pulse-coupled neuralnetwork with dynamical threshold generators. Neurocomputing 2018, 284, 10–16. [CrossRef]
12. Yang, Y.; Yang, M.; Huang, S.; Ding, M.; Sun, J. NSCT-PCNN image fusion based on image gradientmotivation. IET Comput. Vis. 2017, 12, 377–383.
13. Yang, Y.; Yang, M.; Huang, S.; Ding, M.; Sun, J. Robust Sparse Representation Combined with AdaptivePCNN for Multifocus Image Fusion. IEEE Access 2018, 6, 20138–20151. [CrossRef]
14. Deng, X.Y.; Ma, Y.D.; Dong, M. A new adaptive filtering method for removing salt and pepper noise basedon multilayered PCNN. Pattern Recognit. Lett. 2016, 79, 8–17. [CrossRef]
15. Zhu, S.; Wang, L.D.; Duan, S.K. Memristive pulse coupled neural network with applications in medicalimage processing. Neurocomputing 2017, 227, 149–157. [CrossRef]
16. Bai, W.H.; Zhang, W.B.; Zhou, N.R.; Tang, L.; Ma, C.; Shi, X. Transmission line voltage classes identificationbased on particle swarm optimization algorithm and PCNN. Ferroelectrics 2017, 521, 6–17. [CrossRef]
17. Shen, C.; Wang, D.; Tang, S.; Cao, H.; Liu, J. Hybrid image noise reduction algorithm based on genetic antcolony and PCNN. Vis. Comput. 2017, 33, 1373–1384. [CrossRef]
18. Shen, C.; Song, R.; Li, J.; Zhang, X.; Tang, J.; Shi, Y.; Liu, J.; Cao, H.L. Temperature drift modeling of MEMSgyroscope based on genetic-Elman neural network. Mech. Syst. Signal Process. 2016, 72–73, 897–905.
19. Wu, C.D.; Liu, Z.G.; Jiang, H. Catenary image segmentation using the simplified PCNN with adaptiveparameters. Opt. Int. J. Light Electron Opt. 2018, 157, 914–923. [CrossRef]
20. He, F.L.; Guo, Y.C.; Gao, C. A parameter estimation method of the simple PCNN model for infrared humansegmentation. Opt. Laser Technol. 2018. [CrossRef]
21. Xu, X.Z.; Shan, D.; Wang, G.Y.; Jiang, X. Multimodal medical image fusion using PCNN optimized by theQPSO algorithm. Appl. Soft Comput. 2016, 46, 588–595. [CrossRef]
22. Ji, L.P.; Yi, Z. A mixed noise image filtering method using weighted-linking PCNNs. Neurocomputing 2008,71, 2986–3000. [CrossRef]
23. Zhu, Y.; Jiang, W.; Kong, X.; Quan, L.; Zhang, Y. A chaos wolf optimization algorithm with self-adaptivevariable step-size. AIP Adv. 2017, 7, 105024. [CrossRef]
24. Lu, C.; Gao, L.; Yi, J. Grey wolf optimizer with cellular topological structure. Expert Syst. Appl. 2018, 107,89–114. [CrossRef]
25. Zhang, X.M.; Qiang, K.; Kang, J.F.; Wang, X. A novel hybrid algorithm based on Biogeography-BasedOptimization and Grey Wolf Optimizer. Appl. Soft Comput. 2018, 67, 197–214. [CrossRef]
26. Chen, H.G.; Shen, J.Y.; Chen, W.H.; Wu, C.Y.; Huang, C.S.; Yi, Y.Y.; Qian, J.C. The bivariate empirical modedecomposition and its contribution on grinding chatter detection. Appl. Sci. 2017, 7, 145. [CrossRef]
27. Salim, L. Image denoising in bidimensional empirical mode decomposition domain: The role of Student’sprobability distribution function. Healthc. Technol. Lett. 2016, 3, 67–71.
28. Zhang, B.H.; Zhang, C.T.; Wu, J.S.; Liu, H. A medical image fusion method based on energy classification ofBEMD components. Opt. Int. J. Light Electron Opt. 2014, 125, 146–153. [CrossRef]
29. Liu, G.; Li, L.; Gong, H.; Jin, Q.; Li, X.; Song, R.; Chen, Y.; Chen, Y.; He, C.; Huang, Y.; et al. Multisourceremote sensing imagery fusion scheme based on bidimensional empirical mode decomposition (BEMD) andits application to the extraction of bamboo forest. Remote Sens. 2017, 9, 19. [CrossRef]
30. Titijaroonroj, T.; Woraratpanya, K. Iteration-Free Bi-Dimensional Empirical Mode Decomposition and ItsApplication. IEICE Trans. Inf. Syst. 2017, 100, 2183–2196. [CrossRef]
31. Lu, L.; Yan, J.H.; Chen, W.Q.; An, S. Investigation of KDP crystal surface based on an improved bidimensionalempirical mode decomposition method. Appl. Surf. Sci. 2018, 433, 680–688. [CrossRef]
32. Tian, C.; Wang, L.; Wu, L.; Zhu, L.; Xu, W.; Ye, Z.; Zhao, Z.; Wang, Y.; Zhang, Y. Clinical characteristics andprognosis of multiple myeloma with bone-related extramedullary disease at diagnosis. Biosci. Rep. 2018, 38.[CrossRef] [PubMed]
Appl. Sci. 2018, 8, 1977 20 of 20
33. Eckhorn, R.; Reitboeck, H.J.; Arndt, M.; Dicke, P. Feature linking via stimulus-evoked oscillations:Experimental results from cat visual cortex and functional implications from a network model. J. NeuralNetw. 1989, 6, 723–730.
34. Johnson, J.L.; Padgett, M.L. PCNN models and applications. IEEE Trans. Neural Netw. 1999, 10, 480–498.[CrossRef] [PubMed]
35. Zhou, D.G.; Shao, Y.H. Region growing for image segmentation using an extended PCNN model. IET ImageProcess. 2018, 12, 729–737. [CrossRef]
36. Wang, Z.B.; Wang, S.; Guo, L.J. Novel multi-focus image fusion based on PCNN and random walks. NeuralComput. Appl. 2018, 29, 1101–1114. [CrossRef]
37. Mohammed, M.M.; Badr, A.; Abdelhalim, M.B. Image classification and retrieval using optimizedpulse-coupled neural network. Expert Syst. Appl. 2015, 42, 4927–4936. [CrossRef]
38. Wang, Z. Applications of objective image quality assessment methods [applications corner]. IEEE SignalProcess. Mag. 2011, 28, 137–142. [CrossRef]
39. Liu, H.; Wu, H.P.; Li, Y.F. Smart wind speed forecasting using EWT decomposition, GWO evolutionaryoptimization, RELM learning and IEWT reconstruction. Energy Convers. Manag. 2018, 161, 266–283. [CrossRef]
40. Niu, M.F.; Hu, Y.Y.; Sun, S.L.; Liu, Y. A novel hybrid decomposition-ensemble model based on VMD andHGWO for container throughput forecasting. Appl. Math. Model. 2018, 57, 163–178. [CrossRef]
41. Mirjalili, S.; Mirjalili, S.M.; Lewis, A. Grey wolf optimizer. Adv. Eng. Softw. 2014, 69, 46–61. [CrossRef]42. Ozkaya, U.; Seyfi, L. A comparative study on parameters of leaf-shaped patch antenna using hybrid artificial
intelligence network models. Neural Comput. Appl. 2018, 29, 35–45. [CrossRef]43. Khalilpourazari, S.; Khalilpourazary, S. Optimization of production time in the multi-pass milling process
via a Robust Grey Wolf Optimizer. Neural Comput. Appl. 2018, 29, 1321–1336. [CrossRef]44. Banu, S.S.; Baskaran, K. Hybrid FGWO Based FLCs Modeling for Performance Enhancement in Wireless
Body Area Networks. Wirel. Pers. Commun. 2018, 100, 1163–1199. [CrossRef]45. Mirjalili, S.; Saremi, S.; Mirjalili, S.M.; Coelho, L.D.S. Multi-objective grey wolf optimizer: A novel algorithm
for multi-criterion optimization. Expert Syst. Appl. 2016, 47, 106–119. [CrossRef]
© 2018 by the authors. Licensee MDPI, Basel, Switzerland. This article is an open accessarticle distributed under the terms and conditions of the Creative Commons Attribution(CC BY) license (http://creativecommons.org/licenses/by/4.0/).

![Salt and Pepper Noise Removal using Pixon-based ...jad.shahroodut.ac.ir/article_1639_37180564495edeb... · literature to remove the salt and pepper noise. In [13], an adaptive fuzzy](https://img.dokumen.tips/doc/110x75/5f42e3deef027a47746d60b9/salt-and-pepper-noise-removal-using-pixon-based-jad-literature-to-remove-the.jpg)