Embed Size (px)
Citation preview

2
Sales first quarter 2002: SEK 12,487 m. (12,405) Earnings before interest and taxes, EBIT: SEK 770 m. (952)
Scania GroupScania Group

3
Operating income (EBIT) SEK 770 m. (952)EBIT margin for Scania products 6.6%Lower truck deliveries (-16%)Higher bus deliveries (+9%)Positive trend in service sales and customer financePositive currency rate effectsCost-cutting and adjustment programmes in both European and Latin American operations continue
Operating income (EBIT) SEK 770 m. (952)EBIT margin for Scania products 6.6%Lower truck deliveries (-16%)Higher bus deliveries (+9%)Positive trend in service sales and customer financePositive currency rate effectsCost-cutting and adjustment programmes in both European and Latin American operations continue
Scania highlights Scania highlights First quarter 2002First quarter 2002

4
First quarter 2002 and outlookFirst quarter 2002 and outlook
Central andeastern Europe
Improved order bookings
Latin America
Uncertainty
Rest of the world
Low volume
Western Europe
Market bottoming out????
Stronger order bookings
AsiaStronger order bookings

5
SEK m.
0
300
600
900
1,200
1,500
1,800
2,100
Q1 Q2 Q3 Q4 Q1 Q2 Q3 Q4 Q1 Q2 Q3 Q4 Q1 Q2 Q3 Q4 Q1
Quarterly EBIT and EBIT marginQuarterly EBIT and EBIT marginScania GroupScania Group
6.3%
8.6%9.1%
11.2%9.0%
1998 1999
11.6%
629
1,010851
1,1021,2401,263
1,139
11.6%
1,403
9.2%
1,105
2000
1,051
7.9%
901
8.3%13.3%
2,027
7.7%
952
2001
650
4.7%
402
3.4%
463
3.1%
2002
11.4% 770
6.2%

6
SEK m.
0
300
600
900
1,200
1,500
1,800
2,100
Q1 Q2 Q3 Q4 Q1 Q2 Q3 Q4 Q1 Q2 Q3 Q4 Q1 Q2 Q3 Q4 Q1
Quarterly EBIT and EBIT marginQuarterly EBIT and EBIT marginScania productsScania products
6.6%
9.2%9.8%
12.0%9.7%
12.8%
1998 1999
12.4%568
938789
1,0471,178 1,192
1,086
12.5%
1,336
10.1%
1,049
2000
984
8.6%
872
9.4%13.9%
1,904
943
8.5%
2001
597
4.9%384
3.7%
432
3.2%
2002
724
6.6%
7
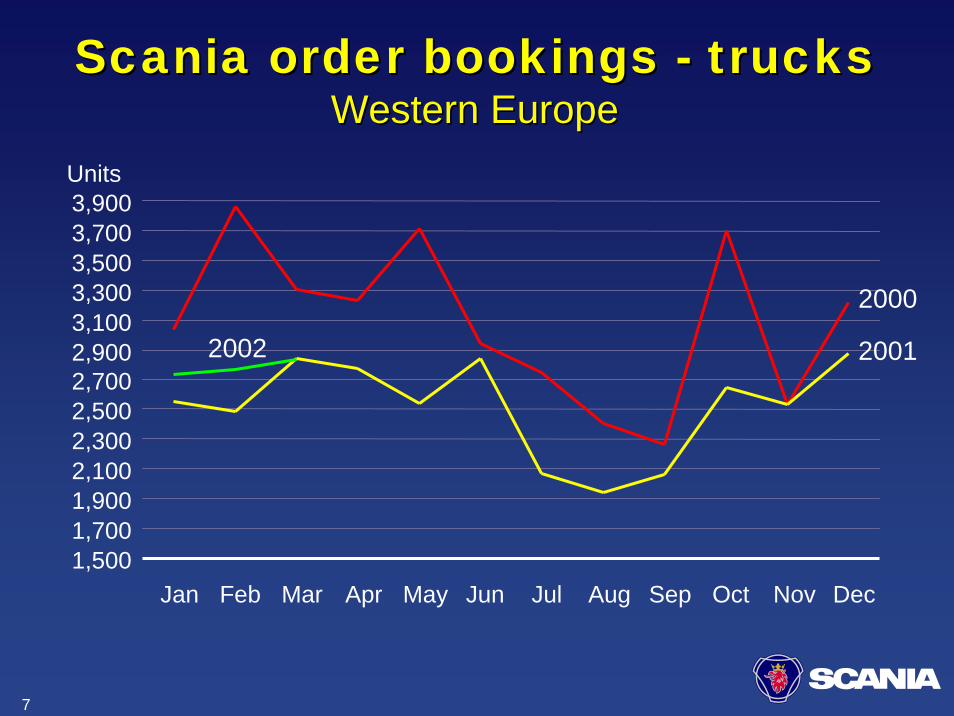
1,5001,7001,9002,1002,3002,5002,7002,9003,1003,3003,5003,7003,900
Jan Feb Mar Apr May Jun Jul Aug Sep Oct Nov Dec
Scania order bookings Scania order bookings -- truckstrucksWestern EuropeWestern Europe
Units
2000
20012002
8
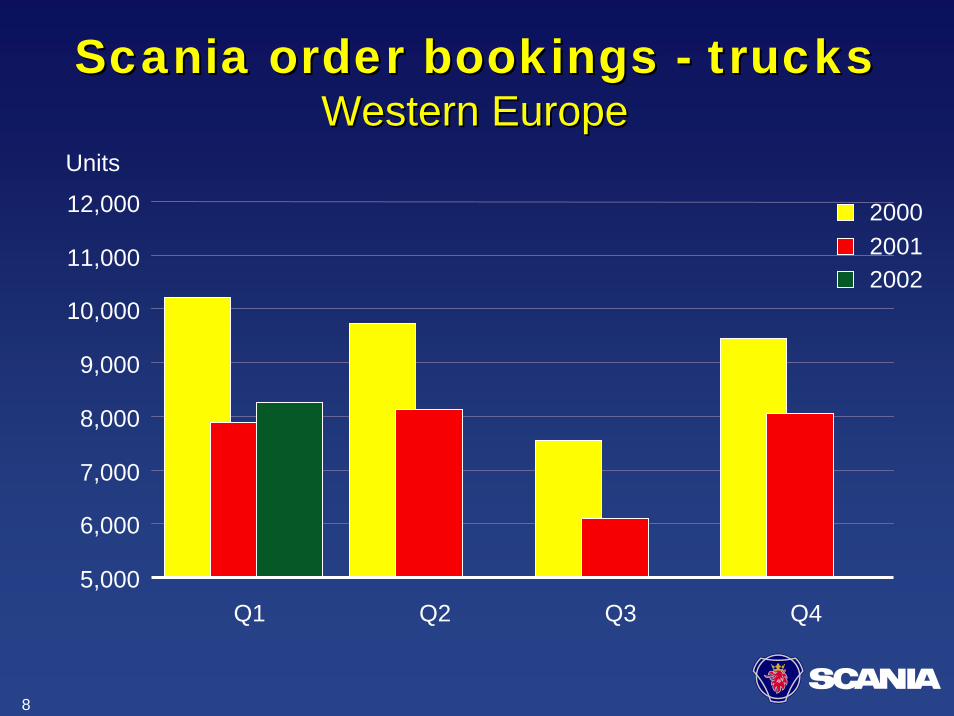
5,000
6,000
7,000
8,000
9,000
10,000
11,000
12,000
Q1 Q2 Q3 Q4
Scania order bookings Scania order bookings -- truckstrucksWestern EuropeWestern Europe
Units
200020012002
9
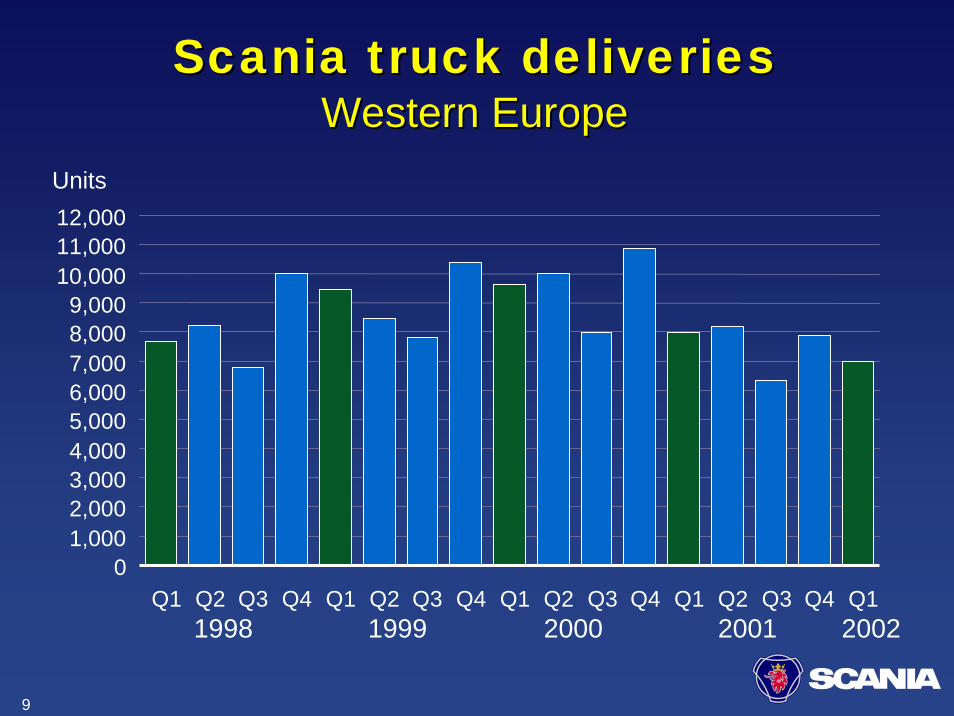
01,0002,0003,0004,0005,0006,0007,0008,0009,000
10,00011,00012,000
Q1 Q2 Q3 Q4 Q1 Q2 Q3 Q4 Q1 Q2 Q3 Q4 Q1 Q2 Q3 Q4 Q11998 1999 2000 2001 2002
Scania truck deliveries Scania truck deliveries Western EuropeWestern Europe
Units
10
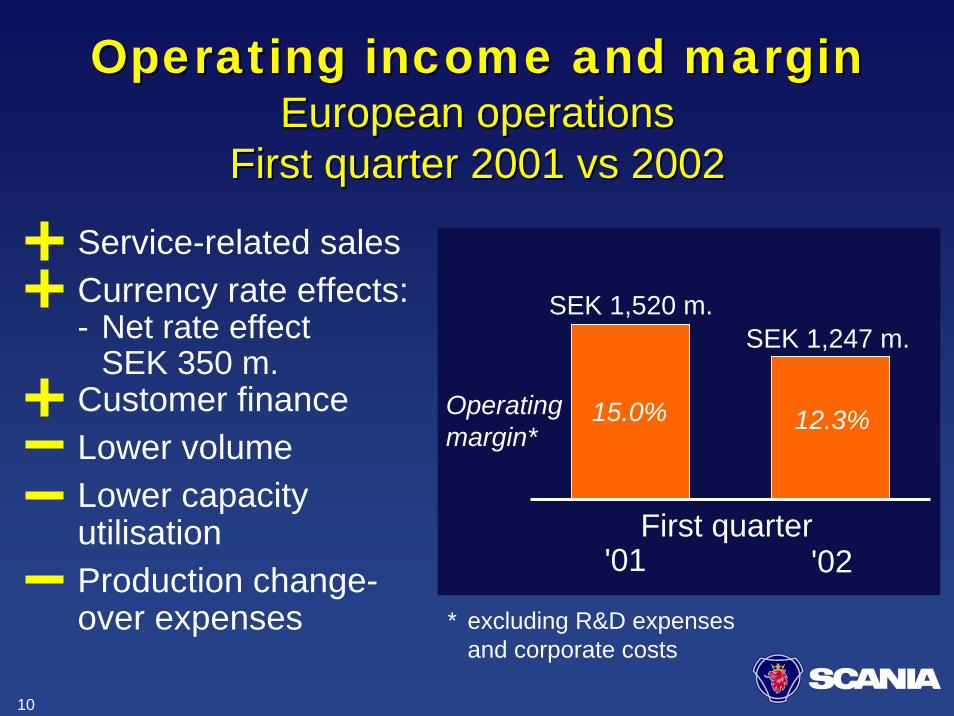
Service-related sales Currency rate effects:- Net rate effect
SEK 350 m.Customer financeLower volumeLower capacityutilisationProduction change-over expenses
Operating income and marginOperating income and marginEuropean operationsEuropean operations
First quarter 2001 vs 2002First quarter 2001 vs 2002
SEK 1,520 m.SEK 1,247 m.
Operating margin*
15.0% 12.3%
'01 '02First quarter
* excluding R&D expenses and corporate costs

11
Mercedes 18.2 19.0
Scania 14.3 14.7
RVI 13.6 14.0
DAF 11.7 13.6
Volvo 15.4 13.2
MAN 13.9 12.2
Iveco 9.7 10.6
CompetitionCompetitionWestern EuropeWestern Europe
Jan-Feb '01 Jan-Feb '02Make Market share Market share Trend
12
0
500
1,000
1,500
2,000
2,500
Q1 Q2 Q3 Q4 Q1 Q2 Q3 Q4 Q1 Q2 Q3 Q4 Q1 Q2 Q3 Q4 Q1
Units
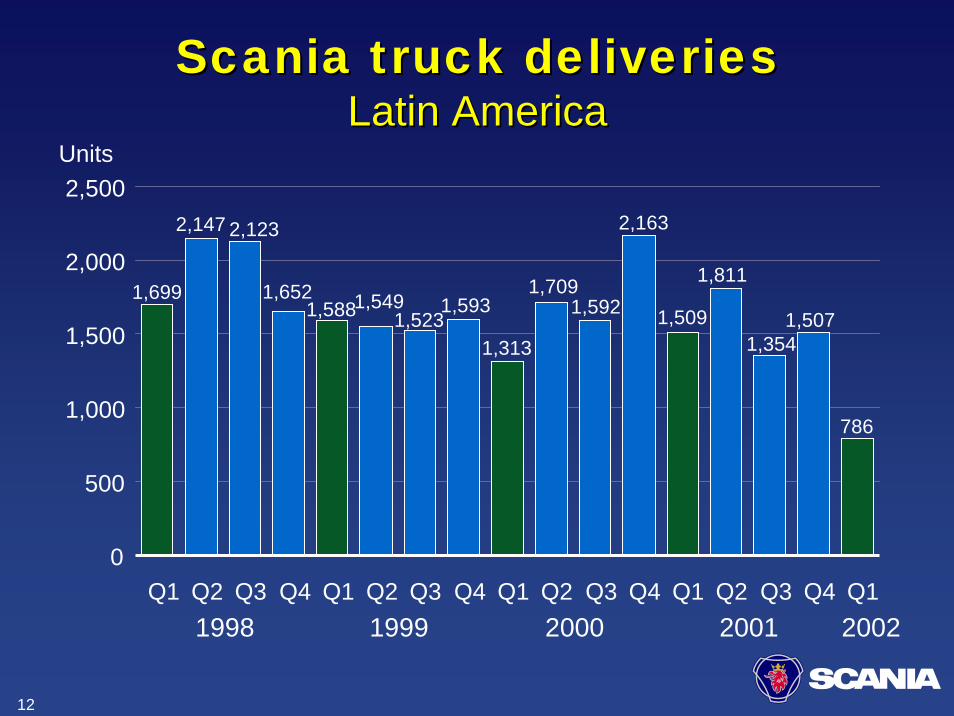
Scania truck deliveriesScania truck deliveriesLatin AmericaLatin America
1998 1999
1,699
2,147 2,123
1,6521,5881,549
1,5231,593
1,313
2000
1,7091,592
2,163
1,509
2001
1,811
1,3541,507
2002
786

13
Operating incomeOperating incomeLatin American operationsLatin American operationsFirst quarter 2001 vs 2002First quarter 2001 vs 2002
SEK -36 m. SEK -58 m.
Increased pricesCost savingsVolume
'01 '02First quarter

14
Mercedes 26.9 28.3
Volvo 22.9 22.4
Scania 29.1 17.6
Volkswagen 7.5 12.8
Iveco 5.2 8.9
Ford 7.4 8.3
International 1.1 1.7
CompetitionCompetitionBrazilBrazil
Jan-Mar '01 Jan-Mar '02Make Market share Market share Trend
15
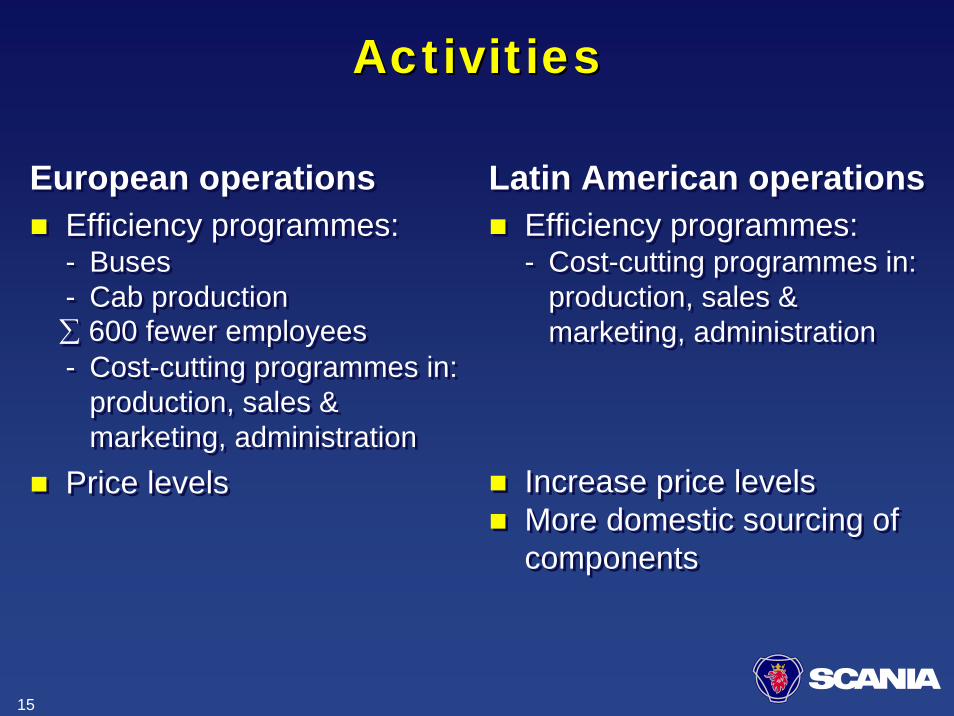
ActivitiesActivities
European operationsEfficiency programmes:- Buses - Cab production
- Cost-cutting programmes in:production, sales &marketing, administration
Price levels
European operationsEfficiency programmes:- Buses - Cab production
- Cost-cutting programmes in:production, sales &marketing, administration
Price levels
Latin American operationsLatin American operations
∑ 600 fewer employees∑ 600 fewer employees
Efficiency programmes:- Cost-cutting programmes in:
production, sales &marketing, administration
Increase price levels More domestic sourcing of components
Efficiency programmes:- Cost-cutting programmes in:
production, sales &marketing, administration
Increase price levels More domestic sourcing of components

16
Operating income (EBIT) SEK 770 m. (952)EBIT margin for Scania products 6.6%Lower truck deliveries (-16%)Higher bus deliveries (+9%)Positive trend in service sales and customer financePositive currency rate effectsCost-cutting and adjustment programmes in both European and Latin American operations continue
Operating income (EBIT) SEK 770 m. (952)EBIT margin for Scania products 6.6%Lower truck deliveries (-16%)Higher bus deliveries (+9%)Positive trend in service sales and customer financePositive currency rate effectsCost-cutting and adjustment programmes in both European and Latin American operations continue
Summing up Summing up First quarter 2002First quarter 2002

17
Svenska Svenska Volkswagen AB and Volkswagen AB and Din Din Bil Sverige Bil Sverige ABAB
Both sold to Volkswagen AGImporting/distributing VW, Audi, Seat, Skoda and Porsche to SwedenCars – consumer productsTrucks – investment productsSvenska Volkswagen divested for SEK 870 m. and Din Bil for SEK 450 m.Scania’s profit approximately SEK 550 m.
Both sold to Volkswagen AGImporting/distributing VW, Audi, Seat, Skoda and Porsche to SwedenCars – consumer productsTrucks – investment productsSvenska Volkswagen divested for SEK 870 m. and Din Bil for SEK 450 m.Scania’s profit approximately SEK 550 m.

18
Scania and Hino form business alliance
Scania and Hino Scania and Hino form business allianceform business alliance
Leverage Scania’s and Hino’s complementary market presence and product ranges
Pilot introduction of Scania tractor units in Japan
Evaluation of potential use of Hino 7/8-litre engines in Scania vehicles
Exchange of know-how regarding emission control technology
Leverage Scania’s and Hino’s complementary market presence and product ranges
Pilot introduction of Scania tractor units in Japan
Evaluation of potential use of Hino 7/8-litre engines in Scania vehicles
Exchange of know-how regarding emission control technology

19
Concentration of– cab body welding (1996): from Meppel to Oskarshamn– 6-cylinder engine production (1999): from Zwolle to Södertälje– axle production (1999-2000): from Zwolle to Falun– 8-cylinder engine production (2001): from Zwolle to Södertälje– cab production (2002): from Meppel to Oskarshamn– development, production development and production of bus
chassis: from Katrineholm to Södertälje– development, production development and production of bus
bodies: in Katrineholm– side-member process (2003): from Zwolle and Södertälje to
Luleå
StructureStructureEuropean production system

For Demanding PeopleFor Demanding PeopleFor Demanding People