Embed Size (px)
Citation preview


Salary $1,000,000
After Taxes
$750,000
Monthly Income
$62,500
Total Monthly Payments
$13,462.67
Income Left $49,037.33

Location: 470 NE 51 Street (Morningside) Miami FL 33137
Bedrooms: 3Bathrooms: 3
Features: Built-Ins AwningsFireplace BarbequeFrench Doors Wood DeckingWalk-In Closets FencePantry Exterior LightningSplit Bedroom Pool
Price: $629,000

Price: $248,000Location: 5128 WHISPER LAKE AV () Las Vegas NV 89101
Bedrooms: 5Bathrooms: 3Features:
Built-In Bookcases, Downstairs, Separate Family Room Formal Dining Room Construction: Frame & Stucco Vaulted Ceiling, Entry Foyer, Formal Carpet, Tile Granite Countertops, Island, Marble/Stone Flooring Mirrored Door Closet, Mbr Walk-In Closet Pool Type: Inground-Private, Solar Heated, Waterfall

Price:$150,000Location: 8026 SPRING CREEK DRIVEKISSIMMEE, FL 34747
Bedrooms: 3Bathrooms: 2
Features:Air Conditioning Dishwasher Washer and Dryer Microwave Oven Walk-in Closets Pool

Price: $57,475
Mileage: 12 Miles Engine: GDI DOHC
Body Style: SUV Transmission: AUTO 6SPDExterior Color: Black Drivertrain: AWDInterior Color: Black Doors: 4

Price: $40,841
Mileage: N/A Engine: 3.5L V6Body Style: SUV Drivetrain: AWDExterior Color: Blue Slate Doors: 4Interior Color: Graphite Wheelbase: 114 inches

Interest
Taxes
Loan Term
Sale Value
Monthly Payment
Total InterestPaid
Total Taxes Paid
Total Payment
Miami House
5% 5% 30 years
$629,000
$5,997.44 $586,578.88
$943,500.00
$2,159,078.88
Las Vegas House
7% 5% 30 years
$248,000
$2,683.28
$345,982.07
$372,000.00
$965,982.07
Orlando House
10% 3% 10 years
$150,000
$2,357.26
$87,871.33
$45,000.00
$282,871.33
Audi Q7
11% 3% 5 years
$57, 475
$1,393.33
$17,503.75
$8,621.25
$83,600.00
Infinity FX35
13% 3% 5 years
$40, 841
$1,031.36
$14,914.50
$6,126.15
$61,881.65
Total $1,125,316
$13,462.67
$1,052,850.53
$1,375,247.4
$3,553,413.93
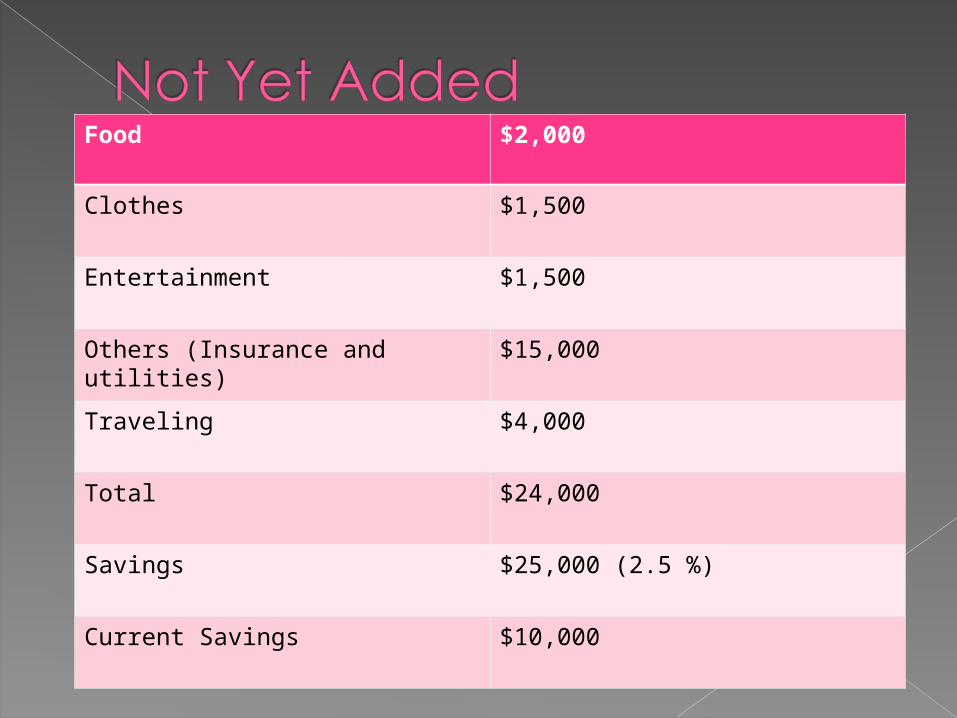
Food $2,000
Clothes $1,500
Entertainment $1,500
Others (Insurance and utilities) $15,000
Traveling $4,000
Total $24,000
Savings $25,000 (2.5 %)
Current Savings $10,000


Amortization Schedule Year Interest Principal Balance 2010
$13,405.85 $8,399.02 $141,600.98 2011 $13,706.37 $10,080.76 $131,520.21 2012 $12,650.78 $11,136.35 $120,383.86 2013 $11,484.66 $12,302.47 $108,081.39 2014 $10,196.43 $13,590.70 $94,490.69 2015 $8,773.31 $15,013.83 $79,476.86 2016 $7,201.16 $16,585.97 $62,890.89 2017 $5,464.39 $18,322.74 $44,568.15 2018 $3,545.76 $20,241.37 $24,326.78 2019 $1,426.23 $22,360.90 $1,965.88 2020 $16.38 $1,965.88 $0.00

Amortization Schedule Month Interest Principal Balance Feb, 2010 $1,250.00 $732.26 $149,267.74 Mar, 2010 $1,243.90 $738.36 $148,529.38 Apr,
2010 $1,237.74 $744.52 $147,784.86 May, 2010 $1,231.54 $750.72 $147,034.14 Jun, 2010 $1,225.28 $756.98 $146,277.16 Jul, 2010 $1,218.98 $763.28 $145,513.88 Aug, 2010 $1,212.62 $769.65 $144,744.23 Sep, 2010 $1,206.20 $776.06 $143,968.17 Oct, 2010 $1,199.73 $782.53 $143,185.65 Nov, 2010 $1,193.21 $789.05 $142,396.60 Dec, 2010 $1,186.64 $795.62 $141,600.98 Jan, 2011 $1,180.01 $802.25 $140,798.72 Feb, 2011 $1,173.32 $808.94 $139,989.79 Mar, 2011 $1,166.58 $815.68 $139,174.11 Apr, 2011 $1,159.78 $822.48 $138,351.63 May, 2011 $1,152.93 $829.33 $137,522.30 Jun, 2011 $1,146.02 $836.24 $136,686.06 Jul, 2011 $1,139.05 $843.21 $135,842.85 Aug, 2011 $1,132.02 $850.24 $134,992.61 Sep, 2011 $1,124.94 $857.32 $134,135.29 Oct, 2011 $1,117.79 $864.47 $133,270.82 Nov, 2011 $1,110.59 $871.67 $132,399.15 Dec, 2011 $1,103.33 $878.93 $131,520.21 Jan, 2012 $1,096.00 $886.26 $130,633.95 Feb, 2012 $1,088.62 $893.64 $129,740.31 Mar, 2012 $1,081.17 $901.09 $128,839.22 Apr, 2012 $1,073.66 $908.60 $127,930.62 May, 2012 $1,066.09 $916.17 $127,014.44 Jun, 2012 $1,058.45 $923.81 $126,090.64 Jul, 2012 $1,050.76 $931.51 $125,159.13 Aug, 2012 $1,042.99 $939.27 $124,219.86 Sep, 2012 $1,035.17 $947.10 $123,272.77 Oct, 2012 $1,027.27 $954.99 $122,317.78 Nov, 2012 $1,019.31 $962.95 $121,354.83 Dec, 2012 $1,011.29 $970.97 $120,383.86 Jan, 2013 $1,003.20 $979.06 $119,404.80 Feb, 2013 $995.04 $987.22 $118,417.58 Mar, 2013 $986.81 $995.45 $117,422.13 Apr, 2013 $978.52 $1,003.74 $116,418.39 May, 2013 $970.15 $1,012.11 $115,406.28 Jun, 2013 $961.72 $1,020.54 $114,385.74 Jul, 2013 $953.21 $1,029.05 $113,356.69 Aug, 2013 $944.64 $1,037.62 $112,319.07 Sep, 2013 $935.99 $1,046.27 $111,272.80 Oct, 2013 $927.27 $1,054.99 $110,217.81 Nov, 2013 $918.48 $1,063.78 $109,154.03 Dec, 2013 $909.62 $1,072.64 $108,081.39 Jan, 2014 $900.68 $1,081.58 $106,999.81 Feb, 2014 $891.67 $1,090.60 $105,909.21 Mar, 2014 $882.58 $1,099.68 $104,809.53 Apr, 2014 $873.41 $1,108.85 $103,700.68 May, 2014 $864.17 $1,118.09 $102,582.59 Jun, 2014 $854.85 $1,127.41 $101,455.18 Jul, 2014 $845.46 $1,136.80 $100,318.38 Aug, 2014 $835.99 $1,146.27 $99,172.11 Sep, 2014 $826.43 $1,155.83 $98,016.28 Oct, 2014 $816.80 $1,165.46 $96,850.82 Nov, 2014 $807.09 $1,175.17 $95,675.65 Dec, 2014 $797.30 $1,184.96 $94,490.69 Jan, 2015 $787.42 $1,194.84 $93,295.85 Feb, 2015 $777.47 $1,204.80 $92,091.05 Mar, 2015 $767.43 $1,214.84 $90,876.22 Apr, 2015 $757.30 $1,224.96 $89,651.26 May, 2015 $747.09 $1,235.17 $88,416.09 Jun, 2015 $736.80 $1,245.46 $87,170.63 Jul, 2015 $726.42 $1,255.84 $85,914.79 Aug, 2015 $715.96 $1,266.30 $84,648.49 Sep, 2015 $705.40 $1,276.86 $83,371.63 Oct, 2015 $694.76 $1,287.50 $82,084.13 Nov, 2015 $684.03 $1,298.23 $80,785.91 Dec, 2015 $673.22 $1,309.05 $79,476.86 Jan, 2016 $662.31 $1,319.95 $78,156.91 Feb, 2016 $651.31 $1,330.95 $76,825.95 Mar, 2016 $640.22 $1,342.04 $75,483.91 Apr, 2016 $629.03 $1,353.23 $74,130.68 May, 2016 $617.76 $1,364.51 $72,766.17 Jun, 2016 $606.38 $1,375.88 $71,390.30 Jul, 2016 $594.92 $1,387.34 $70,002.96 Aug, 2016 $583.36 $1,398.90 $68,604.05 Sep, 2016 $571.70 $1,410.56 $67,193.49 Oct, 2016 $559.95 $1,422.32 $65,771.18 Nov, 2016 $548.09 $1,434.17 $64,337.01 Dec, 2016 $536.14 $1,446.12 $62,890.89 Jan, 2017 $524.09 $1,458.17 $61,432.72 Feb, 2017 $511.94 $1,470.32 $59,962.40 Mar, 2017 $499.69 $1,482.57 $58,479.82 Apr, 2017 $487.33 $1,494.93 $56,984.89 May, 2017 $474.87 $1,507.39 $55,477.51 Jun, 2017 $462.31 $1,519.95 $53,957.56 Jul, 2017 $449.65 $1,532.61 $52,424.94 Aug, 2017 $436.87 $1,545.39 $50,879.56 Sep, 2017 $424.00 $1,558.26 $49,321.29 Oct, 2017 $411.01 $1,571.25 $47,750.04 Nov, 2017 $397.92 $1,584.34 $46,165.70 Dec, 2017 $384.71 $1,597.55 $44,568.15 Jan, 2018 $371.40 $1,610.86 $42,957.29 Feb, 2018 $357.98 $1,624.28 $41,333.01 Mar, 2018 $344.44 $1,637.82 $39,695.19 Apr, 2018 $330.79 $1,651.47 $38,043.72 May, 2018 $317.03 $1,665.23 $36,378.49 Jun, 2018 $303.15 $1,679.11 $34,699.38 Jul, 2018 $289.16 $1,693.10 $33,006.28 Aug, 2018 $275.05 $1,707.21 $31,299.08 Sep, 2018 $260.83 $1,721.44 $29,577.64 Oct, 2018 $246.48 $1,735.78 $27,841.86 Nov, 2018 $232.02 $1,750.25 $26,091.61 Dec, 2018 $217.43 $1,764.83 $24,326.78 Jan, 2019 $202.72 $1,779.54 $22,547.25 Feb, 2019 $187.89 $1,794.37 $20,752.88 Mar, 2019 $172.94 $1,809.32 $18,943.56 Apr, 2019 $157.86 $1,824.40 $17,119.16 May, 2019 $142.66 $1,839.60 $15,279.56 Jun, 2019 $127.33 $1,854.93 $13,424.63 Jul, 2019 $111.87 $1,870.39 $11,554.24 Aug, 2019 $96.29 $1,885.98 $9,668.26 Sep, 2019 $80.57 $1,901.69 $7,766.57 Oct, 2019 $64.72 $1,917.54 $5,849.03 Nov, 2019 $48.74 $1,933.52 $3,915.51 Dec, 2019 $32.63 $1,949.63 $1,965.88 Jan, 2020 $16.38 $1,965.88 $0.00