Embed Size (px)
Citation preview

BondAdviser | Fixed Income Advisory and Research Market Review: September 2021
1 1
11 October 2021
Fixed Income Research
Monthly Review: September 2021
Overview • September saw volatility return to financial markets, largely catalysed by the crisis
in Chinese real estate markets, with developer and conglomerate Evergrande
seemingly the first to fall. This was especially prevalent in equity markets, with the
ASX total return index recording its first negative month since August 2020. The VIX
spiked to as high as 26 from 16 at the start of the month. Bond markets also suffered
as the curve steepened, however AT1 hybrids continued its streak of steady gains.
• In our Strategy section, we analyse what we expect to be a shifting tide for the
Australian housing market.
• In the Banks and Financials section we look at the impacts of APRA phasing out its
Committed Liquidity Facility, macro-prudential measures, Australian Unity’s FY21
result and earnings guidance from Macquarie Group.
• The Corporates section analyses two new high-yield issuances, MoneyMe’s early
redemption of its HoldCo Secured Notes, along with the changes underfoot at
Centuria and Ampol.
Figure 1. YTD Domestic Performance
Source: BondAdviser, Bloomberg. As at 30 September 2021.
950
970
990
1010
1030
1050
1070
1090
1110
1130
1150
1170
1190
31
-De
c
31
-Ja
n
28
-Fe
b
31
-Ma
r
30
-Apr
31
-Ma
y
30
-Ju
n
31
-Ju
l
31
-Aug
30
-Sep
AusBond Credit Index S&P/ASX200 Accumulation Index
AusBond Government Index BondAdviser AU AT1 Index
BondAdviser AU T2 Index
John Likos, CFA Director
(+61) 2 9159 0746 [email protected]
Charlie Callan Associate Director
(+61) 3 8319 5726 [email protected]
Ravi Reddy Analyst
(+61) 2 9159 0747 [email protected]
George Osti Analyst
(+61) 3 8319 5727 [email protected]
Ben Haseler Analyst
(+61) 3 8319 5728 [email protected]
Nicholas Trotter Analyst
(+61) 3 9670 8615 [email protected]

BondAdviser | Fixed Income Advisory and Research Market Review: September 2021 2
Performance
Market Indices
September was a rocky month for financial markets, bringing the rosy, volatility-free
environment for equities in 2021 to a crashing halt. The VIX, a measure of volatility in
US equity markets, gapped upwards as a result of Evergrande Group, a Chinese
property developer, which has failed to make interest payments on its USD bonds.
Equities were not the only markets impacted as a large sell off, especially in junk USD
denominated bonds from Chinese issuers, triggered a global spike in yields.
Our four AusBond indices (see Figure 2) all suffered losses, with the duration-less FRNs
faring better than the hard-hit AusBond Gov Index. Our T2 index recorded another
somewhat flat month, down 0.03% on 31 August levels. BondAdviser’s AT1 index was
the only positive performer in this tumultuous month of unknowns, rising 0.85% for
September.
Figure 2. Monthly Performance - Key Indices
Source: BondAdviser, Bloomberg.
Security Performance
With relatively strong and more importantly, stable performance in the AT1 index during
a month of market-wide contagion, there were some standout securities. The majority of
hybrids went somewhat unchanged for the month of September, with a select few driving
the strong gains for the month. ~70% of our hybrid coverage universe had a monthly
change in margin of less than 0.50%. CBAPE was the standout, tightening by 2.93%,
however this was a function of the security’s maturity date fast approaching (15 October
2021). OBLHA also had a positive month, tightening 1.35%. At the other end, PPCHB
was notable, widening 1.53% by the end of the month, finishing at par ($100.00) after
very slowly repricing downwards from $104.95 post its ex-distribution date of 24
September. As at close on October 6 the price was $100.00. We use this case as an
opportunity to caution investors from buying thinly traded securities in times where some
downward pressure may still be present due to liquidity issues.
-1.85%-1.68%
-1.51%
-0.79%
-0.06% -0.03%
0.85%
-2.50%
-1.50%
-0.50%
0.50%
1.50%

BondAdviser | Fixed Income Advisory and Research Market Review: September 2021 3
Strategy
That’s a nice haircut. Did you do it yourself?
The title of this piece modifies a quote from Michael Burry in the film adaptation of
Micheal Lewis’ novel ‘The Big Short’. Whilst it ties in nicely with the current lockdown
environment, it also ties in with residential housing. We are not housing experts but
sense the tide is turning. We also sense that with appropriate policy measures, there is
no cause for alarm – the alternative is a Miami housing estate and/or Japanification, so
credit investors need to remain vigilant.
Quarter Acre Block a Pipe Dream
We are not at all surprised that record low interest rates have spurred the domestic
housing market forward in 2021. Leaving the hyperbole of anecdotes outside, Australia’s
property prices have been controversial for some time, perhaps because it is easy for
the lay person to grasp the tangible effect of the compounded annual growth rate. For
some, it is a wealth effect, for others, unaffordability.
Since 2004, the ABS Residential Property Price Index has returned a geometric average
of 5.11% p.a. The ASX 200, on a price basis, has only managed 4.60% p.a. over the
same period - noting this is just analysing price, no yield, taxes, dividend return or
reinvestment is factored. It should also be unsurprising to relate such a steady increase
in housing prices, to a base interest rate that has been steadily trending downwards
since the early nineties. When interest rates fall, so do interest repayments, which means
that serviceability increases, allowing mortgagees to borrow more. Interest rates are the
biggest driver of housing prices.
Figure 3: Australian Residential Property Price Index
Source: BondAdviser ABS. As at 30 June 2021.
The explosion in housing prices in 2021 has unnerved many, including bankers at the
coal face. The most notable canaries being the CEOs at CBA and ANZ, both having
publicly opined that housing prices have run too hard.
In September, APRA released data that confirmed the shift in housing market dynamics,
which we have warned about on numerous occasions. Between 2014 and 2017 APRA,
through macro-prudential measures, targeted investor and interest only loans, and
subsequently, as seen in Figure 4, between 2017-2020 first home buyers (FHBs) have
made up an increasingly larger proportion of new home loans. Such trend has reversed
in 2021, with investor loan commitments showing a rapid take-up that is commensurate
in the fall in FHB proportions. A cursory analysis here suggests that FHBs are again
-15%
-10%
-5%
0%
5%
10%
15%
20%
25%
30%
0
20
40
60
80
100
120
140
160
180
Resi Price Index YOY Chg (RHS)
BondAdviser | Fixed Income Advisory and Research Market Review: September 2021 4
being squeezed out of ownership by speculators. This is politically unsustainable and
does not carry favour with regulators.
In late-September, Federal Treasurer Josh Frydenberg suggested macro-prudential
measures were being considered by the Council of Financial Regulators (CFR) to reduce
potential financial risks in the banking system from rising residential property prices.
Around the same time, in a speech, RBA Assistant Governor Michele Bullock also
pointed at the risks pertaining to bank and household balance sheets from the sharp rise
in property prices and associated growth in lending. While she acknowledged the
strength of bank balance sheets and maintenance of lending standards, she noted that
risks to financial stability could be building. The matter was addressed by the CFR at its
September 2021 quarter meeting with APRA being handed the task to publish an
information paper in the next few months on the framework for implementing
macroprudential policy.
Figure 4: New Home Loan Commitments (ex-refinance) Mix
Source: BondAdviser, RBA. As at 31 August 2021.
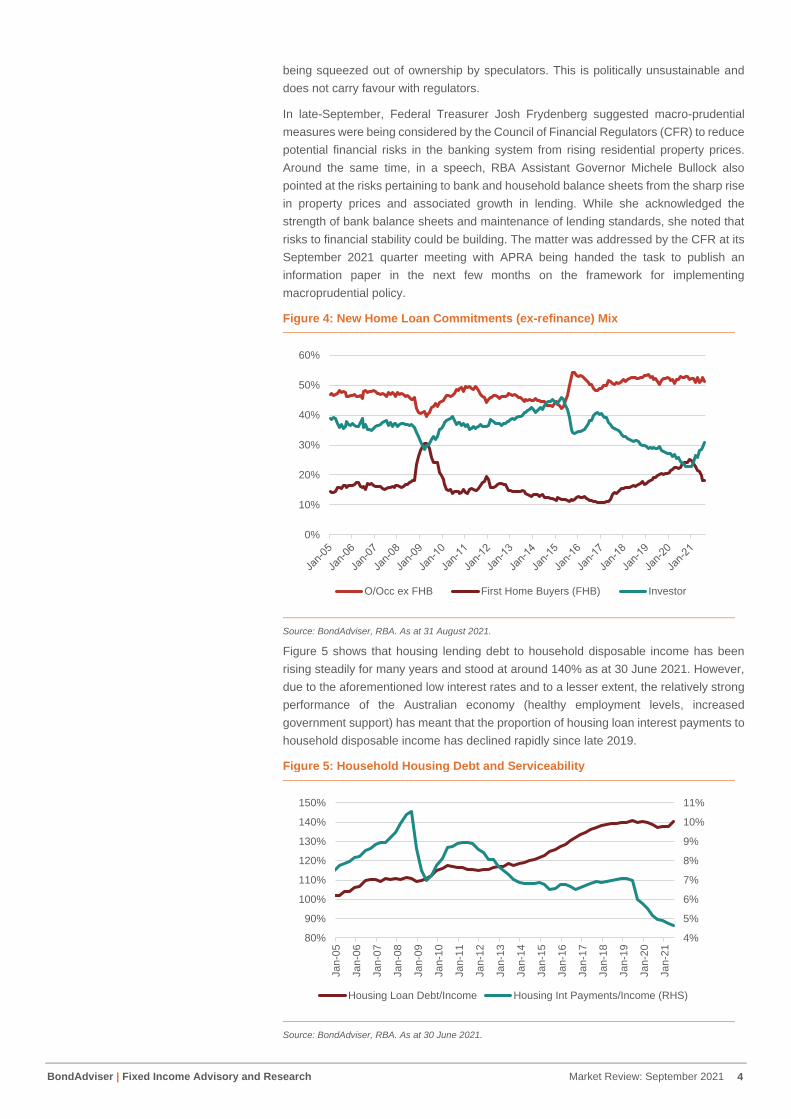
Figure 5 shows that housing lending debt to household disposable income has been
rising steadily for many years and stood at around 140% as at 30 June 2021. However,
due to the aforementioned low interest rates and to a lesser extent, the relatively strong
performance of the Australian economy (healthy employment levels, increased
government support) has meant that the proportion of housing loan interest payments to
household disposable income has declined rapidly since late 2019.
Figure 5: Household Housing Debt and Serviceability
Source: BondAdviser, RBA. As at 30 June 2021.
0%
10%
20%
30%
40%
50%
60%
O/Occ ex FHB First Home Buyers (FHB) Investor
4%
5%
6%
7%
8%
9%
10%
11%
80%
90%
100%
110%
120%
130%
140%
150%
Jan-0
5
Jan-0
6
Jan-0
7
Jan-0
8
Jan-0
9
Jan-1
0
Jan-1
1
Jan-1
2
Jan-1
3
Jan-1
4
Jan-1
5
Jan-1
6
Jan-1
7
Jan-1
8
Jan-1
9
Jan-2
0
Jan-2
1
Housing Loan Debt/Income Housing Int Payments/Income (RHS)

BondAdviser | Fixed Income Advisory and Research Market Review: September 2021 5
Figure 6. ADIs’ New Housing Loans - Debt to Income Ratio
Source: BondAdviser, APRA. As at 30 June 2021.
As illustrated in Figure 6, it is alarming that new loans are being granted to property
buyers with increasingly higher levels of debt relative to the purchaser’s income. Over
the June 2021 quarter, 21.4% of new loans were at least 6x the size of the borrower’s
income. As seen in Figure x, this metric has been on an exponential trajectory over the
past year especially, with the June 2020 quarter at 15.6%.
Another cause for alarm is fraud rates. According to an annual UBS survey (n=900),
41% of those that took out a mortgage over the past year submitted a factually inaccurate
loan application. In the seven years UBS has been conducting this survey on Australians,
it has never recorded such a high reading. Whilst the majority of those that provided an
inaccurate application stated the application was “mostly factual and accurate”, around
a third said the application was only “partially factual and accurate” – this was another
record. Regardless of asset class, an increase in fraud is one of the tell-tale signs of
mania. Chasing the market and falsely stretching one’s capacity limit to ensure
qualification is not sustainable and should be stamped out quickly.
Following the Treasurers speech, on 6 October, APRA surprised many by announcing
an increase in the loan serviceability buffer from 2.50% to 3.00% above the actual
mortgage interest rate that ADI’s use to assess a borrower’s ability to meet interest
repayment commitments. The impact is likely to be modest with the regulator estimating
it will reduce the borrowing capacity of the typical borrower by around 5%. More
substantial measures remain a possibility. We see this move as a signal of further action
to come, APRA’s announcement alone will not de-risk the real estate sector – in many
ways it just lowers the price-based searching criteria for property buyers. Further hard
hitting is needed, albeit gradually, as given the leverage in the system, unwinding is a
tight-rope exercise.
Macro-prudential policies have been introduced in New Zealand, with the RBNZ
reinstating LVR restrictions on home lending in February. However, it has not
significantly slowed the price growth. LVR restrictions were tightened for investor loans
in May and changes for owner occupiers come into effect in November: the 5% limit of
new lending to investors that can be at LVR’s above 60% remains while only 10%
(currently 20%) of new lending to owner occupiers can be at LVR’s greater than 80%.
For the banks, from a credit perspective we are unconcerned, however macro-prudential
tailwinds will take some steam out of earnings growth. The market environment also
stalls the likelihood of scrapping the Responsible Lending laws, as it would appear
without cause (given the boom in prices and credit) and politically unpalatable.
14%
16%
18%
20%
22%
$0b
$20b
$40b
$60b
$80b
$100b
$120b
$140b
$160b
Mar-19 Jun-19 Sep-19 Dec-19 Mar-20 Jun-20 Sep-20 Dec-20 Mar-21 Jun-21
Debt : Income < 4x Debt : Income ≥ 4x < 6x
Debt : Income ≥ 6x Debt : Income ≥ 6x % New Loans (RHS)
BondAdviser | Fixed Income Advisory and Research Market Review: September 2021 6
Banks & Financials
APRA Phases out CLF
On 10 September 2021, APRA announced that commencing 2022, it will start phasing
out the use of the RBA’s Committed Lending Facility (CLF) by ADIs to help meet their
prudential liquidity requirements (as measured by the Liquidity Coverage Ratio, “LCR”)
to zero by the end of 2022. This change was a not a surprise to us, albeit the speed of
phasing out was quicker than expected. We first opined that the excess of liquidity in the
banking sector should be used to support lower yields in January.
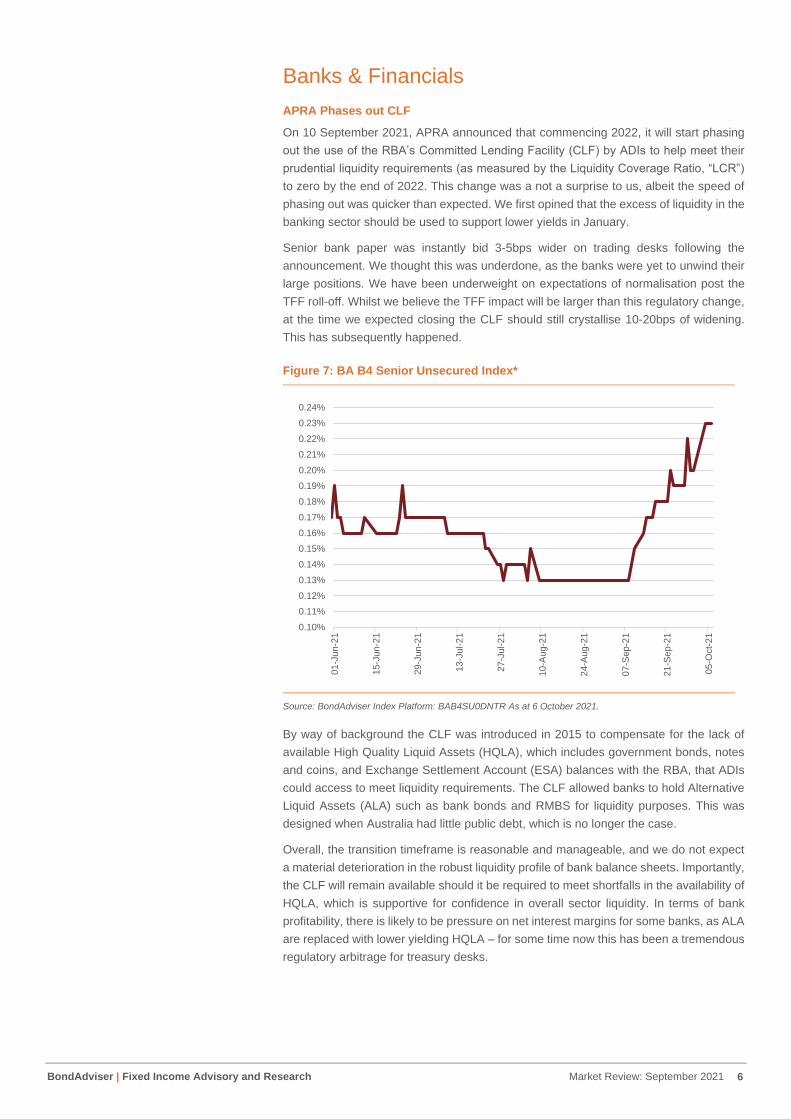
Senior bank paper was instantly bid 3-5bps wider on trading desks following the
announcement. We thought this was underdone, as the banks were yet to unwind their
large positions. We have been underweight on expectations of normalisation post the
TFF roll-off. Whilst we believe the TFF impact will be larger than this regulatory change,
at the time we expected closing the CLF should still crystallise 10-20bps of widening.
This has subsequently happened.
Figure 7: BA B4 Senior Unsecured Index*
Source: BondAdviser Index Platform: BAB4SU0DNTR As at 6 October 2021.
By way of background the CLF was introduced in 2015 to compensate for the lack of
available High Quality Liquid Assets (HQLA), which includes government bonds, notes
and coins, and Exchange Settlement Account (ESA) balances with the RBA, that ADIs
could access to meet liquidity requirements. The CLF allowed banks to hold Alternative
Liquid Assets (ALA) such as bank bonds and RMBS for liquidity purposes. This was
designed when Australia had little public debt, which is no longer the case.
Overall, the transition timeframe is reasonable and manageable, and we do not expect
a material deterioration in the robust liquidity profile of bank balance sheets. Importantly,
the CLF will remain available should it be required to meet shortfalls in the availability of
HQLA, which is supportive for confidence in overall sector liquidity. In terms of bank
profitability, there is likely to be pressure on net interest margins for some banks, as ALA
are replaced with lower yielding HQLA – for some time now this has been a tremendous
regulatory arbitrage for treasury desks.
0.10%
0.11%
0.12%
0.13%
0.14%
0.15%
0.16%
0.17%
0.18%
0.19%
0.20%
0.21%
0.22%
0.23%
0.24%
01
-Ju
n-2
1
15
-Ju
n-2
1
29
-Ju
n-2
1
13
-Ju
l-2
1
27
-Ju
l-2
1
10
-Aug
-21
24
-Aug
-21
07
-Sep
-21
21-S
ep
-21
05
-Oct-
21

BondAdviser | Fixed Income Advisory and Research Market Review: September 2021 7
Figure 8: B4 LCR
Source: BondAdviser, Company Reports.
The Big Four held $127 billion in average ALAs over the June 2021 quarter. Based on
their respective positions, this suggests all the major banks except ANZ would need to
replace ALA with HQLA. ANZ is the best placed, having already reduced its reliance on
the CLF. NAB would have met the 100% minimum LCR requirement solely with HQLA,
but the majors will need to continue to hold a healthy buffer above the minimum - though
possibly not as elevated as the current average LCR of around 130%.
Plummeting Iron Ore Price Puts Pressure on Fiscal Position
The slump in iron ore prices due to growing cuts in Chinese steel production has been
further impacted by weaker confidence in expected demand for steel from the property
construction sector as result of the Evergrande crisis. The spot price fell from ~U$229
per tonne in May 2021 to just under US$100 per tonne in mid-September and is now
above US$115.
Figure 9: Spot Iron Ore
Source: BondAdviser, Bloomberg. As at 28 September 2021.
$210B
$128B$143B
$123B
$10B
$44B
$38B
$36B
135%129% 129% 127%
0%
20%
40%
60%
80%
100%
120%
140%
$30B
$60B
$90B
$120B
$150B
$180B
$210B
$240B
ANZ CBA NAB WBC
100% Minimum (RHS) HQLA
ALA RBNZ
LCR % (RHS) LCR % HQLA Only (RHS)
US$75/T
US$100/T
US$125/T
US$150/T
US$175/T
US$200/T
US$225/T
US$250/T
Se
p-2
0
Oct-
20
No
v-2
0
De
c-2
0
Ja
n-2
1
Fe
b-2
1
Ma
r-2
1
Ap
r-2
1
Ma
y-2
1
Ju
n-2
1
Ju
l-2
1
Aug
-21

BondAdviser | Fixed Income Advisory and Research Market Review: September 2021 8
This will hurt the pace of Australia’s economic recovery, which has already been dented
by recent extended lockdowns, and consequently places pressure on the Federal budget
deficit. According to the 2021-22 Federal Budget Papers, a US $10 per tonne fall in the
iron price will reduce FY22 GDP by ~$6.5 billion and tax receipts ~$1.3 billion. However,
the iron ore price is still above the US$55 per tonne forecast by the end of the March
2022 quarter in the Budget.
A weaker budget position could put Australia’s sovereign credit rating at risk. We see
this risk being somewhat underappreciated in the current environment. Any changes to
the sovereign rating will also impact the ratings of the Major Banks and Macquarie Bank
as they assume government support. We note S&P upgraded Australia’s credit rating
outlook from Negative to Stable in early June 2021, given the better than expected
economic recovery and fiscal outlook, but S&P has assumed a slower pace of decline in
the iron ore price than Government forecasts.
Loan Deferrals on the Rise
APRA data to 31 August 2021 showed that $11.9 billion worth of loans were in temporary
loan repayment deferral arrangements representing 0.5% of total loans outstanding, up
from $5.6 billion at the end of July. Housing loans comprised $11.9 billion (0.7% of total
home loans) with the remaining balance, $765 million, in SME loans (0.3% of total SME
loans). Given the extended lockdown in Sydney, it is no surprise NSW had the highest
proportion of loans subject to deferral, at 1.4% per. According to the Australian Banking
Association, as at 5 September 2021 NSW made up the bulk of all deferrals by number
– 69% of home loans and 72% of business loans.
This is well below the peak of above $250 billion of loans subject to deferral in 2020, but
with parts of Australian still in lockdown, we expect these numbers will rise. Importantly
though, we believe the banks are well placed to cope with any higher impairments as a
result of these lockdowns, given strong CET1 levels and loss provisions being held
above pre-pandemic levels despite some unwinding that has occurred this year.
Changes in the Australian LMI Landscape
Westpac (ASX: WBC) has completed the $350m sale of Westpac Lenders Mortgage
Insurance to Arch Capital Group. The sale is consistent with the Bank’s strategy of
focussing on its core business. This will increase CET1 capital by ~7bps. WBC’s pro-
forma CET1 as at 30 June 2021 was 12.5% post announced and completed asset sales,
placing it well above the unquestionably strong benchmark of 10.5%. WBC is the only
one of the Big Four that has not announced capital management initiatives, though at
the 3Q21 update the potential of a buy-back was raised, with a decision likely to be
revealed at the FY21 results in November 2021.
There is more competitive tension in the LMI market now with the recent entry of Arch
Capital. QBE Insurance Group (ASX: QBE) and Genworth Financial Mortgage Insurance
(ASX: GMA) are the other two players. We expect Arch Capital will be looking to bulk up
its LMI insurance book and as such is likely to be a keen bidder for Commonwealth
Bank’s LMI contract. The contract is currently with Genworth and expires at the end of
December 2022. The potential loss of this contract is a key earnings risk for Genworth
as it represented 57% of FY20 gross written premium. Wholesale and institutional
subscribers can click here for our research on Genworth Subordinated Notes II.
AYU FY21 Result – Credit Positive
We maintained a Stable view on Australian Unity’s (ASX: AYU) credit outlook after the
FY21 result. Overall, it was a sound performance in a challenging environment as
COVID-19 continued to have impacts across the Group. The result was positive for the
Group’s credit profile given the stronger earnings performance and generally improved
balance sheet metrics.

BondAdviser | Fixed Income Advisory and Research Market Review: September 2021 9
Segment adjusted EBITDA was up 19% to $180.2 million, driven by stronger
performances across Independent & Assisted Living and Retail, which outweighed
weakness in Wealth and Capital Markets. After Group corporate costs, Group adjusted
EBITDA rose 29% to $98.9 million.
No FY22 earnings guidance was provided but the business is well placed to leverage
favourable demographic dynamics of a growing and aging population over the long-term.
MQG Guides for Another Strong Result
Macquarie Group (ASX: MQG) provided first time guidance for 1H22 – it is expected to
be slightly down on 2H21 (NPAT: $2.03 billion). Regardless, it still points to another
bumper result, noting it will be well up on 1H21 ($985 million) and 2H20 ($1.27 billion).
This reflects advantageous operating conditions that have led to a stronger than
expected performance in the Commodities and Global Markets segment along with the
sale of the UK commercial and industrial smart meter businesses. As always, the
guidance is subject to a range of factors, including market conditions and the timing of
transactions. Importantly, given the risks from COVID-19, market volatility and
geopolitical issues, the Group reiterated its focus on maintaining conservative capital,
funding and liquidity settings.

BondAdviser | Fixed Income Advisory and Research Market Review: September 2021 10
Corporates
Centuria Continue Expansion with CIP’s Investment Grade
On 22 September 2021, Moody’s assigned the Centuria Industrial REIT (ASX: CIP) a
Baa2 credit rating at the Issuer level. CIP upstreams distributions to Centuria’s HoldCo
Issuer (Centuria Capital No. 2 Fund, “C2F”), which owns a ~17% stake in CIP. In
obtaining a credit rating, we expect CIP to transition towards a more traditional REIT
capital structure, given it now has the size to facilitate larger capital market transactions.
In time, we suspect CIP will issue bonds that will repay revolving bank facilities. Whilst
there may be an incremental increase in leverage (we estimate about $150 million of
debt headroom against the gearing rating metric), we see the funding diversity benefits
as somewhat offsetting.
The next day, CIP announced it would conduct an equity raising worth ~$325 million
(successfully raised $300 million) to partially assist in the funding of a new portfolio
acquisition worth ~$351 million, initially yielding 4.1% on average, across eight assets.
The portfolio will also help to reduce the cap rate for CIP which has consistently fallen
each half since 1H16 at ~7.4%. Whilst WALEs will incrementally fall, this positively
continues the trend of funding any new acquisitions with a large equity component. This
equity raise is positive both in terms of a growth narrative for the Trust, and from a
creditor perspective as we originally expected to see increased leverage following the
investment grade credit rating. That said, the news was taken poorly by shareholders,
with the price of CIP stock falling 6% in a day and has since declined further. Our
Centuria bond recommendations remain unchanged.
Getting MeMoney Back Early
On 27 September 2021, MoneyMe (ASX: MME) announced it had secured a $50 million
funding commitment from Pacific Equity Partners (PEP), by way of a four-year secured
hybrid funding instrument. This facility will be used to repay the existing $22 million
HoldCo Secured Notes.
The facility is a senior secured HoldCo loan, which has a variable step-up coupon that
is contingent on an increase in market valuation, subject to a ceiling of 4.5%. In addition,
PEP will receive warrants which entitle issuance or cash settlement of up to a maximum
of 5 million shares (3.4% of total shares today). The equity upside embedded within the
facility decreases the nominal interest rate.
We highlighted in August that we expected additional capital would be needed by
November and whilst the new structure is somewhat unique, it has crystallised our
opinion that the bonds were underpricing the likelihood of new capital.
The HoldCo Secured Notes settled in April 2021 and following our initial Subscribe
recommendation, we have maintained a Buy. Assuming the bonds are redeemed on 27
October 2021, at 105% of par, the IRR will be 19.0% from our initial Subscribe and
an impressive 36.6% since our latest Buy recommendation.
Latitude Not Yet Off into the Horizon
Latitude Group Holdings (ASX: LFS) launched an Offer for Latitude Capital Notes (ASX:
LFSPA) on September 2. The issuance was in high demand, raising $150 million ($25
million in excess of the original $125 million target) and pricing at the lower bound of the
4.75-5.00% margin range. The Notes commenced trading on 29 September and
experienced some weakness in its first few days, trading up to 25bps wider than at
issuance. At launch, LFSPA priced 99, 179, and 221bps above the respective
Challenger, regional bank, and Big Four bank curves. Those margins are now
significantly wider at 119, 199 and 238bps.

BondAdviser | Fixed Income Advisory and Research Market Review: September 2021 11
Figure 10: AT1 and LFSPA Trading Margin
Source: BondAdviser, ASX, Bloomberg, as at 30 September 2021.
New Issue - CAIG
On 28 September, Capital Alliance Investment Group, through Capital Alliance Au Pty
Ltd launched an offer for fixed rate HoldCo Secured Notes at an initial margin range of
9.00-10.00%. CAIG are looking to raise $50 million to increase working capital for
general corporate purposes and funding the Group’s development pipeline. Being a
developer, manager and owner of both commercial and residential property provides the
Group with a diverse stream of cashflows. CAIG’s historical operating model has been
to develop a mixed-use property with both commercial features such as a hotel or offices
along with residential apartments. Post-development, the Group has maintained
ownership of the commercial assets and typically sold the apartments. This provides for
smoother earnings compared to a typical developer that will sell all assets once
developed, whereby CAIG receives income both from management and from asset
sales.
Figure 11: Yield - USD Lodging Curves (CAIG ASW to USD)
Source: BondAdviser, Bloomberg, as at 27 September 2021. CAIG based on 9% coupon, cross-currency asset swap into USD.
As the majority of the Group’s income is expected to be sourced from 5-star hotel
tenancies in the medium-term, we view the earnings of the Group most comparable to
the lodging universe. Below in Figure [x] it can be seen that at the lower bound of IPT,
the Notes sit at a clear premium to the B-rated lodging curve. As the delta between the
CBAPJ, 2.47%
CBAPI, 2.53%
NABPF, 2.25%WBCPJ, 2.43%
MQGPD, 2.77%
MQGPE, 2.79%
MBLPC, 2.55% SUNPH, 2.71%
AMPPB, 4.90%
BOQPF, 2.89%
BENPH, 2.86%
CGFPC, 3.56%
LFSPA, 4.80%
2.0%
2.5%
3.0%
3.5%
4.0%
4.5%
5.0%
5.5%
4 4.2 4.4 4.6 4.8 5 5.2 5.4 5.6 5.8 6
Tra
din
g M
arg
in
Term to Expected Call
CAIG
CCC
Represents $500m Issuance
0%
1%
2%
3%
4%
5%
6%
7%
8%
9%
0 1 2 3 4 5 6 7 8 9 10
Op
tio
n A
dju
ste
d S
pre
ad
Term to Call
BBB Curve BB Curve B Curve

BondAdviser | Fixed Income Advisory and Research Market Review: September 2021 12
2- and 4-year markers for both the BBB and BB curves is 24bps, we view the 79bps for
an additional 1.5 years against the outstanding CCC bonds to be a suitable term
premium compensation. Click here to read the full IPO Report.
Bartering Taking Longer Than Expected at Ampol
Z Energy (NZX: ZEL) provided an update on 27 September with regards to the
acquisition proposal from Ampol (ASX: ALD), which was first announced at the release
of ALD’s FY21 results on 23 August. The news provided by Z Energy was that there was
no news. Z advised investors that the original four-week exclusivity period provided to
Ampol had been extended by two weeks. Ampol and Z have been unable to yet address
outstanding matters or agree on key transaction terms. The two parties have announced
there isn’t any certainty that the acquisition will go ahead but a market update can be
expected on or before 11 October.
Qantas Tap $200 Million Excess in Early Refinance
On 16 September, Qantas Airways Ltd (ASX: QAN) raised $500 million with a 7-year
senior unsecured issuance, refinancing the outstanding $300 million Note that matures
in May 2022. As the maturing bonds are unable to be called early, we view the early
timing of the raise to be supportive of the Group in this constricted operating
environment. The 2028 Notes priced 20 basis points below initial price talks at 3.15%
and will help significantly reduce QAN’s cost of debt given the coupon of 7.75% for the
2022 Notes.
Moody’s reiterated Qantas’ Baa2 credit rating on 18 September, taking a similar stance
to that of its view on fellow struggling Australian business, Crown Resorts (ASX: CWN)
- that the current operating pressures are not permanent, Qantas are established as a
dominant market leader and the Group has a strong balance sheet to support it through
likely the final stretch of COVID-induced struggles. As at June 30, Qantas’ debt to
EBITDA ratio was already in excess of Moody’s threshold before downgrading the credit
rating, and as such the Outlook held for QAN was Negative. We are not concerned by
the long-run implications of an additional $200 million in debt, however, leverage will be
high as at 1H22 should no further changes be made to the capital structure as both the
2022 and 2028 Notes will be outstanding. Given the low rate of the 2028 Notes we would
be pleased to see the Group use the excess $200 million to pay down bank debt.
In response to the Federal Government’s announcement for international travel bans to
be uplifted on 14 November 2021 for states with greater than 80% of its population
double vaccinated, Qantas announced its return to London and Los Angeles. Given
management’s expectation was 1 December 2021 this has little impact on our earnings
expectations. Unfortunately, 1H22 will likely be the hardest Qantas are hit as a result of
the pandemic. We believe credit rating agencies will continue to look through this, given
the Group’s lion share of the domestic air travel market in combination with the revenge
spend upon borders reopening sure to provide for a sharp rebound in earnings.

BondAdviser | Fixed Income Advisory and Research Market Review: September 2021 13
Term Deposit Review Another month, another gloomy Term Deposit Review. Across the board there was very
little movement from all-time low TD rates. Additionally, if we were expecting to see any
positive news for TDs, it was likely to be September on the back of higher swap rates,
especially at the longer tenors. The three-year swap increased 12bps to 0.57% and the
one-year rose 4bps to 10bps. The higher swap rates and lack of movement from TD
rates led to a slight compression in spreads at the long end of the TD curve.
Commonwealth Bank was the only bank to shift rates up and that was by 5 basis points
to 35bps for 12-months. The only other movement in the market came from Westpac
which lowered 3-month rates to 7bps and 6-month rates to 15bps from 10bps and 20bps
respectively.
Across all three major maturities, the Bank of Queensland continues to offer the best
value for investors. BOQ’s three-month TD rate of 0.35% exceeds the 12-month TD rate
of all its competition except for CBA, which offers the same rate for 12 months. The
differential is biggest at the short-term whereby the next best three-month term deposit
rate on offer is 10 basis points.
Figure 12. Average Term Deposit Returns
Source: BondAdviser, RBA.
Figure 13. Term Deposit Spread Over Relevant BBSW: Sep 2021 vs Aug 2021
Source: BondAdviser, RBA.
0.0%
0.5%
1.0%
1.5%
2.0%
2.5%
Ap
r-1
7
Ju
l-1
7
Oct-
17
Ja
n-1
8
Ap
r-1
8
Ju
l-1
8
Oct-
18
Ja
n-1
9
Ap
r-1
9
Ju
l-1
9
Oct-
19
Ja
n-2
0
Ap
r-2
0
Ju
l-2
0
Oct-
20
Ja
n-2
1
Ap
r-2
1
Ju
l-2
1Short-Term TD Avg. Medium-Term TD Avg. Long-Term TD Avg.
-0.30%
-0.20%
-0.10%
0.00%
0.10%
0.20%
0.30%
1M 3M 6M 1Y 3Y Average"Special"Spread
Change in Spread September August

BondAdviser | Fixed Income Advisory and Research Market Review: September 2021 14
Figure 14. Δ Annual LT TD Rates
7 7
Source: BondAdviser, Company Websites, RBA. Note Long-Term ~12m.
Figure 15. LT Deposit Rates
7 7
Source: BondAdviser, Company Websites, RBA. Note Long-Term ~12m.
Figure 16. MT Deposit Rates
Source: BondAdviser, Company Websites, RBA. Note Medium-Term ~6m.
Figure 17. ST Deposit Rates
Source: BondAdviser, Company Websites, RBA. Note Short-Term ~3m.
-0.45% -0.45%
-0.55%
-0.45%-0.50%
-0.40%
-0.8%
-0.6%
-0.4%
-0.2%
0.0%
ANZ CBA NAB WBC BEN BOQ
0.20%0.25%
0.15% 0.15%0.20%
0.40%
0.00%
0.20%
0.40%
ANZ CBA NAB WBC BEN BOQ
1 Yr Swap Spread over 1Yr Swap
0.15% 0.15% 0.15%0.10%
0.25%
0.35%
0.00%
0.20%
0.40%
ANZ CBA NAB WBC BEN BOQBBSW6M Spread over BBSW6M
0.08% 0.06% 0.08%0.05%
0.08%
0.33%
0.00%
0.20%
0.40%
ANZ CBA NAB WBC BEN BOQ
BBSW3M Spread over BBSW3M

BondAdviser | Fixed Income Advisory and Research Market Review: September 2021 15
Key Events
Date Description
3 September Moody’s places AGL onto a negative outlook citing risks of the
announced demerger to AGL’s credit profile.
APRA publishes a report outlining its Climate Vulnerability
Assessment which it is undertaking with the Big 5.
7 September RBA releases its monthly Monetary Policy Decision, holding the
cash rate target at 10bps and announcing it will maintain its
government bond purchase program at $4bn a week until at least
Feb 2022.
Reports indicate that Qantas has progressed the process to sell
$550m of undeveloped Sydney property, having shortlisted bidders.
8 September Evergrande’s share price falls below its IPO price following a
second downgrade in two days as it announces that a default
seems probable.
9 September In its Annual Report, Crown’s auditor KPMG issues a formal notice
that there is a ‘material uncertainty’ that Crown will be able to
continue as a ‘going concern’.
10 September APRA announces it will require ADIs to end their reliance on the
CLF by the end of 2022, subject to market conditions.
Santos and Oil Search finalise their merger agreement to form a
$21bn, top 20 global oil and gas company.
14 September US August CPI is weaker than expected with headline CPI rising
0.3% MoM (expected: 0.4%; prior: 0.5%) and core CPI rising 0.1%
MoM (expected: 0.3%; prior: 0.3%).
Perth Airport has commenced legal proceedings in WA Supreme
Court against Qantas, claiming it is owed ~$17m in unpaid fees for
aeronautical services provided in 2018.
15 September WBC updates the market on the sale of its Pacific business,
reporting the PNG’s Competition Commission provided its final
determination to deny approval to Kina Bank to purchase the
business.
16 September Telstra provides a number of strategic updates at its Investor Day,
revealing its T25 strategy. Notable announcements include an
expectation for mid-single digit EBITDA growth between FY21-
FY25.
17 September Wesfarmers revises its non-binding offer to acquire Australian
Pharmaceutical Industries to $1.55 per share, up from $1.38.

BondAdviser | Fixed Income Advisory and Research Market Review: September 2021 16
Date Description
20 September AusNet Services receives an indicative, non-binding offer from
Brookfield Asset Management at $2.50 cash per share. AusNet’s
Board has granted Brookfield exclusive due diligence.
22 September APA Group announces it has made a non-binding offer of $2.60
cash per share to acquire AusNet Services.
23 September IAG announces it has received 435 claims relating to the Victorian
earthquake. Suncorp reports it has received minimal claims and
does not expect a big expense impact.
29 September Australia’s Council of Financial Regulators (RBA, ARPA, ASIC,
Treasury) announce they have formally discussed the possibility of
tightening macro-prudential policy and that APRA will publish a
paper setting out a framework in the coming months.
30 September APRA reports that loan deferrals remained very low ($12bn)
through to August compared to 2020.

BondAdviser | Fixed Income Advisory and Research Market Review: September 2021 17
New Issue Monitor
ISIN / ASX Code Issue Date Issuer Structural Position
Coupon Term (Yrs)
Issue Size ($m)
1 Month Δ Price
AU3CB0277077 15/01/2021 European
Investment Bank Sr
Unsecured 0.75% 7 1,250 1.09%
AU3CB0277036 15/01/2021 Australia Pacific Mortgage Fund
Ltd Secured 7.00% 2 15 0.02%
AU3CB0277168 20/01/2021 University of Melbourne
Sr Unsecured
1.97% 10 150 2.57%
AU3FN0058103 21/01/2021 Heartland
Australia Group Pty Ltd
Sr Unsecured
2.11% 2 75 0.06%
AU3CB0277291 27/01/2021 European
Investment Bank Sr
Unsecured 1.30% 10 300 2.71%
AU3CB0277234 27/01/2021 Asian
Development Bank
Sr Unsecured
1.30% 10 200 2.80%
AU3FN0058129 29/01/2021 Westpac
Banking Corp Subordinated 1.56% 10 1,250 0.08%
AU3CB0277432 4/02/2021 Inter-American Development
Bank
Sr Unsecured
1.00% 8 300 1.82%
AU3FN0058244 17/02/2021 Defence Bank
Ltd Subordinated 3.16% 10 15 0.66%
AU3CB0277796 19/02/2021 European
Investment Bank Sr
Unsecured 1.90% 15 200 4.14%
AU3CB0277960 23/02/2021 Australia Pacific Mortgage Fund
Ltd Secured 6.75% 1 13 0.09%
AU3FN0058343 24/02/2021 Suncorp-
Metway Ltd Sr
Unsecured 0.46% 5 750 0.27%
AU3CB0278174 26/02/2021 UBS
AG/Australia Sr
Unsecured 1.10% 5 300 0.81%
AU3FN0058608 26/02/2021 UBS
AG/Australia Sr
Unsecured 0.53% 5 700 0.20%
AU3FN0058699 4/03/2021
Newcastle Permanent
Building Society Ltd
Sr Unsecured
0.66% 5 225 0.10%
AU3CB0278380 9/03/2021 Aurizon Finance
Pty Ltd Sr
Unsecured 3.00% 7 500 1.97%
AU3FN0059200 17/03/2021 Liberty Financial
Pty Ltd Sr
Unsecured 2.48% 4 200 0.08%
AU0000136442 17/03/2021 Macquarie Group Ltd
AT1 2.91% 7 725 0.40%
AU3CB0278653 18/03/021 Mirvac Group Finance Ltd
Sr Unsecured
2.60% 9 300 2.19%
AU3CB0278869 23/03/2021 Verizon
Communications Inc
Sr Unsecured
2.35% 7 600 1.26%
AU3CB0278877 23/03/2021 Verizon
Communications Inc
Sr Unsecured
3.00% 7 500 2.67%

BondAdviser | Fixed Income Advisory and Research Market Review: September 2021 18
ISIN / ASX Code Issue Date Issuer Structural Position
Coupon Term (Yrs)
Issue Size ($m)
1 Month Δ Price
AU3CB0278885 23/03/2021 Verizon
Communications Inc
Sr Unsecured
3.85% 20 150 4.79%
AU3CB0278893 24/03/2021 Stockland Trust Sr
Unsecured 2.30% 7 300 1.54%
AU3FN0059424 26/03/2021 MUFG Bank Ltd/Sydney
Sr Unsecured
0.51% 4 750 0.14%
AU3CB0278711 31/03/2021 Lendlease
Finance Ltd Sr
Unsecured 3.70% 10 300 2.65%
AU3CB0279057 31/03/2021 WestConnex
Finance Co Pty Ltd
Secured 3.15% 10 650 2.76%
AU0000138927 1/04/2021 Commonwealth
Bank of Australia
AT1 2.76% 6 1,180 0.04%
AU3FN0059531 7/04/2021
Australia & New Zealand
Banking Group Ltd
Sr Unsecured
0.18% 1 200 0.06%
AU3FN0059523 7/04/2021
Australia & New Zealand
Banking Group Ltd
Sr Unsecured
0.14% 1 1200 0.02%
AU3FN0059549 9/04/2021 Macquarie Bank
Ltd Sr
Unsecured 0.22% 1 150 0.04%
AU0000140014 15/04/2021 NAOS Emerging
Opportunities Company Ltd
Sr Unsecured
4.50% 5 23 -
AU0000143364 20/04/2021 Centuria Capital
No 2 Fund Secured 4.29% 5 190 0.09%
AU3FN0059994 21/04/2021 Victoria Power
Networks Finance Pty Ltd
Sr Unsecured
0.84% 5 175 0.04%
AU3CB0279651 21/04/2021 Victoria Power
Networks Finance Pty Ltd
Sr Unsecured
1.60% 5 325 0.55%
AU3CB0279644 21/04/2021 Victoria Power
Networks Finance Pty Ltd
Sr Unsecured
2.13% 7 200 1.79%
AU3CB0279560 21/04/2021 CHC Finance
Pty Ltd Sr
Unsecured 3.09% 10 250 2.72%
AU3FN0059721 22/04/2021 Credit Union Australia Ltd
Sr Unsecured
0.72% 5 100 0.10%
AU3CB0279578 23/04/2021 NSW Electricity
Networks Finance Pty Ltd
Secured 2.73% 10 300 1.93%
AU3CB0279891 28/04/2021 Australian Gas Networks Ltd
Secured 2.15% 7 250 1.60%
AU3CB0279883 28/04/2021 Australian Gas Networks Ltd
Secured 2.82% 10 200 2.77%
AU3FN0060091 29/04/2021 Bank of
Queensland Ltd Subordinated 1.64% 10 250 0.01%
AU3CB0279925 29/04/2021 MoneyMe Ltd Secured 8.25% 4 15 0.46%
AU3CB0280402 4/05/2021 IMB Ltd Subordinated 2.54% 10 70 0.38%

BondAdviser | Fixed Income Advisory and Research Market Review: September 2021 19
ISIN / ASX Code Issue Date Issuer Structural Position
Coupon Term (Yrs)
Issue Size ($m)
1 Month Δ Price
AU3FN0060448 5/05/2021 Network
Finance Co Pty Ltd
Secured 2.58% 7 350 0.04%
AU3FN0060406 5/05/2021 Transurban Queensland
Finance Pty Ltd Secured 3.25% 10 300 0.12%
AU3FN0060182 6/05/2021 Bank of
Queensland Ltd Sr
Unsecured 0.67% 5 425 0.80%
AU3CB0279958 6/05/2021 Bank of
Queensland Ltd Sr
Unsecured 1.40% 5 225 2.57%
AU3CB0280295 20/05/2021 Woori
Bank/Sydney Sr
Unsecured 0.31% 1 100 2.93%
AU3CB0280394 20/05/2021 Barclays PLC Sr
Unsecured 2.06% 6 150 4.29%
AU3CB0280287 20/05/2021 Barclays PLC Sr
Unsecured 3.38% 11 200 0.89%
AU3FN0060463 20/05/2021 Barclays PLC Sr
Unsecured 1.29% 6 250 0.00%
AU3CB0280006 24/05/2021 PACCAR
Financial Pty Ltd Sr
Unsecured 0.75% 3 150 1.68%
AU3CB0280030 25/05/2021 Liberty Financial
Pty Ltd Sr
Unsecured 2.59% 5 200 0.72%
AU3CB0280634 2/06/2021 NBN Co Ltd Sr
Unsecured 2.15% 7 350 1.77%
AU3FN0060638 4/06/2021 Peet Ltd Sr
Unsecured 4.88% 5 75 1.48%
AU3FN0060737 8/06/2021 Avanti Finance
Ltd Sr Secured 4.77% 4 70 0.25%
AU3CB0280915 15/06/2021 Aurizon Network
Pty Ltd Sr
Unsecured 3.29% 11 75 4.39%
AU3FN0061016 16/06/2021 Teachers Mutual
Bank Ltd Sr
Unsecured 0.70% 5 100 0.05%
AU3FN0061024 16/06/2021 MyState Bank
Ltd Sr
Unsecured 0.67% 4 50 0.28%
AU3FN0061065 17/06/2021 Macquarie Bank
Ltd Subordinated 1.57% 10 750 0.04%
AU3CB0280956 17/06/2021 Charter Hall LWR Pty Ltd
Sr Unsecured
2.66% 9 200 2.66%
AU3FN0061081 18/06/2021 Bendigo &
Adelaide Bank Ltd
Sr Unsecured
0.67% 5 225 0.08%
AU3CB0281053 23/06/2021 Wesfarmers Ltd Sr
Unsecured 2.55% 10 350 2.94%
AU3CB0281046 23/06/2021 Wesfarmers Ltd Sr
Unsecured 1.94% 7 650 1.80%
AU3CB0281145 24/06/2021 AGI Finance Pty
Ltd Sr Secured 2.12% 6 450 0.92%

BondAdviser | Fixed Income Advisory and Research Market Review: September 2021 20
ISIN / ASX Code Issue Date Issuer Structural Position
Coupon Term (Yrs)
Issue Size ($m)
1 Month Δ Price
AU3CB0281152 24/06/2021 AGI Finance Pty
Ltd Sr Secured 2.94% 10 125 2.81%
AU3FN0061099 24/06/2021 Judo Bank Pty
Ltd Subordinated 4.53% 10 50 2.05%
AU3CB0281251 29/06/2021 Llitst Finance
Pty Ltd Sr
Unsecured 2.85% 9 200 2.76%
AU3CB0281293 2/07/2021 Emeco Pty Ltd Sr
Unsecured 6.25% 5 250 0.41%
AU3FN0061172 2/07/2021 Victoria Power
Networks Finance Pty Ltd
Sr Unsecured
0.93% 10 50 0.31%
AU3FN0061289 9/07/2021 Heartland
Australia Group Pty Ltd
Company Guarnt
2.03% 3 45 0.05%
AU3FN0061404 15/07/2021 Banco
Santander SA Sr
Unsecured 0.88% 5 425 0.64%
AU3CB0281608 15/07/2021 Banco
Santander SA Sr
Unsecured 1.65% 5 100 0.21%
AU3CB0281582 15/07/2021 Edith Cowan
University Sr
Unsecured 2.74% 12 150 2.88%
AU3CB0281590 15/07/2021 Edith Cowan
University Sr
Unsecured 3.40% 20 100 4.60%
AU3FN0061412 15/07/2021 Commonwealth
Bank of Australia
Sr Unsecured
0.33% 5 20 0.01%
AU3CB0281681 23/07/2021 Pallas FM Trust Sr Secured 7.00% 1 9 -
AU3CB0281418 7/08/2021 CNH Industrial
Capital Australia Pty Ltd
Sr Unsecured
1.75% 3 200 0.04%
AU3SG000253 12/08/2021 Northern Territory Treasury
Sr Unsecured
3.00% 30 80 6.74%
AU3SG000254 16/08/2021 South Australian
Government Sr
Unsecured 0.089% 1 500 0.03%
AU3CB028234 18/08/2021 Export Finance
& Insurance Sr
Unsecured 1.465% 10 250 2.94%
AU3CB028233 18/08/2021 Victoria Power
Networks Finance
Sr Unsecured
2.195% 10 50 2.91%
AU3FN006252 19/08/2021 ING Bank
Australia Ltd Secured 0.412% 5 625 0.05%
AU3CB028235 19/08/2021 ING Bank
Australia Ltd Secured 1.10% 4 120 0.98%
AU3FN006264 23/08/2021 Victoria Power
Networks Finance
Sr Unsecured
0.51% 3 300 0.03%
AU0000170284 27/08/2021 Macquarie Bank
Ltd AT1 2.91% 7 655 0.01%
AU3FN006276 30/08/2021 Cooperative
Rabobank UA Sr Preferred 0.072% 1 100 0.04%

BondAdviser | Fixed Income Advisory and Research Market Review: September 2021 21
ISIN / ASX Code Issue Date Issuer Structural Position
Coupon Term (Yrs)
Issue Size ($m)
1 Month Δ Price
AU3FN0062816 7/09/2021 United Energy Distribution Pty
Ltd
Sr Unsecured
0.48% 3 130 -
AU3CB0282945 9/09/2021 Toyota Finance
Australia Ltd Sr
Unsecured 0.85% 3 275 -
AU3FN0062824 9/09/2021 Toyota Finance
Australia Ltd Sr
Unsecured 0.44% 3 425 -
AU3FN0062964 15/09/2021 Suncorp-
Metway Ltd Sr
Unsecured 0.49% 5 750 -
AU3FN0062998 15/09/2021 Toyota Finance
Australia Ltd Sr
Unsecured 0.36% 2 100 -
AU0000172470 15/09/2021 Westpac
Banking Corp AT1 2.91% 8 1,750 -
AU3FN0062915 16/09/2021 Australian
Central Credit Union Ltd
Subordinated 2.41% 10 75 -
AU3CB0283059 21/09/2021 VER Finco Pty
Ltd Sr
Unsecured 2.4% 7 200 -
AU3FN0063103 23/09/2021 Commonwealth
Bank of Australia
Sr Unsecured
0.43% 5 500 -
AU0000173551 23/09/2021 Suncorp-
Metway Ltd AT1 2.91% 7 405 -
AU3CB0283224 24/09/2021
Shopping Centres
Australasia Property Retail
Trust
Sr Unsecured
2.45% 8 250 -
AU3SG0002587 24/09/2021 Northern Territory
Treasury Corp
Sr Unsecured
2.75% 20 100 -
AU3FN0063095 24/09/2021 Woori
Bank/Sydney Sr
Unsecured 0.20% 1 50 -
AU3CB0283182 27/09/2021 Qantas Airways
Ltd Sr
Unsecured 3.15% 7 500 -
AU3CB0283356 27/09/2021 Commonwealth
Bank of Australia
Sr Unsecured
1.09% 5 50 -
AU0000176901 28/09/2021 Latitude Group
Holdings Subordinated 4.76% 5 150 -

BondAdviser | Fixed Income Advisory and Research Market Review: September 2021 22
AT1 Curve and Data
Figure 18. ASX AT1 Trading Margin
Arial
Figure 19. AT1 Primary & Weighted Average Secondary Yield to Call**
Last 1m 3m YTD 1y 3y 5y Inception^
Yield to Call 3.06% 2.85% 2.85% 3.05% 3.22% 5.49% 5.95% 7.26%
%Δ 7.37% 7.37% 0.33% -4.97% -44.26% -48.57% -57.85%
Trading Margin 2.31% 2.33% 2.24% 2.79% 3.01% 3.12% 4.02% 0.79%
%Δ -0.86% 3.13% -17.20% -23.26% -25.96% -42.54% 192.41%
Source: BondAdviser Index Platform: BAAUAT1DFTR ** Weighted average based on market capitalisation. BAAUAT1DFTR is a franked, total return index that is rebalanced on a daily basis. Yield to call based on BondAdviser estimates. ^Inception of BAAUAT1DFTR is 16/5/2007.
WBCPG
AMPPA
ANZPE
CBAPF
CGFPA
SUNPF
NABPD
WBCPE
CBAPD
ANZPF
CGFPB
IAGPD
ANZPG
CBAPH
BENPG
SUNPGWBCPI
BOQPE
MQGPCANZPH
CBAPG
WBCPH
AMPPB
MBLPC
CGFPC
SUNPH
MQGPD
CBAPJ
WBCPJ
CBAPI
BOQPF
BENPHMQGPE
NABPHANZPI
SUNPI WBCPK
0.00%
1.00%
2.00%
3.00%
4.00%
5.00%
6.00%
0 1 2 3 4 5 6 7 8
0%
2%
4%
6%
8%
10%
12%
14%
2007 2008 2009 2010 2011 2012 2013 2014 2015 2016 2017 2018 2019 2020 2021
Yield to Call** AMP SUN/SBK MQG/MBL BEN BOQ CGF
IAG SGB ANZ CBA NAB WBC

BondAdviser | Fixed Income Advisory and Research Market Review: September 2021 23
T2 Curve and Data
Figure 20. T2 Trading Margin
Figure 21. T2 Primary & Weighted Average Secondary Yield to Call**
Last 1m 3m YTD 1y 3y 5y Inception^
Yield to Call 1.98% 1.84% 2.02% 2.14% 2.43% 3.90% 3.89% 7.05%
%Δ 7.61% -1.98% -7.48% -18.52% -49.23% -49.10% -71.91%
Trading Margin 1.31% 1.31% 1.35% 1.80% 2.13% 1.53% 1.99% 0.60%
%Δ 0.00% -2.96% -27.22% -38.50% -14.38% -34.17% 118.33%
Source: BondAdviser Index Platform: BAAUT20DNTR ** Weighted average based on market capitalisation. BAAUT20DNTR is a total return index that is rebalanced on a daily basis. Yield to call based on BondAdviser estimates. ^Inception of BAAUT20DNTR is 16/5/2007.
BEN 2.8%
WBC 4.43%
ANZ 4.63%
AAI 3.15%
CGF 2.09%
AMP 1.84%
WBC 1.4%
BOQ 1.84%
WBC 4.52%
WBC 1.78%
NABPE
AMP 2.85%
BEN 2.38%
SBS 3.73%
SUN 2.1%
NAB 2.1%
IAG 2.07%
ANZ 1.97%
WBC 4.01%
WBC 1.93%
Mac 2.76%
IAG 2.29%
Her 3.38%
Gen 4.68%
MyS 4.12%
Com 1.77%
Cle 5.76%
NAB 1.68%
SUN 2.19%
WBC 1.55%
ANZ 1.82%
QBE 2.65%
NAB 1.96%
NAB 3.1%
IAG 2.37%
NAB 4.45%
ANZ 4.24%
0.00%
1.00%
2.00%
3.00%
4.00%
5.00%
6.00%
0 1 2 3 4 5 6 7
0%
2%
4%
6%
8%
10%
12%
2007 2008 2009 2010 2011 2012 2013 2014 2015 2016 2017 2018 2019 2020 2021
Yield to Call** AMP SUN/SBK SBS BEN
BOQ CGF IAG GMA ANZ
CBA NAB WBC AAI HBS
ME MY MBL CLV

BondAdviser | Fixed Income Advisory and Research Market Review: September 2021 24
Corporate Curves
Figure 22. AAA-A Band
Source: BondAdviser; Bloomberg.
Figure 23. BBB Band
Source: BondAdviser; Bloomberg.
Figure 24. Sub IG Band / Unrated Curve
Source: BondAdviser; Bloomberg.
Telstra 4.00% 2022
Stockland 4.50% 2022
GPT 3.591% 2023
Stockland 3.30% 2024
Vicinity 2.60% 2025
Vicinity FRN 1.42% 2025
Optus 1.60% 2025
NBN Co 1.00% 2025
GPT Office Fund 2.525% 2026
Victoria Power Networks 1.603% 2026
Victoria Power Networks FRN 0.80% 2026
GPT 3.657% 2026
Telstra 4.00% 2027
Stockland 2.30% 2028
Victoria Power Networks 2.132% 2028
NBN Co 2.15% 2028
Wesfarmers SLB 1.941% 2028
Optus 2.50% 2030
NBN Co 2.20% 2030
Wesfarmers SLB 2.550% 2031
0.00%
0.20%
0.40%
0.60%
0.80%
1.00%
1.20%
1.40%
1.60%
0 1 2 3 4 5 6 7 8 9 10
AGL 5.00% 2021
Qantas 7.75% 2022
Mirvac 3.50% 2023
Qantas 4.40% 2023
APA Group 3.75% 2023
Ausgrid FRN 1.10% 2024
Woolworths 2.85% 2024
SCA 3.90% 2024
Aurizon 4.00% 2024
Woolworths 1.85% 2025
Coles FRN 0.97% 2025
AusNet Subordinated FRN 3.1% 2080
Ampol Subordinated FRN 2080
Downer 3.70% 2026
Qantas 4.75% 2026
Coles 2.20% 2026
Ausgrid 1.814% 2027
Port Brisbane 2.30% 2027
Goodman Australia 2.20% 2027
Lend Lease 3.4% 2027
Origin 2.65% 2027
Qantas 3.15% 2028
SCA 2.45% 2029
Coles 2.65% 2029
Woolworths 2.80% 2030
LLITST 2.85% 2030
Coles 2.10% 2030
Qantas 5.25% 2030
Aurizon 2.90% 2030
Port Brisbane 2.85% 2031
Lend Lease 3.70% 2031
Pacific National 3.80% 2031
0.00%
0.50%
1.00%
1.50%
2.00%
2.50%
3.00%
0 1 2 3 4 5 6 7 8 9 10
OBLHA
KITT Notes
PPCHB
Civmec Secured Notes
Centuria Notes II FRN 4.25% 2023
SEEK Subordinated Notes
QUBHA
Centuria 5.00% 2024
Peet Wholesale Notes
Avanti Finance Senior Secured Notes
MME HoldCo Secured Notes
Avanti Finance Senior Secured Notes 2
IMF Jan 2026 5.65%
C2FHA
Emeco 6.25% 2026
Peet Wholesale Notes 2
LFSPA
0.00%
1.00%
2.00%
3.00%
4.00%
5.00%
6.00%
7.00%
8.00%
0 1 2 3 4 5 6
BondAdviser | Fixed Income Advisory and Research Market Review: September 2021 25
Credit and Money Markets Charts
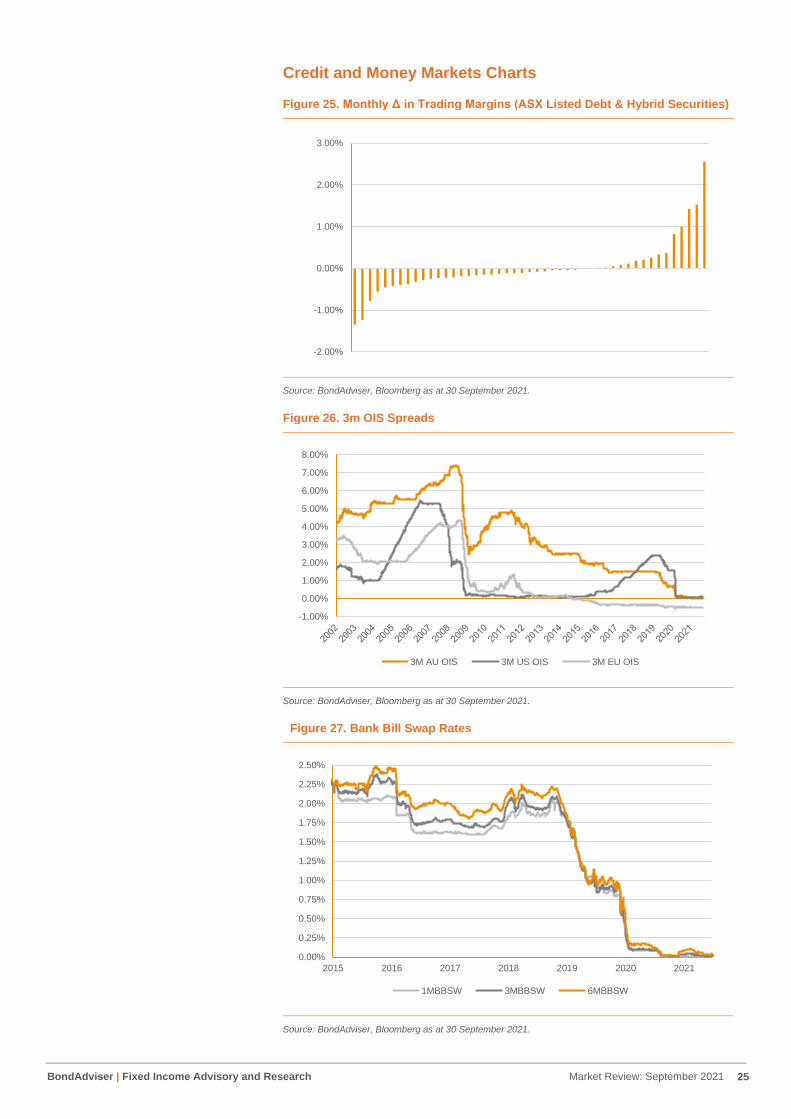
Figure 25. Monthly Δ in Trading Margins (ASX Listed Debt & Hybrid Securities)
Source: BondAdviser, Bloomberg as at 30 September 2021.
Figure 26. 3m OIS Spreads
Source: BondAdviser, Bloomberg as at 30 September 2021.
Figure 27. Bank Bill Swap Rates
Source: BondAdviser, Bloomberg as at 30 September 2021.
-2.00%
-1.00%
0.00%
1.00%
2.00%
3.00%
-1.00%
0.00%
1.00%
2.00%
3.00%
4.00%
5.00%
6.00%
7.00%
8.00%
3M AU OIS 3M US OIS 3M EU OIS
0.00%
0.25%
0.50%
0.75%
1.00%
1.25%
1.50%
1.75%
2.00%
2.25%
2.50%
2015 2016 2017 2018 2019 2020 2021
1MBBSW 3MBBSW 6MBBSW

BondAdviser | Fixed Income Advisory and Research Market Review: September 2021 26
Listed Data Tracker
Description Valuation Income Change in Trading Margin Risk
Ticker Issue Size
Expected Maturity
Term Sector Last Price
Accrued YTM Trading Margin
Fixed/Floating Interest Margin
Frequency Current
Rate Cash
Payment Ex-Date
Payment Date
1 month 3 months 6
months 12
months Modified Duration
Credit Duration
Additional Tier 1 (AT1) Hybrids
Major Banks
ANZPE 1610 24/03/2022 0.5 Banks 100.7 0.054 1.99% 1.94% Floating 3.25% Semi-Annual 2.30% $1.14 15/03/2022 24/03/2022 0.02% 0.47% -0.53% -0.61% 0.48 0.48
ANZPF 970 24/03/2023 1.5 Banks 102.9 0.060 1.85% 1.65% Floating 3.60% Semi-Annual 2.54% $1.26 15/03/2022 24/03/2022 -0.08% -0.33% -0.91% -0.85% 0.49 1.44
ANZPG 1622 20/03/2024 2.5 Banks 107.3 0.129 2.15% 1.72% Floating 4.70% Quarterly 3.30% $0.82 9/12/2021 20/12/2021 -0.40% -0.38% -0.88% -1.43% 0.30 2.33
ANZPH 931 20/03/2025 3.5 Banks 105.8 0.104 2.76% 2.09% Floating 3.80% Quarterly 2.67% $0.67 9/12/2021 20/12/2021 -0.03% 0.07% -0.53% -0.97% 0.31 3.22
CBAPD 3000 15/12/2022 1.2 Banks 101.0 0.116 2.22% 2.08% Floating 2.80% Quarterly 1.97% $0.49 6/12/2021 15/12/2021 0.11% 0.14% -0.49% -0.76% 0.21 1.18
CBAPE 1450 15/10/2021 0.0 Banks 100.0 0.214 1.25% 1.20% Floating 5.20% Quarterly 3.65% $0.91 2/12/2021 15/12/2021 -2.93% 0.22% -0.93% -1.44% -0.52 -0.68
CBAPF 1640 31/03/2022 0.5 Banks 101.2 0.161 1.67% 1.62% Floating 3.90% Quarterly 2.74% $0.68 6/12/2021 15/12/2021 0.82% 0.32% -0.68% -0.93% 0.21 0.45
CBAPG 1365 15/04/2025 3.5 Banks 104.1 0.140 2.89% 2.20% Floating 3.40% Quarterly 2.39% $0.60 6/12/2021 15/12/2021 0.02% -0.10% -0.50% -0.97% 0.27 3.23
CBAPH 1590 26/04/2024 2.6 Banks 104.6 0.152 2.29% 1.84% Floating 3.70% Quarterly 2.60% $0.65 6/12/2021 15/12/2021 -0.15% -0.24% -0.70% -1.21% 0.26 2.34
CBAPI 1650 20/04/2027 5.6 Banks 102.5 0.124 3.63% 2.53% Floating 3.00% Quarterly 2.11% $0.53 6/12/2021 15/12/2021 -0.05% -0.05% -0.30% -0.60% 0.27 4.97
CBAPJ 1180 20/10/2026 5.1 Banks 101.4 0.113 3.49% 2.47% Floating 2.75% Quarterly 1.93% $0.48 6/12/2021 15/12/2021 -0.06% -0.09% - - 0.24 4.59
NABPD 1499 07/07/2022 0.8 Banks 102.6 -0.095 1.56% 1.48% Floating 4.95% Quarterly 3.48% $0.88 28/09/2021 7/10/2021 -0.25% 0.09% -0.78% -1.02% 0.03 0.76
NABPF 1874 17/06/2026 4.7 Banks 107.8 0.143 3.20% 2.25% Floating 4.00% Quarterly 2.81% $0.70 8/12/2021 17/12/2021 -0.28% -0.06% -0.34% -0.97% 0.37 4.22
NABPH 2386 17/12/2027 6.2 Banks 105.0 0.125 3.83% 2.63% Floating 3.50% Quarterly 2.46% $0.61 8/12/2021 17/12/2021 -0.10% -0.02% -0.31% - 0.34 5.40
WBCPE 1311 23/09/2022 1.0 Banks 101.6 0.059 1.56% 1.46% Floating 3.05% Quarterly 2.15% $0.54 14/12/2021 23/12/2021 -0.42% -0.30% -0.87% -1.41% 0.24 0.97
WBCPH 1690 22/09/2025 4.0 Banks 103.7 0.070 3.02% 2.23% Floating 3.20% Quarterly 2.25% $0.56 13/12/2021 22/12/2021 -0.09% -0.16% -0.51% -0.95% 0.29 3.68
WBCPI 1423 31/07/2024 2.8 Banks 105.2 0.102 2.29% 1.76% Floating 3.70% Quarterly 2.60% $0.65 9/12/2021 20/12/2021 -0.32% -0.23% -0.82% -1.27% 0.28 2.58
WBCPJ 1723 22/03/2027 5.5 Banks 104.9 0.075 3.51% 2.43% Floating 3.40% Quarterly 2.39% $0.60 13/12/2021 22/12/2021 -0.14% -0.12% -0.38% - 0.34 4.87
WBCPK 1750 21/09/2029 8.0 Banks 101.0 0.120 4.22% 2.78% Floating 2.90% Quarterly 2.04% $0.54 10/12/2021 21/12/2021 - - - - 0.25 6.73

BondAdviser | Fixed Income Advisory and Research Market Review: September 2021 27
Listed Data Tracker
Description Valuation Income Change in Trading Margin Risk
Ticker Issue Size Expected Maturity
Term Sector Last Price
Accrued YTM Trading Margin
Fixed/Floating Interest Margin
Frequency Current
Rate Cash
Payment Ex-Date Payment Date 1 month
3 months
6 months
12 months Mod. Dur. Credit
Duration
Additional Tier 1 (AT1) Hybrids
Other Financials
AMPPA 268 22/12/2021 0.2 Diversified Financials
100.6 0.146 4.45% 4.43% Floating 5.10% Quarterly 5.12% $1.28 13/12/2021 22/12/2021 1.42% -0.16% -0.10% -0.93% 0.23 0.23
AMPPB 275 16/12/2025 4.2 Diversified Financials
99.0 0.225 5.74% 4.90% Floating 4.50% Quarterly 4.51% $1.13 7/12/2021 16/12/2021 -0.23% 0.13% 0.10% -0.11% 0.18 3.73
BENPG 322 13/06/2024 2.7 Banks 103.8 0.175 2.86% 2.37% Floating 3.75% Quarterly 2.63% $0.66 30/11/2021 13/12/2021 0.20% -0.45% -0.42% -1.14% 0.25 2.55
BENPH 502 15/06/2027 5.7 Banks 105.0 0.157 3.98% 2.86% Floating 3.80% Quarterly 2.67% $0.67 6/12/2021 15/12/2021 -0.15% 0.06% -0.28% - 0.33 4.99
BOQPE 350 15/08/2024 2.9 Banks 104.0 0.464 3.01% 2.48% Floating 3.75% Quarterly 2.64% $0.66 27/10/2021 15/11/2021 -0.19% 0.18% -0.41% -1.12% 0.17 2.70
BOQPF 260 14/05/2027 5.6 Banks 105.0 0.470 4.00% 2.89% Floating 3.80% Quarterly 2.67% $0.67 27/10/2021 15/11/2021 -0.13% -0.05% -0.09% - 0.24 4.91
CGFPA 345 25/05/2022 0.6 Diversified Financials
100.6 0.335 3.05% 2.99% Floating 3.40% Quarterly 2.39% $0.60 16/11/2021 25/11/2021 0.25% -0.59% -0.42% -9.34% 0.15 0.64
CGFPB 460 22/05/2023 1.6 Diversified Financials
103.3 0.459 2.86% 2.63% Floating 4.40% Quarterly 3.09% $0.77 11/11/2021 22/11/2021 -0.46% 0.43% -0.53% -1.76% 0.17 1.58
CGFPC 385 25/05/2026 4.6 Diversified Financials
104.8 0.453 4.49% 3.56% Floating 4.60% Quarterly 3.23% $0.81 16/11/2021 25/11/2021 -0.18% 0.24% 0.07% - 0.24 4.09
IAGPD 404 15/06/2023 1.7 Insurance 105.0 0.277 2.40% 2.15% Floating 4.70% Quarterly 4.71% $1.17 6/12/2021 15/12/2021 -0.38% -0.52% -1.06% -1.07% 0.24 1.63
MQGPC 1000 16/12/2024 3.2 Diversified Financials
104.8 0.154 3.10% 2.49% Floating 4.00% Quarterly 3.43% $0.85 2/12/2021 16/12/2021 -0.22% 0.05% -0.12% -0.76% 0.28 2.99
MQGPD 905 10/09/2026 4.9 Diversified Financials
106.5 0.228 3.76% 2.77% Floating 4.15% Quarterly 3.55% $0.89 29/11/2021 10/12/2021 -0.04% 0.20% 0.09% -0.57% 0.33 4.38
MQGPE 725 18/09/2027 6.0 Diversified Financials
100.7 0.080 3.95% 2.79% Floating 2.90% Quarterly 2.49% $0.62 7/12/2021 20/12/2021 -0.07% -0.06% -0.14% - 0.24 5.29
SUNPF 375 17/06/2022 0.7 Diversified Financials
101.6 0.147 2.12% 2.04% Floating 4.10% Quarterly 2.88% $0.72 2/12/2021 17/12/2021 0.37% 0.39% -0.41% -0.77% 0.22 0.70
SUNPG 375 17/06/2024 2.7 Insurance 104.9 0.130 2.33% 1.84% Floating 3.65% Quarterly 2.56% $0.64 2/12/2021 17/12/2021 -0.78% -0.56% -0.89% -1.47% 0.27 2.57
SUNPH 389 17/06/2026 4.7 Insurance 101.4 0.107 3.65% 2.71% Floating 3.00% Quarterly 2.11% $0.53 2/12/2021 17/12/2021 -0.12% 0.07% -0.34% -0.56% 0.24 4.29
SUNPI 405 19/06/2028 6.7 Insurance 99.9 0.056 4.21% 2.92% Floating 2.90% Quarterly 2.04% $0.48 6/12/2021 17/12/2021 - - - - 0.21 5.84
MBLPC 641 22/12/2025 4.2 Insurance 108.5 0.116 3.40% 2.55% Floating 4.70% Quarterly 4.02% $1.00 9/12/2021 21/12/2021 -0.12% -0.04% -0.12% -0.86% 0.37 3.79
MBLPD 655 07/09/2028 6.9 Insurance 100.3 0.271 4.22% 2.89% Floating 2.90% Quarterly 2.48% $0.69 19/11/2021 7/12/2021 0.03% - - - 0.19 5.99

BondAdviser | Fixed Income Advisory and Research Market Review: September 2021 28
Listed Data Tracker
Description Valuation Income Change in Trading Margin Risk
Ticker Issue Size
Expected Maturity
Term Sector Last Price
Accrued YTM Trading Margin
Fixed/Floating Interest Margin
Frequency Current
Rate Cash
Payment Ex-Date
Payment Date
1 month 3 months 6 months 12
months Mod. Dur.
Credit Duration
Additional Tier 1 (AT1) / T2 Hybrids / Bonds
Other Financials
BENHB 75 Perpetual - Banks 99.5 0.105 2.74% 1.02% Floating 1.00% Quarterly 1.02% $0.26 12/11/2021 30/11/2021 0.00% -0.16% -0.66% -0.66% - -
NABPE 943 20/02023 2.0 Banks 101.1 0.061 1.97% 1.66% Floating 2.20% Quarterly 2.21% $0.55 9/12/2021 20/12/2021 0.05% 0.19% 0.47% 0.47% 0.23 1.92
SBKHB 200 Perpetual - Insurance 99.7 0.071 2.59% 0.76% Floating 0.75% Quarterly 0.78% $0.20 16/08/2021 2/09/2021 0.01% -0.32% -0.49% -0.49% - -
Corporate Hybrids
CWNHB 630 23/07/2022 0.8 Consumer
Discretionary 85.50 0.2 27.63% 27.55% Floating 4.00% Quarterly 4.01% $1.00 3/12/2021 14/12/2021 4.60% 20.09% 19.64% 19.64% 0.15 0.66
C2FHA 199 20/04/2026 4.6 Real Estate 105.00 0.8 4.16% 3.24% Floating 4.25% Semi-Annual 4.27% $1.08 13/10/2021 20/10/2021 0.00% -0.07% - - 0.14 4.03
LFSPA 150 Perpetual - Diversified Financials
99.80 0.0 5.82% 4.80% Floating 4.75% Semi-Annual 3.34% $1.11 18/01/2022 27/01/2022 - - - - - -
NFNG 251 Perpetual - Chemicals 87.50 1.8 6.81% 4.88% Floating 3.90% Semi-Annual 4.00% $2.00 6/10/2021 15/10/2021 0.08% 0.05% -0.43% -0.43% - -
RHCPA 260 Perpetual - Health Care 103.80 -0.3 6.52% 4.59% Floating 4.85% Quarterly 3.46% $1.74 27/09/2021 20/10/2021 -0.11% -0.03% -0.04% -0.04% - -
Listed Bonds / Convertibles / Preference Equity
AYUHC 115 15/12/2024 3.2 Diversified Financials
100.63 0.4 2.55% 1.93% Floating 2.00% Quarterly 2.03% $0.51 5/10/2021 14/10/2021 -0.16% 0.11% -0.74% -0.74% 0.04 2.90
AYUHD 207 15/12/2026 5.2 Diversified Financials
100.00 0.5 3.29% 2.25% Floating 2.15% Semi-Annual 2.18% $0.55 5/10/2021 14/10/2021 -0.23% -0.16% -0.44% -0.44% 0.03 4.62
AYUPA 120 Perpetual - Diversified Financials
107.10 3.3 6.88% 4.94% Fixed 7.14% Semi-Annual 5.00% $2.51 6/10/2021 15/10/2021 -0.21% 0.07% 0.51% 0.51% - -
CVCG 60 22/06/2023 1.7 Diversified Financials
96.20 0.0 6.68% 6.43% Floating 3.75% Quarterly 3.77% $0.95 9/12/2021 31/12/2021 0.18% 0.40% 0.27% 0.27% 0.22 1.44
NCCGA 23 30/09/2026 5.0 Diversified Financials
100.95 0.0 4.29% 3.28% Fixed 4.50% Quarterly 4.50% $2.25 22/03/2022 31/03/2022 -0.25% -0.20% - - 4.44 4.44
OBLHA 76 8/01/2022 0.3 Diversified Financials
100.00 0.0 4.22% 4.20% Floating 4.20% Quarterly 4.22% $1.06 20/12/2021 31/12/2021 -1.35% 2.01% -1.35% -1.35% 0.25 0.25
PPCHB 50 5/10/2022 1.0 Real Estate 100.00 -0.1 4.69% 4.58% Floating 4.65% Quarterly 4.68% $1.18 24/09/2021 5/10/2021 1.53% 0.07% 1.28% 1.28% 0.01 0.99
QUBHA 305 5/10/2023 2.0 Industrials 103.98 -0.1 2.16% 1.85% Floating 3.90% Quarterly 3.93% $0.99 24/09/2021 5/10/2021 -0.56% -0.48% -0.38% -0.38% 0.06 1.93
URFHC 175 24/12/2021 0.2 Real Estate 99.50 1.3 8.99% 8.39% Fixed 7.75% Quarterly 7.75% $1.95 17/09/2021 30/09/2021 1.00% 1.40% 1.01% 1.01% 1.45 1.45

BondAdviser | Fixed Income Research and Advisory Market Review: September 2021
General Disclosures
BondAdviser has acted on information provided to it and our research is subject to
change based on legal offering documents. This research is for informational purposes
only.
This information discusses general market activity, industry or sector trends, or other
broad-based economic, market or political conditions and should not be construed as
research or investment advice.
The content of this report is not intended to provide financial product advice and must
not be relied upon as such. The Content and the Reports are not and shall not be
construed as financial product advice. The statements and/or recommendations on this
web application, the Content and/or the Reports are our opinions only. We do not
express any opinion on the future or expected value of any Security and do not explicitly
or implicitly recommend or suggest an investment strategy of any kind.
The content and reports provided have been prepared based on available data to which
we have access. Neither the accuracy of that data nor the methodology used to produce
the report can be guaranteed or warranted. Some of the research used to create the
content is based on past performance. Past performance is not an indicator of future
performance. We have taken all reasonable steps to ensure that any opinion or
recommendation is based on reasonable grounds. The data generated by the research
is based on methodology that has limitations; and some of the information in the reports
is based on information from third parties.
We do not guarantee the currency of the report. If you would like to assess the currency,
you should compare the reports with more recent characteristics and performance of the
assets mentioned within it. You acknowledge that investment can give rise to substantial
risk and a product mentioned in the reports may not be suitable to you.
You should obtain independent advice specific to your circumstances, make your own
enquiries and satisfy yourself before you make any investment decisions or use the
report for any purpose. This report provides general information only. There has been
no regard whatsoever to your own personal or business needs, your individual
circumstances, your own financial position or investment objectives in preparing the
information.
We do not accept responsibility for any loss or damage, however caused (including
through negligence), which you may directly or indirectly suffer in connection with your
use of this report, nor do we accept any responsibility for any such loss arising out of
your use of, or reliance on, information contained on or accessed through this report.
© 2021 Bond Adviser Pty Ltd. All rights reserved.