Embed Size (px)
Citation preview

ANEMOS.plus SafeWind “Advanced Tools
for the Management of Electricity Grids with Large-Scale Wind Generation”.
EU FP6 Contract N°: 038692
“Multi-scale data assimilation, advanced wind modelling & forecasting with emphasis to extreme weather situations
for a safe large-scale wind power integration” EU FP7 Grant Agreement N°: 213740
DELIVERABLE REPORT The State of the Art in Short-Term Prediction of Wind Power
A Literature Overview, 2nd Edition
DOCUMENT TYPE Deliverable
DOCUMENT NAME: aplus deliverable_D1.2_STP-SOTA_v1.0.docx
VERSION: V1.0
DATE: 2011.01.28
CLASSIFICATION: R0: General public
STATUS: Released Abstract: This Deliverable of ANEMOS.plus and SafeWind projects presents the state of the art in wind power forecasting. More than 380 references of journal and conference papers have been reviewed.

ANEMOS.plus/SafeWind The State of the Art in Short-Term Prediction of Wind PowerA Literature Overview, 2nd Edition
DELIVERABLE REPORT 2011-01-30 2
AUTHORS1
MAIN AUTHOR/EDITOR:
, REVIEWERS G. Giebel et al.
AFFILIATION: Risø DTU, Wind Energy Division
ADDRESS: Frederiksborgvej 399, 4000 Roskilde, Denmark
TEL.: +45 4677 5095
EMAIL: [email protected]
FURTHER AUTHORS: Richard Brownsword, RAL; George Kariniotakis, ARMINES; Michael Denhard, ECMWF ; Caroline Draxl, Risø DTU
PEER REVIEWERS: I. Marti (CENER), P. Pinson (DTU)
REVIEW APPROVAL: Approved : X Rejected (improve as indicated below) :
SUGGESTED
IMPROVEMENTS:
VERSION HISTORY VERSION2 DATE: : COMMENTS, CHANGES, STATUS: PERSON(S):
Previous version from the original ANEMOS project GG
0.7 2009-09-22 First version on new template GG et al
0.8 2009-09-27 Version for Review GG
0.9 2010 Version for public beta (all project members plus selected outside
colleagues) before publication GG
1.0 30-01-2011 Final version for publication of the 2nd Edition GG
STATUS, CONFIDENTIALITY, ACCESSIBILITY STATUS: CONFIDENTIALITY: ACCESSIBILITY:
S0 Approved/Released X R0 General public X Private web site S1 Reviewed R1 Restricted to project members Public web site X S2 Pending for review R2 Restricted to European Commission Paper copy S3 Draft for comments R3 Restricted to WP members + PL S4 Under preparation R4 Restricted to Task members +WPL+PL
PL: Project leader WPL: Work package leader TL: Task leader
1 The authors of this document are solely responsible for its content, which does not represent the opinion of the European Community and the European Community is not responsible for any use that might be made of data appearing therein. 2 VERSION NAMING : V0.x draft before peer-review approval, V1.0 at the approval, V1.x minor revisions, V2.0 major revision

ANEMOS.plus/SafeWind The State of the Art in Short-Term Prediction of Wind PowerA Literature Overview, 2nd Edition
DELIVERABLE REPORT 2011-01-30 3
Contents
1. Introduction .................................................................................................................. 4
1.1 Preface to the second edition ................................................................................... 4 1.2 Timescales ............................................................................................................... 4 1.3 The typical model chain ............................................................................................ 5 1.4 Evaluation of forecasting models .............................................................................. 8 1.5 Typical results .........................................................................................................10 1.6 Actual results from forecasting models ....................................................................15 1.7 Visualisations of probabilistic forecasts ....................................................................22 1.8 Improvements in Short-term Forecasting Quality .....................................................25
2. Time series models .....................................................................................................26 2.1 Direct time series models ........................................................................................26 2.2 Neural networks for time series forecasts ................................................................28 2.3 An explanation of the time series model improvements ...........................................29 2.4 Power modelling ......................................................................................................29
3. Meteorological modelling for wind power predictions ..................................................32 3.1 Operational NWP systems .......................................................................................32
3.1.1 Global models .................................................................................................................. 32 3.1.2 Limited area models ........................................................................................................ 34 3.1.3 MAP D-PHASE ................................................................................................................ 37
3.2 Improvements in NWP and meso-scale modelling ...................................................38 3.3 Ensemble NWP systems .........................................................................................42 3.4 Ensemble forecast applications for wind prediction ..................................................43 3.5 Ensemble Kalman Filtering ......................................................................................44
4. Short-term prediction models ......................................................................................46 5. Upscaling and spatio-temporal correlations ................................................................53
5.1 Models with offsite data input...................................................................................53 5.2 Upscaling ................................................................................................................54 5.3 Ramp forecasting ....................................................................................................61 5.4 Variability forecasting ..............................................................................................63
6. Uncertainty of wind power predictions .........................................................................64 6.1 Statistical approaches .............................................................................................64 6.2 Ensemble forecasts .................................................................................................65
7. The value of forecasting ..............................................................................................69 8. User demands on forecasting models .........................................................................73 9. The ANEMOS projects................................................................................................75 10. Concluding remarks ....................................................................................................77 11. Acknowledgements .....................................................................................................79 12. Glossary .....................................................................................................................80 13. Additional Literature ....................................................................................................82 14. References .................................................................................................................85

ANEMOS.plus/SafeWind The State of the Art in Short-Term Prediction of Wind PowerA Literature Overview, 2nd Edition
DELIVERABLE REPORT 2011-01-30 4
1. Introduction 1.1 Preface to the second edition This paper will give an overview over past and present attempts to predict wind power for single turbines, wind farms or for whole regions, for a few minutes up to a few days ahead. It was first produced for the ANEMOS project [1], which brought together many groups from Europe involved in the field, with up to 15 years of experience in short-term forecasting. The follow-up project ANEMOS.plus [2
Since the first edition of this report, 6 years have passed, and the field has practically exploded. Short-term prediction, in sync with the rise of wind power penetration in more and more countries, has risen from being a fringe topic for the few utilities with high levels of wind power in the grid, to being a central tool to many Transmission System Operators (TSOs) or power traders in or near areas with considerable levels of wind power penetration. At the same time, the amount of literature has risen dramatically, and while in the 2003 edition of the report the aim of including every paper ever written was feasible, this update has to forego completeness and aim to have at least the most important papers represented. While this report was the first large review of short-term prediction literature, a considerable (though not necessarily overlapping) number of reviews has appeared since. Various versions of this report appeared in [
], which concentrates on the best possible integration of the ANEMOS results in the work flow of end users, financed a thorough revision of this report. The literature search involved has been extensive, and it is hoped that this paper can serve as a reference for all further work.
3], [4] and [5], and a gentle (though by now dated) introduction to short-term predictions can also be found in Landberg et al. [6Probably the most comprehensive report to date comes from Argonne National Laboratory [
]. 7]. It gives
a good introduction to Numerical Weather Prediction (NWP), has a detailed market overview of currently available commercial models, and closes with the integration of wind power forecasts into the unit commitment process, especially in the US. Ernst et al. [8] show some recent international use cases and conclude that using a combination of models and forecasting for larger regions and shorter horizons can reduce the average error of the forecasts. Lange and Focken put their emphasis on the developments in Germany in [9]. Pinson gave an overview mainly on probabilistic forecasting [10], and concluded that the next breakthroughs were due in “models specific to different weather regimes, higher focus on potential use of ensemble forecasts, [and] spatio-temporal aspects of forecast uncertainty”. A review on 30 years of history of the wind power short-term prediction is also given by Costa et al. [11]. They concluded with a list of unsolved or even unexploited topics, amongst others “further research on the adaptive parameter estimation” and “new approaches on complex terrain (e.g., more accurate-and computationally feasible-turbulence closure models for microscale tools)”. The Canadian Wind Energy Association commissioned a study on international experiences in short-term forecasting [12]. This work, undertaken by Garrad Hassan (now part of Germanischer Lloyd Group), provides an overview of short-term wind energy forecasting including information about forecast models, their evaluation, forecasting experiences worldwide as well as a detailed summary of forecast providers. Lerner et al. of 3Tier [13] make the business case for forecasting, and argue that good predictability can make a difference at the time of siting the wind farm. Lei [14] wrote a short review as well. Additionally, a whole book devoted to short-term forecasting has appeared by Lange and Focken [15], alongside some book chapters by Ernst [16], Lange3 et al. [17] and a chapter in the book by Fox et al. [18]. To the list of overviews also belongs our work on the best practice in the use of short-term forecasting [19], which is a summary of the workshop series on the same topic [20Another change introduced for this report is the more extensive use of graphics from the cited papers. Essentially, the thinking here is to try to make the report as useful on its own as possible, and the graphs just support this. Finally, in the last years scientific publishing has moved predominantly online, which is reflected in the references section containing direct links to the papers and reports wherever possible.
].
1.2 Timescales One of the largest challenges of wind power, as compared to conventionally generated electricity, is its dependence on the volatility of the wind. This behaviour happens on all time scales, but two of them
3 Please note that there are two prominent Langes in short-term prediction, Bernhard Lange of Fraunhofer IWES (the former ISET) and Matthias Lange of Energy and Meteo Systems in Oldenburg. Both studied in Oldenburg at the same time, but are not related otherwise. Likewise, there are two Nielsens, Torben Skov Nielsen and Henrik Aalborg Nielsen, both previous at DTU.IMM, now at Enfor.

ANEMOS.plus/SafeWind The State of the Art in Short-Term Prediction of Wind PowerA Literature Overview, 2nd Edition
DELIVERABLE REPORT 2011-01-30 5
are most relevant: One is for the turbine control itself (from milliseconds to seconds), and the other one is important for the integration of wind power in the electrical grid, and therefore determined by the time constants in the grid (from minutes to weeks). Turbine control is out of scope of this overview, as it involves mainly advection of a wind field measured a few seconds before it hits the turbine, usually using a lidar in the nose of the turbine, and therefore is qualitatively different from the rest of the approaches mentioned here. One can distinguish the following types of applications: • Allocation of reserves based on the expected wind power feed. This aims at system security and
is done for instance in Ireland [21• Optimisation of the scheduling of conventional power plants by functions such as economic
dispatch etc. The prediction horizons can vary between 3-10 hours depending on the size of the system and the type of conventional units included (ie for systems including only fast conventional units, such as diesel gensets or gas turbines, the horizon can be below 3 hours). Only a few fully integrated on-line applications of this type are met today. Typically, these systems are used for smaller or isolated power systems, like island systems, though the optimisation for larger systems like Ireland is being evaluated, e.g. in the ANEMOS.plus project.
].
• Optimisation of the value of the produced electricity in the market. Such predictions are required by different types of end-users (utilities, TSOs, ESPs, IPPs, energy traders etc.) and for different functions such as unit commitment, economic dispatch, dynamic security assessment, participation in the electricity market, etc. The ANEMOS project and its successors are mainly concerned with the time scale given by the electricity markets, which in most European countries is from 0-48 hours.
• Additionally, even longer time scales would be interesting for the maintenance planning of large power plant components, wind turbines or transmission lines. However, the accuracy of weather predictions decreases strongly looking at 5-7 days in advance, and such systems are only just now starting to appear [22 187, , 329]. As Still [23] reported, shorter horizons can also be considered for maintenance, when it is important that the crew can safely return from the offshore turbines in the evening4. The north-western German Distribution System Operator (DSO) EWE [24
] is integrating wind forecasts into transformer maintenance routines to assess the line loading of the remaining rerouted electricity flows.
1.3 The typical model chain In general, the models can be classified as either involving a Numerical Weather Prediction model (NWP) or not. Whether the inclusion of a NWP model is worth the effort and expense of getting hold of it, depends on the horizon one is trying to predict. Typically, prediction models using NWP forecasts outperform time series approaches after ca 3-6 hours look-ahead time (see also section 1.4). Therefore, all models employed by utilities use this approach. Two different schools of thought exist w.r.t. short-term prediction: the physical and the statistical approach. In most operational and commercial models, a combination of both is used, as indeed both approaches can be needed for successful forecasts. In short, the physical models try to use physical considerations as long as possible to reach to the best possible estimate of the local wind speed before using Model Output Statistics (MOS) or different relatively simple statistical techniques to reduce the remaining error. Statistical models in their pure form try to find the relationships between a wealth of explanatory variables including NWP results, and online measured power data, usually employing recursive techniques. Often, black-box models like advanced Recursive Least Squares or Artificial Neural Networks (ANN) are used. The more successful statistical models actually employ grey-box models, where some knowledge of the wind power properties is used to tune the models to the specific domain. Some of the statistical models can be expressed analytically, some (like ANNs) can not. The statistical models can be used at any stage of the modelling, and more often than not combine various steps into one.
4 The German Offshore Test Field Alpha Ventus had an incident like this in December 2009, when 11 workers were trapped for two days in a storm on the turbines in the North Sea.

ANEMOS.plus/SafeWind The State of the Art in Short-Term Prediction of Wind PowerA Literature Overview, 2nd Edition
DELIVERABLE REPORT 2011-01-30 6
Figure 1: The various forecasting approaches can be classified according to the type of input (SCADA indicates data available on-line). All models involving Meteo Forecasts have a horizon determined by the NWP model, typically 48 hours. (1): Short-term statistical approaches using only SCADA as input (horizons: <6
hours). (2): Physical or statistical approaches. Good performance for >3 hours. (2)+(3): Physical approach. Good performance for >3 hours. (1)+(2): Statistical approach using NWP as input. (1)+ (2)+(3): Combined approach.
If the model is formulated rather explicitly, as is typical for the physical approach, then the stages are downscaling, conversion to power, and upscaling: • The wind speed and direction from the relevant NWP level is scaled to the hub height of the
turbine. This involves a few steps, first finding the best-performing NWP level (often the wind speed at 10 m a.g.l. or at one of the lowest model or pressure levels). The NWP model results can be obtained for the geographical point of the wind farm or for a grid of surrounding points. In the first case the models could be characterised as “advanced power curve models”, in the second case as a “statistical downscaling” model. LocalPred for example uses principal component analysis and artificial intelligence techniques from the surrounding NWP grid points [227,25The next step is the so-called downscaling procedure. Whether the word comes from the earliest approach, where the geostrophic wind high up in the atmosphere was used and then downscaled to the turbine hub height, or whether it is used because in some newer approaches the coarser resolution of the NWP is scaled down to the turbines surroundings using a microscale model with much higher resolution, is not clear. While in the previous edition of this text, mesoscale models were grouped under the downscaling model, now we define them as being in the class of NWP models, since many current weather models already operate on the mesoscale. For example, the current operative models at DMI or DWD are in the order of 2-3 km horizontal resolution, which can only be done using mesoscale modelling.
].
The physical approach uses a meso- or microscale model for the downscaling. If a mesoscale model is run, the mesoscale model can be run for various cases in a look-up table approach. The same procedure holds for microscale models (including CFD). The difference between the two is mainly the maximum and minimum domain size and resolution attainable. One of the reasons for microscale models with their ability to resolve scales down to tens of metres or even smaller, is that the effective resolution, that is the scale at which features are actually resolved in the NWP model, is some 4-7 grid points [26, 27, 28]. Ie even for a 2 km resolution, only features in the order of 10 km are really taken into account. This means that micro-scale models, except in cases of very simple terrain, should always be able to improve the NWP forecasts.

ANEMOS.plus/SafeWind The State of the Art in Short-Term Prediction of Wind PowerA Literature Overview, 2nd Edition
DELIVERABLE REPORT 2011-01-30 7
• The downscaling process yields a wind speed and direction for the turbine hub height. This wind is then converted to power with a power curve. The use of the manufacturers power curve is the easiest approach, although research from a number of groups has shown it advantageous to estimate the power curve from the forecasted wind speed and direction and measured power. Most actual statistical models leave this step out and do a direct prediction of the power production for single turbines or whole wind farms, but all physical and some statistical models have this intermediate step explicitly or at least implicitly. Depending on forecast horizon and availability, measured power data can be used as additional input. In most cases, actual data is beneficial for improving on the residual errors in a MOS approach. If online data is available, then a self-calibrating recursive model is highly advantageous. This is part of the statistical approach. It can have the form of an explicit statistical model employed with advanced auto-regressive statistical methods, or as an ANN type black-box. However, sometimes only offline data is available, with which the model can be calibrated in hindsight. In recent years, a number of system operators have demanded to get online data from wind farms specifically to be used in their online prediction tools.
• If only one wind farm is to be predicted, then the model chain stops here (maybe adding the power for the different turbines of a wind farm while taking the wake losses into account). Since utilities usually want a prediction for the total area they service, the upscaling from the single results to the area total is the last step. If all wind farms in an area were to be predicted, this would involve a simple summation. However, since practical reasons forbid the prediction for thousands of wind farms, some representative farms are chosen to serve as input data for an upscaling algorithm. Helpful in this respect is that the error of distributed farms is reduced compared to the error of a single farm.
Not all short-term prediction models involve all steps and/or all types of input. In the early days of forecasting (1970ies), NWP data was not so widely available, therefore the first approaches were done with time series analysis techniques. But in an age where at least GFS forecasts from the USA are just a download away, there is no real incentive to not use it. Leaving out a few steps can be an advantage in some cases. For example, Prediktor [182] is independent of online data, and can bring results for a new farm from day 1, while the advanced statistical models need older data to learn the proper parameterisations5. However, this is bought with a reduced accuracy for rather short horizons. Alternatively, models using only SCADA data have a quite good accuracy for the first few hours, but without NWP input, they are generally useless for longer prediction horizons (except in very special cases of thermally driven winds with a very high pattern of daily recurrence). Landberg [29
The opposite is a direct transformation of the input variables to wind power. This is done by the use of grey- or black-box statistical models that are able to combine input such as NWPs of speed, direction, temperature etc. of various model levels together with on-line measurements such as wind power, speed, direction etc. With these models, even a direct estimation of regional wind power from the input parameters in a single step is possible. Whether it is better for a statistical model to leave out the wind speed step depends on a number of things, like the availability of data or the representativity of the wind speed and power for the area of the wind farm or region being forecasted.
] has shown that a simple NWP + physical downscaling approach is effectively linear, thereby being very easily amenable to MOS improvements – even to the point of overriding the initial physical considerations.
5 The commissioning behaviour of wind farms does not lend itself easily to statistical recursive approaches, as different turbines will be offline for various reasons during the commissioning process, so that the power data coming from the wind farm tends to be non-representative at many times. Some research is underway eg in the SafeWind project to tackle those issues.
Figure 2: Two different approaches for downscaling. NWP-A represents physical considerations, NWP-B a statistical approach or the use of a meso- or microscale model.

ANEMOS.plus/SafeWind The State of the Art in Short-Term Prediction of Wind PowerA Literature Overview, 2nd Edition
DELIVERABLE REPORT 2011-01-30 8
The optimal model is a combination of both, using physical considerations as far as necessary to capture the air flow in the region surrounding the turbines, and using advanced statistical modelling to make use of every bit of information given by the physical models.
1.4 Evaluation of forecasting models Most of the errors on wind power forecasting stem from the NWP model. There are two types of error: level errors and phase errors. Consider a storm front passing through: a level error misjudges the severity of the storm, while a phase error misplaces the onset and peak of the storm in time. While the level error is easy to get hold of using standard time series error measures, the phase error is harder to quantify, although it has a determining impact on the traditional error scores. A conundrum for forecasters is that higher resolution forecasts tend to capture more of the variability, but if there is just a slight phase error, the traditional error scores as explained in the following will be worse than with a very smooth forecast, even though the operator is probably more fond of the more “realistic” looking forecast. Landberg and Watson [183] pointed out that the use of the mean error may lead to misinterpretation as negative and positive errors may be averaged to give a low mean error. Kariniotakis [30
116
] emphasises the importance of evaluating the performance of a model against a variety of criteria, and particularly of using both RMS and MAE of forecasts. The improvement of one model over another as measured by MAE is lower than that by RMS as the RMS assigns larger weights to large errors. In some cases a positive RMS may even correspond to a negative MAE improvement for certain time steps. The same has also been found by Giebel [ ], where optimising a MOS function’s parameters lead to different results depending on whether the MAE was the cost function or the RMS. Nielsen and Ravn [31
These error measures work well when used for the same farm and the same time series. Farms with differently variable time series are not that easy to compare. For this reason a skill score was developed, which takes the different variability of the time series into account. In this way, different results can be compared against each other, without having to worry about the properties of the different time series. For a while, the POW’WOW project (Prediction Of Waves, Wakes and Offshore Wind) had a Virtual Laboratory [
] rigorously show that the optimal prognosis parameter depends on the error criterion. They identify three different criteria: “The prognosis value of the wind power production should be close to the average of the realised values. The sum of deviations between the prognosis value and realised values should be small. The prognosis should result in a low cost of the consequences of prognosis errors.” The first and second criterion are important for the electrical balance in the grid, the last one is important for the lowest cost integration of wind energy in the market.
32
] for researchers to compete or just to have a platform to source data for model development. Unfortunately, the success was quite limited, and hence it was discontinued.
Among the most important features to forecast are sudden and pronounced changes, like a storm front passing the utility’s area. To develop a measure for the quality of these forecasts is very difficult, however, and the best way to get a feeling for the quality of the forecasts is visual inspection of the data set [eg 33
Costello et al. [
]. Other uses of short-term prediction, related to storms, are the possibility of scheduling maintenance after or during a storm, as happened in Denmark during the hurricane in Dec 1999. The same applies for maintenance on offshore wind farms, where the sea might be too rough to safely access the turbines.
202] show an interesting approach: “In order to focus on particular situations, a dynamic approach was developed to examine correlations in detail. The aim is to estimate the probability of situations where Hirlam fails to predict local conditions for a certain period of time (i.e. due to local weather situations). For this purpose, cross-correlation was estimated using a sliding window of 100 hours. Then, the distribution of the obtained values was estimated as shown in Figure 3. The range of the values is between {–0.4 to 0.92}. This indicates that one should expect short periods at which, Hirlam forecasts will not be reliable. The frequency of these periods is however limited since the distributions are centered around the 0.8 correlation value.”

ANEMOS.plus/SafeWind The State of the Art in Short-Term Prediction of Wind PowerA Literature Overview, 2nd Edition
DELIVERABLE REPORT 2011-01-30 9
Figure 3: Distribution of correlation coefficient r(100) between Hirlam wind speed forecasts and measured wind park power. Source: Costello et al. [202]
There is a wealth of different forecasting criteria, and comparability of performance values in the literature was not easy. Therefore, it was one of the tasks of the ANEMOS project to establish a common set of performance measures with which to compare forecasts across systems and locations. These common error measures are the bias, MAE, RMSE, the coefficient of determination R2, the skill score for comparison with other models, and the error distribution as a histogram [34, 35, and as a journal paper in 36
]. The paper also emphasises the need to split the data set into separate training and validation sets, and proposes to use the normalised mean errors for a comparison across different wind farms. If there should be normalisation (recommended), it should be with the installed capacity, not the mean production. The reason for this is the scalability for large regions in case of additional wind farms: for the system operator, the installed capacity is easy to assess, while the mean production, especially for new wind farms, is hard to know with sufficient accuracy beforehand. An additional evaluation criterion is brought by the Spanish Wind Energy Association: the MAPE (Mean Absolute Percentage Error). This error type stems from the law governing that wind farm owners who want to participate in the electricity market have to predict their own power. Deviations from the declared schedule are punished according to this error measurement.
Tambke et al. [37
] presented the decomposition of RMSE into the three components: bias in mean wind speed, bias in standard deviation and dispersion. This is quite useful to determine whether the main contribution to the errors of the NWP model come from level errors or biases, or rather (if the dispersion term is large) from phase errors.
Bessa, Miranda and Gama [38
] argue, extending the principles of information theoretic learning (ITL) criteria in time-adaptive training of neural networks, that the applicability of mean square error (MSE) to train a neural network is optimal only if the probability distribution function of the prediction errors is Gaussian. Since the wind power forecast error presents an non-Gaussian shape, the authors propose two new training criteria based on minimizing the information content of the error distribution (instead of minimizing its variance, like in MSE). The first criterion is minimum error entropy (MEE), and consists on the minimization of the entropy of the error distribution. The second criterion is maximum correntropy criterion (MCC), and is related with a distance measure between two arbitrary scalar random variables X and Y satisfying all the properties of a metric. Both training criteria seek an error distribution with a shape of a Dirac function (minimum entropy), meaning that all errors would be equal and centered on zero. The results for three real wind farms shown that the ITL criteria lead to a better performance, compared to MSE, in terms of normalized mean absolute error (an independent criterion), and the correntropy based criterion is more effective than the MSE and MEE in isolating outliers.
0
0.1
0.2
0.3
0.4
0.5
-1.0 -0.8 -0.6 -0.4 -0.2 0.0 0.2 0.4 0.6 0.8 1.0
Correlation coefficient (r)
Den
sity
Fun
ctio
n
Level 10m
Level 22
Level 23
Level 24

ANEMOS.plus/SafeWind The State of the Art in Short-Term Prediction of Wind PowerA Literature Overview, 2nd Edition
DELIVERABLE REPORT 2011-01-30 10
During the ANEMOS project, a discussion came up whether it was more “user-friendly” to use the availability time of the forecast as zero time, and not the NWP initialisation time. Since the NWP calculation usually takes a few hours (the short-term models themselves are usually very quick to run), the user does not have access to the predictions from hour zero. However, this way of looking at the forecast zero time convolutes the precision of the forecast with the delay involved in getting the forecast. A short excursion here on run times of meteorological models: many large weather centres bring out a new prediction every six hours, which means that data assimilation and the actual model run must be finished well within those six hours. Other approaches are to run the model in a “hot” mode to avoid spin-up, and use new data fields every hour to nudge the initial fields. This could (with the computing resources at the time) only be run for 12 hours ahead, and is called Rapid Update Cycle [39, 40, 41
].
Vincent et al. [42
] worked on a scheme for the spectral verification of forecasts, ie the verification of the envelope of variance of various frequencies in the forecasts versus the same frequencies in the measurements. The adaptive spectral method they adopted, the Hilbert-Huang transform, verifies variability, but not phase, using instantaneous frequencies. In their application for the 75 MSEPS members for Horns Rev, differences between the various ensemble members could be distinguished and summarised.
For the evaluation of probabilistic models, please refer to the short discussion in the introduction to chapter 6.
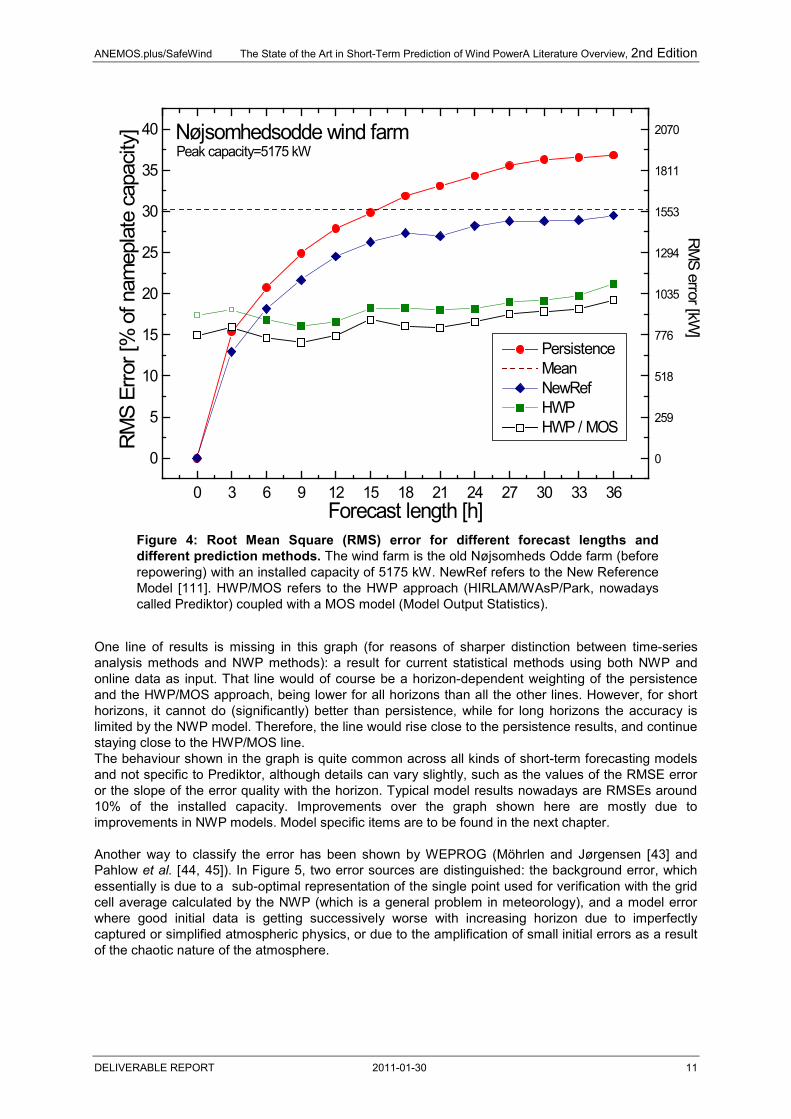
1.5 Typical results The verification of model performance is dependent on the error type. Models can be good at one particular error, and bad at another. The typical behaviour of the error function for models using time series approaches or NWP is shown in Figure 4 for the case of Prediktor applied to an older Danish wind farm in the mid-nineties (the farm has been repowered since), using RMSE as the error measure. A number of features are noteworthy. Persistence (also called the naïve predictor) is the model most frequently used to compare the performance of a forecasting model against. It is one of the simplest prediction models, second only to predicting the mean value for all times (a climatology prediction). In this model, the forecast for all times ahead is set to the value it has now. Hence, by definition the error for zero time steps ahead is zero. For short prediction horizons (eg, a few minutes or hours), this model is the benchmark all other prediction models have to beat. This is because the dominant time scales of large synoptic scale changes in the atmosphere are in the order of days (at least in Europe, where the penetration of wind power is still highest). It takes in the order of days for a low-pressure system to cross the continent. Since the pressure systems are the driving force for the wind, the rest of the atmosphere undergoes periodicity on the same time scales. High-pressure systems can be more stationary, but these are typically not associated with high winds, and therefore not so important in this respect. Mesoscale features (fronts, low pressure troughs, large thunderstorms, mesoscale cellular convection, gravity waves etc.) operate on time scales of hours, and have reasonable predictability using mesoscale models. To predict much better than persistence for short horizons using the same input, that is, online measurements of the predictand, is only possible with some effort. One can see that persistence beats the NWP-based model easily for short prediction horizons (ca 3-6 hours). However, for forecasting horizons beyond ca 15 hours, even forecasting with the climatological mean (the dashed line) is better. This is not surprising, since it can be shown theoretically [111] that the mean square error of forecasting by mean value is half the one of the mean square error of a completely decorrelated time series with the same statistical properties (which is similar to persistence for very long horizons). After about 4 hours the quality of the “raw” NWP model output (marked HWP, full squares) is better than persistence even without any postprocessing. The quality of the New Reference Model [111] (essentially persistence with a trend towards the mean of the time series) is reached after 5 hours. The relatively small slope of the line is a sign of the relatively poor quality of the assessment of the initial state of the atmosphere by the NWP, but of the good quality of the predictive equations used in the model from that initial state. The first two points in the HWP line are fairly theoretical; due to the data assimilation and calculating time of HIRLAM (~4 hours) these cannot be used for practical applications and could be regarded as hindcasting. The improvement attained through use of a simple linear MOS (the line marked HWP/MOS, the model now known as Prediktor, open squares) is quite pronounced.
ANEMOS.plus/SafeWind The State of the Art in Short-Term Prediction of Wind PowerA Literature Overview, 2nd Edition
DELIVERABLE REPORT 2011-01-30 11
One line of results is missing in this graph (for reasons of sharper distinction between time-series analysis methods and NWP methods): a result for current statistical methods using both NWP and online data as input. That line would of course be a horizon-dependent weighting of the persistence and the HWP/MOS approach, being lower for all horizons than all the other lines. However, for short horizons, it cannot do (significantly) better than persistence, while for long horizons the accuracy is limited by the NWP model. Therefore, the line would rise close to the persistence results, and continue staying close to the HWP/MOS line. The behaviour shown in the graph is quite common across all kinds of short-term forecasting models and not specific to Prediktor, although details can vary slightly, such as the values of the RMSE error or the slope of the error quality with the horizon. Typical model results nowadays are RMSEs around 10% of the installed capacity. Improvements over the graph shown here are mostly due to improvements in NWP models. Model specific items are to be found in the next chapter. Another way to classify the error has been shown by WEPROG (Möhrlen and Jørgensen [43] and Pahlow et al. [44, 45 Figure 5]). In , two error sources are distinguished: the background error, which essentially is due to a sub-optimal representation of the single point used for verification with the grid cell average calculated by the NWP (which is a general problem in meteorology), and a model error where good initial data is getting successively worse with increasing horizon due to imperfectly captured or simplified atmospheric physics, or due to the amplification of small initial errors as a result of the chaotic nature of the atmosphere.
0 3 6 9 12 15 18 21 24 27 30 33 36
0
5
10
15
20
25
30
35
40
0
259
518
776
1035
1294
1553
1811
2070
Peak capacity=5175 kW
RM
S error [kW]
Nøjsomhedsodde wind farm
Persistence Mean NewRef HWP HWP / MOS
RM
S Er
ror [
% o
f nam
epla
te c
apac
ity]
Forecast length [h] Figure 4: Root Mean Square (RMS) error for different forecast lengths and different prediction methods. The wind farm is the old Nøjsomheds Odde farm (before repowering) with an installed capacity of 5175 kW. NewRef refers to the New Reference Model [111]. HWP/MOS refers to the HWP approach (HIRLAM/WAsP/Park, nowadays called Prediktor) coupled with a MOS model (Model Output Statistics).

ANEMOS.plus/SafeWind The State of the Art in Short-Term Prediction of Wind PowerA Literature Overview, 2nd Edition
DELIVERABLE REPORT 2011-01-30 12
Figure 5: Typical errors introduced by the NWP. Source: Möhrlen [46
].
In these figures, there is no obvious wind speed dependency of the error. Actually, the wind speed error of a NWP model doesn’t seem to depend much on the level of predicted wind speed, as Lange and Heinemann [308] show in the left graph of Figure 6. But the non-linear power curve (central plot) skews the distribution significantly. Therefore, the distribution of errors per power bracket is non-uniformly distributed.
Figure 6: The error is non-linearly distributed over the power brackets. The error is fairly linear at about 1 m/s for the shown model. However, folding this through the wind farm power curve introduces non-linearities and increases the error in the rising part of the power curve, while decreasing it in the flatter parts. Source: [308], central plot [15]
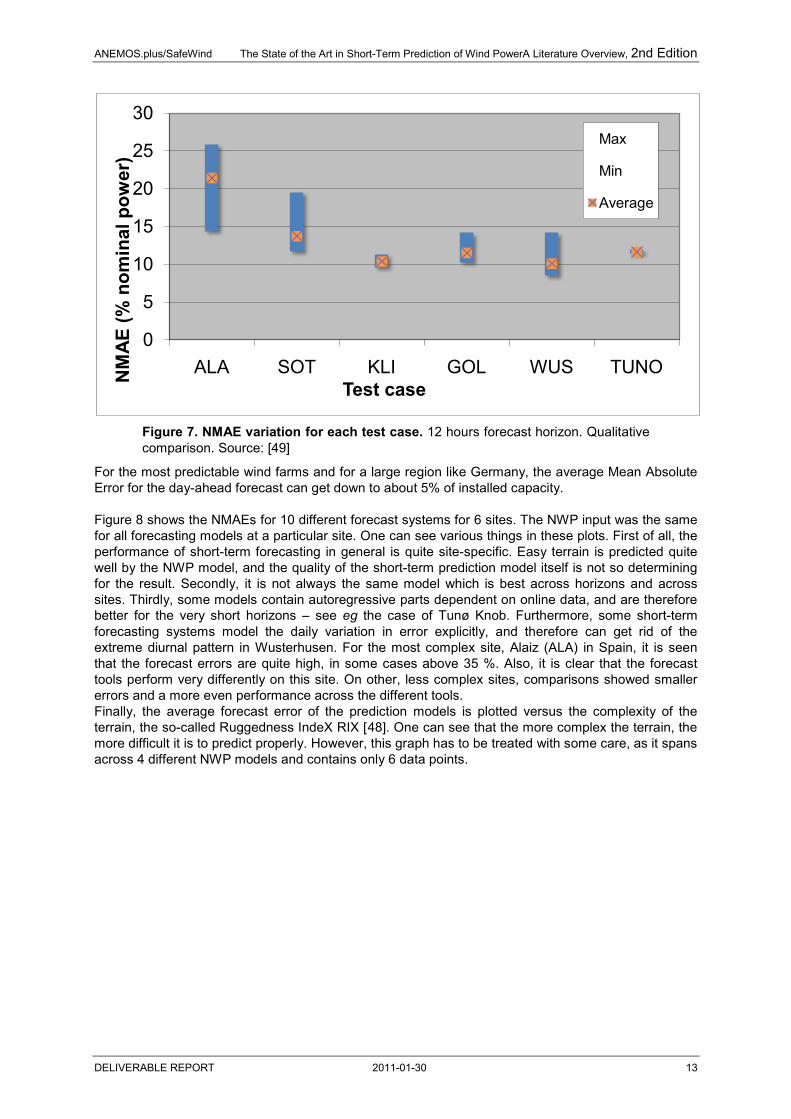
Typical forecast accuracies for single wind farms can vary quite dramatically. For the EU ANEMOS project, a comparison of 11 state-of-the-art tools was made for 6 sites in Europe [47
Figure 7
], and the comparison shows that the differences between the wind farms, but also between the forecasting models are quite large.
shows the NMAE variation for each site. The ALA test site is characterized as highly complex, SOT and GOL as complex, KLI and WUS as flat, and TUNO as offshore. The forecast errors are generally higher for more complex terrain, and the difference between the tools is also most significant for most complex terrain.
ANEMOS.plus/SafeWind The State of the Art in Short-Term Prediction of Wind PowerA Literature Overview, 2nd Edition
DELIVERABLE REPORT 2011-01-30 13
Figure 7. NMAE variation for each test case. 12 hours forecast horizon. Qualitative comparison. Source: [49]
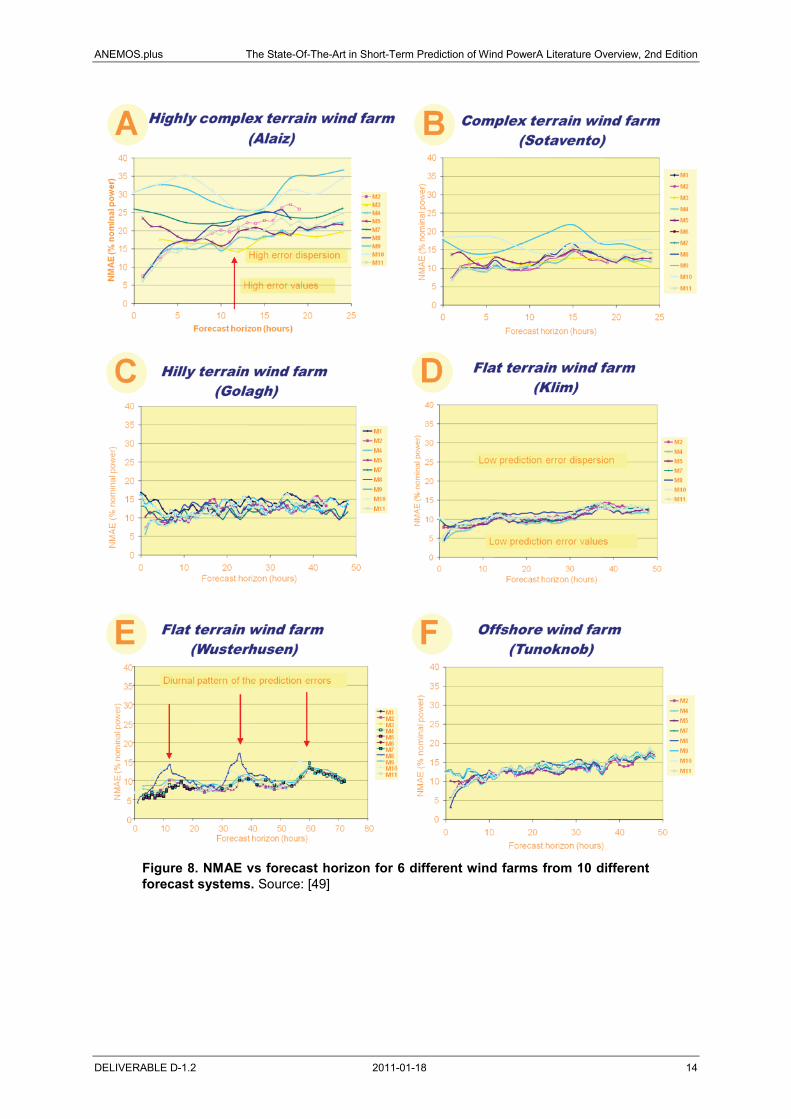
For the most predictable wind farms and for a large region like Germany, the average Mean Absolute Error for the day-ahead forecast can get down to about 5% of installed capacity. Figure 8 shows the NMAEs for 10 different forecast systems for 6 sites. The NWP input was the same for all forecasting models at a particular site. One can see various things in these plots. First of all, the performance of short-term forecasting in general is quite site-specific. Easy terrain is predicted quite well by the NWP model, and the quality of the short-term prediction model itself is not so determining for the result. Secondly, it is not always the same model which is best across horizons and across sites. Thirdly, some models contain autoregressive parts dependent on online data, and are therefore better for the very short horizons – see eg the case of Tunø Knob. Furthermore, some short-term forecasting systems model the daily variation in error explicitly, and therefore can get rid of the extreme diurnal pattern in Wusterhusen. For the most complex site, Alaiz (ALA) in Spain, it is seen that the forecast errors are quite high, in some cases above 35 %. Also, it is clear that the forecast tools perform very differently on this site. On other, less complex sites, comparisons showed smaller errors and a more even performance across the different tools. Finally, the average forecast error of the prediction models is plotted versus the complexity of the terrain, the so-called Ruggedness IndeX RIX [48
]. One can see that the more complex the terrain, the more difficult it is to predict properly. However, this graph has to be treated with some care, as it spans across 4 different NWP models and contains only 6 data points.
0
5
10
15
20
25
30
ALA SOT KLI GOL WUS TUNONM
AE (%
nom
inal
pow
er)
Test case
Max
Min
Average
ANEMOS.plus The State-Of-The-Art in Short-Term Prediction of Wind PowerA Literature Overview, 2nd Edition
DELIVERABLE D-1.2 2011-01-18 14
Figure 8. NMAE vs forecast horizon for 6 different wind farms from 10 different forecast systems. Source: [49]

ANEMOS.plus/SafeWind The State of the Art in Short-Term Prediction of Wind PowerA Literature Overview, 2nd Edition
DELIVERABLE REPORT 2011-01-30 15
Figure 9: The average forecasting error of 11 forecasting models for the next day forecast in relation to the complexity of the terrain. Higher RIX values mean higher complexity. Source: [49
A similar data point is achieved with the 12.5km resolution MesoLAPS model (now replaced by the ACCESS model) of the Australian Bureau of Meteorology feeding WPPT for a wind farm in Tasmania [
]
50
Interestingly, Vidal et al. [
], Here, on the north-western tip of Tasmania, situated on a cliff, the results are 25% RMSE. The RIX of the wind farm is up to 6%, but the complexity of the terrain is higher than this relatively little value indicates, with the wind farm being positioned on top of a cliff overlooking the ocean.
220] come to a slightly different result for the individual members of a 9-member ensemble using two different Model Output Statistics steps: “The performance of the MOS_1 and MOS_2 predictions during the first 24 hours of forecast is inversely correlated with the terrain complexity; the more complex, the less performance is obtained. During the second and third day, the accuracy of the forecast seems to be independent of the terrain features, depending on the NWP models used and the training sample for the MOS calculations.”
1.6 Actual results from forecasting models For utilities or other potential users, it might be interesting to see what the actual forecast errors look like. Therefore, we copied and pasted in this section a number of publicly available forecasts, so that potential end users can assess the impact of forecasting (or the lack thereof) on their own business. It has to be said that many times, the forecasts will behave like the good forecasts shown here, but that is obviously not as interesting for publication than bad forecasts are, therefore we find proportionally more bad forecasts being published than good (i.e., unspectacular) ones. Matthias Lange, now one of the two owners of energy&meteo systems, showed the following plots in his PhD thesis [51
0
5
10
15
20
25
0 2 4 6 8 10 12 14 16
RIX (%)
Ave
rage
NM
AE
(% n
omin
al p
ower
)
TUN (offshore)
KLI
WUSGOL
SOT
ALA
FLAT TERRAIN
COMPLEX TERRAIN
HIGHLYCOMPLEX TERRAIN
]. The forecasts were done with data from the Deutscher Wetterdienst (DWD) using the forecasting tool Previento. In the first two examples, a good forecast is compared to a mediocre forecast.

ANEMOS.plus/SafeWind The State of the Art in Short-Term Prediction of Wind PowerA Literature Overview, 2nd Edition
DELIVERABLE REPORT 2011-01-30 16
Figure 10: A good forecast (6-24h) for a single site in Northern Germany. The agreement is rather well, especially the timing of the slopes.
Figure 11: A mediocre forecast (6-24h) for a single site in Northern Germany.
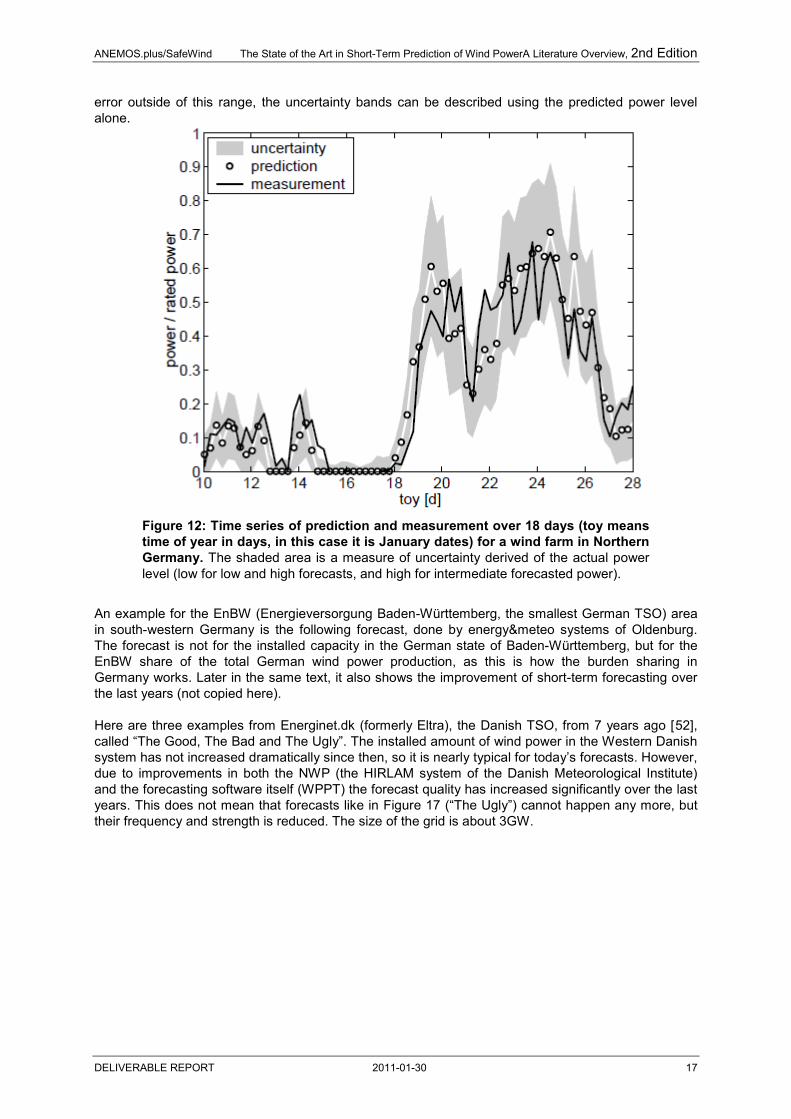
In Figure 11, we see examples of both major error classes: amplitude errors and phase errors. On day 254, a typical amplitude error occurs where the rise in production is timed correctly, but the amount of wind power produced is severely overstated. On day 257 on the other hand, the amplitude is predicted correctly, but the timing of the event is off, especially for the downward slope. This error type is called a phase error. His last example shows the possibility to derive a quite simple measure of the forecast uncertainty just from the predicted power level. Since the slope of the power curve amplifies wind speed prediction errors between cut-in and rated wind speed (i.e., between ca 4 m/s and 11 m/s), but filters away the
ANEMOS.plus/SafeWind The State of the Art in Short-Term Prediction of Wind PowerA Literature Overview, 2nd Edition
DELIVERABLE REPORT 2011-01-30 17
error outside of this range, the uncertainty bands can be described using the predicted power level alone.
Figure 12: Time series of prediction and measurement over 18 days (toy means time of year in days, in this case it is January dates) for a wind farm in Northern Germany. The shaded area is a measure of uncertainty derived of the actual power level (low for low and high forecasts, and high for intermediate forecasted power).
An example for the EnBW (Energieversorgung Baden-Württemberg, the smallest German TSO) area in south-western Germany is the following forecast, done by energy&meteo systems of Oldenburg. The forecast is not for the installed capacity in the German state of Baden-Württemberg, but for the EnBW share of the total German wind power production, as this is how the burden sharing in Germany works. Later in the same text, it also shows the improvement of short-term forecasting over the last years (not copied here). Here are three examples from Energinet.dk (formerly Eltra), the Danish TSO, from 7 years ago [52
Figure 17
], called “The Good, The Bad and The Ugly”. The installed amount of wind power in the Western Danish system has not increased dramatically since then, so it is nearly typical for today’s forecasts. However, due to improvements in both the NWP (the HIRLAM system of the Danish Meteorological Institute) and the forecasting software itself (WPPT) the forecast quality has increased significantly over the last years. This does not mean that forecasts like in (“The Ugly”) cannot happen any more, but their frequency and strength is reduced. The size of the grid is about 3GW.

ANEMOS.plus/SafeWind The State of the Art in Short-Term Prediction of Wind PowerA Literature Overview, 2nd Edition
DELIVERABLE REPORT 2011-01-30 18
Figure 13: The forecast error for the area of EnBW for the day-ahead forecast of Previento. Source: [53
]
Figure 14: The forecast error for the area of EnBW for the day-ahead forecast of Previento. Source: [53]

ANEMOS.plus/SafeWind The State of the Art in Short-Term Prediction of Wind PowerA Literature Overview, 2nd Edition
DELIVERABLE REPORT 2011-01-30 19
Figure 15: “The Good”. Average energy per quarter hour on Nov 6, 2000. The forecast is from Nov 5, 1100 hours. Måling = measurements, afvigelse = deviation, udregnet den = calculated on.
Figure 16: “The Bad”. Average energy per quarter hour on Oct 25, 2000. The forecast is from Oct 24, 1100 hours. The Danish note says: “At this time of the day, the deviation corresponded to 1/3 of the total demand.”
Figure 17: ”The Ugly”. Average energy per quarter hour on Dec 11, 2000. The forecast was calculated on Dec 10, 1100 hours.
ANEMOS.plus/SafeWind The State of the Art in Short-Term Prediction of Wind PowerA Literature Overview, 2nd Edition
DELIVERABLE REPORT 2011-01-30 20
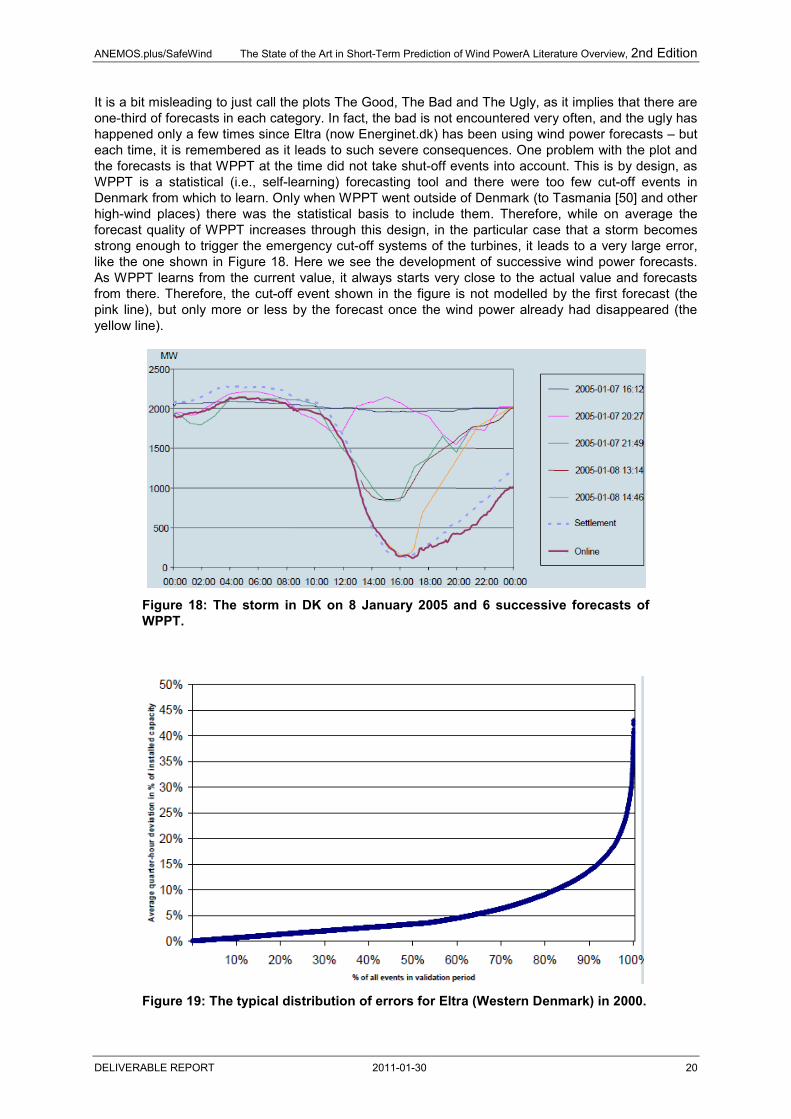
It is a bit misleading to just call the plots The Good, The Bad and The Ugly, as it implies that there are one-third of forecasts in each category. In fact, the bad is not encountered very often, and the ugly has happened only a few times since Eltra (now Energinet.dk) has been using wind power forecasts – but each time, it is remembered as it leads to such severe consequences. One problem with the plot and the forecasts is that WPPT at the time did not take shut-off events into account. This is by design, as WPPT is a statistical (i.e., self-learning) forecasting tool and there were too few cut-off events in Denmark from which to learn. Only when WPPT went outside of Denmark (to Tasmania [50] and other high-wind places) there was the statistical basis to include them. Therefore, while on average the forecast quality of WPPT increases through this design, in the particular case that a storm becomes strong enough to trigger the emergency cut-off systems of the turbines, it leads to a very large error, like the one shown in Figure 18. Here we see the development of successive wind power forecasts. As WPPT learns from the current value, it always starts very close to the actual value and forecasts from there. Therefore, the cut-off event shown in the figure is not modelled by the first forecast (the pink line), but only more or less by the forecast once the wind power already had disappeared (the yellow line).
Figure 18: The storm in DK on 8 January 2005 and 6 successive forecasts of WPPT.
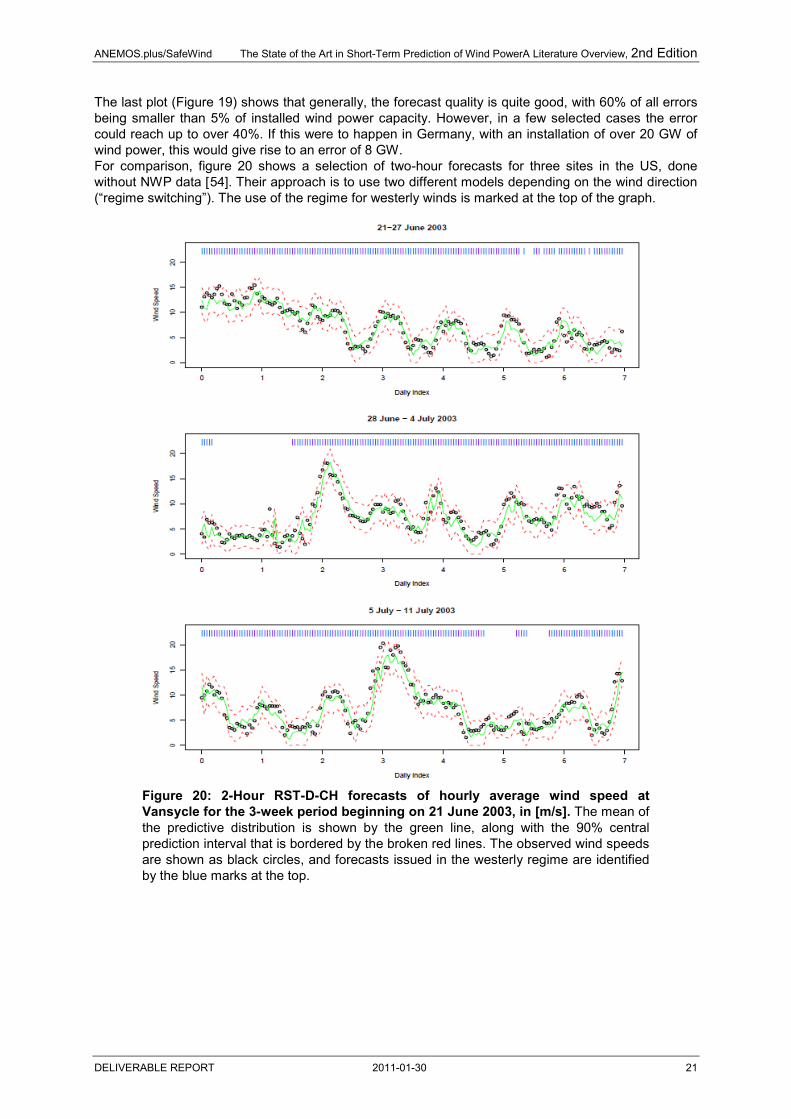
Figure 19: The typical distribution of errors for Eltra (Western Denmark) in 2000.
ANEMOS.plus/SafeWind The State of the Art in Short-Term Prediction of Wind PowerA Literature Overview, 2nd Edition
DELIVERABLE REPORT 2011-01-30 21
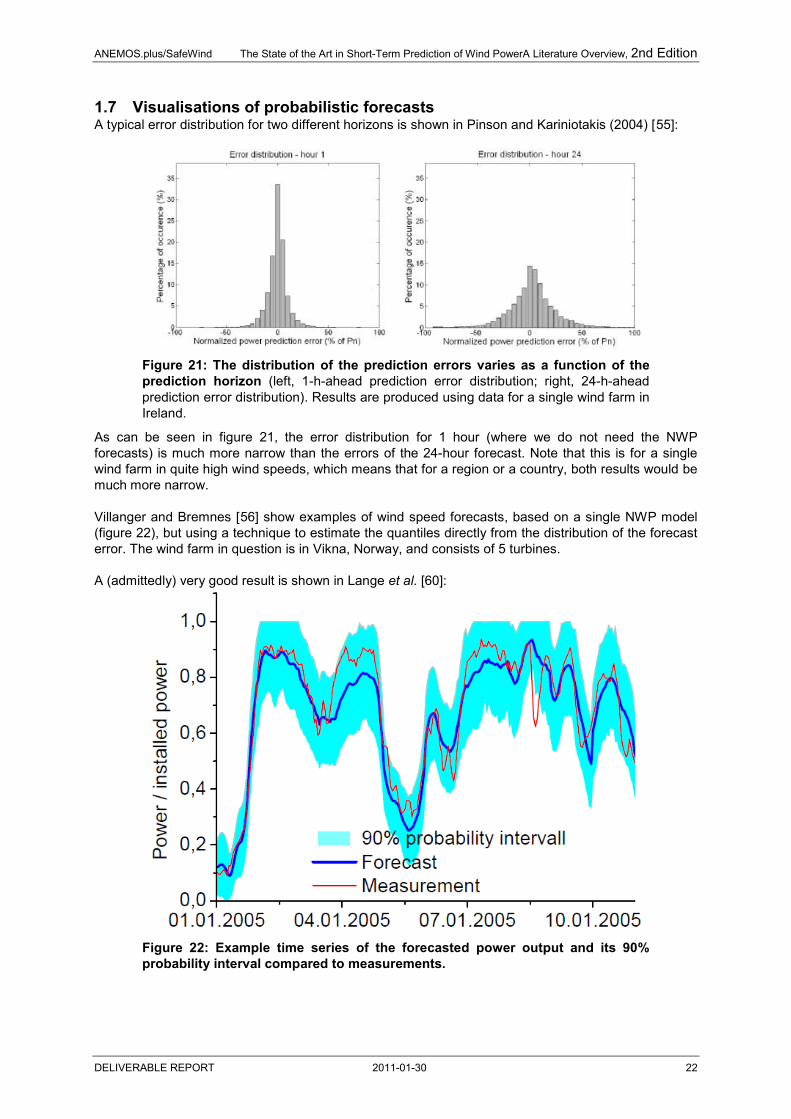
The last plot (Figure 19) shows that generally, the forecast quality is quite good, with 60% of all errors being smaller than 5% of installed wind power capacity. However, in a few selected cases the error could reach up to over 40%. If this were to happen in Germany, with an installation of over 20 GW of wind power, this would give rise to an error of 8 GW. For comparison, figure 20 shows a selection of two-hour forecasts for three sites in the US, done without NWP data [54
]. Their approach is to use two different models depending on the wind direction (“regime switching”). The use of the regime for westerly winds is marked at the top of the graph.
Figure 20: 2-Hour RST-D-CH forecasts of hourly average wind speed at Vansycle for the 3-week period beginning on 21 June 2003, in [m/s]. The mean of the predictive distribution is shown by the green line, along with the 90% central prediction interval that is bordered by the broken red lines. The observed wind speeds are shown as black circles, and forecasts issued in the westerly regime are identified by the blue marks at the top.
ANEMOS.plus/SafeWind The State of the Art in Short-Term Prediction of Wind PowerA Literature Overview, 2nd Edition
DELIVERABLE REPORT 2011-01-30 22
1.7 Visualisations of probabilistic forecasts A typical error distribution for two different horizons is shown in Pinson and Kariniotakis (2004) [55
]:
Figure 21: The distribution of the prediction errors varies as a function of the prediction horizon (left, 1-h-ahead prediction error distribution; right, 24-h-ahead prediction error distribution). Results are produced using data for a single wind farm in Ireland.
As can be seen in figure 21, the error distribution for 1 hour (where we do not need the NWP forecasts) is much more narrow than the errors of the 24-hour forecast. Note that this is for a single wind farm in quite high wind speeds, which means that for a region or a country, both results would be much more narrow. Villanger and Bremnes [56
] show examples of wind speed forecasts, based on a single NWP model (figure 22), but using a technique to estimate the quantiles directly from the distribution of the forecast error. The wind farm in question is in Vikna, Norway, and consists of 5 turbines.
A (admittedly) very good result is shown in Lange et al. [60]:
Figure 22: Example time series of the forecasted power output and its 90% probability interval compared to measurements.

ANEMOS.plus/SafeWind The State of the Art in Short-Term Prediction of Wind PowerA Literature Overview, 2nd Edition
DELIVERABLE REPORT 2011-01-30 23
The example in Figure 22 shows the aggregate next-day forecast of the Wind Power Management System by ISET of Germany for all of Germany. The example is chosen to be quite well-fitting, as more than 90% of all points of that particular graph are within the 90% interval.
Figure 23: Three examples of hourly wind speed (left) and wind power (right) forecasts including their 95, 75, 50, 25, and 5 percentiles. Observations are indicated by filled circles.
Another example of probabilistic forecasts is shown in Pinson et al. (2006) [57Figure 24
], reproduced here in .

ANEMOS.plus/SafeWind The State of the Art in Short-Term Prediction of Wind PowerA Literature Overview, 2nd Edition
DELIVERABLE REPORT 2011-01-30 24
Figure 24: Example of wind power point prediction associated with a set of interval forecasts. The point predictions are given by WPPT and interval forecasts are estimated consequently with the adapted resampling method.
Here, the forecast for two days is shown together with the derived quantiles. The method is adapted resampling, applied to two days of forecasts done by WPPT (the Wind Power Prediction Tool of DTU and Enfor) for the offshore wind farm at Tunø Knob in Denmark. A totally different weather pattern exists in Alberta, Canada [58
], where the Chinook comes in patterns over the mountains with low predictability.
Figure 25: Measurements and calculated quantiles for 6 wind farms in Alberta, Canada. Picture from WEPROG. The measurements are the dark blue dotted line which is identical in both plots. The forecasts to the left show the large-scale model, the forecasts to the right the smaller scale model.
Example forecasts from WEPROG for this location are shown in Figure 25, where the left hand plot is for a low resolution model and the right hand plot is for a high resolution model. The interesting feature here is that, on the left hand plot, the drop in production between 6 and 11 UTC is not captured at all, while in the right-hand image it is clearly captured. So for this case, using finer scale modelling helped the accuracy of the forecasts a lot. This is not always the case, as the modelling effort performed in the ANEMOS project showed [59].

ANEMOS.plus/SafeWind The State of the Art in Short-Term Prediction of Wind PowerA Literature Overview, 2nd Edition
DELIVERABLE REPORT 2011-01-30 25
1.8 Improvements in Short-term Forecasting Quality Recently, a few papers have been published on the increasing quality of short-term prediction services during the last years. In Germany, the TSO’s are required by law to use multiple forecasts, which increased competition both in price and in forecast accuracy. The ISET (Institut für Solare Energieversorgungstechnik e.V., Kassel, Germany, now Fraunhofer IWES) was the first short-term forecasting provider for transmission system operators in Germany. In a widely cited paper for the EWEC 2006, B. Lange et al. [60
Note that their competitor, energy&meteo systems, claims a forecasting RMSE of below 5% for the day-ahead forecast for all of Germany in 2008 [
] presented the following plot for the accuracy of the next-day forecast in the E.On control zone. They state the main reasons for the improvement were (i) taking into account the influence of atmospheric stability into the models which led to a reduction in forecast error (RMSE) by more than 20% for the example of one German TSO control zone (ii) a combination of different models, both for forecasting methods as well as for NWP models. The comparison of the mean RMSE of a wind power forecast for Germany obtained with the WPMS based on ANN with input data from three different NWP models and with a combination of these models showed a decrease in RMSE from approx. 6% to 4.7%.
61], which also the IWES has achieved [62A similar plot, though constrained to the last two years, was shown by Krauss et al. [
]. 63
] for the EnBW TSO area. They show the monthly accuracy of three different forecasting systems for the aggregate error, and conclude that there are significant changes in forecast accuracy from month to month, and that the ranking of the three models changes from month to month as well.
Figure 26: The development of the forecast error during the last years in the E.On Netz area. The numbers in square brackets are references from Lange et al. [60].

ANEMOS.plus/SafeWind The State of the Art in Short-Term Prediction of Wind PowerA Literature Overview, 2nd Edition
DELIVERABLE REPORT 2011-01-30 26
2. Time series models For short horizons, the relevant time scales are given by: the mechanics of the wind turbine: typically the generator, gearbox, yaw mechanism and most of
all, the (blade) pitch regulation. The time scales involved are in the order of turbulence, ie seconds. The purpose is the active control of the wind turbines. Wind on those time scales is inherently non-stationary (compare also the excursion on why wind is non-stationary in [64
the type of the power system into which the wind turbines are integrated. As mentioned in the introduction in small or medium isolated systems the relevant time scale is given by the type of conventional units (“fast” or “slow”) and the functions for which the forecasts are required (ie for economic dispatch horizons can be 10 minutes to 1 hour while for unit commitment they can be a few hours head). It is typical for smaller island systems to consist of Diesel generators with quite short time scales.
]), and can best be forecasted with a Lidar staring into the wind and a simple advection scheme of the measured wind field a few seconds ahead the rotor.
The typical approach is to use time series analysis techniques or neural networks.
2.1 Direct time series models If the forecasting horizon is not too long (see the discussion of Figure 4 when that happens), wind speed and power can be forecast just using time series analysis methods, without resorting to actual weather forecasts. Direct time series models are models which use recent observed values of wind and other variables to predict the future wind speed. While there had been attempts to forecast wind speeds before, the first paper considering wind power forecasts came from Brown, Katz and Murphy in 1984 [65
291
]. In retrospect, it is surprising how complete the paper already was, using a transformation to a Gaussian distribution of the wind speeds, forecasting with a AR (AutoRegressive) process, upscaling with the power law (but discussing the potential benefit of using the log law), and then predicting power using a measured power curve. Additionally, the removal of seasonal and diurnal swings in the AR components is discussed, alongside prediction intervals and probability forecasts. Noteworthy is also that their work was sponsored by Bonneville Power Administration, which much later entered the forecasting business again as a sponsor, this time with a special emphasis for ramps prediction [ ,292]. Bossanyi [66
A similar approach is used in Wilhelmshaven [
] used a Kalman Filter with the last 6 values as input and got up to 10% improvement in the RMS error over persistence for 1-min averaged data for the prediction of the next time step. This improvement decreased for longer averages, and disappeared completely for 1-hourly averages.
67] for the estimation of the wind with the aim of flicker reduction. Vihriälä et al. [68Dambrosio and Fortunato [
] uses a Kalman filter for the control of a variable speed wind turbine. 69
Fellows and Hill [
] used a one-step-ahead adaptive control by means of a recursive least squares algorithm for the electrical part of the turbine. They show a fast and reliable response to a step in the wind.
70
Nogaret et al. [
] used 2-hour ahead forecasts of 10-min wind speeds in a model of the Shetland Islands electricity grid. Their approach was to use optimised, iterative Box-Jenkins forecasting from detrended data, which then was subjected to central moving average smoothing. For 120 minutes look-ahead time, the RMS error reduction over persistence was 57.6%.
71
Tantareanu [
] reported that for the control system of a medium size island system, persistent forecasting is best with an average of the last 2 or 3 values, ie 20-30 minutes.
72
Kamal and Jafri [
] found that Autoregressive Moving Average (ARMA) models can perform up to 30% better than persistence for 3-10 steps ahead in 4-sec averages of 2.5Hz-sampled data.
73
Dutton et al. [
] found an ARMA(p,q) process suitable for both wind speed simulation and forecasting. The inclusion of the diurnal variation was deemed important since the (mainly thermally driven) climate of Pakistan exhibited quite strong uniformity especially in the summer months.
74] used a linear autoregressive model and an adaptive fuzzy logic based model for the cases of Crete and Shetland. They found minor improvements over persistence for a forecasting horizon of 2 hours, but up to 20% in RMS error improvement for 8 hours horizon. However, for longer horizons, the 95% confidence band contained most of the likely wind speed values, and therefore a meteorological-based approach was deemed more promising on this time scale.

ANEMOS.plus/SafeWind The State of the Art in Short-Term Prediction of Wind PowerA Literature Overview, 2nd Edition
DELIVERABLE REPORT 2011-01-30 27
In the same team, Kariniotakis et al. [75,76
Fukuda et al. [
] were testing various methods of forecasting for the Greek island of Crete. These included adaptive linear models, adaptive fuzzy logic models and wavelet based models. Adaptive fuzzy logic based models were installed for on-line operation in the frame of the Joule II project CARE (JOR3-CT96-0119).
77
Hunt and Nason [
] worked on an AutoRegressive model for blade angle optimisation with data for Okinawa, Japan. Using data mining, they found that the use of additional variables was helpful only in December, but not in June.
78
Torres et al. [
] used an analysis of principal components of wavelets derived from wind speed time series for a measure-correlate-predict technique. The use of the words “short-term prediction” is not the same as the one used in our context.
79
Balouktsis et al. [
] use an ARMA model to forecast hourly average wind speeds for five sites in Navarra. They used site and month specific parameters for the ARMA model. The ARMA model usually outperformed persistence for the 1-hour forecast, and always was better in RMSE and MAE for higher horizons up to 10 hours ahead. The two complex sites have a slightly higher RMSE in general, but are still in the same range as the other sites. In general, 2-5% improvements for the 1-h forecast correspond to 12-20% improvement for the 10-h forecast.
80] used stochastic simulation models. They removed the annual and daily periodicities of the measured data and modelled transformed hourly average data with ARMA models. A similar approach is shown by Daniel and Chen [81
Lin et al. [
]. They used stochastic simulation and forecast models of hourly average wind speeds, taking into account autocorrelation, non-Gaussian distribution and diurnal nonstationarity and fit an ARMA process to wind speed data.
82Justus et al. [
] reported about predicting wind behaviour with neural networks. 83
Geerts [
] developed a method to compute power output from wind-powered generators and they applied it to estimate potential power output at various sites across the United States. Values of the Weibull distribution parameters at approximately 135 sites have been evaluated and projected to a constant height of 30.5 m and 61 m.
84Makarov et al. [
] reported about a system-theoretic approach in the short range prediction of wind speeds. 85
Schwartz and Milligan [
] describe a major California ISO-led project. Therein they developed prototype algorithms for short-term wind generation forecasting based on retrospective data (eg pure persistence models). The methods tested include random walk, moving average, exponential smoothing, auto-regression, Kalman filtering, “seasonal” differencing and Box-Jenkins models. The latter one demonstrated the best performance. They also used a bias compensation scheme to minimize the look-ahead forecast bias. For forecasts for the next hour and 1 hour ahead the total ISO-metered generation is predicted with MAE below 3% and 8% of the maximal observed generation correspondingly.
86
Kavasseri and Seetharaman [
] tested different ARMA models for forecasts up to 6 hours for two wind farms in Minnesota and Iowa. Their main conclusion was that model performance was highly dependent on the training period - one should always try to have a parameter set-up procedure using data from a very recent period.
87El-Fouly et al. [
] used a fractional ARIMA model up to 48 hours and beat persistence. 88
] used wind speed and power forecasting technique using the Grey predictor model GM(1,1). They outperformed the persistence model during a test period of 50 hours.
Baïle, Muzy and Poggi [89111
] predicted wind speed 1-12 hours ahead and beat persistence, the New Reference model [ ] and an ANN. “Inspired by recent empirical findings that suggest the existence of some cascading process in the mesoscale range, we consider that wind speed can be described by a seasonal component and a fluctuating part represented by a ‘multifractal noise’ associated with a random cascade.” Pinson et al. [90
] found that wind power and especially wind power variability from large offshore wind farms (Horns Rev and Nysted) occur in certain regimes, and therefore tested “regime-switching approaches relying on observable (i.e. based on recent wind power production) or non-observable (i.e. a hidden Markov chain) regime sequences” for a one-step forecast of 1-min, 5-min and 10-min power data. “It is shown that the regime-switching approach based on MSAR models significantly outperforms those based on observable regime sequences. The reduction in one-step ahead RMSE ranges from 19% to 32% depending on the wind farm and time resolution considered.”

ANEMOS.plus/SafeWind The State of the Art in Short-Term Prediction of Wind PowerA Literature Overview, 2nd Edition
DELIVERABLE REPORT 2011-01-30 28
Lau and McSharry [91
] compared a number of approaches for producing short-term multi-step density forecasts of aggregated wind power. They used a logistic transformation to normalise the wind power data and constructed an ARIMA-GARCH to describe the conditional mean and conditional variance. They also describe a computationally efficient approach suitable for short time series were they use a truncated normal distribution with exponential smoothing models for describing the evolution of the conditional mean and variance.
2.2 Neural networks for time series forecasts Artificial Neural Networks (ANN) are another family of models that use data from online measurements as input. Most groups in the field have used them, but despite their scientific merits in improvements over plain persistence, they did not catch on. The improvements attainable were usually deemed not enough to warrant the extra effort in training the neural networks. Note that this section is only concerned with time series modelling of a single time series; it does not include the use of neural networks in cases with more than one input, eg both measured power and NWP input. Beyer et al. [92
Tande and Landberg [
] found improvements in RMS error for next-step forecasting of either 1-min or 10-min averages to be in the range of 10% over persistence. This improvement was achieved with a rather simple topology, while more complex neural network structures did not improve the results further. A limitation was found in extreme events that were not contained in the data set used to train the neural network.
93
Alexiadis et al. [
] examined 10s forecasts for the 1s average output of a wind turbine and found that the neural networks performed only marginally better than persistence.
94
Bechrakis and Sparis [
] used the differences of wind speeds from their moving averages (differenced pattern method) and found this technique to be superior to the wind speed normally used as input. They achieved improvements of up to 13% over persistence, while for the same time series the standard neural network approach yielded only 9.5% improvement.
95
Sfetsos [
] used neural networks to utilise information from the upwind direction. Their paper does not give any numbers on the increase over persistence, since their aim is to predict the resource rather than to do short-term prediction.
96
Mohandes et al. [
] applied ARIMA (Autoregressive Integrated Moving Average) and feed-forward neural net methods to wind speed time-series data from the UK and Greece, comparing the results of using either 10-minute or hourly averaged data to make a forecast one hour ahead. For both data sets, neither forecasting method showed a significant improvement compared to persistence using hourly-averaged data, but both showed substantial (10-20%) improvement using 10-minute averages. The result is attributed to the inability of hourly averages to represent structure in the time series on the high-frequency side of the ‘spectral gap’, lying at a period of typically around 1 hour.
97
EPRI, the US Electric Power Research Institute, has recently [
] show that Support Vector Machines outperform multilayer perceptron neural networks for mean daily wind speed data from Medina city, Saudi Arabia.
98
Kretzschmar et al. [
] announced their work on the adaptation of their ANNSTLF tool (Artificial Neural Network Short-Term Load Forecaster) to wind power forecasting. They target the range of up to 3 hours with 5-minutely intervals.
99
] used neural network classifications for the forecasts of strong winds and wind gusts at Geneva and Sion in Switzerland. The quality of hit- and miss-rates was clearly improved from persistence for 1, 6, 12 and 24 hour horizons. “The input features selected for the classifiers were several lags of the local wind speed, wind gust, and wind direction time series, time, and data [sic], and additional features from the ECMWF analysis that corresponded closest to a 24-h lead time.” They also analysed the benefits of using many meteorological observations of surrounding masts, and found that “the correlations between speed or gusts to pressure or temperature were found to be more relevant than the correlations of speed or gusts to wind direction, humidity, radiation, or rain.” Despite that, and due to the facts that data usually costs money and that the same accuracy could be obtained just with the local observation, they decided against the use of surrounding data. Partly, this was due to the difficulty in determining the “upstream” station at all times.
Sfetsos [100, 101] compared a number of methods, including a Box-Jenkins model, feed-forward neural networks, radial basis function networks, an Elman recurrent network, ANFIS models (Adaptive Network based Fuzzy Inference System), and a neural logic network based on their ability to forecast hourly mean wind speeds. All non-linear models exhibited comparable RMS error, which was better

ANEMOS.plus/SafeWind The State of the Art in Short-Term Prediction of Wind PowerA Literature Overview, 2nd Edition
DELIVERABLE REPORT 2011-01-30 29
than any of the linear methods. For the one hour ahead, the best model was a neural logic network with logic rules, reducing the error of persistence by 4.9%. Wu and Dou [102
Potter and Negnevitsky [
] used a combination of a Fuzzy Classifier with a temporal neural network for non linear wind prediction.
103
Steen [
] used an ANFIS model (adaptive neuro-fuzzy inference system) to predict just the u (northward) component of the direction 2.5 min ahead in Tasmania. On the 21-month test set, they were able to reduce the 30% mean absolute percentage error (without properly defining it) of persistence for the step-ahead prediction to 4%.
104
In a study for the Mexican Electric Utility Control Centre, Cadenas and Rivera [
] used the feedforward algorithm of ANN as a basis to compute a load forecast of wind energy with an error of up to 6% and a more or less constant correlation of 0.99.
105] compare different configurations of neural networks, and find that the simplest (two layers, two input neurons, one output neuron) outperformed more complex ones for one-step forecasts of hourly wind data in La Venta, Mexico. However, their way of presenting the findings, as MAE of 0.0399 without specifying what it is (m/s would be extremely low), makes one suspicious of the rest of the paper. In an earlier paper [106
For an anemometer near Mumbai, More and Deo [
], they had compared the merits of an ARIMA model and a neural network for the same test case, and had concluded that a Seasonal ARIMA model worked better than the relatively simple ANN they were using.
107
The University of Ulster had a press release in 2003 [
] outperformed ARIMA models using neural networks for the 1-step ahead forecasts of mean daily, weekly and monthly wind speeds. “Forecasting accuracy decreased as the interval of forecasting reduced from one month to one day.”
108] stating that they used Artificial Intelligence techniques to forecast wind energy up to 12 hours in advance. They claim that they would forecast produced wind energy within a 12 percent margin. The press release continues to claim that the “technology will also enable developers to predict wind speeds and power output for the next 2 or 3 years”. This approach was later published by Campbell and Adamson [109
Kusiak, Zheng and Song [
], who examined “the statistical approaches of ARIMA, Moving Averages and compare[d] their performance against both Persistence and a novel Multi-Layered Perceptron which is trained using the Generalised Delta Rule, demonstrating that such an MLP implementation can demonstrate significantly improved accuracy over these more traditional statistical approaches.”
110
2.3 An explanation of the time series model improvements
] explored the viability of 5 data mining algorithms for wind speed and wind power 1-step to 3-step ahead prediction. The 3-step ahead uses the 1-step ahead and 2-step ahead predictions as input. “Two of the five algorithms performed particularly well. The support vector machine regression algorithm provides accurate predictions of wind power and wind speed at 10-min intervals up to 1 h into the future, while the multilayer perceptron algorithm is accurate in predicting power over hour-long intervals up to 4 h ahead.” They further muse: “One disadvantage of the proposed approach is that the time series model uses its own previously predicted values. As the number of prediction steps increases, the errors get accumulated. A possible approach for improving prediction accuracy is to build a set of prediction models for each time step.”
A general note on time series models (neural network or otherwise): Some of the improvement of the time series approach over persistence can be explained with a term taking the time series (running) mean into account. Nielsen et al. tried a few years ago to introduce this as the New Reference Model [111 Figure 4] (see the blue line marked NewRef in ). In essence, it predicts the power p(t) using the power p(t-n) (n being n timesteps back) and the mean µ of the time series. Of course, disregarding µ and having n=1, this would be the persistence model itself. However, the new reference is written as
p(t)=a(n)*p(t-n) + (1-a(n))*µ. a(n) is the autocorrelation of the time series n steps back. This simple model can achieve the typically 10% RMS error improvements over persistence found by many authors in chapters 2.1 and 2.2 using more or less advanced time series analysis techniques.
2.4 Power modelling Comparison of direct wind power prediction against wind speed forecasts with subsequent conversion to wind power [112,113] using autoregressive models showed that the use of wind speed predictions

ANEMOS.plus/SafeWind The State of the Art in Short-Term Prediction of Wind PowerA Literature Overview, 2nd Edition
DELIVERABLE REPORT 2011-01-30 30
as explanatory variable is important for prediction horizons up to 8-12 hrs. For longer prediction horizons, use of separate wind speed forecasts offers no advantage over direct wind power prediction. Madsen [114] and Nielsen [115
] found that two-stage modelling (conversion of wind speed predictions to wind power, in which correlation structure in power measurements is disregarded) are generally inferior to models that take the power correlation into account.
Wind farm forecasting using any of the above methods is likely to benefit from forms of statistical post-processing such as the MOS system. Any use of meteorological models must involve a two-stage process, so the MOS process should operate on the final result (the predicted wind power) instead of trying to optimise the local wind speed prediction. Giebel [116] showed that, when using NWP model winds and a fixed power curve in Prediktor, it is best to use MOS acting on the wind speed, ie before putting it through the power curve, rather than on the final power output. Likewise, Louka et al. [117
Power curve modelling from wind speed was done by Cabezon et al. [
] showed that Kalman filtering SKIRON or RAMS results before feeding them into a power forecasting module significantly improves the forecast skill. The 0.1°x0.1° SKIRON model had its bias removed, and was thereby much better for power predictions than without the filter. The same held true for the RAMS model with runs down to 0.5km horizontal resolution. Due to computing power limitations, only 2 days could be run. Using those results, it showed that Kalman filtering even the 12km run gave a better power forecast than even the 0.5km resolution run. “Therefore, this work suggests that the use of very expensive computational facilities to perform high-resolution (6 km) applications for wind energy predictions may be avoided by the combined use of moderate NWP model resolution and an adaptive statistical technique such as Kalman filtering; providing similar or even more accurate predictions at wind farm scale.”
118
Collins, Parkes and Tindal [
]. They used 5 methods based on statistical tools (linear models with binning methods and a fuzzy logic model) and found an improvement the more accurate the models were and the more effects they took into account.
119
More recently, Kusiak, Zheng and Song [
] point out that for large wind farms (>100MW), the local effects vary so much across the site that a simple application of an upscaled manufacturers power curve is not good enough. An advanced wind farm power curve model taking air density, heterogeneous flow field and wake effects into account and finetuned with local measurements reduced the power MAE for the power model being fed with onsite met mast wind speeds from 7.5% to 1.5% for a site in the UK. Fed with actual NWP forecasts, the day-ahead error was reduced by 1.2%. For a site in the US, the numbers were 11.6%, 4.6% and 0.9% improvement, respectively.
120 110 ] used the data mining approaches from [ ] with NWP input to predict for up to 12 hours and up to 84 hours ahead. As input they used two US NWP models, the Rapid Update Cycle RUC and the North American Mesoscale NAM model, with the 16 data points around the wind farm. Both models had wind speed and direction at various levels plus air density and potential temperature difference. The NAM also had sensible heat flux and the percentage of vegetation in the grid point. Of this multitude of parameters, a boosting tree algorithm was used for feature selection, which reduced the number of data to the four nearest grid points. Data from those was then further reduced via principal component analysis, where all units with the same unit were collected in the first two principal components. The resulting values were then fed either to a model directly predicting the power output, or one predicting wind speed, which then was transformed into power. The direct approach was clearly better than using an intermediate wind speed forecast. Of the five models used, the Multilayer Perceptron outperformed k-Nearest Neighbour, Support Vector Machine regression, Radial Basis Function network, Classification and Regression Tree and Random Forest algorithms. Note that the available power measurement data was only 3 months long. In another paper, Kusiak and Li [121
For statistical power curve modelling, Pinson et al. [
] clustered 10-sec observations from only one week of data from a single wind turbine and compared the mentioned 5 models.
122
] demonstrated the advantage of orthogonal fitting at each point of the power curve, claiming that the usual way assumes noise only in the power, not in the predicted wind speed. “This assumption is not realistic for the wind power forecasting application, when the wind-to-power conversion function is estimated with meteorological forecasts as explanatory variables.”
An interesting hybrid approach was described by H.Aa. Nielsen et al. [123]. The statistical power curve estimation of WPPT was initialised using the wind farm power curve from WAsP, in the way Prediktor uses it. The advantage was most pronounced for the first few months of operation of the model, and

ANEMOS.plus/SafeWind The State of the Art in Short-Term Prediction of Wind PowerA Literature Overview, 2nd Edition
DELIVERABLE REPORT 2011-01-30 31
for wind power classes where only few data points were available. Eg for wind speeds above 10m/s, the NRMSE is reduced with over 30% in the first 6 months. Barthelmie et al. [124] surveyed a number of short-term prediction providers as to their implementation of explicit wake modelling in the short-term prediction model, and found that in most models, the direct estimation of a wind farm power curve from measured data and predicted wind data obviates the need for an actual wake model, as it is implicitly taken into account.

ANEMOS.plus/SafeWind The State of the Art in Short-Term Prediction of Wind PowerA Literature Overview, 2nd Edition
DELIVERABLE REPORT 2011-01-30 32
3. Meteorological modelling for wind power predictions The main error in the final forecast comes from the meteorological input. For example, Sanchez et al. [125
] show that the Spanish statistical tool Sipreolico run with on-site wind speed input has a much higher degree of explanation than HIRLAM forecasts. This means that given a representative wind speed, Sipreolico can predict the power quite well. It is the wind speed input from the NWP model that is decreasing the accuracy significantly. Therefore, it is logical to try to improve the NWP input in order to come up with significant improvement in forecasting accuracy.
Figure 27: The error comes from the NWP. The figure shows the difference in degree of explanation between Sipreolico run with HIRLAM input (from an older version of the Spanish HIRLAM) and Sipreolico run with on-site wind speed input. Source: Sanchez et al. [125].
3.1 Operational NWP systems This section gives an overview of operational numerical weather prediction (NWP) models having relevance for wind power prediction in Europe. Various global forecasting systems exist, designed to predict large scale synoptic weather patterns. But the increase in computer resources during the next years will allow the global models to overtake the current role of the limited area models (LAM) down to about 10km horizontal resolution. The LAMs, which get their boundary conditions from the global models and operate at the moment at horizontal resolutions of 7 to 12km, will be replaced by high resolution, convection resolving LAMs with horizontal resolutions well below 4km. 3.1.1 Global models Figure 28 shows a comparison of different global models for the root mean squared error (RMSE) of 10m wind speed forecasts over the North Sea at 18 different buoys [126]. The verification charts are monthly scores which are updated regularly and can be accessed via the ECMWF web page6
6 http://www.ecmwf.int/products/forecasts/d/charts/medium/verification/wave/intercomparison/
.
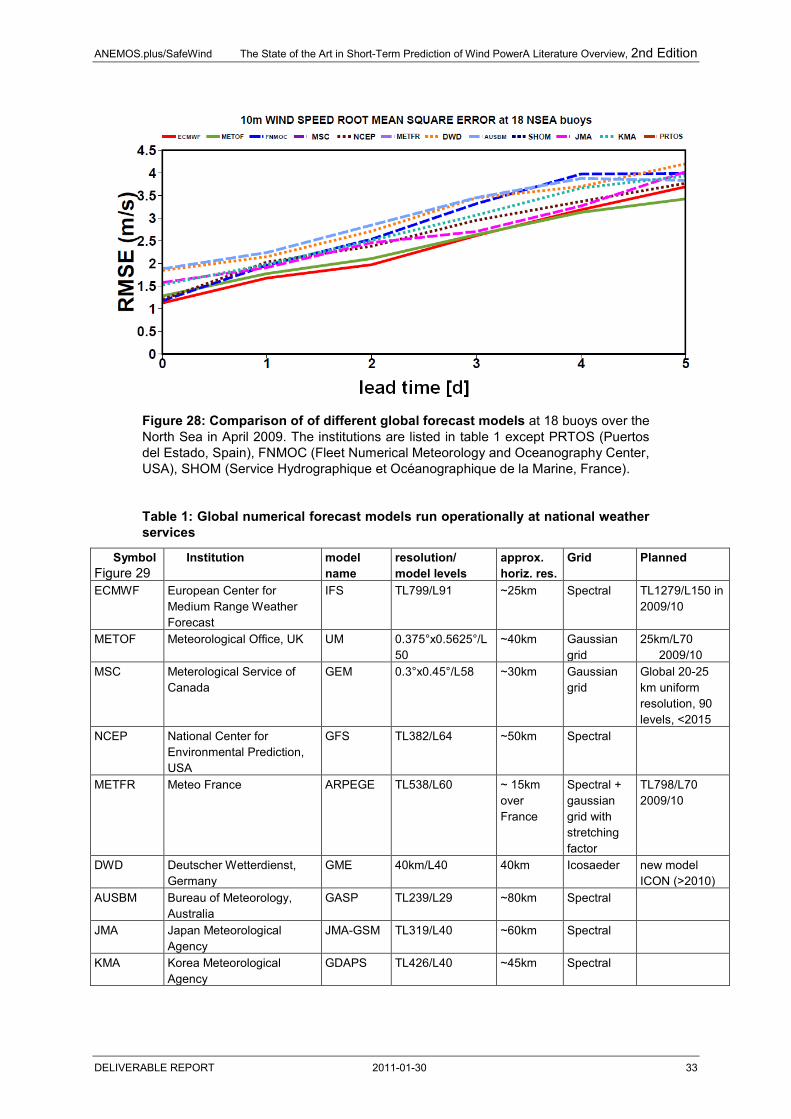
ANEMOS.plus/SafeWind The State of the Art in Short-Term Prediction of Wind PowerA Literature Overview, 2nd Edition
DELIVERABLE REPORT 2011-01-30 33
Figure 28: Comparison of of different global forecast models at 18 buoys over the North Sea in April 2009. The institutions are listed in table 1 except PRTOS (Puertos del Estado, Spain), FNMOC (Fleet Numerical Meteorology and Oceanography Center, USA), SHOM (Service Hydrographique et Océanographique de la Marine, France).
Table 1: Global numerical forecast models run operationally at national weather services
Symbol Figure 29
Institution model name
resolution/ model levels
approx. horiz. res.
Grid Planned
ECMWF European Center for Medium Range Weather Forecast
IFS TL799/L91
~25km Spectral TL1279/L150 in 2009/10
METOF Meteorological Office, UK UM 0.375°x0.5625°/L50
~40km Gaussian grid
25km/L70 2009/10
MSC Meterological Service of Canada
GEM 0.3°x0.45°/L58 ~30km Gaussian grid
Global 20-25 km uniform resolution, 90 levels, <2015
NCEP National Center for Environmental Prediction, USA
GFS TL382/L64 ~50km Spectral
METFR Meteo France ARPEGE TL538/L60
~ 15km over France
Spectral + gaussian grid with stretching factor
TL798/L70 2009/10
DWD Deutscher Wetterdienst, Germany
GME 40km/L40
40km Icosaeder new model ICON (>2010)
AUSBM Bureau of Meteorology, Australia
GASP
TL239/L29
~80km Spectral
JMA Japan Meteorological Agency
JMA-GSM TL319/L40 ~60km Spectral
KMA Korea Meteorological Agency
GDAPS TL426/L40 ~45km Spectral
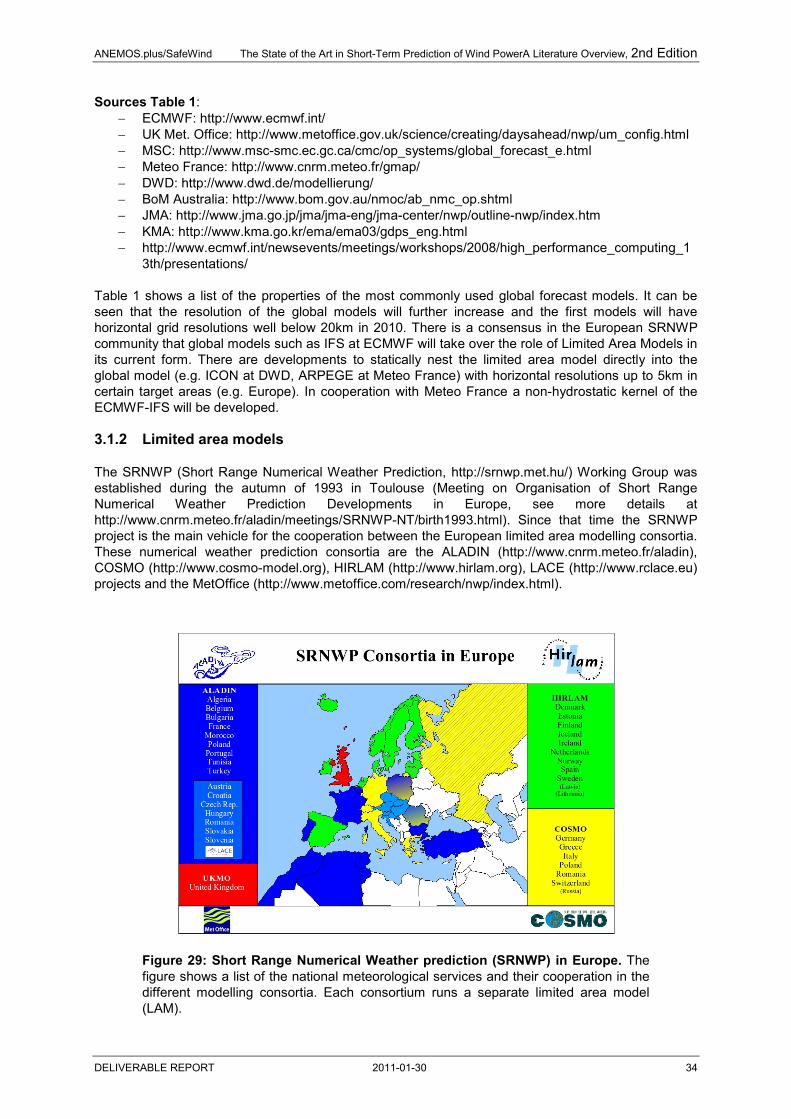
ANEMOS.plus/SafeWind The State of the Art in Short-Term Prediction of Wind PowerA Literature Overview, 2nd Edition
DELIVERABLE REPORT 2011-01-30 34
Sources Table 1: − ECMWF: http://www.ecmwf.int/ − UK Met. Office: http://www.metoffice.gov.uk/science/creating/daysahead/nwp/um_config.html − MSC: http://www.msc-smc.ec.gc.ca/cmc/op_systems/global_forecast_e.html − Meteo France: http://www.cnrm.meteo.fr/gmap/ − DWD: http://www.dwd.de/modellierung/ − BoM Australia: http://www.bom.gov.au/nmoc/ab_nmc_op.shtml − JMA: http://www.jma.go.jp/jma/jma-eng/jma-center/nwp/outline-nwp/index.htm − KMA: http://www.kma.go.kr/ema/ema03/gdps_eng.html − http://www.ecmwf.int/newsevents/meetings/workshops/2008/high_performance_computing_1
3th/presentations/ Table 1 shows a list of the properties of the most commonly used global forecast models. It can be seen that the resolution of the global models will further increase and the first models will have horizontal grid resolutions well below 20km in 2010. There is a consensus in the European SRNWP community that global models such as IFS at ECMWF will take over the role of Limited Area Models in its current form. There are developments to statically nest the limited area model directly into the global model (e.g. ICON at DWD, ARPEGE at Meteo France) with horizontal resolutions up to 5km in certain target areas (e.g. Europe). In cooperation with Meteo France a non-hydrostatic kernel of the ECMWF-IFS will be developed. 3.1.2 Limited area models The SRNWP (Short Range Numerical Weather Prediction, http://srnwp.met.hu/) Working Group was established during the autumn of 1993 in Toulouse (Meeting on Organisation of Short Range Numerical Weather Prediction Developments in Europe, see more details at http://www.cnrm.meteo.fr/aladin/meetings/SRNWP-NT/birth1993.html). Since that time the SRNWP project is the main vehicle for the cooperation between the European limited area modelling consortia. These numerical weather prediction consortia are the ALADIN (http://www.cnrm.meteo.fr/aladin), COSMO (http://www.cosmo-model.org), HIRLAM (http://www.hirlam.org), LACE (http://www.rclace.eu) projects and the MetOffice (http://www.metoffice.com/research/nwp/index.html).
Figure 29: Short Range Numerical Weather prediction (SRNWP) in Europe. The figure shows a list of the national meteorological services and their cooperation in the different modelling consortia. Each consortium runs a separate limited area model (LAM).

ANEMOS.plus/SafeWind The State of the Art in Short-Term Prediction of Wind PowerA Literature Overview, 2nd Edition
DELIVERABLE REPORT 2011-01-30 35
Table 2: EUMETNET-SRNWP overview of operational Numerical Weather Prediction Systems in Europe as of July 2009 compiled by Detlev Majewski, Deutscher Wetterdienst, Germany.
Country Model Mesh size (km)
Number of gridpoints
Number of levels
Initial times & Forecast ranges (h)
Type of data assimilation
Model providing LBC data
16 610 x 568 40 00/06/12/18 +60h 3D-VAR ECMWF/IFS
5.5 496 x 372 40 00/06/12/18 +54h Surf-ana only DMI16
5.5 550 x 378 40 00/06/12/18 +36h Surf-ana only DMI16
11 366 x 280 60 00/06/12/18 +54h 3D-VAR fgat ECMWF/IFS
3.3 306 x 306 60 00/12 +36h 3D-VAR fgat EMHI11
HIRLAM 16 582 x 448 60 00/06/12/18 +54h 4D-VAR ECMWF/IFS
HIRLAM 7.5 482 x 360 60 00/06/12/18 +54h 3D-VAR fgat ECMWF/IFS
HARMONIE 2.5 300 x 600 40 00/12 +24h none HIRLAM
16 438 x 284 60 00/06/12/18 +54h 3D-VAR ECMWF/IFS
5.5 438 x 395 60 00/06/12/18 +30h 3D-VAR HIRLAM16
Netherlands HIRLAM 11 816 x 650 60 00/06/12/18 +48h 3D-VAR ECMWF/IFS
HIRLAM 12 864 x 698 60 00/06/12/18 +60h 3D-VAR fgat ECMWF/IFS
8 344 x 555 60 00/06/12/18 +60h 3D-VAR fgat ECMWF/IFS
4 300 x 500 60 00/12 +60h Surf-ana only HLM 11
UM 4 300 x 500 38 00/12 +60h None HIRLAM 8
17 582 x 424 40 00/06/12/18 +72h 3D-VAR ECMWF/IFS
5.5 606 x 430 40 00/06/12/18 +36h 3D-VAR HLM17
22 306 x 306 40 00/06/12/18 +48h 4D-VAR ECMWF/IFS
11 256 x 288 60 00/06/12/18 +72h 3D-VAR ECMWF/IFS
5.5 294 x 441 60 00/06/12/18 +48h 3D-VAR HIRLAM 11
9.6 300 x 270 60 00/12 +72h none ARPEGE
06/18 +60h
7 240 x 240 46 00 + 54h; 06 +48h none ALADIN-
12 + 42h; 18 +36h FRANCE
00,06,12,18 +60h none ARPEGE
Bulgaria ALADIN 12 90 x 72 41 none ARPEGE
Croatia ALADIN 8 229 x 205 37 00/12 +72h none ARPEGE
9 309 x 277 43 00/06/12/18 +54h ECMWF/IFS
15 -France global 60 00 +102h; 06 +72h 4D-VAR; 6h -
90 -Antipode 12 + 84h; 18 +60h
9.5 289 x 289 60 00 + 54h; 06 +48h 3D-VAR ARPEGE
12 + 42h; 18 +36h
2.5 600 x 512 41 00,06,12,18 +30h 3D-VAR ALADIN- France
8 349 x 309 49 00 + 54h; 06 +48h 3D-VAR ARPEGE
12 + 48h; 18 +36h
Poland ALADIN 13.5 169 x 169 31 00/12 +54h none ARPEGE
Portugal ALADIN 12.7 85 x 96 31 00/12 +48h none ARPEGE
10 144 x 144 41 00 + 78h; 06 +48h none ARPEGE
12 + 66h; 18 +48h
9 309 x 277 37 00/06/12 +72h ARPEGE
18 +60h
9.6 258 x 244 43 00/12 +72h none ARPEGE
06 +60h
18 +48h
Finland
Ireland HIRLAM
Norway
Austria
Denmark HIRLAM
Estonia HIRLAM
Spain HIRLAM
Belgium ALADIN
ALADIN
Sweden HIRLAM
Czech Rep. ALADIN surface OI + upper-air digital filter blending
ARPEGE
ALADIN- France
Hungary ALADIN
AROME- France
France
Romania ALADIN
Slovakia ALADIN upper-air digital filter blending
Slovenia ALADIN

ANEMOS.plus/SafeWind The State of the Art in Short-Term Prediction of Wind PowerA Literature Overview, 2nd Edition
DELIVERABLE REPORT 2011-01-30 36
At the moment most countries run their models for overlapping European areas at 12-7 km grid resolution. In the next few years they will move towards 4-1 km grid resolution and therefore will not run an intermediate nested European grid area anymore. They plan to directly nest their very high resolution models, which then will cover only the national area, into a global model at 25km or less. For very high resolution requirements of a European wide SRNWP coverage a need arises for close cooperation and exchange of NWP products. These recent developments and plans in SRNWP limited area modelling in Europe have been discussed at the SRNWP/EWGLAM meeting 28th September - 1st October 2009 in Athens. There is a web page showing at least the agenda (http://lunar.hnms.gr/content/agenda.htm). There are already operational suits running at very high resolution in most of the European weather services. Figure 29 shows some examples of model domains:
Country Model Mesh size (km)
Number of gridpoints
Number of levels
Initial times & Forecast ranges (h)
Type of data assimilation
Model providing LBC data
Bosnia-Herzegovina HRM 14 161 x 161 40 00/12 +72h none GME
Bulgaria HRM 14 97 x 73 40 00/12 +72h none GME
40 global 40 00/12 +174h 3D-VAR, 3h -
06/18 +48h
7 665 x 657 40 00/12 +72h Nudging GME
06/18 +48h
2.8 421 x 461 50 00/03/06/ Nudging COSMO-EU
09/…/18/21 +21h
Greece COSMO-GR 7 649 x 393 35 00/12 +72h Nudging ECMWF/IFS
EURO-HRM 14 769 x 513 40 00/03/.../21 +18h 3D-VAR fgat ECMWF/IFS
COSMO-ME 7 641 x 401 40 00/12 +72h 3D-VAR (interp) ECMWF/IFS
COSMO-IT 2.8 518 x 684 50 00 +36h Nudging COSMO-ME
COSMO-I7 7 297 x 313 40 00/12 +72h Nudging ECMWF/IFS
COSMO-I2 2.8 447 x 532 45 00 +48h COSMO-I7 COSMO-I7
14 193 x 161 35 00/12 +78h none GME
06/18 +48h
HRM 14 81 x 73 20 00 +78h; 12 +48h none GME
14 81 x 73 35 00/12 +78h none GME
7 161 x 145 40 00 +54h none GME
COSMO-7 6.6 393 x 338 60 00/12 +72h Nudging ECMWF/IFS
COSMO-2 2.2 520 x 350 60 00/12 +72h Nudging COSMO-7
ETA 16 245 x 305 32 00/12 +120h none GME
WRF-NMM 10 92 x 118 38 00/12 +48h none ECMWF/IFS
MM5 (D1) 21 94 x 155 32 00/06/12/18 +48h none ECMWF/IFS
MM5 (D2) 7 136 x 259 32 00/06/12/18 +48h none MM5 (D1)
MM5 (D3) 2.3 91 x 196 32 00/06/12/18 +24h none MM5 (D2)
UM 40 global 50 00/12 +144h 4D-VAR -
06/18 +48h
UM (NAE) 12 600 x 360 38 00/06/12/18 +48h 4D-VAR UM (Global)
UM (UK4) 4 360 x 288 70 03/09/15/21 +36h 3D-VAR UM (NAE)
Switzerland
Italy
Germany GME
COSMO-EU
COSMO-DE
Poland COSMO
Romania
COSMO-RO
Serbia
Turkey
United Kingdom

ANEMOS.plus/SafeWind The State of the Art in Short-Term Prediction of Wind PowerA Literature Overview, 2nd Edition
DELIVERABLE REPORT 2011-01-30 37
Figure 30: Very high high resolution model domains from left to right: AROME (Meteo France, 41 vertical layers), COSMO-DE (DWD, 50 vertical layers), UM-4km (grey shaded area, UK Met Office, 70 vertical layers).
3.1.3 MAP D-PHASE MAP D-PHASE stands for “Demonstration of Probabilistic Hydrological and Atmospheric Simulation of flood Events in the alpine region” within the Mesoscale Alpine Programme (MAP) and is a Forecast Demonstration Project (FDP) of the WWRP (World Weather Research Programme of WMO). For more information see http://www.map.meteoswiss.ch/map-doc/dphase/dphase_info.htm. It aims at demonstrating the ability of forecasting heavy precipitation and related flooding events in the Alpine region. The D-PHASE operations period has been from 1 June to 30 November 2007 and included the entire forecasting chain ranging from limited-area ensemble forecasting to high-resolution atmospheric modelling on the km-scale. Even though the focus of MAP D-Phase was on precipitation the model forecast data from the operations period in 2007 also includes wind at 10m height and at model levels. Especially the wind fields from the very high resolution models COSMO-2 of Meteo Swiss, COSMO-DE of DWD and AROME of Meteo France can be downloaded from the D-PHASE data archive for research purposes (http://cera-www.dkrz.de/WDCC/ui/Index.jsp). Table 3 shows the variables stored at model levels and Figure 31 outlines the D-PHASE domain.
Figure 31: Map of the Alps (color shading) with the outlines of the model domains of some of the high-resolution atmospheric D-PHASE numerical weather forecasting models. The bold red rhomb depicts the D-PHASE domain.

ANEMOS.plus/SafeWind The State of the Art in Short-Term Prediction of Wind PowerA Literature Overview, 2nd Edition
DELIVERABLE REPORT 2011-01-30 38
Table 3: Variables on model levels available from the D-PHASE archive.
Variable
output time steps
Variable number
Table number dataset
Temperature (K) 1h 011 002 MTPQ Pressure (Pa) 1h 001 002 MTPQ U-velocity (m/s) 1h 033 002 MUVW V-velocity (m/s) 1h 034 002 MUVW W-velocity (m/s) 15 min 040 002 MUVW
3.2 Improvements in NWP and meso-scale modelling Möhrlen has looked at the resolution needed for successful application of NWP forecasting. In a study with the Danish HIRLAM model for one site in Ireland [127
In different runs with horizontal model resolutions of 30 km, 15 km, 5 km and 1.4 km for two months in January 2001, the most common statistical accuracy measures (MAE, RMSE, correlation etc) did improve only slightly with higher resolution. However, peak wind speeds were closer to the measured values for the high-resolution forecasts. For the higher resolution forecasts, the best model layers were those closest to the ground. For the errors, she points out that phase errors (the timing of the frontal system) has a much larger influence on the error scores (and eventual payments) than amplitude errors. As one possible remedy, she proposes to use free-standing turbine data as input for the NWP, thereby increasing the observational meteorological network.
] she points out the reasons why NWP models are delivering inadequate accuracy of surface wind speeds. Amongst other things, these were: so far, no customers made it necessary to increase the accuracy of surface winds, since for the existing ones the accuracy was good enough. The topography resolution is not good enough to account eg for tunnel effects in valleys. Accurate predictions require high resolution models covering a large area. However, running both is numerically very expensive. In order to improve on the state of things, she calculated the power directly inside the NWP model. This had the advantage that "major physical properties like direction dependent roughness, actual density, and stratification of the atmospheric boundary layer can be used in the calculations."
A similar point is made by Rife and Davis [128
Also for hurricanes Davis et al. [
]. They compared two otherwise identical model setups with horizontal resolution of 30 and 3.3km, respectively, for wind speed variations at and near the White Sands Missile Range in New Mexico (US). “The authors hypothesize that the additional detail and structure provided by high resolution becomes a ‘liability’ when the forecasts are scored by traditional verification metrics, because such metrics sharply penalize forecasts with small temporal or spatial errors of predicted features.” Therefore, they use three alternative skill scores, namely (in order of tolerance of timing errors) anomaly correlation, object-based verification and variance anomalies. “The largest improvement of the fine-grid forecasts was in the cross-mountain component.” In general, the higher resolution forecasts exhibited more skill than their coarser counterparts.
129
] find that 1.33km grid spacing improves the results for ”Intensity (maximum wind) and rapid intensification, as well as wind radii” over 4km horizontal resolution, using the Advanced Research Hurricane version of WRF.
In a follow-up paper on HIRLAM in Ireland [130
For the same set-up, Jørgensen et al [
], Möhrlen shows the difference between the usual one-hour average wind speed and the instantaneous wind speeds. She concludes that is important to calculate the power within the model itself, to make use of its significantly shorter time step. (The difference comes of course because the energy in the wind is proportional to the cube of the wind speed, and does not depend linearly on it.)
131] make a number of interesting points on the coupling of a NWP model to wind power forecasts. Examining 25 especially bad forecasted days from 15 months for the Western Danish TSO Eltra (now part of Energinet.dk), he found that in all cases the error came from the NWP model and not from the WPPT upscaling. Here too he found that using higher resolution in HIRLAM, the scores do not improve substantially, indicating that level errors are smaller and gradients sharper in the higher resolution. This leads to higher error measures for phase errors.

ANEMOS.plus/SafeWind The State of the Art in Short-Term Prediction of Wind PowerA Literature Overview, 2nd Edition
DELIVERABLE REPORT 2011-01-30 39
On the weather dependence of the errors, he writes: "The more steady the flow is and the longer the controlling low pressure is towards the north, the better the quality of the forecast." He also notes on the roughness (usually in NWP models just one value per grid box): "Most turbines are positioned such that the local roughness is lower than the average roughness in the corresponding NWP model grid box. This is at least true for the prevailing wind direction [...]. Thus, a NWP model will in average have a negative wind bias where turbines are installed unless direction dependent roughness is used." In Jørgensen’s and Möhrlen’s conference proceedings from 2001 to 2002 they reported about wind power prediction using the HIRLAM Model: In [132] Möhrlen et al. describe the “Irish Study”, where HIRPOM was implemented into HIRLAM to be run in prognostic and diagnostic mode with the aim of finding the most efficient resolution for wind energy forecasting in complex terrain. Ireland has Europe’s best wind resources and intends to use them. So the overall purpose of the Irish study was to surpass the island’s own target of 33 % of renewable energy by 2020. The study showed that it is actually possible to generate 42 % of Ireland’s electricity from renewable energy. The Irish Study was one of the biggest numerical experiments carried out in the wind energy domain at the time. For the actual forecasting, in [133
Jørgensen et al [
] they argued that high-resolution forecasting (down to 1.4 km) also need high-resolution input databases for orography and roughness, and that due to the limited possibilities of data transfer (now a less relevant point) the power calculation should happen directly in the weather model.
134
It should be noted that the company WEPROG does not use HIRLAM or HIRPOM, but their own MSEPS [
] also found that coupling HIRLAM with a wave model and HIRPOM improves the forecasts over sea and also over land 100km from the cost. For the North Sea coastline they found 2.5% improvement, further out in the North Sea they expect 5%.
135 6.2]. See chapter for literature regarding this. A new approach is described by Jørgensen et al. [136]: they integrated the power prediction module within the NWP itself. They call it HIRPOM (HIRlam POwer prediction Model), also described by Möhrlen [137
127
]. She used a simplified power conversion module using standard power curves from wind turbine manufactures which was integrated into the NWP model. She also found through experiments with deterministic forecasts that increasing the horizontal resolution did not reduce the forecast errors. So using the same computational resources more economic benefit could be gained generating ensemble forecasts and derive uncertainty, the latter being as important as the wind speed and power itself. Jørgensen and Möhrlen therefore developed a 50-member Multi-Scheme Ensemble Prediction System (MSEPS) (more recently, WEPROG is running the system with 75 members) with an implicit forward-backward stepping algorithm (pmt-filter) to compute an uncertainty estimate for the forecasts [ ]. Sood et al. [138
] used WRF on a 3km resolution grid over the German part of the North Sea. They found that stable and unstable conditions were less well forecasted than neutral conditions.
Vitec AB from Sweden worked on a model based on meteorological forecasts from the Swedish Meteorological and Hydrological Institute SMHI. Unpublished [139] - there is just an image in Söder [140
], citing H. Törnevik, who used to work at SMHI.
Martin et al. [141] started to develop a prediction tool for the rather special case of Tarifa/Spain. Due to the unique situation of the wind farms at the Strait of Gibraltar, they could predict the power output from pressure differences between the measurements at Jerez and Malaga airports (west and east of Gibraltar), with the additional use of the Spanish HIRLAM. However, since the utilities felt at that time that 48 hours of forecasts would not be useful enough, the project was stopped half-way through [142]. On her own, Palomares and de Castro [143
] worked on the prediction using Perfect Prognosis to connect the too coarse fields of the 50-km resolution ECMWF global reanalysis model to the local flow at the strait, with quite reasonable results considering that the ECMWF global model did not even have a strait there.
Barstad [144] used a library of pre-calculated meso-scale model results to downscale the wind from the large scale weather situation to the actual site in Nord-Trøndelag county, Norway. The classification of the overall weather was derived from NCEP/NCAR Reanalysis data [145]. For the 32 cases found, MM5 was run to transform the large-scale flow to the wind at the actual (very complex)

ANEMOS.plus/SafeWind The State of the Art in Short-Term Prediction of Wind PowerA Literature Overview, 2nd Edition
DELIVERABLE REPORT 2011-01-30 40
site. This approach was used together with the reanalysis data to determine the resource in the vicinity, and was also used in conjunction with the HIRLAM system of the Norwegian Meteorological Institute to yield short-term forecasts. Berge [146] presented the whole system at a workshop in Norrköping in 2002. A larger report [147] additionally compares the performance of MM5 with results from the CFD model 3DWind. HIRLAM was run on a horizontal resolution of 10 km, MM5 on 1 km and 3DWind with a resolution varying from 30 m to 500 m. To compare these models, a statistical model has been developed. Bremnes [148
] reported during the Norrköping workshop on the use of probabilistic forecasts, to yield the uncertainty of a forecast. His approach was to transform the forecasts according to the error distribution, standardise the centred forecast errors using the variance estimate, and retransform the wind speed. This effectively gives a direct estimate of the frequencies, or quantiles, of the resulting forecast. The larger report shows that the predicted frequencies actually are fairly reliable (ie, the 95% fractile, defined as a 95% probability that the power production will be below this value, was reached ca. 95% of the time). The best selection of explanatory variables based on HIRLAM10 was to use the wind speed at 10 m a.g.l., the wind direction, the wind speed increase and the time of day/horizon. One result of the comparison of the physical models was that despite the fact that the finer models did present more details of the forecasts, they were always fed with the initial and boundary conditions from the coarser HIRLAM model, and therefore were bound to have the same temporal development as the larger model. Also, the improvements in the details added by the mesoscale model and the CFD model did not show up in the error scores for a horizon of more than 20 hours. As a side note, the model speed-ups from MM5 and WAsP were compared, showing that in the highly complex terrain of Norway, MM5 (on 1 km resolution) tended to underpredict the speed-up effects by around 20%.
Enomoto et al. [149
Murakami et al. [
] used the LOCALS model (Local Circulation Assessment and Prediction System) to forecast the power production of the TAPPI wind farm in Aomori Prefecture, Japan. Despite using the model with a 500-m grid, the result is still an RMSE of 15% of the installed capacity. Their results indicate that the significant differences in turbulence intensity between the turbines are not modelled correctly.
150
Hashimoto et al. [
] developed a numerical prediction model to obtain useful data for selecting suitable sites for windmill planting in Japan. They call it LAWEPS (Local Area Wind Energy Prediction System), and include computational fluid dynamics (CFD) models for meteorological phenomena as well as a five-stage nesting method.
151
] used WRF in conjunction with the local wind model NuWiCC. They found that every additional modelling step improved the accuracy. They also found that NuWiCC was able to express the differences between wind speeds at each turbine.
Yamaguchi et al. [152
] actually managed to reach nearly the same performance as a 1km resolution RAMS downscaling of the 20km resolution Japan Meteorological Agency met model with a simple transfer coefficient method. Using an ARXM (Auto-Regressive with eXogenous input and Multi-timescale parameter) with the operational condition of the wind farm as exogenous parameter, they even exceeded the performance of the RAMS downscaling.
GEO mbh and GKSS [153
Coppin and Katzfey [
] are currently developing the non-hydrostatic meso-scale model GEOFFREY (GESIMA-based Optimisation of Forecasts For Renewable Energy Yield). The model is going to be driven by the medium-range forecast of a private weather forecaster.
381] from CSIRO in Australia developed the CFS (CSIRO Forecasting System). The main feature is the use of the hydrostatic meso-scale model C-CAM (Conformal Cubic Atmospheric Model), driven by the US AVN. For a model not employing MOS, the initial results of between 15 and 30% NRMSE are a reasonable starting point. The Meteorological Service of Canada developed a Simulation Toolkit [154
] called WEST (Wind Energy Simulation Toolkit). It can look forward up to three days (with the meso-scale model MC2) and backward (through the reanalyses of MC2) in time to generate a wind atlas for any location in Canada. They claim to also have modelled the wind power potential for whole Africa.
Tammelin [155] reported for the Finnish case that the Finnish Meteorological Institute is working on wind power forecasts, using their version of the HIRLAM model plus a number of smaller scale models to scale the wind speed down to the surface. An additional problem appearing in Finland is the difference in power curve due to low temperatures and icing.

ANEMOS.plus/SafeWind The State of the Art in Short-Term Prediction of Wind PowerA Literature Overview, 2nd Edition
DELIVERABLE REPORT 2011-01-30 41
Dierer et al. [156
] investigated the use of MM5 for wind energy purposes, not necessarily just with short-term forecasting in mind. They found no big differences in overall performance according to choice of planetary boundary layer schemes, though the ETA and Blackadar scheme seemed generally quite good. An increase in horizontal resolution from 10km to 1km did not bring about large improvements. “This is not an expected result, especially in orographically structured terrain, but it implies that the quality of the modelled wind profile is limited by other factors than the horizontal resolution, for instance the forcing data.”
A large effort to the aim of meteorological forecasts for wind energy purposes has also been made by the original ANEMOS project. A long report [157
] details some work on especially downscaling techniques with microscale, mesoscale and CFD models. The best parameterisation for MM5 was found to be MRF, although it did not lead the competition at every forecast horizon and case study. If possible from a computational point of view, two-way nesting between domains is clearly preferred. While one group using mostly physical modelling reported increased accuracy down to two kilometre grid spacing, another one using an advanced statistical model claimed no improvement when going from 9 to 3 km grid spacing. This is probably due to the fact that the forecasted time series become more “realistic” when increasing horizontal resolution, in the sense that the ups and downs of the time series have a similar amplitude to the original series in the high frequency domain. However, this means a higher potential for phase errors, so for the usual RMS error or MAE the error goes up. Increasing the horizontal resolution beyond the resolution of the terrain database is fairly useless. On the other hand, increasing the vertical resolution in the lowest, say, 200m of the atmosphere improved the results in all cases. The report closed with the following recommendations: “If you have a site in complex terrain, where you even after using an advanced MOS are not happy with the forecasts, then try to use higher resolution modelling. In many cases and with a large number of approaches, the models can improve the NWP results. When setting up a model yourself, make sure to use the best terrain DB available (e.g. SRTM data), and try to get good NWP input data. Set up the model to have good vertical resolution, and reasonable horizontal resolution. Find out for yourself what “reasonable” means in this context. Use a MOS. Use insights gleaned from high-resolution modelling to decide which parameters to employ in the MOS. In any case, setting up a model from scratch will take a long time before one is familiar with the model and its quirks, so do not plan on having a solution up and running immediately.”
For a real-time implementation of WRF (the successor of MM5) at Risø-DTU, Hahmann and Pena [158
For the same set-up, Draxl et al. set up a data assimilation system (WRFDA, 3DVAR) and performed initial tests. They investigated which model parametrisations would best capture wind conditions in the vicinity of the Horns Rev wind farm, and evaluated different model runs of the WRF model with 7 different boundary layer schemes [
] reported and described preliminary verification results for the modelling system using surface observations and tall mast observations from Denmark. “In general, below 80-100m WRF overestimates wind and underestimates it above this level.”
159
The data assimilation system was then used to assimilate winds measured at the nacelle of the wind turbines at Horns Rev, to improve the mesoscale wind forecast for that wind farm [
]. The main findings are that the YSU-scheme tends most of all to make the profiles neutral also when stable conditions were observed.
160
]. Nacelle winds are a new data set and are not used so far for common assimilation systems. The data assimilation experiments included the nudging technique and 3DVAR. The main findings here are that using the nudging technique the forecast could be improved for up to 2 hours, with 3DVAR much longer.
An interesting option for dedicated data collection for assimilation in a meso-scale model has been presented by Ágústsson et al. [161, 162
]: they use the Small Unmanned Meteorological Observer SUMO, a model airplane of 580g total weight, as a “recoverable radiosonde” for ad-hoc observations in the atmosphere, and assimilate the run in WRF. For the wind flow over the Eyjafjalla volcano in Iceland, they find a “major difference in flow pattern extending far above mountain top level.”
Badger et al. [163] discussed the limitations of mesoscale modelling in the context of wind energy resource mapping, and described a post-processing procedure developed at Risø-DTU where output from mesoscale models was linked to microscale modelling, such that correct verification of the models could be performed, and so that the application of mesocale models could be extended for wind resource assessment, analysis of wind conditions or short-term predictions. As an example, generalized winds for a specific storm event were calculated.

ANEMOS.plus/SafeWind The State of the Art in Short-Term Prediction of Wind PowerA Literature Overview, 2nd Edition
DELIVERABLE REPORT 2011-01-30 42
3.3 Ensemble NWP systems TIGGE, the THORPEX Interactive Grand Global Ensemble, is a key component of the THORPEX World Weather Research Programme to accelerate the improvements in the accuracy of 1-day to 2 week high-impact weather forecasts. Table 4 lists the global ensemble systems that exist and contribute to the TIGGE database. For references of the different systems see [164, 165, 166, 167, 168, 169, 170, 171, 172
]. The data can be accessed via three servers in Europe (http://tigge-portal.ecmwf.int/), America (http://tigge.ucar.edu/) and Asia (http://wisportal.cma.gov.cn/tigge/). The forecasts are available for research purposes with a time delay of 48h. In 2010 the ECMWF-EPS resolutions will increase from TL399/TL255 to TL639/TL319 respectively.
Table 4: Global ensembles contributing to the TIGGE database (source: ECMWF Users Meeting, 11 June 2008 – Roberto Buizza: TIGGE: comparison and combination of ensembles)
Table 5: EUMETNET-SRNWP overview of operational Ensemble Prediction Systems (EPS) in Europe as of July 2009 compiled by Detlev Majewski (Deutscher Wetterdienst, Germany)
In Europe seven operational limited-area ensembles are running at the large meteorological centres (and the one by WEPROG, see section 6.2). Table 5 gives an overview. Some of these systems will be stored in a central database within the TIGGE-LAM project, the Limited Area Model component of TIGGE (see http://www.smr.arpa.emr.it/tiggelam/). In addition to the operational LAM-EPS systems the German weather service runs the SRNWP-PEPS under the EUMETNET SRNWP program. The SRNWP-PEPS is an experimental system that generates probabilistic forecasts from a multi-model Poor mans Ensemble Prediction System. The SRNWP-PEPS is a combination of the operational limited area forecasts of the European weather services. The latest configurations of the contributing models can be seen from Table 2. Figure 32 shows the patchwork that is a result of the overlapping of the different model domains.
Country Model Mesh size (km)
Number of gridpoints
Number of levels
Initial times & Forecast ranges (h)
Type of data assimilation
Model providing LBC data
Italy (for COSMO) COSMO-LEPS 10 306 x 258 32 12 +120h ECMWF EPS ECMWF EPS
Austria (for ALADIN/LACE) ALADIN-LAEF 18 324 x 225 37 00/12 +60h Downscaling of ECMWF SV
ECMWF EPS
Norway LAMEPS 12 232 x 371 60 06/18 +60h SV initial perturbation ECMWF TEPS
MOGREPS-G 90 288x217 38 00/12 +72h Local ETKF -
MOGREPS-R 24 300x180 38 06/18 +54h Regional ETKF MOGREPS-G
23 -France global 55 18 +60h SV initial perturbation -
133 -Antipode
Hungary (for ALADIN) ALADIN 12 229 x 205 46 18 +60h SV initial perturbation in PEARP
PEARP
PEARP (ARPEGE EPS)
France
United Kingdom

ANEMOS.plus/SafeWind The State of the Art in Short-Term Prediction of Wind PowerA Literature Overview, 2nd Edition
DELIVERABLE REPORT 2011-01-30 43
Figure 32: Number of forecasts available at each grid point for the SRNWP Poor mans Ensemble Prediction System (PEPS). The patchwork is a result of the different model domains that are used for the operational forecast products of the European weather services.
3.4 Ensemble forecast applications for wind prediction The EU FP 6 PREVIEW Windstorms project (see www.preview-windstorms.eu) has delivered a new Windstorm warning and forecast service for much of Europe, particularly in the north and west. Alerts are generated for a set of 205 specific locations. The sites were chosen as ones for which verifying observations were routinely and reliably available and which are well distributed over Europe in locations of highest vulnerability (e.g. close to big cities). Figure 33 shows the location of the observational sites and illustrates the Windstorms service. One of the main aims of the Windstorms project was to implement a pre-operational multi-model ensemble forecasting system, and to assess its performance. The Windstorms project used forecasts from a combination of the MOGREPS, PEARP, SRNWP-PEPS and LAMEPS systems for the short range and the ECMWF EPS and the COSMO-LEPS systems for the medium range. To create the combined ensemble forecast for days 1-2 and days 3-5 the data from each of the ensembles is pooled into one super-ensemble with each individual ensemble having the same weighting. The Windstorm forecast system uses forecasts of both mean windspeed and gust speed. Estimates of forecast gust speeds are generated using an algorithm provided by project partner Meteo-France and based on boundary layer turbulence theory. This method is well-suited to strong-wind situations, but it should be noted that it is not suitable for predicting strong gusts due to convective storms. This algorithm has been implemented in each of the ensemble producing centres, and gust forecasts are provided to the database for each site in the same way as the mean windspeed forecasts.
Table 6: Reliability and ROC area scores for combined ensembles for 1-2 day forecasts of windspeeds exceeding 10, 15 and 20 ms-1 including and excluding the GE ensemble. (Note the figures including GE are identical to those presented in Table V.) In each column, the better score is highlighted in bold.
Reliability Scores ROC Area Scores Combined Ensemble 10 ms-1 15 ms-1 20 ms-1 10 ms-1 15 ms-1 20 ms-1
Including GE 0.00361 0.00133 0.00040 0.881 0.811 0.684
Excluding GE 0.00484 0.00159 0.00044 0.869 0.797 0.662
ANEMOS.plus/SafeWind The State of the Art in Short-Term Prediction of Wind PowerA Literature Overview, 2nd Edition
DELIVERABLE REPORT 2011-01-30 44
a) b)
Figure 33: Illustrations of the Windstorms service. (a) Example of a traffic-light map showing the risk of a windstorm event in the next two days at locations around Europe. (b) Example of a meteogram giving forecasts of wind speed and gust-speeds.
It was shown during the verification in Windstorms [173
Table 6
] that the SRNWP-PEPS ensemble (GE) performed notably differently from the other individual ensembles, and had the lowest individual reliability and Brier scores, although it did have greater resolution. This is due to the fact that it is a poor man’s ensemble combining individual deterministic forecasts which are generated by the most sophisticated models running operationally at the weather services in Europe. Therefore, the individual forecasts of the SRNWP-PEPS might have greater skill than those of the other ensemble systems, but it does not necessarily produce a good probabilistic forecast. shows that excluding the SRNWP-PEPS from the combined ensemble gives lower scores for the reliability as well as the resolution (ROC-area). This does indicate that having ensemble diversity in the combined ensemble is beneficial. 3.5 Ensemble Kalman Filtering The Kalman filter methods have gained popularity for data assimilation tasks in recent years, because they account for the dynamic propagation of model errors. Anderson and Anderson [174
This limitation of the Kalman filter technique (KF) in meteorological context was however found to not be a limitation in wind power context, because there, the area of observational distribution is also rather small, even if the area spans over an entire country. Therefore, Möhrlen and Jørgensen [
] found an ensemble Kalman filter methodology to combine data assimilation with generation of ensembles to also account for the uncertainty in the forecasting step. However, the method only worked well in low-order systems and could not be applied to large atmospheric models.
175
174
] found that only a type of ensemble Kalman filter techniques (EnKF) can be adopted for wind power purposes. As described by Anderson and Anderson [ ] and Houtekamer and Mitchell [176
In the EnKF, this procedure is approximated by using an ensemble of short-range forecasts, where the forecast error covariance is directly computed from the ensemble when they are needed for the data assimilation. Meng and Zhang [
], the standard KF propagates the error covariance from one assimilation step to the next, which is computationally expensive.
177
Möhrlen and Jørgensen [258] followed the same strategy and used an ensemble that is independent of the data assimilation system and also built upon a multi-scheme approach, their in-house MSEPS.
] found that it was beneficial to use a multi-scheme ensemble approach rather than a single-scheme approach, because it does not require such a large ensemble size to cover the uncertainties. They built an ensemble based on a Penn-State University WRF model kernel and different parameterisation schemes.

ANEMOS.plus/SafeWind The State of the Art in Short-Term Prediction of Wind PowerA Literature Overview, 2nd Edition
DELIVERABLE REPORT 2011-01-30 45
Their MSEPS system has 75 ensemble members with various different parameterisation schemes for the advection and the fast physical processes such as condensation and vertical diffusion. The authors developed the Ensemble Kalman Filter as part of the HREnsembleHR project, funded by the Danish PSO programme 2006-2009 (see www.hrensemble.net) and called it an “inverted Kalman Filter technique” (iEnKF). It was introduced it in 2009 [175] and became an operational short-term forecasting approach rolled out by WEPROG at the beginning of 2010 in Germany, Denmark, Ireland and Canada. The approach is a generalised multi-dimensional state estimate methodology, which is capable of translating information between any kind of variables, that can be forecasted reasonably well by an ensemble prediction system like the MSEPS. The effect of each measurement is computed in the non-dimensional ensemble percentile space and the time dependency is determined via the forecast covariance of the ensemble. The strength of the iEnKF approach is the capability of combining different types of measurements. In this way meteorological SYNOP data, recorded data from wind farms and other power data can be combined to a consistent forecast.

ANEMOS.plus/SafeWind The State of the Art in Short-Term Prediction of Wind PowerA Literature Overview, 2nd Edition
DELIVERABLE REPORT 2011-01-30 46
4. Short-term prediction models The previous chapter dealt with the meteorological input to the short-term prediction model proper, i.e. the power conversion model. Here, the emphasis is on operational models, although a number of pure research models are included. Probably the earliest model was developed by McCarthy [178
] for the Central California Wind Resource Area. It was run in the summers of 1985-87 on a HP 41CX programmable calculator, using meteorological observations and local upper air observations. The program was built around a climatological study of the site and had a forecast horizon of 24 hours. It forecast daily average wind speeds with better skill than either persistence or climatology alone.
In 1990, Landberg [179 (with Troen), 180] developed a short-term prediction model, now known as Prediktor, based on physical reasoning similar to the methodology developed for the European Wind Atlas [181
The site assessment regarding roughness is done as input for WAsP. There, either a roughness rose or a roughness map is needed. From this, WAsP determines an average roughness at hub height. This is the roughness used in the geostrophic drag law or the logarithmic profile.
]. The idea is to use the wind speed and direction from a NWP, then transform this wind to the local site, then to use the power curve and finally to modify this with the park efficiency. Note that the statistical improvement module MOS can either be applied before the transformation to the local wind, before the transformation to power, or at the end of the model chain to operate on the power itself. A combination of all these is also possible. He found that for the MOS to converge, about 4 months worth of data were needed (which might not be available when setting up the model for a new customer). Landberg used the Danish or Risø version for all the parts in the model: the HIRLAM model of the DMI as NWP input, the WAsP model from Risø to convert the wind to the local conditions and the Risø PARK model to account for the lower output in a wind park due to wake effects. Two general possibilities for the transformation of the HIRLAM wind to the local conditions exist: the wind could be from one of the higher levels in the atmosphere, and hence be treated as a geostrophic wind, or the wind could be the NWPs offering for the wind in 10m a.g.l. Usually this wind will not be very accurately tailored to the local conditions, but will be a rather general wind over an average roughness representative for the area modelled at the grid point. In the NWP, even orography on a scale smaller than the spatial resolution of the model is frequently parameterised as roughness. This point is less important now, with the advances in computing power since the inception of the model and the subsequently increased horizontal resolution. If the wind from the upper level is used, the procedure is as follows: from the geostrophic wind and the local roughness, the friction velocity u* is calculated using the geostrophic drag law. This is then used in the logarithmic height profile, again together with the local roughness. If the wind is already a wind from between 10m a.g.l. and hub height, then the logarithmic profile can be used directly.
7 Only one WAsP correction matrix is used, which could be too little for a larger wind farm [182]. In his original work, Landberg and Watson [183] determined the ideal HIRLAM level to be modelling level 27, since this gave the best results. However, the DMI changed the operational HIRLAM model in June 1998, and Joensen et al. [184] found that after the change the 10m wind was much better than the winds from the higher levels. After the change, passing storm systems were also better predicted, only missing the level once for the 9 storms in 1998 and not missing the onset at all [185]. The model has also been used at ESB (Electricity Supply Board, Ireland) [186 317] and in Iowa [ ]. There, for predictions of the Nested Grid Model of the US National Weather Service, the use of MOS was essential. This was partly because the resolution of the Nested Grid Model was ca. 170km, and no local WAsP analysis of the site was available. Prediktor was also used in the generic SCADA system CleverFarm for maintenance scheduling [187
].
The Wind Power Prediction Tool (WPPT) has been developed by the Institute for Informatics and Mathematical Modelling (IMM) of the Technical University of Denmark. In 2006, the original developer Torben Skov Nielsen together with Henrik Madsen and Henrik Aalborg Nielsen founded the DTU spin-off company Enfor, which now stands for all commercial activity with the model. WPPT has been
7 In Previento, the geostrophic profile is used in conjunction with the roughness used by the NWP, not the mesoscale roughness.

ANEMOS.plus/SafeWind The State of the Art in Short-Term Prediction of Wind PowerA Literature Overview, 2nd Edition
DELIVERABLE REPORT 2011-01-30 47
running operationally in the western part of Denmark since 1994, and in the eastern part since 1999. Initially, they used adaptive recursive least squares estimation with exponential forgetting in a multi-step set-up to predict from 0.5 up to 36 hours ahead. However, due to the lack of quality in the results for the higher prediction horizons, the forecasts were only used operationally up to 12 hours ahead. In a later version, HIRLAM forecasts were added [188
Figure 34
], which allowed the range of useful forecasts to be extended to 39 hours ahead. A data-cleaning module was developed, as was an upscaling model (see eg ). This version has successfully operated at Elsam and other Danish utilities [189WPPT is a modelling system for predicting wind power production for individual wind farms, for groups of wind farms or for a larger region. WPPT can be configured to take advantage of the following data:
].
* On-line power production measurements for individual wind farms. * Aggregated on-line power production measurements for larger areas. * Off-line power production measurements for individual wind farms. * Aggregated off-line power production measurements for larger areas. * Numerical Weather Prediction (NWP) data covering individual wind farms. * NWP data covering larger areas. * Multiple NWP forecast providers. * Scheduled availability and curtailment. The forecasts can be in the form of single point forecasts (forecasts of the expected value) or in the form of probabilistic forecasts where the entire distribution of the expected outcome is given. The complexity of the model structure employed by WPPT will depend on the available data. In order to illustrate the flexibility of WPPT, a complex installation for predicting the total wind power production in a larger region based on a combination of on-line measurements of power production from selected wind farms, power measurements for all wind turbines in the region and numerical weather predictions of wind speed and wind direction is presented here as an example. A central part of this system are the statistical models for short-term prediction of the wind power production in wind farms or areas. The modelling system combines traditional linear models with a specific but very general class of non-linear models - the conditional parametric models. For on-line applications it is advantageous to allow the function estimates to be modified as data become available. Furthermore, because the system may change slowly over time, observations should be down-weighted as they become older. For this reason a time-adaptive and recursive estimation method is applied. The time-adaptivity of the estimation is an important property as the total system consisting of a wind farm or area, íts surroundings and the numerical weather prediction (NWP) model itself will be subject to changes over time. This is caused by effects such as aging of the wind turbines, changes in the surrounding vegetation and maybe most importantly due to changes in the NWP models used by the weather service as well as changes in the population of wind turbines in the wind farm or area. Nielsen et al. [123] found a way to algorithmically optimise the tuning parameters for the time adaptive model, like forgetting factor and bandwidth. In the same work, they also improved the robustness of WPPT against suspicious data. Depending on the available data the WPPT modelling system employs a highly flexible modelling hierarchy for calculating predictions of the available wind power from wind turbines in a region. For a larger region this is typically done by separating the region into a number of sub-areas. Wind power predictions are then calculated for each sub-area and hereafter summarized to get a prediction for the total region. In the following an installation using on-line production data from a number of wind farms in a region (reference wind farms), off-line production data for the remaining wind turbines in the region and numerical weather predictions of wind speed and wind direction in the calculation of a total regional power prediction is outlined. The predictions cover a horizon corresponding to the prediction horizon of the numerical weather predictions - typical from 1 to 48 hours ahead in time. The time resolution of the predictions can be chosen freely but a reasonable choice for the longer prediction horizons is to use the same time resolution as available for the numerical weather predictions. The predictions for the total region are calculated for a number of reference wind farms using on-line measurements of power production as well as numerical weather predictions as input (see section ‘The wind farm model’). The predictions from the reference wind farms in the region are summarized and hereafter up-scaled to get the prediction of power production of all wind turbines in region. This modelling chain takes advantage of the auto-correlation which is present in the power production for prediction horizons less than approximately 12-18 hours, but also of the smooth properties of the total

ANEMOS.plus/SafeWind The State of the Art in Short-Term Prediction of Wind PowerA Literature Overview, 2nd Edition
DELIVERABLE REPORT 2011-01-30 48
production as well as the fact that the numerical weather models perform well in predicting the weather patterns but less well in predicting the local weather at a particular wind farm. The power prediction for the region is here calculated directly by the up-scaling model but a larger region could be separated into a number of sub-areas each covered by a model chain as described above. The total power production will then be calculated as a sum of the predictions for the sub-areas. IMM and Risø had started a more formal collaboration under the Zephyr name [190
]. Originally the name of a collaboration project with the target to unify the Prediktor and WPPT models, it ended up being the common header for joint activities, but is rarely used any more.
A rather similar approach to Prediktor was developed at the University of Oldenburg [191]. They named it Previento [192]. They used the Deutschlandmodell [193] or later the Lokalmodell (LM) of the German Weather Service (DWD) as the NWP model. A good overview over the parameters and models influencing the result of a physical short-term forecasting system has been given by Mönnich [194
180]. He found that the most important of the various submodels being used is the model for the
atmospheric stability, although back in 1990, Landberg [ ] had found that the heat flux parameter of HIRLAM was not sufficiently accurate to improve the results (Badger [123] later built a pre-processor for the upscaling of 10m wind speeds improving the forecast especially in complex terrain (Alaiz)). Mönnich found also that the submodels for orography and roughness were not always able to improve the results. The use of MOS was deemed very useful. However, since the NWP model changed frequently, the use of a recursive technique was recommended. A large influence was found regarding the power curve. The theoretical power curve given by the manufacturer and the power curve found from data could be rather different. Actually, even the power curve estimated from data from different years could show strong differences. The latter might be due to a complete overhaul of the turbine. The largest influence on the error was deemed to come from the NWP model itself. In 2004, the two principal researchers behind Previento, Matthias Lange and Ulrich Focken, left the University to form energy & meteo systems, a company which had good success from the start and has now over 20 employees. For their work on regional smoothing of forecasting error see chapter 5. Their work on the weather dependent combination of models is also published in [15] or in [61]. In essence, principal component analysis identifies between 5 and 8 different weather types, and the model parameters are optimised according to weather type. The current forecasting model of Oldenburg University is called Hugin [195
]. It employs NCEP and ECMWF forecasts.
AMI Environmental (the former Applied Modeling Inc) [196
] provide a service not unlike Prediktor, except that their expertise is running a mesoscale model (MM5 or WRF). Instead of WAsP, they use the in-house Diagnostic Wind Model DWM, a mass-consistent model capable of resolution of 100m or better. When power data is available, an adaptive statistical model can be employed for bias removal.
ARMINES and RAL have developed work on short-term wind power forecasting since 1993. Initially, short-term models for the next 6-10 hours were developed based on time series analysis to predict the output of wind farms in the frame of the LEMNOS project (JOU2-CT92-0053). The developed models were integrated in the EMS software developed by AMBER S.A and installed for on line operation in the island of Lemnos. Various approaches have been tested for wind power forecasting based on ARMA, neural networks of various types (backpropagation, RHONN etc), fuzzy neural networks, wavelet networks etc. From this benchmarking procedure, models based on fuzzy neural networks were found to outperform the other approaches [76,197,198In the frame of the project CARE (
]. JOR-CT96-0119) [199], more advanced short-term models were
developed for the wind farms installed in Crete. In the ongoing project MORE-CARE (ERK5-CT1999-00019), ARMINES developed models for the power output of a wind park for the next 48/72 hours based on both on-line SCADA and Numerical Weather Predictions (meteorological forecasts). The developed forecasting system can generically accept as input different types of meteorological forecasts (ie Hirlam, Skiron etc.). The wind forecasting system of ARMINES integrates:

ANEMOS.plus/SafeWind The State of the Art in Short-Term Prediction of Wind PowerA Literature Overview, 2nd Edition
DELIVERABLE REPORT 2011-01-30 49
• short-term models based on the statistical time-series approach able to predict efficiently wind power for horizons up to 10 hours ahead.
• longer-term models based on fuzzy neural networks able to predict the output of a wind farm up to 72 hours ahead. These models receive as input on-line SCADA data and numerical weather predictions [200
• combined forecasts: such forecasts are produced from intelligent weighting of short-term and long term forecasts for an optimal performance over the whole forecast horizon.
].
The developed prediction system is integrated in the MORE-CARE EMS software and is installed for on-line operation in the power systems of Crete and Madeira [201]. A stand alone application of the wind forecasting module is configured for on-line operation in Ireland [202]. An evaluation of this application is presented in [203
For Ireland, they show that using a power curve derived from HIRLAM wind and measured power can improve the forecast RMSE by nearly 20% in comparison to using the manufacturers power curve [
]. The average reported error is in the order of 10% of the installed power.
202]. 80 MW of wind power are installed on the island of Crete where the demand varies between 170-450 MW throughout the year. Wind penetration reaches high levels. Furthermore, the fact that the network is an autonomous one, makes the use of wind power forecasting necessary for an economic and secure integration of wind farms in the grid. Currently, the MORE-CARE system [204
In Portugal, the MORE-CARE system is operated by EEM and provides forecasts for the production of the wind farms at the island of Madeira. The prediction modules provide forecasts for the short-term up to 8 hours ahead using on-line SCADA data as input. Moreover, MORE-CARE provides predictions for the run-of the river hydro installations of the island.
] is installed and operated by PPC in Crete and provides wind power forecasts for all the wind farms for a horizon of 48 hours ahead. These forecasts are based on numerical weather predictions provided by the SKIRON system, which is operated by IASA. On-line data are provided by the SCADA system of the island.
The ISET (Institut für Solare Energieversorgungstechnik, now the main part of the Fraunhofer Institut für Windenergie und Energiesystemtechnik IWES) has since 2000 operatively worked with short-term forecasting, using the DWD model and neural networks. It came out of the German federal monitoring program WMEP (Wissenschaftliches Mess- und EvaluierungsProgramm) [205], where the growth of wind energy in Germany was to be monitored in detail. Their first customer was E.On, who initially lacked an overview of the current wind power production and therefore wanted a good tool for nowcasting [206Ernst and Rohrig [
]. Then, their model was called Advanced Wind Power Prediction Tool AWPT. 207] reported in Norrköping in 2002 on the latest developments of ISET's Wind
Power Management System WPMS. They then predicted for 95% of all wind power in Germany. In some areas of German TSOs E.On Netz and Vattenfall Europe Transmission, wind power has exceeded 100% coverage at times. One additional problem in Germany is that the TSOs even lack the knowledge of the currently fed in wind power. In the case of E.On Netz, the ca 5 GW installed capacity are upscaled from now 50 representative wind farms with 1/3 of the total installed capacity (was: 16 totalling 425 MW). Their input model was the Lokalmodell (always the actual model) of the DWD, which they then feed into an ANN. To improve on the LM, they tried out transforming the predicted wind to the location of wind farms using the numerical mesoscale atmospheric model KLIMM (KLImaModell Mainz), but dropped it again [208]. The LM is run twice daily with a horizontal resolution of 7 km, forecasting up to 48 hours ahead. The ANN also provides for an area power curve. The WPMS runs at E.On since 2001, at RWE since June 2003, for Vattenfall Europe since the end of 2003, and in a variety of other places as well [209
]. A version for two hours horizon has been developed for National Windpower in the UK. For the E.On total area, they claim RMSE values of 2,5% for 1h horizon (persistence would be 3,3%), 5,2% (7,3% for p.) at 3h, 6% (9% for p.) at 4h, and reach the error of a purely NWP based prognosis (7,5%) at 7h horizon.
The Sustainable Energy Research Group (SERG) in University College Cork (UCC) has been researching and developing wind power forecasting methodologies based on ensemble forecasts in the years 2002-2006, see eg [210,211,212,213,214,215
6.2
]. An operational forecasting system was developed by the principle researchers in UCC and brought to life in 2004 by WEPROG (Weather and wind Energy PROGnosis), which was founded in 2003. Details regarding the ensemble approach will be discussed in the ensemble forecasting section (see chapter ). WEPROG's MSEPS system contains a 2-step power prediction module. In the first step a physical reference power is computed

ANEMOS.plus/SafeWind The State of the Art in Short-Term Prediction of Wind PowerA Literature Overview, 2nd Edition
DELIVERABLE REPORT 2011-01-30 50
and in a second step, the reference power is localised statistically and with the help of weather classes defined by the ensemble weather input. It is the first and only operational specific ensemble prediction system for wind power at present (2010), where up to 900 weather parameters are input to the power prediction (see eg.g. [43,44,216
]), and is operationally forecasting wind power on all continents, where there is wind power installed, except South America.
eWind is an US-American model by TrueWind, Inc (now AWS TruePower) [217
221
]. Instead of using a once-and-for-all parameterisation for the local effects, like the Risø approach does with WAsP, they run the ForeWind numerical weather model as a meso-scale model using boundary conditions from a regional weather model. This way, more physical processes are captured, and the prediction can be tailored better to the local site. In the initial configuration of the eWind system, they used the MASS (Mesoscale Atmospheric Simulation System) model [ ]. Additional mesoscale models used were: ForeWind, MM5, WRF, COAMPS, workstation-ETA and OMEGA. To iron out the last systematic errors they use adaptive statistics, either a traditional multiple screening linear regression model, or a Bayesian neural network. Their forecast horizon is 48 hours. They published a 50% improvement in RMSE over persistence in the 12-36 hour range for 5 wind towers in Pennsylvania [218]. Their model is also used by SecondWind for integration into their SCADA system [219The current iteration of eWind uses ARPS, MASS and WRF, fed by the global models GFS, GEM and ECMWF, to yield an ensemble of 9 different model runs [
].
220
EWind, Prediktor and AMI’s WERF have been used concurrently in California and Texas [
]. For the average prediction of 6 wind farms in Europe, their “results reveal that the ensemble prediction outperforms the accuracy of [...] the MOS method applied to single NWP models, achieving between a 20 and 30 % of improvement during the first three days of prediction.”
221]. Both are delivering forecasts for two large wind farm areas, 900 turbines (90 MW) in Altamont Pass and 111 turbines (66.6 MW) at San Gorgognio Pass. The first results for an initial 28-day period are published in the reference. TrueWind reaches a MAE of 10.8% of the installed capacity for same day forecasting, and 11.7% for next day. Prediktor (using the ETA model run by NOAA of the US) achieved a MAE of 2.4 m/s for the 48-hour horizon, but was not yet fully optimised for this application. In the final report [222
Zack [
], MAEs in the range of 44-59% of mean production are encountered. “The reasons for the relatively high forecast errors in California are thought to be the complex terrain at the Altamont, Mountain View I & II, and Southwest Mesa wind project sites, the annual transitions back and forth between the high-wind speed and strong-diurnal character of the spring and summer seasons and the low-wind speed character of the fall and winter seasons at both sites, and observations that the ETA and AVN numerical weather prediction models used by Risoe and TrueWind each do a better job forecasting California weather under different synoptic conditions.” An interesting approach here came from the University of California at Davis, which conducted a wind tunnel evaluation of a scale model of a portion of the Altamont Pass wind resource area. They tried to relate wind speeds at one meteorological tower in the farm with wind speeds at Livermore airport, and subsequently with forecasts for the airport, but concluded that the representativity of a single met mast for such a large area as the Altamont wind farms is too low.
223
] of AWS TrueWind (now TruePower) presented their high resolution atmospheric model to operate in a rapid update cycle mode, called WEFRUC – Wind Energy Forecast Rapid Update Cycle. The model assimilates different types of data available in the local-area environment of a wind plant such as remotely sensed data, which is the starting point for a short-term simulation of the atmosphere. So, the atmospheric simulation produced by the physics based model is incrementally corrected through the use of the measured data as it evolves. Their update cycle is 2 hours.
The strong wind energy growth in Spain led Red Eléctrica de España (the Spanish TSO) to have the Sipreólico tool developed by the University Carlos III of Madrid [224]. The tool is based on Spanish HIRLAM forecasts, taking into account hourly SCADA data from 80% of all Spanish wind turbines [225
2
]. These inputs are then used in adaptive non-parametric statistical models, together with different power curve models. There are 9 different models, depending on the availability of data: one that work along the lines of the models in section , not using NWP input at all. Three more include increasingly higher order terms of the forecasted wind speed, while a further three also take the forecast wind direction into account. The last two are combinations of the other ones, plus a non-parametric prediction of the diurnal cycle. These 9 models are recursively estimated with both a Recursive Least Squares (RLS) algorithm and a Kalman Filter. For the RLS algorithm, a novel approach is used to determine an adaptive forgetting factor based on the link between the influence of a new observation,

ANEMOS.plus/SafeWind The State of the Art in Short-Term Prediction of Wind PowerA Literature Overview, 2nd Edition
DELIVERABLE REPORT 2011-01-30 51
using Cook’s distance as a measure, and the probability that the parameters have changed. The results of these 18 models are then used in a forecast combination [226
Figure 27
], where the error term is based on exponentially weighted mean squared prediction error with a forgetting factor corresponding to a 24-h memory. The R2 for all of Spain is more than 0.6 for a 36-h horizon. The main problem of the Spanish case is the Spanish HIRLAM model in conjunction with the complex terrain. The resolution of HIRLAM is not enough to resolve the flow in many inland areas. The model itself works very well when driven by measured wind speeds instead of predicted ones (with R2 over 0.9 for the whole horizon, see also ). LocalPred and RegioPred [227] are a family of tools developed by Martí Perez (formerly CIEMAT, now CENER) et al. Originally, it involved adaptive optimisation of the NWP input based on principal component analysis, time series modelling, mesoscale modelling with MM5, and power curve modelling. They could show for a case of rather complex terrain near Zaragoza (Spain), that the resolution of HIRLAM was not good enough to resolve the local wind patterns [228]. The two HIRLAM models in Spain were at the time running on a 0.5°x0.5° and 0.2°x0.2° resolution. The use of WPPT as a statistical post-processor for the physical reasoning was deemed very useful in the early stages of the development [229].Successive research and development carried out at CENER [eg. 230
25
] have transformed LocalPred into a multi model wind power forecasting system. In its current form, an ensemble forecasting model takes MM5, Skiron and the ECMWF model as NWP inputs for learning machine techniques as cluster or support vector machines [ ]. The final prediction is offered by an adaptive model that combines all the individual inputs. GL Garrad Hassan [231
] has a forecasting model called GH Forecaster, based on NWP forecasts from the UK MetOffice. It uses "multi-input linear regression techniques" to convert from NWP to local wind speeds. For T+24h, they reach 35-60% improvement over persistence.
3Tier Environmental Forecast Group [232
] works with a nested NWP and statistical techniques for the very short term in the Pacific Northwestern US. They show performance figures in line with most other groups in the field.
Magnusson and Wern [233] coupled the Swedish HIRLAM to the commercial STAR-CD CFD model for a site in Gotland, Sweden, and concluded that due to the complexity of the terrain, small scale effects are important and “an increased accuracy of the wind prediction can be achieved”. However, they do not back that claim up with actual results of an evaluation. Later, Magnusson [234] spoke about wind forecasts for wind engineering purposes, protecting bridges and airports. Since the Swedish Meteorology and Hydrology Institute's HIRLAM model was not running in sufficient resolution for direct coupling into a CFD model (44 or 22 km), they used DYNAD as an intermediate tool. The CFD modelling is done on a scale of 25 m and yields turbulence levels as the main result. ECN [235
] has developed a forecasting system similar to Prediktor.
Moreno et al. [22] presented a model developed by MeteoLógica. Since they focus on maintenance planning, a long horizon is more important than accuracy. Using ECMWF ensembles, they deliver a forecast for the mean wind six-hourly for a horizon up to 4 days, and a mean daily wind for the horizon from 5-10 days ahead. While the shorter horizons have a quite acceptable accuracy, the long horizons are just slightly better than climatology (calculated as a 30-day running mean from 2 years of data). A site in Galicia was easier to predict than a site in the Ebro valley, which is probably due to the larger influence of meso-scale effects in the latter. The use of this model allowed Ecotècnia to save 3-5% of the O&M crane budget for the two wind farms analysed. Moon et al. [236
] investigated Support Vector Machine techniques for wind energy analysis at WindLogics, using GFS and the US ETA model outputs, as one grid point or an ensemble of the four surrounding grid points. They showed that their approach performed better than persistence, especially over large forecast horizons.
A consortium of Portuguese universities and research institutes [237] developed the EPREV tool and tested it at three wind farm sites in Portugal. MM5 was run as input to either a Wind Farm Power Curve model derived from WAsP, or from the CFD code Ventos, or to a statistical power curve.

ANEMOS.plus/SafeWind The State of the Art in Short-Term Prediction of Wind PowerA Literature Overview, 2nd Edition
DELIVERABLE REPORT 2011-01-30 52
Hydro Quebec and some universities in Canada have a research collaboration for short-term prediction together with the Canadian met service, Environment Canada [238
].
Salcedo-Sanz et al. [239] present an interesting study of three global NWP models downscaled with three different parameterisations of MM5 (with local data assimilation) as input to different neural networks [240
]. Unfortunately, their result “that the bank of neural networks obtains better results than the best of the models with a single neural network” is unreliable at best, as it is based on only one month of data.
Sideratos and Hatziargyriou have developed a wind power prediction model using neural networks emphasising the importance to fit a different model for each part of the power curve [241]. In addition, they combine RBF NN with fuzzy logic in order to improve the use of NWP predictions into a final wind power prediction model [242
].
Recently, Natural Power Consultants and meteoblue launched the ForeSite service [243
], where the mesoscale forecast of meteoblue can be enhanced by the Ventos CFD software.
In the Nordic countries, but also in Canada, icing of wind turbines can decrease the production as the turbines need to shut down, or as the aerodynamic efficiency is strongly reduced due to ice aggregation. The Winterwind conferences are specialised in icing predictions. Thomson [244] talked on the potential of WRF and current developments for direct icing forecasts. Landberg [245] showed an example of power curve degradation due to icing. Durstewitz [246] reported on the difficulties encountered in Germany. Heimo [247
] presented the European COST action 727 “Measuring and forecasting atmospheric icing on structures”.
Telvent DTNt [248
] have implemented a lightning warning system to evacuate the maintenance crew with a warning of lightning activity in the general area (30-60 miles).

ANEMOS.plus/SafeWind The State of the Art in Short-Term Prediction of Wind PowerA Literature Overview, 2nd Edition
DELIVERABLE REPORT 2011-01-30 53
5. Upscaling and spatio-temporal correlations Many larger clients are more interested in the result for a region than for a single wind farm, eg an electrically defined region as for Transmission System Operators (TSOs) or a market region as for traders. In only very few cases, typically where wind power only took off in the last few years, is there online data available for all turbines in a region. In many cases though, like in Denmark, the production data for most wind turbines is only available from the accounting system for payments for the wind turbine owners, with a delay of up to a month. This means that for the purposes of an online forecast, it is useless. Therefore, a correlation has to be found between a few wind farms delivering online data within a region, and the much later determined total regional production. This approach is called upscaling and shall be the topic of section 5.2. Since not all wind farms in a region see the same wind speed at the same time, and since the error made by the NWP is temporally and spatially distributed, the error for forecasting a region is smaller than the error for a single wind farm. In this context it is interesting to investigate the spatial correlations between both the wind power generation and the wind power forecasting errors, as it is the uncorrelated part of the error which generates the error improvement due to spatial smoothing. The variability of an averaged time series, eg expressed as the relative standard deviation of this time series, depends on the respective variability of the single time series, and on the correlation between the various series. For wind power forecasting, there are two effects which reduce the forecast error for a region in comparison to the one of a single wind farm: the generation as such is already smoother for a region due to the uncorrelated frequencies of the single wind farm generation profiles, making it thereby more easily predictable, and the forecast errors are uncorrelated on an even smaller length scale. For the former issue, refer to the literature overview given by Giebel [249
]. In most studies, the generation correlation vanishes on a length scale of about 750 km.
5.1 Models with offsite data input In the early days of the development, some models were developed using translatorical models, essentially trying to get an idea of the upstream wind field and just advecting the features found towards the site in question. More recently, with larger computing power and better data handling facilities, the addition of upstream data as additional model input has received some attention. Papke et al. [250] used a data assimilation technique together with three models to get a forecast of about 1 hour ahead for the wind fed into the Schleswag grid in the German land of Schleswig-Holstein. These three models were a statistical model, analysing the trend of the last three hours, a translatorical model which moved a measured weather situation over the utility's area, and a meteorological model based on very simple pressure difference calculations. No accuracy was given. The translatorical model developed into the Pelwin system [251
Another translatorical model was proposed by Alexiadis et al. [
]. On a time scale of one hour, the weather fronts coming over the North Sea to Schleswig-Holstein are predicted to anticipate high negative gradients due to the shutdown of wind turbines.
94, 252], which uses a cleaning of local influence much like the methodology used in the European Wind Atlas. The Spatial Correlation Predictor avoids the drawback of the usual constant delay method and shows improvements over the latter of up to 30% and more. The same data has been analysed by Barbounis and Theocharis [253], using a local recurrent neural network, and by Damousis et al. [254
] using a fuzzy model trained by a genetic algorithm-based learning scheme.
Larson and Gneiting [255] developed a forecast algorithm using off-site observations in the vicinity of the wind farm and applying statistical space-time modelling. They used linear regression, neural networks, conditional neural networks as well as support vector machines and found improvements over persistence in the range of 7 – 37% in the best cases. Adding 5-km resolution MM5 forecasts helped the forecasts even further [256
].
Tastu et al. [257] analysed the auto- and crosscorrelations of the forecast errors between 5 regions in Western Denmark, and found that ”there exists in general a significant cross-correlation between forecast errors for neighboring areas with lags of a few hours. For the present case study, lags with significant dependency are up to 5 h, while the lags with most effect are the 1- and 2-h lags. This cross-correlation pattern is clearly conditioned by the prevailing weather situation, mainly

ANEMOS.plus/SafeWind The State of the Art in Short-Term Prediction of Wind PowerA Literature Overview, 2nd Edition
DELIVERABLE REPORT 2011-01-30 54
characterized by wind speed and direction. Wind direction is shown to play a crucial role”. Wind direction can be taken into account by a standard regime switching model, but the wind speed dependency required to use a conditional parametric regime switching models. Tastu, Pinson and Madsen [258
] used a Conditional Parametric Vector AutoRegressive model to take the other regional measurements into account in Western Denmark, and found a reduction in RMSE for the hour-ahead forecast of up to 18.5%.
Wessel et al. [259,260,261
Jursa and Rohrig [
] used data from the 30m level of 30 wind measurement masts alongside the usual input of the WPMS, NWP fields from the DWD’s CosmoDE model and power data from 68 reference wind farms distributed over all of Germany. For the first few hours, the addition of wind speeds gives a only a slight improvement in overall NRMSE. However, the “forecast accuracy is improved significantly for short forecast horizons especially at high wind speed cases” where the power signal does not contain any information, since the power curve is flat in that area. ”The NRMSE for situations with more than 90% full load is reduced by up to 20%.” - “Remarkable is that the additional input from the measurements takes effect up to forecast horizon up to eight hours. This is hardly to explain, as one would expect an approximation of the nRMSE values of the different models at higher forecast horizons, when the influence of the measurements on the forecast decreases.”
262
] developed a technique for the automatic choice of input parameters and internal model parameters, based on particle swarm optimisation and differential evolution. “For the variable selection we constructed time delay vectors from data from 30 wind farm locations in an extended area. The optimization algorithms were used to find those time delay vectors which are optimal for the prediction of one wind farm.” For 10 wind farms in Germany, a marked improvement was seen in comparison to manually specified forecasting models.
A special case of this is the visualisation proposed by Cutler [263, 264, 265]. He uses something akin to a Measure-Correlate-Predict technique for the wind field coming from the grid points of the NWP, to yield a site-equivalent wind speed. In this way, the orographic and other surface effects are taken out of the upstream field, and it is easier for the operator to assess the incoming fronts. Even the superposition of those fields for a number of wind farms is possible. An assessment of the spatial uncertainty using several grid points similar to the temporal uncertainty used for the Meteo Risk Index of Armines has also shown good potential [266 260]. Wessel et al. [ ] tried a related approach. “The use of the wind measurements to correct the predicted wind fields of the NWP models by a spatial shift of the whole wind field did not lead to an improvement in wind power prediction. The main reason is belived to be the difficulty to move wind fields over different surfaces.”
5.2 Upscaling The upscaling approach is illustrated for the WPPT forecasting system (Wind Power Prediction Tool, developed at the Technical University of Denmark and now sold by Enfor) in an application for an owner of large wind farms in Figure 34. According to [267
• A reasonable (less than 20) number of wind farms
], this configuration is used by a large wind farm owner in Denmark, and the installation has the following characteristics:
• Online power production data is available for a number of wind farms. • Offline production data with a resolution of 15 min. is available for almost all wind turbines.
These offline data are released with a delay of 3-5 weeks. As illustrated in Figure 34, the upscaling combines the present online production data with the historical offline data to predict the production. Since the correlation between forecast errors becomes weaker with distance, the forecasts for a region are much more accurate than the forecast for single wind farms. This error reduction scales with the size of the region in question. Within this region, only a certain number of wind farms is needed to predict the power production in a region quite accurately. For regions, the error autocorrelation is also stronger on a time scale of days than for single wind farms.
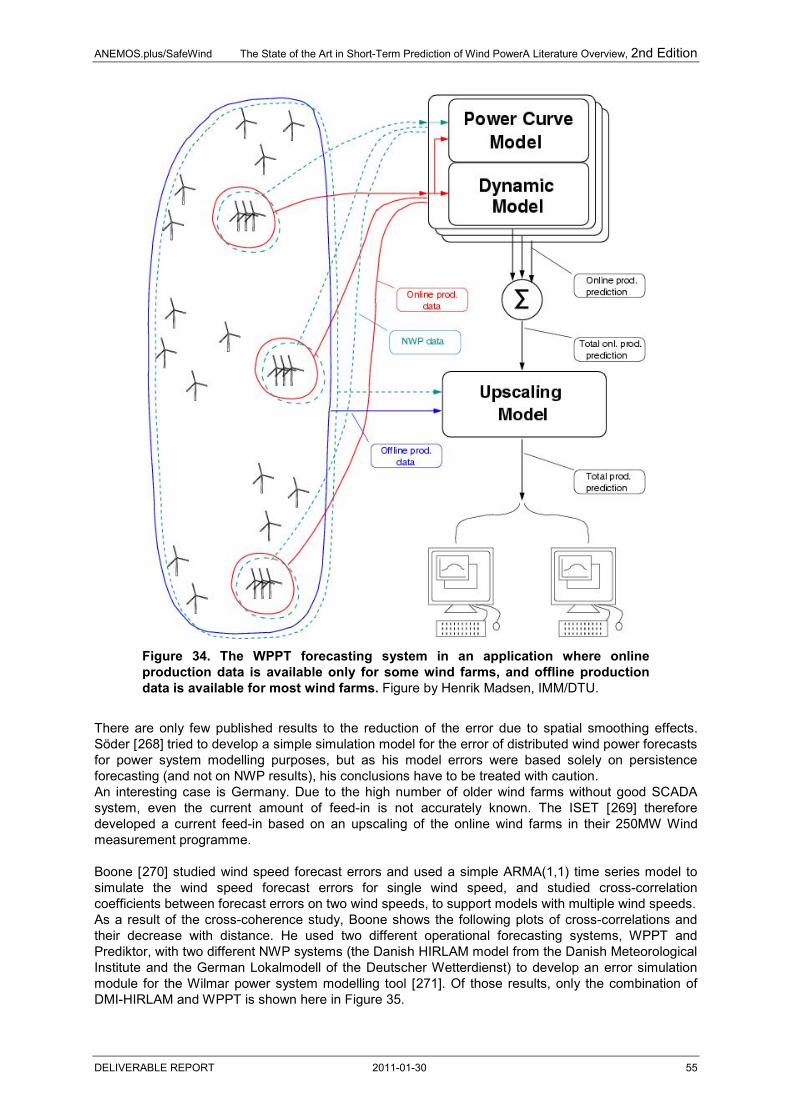
ANEMOS.plus/SafeWind The State of the Art in Short-Term Prediction of Wind PowerA Literature Overview, 2nd Edition
DELIVERABLE REPORT 2011-01-30 55
Figure 34. The WPPT forecasting system in an application where online production data is available only for some wind farms, and offline production data is available for most wind farms. Figure by Henrik Madsen, IMM/DTU.
There are only few published results to the reduction of the error due to spatial smoothing effects. Söder [268
An interesting case is Germany. Due to the high number of older wind farms without good SCADA system, even the current amount of feed-in is not accurately known. The ISET [
] tried to develop a simple simulation model for the error of distributed wind power forecasts for power system modelling purposes, but as his model errors were based solely on persistence forecasting (and not on NWP results), his conclusions have to be treated with caution.
269
] therefore developed a current feed-in based on an upscaling of the online wind farms in their 250MW Wind measurement programme.
Boone [270
As a result of the cross-coherence study, Boone shows the following plots of cross-correlations and their decrease with distance. He used two different operational forecasting systems, WPPT and Prediktor, with two different NWP systems (the Danish HIRLAM model from the Danish Meteorological Institute and the German Lokalmodell of the Deutscher Wetterdienst) to develop an error simulation module for the Wilmar power system modelling tool [
] studied wind speed forecast errors and used a simple ARMA(1,1) time series model to simulate the wind speed forecast errors for single wind speed, and studied cross-correlation coefficients between forecast errors on two wind speeds, to support models with multiple wind speeds.
271Figure 35
]. Of those results, only the combination of DMI-HIRLAM and WPPT is shown here in .

ANEMOS.plus/SafeWind The State of the Art in Short-Term Prediction of Wind PowerA Literature Overview, 2nd Edition
DELIVERABLE REPORT 2011-01-30 56
A least squares fit of the correlations for each set of forecast lengths has been made according to the exponential function
( )λdr −= exp (1) where r is the cross-correlation, d is the distance between the wind farms, and λ is giving the relevant length scale. The estimated length scale increases with the forecast horizon from 62 km for the 0-5 h horizon to 113 km for the 42-47 h horizon, with an average of 81 km.
Figure 35. Correlations between wind speed forecast errors recorded in 2003 for 23 wind farms in western Denmark. In the upper plot, the correlations have been averaged over 25 km bins, while in the lower plot, each correlation is shown along with exponential fits. Darker shades refer to shorter forecast lengths. Figure is from Boone [270].
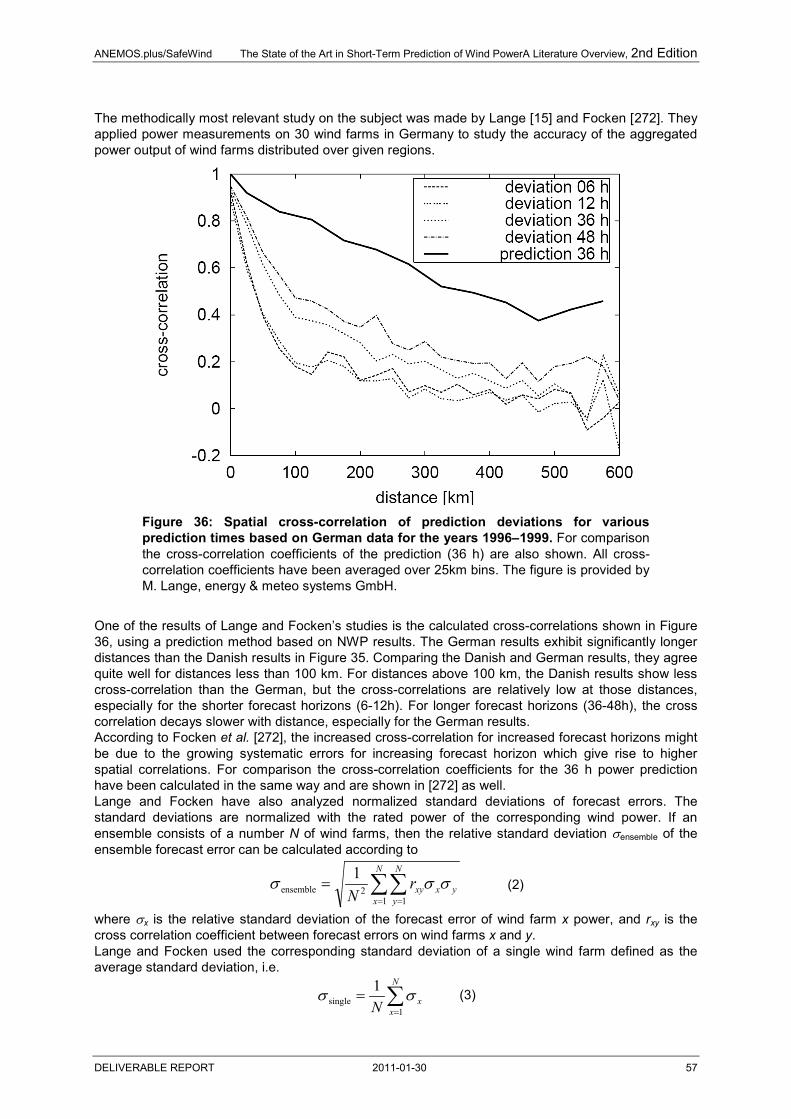
ANEMOS.plus/SafeWind The State of the Art in Short-Term Prediction of Wind PowerA Literature Overview, 2nd Edition
DELIVERABLE REPORT 2011-01-30 57
The methodically most relevant study on the subject was made by Lange [15] and Focken [272
]. They applied power measurements on 30 wind farms in Germany to study the accuracy of the aggregated power output of wind farms distributed over given regions.
Figure 36: Spatial cross-correlation of prediction deviations for various prediction times based on German data for the years 1996–1999. For comparison the cross-correlation coefficients of the prediction (36 h) are also shown. All cross-correlation coefficients have been averaged over 25km bins. The figure is provided by M. Lange, energy & meteo systems GmbH.
One of the results of Lange and Focken’s studies is the calculated cross-correlations shown in Figure 36, using a prediction method based on NWP results. The German results exhibit significantly longer distances than the Danish results in Figure 35. Comparing the Danish and German results, they agree quite well for distances less than 100 km. For distances above 100 km, the Danish results show less cross-correlation than the German, but the cross-correlations are relatively low at those distances, especially for the shorter forecast horizons (6-12h). For longer forecast horizons (36-48h), the cross correlation decays slower with distance, especially for the German results. According to Focken et al. [272], the increased cross-correlation for increased forecast horizons might be due to the growing systematic errors for increasing forecast horizon which give rise to higher spatial correlations. For comparison the cross-correlation coefficients for the 36 h power prediction have been calculated in the same way and are shown in [272] as well. Lange and Focken have also analyzed normalized standard deviations of forecast errors. The standard deviations are normalized with the rated power of the corresponding wind power. If an ensemble consists of a number N of wind farms, then the relative standard deviation σensemble of the ensemble forecast error can be calculated according to
∑∑= =
=N
x
N
yyxxyr
N 1 12ensemble
1 σσσ (2)
where σx is the relative standard deviation of the forecast error of wind farm x power, and rxy is the cross correlation coefficient between forecast errors on wind farms x and y. Lange and Focken used the corresponding standard deviation of a single wind farm defined as the average standard deviation, i.e.
∑=
=N
xxN 1
single1 σσ
(3)
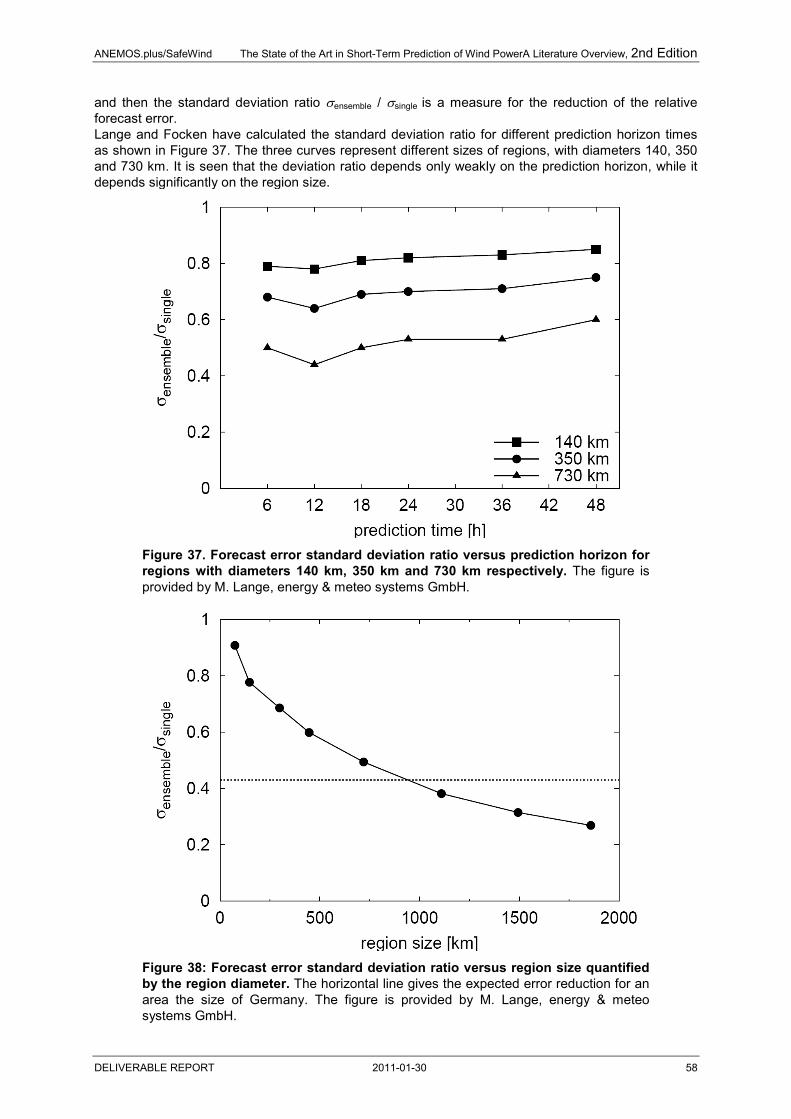
ANEMOS.plus/SafeWind The State of the Art in Short-Term Prediction of Wind PowerA Literature Overview, 2nd Edition
DELIVERABLE REPORT 2011-01-30 58
and then the standard deviation ratio σensemble / σsingle is a measure for the reduction of the relative forecast error. Lange and Focken have calculated the standard deviation ratio for different prediction horizon times as shown in Figure 37. The three curves represent different sizes of regions, with diameters 140, 350 and 730 km. It is seen that the deviation ratio depends only weakly on the prediction horizon, while it depends significantly on the region size.
Figure 37. Forecast error standard deviation ratio versus prediction horizon for regions with diameters 140 km, 350 km and 730 km respectively. The figure is provided by M. Lange, energy & meteo systems GmbH.
Figure 38: Forecast error standard deviation ratio versus region size quantified by the region diameter. The horizontal line gives the expected error reduction for an area the size of Germany. The figure is provided by M. Lange, energy & meteo systems GmbH.

ANEMOS.plus/SafeWind The State of the Art in Short-Term Prediction of Wind PowerA Literature Overview, 2nd Edition
DELIVERABLE REPORT 2011-01-30 59
Lange and Focken also analyzed the relation between forecast error standard deviation ratio and the region size as given in Figure 38. The result indicates that the standard deviation ratio decreases exponentially with the region size. For the forecast of 25 GW of offshore wind in the German Bight, Tambke et al. [273
37
] show for a weighted combination of ECMWF and DWD forecasts that the smoothing effect from the notional distribution of the wind power plants is 0.73, reducing the RMSE to 3 GW despite significantly higher production offshore. Together with the 25 GW installed onshore in Germany within a 800 km radius, this combination would reach a reduction to 0.45 of the error of a single wind farm, or 3.6 GW. Earlier [ ], they had shown that the forecast errors of the DWD model in the German Bight are comparable to those onshore. However, for the upscaling to hub height offshore, they found strong discrepancies between the usual wind speed profiles and the ones found at Horns Rev, so they developed a profile reaching into the Ekman layer, called Inertially Coupled Wind Profiles. Von Bremen et al. [274
Figure 39
] simulated the wind power forecast error with high resolution weather data (7km) for the North Sea and the Baltic Sea. The decrease of the forecast error cross-correlation is not radial to the reference site ( ) and diminishes faster over land and in longitudinal direction. This is due to the difference between offshore and onshore wind conditions and the prevailing westerly wind direction, respectively. It is very important to note that the forecast error between the two reference sites (FINO1 and Baltic1) is almost uncorrelated. Thus, for the safe integration of large shares of offshore wind power it is favourable to install equal shares of wind power capacity in remote offshore waters.
Figure 39: Wind power forecast error correlation (lead time 25-48h) for FINO1 (left) and the planned offshore wind Park Baltic1.
Rohrig [275] presents the German experience from the day-ahead forecast (24h to 48h ahead regarding the start of forecast model at the weather service): Single Wind Farm: 10 % to 20 % (RMSE % of nominal capacity) - Single Control Area: 7.5 % to 10 % - All Control Areas (whole Germany): 5% to 6.5%. Further reductions can be expected from combining different forecasting models: The first results from Germany show the best model performing at 5.1 % RMSE, a "simple" combination 4.2 % and "intelligent" combination 3.9 %.
Table 7: Level of accuracy of wind power predictions in Germany (NRMSE = normalized root mean square error, % of installed wind capacity). Source: Rohrig [275
NRMSE [%]
].
Germany (all 4 control zones) ~1000 km
1 control zone ~ 350 km
day-ahead 5.7 6.8 4h ahead 3.6 4.7 2h ahead 2.6 3.5
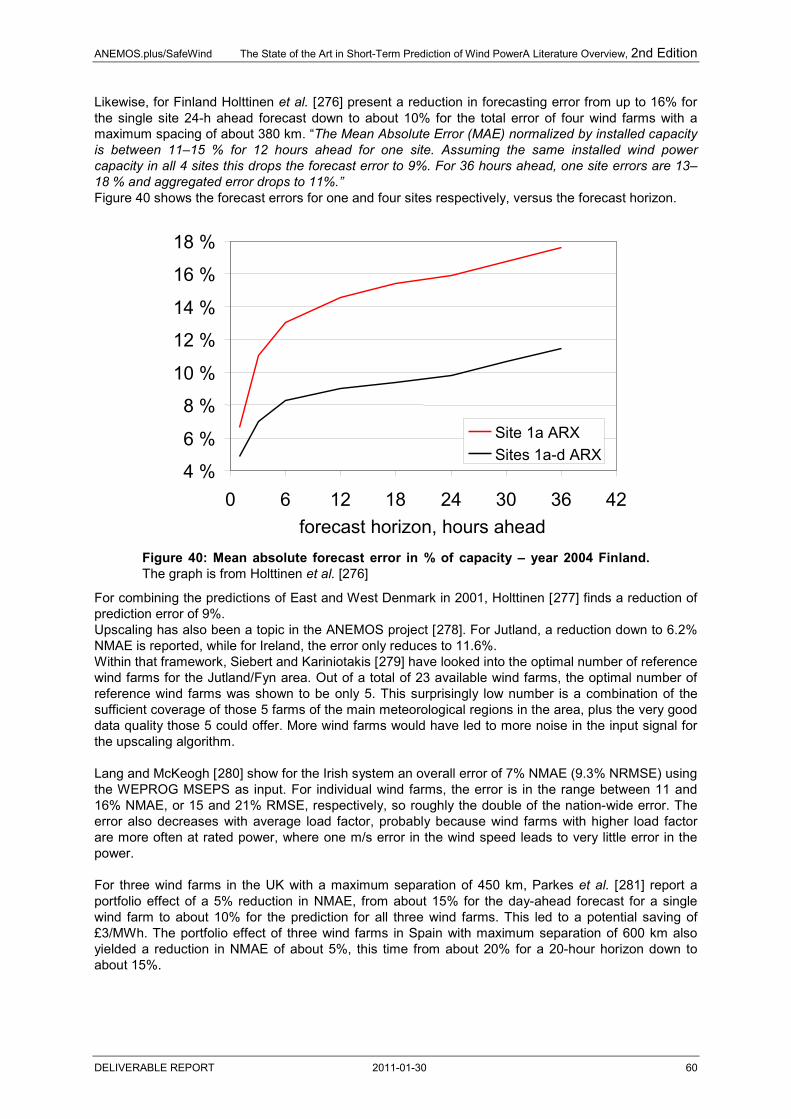
ANEMOS.plus/SafeWind The State of the Art in Short-Term Prediction of Wind PowerA Literature Overview, 2nd Edition
DELIVERABLE REPORT 2011-01-30 60
Likewise, for Finland Holttinen et al. [276
Figure 40
] present a reduction in forecasting error from up to 16% for the single site 24-h ahead forecast down to about 10% for the total error of four wind farms with a maximum spacing of about 380 km. “The Mean Absolute Error (MAE) normalized by installed capacity is between 11–15 % for 12 hours ahead for one site. Assuming the same installed wind power capacity in all 4 sites this drops the forecast error to 9%. For 36 hours ahead, one site errors are 13–18 % and aggregated error drops to 11%.”
shows the forecast errors for one and four sites respectively, versus the forecast horizon.
Figure 40: Mean absolute forecast error in % of capacity – year 2004 Finland. The graph is from Holttinen et al. [276]
For combining the predictions of East and West Denmark in 2001, Holttinen [277
Upscaling has also been a topic in the ANEMOS project [
] finds a reduction of prediction error of 9%.
278
Within that framework, Siebert and Kariniotakis [
]. For Jutland, a reduction down to 6.2% NMAE is reported, while for Ireland, the error only reduces to 11.6%.
279
] have looked into the optimal number of reference wind farms for the Jutland/Fyn area. Out of a total of 23 available wind farms, the optimal number of reference wind farms was shown to be only 5. This surprisingly low number is a combination of the sufficient coverage of those 5 farms of the main meteorological regions in the area, plus the very good data quality those 5 could offer. More wind farms would have led to more noise in the input signal for the upscaling algorithm.
Lang and McKeogh [280
] show for the Irish system an overall error of 7% NMAE (9.3% NRMSE) using the WEPROG MSEPS as input. For individual wind farms, the error is in the range between 11 and 16% NMAE, or 15 and 21% RMSE, respectively, so roughly the double of the nation-wide error. The error also decreases with average load factor, probably because wind farms with higher load factor are more often at rated power, where one m/s error in the wind speed leads to very little error in the power.
For three wind farms in the UK with a maximum separation of 450 km, Parkes et al. [281
] report a portfolio effect of a 5% reduction in NMAE, from about 15% for the day-ahead forecast for a single wind farm to about 10% for the prediction for all three wind farms. This led to a potential saving of £3/MWh. The portfolio effect of three wind farms in Spain with maximum separation of 600 km also yielded a reduction in NMAE of about 5%, this time from about 20% for a 20-hour horizon down to about 15%.
4 %
6 %
8 %
10 %
12 %
14 %
16 %
18 %
0 6 12 18 24 30 36 42forecast horizon, hours ahead
Site 1a ARXSites 1a-d ARX
4 %
6 %
8 %
10 %
12 %
14 %
16 %
18 %
0 6 12 18 24 30 36 42forecast horizon, hours ahead
Site 1a ARXSites 1a-d ARX

ANEMOS.plus/SafeWind The State of the Art in Short-Term Prediction of Wind PowerA Literature Overview, 2nd Edition
DELIVERABLE REPORT 2011-01-30 61
Figure 41: The MAE scaled with average generated power as a function of the load factor. Source: Lang and McKeogh [280].
Ishihara et al. [282
] show for the regional prediction of 9 wind farms in Northern Japan, that already three wind farms having about half the installed capacity are enough with even a quite simple upscaling approach.
Since Liu et al. [283
] in their resource and forecasting assessment of global solar and wind power resource voice the opinion that “[t]here is no forecasting for solar and wind energies”, they do an assessment themselves based on “the NCEP global forecasting data” (not more specified than that). Their plot for both daily and three-hourly forecasts averaged over the whole globe uses the peculiar RMS over Mean Value as y-axis, but also shows that the daily means are better forecasted than the three-hourly means, and that the error roughly doubles between the first 24 hours and 5 days ahead.
5.3 Ramp forecasting In the early days of wind power, installations in e.g. Denmark and Germany were small and well distributed. This led to a quite smooth wind power feed. In recent years though, especially in the new markets like Australia and the US or Canada, but also generally offshore, wind farms are installed in 100-150 MW or even larger blocks. This leads to a much larger possibility for quick variations, or ramps. Those make life difficult for the personnel in the control room, as the wind feed can suddenly decrease several GW, going far out of the bounds of the usual spinning reserve requirements. This was first taken into account as a forecasting requirement in the pilot project of the Alberta Electric System Operator (AESO) in 2006 [284]. The purpose of the AESO pilot project was to trial different methods and vendors of wind power forecasting to determine the best approach to forecasting wind power in Alberta in the future. Three vendors were chosen with global forecasting experience; AWS Truewind (New York), energy & meteo systems (Germany), and WEPROG (Denmark). Each vendor forecasted for 12 geographically dispersed wind power facilities for one year (May 07 to May 08) providing a number of forecast products covering the next 48 hours and an hourly refreshment rate. A final report written by ORTECH exists [285
].
Zack [286
41
] pointed out the importance of understanding of the physical processes leading to large ramps, with the example of a complex meteorological phenomenon at the San Gorgonio pass in California. He then proposed to use event based forecasting specifically for events important to the users. Those considerations eventually led to the development of the ELRAS, the ERCOT (Electricity Reliability Council Of Texas) Large Ramp Alert System [ ]. They use a 3DVAR data assimilation system of many freely available meteorological data in and around Texas as a starting point for the ELRAS-RUC (Rapid Update Cycle) model, which is a NWP model run every two hours. The results of this feed a set of early detection mechanisms, which finally are used in a regime switching statistical model. As a metric for the ramp forecast, they use the Critical Success Index CSI, defined as

ANEMOS.plus/SafeWind The State of the Art in Short-Term Prediction of Wind PowerA Literature Overview, 2nd Edition
DELIVERABLE REPORT 2011-01-30 62
Number_of_Hits / (Number_of_Hits + Number_of_False_Alarms + Number_of_Misses), and the Ranked Probability Skill Score RPSS. Cutler et al. [50] checked the performance of WPPT in Tasmania running with MesoLAPS of the Australian Bureau of Meteorology for the prediction of 41 ramp events over one year. “Sub-hourly ramp events also involve some shutdown cases, but also yaw-misalignment cases caused by a sudden jump in the wind direction, and variability cases during relatively benign conditions caused by nearby low pressure systems or pre- and post-frontal activity. Hence, the prediction of large ramps in wind power output involves the consideration of many different types of weather events.” The performance of the 12.5km resolution MesoLAPS (used directly or in WPPT) was actually worse than pure climatology, which probably is a feature of the RMSE punishing timing errors. Garrad Hassan [287
Figure 42] show a user-friendly way of showing up- and down-ramps with their timing
uncertainty and projected level, see . “For a collection of UK wind farms this distribution has a standard deviation of 4.0 hours for a forecast horizon of 24 hours, and 3.3 hours for a forecast horizon of 3 hours.” A combination of NWP forecasts quite expectedly brought the error down, but for the ramps forecasts, the “better NWP forecast has a ramp capture nearly 10% higher than the combination and the other NWP forecast”.
Figure 42: Visualisation of GL Garrad Hassan of ramp timing risk for up- and downramps. Source: [287]
A promising approach to ramps and variability forecasting is the use of state-transition or of regime-switching models. Reikard [288] models the temperature dependence of the wind speeds and then adds state transition models to achieve a performance of up to 10% better than persistence. Also other tested models (GARCH, EGARCH, neural nets and Kalman Filter) did not work better on the 8 time series of hourly wind speeds. He concludes “The finding of fractality in wind speed data makes prediction inherently difficult. While the fractal dimension is a measure of the probability of outliers, it has a more subtle implication. In stochastic time series, fractality is typically generated by multiplicative relationships among two or more stochastic processes. This in and of itself will give rise to large errors.” In a later paper [289], regime switching models achieved a similarly good performance to multivariate regressions using selected causal factors, or state transition models. However, when looking at the distribution of the forecasted wind speed, the regime switching models were closer to the measured values than the other possibilities (also Kalman filters or neural networks). He used two regimes, a high regime where persistence was used, and a low regime where regressions are used. “If the states could be predicted perfectly, the regime-switching model would improve forecast accuracy by an additional 2.5 to 3 percentage points.”

ANEMOS.plus/SafeWind The State of the Art in Short-Term Prediction of Wind PowerA Literature Overview, 2nd Edition
DELIVERABLE REPORT 2011-01-30 63
Bossavy, Girard and Kariniotakis [290
] investigated two approaches for ramp forecasting: Using the timing and intensity of the predicted ramps as additional variables, they produced much improved reliabilities for the forecasted quantiles, especially in the high range of the probabilistic scale. And mapping the number of ensemble members forecasting a specific ramp event to a probability of that ramp actually occurring, they could produce confidence intervals of ramps occurring.
Bonneville Power Administration [291] held a competition dedicated for ramp forecasting. The first results [292] indicated that for ramps, hourly predictions are not good enough, and shorter timings of the forecast lead to smaller deviations. However, as Focken [293
] points out, in the subsequent Request for Proposals for a short-term prediction system, ramps are not mentioned at all. Focken (having been part of the ramp forecasting competition with his company energy & meteo systems) attributes this to the fact that a ramp does not have an action in the control room associated with it – “the operators don’t know what to do with a ramp forecast”. Having said that, in the remainder of his talk he points out that the ramp forecast needs to be something separate from the usual RMS-optimised forecast, since this tends to be too smooth.
Xcel Energy currently have a project on ramp prediction together with NCAR and Vaisala. The Finnish measurement company thereby tries to get into the solutions market with the commercial offering of their RampCast product [294], based on a set of masts around an existing wind farm and aiming at 0-3 hours prediction horizon. From 3 to 60 hours or more, NCAR’s DICast [295] uses a Dynamic MOS (DMOS) to find the best inputs for the removal of bias between the nacelle wind speeds of every individual turbine and one of 30 different WRF and MM5 runs. The DMOS parameters are recalculated every week and are differentiated by model run time and lead time. Then, the individual forecasts are combined into a consensus forecast “analogous to the job done by a human who, once having removed biases from individual models’ forecasts, must combine them into a single final forecast.” The DMOS step outperforms the best predictor by about 5-10% of RMSE error, while the consensus step reduces the error further 10-15%. For the ramp forecast on the 0-3 hour horizon, Haupt et al. [296] use a Variational Doppler Radar Analysis System (VDRAS) for the nowcasting of the wind field. For the example of one ramp in Colorado, they show the advantage of using regional measured data for the very short term forecast. Onsemble seems to pursue the same niche as Vaisala for a hub height wind sensor network. They deploy them on cell phone towers, currently at ERCOT, BPA and PSCO [297
].
5.4 Variability forecasting While ramp forecasting and variability forecasting bear some resemblance, the two are actually quite different. Variability forecasting refers to large amplitude, periodic changes in wind speed, and it is only recently that it has come into the sight of researchers. Davy et al. [298
Vincent et al. [
] defined an index of variability based on the standard deviation of a band-limited signal in a moving window, and developed methods to statistically downscale reanalysis data to predict their index. Amongst the important predictors of variability, they found planetary boundary layer height, vertical velocity and U wind speed component during the months June-September (southern hemisphere winter), and U-wind speed, geopotential height and cloud water for the months December-February (southern hemisphere summer).
64,299
] defined a variability index as the sum of all amplitudes occurring within a given frequency range based on an adaptive spectrum. They studied the climatological patterns in variability on time scales of minutes to 10 hours at the Horns Rev wind farm, and showed that there were certain meteorological conditions in which the variability tended to be enhanced. For example, variability had a higher average amplitude in flow from sea than in flow from the land, often occurred in the presence of precipitation and was most pronounced during the autumn and winter seasons.
Von Bremen and Saleck [300
] proposed the totalfluc, the sum of the absolute values of gradients exceeding a certain threshold within a, say, 6h period, as a measure of variability. The variability of wind speed data from FINO 1, converted to power with the power curve of the nearby Alpha Ventus offshore wind farm, was highest around 10m/s wind speed. A clustering analysis of the principal components of the 500hPa geopotential height showed that the largest variations occurred for north-western flow.

ANEMOS.plus/SafeWind The State of the Art in Short-Term Prediction of Wind PowerA Literature Overview, 2nd Edition
DELIVERABLE REPORT 2011-01-30 64
6. Uncertainty of wind power predictions Spot predictions of the wind production for the next 48 hours at a single wind farm or at a regional/national level are a primary requirement for end-users. However, for an optimal management of the wind power production it is necessary to also provide end-users with appropriate tools for on-line assessment of the associated prediction risk. Confidence intervals are a response to that need since they provide an estimation of the error linked to power predictions. Essentially, two main methodologies for uncertainty forecasting have established themselves in the industry: statistical approaches working on single NWP forecasts, and uncertainties derived from ensembles of predictions. Please note that there is a companion to this report, detailing the State-of-the-Art in probabilistic forecasting, also published by the ANEMOS consortium [301
].
Pinson et al. [302] propose a framework for the evaluation of probabilistic forecasts of wind power. The “described evaluation framework is composed of measures and diagrams, with the aim of providing useful information on each of these properties, namely reliability, sharpness, resolution and skill.” They apply their framework to two different quantile forecasts for a Danish wind farm. Pinson, McSharry and Madsen [303
] provide an appropriate technique for assessing the reliability of probabilistic forecasts, which accounts for sampling effects and the existence of serial correlation. The efficacy of this technique is demonstrated with probabilistic wind power forecasts, showing how confidence intervals are important when undertaking a reliability assessment.
6.1 Statistical approaches While the estimation of confidence intervals for various types of mathematical models is an established field, only few papers specific to the short-term wind power prediction problem are published. While statistical models already have an estimate of the uncertainty explicitly integrated in the method, physical models need some additional processing to yield an uncertainty result as well. Typical confidence interval methods, developed for models like neural networks, are based on the assumption that the prediction errors follow a Gaussian distribution. This however is often not the case for wind power prediction where error distributions may exhibit some skewness, while the confidence intervals are not symmetric around the spot prediction due to the form of the wind farm power curve. On the other hand, the level of predicted wind speed introduces some nonlinearity to the estimation of the intervals; eg at the cut-out speed, the lower power interval may suddenly switch to zero. Pinson and Kariniotakis [304, 305
The limits introduced by the wind farm power curve (min, max power) are taken into account by the method proposed by Luig et al. [
] propose a methodology for the estimation of confidence intervals based on the resampling approach. This method is applicable to both physical and statistical wind power forecasting models. The authors also present an approach for assessing on-line the uncertainty of the predictions by appropriate prediction risk indices (“Meteo-Risk Index”) based on the weather stability. They use a measure of the distance (or the similarity) of subsequent predictions in a poor-mans ensemble. The approach was verified using HIRLAM forecasts and data from 5 wind farms in Ireland.
306] and Bofinger et al. [307
Lange and Waldl [
]. This method models errors using a ß-distribution, the parameters of which have to be estimated by a post-processing algorithm. This approach is applicable to models that use a well-defined wind park power curve.
309,308] classified wind speed errors as a function of look ahead time. The errors in wind speed of the older DWD Deutschlandmodell are fairly independent of the forecast wind speed, except for significantly lower errors for the 0 and 1 m/s bins [309
322
]. Another result was only for some wind farms did the error depend on the Grosswetterlage (a classification system with 29 classes for the synoptic situation in Europe), as classified by the DWD. Due to the non-linearity of the power curve, wind speed forecasting errors are amplified in the high-slope region between the cut-in wind speed of the turbine and the plateau at rated wind speed, where errors are dampened. Landberg et al. [ ] reported the same behaviour. Nielsen [310] also shows the WPPT error for western Denmark to have its peak at a forecast of half the installed capacity. This method is only applicable to models that provide intermediate forecasts of wind speed at the level of the wind park.

ANEMOS.plus/SafeWind The State of the Art in Short-Term Prediction of Wind PowerA Literature Overview, 2nd Edition
DELIVERABLE REPORT 2011-01-30 65
Bremnes [148] developed a probabilistic forecasting technique, estimating the different quantiles of the distribution directly. In [311
In [
], he describes his method of local quantile regression (LQR) in more detail, and shows that for a test case in Norway, Hirlam forecasts have a lower inter-quantile range than climatology, which means that the Hirlam forecasts actually exhibit skill. LQR Hirlam features about 10% better in economic terms than pure Hirlam forecasts, increasing the revenue from ca 75-79% of the ideal income (without any forecast errors) to ca 79-86%, depending on the horizon. However, his pure Hirlam forecasting did not have an upscaling or MOS step, so this might have worked in favour of LQR in the comparison. He proposed to use the method to reduce the large amount of information found in meteorological ensembles. The motivation for this was that he could show that the economically optimal quantile was not the central (“best”) quantile, but one given by the relative prices of up- and down-regulation.
312
], Bremnes compares three different statistical models for quantile forecasts: LQR, the Local Gaussian model (assuming that, around the forecasted values the distribution can be approximated with a Gaussian) and the Nadaraya-Watson Estimator. Applied to a wind farm in Norway with Hirlam10 forecasts, no clear preference of method is found, although the Local Gaussian model produces slightly more uncertain forecasts than the other two methods. So if ease of implementation is an issue, the Nadaraya-Watson Estimator might be the best.
Nielsen and Madsen [310] developed a stochastic model for Eltra, describing variance and correlation of the forecast errors of WPPT, version 2. Nielsen et al. [313, 314
] tried a method similar to the LQR technique for the case of the small Danish offshore wind farm Tunø Knob, using WPPT with various parameters as input, among them the Meteo-Risk Index. They concentrated on the 25% and 75% quantiles. Also here, the predictions proved “sharp” in comparison to historic data, meaning that the Inter-Quantile Range (IQR), given as the difference between the 75% and the 25% quantile, is much narrower than the historical average of the quantiles of the production distribution. There were deviations in quantiles between the training set and the test set. For the LQR approach, it did not seem important to include the MRI.
These are results for single wind farms. Since the correlation between forecast errors is rather weak with distance, the forecasts for a region are much more accurate than the forecast for single wind farms (as Focken points out [315 272, ]). This error reduction scales with the size of the region in question. This means that only a certain number of wind farms is needed to predict the power production in a region well enough. For regions, the error autocorrelation is also stronger on a time scale of days than for single wind farms. Dobschinski et al. [316
] evaluated and compared five different models (Multi-linear regression, Linear quantile regression, Artificial neural networks (ANN), Simple classification, Adaptive model) to estimate dynamic prediction intervals of existing wind power forecast systems. Their performance concerning reliability differs significantly but their sharpness is nearly equal. The results of all models have been combined in an ensemble model which results in a higher quality of forecast uncertainty estimation. Regarding the sharpness it leads to an improvement of about 11% compared to the single models. Concerning the total German wind power generation an improvement of about 25% is obtained when using the up-scaled ensemble average prediction intervals compared to the reference static approach. It was also shown, that the advantage to use the ensemble model instead of each of the single models increases for higher reliabilities and decreasing quality of the underlying power prediction system.
6.2 Ensemble forecasts The increase in available computer power led to some progressive thinking on how to make the best use of these resources. Instead of just increasing the resolution more and more, the processing cycles might be better used in reducing the other errors. This can be done using ensembles of forecasts, either as a multi-model ensemble, using many different NWP models of different parameterisations within the same model, or by varying the input data and calculating an ensemble based on different forecast initialisations. The use of this is to be able to quantify the uncertainty inherent in the forecasts. For example, if a slight variation in the initial state of the model (which still is consistent with the measured data) leads to a larger variation a few days ahead, where eg a low pressure system takes one of two distinct tracks, then the situation is different from one where all low pressure tracks more or

ANEMOS.plus/SafeWind The State of the Art in Short-Term Prediction of Wind PowerA Literature Overview, 2nd Edition
DELIVERABLE REPORT 2011-01-30 66
less run over the same area. A number of groups in the field are currently investigating the benefits of ensemble forecasts. Giebel et al. [317] and Waldl and Giebel [318,319
Boone and Giebel [
] investigated the relative merits of the Danish HIRLAM model, the Deutschlandmodell of the DWD and a combination of both for a wind farm in Germany. There, the RMSE of the Deutschlandmodell was slightly better than the one of the Danish model, while a simple arithmetic mean of both models yields an even lower RMSE.
320] extended this analysis to additional wind farms and used two different short-term prediction models for the analysis. The result is the same, that a combination of models is helpful. H.Aa. Nielsen et al. [321
] showed that the combination of models can always be better than the best of the two input models, and that in most cases even a simple average outperforms the best of the models. In their paper, they develop the theory of how to combine forecasts if bias and variance/covariance of the individual forecasts are known. They try their approach for two wind farms in Denmark (Klim) and Spain (Alaiz) with up to four individual forecasts per wind farm, all done by WPPT with different NWP input. This “resulted in improvements as high as 15%, with an overall level of 9%, for the wind farm near Klim in Denmark. For the wind farm near Alaiz, the corresponding numbers are 9 and 4%, respectively. However, for Alaiz if one meteorological forecast and three different combinations of MOS and power-curve are used, then no improvement is obtained.”
In the framework of the Danish PSO funded project Intelligent Prognosis, Nielsen et al. [123] showed generic figures for the potential improvement of an additional NWP forecast depending on the correlation between the forecasts and the relative performance. The figures were verified for the Klim wind farm in Denmark and Alaiz in Spain. It “is recommended that two or three good meteorological forecasts are used and the forecast errors of these should have low correlation (less that approximately 0.8). This seems to be the case for meteorological forecasts originating from different global models.” Landberg et al. [322
Pinson et al. [
] used a poor man’s ensemble to estimate the error of the forecast for one wind farm. A poor man’s ensemble is formed using the overlapping runs of the forecasting model from different starting times for a given point in time. In his case, HIRLAM comes every 6 hours with a model horizon of 48 hours, leading to an ensemble size of up to 8 members for the same time. The assumption is that when the forecasts change from one NWP run to the next, then the weather is hard to forecast and the error is large. However, no conclusive proof for this intuitive assumption could be found. Please also note that the term poor man’s ensemble in meteorological circles can also be used to denote a multi-model ensemble from various meteorological institutes. This probably reflects the fact that they do not have to pay the end user prices when exchanging data among themselves. Another expression occasionally used for this type of ensembles is lagged average ensembles or lagged initial conditions ensembles.
323
] extended the Prediction Risk Index concept to such a lagged average ensemble derived from ECMWF forecasts, and compared it to the Prediction Risk Index derived from the dedicated NCEP and ECMWF ensemble forecasts. For 10 months of data from the Danish Tunø Knob wind farm, “it appears that the ECMWF-based ensembles of wind generation have higher informative value owing to their higher discrimination ability.”
M. Lange et al. [61] used input from 16 different European met services for Previento in order to run a forecast combination. They tried to combine up to 5 different NWP forecasts, and showed that the combination is quite advantageous if the forecasts based on different NWPs first have been individually tuned. This way, a reduction of forecast errors from 5% to 4.2% RMSE for all of Germany was achieved. Similar results have been reported from the ISET by Cali et al. [324, 325
Cali et al. [
], where the best combination coming out of the 75 members of the MSEPS (mentioned below) is achieved after first tuning the ANNs individually for every member, and then training a second ANN to combine the optimised forecasts.
324] also showed that the combination of three NWP models for the whole of Germany reduces the RMSE from between 5.8 and 6.1% for the individual models to 4.6%. Using all 75 members of the MSEPS as input to the neural networks of WPMS, instead of just the ensemble mean or a single member, reduced the error considerably.

ANEMOS.plus/SafeWind The State of the Art in Short-Term Prediction of Wind PowerA Literature Overview, 2nd Edition
DELIVERABLE REPORT 2011-01-30 67
The optimal combination of forecasts is a field which has garnered attention quite recently. As Sánchez [326
] points out, “It is common in the wind energy industry to have access to more than one forecaster. It is well known that the relative performances of the alternative wind power forecasts can vary with the wind farm, and also with time. In these cases, an adaptive combination of forecasts can be useful to generate an efficient single forecast.” He therefore implemented for the Spanish TSO a two-step procedure involving the Adaptive Exponential Combination. “The AEC is designed to give all of the weight to the best available forecast.”
Möhrlen et al. [327
Their group was also coordinator of an EU-funded project called HONEYMOON - High resOlution Numerical wind EnergY Model for On- and Offshore forecastiNg using ensemble predictions”. One part of the project was to reduce the large-scale phase errors using ensemble prediction. A final public report is available [
] use a multi-scheme ensemble of different parameterisation schemes within HIRLAM. They make the point that, if the observational network has a spacing of 30-40 km, it might be a better use of resources not to run the NWP model in the highest possible resolution (in the study 1.4 km), but instead to use the computer resources for calculating a large amount of forecasts, and generate an ensemble. A doubling of resolution means a factor 8 in running time (since one has to double the number of points in both horizontal grid components and time). The same effort could therefore be used to generate 8 ensemble members. The effects of lower resolution would not be so bad, since effects well below the spacing of the observational grid are mainly invented by the model anyway, and could be taken care of by using direction dependent roughnesses instead.
211], but does not talk about results in any detail. WEPROG's Multi-Scheme Ensemble Prediction System MS-EPS (see weprog.com) has been operational since 2004. Based on WEPROGs own NWP formulation, the system is built up with three different dynamics schemes, five different condensation schemes and five different vertical diffusion schemes, which result in an ensemble of 75 members. The characteristic of the MSEPS system is that it has the capabilities to develop physical uncertainties with well-defined differences among the ensemble members. This is of advantage especially for wind energy predictions, because it means that the uncertainty is not dependent on the forecast horizon as in other ensemble approaches, but instead develops in every forecasts step as a result of the physically different formulations of the individual ensemble members (eg [328
] or http://www.weprog.com/publications).
In Denmark, the Zephyr collaboration had a PSO-funded three-year project [329,330] on the use of different kinds of ensembles for utility grade forecasting. Amongst others, the NCEP/NCAR and ECMWF ensembles were used, multi-model ensembles (with input from both DMI and DWD) were compared, and some methods for a good visual presentation of the uncertainty were researched. One main result [331] was the development of a technique to transform the quantiles of the meteorological distribution to the quantiles of the power forecast distribution. The resulting quantiles were sharp and skilful. The use of pure meteorological ensemble quantiles was shown to be insufficient, since the ensemble spread is not probabilistically correct. Even using the transformation it was not possible to get satisfactory outer quantiles (eg below 15% and above 90%), since the meteorological ensemble spread is not large enough. This is especially relevant for the first days of the ensemble runs. However, in practice this might be less of a problem, since the ensemble runs also needed 17 hours to complete, therefore making the first day impossible to use operatively. The model was used in a demo application run for two Danish test cases, the Nysted offshore wind farm and all of the former Eltra area (Denmark West). The results were quite satisfactory, have a horizon of one week, and were used for maintenance scheduling of conventional power plants, for the weekly coal purchase planning and for trading on the Leipzig electricity exchange, which is closed over the weekends. Besides a final project report [332], a number of more detailed reports on the model [333], the experiences with the demo application [334], the possibilities of nesting HIRLAM directly in the ECMWF ensemble members [335], and some special turbulent kinetic energy parameterisations within HIRLAM [336
] came out.
Roulston et al. [337, 338] evaluated the value of ECMWF forecasts for the power markets. Using a rather simple market model, they found that the best way to use the ensemble was what they called climatology conditioned on EPS (the ECMWF Ensemble Prediction System). The algorithm was to find

ANEMOS.plus/SafeWind The State of the Art in Short-Term Prediction of Wind PowerA Literature Overview, 2nd Edition
DELIVERABLE REPORT 2011-01-30 68
10 days in a reference set of historical forecasts for which the wind speed forecast at the site was closest to the current forecast. This set was then used to sample the probability distribution of the forecast. This was done for the 10th, 50th and 90th percentile of the ensemble forecasts. Taylor, McSharry and Buizza [339
] create a calibrated wind power density from the ECMWF EPS system. “The resultant point forecasts were comfortably superior to those generated by the time series models and those based on traditional high resolution wind speed point forecasts from an atmospheric model.”
Pinson and Madsen [340
] “describe, apply and discuss a complete ensemble-based probabilistic forecasting methodology” for the example case of Horns Rev as part of the Danish PSO research project “HREnsembleHR – High Resolution Ensemble for Horns Rev, funded by the Danish PSO Fund from 2006-2009 (see www.hrensemble.net). The forecasts from WEPROG's 75 member MSEPS ensemble are converted to power using the novel orthogonal fitting method. The single forecasts are then subjected to adaptive kernel dressing with Gaussian kernels, since “in theory, any probabilistic density may be approximated by a sum of Gaussian kernels”, meaning that the resulting probabilistic distribution can be “a non-symmetric distribution (and possibly multimodal), thus being consistent with the known characteristics of wind power forecast uncertainty”.
ANEMOS.plus/SafeWind The State of the Art in Short-Term Prediction of Wind PowerA Literature Overview, 2nd Edition
DELIVERABLE REPORT 2011-01-30 69
7. The value of forecasting Even though the necessity and advantages of wind power forecasting are generally accepted, there are not many analyses that have looked in detail into the benefits of forecasting for a utility. Partly this lack of analyses stems from the fact that a lot of data input and a proper time step model are needed to be able to draw valid conclusions. In recent years, a number of wind integration studies have undertaken the effort with data backing from typically the TSO. Milligan et al. [341
Hutting and Cleijne [
] used the Elfin model to assess the financial benefits of good forecasting, taking into account the load time series, a wind time series, the distribution of power plants for different utilities, and the forced outage probabilities of the normal plant mix. Even though his method of simulating the forecast error was not very close to reality, some general conclusions could be drawn. When varying the simulated forecast error for three different utilities, zero forecast error always came out advantageously. The relative merit of over- and underpredicting varied between the two utilities analysed in detail: while underpredicting was cheaper for one utility, the opposite held true for the other. The cost penalty in dependency of the forecast error was dependent very much on the structure of the plant mix and the power exchange contracts. Generally speaking, a utility with a relatively large percentage of slow-start units is expected to benefit more from accuracy gains.
342
Nielsen et al. [
] analysed the proposed structure of the Dutch electricity exchange, and found that 1500 MW of offshore wind power could achieve an average price of 3.5 €c/kWh, when coupled with back-up conventional plants. This assumes that "75% of the output can be predicted well enough for the market". Perfect prediction would raise the price to 4 €c/kWh. However, building 6000 MW of wind power would decrease the price to 2.9 €c/kWh. Reducing the specific power of the rotor from 500 to 300 W/m2 would decrease the overall power output, but increase the capacity factor, thereby increasing the predictability and therefore enhancing the value by an extra 0.05 €c/kWh. This would actually improve the price performance ratio by about 10%, just by installing larger blades on the turbines. Spreading out the wind farms along the coast would increase the reliability of the generation and therefore lead to another 0.15 €c/kWh.
343] assessed the value for Danish wind power on the NordPool electricity exchange to be 2.4 €c/kWh in a year with normal precipitation (the NordPool system is dominated by Norwegian and Swedish hydropower). This would be reduced by 0.13-0.27 €c/kWh due to insufficient predictions. The same result is expressed as the penalty due to bad prediction of wind power being 12% of the average price obtained on NordPool by Sørensen and Meibom [344Kariniotakis et al. [
]. 345] propose a methodology to assess the benefits from the use of advanced wind
power and load forecasting techniques for the scheduling of a medium or large size autonomous power system. The case study of the Greek island of Crete is examined. The impact of forecasting accuracy on the various power system management functions is analysed. According to the calculations by Nogaret et al. [346
Gilman et al. [
], the accuracy of the prognostic tools should be improved to more than 90% to reduce the costs for regulating power to an acceptable level.
347
Mylne [
] state that TrueWind’s forecasting saved Southern California Edison $ 2 million in imbalance cost for December 2000 alone, compared to a system based on pure climatology.
348
The potential value of forecasting to wind power generators in the UK was illustrated by Bathurst and Strbac [
] used a multi-element contingency table technique to estimate the value of persistence and NWP forecasting for a single 1.65 MW turbine under the UK NETA trading system at a look-ahead of between 7.5 and 13 hours. The value of the NWP forecast over persistence was found to range from a few pence to as much as £7 per hour. Assuming a 30 % capacity factor, this corresponds to a forecast value ranging from around 0.03 to 0.3 €c/kWh.
349] shortly after the introduction of the New Electricity Trading Arrangements (NETA) in March 2001. Under NETA, the imbalance charges (charges for over- or under-delivery) are determined by market conditions and can lead to severe penalties for generators who cannot make accurate production forecasts. Indeed, in the first week of NETA’s operation, imbalance charges were such that wind generation had net negative value: -0.41 p/ kWh (~ -0.6 €c/kWh) using a standard forecasting method. In a follow up paper, Bathurst et al. [350] present a method to determine the optimum level of contract energy to be sold on the market using Markov probabilities for a wind farm. The effect of market closure delays and forecasting window lengths is also shown.

ANEMOS.plus/SafeWind The State of the Art in Short-Term Prediction of Wind PowerA Literature Overview, 2nd Edition
DELIVERABLE REPORT 2011-01-30 70
Ensslin [351
Parkes et al. [
] talks about the value of a forecasting tool in the framework of an “Internet-based information system for integration of Renewable Energy Sources and Distributed Generation in Europe”.
281] did an analysis using the GH Forecaster service for the UK and Spain. While the two markets are different, both work under the assumption that it should pay to have better forecasts. In the UK, the best forecast was the centered one, meaning that the technically best forecast was also the economically best for the wind farm owner. A 50 MW wind farm with 30% capacity factor could gain £660.000 from forecasting. Due to the 5% lower MAE for a total portfolio of 3 wind farms, another £3/MWh could be gained. In Spain, the exercise yielded about 7 €/MWh for the single wind farm, and another 3 €/MWh for a portfolio. Using a better power model, their group estimated [119] for a 100MW wind farm in the UK an added income of 177.000 EUR per year for a 1.2% MAE improvement. The importance and impact of good forecasts was also stated by Operations Manager Carl Hilger from Eltra (the antecessor of Energinet.dk [352]: “If only we improved the quality of wind forecasts with one percentage point, we would have a profit of two million Danish crowns.” Similar orders of magnitude are quoted infrequently by other utilities or traders, but usually not for publication. For the Xcel Energy forecasting project, arguably the largest and most ambitious privately funded forecasting project to date, Parks [353] reported savings of 6 million US$ for one year alone for three different regions. This significantly exceeds their investment (which is not a public figure [354
]).
The ILEX study [355
Barthelmie et al. [
] is a report that quantifies the additional system costs that are likely to be incurred if the volume of renewable energy in Great Britain were to increase from an assumed level of 10% of demand to 30% by 2020.
356
] investigated the economic benefit of forecasts in the UK. “Using an example with a mean hub height wind speed of close to 8 ms-1 and prices from 2003 we indicate that the maximum benefit using forecasting is approximately £4.50/MWh”, measured as increase in value of the produced and traded MWh of wind energy.
Sustainable Energy Ireland [357
In the Irish All Island Grid Study, Meibom et al. [
] studied the potential impact on costs and emissions increased wind generation can have on operating reserve in Ireland.
358
] showed that improved forecasting in the Irish system would be “relatively small in comparison to the total system operation costs of the All Island power system”, but the “absolute sum of the cost reductions is not negligible”. The cost reductions due to perfect forecasting under the different scenarios assumed varied from 0.05% to 3.6% of overall system cost, with higher benefits for higher installations of wind power.
Usaola et al. [359
] performed simulations of the production of different wind farms according to the Spanish market rules. They concluded that without using a model for wind power prediction, the income reduction due to deviations from schedule is 10%, 9,5% with a persistence model and 7.5% with a short-term prediction tool of average accuracy.
In a widely quoted paper, Pinson, Chevallier and Kariniotakis [360
] “formulate a general methodology for deriving optimal bidding strategies based on probabilistic forecasts of wind generation”. By taking into account the uncertainty structure of the forecast, the bidding strategy based on probabilistic choice can lead to a reduction of more than half the regulation cost for the wind power producer, in their example of a multi-MW wind farm participating in the Dutch electricity market in 2002.
Morales, Conejo and Pérez-Ruiz [361
] developed a methodology to “entitle a high decrease in the risk of profit variability for a comparatively low reduction in expected profit.” They stress the importance of good quality scenario sets representing the stochastic process. Additionally, if adjustment markets with shorter gate times are available, the “certainty gain” from the reduced error of the shorter prediction horizons needed allows for higher income and at the same time reduced risk.
Brand and Kok [362
] showed for the Dutch market that the use of ECN’s forecasting tool Aanbodvoorspeller Duurzame Energie reduces the imbalance in the market, but does not remove it.

ANEMOS.plus/SafeWind The State of the Art in Short-Term Prediction of Wind PowerA Literature Overview, 2nd Edition
DELIVERABLE REPORT 2011-01-30 71
Recently, a number of reports have shown that in markets with significant wind power penetration, the market price of bulk electricity depends inversely on the wind speed (see eg Hochmuth [363] for the Amsterdam Power Exchange, Moesgaard for the Danish part of Nord Pool [364], Sensfuß and Ragnitz [365] for the European Energy Exchange in Leipzig, and AEE [366, 367] for Spain). Jónsson [368] and Jónsson, Pinson and Madsen [369
] could show that the price variation on the Nord Pool day-ahead market is actually better explained by the forecast wind power than by the actually realised wind power, which is logical if one considers how the market price is set – namely on the basis of the wind (and other) power and load forecasts the day before.
Figure 43: Average spot price, categorised by intervals of forecasted wind power penetration, in DK-1 in the period January 4th 2006–October 31st 2007. Source: Jónsson, Pinson and Madsen [369]
Hasche et al. [370
Also Dobschinski et al. [
] used the WILMAR model to assess the value of improved forecasts in operations in Germany. One interesting conclusion was that “Operational costs due to forecast errors could be reduced by one third if an overall stochastic optimization were used in scheduling.”
371
] find that the balancing cost, especially for minute reserve, could be much lower if the TSOs would use the probabilistic distributions offered by modern forecasting models for the day-ahead prediction. However, this is mitigated by the fact that, as they show, a proper use of forecasts for the next few hours is even better.
For the use in full grid model simulations, realistic wind power forecasts need to be simulated. This field has not received much attention, but for the EU WILMAR project, simulations were achieved in the framework of a masters thesis (Boone [270]). His work is based on the original development by Söder [140,372
The OPTIMATE project (see
], who used a modified autoregressive process, ARWIN-1, to forecast piece-wise linear wind speeds. In addition, taking the correlation between sites into account, the smoother regional forecast is simulated with a modified multivariate autoregressive process, MARWIN-1. No NWP results were input to the analysis, therefore the usefulness of the approach would nowadays be limited to the first hours.
optimate-platform.eu) aims at building an online modelling platform for the simulation of various market designs under given load and wind power forecast accuracies. For the wind power forecast simulations, they use a somewhat simplified WILMAR approach [373
].
Pinson et al. [374] created probabilistically correct scenarios of wind power forecasts from the quantiles forecasts for a single wind farm, which also kept the interdependence structure of the forecast errors intact. Those can be used “for a large class of time-dependent and multistage decision-making problems, e.g. optimal operation of combined wind-storage systems or multiple-market trading with different gate closures”.

ANEMOS.plus/SafeWind The State of the Art in Short-Term Prediction of Wind PowerA Literature Overview, 2nd Edition
DELIVERABLE REPORT 2011-01-30 72
Gibescu, Brand and Kling [375
] assessed the variability and predictability of wind power in the Netherlands for a system integration study. In order to be able to scale up the penetration of wind power, they developed a “statistical interpolation method to generate time series of system- and participant-aggregated wind power production and forecast values [...]. The method takes into account the spatial and temporal correlations among multiple sites, as derived from the measurement and forecast data.” For the reduction of forecast error with size of the area, they report that “[t]he percent RMSE value of 14.2% for the system level is smaller compared with the 17–19% for the single wind farm level, and the percent MAE (9.8%) is also smaller [...]”.They also developed a theoretical model for the regional variance of wind speeds (not forecasting errors), depending on the number of wind farms, a characteristic distance or decay parameter (for their dataset, 610 km) and the average distance between the wind farms, for which they also develop a model.
Holttinen [376 277, ] presented a different perspective to short-term forecasting. Since all current models have the error rising with the forecasting horizon, she looks at the benefits of adjusting the market rules to be more wind power friendly. In particular, the current NordPool agreement does trade on 1200 hours for the next full day ahead. This means that the most important forecasting has to be done for the 13-37 h prediction horizon at 1100 hours. The penalty for wrong predictions are fairly steep in this set-up, since either the producer has to sell the electricity on the spot market (if there is demand at all), or has to pay an up-regulation fee to the market. This could be avoided with more flexible market mechanisms, eg looking only 6 hours or even only 1 hour ahead. Using the current forecasting tools for Denmark (WPPT), she calculates a 15% higher value of wind power for a 6-12-h market, and a 30% higher income for a 1-h market, compared to the current 13-37-h market. She also makes the point that wind power could yield higher income in Denmark, if there would be a cable connecting the western part with the east. In this set-up, the wind power forecasting errors would be reduced by 9 % due to the larger catchment area. Cali, Speckmann and Yves-Drenan [377
] agree: “The energy economic investigations point a monetary advantage on use of the Intra Day market to the balancing of the wind power forecasting error”.
While not directly connected to wind power forecasts, Klein and Pielke [378, 379
] looked at lawsuits brought against weather forecaster in the US. Generally speaking, the results are only valid for the US. The public forecasters there are usually immune under the law, which especially applies to exercise of a discretionary duty. This is strictly true for the federal government, while state legislation usually provides similar arrangements. However, “the government’s failure to follow a mandatory statute, regulation, or policy could expose it to liability”. The situation is different for private forecasters. Only two cases were filed for weather related forecasts so far, both of which were ruled in favour of the defendant. In the case Brandt vs. The Weather Channel, the judges (amongst other things) argued that “because prediction of weather is precisely that — a prediction — a weather forecaster should not be subject to liability for an erroneous forecast. Predicting possible future events whose outcome is uncertain is not an exact science for which a broadcaster should be held liable.” From other fields (think securities), more court cases are available. In these cases, the main allegation was fraud, which is reasonable enough (and thrown out of court relatively easily if it is a false allegation). The authors conclude with three pieces of advice to limit the exposure of professional forecasters to lawsuits: “The best defense against liability is, first, for a company and its employees to make their forecasts in good faith using reasonable care. Second, companies should engage in a rigorous evaluation of their forecasts products. This would provide evidence of the skill of their forecast products generally, which may be useful should a liability issue arise, but could also help to scale their customers’ expectations about the accuracies and uncertainties of the products and services that they are purchasing. Third, the company’s services agreement should clearly warn customers that forecasting is not a precise science. While these measures will help to avoid lawsuits in the first place, lawsuits may still be filed. Consequently, liability insurance makes sense.”

ANEMOS.plus/SafeWind The State of the Art in Short-Term Prediction of Wind PowerA Literature Overview, 2nd Edition
DELIVERABLE REPORT 2011-01-30 73
8. User demands on forecasting models Schwartz and Brower [380
EdF has written a paper for the DISPOWER project, detailing the needs on a forecasting model. Since EdF is a company wearing different hats (it is a TSO, a power producer and trades on the European markets), it has slightly different requirements for these different tasks. For the daily planning procedures, they want forecasts before 0600 hours for the same day and the next, until 2400 hours. This means a 48-hour forecast for the whole of France, every 30 minutes. Uncertainties should be shown as a band around the most probable value. Since they are the TSO, with a power purchase obligation, they have performance figures for all wind turbines in France (but seemingly not online). Additionally, they would like to receive a warning when a storm comes and triggers the shut down of wind farms.
] interviewed schedulers, research planners, dispatcher and energy planners at seven US utilities and asked for their needs in a wind energy forecast. Among the most needed was a day-ahead forecast, to be given in the morning for the unit commitment schedule and energy trading for the following day. Hourly forecasts, expressed in likely MW and with error bars, were another wish. However, one important result was that if good tools were available, operators in utilities with enough penetration would use these tools. This is also our experience with operators from Danish utilities.
For the weekly planning, they would like to see the same type of forecasts on a 5-10 day horizon. For trading, the requirements are actually rather similar than for the daily planning. Additionally, they would like to see more statistical measures of the expected performance (eg different quantiles), and get the forecast for most other nations in Europe, too. The Irish TSO gave the following list of demands [202]:
• “Forecasts should be available for individual wind farms and groups of wind farms. • Forecasts should be wind power output, in MW, rather than wind speed, • hourly forecasts extending out to a forecast horizon of at least 48 hours, • an accurate forecast with an associated confidence level (dispatchers would tend to be more
conservative when dealing with larger forecast uncertainties), • a reliable forecast of likely changes in wind power production and • a better understanding of the meteorological conditions which would lead to the forecasts
being poor. • Use of historical data to improve accuracy of forecast over time - the method for doing this
needs to be built into the program.” In Norway [147], a questionnaire sent to Norwegian wind energy producers and visits to a few of the larger energy companies revealed the following five points:
• “The forecasts should be available early in the morning (before 08:00) in order to give time for consideration of the forecast before trading at noon.
• Wind power production should be predicted hourly, uncertainty intervals should also be given. • Forecasts up to +36 h length are desirable. • Updated forecasts in the afternoon based on production data. • Forecasts several days ahead are useful for planning of maintenance.”
Coppin and Katzfey [381
] wrote a fine piece on the applicability of the state-of-the-art for the then Australian market operator and system operator, the National Electricity Market Management Company NEMMCO (now the Australian Energy Market Operator, AEMO), covering all issues from wind to power. He applied the current knowledge (based in part on an earlier version of this report) to the forecasting time frames given by NEMMCO: from Long-Term (defined as a yearly outlook, to be tackled with climatology) over Medium-Term (week to month ahead – not really better than the Long-Term forecast) to Short-Term (up to 7 days, done employing NWP models), Very Short-Term for pre-dispatch (up to 40 hours ahead with 30-min accuracy, once a day at 12.30) and Near Real-Time (5-min regional demand for the next 5-min period). For the two shortest time periods, he recommends that this should be the responsibility of NEMMCO, while the longer time scales should fall into the responsibility of the wind farm operators, with the cut-off being where NWP models have to be employed (3-6 hours ahead).
The ISO New England Wind Integration Study [382] recommends the following for choice of a short-term prediction provider: it should be a centralised system including dedicated probabilistic ramp and severe weather forecasts. The provider should undergo a trial period, and should be doubled up with a

ANEMOS.plus/SafeWind The State of the Art in Short-Term Prediction of Wind PowerA Literature Overview, 2nd Edition
DELIVERABLE REPORT 2011-01-30 74
second forecast provider, both with competencies in offshore forecasting. The forecasting system should be fully integrated in the control room, where all users should undergo “an aggressive training program”. During the ANEMOS, ANEMOS.plus and SafeWind projects, the end user requirements for forecasts were investigated and reported. Many of those requirements had to do with uptime of the installation, user and data security, and presentation. In order to integrate wind power forecasts seamlessly in utilities’ SCADA systems, Giebel and Gehrke [383
] proposed an extension to the widely used IEC61850 and IEC61400-25 family of data transfer protocols for sub-stations and other grid connected equipment to also include forecast data.
Bessa et al. [384
Moreover, an information theoretic learning training criterion called parametric correntropy is introduced as a means to correct problems detected in other criteria and achieve more satisfactory compromises among conflicting criteria, namely forecasting economic value and quality (magnitude of forecast error). The authors shown for three real wind farms participating in the Iberian electricity market that the objectives of the wind power generators may lead to a preference for biased forecasts, which may be in conflict with the larger needs of secure operating policies. The parametric correntropy approach achieves acceptable “compromise” solutions to market participants and system operators.
] give a new view of the relative importance of the forecast error in a multicriteria and multi-perspective paradigm (i.e. forecast consumer paradigm), in which biased point forecasts could be produced to increase the market income, and to stress the conflicting objectives that may exist between different users (or stakeholders). Different user groups may have conflicting interests in an electricity market environment, and therefore, the choice of a forecasting model is not neutral. For instance, system operators are interested in minimizing operational costs while maintaining a high level of reliability. In contrast, wind generation companies are mainly interested in maximizing their income levels in the electricity market. Hence, in some conditions, the definition of a “good” forecast varies with different forecast users.
For users of short-term predictions, there is a series of workshops, probably the closest thing to an actual forecast user group there is, run by Giebel (see powwow.risoe.dk/BestPracticeWorkshop.htm). The series had so far (2010) four instalments, the next one is going to be 2011 in Aarhus, Denmark. The slides of the participant talks are available from the website. Most notably, it is interesting to see the different challenges that the different utilities or TSOs have, and how they use the wind power forecasts to address those challenges. During the POW’WOW project, a report was written on the first two workshops [19]. “Some major results of the workshops were: - Competition improves accuracy. - The value of accurate wind power predictions is appreciated. - The market for wind power prediction models is mature, with many service providers. The Best Practice in the use of short-term forecasting of wind power can be summarised as: • Get a model • Get another model (NWP and / or short-term forecasting model) • Get a good nationwide model instead of many simple and cheap models • Balance all errors together, not just wind • Use the uncertainty / pdf • Use intraday trading • Use longer forecasts for maintenance planning • Meteorological training for the operators • Meteorological hotline for special cases Additionally, if you are setting up a system for dealing with wind power in your country,” there are essentially two ways to deal with forecasting: it can be a demand on every wind power producer, as for example in Spain or the UK, or it can be done with a centralised system as in Germany or Denmark. Since ”the system operator needs to have a good quality forecasting tool anyway, so all the other producers of wind power might as well forego the need to get forecasts themselves.”

ANEMOS.plus/SafeWind The State of the Art in Short-Term Prediction of Wind PowerA Literature Overview, 2nd Edition
DELIVERABLE REPORT 2011-01-30 75
9. The ANEMOS projects The ANEMOS project (“Development of a Next Generation Wind Resource Forecasting System for the Large-Scale Integration of Onshore and Offshore Wind Farms”) was a 4 years R&D project that started in October 2002. It was funded by the European Commission under the 5th Framework Programme (ENK5-CT-2002-00665). A number of 22 partners participated from 7 countries including research institutes, universities, industrial companies, utilities, TSOs, and agencies. A coordination action was the next step for the core partners, together with experts on waves and wakes. Also, in this action, the ISET was a partner, which it was not for the ANEMOS projects. This coordination action was called POW’WOW (Prediction of Waves, Wakes and Offshore Wind, see powwow.risoe.dk). It ran from 2006 to 2009, funded also by the European Commission (Contract No 019898(SES6)). As the major follow-up, two projects are running now (and fund the writing of the second edition of this report): ANEMOS.plus and SafeWind. The former is sponsored by DG TREN (TRansport and ENergy) and has a stronger demonstration aspect, focussing on the maximum benefit for the end users through tools to schedule power plants and storage, to better trade on the markets and to integrate wind on shorter times. For example, Matos and Bessa [385
] presented a probabilistic model that uses as input a probabilistic wind power forecast (non-parametric represented by quantiles) and describe the risk of each reserve level by a set of risk/reserve and risk/cost of reserve curves. After interaction with the decision-maker (system operator), the tool outputs the reserve levels to be set for the next day (or current day) that either: 1) enforce a maximum acceptable risk level; or 2) respect a trade-off limit between risk and reserve cost. This approach is being demonstrated at the Portuguese system operator (REN) control centre in the framework of the ANEMOS.plus project.
Figure 44: The consortium of the ANEMOS.plus project.
More research is done in the latter, SafeWind (Grant Agreement no 213740, funded by DG Research). Here, the main emphasis is on extreme events, be it meteorologically, electrical system wise or

ANEMOS.plus/SafeWind The State of the Art in Short-Term Prediction of Wind PowerA Literature Overview, 2nd Edition
DELIVERABLE REPORT 2011-01-30 76
financially extreme. Pinson and the SafeWind team [386
As major new partner there is the ECMWF, to improve the use of ensemble products for wind power.
] have compiled a catalogue of extreme events, which resulted of a poll amongst project participants. Most importantly, an extreme event was very user dependent. A meteorologist would answer “a significant deviation from climatology”, an actor on the energy system would answer that it needs to have sizeable consequences either financially or for the system safety, and an operator of wind farms is interested in small scale events which could be dangerous for the turbines.

ANEMOS.plus/SafeWind The State of the Art in Short-Term Prediction of Wind PowerA Literature Overview, 2nd Edition
DELIVERABLE REPORT 2011-01-30 77
10. Concluding remarks Short-term forecasting has come a long way since the first attempts at it. Often, running the grid would not be possible without it, in situations with more than 100% instantaneous power from wind in the grid. The current crop of models, typically combining physical and statistical reasoning, is fairly good, although the accuracy is limited by the employed NWP model. Short-term prediction consists of many steps. For a forecasting horizon of more than 6 hours ahead, it starts with a NWP model. Further steps are the downscaling of the NWP model results to the site, the conversion of the local wind speed to power, and the upscaling from the single wind farms power to a whole region. On all these fronts, improvements have been made since the first models. Typical numbers in accuracy are an RMSE of about 10-15% of the installed wind power capacity for a 36 hour horizon. The main error in a short-term forecasting model stems from the NWP model. One current strategy to overcome this error source, and to give an estimate of the uncertainty of one particular forecast, is to use ensembles of models, either by using multiple NWP models or by using different initial conditions within those. For the previous version of this report in 2003, I wrote: “Noteworthy is the current explosion in working models”, to then spell out most of the major models in existence. Now I believe this is typical for an established field of science, where progress is made continuously on the existing parts, while occasionally, a new sub-field is opened (like recently, ramp and variability forecasting). Also, the appearance (and occasionally quick disappearance) of groups with good or sometimes, mediocre papers seems typical of an established arm of science. Wind power forecasting research requires mainly a computer, and access to measured and meteorological data, all of which are generally available or can be made available even in small and not so well-equipped research institutes. Equally relevant was this prediction “Additionally, some of the traditional power companies have shown interest in the field, like Siemens, ABB or Alstom. This could start the trend to treating short-term prediction models as a commodity to be integrated in energy management systems or wind farm control and SCADA systems.” Vestas for instance is building up so much expertise in weather forecasting that they just released a weather forecasting app for the iPhone based on their in-house NWP models. Information and communication technology is expected to play a major role in integrating wind power prediction tools in the market infrastructure. Another aspect of the “commodisation” of short-term prediction is the integration of or into decision making tools for the end users, like the scheduling optimisation module or the trading module developed and integrated by ANEMOS.plus. Wind power prediction software is not “plug-and-play” since it is always site-dependent. In order to run with acceptable accuracy when installed to a new site, it is always necessary to devote considerable effort for tuning the models (in an off-line mode) based on the characteristics of the local wind profile the local environment of the wind farms. It is here where the experience of the installing institute makes the largest difference. Due to the differences in the existing applications (flat, complex terrain, offshore) it is difficult to compare prediction systems based on available results. An evaluation of prediction systems needs however to take into account their robustness under operational conditions and other factors. Despite the appearance of multiple similar approaches today, further research is developed in several areas to further improve the accuracy of the models but also to assess the uncertainty of the predictions. Combination models have received due attention recently. So have ramp and variability forecasts. Optimal use of the forecasts by the end users remains a topic. The feedback from existing on-line applications continues to lead to further improvements of the state-of-the-art prediction systems. The aim of the present report is to contribute to the current research on wind power forecasting though a thorough review of the work developed in the area in the last decades. Wind power forecasting is a multidisciplinary area requiring skills from meteorology, applied mathematics, artificial intelligence, energy, software engineering, information technology and others. It appears as a fairly mature and

ANEMOS.plus/SafeWind The State of the Art in Short-Term Prediction of Wind PowerA Literature Overview, 2nd Edition
DELIVERABLE REPORT 2011-01-30 78
nearly off-the-shelf technology today, thanks not the least to some European Union Institutes and companies nurturing the field for more than a decade. This has been the result of an early recognition by the EU, as well as the pioneer countries in wind energy, of the necessity to anticipate efficient solutions for an economic and secure large-scale integration of wind power. The expectations from short-term wind power forecasting today are high since it is recognised as the means to allow wind power to compete on equal footing with the more traditional energy sources in a competitive electricity marketplace.

ANEMOS.plus/SafeWind The State of the Art in Short-Term Prediction of Wind PowerA Literature Overview, 2nd Edition
DELIVERABLE REPORT 2011-01-30 79
11. Acknowledgements Many people in the ANEMOS consortium for comments. Cyril Nedaud for hard surfing. Nuno Pais for finding the complete list of forecasting papers from selected journals. Ben Lumby for typo finding. This report was made possible through financial support from the European Commission, especially GG’s Marie-Curie Fellowship JOR3-CT97-5004 and the ANEMOS project ENK5-CT-2002-00665. Version 2 of the report received funding from ANEMOS.plus, EU FP6 contract number 038692, and SafeWind, EU FP7 grant number 213740. The models developed here were made possible through financial support from national and European grants. The report has gotten input from some colleagues outside the ANEMOS consortium – especially Corinna Möhrlen of WEPROG has contributed with text, and Bernhard Lange of IWES is acknowledged for finding glaring holes in the narrative. Within ANEMOS, Pierre Pinson of DTU.IMM (currently ECMWF) is acknowledged for additional input and links to papers I had overlooked, as is Ricardo Bessa. I’m especially grateful to Claire Vincent of Risø for the most thorough review this report has gotten in the last 7 years. In general, this report is fairly personal – any omissions do not reflect bias towards or against certain groups, but are usually due to me not being totally up to date. Having said that, I’m mostly referring to the literature, not the market place when writing this report, so commercial offerings which have not talked about it in scientific circles probably will not appear here.

ANEMOS.plus/SafeWind The State of the Art in Short-Term Prediction of Wind PowerA Literature Overview, 2nd Edition
DELIVERABLE REPORT 2011-01-30 80
12. Glossary a.g.l. Above ground level
AESO: Alberta Electrical System Operator
ANN: Artificial Neural Network
ARMA: Autoregressive Moving Average (a class of statistical models)
ARIMA: Autoregressive Integrated Moving Average
ARMINES: Joint Research Unit with Ecole des Mines de Paris.
AWEA: American Wind Energy Association
AWPT: Advanced Wind Power Prediction Tool, of Armines
BPA: Bonneville Power Administration
CLRC: Council for the Central Laboratory of the Research Councils, UK
DMI: Danish Meteorological Institute
DMS: Distribution Management System.
DTU: Technical University of Denmark
DWD: Deutscher Wetterdienst (German Weather Service)
ECMWF: European Centre for Medium Range Weather Forecasts, Reading, UK
ECN: Energy research Centre of the Netherlands
EdF: Electricité de France, the French large electrical utility
EGARCH: Exponential GARCH
EGU: European Geophysical Union
EMS: Energy Management System
EnBW: Energieversorgung Baden-Württemberg, the TSO in the south-west of Germany
EPS: (The ECMWF) Ensemble Prediction System
ERCOT: Electricity Reliability Council Of Texas
ESP: Energy Service Provider
ETA: One of NCEP’s mesoscale models
EWEA: European Wind Energy Association
EWEC: European Wind Energy Conference (since 2011 EWEA Annual Event)
FINO: Forschungsplattformen in Nord- und Ostsee, currently three offshore measurement masts in the North Sea (1 and 3) and the Baltic Sea (FINO 2)
GARCH: Generalized AutoRegressive Conditional Heteroscedasticity, a tool to characterize and model time series
GFS: Global Forecasting System, a NWP provided globally for free by NOAA
HIRLAM: High Resolution Limited Area Model, a NWP model developed by the met. Institutes of Denmark, France, Norway, Finland, Spain, and Ireland
Horizon: The look-ahead time, sometimes used for the maximum a NWP can deliver
ILEX: ILEX Energy Consulting is now a branch of Pöyry Energy Consulting
IMM: Informatics and Mathematical Modelling at DTU, Lyngby, Denmark
IPP: Independent Power Producer

ANEMOS.plus/SafeWind The State of the Art in Short-Term Prediction of Wind PowerA Literature Overview, 2nd Edition
DELIVERABLE REPORT 2011-01-30 81
ISET: Institut für Solare Energieversorgungstechnik e.V. – core part of what is now the Fraunhofer IWES.
ISO: Independent System Operator (like a TSO, but does not own the transmission system)
IWES: Fraunhofer-Institut für Windenergie & Energiesystemtechnik
LM: Lokalmodell (a NWP model of the DWD)
LQR: Local Quantile Regression
MAE: Mean Absolute Error
MM5: Mesoscale Model 5, a formerly popular mesoscale code developed at Pennsylvania State University and NCAR (successor is WRF)
MOS: Model Output Statistics, a means to remove residual error
MRI: Meteo Risk Index, developed by Armines
MSEPS: Multi-Scheme Ensemble Prediction System (75 members, by WEPROG)
NCEP/NCAR: National Center for Environmental Protection / National Center for Atmospheric Research, Golden, Colorado, US
NETA: New Energy Trading Arrangements, legislation in the UK
NWP: Numerical Weather Prediction, usually run by meteorological institutes
NOAA: National Oceanic and Atmospheric Administration, US
PBL: Planetary Boundary Layer, the lowest part of the atmosphere
Persistence: Simple prediction method assuming that the wind production in the future will be the same as now.
Prediktor: Short-term prediction system developed by Risø National Laboratory, Denmark
Previento: Short-term prediction system developed by University of Oldenburg, Germany, now commercialised by energy & meteo systems GmbH
PSO: Power System Operator. In Denmark PSO stands for Public Service Obligation, a statute under which some money is collected from the electricity bills and used towards strengthening the network (including research)
RAL: Rutherford Appleton Laboratory, Didcot, UK. Part of CLRC.
RLS: Recursive Least Squares
RMSE: Root Mean Square Error
SCADA: Supervisory Control and Data Acquisition
SERG: Sustainable Energy Research Group of UCC
Sipreólico: Short-term prediction system developed by University Carlos III, Madrid, Spain
TSO: Transmission System Operator
UCC: University College Cork
WILMAR: Wind Power Integration in Liberalised Electricity Markets, an EU financed project led by Risø National Laboratory (now Risø DTU), which developed the planning software with the same name
WPPT: Wind Power Prediction Tool, the forecasting system developed at IMM (DTU), now commercialised by DTU spin-off Enfor (see Enfor.eu)
WRF Weather Research and Forecasting model, successor to MM5
Zephyr: The collaboration between Risø, IMM and Enfor

ANEMOS.plus/SafeWind The State of the Art in Short-Term Prediction of Wind PowerA Literature Overview, 2nd Edition
DELIVERABLE REPORT 2011-01-30 82
13. Additional Literature This chapter contains literature which I found the links to, but could not find myself, or where I didn’t find a place for in this report. It might be useful to you, so I leave it in here. Many of those come from the Costa State-of-the-Art paper [11]. Akylas E, Tombrou M, Panourgias J, Lalas D: The use of common meteorological predictions in estimating short term wind energy production in complex terrain. In: Watson R, editor. Proceedings of European wind energy conference, Dublin Castle, Ireland, 1997. p. 329–32.
Bailey B, Stewart R.: Wind forecasting for wind power stations. In: Galt J, editor. Proceedings of wind energy conversion, Edinburgh, UK, 1987. p. 265–9.
Bailey B, Stewart R.: Wind forecasting for wind power stations. In: Proceedings of the ninth British wind energy association conference, Edinburgh, 1987.
Benoit R, Yu W.: Developing and testing of wind power forecasting techniques for Canada. In: Proceedings of the first joint action symposium on wind forecasting techniques. Norrköping: International Energy Agency (IEA); 2002.
Beyer H, Degner T, Hausmann J, Hoffmann M, Ruján P.: Short term prediction of wind speed and power output of a wind turbine with neural networks. In: Tsipouridis J, editor. Proceedings of European wind energy conference, Thessaloniki-Macedonia, Greece, 1994. p. 349–52.
Beyer H, Heinemann D, Mellinghoff H, Mönnich K, Waldl H. Forecast of regional power output of wind turbines. In: Proceedings of European wind energy conference, Nice, 1999.
Borja M, Jaramillo O, Miranda U.: Prospects for the application of wind forecasting techniques in La Ventosa, México. In: Proceedings of the first joint action symposium on wind forecasting techniques. Norrköping: International Energy Agency (IEA); 2002.
Bossanyi E.: Short-term stochastic wind prediction and possible control applications. In: Proceedings of the Delphi workshop on wind energy applications; 1985.
Bossanyi E.: Stochastic wind prediction for turbine system control. In: Proceedings of the seventh British wind energy association conference, Oxford, UK, 1985.
Carter, G.M., D.B. Gilhousen: The Potential Impact of Automated Wind Guidance on Wind Energy Conversion Operations. 1980, 13pp.
Costa A, Crespo A, Feitosa E, Navarro J, Jiménez P, García E, et al.: Mathematical and physical wind power forecasting models: a proposal for the UPMPREDICTION project. In: Proceedings of the second joint action symposium on wind forecasting techniques. Lyngby: International Energy Agency (IEA); 2004.
Costa A, Crespo A, Migoya E.: First results from a prediction project. In: Proceedings of European wind energy conference, Madrid, 2003.
Costa A, Crespo A, Navarro J, Palomares A, Madsen H.: Modelling the integration of mathematical and physical models for short-term wind power forecasting. In: Proceedings of European wind energy conference, Athens, 2006.
Fellows A, Hill D.: Wind and load forecasting for integration of wind power into a meso-scale electrical grid. In: Proceedings of European community wind energy conference, Madrid, Spain, 1990. p. 636–40.

ANEMOS.plus/SafeWind The State of the Art in Short-Term Prediction of Wind PowerA Literature Overview, 2nd Edition
DELIVERABLE REPORT 2011-01-30 83
Gallardo C, Gaertner M, Tejeda C, Martínez N, Calabria S, Martínez N, et al.: The Casandra project: first results of a new wind power operational forecasting system in Spain. In: Proceedings of European wind energy conference, Madrid, 2003.
Gilhousen, D.B.: Development and Testing of Model Output Statistics for Wind Forecasts at Wind Turbine Generator Sites. DOE/RL/10046-1. NWS/NOAA, Silver Spring, MD 20910, 1979, 25pp.
Gow G. Short term wind forecasting. In: Proceedings of the first joint action symposium on wind forecasting techniques. Norrkö ping: International Energy Agency (IEA); 2002.
IEA: Variability of Wind Power and other Renewables: Management Options and Strategies. Position paper, 2005
Kaminsky F, et al.: Time series models of average wind speed within synoptic weather categories. In: Proceedings of the fourth ASME wind energy symposium; 1985. p. 215–9.
Landberg L: Implementing wind forecasting at a utility. In: Tsipouridis J, editor. Proceedings of European wind energy conference, Thessaloniki-Macedonia, Greece, 1994. p. 357–60.
Lozano T.: Prediction and planning of wind energy production. In: Proceedings of European wind energy conference, Madrid, 2003
Machenhauer B. HIRLAM Final Report. HIRLAM Technical Report 5, Copenhagen, Denmark, 1988
Marciukaitis M, Katinas V, Kavaliauskas A: Wind power usage and prediction prospects in Lithuania. Renewable and Sustainable Energy Reviews 2008;12:265–77.
Moliner M.: Predicción del viento: España toma la delantera. Energías Renovables 2004;28:20–2.
Møller, J.K., H.Aa. Nielsen, and H. Madsen: Time-adaptive quantile regression. Computational Statistics & Data Analysis, vol. 52, no. 3, pp. 1292–1303, Jan. 2008.
Notis: Learning to Forecast Wind at Remote Sites for Wind Energy Applications. 1983
Palomares A, de Castro M.: Short-term wind prediction model at the Strait of Gibraltar based on a perfect prognosis statistical downscaling method. In: Proceedings of European wind energy conference, Madrid, 2003
Ramirez-Rosado, I.J., L.A. Fernandez-Jimenez, C. Monteiro, J. Sousa, and R. Bessa: Comparison of two new short-term wind-power forecasting systems. Renewable Energy 34, pp. 1848-1854, 2009
Reikard, G.: Regime-switching models and multiple causal factors in forecasting wind speed. Wind Energy 13, pp. 407-418, 2010
Ryan M, Walsh L.: Wind generation in the Irish system. In: Proceedings of the second joint action symposium on wind forecasting techniques. Lyngby: International Energy Agency (IEA); 2004.
Schwartz M, Schwartz B, Brundage K.: Forecasting wind energy application of a NOAA weather forecast model. In: Proceedings of the second joint action symposium on wind forecasting techniques. Lyngby: International Energy Agency (IEA); 2004
Sloughter, J.M., T. Gneiting, and A.E. Raftery: Probabilistic Wind Speed Forecasting Using Ensembles and Bayesian Model Averaging. Journal of the American Statistical Association 105(489), pp. 25-35, March 2010

ANEMOS.plus/SafeWind The State of the Art in Short-Term Prediction of Wind PowerA Literature Overview, 2nd Edition
DELIVERABLE REPORT 2011-01-30 84
Watson R, Landberg L, Costello R, McCoy D, O’Donnell P. Evaluation of the Prediktor wind power forecasting system in Ireland. In: Proceedings of European wind energy conference, Copenhagen, 2001.
Watson S, Halliday J, Landberg L.: Assessing the economic benefits of numerical weather prediction model wind forecasts to electricity generating utilities. In: Clayton B, editor. Proceedings of wind energy conversion, Nottingham, UK, 1992. p. 291–7.
Watson, S., Halliday, J.A., and Landberg, L.: Assessing the economic benefits of numerical weather prediction model wind forecasts to electric generating utilities. Proceedings of the Fourteenth British Wind Energy Association Conference, 1992, pp. 291-298
Wegley, H.L.: The Development and Evaluation of Wind Forecasts for Wind Energy Applications. Battelle-Pacific Northwest Laboratory, Contract DE-AC06-76ALO, 1980
Wegley H, Formica W.: Test applications of a semi-objective approach to wind forecasting for wind energy applications. PNL-4403, Pacific Northwest Laboratory, 1983.
Wegley H, Kosorok M, Formica W.: Subhourly wind forecasting techniques for wind turbine operations. PNL-4894, Pacific Northwest Laboratory, 1984
Wendell, L.L., H.L. Wegley, M.G. Verholek: Report from a Working Group Meeting on Wind Forecasts for WECS Operations. PNL-2513, Batelle-Pacific Northwest Laboratory, Richland, WA 99352, 1978
Zheng H.Y., and A. Kusiak: Prediction of wind farm power ramp rates: a data-mining approach. Journal of Solar Energy Engineering 131(3): 031011, 2009

ANEMOS.plus/SafeWind The State of the Art in Short-Term Prediction of Wind PowerA Literature Overview, 2nd Edition
DELIVERABLE REPORT 2011-01-30 85
14. References 1 See http://anemos.cma.fr/
2 See http://www.anemos-plus.eu/
3 Giebel, G., L. Landberg, G. Kariniotakis, R. Brownsword: State-of-the-Art on Methods and Software Tools for Short-Term Prediction of Wind Energy Production. Proceedings of the European Wind Energy Conference & Exhibition EWEC, Madrid (E), 2003
4 Giebel, G., G. Kariniotakis: Best Practice in Short-term Forecasting - A Users Guide. Proceedings of the European Wind Energy Conference and Exhibition, Milan (IT), 7-10 May 2007
5 Kariniotakis, G., et al.., “Next Generation Short-term Forecasting of Wind Power – Overview of the Anemos Project”. In Proc. of the European Wind Energy Conference 2006, Athens, Greece, 27/2-2/3 2006.
6 Landberg, L., G. Giebel, H.Aa. Nielsen, T.S. Nielsen, H. Madsen: Short-term Prediction – An Overview. Wind Energy 6(3), pp. 273-280, June 2003.
7 Monteiro, C., R. Bessa, V. Miranda, A. Botterud, J. Wang, and G. Conzelmann: Wind Power Forecasting: State-of-the-Art 2009. Argonne National Laboratory ANL/DIS-10-1, November 2009 (see also http://www.dis.anl.gov/projects/windpowerforecasting.html)
8 Ernst, B., B. Oakleaf, M.L. Ahlstrom, M. Lange, C. Möhrlen, B. Lange, U. Focken and K. Rohrig: Predicting the Wind. IEEE Power & Energy Magazine 5(6), pp. 78-89, 2007
9 Lange, M., and U. Focken: State-of-the-Art in Wind Power Prediction in Germany and International Developments. Prediction of Wind Power and Reducing the Uncertainty for Grid Operators, Second Workshop of International Feed-In Cooperation, 15-16 Dec 2005, Berlin (DE)
10 Pinson, P., H. Madsen, G. Giebel, G. Kariniotakis, L. von Bremen, and I. Martí: Forecasting of wind generation – Recent advances and future challenges. Proceedings of the European Wind Energy Conference and Exhibition, Milan (IT), 7-10 May 2007
11 Costa, A., A. Crespo, J. Navarro, G. Lizcano, H. Madsen, E. Feitosa: A review on the young history of the wind power short-term prediction. Renew Sustain Energy Rev (2007)
12 Snodin, H.: Short-term wind energy forecasting: technology and policy. s.l. : Garrad Hassan and Partners Limited, 2006
13 Lerner, J., M. Grundmeyer, and M. Garvert: The Role of Wind Forecasting in the Successful Integration and Management of an Intermittent Energy Source. Energy Central Topics Newsletter, Volume 3, Issue 8, July 2009
14 Lei, M., L. Shiyan, J. Chuanwen, L. Hongling, Z. Yan: A review on the forecasting of wind speed and generated power. Renewable and Sustainable Energy Reviews 13, pp. 915-920, 2009
15 Lange, M., and U. Focken: Physical Approach to Short-Term Wind Power Prediction. Berlin: Springer-Verlag, 2005.
16 Ernst, B.: Wind Power Forecast for the German and Danish Networks. In: Wind Power in Power Systems, edited by T. Ackermann, John Wiley & Sons, Chichester (UK), 2005, ISBN 978-0-470-85508-9, pp. 365-382

ANEMOS.plus/SafeWind The State of the Art in Short-Term Prediction of Wind PowerA Literature Overview, 2nd Edition
DELIVERABLE REPORT 2011-01-30 86
17 Lange, B, K. Rohrig, F. Schlögl, Ü. Cali and R. Jursa: Wind Power Forecasting. In: Renewable Electricity and the Grid, G. Boyle, Ed. Serling,VA: Easthscan, London, 2007, pp. 95–120
18 Fox, B., D. Flynn, L. Bryans, N. Jenkins, D. Milborrow, M. O’Malley, R. Watson, and O. Anaya-Lara: Wind Power Integration: Connection and System Operational Aspects. The Institution of Engineering and Technology, London, 2007. ISBN 0863414494
19 Giebel, G., and G. Kariniotakis: Best Practice in the Use of Short-Term Forecasting. A Users Guide. Project report for the POW’WOW project, online, 6 pp., 2008.
20 powwow.risoe.dk/BestPracticeWorkshop.htm
21 Barry, D.: The Irish Experience. Talk on the Workshop for Best Practice in the Use of Short-term Forecasting of Wind Power, Delft (NL), 25 October 2006
22 Moreno, P., L. Benito, R. Borén and M. Cabré: Short-Term Wind Forecast. Results of First Year Planning Maintenance at a Wind Farm. Poster presented on the European Wind Energy Conference and Exhibition, Madrid (ES), 16-20 June, 2003
23 Still, D., B. Grainger: Demanding Seas – The UK’s First Offshore Wind Farm. Proceedings of the European Wind Energy Conference, Copenhagen, Denmark, 2-6 June 2001, pp. 169-171, ISBN 3-936338-09-4. Note: This statement was done during the talk.
24 Focken, U., J. Jahn, and M. Schaller: Transformer Congestion Forecast Based on Highly Localized Wind Power. Talk on the 8th International Workshop on Large-Scale Integration of Wind Power into Power Systems as well as on Transmission Networks for Offshore Wind Farms, Bremen (DE), 14-15 October 2009
25 Frías, L., E.Pascal, U.Irigoyen, E.Cantero, Y.Loureiro, S.Lozano, PM. Fernandes, I.Martí: Support Vector Machines in the wind energy framework. A new model for wind energy forecasting. Proc. Of the 2009 European Wind Energy Conference EWEC'09 Marseille (FR), 2009
26 Pielke, R.A., and E. Kennedy: Mesoscale terrain features. January 1980 report Uva Env. Sci meso 1980-1 University of Virginia Dept of Environmental Science.
27 Young, G. S., and R.A. Pielke: Application of terrain height variance spectra to meso scale modelling. J. Atmos. Sci. 40, pp 255-2560, 1983
28 Skamarock, W.C.: Evaluating Mesoscale NWP Models Using Kinetic Energy Spectra. Monthly Weather Review 132, p. 3019-3032, December 2004
29 Landberg, L.: A Mathematical Look at a Physical Power Prediction Model. Wind Energy 1, pp. 23-28 (1998).
30 Kariniotakis, G.: Position Paper on JOULE Project JOR3-CT96-0119, (1997)
31 Nielsen, C.S., and H.F. Ravn: Criteria in Short-term Wind Power Prognosis. Proceedings of the European Wind Energy Conference and Exhibition, Madrid, Spain, 16-19 June 2003.
32 Pinson, P., S. Lozano, I. Marti, G. Kariniotakis and G. Giebel. ViLab: a Virtual Laboratory for collaborative research on wind power forecasting. Wind Engineering 31(2), pp. 117–121, 2007
33 Landberg, L.: Short-term prediction of local wind conditions. Wind Engineering into the 21st Century, Proceedings of the Tenth International Conference on Wind Engineering,

ANEMOS.plus/SafeWind The State of the Art in Short-Term Prediction of Wind PowerA Literature Overview, 2nd Edition
DELIVERABLE REPORT 2011-01-30 87
Copenhagen/Denmark, 21-24 June 1999, Larsen, Larose & Livesey (eds), Balkema, Rotterdam, ISBN 90 5809 059 0, pp. 1997-2003
34 Madsen, H., G. Kariniotakis, H.Aa. Nielsen, T.S. Nielsen, P. Pinson: A Protocol for Standardizing the Performance Evaluation of Short-term Wind Power Prediction Models. Proceedings of the Global Wind Power Conference and Exhibition, Chicago (US), 28-31 March 2004
35 Madsen, H., G. Kariniotakis, H.Aa. Nielsen, T.S. Nielsen, P. Pinson: A Protocol for Standardizing the Performance Evaluation of Short-term Wind Power Prediction Models. Project report for the Anemos project, on anemos.cma.fr.
36 Madsen, H., P. Pinson, G. Kariniotakis, H.Aa. Nielsen, T.S. Nielsen: Standardizing the Performance Evaluation of Short-term Wind Power Prediction Models. Wind Engineering 29(6), pp. 475-489, 2005
37 Jens Tambke, Matthias Lange, Ulrich Focken, Jörg-Olaf Wolff, John A. T. Bye: Forecasting offshore wind speeds above the North Sea. Wind Energy 8(1), pp. 3-16, 2005
38 Bessa, R.J., V. Miranda, J. Gama: Entropy and correntropy against minimum square error in offline and online three-day ahead wind power forecasting. IEEE Transactions on Power Systems 24(4), Nov. 2009
39 Schwartz, M., B. Schwartz, and K. Brundage: Forecasting Wind Energy – Application of a NOAA Weather Forecast Model. Proceedings of the 2nd IEA Joint Action Symposium on Wind Forecasting Techniques, Lyngby, Denmark, June 2004, pp. 63-72. FOI-S—1329-SE, 2004
40 Liu, Y., T. Warner, B. Mahoney, K. Parks, R. Bigley, Y. Wan, D. Corbus, and E. Ela: Analysis and modeling study of inter-farm and intra-farm wind variations with the NCAR high-resolution multi-scale WRF-RTFDDA system. Poster on the European Geophysical Union General Assembly, Vienna (AT), 21-25 April 2009
41 Zack, J.W., S. Young, M. Cote, J. Nocera, J. Aymami and J. Vidal: Development and Testing of an Innovative Short-Term Large Wind Ramp Forecasting System. Proceedings of the European Wind Energy Conference and Exhibition, Warsaw (PL), 20-23 Apr 2010
42 Vincent, C., C. Draxl, G. Giebel, P. Pinson, J. Jørgensen, and C. Möhrlen: Spectral Verification of a Mesoscale Ensemble. Proceedings of the European Wind Energy Conference and Exhibition, Marseille (FR), 16-19 Mar 2009
43 Möhrlen, C., Jørgensen, J.U.: Forecasting Wind Power in High Wind Penetration Markets using Multi-Scheme Ensemble Prediction Methods. Proceedings of the German Wind Energy Conference, Bremen (DE), Nov 2006
44 Pahlow, M., C. Möhrlen, and J. Jørgensen: Application of cost functions for large-scale integration of wind power using a multi-scheme ensemble prediction technique. In "Optimization Advances in Electric Power Systems", Ed. Edgardo D. Castronuovo, NOVA Publisher NY, ISBN: 978-1-60692-613-0, 2008
45 Pahlow, M., L. Langhans, C. Möhrlen, J. Jørgensen: On the Potential of coupling Renewables into Energy Pools. Zeitschrift f. Energiewirtschaft 31(1), pp 35-46, 2007
46 Möhrlen, C.: First experiences of the new EEG trading rules in Germany and introduction of an ensemble based short-term forecasting methodology for intra-day trading. Talk on the 3rd Workshop on Best Practice in the Use of Short-term Prediction of Wind Power, Bremen (DE), 13. 10. 2009

ANEMOS.plus/SafeWind The State of the Art in Short-Term Prediction of Wind PowerA Literature Overview, 2nd Edition
DELIVERABLE REPORT 2011-01-30 88
47 Martí, I., G. Kariniotakis, P. Pinson, I. Sanchez, T. S. Nielsen, H. Madsen, G. Giebel, J. Usaola, A.M., Palomares, R. Brownsword, J. Tambke, U. Focken, M. Lange, G. Sideratos, G. Descombes. Evaluation of Advanced Wind Power Forecasting Models – Results of the Anemos Project. Proceedings of the European Wind Energy Conference and Exhibition, Athens (GR), 2006
48 Bowen, A.J., and N.G. Mortensen: WAsP prediction errors due to site orography. Risø National Laboratory, ISBN 87-550-2320-7, December 2004, 65 p. Risø-R-995(EN)
49 Kariniotakis, G., I. Martí, D. Casas, P. Pinson, T. S. Nielsen, H. Madsen, G. Giebel, J. Usaola, I. Sanchez, A.M. Palomares, R. Brownsword, U. Focken, M. Lange, J. Tambke, P. Louka, G. Kallos, C. Lac, G. Descombes, G. Sideratos: What performance can be expected by short-term wind power prediction models depending on site characteristics? Paper for the European Wind Energy Conference and Exhibition, London (UK), 22-25 November 2004
50 Nicholas Cutler, Merlinde Kay, Kieran Jacka, Torben Skov Nielsen: Detecting, categorizing and forecasting large ramps in wind farm power output using meteorological observations and WPPT, Wind Energy 10(5), pp. 453-470, 2007
51 Lange, M.: Analysis of the Uncertainty of Wind Power Predictions. PhD Thesis, Carl von Ossietzky Universität Oldenburg, 2003
52 Sørensen, P.: Erfaringer og udfordringer med vindkraften i Danmark i systemdriften. Systemoperatørforum June 2006 (in Danish)
53 Integration of wind power in the German electricity market - A trader's view - Clemens Krauß, EnBW Trading (DE). Talk held on the Workshop on Best Practice in the Use of Short-Term Prediction of Wind Power, Delft (NL), 25. 10. 2006
54 Gneiting, T., K. Larson, K. Westrick, M.G. Genton and E. Aldrich: Calibrated Probabilistic Forecasting at the Stateline Wind Energy Center: The Regime-Switching Space-Time (RST) Method. Technical Report no. 464 Department of Statistics, University of Washington September 2004
55 Pinson, P., and G. Kariniotakis: On-line Assessment of Prediction Risk for Wind Power Production Forecasts. Wind Energy 7, pp. 119-132, 2004
56 John Bjørnar Bremnes, Fredrik Villanger: Probabilistic Forecasts for Daily Power Production. Proceedings of the Global Wind Power Conference, Paris (FR), 2002
57 P. Pinson, G. Kariniotakis, H. Aa. Nielsen, T. S. Nielsen, H. Madsen: Properties of Quantile and Interval Forecasts of Wind Generation and their Evaluation. Proceedings of the European Wind Energy Conference and Exhibition, Athens (GR), 2006
58 Weprog: AESO Wind Power Forecasting Pilot Project Pre-Conference Session, Calgary, 24th April 2007 (downloaded from weprog.com)
59 G. Giebel (ed.), J. Badger, P. Louka, G. Kallos, I. Martí Perez, C. Lac, A-M. Palomares, G. Descombes: Results from mesoscale, microscale and CFD modelling. Deliverable report for the Anemos project, December 2006
60 Lange, B., K. Rohrig, B. Ernst, F. Schlögl, Ü. Cali, R. Jursa, and J. Moradi: Wind power prediction in Germany – Recent advances and future challenges. European Wind Energy Conference and Exhibition, Athens (GR), 27.2.-2.3. 2006

ANEMOS.plus/SafeWind The State of the Art in Short-Term Prediction of Wind PowerA Literature Overview, 2nd Edition
DELIVERABLE REPORT 2011-01-30 89
61 Lange, M., U. Focken, R. Meyer, M. Denhardt, B. Ernst, F. Berster: Optimal Combination of Different Numerical Weather Models for Improved Wind Power Predictions. 6th International Workshop on Large-Scale Integration of Wind Power and Transmission Networks for Offshore Wind Farms, Delft, 2006
62 Wessel, A., R. Mackensen, B. Lange: Development of a shortest-term wind power forecast for Germany including online wind data and implementation at three German TSO. Talk on the 3rd Workshop for Best Practice in the Use of Short-term Forecasting, Bremen (DE), 13 Oct 2009
63 Krauss, C, B. Graeber, M. Lange, U. Focken: Integration of 18GW Wind Energy into the Energy Market – Practical Experiences in Germany. Workshop on the Best Practice in Short-term Forecasting, Delft (NL), 25 October 2006
64 Vincent, C., G. Giebel, P. Pinson, and H. Madsen: Resolving Non-Stationary Spectral Information in Wind Speed Time Series using the Hilbert-Huang Transform. Journal of Applied Meteorology and Climatology 49(2), pp. 253-267, February 2010
65 Brown, B.G., R.W. Katz, and A.H. Murphy: Time Series Models to Simulate and Forecast Wind Speed and Wind Power. Journal of Climate and Applied Meteorology 23(8), pp. 1184-1195, August 1984
66 Bossanyi, E.A.: Short-Term Wind Prediction Using Kalman Filters. Wind Engineering 9(1), pp. 1-8 (1985)
67 Informationen aus dem Forschungsschwerpunkt Energieversorgung mit dezentralen Kleinkraftwer-ken in leistungsbegrenzten Versorgungsnetzen. Fachhochschule Wilhelmshaven, Fachbereich Elektrotechnik, Oktober 1999
68 Vihriälä, H., P. Ridanpää, R. Perälä, and L. Söderlund: Control of a variable speed wind turbine with feedforward of aerodynamic torque. Proceedings of the European Wind Energy Conference, Nice, France, 1-5 March 1999, pp. 881-884, ISBN 1 902916 00 X
69 Dambrosio, L, and D. Fortunato: One-step-ahead control of a wind-driven, synchronous generator system. Energy 24, pp. 9-20 (1999)
70 Fellows, A., and D. Hill: Wind and Load Forecasting for Integration of Wind Power into a Meso-Scale Electrical Grid. Proceedings of the European Community Wind Energy Conference, 10-14 September 1990, Madrid, Spain, pp. 636-640
71 Nogaret, E., G. Stavrakakis, J.C. Bonin, G. Kariniotakis, B. Papadias, G. Contaxis, M. Papadopou-los, N. Hatziargyriou, S. Papathanassiou, J. Garopoulos, E. Karagounis, J. Halliday, G. Dutton, J. Pedas-Lopes, A. Androutsos, and P. Pligoropoulos: Development and Implementation of an Advanced Control System for Medium Size Wind-Diesel Systems. Proceedings of the EWEC '94 in Thessaloniki, 10.-14. Okt, pp. 599-604
72 Tantareanu, C.: Wind Prediction in Short Term: A first step for a better wind turbine control. Nordvestjysk Folkecenter for Vedvarende Energi, October 1992, ISBN 87-7778-005-1
73 Kamal, L. and Y.Z. Jafri: Time series models to simulate and forecast hourly averaged wind speed in Quetta, Pakistan. Solar Energy 61(1), pp. 23-32, 1997
74 Dutton, A.G., G. Kariniotakis, J.A. Halliday, and E. Nogaret: Load and Wind Power Forecasting Methods for the Optimal Management of Isolated Power Systems with High Wind Penetration. Wind Engineering 23(2), pp. 69-87 (1999)

ANEMOS.plus/SafeWind The State of the Art in Short-Term Prediction of Wind PowerA Literature Overview, 2nd Edition
DELIVERABLE REPORT 2011-01-30 90
75 Kariniotakis, G., E. Nogaret, and G. Stavrakis: Advanced Short-Term Forecasting of Wind Power Production. Proceedings of the European Wind Energy Conference held in Dublin, Ireland, October 1997, pp. 751-754, ISBN 0 9533922 0 1
76 Kariniotakis, G.N., E. Nogaret, A.G. Dutton, J.A. Halliday, and A. Androutsos: Evaluation of Advanced Wind Power and Load Forecasting Meghods for the Optimal Management of Isolated Power Systems. Proceedings of the European Wind Energy Conference, Nice, France, 1-5 March 1999, pp. 1082-1085, ISBN 1 902916 00 X
77 Fukuda, H., S. Tamaki, M. Nakamura, H. Nagai, F. Shijo, S. Asato, K. Onaga: The Development of a Wind Velocity Prediction Method Based on a Data-Mining Type Auto-Regressive Model. Proceedings of the European Wind Energy Conference, Copenhagen, Denmark, 2-6 June 2001, pp. 741-744, ISBN 3-936338-09-4
78 Hunt, K., and G.P. Nason: Wind speed modelling and short-term prediction using wavelets. Wind Engineering 25 (1), pp. 55-61 (2001)
79 Torres, J.L., A. Garcia, M. De Blas and A. De Francisco: Forecast of hourly average wind speed with ARMA models in Navarre (Spain). Solar Energy 79(1), pp. 65-77, 2005
80 Balouktsis, A., D. Tsanakas, and G. Vachtsevanos: Stochastic simulation of hourly and daily average wind speed sequences. Wind Engineering 10(1), pp. 1-11, 1986
81 Daniel, A.R. and A.A. Chen: Stochastic simulation and forecasting of hourly average wind speed sequences in Jamaica. Solar Energy 46(1), pp. 1-11, 1991
82 Lin, L., J.T. Eriksson, H. Vihriälä, and L. Söderlund: Predicting wind behaviour with neural networks. Proceedings of the EUWEC, Göteborg (SE), pp. 655-658, 1996
83 Justus, C.G., W.R. Hargraves, and A. Yacin: Nation-wide assessment of potential output from wind power generators. J. Appl. Meteor. 15(7), pp. 673–678, 1976
84 Geerts, H.M.: Short range prediction of wind speeds: a system-theoretic approach. Proceedings of the European Wind Energy Conference, Hamburg (DE), 1984, pp. 594-599
85 Makarov Y, D. Hawkins, E. Leuze, J. Vidov: California Iso Wind Generation Forecasting Service Design and Experience. Published by California Independent System Operator Corporation
86 Schwartz, M., M. Milligan: Statistical Wind Forecasting at the U.S. National Renewable Energy Laboratory. Proceedings of the First IEA Joint Action Symposium on Wind Forecasting Techniques, Norrköping, Sweden, December 2002, pp. 115-124B. Published by FOI - Swedish Defence Research Agency.
87 Kavasseri, R.G., and K. Seetharaman: Day-ahead wind speed forecasting using f-ARIMA models. Renewable Energy 34 pp. 1388–1393, 2009
88 El-Fouly, T.H.M., E.F. El-Saadany, and M.M.A. Salama: Grey Predictor for Wind Energy Conversion Systems Output Power Prediction. IEEE Trans Pow Sys 21(3), pp. 1450-1452, 2006
89 Baïle, R., J.F. Muzy, and P. Poggi: Short-term forecasting of surface layer wind speed using a continuous random cascade model. Wind Energy, published online, 2011
90 Pinson, P., L.E.A. Christensen, H. Madsen, P.E. Sørensen, M.H. Donovan, and L.E. Jensen: Regime-switching modelling of the fluctuations of offshore wind generation. Journal of Wind Engineering and Industrial Aerodynamics 96(12), pp. 2327– 2347, 2008

ANEMOS.plus/SafeWind The State of the Art in Short-Term Prediction of Wind PowerA Literature Overview, 2nd Edition
DELIVERABLE REPORT 2011-01-30 91
91 Lau, A. and P.E. McSharry: Approaches for multi-step density forecasting with application to aggregated wind power. Annals of Applied Statistics 4(3), pp. 1311-1341, 2010
92 Beyer, H.G., T. Degner, J. Hausmann, M. Hoffmann, and P. Ruján: Short Term Prediction of Wind Speed and Power Output of a Wind Turbine with Neural Networks. Proceedings of the EWEC '94 in Thessaloniki, 10.-14. Okt, pp. 349-352
93 Tande, J.O., and L. Landberg: A 10 sec. Forecast of Wind Turbine Output with Neural Networks. Proceedings of the 1993 ECWEC in Travemünde, 8.-12. March 1993, pp. 774-777, ISBN 0-9521452-0-0
94 Alexiadis, M.C., P.S. Dokopoulos, H.S. Sahsamanoglou, and I.M. Manousaridis: Short-Term Forecasting of Wind Speed and Related Electrical Power. Solar Energy 63, pp. 61-68 (1998)
95 Bechrakis, D.A. and P.D. Sparis: Wind Speed Prediction Using Artificial Neural Networks. Wind Engineering 22(6), pp. 287-295 (1998)
96 Sfetsos, A.: A novel approach for the forecasting of mean hourly wind speed time series. Renewable Energy 27 , pp. 163-174 (2001)
97 Mohandes, M.A., T.O. Halawani, S. Rehman, A.A. Hussain: Support Vector Machines for Wind Speed Prediction. Renewable Energy 28(4), pp. 939—947 (2004).
98 H. Annendyck and D. Becker: Advanced Artificial Neural Network Short Term Load Forecaster (ANNSTLF). Paper presented on the Northern African Power Industry Convention (NAPIC), Algiers, Algeria, 22-24 November 2004
99 Kretzschmar, R., P. Eckert, D. Cattani, and F. Eggimann: Neural Network Classifiers for Local Wind Prediction. J Appl Met 43(5), pp. 727-738
100 Sfetsos, A.: Time series forecasting of wind speed and solar radiation for renewable energy sources. Ph.D. thesis Imperial College, UK, 1999
101 Sfetsos, A.: A comparison of various forecasting techniques applied to mean hourly wind speed time series. Renewable Energy 21 (2000), pp. 23-35
102 Wu, G. and Z. Dou: Non linear wind prediction using a fuzzy modular temporal neural network. Windpower ’95. , 1995, pp. 285-294
103 Potter, C.W., and M. Negnevitsky: Very Short-Term Wind Forecasting for Tasmanian Power Generation. IEEE Trans. On Pow. Sys. 21(2), pp. 965-972, 2006
104 Steen, A.: Entwicklung und Anwendung einer Methode zumsystematischen Aufbau von Lastprognosesystemen und Fallstudien zur Prognose von regenerativ erzeugter Windenergie. Practical Report, University of Flensburg (D), 2004 (in German)
105 Cadenas, E., and W. Rivera: Short term wind speed forecasting in La Venta, Oaxaca, México, using artificial neural networks. Ren Ene 34(1), 274-278, 2009
106 Cadenas, E., and W. Rivera: Wind speed forecasting in the South Coast of Oaxaca, Mexico. Ren. Ene. 32, pp. 2116-2128, 2007
107 More, A., and M.C. Deo: Forecasting wind with neural networks. Marine Structures 16, 35-49
108 University of Ulster: Making Wind Power More Efficient, Press Release from 28 May 2003, http://news.ulster.ac.uk/releases/2003/785.html

ANEMOS.plus/SafeWind The State of the Art in Short-Term Prediction of Wind PowerA Literature Overview, 2nd Edition
DELIVERABLE REPORT 2011-01-30 92
109 Campbell, P.R.J., and K. Adamson: A novel approach to wind forecasting in the United Kingdom and Ireland. International Journal Of Simulation Systems 6(12-13), Science & Technology, Published by UK Simulation Society, pp. 1-10, November 2005, ISSN 1473-8031
110 Kusiak, A., H. Zheng, Z. Song: Short-Term Prediction of Wind Farm Power: A Data Mining Approach. IEEE Transactions on Energy Conversion 24(1), pp. 125-136, March 2009
111 Nielsen, T.S., A. Joensen, H. Madsen, L. Landberg and G. Giebel: A New Reference for Predicting Wind Power. Wind Energy 1, pp. 29-34 (1998).
112 Jensen, U.S., E. Pelgrum and H. Madsen: The Development of a Forecasting Model for the Prediction of Wind Power Production to be Used in Central Dispatch Centres. Proceedings of the EWEC '94 in Thessaloniki, 10.-14. Okt, pp. 353-356
113 ELSAM, Final Report on EU JOULE II Project JOU-CT92-0083, 1996
114 H. Madsen (ed.): Wind Power Prediction Tool in Control Dispatch Centres. ELSAM, Skaerbaek, Denmark (1995), ISBN 87-87090-25-2
115 Nielsen, T.S., and H. Madsen: Using Meteorological Forecasts in On-line Predictions of Wind Power. ELSAM, Skaerbaek, Denmark (1996)
116 Giebel, G.: On the Benefits of Distributed Generation of Wind Energy in Europe. PhD thesis from the Carl von Ossietzky Universität Oldenburg. Fortschr.-Ber. VDI Reihe 6 Nr. 444. Düsseldorf, VDI Verlag 2001. ISBN 3-18-344406-2
117 P. Louka, G. Galanis, N. Siebert, G. Kariniotakis, P. Katsafados, I. Pytharoulis, G. Kallos: Improvements in wind speed forecasts for wind power prediction purposes using Kalman filtering. J Wind Eng Ind Aerodynamics 96, pp. 2348-2362, 2008
118 Cabezon, D., I. Marti, M.J. San Isidro, I. Perez: Comparison of Methods for Power Curve Modeling. Proceedings to Global Windpower 2004, Chicago (USA), 2004
119 Jonathan Collins, Jeremy Parkes, Andrew Tindal: Short Term Forecasting for Utility-Scale Wind Farms - The Power Model Challenge, Wind Engineering 33(3), pp. 247–258, 2009
120 Andrew Kusiak, Haiyang Zheng, Zhe Song; Wind Farm Power Prediction: A Data-Mining Approach, Wind Energy 12(3), pp. 275-293, 2009
121 Kusiak, A., and W. Li: Short-term prediction of wind power with a clustering approach. Renewable Energy 35, pp. 2362-2369, 2010
122 Pinson, P., H.Aa. Nielsen, H. Madsen, and T.S. Nielsen: Local linear regression with adaptive orthogonal fitting for the wind power application. Statistics and Computing 18(1), pp. 59-71, 2008
123 Nielsen, H.Aa., P. Pinson, L.E. Christiansen, T.S. Nielsen, H. Madsen, J. Badger, G. Giebel, H.F. Ravn: Improvement and automation of tools for short term wind power forecasting. Scientific Proceedings of the European Wind Energy Conference and Exhibition, Milan (IT), 7-10 May 2007
124 Barthelmie, R.J., G. Giebel, D. Cabezon, and I. Martí: WP4: An overview of wind turbine wakes and short-term forecasting. Project report for the POW’WOW project, Risø, Roskilde, 2009, 19 pp.
125 Sánchez, I., J. Usaola, O. Ravelo, C. Velasco, J. Domínguez, M.G. Lobo: Sipréolico – A Wind Power Prediction System Based on Flexible Combination of Dynamic Models. Application to the Spanish Power System. Proceedings of the World Wind Energy Conference, Berlin (DE), June 2002

ANEMOS.plus/SafeWind The State of the Art in Short-Term Prediction of Wind PowerA Literature Overview, 2nd Edition
DELIVERABLE REPORT 2011-01-30 93
126 Bidlot, J.-R., J.-G. Li, P. Wittmann, M. Fauchon, H. Chen, J.-M. Lefevre, T. Bruns, D. Greenslade, F. Ardhuin, N. Kohno, S. Park, and M. Gomez: Inter-Comparison of Operational Wave Forecasting Systems. Proceedings of the 10th INTERNATIONAL WORKSHOP ON WAVE HINDCASTING AND FORECASTING AND COASTAL HAZARD SYMPOSIUM NORTH SHORE, OAHU, HAWAII, NOVEMBER 11-16, 2007 (see http://www.waveworkshop.org)
127 Möhrlen, C.: On the Benefits of and Approaches to Wind Energy Forecasting. Invited Speaker at the Irish Wind Energy Association Annual Conference "Towards 500MW", (2001).
128 Rife, D.L., and C.A. Davis: Verification of Temporal Variations in Mesoscale Numerical Wind Forecasts. Monthly Weather Review 133(11), pp. 3368-3381, 2005
129 Davis, C., Wei Wang, Jimy Dudhia, Ryan Torn: Does Increased Horizontal Resolution Improve Hurricane Wind Forecasts? Weather and Forecasting 25(6), pp.1826–1841, 2010
130 Möhrlen, C., J. Jørgensen, K. Sattler, E. McKeogh: On the accuracy of land cover data in NWP forecasts for high resolution wind energy prediction. Proceedings of the European Wind Energy Conference, Copenhagen, Denmark, 2-6 June 2001, pp. 854-857, ISBN 3-936338-09-4
131 Jørgensen, J., C. Möhrlen, E. McKeogh: A New Generation Operational On- and Offshore Numerical Prediction System. Talk on the World Wind Energy Conference in Berlin, Germany, June 2002
132 Möhrlen, C., J.U. Jørgensen, E.J. McKeogh: Power predictions in Complex Terrain with an operational Numerical Weather Prediction Model in Ireland including Ensemble Prediction. Proc. World Wind Energy Conference "Clean Power for the World", Berlin, Germany, 2002
133 Möhrlen, C., J.U. Jørgensen, K. Sattler, E.J. McKeogh: On the accuracy of land cover data in NWP forecasts for high resolution wind energy prediction. Proceedings of the European Wind Energy Conference, Copenhagen, Denmark, 2-6 June 2001, pp. 703-706, ISBN 3-936338-09-4
134 Jørgensen, J.U., C. Möhrlen, K. Sattler: HIRPOM-WAM: An on - and offshore prediction system for real-time prediction and climatic studies. Offshore Wind energy, EWEA Special Topic Conference, Brussels, Dec. 2002
135 Möhrlen, C.: Private communication, 26. 9. 2006
136 Jørgensen, J., C. Möhrlen, B. Ó Gallaghóir, K. Sattler and E. McKeogh: HIRPOM: Description of an operational numerical wind power prediction model for large scale integration of on- and offshore wind power in Denmark. Poster on the Global Windpower Conference and Exhibition, Paris, France, 2-5 April 2002, 5 p. on the Proceedings CDROM
137 Möhrlen, C.: Uncertainty in Wind Energy Forecasting. PhD Thesis, Department of Civil and Environmental Engineering, University College Cork, Ireland, May 2004.
138 Sood, A., K. Suselj, and D. Heinemann: High Resolution NWP North Sea Wind Forecasts in the Marine Atmospheric Boundary Layer. Proceedings of the European Wind Energy Conference, Athens (GR), 27.2.-2.3. 2006
139 Törnevik, H.: private communication, 21.12.1999
140 Söder, L.: Modelling of wind power forecast uncertainty. Proceedings of the 1993 ECWEC in Travemünde, 8.-12. March 1993, p. 786
ANEMOS.plus/SafeWind The State of the Art in Short-Term Prediction of Wind PowerA Literature Overview, 2nd Edition
DELIVERABLE REPORT 2011-01-30 94
141 Martin, F., R. Zubiaur, P. Moreno, S. Rodriguez, M. Cabre, M. Casanova, A. Hormigo, and M. Alonso: Operational Tool for Short Term Prediction Model of Energy Production in Wind Power Plants at Tarifa (Spain). Proceedings of the 1993 ECWEC in Travemünde, 8.-12. March 1993, pp. 802-803, ISBN 0-9521452-0-0
142 Martí Perez, I.: private communication, 8.3.2000
143 Palomares, A., and M. de Castro: Short-term wind prediction model at the Strait of Gibraltar based on a perfect prognosis statistical downscaling method. Paper 164 presented on the European Wind Energy Conference and Exhibition, Madrid (ES), 16-20 June, 2003
144 Barstad, I.: Down-Scaling of Wind in a Dynamic Framework. Proceedings of the European Wind Energy Conference, Copenhagen, Denmark, 2-6 June 2001, pp. 713-716, ISBN 3-936338-09-4
145 Kalnay, E., M. Kanamitsu, R. Kistler, W. Collins, D. Deaven, L. Gandin, M. Iredell, S. Saha, G. White, J. Woollen, Y. Zhu, A. Leetmaa, B. Reynolds, M. Chelliah, W. Ebisuzaki, W. Higgins, J. Janowiak, K.C. Mo, C. Ropelewski, J. Wang, R. Jenne, D. Joseph: The NCEP/NCAR 40-year reanalysis project. Bulletin of the American Meteorological Society 77(3), (1996), pp. 437–471; See also http://wesley.wwb.noaa.gov/reanalysis.html
146 Berge, E.: Experiences with wind forecasting techniques in Norway. Proceedings of the First IEA Joint Action Symposium on Wind Forecasting Techniques, Norrköping, Sweden, December 2002, pp. 59-64. Published by FOI - Swedish Defence Research Agency.
147 Berge, E., F. Nyhammer, L. Tallhaug, F. Villanger, J.b. Bremnes, M.Ø. Køltzow, J. Smits, A. Knauer: Forecasting wind and wind energy production in Norwegian wind farms. Final report of the NFR project: 138848/212 “Korttidsprognoser for energiprokuksjon fra vindkraft”. Kjeller Vindteknikk Report number KVT/EB/2003/005, Kjeller (NO), 2003
148 Bremnes, J.B.: Probablilistic wind power forecasts by means of a statistical model. Proceedings of the First IEA Joint Action Symposium on Wind Forecasting Techniques, Norrköping, Sweden, December 2002, pp. 103-114. Published by FOI - Swedish Defence Research Agency.
149 Enemoto, S., N. Inomata, T. Yamada, H. Chiba, R. Tanikawa, T. Oota, H. Fukuda: Prediction of Power Output from Wind Farm Using Local Meteorological Analysis. Proceedings of the European Wind Energy Conference, Copenhagen, Denmark, 2-6 June 2001, pp. 749-752, ISBN 3-936338-09-4
150 Murakami, S., A. Mochida, S. Kato: Development of local area wind prediction system for selecting suitable site for windmill. J. Wind Eng. Ind. Aerodyn. 91, pp. 1759-1776 (2003)
151 Hashimoto, A., Y. Hattori, S. Kadokura, K. Wada, S. Sugimoto, H. Hirakuchi, and N. Tanaka: Effects Of Numerical Models On Local-Wind Forecasts Over A Complex Terrain with Wind Farm Prediction Model. Proceedings of the European Wind Energy Conference, Milano (IT), 7-10 May 2007
152 Yamaguchi, A., T. Ishihara, K. Sakai, T. Ogawa, and Y. Fujino: A Physical-Statistical Approach for the Regional Wind Power Forecasting. Proceedings of the European Wind Energy Conference EWEC, Milan (IT), 7-10 May 2007
153 GEO mbh and GKSS: Optimierung von Windprognosen zur präzisen Vorausberechnung von Windstromerträgen als Handlungsgrundlage im dezentralen Energiemanagement (Optimisation of wind power forecasts for the precise calculation of wind power yields as a decision basis in the decentralised energy management). Projekt funded by the Deutsche Bundesstiftung Umwelt. 02/2003-01/2005

ANEMOS.plus/SafeWind The State of the Art in Short-Term Prediction of Wind PowerA Literature Overview, 2nd Edition
DELIVERABLE REPORT 2011-01-30 95
154 Canada Meteorological Institute: The Wind Energy Simulation Toolkit http://www.msc-smc.ec.gc.ca/acsd/publications/RMD_msc_report/service/service_7_e.html
155 Tammelin, B.: Wind Power Forecasting. Proceedings of the First IEA Joint Action Symposium on Wind Forecasting Techniques, Norrköping, Sweden, December 2002, pp. 75-81. Published by FOI - Swedish Defence Research Agency.
156 Silke Dierer, Tim de Paus, Francesco Durante, Erik Gregow, Bernhard Lange, Alfredo Lavagnini, Martin Strack, Bengt Tammelin: Predicting Wind Speed for Wind Energy; Progress of the WINDENG Project. Wind Engineering 29(5), pp. 393-408, 2005
157 Giebel, G. (ed.), J. Badger, P. Louka, G. Kallos, I. Martí Perez, C. Lac, A.-M. Palomares, G. Descombes: Results from mesoscale, microscale and CFD modelling. Deliverable D4.1b of the Anemos project. Available online from Anemos.cma.fr. 101 pages, December 2006
158 Peña, A., and A. Hahmann: Validation of Boundary Layer Winds from WRF Mesoscale Forecasts over Denmark. Proceedings of the European Wind Energy Conference, Warsaw (PL), 20-23 April 2010
159 Draxl, C., A.N. Hahmann, A. Peña, J.N. Nissen, and G. Giebel: Validation of boundary-layer winds from WRF mesoscale forecasts with applications to wind energy forecasting. Poster and proceedings at the 9th International Workshop on Large-Scale Integration of Wind Power into Power Systems as well as on Transmission Networks for Offshore Wind Power Farms, Quebec City (CA), 18/19 October 2010
160 Draxl, C., Y. Liu, W. Cheng, L. delle Monache2, A. Hahmann, and G. Giebel: On the assimilation of nacelle winds into mesoscale models for short-term wind energy forecasts: at the example of the wind farm Horns Rev and WRF FDDA. Manuscript under preparation, 2011
161 Ágústsson, H., H. Ólafsson, Ó. Rögnvaldsson, and M.O. Jonassen: On the importance of high spatial resolution and in-situ observations in simulations of the atmosphere in the vicinity of mountains. Proceedings of the Atlantic Conference on Eyjafjallajökull and Aviation, Keflavik (IS), 15-16 September 2010
162 Ágústsson, H., H. Ólafsson, M. Jonassen, J. Reuder, D. Rasol, and Ó. Rögnvaldsson: Improving high-resolution atmospheric simulations of local weather using in-situ realtime observations from small unmanned aircraft. European Geophysical Union General Assembly, Vienna (AT), 3-8 April 2011
163 Badger, J., X. Guo Larsén, N.G. Mortensen, A. Hahmann, J.C. Hansen, H. Jørgensen: A Universal Mesoscale to Microscale Modelling Interface Tool. Proceedings of the European Wind Energy Conference, Warsaw (PL), 20-23 April 2010
164 Bourke, W., R. Buizza, and M. Naughton: Performance of the ECMWF and the BoM ensemble prediction systems in the Southern Hemisphere. Mon. Wea. Rev. 132(10), pp 2338-2357, Oct. 2004
165 Seaman, R., W. Bourke, P. Steinle, T. Hart, G. Embery, M. Naughton, and L. Rikus: Evolution of the Bureau of Meteorology's Global Assimilation and Prediction System. Part 1: Analysis and initialisation. Aust. Meteor. Mag. 44(1), pp. 1-18, 1995
166 Buizza, R., and T.N. Palmer: The singular-vector structure of the atmospheric general circulation. J. Atmos. Sci. 52(9) pp. 1434-1456, 1995
167 Molteni, F., Buizza, R., Palmer, T.N. and Petroliagis,T.: The ECMWF Ensemble Prediction System: Methodology and Validation. Q.J. Roy. Meteorol. Soc. 122(529), pp 73-119, 1996
ANEMOS.plus/SafeWind The State of the Art in Short-Term Prediction of Wind PowerA Literature Overview, 2nd Edition
DELIVERABLE REPORT 2011-01-30 96
168 Buizza, R., Miller, M., & Palmer, T. N.: Stochastic representation of model uncertainties in the ECMWF Ensemble Prediction System. Q. J. Roy. Meteorol. Soc. 125(560), pp. 2887-2908, 1999
169 Buizza, R., Bidlot, J.-R., Wedi, N., Fuentes, M., Hamrud, M., Holt, G., & Vitart, F.: The new ECMWF VAREPS (Variable Resolution Ensemble Prediction System). Q. J. Roy. Meteorol. Soc. 133(624), pp. 681-695, 2007
170 Courtier,P., Freydier,C., Geleyn,J.-F., Rabier, F., Rochas,M.: The ARPEGE project at Météo-France. In Workshop on numerical methods in atmospheric models. volume 2 pages 193-231, Reading, UK. ECMWF, 1991
171 Nicolau, J.,: Short-range ensemble forecasting. WMO/CSB Technical Conference meeting, Cairns (AU), December 2002
172 Bowler, N.E., A. Arribas, K. R. Mylne, K. B. Robertson and S.E. Beare: The MOGREPS short-range ensemble prediction system. Q. J. Roy. Meteorol. Soc. 134(632), pp. 703-722, 2008
173 K. Mylne, C. Woolcock and R. Darvell, EU FP6 PREVIEW Windstorms Forecast Verification Report, September 2008, Met Office, UK
174 Anderson J. L., and S. L. Anderson: A Monte Carlo implementation of the nonlinear filtering problem to produce ensemble assimilations and forecasts. Mon. Wea. Rev 127, pp. 2741–2758, 1999
175 Möhrlen, C., and J. Jørgensen: A new Algorithm for Upscaling and Short-term Forecasting of Wind Power using Ensemble Forecasts. Proceedings of the 8th International Workshop on Large Scale Integration of Wind Power and on Transmission Networks for Offshore Wind Farms, Bremen (DE), 14/15 October 2009
176 Houtekamer P. L., and H. L. Mitchell: Data assimilation using an ensemble Kalman filter technique. Mon. Wea. Rev. 126, pp. 796–811, 1998
177 Meng, Z., and F. Zhang: Tests of an Ensemble Kalman Filter for Mesoscale and Regional-Scale Data Assimilation. Part III: Comparison with 3DVAR in a Real-Data Case Study. Mon. Wea. Rev. 136, pp. 522–540, 2008
178 Ed McCarthy: Wind Speed Forecasting in the Central California Wind Resource Area. Paper presented in the EPRI-DOE-NREL Wind Energy Forecasting Meeting March 23, 1998, Burlingame, CA
179 Troen, I, L. Landberg: Short-Term Prediction of Local Wind Conditions. Proceedings of the European Community Wind Energy Conference, Madrid (ES), September10-14, 1990, pp. 76-78, ISBN 0-9510271-8-2
180 Landberg, L.: Short-term Prediction of Local Wind Conditions. PhD-Thesis, Risø-R-702(EN), Risø National Laboratory, Roskilde, Denmark 1994, ISBN 87-550-1916-1
181 Troen, I., and E.L. Petersen: European Wind Atlas. Published for the EU Commission DGXII by Risø National Laboratory, Denmark (1998), ISBN 87-550-1482-8
182 Landberg, L.: Short-term Prediction of the Power Production from Wind Farms. J. Wind Eng. Ind. Aerodyn. 80, pp. 207-220 (1999)
183 Landberg, L., and S.J. Watson: Short-term Prediction of Local Wind Conditions. Boundary-Layer Meteorology 70, p. 171 (1994)

ANEMOS.plus/SafeWind The State of the Art in Short-Term Prediction of Wind PowerA Literature Overview, 2nd Edition
DELIVERABLE REPORT 2011-01-30 97
184 Joensen, A., G. Giebel, L. Landberg, H. Madsen, and H. Aa. Nielsen: Model Output Statistics Applied to Wind Power Prediction. Proceedings of the European Wind Energy Conference, Nice, France, 1-5 March 1999, pp. 1177-1180, ISBN 1 902916 00 X
185 Landberg, L.: Short-term Prediction of Local Wind Conditions. J. Wind Eng. Ind. Aerodyn. 89, pp. 235-245 (2001)
186 Watson, R., L. Landberg, R. Costello, D. McCoy, P. O’Donnell: Evaluation of the Prediktor Wind Power Forecasting System in Ireland. Proceedings of the European Wind Energy Conference, Copenhagen, Denmark, 2-6 June 2001, pp. 703-706, ISBN 3-936338-09-4
187 Giebel, G., L. Landberg, C. Bjerge, M.H. Donovan, A. Juhl, K. Gram-Hansen, H.-P. Waldl, T. Pahlke, J. Giebhardt, M. Rebbeck, R. Ruffle, O. Brady: CleverFarm - First results from an intelligent wind farm. Paper presented at the European Wind Energy Conference and Exhibition, Madrid, Spain, 16-19 June 2003.
188 Nielsen, T.S., and H. Madsen: Statistical Methods for Predicting Wind Power. Proceedings of the European Wind Energy Conference held in Dublin, Ireland, October 1997, pp. 755-758, ISBN 0 9533922 0 1
189 Nielsen, T.S., H. Madsen, and J. Tøfting: Experiences with Statistical Methods for Wind Power Prediction. Proceedings of the European Wind Energy Conference, Nice, France, 1-5 March 1999, pp. 1066-1069, ISBN 1 902916 00 X
190 Giebel, G., L. Landberg, T.S. Nielsen, H. Madsen: The Zephyr Project – The Next Generation Prediction System. Poster P_GWP145 on the Global Windpower Conference and Exhibition, Paris, France, 2-5 April 2002
191 Beyer, H.G., D. Heinemann, H. Mellinghoff, K. Mönnich, and H.-P. Waldl: Forecast of Regional Power Output of Wind Turbines. Proceedings of the European Wind Energy Conference, Nice, France, 1-5 March 1999, pp. 1070-1073, ISBN 1 902916 00 X
192 Focken, U., M. Lange, H.-P. Waldl: Previento – A Wind Power Prediction System With an Innovative Upscaling Algorithm. Proceedings of the European Wind Energy Conference, Copenhagen, Denmark, 2-6 June 2001, pp. 826-829, ISBN 3-936338-09-4
193 Mellinghoff, H., K. Mönnich, H.-P. Waldl, H.G. Beyer: Windleistungsvorhersage im Zeitbereich von 48 Stunden. DEWI Magazin 13, August 1998, pp. 49-53 (in German)
194 Mönnich, K.: Vorhersage der Leistungsabgabe netzeinspeisender Windkraftanlagen zur Unterstuetzung der Kraftwerkseinsatzplanung. PhD-thesis, Carl von Ossietzky Universität Oldenburg, 2000.
195 See http://www.forwind.de/forwind/index.php?article_id=240&clang=0 (last accessed 20 Sept 2010)
196 http://www.amiace.com/windenergy.htm (accessed 16 Sept 2010)
197 Kariniotakis G., G.S. Stavrakakis, E.F. Nogaret: Wind power forecasting using advanced neural network models. IEEE Transactions on Energy Conversion, Vol. 11, No. 4, December 1996, pp. 762-767. (96 SM 552-0 EC), Presented at the 1996 IEEE/PES Summer Meeting, July 28-Aug. 1, 1996, Denver, Colorado.

ANEMOS.plus/SafeWind The State of the Art in Short-Term Prediction of Wind PowerA Literature Overview, 2nd Edition
DELIVERABLE REPORT 2011-01-30 98
198 Kariniotakis, G.N.: Contribution au développement d'un système de contrôle avancé pour les systèmes éolien-diesel autonomes. Thèse de doctorat européen, Ecole des Mines de Paris, Spécialité énergétique, Décembre 1996. (In French)
199 Wind Engineering, CARE Special Issue, Vol 23(2), 1999
200 Kariniotakis, G.N., D. Mayer: An Advanced On-Line Wind Resource Prediction System for the Optimal Management of Wind Parks. Paper presented on the 3rd MED POWER conference 2002, Athens (GR), November 4-6, 2002
201 Kariniotakis, G.N., D. Mayer, J.A. Halliday, A.G. Dutton, A.D. Irving, R.A. Brownsword, P.S. Dokopoulos, M.C. Alexiadis: Load, Wind and Hydro Power Forecasting Functions of the More-Care EMS System. Paper presented on the 3rd MED POWER conference 2002, Athens (GR), November 4-6, 2002
202 Costello, R., D. McCoy, P. O’Donnell, A.G. Dutton, G.N. Kariniotakis: Potential Benefits of Wind Forecasting and the Application of More-Care in Ireland. Paper presented on the 3rd MED POWER conference 2002, Athens (GR), November 4-6, 2002
203 Kariniotakis, G., P. Pinson: Evaluation of the More-Care Wind Power Prediction Platform. Performance of the Fuzzy Logic Based Models. Paper presented at the European Wind Energy Conference and Exhibition, Madrid, Spain, 16-19 June 2003.
204 Hatziargyriou, G.C., M. Matos, J.A. Pecas Lopes, G. Kariniotakis, D. Mayer, J. Halliday, G. Dutton, P. Dokopoulos, A. Bakirtzis, J. Stefanakis, A. Gigantidou, P. O'Donnell, D. McCoy, M.J. Fernandes, J.M.S. Cotrim, A.P. Figueira: "MORE CARE" Advice for Secure Operation of Isolated Power Systems with Increased Renewable Energy Penetration & Storage. Proceedings of the European Wind Energy Conference, Copenhagen, Denmark, 2-6 June 2001, pp. 1142-1145, ISBN 3-936338-09-4
205 Durstewitz, M. C. Ensslin, B. Hahn, M. Hoppe-Kilpper: Annual Evaluation of the Scientific Measurement and Evaluation Programme (WMEP). Kassel, 2001
206 Ernst, B., K. Rohrig, H. Regber, Dr. P. Schorn: Managing 3000 MW Wind Power in a Transmission System Operation Center. Proceedings of the European Wind Energy Conference, Copenhagen, Denmark, 2-6 June 2001, pp. 890-893, ISBN 3-936338-09-4
207 Ernst, B., K. Rohrig: Online-Monitoring and Prediction of Wind Power in German Transmission System Operation Centres. Proceedings of the First IEA Joint Action Symposium on Wind Forecasting Techniques, Norrköping, Sweden, December 2002, pp. 125-145. Published by FOI - Swedish Defence Research Agency.
208 Ernst, B., personal communication, 17.09.2003
209 Lange, B., K. Rohrig, F. Schlögl, Ü. Cali, R. Mackensen, and L. Adzic: Lessons learnt from the Development of Wind Power Forecast Systems for six European Transmission System Operators. Proceedings of the EWEC, Brussels (BE), 30 March-3 April 2008 (only abstract available)
210 Möhrlen, C., and J.U. Jørgensen: Verification of Ensemble Prediction Systems for a new market: Wind Energy. ECMWF Special Project Interim Reports 1-4, 2004
211 Jørgensen, J.U., and C. Möhrlen: HONEYMOON - A high resolution numerical wind energy model for on- and offshore forecasting using ensemble predictions. ECMWF Special Project Interim Reports 1-4, 2005

ANEMOS.plus/SafeWind The State of the Art in Short-Term Prediction of Wind PowerA Literature Overview, 2nd Edition
DELIVERABLE REPORT 2011-01-30 99
212 Jørgensen J., McKeogh E., Ó Gallachóir B. & Moehrlen C. Development of a Short Range Ensemble Prediction System for Wind Energy Forecasting in Ireland. Interim Report to SEI under Renewable Energy Research, Development and Demonstration Grant RE/W/03/006. 2005
213 Lang, S., C. Möhrlen, J. Jørgensen, B. Ó Gallachóir, E. McKeogh: Application of a Multi-Scheme Ensemble Prediction System for Wind Power Forecating in Ireland and comparison with validation results from Denmark and Germany. Proceedings of the European Wind Energy Conference and Exhibition EWEC, Athens (GR), 27.2.-2.3. 2006
214 Lang, S., C. Möhrlen, J. Jørgensen, B. Ó Gallachóir, E. McKeogh: Aggregate Forecasting of Wind Power Generation on the Irish Grid using a Multi-Scheme Ensemble Prediction System. Proceedings, Renewable Energy in Maritime Island Climates, 2nd Conference, Dublin (IE), 26–28 April 2006
215 Lang, S., C. Möhrlen, J. Jørgensen, B. Ó Gallachóir, E. McKeogh: Forecasting total wind power generation on the Republic of Ireland Grid with a Multi-Scheme Ensemble Prediction System. Proc. Global Wind Energy Conference GWEC, Adelaide (AU), 2006
216 Pahlow, M., L. Langhans, C. Möhrlen, J. Jørgensen: On the Potential of coupling Renewables into Energy Pools. Zeitschrift f. Energiewirtschaft, 31(1), pp 35-46, 2007
217 Bailey, B., M. C. Brower, and J. Zack: Short-Term Wind Forecasting. Proceedings of the European Wind Energy Conference, Nice, France, 1-5 March 1999, pp. 1062-1065, ISBN 1 902916 00 X; see also http://www.truewind.com/.
218 Zack, J.W., M.C. Brower, B.H. Bailey: Validating of the Forewind Model in Wind Forecasting Applications. Talk on the EUWEC Special Topic Conference Wind Power for the 21st Century, Kassel, Germany, 25-27 Sept 2000
219 Cohn, K.E.: Using SCADA to improve wind farm output forecasts. Proceedings of the AWEA Windpower 2002 Conference, Portland/Oregon (US), 2-5 June 2002, paper 06B_3
220 Vidal, J., A. Tortosa, O. Lacave, J. Aymamí, J. Zack, and D. Meade: Validation of a Wind Power Forecast System - The multi-model NWP ensemble strategy. Proceedings of the European Wind Energy Conference, Warsaw (PL), 20-23 April 2010
221 California Wind Energy Forecasting System Development and Testing, Phase 1: Initial Testing. EPRI Final report 1007338, Jan 2003.
222 Wind Energy Forecasting Applications in Texas and California. EPRI Technical Report 1004038. EPRI, Palo Alto, CA (US), California Energy Commission, Sacramento, CA (US), and U.S. Deparment of Energy, Washington, D.C. (US), 2003
223 Zack, J. W.: A new technique for short-term wind energy forecasting: a rapid update cycle with a physics-based atmospheric model. Proceedings of the Global Wind Power Conference and Exhibition, Chicago (US), 28-31 March 2004
224 González Morales, G.: Sipreólico. Wind power prediction experience. Talk slides accompanied by the paper: Sánchez, I., J. Usaola, O. Ravelo, C. Velasco, J. Domínguez, M.G. Lobo, G. González, F. Soto, B. Díaz-Guerra, M. Alonso: Sipreólico - A wind power prediction system based on flexible combination of dynamic models. Application to the Spanish power system. Proceedings of the First IEA Joint Action Symposium on Wind Forecasting Techniques, Norrköping, Sweden, December 2002, pp.197-214. Published by FOI - Swedish Defence Research Agency.

ANEMOS.plus/SafeWind The State of the Art in Short-Term Prediction of Wind PowerA Literature Overview, 2nd Edition
DELIVERABLE REPORT 2011-01-30 100
225 Sánchez, I., J. Usaola, O. Ravelo, C. Velasco, J. Domínguez, M.G. Lobo, G. González, F. Soto: SIPREÓLICO - A Wind Power Prediction System Based on Flexible Combination of Dynamic Models. Application to the Spanish Power System. Poster on the World Wind Energy Conference in Berlin, Germany, June 2002
226 Sánchez, I.: Short-term prediction of wind energy production. International Journal of Forecasting 22(1), pp. 43-56, 2006
227 Martí Perez, I.: Wind Forecasting Activities. Proceedings of the First IEA Joint Action Symposium on Wind Forecasting Techniques, Norrköping, Sweden, December 2002, pp. 11-20. Published by FOI - Swedish Defence Research Agency.
228 Martí Perez, I., T.S. Nielsen, H. Madsen, J. Navarro, A. Roldán, D. Cabezón, C.G. Barquero: Prediction Models in Complex Terrain. Proceedings of the European Wind Energy Conference, Copenhagen, Denmark, 2-6 June 2001, pp. 875-878, ISBN 3-936338-09-4
229 Martí Perez, I., T.S. Nielsen, H. Madsen, A. Roldán, S. Pérez: Improving Prediction Models in Complex Terrain. Poster P_GWP185 on the Global Windpower Conference and Exhibition, Paris, France, 2-5 April 2002, 4 p. on the Proceedings CDROM
230 Martí, I., M.J. San Isidro, D. Cabezón, Y. Loureiro, J. Villanueva, E. Cantaro, and I. Pérez: Wind power prediction in complex terrain: from the synoptic scale to the local scale. Proceedings of The Science of making Torque from Wind, Delft (NL), 19-21 April 2004, pp. 316-327
231 Gow, G.: Short Term Wind Forecasting in the UK. Proceedings of the First IEA Joint Action Symposium on Wind Forecasting Techniques, Norrköping, Sweden, December 2002, pp. 3-10. Published by FOI - Swedish Defence Research Agency.
232 Westrick, K.: Wind Energy Forecasting in the Pacific Northwestern U.S.. Proceedings of the First IEA Joint Action Symposium on Wind Forecasting Techniques, Norrköping, Sweden, December 2002, pp. 65-74. Published by FOI - Swedish Defence Research Agency.
233 Magnusson, M, and L. Wern: Wind Energy Predictions using CFD and HIRLAM Forecast. Proceedings of the European Wind Energy Conference, Copenhagen, Denmark, 2-6 June 2001, pp. 861-863, ISBN 3-936338-09-4.
234 Magnusson, M.: CFD as tool for wind forecasts. Proceedings of the First IEA Joint Action Symposium on Wind Forecasting Techniques, Norrköping, Sweden, December 2002, pp. 83-91. Published by FOI - Swedish Defence Research Agency.
235 Brand, A.J., J.K. Kok: Wind power by a quarter of the hour. Proceedings of the First IEA Joint Action Symposium on Wind Forecasting Techniques, Norrköping, Sweden, December 2002, pp. 163-169. Published by FOI - Swedish Defence Research Agency.
236 Moon, D., N. Lincoln, D. Christenson, R. Chevallez-Perrier: Support Vector Machine Technology Coupled with Physics-based Modeling for Wind Facility Power Production Forecasting. Proceedings of the Global Wind Power Conference and Exhibition, Chicago (US), 28-31 March 2004
237 Rodrigues, A., J.A. Peças Lopes, P. Miranda, L. Palma, C. Monteiro, R. Bessa, J. Sousa, C. Rodrigues, and J. Matos: EPREV – A Wind Power Forecasting Tool for Portugal. Proceedings of the European Wind Energy Conference EWEC’07, Milan (IT), 2007.
238 Yu, W., A. Plante, S. Dyck, L. Chardon, S. Beauregard, N. Gauthier, R. Benoit, A. Glazer, L-D. Tran, F. Petrucci, A. Forcione, G. Roberge, P. Dionne, J. Choisnard, and S. Antic: Wind Energy

ANEMOS.plus/SafeWind The State of the Art in Short-Term Prediction of Wind PowerA Literature Overview, 2nd Edition
DELIVERABLE REPORT 2011-01-30 101
Forecasting R&D and Demonstration Project in Canada. Talk on the 4th Workshop on Best Practice in the Use of Short-term Prediction of Wind Power, Quebec City (CA), 16 October 2010
239 Salcedo-Sanz, S., A. M.Pérez-Bellido, E.G.Ortiz-García, A.Portilla-Figueras, L. Prieto, F. Correoso: Accurate short-term wind speed prediction by exploiting diversity in input data using banks of artificial neural networks. Neurocomputing 72, pp. 1336-1341, 2009
240 Salcedo-Sanz, S., Á.M. Pérez-Bellido, E.G. Ortiz-Garcıá, A. Portilla-Figueras, L. Prieto, and D. Paredes: Hybridizing the fifth generation mesoscale model with artificial neural networks for short-term wind speed prediction. Renewable Energy 34, pp. 1451–1457, 2009
241 Sideratos, G.N., and N. Hatziargyriou: An Advanced Radial Base Structure for Wind Power Forecasting. International Journal on Power and Energy Systems 12, ACTA Press, November 2008
242 Sideratos, G.N., and N. Hatziargyriou: An Advanced Statistical Method for Wind Power Forecasting. IEEE Transactions on Power Systems 22(1), pp. 258-265, February 2007
243 http://www.naturalpower.com/foresite
244 Thompson, G.: Using the Weather Research and Forecasting (WRF) atmospheric model to predict explicitly the potential for icing. Proceedings of the Winterwind conference, Norrköping (SE), 9 Dec 2008
245 Duncan, T., M. LeBlanc, C. Morgan, and L. Landberg: Understanding Icing Losses and Risk of Ice Trhow at Operating Wind Farms. Proceedings of the Winterwind conference, Norrköping (SE), 9 Dec 2008
246 Durstewitz, M., J. Dobschinski, Z.Khadiri-Yazami: Wind power forecast accuracy under icing conditions - General approach, practical applications and options for considering effects of wind turbine icing. Proceedings of the Winterwind conference, Norrköping (SE), 9 Dec 2008
247 Heimo, A.: COST 727 Action Measuring and forecasting atmospheric icing on structures. Proceedings of the Winterwind conference, Norrköping (SE), 9 Dec 2008
248 Leick, D.: How to harness the power of advanced weather information to improve wind farm decisions. Renewable Energy Focus online article (accessed 20 January 2011)
249 Giebel, G.: Wind Power has a Capacity Credit -A Catalogue of 50+ supporting Studies. WindEng EJournal, windeng.net, 2005
250 Papke, U., A. Petersen, and V. Köhne: Evaluation and Short-Time-Forecast of WEC-Power within the power grid of SCHLESWAG AG. Proceedings of the 1993 ECWEC in Travemünde, 8.-12. March 1993, pp. 770-773, ISBN 0-9521452-0-0
251 Papke, U., and V. Köhne: Pelwin -- ein Windleistungsprognosesystem zur Unterstützung des EVU-Lastverteilers. In 2. Deutsche Windenergie-Konferenz 1994, Tagungsband Teil 1 (DEWEK '94), Wilhelmshaven, Deutschland, 1994. Deutsches Windenergie Institut GmbH (DEWI).
252 Alexiadis, M.C., P.S. Dokopoulos, H.S. Sahsamanoglou: Wind Speed and Power Forecasting Based on Spatial Correlation Models. IEEE Trans. Energy, 14(3) (1999), 836-842.
253 Barbounis, T.G., and J.B. Theocharis: Locally recurrent neural networks for wind speed prediction using spatial correlation. Information Sciences 177, pp. 5775–5797, 2007

ANEMOS.plus/SafeWind The State of the Art in Short-Term Prediction of Wind PowerA Literature Overview, 2nd Edition
DELIVERABLE REPORT 2011-01-30 102
254 Damousis, I.G., M.C. Alexiadis, J.B. Theocharis, and P.S. Dokopoulos: A Fuzzy Model for Wind Speed Prediction and Power Generation in Wind Parks Using Spatial Correlation. IEEE Transactions on Energy Conversion 19(2), June 2004
255 Larson, K. A., T. Gneiting: Advanced Short-Range Wind Energy Forecasting Technologies – Challenges, Solutions, and Validation. Proceedings of the Global Wind Power Conference and Exhibition, Chicago (US), 28-31 March 2004
256 Kristin A. Larson, Kenneth Westrick: Short-term wind forecasting using off-site observations, Wind Energy 9(1-2), pp. 55-62, 2006
257 Tastu, J., P. Pinson, E. Kotwa, H. Madsen, and H.Aa. Nielsen: Spatio-temporal analysis and modeling of short-term wind power forecast errors. Wind Energy 14(1), pp. 43-60, 2011
258 Tastu, J., P. Pinson, and H. Madsen: Multivariate Conditional Parametric Models for a spatio-temporal analysis of short-term wind power forecast errors. Scientific Proceedings of the European Wind Energy Conference, Warsaw (PL), 20-23 April 2010, pp. 77-81
259 Lange, B., A. Wessel, J. Jiang, A. Conz, H. Werner: Improving Very Short-term Forecast of Wind Power by Using an Online Wind Measurement Network. Proceedings of the EWEC, Brussels (BE), 30 March-3 April 2008
260 Wessel, A., J. Jiang, J. Dobschinski, and B. Lange: Improving short-term forecast with online measurements. Proceedings of the European Wind Energy Conference EWEC, Marseille (FR), 16-19 March 2009
261 Wessel, A., J. Dobschinski, and B. Lange: Integration of Offsite Wind Speed Measurements in Shortest-term Wind Power Prediction Systems. 8th International Workshop on Large Scale Integration of Wind Power into Power Systems as well as on Transmission Networks for Offshore Wind Farms, Bremen (DE), 14-15 October 2009
262 René Jursa and Kurt Rohrig: Short-term Wind Power Forecasting using evolutionary algorithms for the automated specification of artificial intelligence models. International Journal of Forecasting 24(4), pp. 694–709, 2008
263 Cutler, N.: Characterising the Uncertainty in Potential Large Rapid Changes in Wind Power generation. PhD Thesis, The University of New South Wales, School of Electrical Engineering and Telecommunications, 290 pp., 2009
264 Cutler, N.: Seeing a bigger picture from NWPs to assist power system management during uncertain periods. Talk on the 2nd Workshop on Best Practice in the Use of Short-term Forecasting, Madrid (ES), 28 May 2008
265 Cutler, N., J. Kepert, H. Outhred, I. MacGill, and M. Kay: Characterising Future Large Changes in Aggregated Wind Power using Numerical Weather Prediction Spatial Fields. Wind Energy 12(6), pp.542-555, 2009
266 Cutler, N., J.D. Kepert, H.R. Outhred, and I.F. MacGill: Characterizing Wind Power Forecast Uncertainty with Numerical Weather Prediction Spatial Fields. Wind Engineering 32(6), pp. 509-524, 2008
267 http://www.enfor.eu/wind_power_prediction_tool_wppt.php

ANEMOS.plus/SafeWind The State of the Art in Short-Term Prediction of Wind PowerA Literature Overview, 2nd Edition
DELIVERABLE REPORT 2011-01-30 103
268 Söder, L.: Simulation of Wind Speed Forecast Errors for Operation Planning of Multi-Area Power Systems. 8th International Conference on Probabilistic Methods Applied to Power Systems, 12 - 16 September 2004, Iowa State University, United States
269 Rohrig, K.: Online Supervision and Prediction of 3000 MW Wind Power. Second International Workshop on Transmission Networks for Offshore Wind Farms, Royal Institute of Technology, Stockholm (SE), March 2001
270 Boone, A.: Simulation of Short-term Wind Speed Forecast Errors using a Multi-variate ARMA(1,1) Time-series Model. Masters thesis at the Kungliga Tekniska Högskolan, Stockholm, 95 p., 2005
271 See eg www.wilmar.risoe.dk and the references linked from there
272 Focken, U., M. Lange, K. Mönnich, H.-P. Waldl, H.G. Beyer, A. Luig: Short-term prediction of the aggregated power output of wind farms – a statistical analysis of the reduction of the prediction error by spatial smoothing effects. J. Wind Eng. Ind. Aerodyn. 90(3), pp. 139-249 (March 2002)
273 Tambke, J., C. Poppinga, L. von Bremen, L. Claveri, M. Lange, U. Focken, J.A.T. Bye and J.-O. Wolff: Advanced Forecast Systems for the Grid Integration of 25GW Offshore Wind Power in Germany. European Wind Energy Conference and Exhibition, Athens (GR), 27.2.-2.3. 2006
274 von Bremen, L., T. Petroliagis, J. Tambke, N. Saleck, and D. Heinemann: Meteorologische Methoden und Modelle zur Erstellung von Windleistungsprognosen - Forschung im EU-Projekt: SafeWind, Deutsche Meteorologentagung, 20-24 Sept 2010, Bonn (DE).
275 Rohrig, K, (ed): Entwicklung eines Rechenmodells zur Windleistungsprognose für das Gebiet des deutschen Verbundnetzes, Abschlussbericht Forschungsvorhaben Nr. 0329915A, gefördert durch Bundesministeriums für Umwelt, Naturschutz und Reaktorsicherheit (BMU). Kassel, Germany, 2005
276 Holttinen, H., P. Saarikivi, S. Repo, J. Ikäheimo, and G. Koreneff: Prediction Errors and Balancing Costs for Wind Power Production in Finland. Global Wind Power Conference, Adelaide, 2006
277 Holttinen, H.: Handling of wind power forecast errors in the Nordic power market. 9th International Conference on Probabilistic Methods Applied to Power Systems, KTH, Stockholm (SE), June 11-15, 2006
278 Nielsen, T.S., H. Madsen, H. Aa. Nielsen, P. Pinson, G. Kariniotakis, N. Siebert, I. Marti, M. Lange, U. Focken, L. von Bremen, P. Louka, G. Kallos, G. Galanis: Short-term Wind Power Forecasting Using Advanced Statistical Methods. European Wind Energy Conference and Exhibition, Athens (GR), 27.2.-2.3. 2006
279 Siebert, N., and G. Kariniotakis: Reference wind farm selection for regional wind power prediction models. European Wind Energy Conference and Exhibition, Athens (GR), 27.2.-2.3. 2006
280 Lang, S.J., and E.J. McKeogh: Forecasting Wind Generation, Uncertainty and Reserve Requirement on the Irish Power System using an Ensemble Prediction System. Wind Engineering 33(5), pp. 433-448, 2009
281 Parkes, J., J. Wasey, A. Tindal, and L. Munoz: Wind Energy Trading Benefits Through Short Term Forecasting. European Wind Energy Conference and Exhibition, Athens (GR), 27.2.-2.3. 2006

ANEMOS.plus/SafeWind The State of the Art in Short-Term Prediction of Wind PowerA Literature Overview, 2nd Edition
DELIVERABLE REPORT 2011-01-30 104
282 Ishihara, T., A. Yamaguchi, T. Ogawa, K. Sakai, and Y. Fujino: An upscaling approach for the regional wind power forecasting. Proceedings of the European Wind Energy Conference EWEC, Milan (IT), 7-10 May 2007
283 Liu, Q., Q. Miao, J.J. Liu, and W. Yang: Solar and Wind Energy Resources and Forecasting. Journal of Renewable and Sustainable Energy 1, 043105, 2009
284 Alberta Electric System Operator: Wind Power Forecasting Pilot Project. 2008 Available http://www.aeso.ca/gridoperations/13825.html.
285 McKay, D.C.: Wind Power Forecasting Pilot Project Part B: The Quantitative Analysis - Final Report. ORTECH Power Report no 70093-4, August 2008
286 Zack, J.: Optimization of Wind Power Production Forecast Performance During Critical Periods for Grid Management. Proceedings of the European Wind Energy Conference EWEC, Milano (IT), 8 May 2007
287 Greaves, B., J. Collins, J. Parkes and A. Tindal: Temporal Forecast Uncertainty for Ramp Events. Wind Engineering 33(4), pp. 309-320, 2009
288 Gordon Reikard: Using temperature and state transitions to forecast wind speed, Wind Energy 11(5), pp.431-443 (2008)
289 Gordon Reikard: Regime-switching models and multiple causal factors in forecasting wind speed, Wind Energy 13(5), pp. 407-418, 2010
290 Bossavy, A., R. Girard and G. Kariniotakis: Forecasting Uncertainty Related to Ramps of Wind Power Production. Scientific Proceedings of the European Wind Energy Conference, Warsaw (PL), 20-23 April 2010, pp. 82-85
291 Pease, J.: Wind Power Forecasts in the US Context. Talk on the 2nd Workshop on Best Practice in the Use of Short-term Forecasting, Madrid (ES), 28 May 2008
292 Pease, J.: Critical Short-term Forecasting Needs for Large and Unscheduled Wind Energy on the BPA System. Talk on the 3rd Workshop on Best Practice in the Use of Short-term Forecasting, Bremen (DE), 13 October 2009
293 Focken, U.: Experiences with Extreme Event Warning and Ramp Forecasting for US Wind Farms. Talk on the 4th Workshop on Best Practice in the Use of Short-term Prediction of Wind Power, Quebec City (CA), 16 October 2010
294 Wilson, N., R. Pyle, D. Atallah, and K. Parks: State-of-the-Art Wind Energy Ramp Event Forecasting Using Atmospheric Observations. Proceedings of the EWEA Annual Event, Brussels (BE), 14-17 March 2011
295 Myers, W., and S. Linden: A turbine hub height wind speed consensus forecasting system. 91st American Meteorological Society Annual Meeting, Seattle (US), 22-27 January 2011
296 Haupt, S.E., G. Wiener, Y. Liu, B. Myers, J. Sun, D. Johnson, and W. Mahoney: A Wind Power Forecasting System to Optimize Power Integration. Proceedings of the ASME 5th International Conference on Energy Sustainability, Washington (US), 7-10 August 2011 (read as pre-conference draft)
297 http://www.alternative-energy-news.info/forecast-wind-data-cell-phone-towers/ (accessed 20 January 2011)

ANEMOS.plus/SafeWind The State of the Art in Short-Term Prediction of Wind PowerA Literature Overview, 2nd Edition
DELIVERABLE REPORT 2011-01-30 105
298 Davy, R.J., M.J. Woods, C.J. Russell and P.A. Coppin: Statisical Downscaling of Wind Variability from Meteorological Fields. Boundary Layer Meteorology 135(1), pp. 161-175, 2010
299 Vincent, C.L., P. Pinson and G. Giebel: Wind fluctuation over the North Sea. International Journal of Climatology. 2010
300 Von Bremen, L., and N. Saleck: Minimizing the risk in offshore wind power integration induced by severe wind power fluctuations. Proceedings of the EAWE Special Topic Conference The Science of Making Torque from Wind, Crete (GR), 2010
301 Juban, J.: State of the Art on Probabilistic Forecasting. Deliverable 1.2b of the ANEMOS.plus project. Available: Anemos-plus.eu.
302 Pierre Pinson, Henrik Aa. Nielsen, Jan K. Møller, Henrik Madsen, George N. Kariniotakis: Non-parametric probabilistic forecasts of wind power: required properties and evaluation, Wind Energy 10(6), pp. 497-516, 2007
303 Pinson, P., P.E. McSharry and H. Madsen: Reliability diagrams for density forecasts of continuous variables: accounting for serial correlation. Quarterly Journal of the Royal Meteorological Society 136(646), pp. 77-90, 2010.
304 Pinson, P., G. Kariniotakis: On-line Assessment of Prediction Risk for Wind Power Production Forecasts. Proceedings of the European Wind Energy Conference and Exhibition, Madrid, Spain, 16-19 June 2003.
305 Pinson, P., and G. Kariniotakis: On-line Adaptation of Confidence Intervals based on Weather Stability for Wind Power Forecasting. Proceedings of the Global Wind Power Conference and Exhibition, Chicago (US), 28-31 March 2004
306 Luig, A., S. Bofinger, H.G. Beyer: Analysis of confidence intervals for the prediction of regional wind power output. Proceedings of the European Wind Energy Conference, Copenhagen, Denmark, 2-6 June 2001, pp. 725-728, ISBN 3-936338-09-4
307 Bofinger, S., A. Luig, H.G. Beyer: Qualification of Wind Power Forecasts. Poster P_GWP093 on the Global Windpower Conference and Exhibition, Paris, France, 2-5 April 2002
308 Lange, M., and D. Heinemann: Accuracy of short term wind power predictions depending on meteorological conditions. Poster P_GWP091 on the Global Windpower Conference and Exhibition, Paris, France, 2-5 April 2002
309 Lange, M., H.-P. Waldl: Assessing the Uncertainty of Wind Power Predictions with Regard to Specific Weather Situations. Proceedings of the European Wind Energy Conference, Copenhagen, Denmark, 2-6 June 2001, pp. 695-698, ISBN 3-936338-09-4. (Note: the paper is misprinted in the proceedings, better get it from physik.uni-oldenburg.de/ehf.)
310 Nielsen, H.Aa.: Analyse og simulering af prædiktionsfejl for vindenergiproduktion ved indmelding til NordPool. Report, IMM, DTU, 20. February 2002
311 Bremnes, J.B.: Probabilistic Wind Power Forecasts Using Local Quantile Regression. Wind Energy 7(1), pp. 47-54, 2004
312 John Bjørnar Bremnes: A comparison of a few statistical models for making quantile wind power forecasts. Wind Energy 9(1-2), pp. 3-11, 2006

ANEMOS.plus/SafeWind The State of the Art in Short-Term Prediction of Wind PowerA Literature Overview, 2nd Edition
DELIVERABLE REPORT 2011-01-30 106
313 Nielsen, H.Aa., H. Madsen, T.S. Nielsen: Using Quantile Regression to Extend an Existing Wind Power Forecasting System with Probabilistic Forecasts. Paper in the scientific track of the European Wind Energy Conference, London (UK), 22-25 November 2004
314 Nielsen, H.Aa., H. Madsen, T.S. Nielsen: Using Quantile Regression to Extend an Existing Wind Power Forecasting System with Probabilistic Forecasts. Wind Energy, 9(1-2), pp. 95-108, 2006
315 Focken, U., M. Lange, H.-P. Waldl: Reduction of Wind Power Production Error by Spatial Smoothing Effects. Proceedings of the European Wind Energy Conference, Copenhagen, Denmark, 2-6 June 2001, pp. 822-825, ISBN 3-936338-09-4
316 Dobschinski, J., A. Wessel, B. Lange, K. Rohrig, L. v. Bremen, M. Saint-Drenan: Estimation of wind power prediction intervals using stochastic methods and artificial intelligence model ensembles. Proceedings of the German Wind Energy Conference DEWEK, Bremen (DE), 2008
317 Giebel, G., L. Landberg, K. Mönnich, H.-P. Waldl: Relative Performance of different Numerical Weather Prediction Models for Short Term Prediction of Wind Energy. Proceedings of the European Wind Energy Conference, Nice, France, 1-5 March 1999, pp. 1078-1081, ISBN 1 902916 00 X
318 Waldl, H.-P., and G. Giebel: The Quality of a 48-Hours Wind Power Forecast Using the German and Danish Weather Prediction Model. Wind Power for the 21st Century, EUWEC Special Topic Conference, Kassel (DE), 25-27 Sept 2000
319 Waldl, H.-P., and G. Giebel: Einfluss des dänischen und des deutschen Wettervorhersagemodells auf die Qualität einer 48-Stunden-Windleistungsprognose. 5. Deutsche Windenergiekonferenz DEWEK 2000, Wilhelmshaven (DE), 7-8 Jun 2000, pp. 145-148
320 G. Giebel, A. Boone: A Comparison of DMI-Hirlam and DWD-Lokalmodell for Short-Term Forecasting. Poster on the European Wind Power Conference and Exhibition, London (UK), 22-25 November 2004
321 Henrik Aa. Nielsen, Torben S. Nielsen, Henrik Madsen, Maria J. San Isidro Pindado, Ignacio Marti: Optimal combination of wind power forecasts, Wind Energy 10(5), pp. 471-482, 2007
322 Landberg, L., G. Giebel, L. Myllerup, J. Badger, T.S. Nielsen, H. Madsen: Poor man’s ensemble forecasting for error estimation. AWEA, Portland/Oregon (US), 2-5 June 2002
323 Pinson, P., H.Aa. Nielsen, H. Madsen, and G. Kariniotakis: Skill forecasting from ensemble predictions of wind power. Applied Energy 86, pp. 1326-1334, 2008
324 Cali, Ü, B. Lange, J. Dobschinski, M. Kurt, C. Möhrlen, and B. Ernst: Artificial neural network based wind power forecasting using a multi-model approach. Proceedings of the 7th International Workshop on Large-Scale Integration of Wind Power and on Transmission Networks for Offshore Wind Farms, Madrid (ES), May 2008
325 Cali, Ü., R. Jursa, M. Kurt, B. Lange, C. Möhrlen, J. Jørgensen, and B. Ernst: Artificial Neural Network based Wind Power Forecasting using a Multi-Scheme Ensemble Prediction Model. Proceedings of the EWEC, Brussels (BE), 30 March-3 April 2008
326 Sánchez, I.: Adaptive combination of forecasts with application to wind energy. International Journal of Forecasting 24(4), pp. 679–693, 2008

ANEMOS.plus/SafeWind The State of the Art in Short-Term Prediction of Wind PowerA Literature Overview, 2nd Edition
DELIVERABLE REPORT 2011-01-30 107
327 Möhrlen, C., J. Jørgensen, K. Sattler, E. McKeogh: Power Predictions in Complex Terrain With an Operational Numerical Weather Prediction Model in Ireland Including Ensemble Forecasting. Poster on the World Wind Energy Conference in Berlin (DE), June 2002
328 Möhrlen, C., and J.U. Jørgensen: Forecasting Wind Power in high Wind Penetration Markets using Multi-Scheme Ensemble Prediction Methods. Proc. German Wind Energy Conference DEWEK, Bremen (DE), 2006
329 Giebel, G., L. Landberg, J. Badger, K. Sattler, H. Feddersen, T.S. Nielsen, H.Aa. Nielsen, H. Madsen: Using Ensemble Forecasting for Wind Power. Paper presented on the European Wind Energy Conference and Exhibition, Madrid (ES), 16-20 June, 2003
330 Giebel, G., J. Badger, L. Landberg, H.Aa. Nielsen, H. Madsen, K. Sattler, H. Feddersen: Wind Power Forecasting Using Ensembles. Paper presented on the Global Wind Power Conference and Exhibition, Chicago (US), 28-31 March 2004
331 Nielsen, H.Aa., T.S. Nielsen, H. Madsen, J. Badger, G. Giebel, L. Landberg, H. Feddersen, K. Sattler: Wind Power Ensemble Forecasting. Paper presented on the Global Wind Power Conference and Exhibition, Chicago (US), 28-31 March 2004
332 Gregor Giebel (ed.), Jake Badger, Lars Landberg, Henrik Aalborg Nielsen, Torben Skov Nielsen, Henrik Madsen, Kai Sattler, Henrik Feddersen, Henrik Vedel, John Tøfting, Lars Kruse, Lars Voulund: Wind Power Prediction using Ensembles. Risø-R-1527, September 2005
333 Nielsen, H.Aa., H. Madsen, T.S. Nielsen, J. Badger, G. Giebel, L. Landberg, K. Sattler, H. Feddersen: Wind Power Ensemble Forecasting Using Wind Speed and Direction Ensembles from ECMWF or NCEP. Project report, Lyngby, 2005
334 Nielsen, H.Aa., D. Yates, H. Madsen, T.S. Nielsen, J. Badger, G. Giebel, L. Landberg, K. Sattler, H. Feddersen: Analysis of the Results of an On-line Wind Power Quantile Forecasting System. Project report, Lyngby, 2005
335 Feddersen, H., and K. Sattler: Verification of wind forecasts for a set of experimental DMI-HIRLAM ensemble experiments. DMI Scientific Report 05-01, 2005
336 Boone, A., G. Giebel, K. Sattler, H. Feddersen: Analysis of HIRLAM including Turbulent Kinetic Energy. Project report, 2005
337 Roulston, M.S., D.T. Kaplan, J. Hardenberg, L.A. Smith: Value of the ECMWF Ensemble Prediction System for Forecasting Wind Energy Production. Proceedings of the European Wind Energy Conference, Copenhagen, Denmark, 2-6 June 2001, pp. 699-702, ISBN 3-936338-09-4
338 Roulston M.S., D.T. Kaplan, J. Hardenberg, and L.A. Smith: Using medium-range weather forecasts to improve the value of wind energy production. Renewable Energy 28, pp. 585–602, 2003
339 Taylor, J.W., P.E. McSharry, and R. Buizza: Wind Power Density Forecasting Using Ensemble Predictions and Time Series Models. IEEE Transactions on Energy Conversion 24, pp. 775-782, 2009
340 Pierre Pinson, Henrik Madsen: Ensemble-based probabilistic forecasting at Horns Rev. Wind Energy 12(2), pp.137-155, 2009
341 Milligan, M.R., A.H. Miller, and F. Chapman: Estimating the Economic Value of Wind Forecasting to Utilities. Presented at Windpower '95, Washington, D.C., March 27-30, 1995. NREL/TP-441-7803. Get it from OSTI.gov.

ANEMOS.plus/SafeWind The State of the Art in Short-Term Prediction of Wind PowerA Literature Overview, 2nd Edition
DELIVERABLE REPORT 2011-01-30 108
342 Hutting, H.K., and J.W. Cleijne: The Price of Large Scale Offshore Wind Energy in a Free Electricity Market. Proceedings of the European Wind Energy Conference, Nice, France, 1-5 March 1999, pp. 399-401, ISBN 1 902916 00 X
343 Nielsen, L.H., P.E. Morthorst, K. Skytte, P.H. Jensen, P. Jørgensen, P.B. Eriksen, A.G. Sørensen, F. Nissen, B. Godske, H. Ravn, C. Søndergreen, K. Stærkind, and J. Havsager: Wind Power and a Liberalised North European Electricity Exchange. Proceedings of the European Wind Energy Conference, Nice (FR), 1-5 March 1999, pp. 379-382, ISBN 1 902916 00 X
344 Sørensen, B. and P. Meibom: Can Wind Power be Sold in a Deregulated Electricity Market? Proceedings of the European Wind Energy Conference, Nice, France, 1-5 March 1999, pp. 375-378, ISBN 1 902916 00 X
345 Kariniotakis G., M. Matos, V. Miranda: Assessment of the benefits from advanced load & wind power forecasting in autonomous power systems. Proceedings of the European Wind Energy Conference, Nice (FR), 1-5 March 1999, pp. 391-394, ISBN 1 902916 00 X.
346 Nogaret, E., G.S. Stavrakakis, G.N. Kariniotakis: An advanced control system for the optimal operation and management of medium size power systems with a large penetration from renewable power sources. Renewable Energy 12(2), pp. 137-149, 1997
347 Gilman, B., M. Cheng, J. Isaac, J. Zack, B. Bailey, M. Brower: The Value of Wind Forecasting to Southern California Edison. Paper 021 on the Conference Proceedings CD-ROM of the AWEA Windpower 2001 conference in Washington, USA, 3-7 June 2001
348 Mylne, K.R.: Maximising the Commercial Value of Wind Energy through Forecasting. Report ETSU W/11/00555/REP on behalf of UK Department of Trade & Industry
349 Bathurst, G., and G. Strbac: The Value of Intermittent Renewable Sources in the First Week of NETA, Tyndall Briefing Note No. 2, 3 April 2001
350 Bathurst, G., J. Weatherhill, G. Strbac: Trading wind generation in short-term energy markets. IEEE Trans. Power Syst. 17, pp. 782-789, Aug. 2002
351 Ensslin, C.: Wind Power Integration into Energy Trading Systems and Power Plant Scheduling Schemes. Proceedings of the European Wind Energy Conference, Copenhagen, Denmark, 2-6 June 2001, pp. 321-324, ISBN 3-936338-09-4
352 Carl Hilger, Eltra, at the Fuel and Energy Technical Association Conference on “Challenges from the rapid expansion of wind power” on 3rd April 2005 (oral statement)
353 Parks, K.: Xcel Energy/NCAR Wind Energy Forecasting System. Talk on the UWIG Forecasting Workshop, Albany (US), 23-24 February 2011
354 Keith Parks, personal communication, 9 May 2011
355 ILEX Energy Consulting: Quantifying the system costs of additional renewable in 2020. A report to the Department of Trade & Industry, October 2002
356 Barthelmie, R.J., F. Murray and S.C. Pryor: The economic benefit of short-term forecasting for wind energy in the UK electricity market. Energy Policy, 36(5), pp. 1687-1696, 2008.
357 Sustainable Energy Ireland: Operating Reserve Requirements as Wind Power Penetration Increases In the Irish Electricity System. Report, Aug. 2004

ANEMOS.plus/SafeWind The State of the Art in Short-Term Prediction of Wind PowerA Literature Overview, 2nd Edition
DELIVERABLE REPORT 2011-01-30 109
358 Meibom, P., R. Barth, B. Hasche, H. Brand, C. Weber, and H. Ravn: All Island Grid Study – Results concerning system operation. Proceedings of the EWEC, Brussels (BE), 30 March-3 April 2008
359 Usaola, J., O. Ravelo, G. Gonzalez, F. Soto, C. Davila, B. Diaz-Guerra: Benefits for wind energy in electricity markets form using short term wind power prediction tools: a simulation study. Wind Engineering, 28(1), pp. 119-128, 2004
360 Pinson, P., C. Chevallier, G. Kariniotakis: Trading wind generation with short-term probabilistic forecasts of wind power. IEEE Trans. on Power Systems 22(3), pp. 1148-1156, 2007
361 Morales JM, A.J. Conejo, J. Perez-Ruiz: Short-term trading for a wind power producer. IEEE Transactions on Power Systems 25(1), pp. 554–564, 2010
362 Brand, A.J., and J.K. Kok: Aanbodvoospeller duurzame energie – Deel 2: Korte-termijn prognose van windvermogen. ECN-C-03-049, June 2003
363 Hochmuth, F.: Wind and Imbalance Management. Talk on the Workshop on Best Practice in the Use of Short-term Forecasting, Delft (NL), 25 October 2006
364 Moesgaard, R., and P.E. Morthorst: The effect of wind power on spot market prices. Proceedings of the EWEC, Brussels (BE), 30 March-3 April 2008
365 Sensfuß, F., and M. Ragwitz: Analyse des Preiseffektes der Stromerzeugung aus erneuerbaren Energien auf die Börsenpreise im deutschen Stromhandel -Analyse für das Jahr 2006. Gutachten im Rahmen von Beratungsleistungen für das Bundesministerium für Umwelt, Naturschutz und Reaktorsicherheit (BMU). Fraunhofer ISI, Karlsruhe 2007
366 Asociación Empresarial Eólica (Spanish Wind Power Association): Eólica 2006. (in Spanish and English)
367 Asociación Empresarial Eólica (Spanish Wind Power Association): Eólica 2008. (in Spanish)
368 Jónsson, T.: Forecasting of Electricity Prices Accounting for Wind Power Predictions. Masters Thesis, IMM-DTU, Kongens Lyngby 2008
369 Jonsson, T., P. Pinson, H. Madsen: On the market impact of wind energy forecasts. Energy Economics 32(2), pp. 313-320, 2010
370 Hasche, B., R. Barth, and Derk Jan Swider: Effects of improved wind forecasts on operational costs in the German electricity system. Paper, EcoMod
371 Dobschinski, J., E. De Pascalis, A. Wessel, L.v. Bremen, B. Lange, K. Rohrig, Y-M. Saint Drenan: The potential of advanced shortest-term forecasts and dynamic prediction intervals for reducing the wind power induced reserve requirements. Scientific Proceedings of the European Wind Power Conference, Warsaw (PL), 20-23 April 2010, pp. 177-182
372 Söder, L.: Modelling of wind power foredcast uncertainty. Project report for the Project 506 312-1 Integration of wind power KTH. Department of Electric Power Systems, Royal Institute of Technology, Stockholm (SE), 1994
373 Morthorst, P.E., J.M. Coulondre, S.T. Schröder, P. Meibom: OPTIMATE D3.1 Assumptions on accuracy of wind power to be considered at short and long term horizons. Project report, Risø DTU, 2010

ANEMOS.plus/SafeWind The State of the Art in Short-Term Prediction of Wind PowerA Literature Overview, 2nd Edition
DELIVERABLE REPORT 2011-01-30 110
374 Pierre Pinson, Henrik Madsen, Henrik Aa. Nielsen, George Papaefthymiou, Bernd Klöckl: From probabilistic forecasts to statistical scenarios of short-term wind power production. Wind Energy 12(1), pp. 51-62, 2009
375 Madeleine Gibescu, Arno J. Brand, Wil L. Kling: Estimation of variability and predictability of large-scale wind energy in The Netherlands, Wind Energy 12(3), pp. 241-260, 2009
376 Holttinen, H., T.S. Nielsen, G. Giebel: Wind energy in the liberalised market - forecast errors in a day-ahead market compared to a more flexible market mechanism. Proceedings of the First IEA Joint Action Symposium on Wind Forecasting Techniques, Norrköping, Sweden, December 2002, pp. 171-181. Published by FOI - Swedish Defence Research Agency.
377 Cali, Ü, M. Speckmann and Y.-M. Saint-Drenan: Energy Economical Benefits of Wind Power Forecasting and Utilisation of Intraday Trading. Proceedings of the EWEC, Marseille (FR), 16-19 March 2009
378 Klein, R., and R.A. Pielke Jr.: Bad Weather? Then Sue the Weatherman! Part I: Legal Liability for Public Sector Forecasts. Bulletin of the American Meteorological Society, Vol 83(12), pp. 1791–1799, Dec 2002
379 Klein, R., and R.A. Pielke Jr.: Bad Weather? Then Sue the Weatherman! Part II: Legal Liability for Private Sector Forecasts. Bulletin of the American Meteorological Society, Vol 83(12), pp. 1801–1807, Dec 2002
380 Schwartz, M.N, and B.H. Bailey: Wind Forecasting Objectives for Utility Schedulers and Energy Traders. Presented at Windpower '98, Bakersfield, CA, April 27-May 1, 1998. NREL/CP-500-24680. Available from OSTI.gov .
381 Coppin, P. and J. Katzfey: The Feasibility of Wind Power Production Forecasting in the Australian Context. Report to NEMMCO, December 2003. To be downloaded from http://www.nemmco.com.au/operating/intermittent/260-0006.pdf.
382 Zavadil, R., N. Miller, G. Van Knowe, J. Zack, R. Piwko, and G. Jordan: ISO-NE Wind Integration Study – Technical Requirements for Wind Generation Interconnection and Integration. November 2009
383 Giebel, G., and O. Gehrke: Adding Forecasts to the IEC 61400-25 Communication Standard. Proceedings of the 8th International Workshop on Large Scale Integration of Wind Power and on Transmission Networks for Offshore Wind Farms, Bremen (DE), 14/15 October 2009, and report for the POW’WOW project
384 Bessa, R.J., V. Miranda, A. Botterud, J. Wang: ‘Good’ or ‘bad’ wind power forecasts: a relative concept. Wind Energy, In Press, 2010
385 Matos, M.A., and R.J. Bessa: Setting the operating reserve using probabilistic wind power forecasts. IEEE Transactions on Power Systems, In Press, 2010
386 Pinson, P., & the SafeWind Consortium: Defining a catalogue of complex to extreme events. Proceedings of the European Wind Energy Conference, Warsaw (PL), 20-23 April 2010