Embed Size (px)
Citation preview

SAFETY PERFORMANCE FUNCTIONS FOR
INTERSECTIONS ON HIGHWAYS MAINTAINED
BY THE VIRGINIA DEPARTMENT
OF TRANSPORTATION
FINALCONTRACT REPORT
VTRC 11-CR1
httpwwwvirginiadotorgvtrcmainonline_reportspdf11-cr1pdf
NICHOLAS J GARBER PhD PEProfessor of Civil amp Environmental Engineering
GRISELLE RIVERAGraduate Research Assistant
Department of Civil amp Environmental EngineeringUniversity of Virginia
Standard Title Page - Report on Federally Funded Project 1 Report No 2 Government Accession No 3 Recipientrsquos Catalog No FHWAVTRC 11-CR1
4 Title and Subtitle 5 Report Date October 2010 6 Performing Organization Code
Safety Performance Functions for Intersections on Highways Maintained by the Virginia Department of Transportation
7 Author(s) Nicholas J Garber PhD and Griselle Rivera
8 Performing Organization Report No VTRC 11-CR1
10 Work Unit No (TRAIS) 11 Contract or Grant No
9 Performing Organization and Address University of Virginia Department of Civil amp Environmental Engineering PO Box 400742 351 McCormick Road Charlottesville VA 22903 94412 12 Sponsoring Agenciesrsquo Name and Address 13 Type of Report and Period Covered
Final Contract 14 Sponsoring Agency Code
Virginia Department of Transportation 1401 E Broad Street Richmond VA 23219
Federal Highway Administration 400 North 8th Street Room 750 Richmond VA 23219-4825
15 Supplementary Notes 16 Abstract
In recent years significant effort and money have been invested through research and implemented safety projects to enhance highway safety in Virginia However there is still substantial room for improvement in both crash frequency and severity As there are limits in the available funds for safety improvements it is crucial that allocated resources for safety improvement be spent at highway locations that will result in the maximum safety benefits In addition intersection crashes play a significant role in the safety conditions in Virginia For example crashes at intersections in Virginia for the period 2003 through 2007 account for 438 of all crashes and 26 of fatal crashes Therefore identifying intersections for safety improvements that will give the highest potential for crash reduction when appropriate safety countermeasures are implemented will have a significant impact on the overall safety performance of roads in Virginia
The Federal Highway Administration (FHWA) has developed a procedure for identifying highway locations that have
the highest potential for crash reduction (ITT Corporation 2008) A critical component of this method is the use of safety performance functions (SPFs) to determine the potential for crash reductions at a location An SPF is a mathematical relationship (model) between frequency of crashes by severity and the most significant causal factors on a specific highway Although the SafetyAnalyst Userrsquos Manual presents several SPFs for intersections these were developed using data from Minnesota FHWA also suggested that if feasible each state should develop its own SPFs based on crash and traffic volume data from the state as the SPFs that are based on Minnesota data may not adequately represent the crash characteristics in all states SPFs for intersections in Virginia were developed using the annual average daily traffic as the most significant causal factor emulating the SPFs currently suggested by SafetyAnalyst The SPFs were developed for both total crashes and combined fatal plus injury crashes through generalized linear modeling using a negative binomial distribution Models were also developed for urban and rural intersections separately and in order to account for the different topographies in Virginia SPFs were also developed for three regions Northern Western and Eastern
This report covers Phases I and II of the study which includes urban and rural intersections maintained by VDOT Statistical comparisons of the models based on Minnesota data with those based on the Virginia data showed that the specific models developed for Virginia fit the Virginia crash data better The report recommends that VDOTrsquos Traffic Engineering Division use the SPFs developed for Virginia and the specific regional SPFs suggested in this report to prioritize the locations in need of safety improvement 17 Key Words 18 Distribution Statement Safety Performance Functions Intersections VDOT-Maintained Highways
No restrictions This document is available to the public through NTIS Springfield VA 22161
19 Security Classif (of this report) 20 Security Classif (of this page) 21 No of Pages 22 Price Unclassified Unclassified 61
Form DOT F 17007 (8-72) Reproduction of completed page authorized
FINAL CONTRACT REPORT
SAFETY PERFORMANCE FUNCTIONS FOR INTERSECTIONS ON HIGHWAYS MAINTAINED BY THE VIRGINIA DEPARTMENT OF TRANSPORTATION
Nicholas J Garber PhD PE Professor of Civil amp Environmental Engineering
Griselle Rivera
Graduate Research Assistant
Department of Civil amp Environmental Engineering University of Virginia
Project Manager Catherine C McGhee PE Virginia Transportation Research Council
In Cooperation with the US Department of Transportation Federal Highway Administration
Contract Research Sponsored by
the Virginia Transportation Research Council (A partnership of the Virginia Department of Transportation
and the University of Virginia since 1948)
Charlottesville Virginia
October 2010 VTRC 11-CR1
ii
DISCLAIMER
The project that was the subject of this report was done under contract for the Virginia Department of Transportation Virginia Transportation Research Council The contents of this report reflect the views of the authors who are responsible for the facts and the accuracy of the data presented herein The contents do not necessarily reflect the official views or policies of the Virginia Department of Transportation the Commonwealth Transportation Board or the Federal Highway Administration This report does not constitute a standard specification or regulation Any inclusion of manufacturer names trade names or trademarks was for identification purposes only and is not to be considered an endorsement
Each contract report is peer reviewed and accepted for publication by Research Council staff with expertise in related technical areas Final editing and proof reading of the report are performed by the contractor
Copyright 2010 by the Commonwealth of Virginia All rights reserved
iii
ABSTRACT
In recent years significant effort and money have been invested through research and implemented safety projects to enhance highway safety in Virginia However there is still substantial room for improvement in both crash frequency and severity As there are limits in the available funds for safety improvements it is crucial that allocated resources for safety improvement be spent at highway locations that will result in the maximum safety benefits In addition intersection crashes play a significant role in the safety conditions in Virginia For example crashes at intersections in Virginia for the period 2003 through 2007 account for 438 of all crashes and 26 of fatal crashes Therefore identifying intersections for safety improvements that will give the highest potential for crash reduction when appropriate safety countermeasures are implemented will have a significant impact on the overall safety performance of roads in Virginia
The Federal Highway Administration (FHWA) has developed a procedure for identifying
highway locations that have the highest potential for crash reduction (ITT Corporation 2008) A critical component of this method is the use of safety performance functions (SPFs) to determine the potential for crash reductions at a location An SPF is a mathematical relationship (model) between frequency of crashes by severity and the most significant causal factors on a specific highway Although the SafetyAnalyst Userrsquos Manual presents several SPFs for intersections these were developed using data from Minnesota FHWA also suggested that if feasible each state should develop its own SPFs based on crash and traffic volume data from the state as the SPFs that are based on Minnesota data may not adequately represent the crash characteristics in all states SPFs for intersections in Virginia were developed using the annual average daily traffic as the most significant causal factor emulating the SPFs currently suggested by SafetyAnalyst The SPFs were developed for both total crashes and combined fatal plus injury crashes through generalized linear modeling using a negative binomial distribution Models were also developed for urban and rural intersections separately and in order to account for the different topographies in Virginia SPFs were also developed for three regions Northern Western and Eastern
This report covers Phases I and II of the study which includes urban and rural
intersections maintained by VDOT Statistical comparisons of the models based on Minnesota data with those based on the Virginia data showed that the specific models developed for Virginia fit the Virginia crash data better The report recommends that VDOTrsquos Traffic Engineering Division use the SPFs developed for Virginia and the specific regional SPFs suggested in this report to prioritize the locations in need of safety improvement
FINAL CONTRACT REPORT
SAFETY PERFORMANCE FUNCTIONS FOR INTERSECTIONS ON HIGHWAYS MAINTAINED BY THE VIRGINIA DEPARTMENT OF TRANSPORTATION
Nicholas J Garber PhD PE
Professor of Civil amp Environmental Engineering
Griselle Rivera Graduate Research Assistant
Department of Civil amp Environmental Engineering
University of Virginia
INTRODUCTION
The Virginia Department of Transportation (VDOT) is continually identifying ways to
enhance the achievement of Virginiarsquos broad vision statement to make Virginiarsquos surface transportation system the safest in the nation by 2025 (Virginia Surface Transportation Safety Executive Committee 2006) Reductions in crash occurrence and severity at intersections will significantly contribute to the overall safety improvements in Virginia as intersection crashes form a large proportion of crashes that occur on Virginiarsquos surface transportation system For example Table 1 shows that for 2003 through 2007 intersection crashes on VDOT-maintained roads accounted for about 44 of all crashes and Table 2 shows that about 26 of fatal crashes occurred at intersections
In addition because of limited funds it is crucial that allocated resources for safety improvement be spent at highway locations that will result in the maximum safety benefits The Federal Highway Administration (FHWA) has developed a prioritization methodology for safety improvements using the empirical Bayes (EB) method This method prioritizes sites for safety improvement to obtain the greatest safety benefits (ITT Corporation 2008) This procedure requires the use of safety performance functions (SPFs) An SPF relates the frequency of crashes by severity with the most significant causal factors on a specific type of road For example Figure 1 shows a schematic graph of an SPF for a highway segment to demonstrate how it is used in site prioritization
Table 1 Total and Intersection Crashes For 2003 Through 2007
Year Total Crashes Intersection
Crashes Proportion
()
2003 94817 41116 434 2004 95063 42042 442 2005 96066 42064 438 2006 93732 41714 445 2007 89394 38695 433
TOTAL 469072 205631 438
2
Table 2 Total Fatal and Intersection Fatal Crashes for 2003 Through 2007
Year Total Fatal
Crashes Intersection
Fatal Crashes Proportion
()
2003 726 216 298 2004 723 188 260 2005 752 188 250 2006 722 193 267 2007 778 184 237
TOTAL 3701 969 262
Figure 1 Example of a Safety Performance Function (SPF)
SPFs are developed for different roadway segments and intersection configurations
Currently the SPFs suggested by FHWA use only annual average daily traffic (AADT) as the most significant causal factor For example an intersection SPF gives the predicted number of crashes per year for given AADTs on the major and minor approaches SPFs aid the transportation planner to identify better where to expend limited staff resources on detailed assessments to determine feasible and effective treatments AADT-driven SPFs are practical for network screening Adding more independent variables beyond AADT may be too labor intensive The corresponding EB-adjusted long-term number of crashes can be computed from the actual observed crashes and the SPF-predicted number of crashes for the given AADT As it can be seen in Figure 1 the difference between the EB-adjusted long-term number of crashes and the SPF-predicted number of crashes gives the potential for safety improvement (PSI) The PSI can be better described as the potential for intersection sites to be upgraded or repaired by reducing crashes and improving safety if appropriate countermeasures are applied to these sites This can be used to develop a priority list of the specific sites or intersections where detailed assessments to determine feasible and effective treatment can be undertaken Sites that have a
3
greater PSI are given a higher prioritization when all selected sites are ranked in order to determine which sites should receive prompt attention
SafetyAnalyst provides a set of state-of-the art software tools for use in the decision-
making process to identify safety needs and develop a program for site-specific safety improvement projects SafetyAnalyst also plays an important role because it helps make sure that highway agencies receive the greatest possible safety benefit from every dollar spent toward safety modifications (FHWA 2010) FHWA-suggested SPFs for intersections are however based on data from Minnesota and it has been recommended that individual states develop SPFs based on their own crash and AADT data (Harwood et al 2004) The development of SPFs for Virginia is of great importance when safety improvement is being considered Because of the important role SPFs play in the software tools in SafetyAnalyst it is essential at least to test how well the FHWA-suggested SPFs fit the Virginia data and if necessary to develop specific SPFs for Virginia
PURPOSE AND SCOPE
The purpose of this study was to investigate the extent to which the FHWA-suggested
intersection SPFs which were based on Minnesota data were transferable to Virginia and if necessary to develop Virginia-specific SPFs using crash and corresponding AADTs for intersection sites in Virginia The SPFs for this study include those for total crashes and combined fatal and injury (FI) crashes with different configurations such as four-leg and three-leg intersections signalized intersections and unsignalized intersections or urban and rural locations
The scope was limited to intersection types on VDOT-maintained roads for which
appropriate and adequate data were available This report gives the results obtained for urban and rural intersections The objectives were as follows
1 Evaluate the transferability of the FHWA-suggested SPFs to Virginia 2 If necessary develop SPFs for different intersection types that are suitable for use in
Virginia 3 Identify some of the intersections that have a higher than expected number of crashes
Crashes related to two-lane roads were investigated in a separate study (Garber et al
2010) It is anticipated that the results obtained from both studies will produce a set of SPFs that can be applied to Virginia and be used to prioritize those two-lane segments and intersections that are in need of safety improvements thereby improving the transportation planning process
4
METHODS
Ten tasks were performed to achieve the study objectives 1 Conduct a literature review 2 Select study sites 3 Extract crash data 4 Extract AADT data 5 Evaluate the transferability to Virginia of the suggested Minnesota SPFs 6 Develop specific SPFs for Virginia 7 Evaluate the Virginia SPFs developed 8 Determine the appropriate number of SPFs for Virginia through a pruning process 9 Prioritize sites based on potential for crash reduction 10 Evaluate benefits and implementation prospects
Literature Review
Recent publications related to the development and evaluation of SPFs for different highway systems were identified and reviewed so as to identify information of relevance to this study Sources used were the Transportation Research Information System (TRIS) the VDOT Research Library and the University of Virginia libraries
Selection of Study Sites
The research team in consultation with staff from VDOTrsquos Traffic Engineering Division
(TED) initially selected 21112 intersections under the jurisdiction of VDOT for the study These included all intersections for which the location was properly identified by an intersection node and for which geometric characteristics remained the same throughout the study period of 2003 through 2007 The required geometric traffic and crash data for each site were then extracted from the relevant databases The data were obtained primarily from the Highway Traffic Records Information System (HTRIS) HTRIS is a comprehensive Oracle database system which interrelates and consolidates Virginiarsquos highway and traffic information used for internal management and reporting VDOT maintains detailed records on current and historical roadway crash and traffic information in HTRIS For this reason only VDOT-maintained roads were used for analysis This database system contains multiple subsystems three of which were used to extract data for this study roadway inventory (RDI) for intersection configuration and type of control accident (ACC) for crash counts and highway performance monitoring system (HPMS) for AADTs Using the available data each intersection was classified based on the area type (urban or rural) the traffic control system (signalized stop control or yield control) and the configuration (number of approaches) Intersections for which all the data requirements for proper classification were not available were deleted from the list of study sites
The classification of an intersection as urban or rural was based on VDOTrsquos classification
of each approach route Intersections with all approaches designated as rural were classified as
5
rural and those with all approaches designated as urban were classified as urban Intersections with urban and rural approaches were removed from the list of study sites to minimize the uncertainty A data quality analysis was also performed to ascertain that the AADT values for all approaches of each intersection and for each year of the study period were available Intersections with incomplete data were removed from the study including yield all-way stop and intersections with five approaches This resulted in 18356 intersections classified as urban or rural as shown in Table 3
Virginia is divided into five operational regions as shown in Figure 2 After consultation
with VDOT and the technical review panel the different topographical characteristics in Virginia were then used to group the intersections into three regional groups as Northern Western and Eastern The Northern region is composed of intersections in Northern Virginia and surrounding counties the Western region is considered to have a mountainous terrain and the Eastern region is considered to have rolling to flat terrain Table 3 also shows the specific districts and counties in each of the three regions used in this study This regional classification helped to partially account for different characteristics that are encountered throughout the state
Table 3 Urban and Rural Classification Operational Region Districts Urban Rural Total
Northern (No 1)
District 9 (NOVA) + Culpeper (023) Fauquier County (030) King George County (048) Madison County (056) Orange County (068) Rappahannock County (078) Spotsylvania (088) Stafford County (089)
4620 596 5216
Western (No 10)
District 1 (Bristol) District 2 (Salem) District 3 (Lynchburg) District 8 (Staunton) + Albemarle County (002) Fluvanna County (032) Greene County (039) Louisa County (054)
1197 6706 7903
Eastern (No 100)
District 4 (Richmond) and District 5 (Hampton Roads) + Caroline County (016) Essex County (028) Gloucester County (036) King amp Queen County (049) King William (050) Lancaster County (051) Mathews County (057) Middlesex County (059) Northumberland County (066) Richmond County (079) Westmoreland County (096)
2193 3044 5237
Total 8010 10346 18356 Proportion () 4364 5636 100 Alternative method of identifying regions for easy application of the SAS code No 1 = Northern region No 10 = Western region No 100 = Eastern region
6
Figure 2 Virginia Operational Regions (Cogburn 2007)
The study considered urban and rural intersections with urban consisting of 8010 intersections and rural consisting of 10346 intersections as shown in Table 4
The intersections were also divided by their configuration (number of approaches) and
the type of traffic control (signalized or minor stop control) The number of urban intersection sites for each category is shown in Table 5 and that for rural intersections in Table 6 The total number of rural four-leg signalized and rural three-leg signalized sites is much lower than that for the urban signalized intersections However this is expected as a much lower percentage of rural intersections are signalized In addition all-way stop intersections were excluded because of the low number at the time of the study
Table 4 Proportion of Urban and Rural Sites by Region
Operational Region Urban Proportion () Rural Proportion () Northern 4620 5768 596 5760 Western 1197 1494 6706 64817 Eastern 2193 2738 3044 29423 TOTAL 8010 100 10346 100
Table 5 Distribution of Urban Sites by Geometric Configuration
Operational Region Urban 4-leg Signalized
Urban 4-leg 2-Way Stop
Urban 3-leg Signalized
Urban 3-leg Minor Stop Total
Northern 371 766 497 2986 4620 Western 53 153 137 854 1197 Eastern 144 320 202 1527 2193 TOTAL 568 1239 836 5367 8010 Proportion () 709 1547 1044 6700 100
7
Table 6 Distribution of Rural Sites by Geometric Configuration
Operational Region Rural 4-leg Signalized
Rural 4-leg 2-Way Stop
Rural 3-leg Signalized
Rural 3-leg Minor Stop Total
Northern 19 67 13 497 596 Western 90 894 117 5605 6706 Eastern 73 609 53 2309 3044 TOTAL 182 1570 183 8411 10346 Proportion () 176 1517 177 8130 100
Crash and Operational Data Collection
As previously discussed HTRIS serves as a centralized warehouse of traffic and roadway data for Virginia and is composed of various subsystems that carry distinct data RDI ACC and HPMS were the three subsystems used to extract the necessary data for the study
VDOTrsquos TED staff extracted the crash data by using the ACC database for the years
2003 through 2007 The ACC database is composed of data derived from the crash report forms (DMV FR300) that are filled out by police officers and include data such as driverrsquos actions driver characteristics environmental conditions collision type and crash severity among other factors The database developed for this study included total fatal injury and property damage only (PDO) (property damage greater than $1000) crashes that occurred within a distance of 250 feet or 0047 mile of the intersection which matches the procedure used to develop the suggested SPFs in SafetyAnalyst The RDI database was used to identify the intersection ID or node number for the urban and rural intersection sites that had the same geometric conditions throughout the 5 years selected for the study
A Structured Query Language (SQL) program was developed for retrieving and
formatting the required data for the analysis This query specified the intersection node configuration approach volumes urbanrural classification crashes and traffic control device for each year of the study period The Statistical Analysis Software SAS (913) was then used to format the data in a way suitable for the analysis (SAS Institute Inc 2009)
Annual Average Daily Traffic Selection
The major and minor AADTs were used as the independent variables in developing the SPFs for intersections in Virginia in accordance with the SPFs developed for SafetyAnalyst (Harwood et al 2004) It was therefore necessary to identify the major and minor approaches at each intersection In determining the major and minor AADTs it was recommended by VDOT that for four-leg approaches the major entering volume should be the sum of the two highest approach volumes and the minor entering volume the sum of the two lowest approach volumes For three-leg approaches the major entering volume was the sum of the two highest approach volumes The highway performance monitoring system database was used to obtain the AADTs for the selected study sites
8
Evaluation of Recommended Minnesota SPFs
Once all of the necessary data were obtained for each of the study sites the SafetyAnalyst-recommended SPFs which are based on data for intersections in Minnesota were tested to determine how well they fit the Virginia data Both graphical and statistical methods were used to conduct these tests The graphical method consisted of a visual inspection of the spread of the Virginia data for a specific configuration of intersection and the actual crashes of a given severity plotted with the resultant curve from using the same Virginia database and the corresponding recommended Minnesota SPF The statistical test consisted of computing the Freeman-Tukey RFT 2 coefficients for the recommended SPFs using the appropriate Virginia data The RFT
2 coefficient was used as this was the statistical parameter used to represent the goodness of fit (ITT Corporation 2008) in developing the SafetyAnalyst-recommended SPFs Equations 1 2 and 3 show how the data were transformed to compute the RFT
2 (Fridstroslashm et al 1995) fi = ( yi )05 + ( yi +1 )05 (Eq 1) ecirci = fi ndash ( 4 times ŷi + 1 )05 (Eq 2) RFT
2 = 1 ndash sumiecirci2 sumi( fi ndash fm )2 (Eq 3)
where fi = Freeman-Tukey transformation statistic yi = observed data at site i ecirci = residual at site i ŷi = modeled (predicted) value at site i fm= mean of the transformation statistic (fi) across all sites of the same configuration and urbanrural classification RFT
2 = Freeman-Tukey R2
Developing Virginia-Specific SPFs
The format of the specific SPFs developed for Virginia is the same as that in the
SafetyAnalyst manual and given as
1 2k e x MajAADT x MinAADTβ βα= (Eq 4) where
k = predicted crash frequency per intersection per year MajAADT = AADT on the major road (vehday) MinAADT = AADT on the minor road (vehday) α = intercept
9
β1 = coefficient of major AADT β2 = coefficient of minor AADT
In developing the SPFs a negative binomial (NB) distribution for the crash data was
used as preliminary analysis showed that the data fit the NB distribution The form of the data used to develop the SPFs can be either the panel or cross-sectional (collapsed) format According to Kweon and Lim (2010) the panel format uses original panel data which consist of assembling several years of data over the same intersection and the cross-sectional models use pseudondashcross-sectional data which are data converted or rearranged from the panel set The difference between the two types of models obtained is that the model based on the panel data form takes advantage of the characteristics of the panel data by positioning a predefined correlation structure on reciprocated measures over years at the same time whereas the model based on the cross-sectional form uses the data created by collapsing the multi-year panel data into apparently a single-year panel data The crash data were divided into the estimation and validation portions Seventy percent was selected randomly and used as the estimation data to develop the SPFs and the remaining 30 was used as the evaluation data
An estimation of acceptable values was made for the regression coefficients and the
dispersion parameter when developing the SPFs for the EB method in SafetyAnalyst The regression coefficients are critical for the comparison of different SPFs The dispersion parameter (d) is important when using the EB method in SafetyAnalyst because it plays an integral function in computing the EB weight that influences the estimate of the EB long-term predicted crashes When determining the dispersion parameter from SAS for the urban four-leg signalized intersections the values obtained were d = 02223 for the panel data and d = 02216 for the collapsed data but when determining the values for the urban four-leg two-way stop intersections the values calculated were d = 04284 for panel data and d = 02518 for collapsed data In the urban four-leg two-way stop intersections a significant difference in the d values was observed which led to the choice of panel data for the modeling as they would be more reliable than the collapsed data By looking at the obtained values it can be appreciated that the collapsed model underestimates the dispersion which will eventually cause the EB value to inflate therefore leading to a biased report for the collapsed model
Generalized linear modeling (GLM) was used to create a correlation between the intersection crashes for the 5 years chosen for analysis and the major and minor approach volumes For the statistical modeling SAS was employed (SAS Institute Inc 2009) This software includes the GENMOD procedure and the equation used is the same as given in Equation 5 The GENMOD procedure gives an output of generalized estimating equations (GEE) parameter estimates which are the ones used to develop the Virginia SPFs
1 2exp( )it itk MajAADT MajAADTα β β ε= + + + (Eq 5) where i = intersection index (i = 1hellip N) t = severity index (t = TOT [total crashes] FI [fatal + injury crashes] PDO [property damage only])
10
α = intercept β1 = coefficient of major AADT β2 = coefficient of minor AADT
itk = dependent variable at intersection i and severity t (crashesyr) νit = random error exp (νit) Gamma (θ θ) εit = random (residual) error in GEE
The random errors presented in this equation have the function of not letting the β values or coefficients become biased
Evaluation of Virginia-Specific SPFs
Several statistical parameters were used to assess how well the Virginia SPFs fit the data The parameters used and suggested by Washington et al (2005) were the mean prediction bias (MPB) the mean absolute deviation (MAD) the mean square error (MSE) the mean squared prediction error (MSPE) the Pearsonrsquos product moment correlation coefficients between observed and predicted crash frequencies (used for both validation and estimation data) dispersion parameters and the Freeman Tukey RFT
2 coefficients computed from Equation 3 To test the fit of the SPFs the 70 estimation data set was used to calculate the MSE the Pearsonrsquos product moment correlation coefficients the R2 and the R2
FT To test the transferability of the SPFs the 30 validation data set was used to compute the MPB MAD and the MSPE The expressions used to determine these coefficients are given in Equations 6 through 10
( )2
iin
1i
nYYMPB
2 minussum= = (Eq 6)
2
n
1i ii
n
YYMAD
2sum=minus
= (Eq 7)
( )
pnYY
MSE1
n
1i
2
ii2
minus
minus= sum = (Eq 8)
( )
2
n
1i
2
ii
nYY
MSPE2sum=
minus= (Eq 9)
where p = degrees of freedom i = intersection index Yi = observed crash frequency at intersection i Ŷi = predicted crash frequency at intersection i
11
n2 = validation data sample size 30 n1 = estimation data sample size 70
(Eq 10) where
_
1Y = average of observed crashes per intersections _
2Y = average of predicted crashes per intersections Yi1 = observed values at intersection i Y i2 = predicted values at intersection i
It should be noted that when values obtained from the MPB MAD MSE and MSPE
formulas are close to 0 it indicates a good fit or desirable SPF and when values for the RFT2 and
R2 formulas are close to 1 it indicates a suitable fit The dispersion parameter (d) is used in the variance-mean relationships as shown in Equations 11 and 12
(Eq 11)
( ) ( ) ( )i i i i i iVar Y X E Y X d x E Y X= + (Eq 12) A weighting factor (Wi) used in the EB procedure is obtained from Equation 13 and used in Equation 14 to obtain the EB-estimated value
( )1
1ii i
Wd x E Y X
=+
(Eq 13)
( ) ( ) ( )1EB i i i i i i iE E y y W x E Y X W x Y= + minus (Eq 14)
where 0 lt W lt 1 Var (|) = conditional variance E (|) = conditional mean Var m or Var (Yi|Xi) = estimated variance of mean crash rate E m or E (Yi|Xi) = estimated mean crash rate from SPF d = estimated NB dispersion parameter (also called overdispersion parameter)
2Var m E m d x E m= +
( )( )( ) ( )
1 1 2 21 22 2
1 21 2
i i
i i
Y Y Y Yr
Y Y x Y Y
sum minus minus=⎡ ⎤sum minus sum minus⎢ ⎥⎣ ⎦
12
W = weight Xi = variables such as AADT Yi = number of observed crashes per year at intersection i EEB = EB-adjusted estimated crashes (crashesyr)
In the variance-mean relationship if the value obtained for the dispersion parameter d is 0 then the variance is the same as the mean (see Equations 11 and 12) which causes the NB model to collapse to the Poisson model This parameter has a strong influence on the weight in the EB formula (see Eq 13) therefore it has an effect in the EB-estimated value SAS was helpful in computing this parameter for the different types of intersections analyzed in the study throughout the 5 years
Pruning Process
Before the site prioritization was performed pruning was done to avoid over-representation of the SPFs that might not reflect much difference in the study when compared with statewide SPFs At the completion of the pruning process only the necessary or minimum effective SPFs were retained MSPE is typically the parameter used to assess errors associated with a validation data set for this reason MSPE was used for pruning In order to verify whether a specific regional SPF should be retained or not the validation data set (30 of the data) was used to compute MSPE for both the specific regional SPFs and the corresponding statewide SPFs If MSPE for the regional SPF was greater than that for the corresponding Virginia statewide SPF or if the difference between these two MSPEs was less than 10 it was concluded that the regional SPF was not necessary and it was therefore discarded The following example illustrates the steps for urban four-leg signalized FI crashes in Region 1
1 The 30 FI crash data were obtained for urban signalized four-leg intersections in Region 1 and the MSPE was determined using the statewide SPF for the FI urban four-leg signalized intersections
2 The 30 FI crash data for urban signalized four-leg intersections in Region 1 were
then used to determine MSPE for the specific Region 1 SPF for FI crashes 3 Verify if the MSPE value for the specific regional SPF is higher than the statewide
MSPE value if yes discard the specific regional SPF if no tentatively retain the specific regional model
4 The difference between the two MSPEs was determined to determine whether it was
less than 10 of the statewide MSPE if yes discard the specific regional SPF if no retain the specific regional model This process was repeated for all regional SPFs
13
Identification of Intersections with a Higher Than Expected Number of Crashes
In order to identify some of the intersections with a higher than expected number of crashes a prioritization analysis based on the EB method was conducted This analysis was carried out to identify the top 25 intersections with a high PSI in the urban areas of the Northern Virginia and Bristol districts These two districts were selected to identify any effect of the approach AADTs as two-lane roads in the Northern Virginia District carry much higher volumes than those in the Bristol District The PSI is the difference between the EB-adjusted long-term crashes and the SPF-estimated crashes The PSI was first determined and then a priority list was developed with intersections showing a higher PSI receiving a higher priority This procedure first required the computation of yearly calibration factors (Cy) that accounted for intrinsic yearly variations that were not accounted for in developing the SPFs These yearly calibration factors were determined using the steps described here and given in Equations 15 through 18 (ITT Corporation 2008) Calculation of Yearly Calibration Factor (Cy) For subtype s and severity t the following steps were performed 1 Calculate the (unadjusted) predicted number of crashes using the appropriate SPF yiMinAADTMajAADTe ststst
isyisyisty amp~ 21ˆˆˆ foralltimestimes= ββακ (Eq 15)
2 Sum the predicted numbers over all intersections
ysN
iistysty forall=sum
=
~~1κκ (Eq 16)
3 Sum the observed numbers of crashes over all intersections
yKKsN
iistysty forall=sum
=
1
(Eq 17)
4 Calculate yearly calibration factor csty
yK
csty
stysty forall= ~κ (Eq 18)
5 Repeat the steps for all subtypes (s) and severities (t)
where i = intersection index (i = 1hellip N)
14
s = subtype index (s = urban four-leg signalized intersection rural three-leg minor stop controlled intersection etc) t = severity index (t = TOT [total crashes] FI [fatal + injury crashes] PDO [property damage only]) y = year index (i = 1 [base year] 2 hellip Y) csty = yearly calibration factor for crash subtype s severity t and year y MajAADT = AADT on the major road (vehday) MinAADT = AADT on the minor road (vehday)
istyκ~ = (unadjusted) predicted number of crashes at intersection i for crash subtype s severity t and year y
istyκ = (adjusted) predicted number of crashes at intersection i for crash subtype s severity t and year y α = intercept
1β = coefficient of major AADT 2β = coefficient of minor AADT
These yearly calibration factors were then used to determine the predicted number of
crashes at an intersection based on the SPF for the severity of crashes and type of intersection being considered The PSI for each intersection was then determined using the steps described in Equations 19 through 22 (ITT Corporation 2008) Steps for Calculating PSI for Subtype s
1 Calculate the (adjusted) predicted number of crashes
amp~
21ˆˆˆ ststst
isyisysty
istystyisty
MinAADTMajAADTec
yticββα
κκ
timestimestimes=
foralltimes= (Eq 19)
2 Calculate yearly correction factor Cisty
ytiCyist
istyisty amp
)1(
forall==κ
κ
(Eq 20)
3 Calculate EB weight
tid
w Y
y istystist amp
11
1
foralltimes+
=sum =
κ (Eq 21)
4 Calculate the EB-adjusted estimated number of crashes for year 1
15
tiC
KwwX Y
y isty
Y
y istyistyististyist amp)1(
1
1)1()1( forallminus+times=
sumsum
=
=== κ (Eq 22)
5 Determine the PSI for each intersection If istYX gt istYκ include intersection i in the list for prioritization using istYPSI = istYX
where i = intersection index (i = 1hellip N) s = subtype index (s = urban four-leg signalized intersection rural three-leg minor stop
controlled intersection etc) t = severity index (t = TOT [total crashes] FI [fatal + injury crashes] PDO [property damage
only]) y = year index (y = 1 [base year] 2 hellip Y) cy = yearly calibration factor for crash subtype s severity t and year y d = dispersion parameter w = weight MajAADT = AADT on the major road (vehday) MinAADT = AADT on the minor road (vehday) PSI = potential for safety improvement
istyC = yearly correction factor
istyκ~ = (unadjusted) predicted number of crashes at intersection i for crash subtype s severity t and year y
istyκ = (adjusted) predicted number of crashes at intersection i for crash subtype s severity t and year y
istyX = EB-adjusted estimated number of crashes α = intercept
1β = coefficient of major AADT 2β = coefficient of minor AADT
The prioritization lists for urban two-lane roads in the Northern Virginia and Bristol
districts were then developed based on the PSIs obtained for three prioritization procedures These alternative prioritization procedures were the average crash rates (ACRs) for the study period (see Equation 23) the critical crash ratio (CCR) (see Eqs 24 through 27) (Garber and Hoel 2009) and the EB method The list was developed with the intersections having the highest PSI listed first followed by other intersections in descending order The execution of the EB method prioritization process was achieved through use of the computer codes in SAS Finally the effectiveness of using the EB method for prioritizing sites for safety improvement was illustrated by comparing the PSIs from using intersection crash rates critical crash and the EB procedures
16
Procedure for Crash Rate Method The ACR for the intersection is given as
( )(1000000)( )( )(365)T
TCACRN V
= (Eq 23)
where ACR = the average crash rate for the intersection under consideration (crashes1000000
approach volume) TC = number of crashes over the study period at the intersection N = duration of study period (yr) VT = average daily total approach volume at the intersection Procedure for Critical Rate Method
The critical rate method was accomplished by first computing the traffic base (TB) of the intersection under consideration using Equation 24 The ACR for the intersection under consideration is then computed using its TB as shown in Equation 25 The intersection critical crash rate (ICCR) is then determined using Equation 26 The critical crash ratio (CCR) for the intersection is then computed as the ratio of ICR and the average crash rate (AVR) for all intersections under the same category (intersection type urbanrural etc) as that for the intersection being considered using Equation 27 TB is given as
365
1 000 000
NxVxTB = (Eq 24)
where TB = the total approach volume over the study period of N years at the intersection under consideration (veh1000000) V = average daily approach volume at the intersection under consideration ACR is obtained as
TCACRTB
= (Eq 25)
where ACR = ACR at the intersection under consideration over the study period of N years
17
TB = the total approach volume over the study period of N years at the intersection under consideration (veh1000000) The critical crash rate (ICCR) for the intersection under consideration is given as
05 AVRICCR AVR TFTB TB
= + + (Eq 26)
where AVR = ACR for intersections within the state and of the same designation (eg rural three-leg with minor stop control) as that for the intersection under consideration TF = number of standard deviations for the confidence level being used in the analysis (usually 196 for 95 confidence level) TB = the total approach volume over the study period of N years at the intersection under consideration (veh1000000) The critical crash ratio (CCR) for the intersection is then obtained as
ACRCCRICCR
= (Eq 27)
where ACR = ACR at the intersection under consideration over the study period of N years (see Eq 2) ICCR = critical crash rate for the intersection under consideration (see Eq 26)
Benefits and Implementation Expectations
The expected benefits from developing SPFs and prioritizing intersection sites were illustrated by comparing the PSIs for the prioritized sites when sites were prioritized using the EB method with those obtained when sites were prioritized using crash rates and the critical crash ratio This analysis was conducted for the combined fatal plus injury crashes SPFs An estimate of the cost savings attributable solely to the potential reduction of crashes was also computed by using crash costs given in an FHWA study (FHWA 2005)
18
RESULTS AND DISCUSSION
Literature Review
SafetyAnalyst
The SafetyAnalyst Userrsquos Manual (ITT Corporation 2008) has SPFs that are suggested for intersections that are based on Minnesota data Tables 7 and 8 show the regression coefficients (α β1 and β2) for the SPFs developed for total and combined FI crashes respectively The values for the goodness of fit parameter RFT
2 are also given Although these RFT2 are all less
than 045 with a few less than 010 it has been suggested that the SPFs used in SafetyAnalyst could provide a realistic estimate of an expected crash frequency as a function of traffic volume and roadway geometry (Pham and Ragland 2005)
Methodological and Research References
Several studies similar to this study have been conducted in Canada Colorado California Texas New York and Minnesota For example a study was conducted using data from Colorado California and Texas to examine the functional form of the SPFs for urban freeways (Kononov et al 2008) Five years of crash data were acquired from the respective departments of transportation and the highway safety information system from Colorado The study revealed that the amount of crashes increased moderately with congestion in segments on urban freeways This study however did not include intersections
A study by Lyon et al was conducted in Toronto Ontario Canada to develop SPFs for urban signalized intersections (Lyon et al 2005) Collision data were gathered for five years and included 1950 urban intersections SPFs were developed for different severity levels impact types and intersection types such as four-leg and three-leg intersections The format used to develop the SPFs is shown in Equation 28 This format is somewhat different from that of Equation 4 suggested in Safety Analyst
Collisionsyear = α (F1)β1(F2)β2 exp (β3X1 + β4X2 + ) (Eq 28) where α and βi = the coefficients estimated in the SPF calibration process F1 and F2 = the entering AADTs on the major and minor roads respectively Xi = other independent variables (such as single lane versus multilane approaches with and without left-turn lanes or right-turn lanes high and low pedestrian activities or in some cases F1 or F2 or both)
19
Table 7 SafetyAnalystrsquos SPFs for Intersections (Total Crashes) Site
subtype Code
Site subtype Description
State Regression coefficients
LogIntercept (α)
Regression coefficients
LogAADTmaj (β1)
Regression coefficients LogAADT
min (β2)
Over - dispersion Parameter
(k)
RFT2
() Number of Sites
Max AADTmaj
(vehday)
Max AADTmin
(vehday)
Rural 201 Rural 3-leg with minor-
road STOP control MN -878 071 024 107 133 1706 28500 27000
202 Rural 3-leg with all-way STOP control
MN -1237 122 027 047 41 41 25300 6803
203 Rural 3-leg with signal control
MN -657 066 02 033 26 136 36400 11500
204 Rural 4-leg with minor-road STOP control
MN -896 065 047 07 299 2114 35500 26700
205 Rural 4-leg with all-way STOP control
MN -1237 122 027 047 41 41 25300 6803
206 Rural 4-leg with signal control
MN -657 066 02 033 26 136 36400 11500
Urban 251 Urban 3-leg with minor-
road STOP control MN -535 034 028 128 59 397 68000 18900
252 Urban 3-leg with all-way STOP control
MN -1237 122 027 047 41 41 25300 6803
253 Urban 3-leg with signal control
MN -985 097 018 023 414 33 50000 25807
254 Urban 4-leg with minor-road STOP control
MN -312 027 016 086 76 333 58870 81000
255 Urban 4-leg with all-way STOP control
MN -1237 122 027 047 41 41 25300 6803
256 Urban 4-leg with signal control
MN -347 042 014 032 264 418 75000 81000
ITT Corporation 2008
20
Table 8 SafetyAnalystrsquos SPFs for Intersections (Fatal and Injury Crashes) Site
subtype Code
Site subtype Description
State Regression coefficients
LogIntercept (α)
Regression coefficients
LogAADTmaj (β1)
Regression coefficients LogAADT
min (β2)
Over - dispersion Parameter
(k)
RFT2
() No of Sites
Max AADTmaj
(vehday)
Max AADTmin
(vehday)
Rural 201 Rural 3-leg with minor-
road STOP control MN -935 071 021 123 91 1706 28500 27000
202 Rural 3-leg with all-way STOP control
MN -1002 127 -022 089 248 41 25300 6803
203 Rural 3-leg with signal control
MN -783 075 014 05 215 136 36400 11500
204 Rural 4-leg with minor-road STOP control
MN -936 066 04 0 146 2114 35500 26700
205 Rural 4-leg with all-way STOP control
MN -1002 127 -022 089 248 41 25300 6803
206 Rural 4-leg with signal control
MN -783 075 014 05 215 136 36400 11500
Urban 251 Urban 3-leg with minor-
road STOP control MN -845 049 039 123 81 397 68000 18900
252 Urban 3-leg with all-way STOP control
MN -1002 127 -022 089 248 41 25300 6803
253 Urban 3-leg with signal control
MN -1022 091 021 027 362 33 50000 25807
254 Urban 4-leg with minor-road STOP control
MN -435 029 019 099 57 333 58870 81000
255 Urban 4-leg with all-way STOP control
MN -1002 127 -022 089 248 41 25300 6803
256 Urban 4-leg with signal control
MN -511 049 016 03 295 418 75000 81000
ITT Corporation 2008
21
The study examined the impact of two left turn priority treatments which were flashing advanced green (FAG) and left turn green arrow (LTGA) on left turn collisions These treatments were implemented at 35 intersections in the city of Toronto Two types of collisions were investigated left turns with and without side impact The results indicated that there was an insignificant difference in the impact of the left turn priority treatments on both types of crashes
Lord and Persaud (2003) conducted a study that related SPFs to transportation planning models They noted that traffic safety is not usually accounted for when agencies are conducting a planning analysis to remodel build upgrade or modify their facilities Five-year intersection data from Canada were used Models were developed and statistical measures such as the over dispersion parameter were calculated and conclusions were made from the results The SPFs developed for the study were applied to two sample networks created with the help of a transportation planning software package The research showed that it is possible to make estimation for traffic safety at the planning stage of a project This will allow users to take safety into consideration when designing and possibly create alternatives to change existing designs for more comprehensive projects or development The study also indicated that there are limitations when applying the SPFs to computerized transportation networks The study concluded that although it is possible to predict or estimate crashes on digital transportation networks the accuracy of prediction relies greatly on how precise the traffic flow estimates are
Jonsson et al (2007) performed an SPF study that took into consideration the type and severity of crashes andmdashmost importantmdashthe causal factors for these crashes The study was conducted for intersections on rural four-lane highways in the state of California Four collision types were tested in the study opposite-direction same-direction intersecting-direction and single-vehicle crashes In addition a set of data from the state of New York was used with the same parameters to analyze the severity distribution of crash types The data for California included 1084 intersections on four-lane rural highways and that from New York included 675 intersections mainly stop controlled or without any control Generalized linear modeling was performed with the data after quality analysis Two model forms were estimated with the variables seen in Equations 29 and 30
(Eq 29)
(Eq 30)
where NAcc = predicted number of crashesyr at intersections AADTmajor = AADT on major road AADTminor= AADT traffic flow on minor road Βi = model parameters Xi = variables that describe the intersections (such as terrain lighting left turn number of though lanes and divided or undivided among others)
nn xxxormajorAcc exAADTxAADTN ββββββ ++++=
min4433021
nn xxxormajorAcc exAADTAADTN βββββ +++++=
min332201)(
22
The two different models are different representations of the traffic flow The first represents the AADT of major and minor roads as separate variables but in the second model they are represented as one variable by the sum of the major and minor roads AADTs Results showed that the first model performed better for the multiple-vehicle crashes and the second model fitted better for the single-vehicle crashes In addition the appropriate predictor variables differed depending on the crash type This study is also of interest as it incorporated additional parameters to those in the suggested SPFs now included in SafetyAnalyst and therefore could lead to possible future SPF research for the state of Virginia
Persaud and Nguyen (1998) conducted a study on signalized intersections in Ontario Canada They developed aggregate and disaggregate models to estimate safety performance of three- and four-leg intersections in which crash severity (injury and PDO) environmental class (semi-urban and rural) and time period (daily weekday morning peak and weekday afternoon peak) were considered in the analysis An important aspect of that study is that it supplemented the existing models used for estimating SPFs instead of replacing them because it took into consideration features that were generally not considered in the then existing developed models Two model levels were considered for the study Level 1 was based on the sum of AADTs for all approaches with separate estimates for rear-end right angle and turning movement crashes At this level the equations were adjusted for three- and four-leg intersections by crash severity for all combined impact types and also separately for the three major impact types which were angle rear-end and turning movement In addition models were further separated by time period (daily weekday morning and afternoon peak) and for four-leg intersections which were also classified by environment class such as semi-urban and rural Level 2 allowed estimates to be obtained for specific crash patterns that were defined by movements of the vehicles involved before collision and the same were estimated as a function of the flows that were relevant to each of the patterns For this level models were estimated for four-leg intersections for 12 multi-vehicle and three single-vehicle patterns that were described by the movements of involved vehicles before collision The developed models were intended to estimate the parameters P and d shown in Equations 31 and 33
The safety of the intersection was estimated using the long-term mean based on the EB approach The long term mean (m) was obtained by combining crash count (x) of an intersection in the most recent years (n) with the estimates of the expected annual number of crashes (P) as shown in Equation 31 W1 and W2 in Equations 31 through 33 represent the weights estimated from the mean and variance of the regression estimates
(Eq 31)
(Eq 32)
(Eq 33)
m =W1(x) +W2(P)
2dW
d nP=
+
1PW
d nP=
+
23
(Eq 34)
To estimate the variance of m the following formula was used
(Eq 35)
In Equations 32 through 35 P and d represent the fundamental parameters Two models were selected for SPFs For Level 1 and single-vehicle Level 2 (Eq 36) For multi-vehicle in Level 2 (Eq 37) where P = expected number of crashes of a given type α and β = regression parameters to be estimated S (Level 1) = sum of all entering flows for a given time period for Level 1 analysis S (Level 2) = sum of the daily through right or left turn flows for a given time period for Level 2 (single-vehicle) analysis S1 and S2 = AADTs for small and large flows for a specific crash pattern in Level 2 (multi-vehicle) analysis
The models in either level can be used in the EB procedure to provide estimates for intersections that need to be treated or for the evaluation of the effectiveness of safety countermeasures It should be noted that the quality of the estimates for the study was strongly related to how the parameters were selected and used in the SPFs and unlike other available road models the ones presented in this study can be separated by time period and crash pattern Persaud et al (2002) conducted a study to demonstrate the complexity involved in the calibration of crash prediction models or SPFs for urban intersections Toronto data for three- and four-leg signalized intersections were used to estimate the models for the study The performance of these models was then compared with other models from Vancouver and California The models from these places were recalibrated to fit Toronto by using the Interactive Highway Safety Design Model (IHSDM) and a calibration procedure as proposed by Harwood et al (2000) The results varied significantly and were also mixed The study noted that the calibration of models is not a simple task and due to the importance of the SPFs they must be properly calibrated Several things must be accounted for when performing this procedure in order to obtain good quality data analysis The first thing is to extract a large sample of high quality data A software or program to link all the traffic crash and road characteristics data must exist because the same is usually kept stored in different databases In addition several
2Pd
Var P=
2( )
d xVar m dnP
+=
+
P =αSβ
P =αS1β1 S2
β 2
24
years of crash data must be obtained in order to have a good amount of samples that account for variations The actual process of model calibration is complicated therefore careful attention must be paid when analyzing the same because of the importance of the outcomes of the study The authors of the study made an exploratory analysis and it revealed that the relationship between the crashes and each covariate should be described either by the power function or the gamma function for all intersection types to be analyzed Equations 38 through 40 are the selected model forms used in the study F1 = Power F2 = Gamma (Eq 38) F1 = Gamma F2 = Power (Eq 39) F1 = Power F2 = Power (Eq 40) where E (K) = expected annual number of crashes between 1990 and 1995 F1 F2 = average entering AADT of major and minor roads respectively for the period 1990 to 1995 α β1 β2 β3 β4 = coefficients to be estimated
An NB structure was used to analyze the models and the overdispersion parameter (γ) was analyzed using Equation 41
γ=
2)K(E)K(Var (Eq 41)
Variance increases as γ decreases therefore the value of γ can also be used to make a comparison for the goodness of fit of several models fitted to the same data The larger the value of γ the smaller the variance therefore a more accurate model is given The authors suggest that γ would be enough to calculate the goodness of fit index of any SPF but if one desires to know how accurate the prediction estimate is other measures should also be computed The authors suggested using R2
α as proposed by Miaou et al (1996) which is a dispersion parameter based R2 computed as shown in Equation 42
γγ
minus=αmin2 1R (Eq 42)
where γ = overdispersion parameter for calibrated model γmin = smallest possible overdispersion parameter
The authors suggested that a disaggregation by traffic volume is preferable than using
only a single calibration factor for that is what the IHSDM currently has A recommendation is made to account for safety variation in traffic conditions over time by calibrating the models every two to three years as suggested by Harwood et al (2000)
E(K) =αF1β1 F2
β 2e(β 3F2 )
E(K) =αF1β1 F2
β 2e(β 4 F1 )
E(K) =αF1β1 F2
β 2
25
The Illinois Department of Transportation and the University of Illinois Urbana-Champaign conducted a research study to develop and implement SPFs for road segments and intersections in Illinois (Tegge et al 2010) These SPFs were developed in a way suitable for easy implementation in SafetyAnalyst The crash data (number of crashes and crash severity) and roadway data (number of lanes traffic volume area type and functional class) were collected and used for development of the SPFs Seventeen peer groups were used for developing the SPFs for segments and eight for intersections The intersections peer groups were minor leg stop control all-way stop control signalized and undetermined for rural and urban segments separately The SPFs for segments were developed using NB distribution for crashes and Poisson distribution for intersections The SAS GENMOD procedure was used to develop the SPFs for a five-year analysis period from 2001 to 2005 The model form for the intersection SPFs is the same as that given in the SafetyAnalyst Userrsquos Manual The SPFs were also developed for different crash severities such as fatal crashes type A injury crashes type B injury crashes and fatal plus injury crashes The EB method was used to determine the sites with the higher PSIs Two analysis techniques were used to obtain the PSIs The first considered segments and intersections as individual elements and the second used the sliding window approach The site specific analysis treated each individual segment and intersection as a separate entity Each segment is then compared with every other segment instead of having them grouped together The sliding window approach defined a set length The window lengths were 025 mile and 1 mile for urban and rural segments respectively
The largest impact on crash frequency was found to be the AADT and was therefore the only variable modeled as a logarithm (lnAADT) By doing this the AADT accounted for most of the prediction whereas the rest of the variables refined the prediction further Other variables used included access control functional class lane width surface type area type speed limit and median type The study recommended that a multivariate analysis be conducted for such studies to show how certain variables could contribute to the crashes Other variables could include roadway lighting weather and pavement conditions and roadway geometry The study also concluded that knowledge of roadway characteristics that increase the risk of fatal or injury crashes will facilitate the setting up of safety criteria that can help engineers in the designing of safer roadways Further knowledge of driver behaviors that lead to fatal and severe injury crashes can facilitate the training of enforcement officers to identify these behaviors
The Colorado Department of Transportation (CDOT) (2009) conducted a study to develop SPFs for intersections in the state Their model form is the same as that in SafetyAnalyst The SPFs were developed for many categories based on the number of legs divided undivided rural and urban including urban four-lane divided signalized six-lane divided signalized urban three-leg signalized two-lane undivided unsignalized and urban three-leg unsignalized When a median or left-turn lane is present a roadway is considered divided The sites selected for the study reflected variability in traffic volume and geometry in order to have a diverse representation of intersections throughout the state SPFs were developed for total and for fatal plus injury crash types A five-year study period from 2000 through 2005 was used Crash and AADT data were collected for development of the SPFs CDOT used a NB error structure to develop the SPFs and the EB procedure to estimate the expected safety performance of an intersection site for different safety management purposes Overdispersion parameters were computed and used as a goodness of fit measure According to their data
26
overdispersion parameters indicated that their models provided a reasonable fit to the Colorado data
Results indicated that for signalized intersections roads with six lanes on major approaches have more collisions than those with four lanes on major approaches CDOT recommended that the SPFs should be recalibrated in the future using data from future years as crash frequencies may change over time because of a variety of issues The report also recommended that separate calibration factors should be developed for different regions and different topographies Research in Virginia
In Virginia two other similar studies have recently been published One by Garber et al (2010) for two-lane roads and another by Hamidi et al (2010) to identify high-crash sections on Virginiarsquos primary system by developing a planning-level methodology The study by Garber et al developed SPFs for two-lane segments of 1 mile or less and the study by Hamidi et al developed SPFs for longer segments of two-lane roads that can be used for corridor analysis
Evaluation of the Recommended Minnesota SPFs
Figures 3 through 6 show representative graphs that were used to visually examine how well the Virginia data fitted the suggested Minnesota SPFs Figures 3 and 4 are for urban four-leg signalized intersections and Figures 5 and 6 are for rural four-leg signalized intersections These graphs suggest that the Minnesota SPFs do not fully represent the Virginia data Tables 9 through 12 show the Freeman-Tukey R2
FT coefficients computed for the different Minnesota SPFs using the Virginia data The low Freeman-Tukey R2
FT coefficients obtained and the visual inspection of the graphs suggested that a better fit to the Virginia data could be obtained by developing specific Virginia SPFs using Virginia data It was therefore decided to develop specific SPFs for Virginia
0
2
4
6
8
10
12
14
0 20000 40000 60000 80000 100000 120000
AADT Major
Tota
l Cra
shes
Per
Yea
r
Minnesota VA Actual Observed
Minnesota Model
Figure 3 Total crashes per year vs major AADT for urban 4-leg signalized intersections
with minor AADT of 700
27
0
5
10
15
20
25
30
35
0 20000 40000 60000 80000 100000 120000
AADT Major
Tota
l Cra
shes
per
Yea
r
Minnesota VA Actual Observed
Minnesota Model
Figure 4 Total crashes per year vs major AADT for urban 4-leg signalized intersections
with minor AADT of 4500
0
2
4
6
8
10
12
14
0 20000 40000 60000 80000 100000 120000
AADT Major
Tota
l Cra
shes
Per
Yea
r
Minnesota VA Actual Observed
Minnesota Model
Figure 5 Total crashes per year vs major AADT for rural 4-leg signalized intersections with
minor AADT of 795
28
0
2
4
6
8
10
12
14
16
18
0 20000 40000 60000 80000 100000 120000
AADT Major
Tota
l Cra
shes
per
Yea
r
Minnesota VA Actual Observed
Minnesota Model
Figure 6 Total crashes per year vs major AADT for rural 4-leg signalized intersections with
minor AADT of 5000
Table 9 Minnesota SPFs for Urban FI Crashes and Corresponding R2FT Based
on Virginia Data
Intersection Type
Minnesota FI SPFs R2
FT Based on Virginia Urban FI Crash Data ()
Urban 4-Leg Signalized 032
Urban 4-Leg Minor Stop Control 008
Urban 3-Leg Signalized 026
Urban 3-LegMinor Stop Control 01
Table 10 Minnesota SPFs for Urban TOTAL crashes and Corresponding R2
FT Based on Virginia Data
Type of Intersection
Minnesota SPFs
R2FT Based on Virginia Urban Total
Crash Data ()
Urban 4-Leg Signalized 034
Urban 4-Leg Minor Stop Control 022
Urban 3-Leg Signalized 031
Urban 3-Leg Minor Stop Control 01
29
Table 11 Minnesota SPFs for Rural TOTAL Crashes and Corresponding R2FT
Based on Virginia Data
Type of Intersection
Minnesota SPFs R2
FT Based on Virginia Rural Total Crash Data ()
Rural 4-Leg Signalized 029
Rural 4-Leg Minor Stop Control 013
Rural 3-Leg Signalized 029
Rural 3-Leg Minor Stop Control -010
Table 12 Minnesota SPFs for Rural FI Crashes and Corresponding R2FT Based
on Virginia Data
Type of Intersection
Minnesota SPFs R2
FT Based on Virginia Rural FI Crash Data ()
Rural 4-Leg Signalized 018
Rural 4-Leg Minor Stop Control 010
Rural 3-Leg Signalized 018
Rural 3-Leg Minor Stop Control 001
Development and Evaluation of Specific Virginia SPFs
In keeping with the suggestion given in the Safety Analyst Userrsquos Manual the model form used to develop the intersection SPFs is given in Equation 4 as
1 2k e x MajAADT x MinAADTβ βα=
where
k = predicted crash frequency per intersection per year MajAADT = AADT on the major road (vehday) MinAADT = AADT on the minor road (vehday) α = intercept β1 = coefficient of mayor AADT β2 = coefficient of minor AADT
30
The statewide SPFs developed for Virginia are given in Tables 13 through 16 Due to lack of data the analysis for all-way stop intersections could not be undertaken These tables also give the Freeman-Tukey R2
FT coefficient for each of the Virginia SPFs and the corresponding Minnesota SPF and Freeman-Tukey R2
FT based on the Virginia data The R2FT coefficients
obtained indicate that the Virginia-specific SPFs fit the Virginia data better than the suggested Minnesota SPFs for all types of intersections and crash severity except those for FI crashes on urban three-leg signalized rural four-leg signalized and rural four-leg minor stop control intersections where the corresponding RFT
2 values are similar In Table 15 it can be seen that the Minnesota R2
FT value is negative for the rural three-leg minor stop control intersections The negative RFT
2 value is possible because these calculations were not performed on the same data points that were used to create the Minnesota SPFs (Miller 2009) Table 13 SPF Models for Urban TOTAL crashes and R2
FT results for Virginia Statewide (VDOT-maintained roads)
SPF model with TOTAL Crash values
R2FT TOTAL
Crash Data
Site Virginia Statewide Minnesota VA MN
Urban 4-Leg Signalized 056 034
Urban 4-Leg Minor Stop Control
032 022
Urban 3-Leg Signalized 037 031
Urban 3-Leg Minor Stop Control
023 010
Table 14 SPF Models for Urban FI crashes and R2
FT results for Virginia Statewide (VDOT-maintained roads)
SPF model with FI Crash values R2FT FI Crash Data ()
Site
Virginia Statewide Minnesota VA MN
Urban 4-Leg Signalized 041 032
Urban 4-Leg Minor Stop Control
019 008
Urban 3-Leg Signalized 026 026
Urban 3-Leg Minor Stop Control
013 010
31
Table 15 SPF Models for Rural TOTAL Crashes and R2FT Results for Virginia Statewide (VDOT-
maintained roads) SPF model with TOTAL Crash values R2
FT TOTAL Crash Data
Site
Virginia Statewide Minnesota VA MN
Rural 4-Leg Signalized 0321 0290
Rural 4-Leg Minor Stop Control
0167 0132
Rural 3-Leg Signalized 0305 0291
Rural 3-Leg Minor Stop Control
0104 -0102
Table 16 SPF Models for Rural FI crashes and R2
FT results for Virginia Statewide (VDOT-maintained roads) SPF model with FI Crash values R2
FT TOTAL Crash Data
Site
Virginia Statewide Minnesota VA MN
Rural 4-Leg Signalized 0181 0181
Rural 4-Leg Minor Stop Control
0098 0097
Rural 3-Leg Signalized 0170 0180
Rural 3-Leg Minor Stop Control
0048 0012
Figures 7 through 10 show visual representations of how well the Virginia SPFs fit the
Virginia data in comparison with the suggested Minnesota SPFs In general the Virginia SPFs tend to fit the Virginia data better than the Minnesota SPFs although both sets of SPFs tend to have similar fits at low volumes (AADTmajor lt 2000) except for the SPF for total crashes on urban four-leg signalized intersections shown in Figure 7 The primary reason the Minnesota SPFs do not fit the Virginia data as well as the Virginia SPFs may be the dissimilarities of the roadside environment and the characteristics of the different databases
32
0
2
4
6
8
10
12
14
0 20000 40000 60000 80000 100000 120000
AADT Major
Tota
l Cra
shes
Per
Yea
r
Minnesota VA Actual Observed Virginia
Minnesota Model
Virginia M odel
Figure 7 Total crashes per year vs major AADT for urban 4-leg signalized intersections
with minor AADT of 700
0
5
10
15
20
25
30
35
0 20000 40000 60000 80000 100000 120000
AADT Major
Tota
l Cra
shes
per
Yea
r
Minnesota VA Actual Observed Virginia
Minnesota Model
Virginia Model
Figure 8 Total crashes per year vs major AADT for urban 4-leg signalized intersections
with minor AADT of 8000
33
0
2
4
6
8
10
12
14
0 20000 40000 60000 80000 100000 120000
AADT Major
Tota
l Cra
shes
Per
Yea
r
Minnesota VA Actual Observed Virginia
Virginia Model
Minnesota Model
Figure 9 Total crashes per year vs major AADT for rural 4-leg signalized intersections with
minor AADT of 79
0
5
10
15
20
25
0 20000 40000 60000 80000 100000 120000
AADT Major
Tota
l Cra
shes
per
Yea
r
Minnesota VA Actual Observed Virginia
Minnesota Model
Virginia Model
Figure 10 Total crashes per year vs minor AADT for rural 4-leg signalized intersections with major AADT of 5000
As discussed in the Methodology section in addition to the statewide Virginia SPFs
specific SPFs were developed for each operational region to consider the different topographical characteristics that exist across Virginia The complete set of SPFs together with the associated p values for the regression coefficients are shown in Tables A-1 and A-2 of Appendix A All p values are less than 005 with most being less than 00001 except for some of the rural four-leg signalized intersections regional specific SPFs These p values indicate that the estimated coefficients are statistically significant at the 95 confidence level or better A possible reason
34
for higher p values for a small number of SPFs may be the sample size used for developing these SPFs
To test the transferability and fit of the Virginia statewide specific SPFs several
statistical parameters were determined for the 70 (estimation) data set and the 30 (validation) data set separately The corresponding values for each of these parameters were then compared The results are shown in Tables 17 and 18 for urban and rural intersections respectively The results for the regional SPFs are shown in Tables A-3 through A-8 of Appendix A The results indicate that the developed models are transferable to the 30 validation data set For example the MSE values for the 70 estimation data are similar to the MSPE values for the 30 validation data In addition the mean prediction bias MPB values for the 30 validation data are close to zero (-076 le MPB ge -0004) in Table 17 and (-0067 le MPB ge 00513) in Table 18
Table 17 Goodness of Fit Results for Urban Statewide SPFs
Data Estimation data 70 Validation Data 30 Subtype Site MSE r2 R2
FT MPB MAD MSPE R2FT
Total VA 41150 0529 0557 -0760 4329 38490 0575
Total MN
68636 0506 0336 -3145 5421 68156 0315
FI VA
7043 0385 0406 -0458 1938 7671 0475
Urban 4-Leg Signalized
FI MN 7702 0372 0324 -0316 2124 8981 0376
Total VA 2238 0315 0313 -0034 0897 2383 0292
Total MN 2510 0287 0215 0091 0982 2730 0182
FI VA 0530 0194 0193 -0004 0432 0533 0194
Urban 4-Leg Minor Stop Control
FI MN 0560 0182 0080 0128 0522 0577 0052
Total VA 24900 0375 0370 -0645 3519 27591 0369
Total MN 29322 0365 0308 -2238 3661 33079 0272
FI VA 4467 0275 0259 -0185 1527 4875 0262
Urban 3-Leg Signalized
FI MN 4528 0267 0261 -0294 1526 4937 0261
Total VA 1854 0254 0230 -0043 0893 2038 0239
Total MN 2388 0237 0104 -0541 0902 2600 0107
FI VA 0428 0151 0133 -0021 0431 0476 0157
Urban 3-Leg Minor Stop Control
FI MN 0478 0140 0097 -0184 0385 0537 0104
35
Table 18 Goodness of Fit Results for Rural Statewide SPFs
Data Estimation Data 70
Validation Data 30
Subtype Site MSE r2 R2FT MPB MAD MSPE R2
FT
Total VA 10990 0353 0321 0513 2210 10070 -0073
Total MN 12400 0339 0290 -0154 2071 8460 0035
FI VA 2350 0196 0181 0045 1189 2600 -0034
Rural 4-Leg Signalized
FI MN 2400 0188 0181 -0043 1164 2420 0004
Total VA 1090 0182 0167 -0067 0794 1190 0171
Total MN 1190 0167 0132 -0348 0774 1320 0115
FI VA 0480 0112 0098 -0022 0504 0530 0110
Rural 4-Leg Minor Stop Control
FI MN 0500 0104 0097 -0158 0459 0560 0093
Total VA 5490 0328 0305 -0010 1651 5760 0179
Total MN NA NA NA NA NA NA NA
FI VA 1450 0181 0170 -0041 0902 1710 0099
Rural 3-Leg Signalized
FI MN NA NA NA NA NA NA NA
Total VA 0690 0144 0104 -0008 0613 0730 0102
Total MN 0890 0141 -0102 -0404 0555 0940 -0104
FI VA 0250 0071 0048 -0009 0345 0260 0048
Rural 3-Leg Minor Stop Control
FI MN 0270 0068 0012 -0144 0270 0290 0003
Pruning of Virginia-Specific SPFs A total of 64 SPFs were initially developed using the appropriate data for Virginia as shown in Tables A-1 and A-2 of Appendix A Considering that not all regional models might be necessary the pruning process described in the methodology section was carried out to prune the number of SPFs to the minimum effective number as seen in Tables 19 and 20 for urban and rural intersections respectively The pruning process resulted in 19 SPFs for urban sites and 15 for rural sites To facilitate the use of the correct SPF for a specific type of intersection located in a specific region the lists of the appropriate SPFs to be used are given in Tables B-1 and B-2 of Appendix B for the urban and rural intersections respectively
As can be seen in Tables 19 and 20 and Tables A-1 and A-2 of Appendix A there are some trends worth discussing for the benefit of the study and possible future research With regards to the three different operational regions the Western region retained many more of the specific regional urban SPFs than any other region For example the Western regional SPFs were retained for all urban intersection sites whereas for the Eastern region the only SPFs
36
retained were those for urban four-leg signalized FI crashes and urban four-leg minor stop control for total and FI crashes Similarly the only urban SPF retained for the Northern region was that for urban four-leg minor stop control for total crashes For the rural intersection sites all of the Western regional SPFs were retained except those for rural three-leg signalized total and FI crashes and rural four-leg minor stop control FI crashes The majority of the Eastern region rural SPFs were discarded except those for rural four-leg signalized total and FI crashes while for the Northern region all regional SPFs were discarded
The Western region retained more specific regional SPFs than the other two regions This suggests that the intersections in the Western region exhibit more unique characteristics than those for the other regions This may be due to the more mountainous terrain in the Western region compared to those in the Eastern and Northern regions This supports the philosophy of developing specific SPFs based on the topography of different regions
Site Prioritization
To illustrate the benefits of using the EB method to prioritize intersection sites for safety
improvements the top 25 urban sites from the Bristol and Northern Virginia districts were identified by using crash rates critical crash ratio and the EB method The PSI for each site identified was then determined The results obtained are shown in Tables 21 and 22 for the Bristol and the Northern Virginia districts respectively The results indicate that for the Northern Virginia District the PSIs for the top 25 sites are 258 1317 and 27440 crashes per year and for the Bristol District 432 646 and 1496 crashes per year for the crash rates critical crash ratio and EB methods respectively The important thing in Tables 21 and 22 is the sum of the PSI columns ranked by the three methods The sum of each of the PSIs for the crash rate and critical crash ratio method is lower than that for the EB method These results suggest that the use of the EB method in the planning process will identify intersection sites with the highest PSIs and therefore where detailed assessments to determine feasible and effective safety treatments should be undertaken
37
Table 19 MSPE Values for Virginia Urban Statewide and Urban Regional SPFs Used for Pruning
Data Pruning
Subtype
Site
MSPE [MSPEVA-
MSPEOR]1 [abs(MSPEVA-
MSPEOR)]2 [abs(MSPEVA-
MSPEOR)MSPEVA]3
RetainDiscardTotal VA 3849 Northern 4486 -637 637 0165497532 Discard Western 1791 2058 2058 0534684334 Retain Eastern 3745 104 104 0027020005 Discard FI VA 7671 Northern 95 -1829 1829 0238430452 Discard Western 517 2501 2501 0326033112 Retain
Urban 4-Leg Signalized
Eastern 541 2261 2261 0294746448 Retain Total VA 23834 Northern 202 03634 03634 015247126 Retain Western 105 13334 13334 0559452882 Retain Eastern 115 12334 12334 0517496014 Retain FI VA 05327 Northern 048 00527 00527 0098929979 Discard Western 033 02027 02027 0380514361 Retain
Urban 4-Leg Minor Stop Control
Eastern 036 01727 01727 0324197485 Retain Total VA 275911 Northern 2687 07211 07211 0026135239 Discard Western 2441 31811 31811 0115294425 Retain Eastern 3878 -111889 111889 0405525695 Discard FI VA 48754 Northern 448 03954 03954 0081101038 Discard Western 339 14854 14854 0304672437 Retain
Urban 3-Leg Signalized
Eastern 586 -09846 09846 020195266 Discard Total VA 20379 Northern 219 -01521 01521 0074635654 Discard Western 164 03979 03979 0195250012 Retain Eastern 223 -01921 01921 0094263703 Discard FI VA 04756 Northern 05 -00244 00244 0051303616 Discard Western 038 00956 00956 0201009251 Retain
Urban 3-Leg Minor Stop Control
Eastern 05 -00244 00244 0051303616 Discard 1 Difference between mean square prediction error (MSPE) of Virginia statewide model and OR model 2 Absolute value of the difference between Virginia statewide model MSPE and operational region model MSPE 3 Absolute value of the difference between Virginia statewide model MSPE and operational region model MSPE divided by the Virginia statewide MSPE for comparison
Retained SPFs Discarded if value is negative Discarded if less than 01
38
Table 20 MSPE Values for Virginia Rural Statewide and Rural Regional SPFs Used for Pruning Data Pruning
Subtype
Site
MSPE
[MSPEVA-MSPEOR]1
[abs(MSPEVA-MSPEOR)]2
[abs(MSPEVA-MSPEOR)MSPEVA]3
RetainDiscard
Total VA 1007 Northern 3422 -2415 2415 2398212512 Discard Western 605 402 402 0399205561 Retain Eastern 512 495 495 0491559086 Retain FI VA 26 Northern 976 -716 716 2753846154 Discard Western 159 101 101 0388461538 Retain
Rural 4-Leg Signalized
Eastern 137 123 123 0473076923 Retain Total VA 119 Northern 164 -045 045 0378151261 Discard Western 102 017 017 0142857143 Retain Eastern 114 005 005 0042016807 Discard FI VA 053 Northern 052 001 001 0018867925 Discard Western 048 005 005 0094339623 Discard
Rural 4-Leg Minor Stop Control
Eastern 049 004 004 0075471698 Discard Total VA 576 Northern 1475 -899 899 1560763889 Discard Western 674 -098 098 0170138889 Discard Eastern 626 -05 05 0086805556 Discard FI VA 171 Northern 212 -041 041 0239766082 Discard Western 403 -232 232 1356725146 Discard
Rural 3-Leg Signalized
Eastern 157 014 014 0081871345 Discard Total VA 073 Northern 093 -02 02 0273972603 Discard Western 053 02 02 0273972603 Retain Eastern 069 004 004 0054794521 Discard FI VA 026 Northern 03 -004 004 0153846154 Discard Western 023 003 003 0115384615 Retain
Rural 3-Leg Minor Stop Control
Eastern 027 -001 001 0038461538 Discard 1 Difference between mean square prediction error (MSPE) of Virginia statewide model and OR model 2 Absolute value of the difference between Virginia statewide model MSPE and operational region model MSPE 3 Absolute value of the difference between Virginia statewide model MSPE and operational region model MSPE divided by the Virginia statewide MSPE for comparison
Retained SPFs Discarded if value is negative Discarded if less than 01
39
Table 21 PSIs for Top 25 Sites in District 1 Urban (Bristol) FI
Crashes Ranking Based on Crash
Rates Ranking Based on Crash Ratio Ranking Based on EB
Method
Rank Intersection Node
Crash Rate1 PSI2 Intersection
Node Crash Ratio3 PSI Intersection
Node PSI
1 596726 22112 00000 651193 39672 00000 596095 21413
2 606469 20079 00000 606238 39298 06297 596393 08787
3 706818 12504 00000 651075 31264 00000 651130 08453
4 651193 11550 00000 596726 29227 00000 596701 07112 5 651075 09369 00000 606469 28039 00000 651802 06929 6 606238 08382 06297 651233 25831 03612 636331 06726 7 651807 07089 00000 651130 22718 08453 596395 06579 8 651233 06068 03612 706818 22555 00000 596937 06415 9 651230 05990 00000 651230 20301 00000 606238 06297
10 651783 05756 00000 651210 18882 04747 661033 06061 11 636093 04960 00000 636331 17913 06726 596372 05417 12 651274 04475 00000 651807 16847 00000 636372 04808 13 651130 04179 08453 651805 15814 00000 651210 04747 14 651210 03918 04747 651223 15627 03589 636491 04649 15 636331 03393 06726 651783 15009 00000 596420 04633 16 651223 03363 03589 596095 14865 21413 596403 04579 17 606232 03331 00000 636405 14769 00000 651603 04531 18 651127 03053 00000 661033 14555 06061 636056 04351 19 651999 03048 00000 596353 14215 03717 712033 04110 20 596449 02962 00000 636093 13782 00000 704691 04102 21 636405 02811 00000 651879 13192 00000 651838 04100 22 651883 02698 00000 651274 12975 00000 651894 03878 23 596353 02686 03717 651127 12972 00000 596353 03717 24 651805 02663 00000 651999 12959 00000 651233 03612 25 661033 02500 06061 596449 12702 00000 651889 03601
sum 43202 sum 64615 sum 149606 1Number of crashes per year per 1000000 total approach volume 2Potential for safety improvement (crashes yr) the difference between the EB-adjusted long-term crashes and the SPF-estimated crashes 3Ratio of actual crash rate to critical crash rate
40
Table 22 PSIs for Top 25 Sites in District 9 Urban (Northern Virginia District) FI
Crashes Ranking Based on Crash
Rates Ranking Based on Crash Ratio Ranking Based on EB
Method
Rank Intersection Node
Crash Rate1 PSI2 Intersection
Node Crash Ratio3 PSI Intersection
Node PSI
1 718192 191841 00000 718192 257523 00000 264119 150122 2 702946 178194 00000 547722 152371 11175 263375 140091 3 271531 64846 00000 263628 102794 00000 278648 137239 4 263628 52858 00000 263728 100092 00000 276819 131395 5 263728 42215 00000 719754 95274 09444 263290 130743 6 266955 35294 00000 702946 79268 00000 722678 127897 7 547722 34932 11175 263403 77252 05184 264725 118671 8 702612 30441 00000 704237 77175 07648 267028 116627 9 273886 29539 00000 263729 74681 00000 265204 115925
10 716747 27632 00000 271531 72327 00000 274766 115679 11 263626 27139 00000 263135 66458 18068 263249 113372 12 269485 26567 00000 716747 64461 00000 547044 110769 13 728954 26344 00000 266955 56657 00000 549349 107180 14 263729 25208 00000 546138 52003 31028 268210 105630 15 546988 21922 00000 547544 51924 32529 263347 104257 16 274338 21446 00000 263626 50389 00000 276351 102313 17 429308 21354 00000 269485 49897 00000 428167 100064 18 720401 21197 00000 728954 49702 00000 264344 98789 19 267295 20954 00000 548686 49572 03621 277764 91554 20 267536 20874 00000 711601 47985 04440 263467 89259 21 265938 20484 00000 266970 47730 00000 263090 89199 22 273354 20108 00000 546462 46856 03620 703414 88610 23 268345 19362 00000 265938 46726 00000 428629 87379 24 719754 19073 09444 720401 44833 00000 272219 85659 25 263403 19015 05184 728496 43666 04990 428544 85610
Sum 25803 sum 131747 sum 2744033 1Number of crashes per year per 1000000 total approach volume 2Potential for safety improvement (crashes yr) the difference between the EB-adjusted long-term crashes and the SPF-estimated crashes 3Ratio of actual crash rate to critical crash rate
41
CONCLUSIONS
bull The development of SPFs for intersections is necessary for Virginia because the SafetyAnalyst-suggested SPFs which are based on Minnesota data do not represent the Virginia data well Regarding the fit of the SPFs to Virginia data the R2
FT values shown in Tables 13 through 16 for Minnesota and Virginia indicate that the Virginia-specific SPFs fit the Virginia data better than the Minnesota models This may be due to the dissimilarities of the roadside environment such as difference in topography and the characteristics of the different Virginia and Minnesota databases
bull In some cases the specific regional SPFs fit the regional data better than the statewide
SPFs suggesting that the specific SPFs should be considered for use when available These group divisions that have similar roadway characteristics and driver expectations in some cases tend to improve the fit
bull In identifying intersection sites for safety improvements it is clearly beneficial for the EB
method to be used with the suitable SPFs rather than a crash rate or critical ratio method Results of the site prioritization show a much higher potential for crash reduction when the EB method is used with the appropriate SPFs rather than a procedure based on crash rates or critical rates
RECOMMENDATIONS
1 VDOTrsquos TED should use the Virginia-specific SPFs when using the SafetyAnalyst tools The results of this study have shown that the Virginia-specific SPFs reflected the Virginia data better than the SafetyAnalyst-recommended Minnesota SPFs
2 VDOTrsquos TED should investigate the feasibility of using multiple SPFs in SafetyAnalyst If
feasible regional SPFs should be used If it is not currently feasible to use multiple SPFs VDOTrsquos TED should ask that the FHWA include regional information in SafetyAnalyst so as to allow the use of regional SPFs For the specific regional SPFs to be applied to Virginia and other states the SafetyAnalyst tool should be capable of incorporating the necessary data that support the regional models
3 As soon as it is feasible to use regional SPFs VDOTrsquos TED should use the 19 SPFs
developed for urban intersections and the 15 developed for rural intersections when using the tools in SafetyAnalyst Although the statewide SPFs are available for use by an analyst the specific regional models included in the final set of SPFs will predict crashes better than the statewide SPFs The regional analysis will not only ease the use of specific regional SPFs but will also be of benefit when predicting the potential for safety improvement of a specific site
4 For future similar SPF studies VDOTrsquos TED should be directly involved in screening the
traffic data for accuracy and consistency as was done in this study The direct involvement of the TED in the screening of the traffic data significantly contributed to the accuracy of the
42
data and greatly contributed to the confidence the researchers place on the data used in the study
5 The Virginia Transportation Research Council (VTRC) should conduct a study as soon as
feasible to verify whether incorporating independent variables for which data are available other than AADT such as intersection geometry and other characteristics will result in SPFs that better fit the Virginia data Although the currently suggested SafetyAnalyst SPFs use only the AADTs as the independent variables it is likely that provision will be made for use of SPFs that incorporate other independent variables such as number of approaches entering lanes and the other variables for which data are available as these SPFs are likely to give better fit to crash data
6 As soon as feasible VTRC should undertake a study to develop SPFs for the urban system
intersections which are not currently maintained by VDOT as these intersections may have different crash characteristics than those maintained by VDOT This would facilitate the use of SafetyAnalyst in programming sites that are currently not being maintained by VDOT
BENEFITS AND IMPLEMENTATION PROSPECTS
Significant benefits will be accrued by the use of the Virginia-specific SPFs developed in this study This is clearly illustrated in two ways First in examining the transferability of the suggested SPFs in SafetyAnalyst it is clear that these SPFs do not fit the Virginia data very well The results also indicate that the Virginia-specific SPFs fit the Virginia data much better than the suggested SafetyAnalyst SPFs Second the availability of the Virginia-specific SPFs will enhance the use of the EB procedure given in SafetyAnalyst for prioritizing sites for safety improvements This study has also shown that the EB method better identifies sites with higher potential for crash reduction than those identified by crash rates For example the illustrated examples given for the Bristol and Northern Virginia districts show that the potential reduction in FI crashes when the top 25 sites are identified by the EB method is 28936 (1496 + 27440) crashes per year whereas that obtained when the critical crash ratio method is used for prioritization is only 1963 (646 + 1317) and that obtained with the crash rate method is only 690 (432 + 258) crashes per year This gives a net benefit of 26973 potential crashes per year compared to the critical crash ratio method and 28246 compared to the crash rate method Assuming an average cost of FI crashes of $95629 (FHWA 2005) and only 10 of the estimated net benefit PSI of 28246 crashes per year is achieved the total savings of more than $27 million per year could be accrued The prospects for implementation of the recommendations are very high as the study was requested by VDOTrsquos TED which is planning to incorporate these SPFs in the use of the tools provided in SafetyAnalyst
43
ACKNOWLEDGMENTS
The authors appreciate the opportunity afforded them by VDOT and VTRC to conduct this study Special thanks to Stephen Read (VDOT) Dr In-Kyu Lim (VDOT) Dr Young-Jun Kweon (VTRC) and VDOTrsquos Central Office for their interest and support in SPFs and their help in the selection of intersection sites Many thanks to Lewis Woodson (VTRC) and James Hill (University of Virginia) for all their help and input throughout the study
REFERENCES Cogburn P VDOT Interagency Coordination 2007 Virginia Emergency Management
Conference Virginia Department of Transportation Richmond April 2007 Colorado Department of Transportation DTD Applied Research and Innovation Branch Safety
Performance Functions for Intersections CDOT-2009-10 Denver December 2009 Fridstroslashm L Ifver J Ingebrigtsen S Kulmala R and Thomsen LK Measuring the
Contribution of Randomness Exposure Weather and Daylight to the Variation in Road Accidents Counts Accident Analysis and Prevention Vol 27 No 1 1995 pp 1-20
Federal Highway Administration Cost of Crashes by Severity Table FHWA-HRT-05-051
Washington DC 2005 Federal Highway Administration SafetyAnalyst Home Page httpwwwsafetyanalystorg
Accessed February 2010 Garber N and Hoel L Traffic amp Highway Engineering 4th ed Cenage Learning Toronto
Canada 2009 Garber NJ Haas PR and Gosse C Development of Safety Performance Functions for Two-
Lane Roads Maintained by the Virginia Department of Transportation VTRC 10-R25 Virginia Transportation Research Council Charlottesville 2010
Hamidi A Fontaine MD and Demetsky MJ A Planning-Level Methodology for Identifying
High-Crash Sections of Virginiarsquos Primary System VTRC 11-R4 Virginia Transportation Research Council Charlottesville 2010
Harwood D Council FM Hauer E Hughes WE and Vogt A Prediction of the Expected
Safety Performance of Rural Two-lane Highways Federal Highway Administration McLean VA December 2000
Harwood DW Bauer KM Richard KR Gilmore DK Persaud B and Lyon C
Development of SPFs for Safety Analyst Interim Tools Technical Memorandum
44
Prepared by Midwest Research Institute for the Federal Highway Administration McLean VA 2004
ITT Corporation SafetyAnalyst Userrsquos Manual Turner-Fairbank Highway Research Center
McLean VA 2008 Jonsson T Ivan J and Zhang C Crash Prediction Models for Intersections on Rural
Multilane Highways Differences by Collision Type In Transportation Research Record Journal of the Transportation Research Board No 2019 Transportation Research Board of the National Academies Washington DC 2007 pp 91-98
Kweon Y-J and Lim I-K Appropriate Regression Model Types for the Empirical Bayes
Method and SafetyAnalyst In Proceedings of the 89th Annual Meeting of the Transportation Research Board Transportation Research Board of the National Academies Washington DC 2010
Kononov J Bailey B and Allery B Exploratory Examination of the Functional Form of
Safety Performance Functions of Urban Freeways Colorado Department of Transportation and San Diego State University Denver CO 2008
Lyon C Haq A Persaud B and Kodama S Safety Performance Functions for Signalized
Intersections in Large Urban Areas Development and Application to Evaluation of Left-Turn Priority Treatment In Transportation Research Record Journal of the Transportation Research Board No 1908 Transportation Research Board of the National Academies Washington DC 2005 pp 165-171
Lord D and Persaud B Estimating the Safety Performance of Urban Road Transportation
Networks Center for Transportation Safety Texas Transportation Institute Texas AampM University and Department of Civil Engineering Ryerson University College Station TX 2003 pp 609-620
Miaou S-P Lu A and Lum H S Pitfalls of using R2 to Evaluate Goodness of Fit of
Accident Prediction Models In Transportation Research Record Journal of the Transportation Research Board No 1542 Transportation Research Board of the National Academies Washington DC 2005 1996 pp 6-13
Miller P Re Negative R squared Email Archive Division of Biostatistics Washington
University in St Louis February 2 2005 February 2 2005 httpwwwbiostatwustleduarchiveshtmljmp-l2005msg00075html Accessed February 2010
Persaud B Lord D and Palmisano J Calibration and Transferability of Accident Prediction
Models for Urban Intersections In Transportation Research Record Journal of the Transportation Research Board No 1784 Transportation Research Board of the National Academies Washington DC 2002 pp 57-64
45
Persaud B and Nguyen T Disaggregate Safety Performance Models for Signalized Intersections on Ontario Provincial Roads In Transportation Research Record Journal of the Transportation Research Board No 1635 Transportation Research Board of the National Academies Washington DC 1998 pp 113-120
Pham T and Ragland D Summary of Crash Prediction Models Also known as Safety
Performance Functions (SPFs) California Partners for Advanced Traffic and Highways and University of California Berkeley Berkeley 2005
SAS Institute Inc SAS OnlineDoc Version Eight Cary NC
httpwwwtecnionacildocssasril Accessed 2009 Tegge RA Jo J-H and Ouyang Y Development and Application of Safety Performance
Functions for Illinois ICT-10-066 Illinois Center for Transportation University of Illinois Urbana-Champaign March 2010
Virginiarsquos Surface Transportation Safety Executive Committee Commonwealth of Virginiarsquos
Strategic Highway Safety Plan 2006-2010 Virginia Department of Transportation Richmond 2006
Washington S Persaud B Lyon C and Oh J Validation of Accident Models for
Intersections FHWA-RD-03-037 Federal Highway Administration McLean VA 2005
46
47
APPENDIX A
STATISTICAL PARAMETERS AND GOODNESS-OF-FIT RESULTS
Table A-1 Statistical Parameters for Urban Intersections SPFs Parameter Estimates
Data Intercept
Coefficient of Mayor AADT
Coefficient of Minor AADT
Subtype Site Intercept (α)
StndError
P value
lnMajor (β1)
StndError
P value
lnMinor (β2)
StndError
P value
Total VA -76234 048 lt0001 06742 005 lt0001 03453 003 lt0001
OR1 -83067 056 lt0001 07522 005 lt0001 0328 003 lt0001OR10 -123913 122 lt0001 10631 013 lt0001 04567 006 lt0001OR 100 -88553 077 lt0001 07825 007 lt0001 03706 004 lt0001FI VA -85256 057 lt0001 06477 006 lt0001 03579 004 lt0001OR1 -96546 063 lt0001 07603 006 lt0001 03597 004 lt0001OR10 -114284 15 lt0001 08662 016 lt0001 04412
Urban 4-Leg Signalized
OR 100 -99582 100 lt0001 07484 009 lt0001 04017 005 lt0001Total VA -60723 022 lt0001 04558 002 lt0001 0347 004 lt0001
OR1 -6059 044 lt0001 0505 004 lt0001 02773 006 lt0001OR10 -67031 057 lt0001 03986 007 lt0001 04999 009 lt0001OR 100 -65388 032 lt0001 04689 004 lt0001 043 006 lt0001FI VA -76917 032 lt0001 05001 003 lt0001 03695 005 lt0001OR1 -81437 060 lt0001 05813 005 lt0001 03188 008 lt0001OR10 -80333 063 lt0001 03446 007 lt0001 06218 010 lt0001
Urban 4-Leg Minor Stop Control
OR 100 -83166 051 lt0001 05253 006 lt0001 04695 008 lt0001Total VA -6543 082 lt0001 06591 008 lt0001 02119 002 lt0001
OR1 -4999 103 lt0001 05555 009 lt0001 01554 003 lt0001OR10 -96143 127 lt0001 08677 012 lt0001 03297 005 lt0001OR 100 -67518 110 lt0001 06157 011 lt0001 02969 005 lt0001FI VA -84268 068 lt0001 07147 006 lt0001 02481 002 lt0001OR1 -73982 099 lt0001 06496 009 lt0001 02088 003 lt0001OR10 -110104 155 lt0001 0908 015 lt0001 03226 006 lt0001
Urban 3-Leg Signalized
OR 100 -7266 107 lt0001 05508 011 lt0001 03107 006 lt0001Total VA -54696 013 lt0001 04874 002 lt0001 01985 001 lt0001
OR1 -5361 018 lt0001 04959 002 lt0001 01676 002 lt0001OR10 -5773 034 lt0001 04877 003 lt0001 02314 004 lt0001OR 100 -51642 021 lt0001 04338 003 lt0001 02309 003 lt0001FI VA -74642 018 lt0001 05791 002 lt0001 02091 002 lt0001OR1 -76877 027 lt0001 06204 003 lt0001 0181 002 lt0001OR10 -69458 047 lt0001 05096 004 lt0001 02212 005 lt0001
Urban 3-Leg Minor Stop Control
OR 100 -69883 031 lt0001 05169 004 lt0001 02308 003 lt0001 Standard Error
48
Table A-2 Statistical Parameters for Rural Intersections SPFs Parameter Estimates
Data Intercept
Coefficient of Mayor AADT
Coefficient of Minor AADT
Subtype Site Intercept (α)
StndError
P value
lnMajor (β1)
Stnd Error
P value
lnMinor (β2)
Stnd Error
P value
Total VA -69589 118 lt0001 06746 009 lt0001 0253 009 00047
OR1 -1604 237 04974 02284 021 02791 01514 012 0211 OR10 -63951 183 00005 05508 014 00001 03106 014 00224 OR 100 -06468 220 07692 02262 016 01635 -00158 017 09274 FI VA -87116 128 lt0001 07839 011 lt0001 02166 009 0013 OR1 -33285 246 01767 03601 024 0126 00597 013 06478 OR10 -80583 175 lt0001 06809 018 00001 02557 013 0057
Rural 4-Leg Signalized
OR 100 -48381 221 00287 04243 018 00193 01523 018 03943 Total VA -5494 020 lt0001 03533 002 lt0001 03935 003 lt0001
OR1 -62351 058 lt0001 04167 006 lt0001 04507 008 lt0001OR10 -53594 028 lt0001 03379 003 lt0001 03998 004 lt0001OR 100 -51255 027 lt0001 02914 003 lt0001 04075 004 lt0001FI VA -66927 030 lt0001 03899 003 lt0001 04156 004 lt0001OR1 -82561 095 lt0001 05221 009 lt0001 04962 012 lt0001OR10 -70797 044 lt0001 03789 004 lt0001 0497 005 lt0001
Rural 4-Leg Minor Stop Control
OR 100 -63326 038 lt0001 03223 004 lt0001 04424 005 lt0001Total VA -75754 084 lt0001 06465 008 lt0001 03332 008 lt0001
OR1 -58798 220 00075 05076 020 00143 0313 013 00161 OR10 -64368 110 lt0001 0544 011 lt0001 02863 006 lt0001OR 100 -9899 139 lt0001 08047 015 lt0001 04386 006 lt0001FI VA -87112 103 lt0001 07224 010 lt0001 02578 006 lt0001OR1 -9219 260 00004 07258 022 00011 03407 016 00326 OR10 -88607 146 lt0001 07059 016 lt0001 02809 008 00009
Rural 3-Leg Signalized
OR 100 -111835 185 lt0001 08669 018 lt0001 03977 008 lt0001Total VA -43293 008 lt0001 03366 001 lt0001 02087 001 lt0001
OR1 -50904 022 lt0001 0406 002 lt0001 02752 003 lt0001OR10 -40969 009 lt0001 03133 001 lt0001 02001 001 lt0001OR 100 -4231 016 lt0001 02997 002 lt0001 02308 003 lt0001FI VA -53415 011 lt0001 03394 001 lt0001 02237 001 lt0001OR1 -64457 031 lt0001 04195 003 lt0001 0307 004 lt0001OR10 -50831 014 lt0001 03245 002 lt0001 02014 002 lt0001
Rural 3-Leg Minor Stop Control
OR 100 -51046 024 lt0001 03163 003 lt0001 02112 003 lt0001
Standard Error
49
Table A-3 SPFs Goodness of Fit Results for Urban Northern Operational Region (No 1)
Data Estimation Data 70 Validation Data 30
Subtype Site MSE r2 R2FT MPB MAD MSPE R2
FT
Total VA 41150 0529 0557 -0760 4329 38490 0575
Total R1 4110 051 0551 -020 464 4486 054
FI VA 704 038 0406 -046 194 767 048
Urban 4-Leg Signalized
FI R1 809 039 0439 012 214 950 038
Total VA 224 031 0313 -003 090 238 029
Total R1 308 028 0286 008 095 200 032
FI VA 053 019 0193 000 043 053 019
Urban 4-Leg Minor Stop Control
FI R1 064 018 0187 003 043 048 021
Total VA 2490 038 0370 -064 352 2759 037
Total R1 3034 032 0305 -015 365 2687 037
FI VA 447 028 0259 -019 153 488 026
Urban 3-Leg Signalized
FI R1 559 025 0231 004 157 448 029
Total VA 185 025 0230 -004 089 204 024
Total R1 208 026 0239 -006 094 219 026
FI VA 043 015 0133 -002 043 048 016
Urban 3-Leg Minor Stop Control
FI R1 047 017 0156 -001 044 050 017
50
Table A-4 SPFs Goodness of Fit Results for Urban Western Operational Region (No 10)
Data Estimation Data 70 Validation Data 30
Subtype Site MSE r2 R2FT MPB MAD MSPE R2
FT
Total VA 41150 0529 0557 -0760 4329 38490 0575
Total R10 21976 0777 0735 1290 3233 17910 0686
FI VA 7043 0385 0406 -0458 1938 7671 0475
Urban 4-Leg Signalized
FI R10 4280 0526 0500 0377 1597 5170 0452
Total VA 2238 0315 0313 -0034 0897 2383 0292
Total R10 1161 0361 0300 -0032 0740 1050 0188
FI VA 0530 0194 0193 -0004 0432 0533 0194
Urban 4-Leg Minor Stop Control
FI R10 0312 0197 0187 0000 0382 0330 0009
Total VA 24900 0375 0370 -0645 3519 27591 0369
Total R10 14446 0451 0397 -0168 2801 24410 0255
FI VA 4467 0275 0259 -0185 1527 4875 0262
Urban 3-Leg Signalized
FI R10 3077 0266 0216 0039 1258 3390 0115
Total VA 1854 0254 0230 -0043 0893 2038 0239
Total R10 1391 0233 0197 -0054 0800 1640 0207
FI VA 0428 0151 0133 -0021 0431 0476 0157
Urban 3-Leg Minor Stop Control
FI R10 0354 0111 0089 -0019 0404 0380 0125
51
Table A-5 SPFs Goodness of Fit Results for Urban Eastern Operational Region (No 100)
Data Estimation Data 70 Validation Data 30
Subtype Site MSE r2 R2FT MPB MAD MSPE R2
FT
Total VA 41150 0529 0557 -0760 4329 38490 0575
Total R100 31108 0632 0630 0243 4717 37450 0005
FI VA 7043 0385 0406 -0458 1938 7671 0475
Urban 4-Leg Signalized
FI R100 5201 0480 0454 -0098 1864 5410 0244
Total VA 2238 0315 0313 -0034 0897 2383 0292
Total R100 1720 0443 0381 0087 0758 1150 0003
FI VA 0530 0194 0193 -0004 0432 0533 0194
Urban 4-Leg Minor Stop Control
FI R100 0509 0273 0254 0049 0383 0360 0173
Total VA 24900 0375 0370 -0645 3519 27591 0369
Total R100 17782 0410 0410 -1753 0908 38780 0004
FI VA 4467 0275 0259 -0185 1527 4875 0262
Urban 3-Leg Signalized
FI R100 3194 0243 0263 -0615 1645 5860 0236
Total VA 1854 0254 0230 -0043 0893 2038 0239
Total R100 1561 0233 0210 -0127 0902 2230 0002
FI VA 0428 0151 0133 -0021 0431 0476 0157
Urban 3-Leg Minor Stop Control
FI R100 0387 0131 0116 -0043 0444 0500 0141
52
Table A-6 SPFs Goodness of Fit Results for Rural Northern Operational Region (No 1)
Data Estimation Data 70
Validation Data 30
Subtype Site MSE r2 R2FT MPB MAD MSPE R2
FT
Total VA 10990 0353 0321 0513 2210 10070 -0073
Total R1 20080 0118 0092 -1389 3661 34220 0212
FI VA 2350 0196 0181 0045 1189 2600 -0034
Rural 4-Leg Signalized
FI R1 2920 0057 0052 -1173 1931 9760 0028
Total VA 1090 0182 0167 -0067 0794 1190 0171
Total R1 1990 0190 0245 0001 0942 1640 0173
FI VA 0480 0112 0098 -0022 0504 0530 0110
Rural 4-Leg Minor Stop Control
FI R1 0920 0093 0112 0020 0541 0520 0009
Total VA 5490 0328 0305 -0010 1651 5760 0179
Total R1 11110 0182 0254 -0679 2271 14750 0497
FI VA 1450 0181 0170 -0041 0902 1710 0099
Rural 3-Leg Signalized
FI R1 3230 0131 0153 -0116 1006 2120 0355
Total VA 0690 0144 0104 -0008 0613 0730 0102
Total R1 1210 0245 0196 0030 0712 0930 0126
FI VA 0250 0071 0048 -0009 0345 0260 0048
Rural 3-Leg Minor Stop Control
FI R1 0340 0124 0093 0016 0366 0300 0052
53
Table A-7 SPFs Goodness of Fit Results for Rural Western Operational Region (No 10)
Data Estimation Data 70 Validation Data 30
Subtype Site MSE r2 R2FT MPB MAD MSPE R2
FT
Total VA 10990 0353 0321 0513 2210 10070 -0073
Total R10 6020 0311 0268 0007 1748 6050 0382
FI VA 2350 0196 0181 0045 1189 2600 -0034
Rural 4-Leg Signalized
FI R10 1880 0158 0139 0097 0945 1590 0254
Total VA 1090 0182 0167 -0067 0794 1190 0171
Total R10 1300 0196 0163 0070 0760 1020 0078
FI VA 0480 0112 0098 -0022 0504 0530 0110
Rural 4-Leg Minor Stop Control
FI R10 0560 0142 0118 0025 0495 0480 0014
Total VA 5490 0328 0305 -0010 1651 5760 0179
Total R10 3690 0163 0170 -0432 0748 6740 0039
FI VA 1450 0181 0170 -0041 0902 1710 0099
Rural 3-Leg Signalized
FI R10 0890 0124 0117 -0391 0997 4030 -0066
Total VA 0690 0144 0104 -0008 0613 0730 0102
Total R10 0640 0126 0091 0025 0583 0580 0055
FI VA 0250 0071 0048 -0009 0345 0260 0048
Rural 3-Leg Minor Stop Control
FI R10 0240 0062 0041 0003 0335 0230 0028
54
Table A-8 SPFs Goodness of Fit Results for Rural Eastern Operational Region (No 100)
Data Estimation Data 70 Validation Data 30
Subtype Site MSE r2 R2FT MPB MAD MSPE R2
FT
Total VA 10990 0353 0321 0513 2210 10070 -0073
Total R100 10120 0042 0027 1207 1882 5120 -0307
FI VA 2350 0196 0181 0045 1189 2600 -0034
Rural 4-Leg Signalized
FI R100 2060 0053 0039 0119 0962 1370 -0023
Total VA 1090 0182 0167 -0067 0794 1190 0171
Total R100 0960 0170 0149 -0086 0746 1140 0209
FI VA 0480 0112 0098 -0022 0504 0530 0110
Rural 4-Leg Minor Stop Control
FI R100 0440 0106 0092 -0031 0475 0490 0121
Total VA 5490 0328 0305 -0010 1651 5760 0179
Total R100 2770 0492 0459 0601 1759 6260 0090
FI VA 1450 0181 0170 -0041 0902 1710 0099
Rural 3-Leg Signalized
FI R100 1040 0265 0255 0124 0923 1570 -0055
Total VA 0690 0144 0104 -0008 0613 0730 0102
Total R100 0640 0125 0087 -0037 0601 0690 0119
FI VA 0250 0071 0048 -0009 0345 0260 0048
Rural 3-Leg Minor Stop Control
FI R100 0250 0064 0038 -0013 0345 0270 0062
55
APPENDIX B
RECOMMENDED SAFETY PERFORMANCE FUNCTION MODELS
Table B-1 Recommended Urban SPFs Site Virginia SPF Models to Be Used for Urban Intersections
Urban 4-Leg Signalized Total Virginia generic total
Urban 4-Leg Signalized
Operational Region 1 generic total
Urban 4-Leg Signalized
Operational Region 10
use specified model developed
Urban 4-Leg Signalized
Operational Region 100 generic total
Urban 4-Leg Signalized FI Virginia generic FI
Urban 4-Leg Signalized
Operational Region 1 generic FI
Urban 4-Leg Signalized
Operational Region 10
use specified model developed
Urban 4-Leg Signalized
Operational Region 100
use specified model developed
Urban 4-Leg Minor Stop Control
Total Virginia generic total
Urban 4-Leg Minor Stop Control
Operational Region 1
use specified model developed
Urban 4-Leg Minor Stop Control
Operational Region 10
use specified model developed
Urban 4-Leg Minor Stop Control
Operational Region 100
use specified model developed
Urban 4-Leg Minor Stop Control
FI Virginia generic FI e^-76917MajADT^05001MinADT^03695
Urban 4-Leg Minor Stop Control
Operational Region 1
use specified model developed
Urban 4-Leg Minor Stop Control
Operational Region 10
use specified model developed
Urban 4-Leg Minor Stop Control
Operational Region 100
use specified model developed
56
Table B-1 Recommended Urban SPFs (Continued)
Site Virginia SPF Models to Be Used for Urban Intersections
Urban 3-Leg Signalized
Total Virginia
use generic model developed for total
crashes
Urban 3-Leg Signalized
Operational Region 1
use generic model developed for total
crashes
Urban 3-Leg Signalized
Operational Region 10
use specific regional model
developed
Urban 3-Leg Signalized
Operational Region 100
use generic model developed for total
crashes
Urban 3-Leg Signalized FI Virginia
use generic model developed for FI
crashes
Urban 3-Leg Signalized
Operational Region 1
use generic model developed for FI
crashes
Urban 3-Leg Signalized
Operational Region 10
use specific regional model
developed
Urban 3-Leg Signalized
Operational Region 100
use generic model developed for FI
crashes
Urban 3-Leg Minor Stop Control
Total Virginia
use generic model developed for total
crashes
Urban 3-Leg Minor Stop Control
Operational Region 1
use generic model developed for total
crashes
Urban 3-Leg Minor Stop Control
Operational Region 10
use specific regional model
developed
Urban 3-Leg Minor Stop Control
Operational Region 100
use generic model developed for total
crashes
Urban 3-Leg Minor Stop Control
FI Virginia use generic model developed for FI
crashes
Urban 3-Leg Minor Stop Control
Operational Region 1
use generic model developed for FI
crashes
Urban 3-Leg Minor Stop Control
Operational Region 10
use specific regional model
developed
Urban 3-Leg Minor Stop Control
Operational Region 100
use generic model developed for FI
crashes
57
Table B-2 Recommended Rural SPFs Site Virginia SPF Models to Be Used for Rural Intersections
Rural 4-Leg Signalized Total Virginia
use generic model developed for total
crashes
Rural 4-Leg Signalized
Operational Region 1
use generic model developed for total
crashes
Rural 4-Leg Signalized
Operational Region 10
use specific regional model developed
Rural 4-Leg Signalized
Operational Region 100
use specific regional model developed
Rural 4-Leg Signalized FI Virginia use generic model
developed for FI crashes
Rural 4-Leg Signalized
Operational Region 1
use generic model developed for FI crashes
Rural 4-Leg Signalized
Operational Region 10
use specific regional model developed
Rural 4-Leg Signalized
Operational Region 100
use specific regional model developed
Rural 4-Leg Minor Stop Control Total Virginia
use generic model developed for total
crashes
Rural 4-Leg Minor Stop Control
Operational Region 1
use generic model developed for total
crashes e^-549MajADT^035MinADT^039
Rural 4-Leg Minor Stop Control
Operational Region 10
use specific regional model developed
Rural 4-Leg Minor Stop Control
Operational Region 100
use generic model developed for total
crashes
Rural 4-Leg Minor Stop Control FI Virginia use generic model
developed for FI crashes
Rural 4-Leg Minor Stop Control
Operational Region 1
use generic model developed for FI crashes
Rural 4-Leg Minor Stop Control
Operational Region 10
use generic model developed for FI crashes
Rural 4-Leg Minor Stop Control
Operational Region 100
use generic model developed for FI crashes
58
Table B-2 Recommended Rural SPFs (Continued)
Site Virginia SPF Models to Be Used for Rural Intersections
Rural 3-Leg Signalized Total Virginia use generic model
developed for total crashes
Rural 3-Leg Signalized
Operational Region 1
use generic model developed for total crashes
Rural 3-Leg Signalized
Operational Region 10
use generic model developed for total crashes
Rural 3-Leg Signalized
Operational Region 100
use generic model developed for total crashes
Rural 3-Leg Signalized FI Virginia use generic model
developed for FI crashes
Rural 3-Leg Signalized
Operational Region 1
use generic model developed for FI crashes
Rural 3-Leg Signalized
Operational Region 10
use generic model developed for FI crashes
Rural 3-Leg Signalized
Operational Region 100
use generic model developed for FI crashes
Rural 3-Leg Minor Stop Control Total Virginia use generic model
developed for total crashes
Rural 3-Leg Minor Stop Control
Operational Region 1
use generic model developed for total crashes
Rural 3-Leg Minor Stop Control
Operational Region 10
use specific regional model developed
Rural 3-Leg Minor Stop Control
Operational Region 100
use generic model developed for total crashes
Rural 3-Leg Minor Stop Control FI Virginia use generic model
developed for FI crashes
Rural 3-Leg Minor Stop Control
Operational Region 1
use generic model developed for FI crashes
Rural 3-Leg Minor Stop Control
Operational Region 10
use specific regional model developed
Rural 3-Leg Minor Stop Control
Operational Region 100
use generic model developed for FI crashes

FINAL CONTRACT REPORT
SAFETY PERFORMANCE FUNCTIONS FOR INTERSECTIONS ON HIGHWAYS MAINTAINED BY THE VIRGINIA DEPARTMENT OF TRANSPORTATION
Nicholas J Garber PhD PE Professor of Civil amp Environmental Engineering
Griselle Rivera
Graduate Research Assistant
Department of Civil amp Environmental Engineering University of Virginia
Project Manager Catherine C McGhee PE Virginia Transportation Research Council
In Cooperation with the US Department of Transportation Federal Highway Administration
Contract Research Sponsored by
the Virginia Transportation Research Council (A partnership of the Virginia Department of Transportation
and the University of Virginia since 1948)
Charlottesville Virginia
October 2010 VTRC 11-CR1
ii
DISCLAIMER
The project that was the subject of this report was done under contract for the Virginia Department of Transportation Virginia Transportation Research Council The contents of this report reflect the views of the authors who are responsible for the facts and the accuracy of the data presented herein The contents do not necessarily reflect the official views or policies of the Virginia Department of Transportation the Commonwealth Transportation Board or the Federal Highway Administration This report does not constitute a standard specification or regulation Any inclusion of manufacturer names trade names or trademarks was for identification purposes only and is not to be considered an endorsement
Each contract report is peer reviewed and accepted for publication by Research Council staff with expertise in related technical areas Final editing and proof reading of the report are performed by the contractor
Copyright 2010 by the Commonwealth of Virginia All rights reserved
iii
ABSTRACT
In recent years significant effort and money have been invested through research and implemented safety projects to enhance highway safety in Virginia However there is still substantial room for improvement in both crash frequency and severity As there are limits in the available funds for safety improvements it is crucial that allocated resources for safety improvement be spent at highway locations that will result in the maximum safety benefits In addition intersection crashes play a significant role in the safety conditions in Virginia For example crashes at intersections in Virginia for the period 2003 through 2007 account for 438 of all crashes and 26 of fatal crashes Therefore identifying intersections for safety improvements that will give the highest potential for crash reduction when appropriate safety countermeasures are implemented will have a significant impact on the overall safety performance of roads in Virginia
The Federal Highway Administration (FHWA) has developed a procedure for identifying
highway locations that have the highest potential for crash reduction (ITT Corporation 2008) A critical component of this method is the use of safety performance functions (SPFs) to determine the potential for crash reductions at a location An SPF is a mathematical relationship (model) between frequency of crashes by severity and the most significant causal factors on a specific highway Although the SafetyAnalyst Userrsquos Manual presents several SPFs for intersections these were developed using data from Minnesota FHWA also suggested that if feasible each state should develop its own SPFs based on crash and traffic volume data from the state as the SPFs that are based on Minnesota data may not adequately represent the crash characteristics in all states SPFs for intersections in Virginia were developed using the annual average daily traffic as the most significant causal factor emulating the SPFs currently suggested by SafetyAnalyst The SPFs were developed for both total crashes and combined fatal plus injury crashes through generalized linear modeling using a negative binomial distribution Models were also developed for urban and rural intersections separately and in order to account for the different topographies in Virginia SPFs were also developed for three regions Northern Western and Eastern
This report covers Phases I and II of the study which includes urban and rural
intersections maintained by VDOT Statistical comparisons of the models based on Minnesota data with those based on the Virginia data showed that the specific models developed for Virginia fit the Virginia crash data better The report recommends that VDOTrsquos Traffic Engineering Division use the SPFs developed for Virginia and the specific regional SPFs suggested in this report to prioritize the locations in need of safety improvement
FINAL CONTRACT REPORT
SAFETY PERFORMANCE FUNCTIONS FOR INTERSECTIONS ON HIGHWAYS MAINTAINED BY THE VIRGINIA DEPARTMENT OF TRANSPORTATION
Nicholas J Garber PhD PE
Professor of Civil amp Environmental Engineering
Griselle Rivera Graduate Research Assistant
Department of Civil amp Environmental Engineering
University of Virginia
INTRODUCTION
The Virginia Department of Transportation (VDOT) is continually identifying ways to
enhance the achievement of Virginiarsquos broad vision statement to make Virginiarsquos surface transportation system the safest in the nation by 2025 (Virginia Surface Transportation Safety Executive Committee 2006) Reductions in crash occurrence and severity at intersections will significantly contribute to the overall safety improvements in Virginia as intersection crashes form a large proportion of crashes that occur on Virginiarsquos surface transportation system For example Table 1 shows that for 2003 through 2007 intersection crashes on VDOT-maintained roads accounted for about 44 of all crashes and Table 2 shows that about 26 of fatal crashes occurred at intersections
In addition because of limited funds it is crucial that allocated resources for safety improvement be spent at highway locations that will result in the maximum safety benefits The Federal Highway Administration (FHWA) has developed a prioritization methodology for safety improvements using the empirical Bayes (EB) method This method prioritizes sites for safety improvement to obtain the greatest safety benefits (ITT Corporation 2008) This procedure requires the use of safety performance functions (SPFs) An SPF relates the frequency of crashes by severity with the most significant causal factors on a specific type of road For example Figure 1 shows a schematic graph of an SPF for a highway segment to demonstrate how it is used in site prioritization
Table 1 Total and Intersection Crashes For 2003 Through 2007
Year Total Crashes Intersection
Crashes Proportion
()
2003 94817 41116 434 2004 95063 42042 442 2005 96066 42064 438 2006 93732 41714 445 2007 89394 38695 433
TOTAL 469072 205631 438
2
Table 2 Total Fatal and Intersection Fatal Crashes for 2003 Through 2007
Year Total Fatal
Crashes Intersection
Fatal Crashes Proportion
()
2003 726 216 298 2004 723 188 260 2005 752 188 250 2006 722 193 267 2007 778 184 237
TOTAL 3701 969 262
Figure 1 Example of a Safety Performance Function (SPF)
SPFs are developed for different roadway segments and intersection configurations
Currently the SPFs suggested by FHWA use only annual average daily traffic (AADT) as the most significant causal factor For example an intersection SPF gives the predicted number of crashes per year for given AADTs on the major and minor approaches SPFs aid the transportation planner to identify better where to expend limited staff resources on detailed assessments to determine feasible and effective treatments AADT-driven SPFs are practical for network screening Adding more independent variables beyond AADT may be too labor intensive The corresponding EB-adjusted long-term number of crashes can be computed from the actual observed crashes and the SPF-predicted number of crashes for the given AADT As it can be seen in Figure 1 the difference between the EB-adjusted long-term number of crashes and the SPF-predicted number of crashes gives the potential for safety improvement (PSI) The PSI can be better described as the potential for intersection sites to be upgraded or repaired by reducing crashes and improving safety if appropriate countermeasures are applied to these sites This can be used to develop a priority list of the specific sites or intersections where detailed assessments to determine feasible and effective treatment can be undertaken Sites that have a
3
greater PSI are given a higher prioritization when all selected sites are ranked in order to determine which sites should receive prompt attention
SafetyAnalyst provides a set of state-of-the art software tools for use in the decision-
making process to identify safety needs and develop a program for site-specific safety improvement projects SafetyAnalyst also plays an important role because it helps make sure that highway agencies receive the greatest possible safety benefit from every dollar spent toward safety modifications (FHWA 2010) FHWA-suggested SPFs for intersections are however based on data from Minnesota and it has been recommended that individual states develop SPFs based on their own crash and AADT data (Harwood et al 2004) The development of SPFs for Virginia is of great importance when safety improvement is being considered Because of the important role SPFs play in the software tools in SafetyAnalyst it is essential at least to test how well the FHWA-suggested SPFs fit the Virginia data and if necessary to develop specific SPFs for Virginia
PURPOSE AND SCOPE
The purpose of this study was to investigate the extent to which the FHWA-suggested
intersection SPFs which were based on Minnesota data were transferable to Virginia and if necessary to develop Virginia-specific SPFs using crash and corresponding AADTs for intersection sites in Virginia The SPFs for this study include those for total crashes and combined fatal and injury (FI) crashes with different configurations such as four-leg and three-leg intersections signalized intersections and unsignalized intersections or urban and rural locations
The scope was limited to intersection types on VDOT-maintained roads for which
appropriate and adequate data were available This report gives the results obtained for urban and rural intersections The objectives were as follows
1 Evaluate the transferability of the FHWA-suggested SPFs to Virginia 2 If necessary develop SPFs for different intersection types that are suitable for use in
Virginia 3 Identify some of the intersections that have a higher than expected number of crashes
Crashes related to two-lane roads were investigated in a separate study (Garber et al
2010) It is anticipated that the results obtained from both studies will produce a set of SPFs that can be applied to Virginia and be used to prioritize those two-lane segments and intersections that are in need of safety improvements thereby improving the transportation planning process
4
METHODS
Ten tasks were performed to achieve the study objectives 1 Conduct a literature review 2 Select study sites 3 Extract crash data 4 Extract AADT data 5 Evaluate the transferability to Virginia of the suggested Minnesota SPFs 6 Develop specific SPFs for Virginia 7 Evaluate the Virginia SPFs developed 8 Determine the appropriate number of SPFs for Virginia through a pruning process 9 Prioritize sites based on potential for crash reduction 10 Evaluate benefits and implementation prospects
Literature Review
Recent publications related to the development and evaluation of SPFs for different highway systems were identified and reviewed so as to identify information of relevance to this study Sources used were the Transportation Research Information System (TRIS) the VDOT Research Library and the University of Virginia libraries
Selection of Study Sites
The research team in consultation with staff from VDOTrsquos Traffic Engineering Division
(TED) initially selected 21112 intersections under the jurisdiction of VDOT for the study These included all intersections for which the location was properly identified by an intersection node and for which geometric characteristics remained the same throughout the study period of 2003 through 2007 The required geometric traffic and crash data for each site were then extracted from the relevant databases The data were obtained primarily from the Highway Traffic Records Information System (HTRIS) HTRIS is a comprehensive Oracle database system which interrelates and consolidates Virginiarsquos highway and traffic information used for internal management and reporting VDOT maintains detailed records on current and historical roadway crash and traffic information in HTRIS For this reason only VDOT-maintained roads were used for analysis This database system contains multiple subsystems three of which were used to extract data for this study roadway inventory (RDI) for intersection configuration and type of control accident (ACC) for crash counts and highway performance monitoring system (HPMS) for AADTs Using the available data each intersection was classified based on the area type (urban or rural) the traffic control system (signalized stop control or yield control) and the configuration (number of approaches) Intersections for which all the data requirements for proper classification were not available were deleted from the list of study sites
The classification of an intersection as urban or rural was based on VDOTrsquos classification
of each approach route Intersections with all approaches designated as rural were classified as
5
rural and those with all approaches designated as urban were classified as urban Intersections with urban and rural approaches were removed from the list of study sites to minimize the uncertainty A data quality analysis was also performed to ascertain that the AADT values for all approaches of each intersection and for each year of the study period were available Intersections with incomplete data were removed from the study including yield all-way stop and intersections with five approaches This resulted in 18356 intersections classified as urban or rural as shown in Table 3
Virginia is divided into five operational regions as shown in Figure 2 After consultation
with VDOT and the technical review panel the different topographical characteristics in Virginia were then used to group the intersections into three regional groups as Northern Western and Eastern The Northern region is composed of intersections in Northern Virginia and surrounding counties the Western region is considered to have a mountainous terrain and the Eastern region is considered to have rolling to flat terrain Table 3 also shows the specific districts and counties in each of the three regions used in this study This regional classification helped to partially account for different characteristics that are encountered throughout the state
Table 3 Urban and Rural Classification Operational Region Districts Urban Rural Total
Northern (No 1)
District 9 (NOVA) + Culpeper (023) Fauquier County (030) King George County (048) Madison County (056) Orange County (068) Rappahannock County (078) Spotsylvania (088) Stafford County (089)
4620 596 5216
Western (No 10)
District 1 (Bristol) District 2 (Salem) District 3 (Lynchburg) District 8 (Staunton) + Albemarle County (002) Fluvanna County (032) Greene County (039) Louisa County (054)
1197 6706 7903
Eastern (No 100)
District 4 (Richmond) and District 5 (Hampton Roads) + Caroline County (016) Essex County (028) Gloucester County (036) King amp Queen County (049) King William (050) Lancaster County (051) Mathews County (057) Middlesex County (059) Northumberland County (066) Richmond County (079) Westmoreland County (096)
2193 3044 5237
Total 8010 10346 18356 Proportion () 4364 5636 100 Alternative method of identifying regions for easy application of the SAS code No 1 = Northern region No 10 = Western region No 100 = Eastern region
6
Figure 2 Virginia Operational Regions (Cogburn 2007)
The study considered urban and rural intersections with urban consisting of 8010 intersections and rural consisting of 10346 intersections as shown in Table 4
The intersections were also divided by their configuration (number of approaches) and
the type of traffic control (signalized or minor stop control) The number of urban intersection sites for each category is shown in Table 5 and that for rural intersections in Table 6 The total number of rural four-leg signalized and rural three-leg signalized sites is much lower than that for the urban signalized intersections However this is expected as a much lower percentage of rural intersections are signalized In addition all-way stop intersections were excluded because of the low number at the time of the study
Table 4 Proportion of Urban and Rural Sites by Region
Operational Region Urban Proportion () Rural Proportion () Northern 4620 5768 596 5760 Western 1197 1494 6706 64817 Eastern 2193 2738 3044 29423 TOTAL 8010 100 10346 100
Table 5 Distribution of Urban Sites by Geometric Configuration
Operational Region Urban 4-leg Signalized
Urban 4-leg 2-Way Stop
Urban 3-leg Signalized
Urban 3-leg Minor Stop Total
Northern 371 766 497 2986 4620 Western 53 153 137 854 1197 Eastern 144 320 202 1527 2193 TOTAL 568 1239 836 5367 8010 Proportion () 709 1547 1044 6700 100
7
Table 6 Distribution of Rural Sites by Geometric Configuration
Operational Region Rural 4-leg Signalized
Rural 4-leg 2-Way Stop
Rural 3-leg Signalized
Rural 3-leg Minor Stop Total
Northern 19 67 13 497 596 Western 90 894 117 5605 6706 Eastern 73 609 53 2309 3044 TOTAL 182 1570 183 8411 10346 Proportion () 176 1517 177 8130 100
Crash and Operational Data Collection
As previously discussed HTRIS serves as a centralized warehouse of traffic and roadway data for Virginia and is composed of various subsystems that carry distinct data RDI ACC and HPMS were the three subsystems used to extract the necessary data for the study
VDOTrsquos TED staff extracted the crash data by using the ACC database for the years
2003 through 2007 The ACC database is composed of data derived from the crash report forms (DMV FR300) that are filled out by police officers and include data such as driverrsquos actions driver characteristics environmental conditions collision type and crash severity among other factors The database developed for this study included total fatal injury and property damage only (PDO) (property damage greater than $1000) crashes that occurred within a distance of 250 feet or 0047 mile of the intersection which matches the procedure used to develop the suggested SPFs in SafetyAnalyst The RDI database was used to identify the intersection ID or node number for the urban and rural intersection sites that had the same geometric conditions throughout the 5 years selected for the study
A Structured Query Language (SQL) program was developed for retrieving and
formatting the required data for the analysis This query specified the intersection node configuration approach volumes urbanrural classification crashes and traffic control device for each year of the study period The Statistical Analysis Software SAS (913) was then used to format the data in a way suitable for the analysis (SAS Institute Inc 2009)
Annual Average Daily Traffic Selection
The major and minor AADTs were used as the independent variables in developing the SPFs for intersections in Virginia in accordance with the SPFs developed for SafetyAnalyst (Harwood et al 2004) It was therefore necessary to identify the major and minor approaches at each intersection In determining the major and minor AADTs it was recommended by VDOT that for four-leg approaches the major entering volume should be the sum of the two highest approach volumes and the minor entering volume the sum of the two lowest approach volumes For three-leg approaches the major entering volume was the sum of the two highest approach volumes The highway performance monitoring system database was used to obtain the AADTs for the selected study sites
8
Evaluation of Recommended Minnesota SPFs
Once all of the necessary data were obtained for each of the study sites the SafetyAnalyst-recommended SPFs which are based on data for intersections in Minnesota were tested to determine how well they fit the Virginia data Both graphical and statistical methods were used to conduct these tests The graphical method consisted of a visual inspection of the spread of the Virginia data for a specific configuration of intersection and the actual crashes of a given severity plotted with the resultant curve from using the same Virginia database and the corresponding recommended Minnesota SPF The statistical test consisted of computing the Freeman-Tukey RFT 2 coefficients for the recommended SPFs using the appropriate Virginia data The RFT
2 coefficient was used as this was the statistical parameter used to represent the goodness of fit (ITT Corporation 2008) in developing the SafetyAnalyst-recommended SPFs Equations 1 2 and 3 show how the data were transformed to compute the RFT
2 (Fridstroslashm et al 1995) fi = ( yi )05 + ( yi +1 )05 (Eq 1) ecirci = fi ndash ( 4 times ŷi + 1 )05 (Eq 2) RFT
2 = 1 ndash sumiecirci2 sumi( fi ndash fm )2 (Eq 3)
where fi = Freeman-Tukey transformation statistic yi = observed data at site i ecirci = residual at site i ŷi = modeled (predicted) value at site i fm= mean of the transformation statistic (fi) across all sites of the same configuration and urbanrural classification RFT
2 = Freeman-Tukey R2
Developing Virginia-Specific SPFs
The format of the specific SPFs developed for Virginia is the same as that in the
SafetyAnalyst manual and given as
1 2k e x MajAADT x MinAADTβ βα= (Eq 4) where
k = predicted crash frequency per intersection per year MajAADT = AADT on the major road (vehday) MinAADT = AADT on the minor road (vehday) α = intercept
9
β1 = coefficient of major AADT β2 = coefficient of minor AADT
In developing the SPFs a negative binomial (NB) distribution for the crash data was
used as preliminary analysis showed that the data fit the NB distribution The form of the data used to develop the SPFs can be either the panel or cross-sectional (collapsed) format According to Kweon and Lim (2010) the panel format uses original panel data which consist of assembling several years of data over the same intersection and the cross-sectional models use pseudondashcross-sectional data which are data converted or rearranged from the panel set The difference between the two types of models obtained is that the model based on the panel data form takes advantage of the characteristics of the panel data by positioning a predefined correlation structure on reciprocated measures over years at the same time whereas the model based on the cross-sectional form uses the data created by collapsing the multi-year panel data into apparently a single-year panel data The crash data were divided into the estimation and validation portions Seventy percent was selected randomly and used as the estimation data to develop the SPFs and the remaining 30 was used as the evaluation data
An estimation of acceptable values was made for the regression coefficients and the
dispersion parameter when developing the SPFs for the EB method in SafetyAnalyst The regression coefficients are critical for the comparison of different SPFs The dispersion parameter (d) is important when using the EB method in SafetyAnalyst because it plays an integral function in computing the EB weight that influences the estimate of the EB long-term predicted crashes When determining the dispersion parameter from SAS for the urban four-leg signalized intersections the values obtained were d = 02223 for the panel data and d = 02216 for the collapsed data but when determining the values for the urban four-leg two-way stop intersections the values calculated were d = 04284 for panel data and d = 02518 for collapsed data In the urban four-leg two-way stop intersections a significant difference in the d values was observed which led to the choice of panel data for the modeling as they would be more reliable than the collapsed data By looking at the obtained values it can be appreciated that the collapsed model underestimates the dispersion which will eventually cause the EB value to inflate therefore leading to a biased report for the collapsed model
Generalized linear modeling (GLM) was used to create a correlation between the intersection crashes for the 5 years chosen for analysis and the major and minor approach volumes For the statistical modeling SAS was employed (SAS Institute Inc 2009) This software includes the GENMOD procedure and the equation used is the same as given in Equation 5 The GENMOD procedure gives an output of generalized estimating equations (GEE) parameter estimates which are the ones used to develop the Virginia SPFs
1 2exp( )it itk MajAADT MajAADTα β β ε= + + + (Eq 5) where i = intersection index (i = 1hellip N) t = severity index (t = TOT [total crashes] FI [fatal + injury crashes] PDO [property damage only])
10
α = intercept β1 = coefficient of major AADT β2 = coefficient of minor AADT
itk = dependent variable at intersection i and severity t (crashesyr) νit = random error exp (νit) Gamma (θ θ) εit = random (residual) error in GEE
The random errors presented in this equation have the function of not letting the β values or coefficients become biased
Evaluation of Virginia-Specific SPFs
Several statistical parameters were used to assess how well the Virginia SPFs fit the data The parameters used and suggested by Washington et al (2005) were the mean prediction bias (MPB) the mean absolute deviation (MAD) the mean square error (MSE) the mean squared prediction error (MSPE) the Pearsonrsquos product moment correlation coefficients between observed and predicted crash frequencies (used for both validation and estimation data) dispersion parameters and the Freeman Tukey RFT
2 coefficients computed from Equation 3 To test the fit of the SPFs the 70 estimation data set was used to calculate the MSE the Pearsonrsquos product moment correlation coefficients the R2 and the R2
FT To test the transferability of the SPFs the 30 validation data set was used to compute the MPB MAD and the MSPE The expressions used to determine these coefficients are given in Equations 6 through 10
( )2
iin
1i
nYYMPB
2 minussum= = (Eq 6)
2
n
1i ii
n
YYMAD
2sum=minus
= (Eq 7)
( )
pnYY
MSE1
n
1i
2
ii2
minus
minus= sum = (Eq 8)
( )
2
n
1i
2
ii
nYY
MSPE2sum=
minus= (Eq 9)
where p = degrees of freedom i = intersection index Yi = observed crash frequency at intersection i Ŷi = predicted crash frequency at intersection i
11
n2 = validation data sample size 30 n1 = estimation data sample size 70
(Eq 10) where
_
1Y = average of observed crashes per intersections _
2Y = average of predicted crashes per intersections Yi1 = observed values at intersection i Y i2 = predicted values at intersection i
It should be noted that when values obtained from the MPB MAD MSE and MSPE
formulas are close to 0 it indicates a good fit or desirable SPF and when values for the RFT2 and
R2 formulas are close to 1 it indicates a suitable fit The dispersion parameter (d) is used in the variance-mean relationships as shown in Equations 11 and 12
(Eq 11)
( ) ( ) ( )i i i i i iVar Y X E Y X d x E Y X= + (Eq 12) A weighting factor (Wi) used in the EB procedure is obtained from Equation 13 and used in Equation 14 to obtain the EB-estimated value
( )1
1ii i
Wd x E Y X
=+
(Eq 13)
( ) ( ) ( )1EB i i i i i i iE E y y W x E Y X W x Y= + minus (Eq 14)
where 0 lt W lt 1 Var (|) = conditional variance E (|) = conditional mean Var m or Var (Yi|Xi) = estimated variance of mean crash rate E m or E (Yi|Xi) = estimated mean crash rate from SPF d = estimated NB dispersion parameter (also called overdispersion parameter)
2Var m E m d x E m= +
( )( )( ) ( )
1 1 2 21 22 2
1 21 2
i i
i i
Y Y Y Yr
Y Y x Y Y
sum minus minus=⎡ ⎤sum minus sum minus⎢ ⎥⎣ ⎦
12
W = weight Xi = variables such as AADT Yi = number of observed crashes per year at intersection i EEB = EB-adjusted estimated crashes (crashesyr)
In the variance-mean relationship if the value obtained for the dispersion parameter d is 0 then the variance is the same as the mean (see Equations 11 and 12) which causes the NB model to collapse to the Poisson model This parameter has a strong influence on the weight in the EB formula (see Eq 13) therefore it has an effect in the EB-estimated value SAS was helpful in computing this parameter for the different types of intersections analyzed in the study throughout the 5 years
Pruning Process
Before the site prioritization was performed pruning was done to avoid over-representation of the SPFs that might not reflect much difference in the study when compared with statewide SPFs At the completion of the pruning process only the necessary or minimum effective SPFs were retained MSPE is typically the parameter used to assess errors associated with a validation data set for this reason MSPE was used for pruning In order to verify whether a specific regional SPF should be retained or not the validation data set (30 of the data) was used to compute MSPE for both the specific regional SPFs and the corresponding statewide SPFs If MSPE for the regional SPF was greater than that for the corresponding Virginia statewide SPF or if the difference between these two MSPEs was less than 10 it was concluded that the regional SPF was not necessary and it was therefore discarded The following example illustrates the steps for urban four-leg signalized FI crashes in Region 1
1 The 30 FI crash data were obtained for urban signalized four-leg intersections in Region 1 and the MSPE was determined using the statewide SPF for the FI urban four-leg signalized intersections
2 The 30 FI crash data for urban signalized four-leg intersections in Region 1 were
then used to determine MSPE for the specific Region 1 SPF for FI crashes 3 Verify if the MSPE value for the specific regional SPF is higher than the statewide
MSPE value if yes discard the specific regional SPF if no tentatively retain the specific regional model
4 The difference between the two MSPEs was determined to determine whether it was
less than 10 of the statewide MSPE if yes discard the specific regional SPF if no retain the specific regional model This process was repeated for all regional SPFs
13
Identification of Intersections with a Higher Than Expected Number of Crashes
In order to identify some of the intersections with a higher than expected number of crashes a prioritization analysis based on the EB method was conducted This analysis was carried out to identify the top 25 intersections with a high PSI in the urban areas of the Northern Virginia and Bristol districts These two districts were selected to identify any effect of the approach AADTs as two-lane roads in the Northern Virginia District carry much higher volumes than those in the Bristol District The PSI is the difference between the EB-adjusted long-term crashes and the SPF-estimated crashes The PSI was first determined and then a priority list was developed with intersections showing a higher PSI receiving a higher priority This procedure first required the computation of yearly calibration factors (Cy) that accounted for intrinsic yearly variations that were not accounted for in developing the SPFs These yearly calibration factors were determined using the steps described here and given in Equations 15 through 18 (ITT Corporation 2008) Calculation of Yearly Calibration Factor (Cy) For subtype s and severity t the following steps were performed 1 Calculate the (unadjusted) predicted number of crashes using the appropriate SPF yiMinAADTMajAADTe ststst
isyisyisty amp~ 21ˆˆˆ foralltimestimes= ββακ (Eq 15)
2 Sum the predicted numbers over all intersections
ysN
iistysty forall=sum
=
~~1κκ (Eq 16)
3 Sum the observed numbers of crashes over all intersections
yKKsN
iistysty forall=sum
=
1
(Eq 17)
4 Calculate yearly calibration factor csty
yK
csty
stysty forall= ~κ (Eq 18)
5 Repeat the steps for all subtypes (s) and severities (t)
where i = intersection index (i = 1hellip N)
14
s = subtype index (s = urban four-leg signalized intersection rural three-leg minor stop controlled intersection etc) t = severity index (t = TOT [total crashes] FI [fatal + injury crashes] PDO [property damage only]) y = year index (i = 1 [base year] 2 hellip Y) csty = yearly calibration factor for crash subtype s severity t and year y MajAADT = AADT on the major road (vehday) MinAADT = AADT on the minor road (vehday)
istyκ~ = (unadjusted) predicted number of crashes at intersection i for crash subtype s severity t and year y
istyκ = (adjusted) predicted number of crashes at intersection i for crash subtype s severity t and year y α = intercept
1β = coefficient of major AADT 2β = coefficient of minor AADT
These yearly calibration factors were then used to determine the predicted number of
crashes at an intersection based on the SPF for the severity of crashes and type of intersection being considered The PSI for each intersection was then determined using the steps described in Equations 19 through 22 (ITT Corporation 2008) Steps for Calculating PSI for Subtype s
1 Calculate the (adjusted) predicted number of crashes
amp~
21ˆˆˆ ststst
isyisysty
istystyisty
MinAADTMajAADTec
yticββα
κκ
timestimestimes=
foralltimes= (Eq 19)
2 Calculate yearly correction factor Cisty
ytiCyist
istyisty amp
)1(
forall==κ
κ
(Eq 20)
3 Calculate EB weight
tid
w Y
y istystist amp
11
1
foralltimes+
=sum =
κ (Eq 21)
4 Calculate the EB-adjusted estimated number of crashes for year 1
15
tiC
KwwX Y
y isty
Y
y istyistyististyist amp)1(
1
1)1()1( forallminus+times=
sumsum
=
=== κ (Eq 22)
5 Determine the PSI for each intersection If istYX gt istYκ include intersection i in the list for prioritization using istYPSI = istYX
where i = intersection index (i = 1hellip N) s = subtype index (s = urban four-leg signalized intersection rural three-leg minor stop
controlled intersection etc) t = severity index (t = TOT [total crashes] FI [fatal + injury crashes] PDO [property damage
only]) y = year index (y = 1 [base year] 2 hellip Y) cy = yearly calibration factor for crash subtype s severity t and year y d = dispersion parameter w = weight MajAADT = AADT on the major road (vehday) MinAADT = AADT on the minor road (vehday) PSI = potential for safety improvement
istyC = yearly correction factor
istyκ~ = (unadjusted) predicted number of crashes at intersection i for crash subtype s severity t and year y
istyκ = (adjusted) predicted number of crashes at intersection i for crash subtype s severity t and year y
istyX = EB-adjusted estimated number of crashes α = intercept
1β = coefficient of major AADT 2β = coefficient of minor AADT
The prioritization lists for urban two-lane roads in the Northern Virginia and Bristol
districts were then developed based on the PSIs obtained for three prioritization procedures These alternative prioritization procedures were the average crash rates (ACRs) for the study period (see Equation 23) the critical crash ratio (CCR) (see Eqs 24 through 27) (Garber and Hoel 2009) and the EB method The list was developed with the intersections having the highest PSI listed first followed by other intersections in descending order The execution of the EB method prioritization process was achieved through use of the computer codes in SAS Finally the effectiveness of using the EB method for prioritizing sites for safety improvement was illustrated by comparing the PSIs from using intersection crash rates critical crash and the EB procedures
16
Procedure for Crash Rate Method The ACR for the intersection is given as
( )(1000000)( )( )(365)T
TCACRN V
= (Eq 23)
where ACR = the average crash rate for the intersection under consideration (crashes1000000
approach volume) TC = number of crashes over the study period at the intersection N = duration of study period (yr) VT = average daily total approach volume at the intersection Procedure for Critical Rate Method
The critical rate method was accomplished by first computing the traffic base (TB) of the intersection under consideration using Equation 24 The ACR for the intersection under consideration is then computed using its TB as shown in Equation 25 The intersection critical crash rate (ICCR) is then determined using Equation 26 The critical crash ratio (CCR) for the intersection is then computed as the ratio of ICR and the average crash rate (AVR) for all intersections under the same category (intersection type urbanrural etc) as that for the intersection being considered using Equation 27 TB is given as
365
1 000 000
NxVxTB = (Eq 24)
where TB = the total approach volume over the study period of N years at the intersection under consideration (veh1000000) V = average daily approach volume at the intersection under consideration ACR is obtained as
TCACRTB
= (Eq 25)
where ACR = ACR at the intersection under consideration over the study period of N years
17
TB = the total approach volume over the study period of N years at the intersection under consideration (veh1000000) The critical crash rate (ICCR) for the intersection under consideration is given as
05 AVRICCR AVR TFTB TB
= + + (Eq 26)
where AVR = ACR for intersections within the state and of the same designation (eg rural three-leg with minor stop control) as that for the intersection under consideration TF = number of standard deviations for the confidence level being used in the analysis (usually 196 for 95 confidence level) TB = the total approach volume over the study period of N years at the intersection under consideration (veh1000000) The critical crash ratio (CCR) for the intersection is then obtained as
ACRCCRICCR
= (Eq 27)
where ACR = ACR at the intersection under consideration over the study period of N years (see Eq 2) ICCR = critical crash rate for the intersection under consideration (see Eq 26)
Benefits and Implementation Expectations
The expected benefits from developing SPFs and prioritizing intersection sites were illustrated by comparing the PSIs for the prioritized sites when sites were prioritized using the EB method with those obtained when sites were prioritized using crash rates and the critical crash ratio This analysis was conducted for the combined fatal plus injury crashes SPFs An estimate of the cost savings attributable solely to the potential reduction of crashes was also computed by using crash costs given in an FHWA study (FHWA 2005)
18
RESULTS AND DISCUSSION
Literature Review
SafetyAnalyst
The SafetyAnalyst Userrsquos Manual (ITT Corporation 2008) has SPFs that are suggested for intersections that are based on Minnesota data Tables 7 and 8 show the regression coefficients (α β1 and β2) for the SPFs developed for total and combined FI crashes respectively The values for the goodness of fit parameter RFT
2 are also given Although these RFT2 are all less
than 045 with a few less than 010 it has been suggested that the SPFs used in SafetyAnalyst could provide a realistic estimate of an expected crash frequency as a function of traffic volume and roadway geometry (Pham and Ragland 2005)
Methodological and Research References
Several studies similar to this study have been conducted in Canada Colorado California Texas New York and Minnesota For example a study was conducted using data from Colorado California and Texas to examine the functional form of the SPFs for urban freeways (Kononov et al 2008) Five years of crash data were acquired from the respective departments of transportation and the highway safety information system from Colorado The study revealed that the amount of crashes increased moderately with congestion in segments on urban freeways This study however did not include intersections
A study by Lyon et al was conducted in Toronto Ontario Canada to develop SPFs for urban signalized intersections (Lyon et al 2005) Collision data were gathered for five years and included 1950 urban intersections SPFs were developed for different severity levels impact types and intersection types such as four-leg and three-leg intersections The format used to develop the SPFs is shown in Equation 28 This format is somewhat different from that of Equation 4 suggested in Safety Analyst
Collisionsyear = α (F1)β1(F2)β2 exp (β3X1 + β4X2 + ) (Eq 28) where α and βi = the coefficients estimated in the SPF calibration process F1 and F2 = the entering AADTs on the major and minor roads respectively Xi = other independent variables (such as single lane versus multilane approaches with and without left-turn lanes or right-turn lanes high and low pedestrian activities or in some cases F1 or F2 or both)
19
Table 7 SafetyAnalystrsquos SPFs for Intersections (Total Crashes) Site
subtype Code
Site subtype Description
State Regression coefficients
LogIntercept (α)
Regression coefficients
LogAADTmaj (β1)
Regression coefficients LogAADT
min (β2)
Over - dispersion Parameter
(k)
RFT2
() Number of Sites
Max AADTmaj
(vehday)
Max AADTmin
(vehday)
Rural 201 Rural 3-leg with minor-
road STOP control MN -878 071 024 107 133 1706 28500 27000
202 Rural 3-leg with all-way STOP control
MN -1237 122 027 047 41 41 25300 6803
203 Rural 3-leg with signal control
MN -657 066 02 033 26 136 36400 11500
204 Rural 4-leg with minor-road STOP control
MN -896 065 047 07 299 2114 35500 26700
205 Rural 4-leg with all-way STOP control
MN -1237 122 027 047 41 41 25300 6803
206 Rural 4-leg with signal control
MN -657 066 02 033 26 136 36400 11500
Urban 251 Urban 3-leg with minor-
road STOP control MN -535 034 028 128 59 397 68000 18900
252 Urban 3-leg with all-way STOP control
MN -1237 122 027 047 41 41 25300 6803
253 Urban 3-leg with signal control
MN -985 097 018 023 414 33 50000 25807
254 Urban 4-leg with minor-road STOP control
MN -312 027 016 086 76 333 58870 81000
255 Urban 4-leg with all-way STOP control
MN -1237 122 027 047 41 41 25300 6803
256 Urban 4-leg with signal control
MN -347 042 014 032 264 418 75000 81000
ITT Corporation 2008
20
Table 8 SafetyAnalystrsquos SPFs for Intersections (Fatal and Injury Crashes) Site
subtype Code
Site subtype Description
State Regression coefficients
LogIntercept (α)
Regression coefficients
LogAADTmaj (β1)
Regression coefficients LogAADT
min (β2)
Over - dispersion Parameter
(k)
RFT2
() No of Sites
Max AADTmaj
(vehday)
Max AADTmin
(vehday)
Rural 201 Rural 3-leg with minor-
road STOP control MN -935 071 021 123 91 1706 28500 27000
202 Rural 3-leg with all-way STOP control
MN -1002 127 -022 089 248 41 25300 6803
203 Rural 3-leg with signal control
MN -783 075 014 05 215 136 36400 11500
204 Rural 4-leg with minor-road STOP control
MN -936 066 04 0 146 2114 35500 26700
205 Rural 4-leg with all-way STOP control
MN -1002 127 -022 089 248 41 25300 6803
206 Rural 4-leg with signal control
MN -783 075 014 05 215 136 36400 11500
Urban 251 Urban 3-leg with minor-
road STOP control MN -845 049 039 123 81 397 68000 18900
252 Urban 3-leg with all-way STOP control
MN -1002 127 -022 089 248 41 25300 6803
253 Urban 3-leg with signal control
MN -1022 091 021 027 362 33 50000 25807
254 Urban 4-leg with minor-road STOP control
MN -435 029 019 099 57 333 58870 81000
255 Urban 4-leg with all-way STOP control
MN -1002 127 -022 089 248 41 25300 6803
256 Urban 4-leg with signal control
MN -511 049 016 03 295 418 75000 81000
ITT Corporation 2008
21
The study examined the impact of two left turn priority treatments which were flashing advanced green (FAG) and left turn green arrow (LTGA) on left turn collisions These treatments were implemented at 35 intersections in the city of Toronto Two types of collisions were investigated left turns with and without side impact The results indicated that there was an insignificant difference in the impact of the left turn priority treatments on both types of crashes
Lord and Persaud (2003) conducted a study that related SPFs to transportation planning models They noted that traffic safety is not usually accounted for when agencies are conducting a planning analysis to remodel build upgrade or modify their facilities Five-year intersection data from Canada were used Models were developed and statistical measures such as the over dispersion parameter were calculated and conclusions were made from the results The SPFs developed for the study were applied to two sample networks created with the help of a transportation planning software package The research showed that it is possible to make estimation for traffic safety at the planning stage of a project This will allow users to take safety into consideration when designing and possibly create alternatives to change existing designs for more comprehensive projects or development The study also indicated that there are limitations when applying the SPFs to computerized transportation networks The study concluded that although it is possible to predict or estimate crashes on digital transportation networks the accuracy of prediction relies greatly on how precise the traffic flow estimates are
Jonsson et al (2007) performed an SPF study that took into consideration the type and severity of crashes andmdashmost importantmdashthe causal factors for these crashes The study was conducted for intersections on rural four-lane highways in the state of California Four collision types were tested in the study opposite-direction same-direction intersecting-direction and single-vehicle crashes In addition a set of data from the state of New York was used with the same parameters to analyze the severity distribution of crash types The data for California included 1084 intersections on four-lane rural highways and that from New York included 675 intersections mainly stop controlled or without any control Generalized linear modeling was performed with the data after quality analysis Two model forms were estimated with the variables seen in Equations 29 and 30
(Eq 29)
(Eq 30)
where NAcc = predicted number of crashesyr at intersections AADTmajor = AADT on major road AADTminor= AADT traffic flow on minor road Βi = model parameters Xi = variables that describe the intersections (such as terrain lighting left turn number of though lanes and divided or undivided among others)
nn xxxormajorAcc exAADTxAADTN ββββββ ++++=
min4433021
nn xxxormajorAcc exAADTAADTN βββββ +++++=
min332201)(
22
The two different models are different representations of the traffic flow The first represents the AADT of major and minor roads as separate variables but in the second model they are represented as one variable by the sum of the major and minor roads AADTs Results showed that the first model performed better for the multiple-vehicle crashes and the second model fitted better for the single-vehicle crashes In addition the appropriate predictor variables differed depending on the crash type This study is also of interest as it incorporated additional parameters to those in the suggested SPFs now included in SafetyAnalyst and therefore could lead to possible future SPF research for the state of Virginia
Persaud and Nguyen (1998) conducted a study on signalized intersections in Ontario Canada They developed aggregate and disaggregate models to estimate safety performance of three- and four-leg intersections in which crash severity (injury and PDO) environmental class (semi-urban and rural) and time period (daily weekday morning peak and weekday afternoon peak) were considered in the analysis An important aspect of that study is that it supplemented the existing models used for estimating SPFs instead of replacing them because it took into consideration features that were generally not considered in the then existing developed models Two model levels were considered for the study Level 1 was based on the sum of AADTs for all approaches with separate estimates for rear-end right angle and turning movement crashes At this level the equations were adjusted for three- and four-leg intersections by crash severity for all combined impact types and also separately for the three major impact types which were angle rear-end and turning movement In addition models were further separated by time period (daily weekday morning and afternoon peak) and for four-leg intersections which were also classified by environment class such as semi-urban and rural Level 2 allowed estimates to be obtained for specific crash patterns that were defined by movements of the vehicles involved before collision and the same were estimated as a function of the flows that were relevant to each of the patterns For this level models were estimated for four-leg intersections for 12 multi-vehicle and three single-vehicle patterns that were described by the movements of involved vehicles before collision The developed models were intended to estimate the parameters P and d shown in Equations 31 and 33
The safety of the intersection was estimated using the long-term mean based on the EB approach The long term mean (m) was obtained by combining crash count (x) of an intersection in the most recent years (n) with the estimates of the expected annual number of crashes (P) as shown in Equation 31 W1 and W2 in Equations 31 through 33 represent the weights estimated from the mean and variance of the regression estimates
(Eq 31)
(Eq 32)
(Eq 33)
m =W1(x) +W2(P)
2dW
d nP=
+
1PW
d nP=
+
23
(Eq 34)
To estimate the variance of m the following formula was used
(Eq 35)
In Equations 32 through 35 P and d represent the fundamental parameters Two models were selected for SPFs For Level 1 and single-vehicle Level 2 (Eq 36) For multi-vehicle in Level 2 (Eq 37) where P = expected number of crashes of a given type α and β = regression parameters to be estimated S (Level 1) = sum of all entering flows for a given time period for Level 1 analysis S (Level 2) = sum of the daily through right or left turn flows for a given time period for Level 2 (single-vehicle) analysis S1 and S2 = AADTs for small and large flows for a specific crash pattern in Level 2 (multi-vehicle) analysis
The models in either level can be used in the EB procedure to provide estimates for intersections that need to be treated or for the evaluation of the effectiveness of safety countermeasures It should be noted that the quality of the estimates for the study was strongly related to how the parameters were selected and used in the SPFs and unlike other available road models the ones presented in this study can be separated by time period and crash pattern Persaud et al (2002) conducted a study to demonstrate the complexity involved in the calibration of crash prediction models or SPFs for urban intersections Toronto data for three- and four-leg signalized intersections were used to estimate the models for the study The performance of these models was then compared with other models from Vancouver and California The models from these places were recalibrated to fit Toronto by using the Interactive Highway Safety Design Model (IHSDM) and a calibration procedure as proposed by Harwood et al (2000) The results varied significantly and were also mixed The study noted that the calibration of models is not a simple task and due to the importance of the SPFs they must be properly calibrated Several things must be accounted for when performing this procedure in order to obtain good quality data analysis The first thing is to extract a large sample of high quality data A software or program to link all the traffic crash and road characteristics data must exist because the same is usually kept stored in different databases In addition several
2Pd
Var P=
2( )
d xVar m dnP
+=
+
P =αSβ
P =αS1β1 S2
β 2
24
years of crash data must be obtained in order to have a good amount of samples that account for variations The actual process of model calibration is complicated therefore careful attention must be paid when analyzing the same because of the importance of the outcomes of the study The authors of the study made an exploratory analysis and it revealed that the relationship between the crashes and each covariate should be described either by the power function or the gamma function for all intersection types to be analyzed Equations 38 through 40 are the selected model forms used in the study F1 = Power F2 = Gamma (Eq 38) F1 = Gamma F2 = Power (Eq 39) F1 = Power F2 = Power (Eq 40) where E (K) = expected annual number of crashes between 1990 and 1995 F1 F2 = average entering AADT of major and minor roads respectively for the period 1990 to 1995 α β1 β2 β3 β4 = coefficients to be estimated
An NB structure was used to analyze the models and the overdispersion parameter (γ) was analyzed using Equation 41
γ=
2)K(E)K(Var (Eq 41)
Variance increases as γ decreases therefore the value of γ can also be used to make a comparison for the goodness of fit of several models fitted to the same data The larger the value of γ the smaller the variance therefore a more accurate model is given The authors suggest that γ would be enough to calculate the goodness of fit index of any SPF but if one desires to know how accurate the prediction estimate is other measures should also be computed The authors suggested using R2
α as proposed by Miaou et al (1996) which is a dispersion parameter based R2 computed as shown in Equation 42
γγ
minus=αmin2 1R (Eq 42)
where γ = overdispersion parameter for calibrated model γmin = smallest possible overdispersion parameter
The authors suggested that a disaggregation by traffic volume is preferable than using
only a single calibration factor for that is what the IHSDM currently has A recommendation is made to account for safety variation in traffic conditions over time by calibrating the models every two to three years as suggested by Harwood et al (2000)
E(K) =αF1β1 F2
β 2e(β 3F2 )
E(K) =αF1β1 F2
β 2e(β 4 F1 )
E(K) =αF1β1 F2
β 2
25
The Illinois Department of Transportation and the University of Illinois Urbana-Champaign conducted a research study to develop and implement SPFs for road segments and intersections in Illinois (Tegge et al 2010) These SPFs were developed in a way suitable for easy implementation in SafetyAnalyst The crash data (number of crashes and crash severity) and roadway data (number of lanes traffic volume area type and functional class) were collected and used for development of the SPFs Seventeen peer groups were used for developing the SPFs for segments and eight for intersections The intersections peer groups were minor leg stop control all-way stop control signalized and undetermined for rural and urban segments separately The SPFs for segments were developed using NB distribution for crashes and Poisson distribution for intersections The SAS GENMOD procedure was used to develop the SPFs for a five-year analysis period from 2001 to 2005 The model form for the intersection SPFs is the same as that given in the SafetyAnalyst Userrsquos Manual The SPFs were also developed for different crash severities such as fatal crashes type A injury crashes type B injury crashes and fatal plus injury crashes The EB method was used to determine the sites with the higher PSIs Two analysis techniques were used to obtain the PSIs The first considered segments and intersections as individual elements and the second used the sliding window approach The site specific analysis treated each individual segment and intersection as a separate entity Each segment is then compared with every other segment instead of having them grouped together The sliding window approach defined a set length The window lengths were 025 mile and 1 mile for urban and rural segments respectively
The largest impact on crash frequency was found to be the AADT and was therefore the only variable modeled as a logarithm (lnAADT) By doing this the AADT accounted for most of the prediction whereas the rest of the variables refined the prediction further Other variables used included access control functional class lane width surface type area type speed limit and median type The study recommended that a multivariate analysis be conducted for such studies to show how certain variables could contribute to the crashes Other variables could include roadway lighting weather and pavement conditions and roadway geometry The study also concluded that knowledge of roadway characteristics that increase the risk of fatal or injury crashes will facilitate the setting up of safety criteria that can help engineers in the designing of safer roadways Further knowledge of driver behaviors that lead to fatal and severe injury crashes can facilitate the training of enforcement officers to identify these behaviors
The Colorado Department of Transportation (CDOT) (2009) conducted a study to develop SPFs for intersections in the state Their model form is the same as that in SafetyAnalyst The SPFs were developed for many categories based on the number of legs divided undivided rural and urban including urban four-lane divided signalized six-lane divided signalized urban three-leg signalized two-lane undivided unsignalized and urban three-leg unsignalized When a median or left-turn lane is present a roadway is considered divided The sites selected for the study reflected variability in traffic volume and geometry in order to have a diverse representation of intersections throughout the state SPFs were developed for total and for fatal plus injury crash types A five-year study period from 2000 through 2005 was used Crash and AADT data were collected for development of the SPFs CDOT used a NB error structure to develop the SPFs and the EB procedure to estimate the expected safety performance of an intersection site for different safety management purposes Overdispersion parameters were computed and used as a goodness of fit measure According to their data
26
overdispersion parameters indicated that their models provided a reasonable fit to the Colorado data
Results indicated that for signalized intersections roads with six lanes on major approaches have more collisions than those with four lanes on major approaches CDOT recommended that the SPFs should be recalibrated in the future using data from future years as crash frequencies may change over time because of a variety of issues The report also recommended that separate calibration factors should be developed for different regions and different topographies Research in Virginia
In Virginia two other similar studies have recently been published One by Garber et al (2010) for two-lane roads and another by Hamidi et al (2010) to identify high-crash sections on Virginiarsquos primary system by developing a planning-level methodology The study by Garber et al developed SPFs for two-lane segments of 1 mile or less and the study by Hamidi et al developed SPFs for longer segments of two-lane roads that can be used for corridor analysis
Evaluation of the Recommended Minnesota SPFs
Figures 3 through 6 show representative graphs that were used to visually examine how well the Virginia data fitted the suggested Minnesota SPFs Figures 3 and 4 are for urban four-leg signalized intersections and Figures 5 and 6 are for rural four-leg signalized intersections These graphs suggest that the Minnesota SPFs do not fully represent the Virginia data Tables 9 through 12 show the Freeman-Tukey R2
FT coefficients computed for the different Minnesota SPFs using the Virginia data The low Freeman-Tukey R2
FT coefficients obtained and the visual inspection of the graphs suggested that a better fit to the Virginia data could be obtained by developing specific Virginia SPFs using Virginia data It was therefore decided to develop specific SPFs for Virginia
0
2
4
6
8
10
12
14
0 20000 40000 60000 80000 100000 120000
AADT Major
Tota
l Cra
shes
Per
Yea
r
Minnesota VA Actual Observed
Minnesota Model
Figure 3 Total crashes per year vs major AADT for urban 4-leg signalized intersections
with minor AADT of 700
27
0
5
10
15
20
25
30
35
0 20000 40000 60000 80000 100000 120000
AADT Major
Tota
l Cra
shes
per
Yea
r
Minnesota VA Actual Observed
Minnesota Model
Figure 4 Total crashes per year vs major AADT for urban 4-leg signalized intersections
with minor AADT of 4500
0
2
4
6
8
10
12
14
0 20000 40000 60000 80000 100000 120000
AADT Major
Tota
l Cra
shes
Per
Yea
r
Minnesota VA Actual Observed
Minnesota Model
Figure 5 Total crashes per year vs major AADT for rural 4-leg signalized intersections with
minor AADT of 795
28
0
2
4
6
8
10
12
14
16
18
0 20000 40000 60000 80000 100000 120000
AADT Major
Tota
l Cra
shes
per
Yea
r
Minnesota VA Actual Observed
Minnesota Model
Figure 6 Total crashes per year vs major AADT for rural 4-leg signalized intersections with
minor AADT of 5000
Table 9 Minnesota SPFs for Urban FI Crashes and Corresponding R2FT Based
on Virginia Data
Intersection Type
Minnesota FI SPFs R2
FT Based on Virginia Urban FI Crash Data ()
Urban 4-Leg Signalized 032
Urban 4-Leg Minor Stop Control 008
Urban 3-Leg Signalized 026
Urban 3-LegMinor Stop Control 01
Table 10 Minnesota SPFs for Urban TOTAL crashes and Corresponding R2
FT Based on Virginia Data
Type of Intersection
Minnesota SPFs
R2FT Based on Virginia Urban Total
Crash Data ()
Urban 4-Leg Signalized 034
Urban 4-Leg Minor Stop Control 022
Urban 3-Leg Signalized 031
Urban 3-Leg Minor Stop Control 01
29
Table 11 Minnesota SPFs for Rural TOTAL Crashes and Corresponding R2FT
Based on Virginia Data
Type of Intersection
Minnesota SPFs R2
FT Based on Virginia Rural Total Crash Data ()
Rural 4-Leg Signalized 029
Rural 4-Leg Minor Stop Control 013
Rural 3-Leg Signalized 029
Rural 3-Leg Minor Stop Control -010
Table 12 Minnesota SPFs for Rural FI Crashes and Corresponding R2FT Based
on Virginia Data
Type of Intersection
Minnesota SPFs R2
FT Based on Virginia Rural FI Crash Data ()
Rural 4-Leg Signalized 018
Rural 4-Leg Minor Stop Control 010
Rural 3-Leg Signalized 018
Rural 3-Leg Minor Stop Control 001
Development and Evaluation of Specific Virginia SPFs
In keeping with the suggestion given in the Safety Analyst Userrsquos Manual the model form used to develop the intersection SPFs is given in Equation 4 as
1 2k e x MajAADT x MinAADTβ βα=
where
k = predicted crash frequency per intersection per year MajAADT = AADT on the major road (vehday) MinAADT = AADT on the minor road (vehday) α = intercept β1 = coefficient of mayor AADT β2 = coefficient of minor AADT
30
The statewide SPFs developed for Virginia are given in Tables 13 through 16 Due to lack of data the analysis for all-way stop intersections could not be undertaken These tables also give the Freeman-Tukey R2
FT coefficient for each of the Virginia SPFs and the corresponding Minnesota SPF and Freeman-Tukey R2
FT based on the Virginia data The R2FT coefficients
obtained indicate that the Virginia-specific SPFs fit the Virginia data better than the suggested Minnesota SPFs for all types of intersections and crash severity except those for FI crashes on urban three-leg signalized rural four-leg signalized and rural four-leg minor stop control intersections where the corresponding RFT
2 values are similar In Table 15 it can be seen that the Minnesota R2
FT value is negative for the rural three-leg minor stop control intersections The negative RFT
2 value is possible because these calculations were not performed on the same data points that were used to create the Minnesota SPFs (Miller 2009) Table 13 SPF Models for Urban TOTAL crashes and R2
FT results for Virginia Statewide (VDOT-maintained roads)
SPF model with TOTAL Crash values
R2FT TOTAL
Crash Data
Site Virginia Statewide Minnesota VA MN
Urban 4-Leg Signalized 056 034
Urban 4-Leg Minor Stop Control
032 022
Urban 3-Leg Signalized 037 031
Urban 3-Leg Minor Stop Control
023 010
Table 14 SPF Models for Urban FI crashes and R2
FT results for Virginia Statewide (VDOT-maintained roads)
SPF model with FI Crash values R2FT FI Crash Data ()
Site
Virginia Statewide Minnesota VA MN
Urban 4-Leg Signalized 041 032
Urban 4-Leg Minor Stop Control
019 008
Urban 3-Leg Signalized 026 026
Urban 3-Leg Minor Stop Control
013 010
31
Table 15 SPF Models for Rural TOTAL Crashes and R2FT Results for Virginia Statewide (VDOT-
maintained roads) SPF model with TOTAL Crash values R2
FT TOTAL Crash Data
Site
Virginia Statewide Minnesota VA MN
Rural 4-Leg Signalized 0321 0290
Rural 4-Leg Minor Stop Control
0167 0132
Rural 3-Leg Signalized 0305 0291
Rural 3-Leg Minor Stop Control
0104 -0102
Table 16 SPF Models for Rural FI crashes and R2
FT results for Virginia Statewide (VDOT-maintained roads) SPF model with FI Crash values R2
FT TOTAL Crash Data
Site
Virginia Statewide Minnesota VA MN
Rural 4-Leg Signalized 0181 0181
Rural 4-Leg Minor Stop Control
0098 0097
Rural 3-Leg Signalized 0170 0180
Rural 3-Leg Minor Stop Control
0048 0012
Figures 7 through 10 show visual representations of how well the Virginia SPFs fit the
Virginia data in comparison with the suggested Minnesota SPFs In general the Virginia SPFs tend to fit the Virginia data better than the Minnesota SPFs although both sets of SPFs tend to have similar fits at low volumes (AADTmajor lt 2000) except for the SPF for total crashes on urban four-leg signalized intersections shown in Figure 7 The primary reason the Minnesota SPFs do not fit the Virginia data as well as the Virginia SPFs may be the dissimilarities of the roadside environment and the characteristics of the different databases
32
0
2
4
6
8
10
12
14
0 20000 40000 60000 80000 100000 120000
AADT Major
Tota
l Cra
shes
Per
Yea
r
Minnesota VA Actual Observed Virginia
Minnesota Model
Virginia M odel
Figure 7 Total crashes per year vs major AADT for urban 4-leg signalized intersections
with minor AADT of 700
0
5
10
15
20
25
30
35
0 20000 40000 60000 80000 100000 120000
AADT Major
Tota
l Cra
shes
per
Yea
r
Minnesota VA Actual Observed Virginia
Minnesota Model
Virginia Model
Figure 8 Total crashes per year vs major AADT for urban 4-leg signalized intersections
with minor AADT of 8000
33
0
2
4
6
8
10
12
14
0 20000 40000 60000 80000 100000 120000
AADT Major
Tota
l Cra
shes
Per
Yea
r
Minnesota VA Actual Observed Virginia
Virginia Model
Minnesota Model
Figure 9 Total crashes per year vs major AADT for rural 4-leg signalized intersections with
minor AADT of 79
0
5
10
15
20
25
0 20000 40000 60000 80000 100000 120000
AADT Major
Tota
l Cra
shes
per
Yea
r
Minnesota VA Actual Observed Virginia
Minnesota Model
Virginia Model
Figure 10 Total crashes per year vs minor AADT for rural 4-leg signalized intersections with major AADT of 5000
As discussed in the Methodology section in addition to the statewide Virginia SPFs
specific SPFs were developed for each operational region to consider the different topographical characteristics that exist across Virginia The complete set of SPFs together with the associated p values for the regression coefficients are shown in Tables A-1 and A-2 of Appendix A All p values are less than 005 with most being less than 00001 except for some of the rural four-leg signalized intersections regional specific SPFs These p values indicate that the estimated coefficients are statistically significant at the 95 confidence level or better A possible reason
34
for higher p values for a small number of SPFs may be the sample size used for developing these SPFs
To test the transferability and fit of the Virginia statewide specific SPFs several
statistical parameters were determined for the 70 (estimation) data set and the 30 (validation) data set separately The corresponding values for each of these parameters were then compared The results are shown in Tables 17 and 18 for urban and rural intersections respectively The results for the regional SPFs are shown in Tables A-3 through A-8 of Appendix A The results indicate that the developed models are transferable to the 30 validation data set For example the MSE values for the 70 estimation data are similar to the MSPE values for the 30 validation data In addition the mean prediction bias MPB values for the 30 validation data are close to zero (-076 le MPB ge -0004) in Table 17 and (-0067 le MPB ge 00513) in Table 18
Table 17 Goodness of Fit Results for Urban Statewide SPFs
Data Estimation data 70 Validation Data 30 Subtype Site MSE r2 R2
FT MPB MAD MSPE R2FT
Total VA 41150 0529 0557 -0760 4329 38490 0575
Total MN
68636 0506 0336 -3145 5421 68156 0315
FI VA
7043 0385 0406 -0458 1938 7671 0475
Urban 4-Leg Signalized
FI MN 7702 0372 0324 -0316 2124 8981 0376
Total VA 2238 0315 0313 -0034 0897 2383 0292
Total MN 2510 0287 0215 0091 0982 2730 0182
FI VA 0530 0194 0193 -0004 0432 0533 0194
Urban 4-Leg Minor Stop Control
FI MN 0560 0182 0080 0128 0522 0577 0052
Total VA 24900 0375 0370 -0645 3519 27591 0369
Total MN 29322 0365 0308 -2238 3661 33079 0272
FI VA 4467 0275 0259 -0185 1527 4875 0262
Urban 3-Leg Signalized
FI MN 4528 0267 0261 -0294 1526 4937 0261
Total VA 1854 0254 0230 -0043 0893 2038 0239
Total MN 2388 0237 0104 -0541 0902 2600 0107
FI VA 0428 0151 0133 -0021 0431 0476 0157
Urban 3-Leg Minor Stop Control
FI MN 0478 0140 0097 -0184 0385 0537 0104
35
Table 18 Goodness of Fit Results for Rural Statewide SPFs
Data Estimation Data 70
Validation Data 30
Subtype Site MSE r2 R2FT MPB MAD MSPE R2
FT
Total VA 10990 0353 0321 0513 2210 10070 -0073
Total MN 12400 0339 0290 -0154 2071 8460 0035
FI VA 2350 0196 0181 0045 1189 2600 -0034
Rural 4-Leg Signalized
FI MN 2400 0188 0181 -0043 1164 2420 0004
Total VA 1090 0182 0167 -0067 0794 1190 0171
Total MN 1190 0167 0132 -0348 0774 1320 0115
FI VA 0480 0112 0098 -0022 0504 0530 0110
Rural 4-Leg Minor Stop Control
FI MN 0500 0104 0097 -0158 0459 0560 0093
Total VA 5490 0328 0305 -0010 1651 5760 0179
Total MN NA NA NA NA NA NA NA
FI VA 1450 0181 0170 -0041 0902 1710 0099
Rural 3-Leg Signalized
FI MN NA NA NA NA NA NA NA
Total VA 0690 0144 0104 -0008 0613 0730 0102
Total MN 0890 0141 -0102 -0404 0555 0940 -0104
FI VA 0250 0071 0048 -0009 0345 0260 0048
Rural 3-Leg Minor Stop Control
FI MN 0270 0068 0012 -0144 0270 0290 0003
Pruning of Virginia-Specific SPFs A total of 64 SPFs were initially developed using the appropriate data for Virginia as shown in Tables A-1 and A-2 of Appendix A Considering that not all regional models might be necessary the pruning process described in the methodology section was carried out to prune the number of SPFs to the minimum effective number as seen in Tables 19 and 20 for urban and rural intersections respectively The pruning process resulted in 19 SPFs for urban sites and 15 for rural sites To facilitate the use of the correct SPF for a specific type of intersection located in a specific region the lists of the appropriate SPFs to be used are given in Tables B-1 and B-2 of Appendix B for the urban and rural intersections respectively
As can be seen in Tables 19 and 20 and Tables A-1 and A-2 of Appendix A there are some trends worth discussing for the benefit of the study and possible future research With regards to the three different operational regions the Western region retained many more of the specific regional urban SPFs than any other region For example the Western regional SPFs were retained for all urban intersection sites whereas for the Eastern region the only SPFs
36
retained were those for urban four-leg signalized FI crashes and urban four-leg minor stop control for total and FI crashes Similarly the only urban SPF retained for the Northern region was that for urban four-leg minor stop control for total crashes For the rural intersection sites all of the Western regional SPFs were retained except those for rural three-leg signalized total and FI crashes and rural four-leg minor stop control FI crashes The majority of the Eastern region rural SPFs were discarded except those for rural four-leg signalized total and FI crashes while for the Northern region all regional SPFs were discarded
The Western region retained more specific regional SPFs than the other two regions This suggests that the intersections in the Western region exhibit more unique characteristics than those for the other regions This may be due to the more mountainous terrain in the Western region compared to those in the Eastern and Northern regions This supports the philosophy of developing specific SPFs based on the topography of different regions
Site Prioritization
To illustrate the benefits of using the EB method to prioritize intersection sites for safety
improvements the top 25 urban sites from the Bristol and Northern Virginia districts were identified by using crash rates critical crash ratio and the EB method The PSI for each site identified was then determined The results obtained are shown in Tables 21 and 22 for the Bristol and the Northern Virginia districts respectively The results indicate that for the Northern Virginia District the PSIs for the top 25 sites are 258 1317 and 27440 crashes per year and for the Bristol District 432 646 and 1496 crashes per year for the crash rates critical crash ratio and EB methods respectively The important thing in Tables 21 and 22 is the sum of the PSI columns ranked by the three methods The sum of each of the PSIs for the crash rate and critical crash ratio method is lower than that for the EB method These results suggest that the use of the EB method in the planning process will identify intersection sites with the highest PSIs and therefore where detailed assessments to determine feasible and effective safety treatments should be undertaken
37
Table 19 MSPE Values for Virginia Urban Statewide and Urban Regional SPFs Used for Pruning
Data Pruning
Subtype
Site
MSPE [MSPEVA-
MSPEOR]1 [abs(MSPEVA-
MSPEOR)]2 [abs(MSPEVA-
MSPEOR)MSPEVA]3
RetainDiscardTotal VA 3849 Northern 4486 -637 637 0165497532 Discard Western 1791 2058 2058 0534684334 Retain Eastern 3745 104 104 0027020005 Discard FI VA 7671 Northern 95 -1829 1829 0238430452 Discard Western 517 2501 2501 0326033112 Retain
Urban 4-Leg Signalized
Eastern 541 2261 2261 0294746448 Retain Total VA 23834 Northern 202 03634 03634 015247126 Retain Western 105 13334 13334 0559452882 Retain Eastern 115 12334 12334 0517496014 Retain FI VA 05327 Northern 048 00527 00527 0098929979 Discard Western 033 02027 02027 0380514361 Retain
Urban 4-Leg Minor Stop Control
Eastern 036 01727 01727 0324197485 Retain Total VA 275911 Northern 2687 07211 07211 0026135239 Discard Western 2441 31811 31811 0115294425 Retain Eastern 3878 -111889 111889 0405525695 Discard FI VA 48754 Northern 448 03954 03954 0081101038 Discard Western 339 14854 14854 0304672437 Retain
Urban 3-Leg Signalized
Eastern 586 -09846 09846 020195266 Discard Total VA 20379 Northern 219 -01521 01521 0074635654 Discard Western 164 03979 03979 0195250012 Retain Eastern 223 -01921 01921 0094263703 Discard FI VA 04756 Northern 05 -00244 00244 0051303616 Discard Western 038 00956 00956 0201009251 Retain
Urban 3-Leg Minor Stop Control
Eastern 05 -00244 00244 0051303616 Discard 1 Difference between mean square prediction error (MSPE) of Virginia statewide model and OR model 2 Absolute value of the difference between Virginia statewide model MSPE and operational region model MSPE 3 Absolute value of the difference between Virginia statewide model MSPE and operational region model MSPE divided by the Virginia statewide MSPE for comparison
Retained SPFs Discarded if value is negative Discarded if less than 01
38
Table 20 MSPE Values for Virginia Rural Statewide and Rural Regional SPFs Used for Pruning Data Pruning
Subtype
Site
MSPE
[MSPEVA-MSPEOR]1
[abs(MSPEVA-MSPEOR)]2
[abs(MSPEVA-MSPEOR)MSPEVA]3
RetainDiscard
Total VA 1007 Northern 3422 -2415 2415 2398212512 Discard Western 605 402 402 0399205561 Retain Eastern 512 495 495 0491559086 Retain FI VA 26 Northern 976 -716 716 2753846154 Discard Western 159 101 101 0388461538 Retain
Rural 4-Leg Signalized
Eastern 137 123 123 0473076923 Retain Total VA 119 Northern 164 -045 045 0378151261 Discard Western 102 017 017 0142857143 Retain Eastern 114 005 005 0042016807 Discard FI VA 053 Northern 052 001 001 0018867925 Discard Western 048 005 005 0094339623 Discard
Rural 4-Leg Minor Stop Control
Eastern 049 004 004 0075471698 Discard Total VA 576 Northern 1475 -899 899 1560763889 Discard Western 674 -098 098 0170138889 Discard Eastern 626 -05 05 0086805556 Discard FI VA 171 Northern 212 -041 041 0239766082 Discard Western 403 -232 232 1356725146 Discard
Rural 3-Leg Signalized
Eastern 157 014 014 0081871345 Discard Total VA 073 Northern 093 -02 02 0273972603 Discard Western 053 02 02 0273972603 Retain Eastern 069 004 004 0054794521 Discard FI VA 026 Northern 03 -004 004 0153846154 Discard Western 023 003 003 0115384615 Retain
Rural 3-Leg Minor Stop Control
Eastern 027 -001 001 0038461538 Discard 1 Difference between mean square prediction error (MSPE) of Virginia statewide model and OR model 2 Absolute value of the difference between Virginia statewide model MSPE and operational region model MSPE 3 Absolute value of the difference between Virginia statewide model MSPE and operational region model MSPE divided by the Virginia statewide MSPE for comparison
Retained SPFs Discarded if value is negative Discarded if less than 01
39
Table 21 PSIs for Top 25 Sites in District 1 Urban (Bristol) FI
Crashes Ranking Based on Crash
Rates Ranking Based on Crash Ratio Ranking Based on EB
Method
Rank Intersection Node
Crash Rate1 PSI2 Intersection
Node Crash Ratio3 PSI Intersection
Node PSI
1 596726 22112 00000 651193 39672 00000 596095 21413
2 606469 20079 00000 606238 39298 06297 596393 08787
3 706818 12504 00000 651075 31264 00000 651130 08453
4 651193 11550 00000 596726 29227 00000 596701 07112 5 651075 09369 00000 606469 28039 00000 651802 06929 6 606238 08382 06297 651233 25831 03612 636331 06726 7 651807 07089 00000 651130 22718 08453 596395 06579 8 651233 06068 03612 706818 22555 00000 596937 06415 9 651230 05990 00000 651230 20301 00000 606238 06297
10 651783 05756 00000 651210 18882 04747 661033 06061 11 636093 04960 00000 636331 17913 06726 596372 05417 12 651274 04475 00000 651807 16847 00000 636372 04808 13 651130 04179 08453 651805 15814 00000 651210 04747 14 651210 03918 04747 651223 15627 03589 636491 04649 15 636331 03393 06726 651783 15009 00000 596420 04633 16 651223 03363 03589 596095 14865 21413 596403 04579 17 606232 03331 00000 636405 14769 00000 651603 04531 18 651127 03053 00000 661033 14555 06061 636056 04351 19 651999 03048 00000 596353 14215 03717 712033 04110 20 596449 02962 00000 636093 13782 00000 704691 04102 21 636405 02811 00000 651879 13192 00000 651838 04100 22 651883 02698 00000 651274 12975 00000 651894 03878 23 596353 02686 03717 651127 12972 00000 596353 03717 24 651805 02663 00000 651999 12959 00000 651233 03612 25 661033 02500 06061 596449 12702 00000 651889 03601
sum 43202 sum 64615 sum 149606 1Number of crashes per year per 1000000 total approach volume 2Potential for safety improvement (crashes yr) the difference between the EB-adjusted long-term crashes and the SPF-estimated crashes 3Ratio of actual crash rate to critical crash rate
40
Table 22 PSIs for Top 25 Sites in District 9 Urban (Northern Virginia District) FI
Crashes Ranking Based on Crash
Rates Ranking Based on Crash Ratio Ranking Based on EB
Method
Rank Intersection Node
Crash Rate1 PSI2 Intersection
Node Crash Ratio3 PSI Intersection
Node PSI
1 718192 191841 00000 718192 257523 00000 264119 150122 2 702946 178194 00000 547722 152371 11175 263375 140091 3 271531 64846 00000 263628 102794 00000 278648 137239 4 263628 52858 00000 263728 100092 00000 276819 131395 5 263728 42215 00000 719754 95274 09444 263290 130743 6 266955 35294 00000 702946 79268 00000 722678 127897 7 547722 34932 11175 263403 77252 05184 264725 118671 8 702612 30441 00000 704237 77175 07648 267028 116627 9 273886 29539 00000 263729 74681 00000 265204 115925
10 716747 27632 00000 271531 72327 00000 274766 115679 11 263626 27139 00000 263135 66458 18068 263249 113372 12 269485 26567 00000 716747 64461 00000 547044 110769 13 728954 26344 00000 266955 56657 00000 549349 107180 14 263729 25208 00000 546138 52003 31028 268210 105630 15 546988 21922 00000 547544 51924 32529 263347 104257 16 274338 21446 00000 263626 50389 00000 276351 102313 17 429308 21354 00000 269485 49897 00000 428167 100064 18 720401 21197 00000 728954 49702 00000 264344 98789 19 267295 20954 00000 548686 49572 03621 277764 91554 20 267536 20874 00000 711601 47985 04440 263467 89259 21 265938 20484 00000 266970 47730 00000 263090 89199 22 273354 20108 00000 546462 46856 03620 703414 88610 23 268345 19362 00000 265938 46726 00000 428629 87379 24 719754 19073 09444 720401 44833 00000 272219 85659 25 263403 19015 05184 728496 43666 04990 428544 85610
Sum 25803 sum 131747 sum 2744033 1Number of crashes per year per 1000000 total approach volume 2Potential for safety improvement (crashes yr) the difference between the EB-adjusted long-term crashes and the SPF-estimated crashes 3Ratio of actual crash rate to critical crash rate
41
CONCLUSIONS
bull The development of SPFs for intersections is necessary for Virginia because the SafetyAnalyst-suggested SPFs which are based on Minnesota data do not represent the Virginia data well Regarding the fit of the SPFs to Virginia data the R2
FT values shown in Tables 13 through 16 for Minnesota and Virginia indicate that the Virginia-specific SPFs fit the Virginia data better than the Minnesota models This may be due to the dissimilarities of the roadside environment such as difference in topography and the characteristics of the different Virginia and Minnesota databases
bull In some cases the specific regional SPFs fit the regional data better than the statewide
SPFs suggesting that the specific SPFs should be considered for use when available These group divisions that have similar roadway characteristics and driver expectations in some cases tend to improve the fit
bull In identifying intersection sites for safety improvements it is clearly beneficial for the EB
method to be used with the suitable SPFs rather than a crash rate or critical ratio method Results of the site prioritization show a much higher potential for crash reduction when the EB method is used with the appropriate SPFs rather than a procedure based on crash rates or critical rates
RECOMMENDATIONS
1 VDOTrsquos TED should use the Virginia-specific SPFs when using the SafetyAnalyst tools The results of this study have shown that the Virginia-specific SPFs reflected the Virginia data better than the SafetyAnalyst-recommended Minnesota SPFs
2 VDOTrsquos TED should investigate the feasibility of using multiple SPFs in SafetyAnalyst If
feasible regional SPFs should be used If it is not currently feasible to use multiple SPFs VDOTrsquos TED should ask that the FHWA include regional information in SafetyAnalyst so as to allow the use of regional SPFs For the specific regional SPFs to be applied to Virginia and other states the SafetyAnalyst tool should be capable of incorporating the necessary data that support the regional models
3 As soon as it is feasible to use regional SPFs VDOTrsquos TED should use the 19 SPFs
developed for urban intersections and the 15 developed for rural intersections when using the tools in SafetyAnalyst Although the statewide SPFs are available for use by an analyst the specific regional models included in the final set of SPFs will predict crashes better than the statewide SPFs The regional analysis will not only ease the use of specific regional SPFs but will also be of benefit when predicting the potential for safety improvement of a specific site
4 For future similar SPF studies VDOTrsquos TED should be directly involved in screening the
traffic data for accuracy and consistency as was done in this study The direct involvement of the TED in the screening of the traffic data significantly contributed to the accuracy of the
42
data and greatly contributed to the confidence the researchers place on the data used in the study
5 The Virginia Transportation Research Council (VTRC) should conduct a study as soon as
feasible to verify whether incorporating independent variables for which data are available other than AADT such as intersection geometry and other characteristics will result in SPFs that better fit the Virginia data Although the currently suggested SafetyAnalyst SPFs use only the AADTs as the independent variables it is likely that provision will be made for use of SPFs that incorporate other independent variables such as number of approaches entering lanes and the other variables for which data are available as these SPFs are likely to give better fit to crash data
6 As soon as feasible VTRC should undertake a study to develop SPFs for the urban system
intersections which are not currently maintained by VDOT as these intersections may have different crash characteristics than those maintained by VDOT This would facilitate the use of SafetyAnalyst in programming sites that are currently not being maintained by VDOT
BENEFITS AND IMPLEMENTATION PROSPECTS
Significant benefits will be accrued by the use of the Virginia-specific SPFs developed in this study This is clearly illustrated in two ways First in examining the transferability of the suggested SPFs in SafetyAnalyst it is clear that these SPFs do not fit the Virginia data very well The results also indicate that the Virginia-specific SPFs fit the Virginia data much better than the suggested SafetyAnalyst SPFs Second the availability of the Virginia-specific SPFs will enhance the use of the EB procedure given in SafetyAnalyst for prioritizing sites for safety improvements This study has also shown that the EB method better identifies sites with higher potential for crash reduction than those identified by crash rates For example the illustrated examples given for the Bristol and Northern Virginia districts show that the potential reduction in FI crashes when the top 25 sites are identified by the EB method is 28936 (1496 + 27440) crashes per year whereas that obtained when the critical crash ratio method is used for prioritization is only 1963 (646 + 1317) and that obtained with the crash rate method is only 690 (432 + 258) crashes per year This gives a net benefit of 26973 potential crashes per year compared to the critical crash ratio method and 28246 compared to the crash rate method Assuming an average cost of FI crashes of $95629 (FHWA 2005) and only 10 of the estimated net benefit PSI of 28246 crashes per year is achieved the total savings of more than $27 million per year could be accrued The prospects for implementation of the recommendations are very high as the study was requested by VDOTrsquos TED which is planning to incorporate these SPFs in the use of the tools provided in SafetyAnalyst
43
ACKNOWLEDGMENTS
The authors appreciate the opportunity afforded them by VDOT and VTRC to conduct this study Special thanks to Stephen Read (VDOT) Dr In-Kyu Lim (VDOT) Dr Young-Jun Kweon (VTRC) and VDOTrsquos Central Office for their interest and support in SPFs and their help in the selection of intersection sites Many thanks to Lewis Woodson (VTRC) and James Hill (University of Virginia) for all their help and input throughout the study
REFERENCES Cogburn P VDOT Interagency Coordination 2007 Virginia Emergency Management
Conference Virginia Department of Transportation Richmond April 2007 Colorado Department of Transportation DTD Applied Research and Innovation Branch Safety
Performance Functions for Intersections CDOT-2009-10 Denver December 2009 Fridstroslashm L Ifver J Ingebrigtsen S Kulmala R and Thomsen LK Measuring the
Contribution of Randomness Exposure Weather and Daylight to the Variation in Road Accidents Counts Accident Analysis and Prevention Vol 27 No 1 1995 pp 1-20
Federal Highway Administration Cost of Crashes by Severity Table FHWA-HRT-05-051
Washington DC 2005 Federal Highway Administration SafetyAnalyst Home Page httpwwwsafetyanalystorg
Accessed February 2010 Garber N and Hoel L Traffic amp Highway Engineering 4th ed Cenage Learning Toronto
Canada 2009 Garber NJ Haas PR and Gosse C Development of Safety Performance Functions for Two-
Lane Roads Maintained by the Virginia Department of Transportation VTRC 10-R25 Virginia Transportation Research Council Charlottesville 2010
Hamidi A Fontaine MD and Demetsky MJ A Planning-Level Methodology for Identifying
High-Crash Sections of Virginiarsquos Primary System VTRC 11-R4 Virginia Transportation Research Council Charlottesville 2010
Harwood D Council FM Hauer E Hughes WE and Vogt A Prediction of the Expected
Safety Performance of Rural Two-lane Highways Federal Highway Administration McLean VA December 2000
Harwood DW Bauer KM Richard KR Gilmore DK Persaud B and Lyon C
Development of SPFs for Safety Analyst Interim Tools Technical Memorandum
44
Prepared by Midwest Research Institute for the Federal Highway Administration McLean VA 2004
ITT Corporation SafetyAnalyst Userrsquos Manual Turner-Fairbank Highway Research Center
McLean VA 2008 Jonsson T Ivan J and Zhang C Crash Prediction Models for Intersections on Rural
Multilane Highways Differences by Collision Type In Transportation Research Record Journal of the Transportation Research Board No 2019 Transportation Research Board of the National Academies Washington DC 2007 pp 91-98
Kweon Y-J and Lim I-K Appropriate Regression Model Types for the Empirical Bayes
Method and SafetyAnalyst In Proceedings of the 89th Annual Meeting of the Transportation Research Board Transportation Research Board of the National Academies Washington DC 2010
Kononov J Bailey B and Allery B Exploratory Examination of the Functional Form of
Safety Performance Functions of Urban Freeways Colorado Department of Transportation and San Diego State University Denver CO 2008
Lyon C Haq A Persaud B and Kodama S Safety Performance Functions for Signalized
Intersections in Large Urban Areas Development and Application to Evaluation of Left-Turn Priority Treatment In Transportation Research Record Journal of the Transportation Research Board No 1908 Transportation Research Board of the National Academies Washington DC 2005 pp 165-171
Lord D and Persaud B Estimating the Safety Performance of Urban Road Transportation
Networks Center for Transportation Safety Texas Transportation Institute Texas AampM University and Department of Civil Engineering Ryerson University College Station TX 2003 pp 609-620
Miaou S-P Lu A and Lum H S Pitfalls of using R2 to Evaluate Goodness of Fit of
Accident Prediction Models In Transportation Research Record Journal of the Transportation Research Board No 1542 Transportation Research Board of the National Academies Washington DC 2005 1996 pp 6-13
Miller P Re Negative R squared Email Archive Division of Biostatistics Washington
University in St Louis February 2 2005 February 2 2005 httpwwwbiostatwustleduarchiveshtmljmp-l2005msg00075html Accessed February 2010
Persaud B Lord D and Palmisano J Calibration and Transferability of Accident Prediction
Models for Urban Intersections In Transportation Research Record Journal of the Transportation Research Board No 1784 Transportation Research Board of the National Academies Washington DC 2002 pp 57-64
45
Persaud B and Nguyen T Disaggregate Safety Performance Models for Signalized Intersections on Ontario Provincial Roads In Transportation Research Record Journal of the Transportation Research Board No 1635 Transportation Research Board of the National Academies Washington DC 1998 pp 113-120
Pham T and Ragland D Summary of Crash Prediction Models Also known as Safety
Performance Functions (SPFs) California Partners for Advanced Traffic and Highways and University of California Berkeley Berkeley 2005
SAS Institute Inc SAS OnlineDoc Version Eight Cary NC
httpwwwtecnionacildocssasril Accessed 2009 Tegge RA Jo J-H and Ouyang Y Development and Application of Safety Performance
Functions for Illinois ICT-10-066 Illinois Center for Transportation University of Illinois Urbana-Champaign March 2010
Virginiarsquos Surface Transportation Safety Executive Committee Commonwealth of Virginiarsquos
Strategic Highway Safety Plan 2006-2010 Virginia Department of Transportation Richmond 2006
Washington S Persaud B Lyon C and Oh J Validation of Accident Models for
Intersections FHWA-RD-03-037 Federal Highway Administration McLean VA 2005
46
47
APPENDIX A
STATISTICAL PARAMETERS AND GOODNESS-OF-FIT RESULTS
Table A-1 Statistical Parameters for Urban Intersections SPFs Parameter Estimates
Data Intercept
Coefficient of Mayor AADT
Coefficient of Minor AADT
Subtype Site Intercept (α)
StndError
P value
lnMajor (β1)
StndError
P value
lnMinor (β2)
StndError
P value
Total VA -76234 048 lt0001 06742 005 lt0001 03453 003 lt0001
OR1 -83067 056 lt0001 07522 005 lt0001 0328 003 lt0001OR10 -123913 122 lt0001 10631 013 lt0001 04567 006 lt0001OR 100 -88553 077 lt0001 07825 007 lt0001 03706 004 lt0001FI VA -85256 057 lt0001 06477 006 lt0001 03579 004 lt0001OR1 -96546 063 lt0001 07603 006 lt0001 03597 004 lt0001OR10 -114284 15 lt0001 08662 016 lt0001 04412
Urban 4-Leg Signalized
OR 100 -99582 100 lt0001 07484 009 lt0001 04017 005 lt0001Total VA -60723 022 lt0001 04558 002 lt0001 0347 004 lt0001
OR1 -6059 044 lt0001 0505 004 lt0001 02773 006 lt0001OR10 -67031 057 lt0001 03986 007 lt0001 04999 009 lt0001OR 100 -65388 032 lt0001 04689 004 lt0001 043 006 lt0001FI VA -76917 032 lt0001 05001 003 lt0001 03695 005 lt0001OR1 -81437 060 lt0001 05813 005 lt0001 03188 008 lt0001OR10 -80333 063 lt0001 03446 007 lt0001 06218 010 lt0001
Urban 4-Leg Minor Stop Control
OR 100 -83166 051 lt0001 05253 006 lt0001 04695 008 lt0001Total VA -6543 082 lt0001 06591 008 lt0001 02119 002 lt0001
OR1 -4999 103 lt0001 05555 009 lt0001 01554 003 lt0001OR10 -96143 127 lt0001 08677 012 lt0001 03297 005 lt0001OR 100 -67518 110 lt0001 06157 011 lt0001 02969 005 lt0001FI VA -84268 068 lt0001 07147 006 lt0001 02481 002 lt0001OR1 -73982 099 lt0001 06496 009 lt0001 02088 003 lt0001OR10 -110104 155 lt0001 0908 015 lt0001 03226 006 lt0001
Urban 3-Leg Signalized
OR 100 -7266 107 lt0001 05508 011 lt0001 03107 006 lt0001Total VA -54696 013 lt0001 04874 002 lt0001 01985 001 lt0001
OR1 -5361 018 lt0001 04959 002 lt0001 01676 002 lt0001OR10 -5773 034 lt0001 04877 003 lt0001 02314 004 lt0001OR 100 -51642 021 lt0001 04338 003 lt0001 02309 003 lt0001FI VA -74642 018 lt0001 05791 002 lt0001 02091 002 lt0001OR1 -76877 027 lt0001 06204 003 lt0001 0181 002 lt0001OR10 -69458 047 lt0001 05096 004 lt0001 02212 005 lt0001
Urban 3-Leg Minor Stop Control
OR 100 -69883 031 lt0001 05169 004 lt0001 02308 003 lt0001 Standard Error
48
Table A-2 Statistical Parameters for Rural Intersections SPFs Parameter Estimates
Data Intercept
Coefficient of Mayor AADT
Coefficient of Minor AADT
Subtype Site Intercept (α)
StndError
P value
lnMajor (β1)
Stnd Error
P value
lnMinor (β2)
Stnd Error
P value
Total VA -69589 118 lt0001 06746 009 lt0001 0253 009 00047
OR1 -1604 237 04974 02284 021 02791 01514 012 0211 OR10 -63951 183 00005 05508 014 00001 03106 014 00224 OR 100 -06468 220 07692 02262 016 01635 -00158 017 09274 FI VA -87116 128 lt0001 07839 011 lt0001 02166 009 0013 OR1 -33285 246 01767 03601 024 0126 00597 013 06478 OR10 -80583 175 lt0001 06809 018 00001 02557 013 0057
Rural 4-Leg Signalized
OR 100 -48381 221 00287 04243 018 00193 01523 018 03943 Total VA -5494 020 lt0001 03533 002 lt0001 03935 003 lt0001
OR1 -62351 058 lt0001 04167 006 lt0001 04507 008 lt0001OR10 -53594 028 lt0001 03379 003 lt0001 03998 004 lt0001OR 100 -51255 027 lt0001 02914 003 lt0001 04075 004 lt0001FI VA -66927 030 lt0001 03899 003 lt0001 04156 004 lt0001OR1 -82561 095 lt0001 05221 009 lt0001 04962 012 lt0001OR10 -70797 044 lt0001 03789 004 lt0001 0497 005 lt0001
Rural 4-Leg Minor Stop Control
OR 100 -63326 038 lt0001 03223 004 lt0001 04424 005 lt0001Total VA -75754 084 lt0001 06465 008 lt0001 03332 008 lt0001
OR1 -58798 220 00075 05076 020 00143 0313 013 00161 OR10 -64368 110 lt0001 0544 011 lt0001 02863 006 lt0001OR 100 -9899 139 lt0001 08047 015 lt0001 04386 006 lt0001FI VA -87112 103 lt0001 07224 010 lt0001 02578 006 lt0001OR1 -9219 260 00004 07258 022 00011 03407 016 00326 OR10 -88607 146 lt0001 07059 016 lt0001 02809 008 00009
Rural 3-Leg Signalized
OR 100 -111835 185 lt0001 08669 018 lt0001 03977 008 lt0001Total VA -43293 008 lt0001 03366 001 lt0001 02087 001 lt0001
OR1 -50904 022 lt0001 0406 002 lt0001 02752 003 lt0001OR10 -40969 009 lt0001 03133 001 lt0001 02001 001 lt0001OR 100 -4231 016 lt0001 02997 002 lt0001 02308 003 lt0001FI VA -53415 011 lt0001 03394 001 lt0001 02237 001 lt0001OR1 -64457 031 lt0001 04195 003 lt0001 0307 004 lt0001OR10 -50831 014 lt0001 03245 002 lt0001 02014 002 lt0001
Rural 3-Leg Minor Stop Control
OR 100 -51046 024 lt0001 03163 003 lt0001 02112 003 lt0001
Standard Error
49
Table A-3 SPFs Goodness of Fit Results for Urban Northern Operational Region (No 1)
Data Estimation Data 70 Validation Data 30
Subtype Site MSE r2 R2FT MPB MAD MSPE R2
FT
Total VA 41150 0529 0557 -0760 4329 38490 0575
Total R1 4110 051 0551 -020 464 4486 054
FI VA 704 038 0406 -046 194 767 048
Urban 4-Leg Signalized
FI R1 809 039 0439 012 214 950 038
Total VA 224 031 0313 -003 090 238 029
Total R1 308 028 0286 008 095 200 032
FI VA 053 019 0193 000 043 053 019
Urban 4-Leg Minor Stop Control
FI R1 064 018 0187 003 043 048 021
Total VA 2490 038 0370 -064 352 2759 037
Total R1 3034 032 0305 -015 365 2687 037
FI VA 447 028 0259 -019 153 488 026
Urban 3-Leg Signalized
FI R1 559 025 0231 004 157 448 029
Total VA 185 025 0230 -004 089 204 024
Total R1 208 026 0239 -006 094 219 026
FI VA 043 015 0133 -002 043 048 016
Urban 3-Leg Minor Stop Control
FI R1 047 017 0156 -001 044 050 017
50
Table A-4 SPFs Goodness of Fit Results for Urban Western Operational Region (No 10)
Data Estimation Data 70 Validation Data 30
Subtype Site MSE r2 R2FT MPB MAD MSPE R2
FT
Total VA 41150 0529 0557 -0760 4329 38490 0575
Total R10 21976 0777 0735 1290 3233 17910 0686
FI VA 7043 0385 0406 -0458 1938 7671 0475
Urban 4-Leg Signalized
FI R10 4280 0526 0500 0377 1597 5170 0452
Total VA 2238 0315 0313 -0034 0897 2383 0292
Total R10 1161 0361 0300 -0032 0740 1050 0188
FI VA 0530 0194 0193 -0004 0432 0533 0194
Urban 4-Leg Minor Stop Control
FI R10 0312 0197 0187 0000 0382 0330 0009
Total VA 24900 0375 0370 -0645 3519 27591 0369
Total R10 14446 0451 0397 -0168 2801 24410 0255
FI VA 4467 0275 0259 -0185 1527 4875 0262
Urban 3-Leg Signalized
FI R10 3077 0266 0216 0039 1258 3390 0115
Total VA 1854 0254 0230 -0043 0893 2038 0239
Total R10 1391 0233 0197 -0054 0800 1640 0207
FI VA 0428 0151 0133 -0021 0431 0476 0157
Urban 3-Leg Minor Stop Control
FI R10 0354 0111 0089 -0019 0404 0380 0125
51
Table A-5 SPFs Goodness of Fit Results for Urban Eastern Operational Region (No 100)
Data Estimation Data 70 Validation Data 30
Subtype Site MSE r2 R2FT MPB MAD MSPE R2
FT
Total VA 41150 0529 0557 -0760 4329 38490 0575
Total R100 31108 0632 0630 0243 4717 37450 0005
FI VA 7043 0385 0406 -0458 1938 7671 0475
Urban 4-Leg Signalized
FI R100 5201 0480 0454 -0098 1864 5410 0244
Total VA 2238 0315 0313 -0034 0897 2383 0292
Total R100 1720 0443 0381 0087 0758 1150 0003
FI VA 0530 0194 0193 -0004 0432 0533 0194
Urban 4-Leg Minor Stop Control
FI R100 0509 0273 0254 0049 0383 0360 0173
Total VA 24900 0375 0370 -0645 3519 27591 0369
Total R100 17782 0410 0410 -1753 0908 38780 0004
FI VA 4467 0275 0259 -0185 1527 4875 0262
Urban 3-Leg Signalized
FI R100 3194 0243 0263 -0615 1645 5860 0236
Total VA 1854 0254 0230 -0043 0893 2038 0239
Total R100 1561 0233 0210 -0127 0902 2230 0002
FI VA 0428 0151 0133 -0021 0431 0476 0157
Urban 3-Leg Minor Stop Control
FI R100 0387 0131 0116 -0043 0444 0500 0141
52
Table A-6 SPFs Goodness of Fit Results for Rural Northern Operational Region (No 1)
Data Estimation Data 70
Validation Data 30
Subtype Site MSE r2 R2FT MPB MAD MSPE R2
FT
Total VA 10990 0353 0321 0513 2210 10070 -0073
Total R1 20080 0118 0092 -1389 3661 34220 0212
FI VA 2350 0196 0181 0045 1189 2600 -0034
Rural 4-Leg Signalized
FI R1 2920 0057 0052 -1173 1931 9760 0028
Total VA 1090 0182 0167 -0067 0794 1190 0171
Total R1 1990 0190 0245 0001 0942 1640 0173
FI VA 0480 0112 0098 -0022 0504 0530 0110
Rural 4-Leg Minor Stop Control
FI R1 0920 0093 0112 0020 0541 0520 0009
Total VA 5490 0328 0305 -0010 1651 5760 0179
Total R1 11110 0182 0254 -0679 2271 14750 0497
FI VA 1450 0181 0170 -0041 0902 1710 0099
Rural 3-Leg Signalized
FI R1 3230 0131 0153 -0116 1006 2120 0355
Total VA 0690 0144 0104 -0008 0613 0730 0102
Total R1 1210 0245 0196 0030 0712 0930 0126
FI VA 0250 0071 0048 -0009 0345 0260 0048
Rural 3-Leg Minor Stop Control
FI R1 0340 0124 0093 0016 0366 0300 0052
53
Table A-7 SPFs Goodness of Fit Results for Rural Western Operational Region (No 10)
Data Estimation Data 70 Validation Data 30
Subtype Site MSE r2 R2FT MPB MAD MSPE R2
FT
Total VA 10990 0353 0321 0513 2210 10070 -0073
Total R10 6020 0311 0268 0007 1748 6050 0382
FI VA 2350 0196 0181 0045 1189 2600 -0034
Rural 4-Leg Signalized
FI R10 1880 0158 0139 0097 0945 1590 0254
Total VA 1090 0182 0167 -0067 0794 1190 0171
Total R10 1300 0196 0163 0070 0760 1020 0078
FI VA 0480 0112 0098 -0022 0504 0530 0110
Rural 4-Leg Minor Stop Control
FI R10 0560 0142 0118 0025 0495 0480 0014
Total VA 5490 0328 0305 -0010 1651 5760 0179
Total R10 3690 0163 0170 -0432 0748 6740 0039
FI VA 1450 0181 0170 -0041 0902 1710 0099
Rural 3-Leg Signalized
FI R10 0890 0124 0117 -0391 0997 4030 -0066
Total VA 0690 0144 0104 -0008 0613 0730 0102
Total R10 0640 0126 0091 0025 0583 0580 0055
FI VA 0250 0071 0048 -0009 0345 0260 0048
Rural 3-Leg Minor Stop Control
FI R10 0240 0062 0041 0003 0335 0230 0028
54
Table A-8 SPFs Goodness of Fit Results for Rural Eastern Operational Region (No 100)
Data Estimation Data 70 Validation Data 30
Subtype Site MSE r2 R2FT MPB MAD MSPE R2
FT
Total VA 10990 0353 0321 0513 2210 10070 -0073
Total R100 10120 0042 0027 1207 1882 5120 -0307
FI VA 2350 0196 0181 0045 1189 2600 -0034
Rural 4-Leg Signalized
FI R100 2060 0053 0039 0119 0962 1370 -0023
Total VA 1090 0182 0167 -0067 0794 1190 0171
Total R100 0960 0170 0149 -0086 0746 1140 0209
FI VA 0480 0112 0098 -0022 0504 0530 0110
Rural 4-Leg Minor Stop Control
FI R100 0440 0106 0092 -0031 0475 0490 0121
Total VA 5490 0328 0305 -0010 1651 5760 0179
Total R100 2770 0492 0459 0601 1759 6260 0090
FI VA 1450 0181 0170 -0041 0902 1710 0099
Rural 3-Leg Signalized
FI R100 1040 0265 0255 0124 0923 1570 -0055
Total VA 0690 0144 0104 -0008 0613 0730 0102
Total R100 0640 0125 0087 -0037 0601 0690 0119
FI VA 0250 0071 0048 -0009 0345 0260 0048
Rural 3-Leg Minor Stop Control
FI R100 0250 0064 0038 -0013 0345 0270 0062
55
APPENDIX B
RECOMMENDED SAFETY PERFORMANCE FUNCTION MODELS
Table B-1 Recommended Urban SPFs Site Virginia SPF Models to Be Used for Urban Intersections
Urban 4-Leg Signalized Total Virginia generic total
Urban 4-Leg Signalized
Operational Region 1 generic total
Urban 4-Leg Signalized
Operational Region 10
use specified model developed
Urban 4-Leg Signalized
Operational Region 100 generic total
Urban 4-Leg Signalized FI Virginia generic FI
Urban 4-Leg Signalized
Operational Region 1 generic FI
Urban 4-Leg Signalized
Operational Region 10
use specified model developed
Urban 4-Leg Signalized
Operational Region 100
use specified model developed
Urban 4-Leg Minor Stop Control
Total Virginia generic total
Urban 4-Leg Minor Stop Control
Operational Region 1
use specified model developed
Urban 4-Leg Minor Stop Control
Operational Region 10
use specified model developed
Urban 4-Leg Minor Stop Control
Operational Region 100
use specified model developed
Urban 4-Leg Minor Stop Control
FI Virginia generic FI e^-76917MajADT^05001MinADT^03695
Urban 4-Leg Minor Stop Control
Operational Region 1
use specified model developed
Urban 4-Leg Minor Stop Control
Operational Region 10
use specified model developed
Urban 4-Leg Minor Stop Control
Operational Region 100
use specified model developed
56
Table B-1 Recommended Urban SPFs (Continued)
Site Virginia SPF Models to Be Used for Urban Intersections
Urban 3-Leg Signalized
Total Virginia
use generic model developed for total
crashes
Urban 3-Leg Signalized
Operational Region 1
use generic model developed for total
crashes
Urban 3-Leg Signalized
Operational Region 10
use specific regional model
developed
Urban 3-Leg Signalized
Operational Region 100
use generic model developed for total
crashes
Urban 3-Leg Signalized FI Virginia
use generic model developed for FI
crashes
Urban 3-Leg Signalized
Operational Region 1
use generic model developed for FI
crashes
Urban 3-Leg Signalized
Operational Region 10
use specific regional model
developed
Urban 3-Leg Signalized
Operational Region 100
use generic model developed for FI
crashes
Urban 3-Leg Minor Stop Control
Total Virginia
use generic model developed for total
crashes
Urban 3-Leg Minor Stop Control
Operational Region 1
use generic model developed for total
crashes
Urban 3-Leg Minor Stop Control
Operational Region 10
use specific regional model
developed
Urban 3-Leg Minor Stop Control
Operational Region 100
use generic model developed for total
crashes
Urban 3-Leg Minor Stop Control
FI Virginia use generic model developed for FI
crashes
Urban 3-Leg Minor Stop Control
Operational Region 1
use generic model developed for FI
crashes
Urban 3-Leg Minor Stop Control
Operational Region 10
use specific regional model
developed
Urban 3-Leg Minor Stop Control
Operational Region 100
use generic model developed for FI
crashes
57
Table B-2 Recommended Rural SPFs Site Virginia SPF Models to Be Used for Rural Intersections
Rural 4-Leg Signalized Total Virginia
use generic model developed for total
crashes
Rural 4-Leg Signalized
Operational Region 1
use generic model developed for total
crashes
Rural 4-Leg Signalized
Operational Region 10
use specific regional model developed
Rural 4-Leg Signalized
Operational Region 100
use specific regional model developed
Rural 4-Leg Signalized FI Virginia use generic model
developed for FI crashes
Rural 4-Leg Signalized
Operational Region 1
use generic model developed for FI crashes
Rural 4-Leg Signalized
Operational Region 10
use specific regional model developed
Rural 4-Leg Signalized
Operational Region 100
use specific regional model developed
Rural 4-Leg Minor Stop Control Total Virginia
use generic model developed for total
crashes
Rural 4-Leg Minor Stop Control
Operational Region 1
use generic model developed for total
crashes e^-549MajADT^035MinADT^039
Rural 4-Leg Minor Stop Control
Operational Region 10
use specific regional model developed
Rural 4-Leg Minor Stop Control
Operational Region 100
use generic model developed for total
crashes
Rural 4-Leg Minor Stop Control FI Virginia use generic model
developed for FI crashes
Rural 4-Leg Minor Stop Control
Operational Region 1
use generic model developed for FI crashes
Rural 4-Leg Minor Stop Control
Operational Region 10
use generic model developed for FI crashes
Rural 4-Leg Minor Stop Control
Operational Region 100
use generic model developed for FI crashes
58
Table B-2 Recommended Rural SPFs (Continued)
Site Virginia SPF Models to Be Used for Rural Intersections
Rural 3-Leg Signalized Total Virginia use generic model
developed for total crashes
Rural 3-Leg Signalized
Operational Region 1
use generic model developed for total crashes
Rural 3-Leg Signalized
Operational Region 10
use generic model developed for total crashes
Rural 3-Leg Signalized
Operational Region 100
use generic model developed for total crashes
Rural 3-Leg Signalized FI Virginia use generic model
developed for FI crashes
Rural 3-Leg Signalized
Operational Region 1
use generic model developed for FI crashes
Rural 3-Leg Signalized
Operational Region 10
use generic model developed for FI crashes
Rural 3-Leg Signalized
Operational Region 100
use generic model developed for FI crashes
Rural 3-Leg Minor Stop Control Total Virginia use generic model
developed for total crashes
Rural 3-Leg Minor Stop Control
Operational Region 1
use generic model developed for total crashes
Rural 3-Leg Minor Stop Control
Operational Region 10
use specific regional model developed
Rural 3-Leg Minor Stop Control
Operational Region 100
use generic model developed for total crashes
Rural 3-Leg Minor Stop Control FI Virginia use generic model
developed for FI crashes
Rural 3-Leg Minor Stop Control
Operational Region 1
use generic model developed for FI crashes
Rural 3-Leg Minor Stop Control
Operational Region 10
use specific regional model developed
Rural 3-Leg Minor Stop Control
Operational Region 100
use generic model developed for FI crashes

ii
DISCLAIMER
The project that was the subject of this report was done under contract for the Virginia Department of Transportation Virginia Transportation Research Council The contents of this report reflect the views of the authors who are responsible for the facts and the accuracy of the data presented herein The contents do not necessarily reflect the official views or policies of the Virginia Department of Transportation the Commonwealth Transportation Board or the Federal Highway Administration This report does not constitute a standard specification or regulation Any inclusion of manufacturer names trade names or trademarks was for identification purposes only and is not to be considered an endorsement
Each contract report is peer reviewed and accepted for publication by Research Council staff with expertise in related technical areas Final editing and proof reading of the report are performed by the contractor
Copyright 2010 by the Commonwealth of Virginia All rights reserved
iii
ABSTRACT
In recent years significant effort and money have been invested through research and implemented safety projects to enhance highway safety in Virginia However there is still substantial room for improvement in both crash frequency and severity As there are limits in the available funds for safety improvements it is crucial that allocated resources for safety improvement be spent at highway locations that will result in the maximum safety benefits In addition intersection crashes play a significant role in the safety conditions in Virginia For example crashes at intersections in Virginia for the period 2003 through 2007 account for 438 of all crashes and 26 of fatal crashes Therefore identifying intersections for safety improvements that will give the highest potential for crash reduction when appropriate safety countermeasures are implemented will have a significant impact on the overall safety performance of roads in Virginia
The Federal Highway Administration (FHWA) has developed a procedure for identifying
highway locations that have the highest potential for crash reduction (ITT Corporation 2008) A critical component of this method is the use of safety performance functions (SPFs) to determine the potential for crash reductions at a location An SPF is a mathematical relationship (model) between frequency of crashes by severity and the most significant causal factors on a specific highway Although the SafetyAnalyst Userrsquos Manual presents several SPFs for intersections these were developed using data from Minnesota FHWA also suggested that if feasible each state should develop its own SPFs based on crash and traffic volume data from the state as the SPFs that are based on Minnesota data may not adequately represent the crash characteristics in all states SPFs for intersections in Virginia were developed using the annual average daily traffic as the most significant causal factor emulating the SPFs currently suggested by SafetyAnalyst The SPFs were developed for both total crashes and combined fatal plus injury crashes through generalized linear modeling using a negative binomial distribution Models were also developed for urban and rural intersections separately and in order to account for the different topographies in Virginia SPFs were also developed for three regions Northern Western and Eastern
This report covers Phases I and II of the study which includes urban and rural
intersections maintained by VDOT Statistical comparisons of the models based on Minnesota data with those based on the Virginia data showed that the specific models developed for Virginia fit the Virginia crash data better The report recommends that VDOTrsquos Traffic Engineering Division use the SPFs developed for Virginia and the specific regional SPFs suggested in this report to prioritize the locations in need of safety improvement
FINAL CONTRACT REPORT
SAFETY PERFORMANCE FUNCTIONS FOR INTERSECTIONS ON HIGHWAYS MAINTAINED BY THE VIRGINIA DEPARTMENT OF TRANSPORTATION
Nicholas J Garber PhD PE
Professor of Civil amp Environmental Engineering
Griselle Rivera Graduate Research Assistant
Department of Civil amp Environmental Engineering
University of Virginia
INTRODUCTION
The Virginia Department of Transportation (VDOT) is continually identifying ways to
enhance the achievement of Virginiarsquos broad vision statement to make Virginiarsquos surface transportation system the safest in the nation by 2025 (Virginia Surface Transportation Safety Executive Committee 2006) Reductions in crash occurrence and severity at intersections will significantly contribute to the overall safety improvements in Virginia as intersection crashes form a large proportion of crashes that occur on Virginiarsquos surface transportation system For example Table 1 shows that for 2003 through 2007 intersection crashes on VDOT-maintained roads accounted for about 44 of all crashes and Table 2 shows that about 26 of fatal crashes occurred at intersections
In addition because of limited funds it is crucial that allocated resources for safety improvement be spent at highway locations that will result in the maximum safety benefits The Federal Highway Administration (FHWA) has developed a prioritization methodology for safety improvements using the empirical Bayes (EB) method This method prioritizes sites for safety improvement to obtain the greatest safety benefits (ITT Corporation 2008) This procedure requires the use of safety performance functions (SPFs) An SPF relates the frequency of crashes by severity with the most significant causal factors on a specific type of road For example Figure 1 shows a schematic graph of an SPF for a highway segment to demonstrate how it is used in site prioritization
Table 1 Total and Intersection Crashes For 2003 Through 2007
Year Total Crashes Intersection
Crashes Proportion
()
2003 94817 41116 434 2004 95063 42042 442 2005 96066 42064 438 2006 93732 41714 445 2007 89394 38695 433
TOTAL 469072 205631 438
2
Table 2 Total Fatal and Intersection Fatal Crashes for 2003 Through 2007
Year Total Fatal
Crashes Intersection
Fatal Crashes Proportion
()
2003 726 216 298 2004 723 188 260 2005 752 188 250 2006 722 193 267 2007 778 184 237
TOTAL 3701 969 262
Figure 1 Example of a Safety Performance Function (SPF)
SPFs are developed for different roadway segments and intersection configurations
Currently the SPFs suggested by FHWA use only annual average daily traffic (AADT) as the most significant causal factor For example an intersection SPF gives the predicted number of crashes per year for given AADTs on the major and minor approaches SPFs aid the transportation planner to identify better where to expend limited staff resources on detailed assessments to determine feasible and effective treatments AADT-driven SPFs are practical for network screening Adding more independent variables beyond AADT may be too labor intensive The corresponding EB-adjusted long-term number of crashes can be computed from the actual observed crashes and the SPF-predicted number of crashes for the given AADT As it can be seen in Figure 1 the difference between the EB-adjusted long-term number of crashes and the SPF-predicted number of crashes gives the potential for safety improvement (PSI) The PSI can be better described as the potential for intersection sites to be upgraded or repaired by reducing crashes and improving safety if appropriate countermeasures are applied to these sites This can be used to develop a priority list of the specific sites or intersections where detailed assessments to determine feasible and effective treatment can be undertaken Sites that have a
3
greater PSI are given a higher prioritization when all selected sites are ranked in order to determine which sites should receive prompt attention
SafetyAnalyst provides a set of state-of-the art software tools for use in the decision-
making process to identify safety needs and develop a program for site-specific safety improvement projects SafetyAnalyst also plays an important role because it helps make sure that highway agencies receive the greatest possible safety benefit from every dollar spent toward safety modifications (FHWA 2010) FHWA-suggested SPFs for intersections are however based on data from Minnesota and it has been recommended that individual states develop SPFs based on their own crash and AADT data (Harwood et al 2004) The development of SPFs for Virginia is of great importance when safety improvement is being considered Because of the important role SPFs play in the software tools in SafetyAnalyst it is essential at least to test how well the FHWA-suggested SPFs fit the Virginia data and if necessary to develop specific SPFs for Virginia
PURPOSE AND SCOPE
The purpose of this study was to investigate the extent to which the FHWA-suggested
intersection SPFs which were based on Minnesota data were transferable to Virginia and if necessary to develop Virginia-specific SPFs using crash and corresponding AADTs for intersection sites in Virginia The SPFs for this study include those for total crashes and combined fatal and injury (FI) crashes with different configurations such as four-leg and three-leg intersections signalized intersections and unsignalized intersections or urban and rural locations
The scope was limited to intersection types on VDOT-maintained roads for which
appropriate and adequate data were available This report gives the results obtained for urban and rural intersections The objectives were as follows
1 Evaluate the transferability of the FHWA-suggested SPFs to Virginia 2 If necessary develop SPFs for different intersection types that are suitable for use in
Virginia 3 Identify some of the intersections that have a higher than expected number of crashes
Crashes related to two-lane roads were investigated in a separate study (Garber et al
2010) It is anticipated that the results obtained from both studies will produce a set of SPFs that can be applied to Virginia and be used to prioritize those two-lane segments and intersections that are in need of safety improvements thereby improving the transportation planning process
4
METHODS
Ten tasks were performed to achieve the study objectives 1 Conduct a literature review 2 Select study sites 3 Extract crash data 4 Extract AADT data 5 Evaluate the transferability to Virginia of the suggested Minnesota SPFs 6 Develop specific SPFs for Virginia 7 Evaluate the Virginia SPFs developed 8 Determine the appropriate number of SPFs for Virginia through a pruning process 9 Prioritize sites based on potential for crash reduction 10 Evaluate benefits and implementation prospects
Literature Review
Recent publications related to the development and evaluation of SPFs for different highway systems were identified and reviewed so as to identify information of relevance to this study Sources used were the Transportation Research Information System (TRIS) the VDOT Research Library and the University of Virginia libraries
Selection of Study Sites
The research team in consultation with staff from VDOTrsquos Traffic Engineering Division
(TED) initially selected 21112 intersections under the jurisdiction of VDOT for the study These included all intersections for which the location was properly identified by an intersection node and for which geometric characteristics remained the same throughout the study period of 2003 through 2007 The required geometric traffic and crash data for each site were then extracted from the relevant databases The data were obtained primarily from the Highway Traffic Records Information System (HTRIS) HTRIS is a comprehensive Oracle database system which interrelates and consolidates Virginiarsquos highway and traffic information used for internal management and reporting VDOT maintains detailed records on current and historical roadway crash and traffic information in HTRIS For this reason only VDOT-maintained roads were used for analysis This database system contains multiple subsystems three of which were used to extract data for this study roadway inventory (RDI) for intersection configuration and type of control accident (ACC) for crash counts and highway performance monitoring system (HPMS) for AADTs Using the available data each intersection was classified based on the area type (urban or rural) the traffic control system (signalized stop control or yield control) and the configuration (number of approaches) Intersections for which all the data requirements for proper classification were not available were deleted from the list of study sites
The classification of an intersection as urban or rural was based on VDOTrsquos classification
of each approach route Intersections with all approaches designated as rural were classified as
5
rural and those with all approaches designated as urban were classified as urban Intersections with urban and rural approaches were removed from the list of study sites to minimize the uncertainty A data quality analysis was also performed to ascertain that the AADT values for all approaches of each intersection and for each year of the study period were available Intersections with incomplete data were removed from the study including yield all-way stop and intersections with five approaches This resulted in 18356 intersections classified as urban or rural as shown in Table 3
Virginia is divided into five operational regions as shown in Figure 2 After consultation
with VDOT and the technical review panel the different topographical characteristics in Virginia were then used to group the intersections into three regional groups as Northern Western and Eastern The Northern region is composed of intersections in Northern Virginia and surrounding counties the Western region is considered to have a mountainous terrain and the Eastern region is considered to have rolling to flat terrain Table 3 also shows the specific districts and counties in each of the three regions used in this study This regional classification helped to partially account for different characteristics that are encountered throughout the state
Table 3 Urban and Rural Classification Operational Region Districts Urban Rural Total
Northern (No 1)
District 9 (NOVA) + Culpeper (023) Fauquier County (030) King George County (048) Madison County (056) Orange County (068) Rappahannock County (078) Spotsylvania (088) Stafford County (089)
4620 596 5216
Western (No 10)
District 1 (Bristol) District 2 (Salem) District 3 (Lynchburg) District 8 (Staunton) + Albemarle County (002) Fluvanna County (032) Greene County (039) Louisa County (054)
1197 6706 7903
Eastern (No 100)
District 4 (Richmond) and District 5 (Hampton Roads) + Caroline County (016) Essex County (028) Gloucester County (036) King amp Queen County (049) King William (050) Lancaster County (051) Mathews County (057) Middlesex County (059) Northumberland County (066) Richmond County (079) Westmoreland County (096)
2193 3044 5237
Total 8010 10346 18356 Proportion () 4364 5636 100 Alternative method of identifying regions for easy application of the SAS code No 1 = Northern region No 10 = Western region No 100 = Eastern region
6
Figure 2 Virginia Operational Regions (Cogburn 2007)
The study considered urban and rural intersections with urban consisting of 8010 intersections and rural consisting of 10346 intersections as shown in Table 4
The intersections were also divided by their configuration (number of approaches) and
the type of traffic control (signalized or minor stop control) The number of urban intersection sites for each category is shown in Table 5 and that for rural intersections in Table 6 The total number of rural four-leg signalized and rural three-leg signalized sites is much lower than that for the urban signalized intersections However this is expected as a much lower percentage of rural intersections are signalized In addition all-way stop intersections were excluded because of the low number at the time of the study
Table 4 Proportion of Urban and Rural Sites by Region
Operational Region Urban Proportion () Rural Proportion () Northern 4620 5768 596 5760 Western 1197 1494 6706 64817 Eastern 2193 2738 3044 29423 TOTAL 8010 100 10346 100
Table 5 Distribution of Urban Sites by Geometric Configuration
Operational Region Urban 4-leg Signalized
Urban 4-leg 2-Way Stop
Urban 3-leg Signalized
Urban 3-leg Minor Stop Total
Northern 371 766 497 2986 4620 Western 53 153 137 854 1197 Eastern 144 320 202 1527 2193 TOTAL 568 1239 836 5367 8010 Proportion () 709 1547 1044 6700 100
7
Table 6 Distribution of Rural Sites by Geometric Configuration
Operational Region Rural 4-leg Signalized
Rural 4-leg 2-Way Stop
Rural 3-leg Signalized
Rural 3-leg Minor Stop Total
Northern 19 67 13 497 596 Western 90 894 117 5605 6706 Eastern 73 609 53 2309 3044 TOTAL 182 1570 183 8411 10346 Proportion () 176 1517 177 8130 100
Crash and Operational Data Collection
As previously discussed HTRIS serves as a centralized warehouse of traffic and roadway data for Virginia and is composed of various subsystems that carry distinct data RDI ACC and HPMS were the three subsystems used to extract the necessary data for the study
VDOTrsquos TED staff extracted the crash data by using the ACC database for the years
2003 through 2007 The ACC database is composed of data derived from the crash report forms (DMV FR300) that are filled out by police officers and include data such as driverrsquos actions driver characteristics environmental conditions collision type and crash severity among other factors The database developed for this study included total fatal injury and property damage only (PDO) (property damage greater than $1000) crashes that occurred within a distance of 250 feet or 0047 mile of the intersection which matches the procedure used to develop the suggested SPFs in SafetyAnalyst The RDI database was used to identify the intersection ID or node number for the urban and rural intersection sites that had the same geometric conditions throughout the 5 years selected for the study
A Structured Query Language (SQL) program was developed for retrieving and
formatting the required data for the analysis This query specified the intersection node configuration approach volumes urbanrural classification crashes and traffic control device for each year of the study period The Statistical Analysis Software SAS (913) was then used to format the data in a way suitable for the analysis (SAS Institute Inc 2009)
Annual Average Daily Traffic Selection
The major and minor AADTs were used as the independent variables in developing the SPFs for intersections in Virginia in accordance with the SPFs developed for SafetyAnalyst (Harwood et al 2004) It was therefore necessary to identify the major and minor approaches at each intersection In determining the major and minor AADTs it was recommended by VDOT that for four-leg approaches the major entering volume should be the sum of the two highest approach volumes and the minor entering volume the sum of the two lowest approach volumes For three-leg approaches the major entering volume was the sum of the two highest approach volumes The highway performance monitoring system database was used to obtain the AADTs for the selected study sites
8
Evaluation of Recommended Minnesota SPFs
Once all of the necessary data were obtained for each of the study sites the SafetyAnalyst-recommended SPFs which are based on data for intersections in Minnesota were tested to determine how well they fit the Virginia data Both graphical and statistical methods were used to conduct these tests The graphical method consisted of a visual inspection of the spread of the Virginia data for a specific configuration of intersection and the actual crashes of a given severity plotted with the resultant curve from using the same Virginia database and the corresponding recommended Minnesota SPF The statistical test consisted of computing the Freeman-Tukey RFT 2 coefficients for the recommended SPFs using the appropriate Virginia data The RFT
2 coefficient was used as this was the statistical parameter used to represent the goodness of fit (ITT Corporation 2008) in developing the SafetyAnalyst-recommended SPFs Equations 1 2 and 3 show how the data were transformed to compute the RFT
2 (Fridstroslashm et al 1995) fi = ( yi )05 + ( yi +1 )05 (Eq 1) ecirci = fi ndash ( 4 times ŷi + 1 )05 (Eq 2) RFT
2 = 1 ndash sumiecirci2 sumi( fi ndash fm )2 (Eq 3)
where fi = Freeman-Tukey transformation statistic yi = observed data at site i ecirci = residual at site i ŷi = modeled (predicted) value at site i fm= mean of the transformation statistic (fi) across all sites of the same configuration and urbanrural classification RFT
2 = Freeman-Tukey R2
Developing Virginia-Specific SPFs
The format of the specific SPFs developed for Virginia is the same as that in the
SafetyAnalyst manual and given as
1 2k e x MajAADT x MinAADTβ βα= (Eq 4) where
k = predicted crash frequency per intersection per year MajAADT = AADT on the major road (vehday) MinAADT = AADT on the minor road (vehday) α = intercept
9
β1 = coefficient of major AADT β2 = coefficient of minor AADT
In developing the SPFs a negative binomial (NB) distribution for the crash data was
used as preliminary analysis showed that the data fit the NB distribution The form of the data used to develop the SPFs can be either the panel or cross-sectional (collapsed) format According to Kweon and Lim (2010) the panel format uses original panel data which consist of assembling several years of data over the same intersection and the cross-sectional models use pseudondashcross-sectional data which are data converted or rearranged from the panel set The difference between the two types of models obtained is that the model based on the panel data form takes advantage of the characteristics of the panel data by positioning a predefined correlation structure on reciprocated measures over years at the same time whereas the model based on the cross-sectional form uses the data created by collapsing the multi-year panel data into apparently a single-year panel data The crash data were divided into the estimation and validation portions Seventy percent was selected randomly and used as the estimation data to develop the SPFs and the remaining 30 was used as the evaluation data
An estimation of acceptable values was made for the regression coefficients and the
dispersion parameter when developing the SPFs for the EB method in SafetyAnalyst The regression coefficients are critical for the comparison of different SPFs The dispersion parameter (d) is important when using the EB method in SafetyAnalyst because it plays an integral function in computing the EB weight that influences the estimate of the EB long-term predicted crashes When determining the dispersion parameter from SAS for the urban four-leg signalized intersections the values obtained were d = 02223 for the panel data and d = 02216 for the collapsed data but when determining the values for the urban four-leg two-way stop intersections the values calculated were d = 04284 for panel data and d = 02518 for collapsed data In the urban four-leg two-way stop intersections a significant difference in the d values was observed which led to the choice of panel data for the modeling as they would be more reliable than the collapsed data By looking at the obtained values it can be appreciated that the collapsed model underestimates the dispersion which will eventually cause the EB value to inflate therefore leading to a biased report for the collapsed model
Generalized linear modeling (GLM) was used to create a correlation between the intersection crashes for the 5 years chosen for analysis and the major and minor approach volumes For the statistical modeling SAS was employed (SAS Institute Inc 2009) This software includes the GENMOD procedure and the equation used is the same as given in Equation 5 The GENMOD procedure gives an output of generalized estimating equations (GEE) parameter estimates which are the ones used to develop the Virginia SPFs
1 2exp( )it itk MajAADT MajAADTα β β ε= + + + (Eq 5) where i = intersection index (i = 1hellip N) t = severity index (t = TOT [total crashes] FI [fatal + injury crashes] PDO [property damage only])
10
α = intercept β1 = coefficient of major AADT β2 = coefficient of minor AADT
itk = dependent variable at intersection i and severity t (crashesyr) νit = random error exp (νit) Gamma (θ θ) εit = random (residual) error in GEE
The random errors presented in this equation have the function of not letting the β values or coefficients become biased
Evaluation of Virginia-Specific SPFs
Several statistical parameters were used to assess how well the Virginia SPFs fit the data The parameters used and suggested by Washington et al (2005) were the mean prediction bias (MPB) the mean absolute deviation (MAD) the mean square error (MSE) the mean squared prediction error (MSPE) the Pearsonrsquos product moment correlation coefficients between observed and predicted crash frequencies (used for both validation and estimation data) dispersion parameters and the Freeman Tukey RFT
2 coefficients computed from Equation 3 To test the fit of the SPFs the 70 estimation data set was used to calculate the MSE the Pearsonrsquos product moment correlation coefficients the R2 and the R2
FT To test the transferability of the SPFs the 30 validation data set was used to compute the MPB MAD and the MSPE The expressions used to determine these coefficients are given in Equations 6 through 10
( )2
iin
1i
nYYMPB
2 minussum= = (Eq 6)
2
n
1i ii
n
YYMAD
2sum=minus
= (Eq 7)
( )
pnYY
MSE1
n
1i
2
ii2
minus
minus= sum = (Eq 8)
( )
2
n
1i
2
ii
nYY
MSPE2sum=
minus= (Eq 9)
where p = degrees of freedom i = intersection index Yi = observed crash frequency at intersection i Ŷi = predicted crash frequency at intersection i
11
n2 = validation data sample size 30 n1 = estimation data sample size 70
(Eq 10) where
_
1Y = average of observed crashes per intersections _
2Y = average of predicted crashes per intersections Yi1 = observed values at intersection i Y i2 = predicted values at intersection i
It should be noted that when values obtained from the MPB MAD MSE and MSPE
formulas are close to 0 it indicates a good fit or desirable SPF and when values for the RFT2 and
R2 formulas are close to 1 it indicates a suitable fit The dispersion parameter (d) is used in the variance-mean relationships as shown in Equations 11 and 12
(Eq 11)
( ) ( ) ( )i i i i i iVar Y X E Y X d x E Y X= + (Eq 12) A weighting factor (Wi) used in the EB procedure is obtained from Equation 13 and used in Equation 14 to obtain the EB-estimated value
( )1
1ii i
Wd x E Y X
=+
(Eq 13)
( ) ( ) ( )1EB i i i i i i iE E y y W x E Y X W x Y= + minus (Eq 14)
where 0 lt W lt 1 Var (|) = conditional variance E (|) = conditional mean Var m or Var (Yi|Xi) = estimated variance of mean crash rate E m or E (Yi|Xi) = estimated mean crash rate from SPF d = estimated NB dispersion parameter (also called overdispersion parameter)
2Var m E m d x E m= +
( )( )( ) ( )
1 1 2 21 22 2
1 21 2
i i
i i
Y Y Y Yr
Y Y x Y Y
sum minus minus=⎡ ⎤sum minus sum minus⎢ ⎥⎣ ⎦
12
W = weight Xi = variables such as AADT Yi = number of observed crashes per year at intersection i EEB = EB-adjusted estimated crashes (crashesyr)
In the variance-mean relationship if the value obtained for the dispersion parameter d is 0 then the variance is the same as the mean (see Equations 11 and 12) which causes the NB model to collapse to the Poisson model This parameter has a strong influence on the weight in the EB formula (see Eq 13) therefore it has an effect in the EB-estimated value SAS was helpful in computing this parameter for the different types of intersections analyzed in the study throughout the 5 years
Pruning Process
Before the site prioritization was performed pruning was done to avoid over-representation of the SPFs that might not reflect much difference in the study when compared with statewide SPFs At the completion of the pruning process only the necessary or minimum effective SPFs were retained MSPE is typically the parameter used to assess errors associated with a validation data set for this reason MSPE was used for pruning In order to verify whether a specific regional SPF should be retained or not the validation data set (30 of the data) was used to compute MSPE for both the specific regional SPFs and the corresponding statewide SPFs If MSPE for the regional SPF was greater than that for the corresponding Virginia statewide SPF or if the difference between these two MSPEs was less than 10 it was concluded that the regional SPF was not necessary and it was therefore discarded The following example illustrates the steps for urban four-leg signalized FI crashes in Region 1
1 The 30 FI crash data were obtained for urban signalized four-leg intersections in Region 1 and the MSPE was determined using the statewide SPF for the FI urban four-leg signalized intersections
2 The 30 FI crash data for urban signalized four-leg intersections in Region 1 were
then used to determine MSPE for the specific Region 1 SPF for FI crashes 3 Verify if the MSPE value for the specific regional SPF is higher than the statewide
MSPE value if yes discard the specific regional SPF if no tentatively retain the specific regional model
4 The difference between the two MSPEs was determined to determine whether it was
less than 10 of the statewide MSPE if yes discard the specific regional SPF if no retain the specific regional model This process was repeated for all regional SPFs
13
Identification of Intersections with a Higher Than Expected Number of Crashes
In order to identify some of the intersections with a higher than expected number of crashes a prioritization analysis based on the EB method was conducted This analysis was carried out to identify the top 25 intersections with a high PSI in the urban areas of the Northern Virginia and Bristol districts These two districts were selected to identify any effect of the approach AADTs as two-lane roads in the Northern Virginia District carry much higher volumes than those in the Bristol District The PSI is the difference between the EB-adjusted long-term crashes and the SPF-estimated crashes The PSI was first determined and then a priority list was developed with intersections showing a higher PSI receiving a higher priority This procedure first required the computation of yearly calibration factors (Cy) that accounted for intrinsic yearly variations that were not accounted for in developing the SPFs These yearly calibration factors were determined using the steps described here and given in Equations 15 through 18 (ITT Corporation 2008) Calculation of Yearly Calibration Factor (Cy) For subtype s and severity t the following steps were performed 1 Calculate the (unadjusted) predicted number of crashes using the appropriate SPF yiMinAADTMajAADTe ststst
isyisyisty amp~ 21ˆˆˆ foralltimestimes= ββακ (Eq 15)
2 Sum the predicted numbers over all intersections
ysN
iistysty forall=sum
=
~~1κκ (Eq 16)
3 Sum the observed numbers of crashes over all intersections
yKKsN
iistysty forall=sum
=
1
(Eq 17)
4 Calculate yearly calibration factor csty
yK
csty
stysty forall= ~κ (Eq 18)
5 Repeat the steps for all subtypes (s) and severities (t)
where i = intersection index (i = 1hellip N)
14
s = subtype index (s = urban four-leg signalized intersection rural three-leg minor stop controlled intersection etc) t = severity index (t = TOT [total crashes] FI [fatal + injury crashes] PDO [property damage only]) y = year index (i = 1 [base year] 2 hellip Y) csty = yearly calibration factor for crash subtype s severity t and year y MajAADT = AADT on the major road (vehday) MinAADT = AADT on the minor road (vehday)
istyκ~ = (unadjusted) predicted number of crashes at intersection i for crash subtype s severity t and year y
istyκ = (adjusted) predicted number of crashes at intersection i for crash subtype s severity t and year y α = intercept
1β = coefficient of major AADT 2β = coefficient of minor AADT
These yearly calibration factors were then used to determine the predicted number of
crashes at an intersection based on the SPF for the severity of crashes and type of intersection being considered The PSI for each intersection was then determined using the steps described in Equations 19 through 22 (ITT Corporation 2008) Steps for Calculating PSI for Subtype s
1 Calculate the (adjusted) predicted number of crashes
amp~
21ˆˆˆ ststst
isyisysty
istystyisty
MinAADTMajAADTec
yticββα
κκ
timestimestimes=
foralltimes= (Eq 19)
2 Calculate yearly correction factor Cisty
ytiCyist
istyisty amp
)1(
forall==κ
κ
(Eq 20)
3 Calculate EB weight
tid
w Y
y istystist amp
11
1
foralltimes+
=sum =
κ (Eq 21)
4 Calculate the EB-adjusted estimated number of crashes for year 1
15
tiC
KwwX Y
y isty
Y
y istyistyististyist amp)1(
1
1)1()1( forallminus+times=
sumsum
=
=== κ (Eq 22)
5 Determine the PSI for each intersection If istYX gt istYκ include intersection i in the list for prioritization using istYPSI = istYX
where i = intersection index (i = 1hellip N) s = subtype index (s = urban four-leg signalized intersection rural three-leg minor stop
controlled intersection etc) t = severity index (t = TOT [total crashes] FI [fatal + injury crashes] PDO [property damage
only]) y = year index (y = 1 [base year] 2 hellip Y) cy = yearly calibration factor for crash subtype s severity t and year y d = dispersion parameter w = weight MajAADT = AADT on the major road (vehday) MinAADT = AADT on the minor road (vehday) PSI = potential for safety improvement
istyC = yearly correction factor
istyκ~ = (unadjusted) predicted number of crashes at intersection i for crash subtype s severity t and year y
istyκ = (adjusted) predicted number of crashes at intersection i for crash subtype s severity t and year y
istyX = EB-adjusted estimated number of crashes α = intercept
1β = coefficient of major AADT 2β = coefficient of minor AADT
The prioritization lists for urban two-lane roads in the Northern Virginia and Bristol
districts were then developed based on the PSIs obtained for three prioritization procedures These alternative prioritization procedures were the average crash rates (ACRs) for the study period (see Equation 23) the critical crash ratio (CCR) (see Eqs 24 through 27) (Garber and Hoel 2009) and the EB method The list was developed with the intersections having the highest PSI listed first followed by other intersections in descending order The execution of the EB method prioritization process was achieved through use of the computer codes in SAS Finally the effectiveness of using the EB method for prioritizing sites for safety improvement was illustrated by comparing the PSIs from using intersection crash rates critical crash and the EB procedures
16
Procedure for Crash Rate Method The ACR for the intersection is given as
( )(1000000)( )( )(365)T
TCACRN V
= (Eq 23)
where ACR = the average crash rate for the intersection under consideration (crashes1000000
approach volume) TC = number of crashes over the study period at the intersection N = duration of study period (yr) VT = average daily total approach volume at the intersection Procedure for Critical Rate Method
The critical rate method was accomplished by first computing the traffic base (TB) of the intersection under consideration using Equation 24 The ACR for the intersection under consideration is then computed using its TB as shown in Equation 25 The intersection critical crash rate (ICCR) is then determined using Equation 26 The critical crash ratio (CCR) for the intersection is then computed as the ratio of ICR and the average crash rate (AVR) for all intersections under the same category (intersection type urbanrural etc) as that for the intersection being considered using Equation 27 TB is given as
365
1 000 000
NxVxTB = (Eq 24)
where TB = the total approach volume over the study period of N years at the intersection under consideration (veh1000000) V = average daily approach volume at the intersection under consideration ACR is obtained as
TCACRTB
= (Eq 25)
where ACR = ACR at the intersection under consideration over the study period of N years
17
TB = the total approach volume over the study period of N years at the intersection under consideration (veh1000000) The critical crash rate (ICCR) for the intersection under consideration is given as
05 AVRICCR AVR TFTB TB
= + + (Eq 26)
where AVR = ACR for intersections within the state and of the same designation (eg rural three-leg with minor stop control) as that for the intersection under consideration TF = number of standard deviations for the confidence level being used in the analysis (usually 196 for 95 confidence level) TB = the total approach volume over the study period of N years at the intersection under consideration (veh1000000) The critical crash ratio (CCR) for the intersection is then obtained as
ACRCCRICCR
= (Eq 27)
where ACR = ACR at the intersection under consideration over the study period of N years (see Eq 2) ICCR = critical crash rate for the intersection under consideration (see Eq 26)
Benefits and Implementation Expectations
The expected benefits from developing SPFs and prioritizing intersection sites were illustrated by comparing the PSIs for the prioritized sites when sites were prioritized using the EB method with those obtained when sites were prioritized using crash rates and the critical crash ratio This analysis was conducted for the combined fatal plus injury crashes SPFs An estimate of the cost savings attributable solely to the potential reduction of crashes was also computed by using crash costs given in an FHWA study (FHWA 2005)
18
RESULTS AND DISCUSSION
Literature Review
SafetyAnalyst
The SafetyAnalyst Userrsquos Manual (ITT Corporation 2008) has SPFs that are suggested for intersections that are based on Minnesota data Tables 7 and 8 show the regression coefficients (α β1 and β2) for the SPFs developed for total and combined FI crashes respectively The values for the goodness of fit parameter RFT
2 are also given Although these RFT2 are all less
than 045 with a few less than 010 it has been suggested that the SPFs used in SafetyAnalyst could provide a realistic estimate of an expected crash frequency as a function of traffic volume and roadway geometry (Pham and Ragland 2005)
Methodological and Research References
Several studies similar to this study have been conducted in Canada Colorado California Texas New York and Minnesota For example a study was conducted using data from Colorado California and Texas to examine the functional form of the SPFs for urban freeways (Kononov et al 2008) Five years of crash data were acquired from the respective departments of transportation and the highway safety information system from Colorado The study revealed that the amount of crashes increased moderately with congestion in segments on urban freeways This study however did not include intersections
A study by Lyon et al was conducted in Toronto Ontario Canada to develop SPFs for urban signalized intersections (Lyon et al 2005) Collision data were gathered for five years and included 1950 urban intersections SPFs were developed for different severity levels impact types and intersection types such as four-leg and three-leg intersections The format used to develop the SPFs is shown in Equation 28 This format is somewhat different from that of Equation 4 suggested in Safety Analyst
Collisionsyear = α (F1)β1(F2)β2 exp (β3X1 + β4X2 + ) (Eq 28) where α and βi = the coefficients estimated in the SPF calibration process F1 and F2 = the entering AADTs on the major and minor roads respectively Xi = other independent variables (such as single lane versus multilane approaches with and without left-turn lanes or right-turn lanes high and low pedestrian activities or in some cases F1 or F2 or both)
19
Table 7 SafetyAnalystrsquos SPFs for Intersections (Total Crashes) Site
subtype Code
Site subtype Description
State Regression coefficients
LogIntercept (α)
Regression coefficients
LogAADTmaj (β1)
Regression coefficients LogAADT
min (β2)
Over - dispersion Parameter
(k)
RFT2
() Number of Sites
Max AADTmaj
(vehday)
Max AADTmin
(vehday)
Rural 201 Rural 3-leg with minor-
road STOP control MN -878 071 024 107 133 1706 28500 27000
202 Rural 3-leg with all-way STOP control
MN -1237 122 027 047 41 41 25300 6803
203 Rural 3-leg with signal control
MN -657 066 02 033 26 136 36400 11500
204 Rural 4-leg with minor-road STOP control
MN -896 065 047 07 299 2114 35500 26700
205 Rural 4-leg with all-way STOP control
MN -1237 122 027 047 41 41 25300 6803
206 Rural 4-leg with signal control
MN -657 066 02 033 26 136 36400 11500
Urban 251 Urban 3-leg with minor-
road STOP control MN -535 034 028 128 59 397 68000 18900
252 Urban 3-leg with all-way STOP control
MN -1237 122 027 047 41 41 25300 6803
253 Urban 3-leg with signal control
MN -985 097 018 023 414 33 50000 25807
254 Urban 4-leg with minor-road STOP control
MN -312 027 016 086 76 333 58870 81000
255 Urban 4-leg with all-way STOP control
MN -1237 122 027 047 41 41 25300 6803
256 Urban 4-leg with signal control
MN -347 042 014 032 264 418 75000 81000
ITT Corporation 2008
20
Table 8 SafetyAnalystrsquos SPFs for Intersections (Fatal and Injury Crashes) Site
subtype Code
Site subtype Description
State Regression coefficients
LogIntercept (α)
Regression coefficients
LogAADTmaj (β1)
Regression coefficients LogAADT
min (β2)
Over - dispersion Parameter
(k)
RFT2
() No of Sites
Max AADTmaj
(vehday)
Max AADTmin
(vehday)
Rural 201 Rural 3-leg with minor-
road STOP control MN -935 071 021 123 91 1706 28500 27000
202 Rural 3-leg with all-way STOP control
MN -1002 127 -022 089 248 41 25300 6803
203 Rural 3-leg with signal control
MN -783 075 014 05 215 136 36400 11500
204 Rural 4-leg with minor-road STOP control
MN -936 066 04 0 146 2114 35500 26700
205 Rural 4-leg with all-way STOP control
MN -1002 127 -022 089 248 41 25300 6803
206 Rural 4-leg with signal control
MN -783 075 014 05 215 136 36400 11500
Urban 251 Urban 3-leg with minor-
road STOP control MN -845 049 039 123 81 397 68000 18900
252 Urban 3-leg with all-way STOP control
MN -1002 127 -022 089 248 41 25300 6803
253 Urban 3-leg with signal control
MN -1022 091 021 027 362 33 50000 25807
254 Urban 4-leg with minor-road STOP control
MN -435 029 019 099 57 333 58870 81000
255 Urban 4-leg with all-way STOP control
MN -1002 127 -022 089 248 41 25300 6803
256 Urban 4-leg with signal control
MN -511 049 016 03 295 418 75000 81000
ITT Corporation 2008
21
The study examined the impact of two left turn priority treatments which were flashing advanced green (FAG) and left turn green arrow (LTGA) on left turn collisions These treatments were implemented at 35 intersections in the city of Toronto Two types of collisions were investigated left turns with and without side impact The results indicated that there was an insignificant difference in the impact of the left turn priority treatments on both types of crashes
Lord and Persaud (2003) conducted a study that related SPFs to transportation planning models They noted that traffic safety is not usually accounted for when agencies are conducting a planning analysis to remodel build upgrade or modify their facilities Five-year intersection data from Canada were used Models were developed and statistical measures such as the over dispersion parameter were calculated and conclusions were made from the results The SPFs developed for the study were applied to two sample networks created with the help of a transportation planning software package The research showed that it is possible to make estimation for traffic safety at the planning stage of a project This will allow users to take safety into consideration when designing and possibly create alternatives to change existing designs for more comprehensive projects or development The study also indicated that there are limitations when applying the SPFs to computerized transportation networks The study concluded that although it is possible to predict or estimate crashes on digital transportation networks the accuracy of prediction relies greatly on how precise the traffic flow estimates are
Jonsson et al (2007) performed an SPF study that took into consideration the type and severity of crashes andmdashmost importantmdashthe causal factors for these crashes The study was conducted for intersections on rural four-lane highways in the state of California Four collision types were tested in the study opposite-direction same-direction intersecting-direction and single-vehicle crashes In addition a set of data from the state of New York was used with the same parameters to analyze the severity distribution of crash types The data for California included 1084 intersections on four-lane rural highways and that from New York included 675 intersections mainly stop controlled or without any control Generalized linear modeling was performed with the data after quality analysis Two model forms were estimated with the variables seen in Equations 29 and 30
(Eq 29)
(Eq 30)
where NAcc = predicted number of crashesyr at intersections AADTmajor = AADT on major road AADTminor= AADT traffic flow on minor road Βi = model parameters Xi = variables that describe the intersections (such as terrain lighting left turn number of though lanes and divided or undivided among others)
nn xxxormajorAcc exAADTxAADTN ββββββ ++++=
min4433021
nn xxxormajorAcc exAADTAADTN βββββ +++++=
min332201)(
22
The two different models are different representations of the traffic flow The first represents the AADT of major and minor roads as separate variables but in the second model they are represented as one variable by the sum of the major and minor roads AADTs Results showed that the first model performed better for the multiple-vehicle crashes and the second model fitted better for the single-vehicle crashes In addition the appropriate predictor variables differed depending on the crash type This study is also of interest as it incorporated additional parameters to those in the suggested SPFs now included in SafetyAnalyst and therefore could lead to possible future SPF research for the state of Virginia
Persaud and Nguyen (1998) conducted a study on signalized intersections in Ontario Canada They developed aggregate and disaggregate models to estimate safety performance of three- and four-leg intersections in which crash severity (injury and PDO) environmental class (semi-urban and rural) and time period (daily weekday morning peak and weekday afternoon peak) were considered in the analysis An important aspect of that study is that it supplemented the existing models used for estimating SPFs instead of replacing them because it took into consideration features that were generally not considered in the then existing developed models Two model levels were considered for the study Level 1 was based on the sum of AADTs for all approaches with separate estimates for rear-end right angle and turning movement crashes At this level the equations were adjusted for three- and four-leg intersections by crash severity for all combined impact types and also separately for the three major impact types which were angle rear-end and turning movement In addition models were further separated by time period (daily weekday morning and afternoon peak) and for four-leg intersections which were also classified by environment class such as semi-urban and rural Level 2 allowed estimates to be obtained for specific crash patterns that were defined by movements of the vehicles involved before collision and the same were estimated as a function of the flows that were relevant to each of the patterns For this level models were estimated for four-leg intersections for 12 multi-vehicle and three single-vehicle patterns that were described by the movements of involved vehicles before collision The developed models were intended to estimate the parameters P and d shown in Equations 31 and 33
The safety of the intersection was estimated using the long-term mean based on the EB approach The long term mean (m) was obtained by combining crash count (x) of an intersection in the most recent years (n) with the estimates of the expected annual number of crashes (P) as shown in Equation 31 W1 and W2 in Equations 31 through 33 represent the weights estimated from the mean and variance of the regression estimates
(Eq 31)
(Eq 32)
(Eq 33)
m =W1(x) +W2(P)
2dW
d nP=
+
1PW
d nP=
+
23
(Eq 34)
To estimate the variance of m the following formula was used
(Eq 35)
In Equations 32 through 35 P and d represent the fundamental parameters Two models were selected for SPFs For Level 1 and single-vehicle Level 2 (Eq 36) For multi-vehicle in Level 2 (Eq 37) where P = expected number of crashes of a given type α and β = regression parameters to be estimated S (Level 1) = sum of all entering flows for a given time period for Level 1 analysis S (Level 2) = sum of the daily through right or left turn flows for a given time period for Level 2 (single-vehicle) analysis S1 and S2 = AADTs for small and large flows for a specific crash pattern in Level 2 (multi-vehicle) analysis
The models in either level can be used in the EB procedure to provide estimates for intersections that need to be treated or for the evaluation of the effectiveness of safety countermeasures It should be noted that the quality of the estimates for the study was strongly related to how the parameters were selected and used in the SPFs and unlike other available road models the ones presented in this study can be separated by time period and crash pattern Persaud et al (2002) conducted a study to demonstrate the complexity involved in the calibration of crash prediction models or SPFs for urban intersections Toronto data for three- and four-leg signalized intersections were used to estimate the models for the study The performance of these models was then compared with other models from Vancouver and California The models from these places were recalibrated to fit Toronto by using the Interactive Highway Safety Design Model (IHSDM) and a calibration procedure as proposed by Harwood et al (2000) The results varied significantly and were also mixed The study noted that the calibration of models is not a simple task and due to the importance of the SPFs they must be properly calibrated Several things must be accounted for when performing this procedure in order to obtain good quality data analysis The first thing is to extract a large sample of high quality data A software or program to link all the traffic crash and road characteristics data must exist because the same is usually kept stored in different databases In addition several
2Pd
Var P=
2( )
d xVar m dnP
+=
+
P =αSβ
P =αS1β1 S2
β 2
24
years of crash data must be obtained in order to have a good amount of samples that account for variations The actual process of model calibration is complicated therefore careful attention must be paid when analyzing the same because of the importance of the outcomes of the study The authors of the study made an exploratory analysis and it revealed that the relationship between the crashes and each covariate should be described either by the power function or the gamma function for all intersection types to be analyzed Equations 38 through 40 are the selected model forms used in the study F1 = Power F2 = Gamma (Eq 38) F1 = Gamma F2 = Power (Eq 39) F1 = Power F2 = Power (Eq 40) where E (K) = expected annual number of crashes between 1990 and 1995 F1 F2 = average entering AADT of major and minor roads respectively for the period 1990 to 1995 α β1 β2 β3 β4 = coefficients to be estimated
An NB structure was used to analyze the models and the overdispersion parameter (γ) was analyzed using Equation 41
γ=
2)K(E)K(Var (Eq 41)
Variance increases as γ decreases therefore the value of γ can also be used to make a comparison for the goodness of fit of several models fitted to the same data The larger the value of γ the smaller the variance therefore a more accurate model is given The authors suggest that γ would be enough to calculate the goodness of fit index of any SPF but if one desires to know how accurate the prediction estimate is other measures should also be computed The authors suggested using R2
α as proposed by Miaou et al (1996) which is a dispersion parameter based R2 computed as shown in Equation 42
γγ
minus=αmin2 1R (Eq 42)
where γ = overdispersion parameter for calibrated model γmin = smallest possible overdispersion parameter
The authors suggested that a disaggregation by traffic volume is preferable than using
only a single calibration factor for that is what the IHSDM currently has A recommendation is made to account for safety variation in traffic conditions over time by calibrating the models every two to three years as suggested by Harwood et al (2000)
E(K) =αF1β1 F2
β 2e(β 3F2 )
E(K) =αF1β1 F2
β 2e(β 4 F1 )
E(K) =αF1β1 F2
β 2
25
The Illinois Department of Transportation and the University of Illinois Urbana-Champaign conducted a research study to develop and implement SPFs for road segments and intersections in Illinois (Tegge et al 2010) These SPFs were developed in a way suitable for easy implementation in SafetyAnalyst The crash data (number of crashes and crash severity) and roadway data (number of lanes traffic volume area type and functional class) were collected and used for development of the SPFs Seventeen peer groups were used for developing the SPFs for segments and eight for intersections The intersections peer groups were minor leg stop control all-way stop control signalized and undetermined for rural and urban segments separately The SPFs for segments were developed using NB distribution for crashes and Poisson distribution for intersections The SAS GENMOD procedure was used to develop the SPFs for a five-year analysis period from 2001 to 2005 The model form for the intersection SPFs is the same as that given in the SafetyAnalyst Userrsquos Manual The SPFs were also developed for different crash severities such as fatal crashes type A injury crashes type B injury crashes and fatal plus injury crashes The EB method was used to determine the sites with the higher PSIs Two analysis techniques were used to obtain the PSIs The first considered segments and intersections as individual elements and the second used the sliding window approach The site specific analysis treated each individual segment and intersection as a separate entity Each segment is then compared with every other segment instead of having them grouped together The sliding window approach defined a set length The window lengths were 025 mile and 1 mile for urban and rural segments respectively
The largest impact on crash frequency was found to be the AADT and was therefore the only variable modeled as a logarithm (lnAADT) By doing this the AADT accounted for most of the prediction whereas the rest of the variables refined the prediction further Other variables used included access control functional class lane width surface type area type speed limit and median type The study recommended that a multivariate analysis be conducted for such studies to show how certain variables could contribute to the crashes Other variables could include roadway lighting weather and pavement conditions and roadway geometry The study also concluded that knowledge of roadway characteristics that increase the risk of fatal or injury crashes will facilitate the setting up of safety criteria that can help engineers in the designing of safer roadways Further knowledge of driver behaviors that lead to fatal and severe injury crashes can facilitate the training of enforcement officers to identify these behaviors
The Colorado Department of Transportation (CDOT) (2009) conducted a study to develop SPFs for intersections in the state Their model form is the same as that in SafetyAnalyst The SPFs were developed for many categories based on the number of legs divided undivided rural and urban including urban four-lane divided signalized six-lane divided signalized urban three-leg signalized two-lane undivided unsignalized and urban three-leg unsignalized When a median or left-turn lane is present a roadway is considered divided The sites selected for the study reflected variability in traffic volume and geometry in order to have a diverse representation of intersections throughout the state SPFs were developed for total and for fatal plus injury crash types A five-year study period from 2000 through 2005 was used Crash and AADT data were collected for development of the SPFs CDOT used a NB error structure to develop the SPFs and the EB procedure to estimate the expected safety performance of an intersection site for different safety management purposes Overdispersion parameters were computed and used as a goodness of fit measure According to their data
26
overdispersion parameters indicated that their models provided a reasonable fit to the Colorado data
Results indicated that for signalized intersections roads with six lanes on major approaches have more collisions than those with four lanes on major approaches CDOT recommended that the SPFs should be recalibrated in the future using data from future years as crash frequencies may change over time because of a variety of issues The report also recommended that separate calibration factors should be developed for different regions and different topographies Research in Virginia
In Virginia two other similar studies have recently been published One by Garber et al (2010) for two-lane roads and another by Hamidi et al (2010) to identify high-crash sections on Virginiarsquos primary system by developing a planning-level methodology The study by Garber et al developed SPFs for two-lane segments of 1 mile or less and the study by Hamidi et al developed SPFs for longer segments of two-lane roads that can be used for corridor analysis
Evaluation of the Recommended Minnesota SPFs
Figures 3 through 6 show representative graphs that were used to visually examine how well the Virginia data fitted the suggested Minnesota SPFs Figures 3 and 4 are for urban four-leg signalized intersections and Figures 5 and 6 are for rural four-leg signalized intersections These graphs suggest that the Minnesota SPFs do not fully represent the Virginia data Tables 9 through 12 show the Freeman-Tukey R2
FT coefficients computed for the different Minnesota SPFs using the Virginia data The low Freeman-Tukey R2
FT coefficients obtained and the visual inspection of the graphs suggested that a better fit to the Virginia data could be obtained by developing specific Virginia SPFs using Virginia data It was therefore decided to develop specific SPFs for Virginia
0
2
4
6
8
10
12
14
0 20000 40000 60000 80000 100000 120000
AADT Major
Tota
l Cra
shes
Per
Yea
r
Minnesota VA Actual Observed
Minnesota Model
Figure 3 Total crashes per year vs major AADT for urban 4-leg signalized intersections
with minor AADT of 700
27
0
5
10
15
20
25
30
35
0 20000 40000 60000 80000 100000 120000
AADT Major
Tota
l Cra
shes
per
Yea
r
Minnesota VA Actual Observed
Minnesota Model
Figure 4 Total crashes per year vs major AADT for urban 4-leg signalized intersections
with minor AADT of 4500
0
2
4
6
8
10
12
14
0 20000 40000 60000 80000 100000 120000
AADT Major
Tota
l Cra
shes
Per
Yea
r
Minnesota VA Actual Observed
Minnesota Model
Figure 5 Total crashes per year vs major AADT for rural 4-leg signalized intersections with
minor AADT of 795
28
0
2
4
6
8
10
12
14
16
18
0 20000 40000 60000 80000 100000 120000
AADT Major
Tota
l Cra
shes
per
Yea
r
Minnesota VA Actual Observed
Minnesota Model
Figure 6 Total crashes per year vs major AADT for rural 4-leg signalized intersections with
minor AADT of 5000
Table 9 Minnesota SPFs for Urban FI Crashes and Corresponding R2FT Based
on Virginia Data
Intersection Type
Minnesota FI SPFs R2
FT Based on Virginia Urban FI Crash Data ()
Urban 4-Leg Signalized 032
Urban 4-Leg Minor Stop Control 008
Urban 3-Leg Signalized 026
Urban 3-LegMinor Stop Control 01
Table 10 Minnesota SPFs for Urban TOTAL crashes and Corresponding R2
FT Based on Virginia Data
Type of Intersection
Minnesota SPFs
R2FT Based on Virginia Urban Total
Crash Data ()
Urban 4-Leg Signalized 034
Urban 4-Leg Minor Stop Control 022
Urban 3-Leg Signalized 031
Urban 3-Leg Minor Stop Control 01
29
Table 11 Minnesota SPFs for Rural TOTAL Crashes and Corresponding R2FT
Based on Virginia Data
Type of Intersection
Minnesota SPFs R2
FT Based on Virginia Rural Total Crash Data ()
Rural 4-Leg Signalized 029
Rural 4-Leg Minor Stop Control 013
Rural 3-Leg Signalized 029
Rural 3-Leg Minor Stop Control -010
Table 12 Minnesota SPFs for Rural FI Crashes and Corresponding R2FT Based
on Virginia Data
Type of Intersection
Minnesota SPFs R2
FT Based on Virginia Rural FI Crash Data ()
Rural 4-Leg Signalized 018
Rural 4-Leg Minor Stop Control 010
Rural 3-Leg Signalized 018
Rural 3-Leg Minor Stop Control 001
Development and Evaluation of Specific Virginia SPFs
In keeping with the suggestion given in the Safety Analyst Userrsquos Manual the model form used to develop the intersection SPFs is given in Equation 4 as
1 2k e x MajAADT x MinAADTβ βα=
where
k = predicted crash frequency per intersection per year MajAADT = AADT on the major road (vehday) MinAADT = AADT on the minor road (vehday) α = intercept β1 = coefficient of mayor AADT β2 = coefficient of minor AADT
30
The statewide SPFs developed for Virginia are given in Tables 13 through 16 Due to lack of data the analysis for all-way stop intersections could not be undertaken These tables also give the Freeman-Tukey R2
FT coefficient for each of the Virginia SPFs and the corresponding Minnesota SPF and Freeman-Tukey R2
FT based on the Virginia data The R2FT coefficients
obtained indicate that the Virginia-specific SPFs fit the Virginia data better than the suggested Minnesota SPFs for all types of intersections and crash severity except those for FI crashes on urban three-leg signalized rural four-leg signalized and rural four-leg minor stop control intersections where the corresponding RFT
2 values are similar In Table 15 it can be seen that the Minnesota R2
FT value is negative for the rural three-leg minor stop control intersections The negative RFT
2 value is possible because these calculations were not performed on the same data points that were used to create the Minnesota SPFs (Miller 2009) Table 13 SPF Models for Urban TOTAL crashes and R2
FT results for Virginia Statewide (VDOT-maintained roads)
SPF model with TOTAL Crash values
R2FT TOTAL
Crash Data
Site Virginia Statewide Minnesota VA MN
Urban 4-Leg Signalized 056 034
Urban 4-Leg Minor Stop Control
032 022
Urban 3-Leg Signalized 037 031
Urban 3-Leg Minor Stop Control
023 010
Table 14 SPF Models for Urban FI crashes and R2
FT results for Virginia Statewide (VDOT-maintained roads)
SPF model with FI Crash values R2FT FI Crash Data ()
Site
Virginia Statewide Minnesota VA MN
Urban 4-Leg Signalized 041 032
Urban 4-Leg Minor Stop Control
019 008
Urban 3-Leg Signalized 026 026
Urban 3-Leg Minor Stop Control
013 010
31
Table 15 SPF Models for Rural TOTAL Crashes and R2FT Results for Virginia Statewide (VDOT-
maintained roads) SPF model with TOTAL Crash values R2
FT TOTAL Crash Data
Site
Virginia Statewide Minnesota VA MN
Rural 4-Leg Signalized 0321 0290
Rural 4-Leg Minor Stop Control
0167 0132
Rural 3-Leg Signalized 0305 0291
Rural 3-Leg Minor Stop Control
0104 -0102
Table 16 SPF Models for Rural FI crashes and R2
FT results for Virginia Statewide (VDOT-maintained roads) SPF model with FI Crash values R2
FT TOTAL Crash Data
Site
Virginia Statewide Minnesota VA MN
Rural 4-Leg Signalized 0181 0181
Rural 4-Leg Minor Stop Control
0098 0097
Rural 3-Leg Signalized 0170 0180
Rural 3-Leg Minor Stop Control
0048 0012
Figures 7 through 10 show visual representations of how well the Virginia SPFs fit the
Virginia data in comparison with the suggested Minnesota SPFs In general the Virginia SPFs tend to fit the Virginia data better than the Minnesota SPFs although both sets of SPFs tend to have similar fits at low volumes (AADTmajor lt 2000) except for the SPF for total crashes on urban four-leg signalized intersections shown in Figure 7 The primary reason the Minnesota SPFs do not fit the Virginia data as well as the Virginia SPFs may be the dissimilarities of the roadside environment and the characteristics of the different databases
32
0
2
4
6
8
10
12
14
0 20000 40000 60000 80000 100000 120000
AADT Major
Tota
l Cra
shes
Per
Yea
r
Minnesota VA Actual Observed Virginia
Minnesota Model
Virginia M odel
Figure 7 Total crashes per year vs major AADT for urban 4-leg signalized intersections
with minor AADT of 700
0
5
10
15
20
25
30
35
0 20000 40000 60000 80000 100000 120000
AADT Major
Tota
l Cra
shes
per
Yea
r
Minnesota VA Actual Observed Virginia
Minnesota Model
Virginia Model
Figure 8 Total crashes per year vs major AADT for urban 4-leg signalized intersections
with minor AADT of 8000
33
0
2
4
6
8
10
12
14
0 20000 40000 60000 80000 100000 120000
AADT Major
Tota
l Cra
shes
Per
Yea
r
Minnesota VA Actual Observed Virginia
Virginia Model
Minnesota Model
Figure 9 Total crashes per year vs major AADT for rural 4-leg signalized intersections with
minor AADT of 79
0
5
10
15
20
25
0 20000 40000 60000 80000 100000 120000
AADT Major
Tota
l Cra
shes
per
Yea
r
Minnesota VA Actual Observed Virginia
Minnesota Model
Virginia Model
Figure 10 Total crashes per year vs minor AADT for rural 4-leg signalized intersections with major AADT of 5000
As discussed in the Methodology section in addition to the statewide Virginia SPFs
specific SPFs were developed for each operational region to consider the different topographical characteristics that exist across Virginia The complete set of SPFs together with the associated p values for the regression coefficients are shown in Tables A-1 and A-2 of Appendix A All p values are less than 005 with most being less than 00001 except for some of the rural four-leg signalized intersections regional specific SPFs These p values indicate that the estimated coefficients are statistically significant at the 95 confidence level or better A possible reason
34
for higher p values for a small number of SPFs may be the sample size used for developing these SPFs
To test the transferability and fit of the Virginia statewide specific SPFs several
statistical parameters were determined for the 70 (estimation) data set and the 30 (validation) data set separately The corresponding values for each of these parameters were then compared The results are shown in Tables 17 and 18 for urban and rural intersections respectively The results for the regional SPFs are shown in Tables A-3 through A-8 of Appendix A The results indicate that the developed models are transferable to the 30 validation data set For example the MSE values for the 70 estimation data are similar to the MSPE values for the 30 validation data In addition the mean prediction bias MPB values for the 30 validation data are close to zero (-076 le MPB ge -0004) in Table 17 and (-0067 le MPB ge 00513) in Table 18
Table 17 Goodness of Fit Results for Urban Statewide SPFs
Data Estimation data 70 Validation Data 30 Subtype Site MSE r2 R2
FT MPB MAD MSPE R2FT
Total VA 41150 0529 0557 -0760 4329 38490 0575
Total MN
68636 0506 0336 -3145 5421 68156 0315
FI VA
7043 0385 0406 -0458 1938 7671 0475
Urban 4-Leg Signalized
FI MN 7702 0372 0324 -0316 2124 8981 0376
Total VA 2238 0315 0313 -0034 0897 2383 0292
Total MN 2510 0287 0215 0091 0982 2730 0182
FI VA 0530 0194 0193 -0004 0432 0533 0194
Urban 4-Leg Minor Stop Control
FI MN 0560 0182 0080 0128 0522 0577 0052
Total VA 24900 0375 0370 -0645 3519 27591 0369
Total MN 29322 0365 0308 -2238 3661 33079 0272
FI VA 4467 0275 0259 -0185 1527 4875 0262
Urban 3-Leg Signalized
FI MN 4528 0267 0261 -0294 1526 4937 0261
Total VA 1854 0254 0230 -0043 0893 2038 0239
Total MN 2388 0237 0104 -0541 0902 2600 0107
FI VA 0428 0151 0133 -0021 0431 0476 0157
Urban 3-Leg Minor Stop Control
FI MN 0478 0140 0097 -0184 0385 0537 0104
35
Table 18 Goodness of Fit Results for Rural Statewide SPFs
Data Estimation Data 70
Validation Data 30
Subtype Site MSE r2 R2FT MPB MAD MSPE R2
FT
Total VA 10990 0353 0321 0513 2210 10070 -0073
Total MN 12400 0339 0290 -0154 2071 8460 0035
FI VA 2350 0196 0181 0045 1189 2600 -0034
Rural 4-Leg Signalized
FI MN 2400 0188 0181 -0043 1164 2420 0004
Total VA 1090 0182 0167 -0067 0794 1190 0171
Total MN 1190 0167 0132 -0348 0774 1320 0115
FI VA 0480 0112 0098 -0022 0504 0530 0110
Rural 4-Leg Minor Stop Control
FI MN 0500 0104 0097 -0158 0459 0560 0093
Total VA 5490 0328 0305 -0010 1651 5760 0179
Total MN NA NA NA NA NA NA NA
FI VA 1450 0181 0170 -0041 0902 1710 0099
Rural 3-Leg Signalized
FI MN NA NA NA NA NA NA NA
Total VA 0690 0144 0104 -0008 0613 0730 0102
Total MN 0890 0141 -0102 -0404 0555 0940 -0104
FI VA 0250 0071 0048 -0009 0345 0260 0048
Rural 3-Leg Minor Stop Control
FI MN 0270 0068 0012 -0144 0270 0290 0003
Pruning of Virginia-Specific SPFs A total of 64 SPFs were initially developed using the appropriate data for Virginia as shown in Tables A-1 and A-2 of Appendix A Considering that not all regional models might be necessary the pruning process described in the methodology section was carried out to prune the number of SPFs to the minimum effective number as seen in Tables 19 and 20 for urban and rural intersections respectively The pruning process resulted in 19 SPFs for urban sites and 15 for rural sites To facilitate the use of the correct SPF for a specific type of intersection located in a specific region the lists of the appropriate SPFs to be used are given in Tables B-1 and B-2 of Appendix B for the urban and rural intersections respectively
As can be seen in Tables 19 and 20 and Tables A-1 and A-2 of Appendix A there are some trends worth discussing for the benefit of the study and possible future research With regards to the three different operational regions the Western region retained many more of the specific regional urban SPFs than any other region For example the Western regional SPFs were retained for all urban intersection sites whereas for the Eastern region the only SPFs
36
retained were those for urban four-leg signalized FI crashes and urban four-leg minor stop control for total and FI crashes Similarly the only urban SPF retained for the Northern region was that for urban four-leg minor stop control for total crashes For the rural intersection sites all of the Western regional SPFs were retained except those for rural three-leg signalized total and FI crashes and rural four-leg minor stop control FI crashes The majority of the Eastern region rural SPFs were discarded except those for rural four-leg signalized total and FI crashes while for the Northern region all regional SPFs were discarded
The Western region retained more specific regional SPFs than the other two regions This suggests that the intersections in the Western region exhibit more unique characteristics than those for the other regions This may be due to the more mountainous terrain in the Western region compared to those in the Eastern and Northern regions This supports the philosophy of developing specific SPFs based on the topography of different regions
Site Prioritization
To illustrate the benefits of using the EB method to prioritize intersection sites for safety
improvements the top 25 urban sites from the Bristol and Northern Virginia districts were identified by using crash rates critical crash ratio and the EB method The PSI for each site identified was then determined The results obtained are shown in Tables 21 and 22 for the Bristol and the Northern Virginia districts respectively The results indicate that for the Northern Virginia District the PSIs for the top 25 sites are 258 1317 and 27440 crashes per year and for the Bristol District 432 646 and 1496 crashes per year for the crash rates critical crash ratio and EB methods respectively The important thing in Tables 21 and 22 is the sum of the PSI columns ranked by the three methods The sum of each of the PSIs for the crash rate and critical crash ratio method is lower than that for the EB method These results suggest that the use of the EB method in the planning process will identify intersection sites with the highest PSIs and therefore where detailed assessments to determine feasible and effective safety treatments should be undertaken
37
Table 19 MSPE Values for Virginia Urban Statewide and Urban Regional SPFs Used for Pruning
Data Pruning
Subtype
Site
MSPE [MSPEVA-
MSPEOR]1 [abs(MSPEVA-
MSPEOR)]2 [abs(MSPEVA-
MSPEOR)MSPEVA]3
RetainDiscardTotal VA 3849 Northern 4486 -637 637 0165497532 Discard Western 1791 2058 2058 0534684334 Retain Eastern 3745 104 104 0027020005 Discard FI VA 7671 Northern 95 -1829 1829 0238430452 Discard Western 517 2501 2501 0326033112 Retain
Urban 4-Leg Signalized
Eastern 541 2261 2261 0294746448 Retain Total VA 23834 Northern 202 03634 03634 015247126 Retain Western 105 13334 13334 0559452882 Retain Eastern 115 12334 12334 0517496014 Retain FI VA 05327 Northern 048 00527 00527 0098929979 Discard Western 033 02027 02027 0380514361 Retain
Urban 4-Leg Minor Stop Control
Eastern 036 01727 01727 0324197485 Retain Total VA 275911 Northern 2687 07211 07211 0026135239 Discard Western 2441 31811 31811 0115294425 Retain Eastern 3878 -111889 111889 0405525695 Discard FI VA 48754 Northern 448 03954 03954 0081101038 Discard Western 339 14854 14854 0304672437 Retain
Urban 3-Leg Signalized
Eastern 586 -09846 09846 020195266 Discard Total VA 20379 Northern 219 -01521 01521 0074635654 Discard Western 164 03979 03979 0195250012 Retain Eastern 223 -01921 01921 0094263703 Discard FI VA 04756 Northern 05 -00244 00244 0051303616 Discard Western 038 00956 00956 0201009251 Retain
Urban 3-Leg Minor Stop Control
Eastern 05 -00244 00244 0051303616 Discard 1 Difference between mean square prediction error (MSPE) of Virginia statewide model and OR model 2 Absolute value of the difference between Virginia statewide model MSPE and operational region model MSPE 3 Absolute value of the difference between Virginia statewide model MSPE and operational region model MSPE divided by the Virginia statewide MSPE for comparison
Retained SPFs Discarded if value is negative Discarded if less than 01
38
Table 20 MSPE Values for Virginia Rural Statewide and Rural Regional SPFs Used for Pruning Data Pruning
Subtype
Site
MSPE
[MSPEVA-MSPEOR]1
[abs(MSPEVA-MSPEOR)]2
[abs(MSPEVA-MSPEOR)MSPEVA]3
RetainDiscard
Total VA 1007 Northern 3422 -2415 2415 2398212512 Discard Western 605 402 402 0399205561 Retain Eastern 512 495 495 0491559086 Retain FI VA 26 Northern 976 -716 716 2753846154 Discard Western 159 101 101 0388461538 Retain
Rural 4-Leg Signalized
Eastern 137 123 123 0473076923 Retain Total VA 119 Northern 164 -045 045 0378151261 Discard Western 102 017 017 0142857143 Retain Eastern 114 005 005 0042016807 Discard FI VA 053 Northern 052 001 001 0018867925 Discard Western 048 005 005 0094339623 Discard
Rural 4-Leg Minor Stop Control
Eastern 049 004 004 0075471698 Discard Total VA 576 Northern 1475 -899 899 1560763889 Discard Western 674 -098 098 0170138889 Discard Eastern 626 -05 05 0086805556 Discard FI VA 171 Northern 212 -041 041 0239766082 Discard Western 403 -232 232 1356725146 Discard
Rural 3-Leg Signalized
Eastern 157 014 014 0081871345 Discard Total VA 073 Northern 093 -02 02 0273972603 Discard Western 053 02 02 0273972603 Retain Eastern 069 004 004 0054794521 Discard FI VA 026 Northern 03 -004 004 0153846154 Discard Western 023 003 003 0115384615 Retain
Rural 3-Leg Minor Stop Control
Eastern 027 -001 001 0038461538 Discard 1 Difference between mean square prediction error (MSPE) of Virginia statewide model and OR model 2 Absolute value of the difference between Virginia statewide model MSPE and operational region model MSPE 3 Absolute value of the difference between Virginia statewide model MSPE and operational region model MSPE divided by the Virginia statewide MSPE for comparison
Retained SPFs Discarded if value is negative Discarded if less than 01
39
Table 21 PSIs for Top 25 Sites in District 1 Urban (Bristol) FI
Crashes Ranking Based on Crash
Rates Ranking Based on Crash Ratio Ranking Based on EB
Method
Rank Intersection Node
Crash Rate1 PSI2 Intersection
Node Crash Ratio3 PSI Intersection
Node PSI
1 596726 22112 00000 651193 39672 00000 596095 21413
2 606469 20079 00000 606238 39298 06297 596393 08787
3 706818 12504 00000 651075 31264 00000 651130 08453
4 651193 11550 00000 596726 29227 00000 596701 07112 5 651075 09369 00000 606469 28039 00000 651802 06929 6 606238 08382 06297 651233 25831 03612 636331 06726 7 651807 07089 00000 651130 22718 08453 596395 06579 8 651233 06068 03612 706818 22555 00000 596937 06415 9 651230 05990 00000 651230 20301 00000 606238 06297
10 651783 05756 00000 651210 18882 04747 661033 06061 11 636093 04960 00000 636331 17913 06726 596372 05417 12 651274 04475 00000 651807 16847 00000 636372 04808 13 651130 04179 08453 651805 15814 00000 651210 04747 14 651210 03918 04747 651223 15627 03589 636491 04649 15 636331 03393 06726 651783 15009 00000 596420 04633 16 651223 03363 03589 596095 14865 21413 596403 04579 17 606232 03331 00000 636405 14769 00000 651603 04531 18 651127 03053 00000 661033 14555 06061 636056 04351 19 651999 03048 00000 596353 14215 03717 712033 04110 20 596449 02962 00000 636093 13782 00000 704691 04102 21 636405 02811 00000 651879 13192 00000 651838 04100 22 651883 02698 00000 651274 12975 00000 651894 03878 23 596353 02686 03717 651127 12972 00000 596353 03717 24 651805 02663 00000 651999 12959 00000 651233 03612 25 661033 02500 06061 596449 12702 00000 651889 03601
sum 43202 sum 64615 sum 149606 1Number of crashes per year per 1000000 total approach volume 2Potential for safety improvement (crashes yr) the difference between the EB-adjusted long-term crashes and the SPF-estimated crashes 3Ratio of actual crash rate to critical crash rate
40
Table 22 PSIs for Top 25 Sites in District 9 Urban (Northern Virginia District) FI
Crashes Ranking Based on Crash
Rates Ranking Based on Crash Ratio Ranking Based on EB
Method
Rank Intersection Node
Crash Rate1 PSI2 Intersection
Node Crash Ratio3 PSI Intersection
Node PSI
1 718192 191841 00000 718192 257523 00000 264119 150122 2 702946 178194 00000 547722 152371 11175 263375 140091 3 271531 64846 00000 263628 102794 00000 278648 137239 4 263628 52858 00000 263728 100092 00000 276819 131395 5 263728 42215 00000 719754 95274 09444 263290 130743 6 266955 35294 00000 702946 79268 00000 722678 127897 7 547722 34932 11175 263403 77252 05184 264725 118671 8 702612 30441 00000 704237 77175 07648 267028 116627 9 273886 29539 00000 263729 74681 00000 265204 115925
10 716747 27632 00000 271531 72327 00000 274766 115679 11 263626 27139 00000 263135 66458 18068 263249 113372 12 269485 26567 00000 716747 64461 00000 547044 110769 13 728954 26344 00000 266955 56657 00000 549349 107180 14 263729 25208 00000 546138 52003 31028 268210 105630 15 546988 21922 00000 547544 51924 32529 263347 104257 16 274338 21446 00000 263626 50389 00000 276351 102313 17 429308 21354 00000 269485 49897 00000 428167 100064 18 720401 21197 00000 728954 49702 00000 264344 98789 19 267295 20954 00000 548686 49572 03621 277764 91554 20 267536 20874 00000 711601 47985 04440 263467 89259 21 265938 20484 00000 266970 47730 00000 263090 89199 22 273354 20108 00000 546462 46856 03620 703414 88610 23 268345 19362 00000 265938 46726 00000 428629 87379 24 719754 19073 09444 720401 44833 00000 272219 85659 25 263403 19015 05184 728496 43666 04990 428544 85610
Sum 25803 sum 131747 sum 2744033 1Number of crashes per year per 1000000 total approach volume 2Potential for safety improvement (crashes yr) the difference between the EB-adjusted long-term crashes and the SPF-estimated crashes 3Ratio of actual crash rate to critical crash rate
41
CONCLUSIONS
bull The development of SPFs for intersections is necessary for Virginia because the SafetyAnalyst-suggested SPFs which are based on Minnesota data do not represent the Virginia data well Regarding the fit of the SPFs to Virginia data the R2
FT values shown in Tables 13 through 16 for Minnesota and Virginia indicate that the Virginia-specific SPFs fit the Virginia data better than the Minnesota models This may be due to the dissimilarities of the roadside environment such as difference in topography and the characteristics of the different Virginia and Minnesota databases
bull In some cases the specific regional SPFs fit the regional data better than the statewide
SPFs suggesting that the specific SPFs should be considered for use when available These group divisions that have similar roadway characteristics and driver expectations in some cases tend to improve the fit
bull In identifying intersection sites for safety improvements it is clearly beneficial for the EB
method to be used with the suitable SPFs rather than a crash rate or critical ratio method Results of the site prioritization show a much higher potential for crash reduction when the EB method is used with the appropriate SPFs rather than a procedure based on crash rates or critical rates
RECOMMENDATIONS
1 VDOTrsquos TED should use the Virginia-specific SPFs when using the SafetyAnalyst tools The results of this study have shown that the Virginia-specific SPFs reflected the Virginia data better than the SafetyAnalyst-recommended Minnesota SPFs
2 VDOTrsquos TED should investigate the feasibility of using multiple SPFs in SafetyAnalyst If
feasible regional SPFs should be used If it is not currently feasible to use multiple SPFs VDOTrsquos TED should ask that the FHWA include regional information in SafetyAnalyst so as to allow the use of regional SPFs For the specific regional SPFs to be applied to Virginia and other states the SafetyAnalyst tool should be capable of incorporating the necessary data that support the regional models
3 As soon as it is feasible to use regional SPFs VDOTrsquos TED should use the 19 SPFs
developed for urban intersections and the 15 developed for rural intersections when using the tools in SafetyAnalyst Although the statewide SPFs are available for use by an analyst the specific regional models included in the final set of SPFs will predict crashes better than the statewide SPFs The regional analysis will not only ease the use of specific regional SPFs but will also be of benefit when predicting the potential for safety improvement of a specific site
4 For future similar SPF studies VDOTrsquos TED should be directly involved in screening the
traffic data for accuracy and consistency as was done in this study The direct involvement of the TED in the screening of the traffic data significantly contributed to the accuracy of the
42
data and greatly contributed to the confidence the researchers place on the data used in the study
5 The Virginia Transportation Research Council (VTRC) should conduct a study as soon as
feasible to verify whether incorporating independent variables for which data are available other than AADT such as intersection geometry and other characteristics will result in SPFs that better fit the Virginia data Although the currently suggested SafetyAnalyst SPFs use only the AADTs as the independent variables it is likely that provision will be made for use of SPFs that incorporate other independent variables such as number of approaches entering lanes and the other variables for which data are available as these SPFs are likely to give better fit to crash data
6 As soon as feasible VTRC should undertake a study to develop SPFs for the urban system
intersections which are not currently maintained by VDOT as these intersections may have different crash characteristics than those maintained by VDOT This would facilitate the use of SafetyAnalyst in programming sites that are currently not being maintained by VDOT
BENEFITS AND IMPLEMENTATION PROSPECTS
Significant benefits will be accrued by the use of the Virginia-specific SPFs developed in this study This is clearly illustrated in two ways First in examining the transferability of the suggested SPFs in SafetyAnalyst it is clear that these SPFs do not fit the Virginia data very well The results also indicate that the Virginia-specific SPFs fit the Virginia data much better than the suggested SafetyAnalyst SPFs Second the availability of the Virginia-specific SPFs will enhance the use of the EB procedure given in SafetyAnalyst for prioritizing sites for safety improvements This study has also shown that the EB method better identifies sites with higher potential for crash reduction than those identified by crash rates For example the illustrated examples given for the Bristol and Northern Virginia districts show that the potential reduction in FI crashes when the top 25 sites are identified by the EB method is 28936 (1496 + 27440) crashes per year whereas that obtained when the critical crash ratio method is used for prioritization is only 1963 (646 + 1317) and that obtained with the crash rate method is only 690 (432 + 258) crashes per year This gives a net benefit of 26973 potential crashes per year compared to the critical crash ratio method and 28246 compared to the crash rate method Assuming an average cost of FI crashes of $95629 (FHWA 2005) and only 10 of the estimated net benefit PSI of 28246 crashes per year is achieved the total savings of more than $27 million per year could be accrued The prospects for implementation of the recommendations are very high as the study was requested by VDOTrsquos TED which is planning to incorporate these SPFs in the use of the tools provided in SafetyAnalyst
43
ACKNOWLEDGMENTS
The authors appreciate the opportunity afforded them by VDOT and VTRC to conduct this study Special thanks to Stephen Read (VDOT) Dr In-Kyu Lim (VDOT) Dr Young-Jun Kweon (VTRC) and VDOTrsquos Central Office for their interest and support in SPFs and their help in the selection of intersection sites Many thanks to Lewis Woodson (VTRC) and James Hill (University of Virginia) for all their help and input throughout the study
REFERENCES Cogburn P VDOT Interagency Coordination 2007 Virginia Emergency Management
Conference Virginia Department of Transportation Richmond April 2007 Colorado Department of Transportation DTD Applied Research and Innovation Branch Safety
Performance Functions for Intersections CDOT-2009-10 Denver December 2009 Fridstroslashm L Ifver J Ingebrigtsen S Kulmala R and Thomsen LK Measuring the
Contribution of Randomness Exposure Weather and Daylight to the Variation in Road Accidents Counts Accident Analysis and Prevention Vol 27 No 1 1995 pp 1-20
Federal Highway Administration Cost of Crashes by Severity Table FHWA-HRT-05-051
Washington DC 2005 Federal Highway Administration SafetyAnalyst Home Page httpwwwsafetyanalystorg
Accessed February 2010 Garber N and Hoel L Traffic amp Highway Engineering 4th ed Cenage Learning Toronto
Canada 2009 Garber NJ Haas PR and Gosse C Development of Safety Performance Functions for Two-
Lane Roads Maintained by the Virginia Department of Transportation VTRC 10-R25 Virginia Transportation Research Council Charlottesville 2010
Hamidi A Fontaine MD and Demetsky MJ A Planning-Level Methodology for Identifying
High-Crash Sections of Virginiarsquos Primary System VTRC 11-R4 Virginia Transportation Research Council Charlottesville 2010
Harwood D Council FM Hauer E Hughes WE and Vogt A Prediction of the Expected
Safety Performance of Rural Two-lane Highways Federal Highway Administration McLean VA December 2000
Harwood DW Bauer KM Richard KR Gilmore DK Persaud B and Lyon C
Development of SPFs for Safety Analyst Interim Tools Technical Memorandum
44
Prepared by Midwest Research Institute for the Federal Highway Administration McLean VA 2004
ITT Corporation SafetyAnalyst Userrsquos Manual Turner-Fairbank Highway Research Center
McLean VA 2008 Jonsson T Ivan J and Zhang C Crash Prediction Models for Intersections on Rural
Multilane Highways Differences by Collision Type In Transportation Research Record Journal of the Transportation Research Board No 2019 Transportation Research Board of the National Academies Washington DC 2007 pp 91-98
Kweon Y-J and Lim I-K Appropriate Regression Model Types for the Empirical Bayes
Method and SafetyAnalyst In Proceedings of the 89th Annual Meeting of the Transportation Research Board Transportation Research Board of the National Academies Washington DC 2010
Kononov J Bailey B and Allery B Exploratory Examination of the Functional Form of
Safety Performance Functions of Urban Freeways Colorado Department of Transportation and San Diego State University Denver CO 2008
Lyon C Haq A Persaud B and Kodama S Safety Performance Functions for Signalized
Intersections in Large Urban Areas Development and Application to Evaluation of Left-Turn Priority Treatment In Transportation Research Record Journal of the Transportation Research Board No 1908 Transportation Research Board of the National Academies Washington DC 2005 pp 165-171
Lord D and Persaud B Estimating the Safety Performance of Urban Road Transportation
Networks Center for Transportation Safety Texas Transportation Institute Texas AampM University and Department of Civil Engineering Ryerson University College Station TX 2003 pp 609-620
Miaou S-P Lu A and Lum H S Pitfalls of using R2 to Evaluate Goodness of Fit of
Accident Prediction Models In Transportation Research Record Journal of the Transportation Research Board No 1542 Transportation Research Board of the National Academies Washington DC 2005 1996 pp 6-13
Miller P Re Negative R squared Email Archive Division of Biostatistics Washington
University in St Louis February 2 2005 February 2 2005 httpwwwbiostatwustleduarchiveshtmljmp-l2005msg00075html Accessed February 2010
Persaud B Lord D and Palmisano J Calibration and Transferability of Accident Prediction
Models for Urban Intersections In Transportation Research Record Journal of the Transportation Research Board No 1784 Transportation Research Board of the National Academies Washington DC 2002 pp 57-64
45
Persaud B and Nguyen T Disaggregate Safety Performance Models for Signalized Intersections on Ontario Provincial Roads In Transportation Research Record Journal of the Transportation Research Board No 1635 Transportation Research Board of the National Academies Washington DC 1998 pp 113-120
Pham T and Ragland D Summary of Crash Prediction Models Also known as Safety
Performance Functions (SPFs) California Partners for Advanced Traffic and Highways and University of California Berkeley Berkeley 2005
SAS Institute Inc SAS OnlineDoc Version Eight Cary NC
httpwwwtecnionacildocssasril Accessed 2009 Tegge RA Jo J-H and Ouyang Y Development and Application of Safety Performance
Functions for Illinois ICT-10-066 Illinois Center for Transportation University of Illinois Urbana-Champaign March 2010
Virginiarsquos Surface Transportation Safety Executive Committee Commonwealth of Virginiarsquos
Strategic Highway Safety Plan 2006-2010 Virginia Department of Transportation Richmond 2006
Washington S Persaud B Lyon C and Oh J Validation of Accident Models for
Intersections FHWA-RD-03-037 Federal Highway Administration McLean VA 2005
46
47
APPENDIX A
STATISTICAL PARAMETERS AND GOODNESS-OF-FIT RESULTS
Table A-1 Statistical Parameters for Urban Intersections SPFs Parameter Estimates
Data Intercept
Coefficient of Mayor AADT
Coefficient of Minor AADT
Subtype Site Intercept (α)
StndError
P value
lnMajor (β1)
StndError
P value
lnMinor (β2)
StndError
P value
Total VA -76234 048 lt0001 06742 005 lt0001 03453 003 lt0001
OR1 -83067 056 lt0001 07522 005 lt0001 0328 003 lt0001OR10 -123913 122 lt0001 10631 013 lt0001 04567 006 lt0001OR 100 -88553 077 lt0001 07825 007 lt0001 03706 004 lt0001FI VA -85256 057 lt0001 06477 006 lt0001 03579 004 lt0001OR1 -96546 063 lt0001 07603 006 lt0001 03597 004 lt0001OR10 -114284 15 lt0001 08662 016 lt0001 04412
Urban 4-Leg Signalized
OR 100 -99582 100 lt0001 07484 009 lt0001 04017 005 lt0001Total VA -60723 022 lt0001 04558 002 lt0001 0347 004 lt0001
OR1 -6059 044 lt0001 0505 004 lt0001 02773 006 lt0001OR10 -67031 057 lt0001 03986 007 lt0001 04999 009 lt0001OR 100 -65388 032 lt0001 04689 004 lt0001 043 006 lt0001FI VA -76917 032 lt0001 05001 003 lt0001 03695 005 lt0001OR1 -81437 060 lt0001 05813 005 lt0001 03188 008 lt0001OR10 -80333 063 lt0001 03446 007 lt0001 06218 010 lt0001
Urban 4-Leg Minor Stop Control
OR 100 -83166 051 lt0001 05253 006 lt0001 04695 008 lt0001Total VA -6543 082 lt0001 06591 008 lt0001 02119 002 lt0001
OR1 -4999 103 lt0001 05555 009 lt0001 01554 003 lt0001OR10 -96143 127 lt0001 08677 012 lt0001 03297 005 lt0001OR 100 -67518 110 lt0001 06157 011 lt0001 02969 005 lt0001FI VA -84268 068 lt0001 07147 006 lt0001 02481 002 lt0001OR1 -73982 099 lt0001 06496 009 lt0001 02088 003 lt0001OR10 -110104 155 lt0001 0908 015 lt0001 03226 006 lt0001
Urban 3-Leg Signalized
OR 100 -7266 107 lt0001 05508 011 lt0001 03107 006 lt0001Total VA -54696 013 lt0001 04874 002 lt0001 01985 001 lt0001
OR1 -5361 018 lt0001 04959 002 lt0001 01676 002 lt0001OR10 -5773 034 lt0001 04877 003 lt0001 02314 004 lt0001OR 100 -51642 021 lt0001 04338 003 lt0001 02309 003 lt0001FI VA -74642 018 lt0001 05791 002 lt0001 02091 002 lt0001OR1 -76877 027 lt0001 06204 003 lt0001 0181 002 lt0001OR10 -69458 047 lt0001 05096 004 lt0001 02212 005 lt0001
Urban 3-Leg Minor Stop Control
OR 100 -69883 031 lt0001 05169 004 lt0001 02308 003 lt0001 Standard Error
48
Table A-2 Statistical Parameters for Rural Intersections SPFs Parameter Estimates
Data Intercept
Coefficient of Mayor AADT
Coefficient of Minor AADT
Subtype Site Intercept (α)
StndError
P value
lnMajor (β1)
Stnd Error
P value
lnMinor (β2)
Stnd Error
P value
Total VA -69589 118 lt0001 06746 009 lt0001 0253 009 00047
OR1 -1604 237 04974 02284 021 02791 01514 012 0211 OR10 -63951 183 00005 05508 014 00001 03106 014 00224 OR 100 -06468 220 07692 02262 016 01635 -00158 017 09274 FI VA -87116 128 lt0001 07839 011 lt0001 02166 009 0013 OR1 -33285 246 01767 03601 024 0126 00597 013 06478 OR10 -80583 175 lt0001 06809 018 00001 02557 013 0057
Rural 4-Leg Signalized
OR 100 -48381 221 00287 04243 018 00193 01523 018 03943 Total VA -5494 020 lt0001 03533 002 lt0001 03935 003 lt0001
OR1 -62351 058 lt0001 04167 006 lt0001 04507 008 lt0001OR10 -53594 028 lt0001 03379 003 lt0001 03998 004 lt0001OR 100 -51255 027 lt0001 02914 003 lt0001 04075 004 lt0001FI VA -66927 030 lt0001 03899 003 lt0001 04156 004 lt0001OR1 -82561 095 lt0001 05221 009 lt0001 04962 012 lt0001OR10 -70797 044 lt0001 03789 004 lt0001 0497 005 lt0001
Rural 4-Leg Minor Stop Control
OR 100 -63326 038 lt0001 03223 004 lt0001 04424 005 lt0001Total VA -75754 084 lt0001 06465 008 lt0001 03332 008 lt0001
OR1 -58798 220 00075 05076 020 00143 0313 013 00161 OR10 -64368 110 lt0001 0544 011 lt0001 02863 006 lt0001OR 100 -9899 139 lt0001 08047 015 lt0001 04386 006 lt0001FI VA -87112 103 lt0001 07224 010 lt0001 02578 006 lt0001OR1 -9219 260 00004 07258 022 00011 03407 016 00326 OR10 -88607 146 lt0001 07059 016 lt0001 02809 008 00009
Rural 3-Leg Signalized
OR 100 -111835 185 lt0001 08669 018 lt0001 03977 008 lt0001Total VA -43293 008 lt0001 03366 001 lt0001 02087 001 lt0001
OR1 -50904 022 lt0001 0406 002 lt0001 02752 003 lt0001OR10 -40969 009 lt0001 03133 001 lt0001 02001 001 lt0001OR 100 -4231 016 lt0001 02997 002 lt0001 02308 003 lt0001FI VA -53415 011 lt0001 03394 001 lt0001 02237 001 lt0001OR1 -64457 031 lt0001 04195 003 lt0001 0307 004 lt0001OR10 -50831 014 lt0001 03245 002 lt0001 02014 002 lt0001
Rural 3-Leg Minor Stop Control
OR 100 -51046 024 lt0001 03163 003 lt0001 02112 003 lt0001
Standard Error
49
Table A-3 SPFs Goodness of Fit Results for Urban Northern Operational Region (No 1)
Data Estimation Data 70 Validation Data 30
Subtype Site MSE r2 R2FT MPB MAD MSPE R2
FT
Total VA 41150 0529 0557 -0760 4329 38490 0575
Total R1 4110 051 0551 -020 464 4486 054
FI VA 704 038 0406 -046 194 767 048
Urban 4-Leg Signalized
FI R1 809 039 0439 012 214 950 038
Total VA 224 031 0313 -003 090 238 029
Total R1 308 028 0286 008 095 200 032
FI VA 053 019 0193 000 043 053 019
Urban 4-Leg Minor Stop Control
FI R1 064 018 0187 003 043 048 021
Total VA 2490 038 0370 -064 352 2759 037
Total R1 3034 032 0305 -015 365 2687 037
FI VA 447 028 0259 -019 153 488 026
Urban 3-Leg Signalized
FI R1 559 025 0231 004 157 448 029
Total VA 185 025 0230 -004 089 204 024
Total R1 208 026 0239 -006 094 219 026
FI VA 043 015 0133 -002 043 048 016
Urban 3-Leg Minor Stop Control
FI R1 047 017 0156 -001 044 050 017
50
Table A-4 SPFs Goodness of Fit Results for Urban Western Operational Region (No 10)
Data Estimation Data 70 Validation Data 30
Subtype Site MSE r2 R2FT MPB MAD MSPE R2
FT
Total VA 41150 0529 0557 -0760 4329 38490 0575
Total R10 21976 0777 0735 1290 3233 17910 0686
FI VA 7043 0385 0406 -0458 1938 7671 0475
Urban 4-Leg Signalized
FI R10 4280 0526 0500 0377 1597 5170 0452
Total VA 2238 0315 0313 -0034 0897 2383 0292
Total R10 1161 0361 0300 -0032 0740 1050 0188
FI VA 0530 0194 0193 -0004 0432 0533 0194
Urban 4-Leg Minor Stop Control
FI R10 0312 0197 0187 0000 0382 0330 0009
Total VA 24900 0375 0370 -0645 3519 27591 0369
Total R10 14446 0451 0397 -0168 2801 24410 0255
FI VA 4467 0275 0259 -0185 1527 4875 0262
Urban 3-Leg Signalized
FI R10 3077 0266 0216 0039 1258 3390 0115
Total VA 1854 0254 0230 -0043 0893 2038 0239
Total R10 1391 0233 0197 -0054 0800 1640 0207
FI VA 0428 0151 0133 -0021 0431 0476 0157
Urban 3-Leg Minor Stop Control
FI R10 0354 0111 0089 -0019 0404 0380 0125
51
Table A-5 SPFs Goodness of Fit Results for Urban Eastern Operational Region (No 100)
Data Estimation Data 70 Validation Data 30
Subtype Site MSE r2 R2FT MPB MAD MSPE R2
FT
Total VA 41150 0529 0557 -0760 4329 38490 0575
Total R100 31108 0632 0630 0243 4717 37450 0005
FI VA 7043 0385 0406 -0458 1938 7671 0475
Urban 4-Leg Signalized
FI R100 5201 0480 0454 -0098 1864 5410 0244
Total VA 2238 0315 0313 -0034 0897 2383 0292
Total R100 1720 0443 0381 0087 0758 1150 0003
FI VA 0530 0194 0193 -0004 0432 0533 0194
Urban 4-Leg Minor Stop Control
FI R100 0509 0273 0254 0049 0383 0360 0173
Total VA 24900 0375 0370 -0645 3519 27591 0369
Total R100 17782 0410 0410 -1753 0908 38780 0004
FI VA 4467 0275 0259 -0185 1527 4875 0262
Urban 3-Leg Signalized
FI R100 3194 0243 0263 -0615 1645 5860 0236
Total VA 1854 0254 0230 -0043 0893 2038 0239
Total R100 1561 0233 0210 -0127 0902 2230 0002
FI VA 0428 0151 0133 -0021 0431 0476 0157
Urban 3-Leg Minor Stop Control
FI R100 0387 0131 0116 -0043 0444 0500 0141
52
Table A-6 SPFs Goodness of Fit Results for Rural Northern Operational Region (No 1)
Data Estimation Data 70
Validation Data 30
Subtype Site MSE r2 R2FT MPB MAD MSPE R2
FT
Total VA 10990 0353 0321 0513 2210 10070 -0073
Total R1 20080 0118 0092 -1389 3661 34220 0212
FI VA 2350 0196 0181 0045 1189 2600 -0034
Rural 4-Leg Signalized
FI R1 2920 0057 0052 -1173 1931 9760 0028
Total VA 1090 0182 0167 -0067 0794 1190 0171
Total R1 1990 0190 0245 0001 0942 1640 0173
FI VA 0480 0112 0098 -0022 0504 0530 0110
Rural 4-Leg Minor Stop Control
FI R1 0920 0093 0112 0020 0541 0520 0009
Total VA 5490 0328 0305 -0010 1651 5760 0179
Total R1 11110 0182 0254 -0679 2271 14750 0497
FI VA 1450 0181 0170 -0041 0902 1710 0099
Rural 3-Leg Signalized
FI R1 3230 0131 0153 -0116 1006 2120 0355
Total VA 0690 0144 0104 -0008 0613 0730 0102
Total R1 1210 0245 0196 0030 0712 0930 0126
FI VA 0250 0071 0048 -0009 0345 0260 0048
Rural 3-Leg Minor Stop Control
FI R1 0340 0124 0093 0016 0366 0300 0052
53
Table A-7 SPFs Goodness of Fit Results for Rural Western Operational Region (No 10)
Data Estimation Data 70 Validation Data 30
Subtype Site MSE r2 R2FT MPB MAD MSPE R2
FT
Total VA 10990 0353 0321 0513 2210 10070 -0073
Total R10 6020 0311 0268 0007 1748 6050 0382
FI VA 2350 0196 0181 0045 1189 2600 -0034
Rural 4-Leg Signalized
FI R10 1880 0158 0139 0097 0945 1590 0254
Total VA 1090 0182 0167 -0067 0794 1190 0171
Total R10 1300 0196 0163 0070 0760 1020 0078
FI VA 0480 0112 0098 -0022 0504 0530 0110
Rural 4-Leg Minor Stop Control
FI R10 0560 0142 0118 0025 0495 0480 0014
Total VA 5490 0328 0305 -0010 1651 5760 0179
Total R10 3690 0163 0170 -0432 0748 6740 0039
FI VA 1450 0181 0170 -0041 0902 1710 0099
Rural 3-Leg Signalized
FI R10 0890 0124 0117 -0391 0997 4030 -0066
Total VA 0690 0144 0104 -0008 0613 0730 0102
Total R10 0640 0126 0091 0025 0583 0580 0055
FI VA 0250 0071 0048 -0009 0345 0260 0048
Rural 3-Leg Minor Stop Control
FI R10 0240 0062 0041 0003 0335 0230 0028
54
Table A-8 SPFs Goodness of Fit Results for Rural Eastern Operational Region (No 100)
Data Estimation Data 70 Validation Data 30
Subtype Site MSE r2 R2FT MPB MAD MSPE R2
FT
Total VA 10990 0353 0321 0513 2210 10070 -0073
Total R100 10120 0042 0027 1207 1882 5120 -0307
FI VA 2350 0196 0181 0045 1189 2600 -0034
Rural 4-Leg Signalized
FI R100 2060 0053 0039 0119 0962 1370 -0023
Total VA 1090 0182 0167 -0067 0794 1190 0171
Total R100 0960 0170 0149 -0086 0746 1140 0209
FI VA 0480 0112 0098 -0022 0504 0530 0110
Rural 4-Leg Minor Stop Control
FI R100 0440 0106 0092 -0031 0475 0490 0121
Total VA 5490 0328 0305 -0010 1651 5760 0179
Total R100 2770 0492 0459 0601 1759 6260 0090
FI VA 1450 0181 0170 -0041 0902 1710 0099
Rural 3-Leg Signalized
FI R100 1040 0265 0255 0124 0923 1570 -0055
Total VA 0690 0144 0104 -0008 0613 0730 0102
Total R100 0640 0125 0087 -0037 0601 0690 0119
FI VA 0250 0071 0048 -0009 0345 0260 0048
Rural 3-Leg Minor Stop Control
FI R100 0250 0064 0038 -0013 0345 0270 0062
55
APPENDIX B
RECOMMENDED SAFETY PERFORMANCE FUNCTION MODELS
Table B-1 Recommended Urban SPFs Site Virginia SPF Models to Be Used for Urban Intersections
Urban 4-Leg Signalized Total Virginia generic total
Urban 4-Leg Signalized
Operational Region 1 generic total
Urban 4-Leg Signalized
Operational Region 10
use specified model developed
Urban 4-Leg Signalized
Operational Region 100 generic total
Urban 4-Leg Signalized FI Virginia generic FI
Urban 4-Leg Signalized
Operational Region 1 generic FI
Urban 4-Leg Signalized
Operational Region 10
use specified model developed
Urban 4-Leg Signalized
Operational Region 100
use specified model developed
Urban 4-Leg Minor Stop Control
Total Virginia generic total
Urban 4-Leg Minor Stop Control
Operational Region 1
use specified model developed
Urban 4-Leg Minor Stop Control
Operational Region 10
use specified model developed
Urban 4-Leg Minor Stop Control
Operational Region 100
use specified model developed
Urban 4-Leg Minor Stop Control
FI Virginia generic FI e^-76917MajADT^05001MinADT^03695
Urban 4-Leg Minor Stop Control
Operational Region 1
use specified model developed
Urban 4-Leg Minor Stop Control
Operational Region 10
use specified model developed
Urban 4-Leg Minor Stop Control
Operational Region 100
use specified model developed
56
Table B-1 Recommended Urban SPFs (Continued)
Site Virginia SPF Models to Be Used for Urban Intersections
Urban 3-Leg Signalized
Total Virginia
use generic model developed for total
crashes
Urban 3-Leg Signalized
Operational Region 1
use generic model developed for total
crashes
Urban 3-Leg Signalized
Operational Region 10
use specific regional model
developed
Urban 3-Leg Signalized
Operational Region 100
use generic model developed for total
crashes
Urban 3-Leg Signalized FI Virginia
use generic model developed for FI
crashes
Urban 3-Leg Signalized
Operational Region 1
use generic model developed for FI
crashes
Urban 3-Leg Signalized
Operational Region 10
use specific regional model
developed
Urban 3-Leg Signalized
Operational Region 100
use generic model developed for FI
crashes
Urban 3-Leg Minor Stop Control
Total Virginia
use generic model developed for total
crashes
Urban 3-Leg Minor Stop Control
Operational Region 1
use generic model developed for total
crashes
Urban 3-Leg Minor Stop Control
Operational Region 10
use specific regional model
developed
Urban 3-Leg Minor Stop Control
Operational Region 100
use generic model developed for total
crashes
Urban 3-Leg Minor Stop Control
FI Virginia use generic model developed for FI
crashes
Urban 3-Leg Minor Stop Control
Operational Region 1
use generic model developed for FI
crashes
Urban 3-Leg Minor Stop Control
Operational Region 10
use specific regional model
developed
Urban 3-Leg Minor Stop Control
Operational Region 100
use generic model developed for FI
crashes
57
Table B-2 Recommended Rural SPFs Site Virginia SPF Models to Be Used for Rural Intersections
Rural 4-Leg Signalized Total Virginia
use generic model developed for total
crashes
Rural 4-Leg Signalized
Operational Region 1
use generic model developed for total
crashes
Rural 4-Leg Signalized
Operational Region 10
use specific regional model developed
Rural 4-Leg Signalized
Operational Region 100
use specific regional model developed
Rural 4-Leg Signalized FI Virginia use generic model
developed for FI crashes
Rural 4-Leg Signalized
Operational Region 1
use generic model developed for FI crashes
Rural 4-Leg Signalized
Operational Region 10
use specific regional model developed
Rural 4-Leg Signalized
Operational Region 100
use specific regional model developed
Rural 4-Leg Minor Stop Control Total Virginia
use generic model developed for total
crashes
Rural 4-Leg Minor Stop Control
Operational Region 1
use generic model developed for total
crashes e^-549MajADT^035MinADT^039
Rural 4-Leg Minor Stop Control
Operational Region 10
use specific regional model developed
Rural 4-Leg Minor Stop Control
Operational Region 100
use generic model developed for total
crashes
Rural 4-Leg Minor Stop Control FI Virginia use generic model
developed for FI crashes
Rural 4-Leg Minor Stop Control
Operational Region 1
use generic model developed for FI crashes
Rural 4-Leg Minor Stop Control
Operational Region 10
use generic model developed for FI crashes
Rural 4-Leg Minor Stop Control
Operational Region 100
use generic model developed for FI crashes
58
Table B-2 Recommended Rural SPFs (Continued)
Site Virginia SPF Models to Be Used for Rural Intersections
Rural 3-Leg Signalized Total Virginia use generic model
developed for total crashes
Rural 3-Leg Signalized
Operational Region 1
use generic model developed for total crashes
Rural 3-Leg Signalized
Operational Region 10
use generic model developed for total crashes
Rural 3-Leg Signalized
Operational Region 100
use generic model developed for total crashes
Rural 3-Leg Signalized FI Virginia use generic model
developed for FI crashes
Rural 3-Leg Signalized
Operational Region 1
use generic model developed for FI crashes
Rural 3-Leg Signalized
Operational Region 10
use generic model developed for FI crashes
Rural 3-Leg Signalized
Operational Region 100
use generic model developed for FI crashes
Rural 3-Leg Minor Stop Control Total Virginia use generic model
developed for total crashes
Rural 3-Leg Minor Stop Control
Operational Region 1
use generic model developed for total crashes
Rural 3-Leg Minor Stop Control
Operational Region 10
use specific regional model developed
Rural 3-Leg Minor Stop Control
Operational Region 100
use generic model developed for total crashes
Rural 3-Leg Minor Stop Control FI Virginia use generic model
developed for FI crashes
Rural 3-Leg Minor Stop Control
Operational Region 1
use generic model developed for FI crashes
Rural 3-Leg Minor Stop Control
Operational Region 10
use specific regional model developed
Rural 3-Leg Minor Stop Control
Operational Region 100
use generic model developed for FI crashes

2
Table 2 Total Fatal and Intersection Fatal Crashes for 2003 Through 2007
Year Total Fatal
Crashes Intersection
Fatal Crashes Proportion
()
2003 726 216 298 2004 723 188 260 2005 752 188 250 2006 722 193 267 2007 778 184 237
TOTAL 3701 969 262
Figure 1 Example of a Safety Performance Function (SPF)
SPFs are developed for different roadway segments and intersection configurations
Currently the SPFs suggested by FHWA use only annual average daily traffic (AADT) as the most significant causal factor For example an intersection SPF gives the predicted number of crashes per year for given AADTs on the major and minor approaches SPFs aid the transportation planner to identify better where to expend limited staff resources on detailed assessments to determine feasible and effective treatments AADT-driven SPFs are practical for network screening Adding more independent variables beyond AADT may be too labor intensive The corresponding EB-adjusted long-term number of crashes can be computed from the actual observed crashes and the SPF-predicted number of crashes for the given AADT As it can be seen in Figure 1 the difference between the EB-adjusted long-term number of crashes and the SPF-predicted number of crashes gives the potential for safety improvement (PSI) The PSI can be better described as the potential for intersection sites to be upgraded or repaired by reducing crashes and improving safety if appropriate countermeasures are applied to these sites This can be used to develop a priority list of the specific sites or intersections where detailed assessments to determine feasible and effective treatment can be undertaken Sites that have a
3
greater PSI are given a higher prioritization when all selected sites are ranked in order to determine which sites should receive prompt attention
SafetyAnalyst provides a set of state-of-the art software tools for use in the decision-
making process to identify safety needs and develop a program for site-specific safety improvement projects SafetyAnalyst also plays an important role because it helps make sure that highway agencies receive the greatest possible safety benefit from every dollar spent toward safety modifications (FHWA 2010) FHWA-suggested SPFs for intersections are however based on data from Minnesota and it has been recommended that individual states develop SPFs based on their own crash and AADT data (Harwood et al 2004) The development of SPFs for Virginia is of great importance when safety improvement is being considered Because of the important role SPFs play in the software tools in SafetyAnalyst it is essential at least to test how well the FHWA-suggested SPFs fit the Virginia data and if necessary to develop specific SPFs for Virginia
PURPOSE AND SCOPE
The purpose of this study was to investigate the extent to which the FHWA-suggested
intersection SPFs which were based on Minnesota data were transferable to Virginia and if necessary to develop Virginia-specific SPFs using crash and corresponding AADTs for intersection sites in Virginia The SPFs for this study include those for total crashes and combined fatal and injury (FI) crashes with different configurations such as four-leg and three-leg intersections signalized intersections and unsignalized intersections or urban and rural locations
The scope was limited to intersection types on VDOT-maintained roads for which
appropriate and adequate data were available This report gives the results obtained for urban and rural intersections The objectives were as follows
1 Evaluate the transferability of the FHWA-suggested SPFs to Virginia 2 If necessary develop SPFs for different intersection types that are suitable for use in
Virginia 3 Identify some of the intersections that have a higher than expected number of crashes
Crashes related to two-lane roads were investigated in a separate study (Garber et al
2010) It is anticipated that the results obtained from both studies will produce a set of SPFs that can be applied to Virginia and be used to prioritize those two-lane segments and intersections that are in need of safety improvements thereby improving the transportation planning process
4
METHODS
Ten tasks were performed to achieve the study objectives 1 Conduct a literature review 2 Select study sites 3 Extract crash data 4 Extract AADT data 5 Evaluate the transferability to Virginia of the suggested Minnesota SPFs 6 Develop specific SPFs for Virginia 7 Evaluate the Virginia SPFs developed 8 Determine the appropriate number of SPFs for Virginia through a pruning process 9 Prioritize sites based on potential for crash reduction 10 Evaluate benefits and implementation prospects
Literature Review
Recent publications related to the development and evaluation of SPFs for different highway systems were identified and reviewed so as to identify information of relevance to this study Sources used were the Transportation Research Information System (TRIS) the VDOT Research Library and the University of Virginia libraries
Selection of Study Sites
The research team in consultation with staff from VDOTrsquos Traffic Engineering Division
(TED) initially selected 21112 intersections under the jurisdiction of VDOT for the study These included all intersections for which the location was properly identified by an intersection node and for which geometric characteristics remained the same throughout the study period of 2003 through 2007 The required geometric traffic and crash data for each site were then extracted from the relevant databases The data were obtained primarily from the Highway Traffic Records Information System (HTRIS) HTRIS is a comprehensive Oracle database system which interrelates and consolidates Virginiarsquos highway and traffic information used for internal management and reporting VDOT maintains detailed records on current and historical roadway crash and traffic information in HTRIS For this reason only VDOT-maintained roads were used for analysis This database system contains multiple subsystems three of which were used to extract data for this study roadway inventory (RDI) for intersection configuration and type of control accident (ACC) for crash counts and highway performance monitoring system (HPMS) for AADTs Using the available data each intersection was classified based on the area type (urban or rural) the traffic control system (signalized stop control or yield control) and the configuration (number of approaches) Intersections for which all the data requirements for proper classification were not available were deleted from the list of study sites
The classification of an intersection as urban or rural was based on VDOTrsquos classification
of each approach route Intersections with all approaches designated as rural were classified as
5
rural and those with all approaches designated as urban were classified as urban Intersections with urban and rural approaches were removed from the list of study sites to minimize the uncertainty A data quality analysis was also performed to ascertain that the AADT values for all approaches of each intersection and for each year of the study period were available Intersections with incomplete data were removed from the study including yield all-way stop and intersections with five approaches This resulted in 18356 intersections classified as urban or rural as shown in Table 3
Virginia is divided into five operational regions as shown in Figure 2 After consultation
with VDOT and the technical review panel the different topographical characteristics in Virginia were then used to group the intersections into three regional groups as Northern Western and Eastern The Northern region is composed of intersections in Northern Virginia and surrounding counties the Western region is considered to have a mountainous terrain and the Eastern region is considered to have rolling to flat terrain Table 3 also shows the specific districts and counties in each of the three regions used in this study This regional classification helped to partially account for different characteristics that are encountered throughout the state
Table 3 Urban and Rural Classification Operational Region Districts Urban Rural Total
Northern (No 1)
District 9 (NOVA) + Culpeper (023) Fauquier County (030) King George County (048) Madison County (056) Orange County (068) Rappahannock County (078) Spotsylvania (088) Stafford County (089)
4620 596 5216
Western (No 10)
District 1 (Bristol) District 2 (Salem) District 3 (Lynchburg) District 8 (Staunton) + Albemarle County (002) Fluvanna County (032) Greene County (039) Louisa County (054)
1197 6706 7903
Eastern (No 100)
District 4 (Richmond) and District 5 (Hampton Roads) + Caroline County (016) Essex County (028) Gloucester County (036) King amp Queen County (049) King William (050) Lancaster County (051) Mathews County (057) Middlesex County (059) Northumberland County (066) Richmond County (079) Westmoreland County (096)
2193 3044 5237
Total 8010 10346 18356 Proportion () 4364 5636 100 Alternative method of identifying regions for easy application of the SAS code No 1 = Northern region No 10 = Western region No 100 = Eastern region
6
Figure 2 Virginia Operational Regions (Cogburn 2007)
The study considered urban and rural intersections with urban consisting of 8010 intersections and rural consisting of 10346 intersections as shown in Table 4
The intersections were also divided by their configuration (number of approaches) and
the type of traffic control (signalized or minor stop control) The number of urban intersection sites for each category is shown in Table 5 and that for rural intersections in Table 6 The total number of rural four-leg signalized and rural three-leg signalized sites is much lower than that for the urban signalized intersections However this is expected as a much lower percentage of rural intersections are signalized In addition all-way stop intersections were excluded because of the low number at the time of the study
Table 4 Proportion of Urban and Rural Sites by Region
Operational Region Urban Proportion () Rural Proportion () Northern 4620 5768 596 5760 Western 1197 1494 6706 64817 Eastern 2193 2738 3044 29423 TOTAL 8010 100 10346 100
Table 5 Distribution of Urban Sites by Geometric Configuration
Operational Region Urban 4-leg Signalized
Urban 4-leg 2-Way Stop
Urban 3-leg Signalized
Urban 3-leg Minor Stop Total
Northern 371 766 497 2986 4620 Western 53 153 137 854 1197 Eastern 144 320 202 1527 2193 TOTAL 568 1239 836 5367 8010 Proportion () 709 1547 1044 6700 100
7
Table 6 Distribution of Rural Sites by Geometric Configuration
Operational Region Rural 4-leg Signalized
Rural 4-leg 2-Way Stop
Rural 3-leg Signalized
Rural 3-leg Minor Stop Total
Northern 19 67 13 497 596 Western 90 894 117 5605 6706 Eastern 73 609 53 2309 3044 TOTAL 182 1570 183 8411 10346 Proportion () 176 1517 177 8130 100
Crash and Operational Data Collection
As previously discussed HTRIS serves as a centralized warehouse of traffic and roadway data for Virginia and is composed of various subsystems that carry distinct data RDI ACC and HPMS were the three subsystems used to extract the necessary data for the study
VDOTrsquos TED staff extracted the crash data by using the ACC database for the years
2003 through 2007 The ACC database is composed of data derived from the crash report forms (DMV FR300) that are filled out by police officers and include data such as driverrsquos actions driver characteristics environmental conditions collision type and crash severity among other factors The database developed for this study included total fatal injury and property damage only (PDO) (property damage greater than $1000) crashes that occurred within a distance of 250 feet or 0047 mile of the intersection which matches the procedure used to develop the suggested SPFs in SafetyAnalyst The RDI database was used to identify the intersection ID or node number for the urban and rural intersection sites that had the same geometric conditions throughout the 5 years selected for the study
A Structured Query Language (SQL) program was developed for retrieving and
formatting the required data for the analysis This query specified the intersection node configuration approach volumes urbanrural classification crashes and traffic control device for each year of the study period The Statistical Analysis Software SAS (913) was then used to format the data in a way suitable for the analysis (SAS Institute Inc 2009)
Annual Average Daily Traffic Selection
The major and minor AADTs were used as the independent variables in developing the SPFs for intersections in Virginia in accordance with the SPFs developed for SafetyAnalyst (Harwood et al 2004) It was therefore necessary to identify the major and minor approaches at each intersection In determining the major and minor AADTs it was recommended by VDOT that for four-leg approaches the major entering volume should be the sum of the two highest approach volumes and the minor entering volume the sum of the two lowest approach volumes For three-leg approaches the major entering volume was the sum of the two highest approach volumes The highway performance monitoring system database was used to obtain the AADTs for the selected study sites
8
Evaluation of Recommended Minnesota SPFs
Once all of the necessary data were obtained for each of the study sites the SafetyAnalyst-recommended SPFs which are based on data for intersections in Minnesota were tested to determine how well they fit the Virginia data Both graphical and statistical methods were used to conduct these tests The graphical method consisted of a visual inspection of the spread of the Virginia data for a specific configuration of intersection and the actual crashes of a given severity plotted with the resultant curve from using the same Virginia database and the corresponding recommended Minnesota SPF The statistical test consisted of computing the Freeman-Tukey RFT 2 coefficients for the recommended SPFs using the appropriate Virginia data The RFT
2 coefficient was used as this was the statistical parameter used to represent the goodness of fit (ITT Corporation 2008) in developing the SafetyAnalyst-recommended SPFs Equations 1 2 and 3 show how the data were transformed to compute the RFT
2 (Fridstroslashm et al 1995) fi = ( yi )05 + ( yi +1 )05 (Eq 1) ecirci = fi ndash ( 4 times ŷi + 1 )05 (Eq 2) RFT
2 = 1 ndash sumiecirci2 sumi( fi ndash fm )2 (Eq 3)
where fi = Freeman-Tukey transformation statistic yi = observed data at site i ecirci = residual at site i ŷi = modeled (predicted) value at site i fm= mean of the transformation statistic (fi) across all sites of the same configuration and urbanrural classification RFT
2 = Freeman-Tukey R2
Developing Virginia-Specific SPFs
The format of the specific SPFs developed for Virginia is the same as that in the
SafetyAnalyst manual and given as
1 2k e x MajAADT x MinAADTβ βα= (Eq 4) where
k = predicted crash frequency per intersection per year MajAADT = AADT on the major road (vehday) MinAADT = AADT on the minor road (vehday) α = intercept
9
β1 = coefficient of major AADT β2 = coefficient of minor AADT
In developing the SPFs a negative binomial (NB) distribution for the crash data was
used as preliminary analysis showed that the data fit the NB distribution The form of the data used to develop the SPFs can be either the panel or cross-sectional (collapsed) format According to Kweon and Lim (2010) the panel format uses original panel data which consist of assembling several years of data over the same intersection and the cross-sectional models use pseudondashcross-sectional data which are data converted or rearranged from the panel set The difference between the two types of models obtained is that the model based on the panel data form takes advantage of the characteristics of the panel data by positioning a predefined correlation structure on reciprocated measures over years at the same time whereas the model based on the cross-sectional form uses the data created by collapsing the multi-year panel data into apparently a single-year panel data The crash data were divided into the estimation and validation portions Seventy percent was selected randomly and used as the estimation data to develop the SPFs and the remaining 30 was used as the evaluation data
An estimation of acceptable values was made for the regression coefficients and the
dispersion parameter when developing the SPFs for the EB method in SafetyAnalyst The regression coefficients are critical for the comparison of different SPFs The dispersion parameter (d) is important when using the EB method in SafetyAnalyst because it plays an integral function in computing the EB weight that influences the estimate of the EB long-term predicted crashes When determining the dispersion parameter from SAS for the urban four-leg signalized intersections the values obtained were d = 02223 for the panel data and d = 02216 for the collapsed data but when determining the values for the urban four-leg two-way stop intersections the values calculated were d = 04284 for panel data and d = 02518 for collapsed data In the urban four-leg two-way stop intersections a significant difference in the d values was observed which led to the choice of panel data for the modeling as they would be more reliable than the collapsed data By looking at the obtained values it can be appreciated that the collapsed model underestimates the dispersion which will eventually cause the EB value to inflate therefore leading to a biased report for the collapsed model
Generalized linear modeling (GLM) was used to create a correlation between the intersection crashes for the 5 years chosen for analysis and the major and minor approach volumes For the statistical modeling SAS was employed (SAS Institute Inc 2009) This software includes the GENMOD procedure and the equation used is the same as given in Equation 5 The GENMOD procedure gives an output of generalized estimating equations (GEE) parameter estimates which are the ones used to develop the Virginia SPFs
1 2exp( )it itk MajAADT MajAADTα β β ε= + + + (Eq 5) where i = intersection index (i = 1hellip N) t = severity index (t = TOT [total crashes] FI [fatal + injury crashes] PDO [property damage only])
10
α = intercept β1 = coefficient of major AADT β2 = coefficient of minor AADT
itk = dependent variable at intersection i and severity t (crashesyr) νit = random error exp (νit) Gamma (θ θ) εit = random (residual) error in GEE
The random errors presented in this equation have the function of not letting the β values or coefficients become biased
Evaluation of Virginia-Specific SPFs
Several statistical parameters were used to assess how well the Virginia SPFs fit the data The parameters used and suggested by Washington et al (2005) were the mean prediction bias (MPB) the mean absolute deviation (MAD) the mean square error (MSE) the mean squared prediction error (MSPE) the Pearsonrsquos product moment correlation coefficients between observed and predicted crash frequencies (used for both validation and estimation data) dispersion parameters and the Freeman Tukey RFT
2 coefficients computed from Equation 3 To test the fit of the SPFs the 70 estimation data set was used to calculate the MSE the Pearsonrsquos product moment correlation coefficients the R2 and the R2
FT To test the transferability of the SPFs the 30 validation data set was used to compute the MPB MAD and the MSPE The expressions used to determine these coefficients are given in Equations 6 through 10
( )2
iin
1i
nYYMPB
2 minussum= = (Eq 6)
2
n
1i ii
n
YYMAD
2sum=minus
= (Eq 7)
( )
pnYY
MSE1
n
1i
2
ii2
minus
minus= sum = (Eq 8)
( )
2
n
1i
2
ii
nYY
MSPE2sum=
minus= (Eq 9)
where p = degrees of freedom i = intersection index Yi = observed crash frequency at intersection i Ŷi = predicted crash frequency at intersection i
11
n2 = validation data sample size 30 n1 = estimation data sample size 70
(Eq 10) where
_
1Y = average of observed crashes per intersections _
2Y = average of predicted crashes per intersections Yi1 = observed values at intersection i Y i2 = predicted values at intersection i
It should be noted that when values obtained from the MPB MAD MSE and MSPE
formulas are close to 0 it indicates a good fit or desirable SPF and when values for the RFT2 and
R2 formulas are close to 1 it indicates a suitable fit The dispersion parameter (d) is used in the variance-mean relationships as shown in Equations 11 and 12
(Eq 11)
( ) ( ) ( )i i i i i iVar Y X E Y X d x E Y X= + (Eq 12) A weighting factor (Wi) used in the EB procedure is obtained from Equation 13 and used in Equation 14 to obtain the EB-estimated value
( )1
1ii i
Wd x E Y X
=+
(Eq 13)
( ) ( ) ( )1EB i i i i i i iE E y y W x E Y X W x Y= + minus (Eq 14)
where 0 lt W lt 1 Var (|) = conditional variance E (|) = conditional mean Var m or Var (Yi|Xi) = estimated variance of mean crash rate E m or E (Yi|Xi) = estimated mean crash rate from SPF d = estimated NB dispersion parameter (also called overdispersion parameter)
2Var m E m d x E m= +
( )( )( ) ( )
1 1 2 21 22 2
1 21 2
i i
i i
Y Y Y Yr
Y Y x Y Y
sum minus minus=⎡ ⎤sum minus sum minus⎢ ⎥⎣ ⎦
12
W = weight Xi = variables such as AADT Yi = number of observed crashes per year at intersection i EEB = EB-adjusted estimated crashes (crashesyr)
In the variance-mean relationship if the value obtained for the dispersion parameter d is 0 then the variance is the same as the mean (see Equations 11 and 12) which causes the NB model to collapse to the Poisson model This parameter has a strong influence on the weight in the EB formula (see Eq 13) therefore it has an effect in the EB-estimated value SAS was helpful in computing this parameter for the different types of intersections analyzed in the study throughout the 5 years
Pruning Process
Before the site prioritization was performed pruning was done to avoid over-representation of the SPFs that might not reflect much difference in the study when compared with statewide SPFs At the completion of the pruning process only the necessary or minimum effective SPFs were retained MSPE is typically the parameter used to assess errors associated with a validation data set for this reason MSPE was used for pruning In order to verify whether a specific regional SPF should be retained or not the validation data set (30 of the data) was used to compute MSPE for both the specific regional SPFs and the corresponding statewide SPFs If MSPE for the regional SPF was greater than that for the corresponding Virginia statewide SPF or if the difference between these two MSPEs was less than 10 it was concluded that the regional SPF was not necessary and it was therefore discarded The following example illustrates the steps for urban four-leg signalized FI crashes in Region 1
1 The 30 FI crash data were obtained for urban signalized four-leg intersections in Region 1 and the MSPE was determined using the statewide SPF for the FI urban four-leg signalized intersections
2 The 30 FI crash data for urban signalized four-leg intersections in Region 1 were
then used to determine MSPE for the specific Region 1 SPF for FI crashes 3 Verify if the MSPE value for the specific regional SPF is higher than the statewide
MSPE value if yes discard the specific regional SPF if no tentatively retain the specific regional model
4 The difference between the two MSPEs was determined to determine whether it was
less than 10 of the statewide MSPE if yes discard the specific regional SPF if no retain the specific regional model This process was repeated for all regional SPFs
13
Identification of Intersections with a Higher Than Expected Number of Crashes
In order to identify some of the intersections with a higher than expected number of crashes a prioritization analysis based on the EB method was conducted This analysis was carried out to identify the top 25 intersections with a high PSI in the urban areas of the Northern Virginia and Bristol districts These two districts were selected to identify any effect of the approach AADTs as two-lane roads in the Northern Virginia District carry much higher volumes than those in the Bristol District The PSI is the difference between the EB-adjusted long-term crashes and the SPF-estimated crashes The PSI was first determined and then a priority list was developed with intersections showing a higher PSI receiving a higher priority This procedure first required the computation of yearly calibration factors (Cy) that accounted for intrinsic yearly variations that were not accounted for in developing the SPFs These yearly calibration factors were determined using the steps described here and given in Equations 15 through 18 (ITT Corporation 2008) Calculation of Yearly Calibration Factor (Cy) For subtype s and severity t the following steps were performed 1 Calculate the (unadjusted) predicted number of crashes using the appropriate SPF yiMinAADTMajAADTe ststst
isyisyisty amp~ 21ˆˆˆ foralltimestimes= ββακ (Eq 15)
2 Sum the predicted numbers over all intersections
ysN
iistysty forall=sum
=
~~1κκ (Eq 16)
3 Sum the observed numbers of crashes over all intersections
yKKsN
iistysty forall=sum
=
1
(Eq 17)
4 Calculate yearly calibration factor csty
yK
csty
stysty forall= ~κ (Eq 18)
5 Repeat the steps for all subtypes (s) and severities (t)
where i = intersection index (i = 1hellip N)
14
s = subtype index (s = urban four-leg signalized intersection rural three-leg minor stop controlled intersection etc) t = severity index (t = TOT [total crashes] FI [fatal + injury crashes] PDO [property damage only]) y = year index (i = 1 [base year] 2 hellip Y) csty = yearly calibration factor for crash subtype s severity t and year y MajAADT = AADT on the major road (vehday) MinAADT = AADT on the minor road (vehday)
istyκ~ = (unadjusted) predicted number of crashes at intersection i for crash subtype s severity t and year y
istyκ = (adjusted) predicted number of crashes at intersection i for crash subtype s severity t and year y α = intercept
1β = coefficient of major AADT 2β = coefficient of minor AADT
These yearly calibration factors were then used to determine the predicted number of
crashes at an intersection based on the SPF for the severity of crashes and type of intersection being considered The PSI for each intersection was then determined using the steps described in Equations 19 through 22 (ITT Corporation 2008) Steps for Calculating PSI for Subtype s
1 Calculate the (adjusted) predicted number of crashes
amp~
21ˆˆˆ ststst
isyisysty
istystyisty
MinAADTMajAADTec
yticββα
κκ
timestimestimes=
foralltimes= (Eq 19)
2 Calculate yearly correction factor Cisty
ytiCyist
istyisty amp
)1(
forall==κ
κ
(Eq 20)
3 Calculate EB weight
tid
w Y
y istystist amp
11
1
foralltimes+
=sum =
κ (Eq 21)
4 Calculate the EB-adjusted estimated number of crashes for year 1
15
tiC
KwwX Y
y isty
Y
y istyistyististyist amp)1(
1
1)1()1( forallminus+times=
sumsum
=
=== κ (Eq 22)
5 Determine the PSI for each intersection If istYX gt istYκ include intersection i in the list for prioritization using istYPSI = istYX
where i = intersection index (i = 1hellip N) s = subtype index (s = urban four-leg signalized intersection rural three-leg minor stop
controlled intersection etc) t = severity index (t = TOT [total crashes] FI [fatal + injury crashes] PDO [property damage
only]) y = year index (y = 1 [base year] 2 hellip Y) cy = yearly calibration factor for crash subtype s severity t and year y d = dispersion parameter w = weight MajAADT = AADT on the major road (vehday) MinAADT = AADT on the minor road (vehday) PSI = potential for safety improvement
istyC = yearly correction factor
istyκ~ = (unadjusted) predicted number of crashes at intersection i for crash subtype s severity t and year y
istyκ = (adjusted) predicted number of crashes at intersection i for crash subtype s severity t and year y
istyX = EB-adjusted estimated number of crashes α = intercept
1β = coefficient of major AADT 2β = coefficient of minor AADT
The prioritization lists for urban two-lane roads in the Northern Virginia and Bristol
districts were then developed based on the PSIs obtained for three prioritization procedures These alternative prioritization procedures were the average crash rates (ACRs) for the study period (see Equation 23) the critical crash ratio (CCR) (see Eqs 24 through 27) (Garber and Hoel 2009) and the EB method The list was developed with the intersections having the highest PSI listed first followed by other intersections in descending order The execution of the EB method prioritization process was achieved through use of the computer codes in SAS Finally the effectiveness of using the EB method for prioritizing sites for safety improvement was illustrated by comparing the PSIs from using intersection crash rates critical crash and the EB procedures
16
Procedure for Crash Rate Method The ACR for the intersection is given as
( )(1000000)( )( )(365)T
TCACRN V
= (Eq 23)
where ACR = the average crash rate for the intersection under consideration (crashes1000000
approach volume) TC = number of crashes over the study period at the intersection N = duration of study period (yr) VT = average daily total approach volume at the intersection Procedure for Critical Rate Method
The critical rate method was accomplished by first computing the traffic base (TB) of the intersection under consideration using Equation 24 The ACR for the intersection under consideration is then computed using its TB as shown in Equation 25 The intersection critical crash rate (ICCR) is then determined using Equation 26 The critical crash ratio (CCR) for the intersection is then computed as the ratio of ICR and the average crash rate (AVR) for all intersections under the same category (intersection type urbanrural etc) as that for the intersection being considered using Equation 27 TB is given as
365
1 000 000
NxVxTB = (Eq 24)
where TB = the total approach volume over the study period of N years at the intersection under consideration (veh1000000) V = average daily approach volume at the intersection under consideration ACR is obtained as
TCACRTB
= (Eq 25)
where ACR = ACR at the intersection under consideration over the study period of N years
17
TB = the total approach volume over the study period of N years at the intersection under consideration (veh1000000) The critical crash rate (ICCR) for the intersection under consideration is given as
05 AVRICCR AVR TFTB TB
= + + (Eq 26)
where AVR = ACR for intersections within the state and of the same designation (eg rural three-leg with minor stop control) as that for the intersection under consideration TF = number of standard deviations for the confidence level being used in the analysis (usually 196 for 95 confidence level) TB = the total approach volume over the study period of N years at the intersection under consideration (veh1000000) The critical crash ratio (CCR) for the intersection is then obtained as
ACRCCRICCR
= (Eq 27)
where ACR = ACR at the intersection under consideration over the study period of N years (see Eq 2) ICCR = critical crash rate for the intersection under consideration (see Eq 26)
Benefits and Implementation Expectations
The expected benefits from developing SPFs and prioritizing intersection sites were illustrated by comparing the PSIs for the prioritized sites when sites were prioritized using the EB method with those obtained when sites were prioritized using crash rates and the critical crash ratio This analysis was conducted for the combined fatal plus injury crashes SPFs An estimate of the cost savings attributable solely to the potential reduction of crashes was also computed by using crash costs given in an FHWA study (FHWA 2005)
18
RESULTS AND DISCUSSION
Literature Review
SafetyAnalyst
The SafetyAnalyst Userrsquos Manual (ITT Corporation 2008) has SPFs that are suggested for intersections that are based on Minnesota data Tables 7 and 8 show the regression coefficients (α β1 and β2) for the SPFs developed for total and combined FI crashes respectively The values for the goodness of fit parameter RFT
2 are also given Although these RFT2 are all less
than 045 with a few less than 010 it has been suggested that the SPFs used in SafetyAnalyst could provide a realistic estimate of an expected crash frequency as a function of traffic volume and roadway geometry (Pham and Ragland 2005)
Methodological and Research References
Several studies similar to this study have been conducted in Canada Colorado California Texas New York and Minnesota For example a study was conducted using data from Colorado California and Texas to examine the functional form of the SPFs for urban freeways (Kononov et al 2008) Five years of crash data were acquired from the respective departments of transportation and the highway safety information system from Colorado The study revealed that the amount of crashes increased moderately with congestion in segments on urban freeways This study however did not include intersections
A study by Lyon et al was conducted in Toronto Ontario Canada to develop SPFs for urban signalized intersections (Lyon et al 2005) Collision data were gathered for five years and included 1950 urban intersections SPFs were developed for different severity levels impact types and intersection types such as four-leg and three-leg intersections The format used to develop the SPFs is shown in Equation 28 This format is somewhat different from that of Equation 4 suggested in Safety Analyst
Collisionsyear = α (F1)β1(F2)β2 exp (β3X1 + β4X2 + ) (Eq 28) where α and βi = the coefficients estimated in the SPF calibration process F1 and F2 = the entering AADTs on the major and minor roads respectively Xi = other independent variables (such as single lane versus multilane approaches with and without left-turn lanes or right-turn lanes high and low pedestrian activities or in some cases F1 or F2 or both)
19
Table 7 SafetyAnalystrsquos SPFs for Intersections (Total Crashes) Site
subtype Code
Site subtype Description
State Regression coefficients
LogIntercept (α)
Regression coefficients
LogAADTmaj (β1)
Regression coefficients LogAADT
min (β2)
Over - dispersion Parameter
(k)
RFT2
() Number of Sites
Max AADTmaj
(vehday)
Max AADTmin
(vehday)
Rural 201 Rural 3-leg with minor-
road STOP control MN -878 071 024 107 133 1706 28500 27000
202 Rural 3-leg with all-way STOP control
MN -1237 122 027 047 41 41 25300 6803
203 Rural 3-leg with signal control
MN -657 066 02 033 26 136 36400 11500
204 Rural 4-leg with minor-road STOP control
MN -896 065 047 07 299 2114 35500 26700
205 Rural 4-leg with all-way STOP control
MN -1237 122 027 047 41 41 25300 6803
206 Rural 4-leg with signal control
MN -657 066 02 033 26 136 36400 11500
Urban 251 Urban 3-leg with minor-
road STOP control MN -535 034 028 128 59 397 68000 18900
252 Urban 3-leg with all-way STOP control
MN -1237 122 027 047 41 41 25300 6803
253 Urban 3-leg with signal control
MN -985 097 018 023 414 33 50000 25807
254 Urban 4-leg with minor-road STOP control
MN -312 027 016 086 76 333 58870 81000
255 Urban 4-leg with all-way STOP control
MN -1237 122 027 047 41 41 25300 6803
256 Urban 4-leg with signal control
MN -347 042 014 032 264 418 75000 81000
ITT Corporation 2008
20
Table 8 SafetyAnalystrsquos SPFs for Intersections (Fatal and Injury Crashes) Site
subtype Code
Site subtype Description
State Regression coefficients
LogIntercept (α)
Regression coefficients
LogAADTmaj (β1)
Regression coefficients LogAADT
min (β2)
Over - dispersion Parameter
(k)
RFT2
() No of Sites
Max AADTmaj
(vehday)
Max AADTmin
(vehday)
Rural 201 Rural 3-leg with minor-
road STOP control MN -935 071 021 123 91 1706 28500 27000
202 Rural 3-leg with all-way STOP control
MN -1002 127 -022 089 248 41 25300 6803
203 Rural 3-leg with signal control
MN -783 075 014 05 215 136 36400 11500
204 Rural 4-leg with minor-road STOP control
MN -936 066 04 0 146 2114 35500 26700
205 Rural 4-leg with all-way STOP control
MN -1002 127 -022 089 248 41 25300 6803
206 Rural 4-leg with signal control
MN -783 075 014 05 215 136 36400 11500
Urban 251 Urban 3-leg with minor-
road STOP control MN -845 049 039 123 81 397 68000 18900
252 Urban 3-leg with all-way STOP control
MN -1002 127 -022 089 248 41 25300 6803
253 Urban 3-leg with signal control
MN -1022 091 021 027 362 33 50000 25807
254 Urban 4-leg with minor-road STOP control
MN -435 029 019 099 57 333 58870 81000
255 Urban 4-leg with all-way STOP control
MN -1002 127 -022 089 248 41 25300 6803
256 Urban 4-leg with signal control
MN -511 049 016 03 295 418 75000 81000
ITT Corporation 2008
21
The study examined the impact of two left turn priority treatments which were flashing advanced green (FAG) and left turn green arrow (LTGA) on left turn collisions These treatments were implemented at 35 intersections in the city of Toronto Two types of collisions were investigated left turns with and without side impact The results indicated that there was an insignificant difference in the impact of the left turn priority treatments on both types of crashes
Lord and Persaud (2003) conducted a study that related SPFs to transportation planning models They noted that traffic safety is not usually accounted for when agencies are conducting a planning analysis to remodel build upgrade or modify their facilities Five-year intersection data from Canada were used Models were developed and statistical measures such as the over dispersion parameter were calculated and conclusions were made from the results The SPFs developed for the study were applied to two sample networks created with the help of a transportation planning software package The research showed that it is possible to make estimation for traffic safety at the planning stage of a project This will allow users to take safety into consideration when designing and possibly create alternatives to change existing designs for more comprehensive projects or development The study also indicated that there are limitations when applying the SPFs to computerized transportation networks The study concluded that although it is possible to predict or estimate crashes on digital transportation networks the accuracy of prediction relies greatly on how precise the traffic flow estimates are
Jonsson et al (2007) performed an SPF study that took into consideration the type and severity of crashes andmdashmost importantmdashthe causal factors for these crashes The study was conducted for intersections on rural four-lane highways in the state of California Four collision types were tested in the study opposite-direction same-direction intersecting-direction and single-vehicle crashes In addition a set of data from the state of New York was used with the same parameters to analyze the severity distribution of crash types The data for California included 1084 intersections on four-lane rural highways and that from New York included 675 intersections mainly stop controlled or without any control Generalized linear modeling was performed with the data after quality analysis Two model forms were estimated with the variables seen in Equations 29 and 30
(Eq 29)
(Eq 30)
where NAcc = predicted number of crashesyr at intersections AADTmajor = AADT on major road AADTminor= AADT traffic flow on minor road Βi = model parameters Xi = variables that describe the intersections (such as terrain lighting left turn number of though lanes and divided or undivided among others)
nn xxxormajorAcc exAADTxAADTN ββββββ ++++=
min4433021
nn xxxormajorAcc exAADTAADTN βββββ +++++=
min332201)(
22
The two different models are different representations of the traffic flow The first represents the AADT of major and minor roads as separate variables but in the second model they are represented as one variable by the sum of the major and minor roads AADTs Results showed that the first model performed better for the multiple-vehicle crashes and the second model fitted better for the single-vehicle crashes In addition the appropriate predictor variables differed depending on the crash type This study is also of interest as it incorporated additional parameters to those in the suggested SPFs now included in SafetyAnalyst and therefore could lead to possible future SPF research for the state of Virginia
Persaud and Nguyen (1998) conducted a study on signalized intersections in Ontario Canada They developed aggregate and disaggregate models to estimate safety performance of three- and four-leg intersections in which crash severity (injury and PDO) environmental class (semi-urban and rural) and time period (daily weekday morning peak and weekday afternoon peak) were considered in the analysis An important aspect of that study is that it supplemented the existing models used for estimating SPFs instead of replacing them because it took into consideration features that were generally not considered in the then existing developed models Two model levels were considered for the study Level 1 was based on the sum of AADTs for all approaches with separate estimates for rear-end right angle and turning movement crashes At this level the equations were adjusted for three- and four-leg intersections by crash severity for all combined impact types and also separately for the three major impact types which were angle rear-end and turning movement In addition models were further separated by time period (daily weekday morning and afternoon peak) and for four-leg intersections which were also classified by environment class such as semi-urban and rural Level 2 allowed estimates to be obtained for specific crash patterns that were defined by movements of the vehicles involved before collision and the same were estimated as a function of the flows that were relevant to each of the patterns For this level models were estimated for four-leg intersections for 12 multi-vehicle and three single-vehicle patterns that were described by the movements of involved vehicles before collision The developed models were intended to estimate the parameters P and d shown in Equations 31 and 33
The safety of the intersection was estimated using the long-term mean based on the EB approach The long term mean (m) was obtained by combining crash count (x) of an intersection in the most recent years (n) with the estimates of the expected annual number of crashes (P) as shown in Equation 31 W1 and W2 in Equations 31 through 33 represent the weights estimated from the mean and variance of the regression estimates
(Eq 31)
(Eq 32)
(Eq 33)
m =W1(x) +W2(P)
2dW
d nP=
+
1PW
d nP=
+
23
(Eq 34)
To estimate the variance of m the following formula was used
(Eq 35)
In Equations 32 through 35 P and d represent the fundamental parameters Two models were selected for SPFs For Level 1 and single-vehicle Level 2 (Eq 36) For multi-vehicle in Level 2 (Eq 37) where P = expected number of crashes of a given type α and β = regression parameters to be estimated S (Level 1) = sum of all entering flows for a given time period for Level 1 analysis S (Level 2) = sum of the daily through right or left turn flows for a given time period for Level 2 (single-vehicle) analysis S1 and S2 = AADTs for small and large flows for a specific crash pattern in Level 2 (multi-vehicle) analysis
The models in either level can be used in the EB procedure to provide estimates for intersections that need to be treated or for the evaluation of the effectiveness of safety countermeasures It should be noted that the quality of the estimates for the study was strongly related to how the parameters were selected and used in the SPFs and unlike other available road models the ones presented in this study can be separated by time period and crash pattern Persaud et al (2002) conducted a study to demonstrate the complexity involved in the calibration of crash prediction models or SPFs for urban intersections Toronto data for three- and four-leg signalized intersections were used to estimate the models for the study The performance of these models was then compared with other models from Vancouver and California The models from these places were recalibrated to fit Toronto by using the Interactive Highway Safety Design Model (IHSDM) and a calibration procedure as proposed by Harwood et al (2000) The results varied significantly and were also mixed The study noted that the calibration of models is not a simple task and due to the importance of the SPFs they must be properly calibrated Several things must be accounted for when performing this procedure in order to obtain good quality data analysis The first thing is to extract a large sample of high quality data A software or program to link all the traffic crash and road characteristics data must exist because the same is usually kept stored in different databases In addition several
2Pd
Var P=
2( )
d xVar m dnP
+=
+
P =αSβ
P =αS1β1 S2
β 2
24
years of crash data must be obtained in order to have a good amount of samples that account for variations The actual process of model calibration is complicated therefore careful attention must be paid when analyzing the same because of the importance of the outcomes of the study The authors of the study made an exploratory analysis and it revealed that the relationship between the crashes and each covariate should be described either by the power function or the gamma function for all intersection types to be analyzed Equations 38 through 40 are the selected model forms used in the study F1 = Power F2 = Gamma (Eq 38) F1 = Gamma F2 = Power (Eq 39) F1 = Power F2 = Power (Eq 40) where E (K) = expected annual number of crashes between 1990 and 1995 F1 F2 = average entering AADT of major and minor roads respectively for the period 1990 to 1995 α β1 β2 β3 β4 = coefficients to be estimated
An NB structure was used to analyze the models and the overdispersion parameter (γ) was analyzed using Equation 41
γ=
2)K(E)K(Var (Eq 41)
Variance increases as γ decreases therefore the value of γ can also be used to make a comparison for the goodness of fit of several models fitted to the same data The larger the value of γ the smaller the variance therefore a more accurate model is given The authors suggest that γ would be enough to calculate the goodness of fit index of any SPF but if one desires to know how accurate the prediction estimate is other measures should also be computed The authors suggested using R2
α as proposed by Miaou et al (1996) which is a dispersion parameter based R2 computed as shown in Equation 42
γγ
minus=αmin2 1R (Eq 42)
where γ = overdispersion parameter for calibrated model γmin = smallest possible overdispersion parameter
The authors suggested that a disaggregation by traffic volume is preferable than using
only a single calibration factor for that is what the IHSDM currently has A recommendation is made to account for safety variation in traffic conditions over time by calibrating the models every two to three years as suggested by Harwood et al (2000)
E(K) =αF1β1 F2
β 2e(β 3F2 )
E(K) =αF1β1 F2
β 2e(β 4 F1 )
E(K) =αF1β1 F2
β 2
25
The Illinois Department of Transportation and the University of Illinois Urbana-Champaign conducted a research study to develop and implement SPFs for road segments and intersections in Illinois (Tegge et al 2010) These SPFs were developed in a way suitable for easy implementation in SafetyAnalyst The crash data (number of crashes and crash severity) and roadway data (number of lanes traffic volume area type and functional class) were collected and used for development of the SPFs Seventeen peer groups were used for developing the SPFs for segments and eight for intersections The intersections peer groups were minor leg stop control all-way stop control signalized and undetermined for rural and urban segments separately The SPFs for segments were developed using NB distribution for crashes and Poisson distribution for intersections The SAS GENMOD procedure was used to develop the SPFs for a five-year analysis period from 2001 to 2005 The model form for the intersection SPFs is the same as that given in the SafetyAnalyst Userrsquos Manual The SPFs were also developed for different crash severities such as fatal crashes type A injury crashes type B injury crashes and fatal plus injury crashes The EB method was used to determine the sites with the higher PSIs Two analysis techniques were used to obtain the PSIs The first considered segments and intersections as individual elements and the second used the sliding window approach The site specific analysis treated each individual segment and intersection as a separate entity Each segment is then compared with every other segment instead of having them grouped together The sliding window approach defined a set length The window lengths were 025 mile and 1 mile for urban and rural segments respectively
The largest impact on crash frequency was found to be the AADT and was therefore the only variable modeled as a logarithm (lnAADT) By doing this the AADT accounted for most of the prediction whereas the rest of the variables refined the prediction further Other variables used included access control functional class lane width surface type area type speed limit and median type The study recommended that a multivariate analysis be conducted for such studies to show how certain variables could contribute to the crashes Other variables could include roadway lighting weather and pavement conditions and roadway geometry The study also concluded that knowledge of roadway characteristics that increase the risk of fatal or injury crashes will facilitate the setting up of safety criteria that can help engineers in the designing of safer roadways Further knowledge of driver behaviors that lead to fatal and severe injury crashes can facilitate the training of enforcement officers to identify these behaviors
The Colorado Department of Transportation (CDOT) (2009) conducted a study to develop SPFs for intersections in the state Their model form is the same as that in SafetyAnalyst The SPFs were developed for many categories based on the number of legs divided undivided rural and urban including urban four-lane divided signalized six-lane divided signalized urban three-leg signalized two-lane undivided unsignalized and urban three-leg unsignalized When a median or left-turn lane is present a roadway is considered divided The sites selected for the study reflected variability in traffic volume and geometry in order to have a diverse representation of intersections throughout the state SPFs were developed for total and for fatal plus injury crash types A five-year study period from 2000 through 2005 was used Crash and AADT data were collected for development of the SPFs CDOT used a NB error structure to develop the SPFs and the EB procedure to estimate the expected safety performance of an intersection site for different safety management purposes Overdispersion parameters were computed and used as a goodness of fit measure According to their data
26
overdispersion parameters indicated that their models provided a reasonable fit to the Colorado data
Results indicated that for signalized intersections roads with six lanes on major approaches have more collisions than those with four lanes on major approaches CDOT recommended that the SPFs should be recalibrated in the future using data from future years as crash frequencies may change over time because of a variety of issues The report also recommended that separate calibration factors should be developed for different regions and different topographies Research in Virginia
In Virginia two other similar studies have recently been published One by Garber et al (2010) for two-lane roads and another by Hamidi et al (2010) to identify high-crash sections on Virginiarsquos primary system by developing a planning-level methodology The study by Garber et al developed SPFs for two-lane segments of 1 mile or less and the study by Hamidi et al developed SPFs for longer segments of two-lane roads that can be used for corridor analysis
Evaluation of the Recommended Minnesota SPFs
Figures 3 through 6 show representative graphs that were used to visually examine how well the Virginia data fitted the suggested Minnesota SPFs Figures 3 and 4 are for urban four-leg signalized intersections and Figures 5 and 6 are for rural four-leg signalized intersections These graphs suggest that the Minnesota SPFs do not fully represent the Virginia data Tables 9 through 12 show the Freeman-Tukey R2
FT coefficients computed for the different Minnesota SPFs using the Virginia data The low Freeman-Tukey R2
FT coefficients obtained and the visual inspection of the graphs suggested that a better fit to the Virginia data could be obtained by developing specific Virginia SPFs using Virginia data It was therefore decided to develop specific SPFs for Virginia
0
2
4
6
8
10
12
14
0 20000 40000 60000 80000 100000 120000
AADT Major
Tota
l Cra
shes
Per
Yea
r
Minnesota VA Actual Observed
Minnesota Model
Figure 3 Total crashes per year vs major AADT for urban 4-leg signalized intersections
with minor AADT of 700
27
0
5
10
15
20
25
30
35
0 20000 40000 60000 80000 100000 120000
AADT Major
Tota
l Cra
shes
per
Yea
r
Minnesota VA Actual Observed
Minnesota Model
Figure 4 Total crashes per year vs major AADT for urban 4-leg signalized intersections
with minor AADT of 4500
0
2
4
6
8
10
12
14
0 20000 40000 60000 80000 100000 120000
AADT Major
Tota
l Cra
shes
Per
Yea
r
Minnesota VA Actual Observed
Minnesota Model
Figure 5 Total crashes per year vs major AADT for rural 4-leg signalized intersections with
minor AADT of 795
28
0
2
4
6
8
10
12
14
16
18
0 20000 40000 60000 80000 100000 120000
AADT Major
Tota
l Cra
shes
per
Yea
r
Minnesota VA Actual Observed
Minnesota Model
Figure 6 Total crashes per year vs major AADT for rural 4-leg signalized intersections with
minor AADT of 5000
Table 9 Minnesota SPFs for Urban FI Crashes and Corresponding R2FT Based
on Virginia Data
Intersection Type
Minnesota FI SPFs R2
FT Based on Virginia Urban FI Crash Data ()
Urban 4-Leg Signalized 032
Urban 4-Leg Minor Stop Control 008
Urban 3-Leg Signalized 026
Urban 3-LegMinor Stop Control 01
Table 10 Minnesota SPFs for Urban TOTAL crashes and Corresponding R2
FT Based on Virginia Data
Type of Intersection
Minnesota SPFs
R2FT Based on Virginia Urban Total
Crash Data ()
Urban 4-Leg Signalized 034
Urban 4-Leg Minor Stop Control 022
Urban 3-Leg Signalized 031
Urban 3-Leg Minor Stop Control 01
29
Table 11 Minnesota SPFs for Rural TOTAL Crashes and Corresponding R2FT
Based on Virginia Data
Type of Intersection
Minnesota SPFs R2
FT Based on Virginia Rural Total Crash Data ()
Rural 4-Leg Signalized 029
Rural 4-Leg Minor Stop Control 013
Rural 3-Leg Signalized 029
Rural 3-Leg Minor Stop Control -010
Table 12 Minnesota SPFs for Rural FI Crashes and Corresponding R2FT Based
on Virginia Data
Type of Intersection
Minnesota SPFs R2
FT Based on Virginia Rural FI Crash Data ()
Rural 4-Leg Signalized 018
Rural 4-Leg Minor Stop Control 010
Rural 3-Leg Signalized 018
Rural 3-Leg Minor Stop Control 001
Development and Evaluation of Specific Virginia SPFs
In keeping with the suggestion given in the Safety Analyst Userrsquos Manual the model form used to develop the intersection SPFs is given in Equation 4 as
1 2k e x MajAADT x MinAADTβ βα=
where
k = predicted crash frequency per intersection per year MajAADT = AADT on the major road (vehday) MinAADT = AADT on the minor road (vehday) α = intercept β1 = coefficient of mayor AADT β2 = coefficient of minor AADT
30
The statewide SPFs developed for Virginia are given in Tables 13 through 16 Due to lack of data the analysis for all-way stop intersections could not be undertaken These tables also give the Freeman-Tukey R2
FT coefficient for each of the Virginia SPFs and the corresponding Minnesota SPF and Freeman-Tukey R2
FT based on the Virginia data The R2FT coefficients
obtained indicate that the Virginia-specific SPFs fit the Virginia data better than the suggested Minnesota SPFs for all types of intersections and crash severity except those for FI crashes on urban three-leg signalized rural four-leg signalized and rural four-leg minor stop control intersections where the corresponding RFT
2 values are similar In Table 15 it can be seen that the Minnesota R2
FT value is negative for the rural three-leg minor stop control intersections The negative RFT
2 value is possible because these calculations were not performed on the same data points that were used to create the Minnesota SPFs (Miller 2009) Table 13 SPF Models for Urban TOTAL crashes and R2
FT results for Virginia Statewide (VDOT-maintained roads)
SPF model with TOTAL Crash values
R2FT TOTAL
Crash Data
Site Virginia Statewide Minnesota VA MN
Urban 4-Leg Signalized 056 034
Urban 4-Leg Minor Stop Control
032 022
Urban 3-Leg Signalized 037 031
Urban 3-Leg Minor Stop Control
023 010
Table 14 SPF Models for Urban FI crashes and R2
FT results for Virginia Statewide (VDOT-maintained roads)
SPF model with FI Crash values R2FT FI Crash Data ()
Site
Virginia Statewide Minnesota VA MN
Urban 4-Leg Signalized 041 032
Urban 4-Leg Minor Stop Control
019 008
Urban 3-Leg Signalized 026 026
Urban 3-Leg Minor Stop Control
013 010
31
Table 15 SPF Models for Rural TOTAL Crashes and R2FT Results for Virginia Statewide (VDOT-
maintained roads) SPF model with TOTAL Crash values R2
FT TOTAL Crash Data
Site
Virginia Statewide Minnesota VA MN
Rural 4-Leg Signalized 0321 0290
Rural 4-Leg Minor Stop Control
0167 0132
Rural 3-Leg Signalized 0305 0291
Rural 3-Leg Minor Stop Control
0104 -0102
Table 16 SPF Models for Rural FI crashes and R2
FT results for Virginia Statewide (VDOT-maintained roads) SPF model with FI Crash values R2
FT TOTAL Crash Data
Site
Virginia Statewide Minnesota VA MN
Rural 4-Leg Signalized 0181 0181
Rural 4-Leg Minor Stop Control
0098 0097
Rural 3-Leg Signalized 0170 0180
Rural 3-Leg Minor Stop Control
0048 0012
Figures 7 through 10 show visual representations of how well the Virginia SPFs fit the
Virginia data in comparison with the suggested Minnesota SPFs In general the Virginia SPFs tend to fit the Virginia data better than the Minnesota SPFs although both sets of SPFs tend to have similar fits at low volumes (AADTmajor lt 2000) except for the SPF for total crashes on urban four-leg signalized intersections shown in Figure 7 The primary reason the Minnesota SPFs do not fit the Virginia data as well as the Virginia SPFs may be the dissimilarities of the roadside environment and the characteristics of the different databases
32
0
2
4
6
8
10
12
14
0 20000 40000 60000 80000 100000 120000
AADT Major
Tota
l Cra
shes
Per
Yea
r
Minnesota VA Actual Observed Virginia
Minnesota Model
Virginia M odel
Figure 7 Total crashes per year vs major AADT for urban 4-leg signalized intersections
with minor AADT of 700
0
5
10
15
20
25
30
35
0 20000 40000 60000 80000 100000 120000
AADT Major
Tota
l Cra
shes
per
Yea
r
Minnesota VA Actual Observed Virginia
Minnesota Model
Virginia Model
Figure 8 Total crashes per year vs major AADT for urban 4-leg signalized intersections
with minor AADT of 8000
33
0
2
4
6
8
10
12
14
0 20000 40000 60000 80000 100000 120000
AADT Major
Tota
l Cra
shes
Per
Yea
r
Minnesota VA Actual Observed Virginia
Virginia Model
Minnesota Model
Figure 9 Total crashes per year vs major AADT for rural 4-leg signalized intersections with
minor AADT of 79
0
5
10
15
20
25
0 20000 40000 60000 80000 100000 120000
AADT Major
Tota
l Cra
shes
per
Yea
r
Minnesota VA Actual Observed Virginia
Minnesota Model
Virginia Model
Figure 10 Total crashes per year vs minor AADT for rural 4-leg signalized intersections with major AADT of 5000
As discussed in the Methodology section in addition to the statewide Virginia SPFs
specific SPFs were developed for each operational region to consider the different topographical characteristics that exist across Virginia The complete set of SPFs together with the associated p values for the regression coefficients are shown in Tables A-1 and A-2 of Appendix A All p values are less than 005 with most being less than 00001 except for some of the rural four-leg signalized intersections regional specific SPFs These p values indicate that the estimated coefficients are statistically significant at the 95 confidence level or better A possible reason
34
for higher p values for a small number of SPFs may be the sample size used for developing these SPFs
To test the transferability and fit of the Virginia statewide specific SPFs several
statistical parameters were determined for the 70 (estimation) data set and the 30 (validation) data set separately The corresponding values for each of these parameters were then compared The results are shown in Tables 17 and 18 for urban and rural intersections respectively The results for the regional SPFs are shown in Tables A-3 through A-8 of Appendix A The results indicate that the developed models are transferable to the 30 validation data set For example the MSE values for the 70 estimation data are similar to the MSPE values for the 30 validation data In addition the mean prediction bias MPB values for the 30 validation data are close to zero (-076 le MPB ge -0004) in Table 17 and (-0067 le MPB ge 00513) in Table 18
Table 17 Goodness of Fit Results for Urban Statewide SPFs
Data Estimation data 70 Validation Data 30 Subtype Site MSE r2 R2
FT MPB MAD MSPE R2FT
Total VA 41150 0529 0557 -0760 4329 38490 0575
Total MN
68636 0506 0336 -3145 5421 68156 0315
FI VA
7043 0385 0406 -0458 1938 7671 0475
Urban 4-Leg Signalized
FI MN 7702 0372 0324 -0316 2124 8981 0376
Total VA 2238 0315 0313 -0034 0897 2383 0292
Total MN 2510 0287 0215 0091 0982 2730 0182
FI VA 0530 0194 0193 -0004 0432 0533 0194
Urban 4-Leg Minor Stop Control
FI MN 0560 0182 0080 0128 0522 0577 0052
Total VA 24900 0375 0370 -0645 3519 27591 0369
Total MN 29322 0365 0308 -2238 3661 33079 0272
FI VA 4467 0275 0259 -0185 1527 4875 0262
Urban 3-Leg Signalized
FI MN 4528 0267 0261 -0294 1526 4937 0261
Total VA 1854 0254 0230 -0043 0893 2038 0239
Total MN 2388 0237 0104 -0541 0902 2600 0107
FI VA 0428 0151 0133 -0021 0431 0476 0157
Urban 3-Leg Minor Stop Control
FI MN 0478 0140 0097 -0184 0385 0537 0104
35
Table 18 Goodness of Fit Results for Rural Statewide SPFs
Data Estimation Data 70
Validation Data 30
Subtype Site MSE r2 R2FT MPB MAD MSPE R2
FT
Total VA 10990 0353 0321 0513 2210 10070 -0073
Total MN 12400 0339 0290 -0154 2071 8460 0035
FI VA 2350 0196 0181 0045 1189 2600 -0034
Rural 4-Leg Signalized
FI MN 2400 0188 0181 -0043 1164 2420 0004
Total VA 1090 0182 0167 -0067 0794 1190 0171
Total MN 1190 0167 0132 -0348 0774 1320 0115
FI VA 0480 0112 0098 -0022 0504 0530 0110
Rural 4-Leg Minor Stop Control
FI MN 0500 0104 0097 -0158 0459 0560 0093
Total VA 5490 0328 0305 -0010 1651 5760 0179
Total MN NA NA NA NA NA NA NA
FI VA 1450 0181 0170 -0041 0902 1710 0099
Rural 3-Leg Signalized
FI MN NA NA NA NA NA NA NA
Total VA 0690 0144 0104 -0008 0613 0730 0102
Total MN 0890 0141 -0102 -0404 0555 0940 -0104
FI VA 0250 0071 0048 -0009 0345 0260 0048
Rural 3-Leg Minor Stop Control
FI MN 0270 0068 0012 -0144 0270 0290 0003
Pruning of Virginia-Specific SPFs A total of 64 SPFs were initially developed using the appropriate data for Virginia as shown in Tables A-1 and A-2 of Appendix A Considering that not all regional models might be necessary the pruning process described in the methodology section was carried out to prune the number of SPFs to the minimum effective number as seen in Tables 19 and 20 for urban and rural intersections respectively The pruning process resulted in 19 SPFs for urban sites and 15 for rural sites To facilitate the use of the correct SPF for a specific type of intersection located in a specific region the lists of the appropriate SPFs to be used are given in Tables B-1 and B-2 of Appendix B for the urban and rural intersections respectively
As can be seen in Tables 19 and 20 and Tables A-1 and A-2 of Appendix A there are some trends worth discussing for the benefit of the study and possible future research With regards to the three different operational regions the Western region retained many more of the specific regional urban SPFs than any other region For example the Western regional SPFs were retained for all urban intersection sites whereas for the Eastern region the only SPFs
36
retained were those for urban four-leg signalized FI crashes and urban four-leg minor stop control for total and FI crashes Similarly the only urban SPF retained for the Northern region was that for urban four-leg minor stop control for total crashes For the rural intersection sites all of the Western regional SPFs were retained except those for rural three-leg signalized total and FI crashes and rural four-leg minor stop control FI crashes The majority of the Eastern region rural SPFs were discarded except those for rural four-leg signalized total and FI crashes while for the Northern region all regional SPFs were discarded
The Western region retained more specific regional SPFs than the other two regions This suggests that the intersections in the Western region exhibit more unique characteristics than those for the other regions This may be due to the more mountainous terrain in the Western region compared to those in the Eastern and Northern regions This supports the philosophy of developing specific SPFs based on the topography of different regions
Site Prioritization
To illustrate the benefits of using the EB method to prioritize intersection sites for safety
improvements the top 25 urban sites from the Bristol and Northern Virginia districts were identified by using crash rates critical crash ratio and the EB method The PSI for each site identified was then determined The results obtained are shown in Tables 21 and 22 for the Bristol and the Northern Virginia districts respectively The results indicate that for the Northern Virginia District the PSIs for the top 25 sites are 258 1317 and 27440 crashes per year and for the Bristol District 432 646 and 1496 crashes per year for the crash rates critical crash ratio and EB methods respectively The important thing in Tables 21 and 22 is the sum of the PSI columns ranked by the three methods The sum of each of the PSIs for the crash rate and critical crash ratio method is lower than that for the EB method These results suggest that the use of the EB method in the planning process will identify intersection sites with the highest PSIs and therefore where detailed assessments to determine feasible and effective safety treatments should be undertaken
37
Table 19 MSPE Values for Virginia Urban Statewide and Urban Regional SPFs Used for Pruning
Data Pruning
Subtype
Site
MSPE [MSPEVA-
MSPEOR]1 [abs(MSPEVA-
MSPEOR)]2 [abs(MSPEVA-
MSPEOR)MSPEVA]3
RetainDiscardTotal VA 3849 Northern 4486 -637 637 0165497532 Discard Western 1791 2058 2058 0534684334 Retain Eastern 3745 104 104 0027020005 Discard FI VA 7671 Northern 95 -1829 1829 0238430452 Discard Western 517 2501 2501 0326033112 Retain
Urban 4-Leg Signalized
Eastern 541 2261 2261 0294746448 Retain Total VA 23834 Northern 202 03634 03634 015247126 Retain Western 105 13334 13334 0559452882 Retain Eastern 115 12334 12334 0517496014 Retain FI VA 05327 Northern 048 00527 00527 0098929979 Discard Western 033 02027 02027 0380514361 Retain
Urban 4-Leg Minor Stop Control
Eastern 036 01727 01727 0324197485 Retain Total VA 275911 Northern 2687 07211 07211 0026135239 Discard Western 2441 31811 31811 0115294425 Retain Eastern 3878 -111889 111889 0405525695 Discard FI VA 48754 Northern 448 03954 03954 0081101038 Discard Western 339 14854 14854 0304672437 Retain
Urban 3-Leg Signalized
Eastern 586 -09846 09846 020195266 Discard Total VA 20379 Northern 219 -01521 01521 0074635654 Discard Western 164 03979 03979 0195250012 Retain Eastern 223 -01921 01921 0094263703 Discard FI VA 04756 Northern 05 -00244 00244 0051303616 Discard Western 038 00956 00956 0201009251 Retain
Urban 3-Leg Minor Stop Control
Eastern 05 -00244 00244 0051303616 Discard 1 Difference between mean square prediction error (MSPE) of Virginia statewide model and OR model 2 Absolute value of the difference between Virginia statewide model MSPE and operational region model MSPE 3 Absolute value of the difference between Virginia statewide model MSPE and operational region model MSPE divided by the Virginia statewide MSPE for comparison
Retained SPFs Discarded if value is negative Discarded if less than 01
38
Table 20 MSPE Values for Virginia Rural Statewide and Rural Regional SPFs Used for Pruning Data Pruning
Subtype
Site
MSPE
[MSPEVA-MSPEOR]1
[abs(MSPEVA-MSPEOR)]2
[abs(MSPEVA-MSPEOR)MSPEVA]3
RetainDiscard
Total VA 1007 Northern 3422 -2415 2415 2398212512 Discard Western 605 402 402 0399205561 Retain Eastern 512 495 495 0491559086 Retain FI VA 26 Northern 976 -716 716 2753846154 Discard Western 159 101 101 0388461538 Retain
Rural 4-Leg Signalized
Eastern 137 123 123 0473076923 Retain Total VA 119 Northern 164 -045 045 0378151261 Discard Western 102 017 017 0142857143 Retain Eastern 114 005 005 0042016807 Discard FI VA 053 Northern 052 001 001 0018867925 Discard Western 048 005 005 0094339623 Discard
Rural 4-Leg Minor Stop Control
Eastern 049 004 004 0075471698 Discard Total VA 576 Northern 1475 -899 899 1560763889 Discard Western 674 -098 098 0170138889 Discard Eastern 626 -05 05 0086805556 Discard FI VA 171 Northern 212 -041 041 0239766082 Discard Western 403 -232 232 1356725146 Discard
Rural 3-Leg Signalized
Eastern 157 014 014 0081871345 Discard Total VA 073 Northern 093 -02 02 0273972603 Discard Western 053 02 02 0273972603 Retain Eastern 069 004 004 0054794521 Discard FI VA 026 Northern 03 -004 004 0153846154 Discard Western 023 003 003 0115384615 Retain
Rural 3-Leg Minor Stop Control
Eastern 027 -001 001 0038461538 Discard 1 Difference between mean square prediction error (MSPE) of Virginia statewide model and OR model 2 Absolute value of the difference between Virginia statewide model MSPE and operational region model MSPE 3 Absolute value of the difference between Virginia statewide model MSPE and operational region model MSPE divided by the Virginia statewide MSPE for comparison
Retained SPFs Discarded if value is negative Discarded if less than 01
39
Table 21 PSIs for Top 25 Sites in District 1 Urban (Bristol) FI
Crashes Ranking Based on Crash
Rates Ranking Based on Crash Ratio Ranking Based on EB
Method
Rank Intersection Node
Crash Rate1 PSI2 Intersection
Node Crash Ratio3 PSI Intersection
Node PSI
1 596726 22112 00000 651193 39672 00000 596095 21413
2 606469 20079 00000 606238 39298 06297 596393 08787
3 706818 12504 00000 651075 31264 00000 651130 08453
4 651193 11550 00000 596726 29227 00000 596701 07112 5 651075 09369 00000 606469 28039 00000 651802 06929 6 606238 08382 06297 651233 25831 03612 636331 06726 7 651807 07089 00000 651130 22718 08453 596395 06579 8 651233 06068 03612 706818 22555 00000 596937 06415 9 651230 05990 00000 651230 20301 00000 606238 06297
10 651783 05756 00000 651210 18882 04747 661033 06061 11 636093 04960 00000 636331 17913 06726 596372 05417 12 651274 04475 00000 651807 16847 00000 636372 04808 13 651130 04179 08453 651805 15814 00000 651210 04747 14 651210 03918 04747 651223 15627 03589 636491 04649 15 636331 03393 06726 651783 15009 00000 596420 04633 16 651223 03363 03589 596095 14865 21413 596403 04579 17 606232 03331 00000 636405 14769 00000 651603 04531 18 651127 03053 00000 661033 14555 06061 636056 04351 19 651999 03048 00000 596353 14215 03717 712033 04110 20 596449 02962 00000 636093 13782 00000 704691 04102 21 636405 02811 00000 651879 13192 00000 651838 04100 22 651883 02698 00000 651274 12975 00000 651894 03878 23 596353 02686 03717 651127 12972 00000 596353 03717 24 651805 02663 00000 651999 12959 00000 651233 03612 25 661033 02500 06061 596449 12702 00000 651889 03601
sum 43202 sum 64615 sum 149606 1Number of crashes per year per 1000000 total approach volume 2Potential for safety improvement (crashes yr) the difference between the EB-adjusted long-term crashes and the SPF-estimated crashes 3Ratio of actual crash rate to critical crash rate
40
Table 22 PSIs for Top 25 Sites in District 9 Urban (Northern Virginia District) FI
Crashes Ranking Based on Crash
Rates Ranking Based on Crash Ratio Ranking Based on EB
Method
Rank Intersection Node
Crash Rate1 PSI2 Intersection
Node Crash Ratio3 PSI Intersection
Node PSI
1 718192 191841 00000 718192 257523 00000 264119 150122 2 702946 178194 00000 547722 152371 11175 263375 140091 3 271531 64846 00000 263628 102794 00000 278648 137239 4 263628 52858 00000 263728 100092 00000 276819 131395 5 263728 42215 00000 719754 95274 09444 263290 130743 6 266955 35294 00000 702946 79268 00000 722678 127897 7 547722 34932 11175 263403 77252 05184 264725 118671 8 702612 30441 00000 704237 77175 07648 267028 116627 9 273886 29539 00000 263729 74681 00000 265204 115925
10 716747 27632 00000 271531 72327 00000 274766 115679 11 263626 27139 00000 263135 66458 18068 263249 113372 12 269485 26567 00000 716747 64461 00000 547044 110769 13 728954 26344 00000 266955 56657 00000 549349 107180 14 263729 25208 00000 546138 52003 31028 268210 105630 15 546988 21922 00000 547544 51924 32529 263347 104257 16 274338 21446 00000 263626 50389 00000 276351 102313 17 429308 21354 00000 269485 49897 00000 428167 100064 18 720401 21197 00000 728954 49702 00000 264344 98789 19 267295 20954 00000 548686 49572 03621 277764 91554 20 267536 20874 00000 711601 47985 04440 263467 89259 21 265938 20484 00000 266970 47730 00000 263090 89199 22 273354 20108 00000 546462 46856 03620 703414 88610 23 268345 19362 00000 265938 46726 00000 428629 87379 24 719754 19073 09444 720401 44833 00000 272219 85659 25 263403 19015 05184 728496 43666 04990 428544 85610
Sum 25803 sum 131747 sum 2744033 1Number of crashes per year per 1000000 total approach volume 2Potential for safety improvement (crashes yr) the difference between the EB-adjusted long-term crashes and the SPF-estimated crashes 3Ratio of actual crash rate to critical crash rate
41
CONCLUSIONS
bull The development of SPFs for intersections is necessary for Virginia because the SafetyAnalyst-suggested SPFs which are based on Minnesota data do not represent the Virginia data well Regarding the fit of the SPFs to Virginia data the R2
FT values shown in Tables 13 through 16 for Minnesota and Virginia indicate that the Virginia-specific SPFs fit the Virginia data better than the Minnesota models This may be due to the dissimilarities of the roadside environment such as difference in topography and the characteristics of the different Virginia and Minnesota databases
bull In some cases the specific regional SPFs fit the regional data better than the statewide
SPFs suggesting that the specific SPFs should be considered for use when available These group divisions that have similar roadway characteristics and driver expectations in some cases tend to improve the fit
bull In identifying intersection sites for safety improvements it is clearly beneficial for the EB
method to be used with the suitable SPFs rather than a crash rate or critical ratio method Results of the site prioritization show a much higher potential for crash reduction when the EB method is used with the appropriate SPFs rather than a procedure based on crash rates or critical rates
RECOMMENDATIONS
1 VDOTrsquos TED should use the Virginia-specific SPFs when using the SafetyAnalyst tools The results of this study have shown that the Virginia-specific SPFs reflected the Virginia data better than the SafetyAnalyst-recommended Minnesota SPFs
2 VDOTrsquos TED should investigate the feasibility of using multiple SPFs in SafetyAnalyst If
feasible regional SPFs should be used If it is not currently feasible to use multiple SPFs VDOTrsquos TED should ask that the FHWA include regional information in SafetyAnalyst so as to allow the use of regional SPFs For the specific regional SPFs to be applied to Virginia and other states the SafetyAnalyst tool should be capable of incorporating the necessary data that support the regional models
3 As soon as it is feasible to use regional SPFs VDOTrsquos TED should use the 19 SPFs
developed for urban intersections and the 15 developed for rural intersections when using the tools in SafetyAnalyst Although the statewide SPFs are available for use by an analyst the specific regional models included in the final set of SPFs will predict crashes better than the statewide SPFs The regional analysis will not only ease the use of specific regional SPFs but will also be of benefit when predicting the potential for safety improvement of a specific site
4 For future similar SPF studies VDOTrsquos TED should be directly involved in screening the
traffic data for accuracy and consistency as was done in this study The direct involvement of the TED in the screening of the traffic data significantly contributed to the accuracy of the
42
data and greatly contributed to the confidence the researchers place on the data used in the study
5 The Virginia Transportation Research Council (VTRC) should conduct a study as soon as
feasible to verify whether incorporating independent variables for which data are available other than AADT such as intersection geometry and other characteristics will result in SPFs that better fit the Virginia data Although the currently suggested SafetyAnalyst SPFs use only the AADTs as the independent variables it is likely that provision will be made for use of SPFs that incorporate other independent variables such as number of approaches entering lanes and the other variables for which data are available as these SPFs are likely to give better fit to crash data
6 As soon as feasible VTRC should undertake a study to develop SPFs for the urban system
intersections which are not currently maintained by VDOT as these intersections may have different crash characteristics than those maintained by VDOT This would facilitate the use of SafetyAnalyst in programming sites that are currently not being maintained by VDOT
BENEFITS AND IMPLEMENTATION PROSPECTS
Significant benefits will be accrued by the use of the Virginia-specific SPFs developed in this study This is clearly illustrated in two ways First in examining the transferability of the suggested SPFs in SafetyAnalyst it is clear that these SPFs do not fit the Virginia data very well The results also indicate that the Virginia-specific SPFs fit the Virginia data much better than the suggested SafetyAnalyst SPFs Second the availability of the Virginia-specific SPFs will enhance the use of the EB procedure given in SafetyAnalyst for prioritizing sites for safety improvements This study has also shown that the EB method better identifies sites with higher potential for crash reduction than those identified by crash rates For example the illustrated examples given for the Bristol and Northern Virginia districts show that the potential reduction in FI crashes when the top 25 sites are identified by the EB method is 28936 (1496 + 27440) crashes per year whereas that obtained when the critical crash ratio method is used for prioritization is only 1963 (646 + 1317) and that obtained with the crash rate method is only 690 (432 + 258) crashes per year This gives a net benefit of 26973 potential crashes per year compared to the critical crash ratio method and 28246 compared to the crash rate method Assuming an average cost of FI crashes of $95629 (FHWA 2005) and only 10 of the estimated net benefit PSI of 28246 crashes per year is achieved the total savings of more than $27 million per year could be accrued The prospects for implementation of the recommendations are very high as the study was requested by VDOTrsquos TED which is planning to incorporate these SPFs in the use of the tools provided in SafetyAnalyst
43
ACKNOWLEDGMENTS
The authors appreciate the opportunity afforded them by VDOT and VTRC to conduct this study Special thanks to Stephen Read (VDOT) Dr In-Kyu Lim (VDOT) Dr Young-Jun Kweon (VTRC) and VDOTrsquos Central Office for their interest and support in SPFs and their help in the selection of intersection sites Many thanks to Lewis Woodson (VTRC) and James Hill (University of Virginia) for all their help and input throughout the study
REFERENCES Cogburn P VDOT Interagency Coordination 2007 Virginia Emergency Management
Conference Virginia Department of Transportation Richmond April 2007 Colorado Department of Transportation DTD Applied Research and Innovation Branch Safety
Performance Functions for Intersections CDOT-2009-10 Denver December 2009 Fridstroslashm L Ifver J Ingebrigtsen S Kulmala R and Thomsen LK Measuring the
Contribution of Randomness Exposure Weather and Daylight to the Variation in Road Accidents Counts Accident Analysis and Prevention Vol 27 No 1 1995 pp 1-20
Federal Highway Administration Cost of Crashes by Severity Table FHWA-HRT-05-051
Washington DC 2005 Federal Highway Administration SafetyAnalyst Home Page httpwwwsafetyanalystorg
Accessed February 2010 Garber N and Hoel L Traffic amp Highway Engineering 4th ed Cenage Learning Toronto
Canada 2009 Garber NJ Haas PR and Gosse C Development of Safety Performance Functions for Two-
Lane Roads Maintained by the Virginia Department of Transportation VTRC 10-R25 Virginia Transportation Research Council Charlottesville 2010
Hamidi A Fontaine MD and Demetsky MJ A Planning-Level Methodology for Identifying
High-Crash Sections of Virginiarsquos Primary System VTRC 11-R4 Virginia Transportation Research Council Charlottesville 2010
Harwood D Council FM Hauer E Hughes WE and Vogt A Prediction of the Expected
Safety Performance of Rural Two-lane Highways Federal Highway Administration McLean VA December 2000
Harwood DW Bauer KM Richard KR Gilmore DK Persaud B and Lyon C
Development of SPFs for Safety Analyst Interim Tools Technical Memorandum
44
Prepared by Midwest Research Institute for the Federal Highway Administration McLean VA 2004
ITT Corporation SafetyAnalyst Userrsquos Manual Turner-Fairbank Highway Research Center
McLean VA 2008 Jonsson T Ivan J and Zhang C Crash Prediction Models for Intersections on Rural
Multilane Highways Differences by Collision Type In Transportation Research Record Journal of the Transportation Research Board No 2019 Transportation Research Board of the National Academies Washington DC 2007 pp 91-98
Kweon Y-J and Lim I-K Appropriate Regression Model Types for the Empirical Bayes
Method and SafetyAnalyst In Proceedings of the 89th Annual Meeting of the Transportation Research Board Transportation Research Board of the National Academies Washington DC 2010
Kononov J Bailey B and Allery B Exploratory Examination of the Functional Form of
Safety Performance Functions of Urban Freeways Colorado Department of Transportation and San Diego State University Denver CO 2008
Lyon C Haq A Persaud B and Kodama S Safety Performance Functions for Signalized
Intersections in Large Urban Areas Development and Application to Evaluation of Left-Turn Priority Treatment In Transportation Research Record Journal of the Transportation Research Board No 1908 Transportation Research Board of the National Academies Washington DC 2005 pp 165-171
Lord D and Persaud B Estimating the Safety Performance of Urban Road Transportation
Networks Center for Transportation Safety Texas Transportation Institute Texas AampM University and Department of Civil Engineering Ryerson University College Station TX 2003 pp 609-620
Miaou S-P Lu A and Lum H S Pitfalls of using R2 to Evaluate Goodness of Fit of
Accident Prediction Models In Transportation Research Record Journal of the Transportation Research Board No 1542 Transportation Research Board of the National Academies Washington DC 2005 1996 pp 6-13
Miller P Re Negative R squared Email Archive Division of Biostatistics Washington
University in St Louis February 2 2005 February 2 2005 httpwwwbiostatwustleduarchiveshtmljmp-l2005msg00075html Accessed February 2010
Persaud B Lord D and Palmisano J Calibration and Transferability of Accident Prediction
Models for Urban Intersections In Transportation Research Record Journal of the Transportation Research Board No 1784 Transportation Research Board of the National Academies Washington DC 2002 pp 57-64
45
Persaud B and Nguyen T Disaggregate Safety Performance Models for Signalized Intersections on Ontario Provincial Roads In Transportation Research Record Journal of the Transportation Research Board No 1635 Transportation Research Board of the National Academies Washington DC 1998 pp 113-120
Pham T and Ragland D Summary of Crash Prediction Models Also known as Safety
Performance Functions (SPFs) California Partners for Advanced Traffic and Highways and University of California Berkeley Berkeley 2005
SAS Institute Inc SAS OnlineDoc Version Eight Cary NC
httpwwwtecnionacildocssasril Accessed 2009 Tegge RA Jo J-H and Ouyang Y Development and Application of Safety Performance
Functions for Illinois ICT-10-066 Illinois Center for Transportation University of Illinois Urbana-Champaign March 2010
Virginiarsquos Surface Transportation Safety Executive Committee Commonwealth of Virginiarsquos
Strategic Highway Safety Plan 2006-2010 Virginia Department of Transportation Richmond 2006
Washington S Persaud B Lyon C and Oh J Validation of Accident Models for
Intersections FHWA-RD-03-037 Federal Highway Administration McLean VA 2005
46
47
APPENDIX A
STATISTICAL PARAMETERS AND GOODNESS-OF-FIT RESULTS
Table A-1 Statistical Parameters for Urban Intersections SPFs Parameter Estimates
Data Intercept
Coefficient of Mayor AADT
Coefficient of Minor AADT
Subtype Site Intercept (α)
StndError
P value
lnMajor (β1)
StndError
P value
lnMinor (β2)
StndError
P value
Total VA -76234 048 lt0001 06742 005 lt0001 03453 003 lt0001
OR1 -83067 056 lt0001 07522 005 lt0001 0328 003 lt0001OR10 -123913 122 lt0001 10631 013 lt0001 04567 006 lt0001OR 100 -88553 077 lt0001 07825 007 lt0001 03706 004 lt0001FI VA -85256 057 lt0001 06477 006 lt0001 03579 004 lt0001OR1 -96546 063 lt0001 07603 006 lt0001 03597 004 lt0001OR10 -114284 15 lt0001 08662 016 lt0001 04412
Urban 4-Leg Signalized
OR 100 -99582 100 lt0001 07484 009 lt0001 04017 005 lt0001Total VA -60723 022 lt0001 04558 002 lt0001 0347 004 lt0001
OR1 -6059 044 lt0001 0505 004 lt0001 02773 006 lt0001OR10 -67031 057 lt0001 03986 007 lt0001 04999 009 lt0001OR 100 -65388 032 lt0001 04689 004 lt0001 043 006 lt0001FI VA -76917 032 lt0001 05001 003 lt0001 03695 005 lt0001OR1 -81437 060 lt0001 05813 005 lt0001 03188 008 lt0001OR10 -80333 063 lt0001 03446 007 lt0001 06218 010 lt0001
Urban 4-Leg Minor Stop Control
OR 100 -83166 051 lt0001 05253 006 lt0001 04695 008 lt0001Total VA -6543 082 lt0001 06591 008 lt0001 02119 002 lt0001
OR1 -4999 103 lt0001 05555 009 lt0001 01554 003 lt0001OR10 -96143 127 lt0001 08677 012 lt0001 03297 005 lt0001OR 100 -67518 110 lt0001 06157 011 lt0001 02969 005 lt0001FI VA -84268 068 lt0001 07147 006 lt0001 02481 002 lt0001OR1 -73982 099 lt0001 06496 009 lt0001 02088 003 lt0001OR10 -110104 155 lt0001 0908 015 lt0001 03226 006 lt0001
Urban 3-Leg Signalized
OR 100 -7266 107 lt0001 05508 011 lt0001 03107 006 lt0001Total VA -54696 013 lt0001 04874 002 lt0001 01985 001 lt0001
OR1 -5361 018 lt0001 04959 002 lt0001 01676 002 lt0001OR10 -5773 034 lt0001 04877 003 lt0001 02314 004 lt0001OR 100 -51642 021 lt0001 04338 003 lt0001 02309 003 lt0001FI VA -74642 018 lt0001 05791 002 lt0001 02091 002 lt0001OR1 -76877 027 lt0001 06204 003 lt0001 0181 002 lt0001OR10 -69458 047 lt0001 05096 004 lt0001 02212 005 lt0001
Urban 3-Leg Minor Stop Control
OR 100 -69883 031 lt0001 05169 004 lt0001 02308 003 lt0001 Standard Error
48
Table A-2 Statistical Parameters for Rural Intersections SPFs Parameter Estimates
Data Intercept
Coefficient of Mayor AADT
Coefficient of Minor AADT
Subtype Site Intercept (α)
StndError
P value
lnMajor (β1)
Stnd Error
P value
lnMinor (β2)
Stnd Error
P value
Total VA -69589 118 lt0001 06746 009 lt0001 0253 009 00047
OR1 -1604 237 04974 02284 021 02791 01514 012 0211 OR10 -63951 183 00005 05508 014 00001 03106 014 00224 OR 100 -06468 220 07692 02262 016 01635 -00158 017 09274 FI VA -87116 128 lt0001 07839 011 lt0001 02166 009 0013 OR1 -33285 246 01767 03601 024 0126 00597 013 06478 OR10 -80583 175 lt0001 06809 018 00001 02557 013 0057
Rural 4-Leg Signalized
OR 100 -48381 221 00287 04243 018 00193 01523 018 03943 Total VA -5494 020 lt0001 03533 002 lt0001 03935 003 lt0001
OR1 -62351 058 lt0001 04167 006 lt0001 04507 008 lt0001OR10 -53594 028 lt0001 03379 003 lt0001 03998 004 lt0001OR 100 -51255 027 lt0001 02914 003 lt0001 04075 004 lt0001FI VA -66927 030 lt0001 03899 003 lt0001 04156 004 lt0001OR1 -82561 095 lt0001 05221 009 lt0001 04962 012 lt0001OR10 -70797 044 lt0001 03789 004 lt0001 0497 005 lt0001
Rural 4-Leg Minor Stop Control
OR 100 -63326 038 lt0001 03223 004 lt0001 04424 005 lt0001Total VA -75754 084 lt0001 06465 008 lt0001 03332 008 lt0001
OR1 -58798 220 00075 05076 020 00143 0313 013 00161 OR10 -64368 110 lt0001 0544 011 lt0001 02863 006 lt0001OR 100 -9899 139 lt0001 08047 015 lt0001 04386 006 lt0001FI VA -87112 103 lt0001 07224 010 lt0001 02578 006 lt0001OR1 -9219 260 00004 07258 022 00011 03407 016 00326 OR10 -88607 146 lt0001 07059 016 lt0001 02809 008 00009
Rural 3-Leg Signalized
OR 100 -111835 185 lt0001 08669 018 lt0001 03977 008 lt0001Total VA -43293 008 lt0001 03366 001 lt0001 02087 001 lt0001
OR1 -50904 022 lt0001 0406 002 lt0001 02752 003 lt0001OR10 -40969 009 lt0001 03133 001 lt0001 02001 001 lt0001OR 100 -4231 016 lt0001 02997 002 lt0001 02308 003 lt0001FI VA -53415 011 lt0001 03394 001 lt0001 02237 001 lt0001OR1 -64457 031 lt0001 04195 003 lt0001 0307 004 lt0001OR10 -50831 014 lt0001 03245 002 lt0001 02014 002 lt0001
Rural 3-Leg Minor Stop Control
OR 100 -51046 024 lt0001 03163 003 lt0001 02112 003 lt0001
Standard Error
49
Table A-3 SPFs Goodness of Fit Results for Urban Northern Operational Region (No 1)
Data Estimation Data 70 Validation Data 30
Subtype Site MSE r2 R2FT MPB MAD MSPE R2
FT
Total VA 41150 0529 0557 -0760 4329 38490 0575
Total R1 4110 051 0551 -020 464 4486 054
FI VA 704 038 0406 -046 194 767 048
Urban 4-Leg Signalized
FI R1 809 039 0439 012 214 950 038
Total VA 224 031 0313 -003 090 238 029
Total R1 308 028 0286 008 095 200 032
FI VA 053 019 0193 000 043 053 019
Urban 4-Leg Minor Stop Control
FI R1 064 018 0187 003 043 048 021
Total VA 2490 038 0370 -064 352 2759 037
Total R1 3034 032 0305 -015 365 2687 037
FI VA 447 028 0259 -019 153 488 026
Urban 3-Leg Signalized
FI R1 559 025 0231 004 157 448 029
Total VA 185 025 0230 -004 089 204 024
Total R1 208 026 0239 -006 094 219 026
FI VA 043 015 0133 -002 043 048 016
Urban 3-Leg Minor Stop Control
FI R1 047 017 0156 -001 044 050 017
50
Table A-4 SPFs Goodness of Fit Results for Urban Western Operational Region (No 10)
Data Estimation Data 70 Validation Data 30
Subtype Site MSE r2 R2FT MPB MAD MSPE R2
FT
Total VA 41150 0529 0557 -0760 4329 38490 0575
Total R10 21976 0777 0735 1290 3233 17910 0686
FI VA 7043 0385 0406 -0458 1938 7671 0475
Urban 4-Leg Signalized
FI R10 4280 0526 0500 0377 1597 5170 0452
Total VA 2238 0315 0313 -0034 0897 2383 0292
Total R10 1161 0361 0300 -0032 0740 1050 0188
FI VA 0530 0194 0193 -0004 0432 0533 0194
Urban 4-Leg Minor Stop Control
FI R10 0312 0197 0187 0000 0382 0330 0009
Total VA 24900 0375 0370 -0645 3519 27591 0369
Total R10 14446 0451 0397 -0168 2801 24410 0255
FI VA 4467 0275 0259 -0185 1527 4875 0262
Urban 3-Leg Signalized
FI R10 3077 0266 0216 0039 1258 3390 0115
Total VA 1854 0254 0230 -0043 0893 2038 0239
Total R10 1391 0233 0197 -0054 0800 1640 0207
FI VA 0428 0151 0133 -0021 0431 0476 0157
Urban 3-Leg Minor Stop Control
FI R10 0354 0111 0089 -0019 0404 0380 0125
51
Table A-5 SPFs Goodness of Fit Results for Urban Eastern Operational Region (No 100)
Data Estimation Data 70 Validation Data 30
Subtype Site MSE r2 R2FT MPB MAD MSPE R2
FT
Total VA 41150 0529 0557 -0760 4329 38490 0575
Total R100 31108 0632 0630 0243 4717 37450 0005
FI VA 7043 0385 0406 -0458 1938 7671 0475
Urban 4-Leg Signalized
FI R100 5201 0480 0454 -0098 1864 5410 0244
Total VA 2238 0315 0313 -0034 0897 2383 0292
Total R100 1720 0443 0381 0087 0758 1150 0003
FI VA 0530 0194 0193 -0004 0432 0533 0194
Urban 4-Leg Minor Stop Control
FI R100 0509 0273 0254 0049 0383 0360 0173
Total VA 24900 0375 0370 -0645 3519 27591 0369
Total R100 17782 0410 0410 -1753 0908 38780 0004
FI VA 4467 0275 0259 -0185 1527 4875 0262
Urban 3-Leg Signalized
FI R100 3194 0243 0263 -0615 1645 5860 0236
Total VA 1854 0254 0230 -0043 0893 2038 0239
Total R100 1561 0233 0210 -0127 0902 2230 0002
FI VA 0428 0151 0133 -0021 0431 0476 0157
Urban 3-Leg Minor Stop Control
FI R100 0387 0131 0116 -0043 0444 0500 0141
52
Table A-6 SPFs Goodness of Fit Results for Rural Northern Operational Region (No 1)
Data Estimation Data 70
Validation Data 30
Subtype Site MSE r2 R2FT MPB MAD MSPE R2
FT
Total VA 10990 0353 0321 0513 2210 10070 -0073
Total R1 20080 0118 0092 -1389 3661 34220 0212
FI VA 2350 0196 0181 0045 1189 2600 -0034
Rural 4-Leg Signalized
FI R1 2920 0057 0052 -1173 1931 9760 0028
Total VA 1090 0182 0167 -0067 0794 1190 0171
Total R1 1990 0190 0245 0001 0942 1640 0173
FI VA 0480 0112 0098 -0022 0504 0530 0110
Rural 4-Leg Minor Stop Control
FI R1 0920 0093 0112 0020 0541 0520 0009
Total VA 5490 0328 0305 -0010 1651 5760 0179
Total R1 11110 0182 0254 -0679 2271 14750 0497
FI VA 1450 0181 0170 -0041 0902 1710 0099
Rural 3-Leg Signalized
FI R1 3230 0131 0153 -0116 1006 2120 0355
Total VA 0690 0144 0104 -0008 0613 0730 0102
Total R1 1210 0245 0196 0030 0712 0930 0126
FI VA 0250 0071 0048 -0009 0345 0260 0048
Rural 3-Leg Minor Stop Control
FI R1 0340 0124 0093 0016 0366 0300 0052
53
Table A-7 SPFs Goodness of Fit Results for Rural Western Operational Region (No 10)
Data Estimation Data 70 Validation Data 30
Subtype Site MSE r2 R2FT MPB MAD MSPE R2
FT
Total VA 10990 0353 0321 0513 2210 10070 -0073
Total R10 6020 0311 0268 0007 1748 6050 0382
FI VA 2350 0196 0181 0045 1189 2600 -0034
Rural 4-Leg Signalized
FI R10 1880 0158 0139 0097 0945 1590 0254
Total VA 1090 0182 0167 -0067 0794 1190 0171
Total R10 1300 0196 0163 0070 0760 1020 0078
FI VA 0480 0112 0098 -0022 0504 0530 0110
Rural 4-Leg Minor Stop Control
FI R10 0560 0142 0118 0025 0495 0480 0014
Total VA 5490 0328 0305 -0010 1651 5760 0179
Total R10 3690 0163 0170 -0432 0748 6740 0039
FI VA 1450 0181 0170 -0041 0902 1710 0099
Rural 3-Leg Signalized
FI R10 0890 0124 0117 -0391 0997 4030 -0066
Total VA 0690 0144 0104 -0008 0613 0730 0102
Total R10 0640 0126 0091 0025 0583 0580 0055
FI VA 0250 0071 0048 -0009 0345 0260 0048
Rural 3-Leg Minor Stop Control
FI R10 0240 0062 0041 0003 0335 0230 0028
54
Table A-8 SPFs Goodness of Fit Results for Rural Eastern Operational Region (No 100)
Data Estimation Data 70 Validation Data 30
Subtype Site MSE r2 R2FT MPB MAD MSPE R2
FT
Total VA 10990 0353 0321 0513 2210 10070 -0073
Total R100 10120 0042 0027 1207 1882 5120 -0307
FI VA 2350 0196 0181 0045 1189 2600 -0034
Rural 4-Leg Signalized
FI R100 2060 0053 0039 0119 0962 1370 -0023
Total VA 1090 0182 0167 -0067 0794 1190 0171
Total R100 0960 0170 0149 -0086 0746 1140 0209
FI VA 0480 0112 0098 -0022 0504 0530 0110
Rural 4-Leg Minor Stop Control
FI R100 0440 0106 0092 -0031 0475 0490 0121
Total VA 5490 0328 0305 -0010 1651 5760 0179
Total R100 2770 0492 0459 0601 1759 6260 0090
FI VA 1450 0181 0170 -0041 0902 1710 0099
Rural 3-Leg Signalized
FI R100 1040 0265 0255 0124 0923 1570 -0055
Total VA 0690 0144 0104 -0008 0613 0730 0102
Total R100 0640 0125 0087 -0037 0601 0690 0119
FI VA 0250 0071 0048 -0009 0345 0260 0048
Rural 3-Leg Minor Stop Control
FI R100 0250 0064 0038 -0013 0345 0270 0062
55
APPENDIX B
RECOMMENDED SAFETY PERFORMANCE FUNCTION MODELS
Table B-1 Recommended Urban SPFs Site Virginia SPF Models to Be Used for Urban Intersections
Urban 4-Leg Signalized Total Virginia generic total
Urban 4-Leg Signalized
Operational Region 1 generic total
Urban 4-Leg Signalized
Operational Region 10
use specified model developed
Urban 4-Leg Signalized
Operational Region 100 generic total
Urban 4-Leg Signalized FI Virginia generic FI
Urban 4-Leg Signalized
Operational Region 1 generic FI
Urban 4-Leg Signalized
Operational Region 10
use specified model developed
Urban 4-Leg Signalized
Operational Region 100
use specified model developed
Urban 4-Leg Minor Stop Control
Total Virginia generic total
Urban 4-Leg Minor Stop Control
Operational Region 1
use specified model developed
Urban 4-Leg Minor Stop Control
Operational Region 10
use specified model developed
Urban 4-Leg Minor Stop Control
Operational Region 100
use specified model developed
Urban 4-Leg Minor Stop Control
FI Virginia generic FI e^-76917MajADT^05001MinADT^03695
Urban 4-Leg Minor Stop Control
Operational Region 1
use specified model developed
Urban 4-Leg Minor Stop Control
Operational Region 10
use specified model developed
Urban 4-Leg Minor Stop Control
Operational Region 100
use specified model developed
56
Table B-1 Recommended Urban SPFs (Continued)
Site Virginia SPF Models to Be Used for Urban Intersections
Urban 3-Leg Signalized
Total Virginia
use generic model developed for total
crashes
Urban 3-Leg Signalized
Operational Region 1
use generic model developed for total
crashes
Urban 3-Leg Signalized
Operational Region 10
use specific regional model
developed
Urban 3-Leg Signalized
Operational Region 100
use generic model developed for total
crashes
Urban 3-Leg Signalized FI Virginia
use generic model developed for FI
crashes
Urban 3-Leg Signalized
Operational Region 1
use generic model developed for FI
crashes
Urban 3-Leg Signalized
Operational Region 10
use specific regional model
developed
Urban 3-Leg Signalized
Operational Region 100
use generic model developed for FI
crashes
Urban 3-Leg Minor Stop Control
Total Virginia
use generic model developed for total
crashes
Urban 3-Leg Minor Stop Control
Operational Region 1
use generic model developed for total
crashes
Urban 3-Leg Minor Stop Control
Operational Region 10
use specific regional model
developed
Urban 3-Leg Minor Stop Control
Operational Region 100
use generic model developed for total
crashes
Urban 3-Leg Minor Stop Control
FI Virginia use generic model developed for FI
crashes
Urban 3-Leg Minor Stop Control
Operational Region 1
use generic model developed for FI
crashes
Urban 3-Leg Minor Stop Control
Operational Region 10
use specific regional model
developed
Urban 3-Leg Minor Stop Control
Operational Region 100
use generic model developed for FI
crashes
57
Table B-2 Recommended Rural SPFs Site Virginia SPF Models to Be Used for Rural Intersections
Rural 4-Leg Signalized Total Virginia
use generic model developed for total
crashes
Rural 4-Leg Signalized
Operational Region 1
use generic model developed for total
crashes
Rural 4-Leg Signalized
Operational Region 10
use specific regional model developed
Rural 4-Leg Signalized
Operational Region 100
use specific regional model developed
Rural 4-Leg Signalized FI Virginia use generic model
developed for FI crashes
Rural 4-Leg Signalized
Operational Region 1
use generic model developed for FI crashes
Rural 4-Leg Signalized
Operational Region 10
use specific regional model developed
Rural 4-Leg Signalized
Operational Region 100
use specific regional model developed
Rural 4-Leg Minor Stop Control Total Virginia
use generic model developed for total
crashes
Rural 4-Leg Minor Stop Control
Operational Region 1
use generic model developed for total
crashes e^-549MajADT^035MinADT^039
Rural 4-Leg Minor Stop Control
Operational Region 10
use specific regional model developed
Rural 4-Leg Minor Stop Control
Operational Region 100
use generic model developed for total
crashes
Rural 4-Leg Minor Stop Control FI Virginia use generic model
developed for FI crashes
Rural 4-Leg Minor Stop Control
Operational Region 1
use generic model developed for FI crashes
Rural 4-Leg Minor Stop Control
Operational Region 10
use generic model developed for FI crashes
Rural 4-Leg Minor Stop Control
Operational Region 100
use generic model developed for FI crashes
58
Table B-2 Recommended Rural SPFs (Continued)
Site Virginia SPF Models to Be Used for Rural Intersections
Rural 3-Leg Signalized Total Virginia use generic model
developed for total crashes
Rural 3-Leg Signalized
Operational Region 1
use generic model developed for total crashes
Rural 3-Leg Signalized
Operational Region 10
use generic model developed for total crashes
Rural 3-Leg Signalized
Operational Region 100
use generic model developed for total crashes
Rural 3-Leg Signalized FI Virginia use generic model
developed for FI crashes
Rural 3-Leg Signalized
Operational Region 1
use generic model developed for FI crashes
Rural 3-Leg Signalized
Operational Region 10
use generic model developed for FI crashes
Rural 3-Leg Signalized
Operational Region 100
use generic model developed for FI crashes
Rural 3-Leg Minor Stop Control Total Virginia use generic model
developed for total crashes
Rural 3-Leg Minor Stop Control
Operational Region 1
use generic model developed for total crashes
Rural 3-Leg Minor Stop Control
Operational Region 10
use specific regional model developed
Rural 3-Leg Minor Stop Control
Operational Region 100
use generic model developed for total crashes
Rural 3-Leg Minor Stop Control FI Virginia use generic model
developed for FI crashes
Rural 3-Leg Minor Stop Control
Operational Region 1
use generic model developed for FI crashes
Rural 3-Leg Minor Stop Control
Operational Region 10
use specific regional model developed
Rural 3-Leg Minor Stop Control
Operational Region 100
use generic model developed for FI crashes

4
METHODS
Ten tasks were performed to achieve the study objectives 1 Conduct a literature review 2 Select study sites 3 Extract crash data 4 Extract AADT data 5 Evaluate the transferability to Virginia of the suggested Minnesota SPFs 6 Develop specific SPFs for Virginia 7 Evaluate the Virginia SPFs developed 8 Determine the appropriate number of SPFs for Virginia through a pruning process 9 Prioritize sites based on potential for crash reduction 10 Evaluate benefits and implementation prospects
Literature Review
Recent publications related to the development and evaluation of SPFs for different highway systems were identified and reviewed so as to identify information of relevance to this study Sources used were the Transportation Research Information System (TRIS) the VDOT Research Library and the University of Virginia libraries
Selection of Study Sites
The research team in consultation with staff from VDOTrsquos Traffic Engineering Division
(TED) initially selected 21112 intersections under the jurisdiction of VDOT for the study These included all intersections for which the location was properly identified by an intersection node and for which geometric characteristics remained the same throughout the study period of 2003 through 2007 The required geometric traffic and crash data for each site were then extracted from the relevant databases The data were obtained primarily from the Highway Traffic Records Information System (HTRIS) HTRIS is a comprehensive Oracle database system which interrelates and consolidates Virginiarsquos highway and traffic information used for internal management and reporting VDOT maintains detailed records on current and historical roadway crash and traffic information in HTRIS For this reason only VDOT-maintained roads were used for analysis This database system contains multiple subsystems three of which were used to extract data for this study roadway inventory (RDI) for intersection configuration and type of control accident (ACC) for crash counts and highway performance monitoring system (HPMS) for AADTs Using the available data each intersection was classified based on the area type (urban or rural) the traffic control system (signalized stop control or yield control) and the configuration (number of approaches) Intersections for which all the data requirements for proper classification were not available were deleted from the list of study sites
The classification of an intersection as urban or rural was based on VDOTrsquos classification
of each approach route Intersections with all approaches designated as rural were classified as
5
rural and those with all approaches designated as urban were classified as urban Intersections with urban and rural approaches were removed from the list of study sites to minimize the uncertainty A data quality analysis was also performed to ascertain that the AADT values for all approaches of each intersection and for each year of the study period were available Intersections with incomplete data were removed from the study including yield all-way stop and intersections with five approaches This resulted in 18356 intersections classified as urban or rural as shown in Table 3
Virginia is divided into five operational regions as shown in Figure 2 After consultation
with VDOT and the technical review panel the different topographical characteristics in Virginia were then used to group the intersections into three regional groups as Northern Western and Eastern The Northern region is composed of intersections in Northern Virginia and surrounding counties the Western region is considered to have a mountainous terrain and the Eastern region is considered to have rolling to flat terrain Table 3 also shows the specific districts and counties in each of the three regions used in this study This regional classification helped to partially account for different characteristics that are encountered throughout the state
Table 3 Urban and Rural Classification Operational Region Districts Urban Rural Total
Northern (No 1)
District 9 (NOVA) + Culpeper (023) Fauquier County (030) King George County (048) Madison County (056) Orange County (068) Rappahannock County (078) Spotsylvania (088) Stafford County (089)
4620 596 5216
Western (No 10)
District 1 (Bristol) District 2 (Salem) District 3 (Lynchburg) District 8 (Staunton) + Albemarle County (002) Fluvanna County (032) Greene County (039) Louisa County (054)
1197 6706 7903
Eastern (No 100)
District 4 (Richmond) and District 5 (Hampton Roads) + Caroline County (016) Essex County (028) Gloucester County (036) King amp Queen County (049) King William (050) Lancaster County (051) Mathews County (057) Middlesex County (059) Northumberland County (066) Richmond County (079) Westmoreland County (096)
2193 3044 5237
Total 8010 10346 18356 Proportion () 4364 5636 100 Alternative method of identifying regions for easy application of the SAS code No 1 = Northern region No 10 = Western region No 100 = Eastern region
6
Figure 2 Virginia Operational Regions (Cogburn 2007)
The study considered urban and rural intersections with urban consisting of 8010 intersections and rural consisting of 10346 intersections as shown in Table 4
The intersections were also divided by their configuration (number of approaches) and
the type of traffic control (signalized or minor stop control) The number of urban intersection sites for each category is shown in Table 5 and that for rural intersections in Table 6 The total number of rural four-leg signalized and rural three-leg signalized sites is much lower than that for the urban signalized intersections However this is expected as a much lower percentage of rural intersections are signalized In addition all-way stop intersections were excluded because of the low number at the time of the study
Table 4 Proportion of Urban and Rural Sites by Region
Operational Region Urban Proportion () Rural Proportion () Northern 4620 5768 596 5760 Western 1197 1494 6706 64817 Eastern 2193 2738 3044 29423 TOTAL 8010 100 10346 100
Table 5 Distribution of Urban Sites by Geometric Configuration
Operational Region Urban 4-leg Signalized
Urban 4-leg 2-Way Stop
Urban 3-leg Signalized
Urban 3-leg Minor Stop Total
Northern 371 766 497 2986 4620 Western 53 153 137 854 1197 Eastern 144 320 202 1527 2193 TOTAL 568 1239 836 5367 8010 Proportion () 709 1547 1044 6700 100
7
Table 6 Distribution of Rural Sites by Geometric Configuration
Operational Region Rural 4-leg Signalized
Rural 4-leg 2-Way Stop
Rural 3-leg Signalized
Rural 3-leg Minor Stop Total
Northern 19 67 13 497 596 Western 90 894 117 5605 6706 Eastern 73 609 53 2309 3044 TOTAL 182 1570 183 8411 10346 Proportion () 176 1517 177 8130 100
Crash and Operational Data Collection
As previously discussed HTRIS serves as a centralized warehouse of traffic and roadway data for Virginia and is composed of various subsystems that carry distinct data RDI ACC and HPMS were the three subsystems used to extract the necessary data for the study
VDOTrsquos TED staff extracted the crash data by using the ACC database for the years
2003 through 2007 The ACC database is composed of data derived from the crash report forms (DMV FR300) that are filled out by police officers and include data such as driverrsquos actions driver characteristics environmental conditions collision type and crash severity among other factors The database developed for this study included total fatal injury and property damage only (PDO) (property damage greater than $1000) crashes that occurred within a distance of 250 feet or 0047 mile of the intersection which matches the procedure used to develop the suggested SPFs in SafetyAnalyst The RDI database was used to identify the intersection ID or node number for the urban and rural intersection sites that had the same geometric conditions throughout the 5 years selected for the study
A Structured Query Language (SQL) program was developed for retrieving and
formatting the required data for the analysis This query specified the intersection node configuration approach volumes urbanrural classification crashes and traffic control device for each year of the study period The Statistical Analysis Software SAS (913) was then used to format the data in a way suitable for the analysis (SAS Institute Inc 2009)
Annual Average Daily Traffic Selection
The major and minor AADTs were used as the independent variables in developing the SPFs for intersections in Virginia in accordance with the SPFs developed for SafetyAnalyst (Harwood et al 2004) It was therefore necessary to identify the major and minor approaches at each intersection In determining the major and minor AADTs it was recommended by VDOT that for four-leg approaches the major entering volume should be the sum of the two highest approach volumes and the minor entering volume the sum of the two lowest approach volumes For three-leg approaches the major entering volume was the sum of the two highest approach volumes The highway performance monitoring system database was used to obtain the AADTs for the selected study sites
8
Evaluation of Recommended Minnesota SPFs
Once all of the necessary data were obtained for each of the study sites the SafetyAnalyst-recommended SPFs which are based on data for intersections in Minnesota were tested to determine how well they fit the Virginia data Both graphical and statistical methods were used to conduct these tests The graphical method consisted of a visual inspection of the spread of the Virginia data for a specific configuration of intersection and the actual crashes of a given severity plotted with the resultant curve from using the same Virginia database and the corresponding recommended Minnesota SPF The statistical test consisted of computing the Freeman-Tukey RFT 2 coefficients for the recommended SPFs using the appropriate Virginia data The RFT
2 coefficient was used as this was the statistical parameter used to represent the goodness of fit (ITT Corporation 2008) in developing the SafetyAnalyst-recommended SPFs Equations 1 2 and 3 show how the data were transformed to compute the RFT
2 (Fridstroslashm et al 1995) fi = ( yi )05 + ( yi +1 )05 (Eq 1) ecirci = fi ndash ( 4 times ŷi + 1 )05 (Eq 2) RFT
2 = 1 ndash sumiecirci2 sumi( fi ndash fm )2 (Eq 3)
where fi = Freeman-Tukey transformation statistic yi = observed data at site i ecirci = residual at site i ŷi = modeled (predicted) value at site i fm= mean of the transformation statistic (fi) across all sites of the same configuration and urbanrural classification RFT
2 = Freeman-Tukey R2
Developing Virginia-Specific SPFs
The format of the specific SPFs developed for Virginia is the same as that in the
SafetyAnalyst manual and given as
1 2k e x MajAADT x MinAADTβ βα= (Eq 4) where
k = predicted crash frequency per intersection per year MajAADT = AADT on the major road (vehday) MinAADT = AADT on the minor road (vehday) α = intercept
9
β1 = coefficient of major AADT β2 = coefficient of minor AADT
In developing the SPFs a negative binomial (NB) distribution for the crash data was
used as preliminary analysis showed that the data fit the NB distribution The form of the data used to develop the SPFs can be either the panel or cross-sectional (collapsed) format According to Kweon and Lim (2010) the panel format uses original panel data which consist of assembling several years of data over the same intersection and the cross-sectional models use pseudondashcross-sectional data which are data converted or rearranged from the panel set The difference between the two types of models obtained is that the model based on the panel data form takes advantage of the characteristics of the panel data by positioning a predefined correlation structure on reciprocated measures over years at the same time whereas the model based on the cross-sectional form uses the data created by collapsing the multi-year panel data into apparently a single-year panel data The crash data were divided into the estimation and validation portions Seventy percent was selected randomly and used as the estimation data to develop the SPFs and the remaining 30 was used as the evaluation data
An estimation of acceptable values was made for the regression coefficients and the
dispersion parameter when developing the SPFs for the EB method in SafetyAnalyst The regression coefficients are critical for the comparison of different SPFs The dispersion parameter (d) is important when using the EB method in SafetyAnalyst because it plays an integral function in computing the EB weight that influences the estimate of the EB long-term predicted crashes When determining the dispersion parameter from SAS for the urban four-leg signalized intersections the values obtained were d = 02223 for the panel data and d = 02216 for the collapsed data but when determining the values for the urban four-leg two-way stop intersections the values calculated were d = 04284 for panel data and d = 02518 for collapsed data In the urban four-leg two-way stop intersections a significant difference in the d values was observed which led to the choice of panel data for the modeling as they would be more reliable than the collapsed data By looking at the obtained values it can be appreciated that the collapsed model underestimates the dispersion which will eventually cause the EB value to inflate therefore leading to a biased report for the collapsed model
Generalized linear modeling (GLM) was used to create a correlation between the intersection crashes for the 5 years chosen for analysis and the major and minor approach volumes For the statistical modeling SAS was employed (SAS Institute Inc 2009) This software includes the GENMOD procedure and the equation used is the same as given in Equation 5 The GENMOD procedure gives an output of generalized estimating equations (GEE) parameter estimates which are the ones used to develop the Virginia SPFs
1 2exp( )it itk MajAADT MajAADTα β β ε= + + + (Eq 5) where i = intersection index (i = 1hellip N) t = severity index (t = TOT [total crashes] FI [fatal + injury crashes] PDO [property damage only])
10
α = intercept β1 = coefficient of major AADT β2 = coefficient of minor AADT
itk = dependent variable at intersection i and severity t (crashesyr) νit = random error exp (νit) Gamma (θ θ) εit = random (residual) error in GEE
The random errors presented in this equation have the function of not letting the β values or coefficients become biased
Evaluation of Virginia-Specific SPFs
Several statistical parameters were used to assess how well the Virginia SPFs fit the data The parameters used and suggested by Washington et al (2005) were the mean prediction bias (MPB) the mean absolute deviation (MAD) the mean square error (MSE) the mean squared prediction error (MSPE) the Pearsonrsquos product moment correlation coefficients between observed and predicted crash frequencies (used for both validation and estimation data) dispersion parameters and the Freeman Tukey RFT
2 coefficients computed from Equation 3 To test the fit of the SPFs the 70 estimation data set was used to calculate the MSE the Pearsonrsquos product moment correlation coefficients the R2 and the R2
FT To test the transferability of the SPFs the 30 validation data set was used to compute the MPB MAD and the MSPE The expressions used to determine these coefficients are given in Equations 6 through 10
( )2
iin
1i
nYYMPB
2 minussum= = (Eq 6)
2
n
1i ii
n
YYMAD
2sum=minus
= (Eq 7)
( )
pnYY
MSE1
n
1i
2
ii2
minus
minus= sum = (Eq 8)
( )
2
n
1i
2
ii
nYY
MSPE2sum=
minus= (Eq 9)
where p = degrees of freedom i = intersection index Yi = observed crash frequency at intersection i Ŷi = predicted crash frequency at intersection i
11
n2 = validation data sample size 30 n1 = estimation data sample size 70
(Eq 10) where
_
1Y = average of observed crashes per intersections _
2Y = average of predicted crashes per intersections Yi1 = observed values at intersection i Y i2 = predicted values at intersection i
It should be noted that when values obtained from the MPB MAD MSE and MSPE
formulas are close to 0 it indicates a good fit or desirable SPF and when values for the RFT2 and
R2 formulas are close to 1 it indicates a suitable fit The dispersion parameter (d) is used in the variance-mean relationships as shown in Equations 11 and 12
(Eq 11)
( ) ( ) ( )i i i i i iVar Y X E Y X d x E Y X= + (Eq 12) A weighting factor (Wi) used in the EB procedure is obtained from Equation 13 and used in Equation 14 to obtain the EB-estimated value
( )1
1ii i
Wd x E Y X
=+
(Eq 13)
( ) ( ) ( )1EB i i i i i i iE E y y W x E Y X W x Y= + minus (Eq 14)
where 0 lt W lt 1 Var (|) = conditional variance E (|) = conditional mean Var m or Var (Yi|Xi) = estimated variance of mean crash rate E m or E (Yi|Xi) = estimated mean crash rate from SPF d = estimated NB dispersion parameter (also called overdispersion parameter)
2Var m E m d x E m= +
( )( )( ) ( )
1 1 2 21 22 2
1 21 2
i i
i i
Y Y Y Yr
Y Y x Y Y
sum minus minus=⎡ ⎤sum minus sum minus⎢ ⎥⎣ ⎦
12
W = weight Xi = variables such as AADT Yi = number of observed crashes per year at intersection i EEB = EB-adjusted estimated crashes (crashesyr)
In the variance-mean relationship if the value obtained for the dispersion parameter d is 0 then the variance is the same as the mean (see Equations 11 and 12) which causes the NB model to collapse to the Poisson model This parameter has a strong influence on the weight in the EB formula (see Eq 13) therefore it has an effect in the EB-estimated value SAS was helpful in computing this parameter for the different types of intersections analyzed in the study throughout the 5 years
Pruning Process
Before the site prioritization was performed pruning was done to avoid over-representation of the SPFs that might not reflect much difference in the study when compared with statewide SPFs At the completion of the pruning process only the necessary or minimum effective SPFs were retained MSPE is typically the parameter used to assess errors associated with a validation data set for this reason MSPE was used for pruning In order to verify whether a specific regional SPF should be retained or not the validation data set (30 of the data) was used to compute MSPE for both the specific regional SPFs and the corresponding statewide SPFs If MSPE for the regional SPF was greater than that for the corresponding Virginia statewide SPF or if the difference between these two MSPEs was less than 10 it was concluded that the regional SPF was not necessary and it was therefore discarded The following example illustrates the steps for urban four-leg signalized FI crashes in Region 1
1 The 30 FI crash data were obtained for urban signalized four-leg intersections in Region 1 and the MSPE was determined using the statewide SPF for the FI urban four-leg signalized intersections
2 The 30 FI crash data for urban signalized four-leg intersections in Region 1 were
then used to determine MSPE for the specific Region 1 SPF for FI crashes 3 Verify if the MSPE value for the specific regional SPF is higher than the statewide
MSPE value if yes discard the specific regional SPF if no tentatively retain the specific regional model
4 The difference between the two MSPEs was determined to determine whether it was
less than 10 of the statewide MSPE if yes discard the specific regional SPF if no retain the specific regional model This process was repeated for all regional SPFs
13
Identification of Intersections with a Higher Than Expected Number of Crashes
In order to identify some of the intersections with a higher than expected number of crashes a prioritization analysis based on the EB method was conducted This analysis was carried out to identify the top 25 intersections with a high PSI in the urban areas of the Northern Virginia and Bristol districts These two districts were selected to identify any effect of the approach AADTs as two-lane roads in the Northern Virginia District carry much higher volumes than those in the Bristol District The PSI is the difference between the EB-adjusted long-term crashes and the SPF-estimated crashes The PSI was first determined and then a priority list was developed with intersections showing a higher PSI receiving a higher priority This procedure first required the computation of yearly calibration factors (Cy) that accounted for intrinsic yearly variations that were not accounted for in developing the SPFs These yearly calibration factors were determined using the steps described here and given in Equations 15 through 18 (ITT Corporation 2008) Calculation of Yearly Calibration Factor (Cy) For subtype s and severity t the following steps were performed 1 Calculate the (unadjusted) predicted number of crashes using the appropriate SPF yiMinAADTMajAADTe ststst
isyisyisty amp~ 21ˆˆˆ foralltimestimes= ββακ (Eq 15)
2 Sum the predicted numbers over all intersections
ysN
iistysty forall=sum
=
~~1κκ (Eq 16)
3 Sum the observed numbers of crashes over all intersections
yKKsN
iistysty forall=sum
=
1
(Eq 17)
4 Calculate yearly calibration factor csty
yK
csty
stysty forall= ~κ (Eq 18)
5 Repeat the steps for all subtypes (s) and severities (t)
where i = intersection index (i = 1hellip N)
14
s = subtype index (s = urban four-leg signalized intersection rural three-leg minor stop controlled intersection etc) t = severity index (t = TOT [total crashes] FI [fatal + injury crashes] PDO [property damage only]) y = year index (i = 1 [base year] 2 hellip Y) csty = yearly calibration factor for crash subtype s severity t and year y MajAADT = AADT on the major road (vehday) MinAADT = AADT on the minor road (vehday)
istyκ~ = (unadjusted) predicted number of crashes at intersection i for crash subtype s severity t and year y
istyκ = (adjusted) predicted number of crashes at intersection i for crash subtype s severity t and year y α = intercept
1β = coefficient of major AADT 2β = coefficient of minor AADT
These yearly calibration factors were then used to determine the predicted number of
crashes at an intersection based on the SPF for the severity of crashes and type of intersection being considered The PSI for each intersection was then determined using the steps described in Equations 19 through 22 (ITT Corporation 2008) Steps for Calculating PSI for Subtype s
1 Calculate the (adjusted) predicted number of crashes
amp~
21ˆˆˆ ststst
isyisysty
istystyisty
MinAADTMajAADTec
yticββα
κκ
timestimestimes=
foralltimes= (Eq 19)
2 Calculate yearly correction factor Cisty
ytiCyist
istyisty amp
)1(
forall==κ
κ
(Eq 20)
3 Calculate EB weight
tid
w Y
y istystist amp
11
1
foralltimes+
=sum =
κ (Eq 21)
4 Calculate the EB-adjusted estimated number of crashes for year 1
15
tiC
KwwX Y
y isty
Y
y istyistyististyist amp)1(
1
1)1()1( forallminus+times=
sumsum
=
=== κ (Eq 22)
5 Determine the PSI for each intersection If istYX gt istYκ include intersection i in the list for prioritization using istYPSI = istYX
where i = intersection index (i = 1hellip N) s = subtype index (s = urban four-leg signalized intersection rural three-leg minor stop
controlled intersection etc) t = severity index (t = TOT [total crashes] FI [fatal + injury crashes] PDO [property damage
only]) y = year index (y = 1 [base year] 2 hellip Y) cy = yearly calibration factor for crash subtype s severity t and year y d = dispersion parameter w = weight MajAADT = AADT on the major road (vehday) MinAADT = AADT on the minor road (vehday) PSI = potential for safety improvement
istyC = yearly correction factor
istyκ~ = (unadjusted) predicted number of crashes at intersection i for crash subtype s severity t and year y
istyκ = (adjusted) predicted number of crashes at intersection i for crash subtype s severity t and year y
istyX = EB-adjusted estimated number of crashes α = intercept
1β = coefficient of major AADT 2β = coefficient of minor AADT
The prioritization lists for urban two-lane roads in the Northern Virginia and Bristol
districts were then developed based on the PSIs obtained for three prioritization procedures These alternative prioritization procedures were the average crash rates (ACRs) for the study period (see Equation 23) the critical crash ratio (CCR) (see Eqs 24 through 27) (Garber and Hoel 2009) and the EB method The list was developed with the intersections having the highest PSI listed first followed by other intersections in descending order The execution of the EB method prioritization process was achieved through use of the computer codes in SAS Finally the effectiveness of using the EB method for prioritizing sites for safety improvement was illustrated by comparing the PSIs from using intersection crash rates critical crash and the EB procedures
16
Procedure for Crash Rate Method The ACR for the intersection is given as
( )(1000000)( )( )(365)T
TCACRN V
= (Eq 23)
where ACR = the average crash rate for the intersection under consideration (crashes1000000
approach volume) TC = number of crashes over the study period at the intersection N = duration of study period (yr) VT = average daily total approach volume at the intersection Procedure for Critical Rate Method
The critical rate method was accomplished by first computing the traffic base (TB) of the intersection under consideration using Equation 24 The ACR for the intersection under consideration is then computed using its TB as shown in Equation 25 The intersection critical crash rate (ICCR) is then determined using Equation 26 The critical crash ratio (CCR) for the intersection is then computed as the ratio of ICR and the average crash rate (AVR) for all intersections under the same category (intersection type urbanrural etc) as that for the intersection being considered using Equation 27 TB is given as
365
1 000 000
NxVxTB = (Eq 24)
where TB = the total approach volume over the study period of N years at the intersection under consideration (veh1000000) V = average daily approach volume at the intersection under consideration ACR is obtained as
TCACRTB
= (Eq 25)
where ACR = ACR at the intersection under consideration over the study period of N years
17
TB = the total approach volume over the study period of N years at the intersection under consideration (veh1000000) The critical crash rate (ICCR) for the intersection under consideration is given as
05 AVRICCR AVR TFTB TB
= + + (Eq 26)
where AVR = ACR for intersections within the state and of the same designation (eg rural three-leg with minor stop control) as that for the intersection under consideration TF = number of standard deviations for the confidence level being used in the analysis (usually 196 for 95 confidence level) TB = the total approach volume over the study period of N years at the intersection under consideration (veh1000000) The critical crash ratio (CCR) for the intersection is then obtained as
ACRCCRICCR
= (Eq 27)
where ACR = ACR at the intersection under consideration over the study period of N years (see Eq 2) ICCR = critical crash rate for the intersection under consideration (see Eq 26)
Benefits and Implementation Expectations
The expected benefits from developing SPFs and prioritizing intersection sites were illustrated by comparing the PSIs for the prioritized sites when sites were prioritized using the EB method with those obtained when sites were prioritized using crash rates and the critical crash ratio This analysis was conducted for the combined fatal plus injury crashes SPFs An estimate of the cost savings attributable solely to the potential reduction of crashes was also computed by using crash costs given in an FHWA study (FHWA 2005)
18
RESULTS AND DISCUSSION
Literature Review
SafetyAnalyst
The SafetyAnalyst Userrsquos Manual (ITT Corporation 2008) has SPFs that are suggested for intersections that are based on Minnesota data Tables 7 and 8 show the regression coefficients (α β1 and β2) for the SPFs developed for total and combined FI crashes respectively The values for the goodness of fit parameter RFT
2 are also given Although these RFT2 are all less
than 045 with a few less than 010 it has been suggested that the SPFs used in SafetyAnalyst could provide a realistic estimate of an expected crash frequency as a function of traffic volume and roadway geometry (Pham and Ragland 2005)
Methodological and Research References
Several studies similar to this study have been conducted in Canada Colorado California Texas New York and Minnesota For example a study was conducted using data from Colorado California and Texas to examine the functional form of the SPFs for urban freeways (Kononov et al 2008) Five years of crash data were acquired from the respective departments of transportation and the highway safety information system from Colorado The study revealed that the amount of crashes increased moderately with congestion in segments on urban freeways This study however did not include intersections
A study by Lyon et al was conducted in Toronto Ontario Canada to develop SPFs for urban signalized intersections (Lyon et al 2005) Collision data were gathered for five years and included 1950 urban intersections SPFs were developed for different severity levels impact types and intersection types such as four-leg and three-leg intersections The format used to develop the SPFs is shown in Equation 28 This format is somewhat different from that of Equation 4 suggested in Safety Analyst
Collisionsyear = α (F1)β1(F2)β2 exp (β3X1 + β4X2 + ) (Eq 28) where α and βi = the coefficients estimated in the SPF calibration process F1 and F2 = the entering AADTs on the major and minor roads respectively Xi = other independent variables (such as single lane versus multilane approaches with and without left-turn lanes or right-turn lanes high and low pedestrian activities or in some cases F1 or F2 or both)
19
Table 7 SafetyAnalystrsquos SPFs for Intersections (Total Crashes) Site
subtype Code
Site subtype Description
State Regression coefficients
LogIntercept (α)
Regression coefficients
LogAADTmaj (β1)
Regression coefficients LogAADT
min (β2)
Over - dispersion Parameter
(k)
RFT2
() Number of Sites
Max AADTmaj
(vehday)
Max AADTmin
(vehday)
Rural 201 Rural 3-leg with minor-
road STOP control MN -878 071 024 107 133 1706 28500 27000
202 Rural 3-leg with all-way STOP control
MN -1237 122 027 047 41 41 25300 6803
203 Rural 3-leg with signal control
MN -657 066 02 033 26 136 36400 11500
204 Rural 4-leg with minor-road STOP control
MN -896 065 047 07 299 2114 35500 26700
205 Rural 4-leg with all-way STOP control
MN -1237 122 027 047 41 41 25300 6803
206 Rural 4-leg with signal control
MN -657 066 02 033 26 136 36400 11500
Urban 251 Urban 3-leg with minor-
road STOP control MN -535 034 028 128 59 397 68000 18900
252 Urban 3-leg with all-way STOP control
MN -1237 122 027 047 41 41 25300 6803
253 Urban 3-leg with signal control
MN -985 097 018 023 414 33 50000 25807
254 Urban 4-leg with minor-road STOP control
MN -312 027 016 086 76 333 58870 81000
255 Urban 4-leg with all-way STOP control
MN -1237 122 027 047 41 41 25300 6803
256 Urban 4-leg with signal control
MN -347 042 014 032 264 418 75000 81000
ITT Corporation 2008
20
Table 8 SafetyAnalystrsquos SPFs for Intersections (Fatal and Injury Crashes) Site
subtype Code
Site subtype Description
State Regression coefficients
LogIntercept (α)
Regression coefficients
LogAADTmaj (β1)
Regression coefficients LogAADT
min (β2)
Over - dispersion Parameter
(k)
RFT2
() No of Sites
Max AADTmaj
(vehday)
Max AADTmin
(vehday)
Rural 201 Rural 3-leg with minor-
road STOP control MN -935 071 021 123 91 1706 28500 27000
202 Rural 3-leg with all-way STOP control
MN -1002 127 -022 089 248 41 25300 6803
203 Rural 3-leg with signal control
MN -783 075 014 05 215 136 36400 11500
204 Rural 4-leg with minor-road STOP control
MN -936 066 04 0 146 2114 35500 26700
205 Rural 4-leg with all-way STOP control
MN -1002 127 -022 089 248 41 25300 6803
206 Rural 4-leg with signal control
MN -783 075 014 05 215 136 36400 11500
Urban 251 Urban 3-leg with minor-
road STOP control MN -845 049 039 123 81 397 68000 18900
252 Urban 3-leg with all-way STOP control
MN -1002 127 -022 089 248 41 25300 6803
253 Urban 3-leg with signal control
MN -1022 091 021 027 362 33 50000 25807
254 Urban 4-leg with minor-road STOP control
MN -435 029 019 099 57 333 58870 81000
255 Urban 4-leg with all-way STOP control
MN -1002 127 -022 089 248 41 25300 6803
256 Urban 4-leg with signal control
MN -511 049 016 03 295 418 75000 81000
ITT Corporation 2008
21
The study examined the impact of two left turn priority treatments which were flashing advanced green (FAG) and left turn green arrow (LTGA) on left turn collisions These treatments were implemented at 35 intersections in the city of Toronto Two types of collisions were investigated left turns with and without side impact The results indicated that there was an insignificant difference in the impact of the left turn priority treatments on both types of crashes
Lord and Persaud (2003) conducted a study that related SPFs to transportation planning models They noted that traffic safety is not usually accounted for when agencies are conducting a planning analysis to remodel build upgrade or modify their facilities Five-year intersection data from Canada were used Models were developed and statistical measures such as the over dispersion parameter were calculated and conclusions were made from the results The SPFs developed for the study were applied to two sample networks created with the help of a transportation planning software package The research showed that it is possible to make estimation for traffic safety at the planning stage of a project This will allow users to take safety into consideration when designing and possibly create alternatives to change existing designs for more comprehensive projects or development The study also indicated that there are limitations when applying the SPFs to computerized transportation networks The study concluded that although it is possible to predict or estimate crashes on digital transportation networks the accuracy of prediction relies greatly on how precise the traffic flow estimates are
Jonsson et al (2007) performed an SPF study that took into consideration the type and severity of crashes andmdashmost importantmdashthe causal factors for these crashes The study was conducted for intersections on rural four-lane highways in the state of California Four collision types were tested in the study opposite-direction same-direction intersecting-direction and single-vehicle crashes In addition a set of data from the state of New York was used with the same parameters to analyze the severity distribution of crash types The data for California included 1084 intersections on four-lane rural highways and that from New York included 675 intersections mainly stop controlled or without any control Generalized linear modeling was performed with the data after quality analysis Two model forms were estimated with the variables seen in Equations 29 and 30
(Eq 29)
(Eq 30)
where NAcc = predicted number of crashesyr at intersections AADTmajor = AADT on major road AADTminor= AADT traffic flow on minor road Βi = model parameters Xi = variables that describe the intersections (such as terrain lighting left turn number of though lanes and divided or undivided among others)
nn xxxormajorAcc exAADTxAADTN ββββββ ++++=
min4433021
nn xxxormajorAcc exAADTAADTN βββββ +++++=
min332201)(
22
The two different models are different representations of the traffic flow The first represents the AADT of major and minor roads as separate variables but in the second model they are represented as one variable by the sum of the major and minor roads AADTs Results showed that the first model performed better for the multiple-vehicle crashes and the second model fitted better for the single-vehicle crashes In addition the appropriate predictor variables differed depending on the crash type This study is also of interest as it incorporated additional parameters to those in the suggested SPFs now included in SafetyAnalyst and therefore could lead to possible future SPF research for the state of Virginia
Persaud and Nguyen (1998) conducted a study on signalized intersections in Ontario Canada They developed aggregate and disaggregate models to estimate safety performance of three- and four-leg intersections in which crash severity (injury and PDO) environmental class (semi-urban and rural) and time period (daily weekday morning peak and weekday afternoon peak) were considered in the analysis An important aspect of that study is that it supplemented the existing models used for estimating SPFs instead of replacing them because it took into consideration features that were generally not considered in the then existing developed models Two model levels were considered for the study Level 1 was based on the sum of AADTs for all approaches with separate estimates for rear-end right angle and turning movement crashes At this level the equations were adjusted for three- and four-leg intersections by crash severity for all combined impact types and also separately for the three major impact types which were angle rear-end and turning movement In addition models were further separated by time period (daily weekday morning and afternoon peak) and for four-leg intersections which were also classified by environment class such as semi-urban and rural Level 2 allowed estimates to be obtained for specific crash patterns that were defined by movements of the vehicles involved before collision and the same were estimated as a function of the flows that were relevant to each of the patterns For this level models were estimated for four-leg intersections for 12 multi-vehicle and three single-vehicle patterns that were described by the movements of involved vehicles before collision The developed models were intended to estimate the parameters P and d shown in Equations 31 and 33
The safety of the intersection was estimated using the long-term mean based on the EB approach The long term mean (m) was obtained by combining crash count (x) of an intersection in the most recent years (n) with the estimates of the expected annual number of crashes (P) as shown in Equation 31 W1 and W2 in Equations 31 through 33 represent the weights estimated from the mean and variance of the regression estimates
(Eq 31)
(Eq 32)
(Eq 33)
m =W1(x) +W2(P)
2dW
d nP=
+
1PW
d nP=
+
23
(Eq 34)
To estimate the variance of m the following formula was used
(Eq 35)
In Equations 32 through 35 P and d represent the fundamental parameters Two models were selected for SPFs For Level 1 and single-vehicle Level 2 (Eq 36) For multi-vehicle in Level 2 (Eq 37) where P = expected number of crashes of a given type α and β = regression parameters to be estimated S (Level 1) = sum of all entering flows for a given time period for Level 1 analysis S (Level 2) = sum of the daily through right or left turn flows for a given time period for Level 2 (single-vehicle) analysis S1 and S2 = AADTs for small and large flows for a specific crash pattern in Level 2 (multi-vehicle) analysis
The models in either level can be used in the EB procedure to provide estimates for intersections that need to be treated or for the evaluation of the effectiveness of safety countermeasures It should be noted that the quality of the estimates for the study was strongly related to how the parameters were selected and used in the SPFs and unlike other available road models the ones presented in this study can be separated by time period and crash pattern Persaud et al (2002) conducted a study to demonstrate the complexity involved in the calibration of crash prediction models or SPFs for urban intersections Toronto data for three- and four-leg signalized intersections were used to estimate the models for the study The performance of these models was then compared with other models from Vancouver and California The models from these places were recalibrated to fit Toronto by using the Interactive Highway Safety Design Model (IHSDM) and a calibration procedure as proposed by Harwood et al (2000) The results varied significantly and were also mixed The study noted that the calibration of models is not a simple task and due to the importance of the SPFs they must be properly calibrated Several things must be accounted for when performing this procedure in order to obtain good quality data analysis The first thing is to extract a large sample of high quality data A software or program to link all the traffic crash and road characteristics data must exist because the same is usually kept stored in different databases In addition several
2Pd
Var P=
2( )
d xVar m dnP
+=
+
P =αSβ
P =αS1β1 S2
β 2
24
years of crash data must be obtained in order to have a good amount of samples that account for variations The actual process of model calibration is complicated therefore careful attention must be paid when analyzing the same because of the importance of the outcomes of the study The authors of the study made an exploratory analysis and it revealed that the relationship between the crashes and each covariate should be described either by the power function or the gamma function for all intersection types to be analyzed Equations 38 through 40 are the selected model forms used in the study F1 = Power F2 = Gamma (Eq 38) F1 = Gamma F2 = Power (Eq 39) F1 = Power F2 = Power (Eq 40) where E (K) = expected annual number of crashes between 1990 and 1995 F1 F2 = average entering AADT of major and minor roads respectively for the period 1990 to 1995 α β1 β2 β3 β4 = coefficients to be estimated
An NB structure was used to analyze the models and the overdispersion parameter (γ) was analyzed using Equation 41
γ=
2)K(E)K(Var (Eq 41)
Variance increases as γ decreases therefore the value of γ can also be used to make a comparison for the goodness of fit of several models fitted to the same data The larger the value of γ the smaller the variance therefore a more accurate model is given The authors suggest that γ would be enough to calculate the goodness of fit index of any SPF but if one desires to know how accurate the prediction estimate is other measures should also be computed The authors suggested using R2
α as proposed by Miaou et al (1996) which is a dispersion parameter based R2 computed as shown in Equation 42
γγ
minus=αmin2 1R (Eq 42)
where γ = overdispersion parameter for calibrated model γmin = smallest possible overdispersion parameter
The authors suggested that a disaggregation by traffic volume is preferable than using
only a single calibration factor for that is what the IHSDM currently has A recommendation is made to account for safety variation in traffic conditions over time by calibrating the models every two to three years as suggested by Harwood et al (2000)
E(K) =αF1β1 F2
β 2e(β 3F2 )
E(K) =αF1β1 F2
β 2e(β 4 F1 )
E(K) =αF1β1 F2
β 2
25
The Illinois Department of Transportation and the University of Illinois Urbana-Champaign conducted a research study to develop and implement SPFs for road segments and intersections in Illinois (Tegge et al 2010) These SPFs were developed in a way suitable for easy implementation in SafetyAnalyst The crash data (number of crashes and crash severity) and roadway data (number of lanes traffic volume area type and functional class) were collected and used for development of the SPFs Seventeen peer groups were used for developing the SPFs for segments and eight for intersections The intersections peer groups were minor leg stop control all-way stop control signalized and undetermined for rural and urban segments separately The SPFs for segments were developed using NB distribution for crashes and Poisson distribution for intersections The SAS GENMOD procedure was used to develop the SPFs for a five-year analysis period from 2001 to 2005 The model form for the intersection SPFs is the same as that given in the SafetyAnalyst Userrsquos Manual The SPFs were also developed for different crash severities such as fatal crashes type A injury crashes type B injury crashes and fatal plus injury crashes The EB method was used to determine the sites with the higher PSIs Two analysis techniques were used to obtain the PSIs The first considered segments and intersections as individual elements and the second used the sliding window approach The site specific analysis treated each individual segment and intersection as a separate entity Each segment is then compared with every other segment instead of having them grouped together The sliding window approach defined a set length The window lengths were 025 mile and 1 mile for urban and rural segments respectively
The largest impact on crash frequency was found to be the AADT and was therefore the only variable modeled as a logarithm (lnAADT) By doing this the AADT accounted for most of the prediction whereas the rest of the variables refined the prediction further Other variables used included access control functional class lane width surface type area type speed limit and median type The study recommended that a multivariate analysis be conducted for such studies to show how certain variables could contribute to the crashes Other variables could include roadway lighting weather and pavement conditions and roadway geometry The study also concluded that knowledge of roadway characteristics that increase the risk of fatal or injury crashes will facilitate the setting up of safety criteria that can help engineers in the designing of safer roadways Further knowledge of driver behaviors that lead to fatal and severe injury crashes can facilitate the training of enforcement officers to identify these behaviors
The Colorado Department of Transportation (CDOT) (2009) conducted a study to develop SPFs for intersections in the state Their model form is the same as that in SafetyAnalyst The SPFs were developed for many categories based on the number of legs divided undivided rural and urban including urban four-lane divided signalized six-lane divided signalized urban three-leg signalized two-lane undivided unsignalized and urban three-leg unsignalized When a median or left-turn lane is present a roadway is considered divided The sites selected for the study reflected variability in traffic volume and geometry in order to have a diverse representation of intersections throughout the state SPFs were developed for total and for fatal plus injury crash types A five-year study period from 2000 through 2005 was used Crash and AADT data were collected for development of the SPFs CDOT used a NB error structure to develop the SPFs and the EB procedure to estimate the expected safety performance of an intersection site for different safety management purposes Overdispersion parameters were computed and used as a goodness of fit measure According to their data
26
overdispersion parameters indicated that their models provided a reasonable fit to the Colorado data
Results indicated that for signalized intersections roads with six lanes on major approaches have more collisions than those with four lanes on major approaches CDOT recommended that the SPFs should be recalibrated in the future using data from future years as crash frequencies may change over time because of a variety of issues The report also recommended that separate calibration factors should be developed for different regions and different topographies Research in Virginia
In Virginia two other similar studies have recently been published One by Garber et al (2010) for two-lane roads and another by Hamidi et al (2010) to identify high-crash sections on Virginiarsquos primary system by developing a planning-level methodology The study by Garber et al developed SPFs for two-lane segments of 1 mile or less and the study by Hamidi et al developed SPFs for longer segments of two-lane roads that can be used for corridor analysis
Evaluation of the Recommended Minnesota SPFs
Figures 3 through 6 show representative graphs that were used to visually examine how well the Virginia data fitted the suggested Minnesota SPFs Figures 3 and 4 are for urban four-leg signalized intersections and Figures 5 and 6 are for rural four-leg signalized intersections These graphs suggest that the Minnesota SPFs do not fully represent the Virginia data Tables 9 through 12 show the Freeman-Tukey R2
FT coefficients computed for the different Minnesota SPFs using the Virginia data The low Freeman-Tukey R2
FT coefficients obtained and the visual inspection of the graphs suggested that a better fit to the Virginia data could be obtained by developing specific Virginia SPFs using Virginia data It was therefore decided to develop specific SPFs for Virginia
0
2
4
6
8
10
12
14
0 20000 40000 60000 80000 100000 120000
AADT Major
Tota
l Cra
shes
Per
Yea
r
Minnesota VA Actual Observed
Minnesota Model
Figure 3 Total crashes per year vs major AADT for urban 4-leg signalized intersections
with minor AADT of 700
27
0
5
10
15
20
25
30
35
0 20000 40000 60000 80000 100000 120000
AADT Major
Tota
l Cra
shes
per
Yea
r
Minnesota VA Actual Observed
Minnesota Model
Figure 4 Total crashes per year vs major AADT for urban 4-leg signalized intersections
with minor AADT of 4500
0
2
4
6
8
10
12
14
0 20000 40000 60000 80000 100000 120000
AADT Major
Tota
l Cra
shes
Per
Yea
r
Minnesota VA Actual Observed
Minnesota Model
Figure 5 Total crashes per year vs major AADT for rural 4-leg signalized intersections with
minor AADT of 795
28
0
2
4
6
8
10
12
14
16
18
0 20000 40000 60000 80000 100000 120000
AADT Major
Tota
l Cra
shes
per
Yea
r
Minnesota VA Actual Observed
Minnesota Model
Figure 6 Total crashes per year vs major AADT for rural 4-leg signalized intersections with
minor AADT of 5000
Table 9 Minnesota SPFs for Urban FI Crashes and Corresponding R2FT Based
on Virginia Data
Intersection Type
Minnesota FI SPFs R2
FT Based on Virginia Urban FI Crash Data ()
Urban 4-Leg Signalized 032
Urban 4-Leg Minor Stop Control 008
Urban 3-Leg Signalized 026
Urban 3-LegMinor Stop Control 01
Table 10 Minnesota SPFs for Urban TOTAL crashes and Corresponding R2
FT Based on Virginia Data
Type of Intersection
Minnesota SPFs
R2FT Based on Virginia Urban Total
Crash Data ()
Urban 4-Leg Signalized 034
Urban 4-Leg Minor Stop Control 022
Urban 3-Leg Signalized 031
Urban 3-Leg Minor Stop Control 01
29
Table 11 Minnesota SPFs for Rural TOTAL Crashes and Corresponding R2FT
Based on Virginia Data
Type of Intersection
Minnesota SPFs R2
FT Based on Virginia Rural Total Crash Data ()
Rural 4-Leg Signalized 029
Rural 4-Leg Minor Stop Control 013
Rural 3-Leg Signalized 029
Rural 3-Leg Minor Stop Control -010
Table 12 Minnesota SPFs for Rural FI Crashes and Corresponding R2FT Based
on Virginia Data
Type of Intersection
Minnesota SPFs R2
FT Based on Virginia Rural FI Crash Data ()
Rural 4-Leg Signalized 018
Rural 4-Leg Minor Stop Control 010
Rural 3-Leg Signalized 018
Rural 3-Leg Minor Stop Control 001
Development and Evaluation of Specific Virginia SPFs
In keeping with the suggestion given in the Safety Analyst Userrsquos Manual the model form used to develop the intersection SPFs is given in Equation 4 as
1 2k e x MajAADT x MinAADTβ βα=
where
k = predicted crash frequency per intersection per year MajAADT = AADT on the major road (vehday) MinAADT = AADT on the minor road (vehday) α = intercept β1 = coefficient of mayor AADT β2 = coefficient of minor AADT
30
The statewide SPFs developed for Virginia are given in Tables 13 through 16 Due to lack of data the analysis for all-way stop intersections could not be undertaken These tables also give the Freeman-Tukey R2
FT coefficient for each of the Virginia SPFs and the corresponding Minnesota SPF and Freeman-Tukey R2
FT based on the Virginia data The R2FT coefficients
obtained indicate that the Virginia-specific SPFs fit the Virginia data better than the suggested Minnesota SPFs for all types of intersections and crash severity except those for FI crashes on urban three-leg signalized rural four-leg signalized and rural four-leg minor stop control intersections where the corresponding RFT
2 values are similar In Table 15 it can be seen that the Minnesota R2
FT value is negative for the rural three-leg minor stop control intersections The negative RFT
2 value is possible because these calculations were not performed on the same data points that were used to create the Minnesota SPFs (Miller 2009) Table 13 SPF Models for Urban TOTAL crashes and R2
FT results for Virginia Statewide (VDOT-maintained roads)
SPF model with TOTAL Crash values
R2FT TOTAL
Crash Data
Site Virginia Statewide Minnesota VA MN
Urban 4-Leg Signalized 056 034
Urban 4-Leg Minor Stop Control
032 022
Urban 3-Leg Signalized 037 031
Urban 3-Leg Minor Stop Control
023 010
Table 14 SPF Models for Urban FI crashes and R2
FT results for Virginia Statewide (VDOT-maintained roads)
SPF model with FI Crash values R2FT FI Crash Data ()
Site
Virginia Statewide Minnesota VA MN
Urban 4-Leg Signalized 041 032
Urban 4-Leg Minor Stop Control
019 008
Urban 3-Leg Signalized 026 026
Urban 3-Leg Minor Stop Control
013 010
31
Table 15 SPF Models for Rural TOTAL Crashes and R2FT Results for Virginia Statewide (VDOT-
maintained roads) SPF model with TOTAL Crash values R2
FT TOTAL Crash Data
Site
Virginia Statewide Minnesota VA MN
Rural 4-Leg Signalized 0321 0290
Rural 4-Leg Minor Stop Control
0167 0132
Rural 3-Leg Signalized 0305 0291
Rural 3-Leg Minor Stop Control
0104 -0102
Table 16 SPF Models for Rural FI crashes and R2
FT results for Virginia Statewide (VDOT-maintained roads) SPF model with FI Crash values R2
FT TOTAL Crash Data
Site
Virginia Statewide Minnesota VA MN
Rural 4-Leg Signalized 0181 0181
Rural 4-Leg Minor Stop Control
0098 0097
Rural 3-Leg Signalized 0170 0180
Rural 3-Leg Minor Stop Control
0048 0012
Figures 7 through 10 show visual representations of how well the Virginia SPFs fit the
Virginia data in comparison with the suggested Minnesota SPFs In general the Virginia SPFs tend to fit the Virginia data better than the Minnesota SPFs although both sets of SPFs tend to have similar fits at low volumes (AADTmajor lt 2000) except for the SPF for total crashes on urban four-leg signalized intersections shown in Figure 7 The primary reason the Minnesota SPFs do not fit the Virginia data as well as the Virginia SPFs may be the dissimilarities of the roadside environment and the characteristics of the different databases
32
0
2
4
6
8
10
12
14
0 20000 40000 60000 80000 100000 120000
AADT Major
Tota
l Cra
shes
Per
Yea
r
Minnesota VA Actual Observed Virginia
Minnesota Model
Virginia M odel
Figure 7 Total crashes per year vs major AADT for urban 4-leg signalized intersections
with minor AADT of 700
0
5
10
15
20
25
30
35
0 20000 40000 60000 80000 100000 120000
AADT Major
Tota
l Cra
shes
per
Yea
r
Minnesota VA Actual Observed Virginia
Minnesota Model
Virginia Model
Figure 8 Total crashes per year vs major AADT for urban 4-leg signalized intersections
with minor AADT of 8000
33
0
2
4
6
8
10
12
14
0 20000 40000 60000 80000 100000 120000
AADT Major
Tota
l Cra
shes
Per
Yea
r
Minnesota VA Actual Observed Virginia
Virginia Model
Minnesota Model
Figure 9 Total crashes per year vs major AADT for rural 4-leg signalized intersections with
minor AADT of 79
0
5
10
15
20
25
0 20000 40000 60000 80000 100000 120000
AADT Major
Tota
l Cra
shes
per
Yea
r
Minnesota VA Actual Observed Virginia
Minnesota Model
Virginia Model
Figure 10 Total crashes per year vs minor AADT for rural 4-leg signalized intersections with major AADT of 5000
As discussed in the Methodology section in addition to the statewide Virginia SPFs
specific SPFs were developed for each operational region to consider the different topographical characteristics that exist across Virginia The complete set of SPFs together with the associated p values for the regression coefficients are shown in Tables A-1 and A-2 of Appendix A All p values are less than 005 with most being less than 00001 except for some of the rural four-leg signalized intersections regional specific SPFs These p values indicate that the estimated coefficients are statistically significant at the 95 confidence level or better A possible reason
34
for higher p values for a small number of SPFs may be the sample size used for developing these SPFs
To test the transferability and fit of the Virginia statewide specific SPFs several
statistical parameters were determined for the 70 (estimation) data set and the 30 (validation) data set separately The corresponding values for each of these parameters were then compared The results are shown in Tables 17 and 18 for urban and rural intersections respectively The results for the regional SPFs are shown in Tables A-3 through A-8 of Appendix A The results indicate that the developed models are transferable to the 30 validation data set For example the MSE values for the 70 estimation data are similar to the MSPE values for the 30 validation data In addition the mean prediction bias MPB values for the 30 validation data are close to zero (-076 le MPB ge -0004) in Table 17 and (-0067 le MPB ge 00513) in Table 18
Table 17 Goodness of Fit Results for Urban Statewide SPFs
Data Estimation data 70 Validation Data 30 Subtype Site MSE r2 R2
FT MPB MAD MSPE R2FT
Total VA 41150 0529 0557 -0760 4329 38490 0575
Total MN
68636 0506 0336 -3145 5421 68156 0315
FI VA
7043 0385 0406 -0458 1938 7671 0475
Urban 4-Leg Signalized
FI MN 7702 0372 0324 -0316 2124 8981 0376
Total VA 2238 0315 0313 -0034 0897 2383 0292
Total MN 2510 0287 0215 0091 0982 2730 0182
FI VA 0530 0194 0193 -0004 0432 0533 0194
Urban 4-Leg Minor Stop Control
FI MN 0560 0182 0080 0128 0522 0577 0052
Total VA 24900 0375 0370 -0645 3519 27591 0369
Total MN 29322 0365 0308 -2238 3661 33079 0272
FI VA 4467 0275 0259 -0185 1527 4875 0262
Urban 3-Leg Signalized
FI MN 4528 0267 0261 -0294 1526 4937 0261
Total VA 1854 0254 0230 -0043 0893 2038 0239
Total MN 2388 0237 0104 -0541 0902 2600 0107
FI VA 0428 0151 0133 -0021 0431 0476 0157
Urban 3-Leg Minor Stop Control
FI MN 0478 0140 0097 -0184 0385 0537 0104
35
Table 18 Goodness of Fit Results for Rural Statewide SPFs
Data Estimation Data 70
Validation Data 30
Subtype Site MSE r2 R2FT MPB MAD MSPE R2
FT
Total VA 10990 0353 0321 0513 2210 10070 -0073
Total MN 12400 0339 0290 -0154 2071 8460 0035
FI VA 2350 0196 0181 0045 1189 2600 -0034
Rural 4-Leg Signalized
FI MN 2400 0188 0181 -0043 1164 2420 0004
Total VA 1090 0182 0167 -0067 0794 1190 0171
Total MN 1190 0167 0132 -0348 0774 1320 0115
FI VA 0480 0112 0098 -0022 0504 0530 0110
Rural 4-Leg Minor Stop Control
FI MN 0500 0104 0097 -0158 0459 0560 0093
Total VA 5490 0328 0305 -0010 1651 5760 0179
Total MN NA NA NA NA NA NA NA
FI VA 1450 0181 0170 -0041 0902 1710 0099
Rural 3-Leg Signalized
FI MN NA NA NA NA NA NA NA
Total VA 0690 0144 0104 -0008 0613 0730 0102
Total MN 0890 0141 -0102 -0404 0555 0940 -0104
FI VA 0250 0071 0048 -0009 0345 0260 0048
Rural 3-Leg Minor Stop Control
FI MN 0270 0068 0012 -0144 0270 0290 0003
Pruning of Virginia-Specific SPFs A total of 64 SPFs were initially developed using the appropriate data for Virginia as shown in Tables A-1 and A-2 of Appendix A Considering that not all regional models might be necessary the pruning process described in the methodology section was carried out to prune the number of SPFs to the minimum effective number as seen in Tables 19 and 20 for urban and rural intersections respectively The pruning process resulted in 19 SPFs for urban sites and 15 for rural sites To facilitate the use of the correct SPF for a specific type of intersection located in a specific region the lists of the appropriate SPFs to be used are given in Tables B-1 and B-2 of Appendix B for the urban and rural intersections respectively
As can be seen in Tables 19 and 20 and Tables A-1 and A-2 of Appendix A there are some trends worth discussing for the benefit of the study and possible future research With regards to the three different operational regions the Western region retained many more of the specific regional urban SPFs than any other region For example the Western regional SPFs were retained for all urban intersection sites whereas for the Eastern region the only SPFs
36
retained were those for urban four-leg signalized FI crashes and urban four-leg minor stop control for total and FI crashes Similarly the only urban SPF retained for the Northern region was that for urban four-leg minor stop control for total crashes For the rural intersection sites all of the Western regional SPFs were retained except those for rural three-leg signalized total and FI crashes and rural four-leg minor stop control FI crashes The majority of the Eastern region rural SPFs were discarded except those for rural four-leg signalized total and FI crashes while for the Northern region all regional SPFs were discarded
The Western region retained more specific regional SPFs than the other two regions This suggests that the intersections in the Western region exhibit more unique characteristics than those for the other regions This may be due to the more mountainous terrain in the Western region compared to those in the Eastern and Northern regions This supports the philosophy of developing specific SPFs based on the topography of different regions
Site Prioritization
To illustrate the benefits of using the EB method to prioritize intersection sites for safety
improvements the top 25 urban sites from the Bristol and Northern Virginia districts were identified by using crash rates critical crash ratio and the EB method The PSI for each site identified was then determined The results obtained are shown in Tables 21 and 22 for the Bristol and the Northern Virginia districts respectively The results indicate that for the Northern Virginia District the PSIs for the top 25 sites are 258 1317 and 27440 crashes per year and for the Bristol District 432 646 and 1496 crashes per year for the crash rates critical crash ratio and EB methods respectively The important thing in Tables 21 and 22 is the sum of the PSI columns ranked by the three methods The sum of each of the PSIs for the crash rate and critical crash ratio method is lower than that for the EB method These results suggest that the use of the EB method in the planning process will identify intersection sites with the highest PSIs and therefore where detailed assessments to determine feasible and effective safety treatments should be undertaken
37
Table 19 MSPE Values for Virginia Urban Statewide and Urban Regional SPFs Used for Pruning
Data Pruning
Subtype
Site
MSPE [MSPEVA-
MSPEOR]1 [abs(MSPEVA-
MSPEOR)]2 [abs(MSPEVA-
MSPEOR)MSPEVA]3
RetainDiscardTotal VA 3849 Northern 4486 -637 637 0165497532 Discard Western 1791 2058 2058 0534684334 Retain Eastern 3745 104 104 0027020005 Discard FI VA 7671 Northern 95 -1829 1829 0238430452 Discard Western 517 2501 2501 0326033112 Retain
Urban 4-Leg Signalized
Eastern 541 2261 2261 0294746448 Retain Total VA 23834 Northern 202 03634 03634 015247126 Retain Western 105 13334 13334 0559452882 Retain Eastern 115 12334 12334 0517496014 Retain FI VA 05327 Northern 048 00527 00527 0098929979 Discard Western 033 02027 02027 0380514361 Retain
Urban 4-Leg Minor Stop Control
Eastern 036 01727 01727 0324197485 Retain Total VA 275911 Northern 2687 07211 07211 0026135239 Discard Western 2441 31811 31811 0115294425 Retain Eastern 3878 -111889 111889 0405525695 Discard FI VA 48754 Northern 448 03954 03954 0081101038 Discard Western 339 14854 14854 0304672437 Retain
Urban 3-Leg Signalized
Eastern 586 -09846 09846 020195266 Discard Total VA 20379 Northern 219 -01521 01521 0074635654 Discard Western 164 03979 03979 0195250012 Retain Eastern 223 -01921 01921 0094263703 Discard FI VA 04756 Northern 05 -00244 00244 0051303616 Discard Western 038 00956 00956 0201009251 Retain
Urban 3-Leg Minor Stop Control
Eastern 05 -00244 00244 0051303616 Discard 1 Difference between mean square prediction error (MSPE) of Virginia statewide model and OR model 2 Absolute value of the difference between Virginia statewide model MSPE and operational region model MSPE 3 Absolute value of the difference between Virginia statewide model MSPE and operational region model MSPE divided by the Virginia statewide MSPE for comparison
Retained SPFs Discarded if value is negative Discarded if less than 01
38
Table 20 MSPE Values for Virginia Rural Statewide and Rural Regional SPFs Used for Pruning Data Pruning
Subtype
Site
MSPE
[MSPEVA-MSPEOR]1
[abs(MSPEVA-MSPEOR)]2
[abs(MSPEVA-MSPEOR)MSPEVA]3
RetainDiscard
Total VA 1007 Northern 3422 -2415 2415 2398212512 Discard Western 605 402 402 0399205561 Retain Eastern 512 495 495 0491559086 Retain FI VA 26 Northern 976 -716 716 2753846154 Discard Western 159 101 101 0388461538 Retain
Rural 4-Leg Signalized
Eastern 137 123 123 0473076923 Retain Total VA 119 Northern 164 -045 045 0378151261 Discard Western 102 017 017 0142857143 Retain Eastern 114 005 005 0042016807 Discard FI VA 053 Northern 052 001 001 0018867925 Discard Western 048 005 005 0094339623 Discard
Rural 4-Leg Minor Stop Control
Eastern 049 004 004 0075471698 Discard Total VA 576 Northern 1475 -899 899 1560763889 Discard Western 674 -098 098 0170138889 Discard Eastern 626 -05 05 0086805556 Discard FI VA 171 Northern 212 -041 041 0239766082 Discard Western 403 -232 232 1356725146 Discard
Rural 3-Leg Signalized
Eastern 157 014 014 0081871345 Discard Total VA 073 Northern 093 -02 02 0273972603 Discard Western 053 02 02 0273972603 Retain Eastern 069 004 004 0054794521 Discard FI VA 026 Northern 03 -004 004 0153846154 Discard Western 023 003 003 0115384615 Retain
Rural 3-Leg Minor Stop Control
Eastern 027 -001 001 0038461538 Discard 1 Difference between mean square prediction error (MSPE) of Virginia statewide model and OR model 2 Absolute value of the difference between Virginia statewide model MSPE and operational region model MSPE 3 Absolute value of the difference between Virginia statewide model MSPE and operational region model MSPE divided by the Virginia statewide MSPE for comparison
Retained SPFs Discarded if value is negative Discarded if less than 01
39
Table 21 PSIs for Top 25 Sites in District 1 Urban (Bristol) FI
Crashes Ranking Based on Crash
Rates Ranking Based on Crash Ratio Ranking Based on EB
Method
Rank Intersection Node
Crash Rate1 PSI2 Intersection
Node Crash Ratio3 PSI Intersection
Node PSI
1 596726 22112 00000 651193 39672 00000 596095 21413
2 606469 20079 00000 606238 39298 06297 596393 08787
3 706818 12504 00000 651075 31264 00000 651130 08453
4 651193 11550 00000 596726 29227 00000 596701 07112 5 651075 09369 00000 606469 28039 00000 651802 06929 6 606238 08382 06297 651233 25831 03612 636331 06726 7 651807 07089 00000 651130 22718 08453 596395 06579 8 651233 06068 03612 706818 22555 00000 596937 06415 9 651230 05990 00000 651230 20301 00000 606238 06297
10 651783 05756 00000 651210 18882 04747 661033 06061 11 636093 04960 00000 636331 17913 06726 596372 05417 12 651274 04475 00000 651807 16847 00000 636372 04808 13 651130 04179 08453 651805 15814 00000 651210 04747 14 651210 03918 04747 651223 15627 03589 636491 04649 15 636331 03393 06726 651783 15009 00000 596420 04633 16 651223 03363 03589 596095 14865 21413 596403 04579 17 606232 03331 00000 636405 14769 00000 651603 04531 18 651127 03053 00000 661033 14555 06061 636056 04351 19 651999 03048 00000 596353 14215 03717 712033 04110 20 596449 02962 00000 636093 13782 00000 704691 04102 21 636405 02811 00000 651879 13192 00000 651838 04100 22 651883 02698 00000 651274 12975 00000 651894 03878 23 596353 02686 03717 651127 12972 00000 596353 03717 24 651805 02663 00000 651999 12959 00000 651233 03612 25 661033 02500 06061 596449 12702 00000 651889 03601
sum 43202 sum 64615 sum 149606 1Number of crashes per year per 1000000 total approach volume 2Potential for safety improvement (crashes yr) the difference between the EB-adjusted long-term crashes and the SPF-estimated crashes 3Ratio of actual crash rate to critical crash rate
40
Table 22 PSIs for Top 25 Sites in District 9 Urban (Northern Virginia District) FI
Crashes Ranking Based on Crash
Rates Ranking Based on Crash Ratio Ranking Based on EB
Method
Rank Intersection Node
Crash Rate1 PSI2 Intersection
Node Crash Ratio3 PSI Intersection
Node PSI
1 718192 191841 00000 718192 257523 00000 264119 150122 2 702946 178194 00000 547722 152371 11175 263375 140091 3 271531 64846 00000 263628 102794 00000 278648 137239 4 263628 52858 00000 263728 100092 00000 276819 131395 5 263728 42215 00000 719754 95274 09444 263290 130743 6 266955 35294 00000 702946 79268 00000 722678 127897 7 547722 34932 11175 263403 77252 05184 264725 118671 8 702612 30441 00000 704237 77175 07648 267028 116627 9 273886 29539 00000 263729 74681 00000 265204 115925
10 716747 27632 00000 271531 72327 00000 274766 115679 11 263626 27139 00000 263135 66458 18068 263249 113372 12 269485 26567 00000 716747 64461 00000 547044 110769 13 728954 26344 00000 266955 56657 00000 549349 107180 14 263729 25208 00000 546138 52003 31028 268210 105630 15 546988 21922 00000 547544 51924 32529 263347 104257 16 274338 21446 00000 263626 50389 00000 276351 102313 17 429308 21354 00000 269485 49897 00000 428167 100064 18 720401 21197 00000 728954 49702 00000 264344 98789 19 267295 20954 00000 548686 49572 03621 277764 91554 20 267536 20874 00000 711601 47985 04440 263467 89259 21 265938 20484 00000 266970 47730 00000 263090 89199 22 273354 20108 00000 546462 46856 03620 703414 88610 23 268345 19362 00000 265938 46726 00000 428629 87379 24 719754 19073 09444 720401 44833 00000 272219 85659 25 263403 19015 05184 728496 43666 04990 428544 85610
Sum 25803 sum 131747 sum 2744033 1Number of crashes per year per 1000000 total approach volume 2Potential for safety improvement (crashes yr) the difference between the EB-adjusted long-term crashes and the SPF-estimated crashes 3Ratio of actual crash rate to critical crash rate
41
CONCLUSIONS
bull The development of SPFs for intersections is necessary for Virginia because the SafetyAnalyst-suggested SPFs which are based on Minnesota data do not represent the Virginia data well Regarding the fit of the SPFs to Virginia data the R2
FT values shown in Tables 13 through 16 for Minnesota and Virginia indicate that the Virginia-specific SPFs fit the Virginia data better than the Minnesota models This may be due to the dissimilarities of the roadside environment such as difference in topography and the characteristics of the different Virginia and Minnesota databases
bull In some cases the specific regional SPFs fit the regional data better than the statewide
SPFs suggesting that the specific SPFs should be considered for use when available These group divisions that have similar roadway characteristics and driver expectations in some cases tend to improve the fit
bull In identifying intersection sites for safety improvements it is clearly beneficial for the EB
method to be used with the suitable SPFs rather than a crash rate or critical ratio method Results of the site prioritization show a much higher potential for crash reduction when the EB method is used with the appropriate SPFs rather than a procedure based on crash rates or critical rates
RECOMMENDATIONS
1 VDOTrsquos TED should use the Virginia-specific SPFs when using the SafetyAnalyst tools The results of this study have shown that the Virginia-specific SPFs reflected the Virginia data better than the SafetyAnalyst-recommended Minnesota SPFs
2 VDOTrsquos TED should investigate the feasibility of using multiple SPFs in SafetyAnalyst If
feasible regional SPFs should be used If it is not currently feasible to use multiple SPFs VDOTrsquos TED should ask that the FHWA include regional information in SafetyAnalyst so as to allow the use of regional SPFs For the specific regional SPFs to be applied to Virginia and other states the SafetyAnalyst tool should be capable of incorporating the necessary data that support the regional models
3 As soon as it is feasible to use regional SPFs VDOTrsquos TED should use the 19 SPFs
developed for urban intersections and the 15 developed for rural intersections when using the tools in SafetyAnalyst Although the statewide SPFs are available for use by an analyst the specific regional models included in the final set of SPFs will predict crashes better than the statewide SPFs The regional analysis will not only ease the use of specific regional SPFs but will also be of benefit when predicting the potential for safety improvement of a specific site
4 For future similar SPF studies VDOTrsquos TED should be directly involved in screening the
traffic data for accuracy and consistency as was done in this study The direct involvement of the TED in the screening of the traffic data significantly contributed to the accuracy of the
42
data and greatly contributed to the confidence the researchers place on the data used in the study
5 The Virginia Transportation Research Council (VTRC) should conduct a study as soon as
feasible to verify whether incorporating independent variables for which data are available other than AADT such as intersection geometry and other characteristics will result in SPFs that better fit the Virginia data Although the currently suggested SafetyAnalyst SPFs use only the AADTs as the independent variables it is likely that provision will be made for use of SPFs that incorporate other independent variables such as number of approaches entering lanes and the other variables for which data are available as these SPFs are likely to give better fit to crash data
6 As soon as feasible VTRC should undertake a study to develop SPFs for the urban system
intersections which are not currently maintained by VDOT as these intersections may have different crash characteristics than those maintained by VDOT This would facilitate the use of SafetyAnalyst in programming sites that are currently not being maintained by VDOT
BENEFITS AND IMPLEMENTATION PROSPECTS
Significant benefits will be accrued by the use of the Virginia-specific SPFs developed in this study This is clearly illustrated in two ways First in examining the transferability of the suggested SPFs in SafetyAnalyst it is clear that these SPFs do not fit the Virginia data very well The results also indicate that the Virginia-specific SPFs fit the Virginia data much better than the suggested SafetyAnalyst SPFs Second the availability of the Virginia-specific SPFs will enhance the use of the EB procedure given in SafetyAnalyst for prioritizing sites for safety improvements This study has also shown that the EB method better identifies sites with higher potential for crash reduction than those identified by crash rates For example the illustrated examples given for the Bristol and Northern Virginia districts show that the potential reduction in FI crashes when the top 25 sites are identified by the EB method is 28936 (1496 + 27440) crashes per year whereas that obtained when the critical crash ratio method is used for prioritization is only 1963 (646 + 1317) and that obtained with the crash rate method is only 690 (432 + 258) crashes per year This gives a net benefit of 26973 potential crashes per year compared to the critical crash ratio method and 28246 compared to the crash rate method Assuming an average cost of FI crashes of $95629 (FHWA 2005) and only 10 of the estimated net benefit PSI of 28246 crashes per year is achieved the total savings of more than $27 million per year could be accrued The prospects for implementation of the recommendations are very high as the study was requested by VDOTrsquos TED which is planning to incorporate these SPFs in the use of the tools provided in SafetyAnalyst
43
ACKNOWLEDGMENTS
The authors appreciate the opportunity afforded them by VDOT and VTRC to conduct this study Special thanks to Stephen Read (VDOT) Dr In-Kyu Lim (VDOT) Dr Young-Jun Kweon (VTRC) and VDOTrsquos Central Office for their interest and support in SPFs and their help in the selection of intersection sites Many thanks to Lewis Woodson (VTRC) and James Hill (University of Virginia) for all their help and input throughout the study
REFERENCES Cogburn P VDOT Interagency Coordination 2007 Virginia Emergency Management
Conference Virginia Department of Transportation Richmond April 2007 Colorado Department of Transportation DTD Applied Research and Innovation Branch Safety
Performance Functions for Intersections CDOT-2009-10 Denver December 2009 Fridstroslashm L Ifver J Ingebrigtsen S Kulmala R and Thomsen LK Measuring the
Contribution of Randomness Exposure Weather and Daylight to the Variation in Road Accidents Counts Accident Analysis and Prevention Vol 27 No 1 1995 pp 1-20
Federal Highway Administration Cost of Crashes by Severity Table FHWA-HRT-05-051
Washington DC 2005 Federal Highway Administration SafetyAnalyst Home Page httpwwwsafetyanalystorg
Accessed February 2010 Garber N and Hoel L Traffic amp Highway Engineering 4th ed Cenage Learning Toronto
Canada 2009 Garber NJ Haas PR and Gosse C Development of Safety Performance Functions for Two-
Lane Roads Maintained by the Virginia Department of Transportation VTRC 10-R25 Virginia Transportation Research Council Charlottesville 2010
Hamidi A Fontaine MD and Demetsky MJ A Planning-Level Methodology for Identifying
High-Crash Sections of Virginiarsquos Primary System VTRC 11-R4 Virginia Transportation Research Council Charlottesville 2010
Harwood D Council FM Hauer E Hughes WE and Vogt A Prediction of the Expected
Safety Performance of Rural Two-lane Highways Federal Highway Administration McLean VA December 2000
Harwood DW Bauer KM Richard KR Gilmore DK Persaud B and Lyon C
Development of SPFs for Safety Analyst Interim Tools Technical Memorandum
44
Prepared by Midwest Research Institute for the Federal Highway Administration McLean VA 2004
ITT Corporation SafetyAnalyst Userrsquos Manual Turner-Fairbank Highway Research Center
McLean VA 2008 Jonsson T Ivan J and Zhang C Crash Prediction Models for Intersections on Rural
Multilane Highways Differences by Collision Type In Transportation Research Record Journal of the Transportation Research Board No 2019 Transportation Research Board of the National Academies Washington DC 2007 pp 91-98
Kweon Y-J and Lim I-K Appropriate Regression Model Types for the Empirical Bayes
Method and SafetyAnalyst In Proceedings of the 89th Annual Meeting of the Transportation Research Board Transportation Research Board of the National Academies Washington DC 2010
Kononov J Bailey B and Allery B Exploratory Examination of the Functional Form of
Safety Performance Functions of Urban Freeways Colorado Department of Transportation and San Diego State University Denver CO 2008
Lyon C Haq A Persaud B and Kodama S Safety Performance Functions for Signalized
Intersections in Large Urban Areas Development and Application to Evaluation of Left-Turn Priority Treatment In Transportation Research Record Journal of the Transportation Research Board No 1908 Transportation Research Board of the National Academies Washington DC 2005 pp 165-171
Lord D and Persaud B Estimating the Safety Performance of Urban Road Transportation
Networks Center for Transportation Safety Texas Transportation Institute Texas AampM University and Department of Civil Engineering Ryerson University College Station TX 2003 pp 609-620
Miaou S-P Lu A and Lum H S Pitfalls of using R2 to Evaluate Goodness of Fit of
Accident Prediction Models In Transportation Research Record Journal of the Transportation Research Board No 1542 Transportation Research Board of the National Academies Washington DC 2005 1996 pp 6-13
Miller P Re Negative R squared Email Archive Division of Biostatistics Washington
University in St Louis February 2 2005 February 2 2005 httpwwwbiostatwustleduarchiveshtmljmp-l2005msg00075html Accessed February 2010
Persaud B Lord D and Palmisano J Calibration and Transferability of Accident Prediction
Models for Urban Intersections In Transportation Research Record Journal of the Transportation Research Board No 1784 Transportation Research Board of the National Academies Washington DC 2002 pp 57-64
45
Persaud B and Nguyen T Disaggregate Safety Performance Models for Signalized Intersections on Ontario Provincial Roads In Transportation Research Record Journal of the Transportation Research Board No 1635 Transportation Research Board of the National Academies Washington DC 1998 pp 113-120
Pham T and Ragland D Summary of Crash Prediction Models Also known as Safety
Performance Functions (SPFs) California Partners for Advanced Traffic and Highways and University of California Berkeley Berkeley 2005
SAS Institute Inc SAS OnlineDoc Version Eight Cary NC
httpwwwtecnionacildocssasril Accessed 2009 Tegge RA Jo J-H and Ouyang Y Development and Application of Safety Performance
Functions for Illinois ICT-10-066 Illinois Center for Transportation University of Illinois Urbana-Champaign March 2010
Virginiarsquos Surface Transportation Safety Executive Committee Commonwealth of Virginiarsquos
Strategic Highway Safety Plan 2006-2010 Virginia Department of Transportation Richmond 2006
Washington S Persaud B Lyon C and Oh J Validation of Accident Models for
Intersections FHWA-RD-03-037 Federal Highway Administration McLean VA 2005
46
47
APPENDIX A
STATISTICAL PARAMETERS AND GOODNESS-OF-FIT RESULTS
Table A-1 Statistical Parameters for Urban Intersections SPFs Parameter Estimates
Data Intercept
Coefficient of Mayor AADT
Coefficient of Minor AADT
Subtype Site Intercept (α)
StndError
P value
lnMajor (β1)
StndError
P value
lnMinor (β2)
StndError
P value
Total VA -76234 048 lt0001 06742 005 lt0001 03453 003 lt0001
OR1 -83067 056 lt0001 07522 005 lt0001 0328 003 lt0001OR10 -123913 122 lt0001 10631 013 lt0001 04567 006 lt0001OR 100 -88553 077 lt0001 07825 007 lt0001 03706 004 lt0001FI VA -85256 057 lt0001 06477 006 lt0001 03579 004 lt0001OR1 -96546 063 lt0001 07603 006 lt0001 03597 004 lt0001OR10 -114284 15 lt0001 08662 016 lt0001 04412
Urban 4-Leg Signalized
OR 100 -99582 100 lt0001 07484 009 lt0001 04017 005 lt0001Total VA -60723 022 lt0001 04558 002 lt0001 0347 004 lt0001
OR1 -6059 044 lt0001 0505 004 lt0001 02773 006 lt0001OR10 -67031 057 lt0001 03986 007 lt0001 04999 009 lt0001OR 100 -65388 032 lt0001 04689 004 lt0001 043 006 lt0001FI VA -76917 032 lt0001 05001 003 lt0001 03695 005 lt0001OR1 -81437 060 lt0001 05813 005 lt0001 03188 008 lt0001OR10 -80333 063 lt0001 03446 007 lt0001 06218 010 lt0001
Urban 4-Leg Minor Stop Control
OR 100 -83166 051 lt0001 05253 006 lt0001 04695 008 lt0001Total VA -6543 082 lt0001 06591 008 lt0001 02119 002 lt0001
OR1 -4999 103 lt0001 05555 009 lt0001 01554 003 lt0001OR10 -96143 127 lt0001 08677 012 lt0001 03297 005 lt0001OR 100 -67518 110 lt0001 06157 011 lt0001 02969 005 lt0001FI VA -84268 068 lt0001 07147 006 lt0001 02481 002 lt0001OR1 -73982 099 lt0001 06496 009 lt0001 02088 003 lt0001OR10 -110104 155 lt0001 0908 015 lt0001 03226 006 lt0001
Urban 3-Leg Signalized
OR 100 -7266 107 lt0001 05508 011 lt0001 03107 006 lt0001Total VA -54696 013 lt0001 04874 002 lt0001 01985 001 lt0001
OR1 -5361 018 lt0001 04959 002 lt0001 01676 002 lt0001OR10 -5773 034 lt0001 04877 003 lt0001 02314 004 lt0001OR 100 -51642 021 lt0001 04338 003 lt0001 02309 003 lt0001FI VA -74642 018 lt0001 05791 002 lt0001 02091 002 lt0001OR1 -76877 027 lt0001 06204 003 lt0001 0181 002 lt0001OR10 -69458 047 lt0001 05096 004 lt0001 02212 005 lt0001
Urban 3-Leg Minor Stop Control
OR 100 -69883 031 lt0001 05169 004 lt0001 02308 003 lt0001 Standard Error
48
Table A-2 Statistical Parameters for Rural Intersections SPFs Parameter Estimates
Data Intercept
Coefficient of Mayor AADT
Coefficient of Minor AADT
Subtype Site Intercept (α)
StndError
P value
lnMajor (β1)
Stnd Error
P value
lnMinor (β2)
Stnd Error
P value
Total VA -69589 118 lt0001 06746 009 lt0001 0253 009 00047
OR1 -1604 237 04974 02284 021 02791 01514 012 0211 OR10 -63951 183 00005 05508 014 00001 03106 014 00224 OR 100 -06468 220 07692 02262 016 01635 -00158 017 09274 FI VA -87116 128 lt0001 07839 011 lt0001 02166 009 0013 OR1 -33285 246 01767 03601 024 0126 00597 013 06478 OR10 -80583 175 lt0001 06809 018 00001 02557 013 0057
Rural 4-Leg Signalized
OR 100 -48381 221 00287 04243 018 00193 01523 018 03943 Total VA -5494 020 lt0001 03533 002 lt0001 03935 003 lt0001
OR1 -62351 058 lt0001 04167 006 lt0001 04507 008 lt0001OR10 -53594 028 lt0001 03379 003 lt0001 03998 004 lt0001OR 100 -51255 027 lt0001 02914 003 lt0001 04075 004 lt0001FI VA -66927 030 lt0001 03899 003 lt0001 04156 004 lt0001OR1 -82561 095 lt0001 05221 009 lt0001 04962 012 lt0001OR10 -70797 044 lt0001 03789 004 lt0001 0497 005 lt0001
Rural 4-Leg Minor Stop Control
OR 100 -63326 038 lt0001 03223 004 lt0001 04424 005 lt0001Total VA -75754 084 lt0001 06465 008 lt0001 03332 008 lt0001
OR1 -58798 220 00075 05076 020 00143 0313 013 00161 OR10 -64368 110 lt0001 0544 011 lt0001 02863 006 lt0001OR 100 -9899 139 lt0001 08047 015 lt0001 04386 006 lt0001FI VA -87112 103 lt0001 07224 010 lt0001 02578 006 lt0001OR1 -9219 260 00004 07258 022 00011 03407 016 00326 OR10 -88607 146 lt0001 07059 016 lt0001 02809 008 00009
Rural 3-Leg Signalized
OR 100 -111835 185 lt0001 08669 018 lt0001 03977 008 lt0001Total VA -43293 008 lt0001 03366 001 lt0001 02087 001 lt0001
OR1 -50904 022 lt0001 0406 002 lt0001 02752 003 lt0001OR10 -40969 009 lt0001 03133 001 lt0001 02001 001 lt0001OR 100 -4231 016 lt0001 02997 002 lt0001 02308 003 lt0001FI VA -53415 011 lt0001 03394 001 lt0001 02237 001 lt0001OR1 -64457 031 lt0001 04195 003 lt0001 0307 004 lt0001OR10 -50831 014 lt0001 03245 002 lt0001 02014 002 lt0001
Rural 3-Leg Minor Stop Control
OR 100 -51046 024 lt0001 03163 003 lt0001 02112 003 lt0001
Standard Error
49
Table A-3 SPFs Goodness of Fit Results for Urban Northern Operational Region (No 1)
Data Estimation Data 70 Validation Data 30
Subtype Site MSE r2 R2FT MPB MAD MSPE R2
FT
Total VA 41150 0529 0557 -0760 4329 38490 0575
Total R1 4110 051 0551 -020 464 4486 054
FI VA 704 038 0406 -046 194 767 048
Urban 4-Leg Signalized
FI R1 809 039 0439 012 214 950 038
Total VA 224 031 0313 -003 090 238 029
Total R1 308 028 0286 008 095 200 032
FI VA 053 019 0193 000 043 053 019
Urban 4-Leg Minor Stop Control
FI R1 064 018 0187 003 043 048 021
Total VA 2490 038 0370 -064 352 2759 037
Total R1 3034 032 0305 -015 365 2687 037
FI VA 447 028 0259 -019 153 488 026
Urban 3-Leg Signalized
FI R1 559 025 0231 004 157 448 029
Total VA 185 025 0230 -004 089 204 024
Total R1 208 026 0239 -006 094 219 026
FI VA 043 015 0133 -002 043 048 016
Urban 3-Leg Minor Stop Control
FI R1 047 017 0156 -001 044 050 017
50
Table A-4 SPFs Goodness of Fit Results for Urban Western Operational Region (No 10)
Data Estimation Data 70 Validation Data 30
Subtype Site MSE r2 R2FT MPB MAD MSPE R2
FT
Total VA 41150 0529 0557 -0760 4329 38490 0575
Total R10 21976 0777 0735 1290 3233 17910 0686
FI VA 7043 0385 0406 -0458 1938 7671 0475
Urban 4-Leg Signalized
FI R10 4280 0526 0500 0377 1597 5170 0452
Total VA 2238 0315 0313 -0034 0897 2383 0292
Total R10 1161 0361 0300 -0032 0740 1050 0188
FI VA 0530 0194 0193 -0004 0432 0533 0194
Urban 4-Leg Minor Stop Control
FI R10 0312 0197 0187 0000 0382 0330 0009
Total VA 24900 0375 0370 -0645 3519 27591 0369
Total R10 14446 0451 0397 -0168 2801 24410 0255
FI VA 4467 0275 0259 -0185 1527 4875 0262
Urban 3-Leg Signalized
FI R10 3077 0266 0216 0039 1258 3390 0115
Total VA 1854 0254 0230 -0043 0893 2038 0239
Total R10 1391 0233 0197 -0054 0800 1640 0207
FI VA 0428 0151 0133 -0021 0431 0476 0157
Urban 3-Leg Minor Stop Control
FI R10 0354 0111 0089 -0019 0404 0380 0125
51
Table A-5 SPFs Goodness of Fit Results for Urban Eastern Operational Region (No 100)
Data Estimation Data 70 Validation Data 30
Subtype Site MSE r2 R2FT MPB MAD MSPE R2
FT
Total VA 41150 0529 0557 -0760 4329 38490 0575
Total R100 31108 0632 0630 0243 4717 37450 0005
FI VA 7043 0385 0406 -0458 1938 7671 0475
Urban 4-Leg Signalized
FI R100 5201 0480 0454 -0098 1864 5410 0244
Total VA 2238 0315 0313 -0034 0897 2383 0292
Total R100 1720 0443 0381 0087 0758 1150 0003
FI VA 0530 0194 0193 -0004 0432 0533 0194
Urban 4-Leg Minor Stop Control
FI R100 0509 0273 0254 0049 0383 0360 0173
Total VA 24900 0375 0370 -0645 3519 27591 0369
Total R100 17782 0410 0410 -1753 0908 38780 0004
FI VA 4467 0275 0259 -0185 1527 4875 0262
Urban 3-Leg Signalized
FI R100 3194 0243 0263 -0615 1645 5860 0236
Total VA 1854 0254 0230 -0043 0893 2038 0239
Total R100 1561 0233 0210 -0127 0902 2230 0002
FI VA 0428 0151 0133 -0021 0431 0476 0157
Urban 3-Leg Minor Stop Control
FI R100 0387 0131 0116 -0043 0444 0500 0141
52
Table A-6 SPFs Goodness of Fit Results for Rural Northern Operational Region (No 1)
Data Estimation Data 70
Validation Data 30
Subtype Site MSE r2 R2FT MPB MAD MSPE R2
FT
Total VA 10990 0353 0321 0513 2210 10070 -0073
Total R1 20080 0118 0092 -1389 3661 34220 0212
FI VA 2350 0196 0181 0045 1189 2600 -0034
Rural 4-Leg Signalized
FI R1 2920 0057 0052 -1173 1931 9760 0028
Total VA 1090 0182 0167 -0067 0794 1190 0171
Total R1 1990 0190 0245 0001 0942 1640 0173
FI VA 0480 0112 0098 -0022 0504 0530 0110
Rural 4-Leg Minor Stop Control
FI R1 0920 0093 0112 0020 0541 0520 0009
Total VA 5490 0328 0305 -0010 1651 5760 0179
Total R1 11110 0182 0254 -0679 2271 14750 0497
FI VA 1450 0181 0170 -0041 0902 1710 0099
Rural 3-Leg Signalized
FI R1 3230 0131 0153 -0116 1006 2120 0355
Total VA 0690 0144 0104 -0008 0613 0730 0102
Total R1 1210 0245 0196 0030 0712 0930 0126
FI VA 0250 0071 0048 -0009 0345 0260 0048
Rural 3-Leg Minor Stop Control
FI R1 0340 0124 0093 0016 0366 0300 0052
53
Table A-7 SPFs Goodness of Fit Results for Rural Western Operational Region (No 10)
Data Estimation Data 70 Validation Data 30
Subtype Site MSE r2 R2FT MPB MAD MSPE R2
FT
Total VA 10990 0353 0321 0513 2210 10070 -0073
Total R10 6020 0311 0268 0007 1748 6050 0382
FI VA 2350 0196 0181 0045 1189 2600 -0034
Rural 4-Leg Signalized
FI R10 1880 0158 0139 0097 0945 1590 0254
Total VA 1090 0182 0167 -0067 0794 1190 0171
Total R10 1300 0196 0163 0070 0760 1020 0078
FI VA 0480 0112 0098 -0022 0504 0530 0110
Rural 4-Leg Minor Stop Control
FI R10 0560 0142 0118 0025 0495 0480 0014
Total VA 5490 0328 0305 -0010 1651 5760 0179
Total R10 3690 0163 0170 -0432 0748 6740 0039
FI VA 1450 0181 0170 -0041 0902 1710 0099
Rural 3-Leg Signalized
FI R10 0890 0124 0117 -0391 0997 4030 -0066
Total VA 0690 0144 0104 -0008 0613 0730 0102
Total R10 0640 0126 0091 0025 0583 0580 0055
FI VA 0250 0071 0048 -0009 0345 0260 0048
Rural 3-Leg Minor Stop Control
FI R10 0240 0062 0041 0003 0335 0230 0028
54
Table A-8 SPFs Goodness of Fit Results for Rural Eastern Operational Region (No 100)
Data Estimation Data 70 Validation Data 30
Subtype Site MSE r2 R2FT MPB MAD MSPE R2
FT
Total VA 10990 0353 0321 0513 2210 10070 -0073
Total R100 10120 0042 0027 1207 1882 5120 -0307
FI VA 2350 0196 0181 0045 1189 2600 -0034
Rural 4-Leg Signalized
FI R100 2060 0053 0039 0119 0962 1370 -0023
Total VA 1090 0182 0167 -0067 0794 1190 0171
Total R100 0960 0170 0149 -0086 0746 1140 0209
FI VA 0480 0112 0098 -0022 0504 0530 0110
Rural 4-Leg Minor Stop Control
FI R100 0440 0106 0092 -0031 0475 0490 0121
Total VA 5490 0328 0305 -0010 1651 5760 0179
Total R100 2770 0492 0459 0601 1759 6260 0090
FI VA 1450 0181 0170 -0041 0902 1710 0099
Rural 3-Leg Signalized
FI R100 1040 0265 0255 0124 0923 1570 -0055
Total VA 0690 0144 0104 -0008 0613 0730 0102
Total R100 0640 0125 0087 -0037 0601 0690 0119
FI VA 0250 0071 0048 -0009 0345 0260 0048
Rural 3-Leg Minor Stop Control
FI R100 0250 0064 0038 -0013 0345 0270 0062
55
APPENDIX B
RECOMMENDED SAFETY PERFORMANCE FUNCTION MODELS
Table B-1 Recommended Urban SPFs Site Virginia SPF Models to Be Used for Urban Intersections
Urban 4-Leg Signalized Total Virginia generic total
Urban 4-Leg Signalized
Operational Region 1 generic total
Urban 4-Leg Signalized
Operational Region 10
use specified model developed
Urban 4-Leg Signalized
Operational Region 100 generic total
Urban 4-Leg Signalized FI Virginia generic FI
Urban 4-Leg Signalized
Operational Region 1 generic FI
Urban 4-Leg Signalized
Operational Region 10
use specified model developed
Urban 4-Leg Signalized
Operational Region 100
use specified model developed
Urban 4-Leg Minor Stop Control
Total Virginia generic total
Urban 4-Leg Minor Stop Control
Operational Region 1
use specified model developed
Urban 4-Leg Minor Stop Control
Operational Region 10
use specified model developed
Urban 4-Leg Minor Stop Control
Operational Region 100
use specified model developed
Urban 4-Leg Minor Stop Control
FI Virginia generic FI e^-76917MajADT^05001MinADT^03695
Urban 4-Leg Minor Stop Control
Operational Region 1
use specified model developed
Urban 4-Leg Minor Stop Control
Operational Region 10
use specified model developed
Urban 4-Leg Minor Stop Control
Operational Region 100
use specified model developed
56
Table B-1 Recommended Urban SPFs (Continued)
Site Virginia SPF Models to Be Used for Urban Intersections
Urban 3-Leg Signalized
Total Virginia
use generic model developed for total
crashes
Urban 3-Leg Signalized
Operational Region 1
use generic model developed for total
crashes
Urban 3-Leg Signalized
Operational Region 10
use specific regional model
developed
Urban 3-Leg Signalized
Operational Region 100
use generic model developed for total
crashes
Urban 3-Leg Signalized FI Virginia
use generic model developed for FI
crashes
Urban 3-Leg Signalized
Operational Region 1
use generic model developed for FI
crashes
Urban 3-Leg Signalized
Operational Region 10
use specific regional model
developed
Urban 3-Leg Signalized
Operational Region 100
use generic model developed for FI
crashes
Urban 3-Leg Minor Stop Control
Total Virginia
use generic model developed for total
crashes
Urban 3-Leg Minor Stop Control
Operational Region 1
use generic model developed for total
crashes
Urban 3-Leg Minor Stop Control
Operational Region 10
use specific regional model
developed
Urban 3-Leg Minor Stop Control
Operational Region 100
use generic model developed for total
crashes
Urban 3-Leg Minor Stop Control
FI Virginia use generic model developed for FI
crashes
Urban 3-Leg Minor Stop Control
Operational Region 1
use generic model developed for FI
crashes
Urban 3-Leg Minor Stop Control
Operational Region 10
use specific regional model
developed
Urban 3-Leg Minor Stop Control
Operational Region 100
use generic model developed for FI
crashes
57
Table B-2 Recommended Rural SPFs Site Virginia SPF Models to Be Used for Rural Intersections
Rural 4-Leg Signalized Total Virginia
use generic model developed for total
crashes
Rural 4-Leg Signalized
Operational Region 1
use generic model developed for total
crashes
Rural 4-Leg Signalized
Operational Region 10
use specific regional model developed
Rural 4-Leg Signalized
Operational Region 100
use specific regional model developed
Rural 4-Leg Signalized FI Virginia use generic model
developed for FI crashes
Rural 4-Leg Signalized
Operational Region 1
use generic model developed for FI crashes
Rural 4-Leg Signalized
Operational Region 10
use specific regional model developed
Rural 4-Leg Signalized
Operational Region 100
use specific regional model developed
Rural 4-Leg Minor Stop Control Total Virginia
use generic model developed for total
crashes
Rural 4-Leg Minor Stop Control
Operational Region 1
use generic model developed for total
crashes e^-549MajADT^035MinADT^039
Rural 4-Leg Minor Stop Control
Operational Region 10
use specific regional model developed
Rural 4-Leg Minor Stop Control
Operational Region 100
use generic model developed for total
crashes
Rural 4-Leg Minor Stop Control FI Virginia use generic model
developed for FI crashes
Rural 4-Leg Minor Stop Control
Operational Region 1
use generic model developed for FI crashes
Rural 4-Leg Minor Stop Control
Operational Region 10
use generic model developed for FI crashes
Rural 4-Leg Minor Stop Control
Operational Region 100
use generic model developed for FI crashes
58
Table B-2 Recommended Rural SPFs (Continued)
Site Virginia SPF Models to Be Used for Rural Intersections
Rural 3-Leg Signalized Total Virginia use generic model
developed for total crashes
Rural 3-Leg Signalized
Operational Region 1
use generic model developed for total crashes
Rural 3-Leg Signalized
Operational Region 10
use generic model developed for total crashes
Rural 3-Leg Signalized
Operational Region 100
use generic model developed for total crashes
Rural 3-Leg Signalized FI Virginia use generic model
developed for FI crashes
Rural 3-Leg Signalized
Operational Region 1
use generic model developed for FI crashes
Rural 3-Leg Signalized
Operational Region 10
use generic model developed for FI crashes
Rural 3-Leg Signalized
Operational Region 100
use generic model developed for FI crashes
Rural 3-Leg Minor Stop Control Total Virginia use generic model
developed for total crashes
Rural 3-Leg Minor Stop Control
Operational Region 1
use generic model developed for total crashes
Rural 3-Leg Minor Stop Control
Operational Region 10
use specific regional model developed
Rural 3-Leg Minor Stop Control
Operational Region 100
use generic model developed for total crashes
Rural 3-Leg Minor Stop Control FI Virginia use generic model
developed for FI crashes
Rural 3-Leg Minor Stop Control
Operational Region 1
use generic model developed for FI crashes
Rural 3-Leg Minor Stop Control
Operational Region 10
use specific regional model developed
Rural 3-Leg Minor Stop Control
Operational Region 100
use generic model developed for FI crashes

5
rural and those with all approaches designated as urban were classified as urban Intersections with urban and rural approaches were removed from the list of study sites to minimize the uncertainty A data quality analysis was also performed to ascertain that the AADT values for all approaches of each intersection and for each year of the study period were available Intersections with incomplete data were removed from the study including yield all-way stop and intersections with five approaches This resulted in 18356 intersections classified as urban or rural as shown in Table 3
Virginia is divided into five operational regions as shown in Figure 2 After consultation
with VDOT and the technical review panel the different topographical characteristics in Virginia were then used to group the intersections into three regional groups as Northern Western and Eastern The Northern region is composed of intersections in Northern Virginia and surrounding counties the Western region is considered to have a mountainous terrain and the Eastern region is considered to have rolling to flat terrain Table 3 also shows the specific districts and counties in each of the three regions used in this study This regional classification helped to partially account for different characteristics that are encountered throughout the state
Table 3 Urban and Rural Classification Operational Region Districts Urban Rural Total
Northern (No 1)
District 9 (NOVA) + Culpeper (023) Fauquier County (030) King George County (048) Madison County (056) Orange County (068) Rappahannock County (078) Spotsylvania (088) Stafford County (089)
4620 596 5216
Western (No 10)
District 1 (Bristol) District 2 (Salem) District 3 (Lynchburg) District 8 (Staunton) + Albemarle County (002) Fluvanna County (032) Greene County (039) Louisa County (054)
1197 6706 7903
Eastern (No 100)
District 4 (Richmond) and District 5 (Hampton Roads) + Caroline County (016) Essex County (028) Gloucester County (036) King amp Queen County (049) King William (050) Lancaster County (051) Mathews County (057) Middlesex County (059) Northumberland County (066) Richmond County (079) Westmoreland County (096)
2193 3044 5237
Total 8010 10346 18356 Proportion () 4364 5636 100 Alternative method of identifying regions for easy application of the SAS code No 1 = Northern region No 10 = Western region No 100 = Eastern region
6
Figure 2 Virginia Operational Regions (Cogburn 2007)
The study considered urban and rural intersections with urban consisting of 8010 intersections and rural consisting of 10346 intersections as shown in Table 4
The intersections were also divided by their configuration (number of approaches) and
the type of traffic control (signalized or minor stop control) The number of urban intersection sites for each category is shown in Table 5 and that for rural intersections in Table 6 The total number of rural four-leg signalized and rural three-leg signalized sites is much lower than that for the urban signalized intersections However this is expected as a much lower percentage of rural intersections are signalized In addition all-way stop intersections were excluded because of the low number at the time of the study
Table 4 Proportion of Urban and Rural Sites by Region
Operational Region Urban Proportion () Rural Proportion () Northern 4620 5768 596 5760 Western 1197 1494 6706 64817 Eastern 2193 2738 3044 29423 TOTAL 8010 100 10346 100
Table 5 Distribution of Urban Sites by Geometric Configuration
Operational Region Urban 4-leg Signalized
Urban 4-leg 2-Way Stop
Urban 3-leg Signalized
Urban 3-leg Minor Stop Total
Northern 371 766 497 2986 4620 Western 53 153 137 854 1197 Eastern 144 320 202 1527 2193 TOTAL 568 1239 836 5367 8010 Proportion () 709 1547 1044 6700 100
7
Table 6 Distribution of Rural Sites by Geometric Configuration
Operational Region Rural 4-leg Signalized
Rural 4-leg 2-Way Stop
Rural 3-leg Signalized
Rural 3-leg Minor Stop Total
Northern 19 67 13 497 596 Western 90 894 117 5605 6706 Eastern 73 609 53 2309 3044 TOTAL 182 1570 183 8411 10346 Proportion () 176 1517 177 8130 100
Crash and Operational Data Collection
As previously discussed HTRIS serves as a centralized warehouse of traffic and roadway data for Virginia and is composed of various subsystems that carry distinct data RDI ACC and HPMS were the three subsystems used to extract the necessary data for the study
VDOTrsquos TED staff extracted the crash data by using the ACC database for the years
2003 through 2007 The ACC database is composed of data derived from the crash report forms (DMV FR300) that are filled out by police officers and include data such as driverrsquos actions driver characteristics environmental conditions collision type and crash severity among other factors The database developed for this study included total fatal injury and property damage only (PDO) (property damage greater than $1000) crashes that occurred within a distance of 250 feet or 0047 mile of the intersection which matches the procedure used to develop the suggested SPFs in SafetyAnalyst The RDI database was used to identify the intersection ID or node number for the urban and rural intersection sites that had the same geometric conditions throughout the 5 years selected for the study
A Structured Query Language (SQL) program was developed for retrieving and
formatting the required data for the analysis This query specified the intersection node configuration approach volumes urbanrural classification crashes and traffic control device for each year of the study period The Statistical Analysis Software SAS (913) was then used to format the data in a way suitable for the analysis (SAS Institute Inc 2009)
Annual Average Daily Traffic Selection
The major and minor AADTs were used as the independent variables in developing the SPFs for intersections in Virginia in accordance with the SPFs developed for SafetyAnalyst (Harwood et al 2004) It was therefore necessary to identify the major and minor approaches at each intersection In determining the major and minor AADTs it was recommended by VDOT that for four-leg approaches the major entering volume should be the sum of the two highest approach volumes and the minor entering volume the sum of the two lowest approach volumes For three-leg approaches the major entering volume was the sum of the two highest approach volumes The highway performance monitoring system database was used to obtain the AADTs for the selected study sites
8
Evaluation of Recommended Minnesota SPFs
Once all of the necessary data were obtained for each of the study sites the SafetyAnalyst-recommended SPFs which are based on data for intersections in Minnesota were tested to determine how well they fit the Virginia data Both graphical and statistical methods were used to conduct these tests The graphical method consisted of a visual inspection of the spread of the Virginia data for a specific configuration of intersection and the actual crashes of a given severity plotted with the resultant curve from using the same Virginia database and the corresponding recommended Minnesota SPF The statistical test consisted of computing the Freeman-Tukey RFT 2 coefficients for the recommended SPFs using the appropriate Virginia data The RFT
2 coefficient was used as this was the statistical parameter used to represent the goodness of fit (ITT Corporation 2008) in developing the SafetyAnalyst-recommended SPFs Equations 1 2 and 3 show how the data were transformed to compute the RFT
2 (Fridstroslashm et al 1995) fi = ( yi )05 + ( yi +1 )05 (Eq 1) ecirci = fi ndash ( 4 times ŷi + 1 )05 (Eq 2) RFT
2 = 1 ndash sumiecirci2 sumi( fi ndash fm )2 (Eq 3)
where fi = Freeman-Tukey transformation statistic yi = observed data at site i ecirci = residual at site i ŷi = modeled (predicted) value at site i fm= mean of the transformation statistic (fi) across all sites of the same configuration and urbanrural classification RFT
2 = Freeman-Tukey R2
Developing Virginia-Specific SPFs
The format of the specific SPFs developed for Virginia is the same as that in the
SafetyAnalyst manual and given as
1 2k e x MajAADT x MinAADTβ βα= (Eq 4) where
k = predicted crash frequency per intersection per year MajAADT = AADT on the major road (vehday) MinAADT = AADT on the minor road (vehday) α = intercept
9
β1 = coefficient of major AADT β2 = coefficient of minor AADT
In developing the SPFs a negative binomial (NB) distribution for the crash data was
used as preliminary analysis showed that the data fit the NB distribution The form of the data used to develop the SPFs can be either the panel or cross-sectional (collapsed) format According to Kweon and Lim (2010) the panel format uses original panel data which consist of assembling several years of data over the same intersection and the cross-sectional models use pseudondashcross-sectional data which are data converted or rearranged from the panel set The difference between the two types of models obtained is that the model based on the panel data form takes advantage of the characteristics of the panel data by positioning a predefined correlation structure on reciprocated measures over years at the same time whereas the model based on the cross-sectional form uses the data created by collapsing the multi-year panel data into apparently a single-year panel data The crash data were divided into the estimation and validation portions Seventy percent was selected randomly and used as the estimation data to develop the SPFs and the remaining 30 was used as the evaluation data
An estimation of acceptable values was made for the regression coefficients and the
dispersion parameter when developing the SPFs for the EB method in SafetyAnalyst The regression coefficients are critical for the comparison of different SPFs The dispersion parameter (d) is important when using the EB method in SafetyAnalyst because it plays an integral function in computing the EB weight that influences the estimate of the EB long-term predicted crashes When determining the dispersion parameter from SAS for the urban four-leg signalized intersections the values obtained were d = 02223 for the panel data and d = 02216 for the collapsed data but when determining the values for the urban four-leg two-way stop intersections the values calculated were d = 04284 for panel data and d = 02518 for collapsed data In the urban four-leg two-way stop intersections a significant difference in the d values was observed which led to the choice of panel data for the modeling as they would be more reliable than the collapsed data By looking at the obtained values it can be appreciated that the collapsed model underestimates the dispersion which will eventually cause the EB value to inflate therefore leading to a biased report for the collapsed model
Generalized linear modeling (GLM) was used to create a correlation between the intersection crashes for the 5 years chosen for analysis and the major and minor approach volumes For the statistical modeling SAS was employed (SAS Institute Inc 2009) This software includes the GENMOD procedure and the equation used is the same as given in Equation 5 The GENMOD procedure gives an output of generalized estimating equations (GEE) parameter estimates which are the ones used to develop the Virginia SPFs
1 2exp( )it itk MajAADT MajAADTα β β ε= + + + (Eq 5) where i = intersection index (i = 1hellip N) t = severity index (t = TOT [total crashes] FI [fatal + injury crashes] PDO [property damage only])
10
α = intercept β1 = coefficient of major AADT β2 = coefficient of minor AADT
itk = dependent variable at intersection i and severity t (crashesyr) νit = random error exp (νit) Gamma (θ θ) εit = random (residual) error in GEE
The random errors presented in this equation have the function of not letting the β values or coefficients become biased
Evaluation of Virginia-Specific SPFs
Several statistical parameters were used to assess how well the Virginia SPFs fit the data The parameters used and suggested by Washington et al (2005) were the mean prediction bias (MPB) the mean absolute deviation (MAD) the mean square error (MSE) the mean squared prediction error (MSPE) the Pearsonrsquos product moment correlation coefficients between observed and predicted crash frequencies (used for both validation and estimation data) dispersion parameters and the Freeman Tukey RFT
2 coefficients computed from Equation 3 To test the fit of the SPFs the 70 estimation data set was used to calculate the MSE the Pearsonrsquos product moment correlation coefficients the R2 and the R2
FT To test the transferability of the SPFs the 30 validation data set was used to compute the MPB MAD and the MSPE The expressions used to determine these coefficients are given in Equations 6 through 10
( )2
iin
1i
nYYMPB
2 minussum= = (Eq 6)
2
n
1i ii
n
YYMAD
2sum=minus
= (Eq 7)
( )
pnYY
MSE1
n
1i
2
ii2
minus
minus= sum = (Eq 8)
( )
2
n
1i
2
ii
nYY
MSPE2sum=
minus= (Eq 9)
where p = degrees of freedom i = intersection index Yi = observed crash frequency at intersection i Ŷi = predicted crash frequency at intersection i
11
n2 = validation data sample size 30 n1 = estimation data sample size 70
(Eq 10) where
_
1Y = average of observed crashes per intersections _
2Y = average of predicted crashes per intersections Yi1 = observed values at intersection i Y i2 = predicted values at intersection i
It should be noted that when values obtained from the MPB MAD MSE and MSPE
formulas are close to 0 it indicates a good fit or desirable SPF and when values for the RFT2 and
R2 formulas are close to 1 it indicates a suitable fit The dispersion parameter (d) is used in the variance-mean relationships as shown in Equations 11 and 12
(Eq 11)
( ) ( ) ( )i i i i i iVar Y X E Y X d x E Y X= + (Eq 12) A weighting factor (Wi) used in the EB procedure is obtained from Equation 13 and used in Equation 14 to obtain the EB-estimated value
( )1
1ii i
Wd x E Y X
=+
(Eq 13)
( ) ( ) ( )1EB i i i i i i iE E y y W x E Y X W x Y= + minus (Eq 14)
where 0 lt W lt 1 Var (|) = conditional variance E (|) = conditional mean Var m or Var (Yi|Xi) = estimated variance of mean crash rate E m or E (Yi|Xi) = estimated mean crash rate from SPF d = estimated NB dispersion parameter (also called overdispersion parameter)
2Var m E m d x E m= +
( )( )( ) ( )
1 1 2 21 22 2
1 21 2
i i
i i
Y Y Y Yr
Y Y x Y Y
sum minus minus=⎡ ⎤sum minus sum minus⎢ ⎥⎣ ⎦
12
W = weight Xi = variables such as AADT Yi = number of observed crashes per year at intersection i EEB = EB-adjusted estimated crashes (crashesyr)
In the variance-mean relationship if the value obtained for the dispersion parameter d is 0 then the variance is the same as the mean (see Equations 11 and 12) which causes the NB model to collapse to the Poisson model This parameter has a strong influence on the weight in the EB formula (see Eq 13) therefore it has an effect in the EB-estimated value SAS was helpful in computing this parameter for the different types of intersections analyzed in the study throughout the 5 years
Pruning Process
Before the site prioritization was performed pruning was done to avoid over-representation of the SPFs that might not reflect much difference in the study when compared with statewide SPFs At the completion of the pruning process only the necessary or minimum effective SPFs were retained MSPE is typically the parameter used to assess errors associated with a validation data set for this reason MSPE was used for pruning In order to verify whether a specific regional SPF should be retained or not the validation data set (30 of the data) was used to compute MSPE for both the specific regional SPFs and the corresponding statewide SPFs If MSPE for the regional SPF was greater than that for the corresponding Virginia statewide SPF or if the difference between these two MSPEs was less than 10 it was concluded that the regional SPF was not necessary and it was therefore discarded The following example illustrates the steps for urban four-leg signalized FI crashes in Region 1
1 The 30 FI crash data were obtained for urban signalized four-leg intersections in Region 1 and the MSPE was determined using the statewide SPF for the FI urban four-leg signalized intersections
2 The 30 FI crash data for urban signalized four-leg intersections in Region 1 were
then used to determine MSPE for the specific Region 1 SPF for FI crashes 3 Verify if the MSPE value for the specific regional SPF is higher than the statewide
MSPE value if yes discard the specific regional SPF if no tentatively retain the specific regional model
4 The difference between the two MSPEs was determined to determine whether it was
less than 10 of the statewide MSPE if yes discard the specific regional SPF if no retain the specific regional model This process was repeated for all regional SPFs
13
Identification of Intersections with a Higher Than Expected Number of Crashes
In order to identify some of the intersections with a higher than expected number of crashes a prioritization analysis based on the EB method was conducted This analysis was carried out to identify the top 25 intersections with a high PSI in the urban areas of the Northern Virginia and Bristol districts These two districts were selected to identify any effect of the approach AADTs as two-lane roads in the Northern Virginia District carry much higher volumes than those in the Bristol District The PSI is the difference between the EB-adjusted long-term crashes and the SPF-estimated crashes The PSI was first determined and then a priority list was developed with intersections showing a higher PSI receiving a higher priority This procedure first required the computation of yearly calibration factors (Cy) that accounted for intrinsic yearly variations that were not accounted for in developing the SPFs These yearly calibration factors were determined using the steps described here and given in Equations 15 through 18 (ITT Corporation 2008) Calculation of Yearly Calibration Factor (Cy) For subtype s and severity t the following steps were performed 1 Calculate the (unadjusted) predicted number of crashes using the appropriate SPF yiMinAADTMajAADTe ststst
isyisyisty amp~ 21ˆˆˆ foralltimestimes= ββακ (Eq 15)
2 Sum the predicted numbers over all intersections
ysN
iistysty forall=sum
=
~~1κκ (Eq 16)
3 Sum the observed numbers of crashes over all intersections
yKKsN
iistysty forall=sum
=
1
(Eq 17)
4 Calculate yearly calibration factor csty
yK
csty
stysty forall= ~κ (Eq 18)
5 Repeat the steps for all subtypes (s) and severities (t)
where i = intersection index (i = 1hellip N)
14
s = subtype index (s = urban four-leg signalized intersection rural three-leg minor stop controlled intersection etc) t = severity index (t = TOT [total crashes] FI [fatal + injury crashes] PDO [property damage only]) y = year index (i = 1 [base year] 2 hellip Y) csty = yearly calibration factor for crash subtype s severity t and year y MajAADT = AADT on the major road (vehday) MinAADT = AADT on the minor road (vehday)
istyκ~ = (unadjusted) predicted number of crashes at intersection i for crash subtype s severity t and year y
istyκ = (adjusted) predicted number of crashes at intersection i for crash subtype s severity t and year y α = intercept
1β = coefficient of major AADT 2β = coefficient of minor AADT
These yearly calibration factors were then used to determine the predicted number of
crashes at an intersection based on the SPF for the severity of crashes and type of intersection being considered The PSI for each intersection was then determined using the steps described in Equations 19 through 22 (ITT Corporation 2008) Steps for Calculating PSI for Subtype s
1 Calculate the (adjusted) predicted number of crashes
amp~
21ˆˆˆ ststst
isyisysty
istystyisty
MinAADTMajAADTec
yticββα
κκ
timestimestimes=
foralltimes= (Eq 19)
2 Calculate yearly correction factor Cisty
ytiCyist
istyisty amp
)1(
forall==κ
κ
(Eq 20)
3 Calculate EB weight
tid
w Y
y istystist amp
11
1
foralltimes+
=sum =
κ (Eq 21)
4 Calculate the EB-adjusted estimated number of crashes for year 1
15
tiC
KwwX Y
y isty
Y
y istyistyististyist amp)1(
1
1)1()1( forallminus+times=
sumsum
=
=== κ (Eq 22)
5 Determine the PSI for each intersection If istYX gt istYκ include intersection i in the list for prioritization using istYPSI = istYX
where i = intersection index (i = 1hellip N) s = subtype index (s = urban four-leg signalized intersection rural three-leg minor stop
controlled intersection etc) t = severity index (t = TOT [total crashes] FI [fatal + injury crashes] PDO [property damage
only]) y = year index (y = 1 [base year] 2 hellip Y) cy = yearly calibration factor for crash subtype s severity t and year y d = dispersion parameter w = weight MajAADT = AADT on the major road (vehday) MinAADT = AADT on the minor road (vehday) PSI = potential for safety improvement
istyC = yearly correction factor
istyκ~ = (unadjusted) predicted number of crashes at intersection i for crash subtype s severity t and year y
istyκ = (adjusted) predicted number of crashes at intersection i for crash subtype s severity t and year y
istyX = EB-adjusted estimated number of crashes α = intercept
1β = coefficient of major AADT 2β = coefficient of minor AADT
The prioritization lists for urban two-lane roads in the Northern Virginia and Bristol
districts were then developed based on the PSIs obtained for three prioritization procedures These alternative prioritization procedures were the average crash rates (ACRs) for the study period (see Equation 23) the critical crash ratio (CCR) (see Eqs 24 through 27) (Garber and Hoel 2009) and the EB method The list was developed with the intersections having the highest PSI listed first followed by other intersections in descending order The execution of the EB method prioritization process was achieved through use of the computer codes in SAS Finally the effectiveness of using the EB method for prioritizing sites for safety improvement was illustrated by comparing the PSIs from using intersection crash rates critical crash and the EB procedures
16
Procedure for Crash Rate Method The ACR for the intersection is given as
( )(1000000)( )( )(365)T
TCACRN V
= (Eq 23)
where ACR = the average crash rate for the intersection under consideration (crashes1000000
approach volume) TC = number of crashes over the study period at the intersection N = duration of study period (yr) VT = average daily total approach volume at the intersection Procedure for Critical Rate Method
The critical rate method was accomplished by first computing the traffic base (TB) of the intersection under consideration using Equation 24 The ACR for the intersection under consideration is then computed using its TB as shown in Equation 25 The intersection critical crash rate (ICCR) is then determined using Equation 26 The critical crash ratio (CCR) for the intersection is then computed as the ratio of ICR and the average crash rate (AVR) for all intersections under the same category (intersection type urbanrural etc) as that for the intersection being considered using Equation 27 TB is given as
365
1 000 000
NxVxTB = (Eq 24)
where TB = the total approach volume over the study period of N years at the intersection under consideration (veh1000000) V = average daily approach volume at the intersection under consideration ACR is obtained as
TCACRTB
= (Eq 25)
where ACR = ACR at the intersection under consideration over the study period of N years
17
TB = the total approach volume over the study period of N years at the intersection under consideration (veh1000000) The critical crash rate (ICCR) for the intersection under consideration is given as
05 AVRICCR AVR TFTB TB
= + + (Eq 26)
where AVR = ACR for intersections within the state and of the same designation (eg rural three-leg with minor stop control) as that for the intersection under consideration TF = number of standard deviations for the confidence level being used in the analysis (usually 196 for 95 confidence level) TB = the total approach volume over the study period of N years at the intersection under consideration (veh1000000) The critical crash ratio (CCR) for the intersection is then obtained as
ACRCCRICCR
= (Eq 27)
where ACR = ACR at the intersection under consideration over the study period of N years (see Eq 2) ICCR = critical crash rate for the intersection under consideration (see Eq 26)
Benefits and Implementation Expectations
The expected benefits from developing SPFs and prioritizing intersection sites were illustrated by comparing the PSIs for the prioritized sites when sites were prioritized using the EB method with those obtained when sites were prioritized using crash rates and the critical crash ratio This analysis was conducted for the combined fatal plus injury crashes SPFs An estimate of the cost savings attributable solely to the potential reduction of crashes was also computed by using crash costs given in an FHWA study (FHWA 2005)
18
RESULTS AND DISCUSSION
Literature Review
SafetyAnalyst
The SafetyAnalyst Userrsquos Manual (ITT Corporation 2008) has SPFs that are suggested for intersections that are based on Minnesota data Tables 7 and 8 show the regression coefficients (α β1 and β2) for the SPFs developed for total and combined FI crashes respectively The values for the goodness of fit parameter RFT
2 are also given Although these RFT2 are all less
than 045 with a few less than 010 it has been suggested that the SPFs used in SafetyAnalyst could provide a realistic estimate of an expected crash frequency as a function of traffic volume and roadway geometry (Pham and Ragland 2005)
Methodological and Research References
Several studies similar to this study have been conducted in Canada Colorado California Texas New York and Minnesota For example a study was conducted using data from Colorado California and Texas to examine the functional form of the SPFs for urban freeways (Kononov et al 2008) Five years of crash data were acquired from the respective departments of transportation and the highway safety information system from Colorado The study revealed that the amount of crashes increased moderately with congestion in segments on urban freeways This study however did not include intersections
A study by Lyon et al was conducted in Toronto Ontario Canada to develop SPFs for urban signalized intersections (Lyon et al 2005) Collision data were gathered for five years and included 1950 urban intersections SPFs were developed for different severity levels impact types and intersection types such as four-leg and three-leg intersections The format used to develop the SPFs is shown in Equation 28 This format is somewhat different from that of Equation 4 suggested in Safety Analyst
Collisionsyear = α (F1)β1(F2)β2 exp (β3X1 + β4X2 + ) (Eq 28) where α and βi = the coefficients estimated in the SPF calibration process F1 and F2 = the entering AADTs on the major and minor roads respectively Xi = other independent variables (such as single lane versus multilane approaches with and without left-turn lanes or right-turn lanes high and low pedestrian activities or in some cases F1 or F2 or both)
19
Table 7 SafetyAnalystrsquos SPFs for Intersections (Total Crashes) Site
subtype Code
Site subtype Description
State Regression coefficients
LogIntercept (α)
Regression coefficients
LogAADTmaj (β1)
Regression coefficients LogAADT
min (β2)
Over - dispersion Parameter
(k)
RFT2
() Number of Sites
Max AADTmaj
(vehday)
Max AADTmin
(vehday)
Rural 201 Rural 3-leg with minor-
road STOP control MN -878 071 024 107 133 1706 28500 27000
202 Rural 3-leg with all-way STOP control
MN -1237 122 027 047 41 41 25300 6803
203 Rural 3-leg with signal control
MN -657 066 02 033 26 136 36400 11500
204 Rural 4-leg with minor-road STOP control
MN -896 065 047 07 299 2114 35500 26700
205 Rural 4-leg with all-way STOP control
MN -1237 122 027 047 41 41 25300 6803
206 Rural 4-leg with signal control
MN -657 066 02 033 26 136 36400 11500
Urban 251 Urban 3-leg with minor-
road STOP control MN -535 034 028 128 59 397 68000 18900
252 Urban 3-leg with all-way STOP control
MN -1237 122 027 047 41 41 25300 6803
253 Urban 3-leg with signal control
MN -985 097 018 023 414 33 50000 25807
254 Urban 4-leg with minor-road STOP control
MN -312 027 016 086 76 333 58870 81000
255 Urban 4-leg with all-way STOP control
MN -1237 122 027 047 41 41 25300 6803
256 Urban 4-leg with signal control
MN -347 042 014 032 264 418 75000 81000
ITT Corporation 2008
20
Table 8 SafetyAnalystrsquos SPFs for Intersections (Fatal and Injury Crashes) Site
subtype Code
Site subtype Description
State Regression coefficients
LogIntercept (α)
Regression coefficients
LogAADTmaj (β1)
Regression coefficients LogAADT
min (β2)
Over - dispersion Parameter
(k)
RFT2
() No of Sites
Max AADTmaj
(vehday)
Max AADTmin
(vehday)
Rural 201 Rural 3-leg with minor-
road STOP control MN -935 071 021 123 91 1706 28500 27000
202 Rural 3-leg with all-way STOP control
MN -1002 127 -022 089 248 41 25300 6803
203 Rural 3-leg with signal control
MN -783 075 014 05 215 136 36400 11500
204 Rural 4-leg with minor-road STOP control
MN -936 066 04 0 146 2114 35500 26700
205 Rural 4-leg with all-way STOP control
MN -1002 127 -022 089 248 41 25300 6803
206 Rural 4-leg with signal control
MN -783 075 014 05 215 136 36400 11500
Urban 251 Urban 3-leg with minor-
road STOP control MN -845 049 039 123 81 397 68000 18900
252 Urban 3-leg with all-way STOP control
MN -1002 127 -022 089 248 41 25300 6803
253 Urban 3-leg with signal control
MN -1022 091 021 027 362 33 50000 25807
254 Urban 4-leg with minor-road STOP control
MN -435 029 019 099 57 333 58870 81000
255 Urban 4-leg with all-way STOP control
MN -1002 127 -022 089 248 41 25300 6803
256 Urban 4-leg with signal control
MN -511 049 016 03 295 418 75000 81000
ITT Corporation 2008
21
The study examined the impact of two left turn priority treatments which were flashing advanced green (FAG) and left turn green arrow (LTGA) on left turn collisions These treatments were implemented at 35 intersections in the city of Toronto Two types of collisions were investigated left turns with and without side impact The results indicated that there was an insignificant difference in the impact of the left turn priority treatments on both types of crashes
Lord and Persaud (2003) conducted a study that related SPFs to transportation planning models They noted that traffic safety is not usually accounted for when agencies are conducting a planning analysis to remodel build upgrade or modify their facilities Five-year intersection data from Canada were used Models were developed and statistical measures such as the over dispersion parameter were calculated and conclusions were made from the results The SPFs developed for the study were applied to two sample networks created with the help of a transportation planning software package The research showed that it is possible to make estimation for traffic safety at the planning stage of a project This will allow users to take safety into consideration when designing and possibly create alternatives to change existing designs for more comprehensive projects or development The study also indicated that there are limitations when applying the SPFs to computerized transportation networks The study concluded that although it is possible to predict or estimate crashes on digital transportation networks the accuracy of prediction relies greatly on how precise the traffic flow estimates are
Jonsson et al (2007) performed an SPF study that took into consideration the type and severity of crashes andmdashmost importantmdashthe causal factors for these crashes The study was conducted for intersections on rural four-lane highways in the state of California Four collision types were tested in the study opposite-direction same-direction intersecting-direction and single-vehicle crashes In addition a set of data from the state of New York was used with the same parameters to analyze the severity distribution of crash types The data for California included 1084 intersections on four-lane rural highways and that from New York included 675 intersections mainly stop controlled or without any control Generalized linear modeling was performed with the data after quality analysis Two model forms were estimated with the variables seen in Equations 29 and 30
(Eq 29)
(Eq 30)
where NAcc = predicted number of crashesyr at intersections AADTmajor = AADT on major road AADTminor= AADT traffic flow on minor road Βi = model parameters Xi = variables that describe the intersections (such as terrain lighting left turn number of though lanes and divided or undivided among others)
nn xxxormajorAcc exAADTxAADTN ββββββ ++++=
min4433021
nn xxxormajorAcc exAADTAADTN βββββ +++++=
min332201)(
22
The two different models are different representations of the traffic flow The first represents the AADT of major and minor roads as separate variables but in the second model they are represented as one variable by the sum of the major and minor roads AADTs Results showed that the first model performed better for the multiple-vehicle crashes and the second model fitted better for the single-vehicle crashes In addition the appropriate predictor variables differed depending on the crash type This study is also of interest as it incorporated additional parameters to those in the suggested SPFs now included in SafetyAnalyst and therefore could lead to possible future SPF research for the state of Virginia
Persaud and Nguyen (1998) conducted a study on signalized intersections in Ontario Canada They developed aggregate and disaggregate models to estimate safety performance of three- and four-leg intersections in which crash severity (injury and PDO) environmental class (semi-urban and rural) and time period (daily weekday morning peak and weekday afternoon peak) were considered in the analysis An important aspect of that study is that it supplemented the existing models used for estimating SPFs instead of replacing them because it took into consideration features that were generally not considered in the then existing developed models Two model levels were considered for the study Level 1 was based on the sum of AADTs for all approaches with separate estimates for rear-end right angle and turning movement crashes At this level the equations were adjusted for three- and four-leg intersections by crash severity for all combined impact types and also separately for the three major impact types which were angle rear-end and turning movement In addition models were further separated by time period (daily weekday morning and afternoon peak) and for four-leg intersections which were also classified by environment class such as semi-urban and rural Level 2 allowed estimates to be obtained for specific crash patterns that were defined by movements of the vehicles involved before collision and the same were estimated as a function of the flows that were relevant to each of the patterns For this level models were estimated for four-leg intersections for 12 multi-vehicle and three single-vehicle patterns that were described by the movements of involved vehicles before collision The developed models were intended to estimate the parameters P and d shown in Equations 31 and 33
The safety of the intersection was estimated using the long-term mean based on the EB approach The long term mean (m) was obtained by combining crash count (x) of an intersection in the most recent years (n) with the estimates of the expected annual number of crashes (P) as shown in Equation 31 W1 and W2 in Equations 31 through 33 represent the weights estimated from the mean and variance of the regression estimates
(Eq 31)
(Eq 32)
(Eq 33)
m =W1(x) +W2(P)
2dW
d nP=
+
1PW
d nP=
+
23
(Eq 34)
To estimate the variance of m the following formula was used
(Eq 35)
In Equations 32 through 35 P and d represent the fundamental parameters Two models were selected for SPFs For Level 1 and single-vehicle Level 2 (Eq 36) For multi-vehicle in Level 2 (Eq 37) where P = expected number of crashes of a given type α and β = regression parameters to be estimated S (Level 1) = sum of all entering flows for a given time period for Level 1 analysis S (Level 2) = sum of the daily through right or left turn flows for a given time period for Level 2 (single-vehicle) analysis S1 and S2 = AADTs for small and large flows for a specific crash pattern in Level 2 (multi-vehicle) analysis
The models in either level can be used in the EB procedure to provide estimates for intersections that need to be treated or for the evaluation of the effectiveness of safety countermeasures It should be noted that the quality of the estimates for the study was strongly related to how the parameters were selected and used in the SPFs and unlike other available road models the ones presented in this study can be separated by time period and crash pattern Persaud et al (2002) conducted a study to demonstrate the complexity involved in the calibration of crash prediction models or SPFs for urban intersections Toronto data for three- and four-leg signalized intersections were used to estimate the models for the study The performance of these models was then compared with other models from Vancouver and California The models from these places were recalibrated to fit Toronto by using the Interactive Highway Safety Design Model (IHSDM) and a calibration procedure as proposed by Harwood et al (2000) The results varied significantly and were also mixed The study noted that the calibration of models is not a simple task and due to the importance of the SPFs they must be properly calibrated Several things must be accounted for when performing this procedure in order to obtain good quality data analysis The first thing is to extract a large sample of high quality data A software or program to link all the traffic crash and road characteristics data must exist because the same is usually kept stored in different databases In addition several
2Pd
Var P=
2( )
d xVar m dnP
+=
+
P =αSβ
P =αS1β1 S2
β 2
24
years of crash data must be obtained in order to have a good amount of samples that account for variations The actual process of model calibration is complicated therefore careful attention must be paid when analyzing the same because of the importance of the outcomes of the study The authors of the study made an exploratory analysis and it revealed that the relationship between the crashes and each covariate should be described either by the power function or the gamma function for all intersection types to be analyzed Equations 38 through 40 are the selected model forms used in the study F1 = Power F2 = Gamma (Eq 38) F1 = Gamma F2 = Power (Eq 39) F1 = Power F2 = Power (Eq 40) where E (K) = expected annual number of crashes between 1990 and 1995 F1 F2 = average entering AADT of major and minor roads respectively for the period 1990 to 1995 α β1 β2 β3 β4 = coefficients to be estimated
An NB structure was used to analyze the models and the overdispersion parameter (γ) was analyzed using Equation 41
γ=
2)K(E)K(Var (Eq 41)
Variance increases as γ decreases therefore the value of γ can also be used to make a comparison for the goodness of fit of several models fitted to the same data The larger the value of γ the smaller the variance therefore a more accurate model is given The authors suggest that γ would be enough to calculate the goodness of fit index of any SPF but if one desires to know how accurate the prediction estimate is other measures should also be computed The authors suggested using R2
α as proposed by Miaou et al (1996) which is a dispersion parameter based R2 computed as shown in Equation 42
γγ
minus=αmin2 1R (Eq 42)
where γ = overdispersion parameter for calibrated model γmin = smallest possible overdispersion parameter
The authors suggested that a disaggregation by traffic volume is preferable than using
only a single calibration factor for that is what the IHSDM currently has A recommendation is made to account for safety variation in traffic conditions over time by calibrating the models every two to three years as suggested by Harwood et al (2000)
E(K) =αF1β1 F2
β 2e(β 3F2 )
E(K) =αF1β1 F2
β 2e(β 4 F1 )
E(K) =αF1β1 F2
β 2
25
The Illinois Department of Transportation and the University of Illinois Urbana-Champaign conducted a research study to develop and implement SPFs for road segments and intersections in Illinois (Tegge et al 2010) These SPFs were developed in a way suitable for easy implementation in SafetyAnalyst The crash data (number of crashes and crash severity) and roadway data (number of lanes traffic volume area type and functional class) were collected and used for development of the SPFs Seventeen peer groups were used for developing the SPFs for segments and eight for intersections The intersections peer groups were minor leg stop control all-way stop control signalized and undetermined for rural and urban segments separately The SPFs for segments were developed using NB distribution for crashes and Poisson distribution for intersections The SAS GENMOD procedure was used to develop the SPFs for a five-year analysis period from 2001 to 2005 The model form for the intersection SPFs is the same as that given in the SafetyAnalyst Userrsquos Manual The SPFs were also developed for different crash severities such as fatal crashes type A injury crashes type B injury crashes and fatal plus injury crashes The EB method was used to determine the sites with the higher PSIs Two analysis techniques were used to obtain the PSIs The first considered segments and intersections as individual elements and the second used the sliding window approach The site specific analysis treated each individual segment and intersection as a separate entity Each segment is then compared with every other segment instead of having them grouped together The sliding window approach defined a set length The window lengths were 025 mile and 1 mile for urban and rural segments respectively
The largest impact on crash frequency was found to be the AADT and was therefore the only variable modeled as a logarithm (lnAADT) By doing this the AADT accounted for most of the prediction whereas the rest of the variables refined the prediction further Other variables used included access control functional class lane width surface type area type speed limit and median type The study recommended that a multivariate analysis be conducted for such studies to show how certain variables could contribute to the crashes Other variables could include roadway lighting weather and pavement conditions and roadway geometry The study also concluded that knowledge of roadway characteristics that increase the risk of fatal or injury crashes will facilitate the setting up of safety criteria that can help engineers in the designing of safer roadways Further knowledge of driver behaviors that lead to fatal and severe injury crashes can facilitate the training of enforcement officers to identify these behaviors
The Colorado Department of Transportation (CDOT) (2009) conducted a study to develop SPFs for intersections in the state Their model form is the same as that in SafetyAnalyst The SPFs were developed for many categories based on the number of legs divided undivided rural and urban including urban four-lane divided signalized six-lane divided signalized urban three-leg signalized two-lane undivided unsignalized and urban three-leg unsignalized When a median or left-turn lane is present a roadway is considered divided The sites selected for the study reflected variability in traffic volume and geometry in order to have a diverse representation of intersections throughout the state SPFs were developed for total and for fatal plus injury crash types A five-year study period from 2000 through 2005 was used Crash and AADT data were collected for development of the SPFs CDOT used a NB error structure to develop the SPFs and the EB procedure to estimate the expected safety performance of an intersection site for different safety management purposes Overdispersion parameters were computed and used as a goodness of fit measure According to their data
26
overdispersion parameters indicated that their models provided a reasonable fit to the Colorado data
Results indicated that for signalized intersections roads with six lanes on major approaches have more collisions than those with four lanes on major approaches CDOT recommended that the SPFs should be recalibrated in the future using data from future years as crash frequencies may change over time because of a variety of issues The report also recommended that separate calibration factors should be developed for different regions and different topographies Research in Virginia
In Virginia two other similar studies have recently been published One by Garber et al (2010) for two-lane roads and another by Hamidi et al (2010) to identify high-crash sections on Virginiarsquos primary system by developing a planning-level methodology The study by Garber et al developed SPFs for two-lane segments of 1 mile or less and the study by Hamidi et al developed SPFs for longer segments of two-lane roads that can be used for corridor analysis
Evaluation of the Recommended Minnesota SPFs
Figures 3 through 6 show representative graphs that were used to visually examine how well the Virginia data fitted the suggested Minnesota SPFs Figures 3 and 4 are for urban four-leg signalized intersections and Figures 5 and 6 are for rural four-leg signalized intersections These graphs suggest that the Minnesota SPFs do not fully represent the Virginia data Tables 9 through 12 show the Freeman-Tukey R2
FT coefficients computed for the different Minnesota SPFs using the Virginia data The low Freeman-Tukey R2
FT coefficients obtained and the visual inspection of the graphs suggested that a better fit to the Virginia data could be obtained by developing specific Virginia SPFs using Virginia data It was therefore decided to develop specific SPFs for Virginia
0
2
4
6
8
10
12
14
0 20000 40000 60000 80000 100000 120000
AADT Major
Tota
l Cra
shes
Per
Yea
r
Minnesota VA Actual Observed
Minnesota Model
Figure 3 Total crashes per year vs major AADT for urban 4-leg signalized intersections
with minor AADT of 700
27
0
5
10
15
20
25
30
35
0 20000 40000 60000 80000 100000 120000
AADT Major
Tota
l Cra
shes
per
Yea
r
Minnesota VA Actual Observed
Minnesota Model
Figure 4 Total crashes per year vs major AADT for urban 4-leg signalized intersections
with minor AADT of 4500
0
2
4
6
8
10
12
14
0 20000 40000 60000 80000 100000 120000
AADT Major
Tota
l Cra
shes
Per
Yea
r
Minnesota VA Actual Observed
Minnesota Model
Figure 5 Total crashes per year vs major AADT for rural 4-leg signalized intersections with
minor AADT of 795
28
0
2
4
6
8
10
12
14
16
18
0 20000 40000 60000 80000 100000 120000
AADT Major
Tota
l Cra
shes
per
Yea
r
Minnesota VA Actual Observed
Minnesota Model
Figure 6 Total crashes per year vs major AADT for rural 4-leg signalized intersections with
minor AADT of 5000
Table 9 Minnesota SPFs for Urban FI Crashes and Corresponding R2FT Based
on Virginia Data
Intersection Type
Minnesota FI SPFs R2
FT Based on Virginia Urban FI Crash Data ()
Urban 4-Leg Signalized 032
Urban 4-Leg Minor Stop Control 008
Urban 3-Leg Signalized 026
Urban 3-LegMinor Stop Control 01
Table 10 Minnesota SPFs for Urban TOTAL crashes and Corresponding R2
FT Based on Virginia Data
Type of Intersection
Minnesota SPFs
R2FT Based on Virginia Urban Total
Crash Data ()
Urban 4-Leg Signalized 034
Urban 4-Leg Minor Stop Control 022
Urban 3-Leg Signalized 031
Urban 3-Leg Minor Stop Control 01
29
Table 11 Minnesota SPFs for Rural TOTAL Crashes and Corresponding R2FT
Based on Virginia Data
Type of Intersection
Minnesota SPFs R2
FT Based on Virginia Rural Total Crash Data ()
Rural 4-Leg Signalized 029
Rural 4-Leg Minor Stop Control 013
Rural 3-Leg Signalized 029
Rural 3-Leg Minor Stop Control -010
Table 12 Minnesota SPFs for Rural FI Crashes and Corresponding R2FT Based
on Virginia Data
Type of Intersection
Minnesota SPFs R2
FT Based on Virginia Rural FI Crash Data ()
Rural 4-Leg Signalized 018
Rural 4-Leg Minor Stop Control 010
Rural 3-Leg Signalized 018
Rural 3-Leg Minor Stop Control 001
Development and Evaluation of Specific Virginia SPFs
In keeping with the suggestion given in the Safety Analyst Userrsquos Manual the model form used to develop the intersection SPFs is given in Equation 4 as
1 2k e x MajAADT x MinAADTβ βα=
where
k = predicted crash frequency per intersection per year MajAADT = AADT on the major road (vehday) MinAADT = AADT on the minor road (vehday) α = intercept β1 = coefficient of mayor AADT β2 = coefficient of minor AADT
30
The statewide SPFs developed for Virginia are given in Tables 13 through 16 Due to lack of data the analysis for all-way stop intersections could not be undertaken These tables also give the Freeman-Tukey R2
FT coefficient for each of the Virginia SPFs and the corresponding Minnesota SPF and Freeman-Tukey R2
FT based on the Virginia data The R2FT coefficients
obtained indicate that the Virginia-specific SPFs fit the Virginia data better than the suggested Minnesota SPFs for all types of intersections and crash severity except those for FI crashes on urban three-leg signalized rural four-leg signalized and rural four-leg minor stop control intersections where the corresponding RFT
2 values are similar In Table 15 it can be seen that the Minnesota R2
FT value is negative for the rural three-leg minor stop control intersections The negative RFT
2 value is possible because these calculations were not performed on the same data points that were used to create the Minnesota SPFs (Miller 2009) Table 13 SPF Models for Urban TOTAL crashes and R2
FT results for Virginia Statewide (VDOT-maintained roads)
SPF model with TOTAL Crash values
R2FT TOTAL
Crash Data
Site Virginia Statewide Minnesota VA MN
Urban 4-Leg Signalized 056 034
Urban 4-Leg Minor Stop Control
032 022
Urban 3-Leg Signalized 037 031
Urban 3-Leg Minor Stop Control
023 010
Table 14 SPF Models for Urban FI crashes and R2
FT results for Virginia Statewide (VDOT-maintained roads)
SPF model with FI Crash values R2FT FI Crash Data ()
Site
Virginia Statewide Minnesota VA MN
Urban 4-Leg Signalized 041 032
Urban 4-Leg Minor Stop Control
019 008
Urban 3-Leg Signalized 026 026
Urban 3-Leg Minor Stop Control
013 010
31
Table 15 SPF Models for Rural TOTAL Crashes and R2FT Results for Virginia Statewide (VDOT-
maintained roads) SPF model with TOTAL Crash values R2
FT TOTAL Crash Data
Site
Virginia Statewide Minnesota VA MN
Rural 4-Leg Signalized 0321 0290
Rural 4-Leg Minor Stop Control
0167 0132
Rural 3-Leg Signalized 0305 0291
Rural 3-Leg Minor Stop Control
0104 -0102
Table 16 SPF Models for Rural FI crashes and R2
FT results for Virginia Statewide (VDOT-maintained roads) SPF model with FI Crash values R2
FT TOTAL Crash Data
Site
Virginia Statewide Minnesota VA MN
Rural 4-Leg Signalized 0181 0181
Rural 4-Leg Minor Stop Control
0098 0097
Rural 3-Leg Signalized 0170 0180
Rural 3-Leg Minor Stop Control
0048 0012
Figures 7 through 10 show visual representations of how well the Virginia SPFs fit the
Virginia data in comparison with the suggested Minnesota SPFs In general the Virginia SPFs tend to fit the Virginia data better than the Minnesota SPFs although both sets of SPFs tend to have similar fits at low volumes (AADTmajor lt 2000) except for the SPF for total crashes on urban four-leg signalized intersections shown in Figure 7 The primary reason the Minnesota SPFs do not fit the Virginia data as well as the Virginia SPFs may be the dissimilarities of the roadside environment and the characteristics of the different databases
32
0
2
4
6
8
10
12
14
0 20000 40000 60000 80000 100000 120000
AADT Major
Tota
l Cra
shes
Per
Yea
r
Minnesota VA Actual Observed Virginia
Minnesota Model
Virginia M odel
Figure 7 Total crashes per year vs major AADT for urban 4-leg signalized intersections
with minor AADT of 700
0
5
10
15
20
25
30
35
0 20000 40000 60000 80000 100000 120000
AADT Major
Tota
l Cra
shes
per
Yea
r
Minnesota VA Actual Observed Virginia
Minnesota Model
Virginia Model
Figure 8 Total crashes per year vs major AADT for urban 4-leg signalized intersections
with minor AADT of 8000
33
0
2
4
6
8
10
12
14
0 20000 40000 60000 80000 100000 120000
AADT Major
Tota
l Cra
shes
Per
Yea
r
Minnesota VA Actual Observed Virginia
Virginia Model
Minnesota Model
Figure 9 Total crashes per year vs major AADT for rural 4-leg signalized intersections with
minor AADT of 79
0
5
10
15
20
25
0 20000 40000 60000 80000 100000 120000
AADT Major
Tota
l Cra
shes
per
Yea
r
Minnesota VA Actual Observed Virginia
Minnesota Model
Virginia Model
Figure 10 Total crashes per year vs minor AADT for rural 4-leg signalized intersections with major AADT of 5000
As discussed in the Methodology section in addition to the statewide Virginia SPFs
specific SPFs were developed for each operational region to consider the different topographical characteristics that exist across Virginia The complete set of SPFs together with the associated p values for the regression coefficients are shown in Tables A-1 and A-2 of Appendix A All p values are less than 005 with most being less than 00001 except for some of the rural four-leg signalized intersections regional specific SPFs These p values indicate that the estimated coefficients are statistically significant at the 95 confidence level or better A possible reason
34
for higher p values for a small number of SPFs may be the sample size used for developing these SPFs
To test the transferability and fit of the Virginia statewide specific SPFs several
statistical parameters were determined for the 70 (estimation) data set and the 30 (validation) data set separately The corresponding values for each of these parameters were then compared The results are shown in Tables 17 and 18 for urban and rural intersections respectively The results for the regional SPFs are shown in Tables A-3 through A-8 of Appendix A The results indicate that the developed models are transferable to the 30 validation data set For example the MSE values for the 70 estimation data are similar to the MSPE values for the 30 validation data In addition the mean prediction bias MPB values for the 30 validation data are close to zero (-076 le MPB ge -0004) in Table 17 and (-0067 le MPB ge 00513) in Table 18
Table 17 Goodness of Fit Results for Urban Statewide SPFs
Data Estimation data 70 Validation Data 30 Subtype Site MSE r2 R2
FT MPB MAD MSPE R2FT
Total VA 41150 0529 0557 -0760 4329 38490 0575
Total MN
68636 0506 0336 -3145 5421 68156 0315
FI VA
7043 0385 0406 -0458 1938 7671 0475
Urban 4-Leg Signalized
FI MN 7702 0372 0324 -0316 2124 8981 0376
Total VA 2238 0315 0313 -0034 0897 2383 0292
Total MN 2510 0287 0215 0091 0982 2730 0182
FI VA 0530 0194 0193 -0004 0432 0533 0194
Urban 4-Leg Minor Stop Control
FI MN 0560 0182 0080 0128 0522 0577 0052
Total VA 24900 0375 0370 -0645 3519 27591 0369
Total MN 29322 0365 0308 -2238 3661 33079 0272
FI VA 4467 0275 0259 -0185 1527 4875 0262
Urban 3-Leg Signalized
FI MN 4528 0267 0261 -0294 1526 4937 0261
Total VA 1854 0254 0230 -0043 0893 2038 0239
Total MN 2388 0237 0104 -0541 0902 2600 0107
FI VA 0428 0151 0133 -0021 0431 0476 0157
Urban 3-Leg Minor Stop Control
FI MN 0478 0140 0097 -0184 0385 0537 0104
35
Table 18 Goodness of Fit Results for Rural Statewide SPFs
Data Estimation Data 70
Validation Data 30
Subtype Site MSE r2 R2FT MPB MAD MSPE R2
FT
Total VA 10990 0353 0321 0513 2210 10070 -0073
Total MN 12400 0339 0290 -0154 2071 8460 0035
FI VA 2350 0196 0181 0045 1189 2600 -0034
Rural 4-Leg Signalized
FI MN 2400 0188 0181 -0043 1164 2420 0004
Total VA 1090 0182 0167 -0067 0794 1190 0171
Total MN 1190 0167 0132 -0348 0774 1320 0115
FI VA 0480 0112 0098 -0022 0504 0530 0110
Rural 4-Leg Minor Stop Control
FI MN 0500 0104 0097 -0158 0459 0560 0093
Total VA 5490 0328 0305 -0010 1651 5760 0179
Total MN NA NA NA NA NA NA NA
FI VA 1450 0181 0170 -0041 0902 1710 0099
Rural 3-Leg Signalized
FI MN NA NA NA NA NA NA NA
Total VA 0690 0144 0104 -0008 0613 0730 0102
Total MN 0890 0141 -0102 -0404 0555 0940 -0104
FI VA 0250 0071 0048 -0009 0345 0260 0048
Rural 3-Leg Minor Stop Control
FI MN 0270 0068 0012 -0144 0270 0290 0003
Pruning of Virginia-Specific SPFs A total of 64 SPFs were initially developed using the appropriate data for Virginia as shown in Tables A-1 and A-2 of Appendix A Considering that not all regional models might be necessary the pruning process described in the methodology section was carried out to prune the number of SPFs to the minimum effective number as seen in Tables 19 and 20 for urban and rural intersections respectively The pruning process resulted in 19 SPFs for urban sites and 15 for rural sites To facilitate the use of the correct SPF for a specific type of intersection located in a specific region the lists of the appropriate SPFs to be used are given in Tables B-1 and B-2 of Appendix B for the urban and rural intersections respectively
As can be seen in Tables 19 and 20 and Tables A-1 and A-2 of Appendix A there are some trends worth discussing for the benefit of the study and possible future research With regards to the three different operational regions the Western region retained many more of the specific regional urban SPFs than any other region For example the Western regional SPFs were retained for all urban intersection sites whereas for the Eastern region the only SPFs
36
retained were those for urban four-leg signalized FI crashes and urban four-leg minor stop control for total and FI crashes Similarly the only urban SPF retained for the Northern region was that for urban four-leg minor stop control for total crashes For the rural intersection sites all of the Western regional SPFs were retained except those for rural three-leg signalized total and FI crashes and rural four-leg minor stop control FI crashes The majority of the Eastern region rural SPFs were discarded except those for rural four-leg signalized total and FI crashes while for the Northern region all regional SPFs were discarded
The Western region retained more specific regional SPFs than the other two regions This suggests that the intersections in the Western region exhibit more unique characteristics than those for the other regions This may be due to the more mountainous terrain in the Western region compared to those in the Eastern and Northern regions This supports the philosophy of developing specific SPFs based on the topography of different regions
Site Prioritization
To illustrate the benefits of using the EB method to prioritize intersection sites for safety
improvements the top 25 urban sites from the Bristol and Northern Virginia districts were identified by using crash rates critical crash ratio and the EB method The PSI for each site identified was then determined The results obtained are shown in Tables 21 and 22 for the Bristol and the Northern Virginia districts respectively The results indicate that for the Northern Virginia District the PSIs for the top 25 sites are 258 1317 and 27440 crashes per year and for the Bristol District 432 646 and 1496 crashes per year for the crash rates critical crash ratio and EB methods respectively The important thing in Tables 21 and 22 is the sum of the PSI columns ranked by the three methods The sum of each of the PSIs for the crash rate and critical crash ratio method is lower than that for the EB method These results suggest that the use of the EB method in the planning process will identify intersection sites with the highest PSIs and therefore where detailed assessments to determine feasible and effective safety treatments should be undertaken
37
Table 19 MSPE Values for Virginia Urban Statewide and Urban Regional SPFs Used for Pruning
Data Pruning
Subtype
Site
MSPE [MSPEVA-
MSPEOR]1 [abs(MSPEVA-
MSPEOR)]2 [abs(MSPEVA-
MSPEOR)MSPEVA]3
RetainDiscardTotal VA 3849 Northern 4486 -637 637 0165497532 Discard Western 1791 2058 2058 0534684334 Retain Eastern 3745 104 104 0027020005 Discard FI VA 7671 Northern 95 -1829 1829 0238430452 Discard Western 517 2501 2501 0326033112 Retain
Urban 4-Leg Signalized
Eastern 541 2261 2261 0294746448 Retain Total VA 23834 Northern 202 03634 03634 015247126 Retain Western 105 13334 13334 0559452882 Retain Eastern 115 12334 12334 0517496014 Retain FI VA 05327 Northern 048 00527 00527 0098929979 Discard Western 033 02027 02027 0380514361 Retain
Urban 4-Leg Minor Stop Control
Eastern 036 01727 01727 0324197485 Retain Total VA 275911 Northern 2687 07211 07211 0026135239 Discard Western 2441 31811 31811 0115294425 Retain Eastern 3878 -111889 111889 0405525695 Discard FI VA 48754 Northern 448 03954 03954 0081101038 Discard Western 339 14854 14854 0304672437 Retain
Urban 3-Leg Signalized
Eastern 586 -09846 09846 020195266 Discard Total VA 20379 Northern 219 -01521 01521 0074635654 Discard Western 164 03979 03979 0195250012 Retain Eastern 223 -01921 01921 0094263703 Discard FI VA 04756 Northern 05 -00244 00244 0051303616 Discard Western 038 00956 00956 0201009251 Retain
Urban 3-Leg Minor Stop Control
Eastern 05 -00244 00244 0051303616 Discard 1 Difference between mean square prediction error (MSPE) of Virginia statewide model and OR model 2 Absolute value of the difference between Virginia statewide model MSPE and operational region model MSPE 3 Absolute value of the difference between Virginia statewide model MSPE and operational region model MSPE divided by the Virginia statewide MSPE for comparison
Retained SPFs Discarded if value is negative Discarded if less than 01
38
Table 20 MSPE Values for Virginia Rural Statewide and Rural Regional SPFs Used for Pruning Data Pruning
Subtype
Site
MSPE
[MSPEVA-MSPEOR]1
[abs(MSPEVA-MSPEOR)]2
[abs(MSPEVA-MSPEOR)MSPEVA]3
RetainDiscard
Total VA 1007 Northern 3422 -2415 2415 2398212512 Discard Western 605 402 402 0399205561 Retain Eastern 512 495 495 0491559086 Retain FI VA 26 Northern 976 -716 716 2753846154 Discard Western 159 101 101 0388461538 Retain
Rural 4-Leg Signalized
Eastern 137 123 123 0473076923 Retain Total VA 119 Northern 164 -045 045 0378151261 Discard Western 102 017 017 0142857143 Retain Eastern 114 005 005 0042016807 Discard FI VA 053 Northern 052 001 001 0018867925 Discard Western 048 005 005 0094339623 Discard
Rural 4-Leg Minor Stop Control
Eastern 049 004 004 0075471698 Discard Total VA 576 Northern 1475 -899 899 1560763889 Discard Western 674 -098 098 0170138889 Discard Eastern 626 -05 05 0086805556 Discard FI VA 171 Northern 212 -041 041 0239766082 Discard Western 403 -232 232 1356725146 Discard
Rural 3-Leg Signalized
Eastern 157 014 014 0081871345 Discard Total VA 073 Northern 093 -02 02 0273972603 Discard Western 053 02 02 0273972603 Retain Eastern 069 004 004 0054794521 Discard FI VA 026 Northern 03 -004 004 0153846154 Discard Western 023 003 003 0115384615 Retain
Rural 3-Leg Minor Stop Control
Eastern 027 -001 001 0038461538 Discard 1 Difference between mean square prediction error (MSPE) of Virginia statewide model and OR model 2 Absolute value of the difference between Virginia statewide model MSPE and operational region model MSPE 3 Absolute value of the difference between Virginia statewide model MSPE and operational region model MSPE divided by the Virginia statewide MSPE for comparison
Retained SPFs Discarded if value is negative Discarded if less than 01
39
Table 21 PSIs for Top 25 Sites in District 1 Urban (Bristol) FI
Crashes Ranking Based on Crash
Rates Ranking Based on Crash Ratio Ranking Based on EB
Method
Rank Intersection Node
Crash Rate1 PSI2 Intersection
Node Crash Ratio3 PSI Intersection
Node PSI
1 596726 22112 00000 651193 39672 00000 596095 21413
2 606469 20079 00000 606238 39298 06297 596393 08787
3 706818 12504 00000 651075 31264 00000 651130 08453
4 651193 11550 00000 596726 29227 00000 596701 07112 5 651075 09369 00000 606469 28039 00000 651802 06929 6 606238 08382 06297 651233 25831 03612 636331 06726 7 651807 07089 00000 651130 22718 08453 596395 06579 8 651233 06068 03612 706818 22555 00000 596937 06415 9 651230 05990 00000 651230 20301 00000 606238 06297
10 651783 05756 00000 651210 18882 04747 661033 06061 11 636093 04960 00000 636331 17913 06726 596372 05417 12 651274 04475 00000 651807 16847 00000 636372 04808 13 651130 04179 08453 651805 15814 00000 651210 04747 14 651210 03918 04747 651223 15627 03589 636491 04649 15 636331 03393 06726 651783 15009 00000 596420 04633 16 651223 03363 03589 596095 14865 21413 596403 04579 17 606232 03331 00000 636405 14769 00000 651603 04531 18 651127 03053 00000 661033 14555 06061 636056 04351 19 651999 03048 00000 596353 14215 03717 712033 04110 20 596449 02962 00000 636093 13782 00000 704691 04102 21 636405 02811 00000 651879 13192 00000 651838 04100 22 651883 02698 00000 651274 12975 00000 651894 03878 23 596353 02686 03717 651127 12972 00000 596353 03717 24 651805 02663 00000 651999 12959 00000 651233 03612 25 661033 02500 06061 596449 12702 00000 651889 03601
sum 43202 sum 64615 sum 149606 1Number of crashes per year per 1000000 total approach volume 2Potential for safety improvement (crashes yr) the difference between the EB-adjusted long-term crashes and the SPF-estimated crashes 3Ratio of actual crash rate to critical crash rate
40
Table 22 PSIs for Top 25 Sites in District 9 Urban (Northern Virginia District) FI
Crashes Ranking Based on Crash
Rates Ranking Based on Crash Ratio Ranking Based on EB
Method
Rank Intersection Node
Crash Rate1 PSI2 Intersection
Node Crash Ratio3 PSI Intersection
Node PSI
1 718192 191841 00000 718192 257523 00000 264119 150122 2 702946 178194 00000 547722 152371 11175 263375 140091 3 271531 64846 00000 263628 102794 00000 278648 137239 4 263628 52858 00000 263728 100092 00000 276819 131395 5 263728 42215 00000 719754 95274 09444 263290 130743 6 266955 35294 00000 702946 79268 00000 722678 127897 7 547722 34932 11175 263403 77252 05184 264725 118671 8 702612 30441 00000 704237 77175 07648 267028 116627 9 273886 29539 00000 263729 74681 00000 265204 115925
10 716747 27632 00000 271531 72327 00000 274766 115679 11 263626 27139 00000 263135 66458 18068 263249 113372 12 269485 26567 00000 716747 64461 00000 547044 110769 13 728954 26344 00000 266955 56657 00000 549349 107180 14 263729 25208 00000 546138 52003 31028 268210 105630 15 546988 21922 00000 547544 51924 32529 263347 104257 16 274338 21446 00000 263626 50389 00000 276351 102313 17 429308 21354 00000 269485 49897 00000 428167 100064 18 720401 21197 00000 728954 49702 00000 264344 98789 19 267295 20954 00000 548686 49572 03621 277764 91554 20 267536 20874 00000 711601 47985 04440 263467 89259 21 265938 20484 00000 266970 47730 00000 263090 89199 22 273354 20108 00000 546462 46856 03620 703414 88610 23 268345 19362 00000 265938 46726 00000 428629 87379 24 719754 19073 09444 720401 44833 00000 272219 85659 25 263403 19015 05184 728496 43666 04990 428544 85610
Sum 25803 sum 131747 sum 2744033 1Number of crashes per year per 1000000 total approach volume 2Potential for safety improvement (crashes yr) the difference between the EB-adjusted long-term crashes and the SPF-estimated crashes 3Ratio of actual crash rate to critical crash rate
41
CONCLUSIONS
bull The development of SPFs for intersections is necessary for Virginia because the SafetyAnalyst-suggested SPFs which are based on Minnesota data do not represent the Virginia data well Regarding the fit of the SPFs to Virginia data the R2
FT values shown in Tables 13 through 16 for Minnesota and Virginia indicate that the Virginia-specific SPFs fit the Virginia data better than the Minnesota models This may be due to the dissimilarities of the roadside environment such as difference in topography and the characteristics of the different Virginia and Minnesota databases
bull In some cases the specific regional SPFs fit the regional data better than the statewide
SPFs suggesting that the specific SPFs should be considered for use when available These group divisions that have similar roadway characteristics and driver expectations in some cases tend to improve the fit
bull In identifying intersection sites for safety improvements it is clearly beneficial for the EB
method to be used with the suitable SPFs rather than a crash rate or critical ratio method Results of the site prioritization show a much higher potential for crash reduction when the EB method is used with the appropriate SPFs rather than a procedure based on crash rates or critical rates
RECOMMENDATIONS
1 VDOTrsquos TED should use the Virginia-specific SPFs when using the SafetyAnalyst tools The results of this study have shown that the Virginia-specific SPFs reflected the Virginia data better than the SafetyAnalyst-recommended Minnesota SPFs
2 VDOTrsquos TED should investigate the feasibility of using multiple SPFs in SafetyAnalyst If
feasible regional SPFs should be used If it is not currently feasible to use multiple SPFs VDOTrsquos TED should ask that the FHWA include regional information in SafetyAnalyst so as to allow the use of regional SPFs For the specific regional SPFs to be applied to Virginia and other states the SafetyAnalyst tool should be capable of incorporating the necessary data that support the regional models
3 As soon as it is feasible to use regional SPFs VDOTrsquos TED should use the 19 SPFs
developed for urban intersections and the 15 developed for rural intersections when using the tools in SafetyAnalyst Although the statewide SPFs are available for use by an analyst the specific regional models included in the final set of SPFs will predict crashes better than the statewide SPFs The regional analysis will not only ease the use of specific regional SPFs but will also be of benefit when predicting the potential for safety improvement of a specific site
4 For future similar SPF studies VDOTrsquos TED should be directly involved in screening the
traffic data for accuracy and consistency as was done in this study The direct involvement of the TED in the screening of the traffic data significantly contributed to the accuracy of the
42
data and greatly contributed to the confidence the researchers place on the data used in the study
5 The Virginia Transportation Research Council (VTRC) should conduct a study as soon as
feasible to verify whether incorporating independent variables for which data are available other than AADT such as intersection geometry and other characteristics will result in SPFs that better fit the Virginia data Although the currently suggested SafetyAnalyst SPFs use only the AADTs as the independent variables it is likely that provision will be made for use of SPFs that incorporate other independent variables such as number of approaches entering lanes and the other variables for which data are available as these SPFs are likely to give better fit to crash data
6 As soon as feasible VTRC should undertake a study to develop SPFs for the urban system
intersections which are not currently maintained by VDOT as these intersections may have different crash characteristics than those maintained by VDOT This would facilitate the use of SafetyAnalyst in programming sites that are currently not being maintained by VDOT
BENEFITS AND IMPLEMENTATION PROSPECTS
Significant benefits will be accrued by the use of the Virginia-specific SPFs developed in this study This is clearly illustrated in two ways First in examining the transferability of the suggested SPFs in SafetyAnalyst it is clear that these SPFs do not fit the Virginia data very well The results also indicate that the Virginia-specific SPFs fit the Virginia data much better than the suggested SafetyAnalyst SPFs Second the availability of the Virginia-specific SPFs will enhance the use of the EB procedure given in SafetyAnalyst for prioritizing sites for safety improvements This study has also shown that the EB method better identifies sites with higher potential for crash reduction than those identified by crash rates For example the illustrated examples given for the Bristol and Northern Virginia districts show that the potential reduction in FI crashes when the top 25 sites are identified by the EB method is 28936 (1496 + 27440) crashes per year whereas that obtained when the critical crash ratio method is used for prioritization is only 1963 (646 + 1317) and that obtained with the crash rate method is only 690 (432 + 258) crashes per year This gives a net benefit of 26973 potential crashes per year compared to the critical crash ratio method and 28246 compared to the crash rate method Assuming an average cost of FI crashes of $95629 (FHWA 2005) and only 10 of the estimated net benefit PSI of 28246 crashes per year is achieved the total savings of more than $27 million per year could be accrued The prospects for implementation of the recommendations are very high as the study was requested by VDOTrsquos TED which is planning to incorporate these SPFs in the use of the tools provided in SafetyAnalyst
43
ACKNOWLEDGMENTS
The authors appreciate the opportunity afforded them by VDOT and VTRC to conduct this study Special thanks to Stephen Read (VDOT) Dr In-Kyu Lim (VDOT) Dr Young-Jun Kweon (VTRC) and VDOTrsquos Central Office for their interest and support in SPFs and their help in the selection of intersection sites Many thanks to Lewis Woodson (VTRC) and James Hill (University of Virginia) for all their help and input throughout the study
REFERENCES Cogburn P VDOT Interagency Coordination 2007 Virginia Emergency Management
Conference Virginia Department of Transportation Richmond April 2007 Colorado Department of Transportation DTD Applied Research and Innovation Branch Safety
Performance Functions for Intersections CDOT-2009-10 Denver December 2009 Fridstroslashm L Ifver J Ingebrigtsen S Kulmala R and Thomsen LK Measuring the
Contribution of Randomness Exposure Weather and Daylight to the Variation in Road Accidents Counts Accident Analysis and Prevention Vol 27 No 1 1995 pp 1-20
Federal Highway Administration Cost of Crashes by Severity Table FHWA-HRT-05-051
Washington DC 2005 Federal Highway Administration SafetyAnalyst Home Page httpwwwsafetyanalystorg
Accessed February 2010 Garber N and Hoel L Traffic amp Highway Engineering 4th ed Cenage Learning Toronto
Canada 2009 Garber NJ Haas PR and Gosse C Development of Safety Performance Functions for Two-
Lane Roads Maintained by the Virginia Department of Transportation VTRC 10-R25 Virginia Transportation Research Council Charlottesville 2010
Hamidi A Fontaine MD and Demetsky MJ A Planning-Level Methodology for Identifying
High-Crash Sections of Virginiarsquos Primary System VTRC 11-R4 Virginia Transportation Research Council Charlottesville 2010
Harwood D Council FM Hauer E Hughes WE and Vogt A Prediction of the Expected
Safety Performance of Rural Two-lane Highways Federal Highway Administration McLean VA December 2000
Harwood DW Bauer KM Richard KR Gilmore DK Persaud B and Lyon C
Development of SPFs for Safety Analyst Interim Tools Technical Memorandum
44
Prepared by Midwest Research Institute for the Federal Highway Administration McLean VA 2004
ITT Corporation SafetyAnalyst Userrsquos Manual Turner-Fairbank Highway Research Center
McLean VA 2008 Jonsson T Ivan J and Zhang C Crash Prediction Models for Intersections on Rural
Multilane Highways Differences by Collision Type In Transportation Research Record Journal of the Transportation Research Board No 2019 Transportation Research Board of the National Academies Washington DC 2007 pp 91-98
Kweon Y-J and Lim I-K Appropriate Regression Model Types for the Empirical Bayes
Method and SafetyAnalyst In Proceedings of the 89th Annual Meeting of the Transportation Research Board Transportation Research Board of the National Academies Washington DC 2010
Kononov J Bailey B and Allery B Exploratory Examination of the Functional Form of
Safety Performance Functions of Urban Freeways Colorado Department of Transportation and San Diego State University Denver CO 2008
Lyon C Haq A Persaud B and Kodama S Safety Performance Functions for Signalized
Intersections in Large Urban Areas Development and Application to Evaluation of Left-Turn Priority Treatment In Transportation Research Record Journal of the Transportation Research Board No 1908 Transportation Research Board of the National Academies Washington DC 2005 pp 165-171
Lord D and Persaud B Estimating the Safety Performance of Urban Road Transportation
Networks Center for Transportation Safety Texas Transportation Institute Texas AampM University and Department of Civil Engineering Ryerson University College Station TX 2003 pp 609-620
Miaou S-P Lu A and Lum H S Pitfalls of using R2 to Evaluate Goodness of Fit of
Accident Prediction Models In Transportation Research Record Journal of the Transportation Research Board No 1542 Transportation Research Board of the National Academies Washington DC 2005 1996 pp 6-13
Miller P Re Negative R squared Email Archive Division of Biostatistics Washington
University in St Louis February 2 2005 February 2 2005 httpwwwbiostatwustleduarchiveshtmljmp-l2005msg00075html Accessed February 2010
Persaud B Lord D and Palmisano J Calibration and Transferability of Accident Prediction
Models for Urban Intersections In Transportation Research Record Journal of the Transportation Research Board No 1784 Transportation Research Board of the National Academies Washington DC 2002 pp 57-64
45
Persaud B and Nguyen T Disaggregate Safety Performance Models for Signalized Intersections on Ontario Provincial Roads In Transportation Research Record Journal of the Transportation Research Board No 1635 Transportation Research Board of the National Academies Washington DC 1998 pp 113-120
Pham T and Ragland D Summary of Crash Prediction Models Also known as Safety
Performance Functions (SPFs) California Partners for Advanced Traffic and Highways and University of California Berkeley Berkeley 2005
SAS Institute Inc SAS OnlineDoc Version Eight Cary NC
httpwwwtecnionacildocssasril Accessed 2009 Tegge RA Jo J-H and Ouyang Y Development and Application of Safety Performance
Functions for Illinois ICT-10-066 Illinois Center for Transportation University of Illinois Urbana-Champaign March 2010
Virginiarsquos Surface Transportation Safety Executive Committee Commonwealth of Virginiarsquos
Strategic Highway Safety Plan 2006-2010 Virginia Department of Transportation Richmond 2006
Washington S Persaud B Lyon C and Oh J Validation of Accident Models for
Intersections FHWA-RD-03-037 Federal Highway Administration McLean VA 2005
46
47
APPENDIX A
STATISTICAL PARAMETERS AND GOODNESS-OF-FIT RESULTS
Table A-1 Statistical Parameters for Urban Intersections SPFs Parameter Estimates
Data Intercept
Coefficient of Mayor AADT
Coefficient of Minor AADT
Subtype Site Intercept (α)
StndError
P value
lnMajor (β1)
StndError
P value
lnMinor (β2)
StndError
P value
Total VA -76234 048 lt0001 06742 005 lt0001 03453 003 lt0001
OR1 -83067 056 lt0001 07522 005 lt0001 0328 003 lt0001OR10 -123913 122 lt0001 10631 013 lt0001 04567 006 lt0001OR 100 -88553 077 lt0001 07825 007 lt0001 03706 004 lt0001FI VA -85256 057 lt0001 06477 006 lt0001 03579 004 lt0001OR1 -96546 063 lt0001 07603 006 lt0001 03597 004 lt0001OR10 -114284 15 lt0001 08662 016 lt0001 04412
Urban 4-Leg Signalized
OR 100 -99582 100 lt0001 07484 009 lt0001 04017 005 lt0001Total VA -60723 022 lt0001 04558 002 lt0001 0347 004 lt0001
OR1 -6059 044 lt0001 0505 004 lt0001 02773 006 lt0001OR10 -67031 057 lt0001 03986 007 lt0001 04999 009 lt0001OR 100 -65388 032 lt0001 04689 004 lt0001 043 006 lt0001FI VA -76917 032 lt0001 05001 003 lt0001 03695 005 lt0001OR1 -81437 060 lt0001 05813 005 lt0001 03188 008 lt0001OR10 -80333 063 lt0001 03446 007 lt0001 06218 010 lt0001
Urban 4-Leg Minor Stop Control
OR 100 -83166 051 lt0001 05253 006 lt0001 04695 008 lt0001Total VA -6543 082 lt0001 06591 008 lt0001 02119 002 lt0001
OR1 -4999 103 lt0001 05555 009 lt0001 01554 003 lt0001OR10 -96143 127 lt0001 08677 012 lt0001 03297 005 lt0001OR 100 -67518 110 lt0001 06157 011 lt0001 02969 005 lt0001FI VA -84268 068 lt0001 07147 006 lt0001 02481 002 lt0001OR1 -73982 099 lt0001 06496 009 lt0001 02088 003 lt0001OR10 -110104 155 lt0001 0908 015 lt0001 03226 006 lt0001
Urban 3-Leg Signalized
OR 100 -7266 107 lt0001 05508 011 lt0001 03107 006 lt0001Total VA -54696 013 lt0001 04874 002 lt0001 01985 001 lt0001
OR1 -5361 018 lt0001 04959 002 lt0001 01676 002 lt0001OR10 -5773 034 lt0001 04877 003 lt0001 02314 004 lt0001OR 100 -51642 021 lt0001 04338 003 lt0001 02309 003 lt0001FI VA -74642 018 lt0001 05791 002 lt0001 02091 002 lt0001OR1 -76877 027 lt0001 06204 003 lt0001 0181 002 lt0001OR10 -69458 047 lt0001 05096 004 lt0001 02212 005 lt0001
Urban 3-Leg Minor Stop Control
OR 100 -69883 031 lt0001 05169 004 lt0001 02308 003 lt0001 Standard Error
48
Table A-2 Statistical Parameters for Rural Intersections SPFs Parameter Estimates
Data Intercept
Coefficient of Mayor AADT
Coefficient of Minor AADT
Subtype Site Intercept (α)
StndError
P value
lnMajor (β1)
Stnd Error
P value
lnMinor (β2)
Stnd Error
P value
Total VA -69589 118 lt0001 06746 009 lt0001 0253 009 00047
OR1 -1604 237 04974 02284 021 02791 01514 012 0211 OR10 -63951 183 00005 05508 014 00001 03106 014 00224 OR 100 -06468 220 07692 02262 016 01635 -00158 017 09274 FI VA -87116 128 lt0001 07839 011 lt0001 02166 009 0013 OR1 -33285 246 01767 03601 024 0126 00597 013 06478 OR10 -80583 175 lt0001 06809 018 00001 02557 013 0057
Rural 4-Leg Signalized
OR 100 -48381 221 00287 04243 018 00193 01523 018 03943 Total VA -5494 020 lt0001 03533 002 lt0001 03935 003 lt0001
OR1 -62351 058 lt0001 04167 006 lt0001 04507 008 lt0001OR10 -53594 028 lt0001 03379 003 lt0001 03998 004 lt0001OR 100 -51255 027 lt0001 02914 003 lt0001 04075 004 lt0001FI VA -66927 030 lt0001 03899 003 lt0001 04156 004 lt0001OR1 -82561 095 lt0001 05221 009 lt0001 04962 012 lt0001OR10 -70797 044 lt0001 03789 004 lt0001 0497 005 lt0001
Rural 4-Leg Minor Stop Control
OR 100 -63326 038 lt0001 03223 004 lt0001 04424 005 lt0001Total VA -75754 084 lt0001 06465 008 lt0001 03332 008 lt0001
OR1 -58798 220 00075 05076 020 00143 0313 013 00161 OR10 -64368 110 lt0001 0544 011 lt0001 02863 006 lt0001OR 100 -9899 139 lt0001 08047 015 lt0001 04386 006 lt0001FI VA -87112 103 lt0001 07224 010 lt0001 02578 006 lt0001OR1 -9219 260 00004 07258 022 00011 03407 016 00326 OR10 -88607 146 lt0001 07059 016 lt0001 02809 008 00009
Rural 3-Leg Signalized
OR 100 -111835 185 lt0001 08669 018 lt0001 03977 008 lt0001Total VA -43293 008 lt0001 03366 001 lt0001 02087 001 lt0001
OR1 -50904 022 lt0001 0406 002 lt0001 02752 003 lt0001OR10 -40969 009 lt0001 03133 001 lt0001 02001 001 lt0001OR 100 -4231 016 lt0001 02997 002 lt0001 02308 003 lt0001FI VA -53415 011 lt0001 03394 001 lt0001 02237 001 lt0001OR1 -64457 031 lt0001 04195 003 lt0001 0307 004 lt0001OR10 -50831 014 lt0001 03245 002 lt0001 02014 002 lt0001
Rural 3-Leg Minor Stop Control
OR 100 -51046 024 lt0001 03163 003 lt0001 02112 003 lt0001
Standard Error
49
Table A-3 SPFs Goodness of Fit Results for Urban Northern Operational Region (No 1)
Data Estimation Data 70 Validation Data 30
Subtype Site MSE r2 R2FT MPB MAD MSPE R2
FT
Total VA 41150 0529 0557 -0760 4329 38490 0575
Total R1 4110 051 0551 -020 464 4486 054
FI VA 704 038 0406 -046 194 767 048
Urban 4-Leg Signalized
FI R1 809 039 0439 012 214 950 038
Total VA 224 031 0313 -003 090 238 029
Total R1 308 028 0286 008 095 200 032
FI VA 053 019 0193 000 043 053 019
Urban 4-Leg Minor Stop Control
FI R1 064 018 0187 003 043 048 021
Total VA 2490 038 0370 -064 352 2759 037
Total R1 3034 032 0305 -015 365 2687 037
FI VA 447 028 0259 -019 153 488 026
Urban 3-Leg Signalized
FI R1 559 025 0231 004 157 448 029
Total VA 185 025 0230 -004 089 204 024
Total R1 208 026 0239 -006 094 219 026
FI VA 043 015 0133 -002 043 048 016
Urban 3-Leg Minor Stop Control
FI R1 047 017 0156 -001 044 050 017
50
Table A-4 SPFs Goodness of Fit Results for Urban Western Operational Region (No 10)
Data Estimation Data 70 Validation Data 30
Subtype Site MSE r2 R2FT MPB MAD MSPE R2
FT
Total VA 41150 0529 0557 -0760 4329 38490 0575
Total R10 21976 0777 0735 1290 3233 17910 0686
FI VA 7043 0385 0406 -0458 1938 7671 0475
Urban 4-Leg Signalized
FI R10 4280 0526 0500 0377 1597 5170 0452
Total VA 2238 0315 0313 -0034 0897 2383 0292
Total R10 1161 0361 0300 -0032 0740 1050 0188
FI VA 0530 0194 0193 -0004 0432 0533 0194
Urban 4-Leg Minor Stop Control
FI R10 0312 0197 0187 0000 0382 0330 0009
Total VA 24900 0375 0370 -0645 3519 27591 0369
Total R10 14446 0451 0397 -0168 2801 24410 0255
FI VA 4467 0275 0259 -0185 1527 4875 0262
Urban 3-Leg Signalized
FI R10 3077 0266 0216 0039 1258 3390 0115
Total VA 1854 0254 0230 -0043 0893 2038 0239
Total R10 1391 0233 0197 -0054 0800 1640 0207
FI VA 0428 0151 0133 -0021 0431 0476 0157
Urban 3-Leg Minor Stop Control
FI R10 0354 0111 0089 -0019 0404 0380 0125
51
Table A-5 SPFs Goodness of Fit Results for Urban Eastern Operational Region (No 100)
Data Estimation Data 70 Validation Data 30
Subtype Site MSE r2 R2FT MPB MAD MSPE R2
FT
Total VA 41150 0529 0557 -0760 4329 38490 0575
Total R100 31108 0632 0630 0243 4717 37450 0005
FI VA 7043 0385 0406 -0458 1938 7671 0475
Urban 4-Leg Signalized
FI R100 5201 0480 0454 -0098 1864 5410 0244
Total VA 2238 0315 0313 -0034 0897 2383 0292
Total R100 1720 0443 0381 0087 0758 1150 0003
FI VA 0530 0194 0193 -0004 0432 0533 0194
Urban 4-Leg Minor Stop Control
FI R100 0509 0273 0254 0049 0383 0360 0173
Total VA 24900 0375 0370 -0645 3519 27591 0369
Total R100 17782 0410 0410 -1753 0908 38780 0004
FI VA 4467 0275 0259 -0185 1527 4875 0262
Urban 3-Leg Signalized
FI R100 3194 0243 0263 -0615 1645 5860 0236
Total VA 1854 0254 0230 -0043 0893 2038 0239
Total R100 1561 0233 0210 -0127 0902 2230 0002
FI VA 0428 0151 0133 -0021 0431 0476 0157
Urban 3-Leg Minor Stop Control
FI R100 0387 0131 0116 -0043 0444 0500 0141
52
Table A-6 SPFs Goodness of Fit Results for Rural Northern Operational Region (No 1)
Data Estimation Data 70
Validation Data 30
Subtype Site MSE r2 R2FT MPB MAD MSPE R2
FT
Total VA 10990 0353 0321 0513 2210 10070 -0073
Total R1 20080 0118 0092 -1389 3661 34220 0212
FI VA 2350 0196 0181 0045 1189 2600 -0034
Rural 4-Leg Signalized
FI R1 2920 0057 0052 -1173 1931 9760 0028
Total VA 1090 0182 0167 -0067 0794 1190 0171
Total R1 1990 0190 0245 0001 0942 1640 0173
FI VA 0480 0112 0098 -0022 0504 0530 0110
Rural 4-Leg Minor Stop Control
FI R1 0920 0093 0112 0020 0541 0520 0009
Total VA 5490 0328 0305 -0010 1651 5760 0179
Total R1 11110 0182 0254 -0679 2271 14750 0497
FI VA 1450 0181 0170 -0041 0902 1710 0099
Rural 3-Leg Signalized
FI R1 3230 0131 0153 -0116 1006 2120 0355
Total VA 0690 0144 0104 -0008 0613 0730 0102
Total R1 1210 0245 0196 0030 0712 0930 0126
FI VA 0250 0071 0048 -0009 0345 0260 0048
Rural 3-Leg Minor Stop Control
FI R1 0340 0124 0093 0016 0366 0300 0052
53
Table A-7 SPFs Goodness of Fit Results for Rural Western Operational Region (No 10)
Data Estimation Data 70 Validation Data 30
Subtype Site MSE r2 R2FT MPB MAD MSPE R2
FT
Total VA 10990 0353 0321 0513 2210 10070 -0073
Total R10 6020 0311 0268 0007 1748 6050 0382
FI VA 2350 0196 0181 0045 1189 2600 -0034
Rural 4-Leg Signalized
FI R10 1880 0158 0139 0097 0945 1590 0254
Total VA 1090 0182 0167 -0067 0794 1190 0171
Total R10 1300 0196 0163 0070 0760 1020 0078
FI VA 0480 0112 0098 -0022 0504 0530 0110
Rural 4-Leg Minor Stop Control
FI R10 0560 0142 0118 0025 0495 0480 0014
Total VA 5490 0328 0305 -0010 1651 5760 0179
Total R10 3690 0163 0170 -0432 0748 6740 0039
FI VA 1450 0181 0170 -0041 0902 1710 0099
Rural 3-Leg Signalized
FI R10 0890 0124 0117 -0391 0997 4030 -0066
Total VA 0690 0144 0104 -0008 0613 0730 0102
Total R10 0640 0126 0091 0025 0583 0580 0055
FI VA 0250 0071 0048 -0009 0345 0260 0048
Rural 3-Leg Minor Stop Control
FI R10 0240 0062 0041 0003 0335 0230 0028
54
Table A-8 SPFs Goodness of Fit Results for Rural Eastern Operational Region (No 100)
Data Estimation Data 70 Validation Data 30
Subtype Site MSE r2 R2FT MPB MAD MSPE R2
FT
Total VA 10990 0353 0321 0513 2210 10070 -0073
Total R100 10120 0042 0027 1207 1882 5120 -0307
FI VA 2350 0196 0181 0045 1189 2600 -0034
Rural 4-Leg Signalized
FI R100 2060 0053 0039 0119 0962 1370 -0023
Total VA 1090 0182 0167 -0067 0794 1190 0171
Total R100 0960 0170 0149 -0086 0746 1140 0209
FI VA 0480 0112 0098 -0022 0504 0530 0110
Rural 4-Leg Minor Stop Control
FI R100 0440 0106 0092 -0031 0475 0490 0121
Total VA 5490 0328 0305 -0010 1651 5760 0179
Total R100 2770 0492 0459 0601 1759 6260 0090
FI VA 1450 0181 0170 -0041 0902 1710 0099
Rural 3-Leg Signalized
FI R100 1040 0265 0255 0124 0923 1570 -0055
Total VA 0690 0144 0104 -0008 0613 0730 0102
Total R100 0640 0125 0087 -0037 0601 0690 0119
FI VA 0250 0071 0048 -0009 0345 0260 0048
Rural 3-Leg Minor Stop Control
FI R100 0250 0064 0038 -0013 0345 0270 0062
55
APPENDIX B
RECOMMENDED SAFETY PERFORMANCE FUNCTION MODELS
Table B-1 Recommended Urban SPFs Site Virginia SPF Models to Be Used for Urban Intersections
Urban 4-Leg Signalized Total Virginia generic total
Urban 4-Leg Signalized
Operational Region 1 generic total
Urban 4-Leg Signalized
Operational Region 10
use specified model developed
Urban 4-Leg Signalized
Operational Region 100 generic total
Urban 4-Leg Signalized FI Virginia generic FI
Urban 4-Leg Signalized
Operational Region 1 generic FI
Urban 4-Leg Signalized
Operational Region 10
use specified model developed
Urban 4-Leg Signalized
Operational Region 100
use specified model developed
Urban 4-Leg Minor Stop Control
Total Virginia generic total
Urban 4-Leg Minor Stop Control
Operational Region 1
use specified model developed
Urban 4-Leg Minor Stop Control
Operational Region 10
use specified model developed
Urban 4-Leg Minor Stop Control
Operational Region 100
use specified model developed
Urban 4-Leg Minor Stop Control
FI Virginia generic FI e^-76917MajADT^05001MinADT^03695
Urban 4-Leg Minor Stop Control
Operational Region 1
use specified model developed
Urban 4-Leg Minor Stop Control
Operational Region 10
use specified model developed
Urban 4-Leg Minor Stop Control
Operational Region 100
use specified model developed
56
Table B-1 Recommended Urban SPFs (Continued)
Site Virginia SPF Models to Be Used for Urban Intersections
Urban 3-Leg Signalized
Total Virginia
use generic model developed for total
crashes
Urban 3-Leg Signalized
Operational Region 1
use generic model developed for total
crashes
Urban 3-Leg Signalized
Operational Region 10
use specific regional model
developed
Urban 3-Leg Signalized
Operational Region 100
use generic model developed for total
crashes
Urban 3-Leg Signalized FI Virginia
use generic model developed for FI
crashes
Urban 3-Leg Signalized
Operational Region 1
use generic model developed for FI
crashes
Urban 3-Leg Signalized
Operational Region 10
use specific regional model
developed
Urban 3-Leg Signalized
Operational Region 100
use generic model developed for FI
crashes
Urban 3-Leg Minor Stop Control
Total Virginia
use generic model developed for total
crashes
Urban 3-Leg Minor Stop Control
Operational Region 1
use generic model developed for total
crashes
Urban 3-Leg Minor Stop Control
Operational Region 10
use specific regional model
developed
Urban 3-Leg Minor Stop Control
Operational Region 100
use generic model developed for total
crashes
Urban 3-Leg Minor Stop Control
FI Virginia use generic model developed for FI
crashes
Urban 3-Leg Minor Stop Control
Operational Region 1
use generic model developed for FI
crashes
Urban 3-Leg Minor Stop Control
Operational Region 10
use specific regional model
developed
Urban 3-Leg Minor Stop Control
Operational Region 100
use generic model developed for FI
crashes
57
Table B-2 Recommended Rural SPFs Site Virginia SPF Models to Be Used for Rural Intersections
Rural 4-Leg Signalized Total Virginia
use generic model developed for total
crashes
Rural 4-Leg Signalized
Operational Region 1
use generic model developed for total
crashes
Rural 4-Leg Signalized
Operational Region 10
use specific regional model developed
Rural 4-Leg Signalized
Operational Region 100
use specific regional model developed
Rural 4-Leg Signalized FI Virginia use generic model
developed for FI crashes
Rural 4-Leg Signalized
Operational Region 1
use generic model developed for FI crashes
Rural 4-Leg Signalized
Operational Region 10
use specific regional model developed
Rural 4-Leg Signalized
Operational Region 100
use specific regional model developed
Rural 4-Leg Minor Stop Control Total Virginia
use generic model developed for total
crashes
Rural 4-Leg Minor Stop Control
Operational Region 1
use generic model developed for total
crashes e^-549MajADT^035MinADT^039
Rural 4-Leg Minor Stop Control
Operational Region 10
use specific regional model developed
Rural 4-Leg Minor Stop Control
Operational Region 100
use generic model developed for total
crashes
Rural 4-Leg Minor Stop Control FI Virginia use generic model
developed for FI crashes
Rural 4-Leg Minor Stop Control
Operational Region 1
use generic model developed for FI crashes
Rural 4-Leg Minor Stop Control
Operational Region 10
use generic model developed for FI crashes
Rural 4-Leg Minor Stop Control
Operational Region 100
use generic model developed for FI crashes
58
Table B-2 Recommended Rural SPFs (Continued)
Site Virginia SPF Models to Be Used for Rural Intersections
Rural 3-Leg Signalized Total Virginia use generic model
developed for total crashes
Rural 3-Leg Signalized
Operational Region 1
use generic model developed for total crashes
Rural 3-Leg Signalized
Operational Region 10
use generic model developed for total crashes
Rural 3-Leg Signalized
Operational Region 100
use generic model developed for total crashes
Rural 3-Leg Signalized FI Virginia use generic model
developed for FI crashes
Rural 3-Leg Signalized
Operational Region 1
use generic model developed for FI crashes
Rural 3-Leg Signalized
Operational Region 10
use generic model developed for FI crashes
Rural 3-Leg Signalized
Operational Region 100
use generic model developed for FI crashes
Rural 3-Leg Minor Stop Control Total Virginia use generic model
developed for total crashes
Rural 3-Leg Minor Stop Control
Operational Region 1
use generic model developed for total crashes
Rural 3-Leg Minor Stop Control
Operational Region 10
use specific regional model developed
Rural 3-Leg Minor Stop Control
Operational Region 100
use generic model developed for total crashes
Rural 3-Leg Minor Stop Control FI Virginia use generic model
developed for FI crashes
Rural 3-Leg Minor Stop Control
Operational Region 1
use generic model developed for FI crashes
Rural 3-Leg Minor Stop Control
Operational Region 10
use specific regional model developed
Rural 3-Leg Minor Stop Control
Operational Region 100
use generic model developed for FI crashes
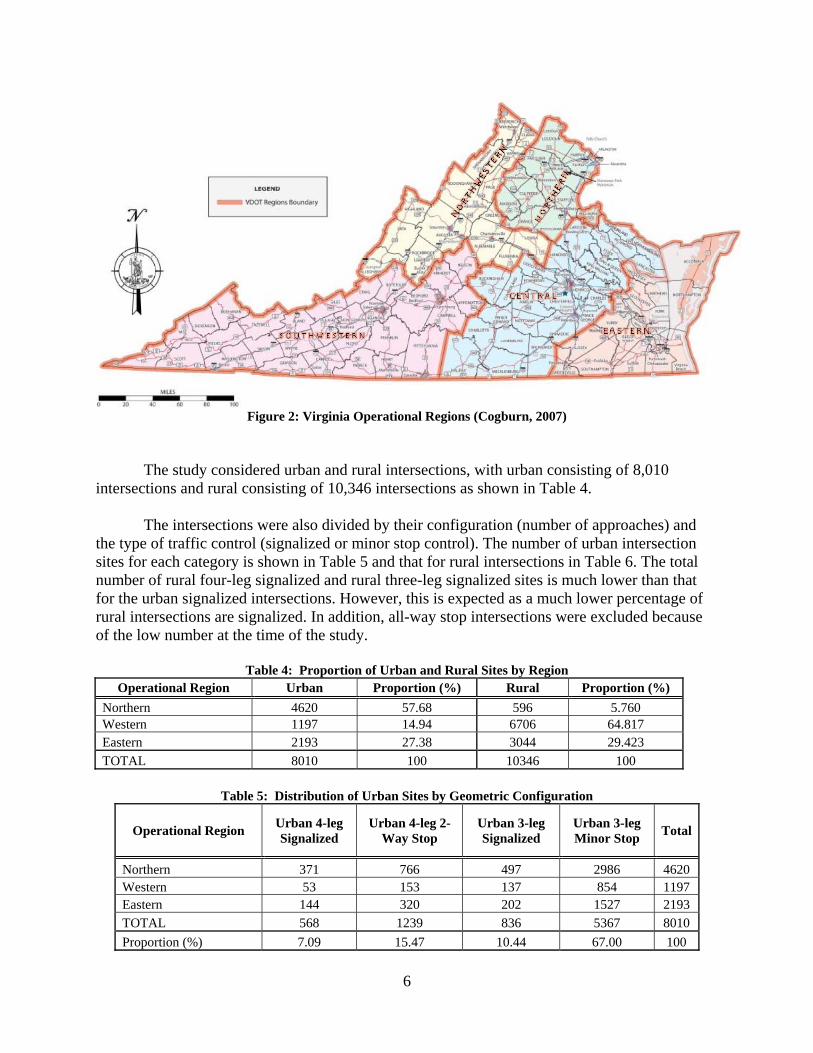
6
Figure 2 Virginia Operational Regions (Cogburn 2007)
The study considered urban and rural intersections with urban consisting of 8010 intersections and rural consisting of 10346 intersections as shown in Table 4
The intersections were also divided by their configuration (number of approaches) and
the type of traffic control (signalized or minor stop control) The number of urban intersection sites for each category is shown in Table 5 and that for rural intersections in Table 6 The total number of rural four-leg signalized and rural three-leg signalized sites is much lower than that for the urban signalized intersections However this is expected as a much lower percentage of rural intersections are signalized In addition all-way stop intersections were excluded because of the low number at the time of the study
Table 4 Proportion of Urban and Rural Sites by Region
Operational Region Urban Proportion () Rural Proportion () Northern 4620 5768 596 5760 Western 1197 1494 6706 64817 Eastern 2193 2738 3044 29423 TOTAL 8010 100 10346 100
Table 5 Distribution of Urban Sites by Geometric Configuration
Operational Region Urban 4-leg Signalized
Urban 4-leg 2-Way Stop
Urban 3-leg Signalized
Urban 3-leg Minor Stop Total
Northern 371 766 497 2986 4620 Western 53 153 137 854 1197 Eastern 144 320 202 1527 2193 TOTAL 568 1239 836 5367 8010 Proportion () 709 1547 1044 6700 100
7
Table 6 Distribution of Rural Sites by Geometric Configuration
Operational Region Rural 4-leg Signalized
Rural 4-leg 2-Way Stop
Rural 3-leg Signalized
Rural 3-leg Minor Stop Total
Northern 19 67 13 497 596 Western 90 894 117 5605 6706 Eastern 73 609 53 2309 3044 TOTAL 182 1570 183 8411 10346 Proportion () 176 1517 177 8130 100
Crash and Operational Data Collection
As previously discussed HTRIS serves as a centralized warehouse of traffic and roadway data for Virginia and is composed of various subsystems that carry distinct data RDI ACC and HPMS were the three subsystems used to extract the necessary data for the study
VDOTrsquos TED staff extracted the crash data by using the ACC database for the years
2003 through 2007 The ACC database is composed of data derived from the crash report forms (DMV FR300) that are filled out by police officers and include data such as driverrsquos actions driver characteristics environmental conditions collision type and crash severity among other factors The database developed for this study included total fatal injury and property damage only (PDO) (property damage greater than $1000) crashes that occurred within a distance of 250 feet or 0047 mile of the intersection which matches the procedure used to develop the suggested SPFs in SafetyAnalyst The RDI database was used to identify the intersection ID or node number for the urban and rural intersection sites that had the same geometric conditions throughout the 5 years selected for the study
A Structured Query Language (SQL) program was developed for retrieving and
formatting the required data for the analysis This query specified the intersection node configuration approach volumes urbanrural classification crashes and traffic control device for each year of the study period The Statistical Analysis Software SAS (913) was then used to format the data in a way suitable for the analysis (SAS Institute Inc 2009)
Annual Average Daily Traffic Selection
The major and minor AADTs were used as the independent variables in developing the SPFs for intersections in Virginia in accordance with the SPFs developed for SafetyAnalyst (Harwood et al 2004) It was therefore necessary to identify the major and minor approaches at each intersection In determining the major and minor AADTs it was recommended by VDOT that for four-leg approaches the major entering volume should be the sum of the two highest approach volumes and the minor entering volume the sum of the two lowest approach volumes For three-leg approaches the major entering volume was the sum of the two highest approach volumes The highway performance monitoring system database was used to obtain the AADTs for the selected study sites
8
Evaluation of Recommended Minnesota SPFs
Once all of the necessary data were obtained for each of the study sites the SafetyAnalyst-recommended SPFs which are based on data for intersections in Minnesota were tested to determine how well they fit the Virginia data Both graphical and statistical methods were used to conduct these tests The graphical method consisted of a visual inspection of the spread of the Virginia data for a specific configuration of intersection and the actual crashes of a given severity plotted with the resultant curve from using the same Virginia database and the corresponding recommended Minnesota SPF The statistical test consisted of computing the Freeman-Tukey RFT 2 coefficients for the recommended SPFs using the appropriate Virginia data The RFT
2 coefficient was used as this was the statistical parameter used to represent the goodness of fit (ITT Corporation 2008) in developing the SafetyAnalyst-recommended SPFs Equations 1 2 and 3 show how the data were transformed to compute the RFT
2 (Fridstroslashm et al 1995) fi = ( yi )05 + ( yi +1 )05 (Eq 1) ecirci = fi ndash ( 4 times ŷi + 1 )05 (Eq 2) RFT
2 = 1 ndash sumiecirci2 sumi( fi ndash fm )2 (Eq 3)
where fi = Freeman-Tukey transformation statistic yi = observed data at site i ecirci = residual at site i ŷi = modeled (predicted) value at site i fm= mean of the transformation statistic (fi) across all sites of the same configuration and urbanrural classification RFT
2 = Freeman-Tukey R2
Developing Virginia-Specific SPFs
The format of the specific SPFs developed for Virginia is the same as that in the
SafetyAnalyst manual and given as
1 2k e x MajAADT x MinAADTβ βα= (Eq 4) where
k = predicted crash frequency per intersection per year MajAADT = AADT on the major road (vehday) MinAADT = AADT on the minor road (vehday) α = intercept
9
β1 = coefficient of major AADT β2 = coefficient of minor AADT
In developing the SPFs a negative binomial (NB) distribution for the crash data was
used as preliminary analysis showed that the data fit the NB distribution The form of the data used to develop the SPFs can be either the panel or cross-sectional (collapsed) format According to Kweon and Lim (2010) the panel format uses original panel data which consist of assembling several years of data over the same intersection and the cross-sectional models use pseudondashcross-sectional data which are data converted or rearranged from the panel set The difference between the two types of models obtained is that the model based on the panel data form takes advantage of the characteristics of the panel data by positioning a predefined correlation structure on reciprocated measures over years at the same time whereas the model based on the cross-sectional form uses the data created by collapsing the multi-year panel data into apparently a single-year panel data The crash data were divided into the estimation and validation portions Seventy percent was selected randomly and used as the estimation data to develop the SPFs and the remaining 30 was used as the evaluation data
An estimation of acceptable values was made for the regression coefficients and the
dispersion parameter when developing the SPFs for the EB method in SafetyAnalyst The regression coefficients are critical for the comparison of different SPFs The dispersion parameter (d) is important when using the EB method in SafetyAnalyst because it plays an integral function in computing the EB weight that influences the estimate of the EB long-term predicted crashes When determining the dispersion parameter from SAS for the urban four-leg signalized intersections the values obtained were d = 02223 for the panel data and d = 02216 for the collapsed data but when determining the values for the urban four-leg two-way stop intersections the values calculated were d = 04284 for panel data and d = 02518 for collapsed data In the urban four-leg two-way stop intersections a significant difference in the d values was observed which led to the choice of panel data for the modeling as they would be more reliable than the collapsed data By looking at the obtained values it can be appreciated that the collapsed model underestimates the dispersion which will eventually cause the EB value to inflate therefore leading to a biased report for the collapsed model
Generalized linear modeling (GLM) was used to create a correlation between the intersection crashes for the 5 years chosen for analysis and the major and minor approach volumes For the statistical modeling SAS was employed (SAS Institute Inc 2009) This software includes the GENMOD procedure and the equation used is the same as given in Equation 5 The GENMOD procedure gives an output of generalized estimating equations (GEE) parameter estimates which are the ones used to develop the Virginia SPFs
1 2exp( )it itk MajAADT MajAADTα β β ε= + + + (Eq 5) where i = intersection index (i = 1hellip N) t = severity index (t = TOT [total crashes] FI [fatal + injury crashes] PDO [property damage only])
10
α = intercept β1 = coefficient of major AADT β2 = coefficient of minor AADT
itk = dependent variable at intersection i and severity t (crashesyr) νit = random error exp (νit) Gamma (θ θ) εit = random (residual) error in GEE
The random errors presented in this equation have the function of not letting the β values or coefficients become biased
Evaluation of Virginia-Specific SPFs
Several statistical parameters were used to assess how well the Virginia SPFs fit the data The parameters used and suggested by Washington et al (2005) were the mean prediction bias (MPB) the mean absolute deviation (MAD) the mean square error (MSE) the mean squared prediction error (MSPE) the Pearsonrsquos product moment correlation coefficients between observed and predicted crash frequencies (used for both validation and estimation data) dispersion parameters and the Freeman Tukey RFT
2 coefficients computed from Equation 3 To test the fit of the SPFs the 70 estimation data set was used to calculate the MSE the Pearsonrsquos product moment correlation coefficients the R2 and the R2
FT To test the transferability of the SPFs the 30 validation data set was used to compute the MPB MAD and the MSPE The expressions used to determine these coefficients are given in Equations 6 through 10
( )2
iin
1i
nYYMPB
2 minussum= = (Eq 6)
2
n
1i ii
n
YYMAD
2sum=minus
= (Eq 7)
( )
pnYY
MSE1
n
1i
2
ii2
minus
minus= sum = (Eq 8)
( )
2
n
1i
2
ii
nYY
MSPE2sum=
minus= (Eq 9)
where p = degrees of freedom i = intersection index Yi = observed crash frequency at intersection i Ŷi = predicted crash frequency at intersection i
11
n2 = validation data sample size 30 n1 = estimation data sample size 70
(Eq 10) where
_
1Y = average of observed crashes per intersections _
2Y = average of predicted crashes per intersections Yi1 = observed values at intersection i Y i2 = predicted values at intersection i
It should be noted that when values obtained from the MPB MAD MSE and MSPE
formulas are close to 0 it indicates a good fit or desirable SPF and when values for the RFT2 and
R2 formulas are close to 1 it indicates a suitable fit The dispersion parameter (d) is used in the variance-mean relationships as shown in Equations 11 and 12
(Eq 11)
( ) ( ) ( )i i i i i iVar Y X E Y X d x E Y X= + (Eq 12) A weighting factor (Wi) used in the EB procedure is obtained from Equation 13 and used in Equation 14 to obtain the EB-estimated value
( )1
1ii i
Wd x E Y X
=+
(Eq 13)
( ) ( ) ( )1EB i i i i i i iE E y y W x E Y X W x Y= + minus (Eq 14)
where 0 lt W lt 1 Var (|) = conditional variance E (|) = conditional mean Var m or Var (Yi|Xi) = estimated variance of mean crash rate E m or E (Yi|Xi) = estimated mean crash rate from SPF d = estimated NB dispersion parameter (also called overdispersion parameter)
2Var m E m d x E m= +
( )( )( ) ( )
1 1 2 21 22 2
1 21 2
i i
i i
Y Y Y Yr
Y Y x Y Y
sum minus minus=⎡ ⎤sum minus sum minus⎢ ⎥⎣ ⎦
12
W = weight Xi = variables such as AADT Yi = number of observed crashes per year at intersection i EEB = EB-adjusted estimated crashes (crashesyr)
In the variance-mean relationship if the value obtained for the dispersion parameter d is 0 then the variance is the same as the mean (see Equations 11 and 12) which causes the NB model to collapse to the Poisson model This parameter has a strong influence on the weight in the EB formula (see Eq 13) therefore it has an effect in the EB-estimated value SAS was helpful in computing this parameter for the different types of intersections analyzed in the study throughout the 5 years
Pruning Process
Before the site prioritization was performed pruning was done to avoid over-representation of the SPFs that might not reflect much difference in the study when compared with statewide SPFs At the completion of the pruning process only the necessary or minimum effective SPFs were retained MSPE is typically the parameter used to assess errors associated with a validation data set for this reason MSPE was used for pruning In order to verify whether a specific regional SPF should be retained or not the validation data set (30 of the data) was used to compute MSPE for both the specific regional SPFs and the corresponding statewide SPFs If MSPE for the regional SPF was greater than that for the corresponding Virginia statewide SPF or if the difference between these two MSPEs was less than 10 it was concluded that the regional SPF was not necessary and it was therefore discarded The following example illustrates the steps for urban four-leg signalized FI crashes in Region 1
1 The 30 FI crash data were obtained for urban signalized four-leg intersections in Region 1 and the MSPE was determined using the statewide SPF for the FI urban four-leg signalized intersections
2 The 30 FI crash data for urban signalized four-leg intersections in Region 1 were
then used to determine MSPE for the specific Region 1 SPF for FI crashes 3 Verify if the MSPE value for the specific regional SPF is higher than the statewide
MSPE value if yes discard the specific regional SPF if no tentatively retain the specific regional model
4 The difference between the two MSPEs was determined to determine whether it was
less than 10 of the statewide MSPE if yes discard the specific regional SPF if no retain the specific regional model This process was repeated for all regional SPFs
13
Identification of Intersections with a Higher Than Expected Number of Crashes
In order to identify some of the intersections with a higher than expected number of crashes a prioritization analysis based on the EB method was conducted This analysis was carried out to identify the top 25 intersections with a high PSI in the urban areas of the Northern Virginia and Bristol districts These two districts were selected to identify any effect of the approach AADTs as two-lane roads in the Northern Virginia District carry much higher volumes than those in the Bristol District The PSI is the difference between the EB-adjusted long-term crashes and the SPF-estimated crashes The PSI was first determined and then a priority list was developed with intersections showing a higher PSI receiving a higher priority This procedure first required the computation of yearly calibration factors (Cy) that accounted for intrinsic yearly variations that were not accounted for in developing the SPFs These yearly calibration factors were determined using the steps described here and given in Equations 15 through 18 (ITT Corporation 2008) Calculation of Yearly Calibration Factor (Cy) For subtype s and severity t the following steps were performed 1 Calculate the (unadjusted) predicted number of crashes using the appropriate SPF yiMinAADTMajAADTe ststst
isyisyisty amp~ 21ˆˆˆ foralltimestimes= ββακ (Eq 15)
2 Sum the predicted numbers over all intersections
ysN
iistysty forall=sum
=
~~1κκ (Eq 16)
3 Sum the observed numbers of crashes over all intersections
yKKsN
iistysty forall=sum
=
1
(Eq 17)
4 Calculate yearly calibration factor csty
yK
csty
stysty forall= ~κ (Eq 18)
5 Repeat the steps for all subtypes (s) and severities (t)
where i = intersection index (i = 1hellip N)
14
s = subtype index (s = urban four-leg signalized intersection rural three-leg minor stop controlled intersection etc) t = severity index (t = TOT [total crashes] FI [fatal + injury crashes] PDO [property damage only]) y = year index (i = 1 [base year] 2 hellip Y) csty = yearly calibration factor for crash subtype s severity t and year y MajAADT = AADT on the major road (vehday) MinAADT = AADT on the minor road (vehday)
istyκ~ = (unadjusted) predicted number of crashes at intersection i for crash subtype s severity t and year y
istyκ = (adjusted) predicted number of crashes at intersection i for crash subtype s severity t and year y α = intercept
1β = coefficient of major AADT 2β = coefficient of minor AADT
These yearly calibration factors were then used to determine the predicted number of
crashes at an intersection based on the SPF for the severity of crashes and type of intersection being considered The PSI for each intersection was then determined using the steps described in Equations 19 through 22 (ITT Corporation 2008) Steps for Calculating PSI for Subtype s
1 Calculate the (adjusted) predicted number of crashes
amp~
21ˆˆˆ ststst
isyisysty
istystyisty
MinAADTMajAADTec
yticββα
κκ
timestimestimes=
foralltimes= (Eq 19)
2 Calculate yearly correction factor Cisty
ytiCyist
istyisty amp
)1(
forall==κ
κ
(Eq 20)
3 Calculate EB weight
tid
w Y
y istystist amp
11
1
foralltimes+
=sum =
κ (Eq 21)
4 Calculate the EB-adjusted estimated number of crashes for year 1
15
tiC
KwwX Y
y isty
Y
y istyistyististyist amp)1(
1
1)1()1( forallminus+times=
sumsum
=
=== κ (Eq 22)
5 Determine the PSI for each intersection If istYX gt istYκ include intersection i in the list for prioritization using istYPSI = istYX
where i = intersection index (i = 1hellip N) s = subtype index (s = urban four-leg signalized intersection rural three-leg minor stop
controlled intersection etc) t = severity index (t = TOT [total crashes] FI [fatal + injury crashes] PDO [property damage
only]) y = year index (y = 1 [base year] 2 hellip Y) cy = yearly calibration factor for crash subtype s severity t and year y d = dispersion parameter w = weight MajAADT = AADT on the major road (vehday) MinAADT = AADT on the minor road (vehday) PSI = potential for safety improvement
istyC = yearly correction factor
istyκ~ = (unadjusted) predicted number of crashes at intersection i for crash subtype s severity t and year y
istyκ = (adjusted) predicted number of crashes at intersection i for crash subtype s severity t and year y
istyX = EB-adjusted estimated number of crashes α = intercept
1β = coefficient of major AADT 2β = coefficient of minor AADT
The prioritization lists for urban two-lane roads in the Northern Virginia and Bristol
districts were then developed based on the PSIs obtained for three prioritization procedures These alternative prioritization procedures were the average crash rates (ACRs) for the study period (see Equation 23) the critical crash ratio (CCR) (see Eqs 24 through 27) (Garber and Hoel 2009) and the EB method The list was developed with the intersections having the highest PSI listed first followed by other intersections in descending order The execution of the EB method prioritization process was achieved through use of the computer codes in SAS Finally the effectiveness of using the EB method for prioritizing sites for safety improvement was illustrated by comparing the PSIs from using intersection crash rates critical crash and the EB procedures
16
Procedure for Crash Rate Method The ACR for the intersection is given as
( )(1000000)( )( )(365)T
TCACRN V
= (Eq 23)
where ACR = the average crash rate for the intersection under consideration (crashes1000000
approach volume) TC = number of crashes over the study period at the intersection N = duration of study period (yr) VT = average daily total approach volume at the intersection Procedure for Critical Rate Method
The critical rate method was accomplished by first computing the traffic base (TB) of the intersection under consideration using Equation 24 The ACR for the intersection under consideration is then computed using its TB as shown in Equation 25 The intersection critical crash rate (ICCR) is then determined using Equation 26 The critical crash ratio (CCR) for the intersection is then computed as the ratio of ICR and the average crash rate (AVR) for all intersections under the same category (intersection type urbanrural etc) as that for the intersection being considered using Equation 27 TB is given as
365
1 000 000
NxVxTB = (Eq 24)
where TB = the total approach volume over the study period of N years at the intersection under consideration (veh1000000) V = average daily approach volume at the intersection under consideration ACR is obtained as
TCACRTB
= (Eq 25)
where ACR = ACR at the intersection under consideration over the study period of N years
17
TB = the total approach volume over the study period of N years at the intersection under consideration (veh1000000) The critical crash rate (ICCR) for the intersection under consideration is given as
05 AVRICCR AVR TFTB TB
= + + (Eq 26)
where AVR = ACR for intersections within the state and of the same designation (eg rural three-leg with minor stop control) as that for the intersection under consideration TF = number of standard deviations for the confidence level being used in the analysis (usually 196 for 95 confidence level) TB = the total approach volume over the study period of N years at the intersection under consideration (veh1000000) The critical crash ratio (CCR) for the intersection is then obtained as
ACRCCRICCR
= (Eq 27)
where ACR = ACR at the intersection under consideration over the study period of N years (see Eq 2) ICCR = critical crash rate for the intersection under consideration (see Eq 26)
Benefits and Implementation Expectations
The expected benefits from developing SPFs and prioritizing intersection sites were illustrated by comparing the PSIs for the prioritized sites when sites were prioritized using the EB method with those obtained when sites were prioritized using crash rates and the critical crash ratio This analysis was conducted for the combined fatal plus injury crashes SPFs An estimate of the cost savings attributable solely to the potential reduction of crashes was also computed by using crash costs given in an FHWA study (FHWA 2005)
18
RESULTS AND DISCUSSION
Literature Review
SafetyAnalyst
The SafetyAnalyst Userrsquos Manual (ITT Corporation 2008) has SPFs that are suggested for intersections that are based on Minnesota data Tables 7 and 8 show the regression coefficients (α β1 and β2) for the SPFs developed for total and combined FI crashes respectively The values for the goodness of fit parameter RFT
2 are also given Although these RFT2 are all less
than 045 with a few less than 010 it has been suggested that the SPFs used in SafetyAnalyst could provide a realistic estimate of an expected crash frequency as a function of traffic volume and roadway geometry (Pham and Ragland 2005)
Methodological and Research References
Several studies similar to this study have been conducted in Canada Colorado California Texas New York and Minnesota For example a study was conducted using data from Colorado California and Texas to examine the functional form of the SPFs for urban freeways (Kononov et al 2008) Five years of crash data were acquired from the respective departments of transportation and the highway safety information system from Colorado The study revealed that the amount of crashes increased moderately with congestion in segments on urban freeways This study however did not include intersections
A study by Lyon et al was conducted in Toronto Ontario Canada to develop SPFs for urban signalized intersections (Lyon et al 2005) Collision data were gathered for five years and included 1950 urban intersections SPFs were developed for different severity levels impact types and intersection types such as four-leg and three-leg intersections The format used to develop the SPFs is shown in Equation 28 This format is somewhat different from that of Equation 4 suggested in Safety Analyst
Collisionsyear = α (F1)β1(F2)β2 exp (β3X1 + β4X2 + ) (Eq 28) where α and βi = the coefficients estimated in the SPF calibration process F1 and F2 = the entering AADTs on the major and minor roads respectively Xi = other independent variables (such as single lane versus multilane approaches with and without left-turn lanes or right-turn lanes high and low pedestrian activities or in some cases F1 or F2 or both)
19
Table 7 SafetyAnalystrsquos SPFs for Intersections (Total Crashes) Site
subtype Code
Site subtype Description
State Regression coefficients
LogIntercept (α)
Regression coefficients
LogAADTmaj (β1)
Regression coefficients LogAADT
min (β2)
Over - dispersion Parameter
(k)
RFT2
() Number of Sites
Max AADTmaj
(vehday)
Max AADTmin
(vehday)
Rural 201 Rural 3-leg with minor-
road STOP control MN -878 071 024 107 133 1706 28500 27000
202 Rural 3-leg with all-way STOP control
MN -1237 122 027 047 41 41 25300 6803
203 Rural 3-leg with signal control
MN -657 066 02 033 26 136 36400 11500
204 Rural 4-leg with minor-road STOP control
MN -896 065 047 07 299 2114 35500 26700
205 Rural 4-leg with all-way STOP control
MN -1237 122 027 047 41 41 25300 6803
206 Rural 4-leg with signal control
MN -657 066 02 033 26 136 36400 11500
Urban 251 Urban 3-leg with minor-
road STOP control MN -535 034 028 128 59 397 68000 18900
252 Urban 3-leg with all-way STOP control
MN -1237 122 027 047 41 41 25300 6803
253 Urban 3-leg with signal control
MN -985 097 018 023 414 33 50000 25807
254 Urban 4-leg with minor-road STOP control
MN -312 027 016 086 76 333 58870 81000
255 Urban 4-leg with all-way STOP control
MN -1237 122 027 047 41 41 25300 6803
256 Urban 4-leg with signal control
MN -347 042 014 032 264 418 75000 81000
ITT Corporation 2008
20
Table 8 SafetyAnalystrsquos SPFs for Intersections (Fatal and Injury Crashes) Site
subtype Code
Site subtype Description
State Regression coefficients
LogIntercept (α)
Regression coefficients
LogAADTmaj (β1)
Regression coefficients LogAADT
min (β2)
Over - dispersion Parameter
(k)
RFT2
() No of Sites
Max AADTmaj
(vehday)
Max AADTmin
(vehday)
Rural 201 Rural 3-leg with minor-
road STOP control MN -935 071 021 123 91 1706 28500 27000
202 Rural 3-leg with all-way STOP control
MN -1002 127 -022 089 248 41 25300 6803
203 Rural 3-leg with signal control
MN -783 075 014 05 215 136 36400 11500
204 Rural 4-leg with minor-road STOP control
MN -936 066 04 0 146 2114 35500 26700
205 Rural 4-leg with all-way STOP control
MN -1002 127 -022 089 248 41 25300 6803
206 Rural 4-leg with signal control
MN -783 075 014 05 215 136 36400 11500
Urban 251 Urban 3-leg with minor-
road STOP control MN -845 049 039 123 81 397 68000 18900
252 Urban 3-leg with all-way STOP control
MN -1002 127 -022 089 248 41 25300 6803
253 Urban 3-leg with signal control
MN -1022 091 021 027 362 33 50000 25807
254 Urban 4-leg with minor-road STOP control
MN -435 029 019 099 57 333 58870 81000
255 Urban 4-leg with all-way STOP control
MN -1002 127 -022 089 248 41 25300 6803
256 Urban 4-leg with signal control
MN -511 049 016 03 295 418 75000 81000
ITT Corporation 2008
21
The study examined the impact of two left turn priority treatments which were flashing advanced green (FAG) and left turn green arrow (LTGA) on left turn collisions These treatments were implemented at 35 intersections in the city of Toronto Two types of collisions were investigated left turns with and without side impact The results indicated that there was an insignificant difference in the impact of the left turn priority treatments on both types of crashes
Lord and Persaud (2003) conducted a study that related SPFs to transportation planning models They noted that traffic safety is not usually accounted for when agencies are conducting a planning analysis to remodel build upgrade or modify their facilities Five-year intersection data from Canada were used Models were developed and statistical measures such as the over dispersion parameter were calculated and conclusions were made from the results The SPFs developed for the study were applied to two sample networks created with the help of a transportation planning software package The research showed that it is possible to make estimation for traffic safety at the planning stage of a project This will allow users to take safety into consideration when designing and possibly create alternatives to change existing designs for more comprehensive projects or development The study also indicated that there are limitations when applying the SPFs to computerized transportation networks The study concluded that although it is possible to predict or estimate crashes on digital transportation networks the accuracy of prediction relies greatly on how precise the traffic flow estimates are
Jonsson et al (2007) performed an SPF study that took into consideration the type and severity of crashes andmdashmost importantmdashthe causal factors for these crashes The study was conducted for intersections on rural four-lane highways in the state of California Four collision types were tested in the study opposite-direction same-direction intersecting-direction and single-vehicle crashes In addition a set of data from the state of New York was used with the same parameters to analyze the severity distribution of crash types The data for California included 1084 intersections on four-lane rural highways and that from New York included 675 intersections mainly stop controlled or without any control Generalized linear modeling was performed with the data after quality analysis Two model forms were estimated with the variables seen in Equations 29 and 30
(Eq 29)
(Eq 30)
where NAcc = predicted number of crashesyr at intersections AADTmajor = AADT on major road AADTminor= AADT traffic flow on minor road Βi = model parameters Xi = variables that describe the intersections (such as terrain lighting left turn number of though lanes and divided or undivided among others)
nn xxxormajorAcc exAADTxAADTN ββββββ ++++=
min4433021
nn xxxormajorAcc exAADTAADTN βββββ +++++=
min332201)(
22
The two different models are different representations of the traffic flow The first represents the AADT of major and minor roads as separate variables but in the second model they are represented as one variable by the sum of the major and minor roads AADTs Results showed that the first model performed better for the multiple-vehicle crashes and the second model fitted better for the single-vehicle crashes In addition the appropriate predictor variables differed depending on the crash type This study is also of interest as it incorporated additional parameters to those in the suggested SPFs now included in SafetyAnalyst and therefore could lead to possible future SPF research for the state of Virginia
Persaud and Nguyen (1998) conducted a study on signalized intersections in Ontario Canada They developed aggregate and disaggregate models to estimate safety performance of three- and four-leg intersections in which crash severity (injury and PDO) environmental class (semi-urban and rural) and time period (daily weekday morning peak and weekday afternoon peak) were considered in the analysis An important aspect of that study is that it supplemented the existing models used for estimating SPFs instead of replacing them because it took into consideration features that were generally not considered in the then existing developed models Two model levels were considered for the study Level 1 was based on the sum of AADTs for all approaches with separate estimates for rear-end right angle and turning movement crashes At this level the equations were adjusted for three- and four-leg intersections by crash severity for all combined impact types and also separately for the three major impact types which were angle rear-end and turning movement In addition models were further separated by time period (daily weekday morning and afternoon peak) and for four-leg intersections which were also classified by environment class such as semi-urban and rural Level 2 allowed estimates to be obtained for specific crash patterns that were defined by movements of the vehicles involved before collision and the same were estimated as a function of the flows that were relevant to each of the patterns For this level models were estimated for four-leg intersections for 12 multi-vehicle and three single-vehicle patterns that were described by the movements of involved vehicles before collision The developed models were intended to estimate the parameters P and d shown in Equations 31 and 33
The safety of the intersection was estimated using the long-term mean based on the EB approach The long term mean (m) was obtained by combining crash count (x) of an intersection in the most recent years (n) with the estimates of the expected annual number of crashes (P) as shown in Equation 31 W1 and W2 in Equations 31 through 33 represent the weights estimated from the mean and variance of the regression estimates
(Eq 31)
(Eq 32)
(Eq 33)
m =W1(x) +W2(P)
2dW
d nP=
+
1PW
d nP=
+
23
(Eq 34)
To estimate the variance of m the following formula was used
(Eq 35)
In Equations 32 through 35 P and d represent the fundamental parameters Two models were selected for SPFs For Level 1 and single-vehicle Level 2 (Eq 36) For multi-vehicle in Level 2 (Eq 37) where P = expected number of crashes of a given type α and β = regression parameters to be estimated S (Level 1) = sum of all entering flows for a given time period for Level 1 analysis S (Level 2) = sum of the daily through right or left turn flows for a given time period for Level 2 (single-vehicle) analysis S1 and S2 = AADTs for small and large flows for a specific crash pattern in Level 2 (multi-vehicle) analysis
The models in either level can be used in the EB procedure to provide estimates for intersections that need to be treated or for the evaluation of the effectiveness of safety countermeasures It should be noted that the quality of the estimates for the study was strongly related to how the parameters were selected and used in the SPFs and unlike other available road models the ones presented in this study can be separated by time period and crash pattern Persaud et al (2002) conducted a study to demonstrate the complexity involved in the calibration of crash prediction models or SPFs for urban intersections Toronto data for three- and four-leg signalized intersections were used to estimate the models for the study The performance of these models was then compared with other models from Vancouver and California The models from these places were recalibrated to fit Toronto by using the Interactive Highway Safety Design Model (IHSDM) and a calibration procedure as proposed by Harwood et al (2000) The results varied significantly and were also mixed The study noted that the calibration of models is not a simple task and due to the importance of the SPFs they must be properly calibrated Several things must be accounted for when performing this procedure in order to obtain good quality data analysis The first thing is to extract a large sample of high quality data A software or program to link all the traffic crash and road characteristics data must exist because the same is usually kept stored in different databases In addition several
2Pd
Var P=
2( )
d xVar m dnP
+=
+
P =αSβ
P =αS1β1 S2
β 2
24
years of crash data must be obtained in order to have a good amount of samples that account for variations The actual process of model calibration is complicated therefore careful attention must be paid when analyzing the same because of the importance of the outcomes of the study The authors of the study made an exploratory analysis and it revealed that the relationship between the crashes and each covariate should be described either by the power function or the gamma function for all intersection types to be analyzed Equations 38 through 40 are the selected model forms used in the study F1 = Power F2 = Gamma (Eq 38) F1 = Gamma F2 = Power (Eq 39) F1 = Power F2 = Power (Eq 40) where E (K) = expected annual number of crashes between 1990 and 1995 F1 F2 = average entering AADT of major and minor roads respectively for the period 1990 to 1995 α β1 β2 β3 β4 = coefficients to be estimated
An NB structure was used to analyze the models and the overdispersion parameter (γ) was analyzed using Equation 41
γ=
2)K(E)K(Var (Eq 41)
Variance increases as γ decreases therefore the value of γ can also be used to make a comparison for the goodness of fit of several models fitted to the same data The larger the value of γ the smaller the variance therefore a more accurate model is given The authors suggest that γ would be enough to calculate the goodness of fit index of any SPF but if one desires to know how accurate the prediction estimate is other measures should also be computed The authors suggested using R2
α as proposed by Miaou et al (1996) which is a dispersion parameter based R2 computed as shown in Equation 42
γγ
minus=αmin2 1R (Eq 42)
where γ = overdispersion parameter for calibrated model γmin = smallest possible overdispersion parameter
The authors suggested that a disaggregation by traffic volume is preferable than using
only a single calibration factor for that is what the IHSDM currently has A recommendation is made to account for safety variation in traffic conditions over time by calibrating the models every two to three years as suggested by Harwood et al (2000)
E(K) =αF1β1 F2
β 2e(β 3F2 )
E(K) =αF1β1 F2
β 2e(β 4 F1 )
E(K) =αF1β1 F2
β 2
25
The Illinois Department of Transportation and the University of Illinois Urbana-Champaign conducted a research study to develop and implement SPFs for road segments and intersections in Illinois (Tegge et al 2010) These SPFs were developed in a way suitable for easy implementation in SafetyAnalyst The crash data (number of crashes and crash severity) and roadway data (number of lanes traffic volume area type and functional class) were collected and used for development of the SPFs Seventeen peer groups were used for developing the SPFs for segments and eight for intersections The intersections peer groups were minor leg stop control all-way stop control signalized and undetermined for rural and urban segments separately The SPFs for segments were developed using NB distribution for crashes and Poisson distribution for intersections The SAS GENMOD procedure was used to develop the SPFs for a five-year analysis period from 2001 to 2005 The model form for the intersection SPFs is the same as that given in the SafetyAnalyst Userrsquos Manual The SPFs were also developed for different crash severities such as fatal crashes type A injury crashes type B injury crashes and fatal plus injury crashes The EB method was used to determine the sites with the higher PSIs Two analysis techniques were used to obtain the PSIs The first considered segments and intersections as individual elements and the second used the sliding window approach The site specific analysis treated each individual segment and intersection as a separate entity Each segment is then compared with every other segment instead of having them grouped together The sliding window approach defined a set length The window lengths were 025 mile and 1 mile for urban and rural segments respectively
The largest impact on crash frequency was found to be the AADT and was therefore the only variable modeled as a logarithm (lnAADT) By doing this the AADT accounted for most of the prediction whereas the rest of the variables refined the prediction further Other variables used included access control functional class lane width surface type area type speed limit and median type The study recommended that a multivariate analysis be conducted for such studies to show how certain variables could contribute to the crashes Other variables could include roadway lighting weather and pavement conditions and roadway geometry The study also concluded that knowledge of roadway characteristics that increase the risk of fatal or injury crashes will facilitate the setting up of safety criteria that can help engineers in the designing of safer roadways Further knowledge of driver behaviors that lead to fatal and severe injury crashes can facilitate the training of enforcement officers to identify these behaviors
The Colorado Department of Transportation (CDOT) (2009) conducted a study to develop SPFs for intersections in the state Their model form is the same as that in SafetyAnalyst The SPFs were developed for many categories based on the number of legs divided undivided rural and urban including urban four-lane divided signalized six-lane divided signalized urban three-leg signalized two-lane undivided unsignalized and urban three-leg unsignalized When a median or left-turn lane is present a roadway is considered divided The sites selected for the study reflected variability in traffic volume and geometry in order to have a diverse representation of intersections throughout the state SPFs were developed for total and for fatal plus injury crash types A five-year study period from 2000 through 2005 was used Crash and AADT data were collected for development of the SPFs CDOT used a NB error structure to develop the SPFs and the EB procedure to estimate the expected safety performance of an intersection site for different safety management purposes Overdispersion parameters were computed and used as a goodness of fit measure According to their data
26
overdispersion parameters indicated that their models provided a reasonable fit to the Colorado data
Results indicated that for signalized intersections roads with six lanes on major approaches have more collisions than those with four lanes on major approaches CDOT recommended that the SPFs should be recalibrated in the future using data from future years as crash frequencies may change over time because of a variety of issues The report also recommended that separate calibration factors should be developed for different regions and different topographies Research in Virginia
In Virginia two other similar studies have recently been published One by Garber et al (2010) for two-lane roads and another by Hamidi et al (2010) to identify high-crash sections on Virginiarsquos primary system by developing a planning-level methodology The study by Garber et al developed SPFs for two-lane segments of 1 mile or less and the study by Hamidi et al developed SPFs for longer segments of two-lane roads that can be used for corridor analysis
Evaluation of the Recommended Minnesota SPFs
Figures 3 through 6 show representative graphs that were used to visually examine how well the Virginia data fitted the suggested Minnesota SPFs Figures 3 and 4 are for urban four-leg signalized intersections and Figures 5 and 6 are for rural four-leg signalized intersections These graphs suggest that the Minnesota SPFs do not fully represent the Virginia data Tables 9 through 12 show the Freeman-Tukey R2
FT coefficients computed for the different Minnesota SPFs using the Virginia data The low Freeman-Tukey R2
FT coefficients obtained and the visual inspection of the graphs suggested that a better fit to the Virginia data could be obtained by developing specific Virginia SPFs using Virginia data It was therefore decided to develop specific SPFs for Virginia
0
2
4
6
8
10
12
14
0 20000 40000 60000 80000 100000 120000
AADT Major
Tota
l Cra
shes
Per
Yea
r
Minnesota VA Actual Observed
Minnesota Model
Figure 3 Total crashes per year vs major AADT for urban 4-leg signalized intersections
with minor AADT of 700
27
0
5
10
15
20
25
30
35
0 20000 40000 60000 80000 100000 120000
AADT Major
Tota
l Cra
shes
per
Yea
r
Minnesota VA Actual Observed
Minnesota Model
Figure 4 Total crashes per year vs major AADT for urban 4-leg signalized intersections
with minor AADT of 4500
0
2
4
6
8
10
12
14
0 20000 40000 60000 80000 100000 120000
AADT Major
Tota
l Cra
shes
Per
Yea
r
Minnesota VA Actual Observed
Minnesota Model
Figure 5 Total crashes per year vs major AADT for rural 4-leg signalized intersections with
minor AADT of 795
28
0
2
4
6
8
10
12
14
16
18
0 20000 40000 60000 80000 100000 120000
AADT Major
Tota
l Cra
shes
per
Yea
r
Minnesota VA Actual Observed
Minnesota Model
Figure 6 Total crashes per year vs major AADT for rural 4-leg signalized intersections with
minor AADT of 5000
Table 9 Minnesota SPFs for Urban FI Crashes and Corresponding R2FT Based
on Virginia Data
Intersection Type
Minnesota FI SPFs R2
FT Based on Virginia Urban FI Crash Data ()
Urban 4-Leg Signalized 032
Urban 4-Leg Minor Stop Control 008
Urban 3-Leg Signalized 026
Urban 3-LegMinor Stop Control 01
Table 10 Minnesota SPFs for Urban TOTAL crashes and Corresponding R2
FT Based on Virginia Data
Type of Intersection
Minnesota SPFs
R2FT Based on Virginia Urban Total
Crash Data ()
Urban 4-Leg Signalized 034
Urban 4-Leg Minor Stop Control 022
Urban 3-Leg Signalized 031
Urban 3-Leg Minor Stop Control 01
29
Table 11 Minnesota SPFs for Rural TOTAL Crashes and Corresponding R2FT
Based on Virginia Data
Type of Intersection
Minnesota SPFs R2
FT Based on Virginia Rural Total Crash Data ()
Rural 4-Leg Signalized 029
Rural 4-Leg Minor Stop Control 013
Rural 3-Leg Signalized 029
Rural 3-Leg Minor Stop Control -010
Table 12 Minnesota SPFs for Rural FI Crashes and Corresponding R2FT Based
on Virginia Data
Type of Intersection
Minnesota SPFs R2
FT Based on Virginia Rural FI Crash Data ()
Rural 4-Leg Signalized 018
Rural 4-Leg Minor Stop Control 010
Rural 3-Leg Signalized 018
Rural 3-Leg Minor Stop Control 001
Development and Evaluation of Specific Virginia SPFs
In keeping with the suggestion given in the Safety Analyst Userrsquos Manual the model form used to develop the intersection SPFs is given in Equation 4 as
1 2k e x MajAADT x MinAADTβ βα=
where
k = predicted crash frequency per intersection per year MajAADT = AADT on the major road (vehday) MinAADT = AADT on the minor road (vehday) α = intercept β1 = coefficient of mayor AADT β2 = coefficient of minor AADT
30
The statewide SPFs developed for Virginia are given in Tables 13 through 16 Due to lack of data the analysis for all-way stop intersections could not be undertaken These tables also give the Freeman-Tukey R2
FT coefficient for each of the Virginia SPFs and the corresponding Minnesota SPF and Freeman-Tukey R2
FT based on the Virginia data The R2FT coefficients
obtained indicate that the Virginia-specific SPFs fit the Virginia data better than the suggested Minnesota SPFs for all types of intersections and crash severity except those for FI crashes on urban three-leg signalized rural four-leg signalized and rural four-leg minor stop control intersections where the corresponding RFT
2 values are similar In Table 15 it can be seen that the Minnesota R2
FT value is negative for the rural three-leg minor stop control intersections The negative RFT
2 value is possible because these calculations were not performed on the same data points that were used to create the Minnesota SPFs (Miller 2009) Table 13 SPF Models for Urban TOTAL crashes and R2
FT results for Virginia Statewide (VDOT-maintained roads)
SPF model with TOTAL Crash values
R2FT TOTAL
Crash Data
Site Virginia Statewide Minnesota VA MN
Urban 4-Leg Signalized 056 034
Urban 4-Leg Minor Stop Control
032 022
Urban 3-Leg Signalized 037 031
Urban 3-Leg Minor Stop Control
023 010
Table 14 SPF Models for Urban FI crashes and R2
FT results for Virginia Statewide (VDOT-maintained roads)
SPF model with FI Crash values R2FT FI Crash Data ()
Site
Virginia Statewide Minnesota VA MN
Urban 4-Leg Signalized 041 032
Urban 4-Leg Minor Stop Control
019 008
Urban 3-Leg Signalized 026 026
Urban 3-Leg Minor Stop Control
013 010
31
Table 15 SPF Models for Rural TOTAL Crashes and R2FT Results for Virginia Statewide (VDOT-
maintained roads) SPF model with TOTAL Crash values R2
FT TOTAL Crash Data
Site
Virginia Statewide Minnesota VA MN
Rural 4-Leg Signalized 0321 0290
Rural 4-Leg Minor Stop Control
0167 0132
Rural 3-Leg Signalized 0305 0291
Rural 3-Leg Minor Stop Control
0104 -0102
Table 16 SPF Models for Rural FI crashes and R2
FT results for Virginia Statewide (VDOT-maintained roads) SPF model with FI Crash values R2
FT TOTAL Crash Data
Site
Virginia Statewide Minnesota VA MN
Rural 4-Leg Signalized 0181 0181
Rural 4-Leg Minor Stop Control
0098 0097
Rural 3-Leg Signalized 0170 0180
Rural 3-Leg Minor Stop Control
0048 0012
Figures 7 through 10 show visual representations of how well the Virginia SPFs fit the
Virginia data in comparison with the suggested Minnesota SPFs In general the Virginia SPFs tend to fit the Virginia data better than the Minnesota SPFs although both sets of SPFs tend to have similar fits at low volumes (AADTmajor lt 2000) except for the SPF for total crashes on urban four-leg signalized intersections shown in Figure 7 The primary reason the Minnesota SPFs do not fit the Virginia data as well as the Virginia SPFs may be the dissimilarities of the roadside environment and the characteristics of the different databases
32
0
2
4
6
8
10
12
14
0 20000 40000 60000 80000 100000 120000
AADT Major
Tota
l Cra
shes
Per
Yea
r
Minnesota VA Actual Observed Virginia
Minnesota Model
Virginia M odel
Figure 7 Total crashes per year vs major AADT for urban 4-leg signalized intersections
with minor AADT of 700
0
5
10
15
20
25
30
35
0 20000 40000 60000 80000 100000 120000
AADT Major
Tota
l Cra
shes
per
Yea
r
Minnesota VA Actual Observed Virginia
Minnesota Model
Virginia Model
Figure 8 Total crashes per year vs major AADT for urban 4-leg signalized intersections
with minor AADT of 8000
33
0
2
4
6
8
10
12
14
0 20000 40000 60000 80000 100000 120000
AADT Major
Tota
l Cra
shes
Per
Yea
r
Minnesota VA Actual Observed Virginia
Virginia Model
Minnesota Model
Figure 9 Total crashes per year vs major AADT for rural 4-leg signalized intersections with
minor AADT of 79
0
5
10
15
20
25
0 20000 40000 60000 80000 100000 120000
AADT Major
Tota
l Cra
shes
per
Yea
r
Minnesota VA Actual Observed Virginia
Minnesota Model
Virginia Model
Figure 10 Total crashes per year vs minor AADT for rural 4-leg signalized intersections with major AADT of 5000
As discussed in the Methodology section in addition to the statewide Virginia SPFs
specific SPFs were developed for each operational region to consider the different topographical characteristics that exist across Virginia The complete set of SPFs together with the associated p values for the regression coefficients are shown in Tables A-1 and A-2 of Appendix A All p values are less than 005 with most being less than 00001 except for some of the rural four-leg signalized intersections regional specific SPFs These p values indicate that the estimated coefficients are statistically significant at the 95 confidence level or better A possible reason
34
for higher p values for a small number of SPFs may be the sample size used for developing these SPFs
To test the transferability and fit of the Virginia statewide specific SPFs several
statistical parameters were determined for the 70 (estimation) data set and the 30 (validation) data set separately The corresponding values for each of these parameters were then compared The results are shown in Tables 17 and 18 for urban and rural intersections respectively The results for the regional SPFs are shown in Tables A-3 through A-8 of Appendix A The results indicate that the developed models are transferable to the 30 validation data set For example the MSE values for the 70 estimation data are similar to the MSPE values for the 30 validation data In addition the mean prediction bias MPB values for the 30 validation data are close to zero (-076 le MPB ge -0004) in Table 17 and (-0067 le MPB ge 00513) in Table 18
Table 17 Goodness of Fit Results for Urban Statewide SPFs
Data Estimation data 70 Validation Data 30 Subtype Site MSE r2 R2
FT MPB MAD MSPE R2FT
Total VA 41150 0529 0557 -0760 4329 38490 0575
Total MN
68636 0506 0336 -3145 5421 68156 0315
FI VA
7043 0385 0406 -0458 1938 7671 0475
Urban 4-Leg Signalized
FI MN 7702 0372 0324 -0316 2124 8981 0376
Total VA 2238 0315 0313 -0034 0897 2383 0292
Total MN 2510 0287 0215 0091 0982 2730 0182
FI VA 0530 0194 0193 -0004 0432 0533 0194
Urban 4-Leg Minor Stop Control
FI MN 0560 0182 0080 0128 0522 0577 0052
Total VA 24900 0375 0370 -0645 3519 27591 0369
Total MN 29322 0365 0308 -2238 3661 33079 0272
FI VA 4467 0275 0259 -0185 1527 4875 0262
Urban 3-Leg Signalized
FI MN 4528 0267 0261 -0294 1526 4937 0261
Total VA 1854 0254 0230 -0043 0893 2038 0239
Total MN 2388 0237 0104 -0541 0902 2600 0107
FI VA 0428 0151 0133 -0021 0431 0476 0157
Urban 3-Leg Minor Stop Control
FI MN 0478 0140 0097 -0184 0385 0537 0104
35
Table 18 Goodness of Fit Results for Rural Statewide SPFs
Data Estimation Data 70
Validation Data 30
Subtype Site MSE r2 R2FT MPB MAD MSPE R2
FT
Total VA 10990 0353 0321 0513 2210 10070 -0073
Total MN 12400 0339 0290 -0154 2071 8460 0035
FI VA 2350 0196 0181 0045 1189 2600 -0034
Rural 4-Leg Signalized
FI MN 2400 0188 0181 -0043 1164 2420 0004
Total VA 1090 0182 0167 -0067 0794 1190 0171
Total MN 1190 0167 0132 -0348 0774 1320 0115
FI VA 0480 0112 0098 -0022 0504 0530 0110
Rural 4-Leg Minor Stop Control
FI MN 0500 0104 0097 -0158 0459 0560 0093
Total VA 5490 0328 0305 -0010 1651 5760 0179
Total MN NA NA NA NA NA NA NA
FI VA 1450 0181 0170 -0041 0902 1710 0099
Rural 3-Leg Signalized
FI MN NA NA NA NA NA NA NA
Total VA 0690 0144 0104 -0008 0613 0730 0102
Total MN 0890 0141 -0102 -0404 0555 0940 -0104
FI VA 0250 0071 0048 -0009 0345 0260 0048
Rural 3-Leg Minor Stop Control
FI MN 0270 0068 0012 -0144 0270 0290 0003
Pruning of Virginia-Specific SPFs A total of 64 SPFs were initially developed using the appropriate data for Virginia as shown in Tables A-1 and A-2 of Appendix A Considering that not all regional models might be necessary the pruning process described in the methodology section was carried out to prune the number of SPFs to the minimum effective number as seen in Tables 19 and 20 for urban and rural intersections respectively The pruning process resulted in 19 SPFs for urban sites and 15 for rural sites To facilitate the use of the correct SPF for a specific type of intersection located in a specific region the lists of the appropriate SPFs to be used are given in Tables B-1 and B-2 of Appendix B for the urban and rural intersections respectively
As can be seen in Tables 19 and 20 and Tables A-1 and A-2 of Appendix A there are some trends worth discussing for the benefit of the study and possible future research With regards to the three different operational regions the Western region retained many more of the specific regional urban SPFs than any other region For example the Western regional SPFs were retained for all urban intersection sites whereas for the Eastern region the only SPFs
36
retained were those for urban four-leg signalized FI crashes and urban four-leg minor stop control for total and FI crashes Similarly the only urban SPF retained for the Northern region was that for urban four-leg minor stop control for total crashes For the rural intersection sites all of the Western regional SPFs were retained except those for rural three-leg signalized total and FI crashes and rural four-leg minor stop control FI crashes The majority of the Eastern region rural SPFs were discarded except those for rural four-leg signalized total and FI crashes while for the Northern region all regional SPFs were discarded
The Western region retained more specific regional SPFs than the other two regions This suggests that the intersections in the Western region exhibit more unique characteristics than those for the other regions This may be due to the more mountainous terrain in the Western region compared to those in the Eastern and Northern regions This supports the philosophy of developing specific SPFs based on the topography of different regions
Site Prioritization
To illustrate the benefits of using the EB method to prioritize intersection sites for safety
improvements the top 25 urban sites from the Bristol and Northern Virginia districts were identified by using crash rates critical crash ratio and the EB method The PSI for each site identified was then determined The results obtained are shown in Tables 21 and 22 for the Bristol and the Northern Virginia districts respectively The results indicate that for the Northern Virginia District the PSIs for the top 25 sites are 258 1317 and 27440 crashes per year and for the Bristol District 432 646 and 1496 crashes per year for the crash rates critical crash ratio and EB methods respectively The important thing in Tables 21 and 22 is the sum of the PSI columns ranked by the three methods The sum of each of the PSIs for the crash rate and critical crash ratio method is lower than that for the EB method These results suggest that the use of the EB method in the planning process will identify intersection sites with the highest PSIs and therefore where detailed assessments to determine feasible and effective safety treatments should be undertaken
37
Table 19 MSPE Values for Virginia Urban Statewide and Urban Regional SPFs Used for Pruning
Data Pruning
Subtype
Site
MSPE [MSPEVA-
MSPEOR]1 [abs(MSPEVA-
MSPEOR)]2 [abs(MSPEVA-
MSPEOR)MSPEVA]3
RetainDiscardTotal VA 3849 Northern 4486 -637 637 0165497532 Discard Western 1791 2058 2058 0534684334 Retain Eastern 3745 104 104 0027020005 Discard FI VA 7671 Northern 95 -1829 1829 0238430452 Discard Western 517 2501 2501 0326033112 Retain
Urban 4-Leg Signalized
Eastern 541 2261 2261 0294746448 Retain Total VA 23834 Northern 202 03634 03634 015247126 Retain Western 105 13334 13334 0559452882 Retain Eastern 115 12334 12334 0517496014 Retain FI VA 05327 Northern 048 00527 00527 0098929979 Discard Western 033 02027 02027 0380514361 Retain
Urban 4-Leg Minor Stop Control
Eastern 036 01727 01727 0324197485 Retain Total VA 275911 Northern 2687 07211 07211 0026135239 Discard Western 2441 31811 31811 0115294425 Retain Eastern 3878 -111889 111889 0405525695 Discard FI VA 48754 Northern 448 03954 03954 0081101038 Discard Western 339 14854 14854 0304672437 Retain
Urban 3-Leg Signalized
Eastern 586 -09846 09846 020195266 Discard Total VA 20379 Northern 219 -01521 01521 0074635654 Discard Western 164 03979 03979 0195250012 Retain Eastern 223 -01921 01921 0094263703 Discard FI VA 04756 Northern 05 -00244 00244 0051303616 Discard Western 038 00956 00956 0201009251 Retain
Urban 3-Leg Minor Stop Control
Eastern 05 -00244 00244 0051303616 Discard 1 Difference between mean square prediction error (MSPE) of Virginia statewide model and OR model 2 Absolute value of the difference between Virginia statewide model MSPE and operational region model MSPE 3 Absolute value of the difference between Virginia statewide model MSPE and operational region model MSPE divided by the Virginia statewide MSPE for comparison
Retained SPFs Discarded if value is negative Discarded if less than 01
38
Table 20 MSPE Values for Virginia Rural Statewide and Rural Regional SPFs Used for Pruning Data Pruning
Subtype
Site
MSPE
[MSPEVA-MSPEOR]1
[abs(MSPEVA-MSPEOR)]2
[abs(MSPEVA-MSPEOR)MSPEVA]3
RetainDiscard
Total VA 1007 Northern 3422 -2415 2415 2398212512 Discard Western 605 402 402 0399205561 Retain Eastern 512 495 495 0491559086 Retain FI VA 26 Northern 976 -716 716 2753846154 Discard Western 159 101 101 0388461538 Retain
Rural 4-Leg Signalized
Eastern 137 123 123 0473076923 Retain Total VA 119 Northern 164 -045 045 0378151261 Discard Western 102 017 017 0142857143 Retain Eastern 114 005 005 0042016807 Discard FI VA 053 Northern 052 001 001 0018867925 Discard Western 048 005 005 0094339623 Discard
Rural 4-Leg Minor Stop Control
Eastern 049 004 004 0075471698 Discard Total VA 576 Northern 1475 -899 899 1560763889 Discard Western 674 -098 098 0170138889 Discard Eastern 626 -05 05 0086805556 Discard FI VA 171 Northern 212 -041 041 0239766082 Discard Western 403 -232 232 1356725146 Discard
Rural 3-Leg Signalized
Eastern 157 014 014 0081871345 Discard Total VA 073 Northern 093 -02 02 0273972603 Discard Western 053 02 02 0273972603 Retain Eastern 069 004 004 0054794521 Discard FI VA 026 Northern 03 -004 004 0153846154 Discard Western 023 003 003 0115384615 Retain
Rural 3-Leg Minor Stop Control
Eastern 027 -001 001 0038461538 Discard 1 Difference between mean square prediction error (MSPE) of Virginia statewide model and OR model 2 Absolute value of the difference between Virginia statewide model MSPE and operational region model MSPE 3 Absolute value of the difference between Virginia statewide model MSPE and operational region model MSPE divided by the Virginia statewide MSPE for comparison
Retained SPFs Discarded if value is negative Discarded if less than 01
39
Table 21 PSIs for Top 25 Sites in District 1 Urban (Bristol) FI
Crashes Ranking Based on Crash
Rates Ranking Based on Crash Ratio Ranking Based on EB
Method
Rank Intersection Node
Crash Rate1 PSI2 Intersection
Node Crash Ratio3 PSI Intersection
Node PSI
1 596726 22112 00000 651193 39672 00000 596095 21413
2 606469 20079 00000 606238 39298 06297 596393 08787
3 706818 12504 00000 651075 31264 00000 651130 08453
4 651193 11550 00000 596726 29227 00000 596701 07112 5 651075 09369 00000 606469 28039 00000 651802 06929 6 606238 08382 06297 651233 25831 03612 636331 06726 7 651807 07089 00000 651130 22718 08453 596395 06579 8 651233 06068 03612 706818 22555 00000 596937 06415 9 651230 05990 00000 651230 20301 00000 606238 06297
10 651783 05756 00000 651210 18882 04747 661033 06061 11 636093 04960 00000 636331 17913 06726 596372 05417 12 651274 04475 00000 651807 16847 00000 636372 04808 13 651130 04179 08453 651805 15814 00000 651210 04747 14 651210 03918 04747 651223 15627 03589 636491 04649 15 636331 03393 06726 651783 15009 00000 596420 04633 16 651223 03363 03589 596095 14865 21413 596403 04579 17 606232 03331 00000 636405 14769 00000 651603 04531 18 651127 03053 00000 661033 14555 06061 636056 04351 19 651999 03048 00000 596353 14215 03717 712033 04110 20 596449 02962 00000 636093 13782 00000 704691 04102 21 636405 02811 00000 651879 13192 00000 651838 04100 22 651883 02698 00000 651274 12975 00000 651894 03878 23 596353 02686 03717 651127 12972 00000 596353 03717 24 651805 02663 00000 651999 12959 00000 651233 03612 25 661033 02500 06061 596449 12702 00000 651889 03601
sum 43202 sum 64615 sum 149606 1Number of crashes per year per 1000000 total approach volume 2Potential for safety improvement (crashes yr) the difference between the EB-adjusted long-term crashes and the SPF-estimated crashes 3Ratio of actual crash rate to critical crash rate
40
Table 22 PSIs for Top 25 Sites in District 9 Urban (Northern Virginia District) FI
Crashes Ranking Based on Crash
Rates Ranking Based on Crash Ratio Ranking Based on EB
Method
Rank Intersection Node
Crash Rate1 PSI2 Intersection
Node Crash Ratio3 PSI Intersection
Node PSI
1 718192 191841 00000 718192 257523 00000 264119 150122 2 702946 178194 00000 547722 152371 11175 263375 140091 3 271531 64846 00000 263628 102794 00000 278648 137239 4 263628 52858 00000 263728 100092 00000 276819 131395 5 263728 42215 00000 719754 95274 09444 263290 130743 6 266955 35294 00000 702946 79268 00000 722678 127897 7 547722 34932 11175 263403 77252 05184 264725 118671 8 702612 30441 00000 704237 77175 07648 267028 116627 9 273886 29539 00000 263729 74681 00000 265204 115925
10 716747 27632 00000 271531 72327 00000 274766 115679 11 263626 27139 00000 263135 66458 18068 263249 113372 12 269485 26567 00000 716747 64461 00000 547044 110769 13 728954 26344 00000 266955 56657 00000 549349 107180 14 263729 25208 00000 546138 52003 31028 268210 105630 15 546988 21922 00000 547544 51924 32529 263347 104257 16 274338 21446 00000 263626 50389 00000 276351 102313 17 429308 21354 00000 269485 49897 00000 428167 100064 18 720401 21197 00000 728954 49702 00000 264344 98789 19 267295 20954 00000 548686 49572 03621 277764 91554 20 267536 20874 00000 711601 47985 04440 263467 89259 21 265938 20484 00000 266970 47730 00000 263090 89199 22 273354 20108 00000 546462 46856 03620 703414 88610 23 268345 19362 00000 265938 46726 00000 428629 87379 24 719754 19073 09444 720401 44833 00000 272219 85659 25 263403 19015 05184 728496 43666 04990 428544 85610
Sum 25803 sum 131747 sum 2744033 1Number of crashes per year per 1000000 total approach volume 2Potential for safety improvement (crashes yr) the difference between the EB-adjusted long-term crashes and the SPF-estimated crashes 3Ratio of actual crash rate to critical crash rate
41
CONCLUSIONS
bull The development of SPFs for intersections is necessary for Virginia because the SafetyAnalyst-suggested SPFs which are based on Minnesota data do not represent the Virginia data well Regarding the fit of the SPFs to Virginia data the R2
FT values shown in Tables 13 through 16 for Minnesota and Virginia indicate that the Virginia-specific SPFs fit the Virginia data better than the Minnesota models This may be due to the dissimilarities of the roadside environment such as difference in topography and the characteristics of the different Virginia and Minnesota databases
bull In some cases the specific regional SPFs fit the regional data better than the statewide
SPFs suggesting that the specific SPFs should be considered for use when available These group divisions that have similar roadway characteristics and driver expectations in some cases tend to improve the fit
bull In identifying intersection sites for safety improvements it is clearly beneficial for the EB
method to be used with the suitable SPFs rather than a crash rate or critical ratio method Results of the site prioritization show a much higher potential for crash reduction when the EB method is used with the appropriate SPFs rather than a procedure based on crash rates or critical rates
RECOMMENDATIONS
1 VDOTrsquos TED should use the Virginia-specific SPFs when using the SafetyAnalyst tools The results of this study have shown that the Virginia-specific SPFs reflected the Virginia data better than the SafetyAnalyst-recommended Minnesota SPFs
2 VDOTrsquos TED should investigate the feasibility of using multiple SPFs in SafetyAnalyst If
feasible regional SPFs should be used If it is not currently feasible to use multiple SPFs VDOTrsquos TED should ask that the FHWA include regional information in SafetyAnalyst so as to allow the use of regional SPFs For the specific regional SPFs to be applied to Virginia and other states the SafetyAnalyst tool should be capable of incorporating the necessary data that support the regional models
3 As soon as it is feasible to use regional SPFs VDOTrsquos TED should use the 19 SPFs
developed for urban intersections and the 15 developed for rural intersections when using the tools in SafetyAnalyst Although the statewide SPFs are available for use by an analyst the specific regional models included in the final set of SPFs will predict crashes better than the statewide SPFs The regional analysis will not only ease the use of specific regional SPFs but will also be of benefit when predicting the potential for safety improvement of a specific site
4 For future similar SPF studies VDOTrsquos TED should be directly involved in screening the
traffic data for accuracy and consistency as was done in this study The direct involvement of the TED in the screening of the traffic data significantly contributed to the accuracy of the
42
data and greatly contributed to the confidence the researchers place on the data used in the study
5 The Virginia Transportation Research Council (VTRC) should conduct a study as soon as
feasible to verify whether incorporating independent variables for which data are available other than AADT such as intersection geometry and other characteristics will result in SPFs that better fit the Virginia data Although the currently suggested SafetyAnalyst SPFs use only the AADTs as the independent variables it is likely that provision will be made for use of SPFs that incorporate other independent variables such as number of approaches entering lanes and the other variables for which data are available as these SPFs are likely to give better fit to crash data
6 As soon as feasible VTRC should undertake a study to develop SPFs for the urban system
intersections which are not currently maintained by VDOT as these intersections may have different crash characteristics than those maintained by VDOT This would facilitate the use of SafetyAnalyst in programming sites that are currently not being maintained by VDOT
BENEFITS AND IMPLEMENTATION PROSPECTS
Significant benefits will be accrued by the use of the Virginia-specific SPFs developed in this study This is clearly illustrated in two ways First in examining the transferability of the suggested SPFs in SafetyAnalyst it is clear that these SPFs do not fit the Virginia data very well The results also indicate that the Virginia-specific SPFs fit the Virginia data much better than the suggested SafetyAnalyst SPFs Second the availability of the Virginia-specific SPFs will enhance the use of the EB procedure given in SafetyAnalyst for prioritizing sites for safety improvements This study has also shown that the EB method better identifies sites with higher potential for crash reduction than those identified by crash rates For example the illustrated examples given for the Bristol and Northern Virginia districts show that the potential reduction in FI crashes when the top 25 sites are identified by the EB method is 28936 (1496 + 27440) crashes per year whereas that obtained when the critical crash ratio method is used for prioritization is only 1963 (646 + 1317) and that obtained with the crash rate method is only 690 (432 + 258) crashes per year This gives a net benefit of 26973 potential crashes per year compared to the critical crash ratio method and 28246 compared to the crash rate method Assuming an average cost of FI crashes of $95629 (FHWA 2005) and only 10 of the estimated net benefit PSI of 28246 crashes per year is achieved the total savings of more than $27 million per year could be accrued The prospects for implementation of the recommendations are very high as the study was requested by VDOTrsquos TED which is planning to incorporate these SPFs in the use of the tools provided in SafetyAnalyst
43
ACKNOWLEDGMENTS
The authors appreciate the opportunity afforded them by VDOT and VTRC to conduct this study Special thanks to Stephen Read (VDOT) Dr In-Kyu Lim (VDOT) Dr Young-Jun Kweon (VTRC) and VDOTrsquos Central Office for their interest and support in SPFs and their help in the selection of intersection sites Many thanks to Lewis Woodson (VTRC) and James Hill (University of Virginia) for all their help and input throughout the study
REFERENCES Cogburn P VDOT Interagency Coordination 2007 Virginia Emergency Management
Conference Virginia Department of Transportation Richmond April 2007 Colorado Department of Transportation DTD Applied Research and Innovation Branch Safety
Performance Functions for Intersections CDOT-2009-10 Denver December 2009 Fridstroslashm L Ifver J Ingebrigtsen S Kulmala R and Thomsen LK Measuring the
Contribution of Randomness Exposure Weather and Daylight to the Variation in Road Accidents Counts Accident Analysis and Prevention Vol 27 No 1 1995 pp 1-20
Federal Highway Administration Cost of Crashes by Severity Table FHWA-HRT-05-051
Washington DC 2005 Federal Highway Administration SafetyAnalyst Home Page httpwwwsafetyanalystorg
Accessed February 2010 Garber N and Hoel L Traffic amp Highway Engineering 4th ed Cenage Learning Toronto
Canada 2009 Garber NJ Haas PR and Gosse C Development of Safety Performance Functions for Two-
Lane Roads Maintained by the Virginia Department of Transportation VTRC 10-R25 Virginia Transportation Research Council Charlottesville 2010
Hamidi A Fontaine MD and Demetsky MJ A Planning-Level Methodology for Identifying
High-Crash Sections of Virginiarsquos Primary System VTRC 11-R4 Virginia Transportation Research Council Charlottesville 2010
Harwood D Council FM Hauer E Hughes WE and Vogt A Prediction of the Expected
Safety Performance of Rural Two-lane Highways Federal Highway Administration McLean VA December 2000
Harwood DW Bauer KM Richard KR Gilmore DK Persaud B and Lyon C
Development of SPFs for Safety Analyst Interim Tools Technical Memorandum
44
Prepared by Midwest Research Institute for the Federal Highway Administration McLean VA 2004
ITT Corporation SafetyAnalyst Userrsquos Manual Turner-Fairbank Highway Research Center
McLean VA 2008 Jonsson T Ivan J and Zhang C Crash Prediction Models for Intersections on Rural
Multilane Highways Differences by Collision Type In Transportation Research Record Journal of the Transportation Research Board No 2019 Transportation Research Board of the National Academies Washington DC 2007 pp 91-98
Kweon Y-J and Lim I-K Appropriate Regression Model Types for the Empirical Bayes
Method and SafetyAnalyst In Proceedings of the 89th Annual Meeting of the Transportation Research Board Transportation Research Board of the National Academies Washington DC 2010
Kononov J Bailey B and Allery B Exploratory Examination of the Functional Form of
Safety Performance Functions of Urban Freeways Colorado Department of Transportation and San Diego State University Denver CO 2008
Lyon C Haq A Persaud B and Kodama S Safety Performance Functions for Signalized
Intersections in Large Urban Areas Development and Application to Evaluation of Left-Turn Priority Treatment In Transportation Research Record Journal of the Transportation Research Board No 1908 Transportation Research Board of the National Academies Washington DC 2005 pp 165-171
Lord D and Persaud B Estimating the Safety Performance of Urban Road Transportation
Networks Center for Transportation Safety Texas Transportation Institute Texas AampM University and Department of Civil Engineering Ryerson University College Station TX 2003 pp 609-620
Miaou S-P Lu A and Lum H S Pitfalls of using R2 to Evaluate Goodness of Fit of
Accident Prediction Models In Transportation Research Record Journal of the Transportation Research Board No 1542 Transportation Research Board of the National Academies Washington DC 2005 1996 pp 6-13
Miller P Re Negative R squared Email Archive Division of Biostatistics Washington
University in St Louis February 2 2005 February 2 2005 httpwwwbiostatwustleduarchiveshtmljmp-l2005msg00075html Accessed February 2010
Persaud B Lord D and Palmisano J Calibration and Transferability of Accident Prediction
Models for Urban Intersections In Transportation Research Record Journal of the Transportation Research Board No 1784 Transportation Research Board of the National Academies Washington DC 2002 pp 57-64
45
Persaud B and Nguyen T Disaggregate Safety Performance Models for Signalized Intersections on Ontario Provincial Roads In Transportation Research Record Journal of the Transportation Research Board No 1635 Transportation Research Board of the National Academies Washington DC 1998 pp 113-120
Pham T and Ragland D Summary of Crash Prediction Models Also known as Safety
Performance Functions (SPFs) California Partners for Advanced Traffic and Highways and University of California Berkeley Berkeley 2005
SAS Institute Inc SAS OnlineDoc Version Eight Cary NC
httpwwwtecnionacildocssasril Accessed 2009 Tegge RA Jo J-H and Ouyang Y Development and Application of Safety Performance
Functions for Illinois ICT-10-066 Illinois Center for Transportation University of Illinois Urbana-Champaign March 2010
Virginiarsquos Surface Transportation Safety Executive Committee Commonwealth of Virginiarsquos
Strategic Highway Safety Plan 2006-2010 Virginia Department of Transportation Richmond 2006
Washington S Persaud B Lyon C and Oh J Validation of Accident Models for
Intersections FHWA-RD-03-037 Federal Highway Administration McLean VA 2005
46
47
APPENDIX A
STATISTICAL PARAMETERS AND GOODNESS-OF-FIT RESULTS
Table A-1 Statistical Parameters for Urban Intersections SPFs Parameter Estimates
Data Intercept
Coefficient of Mayor AADT
Coefficient of Minor AADT
Subtype Site Intercept (α)
StndError
P value
lnMajor (β1)
StndError
P value
lnMinor (β2)
StndError
P value
Total VA -76234 048 lt0001 06742 005 lt0001 03453 003 lt0001
OR1 -83067 056 lt0001 07522 005 lt0001 0328 003 lt0001OR10 -123913 122 lt0001 10631 013 lt0001 04567 006 lt0001OR 100 -88553 077 lt0001 07825 007 lt0001 03706 004 lt0001FI VA -85256 057 lt0001 06477 006 lt0001 03579 004 lt0001OR1 -96546 063 lt0001 07603 006 lt0001 03597 004 lt0001OR10 -114284 15 lt0001 08662 016 lt0001 04412
Urban 4-Leg Signalized
OR 100 -99582 100 lt0001 07484 009 lt0001 04017 005 lt0001Total VA -60723 022 lt0001 04558 002 lt0001 0347 004 lt0001
OR1 -6059 044 lt0001 0505 004 lt0001 02773 006 lt0001OR10 -67031 057 lt0001 03986 007 lt0001 04999 009 lt0001OR 100 -65388 032 lt0001 04689 004 lt0001 043 006 lt0001FI VA -76917 032 lt0001 05001 003 lt0001 03695 005 lt0001OR1 -81437 060 lt0001 05813 005 lt0001 03188 008 lt0001OR10 -80333 063 lt0001 03446 007 lt0001 06218 010 lt0001
Urban 4-Leg Minor Stop Control
OR 100 -83166 051 lt0001 05253 006 lt0001 04695 008 lt0001Total VA -6543 082 lt0001 06591 008 lt0001 02119 002 lt0001
OR1 -4999 103 lt0001 05555 009 lt0001 01554 003 lt0001OR10 -96143 127 lt0001 08677 012 lt0001 03297 005 lt0001OR 100 -67518 110 lt0001 06157 011 lt0001 02969 005 lt0001FI VA -84268 068 lt0001 07147 006 lt0001 02481 002 lt0001OR1 -73982 099 lt0001 06496 009 lt0001 02088 003 lt0001OR10 -110104 155 lt0001 0908 015 lt0001 03226 006 lt0001
Urban 3-Leg Signalized
OR 100 -7266 107 lt0001 05508 011 lt0001 03107 006 lt0001Total VA -54696 013 lt0001 04874 002 lt0001 01985 001 lt0001
OR1 -5361 018 lt0001 04959 002 lt0001 01676 002 lt0001OR10 -5773 034 lt0001 04877 003 lt0001 02314 004 lt0001OR 100 -51642 021 lt0001 04338 003 lt0001 02309 003 lt0001FI VA -74642 018 lt0001 05791 002 lt0001 02091 002 lt0001OR1 -76877 027 lt0001 06204 003 lt0001 0181 002 lt0001OR10 -69458 047 lt0001 05096 004 lt0001 02212 005 lt0001
Urban 3-Leg Minor Stop Control
OR 100 -69883 031 lt0001 05169 004 lt0001 02308 003 lt0001 Standard Error
48
Table A-2 Statistical Parameters for Rural Intersections SPFs Parameter Estimates
Data Intercept
Coefficient of Mayor AADT
Coefficient of Minor AADT
Subtype Site Intercept (α)
StndError
P value
lnMajor (β1)
Stnd Error
P value
lnMinor (β2)
Stnd Error
P value
Total VA -69589 118 lt0001 06746 009 lt0001 0253 009 00047
OR1 -1604 237 04974 02284 021 02791 01514 012 0211 OR10 -63951 183 00005 05508 014 00001 03106 014 00224 OR 100 -06468 220 07692 02262 016 01635 -00158 017 09274 FI VA -87116 128 lt0001 07839 011 lt0001 02166 009 0013 OR1 -33285 246 01767 03601 024 0126 00597 013 06478 OR10 -80583 175 lt0001 06809 018 00001 02557 013 0057
Rural 4-Leg Signalized
OR 100 -48381 221 00287 04243 018 00193 01523 018 03943 Total VA -5494 020 lt0001 03533 002 lt0001 03935 003 lt0001
OR1 -62351 058 lt0001 04167 006 lt0001 04507 008 lt0001OR10 -53594 028 lt0001 03379 003 lt0001 03998 004 lt0001OR 100 -51255 027 lt0001 02914 003 lt0001 04075 004 lt0001FI VA -66927 030 lt0001 03899 003 lt0001 04156 004 lt0001OR1 -82561 095 lt0001 05221 009 lt0001 04962 012 lt0001OR10 -70797 044 lt0001 03789 004 lt0001 0497 005 lt0001
Rural 4-Leg Minor Stop Control
OR 100 -63326 038 lt0001 03223 004 lt0001 04424 005 lt0001Total VA -75754 084 lt0001 06465 008 lt0001 03332 008 lt0001
OR1 -58798 220 00075 05076 020 00143 0313 013 00161 OR10 -64368 110 lt0001 0544 011 lt0001 02863 006 lt0001OR 100 -9899 139 lt0001 08047 015 lt0001 04386 006 lt0001FI VA -87112 103 lt0001 07224 010 lt0001 02578 006 lt0001OR1 -9219 260 00004 07258 022 00011 03407 016 00326 OR10 -88607 146 lt0001 07059 016 lt0001 02809 008 00009
Rural 3-Leg Signalized
OR 100 -111835 185 lt0001 08669 018 lt0001 03977 008 lt0001Total VA -43293 008 lt0001 03366 001 lt0001 02087 001 lt0001
OR1 -50904 022 lt0001 0406 002 lt0001 02752 003 lt0001OR10 -40969 009 lt0001 03133 001 lt0001 02001 001 lt0001OR 100 -4231 016 lt0001 02997 002 lt0001 02308 003 lt0001FI VA -53415 011 lt0001 03394 001 lt0001 02237 001 lt0001OR1 -64457 031 lt0001 04195 003 lt0001 0307 004 lt0001OR10 -50831 014 lt0001 03245 002 lt0001 02014 002 lt0001
Rural 3-Leg Minor Stop Control
OR 100 -51046 024 lt0001 03163 003 lt0001 02112 003 lt0001
Standard Error
49
Table A-3 SPFs Goodness of Fit Results for Urban Northern Operational Region (No 1)
Data Estimation Data 70 Validation Data 30
Subtype Site MSE r2 R2FT MPB MAD MSPE R2
FT
Total VA 41150 0529 0557 -0760 4329 38490 0575
Total R1 4110 051 0551 -020 464 4486 054
FI VA 704 038 0406 -046 194 767 048
Urban 4-Leg Signalized
FI R1 809 039 0439 012 214 950 038
Total VA 224 031 0313 -003 090 238 029
Total R1 308 028 0286 008 095 200 032
FI VA 053 019 0193 000 043 053 019
Urban 4-Leg Minor Stop Control
FI R1 064 018 0187 003 043 048 021
Total VA 2490 038 0370 -064 352 2759 037
Total R1 3034 032 0305 -015 365 2687 037
FI VA 447 028 0259 -019 153 488 026
Urban 3-Leg Signalized
FI R1 559 025 0231 004 157 448 029
Total VA 185 025 0230 -004 089 204 024
Total R1 208 026 0239 -006 094 219 026
FI VA 043 015 0133 -002 043 048 016
Urban 3-Leg Minor Stop Control
FI R1 047 017 0156 -001 044 050 017
50
Table A-4 SPFs Goodness of Fit Results for Urban Western Operational Region (No 10)
Data Estimation Data 70 Validation Data 30
Subtype Site MSE r2 R2FT MPB MAD MSPE R2
FT
Total VA 41150 0529 0557 -0760 4329 38490 0575
Total R10 21976 0777 0735 1290 3233 17910 0686
FI VA 7043 0385 0406 -0458 1938 7671 0475
Urban 4-Leg Signalized
FI R10 4280 0526 0500 0377 1597 5170 0452
Total VA 2238 0315 0313 -0034 0897 2383 0292
Total R10 1161 0361 0300 -0032 0740 1050 0188
FI VA 0530 0194 0193 -0004 0432 0533 0194
Urban 4-Leg Minor Stop Control
FI R10 0312 0197 0187 0000 0382 0330 0009
Total VA 24900 0375 0370 -0645 3519 27591 0369
Total R10 14446 0451 0397 -0168 2801 24410 0255
FI VA 4467 0275 0259 -0185 1527 4875 0262
Urban 3-Leg Signalized
FI R10 3077 0266 0216 0039 1258 3390 0115
Total VA 1854 0254 0230 -0043 0893 2038 0239
Total R10 1391 0233 0197 -0054 0800 1640 0207
FI VA 0428 0151 0133 -0021 0431 0476 0157
Urban 3-Leg Minor Stop Control
FI R10 0354 0111 0089 -0019 0404 0380 0125
51
Table A-5 SPFs Goodness of Fit Results for Urban Eastern Operational Region (No 100)
Data Estimation Data 70 Validation Data 30
Subtype Site MSE r2 R2FT MPB MAD MSPE R2
FT
Total VA 41150 0529 0557 -0760 4329 38490 0575
Total R100 31108 0632 0630 0243 4717 37450 0005
FI VA 7043 0385 0406 -0458 1938 7671 0475
Urban 4-Leg Signalized
FI R100 5201 0480 0454 -0098 1864 5410 0244
Total VA 2238 0315 0313 -0034 0897 2383 0292
Total R100 1720 0443 0381 0087 0758 1150 0003
FI VA 0530 0194 0193 -0004 0432 0533 0194
Urban 4-Leg Minor Stop Control
FI R100 0509 0273 0254 0049 0383 0360 0173
Total VA 24900 0375 0370 -0645 3519 27591 0369
Total R100 17782 0410 0410 -1753 0908 38780 0004
FI VA 4467 0275 0259 -0185 1527 4875 0262
Urban 3-Leg Signalized
FI R100 3194 0243 0263 -0615 1645 5860 0236
Total VA 1854 0254 0230 -0043 0893 2038 0239
Total R100 1561 0233 0210 -0127 0902 2230 0002
FI VA 0428 0151 0133 -0021 0431 0476 0157
Urban 3-Leg Minor Stop Control
FI R100 0387 0131 0116 -0043 0444 0500 0141
52
Table A-6 SPFs Goodness of Fit Results for Rural Northern Operational Region (No 1)
Data Estimation Data 70
Validation Data 30
Subtype Site MSE r2 R2FT MPB MAD MSPE R2
FT
Total VA 10990 0353 0321 0513 2210 10070 -0073
Total R1 20080 0118 0092 -1389 3661 34220 0212
FI VA 2350 0196 0181 0045 1189 2600 -0034
Rural 4-Leg Signalized
FI R1 2920 0057 0052 -1173 1931 9760 0028
Total VA 1090 0182 0167 -0067 0794 1190 0171
Total R1 1990 0190 0245 0001 0942 1640 0173
FI VA 0480 0112 0098 -0022 0504 0530 0110
Rural 4-Leg Minor Stop Control
FI R1 0920 0093 0112 0020 0541 0520 0009
Total VA 5490 0328 0305 -0010 1651 5760 0179
Total R1 11110 0182 0254 -0679 2271 14750 0497
FI VA 1450 0181 0170 -0041 0902 1710 0099
Rural 3-Leg Signalized
FI R1 3230 0131 0153 -0116 1006 2120 0355
Total VA 0690 0144 0104 -0008 0613 0730 0102
Total R1 1210 0245 0196 0030 0712 0930 0126
FI VA 0250 0071 0048 -0009 0345 0260 0048
Rural 3-Leg Minor Stop Control
FI R1 0340 0124 0093 0016 0366 0300 0052
53
Table A-7 SPFs Goodness of Fit Results for Rural Western Operational Region (No 10)
Data Estimation Data 70 Validation Data 30
Subtype Site MSE r2 R2FT MPB MAD MSPE R2
FT
Total VA 10990 0353 0321 0513 2210 10070 -0073
Total R10 6020 0311 0268 0007 1748 6050 0382
FI VA 2350 0196 0181 0045 1189 2600 -0034
Rural 4-Leg Signalized
FI R10 1880 0158 0139 0097 0945 1590 0254
Total VA 1090 0182 0167 -0067 0794 1190 0171
Total R10 1300 0196 0163 0070 0760 1020 0078
FI VA 0480 0112 0098 -0022 0504 0530 0110
Rural 4-Leg Minor Stop Control
FI R10 0560 0142 0118 0025 0495 0480 0014
Total VA 5490 0328 0305 -0010 1651 5760 0179
Total R10 3690 0163 0170 -0432 0748 6740 0039
FI VA 1450 0181 0170 -0041 0902 1710 0099
Rural 3-Leg Signalized
FI R10 0890 0124 0117 -0391 0997 4030 -0066
Total VA 0690 0144 0104 -0008 0613 0730 0102
Total R10 0640 0126 0091 0025 0583 0580 0055
FI VA 0250 0071 0048 -0009 0345 0260 0048
Rural 3-Leg Minor Stop Control
FI R10 0240 0062 0041 0003 0335 0230 0028
54
Table A-8 SPFs Goodness of Fit Results for Rural Eastern Operational Region (No 100)
Data Estimation Data 70 Validation Data 30
Subtype Site MSE r2 R2FT MPB MAD MSPE R2
FT
Total VA 10990 0353 0321 0513 2210 10070 -0073
Total R100 10120 0042 0027 1207 1882 5120 -0307
FI VA 2350 0196 0181 0045 1189 2600 -0034
Rural 4-Leg Signalized
FI R100 2060 0053 0039 0119 0962 1370 -0023
Total VA 1090 0182 0167 -0067 0794 1190 0171
Total R100 0960 0170 0149 -0086 0746 1140 0209
FI VA 0480 0112 0098 -0022 0504 0530 0110
Rural 4-Leg Minor Stop Control
FI R100 0440 0106 0092 -0031 0475 0490 0121
Total VA 5490 0328 0305 -0010 1651 5760 0179
Total R100 2770 0492 0459 0601 1759 6260 0090
FI VA 1450 0181 0170 -0041 0902 1710 0099
Rural 3-Leg Signalized
FI R100 1040 0265 0255 0124 0923 1570 -0055
Total VA 0690 0144 0104 -0008 0613 0730 0102
Total R100 0640 0125 0087 -0037 0601 0690 0119
FI VA 0250 0071 0048 -0009 0345 0260 0048
Rural 3-Leg Minor Stop Control
FI R100 0250 0064 0038 -0013 0345 0270 0062
55
APPENDIX B
RECOMMENDED SAFETY PERFORMANCE FUNCTION MODELS
Table B-1 Recommended Urban SPFs Site Virginia SPF Models to Be Used for Urban Intersections
Urban 4-Leg Signalized Total Virginia generic total
Urban 4-Leg Signalized
Operational Region 1 generic total
Urban 4-Leg Signalized
Operational Region 10
use specified model developed
Urban 4-Leg Signalized
Operational Region 100 generic total
Urban 4-Leg Signalized FI Virginia generic FI
Urban 4-Leg Signalized
Operational Region 1 generic FI
Urban 4-Leg Signalized
Operational Region 10
use specified model developed
Urban 4-Leg Signalized
Operational Region 100
use specified model developed
Urban 4-Leg Minor Stop Control
Total Virginia generic total
Urban 4-Leg Minor Stop Control
Operational Region 1
use specified model developed
Urban 4-Leg Minor Stop Control
Operational Region 10
use specified model developed
Urban 4-Leg Minor Stop Control
Operational Region 100
use specified model developed
Urban 4-Leg Minor Stop Control
FI Virginia generic FI e^-76917MajADT^05001MinADT^03695
Urban 4-Leg Minor Stop Control
Operational Region 1
use specified model developed
Urban 4-Leg Minor Stop Control
Operational Region 10
use specified model developed
Urban 4-Leg Minor Stop Control
Operational Region 100
use specified model developed
56
Table B-1 Recommended Urban SPFs (Continued)
Site Virginia SPF Models to Be Used for Urban Intersections
Urban 3-Leg Signalized
Total Virginia
use generic model developed for total
crashes
Urban 3-Leg Signalized
Operational Region 1
use generic model developed for total
crashes
Urban 3-Leg Signalized
Operational Region 10
use specific regional model
developed
Urban 3-Leg Signalized
Operational Region 100
use generic model developed for total
crashes
Urban 3-Leg Signalized FI Virginia
use generic model developed for FI
crashes
Urban 3-Leg Signalized
Operational Region 1
use generic model developed for FI
crashes
Urban 3-Leg Signalized
Operational Region 10
use specific regional model
developed
Urban 3-Leg Signalized
Operational Region 100
use generic model developed for FI
crashes
Urban 3-Leg Minor Stop Control
Total Virginia
use generic model developed for total
crashes
Urban 3-Leg Minor Stop Control
Operational Region 1
use generic model developed for total
crashes
Urban 3-Leg Minor Stop Control
Operational Region 10
use specific regional model
developed
Urban 3-Leg Minor Stop Control
Operational Region 100
use generic model developed for total
crashes
Urban 3-Leg Minor Stop Control
FI Virginia use generic model developed for FI
crashes
Urban 3-Leg Minor Stop Control
Operational Region 1
use generic model developed for FI
crashes
Urban 3-Leg Minor Stop Control
Operational Region 10
use specific regional model
developed
Urban 3-Leg Minor Stop Control
Operational Region 100
use generic model developed for FI
crashes
57
Table B-2 Recommended Rural SPFs Site Virginia SPF Models to Be Used for Rural Intersections
Rural 4-Leg Signalized Total Virginia
use generic model developed for total
crashes
Rural 4-Leg Signalized
Operational Region 1
use generic model developed for total
crashes
Rural 4-Leg Signalized
Operational Region 10
use specific regional model developed
Rural 4-Leg Signalized
Operational Region 100
use specific regional model developed
Rural 4-Leg Signalized FI Virginia use generic model
developed for FI crashes
Rural 4-Leg Signalized
Operational Region 1
use generic model developed for FI crashes
Rural 4-Leg Signalized
Operational Region 10
use specific regional model developed
Rural 4-Leg Signalized
Operational Region 100
use specific regional model developed
Rural 4-Leg Minor Stop Control Total Virginia
use generic model developed for total
crashes
Rural 4-Leg Minor Stop Control
Operational Region 1
use generic model developed for total
crashes e^-549MajADT^035MinADT^039
Rural 4-Leg Minor Stop Control
Operational Region 10
use specific regional model developed
Rural 4-Leg Minor Stop Control
Operational Region 100
use generic model developed for total
crashes
Rural 4-Leg Minor Stop Control FI Virginia use generic model
developed for FI crashes
Rural 4-Leg Minor Stop Control
Operational Region 1
use generic model developed for FI crashes
Rural 4-Leg Minor Stop Control
Operational Region 10
use generic model developed for FI crashes
Rural 4-Leg Minor Stop Control
Operational Region 100
use generic model developed for FI crashes
58
Table B-2 Recommended Rural SPFs (Continued)
Site Virginia SPF Models to Be Used for Rural Intersections
Rural 3-Leg Signalized Total Virginia use generic model
developed for total crashes
Rural 3-Leg Signalized
Operational Region 1
use generic model developed for total crashes
Rural 3-Leg Signalized
Operational Region 10
use generic model developed for total crashes
Rural 3-Leg Signalized
Operational Region 100
use generic model developed for total crashes
Rural 3-Leg Signalized FI Virginia use generic model
developed for FI crashes
Rural 3-Leg Signalized
Operational Region 1
use generic model developed for FI crashes
Rural 3-Leg Signalized
Operational Region 10
use generic model developed for FI crashes
Rural 3-Leg Signalized
Operational Region 100
use generic model developed for FI crashes
Rural 3-Leg Minor Stop Control Total Virginia use generic model
developed for total crashes
Rural 3-Leg Minor Stop Control
Operational Region 1
use generic model developed for total crashes
Rural 3-Leg Minor Stop Control
Operational Region 10
use specific regional model developed
Rural 3-Leg Minor Stop Control
Operational Region 100
use generic model developed for total crashes
Rural 3-Leg Minor Stop Control FI Virginia use generic model
developed for FI crashes
Rural 3-Leg Minor Stop Control
Operational Region 1
use generic model developed for FI crashes
Rural 3-Leg Minor Stop Control
Operational Region 10
use specific regional model developed
Rural 3-Leg Minor Stop Control
Operational Region 100
use generic model developed for FI crashes

8
Evaluation of Recommended Minnesota SPFs
Once all of the necessary data were obtained for each of the study sites the SafetyAnalyst-recommended SPFs which are based on data for intersections in Minnesota were tested to determine how well they fit the Virginia data Both graphical and statistical methods were used to conduct these tests The graphical method consisted of a visual inspection of the spread of the Virginia data for a specific configuration of intersection and the actual crashes of a given severity plotted with the resultant curve from using the same Virginia database and the corresponding recommended Minnesota SPF The statistical test consisted of computing the Freeman-Tukey RFT 2 coefficients for the recommended SPFs using the appropriate Virginia data The RFT
2 coefficient was used as this was the statistical parameter used to represent the goodness of fit (ITT Corporation 2008) in developing the SafetyAnalyst-recommended SPFs Equations 1 2 and 3 show how the data were transformed to compute the RFT
2 (Fridstroslashm et al 1995) fi = ( yi )05 + ( yi +1 )05 (Eq 1) ecirci = fi ndash ( 4 times ŷi + 1 )05 (Eq 2) RFT
2 = 1 ndash sumiecirci2 sumi( fi ndash fm )2 (Eq 3)
where fi = Freeman-Tukey transformation statistic yi = observed data at site i ecirci = residual at site i ŷi = modeled (predicted) value at site i fm= mean of the transformation statistic (fi) across all sites of the same configuration and urbanrural classification RFT
2 = Freeman-Tukey R2
Developing Virginia-Specific SPFs
The format of the specific SPFs developed for Virginia is the same as that in the
SafetyAnalyst manual and given as
1 2k e x MajAADT x MinAADTβ βα= (Eq 4) where
k = predicted crash frequency per intersection per year MajAADT = AADT on the major road (vehday) MinAADT = AADT on the minor road (vehday) α = intercept
9
β1 = coefficient of major AADT β2 = coefficient of minor AADT
In developing the SPFs a negative binomial (NB) distribution for the crash data was
used as preliminary analysis showed that the data fit the NB distribution The form of the data used to develop the SPFs can be either the panel or cross-sectional (collapsed) format According to Kweon and Lim (2010) the panel format uses original panel data which consist of assembling several years of data over the same intersection and the cross-sectional models use pseudondashcross-sectional data which are data converted or rearranged from the panel set The difference between the two types of models obtained is that the model based on the panel data form takes advantage of the characteristics of the panel data by positioning a predefined correlation structure on reciprocated measures over years at the same time whereas the model based on the cross-sectional form uses the data created by collapsing the multi-year panel data into apparently a single-year panel data The crash data were divided into the estimation and validation portions Seventy percent was selected randomly and used as the estimation data to develop the SPFs and the remaining 30 was used as the evaluation data
An estimation of acceptable values was made for the regression coefficients and the
dispersion parameter when developing the SPFs for the EB method in SafetyAnalyst The regression coefficients are critical for the comparison of different SPFs The dispersion parameter (d) is important when using the EB method in SafetyAnalyst because it plays an integral function in computing the EB weight that influences the estimate of the EB long-term predicted crashes When determining the dispersion parameter from SAS for the urban four-leg signalized intersections the values obtained were d = 02223 for the panel data and d = 02216 for the collapsed data but when determining the values for the urban four-leg two-way stop intersections the values calculated were d = 04284 for panel data and d = 02518 for collapsed data In the urban four-leg two-way stop intersections a significant difference in the d values was observed which led to the choice of panel data for the modeling as they would be more reliable than the collapsed data By looking at the obtained values it can be appreciated that the collapsed model underestimates the dispersion which will eventually cause the EB value to inflate therefore leading to a biased report for the collapsed model
Generalized linear modeling (GLM) was used to create a correlation between the intersection crashes for the 5 years chosen for analysis and the major and minor approach volumes For the statistical modeling SAS was employed (SAS Institute Inc 2009) This software includes the GENMOD procedure and the equation used is the same as given in Equation 5 The GENMOD procedure gives an output of generalized estimating equations (GEE) parameter estimates which are the ones used to develop the Virginia SPFs
1 2exp( )it itk MajAADT MajAADTα β β ε= + + + (Eq 5) where i = intersection index (i = 1hellip N) t = severity index (t = TOT [total crashes] FI [fatal + injury crashes] PDO [property damage only])
10
α = intercept β1 = coefficient of major AADT β2 = coefficient of minor AADT
itk = dependent variable at intersection i and severity t (crashesyr) νit = random error exp (νit) Gamma (θ θ) εit = random (residual) error in GEE
The random errors presented in this equation have the function of not letting the β values or coefficients become biased
Evaluation of Virginia-Specific SPFs
Several statistical parameters were used to assess how well the Virginia SPFs fit the data The parameters used and suggested by Washington et al (2005) were the mean prediction bias (MPB) the mean absolute deviation (MAD) the mean square error (MSE) the mean squared prediction error (MSPE) the Pearsonrsquos product moment correlation coefficients between observed and predicted crash frequencies (used for both validation and estimation data) dispersion parameters and the Freeman Tukey RFT
2 coefficients computed from Equation 3 To test the fit of the SPFs the 70 estimation data set was used to calculate the MSE the Pearsonrsquos product moment correlation coefficients the R2 and the R2
FT To test the transferability of the SPFs the 30 validation data set was used to compute the MPB MAD and the MSPE The expressions used to determine these coefficients are given in Equations 6 through 10
( )2
iin
1i
nYYMPB
2 minussum= = (Eq 6)
2
n
1i ii
n
YYMAD
2sum=minus
= (Eq 7)
( )
pnYY
MSE1
n
1i
2
ii2
minus
minus= sum = (Eq 8)
( )
2
n
1i
2
ii
nYY
MSPE2sum=
minus= (Eq 9)
where p = degrees of freedom i = intersection index Yi = observed crash frequency at intersection i Ŷi = predicted crash frequency at intersection i
11
n2 = validation data sample size 30 n1 = estimation data sample size 70
(Eq 10) where
_
1Y = average of observed crashes per intersections _
2Y = average of predicted crashes per intersections Yi1 = observed values at intersection i Y i2 = predicted values at intersection i
It should be noted that when values obtained from the MPB MAD MSE and MSPE
formulas are close to 0 it indicates a good fit or desirable SPF and when values for the RFT2 and
R2 formulas are close to 1 it indicates a suitable fit The dispersion parameter (d) is used in the variance-mean relationships as shown in Equations 11 and 12
(Eq 11)
( ) ( ) ( )i i i i i iVar Y X E Y X d x E Y X= + (Eq 12) A weighting factor (Wi) used in the EB procedure is obtained from Equation 13 and used in Equation 14 to obtain the EB-estimated value
( )1
1ii i
Wd x E Y X
=+
(Eq 13)
( ) ( ) ( )1EB i i i i i i iE E y y W x E Y X W x Y= + minus (Eq 14)
where 0 lt W lt 1 Var (|) = conditional variance E (|) = conditional mean Var m or Var (Yi|Xi) = estimated variance of mean crash rate E m or E (Yi|Xi) = estimated mean crash rate from SPF d = estimated NB dispersion parameter (also called overdispersion parameter)
2Var m E m d x E m= +
( )( )( ) ( )
1 1 2 21 22 2
1 21 2
i i
i i
Y Y Y Yr
Y Y x Y Y
sum minus minus=⎡ ⎤sum minus sum minus⎢ ⎥⎣ ⎦
12
W = weight Xi = variables such as AADT Yi = number of observed crashes per year at intersection i EEB = EB-adjusted estimated crashes (crashesyr)
In the variance-mean relationship if the value obtained for the dispersion parameter d is 0 then the variance is the same as the mean (see Equations 11 and 12) which causes the NB model to collapse to the Poisson model This parameter has a strong influence on the weight in the EB formula (see Eq 13) therefore it has an effect in the EB-estimated value SAS was helpful in computing this parameter for the different types of intersections analyzed in the study throughout the 5 years
Pruning Process
Before the site prioritization was performed pruning was done to avoid over-representation of the SPFs that might not reflect much difference in the study when compared with statewide SPFs At the completion of the pruning process only the necessary or minimum effective SPFs were retained MSPE is typically the parameter used to assess errors associated with a validation data set for this reason MSPE was used for pruning In order to verify whether a specific regional SPF should be retained or not the validation data set (30 of the data) was used to compute MSPE for both the specific regional SPFs and the corresponding statewide SPFs If MSPE for the regional SPF was greater than that for the corresponding Virginia statewide SPF or if the difference between these two MSPEs was less than 10 it was concluded that the regional SPF was not necessary and it was therefore discarded The following example illustrates the steps for urban four-leg signalized FI crashes in Region 1
1 The 30 FI crash data were obtained for urban signalized four-leg intersections in Region 1 and the MSPE was determined using the statewide SPF for the FI urban four-leg signalized intersections
2 The 30 FI crash data for urban signalized four-leg intersections in Region 1 were
then used to determine MSPE for the specific Region 1 SPF for FI crashes 3 Verify if the MSPE value for the specific regional SPF is higher than the statewide
MSPE value if yes discard the specific regional SPF if no tentatively retain the specific regional model
4 The difference between the two MSPEs was determined to determine whether it was
less than 10 of the statewide MSPE if yes discard the specific regional SPF if no retain the specific regional model This process was repeated for all regional SPFs
13
Identification of Intersections with a Higher Than Expected Number of Crashes
In order to identify some of the intersections with a higher than expected number of crashes a prioritization analysis based on the EB method was conducted This analysis was carried out to identify the top 25 intersections with a high PSI in the urban areas of the Northern Virginia and Bristol districts These two districts were selected to identify any effect of the approach AADTs as two-lane roads in the Northern Virginia District carry much higher volumes than those in the Bristol District The PSI is the difference between the EB-adjusted long-term crashes and the SPF-estimated crashes The PSI was first determined and then a priority list was developed with intersections showing a higher PSI receiving a higher priority This procedure first required the computation of yearly calibration factors (Cy) that accounted for intrinsic yearly variations that were not accounted for in developing the SPFs These yearly calibration factors were determined using the steps described here and given in Equations 15 through 18 (ITT Corporation 2008) Calculation of Yearly Calibration Factor (Cy) For subtype s and severity t the following steps were performed 1 Calculate the (unadjusted) predicted number of crashes using the appropriate SPF yiMinAADTMajAADTe ststst
isyisyisty amp~ 21ˆˆˆ foralltimestimes= ββακ (Eq 15)
2 Sum the predicted numbers over all intersections
ysN
iistysty forall=sum
=
~~1κκ (Eq 16)
3 Sum the observed numbers of crashes over all intersections
yKKsN
iistysty forall=sum
=
1
(Eq 17)
4 Calculate yearly calibration factor csty
yK
csty
stysty forall= ~κ (Eq 18)
5 Repeat the steps for all subtypes (s) and severities (t)
where i = intersection index (i = 1hellip N)
14
s = subtype index (s = urban four-leg signalized intersection rural three-leg minor stop controlled intersection etc) t = severity index (t = TOT [total crashes] FI [fatal + injury crashes] PDO [property damage only]) y = year index (i = 1 [base year] 2 hellip Y) csty = yearly calibration factor for crash subtype s severity t and year y MajAADT = AADT on the major road (vehday) MinAADT = AADT on the minor road (vehday)
istyκ~ = (unadjusted) predicted number of crashes at intersection i for crash subtype s severity t and year y
istyκ = (adjusted) predicted number of crashes at intersection i for crash subtype s severity t and year y α = intercept
1β = coefficient of major AADT 2β = coefficient of minor AADT
These yearly calibration factors were then used to determine the predicted number of
crashes at an intersection based on the SPF for the severity of crashes and type of intersection being considered The PSI for each intersection was then determined using the steps described in Equations 19 through 22 (ITT Corporation 2008) Steps for Calculating PSI for Subtype s
1 Calculate the (adjusted) predicted number of crashes
amp~
21ˆˆˆ ststst
isyisysty
istystyisty
MinAADTMajAADTec
yticββα
κκ
timestimestimes=
foralltimes= (Eq 19)
2 Calculate yearly correction factor Cisty
ytiCyist
istyisty amp
)1(
forall==κ
κ
(Eq 20)
3 Calculate EB weight
tid
w Y
y istystist amp
11
1
foralltimes+
=sum =
κ (Eq 21)
4 Calculate the EB-adjusted estimated number of crashes for year 1
15
tiC
KwwX Y
y isty
Y
y istyistyististyist amp)1(
1
1)1()1( forallminus+times=
sumsum
=
=== κ (Eq 22)
5 Determine the PSI for each intersection If istYX gt istYκ include intersection i in the list for prioritization using istYPSI = istYX
where i = intersection index (i = 1hellip N) s = subtype index (s = urban four-leg signalized intersection rural three-leg minor stop
controlled intersection etc) t = severity index (t = TOT [total crashes] FI [fatal + injury crashes] PDO [property damage
only]) y = year index (y = 1 [base year] 2 hellip Y) cy = yearly calibration factor for crash subtype s severity t and year y d = dispersion parameter w = weight MajAADT = AADT on the major road (vehday) MinAADT = AADT on the minor road (vehday) PSI = potential for safety improvement
istyC = yearly correction factor
istyκ~ = (unadjusted) predicted number of crashes at intersection i for crash subtype s severity t and year y
istyκ = (adjusted) predicted number of crashes at intersection i for crash subtype s severity t and year y
istyX = EB-adjusted estimated number of crashes α = intercept
1β = coefficient of major AADT 2β = coefficient of minor AADT
The prioritization lists for urban two-lane roads in the Northern Virginia and Bristol
districts were then developed based on the PSIs obtained for three prioritization procedures These alternative prioritization procedures were the average crash rates (ACRs) for the study period (see Equation 23) the critical crash ratio (CCR) (see Eqs 24 through 27) (Garber and Hoel 2009) and the EB method The list was developed with the intersections having the highest PSI listed first followed by other intersections in descending order The execution of the EB method prioritization process was achieved through use of the computer codes in SAS Finally the effectiveness of using the EB method for prioritizing sites for safety improvement was illustrated by comparing the PSIs from using intersection crash rates critical crash and the EB procedures
16
Procedure for Crash Rate Method The ACR for the intersection is given as
( )(1000000)( )( )(365)T
TCACRN V
= (Eq 23)
where ACR = the average crash rate for the intersection under consideration (crashes1000000
approach volume) TC = number of crashes over the study period at the intersection N = duration of study period (yr) VT = average daily total approach volume at the intersection Procedure for Critical Rate Method
The critical rate method was accomplished by first computing the traffic base (TB) of the intersection under consideration using Equation 24 The ACR for the intersection under consideration is then computed using its TB as shown in Equation 25 The intersection critical crash rate (ICCR) is then determined using Equation 26 The critical crash ratio (CCR) for the intersection is then computed as the ratio of ICR and the average crash rate (AVR) for all intersections under the same category (intersection type urbanrural etc) as that for the intersection being considered using Equation 27 TB is given as
365
1 000 000
NxVxTB = (Eq 24)
where TB = the total approach volume over the study period of N years at the intersection under consideration (veh1000000) V = average daily approach volume at the intersection under consideration ACR is obtained as
TCACRTB
= (Eq 25)
where ACR = ACR at the intersection under consideration over the study period of N years
17
TB = the total approach volume over the study period of N years at the intersection under consideration (veh1000000) The critical crash rate (ICCR) for the intersection under consideration is given as
05 AVRICCR AVR TFTB TB
= + + (Eq 26)
where AVR = ACR for intersections within the state and of the same designation (eg rural three-leg with minor stop control) as that for the intersection under consideration TF = number of standard deviations for the confidence level being used in the analysis (usually 196 for 95 confidence level) TB = the total approach volume over the study period of N years at the intersection under consideration (veh1000000) The critical crash ratio (CCR) for the intersection is then obtained as
ACRCCRICCR
= (Eq 27)
where ACR = ACR at the intersection under consideration over the study period of N years (see Eq 2) ICCR = critical crash rate for the intersection under consideration (see Eq 26)
Benefits and Implementation Expectations
The expected benefits from developing SPFs and prioritizing intersection sites were illustrated by comparing the PSIs for the prioritized sites when sites were prioritized using the EB method with those obtained when sites were prioritized using crash rates and the critical crash ratio This analysis was conducted for the combined fatal plus injury crashes SPFs An estimate of the cost savings attributable solely to the potential reduction of crashes was also computed by using crash costs given in an FHWA study (FHWA 2005)
18
RESULTS AND DISCUSSION
Literature Review
SafetyAnalyst
The SafetyAnalyst Userrsquos Manual (ITT Corporation 2008) has SPFs that are suggested for intersections that are based on Minnesota data Tables 7 and 8 show the regression coefficients (α β1 and β2) for the SPFs developed for total and combined FI crashes respectively The values for the goodness of fit parameter RFT
2 are also given Although these RFT2 are all less
than 045 with a few less than 010 it has been suggested that the SPFs used in SafetyAnalyst could provide a realistic estimate of an expected crash frequency as a function of traffic volume and roadway geometry (Pham and Ragland 2005)
Methodological and Research References
Several studies similar to this study have been conducted in Canada Colorado California Texas New York and Minnesota For example a study was conducted using data from Colorado California and Texas to examine the functional form of the SPFs for urban freeways (Kononov et al 2008) Five years of crash data were acquired from the respective departments of transportation and the highway safety information system from Colorado The study revealed that the amount of crashes increased moderately with congestion in segments on urban freeways This study however did not include intersections
A study by Lyon et al was conducted in Toronto Ontario Canada to develop SPFs for urban signalized intersections (Lyon et al 2005) Collision data were gathered for five years and included 1950 urban intersections SPFs were developed for different severity levels impact types and intersection types such as four-leg and three-leg intersections The format used to develop the SPFs is shown in Equation 28 This format is somewhat different from that of Equation 4 suggested in Safety Analyst
Collisionsyear = α (F1)β1(F2)β2 exp (β3X1 + β4X2 + ) (Eq 28) where α and βi = the coefficients estimated in the SPF calibration process F1 and F2 = the entering AADTs on the major and minor roads respectively Xi = other independent variables (such as single lane versus multilane approaches with and without left-turn lanes or right-turn lanes high and low pedestrian activities or in some cases F1 or F2 or both)
19
Table 7 SafetyAnalystrsquos SPFs for Intersections (Total Crashes) Site
subtype Code
Site subtype Description
State Regression coefficients
LogIntercept (α)
Regression coefficients
LogAADTmaj (β1)
Regression coefficients LogAADT
min (β2)
Over - dispersion Parameter
(k)
RFT2
() Number of Sites
Max AADTmaj
(vehday)
Max AADTmin
(vehday)
Rural 201 Rural 3-leg with minor-
road STOP control MN -878 071 024 107 133 1706 28500 27000
202 Rural 3-leg with all-way STOP control
MN -1237 122 027 047 41 41 25300 6803
203 Rural 3-leg with signal control
MN -657 066 02 033 26 136 36400 11500
204 Rural 4-leg with minor-road STOP control
MN -896 065 047 07 299 2114 35500 26700
205 Rural 4-leg with all-way STOP control
MN -1237 122 027 047 41 41 25300 6803
206 Rural 4-leg with signal control
MN -657 066 02 033 26 136 36400 11500
Urban 251 Urban 3-leg with minor-
road STOP control MN -535 034 028 128 59 397 68000 18900
252 Urban 3-leg with all-way STOP control
MN -1237 122 027 047 41 41 25300 6803
253 Urban 3-leg with signal control
MN -985 097 018 023 414 33 50000 25807
254 Urban 4-leg with minor-road STOP control
MN -312 027 016 086 76 333 58870 81000
255 Urban 4-leg with all-way STOP control
MN -1237 122 027 047 41 41 25300 6803
256 Urban 4-leg with signal control
MN -347 042 014 032 264 418 75000 81000
ITT Corporation 2008
20
Table 8 SafetyAnalystrsquos SPFs for Intersections (Fatal and Injury Crashes) Site
subtype Code
Site subtype Description
State Regression coefficients
LogIntercept (α)
Regression coefficients
LogAADTmaj (β1)
Regression coefficients LogAADT
min (β2)
Over - dispersion Parameter
(k)
RFT2
() No of Sites
Max AADTmaj
(vehday)
Max AADTmin
(vehday)
Rural 201 Rural 3-leg with minor-
road STOP control MN -935 071 021 123 91 1706 28500 27000
202 Rural 3-leg with all-way STOP control
MN -1002 127 -022 089 248 41 25300 6803
203 Rural 3-leg with signal control
MN -783 075 014 05 215 136 36400 11500
204 Rural 4-leg with minor-road STOP control
MN -936 066 04 0 146 2114 35500 26700
205 Rural 4-leg with all-way STOP control
MN -1002 127 -022 089 248 41 25300 6803
206 Rural 4-leg with signal control
MN -783 075 014 05 215 136 36400 11500
Urban 251 Urban 3-leg with minor-
road STOP control MN -845 049 039 123 81 397 68000 18900
252 Urban 3-leg with all-way STOP control
MN -1002 127 -022 089 248 41 25300 6803
253 Urban 3-leg with signal control
MN -1022 091 021 027 362 33 50000 25807
254 Urban 4-leg with minor-road STOP control
MN -435 029 019 099 57 333 58870 81000
255 Urban 4-leg with all-way STOP control
MN -1002 127 -022 089 248 41 25300 6803
256 Urban 4-leg with signal control
MN -511 049 016 03 295 418 75000 81000
ITT Corporation 2008
21
The study examined the impact of two left turn priority treatments which were flashing advanced green (FAG) and left turn green arrow (LTGA) on left turn collisions These treatments were implemented at 35 intersections in the city of Toronto Two types of collisions were investigated left turns with and without side impact The results indicated that there was an insignificant difference in the impact of the left turn priority treatments on both types of crashes
Lord and Persaud (2003) conducted a study that related SPFs to transportation planning models They noted that traffic safety is not usually accounted for when agencies are conducting a planning analysis to remodel build upgrade or modify their facilities Five-year intersection data from Canada were used Models were developed and statistical measures such as the over dispersion parameter were calculated and conclusions were made from the results The SPFs developed for the study were applied to two sample networks created with the help of a transportation planning software package The research showed that it is possible to make estimation for traffic safety at the planning stage of a project This will allow users to take safety into consideration when designing and possibly create alternatives to change existing designs for more comprehensive projects or development The study also indicated that there are limitations when applying the SPFs to computerized transportation networks The study concluded that although it is possible to predict or estimate crashes on digital transportation networks the accuracy of prediction relies greatly on how precise the traffic flow estimates are
Jonsson et al (2007) performed an SPF study that took into consideration the type and severity of crashes andmdashmost importantmdashthe causal factors for these crashes The study was conducted for intersections on rural four-lane highways in the state of California Four collision types were tested in the study opposite-direction same-direction intersecting-direction and single-vehicle crashes In addition a set of data from the state of New York was used with the same parameters to analyze the severity distribution of crash types The data for California included 1084 intersections on four-lane rural highways and that from New York included 675 intersections mainly stop controlled or without any control Generalized linear modeling was performed with the data after quality analysis Two model forms were estimated with the variables seen in Equations 29 and 30
(Eq 29)
(Eq 30)
where NAcc = predicted number of crashesyr at intersections AADTmajor = AADT on major road AADTminor= AADT traffic flow on minor road Βi = model parameters Xi = variables that describe the intersections (such as terrain lighting left turn number of though lanes and divided or undivided among others)
nn xxxormajorAcc exAADTxAADTN ββββββ ++++=
min4433021
nn xxxormajorAcc exAADTAADTN βββββ +++++=
min332201)(
22
The two different models are different representations of the traffic flow The first represents the AADT of major and minor roads as separate variables but in the second model they are represented as one variable by the sum of the major and minor roads AADTs Results showed that the first model performed better for the multiple-vehicle crashes and the second model fitted better for the single-vehicle crashes In addition the appropriate predictor variables differed depending on the crash type This study is also of interest as it incorporated additional parameters to those in the suggested SPFs now included in SafetyAnalyst and therefore could lead to possible future SPF research for the state of Virginia
Persaud and Nguyen (1998) conducted a study on signalized intersections in Ontario Canada They developed aggregate and disaggregate models to estimate safety performance of three- and four-leg intersections in which crash severity (injury and PDO) environmental class (semi-urban and rural) and time period (daily weekday morning peak and weekday afternoon peak) were considered in the analysis An important aspect of that study is that it supplemented the existing models used for estimating SPFs instead of replacing them because it took into consideration features that were generally not considered in the then existing developed models Two model levels were considered for the study Level 1 was based on the sum of AADTs for all approaches with separate estimates for rear-end right angle and turning movement crashes At this level the equations were adjusted for three- and four-leg intersections by crash severity for all combined impact types and also separately for the three major impact types which were angle rear-end and turning movement In addition models were further separated by time period (daily weekday morning and afternoon peak) and for four-leg intersections which were also classified by environment class such as semi-urban and rural Level 2 allowed estimates to be obtained for specific crash patterns that were defined by movements of the vehicles involved before collision and the same were estimated as a function of the flows that were relevant to each of the patterns For this level models were estimated for four-leg intersections for 12 multi-vehicle and three single-vehicle patterns that were described by the movements of involved vehicles before collision The developed models were intended to estimate the parameters P and d shown in Equations 31 and 33
The safety of the intersection was estimated using the long-term mean based on the EB approach The long term mean (m) was obtained by combining crash count (x) of an intersection in the most recent years (n) with the estimates of the expected annual number of crashes (P) as shown in Equation 31 W1 and W2 in Equations 31 through 33 represent the weights estimated from the mean and variance of the regression estimates
(Eq 31)
(Eq 32)
(Eq 33)
m =W1(x) +W2(P)
2dW
d nP=
+
1PW
d nP=
+
23
(Eq 34)
To estimate the variance of m the following formula was used
(Eq 35)
In Equations 32 through 35 P and d represent the fundamental parameters Two models were selected for SPFs For Level 1 and single-vehicle Level 2 (Eq 36) For multi-vehicle in Level 2 (Eq 37) where P = expected number of crashes of a given type α and β = regression parameters to be estimated S (Level 1) = sum of all entering flows for a given time period for Level 1 analysis S (Level 2) = sum of the daily through right or left turn flows for a given time period for Level 2 (single-vehicle) analysis S1 and S2 = AADTs for small and large flows for a specific crash pattern in Level 2 (multi-vehicle) analysis
The models in either level can be used in the EB procedure to provide estimates for intersections that need to be treated or for the evaluation of the effectiveness of safety countermeasures It should be noted that the quality of the estimates for the study was strongly related to how the parameters were selected and used in the SPFs and unlike other available road models the ones presented in this study can be separated by time period and crash pattern Persaud et al (2002) conducted a study to demonstrate the complexity involved in the calibration of crash prediction models or SPFs for urban intersections Toronto data for three- and four-leg signalized intersections were used to estimate the models for the study The performance of these models was then compared with other models from Vancouver and California The models from these places were recalibrated to fit Toronto by using the Interactive Highway Safety Design Model (IHSDM) and a calibration procedure as proposed by Harwood et al (2000) The results varied significantly and were also mixed The study noted that the calibration of models is not a simple task and due to the importance of the SPFs they must be properly calibrated Several things must be accounted for when performing this procedure in order to obtain good quality data analysis The first thing is to extract a large sample of high quality data A software or program to link all the traffic crash and road characteristics data must exist because the same is usually kept stored in different databases In addition several
2Pd
Var P=
2( )
d xVar m dnP
+=
+
P =αSβ
P =αS1β1 S2
β 2
24
years of crash data must be obtained in order to have a good amount of samples that account for variations The actual process of model calibration is complicated therefore careful attention must be paid when analyzing the same because of the importance of the outcomes of the study The authors of the study made an exploratory analysis and it revealed that the relationship between the crashes and each covariate should be described either by the power function or the gamma function for all intersection types to be analyzed Equations 38 through 40 are the selected model forms used in the study F1 = Power F2 = Gamma (Eq 38) F1 = Gamma F2 = Power (Eq 39) F1 = Power F2 = Power (Eq 40) where E (K) = expected annual number of crashes between 1990 and 1995 F1 F2 = average entering AADT of major and minor roads respectively for the period 1990 to 1995 α β1 β2 β3 β4 = coefficients to be estimated
An NB structure was used to analyze the models and the overdispersion parameter (γ) was analyzed using Equation 41
γ=
2)K(E)K(Var (Eq 41)
Variance increases as γ decreases therefore the value of γ can also be used to make a comparison for the goodness of fit of several models fitted to the same data The larger the value of γ the smaller the variance therefore a more accurate model is given The authors suggest that γ would be enough to calculate the goodness of fit index of any SPF but if one desires to know how accurate the prediction estimate is other measures should also be computed The authors suggested using R2
α as proposed by Miaou et al (1996) which is a dispersion parameter based R2 computed as shown in Equation 42
γγ
minus=αmin2 1R (Eq 42)
where γ = overdispersion parameter for calibrated model γmin = smallest possible overdispersion parameter
The authors suggested that a disaggregation by traffic volume is preferable than using
only a single calibration factor for that is what the IHSDM currently has A recommendation is made to account for safety variation in traffic conditions over time by calibrating the models every two to three years as suggested by Harwood et al (2000)
E(K) =αF1β1 F2
β 2e(β 3F2 )
E(K) =αF1β1 F2
β 2e(β 4 F1 )
E(K) =αF1β1 F2
β 2
25
The Illinois Department of Transportation and the University of Illinois Urbana-Champaign conducted a research study to develop and implement SPFs for road segments and intersections in Illinois (Tegge et al 2010) These SPFs were developed in a way suitable for easy implementation in SafetyAnalyst The crash data (number of crashes and crash severity) and roadway data (number of lanes traffic volume area type and functional class) were collected and used for development of the SPFs Seventeen peer groups were used for developing the SPFs for segments and eight for intersections The intersections peer groups were minor leg stop control all-way stop control signalized and undetermined for rural and urban segments separately The SPFs for segments were developed using NB distribution for crashes and Poisson distribution for intersections The SAS GENMOD procedure was used to develop the SPFs for a five-year analysis period from 2001 to 2005 The model form for the intersection SPFs is the same as that given in the SafetyAnalyst Userrsquos Manual The SPFs were also developed for different crash severities such as fatal crashes type A injury crashes type B injury crashes and fatal plus injury crashes The EB method was used to determine the sites with the higher PSIs Two analysis techniques were used to obtain the PSIs The first considered segments and intersections as individual elements and the second used the sliding window approach The site specific analysis treated each individual segment and intersection as a separate entity Each segment is then compared with every other segment instead of having them grouped together The sliding window approach defined a set length The window lengths were 025 mile and 1 mile for urban and rural segments respectively
The largest impact on crash frequency was found to be the AADT and was therefore the only variable modeled as a logarithm (lnAADT) By doing this the AADT accounted for most of the prediction whereas the rest of the variables refined the prediction further Other variables used included access control functional class lane width surface type area type speed limit and median type The study recommended that a multivariate analysis be conducted for such studies to show how certain variables could contribute to the crashes Other variables could include roadway lighting weather and pavement conditions and roadway geometry The study also concluded that knowledge of roadway characteristics that increase the risk of fatal or injury crashes will facilitate the setting up of safety criteria that can help engineers in the designing of safer roadways Further knowledge of driver behaviors that lead to fatal and severe injury crashes can facilitate the training of enforcement officers to identify these behaviors
The Colorado Department of Transportation (CDOT) (2009) conducted a study to develop SPFs for intersections in the state Their model form is the same as that in SafetyAnalyst The SPFs were developed for many categories based on the number of legs divided undivided rural and urban including urban four-lane divided signalized six-lane divided signalized urban three-leg signalized two-lane undivided unsignalized and urban three-leg unsignalized When a median or left-turn lane is present a roadway is considered divided The sites selected for the study reflected variability in traffic volume and geometry in order to have a diverse representation of intersections throughout the state SPFs were developed for total and for fatal plus injury crash types A five-year study period from 2000 through 2005 was used Crash and AADT data were collected for development of the SPFs CDOT used a NB error structure to develop the SPFs and the EB procedure to estimate the expected safety performance of an intersection site for different safety management purposes Overdispersion parameters were computed and used as a goodness of fit measure According to their data
26
overdispersion parameters indicated that their models provided a reasonable fit to the Colorado data
Results indicated that for signalized intersections roads with six lanes on major approaches have more collisions than those with four lanes on major approaches CDOT recommended that the SPFs should be recalibrated in the future using data from future years as crash frequencies may change over time because of a variety of issues The report also recommended that separate calibration factors should be developed for different regions and different topographies Research in Virginia
In Virginia two other similar studies have recently been published One by Garber et al (2010) for two-lane roads and another by Hamidi et al (2010) to identify high-crash sections on Virginiarsquos primary system by developing a planning-level methodology The study by Garber et al developed SPFs for two-lane segments of 1 mile or less and the study by Hamidi et al developed SPFs for longer segments of two-lane roads that can be used for corridor analysis
Evaluation of the Recommended Minnesota SPFs
Figures 3 through 6 show representative graphs that were used to visually examine how well the Virginia data fitted the suggested Minnesota SPFs Figures 3 and 4 are for urban four-leg signalized intersections and Figures 5 and 6 are for rural four-leg signalized intersections These graphs suggest that the Minnesota SPFs do not fully represent the Virginia data Tables 9 through 12 show the Freeman-Tukey R2
FT coefficients computed for the different Minnesota SPFs using the Virginia data The low Freeman-Tukey R2
FT coefficients obtained and the visual inspection of the graphs suggested that a better fit to the Virginia data could be obtained by developing specific Virginia SPFs using Virginia data It was therefore decided to develop specific SPFs for Virginia
0
2
4
6
8
10
12
14
0 20000 40000 60000 80000 100000 120000
AADT Major
Tota
l Cra
shes
Per
Yea
r
Minnesota VA Actual Observed
Minnesota Model
Figure 3 Total crashes per year vs major AADT for urban 4-leg signalized intersections
with minor AADT of 700
27
0
5
10
15
20
25
30
35
0 20000 40000 60000 80000 100000 120000
AADT Major
Tota
l Cra
shes
per
Yea
r
Minnesota VA Actual Observed
Minnesota Model
Figure 4 Total crashes per year vs major AADT for urban 4-leg signalized intersections
with minor AADT of 4500
0
2
4
6
8
10
12
14
0 20000 40000 60000 80000 100000 120000
AADT Major
Tota
l Cra
shes
Per
Yea
r
Minnesota VA Actual Observed
Minnesota Model
Figure 5 Total crashes per year vs major AADT for rural 4-leg signalized intersections with
minor AADT of 795
28
0
2
4
6
8
10
12
14
16
18
0 20000 40000 60000 80000 100000 120000
AADT Major
Tota
l Cra
shes
per
Yea
r
Minnesota VA Actual Observed
Minnesota Model
Figure 6 Total crashes per year vs major AADT for rural 4-leg signalized intersections with
minor AADT of 5000
Table 9 Minnesota SPFs for Urban FI Crashes and Corresponding R2FT Based
on Virginia Data
Intersection Type
Minnesota FI SPFs R2
FT Based on Virginia Urban FI Crash Data ()
Urban 4-Leg Signalized 032
Urban 4-Leg Minor Stop Control 008
Urban 3-Leg Signalized 026
Urban 3-LegMinor Stop Control 01
Table 10 Minnesota SPFs for Urban TOTAL crashes and Corresponding R2
FT Based on Virginia Data
Type of Intersection
Minnesota SPFs
R2FT Based on Virginia Urban Total
Crash Data ()
Urban 4-Leg Signalized 034
Urban 4-Leg Minor Stop Control 022
Urban 3-Leg Signalized 031
Urban 3-Leg Minor Stop Control 01
29
Table 11 Minnesota SPFs for Rural TOTAL Crashes and Corresponding R2FT
Based on Virginia Data
Type of Intersection
Minnesota SPFs R2
FT Based on Virginia Rural Total Crash Data ()
Rural 4-Leg Signalized 029
Rural 4-Leg Minor Stop Control 013
Rural 3-Leg Signalized 029
Rural 3-Leg Minor Stop Control -010
Table 12 Minnesota SPFs for Rural FI Crashes and Corresponding R2FT Based
on Virginia Data
Type of Intersection
Minnesota SPFs R2
FT Based on Virginia Rural FI Crash Data ()
Rural 4-Leg Signalized 018
Rural 4-Leg Minor Stop Control 010
Rural 3-Leg Signalized 018
Rural 3-Leg Minor Stop Control 001
Development and Evaluation of Specific Virginia SPFs
In keeping with the suggestion given in the Safety Analyst Userrsquos Manual the model form used to develop the intersection SPFs is given in Equation 4 as
1 2k e x MajAADT x MinAADTβ βα=
where
k = predicted crash frequency per intersection per year MajAADT = AADT on the major road (vehday) MinAADT = AADT on the minor road (vehday) α = intercept β1 = coefficient of mayor AADT β2 = coefficient of minor AADT
30
The statewide SPFs developed for Virginia are given in Tables 13 through 16 Due to lack of data the analysis for all-way stop intersections could not be undertaken These tables also give the Freeman-Tukey R2
FT coefficient for each of the Virginia SPFs and the corresponding Minnesota SPF and Freeman-Tukey R2
FT based on the Virginia data The R2FT coefficients
obtained indicate that the Virginia-specific SPFs fit the Virginia data better than the suggested Minnesota SPFs for all types of intersections and crash severity except those for FI crashes on urban three-leg signalized rural four-leg signalized and rural four-leg minor stop control intersections where the corresponding RFT
2 values are similar In Table 15 it can be seen that the Minnesota R2
FT value is negative for the rural three-leg minor stop control intersections The negative RFT
2 value is possible because these calculations were not performed on the same data points that were used to create the Minnesota SPFs (Miller 2009) Table 13 SPF Models for Urban TOTAL crashes and R2
FT results for Virginia Statewide (VDOT-maintained roads)
SPF model with TOTAL Crash values
R2FT TOTAL
Crash Data
Site Virginia Statewide Minnesota VA MN
Urban 4-Leg Signalized 056 034
Urban 4-Leg Minor Stop Control
032 022
Urban 3-Leg Signalized 037 031
Urban 3-Leg Minor Stop Control
023 010
Table 14 SPF Models for Urban FI crashes and R2
FT results for Virginia Statewide (VDOT-maintained roads)
SPF model with FI Crash values R2FT FI Crash Data ()
Site
Virginia Statewide Minnesota VA MN
Urban 4-Leg Signalized 041 032
Urban 4-Leg Minor Stop Control
019 008
Urban 3-Leg Signalized 026 026
Urban 3-Leg Minor Stop Control
013 010
31
Table 15 SPF Models for Rural TOTAL Crashes and R2FT Results for Virginia Statewide (VDOT-
maintained roads) SPF model with TOTAL Crash values R2
FT TOTAL Crash Data
Site
Virginia Statewide Minnesota VA MN
Rural 4-Leg Signalized 0321 0290
Rural 4-Leg Minor Stop Control
0167 0132
Rural 3-Leg Signalized 0305 0291
Rural 3-Leg Minor Stop Control
0104 -0102
Table 16 SPF Models for Rural FI crashes and R2
FT results for Virginia Statewide (VDOT-maintained roads) SPF model with FI Crash values R2
FT TOTAL Crash Data
Site
Virginia Statewide Minnesota VA MN
Rural 4-Leg Signalized 0181 0181
Rural 4-Leg Minor Stop Control
0098 0097
Rural 3-Leg Signalized 0170 0180
Rural 3-Leg Minor Stop Control
0048 0012
Figures 7 through 10 show visual representations of how well the Virginia SPFs fit the
Virginia data in comparison with the suggested Minnesota SPFs In general the Virginia SPFs tend to fit the Virginia data better than the Minnesota SPFs although both sets of SPFs tend to have similar fits at low volumes (AADTmajor lt 2000) except for the SPF for total crashes on urban four-leg signalized intersections shown in Figure 7 The primary reason the Minnesota SPFs do not fit the Virginia data as well as the Virginia SPFs may be the dissimilarities of the roadside environment and the characteristics of the different databases
32
0
2
4
6
8
10
12
14
0 20000 40000 60000 80000 100000 120000
AADT Major
Tota
l Cra
shes
Per
Yea
r
Minnesota VA Actual Observed Virginia
Minnesota Model
Virginia M odel
Figure 7 Total crashes per year vs major AADT for urban 4-leg signalized intersections
with minor AADT of 700
0
5
10
15
20
25
30
35
0 20000 40000 60000 80000 100000 120000
AADT Major
Tota
l Cra
shes
per
Yea
r
Minnesota VA Actual Observed Virginia
Minnesota Model
Virginia Model
Figure 8 Total crashes per year vs major AADT for urban 4-leg signalized intersections
with minor AADT of 8000
33
0
2
4
6
8
10
12
14
0 20000 40000 60000 80000 100000 120000
AADT Major
Tota
l Cra
shes
Per
Yea
r
Minnesota VA Actual Observed Virginia
Virginia Model
Minnesota Model
Figure 9 Total crashes per year vs major AADT for rural 4-leg signalized intersections with
minor AADT of 79
0
5
10
15
20
25
0 20000 40000 60000 80000 100000 120000
AADT Major
Tota
l Cra
shes
per
Yea
r
Minnesota VA Actual Observed Virginia
Minnesota Model
Virginia Model
Figure 10 Total crashes per year vs minor AADT for rural 4-leg signalized intersections with major AADT of 5000
As discussed in the Methodology section in addition to the statewide Virginia SPFs
specific SPFs were developed for each operational region to consider the different topographical characteristics that exist across Virginia The complete set of SPFs together with the associated p values for the regression coefficients are shown in Tables A-1 and A-2 of Appendix A All p values are less than 005 with most being less than 00001 except for some of the rural four-leg signalized intersections regional specific SPFs These p values indicate that the estimated coefficients are statistically significant at the 95 confidence level or better A possible reason
34
for higher p values for a small number of SPFs may be the sample size used for developing these SPFs
To test the transferability and fit of the Virginia statewide specific SPFs several
statistical parameters were determined for the 70 (estimation) data set and the 30 (validation) data set separately The corresponding values for each of these parameters were then compared The results are shown in Tables 17 and 18 for urban and rural intersections respectively The results for the regional SPFs are shown in Tables A-3 through A-8 of Appendix A The results indicate that the developed models are transferable to the 30 validation data set For example the MSE values for the 70 estimation data are similar to the MSPE values for the 30 validation data In addition the mean prediction bias MPB values for the 30 validation data are close to zero (-076 le MPB ge -0004) in Table 17 and (-0067 le MPB ge 00513) in Table 18
Table 17 Goodness of Fit Results for Urban Statewide SPFs
Data Estimation data 70 Validation Data 30 Subtype Site MSE r2 R2
FT MPB MAD MSPE R2FT
Total VA 41150 0529 0557 -0760 4329 38490 0575
Total MN
68636 0506 0336 -3145 5421 68156 0315
FI VA
7043 0385 0406 -0458 1938 7671 0475
Urban 4-Leg Signalized
FI MN 7702 0372 0324 -0316 2124 8981 0376
Total VA 2238 0315 0313 -0034 0897 2383 0292
Total MN 2510 0287 0215 0091 0982 2730 0182
FI VA 0530 0194 0193 -0004 0432 0533 0194
Urban 4-Leg Minor Stop Control
FI MN 0560 0182 0080 0128 0522 0577 0052
Total VA 24900 0375 0370 -0645 3519 27591 0369
Total MN 29322 0365 0308 -2238 3661 33079 0272
FI VA 4467 0275 0259 -0185 1527 4875 0262
Urban 3-Leg Signalized
FI MN 4528 0267 0261 -0294 1526 4937 0261
Total VA 1854 0254 0230 -0043 0893 2038 0239
Total MN 2388 0237 0104 -0541 0902 2600 0107
FI VA 0428 0151 0133 -0021 0431 0476 0157
Urban 3-Leg Minor Stop Control
FI MN 0478 0140 0097 -0184 0385 0537 0104
35
Table 18 Goodness of Fit Results for Rural Statewide SPFs
Data Estimation Data 70
Validation Data 30
Subtype Site MSE r2 R2FT MPB MAD MSPE R2
FT
Total VA 10990 0353 0321 0513 2210 10070 -0073
Total MN 12400 0339 0290 -0154 2071 8460 0035
FI VA 2350 0196 0181 0045 1189 2600 -0034
Rural 4-Leg Signalized
FI MN 2400 0188 0181 -0043 1164 2420 0004
Total VA 1090 0182 0167 -0067 0794 1190 0171
Total MN 1190 0167 0132 -0348 0774 1320 0115
FI VA 0480 0112 0098 -0022 0504 0530 0110
Rural 4-Leg Minor Stop Control
FI MN 0500 0104 0097 -0158 0459 0560 0093
Total VA 5490 0328 0305 -0010 1651 5760 0179
Total MN NA NA NA NA NA NA NA
FI VA 1450 0181 0170 -0041 0902 1710 0099
Rural 3-Leg Signalized
FI MN NA NA NA NA NA NA NA
Total VA 0690 0144 0104 -0008 0613 0730 0102
Total MN 0890 0141 -0102 -0404 0555 0940 -0104
FI VA 0250 0071 0048 -0009 0345 0260 0048
Rural 3-Leg Minor Stop Control
FI MN 0270 0068 0012 -0144 0270 0290 0003
Pruning of Virginia-Specific SPFs A total of 64 SPFs were initially developed using the appropriate data for Virginia as shown in Tables A-1 and A-2 of Appendix A Considering that not all regional models might be necessary the pruning process described in the methodology section was carried out to prune the number of SPFs to the minimum effective number as seen in Tables 19 and 20 for urban and rural intersections respectively The pruning process resulted in 19 SPFs for urban sites and 15 for rural sites To facilitate the use of the correct SPF for a specific type of intersection located in a specific region the lists of the appropriate SPFs to be used are given in Tables B-1 and B-2 of Appendix B for the urban and rural intersections respectively
As can be seen in Tables 19 and 20 and Tables A-1 and A-2 of Appendix A there are some trends worth discussing for the benefit of the study and possible future research With regards to the three different operational regions the Western region retained many more of the specific regional urban SPFs than any other region For example the Western regional SPFs were retained for all urban intersection sites whereas for the Eastern region the only SPFs
36
retained were those for urban four-leg signalized FI crashes and urban four-leg minor stop control for total and FI crashes Similarly the only urban SPF retained for the Northern region was that for urban four-leg minor stop control for total crashes For the rural intersection sites all of the Western regional SPFs were retained except those for rural three-leg signalized total and FI crashes and rural four-leg minor stop control FI crashes The majority of the Eastern region rural SPFs were discarded except those for rural four-leg signalized total and FI crashes while for the Northern region all regional SPFs were discarded
The Western region retained more specific regional SPFs than the other two regions This suggests that the intersections in the Western region exhibit more unique characteristics than those for the other regions This may be due to the more mountainous terrain in the Western region compared to those in the Eastern and Northern regions This supports the philosophy of developing specific SPFs based on the topography of different regions
Site Prioritization
To illustrate the benefits of using the EB method to prioritize intersection sites for safety
improvements the top 25 urban sites from the Bristol and Northern Virginia districts were identified by using crash rates critical crash ratio and the EB method The PSI for each site identified was then determined The results obtained are shown in Tables 21 and 22 for the Bristol and the Northern Virginia districts respectively The results indicate that for the Northern Virginia District the PSIs for the top 25 sites are 258 1317 and 27440 crashes per year and for the Bristol District 432 646 and 1496 crashes per year for the crash rates critical crash ratio and EB methods respectively The important thing in Tables 21 and 22 is the sum of the PSI columns ranked by the three methods The sum of each of the PSIs for the crash rate and critical crash ratio method is lower than that for the EB method These results suggest that the use of the EB method in the planning process will identify intersection sites with the highest PSIs and therefore where detailed assessments to determine feasible and effective safety treatments should be undertaken
37
Table 19 MSPE Values for Virginia Urban Statewide and Urban Regional SPFs Used for Pruning
Data Pruning
Subtype
Site
MSPE [MSPEVA-
MSPEOR]1 [abs(MSPEVA-
MSPEOR)]2 [abs(MSPEVA-
MSPEOR)MSPEVA]3
RetainDiscardTotal VA 3849 Northern 4486 -637 637 0165497532 Discard Western 1791 2058 2058 0534684334 Retain Eastern 3745 104 104 0027020005 Discard FI VA 7671 Northern 95 -1829 1829 0238430452 Discard Western 517 2501 2501 0326033112 Retain
Urban 4-Leg Signalized
Eastern 541 2261 2261 0294746448 Retain Total VA 23834 Northern 202 03634 03634 015247126 Retain Western 105 13334 13334 0559452882 Retain Eastern 115 12334 12334 0517496014 Retain FI VA 05327 Northern 048 00527 00527 0098929979 Discard Western 033 02027 02027 0380514361 Retain
Urban 4-Leg Minor Stop Control
Eastern 036 01727 01727 0324197485 Retain Total VA 275911 Northern 2687 07211 07211 0026135239 Discard Western 2441 31811 31811 0115294425 Retain Eastern 3878 -111889 111889 0405525695 Discard FI VA 48754 Northern 448 03954 03954 0081101038 Discard Western 339 14854 14854 0304672437 Retain
Urban 3-Leg Signalized
Eastern 586 -09846 09846 020195266 Discard Total VA 20379 Northern 219 -01521 01521 0074635654 Discard Western 164 03979 03979 0195250012 Retain Eastern 223 -01921 01921 0094263703 Discard FI VA 04756 Northern 05 -00244 00244 0051303616 Discard Western 038 00956 00956 0201009251 Retain
Urban 3-Leg Minor Stop Control
Eastern 05 -00244 00244 0051303616 Discard 1 Difference between mean square prediction error (MSPE) of Virginia statewide model and OR model 2 Absolute value of the difference between Virginia statewide model MSPE and operational region model MSPE 3 Absolute value of the difference between Virginia statewide model MSPE and operational region model MSPE divided by the Virginia statewide MSPE for comparison
Retained SPFs Discarded if value is negative Discarded if less than 01
38
Table 20 MSPE Values for Virginia Rural Statewide and Rural Regional SPFs Used for Pruning Data Pruning
Subtype
Site
MSPE
[MSPEVA-MSPEOR]1
[abs(MSPEVA-MSPEOR)]2
[abs(MSPEVA-MSPEOR)MSPEVA]3
RetainDiscard
Total VA 1007 Northern 3422 -2415 2415 2398212512 Discard Western 605 402 402 0399205561 Retain Eastern 512 495 495 0491559086 Retain FI VA 26 Northern 976 -716 716 2753846154 Discard Western 159 101 101 0388461538 Retain
Rural 4-Leg Signalized
Eastern 137 123 123 0473076923 Retain Total VA 119 Northern 164 -045 045 0378151261 Discard Western 102 017 017 0142857143 Retain Eastern 114 005 005 0042016807 Discard FI VA 053 Northern 052 001 001 0018867925 Discard Western 048 005 005 0094339623 Discard
Rural 4-Leg Minor Stop Control
Eastern 049 004 004 0075471698 Discard Total VA 576 Northern 1475 -899 899 1560763889 Discard Western 674 -098 098 0170138889 Discard Eastern 626 -05 05 0086805556 Discard FI VA 171 Northern 212 -041 041 0239766082 Discard Western 403 -232 232 1356725146 Discard
Rural 3-Leg Signalized
Eastern 157 014 014 0081871345 Discard Total VA 073 Northern 093 -02 02 0273972603 Discard Western 053 02 02 0273972603 Retain Eastern 069 004 004 0054794521 Discard FI VA 026 Northern 03 -004 004 0153846154 Discard Western 023 003 003 0115384615 Retain
Rural 3-Leg Minor Stop Control
Eastern 027 -001 001 0038461538 Discard 1 Difference between mean square prediction error (MSPE) of Virginia statewide model and OR model 2 Absolute value of the difference between Virginia statewide model MSPE and operational region model MSPE 3 Absolute value of the difference between Virginia statewide model MSPE and operational region model MSPE divided by the Virginia statewide MSPE for comparison
Retained SPFs Discarded if value is negative Discarded if less than 01
39
Table 21 PSIs for Top 25 Sites in District 1 Urban (Bristol) FI
Crashes Ranking Based on Crash
Rates Ranking Based on Crash Ratio Ranking Based on EB
Method
Rank Intersection Node
Crash Rate1 PSI2 Intersection
Node Crash Ratio3 PSI Intersection
Node PSI
1 596726 22112 00000 651193 39672 00000 596095 21413
2 606469 20079 00000 606238 39298 06297 596393 08787
3 706818 12504 00000 651075 31264 00000 651130 08453
4 651193 11550 00000 596726 29227 00000 596701 07112 5 651075 09369 00000 606469 28039 00000 651802 06929 6 606238 08382 06297 651233 25831 03612 636331 06726 7 651807 07089 00000 651130 22718 08453 596395 06579 8 651233 06068 03612 706818 22555 00000 596937 06415 9 651230 05990 00000 651230 20301 00000 606238 06297
10 651783 05756 00000 651210 18882 04747 661033 06061 11 636093 04960 00000 636331 17913 06726 596372 05417 12 651274 04475 00000 651807 16847 00000 636372 04808 13 651130 04179 08453 651805 15814 00000 651210 04747 14 651210 03918 04747 651223 15627 03589 636491 04649 15 636331 03393 06726 651783 15009 00000 596420 04633 16 651223 03363 03589 596095 14865 21413 596403 04579 17 606232 03331 00000 636405 14769 00000 651603 04531 18 651127 03053 00000 661033 14555 06061 636056 04351 19 651999 03048 00000 596353 14215 03717 712033 04110 20 596449 02962 00000 636093 13782 00000 704691 04102 21 636405 02811 00000 651879 13192 00000 651838 04100 22 651883 02698 00000 651274 12975 00000 651894 03878 23 596353 02686 03717 651127 12972 00000 596353 03717 24 651805 02663 00000 651999 12959 00000 651233 03612 25 661033 02500 06061 596449 12702 00000 651889 03601
sum 43202 sum 64615 sum 149606 1Number of crashes per year per 1000000 total approach volume 2Potential for safety improvement (crashes yr) the difference between the EB-adjusted long-term crashes and the SPF-estimated crashes 3Ratio of actual crash rate to critical crash rate
40
Table 22 PSIs for Top 25 Sites in District 9 Urban (Northern Virginia District) FI
Crashes Ranking Based on Crash
Rates Ranking Based on Crash Ratio Ranking Based on EB
Method
Rank Intersection Node
Crash Rate1 PSI2 Intersection
Node Crash Ratio3 PSI Intersection
Node PSI
1 718192 191841 00000 718192 257523 00000 264119 150122 2 702946 178194 00000 547722 152371 11175 263375 140091 3 271531 64846 00000 263628 102794 00000 278648 137239 4 263628 52858 00000 263728 100092 00000 276819 131395 5 263728 42215 00000 719754 95274 09444 263290 130743 6 266955 35294 00000 702946 79268 00000 722678 127897 7 547722 34932 11175 263403 77252 05184 264725 118671 8 702612 30441 00000 704237 77175 07648 267028 116627 9 273886 29539 00000 263729 74681 00000 265204 115925
10 716747 27632 00000 271531 72327 00000 274766 115679 11 263626 27139 00000 263135 66458 18068 263249 113372 12 269485 26567 00000 716747 64461 00000 547044 110769 13 728954 26344 00000 266955 56657 00000 549349 107180 14 263729 25208 00000 546138 52003 31028 268210 105630 15 546988 21922 00000 547544 51924 32529 263347 104257 16 274338 21446 00000 263626 50389 00000 276351 102313 17 429308 21354 00000 269485 49897 00000 428167 100064 18 720401 21197 00000 728954 49702 00000 264344 98789 19 267295 20954 00000 548686 49572 03621 277764 91554 20 267536 20874 00000 711601 47985 04440 263467 89259 21 265938 20484 00000 266970 47730 00000 263090 89199 22 273354 20108 00000 546462 46856 03620 703414 88610 23 268345 19362 00000 265938 46726 00000 428629 87379 24 719754 19073 09444 720401 44833 00000 272219 85659 25 263403 19015 05184 728496 43666 04990 428544 85610
Sum 25803 sum 131747 sum 2744033 1Number of crashes per year per 1000000 total approach volume 2Potential for safety improvement (crashes yr) the difference between the EB-adjusted long-term crashes and the SPF-estimated crashes 3Ratio of actual crash rate to critical crash rate
41
CONCLUSIONS
bull The development of SPFs for intersections is necessary for Virginia because the SafetyAnalyst-suggested SPFs which are based on Minnesota data do not represent the Virginia data well Regarding the fit of the SPFs to Virginia data the R2
FT values shown in Tables 13 through 16 for Minnesota and Virginia indicate that the Virginia-specific SPFs fit the Virginia data better than the Minnesota models This may be due to the dissimilarities of the roadside environment such as difference in topography and the characteristics of the different Virginia and Minnesota databases
bull In some cases the specific regional SPFs fit the regional data better than the statewide
SPFs suggesting that the specific SPFs should be considered for use when available These group divisions that have similar roadway characteristics and driver expectations in some cases tend to improve the fit
bull In identifying intersection sites for safety improvements it is clearly beneficial for the EB
method to be used with the suitable SPFs rather than a crash rate or critical ratio method Results of the site prioritization show a much higher potential for crash reduction when the EB method is used with the appropriate SPFs rather than a procedure based on crash rates or critical rates
RECOMMENDATIONS
1 VDOTrsquos TED should use the Virginia-specific SPFs when using the SafetyAnalyst tools The results of this study have shown that the Virginia-specific SPFs reflected the Virginia data better than the SafetyAnalyst-recommended Minnesota SPFs
2 VDOTrsquos TED should investigate the feasibility of using multiple SPFs in SafetyAnalyst If
feasible regional SPFs should be used If it is not currently feasible to use multiple SPFs VDOTrsquos TED should ask that the FHWA include regional information in SafetyAnalyst so as to allow the use of regional SPFs For the specific regional SPFs to be applied to Virginia and other states the SafetyAnalyst tool should be capable of incorporating the necessary data that support the regional models
3 As soon as it is feasible to use regional SPFs VDOTrsquos TED should use the 19 SPFs
developed for urban intersections and the 15 developed for rural intersections when using the tools in SafetyAnalyst Although the statewide SPFs are available for use by an analyst the specific regional models included in the final set of SPFs will predict crashes better than the statewide SPFs The regional analysis will not only ease the use of specific regional SPFs but will also be of benefit when predicting the potential for safety improvement of a specific site
4 For future similar SPF studies VDOTrsquos TED should be directly involved in screening the
traffic data for accuracy and consistency as was done in this study The direct involvement of the TED in the screening of the traffic data significantly contributed to the accuracy of the
42
data and greatly contributed to the confidence the researchers place on the data used in the study
5 The Virginia Transportation Research Council (VTRC) should conduct a study as soon as
feasible to verify whether incorporating independent variables for which data are available other than AADT such as intersection geometry and other characteristics will result in SPFs that better fit the Virginia data Although the currently suggested SafetyAnalyst SPFs use only the AADTs as the independent variables it is likely that provision will be made for use of SPFs that incorporate other independent variables such as number of approaches entering lanes and the other variables for which data are available as these SPFs are likely to give better fit to crash data
6 As soon as feasible VTRC should undertake a study to develop SPFs for the urban system
intersections which are not currently maintained by VDOT as these intersections may have different crash characteristics than those maintained by VDOT This would facilitate the use of SafetyAnalyst in programming sites that are currently not being maintained by VDOT
BENEFITS AND IMPLEMENTATION PROSPECTS
Significant benefits will be accrued by the use of the Virginia-specific SPFs developed in this study This is clearly illustrated in two ways First in examining the transferability of the suggested SPFs in SafetyAnalyst it is clear that these SPFs do not fit the Virginia data very well The results also indicate that the Virginia-specific SPFs fit the Virginia data much better than the suggested SafetyAnalyst SPFs Second the availability of the Virginia-specific SPFs will enhance the use of the EB procedure given in SafetyAnalyst for prioritizing sites for safety improvements This study has also shown that the EB method better identifies sites with higher potential for crash reduction than those identified by crash rates For example the illustrated examples given for the Bristol and Northern Virginia districts show that the potential reduction in FI crashes when the top 25 sites are identified by the EB method is 28936 (1496 + 27440) crashes per year whereas that obtained when the critical crash ratio method is used for prioritization is only 1963 (646 + 1317) and that obtained with the crash rate method is only 690 (432 + 258) crashes per year This gives a net benefit of 26973 potential crashes per year compared to the critical crash ratio method and 28246 compared to the crash rate method Assuming an average cost of FI crashes of $95629 (FHWA 2005) and only 10 of the estimated net benefit PSI of 28246 crashes per year is achieved the total savings of more than $27 million per year could be accrued The prospects for implementation of the recommendations are very high as the study was requested by VDOTrsquos TED which is planning to incorporate these SPFs in the use of the tools provided in SafetyAnalyst
43
ACKNOWLEDGMENTS
The authors appreciate the opportunity afforded them by VDOT and VTRC to conduct this study Special thanks to Stephen Read (VDOT) Dr In-Kyu Lim (VDOT) Dr Young-Jun Kweon (VTRC) and VDOTrsquos Central Office for their interest and support in SPFs and their help in the selection of intersection sites Many thanks to Lewis Woodson (VTRC) and James Hill (University of Virginia) for all their help and input throughout the study
REFERENCES Cogburn P VDOT Interagency Coordination 2007 Virginia Emergency Management
Conference Virginia Department of Transportation Richmond April 2007 Colorado Department of Transportation DTD Applied Research and Innovation Branch Safety
Performance Functions for Intersections CDOT-2009-10 Denver December 2009 Fridstroslashm L Ifver J Ingebrigtsen S Kulmala R and Thomsen LK Measuring the
Contribution of Randomness Exposure Weather and Daylight to the Variation in Road Accidents Counts Accident Analysis and Prevention Vol 27 No 1 1995 pp 1-20
Federal Highway Administration Cost of Crashes by Severity Table FHWA-HRT-05-051
Washington DC 2005 Federal Highway Administration SafetyAnalyst Home Page httpwwwsafetyanalystorg
Accessed February 2010 Garber N and Hoel L Traffic amp Highway Engineering 4th ed Cenage Learning Toronto
Canada 2009 Garber NJ Haas PR and Gosse C Development of Safety Performance Functions for Two-
Lane Roads Maintained by the Virginia Department of Transportation VTRC 10-R25 Virginia Transportation Research Council Charlottesville 2010
Hamidi A Fontaine MD and Demetsky MJ A Planning-Level Methodology for Identifying
High-Crash Sections of Virginiarsquos Primary System VTRC 11-R4 Virginia Transportation Research Council Charlottesville 2010
Harwood D Council FM Hauer E Hughes WE and Vogt A Prediction of the Expected
Safety Performance of Rural Two-lane Highways Federal Highway Administration McLean VA December 2000
Harwood DW Bauer KM Richard KR Gilmore DK Persaud B and Lyon C
Development of SPFs for Safety Analyst Interim Tools Technical Memorandum
44
Prepared by Midwest Research Institute for the Federal Highway Administration McLean VA 2004
ITT Corporation SafetyAnalyst Userrsquos Manual Turner-Fairbank Highway Research Center
McLean VA 2008 Jonsson T Ivan J and Zhang C Crash Prediction Models for Intersections on Rural
Multilane Highways Differences by Collision Type In Transportation Research Record Journal of the Transportation Research Board No 2019 Transportation Research Board of the National Academies Washington DC 2007 pp 91-98
Kweon Y-J and Lim I-K Appropriate Regression Model Types for the Empirical Bayes
Method and SafetyAnalyst In Proceedings of the 89th Annual Meeting of the Transportation Research Board Transportation Research Board of the National Academies Washington DC 2010
Kononov J Bailey B and Allery B Exploratory Examination of the Functional Form of
Safety Performance Functions of Urban Freeways Colorado Department of Transportation and San Diego State University Denver CO 2008
Lyon C Haq A Persaud B and Kodama S Safety Performance Functions for Signalized
Intersections in Large Urban Areas Development and Application to Evaluation of Left-Turn Priority Treatment In Transportation Research Record Journal of the Transportation Research Board No 1908 Transportation Research Board of the National Academies Washington DC 2005 pp 165-171
Lord D and Persaud B Estimating the Safety Performance of Urban Road Transportation
Networks Center for Transportation Safety Texas Transportation Institute Texas AampM University and Department of Civil Engineering Ryerson University College Station TX 2003 pp 609-620
Miaou S-P Lu A and Lum H S Pitfalls of using R2 to Evaluate Goodness of Fit of
Accident Prediction Models In Transportation Research Record Journal of the Transportation Research Board No 1542 Transportation Research Board of the National Academies Washington DC 2005 1996 pp 6-13
Miller P Re Negative R squared Email Archive Division of Biostatistics Washington
University in St Louis February 2 2005 February 2 2005 httpwwwbiostatwustleduarchiveshtmljmp-l2005msg00075html Accessed February 2010
Persaud B Lord D and Palmisano J Calibration and Transferability of Accident Prediction
Models for Urban Intersections In Transportation Research Record Journal of the Transportation Research Board No 1784 Transportation Research Board of the National Academies Washington DC 2002 pp 57-64
45
Persaud B and Nguyen T Disaggregate Safety Performance Models for Signalized Intersections on Ontario Provincial Roads In Transportation Research Record Journal of the Transportation Research Board No 1635 Transportation Research Board of the National Academies Washington DC 1998 pp 113-120
Pham T and Ragland D Summary of Crash Prediction Models Also known as Safety
Performance Functions (SPFs) California Partners for Advanced Traffic and Highways and University of California Berkeley Berkeley 2005
SAS Institute Inc SAS OnlineDoc Version Eight Cary NC
httpwwwtecnionacildocssasril Accessed 2009 Tegge RA Jo J-H and Ouyang Y Development and Application of Safety Performance
Functions for Illinois ICT-10-066 Illinois Center for Transportation University of Illinois Urbana-Champaign March 2010
Virginiarsquos Surface Transportation Safety Executive Committee Commonwealth of Virginiarsquos
Strategic Highway Safety Plan 2006-2010 Virginia Department of Transportation Richmond 2006
Washington S Persaud B Lyon C and Oh J Validation of Accident Models for
Intersections FHWA-RD-03-037 Federal Highway Administration McLean VA 2005
46
47
APPENDIX A
STATISTICAL PARAMETERS AND GOODNESS-OF-FIT RESULTS
Table A-1 Statistical Parameters for Urban Intersections SPFs Parameter Estimates
Data Intercept
Coefficient of Mayor AADT
Coefficient of Minor AADT
Subtype Site Intercept (α)
StndError
P value
lnMajor (β1)
StndError
P value
lnMinor (β2)
StndError
P value
Total VA -76234 048 lt0001 06742 005 lt0001 03453 003 lt0001
OR1 -83067 056 lt0001 07522 005 lt0001 0328 003 lt0001OR10 -123913 122 lt0001 10631 013 lt0001 04567 006 lt0001OR 100 -88553 077 lt0001 07825 007 lt0001 03706 004 lt0001FI VA -85256 057 lt0001 06477 006 lt0001 03579 004 lt0001OR1 -96546 063 lt0001 07603 006 lt0001 03597 004 lt0001OR10 -114284 15 lt0001 08662 016 lt0001 04412
Urban 4-Leg Signalized
OR 100 -99582 100 lt0001 07484 009 lt0001 04017 005 lt0001Total VA -60723 022 lt0001 04558 002 lt0001 0347 004 lt0001
OR1 -6059 044 lt0001 0505 004 lt0001 02773 006 lt0001OR10 -67031 057 lt0001 03986 007 lt0001 04999 009 lt0001OR 100 -65388 032 lt0001 04689 004 lt0001 043 006 lt0001FI VA -76917 032 lt0001 05001 003 lt0001 03695 005 lt0001OR1 -81437 060 lt0001 05813 005 lt0001 03188 008 lt0001OR10 -80333 063 lt0001 03446 007 lt0001 06218 010 lt0001
Urban 4-Leg Minor Stop Control
OR 100 -83166 051 lt0001 05253 006 lt0001 04695 008 lt0001Total VA -6543 082 lt0001 06591 008 lt0001 02119 002 lt0001
OR1 -4999 103 lt0001 05555 009 lt0001 01554 003 lt0001OR10 -96143 127 lt0001 08677 012 lt0001 03297 005 lt0001OR 100 -67518 110 lt0001 06157 011 lt0001 02969 005 lt0001FI VA -84268 068 lt0001 07147 006 lt0001 02481 002 lt0001OR1 -73982 099 lt0001 06496 009 lt0001 02088 003 lt0001OR10 -110104 155 lt0001 0908 015 lt0001 03226 006 lt0001
Urban 3-Leg Signalized
OR 100 -7266 107 lt0001 05508 011 lt0001 03107 006 lt0001Total VA -54696 013 lt0001 04874 002 lt0001 01985 001 lt0001
OR1 -5361 018 lt0001 04959 002 lt0001 01676 002 lt0001OR10 -5773 034 lt0001 04877 003 lt0001 02314 004 lt0001OR 100 -51642 021 lt0001 04338 003 lt0001 02309 003 lt0001FI VA -74642 018 lt0001 05791 002 lt0001 02091 002 lt0001OR1 -76877 027 lt0001 06204 003 lt0001 0181 002 lt0001OR10 -69458 047 lt0001 05096 004 lt0001 02212 005 lt0001
Urban 3-Leg Minor Stop Control
OR 100 -69883 031 lt0001 05169 004 lt0001 02308 003 lt0001 Standard Error
48
Table A-2 Statistical Parameters for Rural Intersections SPFs Parameter Estimates
Data Intercept
Coefficient of Mayor AADT
Coefficient of Minor AADT
Subtype Site Intercept (α)
StndError
P value
lnMajor (β1)
Stnd Error
P value
lnMinor (β2)
Stnd Error
P value
Total VA -69589 118 lt0001 06746 009 lt0001 0253 009 00047
OR1 -1604 237 04974 02284 021 02791 01514 012 0211 OR10 -63951 183 00005 05508 014 00001 03106 014 00224 OR 100 -06468 220 07692 02262 016 01635 -00158 017 09274 FI VA -87116 128 lt0001 07839 011 lt0001 02166 009 0013 OR1 -33285 246 01767 03601 024 0126 00597 013 06478 OR10 -80583 175 lt0001 06809 018 00001 02557 013 0057
Rural 4-Leg Signalized
OR 100 -48381 221 00287 04243 018 00193 01523 018 03943 Total VA -5494 020 lt0001 03533 002 lt0001 03935 003 lt0001
OR1 -62351 058 lt0001 04167 006 lt0001 04507 008 lt0001OR10 -53594 028 lt0001 03379 003 lt0001 03998 004 lt0001OR 100 -51255 027 lt0001 02914 003 lt0001 04075 004 lt0001FI VA -66927 030 lt0001 03899 003 lt0001 04156 004 lt0001OR1 -82561 095 lt0001 05221 009 lt0001 04962 012 lt0001OR10 -70797 044 lt0001 03789 004 lt0001 0497 005 lt0001
Rural 4-Leg Minor Stop Control
OR 100 -63326 038 lt0001 03223 004 lt0001 04424 005 lt0001Total VA -75754 084 lt0001 06465 008 lt0001 03332 008 lt0001
OR1 -58798 220 00075 05076 020 00143 0313 013 00161 OR10 -64368 110 lt0001 0544 011 lt0001 02863 006 lt0001OR 100 -9899 139 lt0001 08047 015 lt0001 04386 006 lt0001FI VA -87112 103 lt0001 07224 010 lt0001 02578 006 lt0001OR1 -9219 260 00004 07258 022 00011 03407 016 00326 OR10 -88607 146 lt0001 07059 016 lt0001 02809 008 00009
Rural 3-Leg Signalized
OR 100 -111835 185 lt0001 08669 018 lt0001 03977 008 lt0001Total VA -43293 008 lt0001 03366 001 lt0001 02087 001 lt0001
OR1 -50904 022 lt0001 0406 002 lt0001 02752 003 lt0001OR10 -40969 009 lt0001 03133 001 lt0001 02001 001 lt0001OR 100 -4231 016 lt0001 02997 002 lt0001 02308 003 lt0001FI VA -53415 011 lt0001 03394 001 lt0001 02237 001 lt0001OR1 -64457 031 lt0001 04195 003 lt0001 0307 004 lt0001OR10 -50831 014 lt0001 03245 002 lt0001 02014 002 lt0001
Rural 3-Leg Minor Stop Control
OR 100 -51046 024 lt0001 03163 003 lt0001 02112 003 lt0001
Standard Error
49
Table A-3 SPFs Goodness of Fit Results for Urban Northern Operational Region (No 1)
Data Estimation Data 70 Validation Data 30
Subtype Site MSE r2 R2FT MPB MAD MSPE R2
FT
Total VA 41150 0529 0557 -0760 4329 38490 0575
Total R1 4110 051 0551 -020 464 4486 054
FI VA 704 038 0406 -046 194 767 048
Urban 4-Leg Signalized
FI R1 809 039 0439 012 214 950 038
Total VA 224 031 0313 -003 090 238 029
Total R1 308 028 0286 008 095 200 032
FI VA 053 019 0193 000 043 053 019
Urban 4-Leg Minor Stop Control
FI R1 064 018 0187 003 043 048 021
Total VA 2490 038 0370 -064 352 2759 037
Total R1 3034 032 0305 -015 365 2687 037
FI VA 447 028 0259 -019 153 488 026
Urban 3-Leg Signalized
FI R1 559 025 0231 004 157 448 029
Total VA 185 025 0230 -004 089 204 024
Total R1 208 026 0239 -006 094 219 026
FI VA 043 015 0133 -002 043 048 016
Urban 3-Leg Minor Stop Control
FI R1 047 017 0156 -001 044 050 017
50
Table A-4 SPFs Goodness of Fit Results for Urban Western Operational Region (No 10)
Data Estimation Data 70 Validation Data 30
Subtype Site MSE r2 R2FT MPB MAD MSPE R2
FT
Total VA 41150 0529 0557 -0760 4329 38490 0575
Total R10 21976 0777 0735 1290 3233 17910 0686
FI VA 7043 0385 0406 -0458 1938 7671 0475
Urban 4-Leg Signalized
FI R10 4280 0526 0500 0377 1597 5170 0452
Total VA 2238 0315 0313 -0034 0897 2383 0292
Total R10 1161 0361 0300 -0032 0740 1050 0188
FI VA 0530 0194 0193 -0004 0432 0533 0194
Urban 4-Leg Minor Stop Control
FI R10 0312 0197 0187 0000 0382 0330 0009
Total VA 24900 0375 0370 -0645 3519 27591 0369
Total R10 14446 0451 0397 -0168 2801 24410 0255
FI VA 4467 0275 0259 -0185 1527 4875 0262
Urban 3-Leg Signalized
FI R10 3077 0266 0216 0039 1258 3390 0115
Total VA 1854 0254 0230 -0043 0893 2038 0239
Total R10 1391 0233 0197 -0054 0800 1640 0207
FI VA 0428 0151 0133 -0021 0431 0476 0157
Urban 3-Leg Minor Stop Control
FI R10 0354 0111 0089 -0019 0404 0380 0125
51
Table A-5 SPFs Goodness of Fit Results for Urban Eastern Operational Region (No 100)
Data Estimation Data 70 Validation Data 30
Subtype Site MSE r2 R2FT MPB MAD MSPE R2
FT
Total VA 41150 0529 0557 -0760 4329 38490 0575
Total R100 31108 0632 0630 0243 4717 37450 0005
FI VA 7043 0385 0406 -0458 1938 7671 0475
Urban 4-Leg Signalized
FI R100 5201 0480 0454 -0098 1864 5410 0244
Total VA 2238 0315 0313 -0034 0897 2383 0292
Total R100 1720 0443 0381 0087 0758 1150 0003
FI VA 0530 0194 0193 -0004 0432 0533 0194
Urban 4-Leg Minor Stop Control
FI R100 0509 0273 0254 0049 0383 0360 0173
Total VA 24900 0375 0370 -0645 3519 27591 0369
Total R100 17782 0410 0410 -1753 0908 38780 0004
FI VA 4467 0275 0259 -0185 1527 4875 0262
Urban 3-Leg Signalized
FI R100 3194 0243 0263 -0615 1645 5860 0236
Total VA 1854 0254 0230 -0043 0893 2038 0239
Total R100 1561 0233 0210 -0127 0902 2230 0002
FI VA 0428 0151 0133 -0021 0431 0476 0157
Urban 3-Leg Minor Stop Control
FI R100 0387 0131 0116 -0043 0444 0500 0141
52
Table A-6 SPFs Goodness of Fit Results for Rural Northern Operational Region (No 1)
Data Estimation Data 70
Validation Data 30
Subtype Site MSE r2 R2FT MPB MAD MSPE R2
FT
Total VA 10990 0353 0321 0513 2210 10070 -0073
Total R1 20080 0118 0092 -1389 3661 34220 0212
FI VA 2350 0196 0181 0045 1189 2600 -0034
Rural 4-Leg Signalized
FI R1 2920 0057 0052 -1173 1931 9760 0028
Total VA 1090 0182 0167 -0067 0794 1190 0171
Total R1 1990 0190 0245 0001 0942 1640 0173
FI VA 0480 0112 0098 -0022 0504 0530 0110
Rural 4-Leg Minor Stop Control
FI R1 0920 0093 0112 0020 0541 0520 0009
Total VA 5490 0328 0305 -0010 1651 5760 0179
Total R1 11110 0182 0254 -0679 2271 14750 0497
FI VA 1450 0181 0170 -0041 0902 1710 0099
Rural 3-Leg Signalized
FI R1 3230 0131 0153 -0116 1006 2120 0355
Total VA 0690 0144 0104 -0008 0613 0730 0102
Total R1 1210 0245 0196 0030 0712 0930 0126
FI VA 0250 0071 0048 -0009 0345 0260 0048
Rural 3-Leg Minor Stop Control
FI R1 0340 0124 0093 0016 0366 0300 0052
53
Table A-7 SPFs Goodness of Fit Results for Rural Western Operational Region (No 10)
Data Estimation Data 70 Validation Data 30
Subtype Site MSE r2 R2FT MPB MAD MSPE R2
FT
Total VA 10990 0353 0321 0513 2210 10070 -0073
Total R10 6020 0311 0268 0007 1748 6050 0382
FI VA 2350 0196 0181 0045 1189 2600 -0034
Rural 4-Leg Signalized
FI R10 1880 0158 0139 0097 0945 1590 0254
Total VA 1090 0182 0167 -0067 0794 1190 0171
Total R10 1300 0196 0163 0070 0760 1020 0078
FI VA 0480 0112 0098 -0022 0504 0530 0110
Rural 4-Leg Minor Stop Control
FI R10 0560 0142 0118 0025 0495 0480 0014
Total VA 5490 0328 0305 -0010 1651 5760 0179
Total R10 3690 0163 0170 -0432 0748 6740 0039
FI VA 1450 0181 0170 -0041 0902 1710 0099
Rural 3-Leg Signalized
FI R10 0890 0124 0117 -0391 0997 4030 -0066
Total VA 0690 0144 0104 -0008 0613 0730 0102
Total R10 0640 0126 0091 0025 0583 0580 0055
FI VA 0250 0071 0048 -0009 0345 0260 0048
Rural 3-Leg Minor Stop Control
FI R10 0240 0062 0041 0003 0335 0230 0028
54
Table A-8 SPFs Goodness of Fit Results for Rural Eastern Operational Region (No 100)
Data Estimation Data 70 Validation Data 30
Subtype Site MSE r2 R2FT MPB MAD MSPE R2
FT
Total VA 10990 0353 0321 0513 2210 10070 -0073
Total R100 10120 0042 0027 1207 1882 5120 -0307
FI VA 2350 0196 0181 0045 1189 2600 -0034
Rural 4-Leg Signalized
FI R100 2060 0053 0039 0119 0962 1370 -0023
Total VA 1090 0182 0167 -0067 0794 1190 0171
Total R100 0960 0170 0149 -0086 0746 1140 0209
FI VA 0480 0112 0098 -0022 0504 0530 0110
Rural 4-Leg Minor Stop Control
FI R100 0440 0106 0092 -0031 0475 0490 0121
Total VA 5490 0328 0305 -0010 1651 5760 0179
Total R100 2770 0492 0459 0601 1759 6260 0090
FI VA 1450 0181 0170 -0041 0902 1710 0099
Rural 3-Leg Signalized
FI R100 1040 0265 0255 0124 0923 1570 -0055
Total VA 0690 0144 0104 -0008 0613 0730 0102
Total R100 0640 0125 0087 -0037 0601 0690 0119
FI VA 0250 0071 0048 -0009 0345 0260 0048
Rural 3-Leg Minor Stop Control
FI R100 0250 0064 0038 -0013 0345 0270 0062
55
APPENDIX B
RECOMMENDED SAFETY PERFORMANCE FUNCTION MODELS
Table B-1 Recommended Urban SPFs Site Virginia SPF Models to Be Used for Urban Intersections
Urban 4-Leg Signalized Total Virginia generic total
Urban 4-Leg Signalized
Operational Region 1 generic total
Urban 4-Leg Signalized
Operational Region 10
use specified model developed
Urban 4-Leg Signalized
Operational Region 100 generic total
Urban 4-Leg Signalized FI Virginia generic FI
Urban 4-Leg Signalized
Operational Region 1 generic FI
Urban 4-Leg Signalized
Operational Region 10
use specified model developed
Urban 4-Leg Signalized
Operational Region 100
use specified model developed
Urban 4-Leg Minor Stop Control
Total Virginia generic total
Urban 4-Leg Minor Stop Control
Operational Region 1
use specified model developed
Urban 4-Leg Minor Stop Control
Operational Region 10
use specified model developed
Urban 4-Leg Minor Stop Control
Operational Region 100
use specified model developed
Urban 4-Leg Minor Stop Control
FI Virginia generic FI e^-76917MajADT^05001MinADT^03695
Urban 4-Leg Minor Stop Control
Operational Region 1
use specified model developed
Urban 4-Leg Minor Stop Control
Operational Region 10
use specified model developed
Urban 4-Leg Minor Stop Control
Operational Region 100
use specified model developed
56
Table B-1 Recommended Urban SPFs (Continued)
Site Virginia SPF Models to Be Used for Urban Intersections
Urban 3-Leg Signalized
Total Virginia
use generic model developed for total
crashes
Urban 3-Leg Signalized
Operational Region 1
use generic model developed for total
crashes
Urban 3-Leg Signalized
Operational Region 10
use specific regional model
developed
Urban 3-Leg Signalized
Operational Region 100
use generic model developed for total
crashes
Urban 3-Leg Signalized FI Virginia
use generic model developed for FI
crashes
Urban 3-Leg Signalized
Operational Region 1
use generic model developed for FI
crashes
Urban 3-Leg Signalized
Operational Region 10
use specific regional model
developed
Urban 3-Leg Signalized
Operational Region 100
use generic model developed for FI
crashes
Urban 3-Leg Minor Stop Control
Total Virginia
use generic model developed for total
crashes
Urban 3-Leg Minor Stop Control
Operational Region 1
use generic model developed for total
crashes
Urban 3-Leg Minor Stop Control
Operational Region 10
use specific regional model
developed
Urban 3-Leg Minor Stop Control
Operational Region 100
use generic model developed for total
crashes
Urban 3-Leg Minor Stop Control
FI Virginia use generic model developed for FI
crashes
Urban 3-Leg Minor Stop Control
Operational Region 1
use generic model developed for FI
crashes
Urban 3-Leg Minor Stop Control
Operational Region 10
use specific regional model
developed
Urban 3-Leg Minor Stop Control
Operational Region 100
use generic model developed for FI
crashes
57
Table B-2 Recommended Rural SPFs Site Virginia SPF Models to Be Used for Rural Intersections
Rural 4-Leg Signalized Total Virginia
use generic model developed for total
crashes
Rural 4-Leg Signalized
Operational Region 1
use generic model developed for total
crashes
Rural 4-Leg Signalized
Operational Region 10
use specific regional model developed
Rural 4-Leg Signalized
Operational Region 100
use specific regional model developed
Rural 4-Leg Signalized FI Virginia use generic model
developed for FI crashes
Rural 4-Leg Signalized
Operational Region 1
use generic model developed for FI crashes
Rural 4-Leg Signalized
Operational Region 10
use specific regional model developed
Rural 4-Leg Signalized
Operational Region 100
use specific regional model developed
Rural 4-Leg Minor Stop Control Total Virginia
use generic model developed for total
crashes
Rural 4-Leg Minor Stop Control
Operational Region 1
use generic model developed for total
crashes e^-549MajADT^035MinADT^039
Rural 4-Leg Minor Stop Control
Operational Region 10
use specific regional model developed
Rural 4-Leg Minor Stop Control
Operational Region 100
use generic model developed for total
crashes
Rural 4-Leg Minor Stop Control FI Virginia use generic model
developed for FI crashes
Rural 4-Leg Minor Stop Control
Operational Region 1
use generic model developed for FI crashes
Rural 4-Leg Minor Stop Control
Operational Region 10
use generic model developed for FI crashes
Rural 4-Leg Minor Stop Control
Operational Region 100
use generic model developed for FI crashes
58
Table B-2 Recommended Rural SPFs (Continued)
Site Virginia SPF Models to Be Used for Rural Intersections
Rural 3-Leg Signalized Total Virginia use generic model
developed for total crashes
Rural 3-Leg Signalized
Operational Region 1
use generic model developed for total crashes
Rural 3-Leg Signalized
Operational Region 10
use generic model developed for total crashes
Rural 3-Leg Signalized
Operational Region 100
use generic model developed for total crashes
Rural 3-Leg Signalized FI Virginia use generic model
developed for FI crashes
Rural 3-Leg Signalized
Operational Region 1
use generic model developed for FI crashes
Rural 3-Leg Signalized
Operational Region 10
use generic model developed for FI crashes
Rural 3-Leg Signalized
Operational Region 100
use generic model developed for FI crashes
Rural 3-Leg Minor Stop Control Total Virginia use generic model
developed for total crashes
Rural 3-Leg Minor Stop Control
Operational Region 1
use generic model developed for total crashes
Rural 3-Leg Minor Stop Control
Operational Region 10
use specific regional model developed
Rural 3-Leg Minor Stop Control
Operational Region 100
use generic model developed for total crashes
Rural 3-Leg Minor Stop Control FI Virginia use generic model
developed for FI crashes
Rural 3-Leg Minor Stop Control
Operational Region 1
use generic model developed for FI crashes
Rural 3-Leg Minor Stop Control
Operational Region 10
use specific regional model developed
Rural 3-Leg Minor Stop Control
Operational Region 100
use generic model developed for FI crashes

10
α = intercept β1 = coefficient of major AADT β2 = coefficient of minor AADT
itk = dependent variable at intersection i and severity t (crashesyr) νit = random error exp (νit) Gamma (θ θ) εit = random (residual) error in GEE
The random errors presented in this equation have the function of not letting the β values or coefficients become biased
Evaluation of Virginia-Specific SPFs
Several statistical parameters were used to assess how well the Virginia SPFs fit the data The parameters used and suggested by Washington et al (2005) were the mean prediction bias (MPB) the mean absolute deviation (MAD) the mean square error (MSE) the mean squared prediction error (MSPE) the Pearsonrsquos product moment correlation coefficients between observed and predicted crash frequencies (used for both validation and estimation data) dispersion parameters and the Freeman Tukey RFT
2 coefficients computed from Equation 3 To test the fit of the SPFs the 70 estimation data set was used to calculate the MSE the Pearsonrsquos product moment correlation coefficients the R2 and the R2
FT To test the transferability of the SPFs the 30 validation data set was used to compute the MPB MAD and the MSPE The expressions used to determine these coefficients are given in Equations 6 through 10
( )2
iin
1i
nYYMPB
2 minussum= = (Eq 6)
2
n
1i ii
n
YYMAD
2sum=minus
= (Eq 7)
( )
pnYY
MSE1
n
1i
2
ii2
minus
minus= sum = (Eq 8)
( )
2
n
1i
2
ii
nYY
MSPE2sum=
minus= (Eq 9)
where p = degrees of freedom i = intersection index Yi = observed crash frequency at intersection i Ŷi = predicted crash frequency at intersection i
11
n2 = validation data sample size 30 n1 = estimation data sample size 70
(Eq 10) where
_
1Y = average of observed crashes per intersections _
2Y = average of predicted crashes per intersections Yi1 = observed values at intersection i Y i2 = predicted values at intersection i
It should be noted that when values obtained from the MPB MAD MSE and MSPE
formulas are close to 0 it indicates a good fit or desirable SPF and when values for the RFT2 and
R2 formulas are close to 1 it indicates a suitable fit The dispersion parameter (d) is used in the variance-mean relationships as shown in Equations 11 and 12
(Eq 11)
( ) ( ) ( )i i i i i iVar Y X E Y X d x E Y X= + (Eq 12) A weighting factor (Wi) used in the EB procedure is obtained from Equation 13 and used in Equation 14 to obtain the EB-estimated value
( )1
1ii i
Wd x E Y X
=+
(Eq 13)
( ) ( ) ( )1EB i i i i i i iE E y y W x E Y X W x Y= + minus (Eq 14)
where 0 lt W lt 1 Var (|) = conditional variance E (|) = conditional mean Var m or Var (Yi|Xi) = estimated variance of mean crash rate E m or E (Yi|Xi) = estimated mean crash rate from SPF d = estimated NB dispersion parameter (also called overdispersion parameter)
2Var m E m d x E m= +
( )( )( ) ( )
1 1 2 21 22 2
1 21 2
i i
i i
Y Y Y Yr
Y Y x Y Y
sum minus minus=⎡ ⎤sum minus sum minus⎢ ⎥⎣ ⎦
12
W = weight Xi = variables such as AADT Yi = number of observed crashes per year at intersection i EEB = EB-adjusted estimated crashes (crashesyr)
In the variance-mean relationship if the value obtained for the dispersion parameter d is 0 then the variance is the same as the mean (see Equations 11 and 12) which causes the NB model to collapse to the Poisson model This parameter has a strong influence on the weight in the EB formula (see Eq 13) therefore it has an effect in the EB-estimated value SAS was helpful in computing this parameter for the different types of intersections analyzed in the study throughout the 5 years
Pruning Process
Before the site prioritization was performed pruning was done to avoid over-representation of the SPFs that might not reflect much difference in the study when compared with statewide SPFs At the completion of the pruning process only the necessary or minimum effective SPFs were retained MSPE is typically the parameter used to assess errors associated with a validation data set for this reason MSPE was used for pruning In order to verify whether a specific regional SPF should be retained or not the validation data set (30 of the data) was used to compute MSPE for both the specific regional SPFs and the corresponding statewide SPFs If MSPE for the regional SPF was greater than that for the corresponding Virginia statewide SPF or if the difference between these two MSPEs was less than 10 it was concluded that the regional SPF was not necessary and it was therefore discarded The following example illustrates the steps for urban four-leg signalized FI crashes in Region 1
1 The 30 FI crash data were obtained for urban signalized four-leg intersections in Region 1 and the MSPE was determined using the statewide SPF for the FI urban four-leg signalized intersections
2 The 30 FI crash data for urban signalized four-leg intersections in Region 1 were
then used to determine MSPE for the specific Region 1 SPF for FI crashes 3 Verify if the MSPE value for the specific regional SPF is higher than the statewide
MSPE value if yes discard the specific regional SPF if no tentatively retain the specific regional model
4 The difference between the two MSPEs was determined to determine whether it was
less than 10 of the statewide MSPE if yes discard the specific regional SPF if no retain the specific regional model This process was repeated for all regional SPFs
13
Identification of Intersections with a Higher Than Expected Number of Crashes
In order to identify some of the intersections with a higher than expected number of crashes a prioritization analysis based on the EB method was conducted This analysis was carried out to identify the top 25 intersections with a high PSI in the urban areas of the Northern Virginia and Bristol districts These two districts were selected to identify any effect of the approach AADTs as two-lane roads in the Northern Virginia District carry much higher volumes than those in the Bristol District The PSI is the difference between the EB-adjusted long-term crashes and the SPF-estimated crashes The PSI was first determined and then a priority list was developed with intersections showing a higher PSI receiving a higher priority This procedure first required the computation of yearly calibration factors (Cy) that accounted for intrinsic yearly variations that were not accounted for in developing the SPFs These yearly calibration factors were determined using the steps described here and given in Equations 15 through 18 (ITT Corporation 2008) Calculation of Yearly Calibration Factor (Cy) For subtype s and severity t the following steps were performed 1 Calculate the (unadjusted) predicted number of crashes using the appropriate SPF yiMinAADTMajAADTe ststst
isyisyisty amp~ 21ˆˆˆ foralltimestimes= ββακ (Eq 15)
2 Sum the predicted numbers over all intersections
ysN
iistysty forall=sum
=
~~1κκ (Eq 16)
3 Sum the observed numbers of crashes over all intersections
yKKsN
iistysty forall=sum
=
1
(Eq 17)
4 Calculate yearly calibration factor csty
yK
csty
stysty forall= ~κ (Eq 18)
5 Repeat the steps for all subtypes (s) and severities (t)
where i = intersection index (i = 1hellip N)
14
s = subtype index (s = urban four-leg signalized intersection rural three-leg minor stop controlled intersection etc) t = severity index (t = TOT [total crashes] FI [fatal + injury crashes] PDO [property damage only]) y = year index (i = 1 [base year] 2 hellip Y) csty = yearly calibration factor for crash subtype s severity t and year y MajAADT = AADT on the major road (vehday) MinAADT = AADT on the minor road (vehday)
istyκ~ = (unadjusted) predicted number of crashes at intersection i for crash subtype s severity t and year y
istyκ = (adjusted) predicted number of crashes at intersection i for crash subtype s severity t and year y α = intercept
1β = coefficient of major AADT 2β = coefficient of minor AADT
These yearly calibration factors were then used to determine the predicted number of
crashes at an intersection based on the SPF for the severity of crashes and type of intersection being considered The PSI for each intersection was then determined using the steps described in Equations 19 through 22 (ITT Corporation 2008) Steps for Calculating PSI for Subtype s
1 Calculate the (adjusted) predicted number of crashes
amp~
21ˆˆˆ ststst
isyisysty
istystyisty
MinAADTMajAADTec
yticββα
κκ
timestimestimes=
foralltimes= (Eq 19)
2 Calculate yearly correction factor Cisty
ytiCyist
istyisty amp
)1(
forall==κ
κ
(Eq 20)
3 Calculate EB weight
tid
w Y
y istystist amp
11
1
foralltimes+
=sum =
κ (Eq 21)
4 Calculate the EB-adjusted estimated number of crashes for year 1
15
tiC
KwwX Y
y isty
Y
y istyistyististyist amp)1(
1
1)1()1( forallminus+times=
sumsum
=
=== κ (Eq 22)
5 Determine the PSI for each intersection If istYX gt istYκ include intersection i in the list for prioritization using istYPSI = istYX
where i = intersection index (i = 1hellip N) s = subtype index (s = urban four-leg signalized intersection rural three-leg minor stop
controlled intersection etc) t = severity index (t = TOT [total crashes] FI [fatal + injury crashes] PDO [property damage
only]) y = year index (y = 1 [base year] 2 hellip Y) cy = yearly calibration factor for crash subtype s severity t and year y d = dispersion parameter w = weight MajAADT = AADT on the major road (vehday) MinAADT = AADT on the minor road (vehday) PSI = potential for safety improvement
istyC = yearly correction factor
istyκ~ = (unadjusted) predicted number of crashes at intersection i for crash subtype s severity t and year y
istyκ = (adjusted) predicted number of crashes at intersection i for crash subtype s severity t and year y
istyX = EB-adjusted estimated number of crashes α = intercept
1β = coefficient of major AADT 2β = coefficient of minor AADT
The prioritization lists for urban two-lane roads in the Northern Virginia and Bristol
districts were then developed based on the PSIs obtained for three prioritization procedures These alternative prioritization procedures were the average crash rates (ACRs) for the study period (see Equation 23) the critical crash ratio (CCR) (see Eqs 24 through 27) (Garber and Hoel 2009) and the EB method The list was developed with the intersections having the highest PSI listed first followed by other intersections in descending order The execution of the EB method prioritization process was achieved through use of the computer codes in SAS Finally the effectiveness of using the EB method for prioritizing sites for safety improvement was illustrated by comparing the PSIs from using intersection crash rates critical crash and the EB procedures
16
Procedure for Crash Rate Method The ACR for the intersection is given as
( )(1000000)( )( )(365)T
TCACRN V
= (Eq 23)
where ACR = the average crash rate for the intersection under consideration (crashes1000000
approach volume) TC = number of crashes over the study period at the intersection N = duration of study period (yr) VT = average daily total approach volume at the intersection Procedure for Critical Rate Method
The critical rate method was accomplished by first computing the traffic base (TB) of the intersection under consideration using Equation 24 The ACR for the intersection under consideration is then computed using its TB as shown in Equation 25 The intersection critical crash rate (ICCR) is then determined using Equation 26 The critical crash ratio (CCR) for the intersection is then computed as the ratio of ICR and the average crash rate (AVR) for all intersections under the same category (intersection type urbanrural etc) as that for the intersection being considered using Equation 27 TB is given as
365
1 000 000
NxVxTB = (Eq 24)
where TB = the total approach volume over the study period of N years at the intersection under consideration (veh1000000) V = average daily approach volume at the intersection under consideration ACR is obtained as
TCACRTB
= (Eq 25)
where ACR = ACR at the intersection under consideration over the study period of N years
17
TB = the total approach volume over the study period of N years at the intersection under consideration (veh1000000) The critical crash rate (ICCR) for the intersection under consideration is given as
05 AVRICCR AVR TFTB TB
= + + (Eq 26)
where AVR = ACR for intersections within the state and of the same designation (eg rural three-leg with minor stop control) as that for the intersection under consideration TF = number of standard deviations for the confidence level being used in the analysis (usually 196 for 95 confidence level) TB = the total approach volume over the study period of N years at the intersection under consideration (veh1000000) The critical crash ratio (CCR) for the intersection is then obtained as
ACRCCRICCR
= (Eq 27)
where ACR = ACR at the intersection under consideration over the study period of N years (see Eq 2) ICCR = critical crash rate for the intersection under consideration (see Eq 26)
Benefits and Implementation Expectations
The expected benefits from developing SPFs and prioritizing intersection sites were illustrated by comparing the PSIs for the prioritized sites when sites were prioritized using the EB method with those obtained when sites were prioritized using crash rates and the critical crash ratio This analysis was conducted for the combined fatal plus injury crashes SPFs An estimate of the cost savings attributable solely to the potential reduction of crashes was also computed by using crash costs given in an FHWA study (FHWA 2005)
18
RESULTS AND DISCUSSION
Literature Review
SafetyAnalyst
The SafetyAnalyst Userrsquos Manual (ITT Corporation 2008) has SPFs that are suggested for intersections that are based on Minnesota data Tables 7 and 8 show the regression coefficients (α β1 and β2) for the SPFs developed for total and combined FI crashes respectively The values for the goodness of fit parameter RFT
2 are also given Although these RFT2 are all less
than 045 with a few less than 010 it has been suggested that the SPFs used in SafetyAnalyst could provide a realistic estimate of an expected crash frequency as a function of traffic volume and roadway geometry (Pham and Ragland 2005)
Methodological and Research References
Several studies similar to this study have been conducted in Canada Colorado California Texas New York and Minnesota For example a study was conducted using data from Colorado California and Texas to examine the functional form of the SPFs for urban freeways (Kononov et al 2008) Five years of crash data were acquired from the respective departments of transportation and the highway safety information system from Colorado The study revealed that the amount of crashes increased moderately with congestion in segments on urban freeways This study however did not include intersections
A study by Lyon et al was conducted in Toronto Ontario Canada to develop SPFs for urban signalized intersections (Lyon et al 2005) Collision data were gathered for five years and included 1950 urban intersections SPFs were developed for different severity levels impact types and intersection types such as four-leg and three-leg intersections The format used to develop the SPFs is shown in Equation 28 This format is somewhat different from that of Equation 4 suggested in Safety Analyst
Collisionsyear = α (F1)β1(F2)β2 exp (β3X1 + β4X2 + ) (Eq 28) where α and βi = the coefficients estimated in the SPF calibration process F1 and F2 = the entering AADTs on the major and minor roads respectively Xi = other independent variables (such as single lane versus multilane approaches with and without left-turn lanes or right-turn lanes high and low pedestrian activities or in some cases F1 or F2 or both)
19
Table 7 SafetyAnalystrsquos SPFs for Intersections (Total Crashes) Site
subtype Code
Site subtype Description
State Regression coefficients
LogIntercept (α)
Regression coefficients
LogAADTmaj (β1)
Regression coefficients LogAADT
min (β2)
Over - dispersion Parameter
(k)
RFT2
() Number of Sites
Max AADTmaj
(vehday)
Max AADTmin
(vehday)
Rural 201 Rural 3-leg with minor-
road STOP control MN -878 071 024 107 133 1706 28500 27000
202 Rural 3-leg with all-way STOP control
MN -1237 122 027 047 41 41 25300 6803
203 Rural 3-leg with signal control
MN -657 066 02 033 26 136 36400 11500
204 Rural 4-leg with minor-road STOP control
MN -896 065 047 07 299 2114 35500 26700
205 Rural 4-leg with all-way STOP control
MN -1237 122 027 047 41 41 25300 6803
206 Rural 4-leg with signal control
MN -657 066 02 033 26 136 36400 11500
Urban 251 Urban 3-leg with minor-
road STOP control MN -535 034 028 128 59 397 68000 18900
252 Urban 3-leg with all-way STOP control
MN -1237 122 027 047 41 41 25300 6803
253 Urban 3-leg with signal control
MN -985 097 018 023 414 33 50000 25807
254 Urban 4-leg with minor-road STOP control
MN -312 027 016 086 76 333 58870 81000
255 Urban 4-leg with all-way STOP control
MN -1237 122 027 047 41 41 25300 6803
256 Urban 4-leg with signal control
MN -347 042 014 032 264 418 75000 81000
ITT Corporation 2008
20
Table 8 SafetyAnalystrsquos SPFs for Intersections (Fatal and Injury Crashes) Site
subtype Code
Site subtype Description
State Regression coefficients
LogIntercept (α)
Regression coefficients
LogAADTmaj (β1)
Regression coefficients LogAADT
min (β2)
Over - dispersion Parameter
(k)
RFT2
() No of Sites
Max AADTmaj
(vehday)
Max AADTmin
(vehday)
Rural 201 Rural 3-leg with minor-
road STOP control MN -935 071 021 123 91 1706 28500 27000
202 Rural 3-leg with all-way STOP control
MN -1002 127 -022 089 248 41 25300 6803
203 Rural 3-leg with signal control
MN -783 075 014 05 215 136 36400 11500
204 Rural 4-leg with minor-road STOP control
MN -936 066 04 0 146 2114 35500 26700
205 Rural 4-leg with all-way STOP control
MN -1002 127 -022 089 248 41 25300 6803
206 Rural 4-leg with signal control
MN -783 075 014 05 215 136 36400 11500
Urban 251 Urban 3-leg with minor-
road STOP control MN -845 049 039 123 81 397 68000 18900
252 Urban 3-leg with all-way STOP control
MN -1002 127 -022 089 248 41 25300 6803
253 Urban 3-leg with signal control
MN -1022 091 021 027 362 33 50000 25807
254 Urban 4-leg with minor-road STOP control
MN -435 029 019 099 57 333 58870 81000
255 Urban 4-leg with all-way STOP control
MN -1002 127 -022 089 248 41 25300 6803
256 Urban 4-leg with signal control
MN -511 049 016 03 295 418 75000 81000
ITT Corporation 2008
21
The study examined the impact of two left turn priority treatments which were flashing advanced green (FAG) and left turn green arrow (LTGA) on left turn collisions These treatments were implemented at 35 intersections in the city of Toronto Two types of collisions were investigated left turns with and without side impact The results indicated that there was an insignificant difference in the impact of the left turn priority treatments on both types of crashes
Lord and Persaud (2003) conducted a study that related SPFs to transportation planning models They noted that traffic safety is not usually accounted for when agencies are conducting a planning analysis to remodel build upgrade or modify their facilities Five-year intersection data from Canada were used Models were developed and statistical measures such as the over dispersion parameter were calculated and conclusions were made from the results The SPFs developed for the study were applied to two sample networks created with the help of a transportation planning software package The research showed that it is possible to make estimation for traffic safety at the planning stage of a project This will allow users to take safety into consideration when designing and possibly create alternatives to change existing designs for more comprehensive projects or development The study also indicated that there are limitations when applying the SPFs to computerized transportation networks The study concluded that although it is possible to predict or estimate crashes on digital transportation networks the accuracy of prediction relies greatly on how precise the traffic flow estimates are
Jonsson et al (2007) performed an SPF study that took into consideration the type and severity of crashes andmdashmost importantmdashthe causal factors for these crashes The study was conducted for intersections on rural four-lane highways in the state of California Four collision types were tested in the study opposite-direction same-direction intersecting-direction and single-vehicle crashes In addition a set of data from the state of New York was used with the same parameters to analyze the severity distribution of crash types The data for California included 1084 intersections on four-lane rural highways and that from New York included 675 intersections mainly stop controlled or without any control Generalized linear modeling was performed with the data after quality analysis Two model forms were estimated with the variables seen in Equations 29 and 30
(Eq 29)
(Eq 30)
where NAcc = predicted number of crashesyr at intersections AADTmajor = AADT on major road AADTminor= AADT traffic flow on minor road Βi = model parameters Xi = variables that describe the intersections (such as terrain lighting left turn number of though lanes and divided or undivided among others)
nn xxxormajorAcc exAADTxAADTN ββββββ ++++=
min4433021
nn xxxormajorAcc exAADTAADTN βββββ +++++=
min332201)(
22
The two different models are different representations of the traffic flow The first represents the AADT of major and minor roads as separate variables but in the second model they are represented as one variable by the sum of the major and minor roads AADTs Results showed that the first model performed better for the multiple-vehicle crashes and the second model fitted better for the single-vehicle crashes In addition the appropriate predictor variables differed depending on the crash type This study is also of interest as it incorporated additional parameters to those in the suggested SPFs now included in SafetyAnalyst and therefore could lead to possible future SPF research for the state of Virginia
Persaud and Nguyen (1998) conducted a study on signalized intersections in Ontario Canada They developed aggregate and disaggregate models to estimate safety performance of three- and four-leg intersections in which crash severity (injury and PDO) environmental class (semi-urban and rural) and time period (daily weekday morning peak and weekday afternoon peak) were considered in the analysis An important aspect of that study is that it supplemented the existing models used for estimating SPFs instead of replacing them because it took into consideration features that were generally not considered in the then existing developed models Two model levels were considered for the study Level 1 was based on the sum of AADTs for all approaches with separate estimates for rear-end right angle and turning movement crashes At this level the equations were adjusted for three- and four-leg intersections by crash severity for all combined impact types and also separately for the three major impact types which were angle rear-end and turning movement In addition models were further separated by time period (daily weekday morning and afternoon peak) and for four-leg intersections which were also classified by environment class such as semi-urban and rural Level 2 allowed estimates to be obtained for specific crash patterns that were defined by movements of the vehicles involved before collision and the same were estimated as a function of the flows that were relevant to each of the patterns For this level models were estimated for four-leg intersections for 12 multi-vehicle and three single-vehicle patterns that were described by the movements of involved vehicles before collision The developed models were intended to estimate the parameters P and d shown in Equations 31 and 33
The safety of the intersection was estimated using the long-term mean based on the EB approach The long term mean (m) was obtained by combining crash count (x) of an intersection in the most recent years (n) with the estimates of the expected annual number of crashes (P) as shown in Equation 31 W1 and W2 in Equations 31 through 33 represent the weights estimated from the mean and variance of the regression estimates
(Eq 31)
(Eq 32)
(Eq 33)
m =W1(x) +W2(P)
2dW
d nP=
+
1PW
d nP=
+
23
(Eq 34)
To estimate the variance of m the following formula was used
(Eq 35)
In Equations 32 through 35 P and d represent the fundamental parameters Two models were selected for SPFs For Level 1 and single-vehicle Level 2 (Eq 36) For multi-vehicle in Level 2 (Eq 37) where P = expected number of crashes of a given type α and β = regression parameters to be estimated S (Level 1) = sum of all entering flows for a given time period for Level 1 analysis S (Level 2) = sum of the daily through right or left turn flows for a given time period for Level 2 (single-vehicle) analysis S1 and S2 = AADTs for small and large flows for a specific crash pattern in Level 2 (multi-vehicle) analysis
The models in either level can be used in the EB procedure to provide estimates for intersections that need to be treated or for the evaluation of the effectiveness of safety countermeasures It should be noted that the quality of the estimates for the study was strongly related to how the parameters were selected and used in the SPFs and unlike other available road models the ones presented in this study can be separated by time period and crash pattern Persaud et al (2002) conducted a study to demonstrate the complexity involved in the calibration of crash prediction models or SPFs for urban intersections Toronto data for three- and four-leg signalized intersections were used to estimate the models for the study The performance of these models was then compared with other models from Vancouver and California The models from these places were recalibrated to fit Toronto by using the Interactive Highway Safety Design Model (IHSDM) and a calibration procedure as proposed by Harwood et al (2000) The results varied significantly and were also mixed The study noted that the calibration of models is not a simple task and due to the importance of the SPFs they must be properly calibrated Several things must be accounted for when performing this procedure in order to obtain good quality data analysis The first thing is to extract a large sample of high quality data A software or program to link all the traffic crash and road characteristics data must exist because the same is usually kept stored in different databases In addition several
2Pd
Var P=
2( )
d xVar m dnP
+=
+
P =αSβ
P =αS1β1 S2
β 2
24
years of crash data must be obtained in order to have a good amount of samples that account for variations The actual process of model calibration is complicated therefore careful attention must be paid when analyzing the same because of the importance of the outcomes of the study The authors of the study made an exploratory analysis and it revealed that the relationship between the crashes and each covariate should be described either by the power function or the gamma function for all intersection types to be analyzed Equations 38 through 40 are the selected model forms used in the study F1 = Power F2 = Gamma (Eq 38) F1 = Gamma F2 = Power (Eq 39) F1 = Power F2 = Power (Eq 40) where E (K) = expected annual number of crashes between 1990 and 1995 F1 F2 = average entering AADT of major and minor roads respectively for the period 1990 to 1995 α β1 β2 β3 β4 = coefficients to be estimated
An NB structure was used to analyze the models and the overdispersion parameter (γ) was analyzed using Equation 41
γ=
2)K(E)K(Var (Eq 41)
Variance increases as γ decreases therefore the value of γ can also be used to make a comparison for the goodness of fit of several models fitted to the same data The larger the value of γ the smaller the variance therefore a more accurate model is given The authors suggest that γ would be enough to calculate the goodness of fit index of any SPF but if one desires to know how accurate the prediction estimate is other measures should also be computed The authors suggested using R2
α as proposed by Miaou et al (1996) which is a dispersion parameter based R2 computed as shown in Equation 42
γγ
minus=αmin2 1R (Eq 42)
where γ = overdispersion parameter for calibrated model γmin = smallest possible overdispersion parameter
The authors suggested that a disaggregation by traffic volume is preferable than using
only a single calibration factor for that is what the IHSDM currently has A recommendation is made to account for safety variation in traffic conditions over time by calibrating the models every two to three years as suggested by Harwood et al (2000)
E(K) =αF1β1 F2
β 2e(β 3F2 )
E(K) =αF1β1 F2
β 2e(β 4 F1 )
E(K) =αF1β1 F2
β 2
25
The Illinois Department of Transportation and the University of Illinois Urbana-Champaign conducted a research study to develop and implement SPFs for road segments and intersections in Illinois (Tegge et al 2010) These SPFs were developed in a way suitable for easy implementation in SafetyAnalyst The crash data (number of crashes and crash severity) and roadway data (number of lanes traffic volume area type and functional class) were collected and used for development of the SPFs Seventeen peer groups were used for developing the SPFs for segments and eight for intersections The intersections peer groups were minor leg stop control all-way stop control signalized and undetermined for rural and urban segments separately The SPFs for segments were developed using NB distribution for crashes and Poisson distribution for intersections The SAS GENMOD procedure was used to develop the SPFs for a five-year analysis period from 2001 to 2005 The model form for the intersection SPFs is the same as that given in the SafetyAnalyst Userrsquos Manual The SPFs were also developed for different crash severities such as fatal crashes type A injury crashes type B injury crashes and fatal plus injury crashes The EB method was used to determine the sites with the higher PSIs Two analysis techniques were used to obtain the PSIs The first considered segments and intersections as individual elements and the second used the sliding window approach The site specific analysis treated each individual segment and intersection as a separate entity Each segment is then compared with every other segment instead of having them grouped together The sliding window approach defined a set length The window lengths were 025 mile and 1 mile for urban and rural segments respectively
The largest impact on crash frequency was found to be the AADT and was therefore the only variable modeled as a logarithm (lnAADT) By doing this the AADT accounted for most of the prediction whereas the rest of the variables refined the prediction further Other variables used included access control functional class lane width surface type area type speed limit and median type The study recommended that a multivariate analysis be conducted for such studies to show how certain variables could contribute to the crashes Other variables could include roadway lighting weather and pavement conditions and roadway geometry The study also concluded that knowledge of roadway characteristics that increase the risk of fatal or injury crashes will facilitate the setting up of safety criteria that can help engineers in the designing of safer roadways Further knowledge of driver behaviors that lead to fatal and severe injury crashes can facilitate the training of enforcement officers to identify these behaviors
The Colorado Department of Transportation (CDOT) (2009) conducted a study to develop SPFs for intersections in the state Their model form is the same as that in SafetyAnalyst The SPFs were developed for many categories based on the number of legs divided undivided rural and urban including urban four-lane divided signalized six-lane divided signalized urban three-leg signalized two-lane undivided unsignalized and urban three-leg unsignalized When a median or left-turn lane is present a roadway is considered divided The sites selected for the study reflected variability in traffic volume and geometry in order to have a diverse representation of intersections throughout the state SPFs were developed for total and for fatal plus injury crash types A five-year study period from 2000 through 2005 was used Crash and AADT data were collected for development of the SPFs CDOT used a NB error structure to develop the SPFs and the EB procedure to estimate the expected safety performance of an intersection site for different safety management purposes Overdispersion parameters were computed and used as a goodness of fit measure According to their data
26
overdispersion parameters indicated that their models provided a reasonable fit to the Colorado data
Results indicated that for signalized intersections roads with six lanes on major approaches have more collisions than those with four lanes on major approaches CDOT recommended that the SPFs should be recalibrated in the future using data from future years as crash frequencies may change over time because of a variety of issues The report also recommended that separate calibration factors should be developed for different regions and different topographies Research in Virginia
In Virginia two other similar studies have recently been published One by Garber et al (2010) for two-lane roads and another by Hamidi et al (2010) to identify high-crash sections on Virginiarsquos primary system by developing a planning-level methodology The study by Garber et al developed SPFs for two-lane segments of 1 mile or less and the study by Hamidi et al developed SPFs for longer segments of two-lane roads that can be used for corridor analysis
Evaluation of the Recommended Minnesota SPFs
Figures 3 through 6 show representative graphs that were used to visually examine how well the Virginia data fitted the suggested Minnesota SPFs Figures 3 and 4 are for urban four-leg signalized intersections and Figures 5 and 6 are for rural four-leg signalized intersections These graphs suggest that the Minnesota SPFs do not fully represent the Virginia data Tables 9 through 12 show the Freeman-Tukey R2
FT coefficients computed for the different Minnesota SPFs using the Virginia data The low Freeman-Tukey R2
FT coefficients obtained and the visual inspection of the graphs suggested that a better fit to the Virginia data could be obtained by developing specific Virginia SPFs using Virginia data It was therefore decided to develop specific SPFs for Virginia
0
2
4
6
8
10
12
14
0 20000 40000 60000 80000 100000 120000
AADT Major
Tota
l Cra
shes
Per
Yea
r
Minnesota VA Actual Observed
Minnesota Model
Figure 3 Total crashes per year vs major AADT for urban 4-leg signalized intersections
with minor AADT of 700
27
0
5
10
15
20
25
30
35
0 20000 40000 60000 80000 100000 120000
AADT Major
Tota
l Cra
shes
per
Yea
r
Minnesota VA Actual Observed
Minnesota Model
Figure 4 Total crashes per year vs major AADT for urban 4-leg signalized intersections
with minor AADT of 4500
0
2
4
6
8
10
12
14
0 20000 40000 60000 80000 100000 120000
AADT Major
Tota
l Cra
shes
Per
Yea
r
Minnesota VA Actual Observed
Minnesota Model
Figure 5 Total crashes per year vs major AADT for rural 4-leg signalized intersections with
minor AADT of 795
28
0
2
4
6
8
10
12
14
16
18
0 20000 40000 60000 80000 100000 120000
AADT Major
Tota
l Cra
shes
per
Yea
r
Minnesota VA Actual Observed
Minnesota Model
Figure 6 Total crashes per year vs major AADT for rural 4-leg signalized intersections with
minor AADT of 5000
Table 9 Minnesota SPFs for Urban FI Crashes and Corresponding R2FT Based
on Virginia Data
Intersection Type
Minnesota FI SPFs R2
FT Based on Virginia Urban FI Crash Data ()
Urban 4-Leg Signalized 032
Urban 4-Leg Minor Stop Control 008
Urban 3-Leg Signalized 026
Urban 3-LegMinor Stop Control 01
Table 10 Minnesota SPFs for Urban TOTAL crashes and Corresponding R2
FT Based on Virginia Data
Type of Intersection
Minnesota SPFs
R2FT Based on Virginia Urban Total
Crash Data ()
Urban 4-Leg Signalized 034
Urban 4-Leg Minor Stop Control 022
Urban 3-Leg Signalized 031
Urban 3-Leg Minor Stop Control 01
29
Table 11 Minnesota SPFs for Rural TOTAL Crashes and Corresponding R2FT
Based on Virginia Data
Type of Intersection
Minnesota SPFs R2
FT Based on Virginia Rural Total Crash Data ()
Rural 4-Leg Signalized 029
Rural 4-Leg Minor Stop Control 013
Rural 3-Leg Signalized 029
Rural 3-Leg Minor Stop Control -010
Table 12 Minnesota SPFs for Rural FI Crashes and Corresponding R2FT Based
on Virginia Data
Type of Intersection
Minnesota SPFs R2
FT Based on Virginia Rural FI Crash Data ()
Rural 4-Leg Signalized 018
Rural 4-Leg Minor Stop Control 010
Rural 3-Leg Signalized 018
Rural 3-Leg Minor Stop Control 001
Development and Evaluation of Specific Virginia SPFs
In keeping with the suggestion given in the Safety Analyst Userrsquos Manual the model form used to develop the intersection SPFs is given in Equation 4 as
1 2k e x MajAADT x MinAADTβ βα=
where
k = predicted crash frequency per intersection per year MajAADT = AADT on the major road (vehday) MinAADT = AADT on the minor road (vehday) α = intercept β1 = coefficient of mayor AADT β2 = coefficient of minor AADT
30
The statewide SPFs developed for Virginia are given in Tables 13 through 16 Due to lack of data the analysis for all-way stop intersections could not be undertaken These tables also give the Freeman-Tukey R2
FT coefficient for each of the Virginia SPFs and the corresponding Minnesota SPF and Freeman-Tukey R2
FT based on the Virginia data The R2FT coefficients
obtained indicate that the Virginia-specific SPFs fit the Virginia data better than the suggested Minnesota SPFs for all types of intersections and crash severity except those for FI crashes on urban three-leg signalized rural four-leg signalized and rural four-leg minor stop control intersections where the corresponding RFT
2 values are similar In Table 15 it can be seen that the Minnesota R2
FT value is negative for the rural three-leg minor stop control intersections The negative RFT
2 value is possible because these calculations were not performed on the same data points that were used to create the Minnesota SPFs (Miller 2009) Table 13 SPF Models for Urban TOTAL crashes and R2
FT results for Virginia Statewide (VDOT-maintained roads)
SPF model with TOTAL Crash values
R2FT TOTAL
Crash Data
Site Virginia Statewide Minnesota VA MN
Urban 4-Leg Signalized 056 034
Urban 4-Leg Minor Stop Control
032 022
Urban 3-Leg Signalized 037 031
Urban 3-Leg Minor Stop Control
023 010
Table 14 SPF Models for Urban FI crashes and R2
FT results for Virginia Statewide (VDOT-maintained roads)
SPF model with FI Crash values R2FT FI Crash Data ()
Site
Virginia Statewide Minnesota VA MN
Urban 4-Leg Signalized 041 032
Urban 4-Leg Minor Stop Control
019 008
Urban 3-Leg Signalized 026 026
Urban 3-Leg Minor Stop Control
013 010
31
Table 15 SPF Models for Rural TOTAL Crashes and R2FT Results for Virginia Statewide (VDOT-
maintained roads) SPF model with TOTAL Crash values R2
FT TOTAL Crash Data
Site
Virginia Statewide Minnesota VA MN
Rural 4-Leg Signalized 0321 0290
Rural 4-Leg Minor Stop Control
0167 0132
Rural 3-Leg Signalized 0305 0291
Rural 3-Leg Minor Stop Control
0104 -0102
Table 16 SPF Models for Rural FI crashes and R2
FT results for Virginia Statewide (VDOT-maintained roads) SPF model with FI Crash values R2
FT TOTAL Crash Data
Site
Virginia Statewide Minnesota VA MN
Rural 4-Leg Signalized 0181 0181
Rural 4-Leg Minor Stop Control
0098 0097
Rural 3-Leg Signalized 0170 0180
Rural 3-Leg Minor Stop Control
0048 0012
Figures 7 through 10 show visual representations of how well the Virginia SPFs fit the
Virginia data in comparison with the suggested Minnesota SPFs In general the Virginia SPFs tend to fit the Virginia data better than the Minnesota SPFs although both sets of SPFs tend to have similar fits at low volumes (AADTmajor lt 2000) except for the SPF for total crashes on urban four-leg signalized intersections shown in Figure 7 The primary reason the Minnesota SPFs do not fit the Virginia data as well as the Virginia SPFs may be the dissimilarities of the roadside environment and the characteristics of the different databases
32
0
2
4
6
8
10
12
14
0 20000 40000 60000 80000 100000 120000
AADT Major
Tota
l Cra
shes
Per
Yea
r
Minnesota VA Actual Observed Virginia
Minnesota Model
Virginia M odel
Figure 7 Total crashes per year vs major AADT for urban 4-leg signalized intersections
with minor AADT of 700
0
5
10
15
20
25
30
35
0 20000 40000 60000 80000 100000 120000
AADT Major
Tota
l Cra
shes
per
Yea
r
Minnesota VA Actual Observed Virginia
Minnesota Model
Virginia Model
Figure 8 Total crashes per year vs major AADT for urban 4-leg signalized intersections
with minor AADT of 8000
33
0
2
4
6
8
10
12
14
0 20000 40000 60000 80000 100000 120000
AADT Major
Tota
l Cra
shes
Per
Yea
r
Minnesota VA Actual Observed Virginia
Virginia Model
Minnesota Model
Figure 9 Total crashes per year vs major AADT for rural 4-leg signalized intersections with
minor AADT of 79
0
5
10
15
20
25
0 20000 40000 60000 80000 100000 120000
AADT Major
Tota
l Cra
shes
per
Yea
r
Minnesota VA Actual Observed Virginia
Minnesota Model
Virginia Model
Figure 10 Total crashes per year vs minor AADT for rural 4-leg signalized intersections with major AADT of 5000
As discussed in the Methodology section in addition to the statewide Virginia SPFs
specific SPFs were developed for each operational region to consider the different topographical characteristics that exist across Virginia The complete set of SPFs together with the associated p values for the regression coefficients are shown in Tables A-1 and A-2 of Appendix A All p values are less than 005 with most being less than 00001 except for some of the rural four-leg signalized intersections regional specific SPFs These p values indicate that the estimated coefficients are statistically significant at the 95 confidence level or better A possible reason
34
for higher p values for a small number of SPFs may be the sample size used for developing these SPFs
To test the transferability and fit of the Virginia statewide specific SPFs several
statistical parameters were determined for the 70 (estimation) data set and the 30 (validation) data set separately The corresponding values for each of these parameters were then compared The results are shown in Tables 17 and 18 for urban and rural intersections respectively The results for the regional SPFs are shown in Tables A-3 through A-8 of Appendix A The results indicate that the developed models are transferable to the 30 validation data set For example the MSE values for the 70 estimation data are similar to the MSPE values for the 30 validation data In addition the mean prediction bias MPB values for the 30 validation data are close to zero (-076 le MPB ge -0004) in Table 17 and (-0067 le MPB ge 00513) in Table 18
Table 17 Goodness of Fit Results for Urban Statewide SPFs
Data Estimation data 70 Validation Data 30 Subtype Site MSE r2 R2
FT MPB MAD MSPE R2FT
Total VA 41150 0529 0557 -0760 4329 38490 0575
Total MN
68636 0506 0336 -3145 5421 68156 0315
FI VA
7043 0385 0406 -0458 1938 7671 0475
Urban 4-Leg Signalized
FI MN 7702 0372 0324 -0316 2124 8981 0376
Total VA 2238 0315 0313 -0034 0897 2383 0292
Total MN 2510 0287 0215 0091 0982 2730 0182
FI VA 0530 0194 0193 -0004 0432 0533 0194
Urban 4-Leg Minor Stop Control
FI MN 0560 0182 0080 0128 0522 0577 0052
Total VA 24900 0375 0370 -0645 3519 27591 0369
Total MN 29322 0365 0308 -2238 3661 33079 0272
FI VA 4467 0275 0259 -0185 1527 4875 0262
Urban 3-Leg Signalized
FI MN 4528 0267 0261 -0294 1526 4937 0261
Total VA 1854 0254 0230 -0043 0893 2038 0239
Total MN 2388 0237 0104 -0541 0902 2600 0107
FI VA 0428 0151 0133 -0021 0431 0476 0157
Urban 3-Leg Minor Stop Control
FI MN 0478 0140 0097 -0184 0385 0537 0104
35
Table 18 Goodness of Fit Results for Rural Statewide SPFs
Data Estimation Data 70
Validation Data 30
Subtype Site MSE r2 R2FT MPB MAD MSPE R2
FT
Total VA 10990 0353 0321 0513 2210 10070 -0073
Total MN 12400 0339 0290 -0154 2071 8460 0035
FI VA 2350 0196 0181 0045 1189 2600 -0034
Rural 4-Leg Signalized
FI MN 2400 0188 0181 -0043 1164 2420 0004
Total VA 1090 0182 0167 -0067 0794 1190 0171
Total MN 1190 0167 0132 -0348 0774 1320 0115
FI VA 0480 0112 0098 -0022 0504 0530 0110
Rural 4-Leg Minor Stop Control
FI MN 0500 0104 0097 -0158 0459 0560 0093
Total VA 5490 0328 0305 -0010 1651 5760 0179
Total MN NA NA NA NA NA NA NA
FI VA 1450 0181 0170 -0041 0902 1710 0099
Rural 3-Leg Signalized
FI MN NA NA NA NA NA NA NA
Total VA 0690 0144 0104 -0008 0613 0730 0102
Total MN 0890 0141 -0102 -0404 0555 0940 -0104
FI VA 0250 0071 0048 -0009 0345 0260 0048
Rural 3-Leg Minor Stop Control
FI MN 0270 0068 0012 -0144 0270 0290 0003
Pruning of Virginia-Specific SPFs A total of 64 SPFs were initially developed using the appropriate data for Virginia as shown in Tables A-1 and A-2 of Appendix A Considering that not all regional models might be necessary the pruning process described in the methodology section was carried out to prune the number of SPFs to the minimum effective number as seen in Tables 19 and 20 for urban and rural intersections respectively The pruning process resulted in 19 SPFs for urban sites and 15 for rural sites To facilitate the use of the correct SPF for a specific type of intersection located in a specific region the lists of the appropriate SPFs to be used are given in Tables B-1 and B-2 of Appendix B for the urban and rural intersections respectively
As can be seen in Tables 19 and 20 and Tables A-1 and A-2 of Appendix A there are some trends worth discussing for the benefit of the study and possible future research With regards to the three different operational regions the Western region retained many more of the specific regional urban SPFs than any other region For example the Western regional SPFs were retained for all urban intersection sites whereas for the Eastern region the only SPFs
36
retained were those for urban four-leg signalized FI crashes and urban four-leg minor stop control for total and FI crashes Similarly the only urban SPF retained for the Northern region was that for urban four-leg minor stop control for total crashes For the rural intersection sites all of the Western regional SPFs were retained except those for rural three-leg signalized total and FI crashes and rural four-leg minor stop control FI crashes The majority of the Eastern region rural SPFs were discarded except those for rural four-leg signalized total and FI crashes while for the Northern region all regional SPFs were discarded
The Western region retained more specific regional SPFs than the other two regions This suggests that the intersections in the Western region exhibit more unique characteristics than those for the other regions This may be due to the more mountainous terrain in the Western region compared to those in the Eastern and Northern regions This supports the philosophy of developing specific SPFs based on the topography of different regions
Site Prioritization
To illustrate the benefits of using the EB method to prioritize intersection sites for safety
improvements the top 25 urban sites from the Bristol and Northern Virginia districts were identified by using crash rates critical crash ratio and the EB method The PSI for each site identified was then determined The results obtained are shown in Tables 21 and 22 for the Bristol and the Northern Virginia districts respectively The results indicate that for the Northern Virginia District the PSIs for the top 25 sites are 258 1317 and 27440 crashes per year and for the Bristol District 432 646 and 1496 crashes per year for the crash rates critical crash ratio and EB methods respectively The important thing in Tables 21 and 22 is the sum of the PSI columns ranked by the three methods The sum of each of the PSIs for the crash rate and critical crash ratio method is lower than that for the EB method These results suggest that the use of the EB method in the planning process will identify intersection sites with the highest PSIs and therefore where detailed assessments to determine feasible and effective safety treatments should be undertaken
37
Table 19 MSPE Values for Virginia Urban Statewide and Urban Regional SPFs Used for Pruning
Data Pruning
Subtype
Site
MSPE [MSPEVA-
MSPEOR]1 [abs(MSPEVA-
MSPEOR)]2 [abs(MSPEVA-
MSPEOR)MSPEVA]3
RetainDiscardTotal VA 3849 Northern 4486 -637 637 0165497532 Discard Western 1791 2058 2058 0534684334 Retain Eastern 3745 104 104 0027020005 Discard FI VA 7671 Northern 95 -1829 1829 0238430452 Discard Western 517 2501 2501 0326033112 Retain
Urban 4-Leg Signalized
Eastern 541 2261 2261 0294746448 Retain Total VA 23834 Northern 202 03634 03634 015247126 Retain Western 105 13334 13334 0559452882 Retain Eastern 115 12334 12334 0517496014 Retain FI VA 05327 Northern 048 00527 00527 0098929979 Discard Western 033 02027 02027 0380514361 Retain
Urban 4-Leg Minor Stop Control
Eastern 036 01727 01727 0324197485 Retain Total VA 275911 Northern 2687 07211 07211 0026135239 Discard Western 2441 31811 31811 0115294425 Retain Eastern 3878 -111889 111889 0405525695 Discard FI VA 48754 Northern 448 03954 03954 0081101038 Discard Western 339 14854 14854 0304672437 Retain
Urban 3-Leg Signalized
Eastern 586 -09846 09846 020195266 Discard Total VA 20379 Northern 219 -01521 01521 0074635654 Discard Western 164 03979 03979 0195250012 Retain Eastern 223 -01921 01921 0094263703 Discard FI VA 04756 Northern 05 -00244 00244 0051303616 Discard Western 038 00956 00956 0201009251 Retain
Urban 3-Leg Minor Stop Control
Eastern 05 -00244 00244 0051303616 Discard 1 Difference between mean square prediction error (MSPE) of Virginia statewide model and OR model 2 Absolute value of the difference between Virginia statewide model MSPE and operational region model MSPE 3 Absolute value of the difference between Virginia statewide model MSPE and operational region model MSPE divided by the Virginia statewide MSPE for comparison
Retained SPFs Discarded if value is negative Discarded if less than 01
38
Table 20 MSPE Values for Virginia Rural Statewide and Rural Regional SPFs Used for Pruning Data Pruning
Subtype
Site
MSPE
[MSPEVA-MSPEOR]1
[abs(MSPEVA-MSPEOR)]2
[abs(MSPEVA-MSPEOR)MSPEVA]3
RetainDiscard
Total VA 1007 Northern 3422 -2415 2415 2398212512 Discard Western 605 402 402 0399205561 Retain Eastern 512 495 495 0491559086 Retain FI VA 26 Northern 976 -716 716 2753846154 Discard Western 159 101 101 0388461538 Retain
Rural 4-Leg Signalized
Eastern 137 123 123 0473076923 Retain Total VA 119 Northern 164 -045 045 0378151261 Discard Western 102 017 017 0142857143 Retain Eastern 114 005 005 0042016807 Discard FI VA 053 Northern 052 001 001 0018867925 Discard Western 048 005 005 0094339623 Discard
Rural 4-Leg Minor Stop Control
Eastern 049 004 004 0075471698 Discard Total VA 576 Northern 1475 -899 899 1560763889 Discard Western 674 -098 098 0170138889 Discard Eastern 626 -05 05 0086805556 Discard FI VA 171 Northern 212 -041 041 0239766082 Discard Western 403 -232 232 1356725146 Discard
Rural 3-Leg Signalized
Eastern 157 014 014 0081871345 Discard Total VA 073 Northern 093 -02 02 0273972603 Discard Western 053 02 02 0273972603 Retain Eastern 069 004 004 0054794521 Discard FI VA 026 Northern 03 -004 004 0153846154 Discard Western 023 003 003 0115384615 Retain
Rural 3-Leg Minor Stop Control
Eastern 027 -001 001 0038461538 Discard 1 Difference between mean square prediction error (MSPE) of Virginia statewide model and OR model 2 Absolute value of the difference between Virginia statewide model MSPE and operational region model MSPE 3 Absolute value of the difference between Virginia statewide model MSPE and operational region model MSPE divided by the Virginia statewide MSPE for comparison
Retained SPFs Discarded if value is negative Discarded if less than 01
39
Table 21 PSIs for Top 25 Sites in District 1 Urban (Bristol) FI
Crashes Ranking Based on Crash
Rates Ranking Based on Crash Ratio Ranking Based on EB
Method
Rank Intersection Node
Crash Rate1 PSI2 Intersection
Node Crash Ratio3 PSI Intersection
Node PSI
1 596726 22112 00000 651193 39672 00000 596095 21413
2 606469 20079 00000 606238 39298 06297 596393 08787
3 706818 12504 00000 651075 31264 00000 651130 08453
4 651193 11550 00000 596726 29227 00000 596701 07112 5 651075 09369 00000 606469 28039 00000 651802 06929 6 606238 08382 06297 651233 25831 03612 636331 06726 7 651807 07089 00000 651130 22718 08453 596395 06579 8 651233 06068 03612 706818 22555 00000 596937 06415 9 651230 05990 00000 651230 20301 00000 606238 06297
10 651783 05756 00000 651210 18882 04747 661033 06061 11 636093 04960 00000 636331 17913 06726 596372 05417 12 651274 04475 00000 651807 16847 00000 636372 04808 13 651130 04179 08453 651805 15814 00000 651210 04747 14 651210 03918 04747 651223 15627 03589 636491 04649 15 636331 03393 06726 651783 15009 00000 596420 04633 16 651223 03363 03589 596095 14865 21413 596403 04579 17 606232 03331 00000 636405 14769 00000 651603 04531 18 651127 03053 00000 661033 14555 06061 636056 04351 19 651999 03048 00000 596353 14215 03717 712033 04110 20 596449 02962 00000 636093 13782 00000 704691 04102 21 636405 02811 00000 651879 13192 00000 651838 04100 22 651883 02698 00000 651274 12975 00000 651894 03878 23 596353 02686 03717 651127 12972 00000 596353 03717 24 651805 02663 00000 651999 12959 00000 651233 03612 25 661033 02500 06061 596449 12702 00000 651889 03601
sum 43202 sum 64615 sum 149606 1Number of crashes per year per 1000000 total approach volume 2Potential for safety improvement (crashes yr) the difference between the EB-adjusted long-term crashes and the SPF-estimated crashes 3Ratio of actual crash rate to critical crash rate
40
Table 22 PSIs for Top 25 Sites in District 9 Urban (Northern Virginia District) FI
Crashes Ranking Based on Crash
Rates Ranking Based on Crash Ratio Ranking Based on EB
Method
Rank Intersection Node
Crash Rate1 PSI2 Intersection
Node Crash Ratio3 PSI Intersection
Node PSI
1 718192 191841 00000 718192 257523 00000 264119 150122 2 702946 178194 00000 547722 152371 11175 263375 140091 3 271531 64846 00000 263628 102794 00000 278648 137239 4 263628 52858 00000 263728 100092 00000 276819 131395 5 263728 42215 00000 719754 95274 09444 263290 130743 6 266955 35294 00000 702946 79268 00000 722678 127897 7 547722 34932 11175 263403 77252 05184 264725 118671 8 702612 30441 00000 704237 77175 07648 267028 116627 9 273886 29539 00000 263729 74681 00000 265204 115925
10 716747 27632 00000 271531 72327 00000 274766 115679 11 263626 27139 00000 263135 66458 18068 263249 113372 12 269485 26567 00000 716747 64461 00000 547044 110769 13 728954 26344 00000 266955 56657 00000 549349 107180 14 263729 25208 00000 546138 52003 31028 268210 105630 15 546988 21922 00000 547544 51924 32529 263347 104257 16 274338 21446 00000 263626 50389 00000 276351 102313 17 429308 21354 00000 269485 49897 00000 428167 100064 18 720401 21197 00000 728954 49702 00000 264344 98789 19 267295 20954 00000 548686 49572 03621 277764 91554 20 267536 20874 00000 711601 47985 04440 263467 89259 21 265938 20484 00000 266970 47730 00000 263090 89199 22 273354 20108 00000 546462 46856 03620 703414 88610 23 268345 19362 00000 265938 46726 00000 428629 87379 24 719754 19073 09444 720401 44833 00000 272219 85659 25 263403 19015 05184 728496 43666 04990 428544 85610
Sum 25803 sum 131747 sum 2744033 1Number of crashes per year per 1000000 total approach volume 2Potential for safety improvement (crashes yr) the difference between the EB-adjusted long-term crashes and the SPF-estimated crashes 3Ratio of actual crash rate to critical crash rate
41
CONCLUSIONS
bull The development of SPFs for intersections is necessary for Virginia because the SafetyAnalyst-suggested SPFs which are based on Minnesota data do not represent the Virginia data well Regarding the fit of the SPFs to Virginia data the R2
FT values shown in Tables 13 through 16 for Minnesota and Virginia indicate that the Virginia-specific SPFs fit the Virginia data better than the Minnesota models This may be due to the dissimilarities of the roadside environment such as difference in topography and the characteristics of the different Virginia and Minnesota databases
bull In some cases the specific regional SPFs fit the regional data better than the statewide
SPFs suggesting that the specific SPFs should be considered for use when available These group divisions that have similar roadway characteristics and driver expectations in some cases tend to improve the fit
bull In identifying intersection sites for safety improvements it is clearly beneficial for the EB
method to be used with the suitable SPFs rather than a crash rate or critical ratio method Results of the site prioritization show a much higher potential for crash reduction when the EB method is used with the appropriate SPFs rather than a procedure based on crash rates or critical rates
RECOMMENDATIONS
1 VDOTrsquos TED should use the Virginia-specific SPFs when using the SafetyAnalyst tools The results of this study have shown that the Virginia-specific SPFs reflected the Virginia data better than the SafetyAnalyst-recommended Minnesota SPFs
2 VDOTrsquos TED should investigate the feasibility of using multiple SPFs in SafetyAnalyst If
feasible regional SPFs should be used If it is not currently feasible to use multiple SPFs VDOTrsquos TED should ask that the FHWA include regional information in SafetyAnalyst so as to allow the use of regional SPFs For the specific regional SPFs to be applied to Virginia and other states the SafetyAnalyst tool should be capable of incorporating the necessary data that support the regional models
3 As soon as it is feasible to use regional SPFs VDOTrsquos TED should use the 19 SPFs
developed for urban intersections and the 15 developed for rural intersections when using the tools in SafetyAnalyst Although the statewide SPFs are available for use by an analyst the specific regional models included in the final set of SPFs will predict crashes better than the statewide SPFs The regional analysis will not only ease the use of specific regional SPFs but will also be of benefit when predicting the potential for safety improvement of a specific site
4 For future similar SPF studies VDOTrsquos TED should be directly involved in screening the
traffic data for accuracy and consistency as was done in this study The direct involvement of the TED in the screening of the traffic data significantly contributed to the accuracy of the
42
data and greatly contributed to the confidence the researchers place on the data used in the study
5 The Virginia Transportation Research Council (VTRC) should conduct a study as soon as
feasible to verify whether incorporating independent variables for which data are available other than AADT such as intersection geometry and other characteristics will result in SPFs that better fit the Virginia data Although the currently suggested SafetyAnalyst SPFs use only the AADTs as the independent variables it is likely that provision will be made for use of SPFs that incorporate other independent variables such as number of approaches entering lanes and the other variables for which data are available as these SPFs are likely to give better fit to crash data
6 As soon as feasible VTRC should undertake a study to develop SPFs for the urban system
intersections which are not currently maintained by VDOT as these intersections may have different crash characteristics than those maintained by VDOT This would facilitate the use of SafetyAnalyst in programming sites that are currently not being maintained by VDOT
BENEFITS AND IMPLEMENTATION PROSPECTS
Significant benefits will be accrued by the use of the Virginia-specific SPFs developed in this study This is clearly illustrated in two ways First in examining the transferability of the suggested SPFs in SafetyAnalyst it is clear that these SPFs do not fit the Virginia data very well The results also indicate that the Virginia-specific SPFs fit the Virginia data much better than the suggested SafetyAnalyst SPFs Second the availability of the Virginia-specific SPFs will enhance the use of the EB procedure given in SafetyAnalyst for prioritizing sites for safety improvements This study has also shown that the EB method better identifies sites with higher potential for crash reduction than those identified by crash rates For example the illustrated examples given for the Bristol and Northern Virginia districts show that the potential reduction in FI crashes when the top 25 sites are identified by the EB method is 28936 (1496 + 27440) crashes per year whereas that obtained when the critical crash ratio method is used for prioritization is only 1963 (646 + 1317) and that obtained with the crash rate method is only 690 (432 + 258) crashes per year This gives a net benefit of 26973 potential crashes per year compared to the critical crash ratio method and 28246 compared to the crash rate method Assuming an average cost of FI crashes of $95629 (FHWA 2005) and only 10 of the estimated net benefit PSI of 28246 crashes per year is achieved the total savings of more than $27 million per year could be accrued The prospects for implementation of the recommendations are very high as the study was requested by VDOTrsquos TED which is planning to incorporate these SPFs in the use of the tools provided in SafetyAnalyst
43
ACKNOWLEDGMENTS
The authors appreciate the opportunity afforded them by VDOT and VTRC to conduct this study Special thanks to Stephen Read (VDOT) Dr In-Kyu Lim (VDOT) Dr Young-Jun Kweon (VTRC) and VDOTrsquos Central Office for their interest and support in SPFs and their help in the selection of intersection sites Many thanks to Lewis Woodson (VTRC) and James Hill (University of Virginia) for all their help and input throughout the study
REFERENCES Cogburn P VDOT Interagency Coordination 2007 Virginia Emergency Management
Conference Virginia Department of Transportation Richmond April 2007 Colorado Department of Transportation DTD Applied Research and Innovation Branch Safety
Performance Functions for Intersections CDOT-2009-10 Denver December 2009 Fridstroslashm L Ifver J Ingebrigtsen S Kulmala R and Thomsen LK Measuring the
Contribution of Randomness Exposure Weather and Daylight to the Variation in Road Accidents Counts Accident Analysis and Prevention Vol 27 No 1 1995 pp 1-20
Federal Highway Administration Cost of Crashes by Severity Table FHWA-HRT-05-051
Washington DC 2005 Federal Highway Administration SafetyAnalyst Home Page httpwwwsafetyanalystorg
Accessed February 2010 Garber N and Hoel L Traffic amp Highway Engineering 4th ed Cenage Learning Toronto
Canada 2009 Garber NJ Haas PR and Gosse C Development of Safety Performance Functions for Two-
Lane Roads Maintained by the Virginia Department of Transportation VTRC 10-R25 Virginia Transportation Research Council Charlottesville 2010
Hamidi A Fontaine MD and Demetsky MJ A Planning-Level Methodology for Identifying
High-Crash Sections of Virginiarsquos Primary System VTRC 11-R4 Virginia Transportation Research Council Charlottesville 2010
Harwood D Council FM Hauer E Hughes WE and Vogt A Prediction of the Expected
Safety Performance of Rural Two-lane Highways Federal Highway Administration McLean VA December 2000
Harwood DW Bauer KM Richard KR Gilmore DK Persaud B and Lyon C
Development of SPFs for Safety Analyst Interim Tools Technical Memorandum
44
Prepared by Midwest Research Institute for the Federal Highway Administration McLean VA 2004
ITT Corporation SafetyAnalyst Userrsquos Manual Turner-Fairbank Highway Research Center
McLean VA 2008 Jonsson T Ivan J and Zhang C Crash Prediction Models for Intersections on Rural
Multilane Highways Differences by Collision Type In Transportation Research Record Journal of the Transportation Research Board No 2019 Transportation Research Board of the National Academies Washington DC 2007 pp 91-98
Kweon Y-J and Lim I-K Appropriate Regression Model Types for the Empirical Bayes
Method and SafetyAnalyst In Proceedings of the 89th Annual Meeting of the Transportation Research Board Transportation Research Board of the National Academies Washington DC 2010
Kononov J Bailey B and Allery B Exploratory Examination of the Functional Form of
Safety Performance Functions of Urban Freeways Colorado Department of Transportation and San Diego State University Denver CO 2008
Lyon C Haq A Persaud B and Kodama S Safety Performance Functions for Signalized
Intersections in Large Urban Areas Development and Application to Evaluation of Left-Turn Priority Treatment In Transportation Research Record Journal of the Transportation Research Board No 1908 Transportation Research Board of the National Academies Washington DC 2005 pp 165-171
Lord D and Persaud B Estimating the Safety Performance of Urban Road Transportation
Networks Center for Transportation Safety Texas Transportation Institute Texas AampM University and Department of Civil Engineering Ryerson University College Station TX 2003 pp 609-620
Miaou S-P Lu A and Lum H S Pitfalls of using R2 to Evaluate Goodness of Fit of
Accident Prediction Models In Transportation Research Record Journal of the Transportation Research Board No 1542 Transportation Research Board of the National Academies Washington DC 2005 1996 pp 6-13
Miller P Re Negative R squared Email Archive Division of Biostatistics Washington
University in St Louis February 2 2005 February 2 2005 httpwwwbiostatwustleduarchiveshtmljmp-l2005msg00075html Accessed February 2010
Persaud B Lord D and Palmisano J Calibration and Transferability of Accident Prediction
Models for Urban Intersections In Transportation Research Record Journal of the Transportation Research Board No 1784 Transportation Research Board of the National Academies Washington DC 2002 pp 57-64
45
Persaud B and Nguyen T Disaggregate Safety Performance Models for Signalized Intersections on Ontario Provincial Roads In Transportation Research Record Journal of the Transportation Research Board No 1635 Transportation Research Board of the National Academies Washington DC 1998 pp 113-120
Pham T and Ragland D Summary of Crash Prediction Models Also known as Safety
Performance Functions (SPFs) California Partners for Advanced Traffic and Highways and University of California Berkeley Berkeley 2005
SAS Institute Inc SAS OnlineDoc Version Eight Cary NC
httpwwwtecnionacildocssasril Accessed 2009 Tegge RA Jo J-H and Ouyang Y Development and Application of Safety Performance
Functions for Illinois ICT-10-066 Illinois Center for Transportation University of Illinois Urbana-Champaign March 2010
Virginiarsquos Surface Transportation Safety Executive Committee Commonwealth of Virginiarsquos
Strategic Highway Safety Plan 2006-2010 Virginia Department of Transportation Richmond 2006
Washington S Persaud B Lyon C and Oh J Validation of Accident Models for
Intersections FHWA-RD-03-037 Federal Highway Administration McLean VA 2005
46
47
APPENDIX A
STATISTICAL PARAMETERS AND GOODNESS-OF-FIT RESULTS
Table A-1 Statistical Parameters for Urban Intersections SPFs Parameter Estimates
Data Intercept
Coefficient of Mayor AADT
Coefficient of Minor AADT
Subtype Site Intercept (α)
StndError
P value
lnMajor (β1)
StndError
P value
lnMinor (β2)
StndError
P value
Total VA -76234 048 lt0001 06742 005 lt0001 03453 003 lt0001
OR1 -83067 056 lt0001 07522 005 lt0001 0328 003 lt0001OR10 -123913 122 lt0001 10631 013 lt0001 04567 006 lt0001OR 100 -88553 077 lt0001 07825 007 lt0001 03706 004 lt0001FI VA -85256 057 lt0001 06477 006 lt0001 03579 004 lt0001OR1 -96546 063 lt0001 07603 006 lt0001 03597 004 lt0001OR10 -114284 15 lt0001 08662 016 lt0001 04412
Urban 4-Leg Signalized
OR 100 -99582 100 lt0001 07484 009 lt0001 04017 005 lt0001Total VA -60723 022 lt0001 04558 002 lt0001 0347 004 lt0001
OR1 -6059 044 lt0001 0505 004 lt0001 02773 006 lt0001OR10 -67031 057 lt0001 03986 007 lt0001 04999 009 lt0001OR 100 -65388 032 lt0001 04689 004 lt0001 043 006 lt0001FI VA -76917 032 lt0001 05001 003 lt0001 03695 005 lt0001OR1 -81437 060 lt0001 05813 005 lt0001 03188 008 lt0001OR10 -80333 063 lt0001 03446 007 lt0001 06218 010 lt0001
Urban 4-Leg Minor Stop Control
OR 100 -83166 051 lt0001 05253 006 lt0001 04695 008 lt0001Total VA -6543 082 lt0001 06591 008 lt0001 02119 002 lt0001
OR1 -4999 103 lt0001 05555 009 lt0001 01554 003 lt0001OR10 -96143 127 lt0001 08677 012 lt0001 03297 005 lt0001OR 100 -67518 110 lt0001 06157 011 lt0001 02969 005 lt0001FI VA -84268 068 lt0001 07147 006 lt0001 02481 002 lt0001OR1 -73982 099 lt0001 06496 009 lt0001 02088 003 lt0001OR10 -110104 155 lt0001 0908 015 lt0001 03226 006 lt0001
Urban 3-Leg Signalized
OR 100 -7266 107 lt0001 05508 011 lt0001 03107 006 lt0001Total VA -54696 013 lt0001 04874 002 lt0001 01985 001 lt0001
OR1 -5361 018 lt0001 04959 002 lt0001 01676 002 lt0001OR10 -5773 034 lt0001 04877 003 lt0001 02314 004 lt0001OR 100 -51642 021 lt0001 04338 003 lt0001 02309 003 lt0001FI VA -74642 018 lt0001 05791 002 lt0001 02091 002 lt0001OR1 -76877 027 lt0001 06204 003 lt0001 0181 002 lt0001OR10 -69458 047 lt0001 05096 004 lt0001 02212 005 lt0001
Urban 3-Leg Minor Stop Control
OR 100 -69883 031 lt0001 05169 004 lt0001 02308 003 lt0001 Standard Error
48
Table A-2 Statistical Parameters for Rural Intersections SPFs Parameter Estimates
Data Intercept
Coefficient of Mayor AADT
Coefficient of Minor AADT
Subtype Site Intercept (α)
StndError
P value
lnMajor (β1)
Stnd Error
P value
lnMinor (β2)
Stnd Error
P value
Total VA -69589 118 lt0001 06746 009 lt0001 0253 009 00047
OR1 -1604 237 04974 02284 021 02791 01514 012 0211 OR10 -63951 183 00005 05508 014 00001 03106 014 00224 OR 100 -06468 220 07692 02262 016 01635 -00158 017 09274 FI VA -87116 128 lt0001 07839 011 lt0001 02166 009 0013 OR1 -33285 246 01767 03601 024 0126 00597 013 06478 OR10 -80583 175 lt0001 06809 018 00001 02557 013 0057
Rural 4-Leg Signalized
OR 100 -48381 221 00287 04243 018 00193 01523 018 03943 Total VA -5494 020 lt0001 03533 002 lt0001 03935 003 lt0001
OR1 -62351 058 lt0001 04167 006 lt0001 04507 008 lt0001OR10 -53594 028 lt0001 03379 003 lt0001 03998 004 lt0001OR 100 -51255 027 lt0001 02914 003 lt0001 04075 004 lt0001FI VA -66927 030 lt0001 03899 003 lt0001 04156 004 lt0001OR1 -82561 095 lt0001 05221 009 lt0001 04962 012 lt0001OR10 -70797 044 lt0001 03789 004 lt0001 0497 005 lt0001
Rural 4-Leg Minor Stop Control
OR 100 -63326 038 lt0001 03223 004 lt0001 04424 005 lt0001Total VA -75754 084 lt0001 06465 008 lt0001 03332 008 lt0001
OR1 -58798 220 00075 05076 020 00143 0313 013 00161 OR10 -64368 110 lt0001 0544 011 lt0001 02863 006 lt0001OR 100 -9899 139 lt0001 08047 015 lt0001 04386 006 lt0001FI VA -87112 103 lt0001 07224 010 lt0001 02578 006 lt0001OR1 -9219 260 00004 07258 022 00011 03407 016 00326 OR10 -88607 146 lt0001 07059 016 lt0001 02809 008 00009
Rural 3-Leg Signalized
OR 100 -111835 185 lt0001 08669 018 lt0001 03977 008 lt0001Total VA -43293 008 lt0001 03366 001 lt0001 02087 001 lt0001
OR1 -50904 022 lt0001 0406 002 lt0001 02752 003 lt0001OR10 -40969 009 lt0001 03133 001 lt0001 02001 001 lt0001OR 100 -4231 016 lt0001 02997 002 lt0001 02308 003 lt0001FI VA -53415 011 lt0001 03394 001 lt0001 02237 001 lt0001OR1 -64457 031 lt0001 04195 003 lt0001 0307 004 lt0001OR10 -50831 014 lt0001 03245 002 lt0001 02014 002 lt0001
Rural 3-Leg Minor Stop Control
OR 100 -51046 024 lt0001 03163 003 lt0001 02112 003 lt0001
Standard Error
49
Table A-3 SPFs Goodness of Fit Results for Urban Northern Operational Region (No 1)
Data Estimation Data 70 Validation Data 30
Subtype Site MSE r2 R2FT MPB MAD MSPE R2
FT
Total VA 41150 0529 0557 -0760 4329 38490 0575
Total R1 4110 051 0551 -020 464 4486 054
FI VA 704 038 0406 -046 194 767 048
Urban 4-Leg Signalized
FI R1 809 039 0439 012 214 950 038
Total VA 224 031 0313 -003 090 238 029
Total R1 308 028 0286 008 095 200 032
FI VA 053 019 0193 000 043 053 019
Urban 4-Leg Minor Stop Control
FI R1 064 018 0187 003 043 048 021
Total VA 2490 038 0370 -064 352 2759 037
Total R1 3034 032 0305 -015 365 2687 037
FI VA 447 028 0259 -019 153 488 026
Urban 3-Leg Signalized
FI R1 559 025 0231 004 157 448 029
Total VA 185 025 0230 -004 089 204 024
Total R1 208 026 0239 -006 094 219 026
FI VA 043 015 0133 -002 043 048 016
Urban 3-Leg Minor Stop Control
FI R1 047 017 0156 -001 044 050 017
50
Table A-4 SPFs Goodness of Fit Results for Urban Western Operational Region (No 10)
Data Estimation Data 70 Validation Data 30
Subtype Site MSE r2 R2FT MPB MAD MSPE R2
FT
Total VA 41150 0529 0557 -0760 4329 38490 0575
Total R10 21976 0777 0735 1290 3233 17910 0686
FI VA 7043 0385 0406 -0458 1938 7671 0475
Urban 4-Leg Signalized
FI R10 4280 0526 0500 0377 1597 5170 0452
Total VA 2238 0315 0313 -0034 0897 2383 0292
Total R10 1161 0361 0300 -0032 0740 1050 0188
FI VA 0530 0194 0193 -0004 0432 0533 0194
Urban 4-Leg Minor Stop Control
FI R10 0312 0197 0187 0000 0382 0330 0009
Total VA 24900 0375 0370 -0645 3519 27591 0369
Total R10 14446 0451 0397 -0168 2801 24410 0255
FI VA 4467 0275 0259 -0185 1527 4875 0262
Urban 3-Leg Signalized
FI R10 3077 0266 0216 0039 1258 3390 0115
Total VA 1854 0254 0230 -0043 0893 2038 0239
Total R10 1391 0233 0197 -0054 0800 1640 0207
FI VA 0428 0151 0133 -0021 0431 0476 0157
Urban 3-Leg Minor Stop Control
FI R10 0354 0111 0089 -0019 0404 0380 0125
51
Table A-5 SPFs Goodness of Fit Results for Urban Eastern Operational Region (No 100)
Data Estimation Data 70 Validation Data 30
Subtype Site MSE r2 R2FT MPB MAD MSPE R2
FT
Total VA 41150 0529 0557 -0760 4329 38490 0575
Total R100 31108 0632 0630 0243 4717 37450 0005
FI VA 7043 0385 0406 -0458 1938 7671 0475
Urban 4-Leg Signalized
FI R100 5201 0480 0454 -0098 1864 5410 0244
Total VA 2238 0315 0313 -0034 0897 2383 0292
Total R100 1720 0443 0381 0087 0758 1150 0003
FI VA 0530 0194 0193 -0004 0432 0533 0194
Urban 4-Leg Minor Stop Control
FI R100 0509 0273 0254 0049 0383 0360 0173
Total VA 24900 0375 0370 -0645 3519 27591 0369
Total R100 17782 0410 0410 -1753 0908 38780 0004
FI VA 4467 0275 0259 -0185 1527 4875 0262
Urban 3-Leg Signalized
FI R100 3194 0243 0263 -0615 1645 5860 0236
Total VA 1854 0254 0230 -0043 0893 2038 0239
Total R100 1561 0233 0210 -0127 0902 2230 0002
FI VA 0428 0151 0133 -0021 0431 0476 0157
Urban 3-Leg Minor Stop Control
FI R100 0387 0131 0116 -0043 0444 0500 0141
52
Table A-6 SPFs Goodness of Fit Results for Rural Northern Operational Region (No 1)
Data Estimation Data 70
Validation Data 30
Subtype Site MSE r2 R2FT MPB MAD MSPE R2
FT
Total VA 10990 0353 0321 0513 2210 10070 -0073
Total R1 20080 0118 0092 -1389 3661 34220 0212
FI VA 2350 0196 0181 0045 1189 2600 -0034
Rural 4-Leg Signalized
FI R1 2920 0057 0052 -1173 1931 9760 0028
Total VA 1090 0182 0167 -0067 0794 1190 0171
Total R1 1990 0190 0245 0001 0942 1640 0173
FI VA 0480 0112 0098 -0022 0504 0530 0110
Rural 4-Leg Minor Stop Control
FI R1 0920 0093 0112 0020 0541 0520 0009
Total VA 5490 0328 0305 -0010 1651 5760 0179
Total R1 11110 0182 0254 -0679 2271 14750 0497
FI VA 1450 0181 0170 -0041 0902 1710 0099
Rural 3-Leg Signalized
FI R1 3230 0131 0153 -0116 1006 2120 0355
Total VA 0690 0144 0104 -0008 0613 0730 0102
Total R1 1210 0245 0196 0030 0712 0930 0126
FI VA 0250 0071 0048 -0009 0345 0260 0048
Rural 3-Leg Minor Stop Control
FI R1 0340 0124 0093 0016 0366 0300 0052
53
Table A-7 SPFs Goodness of Fit Results for Rural Western Operational Region (No 10)
Data Estimation Data 70 Validation Data 30
Subtype Site MSE r2 R2FT MPB MAD MSPE R2
FT
Total VA 10990 0353 0321 0513 2210 10070 -0073
Total R10 6020 0311 0268 0007 1748 6050 0382
FI VA 2350 0196 0181 0045 1189 2600 -0034
Rural 4-Leg Signalized
FI R10 1880 0158 0139 0097 0945 1590 0254
Total VA 1090 0182 0167 -0067 0794 1190 0171
Total R10 1300 0196 0163 0070 0760 1020 0078
FI VA 0480 0112 0098 -0022 0504 0530 0110
Rural 4-Leg Minor Stop Control
FI R10 0560 0142 0118 0025 0495 0480 0014
Total VA 5490 0328 0305 -0010 1651 5760 0179
Total R10 3690 0163 0170 -0432 0748 6740 0039
FI VA 1450 0181 0170 -0041 0902 1710 0099
Rural 3-Leg Signalized
FI R10 0890 0124 0117 -0391 0997 4030 -0066
Total VA 0690 0144 0104 -0008 0613 0730 0102
Total R10 0640 0126 0091 0025 0583 0580 0055
FI VA 0250 0071 0048 -0009 0345 0260 0048
Rural 3-Leg Minor Stop Control
FI R10 0240 0062 0041 0003 0335 0230 0028
54
Table A-8 SPFs Goodness of Fit Results for Rural Eastern Operational Region (No 100)
Data Estimation Data 70 Validation Data 30
Subtype Site MSE r2 R2FT MPB MAD MSPE R2
FT
Total VA 10990 0353 0321 0513 2210 10070 -0073
Total R100 10120 0042 0027 1207 1882 5120 -0307
FI VA 2350 0196 0181 0045 1189 2600 -0034
Rural 4-Leg Signalized
FI R100 2060 0053 0039 0119 0962 1370 -0023
Total VA 1090 0182 0167 -0067 0794 1190 0171
Total R100 0960 0170 0149 -0086 0746 1140 0209
FI VA 0480 0112 0098 -0022 0504 0530 0110
Rural 4-Leg Minor Stop Control
FI R100 0440 0106 0092 -0031 0475 0490 0121
Total VA 5490 0328 0305 -0010 1651 5760 0179
Total R100 2770 0492 0459 0601 1759 6260 0090
FI VA 1450 0181 0170 -0041 0902 1710 0099
Rural 3-Leg Signalized
FI R100 1040 0265 0255 0124 0923 1570 -0055
Total VA 0690 0144 0104 -0008 0613 0730 0102
Total R100 0640 0125 0087 -0037 0601 0690 0119
FI VA 0250 0071 0048 -0009 0345 0260 0048
Rural 3-Leg Minor Stop Control
FI R100 0250 0064 0038 -0013 0345 0270 0062
55
APPENDIX B
RECOMMENDED SAFETY PERFORMANCE FUNCTION MODELS
Table B-1 Recommended Urban SPFs Site Virginia SPF Models to Be Used for Urban Intersections
Urban 4-Leg Signalized Total Virginia generic total
Urban 4-Leg Signalized
Operational Region 1 generic total
Urban 4-Leg Signalized
Operational Region 10
use specified model developed
Urban 4-Leg Signalized
Operational Region 100 generic total
Urban 4-Leg Signalized FI Virginia generic FI
Urban 4-Leg Signalized
Operational Region 1 generic FI
Urban 4-Leg Signalized
Operational Region 10
use specified model developed
Urban 4-Leg Signalized
Operational Region 100
use specified model developed
Urban 4-Leg Minor Stop Control
Total Virginia generic total
Urban 4-Leg Minor Stop Control
Operational Region 1
use specified model developed
Urban 4-Leg Minor Stop Control
Operational Region 10
use specified model developed
Urban 4-Leg Minor Stop Control
Operational Region 100
use specified model developed
Urban 4-Leg Minor Stop Control
FI Virginia generic FI e^-76917MajADT^05001MinADT^03695
Urban 4-Leg Minor Stop Control
Operational Region 1
use specified model developed
Urban 4-Leg Minor Stop Control
Operational Region 10
use specified model developed
Urban 4-Leg Minor Stop Control
Operational Region 100
use specified model developed
56
Table B-1 Recommended Urban SPFs (Continued)
Site Virginia SPF Models to Be Used for Urban Intersections
Urban 3-Leg Signalized
Total Virginia
use generic model developed for total
crashes
Urban 3-Leg Signalized
Operational Region 1
use generic model developed for total
crashes
Urban 3-Leg Signalized
Operational Region 10
use specific regional model
developed
Urban 3-Leg Signalized
Operational Region 100
use generic model developed for total
crashes
Urban 3-Leg Signalized FI Virginia
use generic model developed for FI
crashes
Urban 3-Leg Signalized
Operational Region 1
use generic model developed for FI
crashes
Urban 3-Leg Signalized
Operational Region 10
use specific regional model
developed
Urban 3-Leg Signalized
Operational Region 100
use generic model developed for FI
crashes
Urban 3-Leg Minor Stop Control
Total Virginia
use generic model developed for total
crashes
Urban 3-Leg Minor Stop Control
Operational Region 1
use generic model developed for total
crashes
Urban 3-Leg Minor Stop Control
Operational Region 10
use specific regional model
developed
Urban 3-Leg Minor Stop Control
Operational Region 100
use generic model developed for total
crashes
Urban 3-Leg Minor Stop Control
FI Virginia use generic model developed for FI
crashes
Urban 3-Leg Minor Stop Control
Operational Region 1
use generic model developed for FI
crashes
Urban 3-Leg Minor Stop Control
Operational Region 10
use specific regional model
developed
Urban 3-Leg Minor Stop Control
Operational Region 100
use generic model developed for FI
crashes
57
Table B-2 Recommended Rural SPFs Site Virginia SPF Models to Be Used for Rural Intersections
Rural 4-Leg Signalized Total Virginia
use generic model developed for total
crashes
Rural 4-Leg Signalized
Operational Region 1
use generic model developed for total
crashes
Rural 4-Leg Signalized
Operational Region 10
use specific regional model developed
Rural 4-Leg Signalized
Operational Region 100
use specific regional model developed
Rural 4-Leg Signalized FI Virginia use generic model
developed for FI crashes
Rural 4-Leg Signalized
Operational Region 1
use generic model developed for FI crashes
Rural 4-Leg Signalized
Operational Region 10
use specific regional model developed
Rural 4-Leg Signalized
Operational Region 100
use specific regional model developed
Rural 4-Leg Minor Stop Control Total Virginia
use generic model developed for total
crashes
Rural 4-Leg Minor Stop Control
Operational Region 1
use generic model developed for total
crashes e^-549MajADT^035MinADT^039
Rural 4-Leg Minor Stop Control
Operational Region 10
use specific regional model developed
Rural 4-Leg Minor Stop Control
Operational Region 100
use generic model developed for total
crashes
Rural 4-Leg Minor Stop Control FI Virginia use generic model
developed for FI crashes
Rural 4-Leg Minor Stop Control
Operational Region 1
use generic model developed for FI crashes
Rural 4-Leg Minor Stop Control
Operational Region 10
use generic model developed for FI crashes
Rural 4-Leg Minor Stop Control
Operational Region 100
use generic model developed for FI crashes
58
Table B-2 Recommended Rural SPFs (Continued)
Site Virginia SPF Models to Be Used for Rural Intersections
Rural 3-Leg Signalized Total Virginia use generic model
developed for total crashes
Rural 3-Leg Signalized
Operational Region 1
use generic model developed for total crashes
Rural 3-Leg Signalized
Operational Region 10
use generic model developed for total crashes
Rural 3-Leg Signalized
Operational Region 100
use generic model developed for total crashes
Rural 3-Leg Signalized FI Virginia use generic model
developed for FI crashes
Rural 3-Leg Signalized
Operational Region 1
use generic model developed for FI crashes
Rural 3-Leg Signalized
Operational Region 10
use generic model developed for FI crashes
Rural 3-Leg Signalized
Operational Region 100
use generic model developed for FI crashes
Rural 3-Leg Minor Stop Control Total Virginia use generic model
developed for total crashes
Rural 3-Leg Minor Stop Control
Operational Region 1
use generic model developed for total crashes
Rural 3-Leg Minor Stop Control
Operational Region 10
use specific regional model developed
Rural 3-Leg Minor Stop Control
Operational Region 100
use generic model developed for total crashes
Rural 3-Leg Minor Stop Control FI Virginia use generic model
developed for FI crashes
Rural 3-Leg Minor Stop Control
Operational Region 1
use generic model developed for FI crashes
Rural 3-Leg Minor Stop Control
Operational Region 10
use specific regional model developed
Rural 3-Leg Minor Stop Control
Operational Region 100
use generic model developed for FI crashes

11
n2 = validation data sample size 30 n1 = estimation data sample size 70
(Eq 10) where
_
1Y = average of observed crashes per intersections _
2Y = average of predicted crashes per intersections Yi1 = observed values at intersection i Y i2 = predicted values at intersection i
It should be noted that when values obtained from the MPB MAD MSE and MSPE
formulas are close to 0 it indicates a good fit or desirable SPF and when values for the RFT2 and
R2 formulas are close to 1 it indicates a suitable fit The dispersion parameter (d) is used in the variance-mean relationships as shown in Equations 11 and 12
(Eq 11)
( ) ( ) ( )i i i i i iVar Y X E Y X d x E Y X= + (Eq 12) A weighting factor (Wi) used in the EB procedure is obtained from Equation 13 and used in Equation 14 to obtain the EB-estimated value
( )1
1ii i
Wd x E Y X
=+
(Eq 13)
( ) ( ) ( )1EB i i i i i i iE E y y W x E Y X W x Y= + minus (Eq 14)
where 0 lt W lt 1 Var (|) = conditional variance E (|) = conditional mean Var m or Var (Yi|Xi) = estimated variance of mean crash rate E m or E (Yi|Xi) = estimated mean crash rate from SPF d = estimated NB dispersion parameter (also called overdispersion parameter)
2Var m E m d x E m= +
( )( )( ) ( )
1 1 2 21 22 2
1 21 2
i i
i i
Y Y Y Yr
Y Y x Y Y
sum minus minus=⎡ ⎤sum minus sum minus⎢ ⎥⎣ ⎦
12
W = weight Xi = variables such as AADT Yi = number of observed crashes per year at intersection i EEB = EB-adjusted estimated crashes (crashesyr)
In the variance-mean relationship if the value obtained for the dispersion parameter d is 0 then the variance is the same as the mean (see Equations 11 and 12) which causes the NB model to collapse to the Poisson model This parameter has a strong influence on the weight in the EB formula (see Eq 13) therefore it has an effect in the EB-estimated value SAS was helpful in computing this parameter for the different types of intersections analyzed in the study throughout the 5 years
Pruning Process
Before the site prioritization was performed pruning was done to avoid over-representation of the SPFs that might not reflect much difference in the study when compared with statewide SPFs At the completion of the pruning process only the necessary or minimum effective SPFs were retained MSPE is typically the parameter used to assess errors associated with a validation data set for this reason MSPE was used for pruning In order to verify whether a specific regional SPF should be retained or not the validation data set (30 of the data) was used to compute MSPE for both the specific regional SPFs and the corresponding statewide SPFs If MSPE for the regional SPF was greater than that for the corresponding Virginia statewide SPF or if the difference between these two MSPEs was less than 10 it was concluded that the regional SPF was not necessary and it was therefore discarded The following example illustrates the steps for urban four-leg signalized FI crashes in Region 1
1 The 30 FI crash data were obtained for urban signalized four-leg intersections in Region 1 and the MSPE was determined using the statewide SPF for the FI urban four-leg signalized intersections
2 The 30 FI crash data for urban signalized four-leg intersections in Region 1 were
then used to determine MSPE for the specific Region 1 SPF for FI crashes 3 Verify if the MSPE value for the specific regional SPF is higher than the statewide
MSPE value if yes discard the specific regional SPF if no tentatively retain the specific regional model
4 The difference between the two MSPEs was determined to determine whether it was
less than 10 of the statewide MSPE if yes discard the specific regional SPF if no retain the specific regional model This process was repeated for all regional SPFs
13
Identification of Intersections with a Higher Than Expected Number of Crashes
In order to identify some of the intersections with a higher than expected number of crashes a prioritization analysis based on the EB method was conducted This analysis was carried out to identify the top 25 intersections with a high PSI in the urban areas of the Northern Virginia and Bristol districts These two districts were selected to identify any effect of the approach AADTs as two-lane roads in the Northern Virginia District carry much higher volumes than those in the Bristol District The PSI is the difference between the EB-adjusted long-term crashes and the SPF-estimated crashes The PSI was first determined and then a priority list was developed with intersections showing a higher PSI receiving a higher priority This procedure first required the computation of yearly calibration factors (Cy) that accounted for intrinsic yearly variations that were not accounted for in developing the SPFs These yearly calibration factors were determined using the steps described here and given in Equations 15 through 18 (ITT Corporation 2008) Calculation of Yearly Calibration Factor (Cy) For subtype s and severity t the following steps were performed 1 Calculate the (unadjusted) predicted number of crashes using the appropriate SPF yiMinAADTMajAADTe ststst
isyisyisty amp~ 21ˆˆˆ foralltimestimes= ββακ (Eq 15)
2 Sum the predicted numbers over all intersections
ysN
iistysty forall=sum
=
~~1κκ (Eq 16)
3 Sum the observed numbers of crashes over all intersections
yKKsN
iistysty forall=sum
=
1
(Eq 17)
4 Calculate yearly calibration factor csty
yK
csty
stysty forall= ~κ (Eq 18)
5 Repeat the steps for all subtypes (s) and severities (t)
where i = intersection index (i = 1hellip N)
14
s = subtype index (s = urban four-leg signalized intersection rural three-leg minor stop controlled intersection etc) t = severity index (t = TOT [total crashes] FI [fatal + injury crashes] PDO [property damage only]) y = year index (i = 1 [base year] 2 hellip Y) csty = yearly calibration factor for crash subtype s severity t and year y MajAADT = AADT on the major road (vehday) MinAADT = AADT on the minor road (vehday)
istyκ~ = (unadjusted) predicted number of crashes at intersection i for crash subtype s severity t and year y
istyκ = (adjusted) predicted number of crashes at intersection i for crash subtype s severity t and year y α = intercept
1β = coefficient of major AADT 2β = coefficient of minor AADT
These yearly calibration factors were then used to determine the predicted number of
crashes at an intersection based on the SPF for the severity of crashes and type of intersection being considered The PSI for each intersection was then determined using the steps described in Equations 19 through 22 (ITT Corporation 2008) Steps for Calculating PSI for Subtype s
1 Calculate the (adjusted) predicted number of crashes
amp~
21ˆˆˆ ststst
isyisysty
istystyisty
MinAADTMajAADTec
yticββα
κκ
timestimestimes=
foralltimes= (Eq 19)
2 Calculate yearly correction factor Cisty
ytiCyist
istyisty amp
)1(
forall==κ
κ
(Eq 20)
3 Calculate EB weight
tid
w Y
y istystist amp
11
1
foralltimes+
=sum =
κ (Eq 21)
4 Calculate the EB-adjusted estimated number of crashes for year 1
15
tiC
KwwX Y
y isty
Y
y istyistyististyist amp)1(
1
1)1()1( forallminus+times=
sumsum
=
=== κ (Eq 22)
5 Determine the PSI for each intersection If istYX gt istYκ include intersection i in the list for prioritization using istYPSI = istYX
where i = intersection index (i = 1hellip N) s = subtype index (s = urban four-leg signalized intersection rural three-leg minor stop
controlled intersection etc) t = severity index (t = TOT [total crashes] FI [fatal + injury crashes] PDO [property damage
only]) y = year index (y = 1 [base year] 2 hellip Y) cy = yearly calibration factor for crash subtype s severity t and year y d = dispersion parameter w = weight MajAADT = AADT on the major road (vehday) MinAADT = AADT on the minor road (vehday) PSI = potential for safety improvement
istyC = yearly correction factor
istyκ~ = (unadjusted) predicted number of crashes at intersection i for crash subtype s severity t and year y
istyκ = (adjusted) predicted number of crashes at intersection i for crash subtype s severity t and year y
istyX = EB-adjusted estimated number of crashes α = intercept
1β = coefficient of major AADT 2β = coefficient of minor AADT
The prioritization lists for urban two-lane roads in the Northern Virginia and Bristol
districts were then developed based on the PSIs obtained for three prioritization procedures These alternative prioritization procedures were the average crash rates (ACRs) for the study period (see Equation 23) the critical crash ratio (CCR) (see Eqs 24 through 27) (Garber and Hoel 2009) and the EB method The list was developed with the intersections having the highest PSI listed first followed by other intersections in descending order The execution of the EB method prioritization process was achieved through use of the computer codes in SAS Finally the effectiveness of using the EB method for prioritizing sites for safety improvement was illustrated by comparing the PSIs from using intersection crash rates critical crash and the EB procedures
16
Procedure for Crash Rate Method The ACR for the intersection is given as
( )(1000000)( )( )(365)T
TCACRN V
= (Eq 23)
where ACR = the average crash rate for the intersection under consideration (crashes1000000
approach volume) TC = number of crashes over the study period at the intersection N = duration of study period (yr) VT = average daily total approach volume at the intersection Procedure for Critical Rate Method
The critical rate method was accomplished by first computing the traffic base (TB) of the intersection under consideration using Equation 24 The ACR for the intersection under consideration is then computed using its TB as shown in Equation 25 The intersection critical crash rate (ICCR) is then determined using Equation 26 The critical crash ratio (CCR) for the intersection is then computed as the ratio of ICR and the average crash rate (AVR) for all intersections under the same category (intersection type urbanrural etc) as that for the intersection being considered using Equation 27 TB is given as
365
1 000 000
NxVxTB = (Eq 24)
where TB = the total approach volume over the study period of N years at the intersection under consideration (veh1000000) V = average daily approach volume at the intersection under consideration ACR is obtained as
TCACRTB
= (Eq 25)
where ACR = ACR at the intersection under consideration over the study period of N years
17
TB = the total approach volume over the study period of N years at the intersection under consideration (veh1000000) The critical crash rate (ICCR) for the intersection under consideration is given as
05 AVRICCR AVR TFTB TB
= + + (Eq 26)
where AVR = ACR for intersections within the state and of the same designation (eg rural three-leg with minor stop control) as that for the intersection under consideration TF = number of standard deviations for the confidence level being used in the analysis (usually 196 for 95 confidence level) TB = the total approach volume over the study period of N years at the intersection under consideration (veh1000000) The critical crash ratio (CCR) for the intersection is then obtained as
ACRCCRICCR
= (Eq 27)
where ACR = ACR at the intersection under consideration over the study period of N years (see Eq 2) ICCR = critical crash rate for the intersection under consideration (see Eq 26)
Benefits and Implementation Expectations
The expected benefits from developing SPFs and prioritizing intersection sites were illustrated by comparing the PSIs for the prioritized sites when sites were prioritized using the EB method with those obtained when sites were prioritized using crash rates and the critical crash ratio This analysis was conducted for the combined fatal plus injury crashes SPFs An estimate of the cost savings attributable solely to the potential reduction of crashes was also computed by using crash costs given in an FHWA study (FHWA 2005)
18
RESULTS AND DISCUSSION
Literature Review
SafetyAnalyst
The SafetyAnalyst Userrsquos Manual (ITT Corporation 2008) has SPFs that are suggested for intersections that are based on Minnesota data Tables 7 and 8 show the regression coefficients (α β1 and β2) for the SPFs developed for total and combined FI crashes respectively The values for the goodness of fit parameter RFT
2 are also given Although these RFT2 are all less
than 045 with a few less than 010 it has been suggested that the SPFs used in SafetyAnalyst could provide a realistic estimate of an expected crash frequency as a function of traffic volume and roadway geometry (Pham and Ragland 2005)
Methodological and Research References
Several studies similar to this study have been conducted in Canada Colorado California Texas New York and Minnesota For example a study was conducted using data from Colorado California and Texas to examine the functional form of the SPFs for urban freeways (Kononov et al 2008) Five years of crash data were acquired from the respective departments of transportation and the highway safety information system from Colorado The study revealed that the amount of crashes increased moderately with congestion in segments on urban freeways This study however did not include intersections
A study by Lyon et al was conducted in Toronto Ontario Canada to develop SPFs for urban signalized intersections (Lyon et al 2005) Collision data were gathered for five years and included 1950 urban intersections SPFs were developed for different severity levels impact types and intersection types such as four-leg and three-leg intersections The format used to develop the SPFs is shown in Equation 28 This format is somewhat different from that of Equation 4 suggested in Safety Analyst
Collisionsyear = α (F1)β1(F2)β2 exp (β3X1 + β4X2 + ) (Eq 28) where α and βi = the coefficients estimated in the SPF calibration process F1 and F2 = the entering AADTs on the major and minor roads respectively Xi = other independent variables (such as single lane versus multilane approaches with and without left-turn lanes or right-turn lanes high and low pedestrian activities or in some cases F1 or F2 or both)
19
Table 7 SafetyAnalystrsquos SPFs for Intersections (Total Crashes) Site
subtype Code
Site subtype Description
State Regression coefficients
LogIntercept (α)
Regression coefficients
LogAADTmaj (β1)
Regression coefficients LogAADT
min (β2)
Over - dispersion Parameter
(k)
RFT2
() Number of Sites
Max AADTmaj
(vehday)
Max AADTmin
(vehday)
Rural 201 Rural 3-leg with minor-
road STOP control MN -878 071 024 107 133 1706 28500 27000
202 Rural 3-leg with all-way STOP control
MN -1237 122 027 047 41 41 25300 6803
203 Rural 3-leg with signal control
MN -657 066 02 033 26 136 36400 11500
204 Rural 4-leg with minor-road STOP control
MN -896 065 047 07 299 2114 35500 26700
205 Rural 4-leg with all-way STOP control
MN -1237 122 027 047 41 41 25300 6803
206 Rural 4-leg with signal control
MN -657 066 02 033 26 136 36400 11500
Urban 251 Urban 3-leg with minor-
road STOP control MN -535 034 028 128 59 397 68000 18900
252 Urban 3-leg with all-way STOP control
MN -1237 122 027 047 41 41 25300 6803
253 Urban 3-leg with signal control
MN -985 097 018 023 414 33 50000 25807
254 Urban 4-leg with minor-road STOP control
MN -312 027 016 086 76 333 58870 81000
255 Urban 4-leg with all-way STOP control
MN -1237 122 027 047 41 41 25300 6803
256 Urban 4-leg with signal control
MN -347 042 014 032 264 418 75000 81000
ITT Corporation 2008
20
Table 8 SafetyAnalystrsquos SPFs for Intersections (Fatal and Injury Crashes) Site
subtype Code
Site subtype Description
State Regression coefficients
LogIntercept (α)
Regression coefficients
LogAADTmaj (β1)
Regression coefficients LogAADT
min (β2)
Over - dispersion Parameter
(k)
RFT2
() No of Sites
Max AADTmaj
(vehday)
Max AADTmin
(vehday)
Rural 201 Rural 3-leg with minor-
road STOP control MN -935 071 021 123 91 1706 28500 27000
202 Rural 3-leg with all-way STOP control
MN -1002 127 -022 089 248 41 25300 6803
203 Rural 3-leg with signal control
MN -783 075 014 05 215 136 36400 11500
204 Rural 4-leg with minor-road STOP control
MN -936 066 04 0 146 2114 35500 26700
205 Rural 4-leg with all-way STOP control
MN -1002 127 -022 089 248 41 25300 6803
206 Rural 4-leg with signal control
MN -783 075 014 05 215 136 36400 11500
Urban 251 Urban 3-leg with minor-
road STOP control MN -845 049 039 123 81 397 68000 18900
252 Urban 3-leg with all-way STOP control
MN -1002 127 -022 089 248 41 25300 6803
253 Urban 3-leg with signal control
MN -1022 091 021 027 362 33 50000 25807
254 Urban 4-leg with minor-road STOP control
MN -435 029 019 099 57 333 58870 81000
255 Urban 4-leg with all-way STOP control
MN -1002 127 -022 089 248 41 25300 6803
256 Urban 4-leg with signal control
MN -511 049 016 03 295 418 75000 81000
ITT Corporation 2008
21
The study examined the impact of two left turn priority treatments which were flashing advanced green (FAG) and left turn green arrow (LTGA) on left turn collisions These treatments were implemented at 35 intersections in the city of Toronto Two types of collisions were investigated left turns with and without side impact The results indicated that there was an insignificant difference in the impact of the left turn priority treatments on both types of crashes
Lord and Persaud (2003) conducted a study that related SPFs to transportation planning models They noted that traffic safety is not usually accounted for when agencies are conducting a planning analysis to remodel build upgrade or modify their facilities Five-year intersection data from Canada were used Models were developed and statistical measures such as the over dispersion parameter were calculated and conclusions were made from the results The SPFs developed for the study were applied to two sample networks created with the help of a transportation planning software package The research showed that it is possible to make estimation for traffic safety at the planning stage of a project This will allow users to take safety into consideration when designing and possibly create alternatives to change existing designs for more comprehensive projects or development The study also indicated that there are limitations when applying the SPFs to computerized transportation networks The study concluded that although it is possible to predict or estimate crashes on digital transportation networks the accuracy of prediction relies greatly on how precise the traffic flow estimates are
Jonsson et al (2007) performed an SPF study that took into consideration the type and severity of crashes andmdashmost importantmdashthe causal factors for these crashes The study was conducted for intersections on rural four-lane highways in the state of California Four collision types were tested in the study opposite-direction same-direction intersecting-direction and single-vehicle crashes In addition a set of data from the state of New York was used with the same parameters to analyze the severity distribution of crash types The data for California included 1084 intersections on four-lane rural highways and that from New York included 675 intersections mainly stop controlled or without any control Generalized linear modeling was performed with the data after quality analysis Two model forms were estimated with the variables seen in Equations 29 and 30
(Eq 29)
(Eq 30)
where NAcc = predicted number of crashesyr at intersections AADTmajor = AADT on major road AADTminor= AADT traffic flow on minor road Βi = model parameters Xi = variables that describe the intersections (such as terrain lighting left turn number of though lanes and divided or undivided among others)
nn xxxormajorAcc exAADTxAADTN ββββββ ++++=
min4433021
nn xxxormajorAcc exAADTAADTN βββββ +++++=
min332201)(
22
The two different models are different representations of the traffic flow The first represents the AADT of major and minor roads as separate variables but in the second model they are represented as one variable by the sum of the major and minor roads AADTs Results showed that the first model performed better for the multiple-vehicle crashes and the second model fitted better for the single-vehicle crashes In addition the appropriate predictor variables differed depending on the crash type This study is also of interest as it incorporated additional parameters to those in the suggested SPFs now included in SafetyAnalyst and therefore could lead to possible future SPF research for the state of Virginia
Persaud and Nguyen (1998) conducted a study on signalized intersections in Ontario Canada They developed aggregate and disaggregate models to estimate safety performance of three- and four-leg intersections in which crash severity (injury and PDO) environmental class (semi-urban and rural) and time period (daily weekday morning peak and weekday afternoon peak) were considered in the analysis An important aspect of that study is that it supplemented the existing models used for estimating SPFs instead of replacing them because it took into consideration features that were generally not considered in the then existing developed models Two model levels were considered for the study Level 1 was based on the sum of AADTs for all approaches with separate estimates for rear-end right angle and turning movement crashes At this level the equations were adjusted for three- and four-leg intersections by crash severity for all combined impact types and also separately for the three major impact types which were angle rear-end and turning movement In addition models were further separated by time period (daily weekday morning and afternoon peak) and for four-leg intersections which were also classified by environment class such as semi-urban and rural Level 2 allowed estimates to be obtained for specific crash patterns that were defined by movements of the vehicles involved before collision and the same were estimated as a function of the flows that were relevant to each of the patterns For this level models were estimated for four-leg intersections for 12 multi-vehicle and three single-vehicle patterns that were described by the movements of involved vehicles before collision The developed models were intended to estimate the parameters P and d shown in Equations 31 and 33
The safety of the intersection was estimated using the long-term mean based on the EB approach The long term mean (m) was obtained by combining crash count (x) of an intersection in the most recent years (n) with the estimates of the expected annual number of crashes (P) as shown in Equation 31 W1 and W2 in Equations 31 through 33 represent the weights estimated from the mean and variance of the regression estimates
(Eq 31)
(Eq 32)
(Eq 33)
m =W1(x) +W2(P)
2dW
d nP=
+
1PW
d nP=
+
23
(Eq 34)
To estimate the variance of m the following formula was used
(Eq 35)
In Equations 32 through 35 P and d represent the fundamental parameters Two models were selected for SPFs For Level 1 and single-vehicle Level 2 (Eq 36) For multi-vehicle in Level 2 (Eq 37) where P = expected number of crashes of a given type α and β = regression parameters to be estimated S (Level 1) = sum of all entering flows for a given time period for Level 1 analysis S (Level 2) = sum of the daily through right or left turn flows for a given time period for Level 2 (single-vehicle) analysis S1 and S2 = AADTs for small and large flows for a specific crash pattern in Level 2 (multi-vehicle) analysis
The models in either level can be used in the EB procedure to provide estimates for intersections that need to be treated or for the evaluation of the effectiveness of safety countermeasures It should be noted that the quality of the estimates for the study was strongly related to how the parameters were selected and used in the SPFs and unlike other available road models the ones presented in this study can be separated by time period and crash pattern Persaud et al (2002) conducted a study to demonstrate the complexity involved in the calibration of crash prediction models or SPFs for urban intersections Toronto data for three- and four-leg signalized intersections were used to estimate the models for the study The performance of these models was then compared with other models from Vancouver and California The models from these places were recalibrated to fit Toronto by using the Interactive Highway Safety Design Model (IHSDM) and a calibration procedure as proposed by Harwood et al (2000) The results varied significantly and were also mixed The study noted that the calibration of models is not a simple task and due to the importance of the SPFs they must be properly calibrated Several things must be accounted for when performing this procedure in order to obtain good quality data analysis The first thing is to extract a large sample of high quality data A software or program to link all the traffic crash and road characteristics data must exist because the same is usually kept stored in different databases In addition several
2Pd
Var P=
2( )
d xVar m dnP
+=
+
P =αSβ
P =αS1β1 S2
β 2
24
years of crash data must be obtained in order to have a good amount of samples that account for variations The actual process of model calibration is complicated therefore careful attention must be paid when analyzing the same because of the importance of the outcomes of the study The authors of the study made an exploratory analysis and it revealed that the relationship between the crashes and each covariate should be described either by the power function or the gamma function for all intersection types to be analyzed Equations 38 through 40 are the selected model forms used in the study F1 = Power F2 = Gamma (Eq 38) F1 = Gamma F2 = Power (Eq 39) F1 = Power F2 = Power (Eq 40) where E (K) = expected annual number of crashes between 1990 and 1995 F1 F2 = average entering AADT of major and minor roads respectively for the period 1990 to 1995 α β1 β2 β3 β4 = coefficients to be estimated
An NB structure was used to analyze the models and the overdispersion parameter (γ) was analyzed using Equation 41
γ=
2)K(E)K(Var (Eq 41)
Variance increases as γ decreases therefore the value of γ can also be used to make a comparison for the goodness of fit of several models fitted to the same data The larger the value of γ the smaller the variance therefore a more accurate model is given The authors suggest that γ would be enough to calculate the goodness of fit index of any SPF but if one desires to know how accurate the prediction estimate is other measures should also be computed The authors suggested using R2
α as proposed by Miaou et al (1996) which is a dispersion parameter based R2 computed as shown in Equation 42
γγ
minus=αmin2 1R (Eq 42)
where γ = overdispersion parameter for calibrated model γmin = smallest possible overdispersion parameter
The authors suggested that a disaggregation by traffic volume is preferable than using
only a single calibration factor for that is what the IHSDM currently has A recommendation is made to account for safety variation in traffic conditions over time by calibrating the models every two to three years as suggested by Harwood et al (2000)
E(K) =αF1β1 F2
β 2e(β 3F2 )
E(K) =αF1β1 F2
β 2e(β 4 F1 )
E(K) =αF1β1 F2
β 2
25
The Illinois Department of Transportation and the University of Illinois Urbana-Champaign conducted a research study to develop and implement SPFs for road segments and intersections in Illinois (Tegge et al 2010) These SPFs were developed in a way suitable for easy implementation in SafetyAnalyst The crash data (number of crashes and crash severity) and roadway data (number of lanes traffic volume area type and functional class) were collected and used for development of the SPFs Seventeen peer groups were used for developing the SPFs for segments and eight for intersections The intersections peer groups were minor leg stop control all-way stop control signalized and undetermined for rural and urban segments separately The SPFs for segments were developed using NB distribution for crashes and Poisson distribution for intersections The SAS GENMOD procedure was used to develop the SPFs for a five-year analysis period from 2001 to 2005 The model form for the intersection SPFs is the same as that given in the SafetyAnalyst Userrsquos Manual The SPFs were also developed for different crash severities such as fatal crashes type A injury crashes type B injury crashes and fatal plus injury crashes The EB method was used to determine the sites with the higher PSIs Two analysis techniques were used to obtain the PSIs The first considered segments and intersections as individual elements and the second used the sliding window approach The site specific analysis treated each individual segment and intersection as a separate entity Each segment is then compared with every other segment instead of having them grouped together The sliding window approach defined a set length The window lengths were 025 mile and 1 mile for urban and rural segments respectively
The largest impact on crash frequency was found to be the AADT and was therefore the only variable modeled as a logarithm (lnAADT) By doing this the AADT accounted for most of the prediction whereas the rest of the variables refined the prediction further Other variables used included access control functional class lane width surface type area type speed limit and median type The study recommended that a multivariate analysis be conducted for such studies to show how certain variables could contribute to the crashes Other variables could include roadway lighting weather and pavement conditions and roadway geometry The study also concluded that knowledge of roadway characteristics that increase the risk of fatal or injury crashes will facilitate the setting up of safety criteria that can help engineers in the designing of safer roadways Further knowledge of driver behaviors that lead to fatal and severe injury crashes can facilitate the training of enforcement officers to identify these behaviors
The Colorado Department of Transportation (CDOT) (2009) conducted a study to develop SPFs for intersections in the state Their model form is the same as that in SafetyAnalyst The SPFs were developed for many categories based on the number of legs divided undivided rural and urban including urban four-lane divided signalized six-lane divided signalized urban three-leg signalized two-lane undivided unsignalized and urban three-leg unsignalized When a median or left-turn lane is present a roadway is considered divided The sites selected for the study reflected variability in traffic volume and geometry in order to have a diverse representation of intersections throughout the state SPFs were developed for total and for fatal plus injury crash types A five-year study period from 2000 through 2005 was used Crash and AADT data were collected for development of the SPFs CDOT used a NB error structure to develop the SPFs and the EB procedure to estimate the expected safety performance of an intersection site for different safety management purposes Overdispersion parameters were computed and used as a goodness of fit measure According to their data
26
overdispersion parameters indicated that their models provided a reasonable fit to the Colorado data
Results indicated that for signalized intersections roads with six lanes on major approaches have more collisions than those with four lanes on major approaches CDOT recommended that the SPFs should be recalibrated in the future using data from future years as crash frequencies may change over time because of a variety of issues The report also recommended that separate calibration factors should be developed for different regions and different topographies Research in Virginia
In Virginia two other similar studies have recently been published One by Garber et al (2010) for two-lane roads and another by Hamidi et al (2010) to identify high-crash sections on Virginiarsquos primary system by developing a planning-level methodology The study by Garber et al developed SPFs for two-lane segments of 1 mile or less and the study by Hamidi et al developed SPFs for longer segments of two-lane roads that can be used for corridor analysis
Evaluation of the Recommended Minnesota SPFs
Figures 3 through 6 show representative graphs that were used to visually examine how well the Virginia data fitted the suggested Minnesota SPFs Figures 3 and 4 are for urban four-leg signalized intersections and Figures 5 and 6 are for rural four-leg signalized intersections These graphs suggest that the Minnesota SPFs do not fully represent the Virginia data Tables 9 through 12 show the Freeman-Tukey R2
FT coefficients computed for the different Minnesota SPFs using the Virginia data The low Freeman-Tukey R2
FT coefficients obtained and the visual inspection of the graphs suggested that a better fit to the Virginia data could be obtained by developing specific Virginia SPFs using Virginia data It was therefore decided to develop specific SPFs for Virginia
0
2
4
6
8
10
12
14
0 20000 40000 60000 80000 100000 120000
AADT Major
Tota
l Cra
shes
Per
Yea
r
Minnesota VA Actual Observed
Minnesota Model
Figure 3 Total crashes per year vs major AADT for urban 4-leg signalized intersections
with minor AADT of 700
27
0
5
10
15
20
25
30
35
0 20000 40000 60000 80000 100000 120000
AADT Major
Tota
l Cra
shes
per
Yea
r
Minnesota VA Actual Observed
Minnesota Model
Figure 4 Total crashes per year vs major AADT for urban 4-leg signalized intersections
with minor AADT of 4500
0
2
4
6
8
10
12
14
0 20000 40000 60000 80000 100000 120000
AADT Major
Tota
l Cra
shes
Per
Yea
r
Minnesota VA Actual Observed
Minnesota Model
Figure 5 Total crashes per year vs major AADT for rural 4-leg signalized intersections with
minor AADT of 795
28
0
2
4
6
8
10
12
14
16
18
0 20000 40000 60000 80000 100000 120000
AADT Major
Tota
l Cra
shes
per
Yea
r
Minnesota VA Actual Observed
Minnesota Model
Figure 6 Total crashes per year vs major AADT for rural 4-leg signalized intersections with
minor AADT of 5000
Table 9 Minnesota SPFs for Urban FI Crashes and Corresponding R2FT Based
on Virginia Data
Intersection Type
Minnesota FI SPFs R2
FT Based on Virginia Urban FI Crash Data ()
Urban 4-Leg Signalized 032
Urban 4-Leg Minor Stop Control 008
Urban 3-Leg Signalized 026
Urban 3-LegMinor Stop Control 01
Table 10 Minnesota SPFs for Urban TOTAL crashes and Corresponding R2
FT Based on Virginia Data
Type of Intersection
Minnesota SPFs
R2FT Based on Virginia Urban Total
Crash Data ()
Urban 4-Leg Signalized 034
Urban 4-Leg Minor Stop Control 022
Urban 3-Leg Signalized 031
Urban 3-Leg Minor Stop Control 01
29
Table 11 Minnesota SPFs for Rural TOTAL Crashes and Corresponding R2FT
Based on Virginia Data
Type of Intersection
Minnesota SPFs R2
FT Based on Virginia Rural Total Crash Data ()
Rural 4-Leg Signalized 029
Rural 4-Leg Minor Stop Control 013
Rural 3-Leg Signalized 029
Rural 3-Leg Minor Stop Control -010
Table 12 Minnesota SPFs for Rural FI Crashes and Corresponding R2FT Based
on Virginia Data
Type of Intersection
Minnesota SPFs R2
FT Based on Virginia Rural FI Crash Data ()
Rural 4-Leg Signalized 018
Rural 4-Leg Minor Stop Control 010
Rural 3-Leg Signalized 018
Rural 3-Leg Minor Stop Control 001
Development and Evaluation of Specific Virginia SPFs
In keeping with the suggestion given in the Safety Analyst Userrsquos Manual the model form used to develop the intersection SPFs is given in Equation 4 as
1 2k e x MajAADT x MinAADTβ βα=
where
k = predicted crash frequency per intersection per year MajAADT = AADT on the major road (vehday) MinAADT = AADT on the minor road (vehday) α = intercept β1 = coefficient of mayor AADT β2 = coefficient of minor AADT
30
The statewide SPFs developed for Virginia are given in Tables 13 through 16 Due to lack of data the analysis for all-way stop intersections could not be undertaken These tables also give the Freeman-Tukey R2
FT coefficient for each of the Virginia SPFs and the corresponding Minnesota SPF and Freeman-Tukey R2
FT based on the Virginia data The R2FT coefficients
obtained indicate that the Virginia-specific SPFs fit the Virginia data better than the suggested Minnesota SPFs for all types of intersections and crash severity except those for FI crashes on urban three-leg signalized rural four-leg signalized and rural four-leg minor stop control intersections where the corresponding RFT
2 values are similar In Table 15 it can be seen that the Minnesota R2
FT value is negative for the rural three-leg minor stop control intersections The negative RFT
2 value is possible because these calculations were not performed on the same data points that were used to create the Minnesota SPFs (Miller 2009) Table 13 SPF Models for Urban TOTAL crashes and R2
FT results for Virginia Statewide (VDOT-maintained roads)
SPF model with TOTAL Crash values
R2FT TOTAL
Crash Data
Site Virginia Statewide Minnesota VA MN
Urban 4-Leg Signalized 056 034
Urban 4-Leg Minor Stop Control
032 022
Urban 3-Leg Signalized 037 031
Urban 3-Leg Minor Stop Control
023 010
Table 14 SPF Models for Urban FI crashes and R2
FT results for Virginia Statewide (VDOT-maintained roads)
SPF model with FI Crash values R2FT FI Crash Data ()
Site
Virginia Statewide Minnesota VA MN
Urban 4-Leg Signalized 041 032
Urban 4-Leg Minor Stop Control
019 008
Urban 3-Leg Signalized 026 026
Urban 3-Leg Minor Stop Control
013 010
31
Table 15 SPF Models for Rural TOTAL Crashes and R2FT Results for Virginia Statewide (VDOT-
maintained roads) SPF model with TOTAL Crash values R2
FT TOTAL Crash Data
Site
Virginia Statewide Minnesota VA MN
Rural 4-Leg Signalized 0321 0290
Rural 4-Leg Minor Stop Control
0167 0132
Rural 3-Leg Signalized 0305 0291
Rural 3-Leg Minor Stop Control
0104 -0102
Table 16 SPF Models for Rural FI crashes and R2
FT results for Virginia Statewide (VDOT-maintained roads) SPF model with FI Crash values R2
FT TOTAL Crash Data
Site
Virginia Statewide Minnesota VA MN
Rural 4-Leg Signalized 0181 0181
Rural 4-Leg Minor Stop Control
0098 0097
Rural 3-Leg Signalized 0170 0180
Rural 3-Leg Minor Stop Control
0048 0012
Figures 7 through 10 show visual representations of how well the Virginia SPFs fit the
Virginia data in comparison with the suggested Minnesota SPFs In general the Virginia SPFs tend to fit the Virginia data better than the Minnesota SPFs although both sets of SPFs tend to have similar fits at low volumes (AADTmajor lt 2000) except for the SPF for total crashes on urban four-leg signalized intersections shown in Figure 7 The primary reason the Minnesota SPFs do not fit the Virginia data as well as the Virginia SPFs may be the dissimilarities of the roadside environment and the characteristics of the different databases
32
0
2
4
6
8
10
12
14
0 20000 40000 60000 80000 100000 120000
AADT Major
Tota
l Cra
shes
Per
Yea
r
Minnesota VA Actual Observed Virginia
Minnesota Model
Virginia M odel
Figure 7 Total crashes per year vs major AADT for urban 4-leg signalized intersections
with minor AADT of 700
0
5
10
15
20
25
30
35
0 20000 40000 60000 80000 100000 120000
AADT Major
Tota
l Cra
shes
per
Yea
r
Minnesota VA Actual Observed Virginia
Minnesota Model
Virginia Model
Figure 8 Total crashes per year vs major AADT for urban 4-leg signalized intersections
with minor AADT of 8000
33
0
2
4
6
8
10
12
14
0 20000 40000 60000 80000 100000 120000
AADT Major
Tota
l Cra
shes
Per
Yea
r
Minnesota VA Actual Observed Virginia
Virginia Model
Minnesota Model
Figure 9 Total crashes per year vs major AADT for rural 4-leg signalized intersections with
minor AADT of 79
0
5
10
15
20
25
0 20000 40000 60000 80000 100000 120000
AADT Major
Tota
l Cra
shes
per
Yea
r
Minnesota VA Actual Observed Virginia
Minnesota Model
Virginia Model
Figure 10 Total crashes per year vs minor AADT for rural 4-leg signalized intersections with major AADT of 5000
As discussed in the Methodology section in addition to the statewide Virginia SPFs
specific SPFs were developed for each operational region to consider the different topographical characteristics that exist across Virginia The complete set of SPFs together with the associated p values for the regression coefficients are shown in Tables A-1 and A-2 of Appendix A All p values are less than 005 with most being less than 00001 except for some of the rural four-leg signalized intersections regional specific SPFs These p values indicate that the estimated coefficients are statistically significant at the 95 confidence level or better A possible reason
34
for higher p values for a small number of SPFs may be the sample size used for developing these SPFs
To test the transferability and fit of the Virginia statewide specific SPFs several
statistical parameters were determined for the 70 (estimation) data set and the 30 (validation) data set separately The corresponding values for each of these parameters were then compared The results are shown in Tables 17 and 18 for urban and rural intersections respectively The results for the regional SPFs are shown in Tables A-3 through A-8 of Appendix A The results indicate that the developed models are transferable to the 30 validation data set For example the MSE values for the 70 estimation data are similar to the MSPE values for the 30 validation data In addition the mean prediction bias MPB values for the 30 validation data are close to zero (-076 le MPB ge -0004) in Table 17 and (-0067 le MPB ge 00513) in Table 18
Table 17 Goodness of Fit Results for Urban Statewide SPFs
Data Estimation data 70 Validation Data 30 Subtype Site MSE r2 R2
FT MPB MAD MSPE R2FT
Total VA 41150 0529 0557 -0760 4329 38490 0575
Total MN
68636 0506 0336 -3145 5421 68156 0315
FI VA
7043 0385 0406 -0458 1938 7671 0475
Urban 4-Leg Signalized
FI MN 7702 0372 0324 -0316 2124 8981 0376
Total VA 2238 0315 0313 -0034 0897 2383 0292
Total MN 2510 0287 0215 0091 0982 2730 0182
FI VA 0530 0194 0193 -0004 0432 0533 0194
Urban 4-Leg Minor Stop Control
FI MN 0560 0182 0080 0128 0522 0577 0052
Total VA 24900 0375 0370 -0645 3519 27591 0369
Total MN 29322 0365 0308 -2238 3661 33079 0272
FI VA 4467 0275 0259 -0185 1527 4875 0262
Urban 3-Leg Signalized
FI MN 4528 0267 0261 -0294 1526 4937 0261
Total VA 1854 0254 0230 -0043 0893 2038 0239
Total MN 2388 0237 0104 -0541 0902 2600 0107
FI VA 0428 0151 0133 -0021 0431 0476 0157
Urban 3-Leg Minor Stop Control
FI MN 0478 0140 0097 -0184 0385 0537 0104
35
Table 18 Goodness of Fit Results for Rural Statewide SPFs
Data Estimation Data 70
Validation Data 30
Subtype Site MSE r2 R2FT MPB MAD MSPE R2
FT
Total VA 10990 0353 0321 0513 2210 10070 -0073
Total MN 12400 0339 0290 -0154 2071 8460 0035
FI VA 2350 0196 0181 0045 1189 2600 -0034
Rural 4-Leg Signalized
FI MN 2400 0188 0181 -0043 1164 2420 0004
Total VA 1090 0182 0167 -0067 0794 1190 0171
Total MN 1190 0167 0132 -0348 0774 1320 0115
FI VA 0480 0112 0098 -0022 0504 0530 0110
Rural 4-Leg Minor Stop Control
FI MN 0500 0104 0097 -0158 0459 0560 0093
Total VA 5490 0328 0305 -0010 1651 5760 0179
Total MN NA NA NA NA NA NA NA
FI VA 1450 0181 0170 -0041 0902 1710 0099
Rural 3-Leg Signalized
FI MN NA NA NA NA NA NA NA
Total VA 0690 0144 0104 -0008 0613 0730 0102
Total MN 0890 0141 -0102 -0404 0555 0940 -0104
FI VA 0250 0071 0048 -0009 0345 0260 0048
Rural 3-Leg Minor Stop Control
FI MN 0270 0068 0012 -0144 0270 0290 0003
Pruning of Virginia-Specific SPFs A total of 64 SPFs were initially developed using the appropriate data for Virginia as shown in Tables A-1 and A-2 of Appendix A Considering that not all regional models might be necessary the pruning process described in the methodology section was carried out to prune the number of SPFs to the minimum effective number as seen in Tables 19 and 20 for urban and rural intersections respectively The pruning process resulted in 19 SPFs for urban sites and 15 for rural sites To facilitate the use of the correct SPF for a specific type of intersection located in a specific region the lists of the appropriate SPFs to be used are given in Tables B-1 and B-2 of Appendix B for the urban and rural intersections respectively
As can be seen in Tables 19 and 20 and Tables A-1 and A-2 of Appendix A there are some trends worth discussing for the benefit of the study and possible future research With regards to the three different operational regions the Western region retained many more of the specific regional urban SPFs than any other region For example the Western regional SPFs were retained for all urban intersection sites whereas for the Eastern region the only SPFs
36
retained were those for urban four-leg signalized FI crashes and urban four-leg minor stop control for total and FI crashes Similarly the only urban SPF retained for the Northern region was that for urban four-leg minor stop control for total crashes For the rural intersection sites all of the Western regional SPFs were retained except those for rural three-leg signalized total and FI crashes and rural four-leg minor stop control FI crashes The majority of the Eastern region rural SPFs were discarded except those for rural four-leg signalized total and FI crashes while for the Northern region all regional SPFs were discarded
The Western region retained more specific regional SPFs than the other two regions This suggests that the intersections in the Western region exhibit more unique characteristics than those for the other regions This may be due to the more mountainous terrain in the Western region compared to those in the Eastern and Northern regions This supports the philosophy of developing specific SPFs based on the topography of different regions
Site Prioritization
To illustrate the benefits of using the EB method to prioritize intersection sites for safety
improvements the top 25 urban sites from the Bristol and Northern Virginia districts were identified by using crash rates critical crash ratio and the EB method The PSI for each site identified was then determined The results obtained are shown in Tables 21 and 22 for the Bristol and the Northern Virginia districts respectively The results indicate that for the Northern Virginia District the PSIs for the top 25 sites are 258 1317 and 27440 crashes per year and for the Bristol District 432 646 and 1496 crashes per year for the crash rates critical crash ratio and EB methods respectively The important thing in Tables 21 and 22 is the sum of the PSI columns ranked by the three methods The sum of each of the PSIs for the crash rate and critical crash ratio method is lower than that for the EB method These results suggest that the use of the EB method in the planning process will identify intersection sites with the highest PSIs and therefore where detailed assessments to determine feasible and effective safety treatments should be undertaken
37
Table 19 MSPE Values for Virginia Urban Statewide and Urban Regional SPFs Used for Pruning
Data Pruning
Subtype
Site
MSPE [MSPEVA-
MSPEOR]1 [abs(MSPEVA-
MSPEOR)]2 [abs(MSPEVA-
MSPEOR)MSPEVA]3
RetainDiscardTotal VA 3849 Northern 4486 -637 637 0165497532 Discard Western 1791 2058 2058 0534684334 Retain Eastern 3745 104 104 0027020005 Discard FI VA 7671 Northern 95 -1829 1829 0238430452 Discard Western 517 2501 2501 0326033112 Retain
Urban 4-Leg Signalized
Eastern 541 2261 2261 0294746448 Retain Total VA 23834 Northern 202 03634 03634 015247126 Retain Western 105 13334 13334 0559452882 Retain Eastern 115 12334 12334 0517496014 Retain FI VA 05327 Northern 048 00527 00527 0098929979 Discard Western 033 02027 02027 0380514361 Retain
Urban 4-Leg Minor Stop Control
Eastern 036 01727 01727 0324197485 Retain Total VA 275911 Northern 2687 07211 07211 0026135239 Discard Western 2441 31811 31811 0115294425 Retain Eastern 3878 -111889 111889 0405525695 Discard FI VA 48754 Northern 448 03954 03954 0081101038 Discard Western 339 14854 14854 0304672437 Retain
Urban 3-Leg Signalized
Eastern 586 -09846 09846 020195266 Discard Total VA 20379 Northern 219 -01521 01521 0074635654 Discard Western 164 03979 03979 0195250012 Retain Eastern 223 -01921 01921 0094263703 Discard FI VA 04756 Northern 05 -00244 00244 0051303616 Discard Western 038 00956 00956 0201009251 Retain
Urban 3-Leg Minor Stop Control
Eastern 05 -00244 00244 0051303616 Discard 1 Difference between mean square prediction error (MSPE) of Virginia statewide model and OR model 2 Absolute value of the difference between Virginia statewide model MSPE and operational region model MSPE 3 Absolute value of the difference between Virginia statewide model MSPE and operational region model MSPE divided by the Virginia statewide MSPE for comparison
Retained SPFs Discarded if value is negative Discarded if less than 01
38
Table 20 MSPE Values for Virginia Rural Statewide and Rural Regional SPFs Used for Pruning Data Pruning
Subtype
Site
MSPE
[MSPEVA-MSPEOR]1
[abs(MSPEVA-MSPEOR)]2
[abs(MSPEVA-MSPEOR)MSPEVA]3
RetainDiscard
Total VA 1007 Northern 3422 -2415 2415 2398212512 Discard Western 605 402 402 0399205561 Retain Eastern 512 495 495 0491559086 Retain FI VA 26 Northern 976 -716 716 2753846154 Discard Western 159 101 101 0388461538 Retain
Rural 4-Leg Signalized
Eastern 137 123 123 0473076923 Retain Total VA 119 Northern 164 -045 045 0378151261 Discard Western 102 017 017 0142857143 Retain Eastern 114 005 005 0042016807 Discard FI VA 053 Northern 052 001 001 0018867925 Discard Western 048 005 005 0094339623 Discard
Rural 4-Leg Minor Stop Control
Eastern 049 004 004 0075471698 Discard Total VA 576 Northern 1475 -899 899 1560763889 Discard Western 674 -098 098 0170138889 Discard Eastern 626 -05 05 0086805556 Discard FI VA 171 Northern 212 -041 041 0239766082 Discard Western 403 -232 232 1356725146 Discard
Rural 3-Leg Signalized
Eastern 157 014 014 0081871345 Discard Total VA 073 Northern 093 -02 02 0273972603 Discard Western 053 02 02 0273972603 Retain Eastern 069 004 004 0054794521 Discard FI VA 026 Northern 03 -004 004 0153846154 Discard Western 023 003 003 0115384615 Retain
Rural 3-Leg Minor Stop Control
Eastern 027 -001 001 0038461538 Discard 1 Difference between mean square prediction error (MSPE) of Virginia statewide model and OR model 2 Absolute value of the difference between Virginia statewide model MSPE and operational region model MSPE 3 Absolute value of the difference between Virginia statewide model MSPE and operational region model MSPE divided by the Virginia statewide MSPE for comparison
Retained SPFs Discarded if value is negative Discarded if less than 01
39
Table 21 PSIs for Top 25 Sites in District 1 Urban (Bristol) FI
Crashes Ranking Based on Crash
Rates Ranking Based on Crash Ratio Ranking Based on EB
Method
Rank Intersection Node
Crash Rate1 PSI2 Intersection
Node Crash Ratio3 PSI Intersection
Node PSI
1 596726 22112 00000 651193 39672 00000 596095 21413
2 606469 20079 00000 606238 39298 06297 596393 08787
3 706818 12504 00000 651075 31264 00000 651130 08453
4 651193 11550 00000 596726 29227 00000 596701 07112 5 651075 09369 00000 606469 28039 00000 651802 06929 6 606238 08382 06297 651233 25831 03612 636331 06726 7 651807 07089 00000 651130 22718 08453 596395 06579 8 651233 06068 03612 706818 22555 00000 596937 06415 9 651230 05990 00000 651230 20301 00000 606238 06297
10 651783 05756 00000 651210 18882 04747 661033 06061 11 636093 04960 00000 636331 17913 06726 596372 05417 12 651274 04475 00000 651807 16847 00000 636372 04808 13 651130 04179 08453 651805 15814 00000 651210 04747 14 651210 03918 04747 651223 15627 03589 636491 04649 15 636331 03393 06726 651783 15009 00000 596420 04633 16 651223 03363 03589 596095 14865 21413 596403 04579 17 606232 03331 00000 636405 14769 00000 651603 04531 18 651127 03053 00000 661033 14555 06061 636056 04351 19 651999 03048 00000 596353 14215 03717 712033 04110 20 596449 02962 00000 636093 13782 00000 704691 04102 21 636405 02811 00000 651879 13192 00000 651838 04100 22 651883 02698 00000 651274 12975 00000 651894 03878 23 596353 02686 03717 651127 12972 00000 596353 03717 24 651805 02663 00000 651999 12959 00000 651233 03612 25 661033 02500 06061 596449 12702 00000 651889 03601
sum 43202 sum 64615 sum 149606 1Number of crashes per year per 1000000 total approach volume 2Potential for safety improvement (crashes yr) the difference between the EB-adjusted long-term crashes and the SPF-estimated crashes 3Ratio of actual crash rate to critical crash rate
40
Table 22 PSIs for Top 25 Sites in District 9 Urban (Northern Virginia District) FI
Crashes Ranking Based on Crash
Rates Ranking Based on Crash Ratio Ranking Based on EB
Method
Rank Intersection Node
Crash Rate1 PSI2 Intersection
Node Crash Ratio3 PSI Intersection
Node PSI
1 718192 191841 00000 718192 257523 00000 264119 150122 2 702946 178194 00000 547722 152371 11175 263375 140091 3 271531 64846 00000 263628 102794 00000 278648 137239 4 263628 52858 00000 263728 100092 00000 276819 131395 5 263728 42215 00000 719754 95274 09444 263290 130743 6 266955 35294 00000 702946 79268 00000 722678 127897 7 547722 34932 11175 263403 77252 05184 264725 118671 8 702612 30441 00000 704237 77175 07648 267028 116627 9 273886 29539 00000 263729 74681 00000 265204 115925
10 716747 27632 00000 271531 72327 00000 274766 115679 11 263626 27139 00000 263135 66458 18068 263249 113372 12 269485 26567 00000 716747 64461 00000 547044 110769 13 728954 26344 00000 266955 56657 00000 549349 107180 14 263729 25208 00000 546138 52003 31028 268210 105630 15 546988 21922 00000 547544 51924 32529 263347 104257 16 274338 21446 00000 263626 50389 00000 276351 102313 17 429308 21354 00000 269485 49897 00000 428167 100064 18 720401 21197 00000 728954 49702 00000 264344 98789 19 267295 20954 00000 548686 49572 03621 277764 91554 20 267536 20874 00000 711601 47985 04440 263467 89259 21 265938 20484 00000 266970 47730 00000 263090 89199 22 273354 20108 00000 546462 46856 03620 703414 88610 23 268345 19362 00000 265938 46726 00000 428629 87379 24 719754 19073 09444 720401 44833 00000 272219 85659 25 263403 19015 05184 728496 43666 04990 428544 85610
Sum 25803 sum 131747 sum 2744033 1Number of crashes per year per 1000000 total approach volume 2Potential for safety improvement (crashes yr) the difference between the EB-adjusted long-term crashes and the SPF-estimated crashes 3Ratio of actual crash rate to critical crash rate
41
CONCLUSIONS
bull The development of SPFs for intersections is necessary for Virginia because the SafetyAnalyst-suggested SPFs which are based on Minnesota data do not represent the Virginia data well Regarding the fit of the SPFs to Virginia data the R2
FT values shown in Tables 13 through 16 for Minnesota and Virginia indicate that the Virginia-specific SPFs fit the Virginia data better than the Minnesota models This may be due to the dissimilarities of the roadside environment such as difference in topography and the characteristics of the different Virginia and Minnesota databases
bull In some cases the specific regional SPFs fit the regional data better than the statewide
SPFs suggesting that the specific SPFs should be considered for use when available These group divisions that have similar roadway characteristics and driver expectations in some cases tend to improve the fit
bull In identifying intersection sites for safety improvements it is clearly beneficial for the EB
method to be used with the suitable SPFs rather than a crash rate or critical ratio method Results of the site prioritization show a much higher potential for crash reduction when the EB method is used with the appropriate SPFs rather than a procedure based on crash rates or critical rates
RECOMMENDATIONS
1 VDOTrsquos TED should use the Virginia-specific SPFs when using the SafetyAnalyst tools The results of this study have shown that the Virginia-specific SPFs reflected the Virginia data better than the SafetyAnalyst-recommended Minnesota SPFs
2 VDOTrsquos TED should investigate the feasibility of using multiple SPFs in SafetyAnalyst If
feasible regional SPFs should be used If it is not currently feasible to use multiple SPFs VDOTrsquos TED should ask that the FHWA include regional information in SafetyAnalyst so as to allow the use of regional SPFs For the specific regional SPFs to be applied to Virginia and other states the SafetyAnalyst tool should be capable of incorporating the necessary data that support the regional models
3 As soon as it is feasible to use regional SPFs VDOTrsquos TED should use the 19 SPFs
developed for urban intersections and the 15 developed for rural intersections when using the tools in SafetyAnalyst Although the statewide SPFs are available for use by an analyst the specific regional models included in the final set of SPFs will predict crashes better than the statewide SPFs The regional analysis will not only ease the use of specific regional SPFs but will also be of benefit when predicting the potential for safety improvement of a specific site
4 For future similar SPF studies VDOTrsquos TED should be directly involved in screening the
traffic data for accuracy and consistency as was done in this study The direct involvement of the TED in the screening of the traffic data significantly contributed to the accuracy of the
42
data and greatly contributed to the confidence the researchers place on the data used in the study
5 The Virginia Transportation Research Council (VTRC) should conduct a study as soon as
feasible to verify whether incorporating independent variables for which data are available other than AADT such as intersection geometry and other characteristics will result in SPFs that better fit the Virginia data Although the currently suggested SafetyAnalyst SPFs use only the AADTs as the independent variables it is likely that provision will be made for use of SPFs that incorporate other independent variables such as number of approaches entering lanes and the other variables for which data are available as these SPFs are likely to give better fit to crash data
6 As soon as feasible VTRC should undertake a study to develop SPFs for the urban system
intersections which are not currently maintained by VDOT as these intersections may have different crash characteristics than those maintained by VDOT This would facilitate the use of SafetyAnalyst in programming sites that are currently not being maintained by VDOT
BENEFITS AND IMPLEMENTATION PROSPECTS
Significant benefits will be accrued by the use of the Virginia-specific SPFs developed in this study This is clearly illustrated in two ways First in examining the transferability of the suggested SPFs in SafetyAnalyst it is clear that these SPFs do not fit the Virginia data very well The results also indicate that the Virginia-specific SPFs fit the Virginia data much better than the suggested SafetyAnalyst SPFs Second the availability of the Virginia-specific SPFs will enhance the use of the EB procedure given in SafetyAnalyst for prioritizing sites for safety improvements This study has also shown that the EB method better identifies sites with higher potential for crash reduction than those identified by crash rates For example the illustrated examples given for the Bristol and Northern Virginia districts show that the potential reduction in FI crashes when the top 25 sites are identified by the EB method is 28936 (1496 + 27440) crashes per year whereas that obtained when the critical crash ratio method is used for prioritization is only 1963 (646 + 1317) and that obtained with the crash rate method is only 690 (432 + 258) crashes per year This gives a net benefit of 26973 potential crashes per year compared to the critical crash ratio method and 28246 compared to the crash rate method Assuming an average cost of FI crashes of $95629 (FHWA 2005) and only 10 of the estimated net benefit PSI of 28246 crashes per year is achieved the total savings of more than $27 million per year could be accrued The prospects for implementation of the recommendations are very high as the study was requested by VDOTrsquos TED which is planning to incorporate these SPFs in the use of the tools provided in SafetyAnalyst
43
ACKNOWLEDGMENTS
The authors appreciate the opportunity afforded them by VDOT and VTRC to conduct this study Special thanks to Stephen Read (VDOT) Dr In-Kyu Lim (VDOT) Dr Young-Jun Kweon (VTRC) and VDOTrsquos Central Office for their interest and support in SPFs and their help in the selection of intersection sites Many thanks to Lewis Woodson (VTRC) and James Hill (University of Virginia) for all their help and input throughout the study
REFERENCES Cogburn P VDOT Interagency Coordination 2007 Virginia Emergency Management
Conference Virginia Department of Transportation Richmond April 2007 Colorado Department of Transportation DTD Applied Research and Innovation Branch Safety
Performance Functions for Intersections CDOT-2009-10 Denver December 2009 Fridstroslashm L Ifver J Ingebrigtsen S Kulmala R and Thomsen LK Measuring the
Contribution of Randomness Exposure Weather and Daylight to the Variation in Road Accidents Counts Accident Analysis and Prevention Vol 27 No 1 1995 pp 1-20
Federal Highway Administration Cost of Crashes by Severity Table FHWA-HRT-05-051
Washington DC 2005 Federal Highway Administration SafetyAnalyst Home Page httpwwwsafetyanalystorg
Accessed February 2010 Garber N and Hoel L Traffic amp Highway Engineering 4th ed Cenage Learning Toronto
Canada 2009 Garber NJ Haas PR and Gosse C Development of Safety Performance Functions for Two-
Lane Roads Maintained by the Virginia Department of Transportation VTRC 10-R25 Virginia Transportation Research Council Charlottesville 2010
Hamidi A Fontaine MD and Demetsky MJ A Planning-Level Methodology for Identifying
High-Crash Sections of Virginiarsquos Primary System VTRC 11-R4 Virginia Transportation Research Council Charlottesville 2010
Harwood D Council FM Hauer E Hughes WE and Vogt A Prediction of the Expected
Safety Performance of Rural Two-lane Highways Federal Highway Administration McLean VA December 2000
Harwood DW Bauer KM Richard KR Gilmore DK Persaud B and Lyon C
Development of SPFs for Safety Analyst Interim Tools Technical Memorandum
44
Prepared by Midwest Research Institute for the Federal Highway Administration McLean VA 2004
ITT Corporation SafetyAnalyst Userrsquos Manual Turner-Fairbank Highway Research Center
McLean VA 2008 Jonsson T Ivan J and Zhang C Crash Prediction Models for Intersections on Rural
Multilane Highways Differences by Collision Type In Transportation Research Record Journal of the Transportation Research Board No 2019 Transportation Research Board of the National Academies Washington DC 2007 pp 91-98
Kweon Y-J and Lim I-K Appropriate Regression Model Types for the Empirical Bayes
Method and SafetyAnalyst In Proceedings of the 89th Annual Meeting of the Transportation Research Board Transportation Research Board of the National Academies Washington DC 2010
Kononov J Bailey B and Allery B Exploratory Examination of the Functional Form of
Safety Performance Functions of Urban Freeways Colorado Department of Transportation and San Diego State University Denver CO 2008
Lyon C Haq A Persaud B and Kodama S Safety Performance Functions for Signalized
Intersections in Large Urban Areas Development and Application to Evaluation of Left-Turn Priority Treatment In Transportation Research Record Journal of the Transportation Research Board No 1908 Transportation Research Board of the National Academies Washington DC 2005 pp 165-171
Lord D and Persaud B Estimating the Safety Performance of Urban Road Transportation
Networks Center for Transportation Safety Texas Transportation Institute Texas AampM University and Department of Civil Engineering Ryerson University College Station TX 2003 pp 609-620
Miaou S-P Lu A and Lum H S Pitfalls of using R2 to Evaluate Goodness of Fit of
Accident Prediction Models In Transportation Research Record Journal of the Transportation Research Board No 1542 Transportation Research Board of the National Academies Washington DC 2005 1996 pp 6-13
Miller P Re Negative R squared Email Archive Division of Biostatistics Washington
University in St Louis February 2 2005 February 2 2005 httpwwwbiostatwustleduarchiveshtmljmp-l2005msg00075html Accessed February 2010
Persaud B Lord D and Palmisano J Calibration and Transferability of Accident Prediction
Models for Urban Intersections In Transportation Research Record Journal of the Transportation Research Board No 1784 Transportation Research Board of the National Academies Washington DC 2002 pp 57-64
45
Persaud B and Nguyen T Disaggregate Safety Performance Models for Signalized Intersections on Ontario Provincial Roads In Transportation Research Record Journal of the Transportation Research Board No 1635 Transportation Research Board of the National Academies Washington DC 1998 pp 113-120
Pham T and Ragland D Summary of Crash Prediction Models Also known as Safety
Performance Functions (SPFs) California Partners for Advanced Traffic and Highways and University of California Berkeley Berkeley 2005
SAS Institute Inc SAS OnlineDoc Version Eight Cary NC
httpwwwtecnionacildocssasril Accessed 2009 Tegge RA Jo J-H and Ouyang Y Development and Application of Safety Performance
Functions for Illinois ICT-10-066 Illinois Center for Transportation University of Illinois Urbana-Champaign March 2010
Virginiarsquos Surface Transportation Safety Executive Committee Commonwealth of Virginiarsquos
Strategic Highway Safety Plan 2006-2010 Virginia Department of Transportation Richmond 2006
Washington S Persaud B Lyon C and Oh J Validation of Accident Models for
Intersections FHWA-RD-03-037 Federal Highway Administration McLean VA 2005
46
47
APPENDIX A
STATISTICAL PARAMETERS AND GOODNESS-OF-FIT RESULTS
Table A-1 Statistical Parameters for Urban Intersections SPFs Parameter Estimates
Data Intercept
Coefficient of Mayor AADT
Coefficient of Minor AADT
Subtype Site Intercept (α)
StndError
P value
lnMajor (β1)
StndError
P value
lnMinor (β2)
StndError
P value
Total VA -76234 048 lt0001 06742 005 lt0001 03453 003 lt0001
OR1 -83067 056 lt0001 07522 005 lt0001 0328 003 lt0001OR10 -123913 122 lt0001 10631 013 lt0001 04567 006 lt0001OR 100 -88553 077 lt0001 07825 007 lt0001 03706 004 lt0001FI VA -85256 057 lt0001 06477 006 lt0001 03579 004 lt0001OR1 -96546 063 lt0001 07603 006 lt0001 03597 004 lt0001OR10 -114284 15 lt0001 08662 016 lt0001 04412
Urban 4-Leg Signalized
OR 100 -99582 100 lt0001 07484 009 lt0001 04017 005 lt0001Total VA -60723 022 lt0001 04558 002 lt0001 0347 004 lt0001
OR1 -6059 044 lt0001 0505 004 lt0001 02773 006 lt0001OR10 -67031 057 lt0001 03986 007 lt0001 04999 009 lt0001OR 100 -65388 032 lt0001 04689 004 lt0001 043 006 lt0001FI VA -76917 032 lt0001 05001 003 lt0001 03695 005 lt0001OR1 -81437 060 lt0001 05813 005 lt0001 03188 008 lt0001OR10 -80333 063 lt0001 03446 007 lt0001 06218 010 lt0001
Urban 4-Leg Minor Stop Control
OR 100 -83166 051 lt0001 05253 006 lt0001 04695 008 lt0001Total VA -6543 082 lt0001 06591 008 lt0001 02119 002 lt0001
OR1 -4999 103 lt0001 05555 009 lt0001 01554 003 lt0001OR10 -96143 127 lt0001 08677 012 lt0001 03297 005 lt0001OR 100 -67518 110 lt0001 06157 011 lt0001 02969 005 lt0001FI VA -84268 068 lt0001 07147 006 lt0001 02481 002 lt0001OR1 -73982 099 lt0001 06496 009 lt0001 02088 003 lt0001OR10 -110104 155 lt0001 0908 015 lt0001 03226 006 lt0001
Urban 3-Leg Signalized
OR 100 -7266 107 lt0001 05508 011 lt0001 03107 006 lt0001Total VA -54696 013 lt0001 04874 002 lt0001 01985 001 lt0001
OR1 -5361 018 lt0001 04959 002 lt0001 01676 002 lt0001OR10 -5773 034 lt0001 04877 003 lt0001 02314 004 lt0001OR 100 -51642 021 lt0001 04338 003 lt0001 02309 003 lt0001FI VA -74642 018 lt0001 05791 002 lt0001 02091 002 lt0001OR1 -76877 027 lt0001 06204 003 lt0001 0181 002 lt0001OR10 -69458 047 lt0001 05096 004 lt0001 02212 005 lt0001
Urban 3-Leg Minor Stop Control
OR 100 -69883 031 lt0001 05169 004 lt0001 02308 003 lt0001 Standard Error
48
Table A-2 Statistical Parameters for Rural Intersections SPFs Parameter Estimates
Data Intercept
Coefficient of Mayor AADT
Coefficient of Minor AADT
Subtype Site Intercept (α)
StndError
P value
lnMajor (β1)
Stnd Error
P value
lnMinor (β2)
Stnd Error
P value
Total VA -69589 118 lt0001 06746 009 lt0001 0253 009 00047
OR1 -1604 237 04974 02284 021 02791 01514 012 0211 OR10 -63951 183 00005 05508 014 00001 03106 014 00224 OR 100 -06468 220 07692 02262 016 01635 -00158 017 09274 FI VA -87116 128 lt0001 07839 011 lt0001 02166 009 0013 OR1 -33285 246 01767 03601 024 0126 00597 013 06478 OR10 -80583 175 lt0001 06809 018 00001 02557 013 0057
Rural 4-Leg Signalized
OR 100 -48381 221 00287 04243 018 00193 01523 018 03943 Total VA -5494 020 lt0001 03533 002 lt0001 03935 003 lt0001
OR1 -62351 058 lt0001 04167 006 lt0001 04507 008 lt0001OR10 -53594 028 lt0001 03379 003 lt0001 03998 004 lt0001OR 100 -51255 027 lt0001 02914 003 lt0001 04075 004 lt0001FI VA -66927 030 lt0001 03899 003 lt0001 04156 004 lt0001OR1 -82561 095 lt0001 05221 009 lt0001 04962 012 lt0001OR10 -70797 044 lt0001 03789 004 lt0001 0497 005 lt0001
Rural 4-Leg Minor Stop Control
OR 100 -63326 038 lt0001 03223 004 lt0001 04424 005 lt0001Total VA -75754 084 lt0001 06465 008 lt0001 03332 008 lt0001
OR1 -58798 220 00075 05076 020 00143 0313 013 00161 OR10 -64368 110 lt0001 0544 011 lt0001 02863 006 lt0001OR 100 -9899 139 lt0001 08047 015 lt0001 04386 006 lt0001FI VA -87112 103 lt0001 07224 010 lt0001 02578 006 lt0001OR1 -9219 260 00004 07258 022 00011 03407 016 00326 OR10 -88607 146 lt0001 07059 016 lt0001 02809 008 00009
Rural 3-Leg Signalized
OR 100 -111835 185 lt0001 08669 018 lt0001 03977 008 lt0001Total VA -43293 008 lt0001 03366 001 lt0001 02087 001 lt0001
OR1 -50904 022 lt0001 0406 002 lt0001 02752 003 lt0001OR10 -40969 009 lt0001 03133 001 lt0001 02001 001 lt0001OR 100 -4231 016 lt0001 02997 002 lt0001 02308 003 lt0001FI VA -53415 011 lt0001 03394 001 lt0001 02237 001 lt0001OR1 -64457 031 lt0001 04195 003 lt0001 0307 004 lt0001OR10 -50831 014 lt0001 03245 002 lt0001 02014 002 lt0001
Rural 3-Leg Minor Stop Control
OR 100 -51046 024 lt0001 03163 003 lt0001 02112 003 lt0001
Standard Error
49
Table A-3 SPFs Goodness of Fit Results for Urban Northern Operational Region (No 1)
Data Estimation Data 70 Validation Data 30
Subtype Site MSE r2 R2FT MPB MAD MSPE R2
FT
Total VA 41150 0529 0557 -0760 4329 38490 0575
Total R1 4110 051 0551 -020 464 4486 054
FI VA 704 038 0406 -046 194 767 048
Urban 4-Leg Signalized
FI R1 809 039 0439 012 214 950 038
Total VA 224 031 0313 -003 090 238 029
Total R1 308 028 0286 008 095 200 032
FI VA 053 019 0193 000 043 053 019
Urban 4-Leg Minor Stop Control
FI R1 064 018 0187 003 043 048 021
Total VA 2490 038 0370 -064 352 2759 037
Total R1 3034 032 0305 -015 365 2687 037
FI VA 447 028 0259 -019 153 488 026
Urban 3-Leg Signalized
FI R1 559 025 0231 004 157 448 029
Total VA 185 025 0230 -004 089 204 024
Total R1 208 026 0239 -006 094 219 026
FI VA 043 015 0133 -002 043 048 016
Urban 3-Leg Minor Stop Control
FI R1 047 017 0156 -001 044 050 017
50
Table A-4 SPFs Goodness of Fit Results for Urban Western Operational Region (No 10)
Data Estimation Data 70 Validation Data 30
Subtype Site MSE r2 R2FT MPB MAD MSPE R2
FT
Total VA 41150 0529 0557 -0760 4329 38490 0575
Total R10 21976 0777 0735 1290 3233 17910 0686
FI VA 7043 0385 0406 -0458 1938 7671 0475
Urban 4-Leg Signalized
FI R10 4280 0526 0500 0377 1597 5170 0452
Total VA 2238 0315 0313 -0034 0897 2383 0292
Total R10 1161 0361 0300 -0032 0740 1050 0188
FI VA 0530 0194 0193 -0004 0432 0533 0194
Urban 4-Leg Minor Stop Control
FI R10 0312 0197 0187 0000 0382 0330 0009
Total VA 24900 0375 0370 -0645 3519 27591 0369
Total R10 14446 0451 0397 -0168 2801 24410 0255
FI VA 4467 0275 0259 -0185 1527 4875 0262
Urban 3-Leg Signalized
FI R10 3077 0266 0216 0039 1258 3390 0115
Total VA 1854 0254 0230 -0043 0893 2038 0239
Total R10 1391 0233 0197 -0054 0800 1640 0207
FI VA 0428 0151 0133 -0021 0431 0476 0157
Urban 3-Leg Minor Stop Control
FI R10 0354 0111 0089 -0019 0404 0380 0125
51
Table A-5 SPFs Goodness of Fit Results for Urban Eastern Operational Region (No 100)
Data Estimation Data 70 Validation Data 30
Subtype Site MSE r2 R2FT MPB MAD MSPE R2
FT
Total VA 41150 0529 0557 -0760 4329 38490 0575
Total R100 31108 0632 0630 0243 4717 37450 0005
FI VA 7043 0385 0406 -0458 1938 7671 0475
Urban 4-Leg Signalized
FI R100 5201 0480 0454 -0098 1864 5410 0244
Total VA 2238 0315 0313 -0034 0897 2383 0292
Total R100 1720 0443 0381 0087 0758 1150 0003
FI VA 0530 0194 0193 -0004 0432 0533 0194
Urban 4-Leg Minor Stop Control
FI R100 0509 0273 0254 0049 0383 0360 0173
Total VA 24900 0375 0370 -0645 3519 27591 0369
Total R100 17782 0410 0410 -1753 0908 38780 0004
FI VA 4467 0275 0259 -0185 1527 4875 0262
Urban 3-Leg Signalized
FI R100 3194 0243 0263 -0615 1645 5860 0236
Total VA 1854 0254 0230 -0043 0893 2038 0239
Total R100 1561 0233 0210 -0127 0902 2230 0002
FI VA 0428 0151 0133 -0021 0431 0476 0157
Urban 3-Leg Minor Stop Control
FI R100 0387 0131 0116 -0043 0444 0500 0141
52
Table A-6 SPFs Goodness of Fit Results for Rural Northern Operational Region (No 1)
Data Estimation Data 70
Validation Data 30
Subtype Site MSE r2 R2FT MPB MAD MSPE R2
FT
Total VA 10990 0353 0321 0513 2210 10070 -0073
Total R1 20080 0118 0092 -1389 3661 34220 0212
FI VA 2350 0196 0181 0045 1189 2600 -0034
Rural 4-Leg Signalized
FI R1 2920 0057 0052 -1173 1931 9760 0028
Total VA 1090 0182 0167 -0067 0794 1190 0171
Total R1 1990 0190 0245 0001 0942 1640 0173
FI VA 0480 0112 0098 -0022 0504 0530 0110
Rural 4-Leg Minor Stop Control
FI R1 0920 0093 0112 0020 0541 0520 0009
Total VA 5490 0328 0305 -0010 1651 5760 0179
Total R1 11110 0182 0254 -0679 2271 14750 0497
FI VA 1450 0181 0170 -0041 0902 1710 0099
Rural 3-Leg Signalized
FI R1 3230 0131 0153 -0116 1006 2120 0355
Total VA 0690 0144 0104 -0008 0613 0730 0102
Total R1 1210 0245 0196 0030 0712 0930 0126
FI VA 0250 0071 0048 -0009 0345 0260 0048
Rural 3-Leg Minor Stop Control
FI R1 0340 0124 0093 0016 0366 0300 0052
53
Table A-7 SPFs Goodness of Fit Results for Rural Western Operational Region (No 10)
Data Estimation Data 70 Validation Data 30
Subtype Site MSE r2 R2FT MPB MAD MSPE R2
FT
Total VA 10990 0353 0321 0513 2210 10070 -0073
Total R10 6020 0311 0268 0007 1748 6050 0382
FI VA 2350 0196 0181 0045 1189 2600 -0034
Rural 4-Leg Signalized
FI R10 1880 0158 0139 0097 0945 1590 0254
Total VA 1090 0182 0167 -0067 0794 1190 0171
Total R10 1300 0196 0163 0070 0760 1020 0078
FI VA 0480 0112 0098 -0022 0504 0530 0110
Rural 4-Leg Minor Stop Control
FI R10 0560 0142 0118 0025 0495 0480 0014
Total VA 5490 0328 0305 -0010 1651 5760 0179
Total R10 3690 0163 0170 -0432 0748 6740 0039
FI VA 1450 0181 0170 -0041 0902 1710 0099
Rural 3-Leg Signalized
FI R10 0890 0124 0117 -0391 0997 4030 -0066
Total VA 0690 0144 0104 -0008 0613 0730 0102
Total R10 0640 0126 0091 0025 0583 0580 0055
FI VA 0250 0071 0048 -0009 0345 0260 0048
Rural 3-Leg Minor Stop Control
FI R10 0240 0062 0041 0003 0335 0230 0028
54
Table A-8 SPFs Goodness of Fit Results for Rural Eastern Operational Region (No 100)
Data Estimation Data 70 Validation Data 30
Subtype Site MSE r2 R2FT MPB MAD MSPE R2
FT
Total VA 10990 0353 0321 0513 2210 10070 -0073
Total R100 10120 0042 0027 1207 1882 5120 -0307
FI VA 2350 0196 0181 0045 1189 2600 -0034
Rural 4-Leg Signalized
FI R100 2060 0053 0039 0119 0962 1370 -0023
Total VA 1090 0182 0167 -0067 0794 1190 0171
Total R100 0960 0170 0149 -0086 0746 1140 0209
FI VA 0480 0112 0098 -0022 0504 0530 0110
Rural 4-Leg Minor Stop Control
FI R100 0440 0106 0092 -0031 0475 0490 0121
Total VA 5490 0328 0305 -0010 1651 5760 0179
Total R100 2770 0492 0459 0601 1759 6260 0090
FI VA 1450 0181 0170 -0041 0902 1710 0099
Rural 3-Leg Signalized
FI R100 1040 0265 0255 0124 0923 1570 -0055
Total VA 0690 0144 0104 -0008 0613 0730 0102
Total R100 0640 0125 0087 -0037 0601 0690 0119
FI VA 0250 0071 0048 -0009 0345 0260 0048
Rural 3-Leg Minor Stop Control
FI R100 0250 0064 0038 -0013 0345 0270 0062
55
APPENDIX B
RECOMMENDED SAFETY PERFORMANCE FUNCTION MODELS
Table B-1 Recommended Urban SPFs Site Virginia SPF Models to Be Used for Urban Intersections
Urban 4-Leg Signalized Total Virginia generic total
Urban 4-Leg Signalized
Operational Region 1 generic total
Urban 4-Leg Signalized
Operational Region 10
use specified model developed
Urban 4-Leg Signalized
Operational Region 100 generic total
Urban 4-Leg Signalized FI Virginia generic FI
Urban 4-Leg Signalized
Operational Region 1 generic FI
Urban 4-Leg Signalized
Operational Region 10
use specified model developed
Urban 4-Leg Signalized
Operational Region 100
use specified model developed
Urban 4-Leg Minor Stop Control
Total Virginia generic total
Urban 4-Leg Minor Stop Control
Operational Region 1
use specified model developed
Urban 4-Leg Minor Stop Control
Operational Region 10
use specified model developed
Urban 4-Leg Minor Stop Control
Operational Region 100
use specified model developed
Urban 4-Leg Minor Stop Control
FI Virginia generic FI e^-76917MajADT^05001MinADT^03695
Urban 4-Leg Minor Stop Control
Operational Region 1
use specified model developed
Urban 4-Leg Minor Stop Control
Operational Region 10
use specified model developed
Urban 4-Leg Minor Stop Control
Operational Region 100
use specified model developed
56
Table B-1 Recommended Urban SPFs (Continued)
Site Virginia SPF Models to Be Used for Urban Intersections
Urban 3-Leg Signalized
Total Virginia
use generic model developed for total
crashes
Urban 3-Leg Signalized
Operational Region 1
use generic model developed for total
crashes
Urban 3-Leg Signalized
Operational Region 10
use specific regional model
developed
Urban 3-Leg Signalized
Operational Region 100
use generic model developed for total
crashes
Urban 3-Leg Signalized FI Virginia
use generic model developed for FI
crashes
Urban 3-Leg Signalized
Operational Region 1
use generic model developed for FI
crashes
Urban 3-Leg Signalized
Operational Region 10
use specific regional model
developed
Urban 3-Leg Signalized
Operational Region 100
use generic model developed for FI
crashes
Urban 3-Leg Minor Stop Control
Total Virginia
use generic model developed for total
crashes
Urban 3-Leg Minor Stop Control
Operational Region 1
use generic model developed for total
crashes
Urban 3-Leg Minor Stop Control
Operational Region 10
use specific regional model
developed
Urban 3-Leg Minor Stop Control
Operational Region 100
use generic model developed for total
crashes
Urban 3-Leg Minor Stop Control
FI Virginia use generic model developed for FI
crashes
Urban 3-Leg Minor Stop Control
Operational Region 1
use generic model developed for FI
crashes
Urban 3-Leg Minor Stop Control
Operational Region 10
use specific regional model
developed
Urban 3-Leg Minor Stop Control
Operational Region 100
use generic model developed for FI
crashes
57
Table B-2 Recommended Rural SPFs Site Virginia SPF Models to Be Used for Rural Intersections
Rural 4-Leg Signalized Total Virginia
use generic model developed for total
crashes
Rural 4-Leg Signalized
Operational Region 1
use generic model developed for total
crashes
Rural 4-Leg Signalized
Operational Region 10
use specific regional model developed
Rural 4-Leg Signalized
Operational Region 100
use specific regional model developed
Rural 4-Leg Signalized FI Virginia use generic model
developed for FI crashes
Rural 4-Leg Signalized
Operational Region 1
use generic model developed for FI crashes
Rural 4-Leg Signalized
Operational Region 10
use specific regional model developed
Rural 4-Leg Signalized
Operational Region 100
use specific regional model developed
Rural 4-Leg Minor Stop Control Total Virginia
use generic model developed for total
crashes
Rural 4-Leg Minor Stop Control
Operational Region 1
use generic model developed for total
crashes e^-549MajADT^035MinADT^039
Rural 4-Leg Minor Stop Control
Operational Region 10
use specific regional model developed
Rural 4-Leg Minor Stop Control
Operational Region 100
use generic model developed for total
crashes
Rural 4-Leg Minor Stop Control FI Virginia use generic model
developed for FI crashes
Rural 4-Leg Minor Stop Control
Operational Region 1
use generic model developed for FI crashes
Rural 4-Leg Minor Stop Control
Operational Region 10
use generic model developed for FI crashes
Rural 4-Leg Minor Stop Control
Operational Region 100
use generic model developed for FI crashes
58
Table B-2 Recommended Rural SPFs (Continued)
Site Virginia SPF Models to Be Used for Rural Intersections
Rural 3-Leg Signalized Total Virginia use generic model
developed for total crashes
Rural 3-Leg Signalized
Operational Region 1
use generic model developed for total crashes
Rural 3-Leg Signalized
Operational Region 10
use generic model developed for total crashes
Rural 3-Leg Signalized
Operational Region 100
use generic model developed for total crashes
Rural 3-Leg Signalized FI Virginia use generic model
developed for FI crashes
Rural 3-Leg Signalized
Operational Region 1
use generic model developed for FI crashes
Rural 3-Leg Signalized
Operational Region 10
use generic model developed for FI crashes
Rural 3-Leg Signalized
Operational Region 100
use generic model developed for FI crashes
Rural 3-Leg Minor Stop Control Total Virginia use generic model
developed for total crashes
Rural 3-Leg Minor Stop Control
Operational Region 1
use generic model developed for total crashes
Rural 3-Leg Minor Stop Control
Operational Region 10
use specific regional model developed
Rural 3-Leg Minor Stop Control
Operational Region 100
use generic model developed for total crashes
Rural 3-Leg Minor Stop Control FI Virginia use generic model
developed for FI crashes
Rural 3-Leg Minor Stop Control
Operational Region 1
use generic model developed for FI crashes
Rural 3-Leg Minor Stop Control
Operational Region 10
use specific regional model developed
Rural 3-Leg Minor Stop Control
Operational Region 100
use generic model developed for FI crashes

12
W = weight Xi = variables such as AADT Yi = number of observed crashes per year at intersection i EEB = EB-adjusted estimated crashes (crashesyr)
In the variance-mean relationship if the value obtained for the dispersion parameter d is 0 then the variance is the same as the mean (see Equations 11 and 12) which causes the NB model to collapse to the Poisson model This parameter has a strong influence on the weight in the EB formula (see Eq 13) therefore it has an effect in the EB-estimated value SAS was helpful in computing this parameter for the different types of intersections analyzed in the study throughout the 5 years
Pruning Process
Before the site prioritization was performed pruning was done to avoid over-representation of the SPFs that might not reflect much difference in the study when compared with statewide SPFs At the completion of the pruning process only the necessary or minimum effective SPFs were retained MSPE is typically the parameter used to assess errors associated with a validation data set for this reason MSPE was used for pruning In order to verify whether a specific regional SPF should be retained or not the validation data set (30 of the data) was used to compute MSPE for both the specific regional SPFs and the corresponding statewide SPFs If MSPE for the regional SPF was greater than that for the corresponding Virginia statewide SPF or if the difference between these two MSPEs was less than 10 it was concluded that the regional SPF was not necessary and it was therefore discarded The following example illustrates the steps for urban four-leg signalized FI crashes in Region 1
1 The 30 FI crash data were obtained for urban signalized four-leg intersections in Region 1 and the MSPE was determined using the statewide SPF for the FI urban four-leg signalized intersections
2 The 30 FI crash data for urban signalized four-leg intersections in Region 1 were
then used to determine MSPE for the specific Region 1 SPF for FI crashes 3 Verify if the MSPE value for the specific regional SPF is higher than the statewide
MSPE value if yes discard the specific regional SPF if no tentatively retain the specific regional model
4 The difference between the two MSPEs was determined to determine whether it was
less than 10 of the statewide MSPE if yes discard the specific regional SPF if no retain the specific regional model This process was repeated for all regional SPFs
13
Identification of Intersections with a Higher Than Expected Number of Crashes
In order to identify some of the intersections with a higher than expected number of crashes a prioritization analysis based on the EB method was conducted This analysis was carried out to identify the top 25 intersections with a high PSI in the urban areas of the Northern Virginia and Bristol districts These two districts were selected to identify any effect of the approach AADTs as two-lane roads in the Northern Virginia District carry much higher volumes than those in the Bristol District The PSI is the difference between the EB-adjusted long-term crashes and the SPF-estimated crashes The PSI was first determined and then a priority list was developed with intersections showing a higher PSI receiving a higher priority This procedure first required the computation of yearly calibration factors (Cy) that accounted for intrinsic yearly variations that were not accounted for in developing the SPFs These yearly calibration factors were determined using the steps described here and given in Equations 15 through 18 (ITT Corporation 2008) Calculation of Yearly Calibration Factor (Cy) For subtype s and severity t the following steps were performed 1 Calculate the (unadjusted) predicted number of crashes using the appropriate SPF yiMinAADTMajAADTe ststst
isyisyisty amp~ 21ˆˆˆ foralltimestimes= ββακ (Eq 15)
2 Sum the predicted numbers over all intersections
ysN
iistysty forall=sum
=
~~1κκ (Eq 16)
3 Sum the observed numbers of crashes over all intersections
yKKsN
iistysty forall=sum
=
1
(Eq 17)
4 Calculate yearly calibration factor csty
yK
csty
stysty forall= ~κ (Eq 18)
5 Repeat the steps for all subtypes (s) and severities (t)
where i = intersection index (i = 1hellip N)
14
s = subtype index (s = urban four-leg signalized intersection rural three-leg minor stop controlled intersection etc) t = severity index (t = TOT [total crashes] FI [fatal + injury crashes] PDO [property damage only]) y = year index (i = 1 [base year] 2 hellip Y) csty = yearly calibration factor for crash subtype s severity t and year y MajAADT = AADT on the major road (vehday) MinAADT = AADT on the minor road (vehday)
istyκ~ = (unadjusted) predicted number of crashes at intersection i for crash subtype s severity t and year y
istyκ = (adjusted) predicted number of crashes at intersection i for crash subtype s severity t and year y α = intercept
1β = coefficient of major AADT 2β = coefficient of minor AADT
These yearly calibration factors were then used to determine the predicted number of
crashes at an intersection based on the SPF for the severity of crashes and type of intersection being considered The PSI for each intersection was then determined using the steps described in Equations 19 through 22 (ITT Corporation 2008) Steps for Calculating PSI for Subtype s
1 Calculate the (adjusted) predicted number of crashes
amp~
21ˆˆˆ ststst
isyisysty
istystyisty
MinAADTMajAADTec
yticββα
κκ
timestimestimes=
foralltimes= (Eq 19)
2 Calculate yearly correction factor Cisty
ytiCyist
istyisty amp
)1(
forall==κ
κ
(Eq 20)
3 Calculate EB weight
tid
w Y
y istystist amp
11
1
foralltimes+
=sum =
κ (Eq 21)
4 Calculate the EB-adjusted estimated number of crashes for year 1
15
tiC
KwwX Y
y isty
Y
y istyistyististyist amp)1(
1
1)1()1( forallminus+times=
sumsum
=
=== κ (Eq 22)
5 Determine the PSI for each intersection If istYX gt istYκ include intersection i in the list for prioritization using istYPSI = istYX
where i = intersection index (i = 1hellip N) s = subtype index (s = urban four-leg signalized intersection rural three-leg minor stop
controlled intersection etc) t = severity index (t = TOT [total crashes] FI [fatal + injury crashes] PDO [property damage
only]) y = year index (y = 1 [base year] 2 hellip Y) cy = yearly calibration factor for crash subtype s severity t and year y d = dispersion parameter w = weight MajAADT = AADT on the major road (vehday) MinAADT = AADT on the minor road (vehday) PSI = potential for safety improvement
istyC = yearly correction factor
istyκ~ = (unadjusted) predicted number of crashes at intersection i for crash subtype s severity t and year y
istyκ = (adjusted) predicted number of crashes at intersection i for crash subtype s severity t and year y
istyX = EB-adjusted estimated number of crashes α = intercept
1β = coefficient of major AADT 2β = coefficient of minor AADT
The prioritization lists for urban two-lane roads in the Northern Virginia and Bristol
districts were then developed based on the PSIs obtained for three prioritization procedures These alternative prioritization procedures were the average crash rates (ACRs) for the study period (see Equation 23) the critical crash ratio (CCR) (see Eqs 24 through 27) (Garber and Hoel 2009) and the EB method The list was developed with the intersections having the highest PSI listed first followed by other intersections in descending order The execution of the EB method prioritization process was achieved through use of the computer codes in SAS Finally the effectiveness of using the EB method for prioritizing sites for safety improvement was illustrated by comparing the PSIs from using intersection crash rates critical crash and the EB procedures
16
Procedure for Crash Rate Method The ACR for the intersection is given as
( )(1000000)( )( )(365)T
TCACRN V
= (Eq 23)
where ACR = the average crash rate for the intersection under consideration (crashes1000000
approach volume) TC = number of crashes over the study period at the intersection N = duration of study period (yr) VT = average daily total approach volume at the intersection Procedure for Critical Rate Method
The critical rate method was accomplished by first computing the traffic base (TB) of the intersection under consideration using Equation 24 The ACR for the intersection under consideration is then computed using its TB as shown in Equation 25 The intersection critical crash rate (ICCR) is then determined using Equation 26 The critical crash ratio (CCR) for the intersection is then computed as the ratio of ICR and the average crash rate (AVR) for all intersections under the same category (intersection type urbanrural etc) as that for the intersection being considered using Equation 27 TB is given as
365
1 000 000
NxVxTB = (Eq 24)
where TB = the total approach volume over the study period of N years at the intersection under consideration (veh1000000) V = average daily approach volume at the intersection under consideration ACR is obtained as
TCACRTB
= (Eq 25)
where ACR = ACR at the intersection under consideration over the study period of N years
17
TB = the total approach volume over the study period of N years at the intersection under consideration (veh1000000) The critical crash rate (ICCR) for the intersection under consideration is given as
05 AVRICCR AVR TFTB TB
= + + (Eq 26)
where AVR = ACR for intersections within the state and of the same designation (eg rural three-leg with minor stop control) as that for the intersection under consideration TF = number of standard deviations for the confidence level being used in the analysis (usually 196 for 95 confidence level) TB = the total approach volume over the study period of N years at the intersection under consideration (veh1000000) The critical crash ratio (CCR) for the intersection is then obtained as
ACRCCRICCR
= (Eq 27)
where ACR = ACR at the intersection under consideration over the study period of N years (see Eq 2) ICCR = critical crash rate for the intersection under consideration (see Eq 26)
Benefits and Implementation Expectations
The expected benefits from developing SPFs and prioritizing intersection sites were illustrated by comparing the PSIs for the prioritized sites when sites were prioritized using the EB method with those obtained when sites were prioritized using crash rates and the critical crash ratio This analysis was conducted for the combined fatal plus injury crashes SPFs An estimate of the cost savings attributable solely to the potential reduction of crashes was also computed by using crash costs given in an FHWA study (FHWA 2005)
18
RESULTS AND DISCUSSION
Literature Review
SafetyAnalyst
The SafetyAnalyst Userrsquos Manual (ITT Corporation 2008) has SPFs that are suggested for intersections that are based on Minnesota data Tables 7 and 8 show the regression coefficients (α β1 and β2) for the SPFs developed for total and combined FI crashes respectively The values for the goodness of fit parameter RFT
2 are also given Although these RFT2 are all less
than 045 with a few less than 010 it has been suggested that the SPFs used in SafetyAnalyst could provide a realistic estimate of an expected crash frequency as a function of traffic volume and roadway geometry (Pham and Ragland 2005)
Methodological and Research References
Several studies similar to this study have been conducted in Canada Colorado California Texas New York and Minnesota For example a study was conducted using data from Colorado California and Texas to examine the functional form of the SPFs for urban freeways (Kononov et al 2008) Five years of crash data were acquired from the respective departments of transportation and the highway safety information system from Colorado The study revealed that the amount of crashes increased moderately with congestion in segments on urban freeways This study however did not include intersections
A study by Lyon et al was conducted in Toronto Ontario Canada to develop SPFs for urban signalized intersections (Lyon et al 2005) Collision data were gathered for five years and included 1950 urban intersections SPFs were developed for different severity levels impact types and intersection types such as four-leg and three-leg intersections The format used to develop the SPFs is shown in Equation 28 This format is somewhat different from that of Equation 4 suggested in Safety Analyst
Collisionsyear = α (F1)β1(F2)β2 exp (β3X1 + β4X2 + ) (Eq 28) where α and βi = the coefficients estimated in the SPF calibration process F1 and F2 = the entering AADTs on the major and minor roads respectively Xi = other independent variables (such as single lane versus multilane approaches with and without left-turn lanes or right-turn lanes high and low pedestrian activities or in some cases F1 or F2 or both)
19
Table 7 SafetyAnalystrsquos SPFs for Intersections (Total Crashes) Site
subtype Code
Site subtype Description
State Regression coefficients
LogIntercept (α)
Regression coefficients
LogAADTmaj (β1)
Regression coefficients LogAADT
min (β2)
Over - dispersion Parameter
(k)
RFT2
() Number of Sites
Max AADTmaj
(vehday)
Max AADTmin
(vehday)
Rural 201 Rural 3-leg with minor-
road STOP control MN -878 071 024 107 133 1706 28500 27000
202 Rural 3-leg with all-way STOP control
MN -1237 122 027 047 41 41 25300 6803
203 Rural 3-leg with signal control
MN -657 066 02 033 26 136 36400 11500
204 Rural 4-leg with minor-road STOP control
MN -896 065 047 07 299 2114 35500 26700
205 Rural 4-leg with all-way STOP control
MN -1237 122 027 047 41 41 25300 6803
206 Rural 4-leg with signal control
MN -657 066 02 033 26 136 36400 11500
Urban 251 Urban 3-leg with minor-
road STOP control MN -535 034 028 128 59 397 68000 18900
252 Urban 3-leg with all-way STOP control
MN -1237 122 027 047 41 41 25300 6803
253 Urban 3-leg with signal control
MN -985 097 018 023 414 33 50000 25807
254 Urban 4-leg with minor-road STOP control
MN -312 027 016 086 76 333 58870 81000
255 Urban 4-leg with all-way STOP control
MN -1237 122 027 047 41 41 25300 6803
256 Urban 4-leg with signal control
MN -347 042 014 032 264 418 75000 81000
ITT Corporation 2008
20
Table 8 SafetyAnalystrsquos SPFs for Intersections (Fatal and Injury Crashes) Site
subtype Code
Site subtype Description
State Regression coefficients
LogIntercept (α)
Regression coefficients
LogAADTmaj (β1)
Regression coefficients LogAADT
min (β2)
Over - dispersion Parameter
(k)
RFT2
() No of Sites
Max AADTmaj
(vehday)
Max AADTmin
(vehday)
Rural 201 Rural 3-leg with minor-
road STOP control MN -935 071 021 123 91 1706 28500 27000
202 Rural 3-leg with all-way STOP control
MN -1002 127 -022 089 248 41 25300 6803
203 Rural 3-leg with signal control
MN -783 075 014 05 215 136 36400 11500
204 Rural 4-leg with minor-road STOP control
MN -936 066 04 0 146 2114 35500 26700
205 Rural 4-leg with all-way STOP control
MN -1002 127 -022 089 248 41 25300 6803
206 Rural 4-leg with signal control
MN -783 075 014 05 215 136 36400 11500
Urban 251 Urban 3-leg with minor-
road STOP control MN -845 049 039 123 81 397 68000 18900
252 Urban 3-leg with all-way STOP control
MN -1002 127 -022 089 248 41 25300 6803
253 Urban 3-leg with signal control
MN -1022 091 021 027 362 33 50000 25807
254 Urban 4-leg with minor-road STOP control
MN -435 029 019 099 57 333 58870 81000
255 Urban 4-leg with all-way STOP control
MN -1002 127 -022 089 248 41 25300 6803
256 Urban 4-leg with signal control
MN -511 049 016 03 295 418 75000 81000
ITT Corporation 2008
21
The study examined the impact of two left turn priority treatments which were flashing advanced green (FAG) and left turn green arrow (LTGA) on left turn collisions These treatments were implemented at 35 intersections in the city of Toronto Two types of collisions were investigated left turns with and without side impact The results indicated that there was an insignificant difference in the impact of the left turn priority treatments on both types of crashes
Lord and Persaud (2003) conducted a study that related SPFs to transportation planning models They noted that traffic safety is not usually accounted for when agencies are conducting a planning analysis to remodel build upgrade or modify their facilities Five-year intersection data from Canada were used Models were developed and statistical measures such as the over dispersion parameter were calculated and conclusions were made from the results The SPFs developed for the study were applied to two sample networks created with the help of a transportation planning software package The research showed that it is possible to make estimation for traffic safety at the planning stage of a project This will allow users to take safety into consideration when designing and possibly create alternatives to change existing designs for more comprehensive projects or development The study also indicated that there are limitations when applying the SPFs to computerized transportation networks The study concluded that although it is possible to predict or estimate crashes on digital transportation networks the accuracy of prediction relies greatly on how precise the traffic flow estimates are
Jonsson et al (2007) performed an SPF study that took into consideration the type and severity of crashes andmdashmost importantmdashthe causal factors for these crashes The study was conducted for intersections on rural four-lane highways in the state of California Four collision types were tested in the study opposite-direction same-direction intersecting-direction and single-vehicle crashes In addition a set of data from the state of New York was used with the same parameters to analyze the severity distribution of crash types The data for California included 1084 intersections on four-lane rural highways and that from New York included 675 intersections mainly stop controlled or without any control Generalized linear modeling was performed with the data after quality analysis Two model forms were estimated with the variables seen in Equations 29 and 30
(Eq 29)
(Eq 30)
where NAcc = predicted number of crashesyr at intersections AADTmajor = AADT on major road AADTminor= AADT traffic flow on minor road Βi = model parameters Xi = variables that describe the intersections (such as terrain lighting left turn number of though lanes and divided or undivided among others)
nn xxxormajorAcc exAADTxAADTN ββββββ ++++=
min4433021
nn xxxormajorAcc exAADTAADTN βββββ +++++=
min332201)(
22
The two different models are different representations of the traffic flow The first represents the AADT of major and minor roads as separate variables but in the second model they are represented as one variable by the sum of the major and minor roads AADTs Results showed that the first model performed better for the multiple-vehicle crashes and the second model fitted better for the single-vehicle crashes In addition the appropriate predictor variables differed depending on the crash type This study is also of interest as it incorporated additional parameters to those in the suggested SPFs now included in SafetyAnalyst and therefore could lead to possible future SPF research for the state of Virginia
Persaud and Nguyen (1998) conducted a study on signalized intersections in Ontario Canada They developed aggregate and disaggregate models to estimate safety performance of three- and four-leg intersections in which crash severity (injury and PDO) environmental class (semi-urban and rural) and time period (daily weekday morning peak and weekday afternoon peak) were considered in the analysis An important aspect of that study is that it supplemented the existing models used for estimating SPFs instead of replacing them because it took into consideration features that were generally not considered in the then existing developed models Two model levels were considered for the study Level 1 was based on the sum of AADTs for all approaches with separate estimates for rear-end right angle and turning movement crashes At this level the equations were adjusted for three- and four-leg intersections by crash severity for all combined impact types and also separately for the three major impact types which were angle rear-end and turning movement In addition models were further separated by time period (daily weekday morning and afternoon peak) and for four-leg intersections which were also classified by environment class such as semi-urban and rural Level 2 allowed estimates to be obtained for specific crash patterns that were defined by movements of the vehicles involved before collision and the same were estimated as a function of the flows that were relevant to each of the patterns For this level models were estimated for four-leg intersections for 12 multi-vehicle and three single-vehicle patterns that were described by the movements of involved vehicles before collision The developed models were intended to estimate the parameters P and d shown in Equations 31 and 33
The safety of the intersection was estimated using the long-term mean based on the EB approach The long term mean (m) was obtained by combining crash count (x) of an intersection in the most recent years (n) with the estimates of the expected annual number of crashes (P) as shown in Equation 31 W1 and W2 in Equations 31 through 33 represent the weights estimated from the mean and variance of the regression estimates
(Eq 31)
(Eq 32)
(Eq 33)
m =W1(x) +W2(P)
2dW
d nP=
+
1PW
d nP=
+
23
(Eq 34)
To estimate the variance of m the following formula was used
(Eq 35)
In Equations 32 through 35 P and d represent the fundamental parameters Two models were selected for SPFs For Level 1 and single-vehicle Level 2 (Eq 36) For multi-vehicle in Level 2 (Eq 37) where P = expected number of crashes of a given type α and β = regression parameters to be estimated S (Level 1) = sum of all entering flows for a given time period for Level 1 analysis S (Level 2) = sum of the daily through right or left turn flows for a given time period for Level 2 (single-vehicle) analysis S1 and S2 = AADTs for small and large flows for a specific crash pattern in Level 2 (multi-vehicle) analysis
The models in either level can be used in the EB procedure to provide estimates for intersections that need to be treated or for the evaluation of the effectiveness of safety countermeasures It should be noted that the quality of the estimates for the study was strongly related to how the parameters were selected and used in the SPFs and unlike other available road models the ones presented in this study can be separated by time period and crash pattern Persaud et al (2002) conducted a study to demonstrate the complexity involved in the calibration of crash prediction models or SPFs for urban intersections Toronto data for three- and four-leg signalized intersections were used to estimate the models for the study The performance of these models was then compared with other models from Vancouver and California The models from these places were recalibrated to fit Toronto by using the Interactive Highway Safety Design Model (IHSDM) and a calibration procedure as proposed by Harwood et al (2000) The results varied significantly and were also mixed The study noted that the calibration of models is not a simple task and due to the importance of the SPFs they must be properly calibrated Several things must be accounted for when performing this procedure in order to obtain good quality data analysis The first thing is to extract a large sample of high quality data A software or program to link all the traffic crash and road characteristics data must exist because the same is usually kept stored in different databases In addition several
2Pd
Var P=
2( )
d xVar m dnP
+=
+
P =αSβ
P =αS1β1 S2
β 2
24
years of crash data must be obtained in order to have a good amount of samples that account for variations The actual process of model calibration is complicated therefore careful attention must be paid when analyzing the same because of the importance of the outcomes of the study The authors of the study made an exploratory analysis and it revealed that the relationship between the crashes and each covariate should be described either by the power function or the gamma function for all intersection types to be analyzed Equations 38 through 40 are the selected model forms used in the study F1 = Power F2 = Gamma (Eq 38) F1 = Gamma F2 = Power (Eq 39) F1 = Power F2 = Power (Eq 40) where E (K) = expected annual number of crashes between 1990 and 1995 F1 F2 = average entering AADT of major and minor roads respectively for the period 1990 to 1995 α β1 β2 β3 β4 = coefficients to be estimated
An NB structure was used to analyze the models and the overdispersion parameter (γ) was analyzed using Equation 41
γ=
2)K(E)K(Var (Eq 41)
Variance increases as γ decreases therefore the value of γ can also be used to make a comparison for the goodness of fit of several models fitted to the same data The larger the value of γ the smaller the variance therefore a more accurate model is given The authors suggest that γ would be enough to calculate the goodness of fit index of any SPF but if one desires to know how accurate the prediction estimate is other measures should also be computed The authors suggested using R2
α as proposed by Miaou et al (1996) which is a dispersion parameter based R2 computed as shown in Equation 42
γγ
minus=αmin2 1R (Eq 42)
where γ = overdispersion parameter for calibrated model γmin = smallest possible overdispersion parameter
The authors suggested that a disaggregation by traffic volume is preferable than using
only a single calibration factor for that is what the IHSDM currently has A recommendation is made to account for safety variation in traffic conditions over time by calibrating the models every two to three years as suggested by Harwood et al (2000)
E(K) =αF1β1 F2
β 2e(β 3F2 )
E(K) =αF1β1 F2
β 2e(β 4 F1 )
E(K) =αF1β1 F2
β 2
25
The Illinois Department of Transportation and the University of Illinois Urbana-Champaign conducted a research study to develop and implement SPFs for road segments and intersections in Illinois (Tegge et al 2010) These SPFs were developed in a way suitable for easy implementation in SafetyAnalyst The crash data (number of crashes and crash severity) and roadway data (number of lanes traffic volume area type and functional class) were collected and used for development of the SPFs Seventeen peer groups were used for developing the SPFs for segments and eight for intersections The intersections peer groups were minor leg stop control all-way stop control signalized and undetermined for rural and urban segments separately The SPFs for segments were developed using NB distribution for crashes and Poisson distribution for intersections The SAS GENMOD procedure was used to develop the SPFs for a five-year analysis period from 2001 to 2005 The model form for the intersection SPFs is the same as that given in the SafetyAnalyst Userrsquos Manual The SPFs were also developed for different crash severities such as fatal crashes type A injury crashes type B injury crashes and fatal plus injury crashes The EB method was used to determine the sites with the higher PSIs Two analysis techniques were used to obtain the PSIs The first considered segments and intersections as individual elements and the second used the sliding window approach The site specific analysis treated each individual segment and intersection as a separate entity Each segment is then compared with every other segment instead of having them grouped together The sliding window approach defined a set length The window lengths were 025 mile and 1 mile for urban and rural segments respectively
The largest impact on crash frequency was found to be the AADT and was therefore the only variable modeled as a logarithm (lnAADT) By doing this the AADT accounted for most of the prediction whereas the rest of the variables refined the prediction further Other variables used included access control functional class lane width surface type area type speed limit and median type The study recommended that a multivariate analysis be conducted for such studies to show how certain variables could contribute to the crashes Other variables could include roadway lighting weather and pavement conditions and roadway geometry The study also concluded that knowledge of roadway characteristics that increase the risk of fatal or injury crashes will facilitate the setting up of safety criteria that can help engineers in the designing of safer roadways Further knowledge of driver behaviors that lead to fatal and severe injury crashes can facilitate the training of enforcement officers to identify these behaviors
The Colorado Department of Transportation (CDOT) (2009) conducted a study to develop SPFs for intersections in the state Their model form is the same as that in SafetyAnalyst The SPFs were developed for many categories based on the number of legs divided undivided rural and urban including urban four-lane divided signalized six-lane divided signalized urban three-leg signalized two-lane undivided unsignalized and urban three-leg unsignalized When a median or left-turn lane is present a roadway is considered divided The sites selected for the study reflected variability in traffic volume and geometry in order to have a diverse representation of intersections throughout the state SPFs were developed for total and for fatal plus injury crash types A five-year study period from 2000 through 2005 was used Crash and AADT data were collected for development of the SPFs CDOT used a NB error structure to develop the SPFs and the EB procedure to estimate the expected safety performance of an intersection site for different safety management purposes Overdispersion parameters were computed and used as a goodness of fit measure According to their data
26
overdispersion parameters indicated that their models provided a reasonable fit to the Colorado data
Results indicated that for signalized intersections roads with six lanes on major approaches have more collisions than those with four lanes on major approaches CDOT recommended that the SPFs should be recalibrated in the future using data from future years as crash frequencies may change over time because of a variety of issues The report also recommended that separate calibration factors should be developed for different regions and different topographies Research in Virginia
In Virginia two other similar studies have recently been published One by Garber et al (2010) for two-lane roads and another by Hamidi et al (2010) to identify high-crash sections on Virginiarsquos primary system by developing a planning-level methodology The study by Garber et al developed SPFs for two-lane segments of 1 mile or less and the study by Hamidi et al developed SPFs for longer segments of two-lane roads that can be used for corridor analysis
Evaluation of the Recommended Minnesota SPFs
Figures 3 through 6 show representative graphs that were used to visually examine how well the Virginia data fitted the suggested Minnesota SPFs Figures 3 and 4 are for urban four-leg signalized intersections and Figures 5 and 6 are for rural four-leg signalized intersections These graphs suggest that the Minnesota SPFs do not fully represent the Virginia data Tables 9 through 12 show the Freeman-Tukey R2
FT coefficients computed for the different Minnesota SPFs using the Virginia data The low Freeman-Tukey R2
FT coefficients obtained and the visual inspection of the graphs suggested that a better fit to the Virginia data could be obtained by developing specific Virginia SPFs using Virginia data It was therefore decided to develop specific SPFs for Virginia
0
2
4
6
8
10
12
14
0 20000 40000 60000 80000 100000 120000
AADT Major
Tota
l Cra
shes
Per
Yea
r
Minnesota VA Actual Observed
Minnesota Model
Figure 3 Total crashes per year vs major AADT for urban 4-leg signalized intersections
with minor AADT of 700
27
0
5
10
15
20
25
30
35
0 20000 40000 60000 80000 100000 120000
AADT Major
Tota
l Cra
shes
per
Yea
r
Minnesota VA Actual Observed
Minnesota Model
Figure 4 Total crashes per year vs major AADT for urban 4-leg signalized intersections
with minor AADT of 4500
0
2
4
6
8
10
12
14
0 20000 40000 60000 80000 100000 120000
AADT Major
Tota
l Cra
shes
Per
Yea
r
Minnesota VA Actual Observed
Minnesota Model
Figure 5 Total crashes per year vs major AADT for rural 4-leg signalized intersections with
minor AADT of 795
28
0
2
4
6
8
10
12
14
16
18
0 20000 40000 60000 80000 100000 120000
AADT Major
Tota
l Cra
shes
per
Yea
r
Minnesota VA Actual Observed
Minnesota Model
Figure 6 Total crashes per year vs major AADT for rural 4-leg signalized intersections with
minor AADT of 5000
Table 9 Minnesota SPFs for Urban FI Crashes and Corresponding R2FT Based
on Virginia Data
Intersection Type
Minnesota FI SPFs R2
FT Based on Virginia Urban FI Crash Data ()
Urban 4-Leg Signalized 032
Urban 4-Leg Minor Stop Control 008
Urban 3-Leg Signalized 026
Urban 3-LegMinor Stop Control 01
Table 10 Minnesota SPFs for Urban TOTAL crashes and Corresponding R2
FT Based on Virginia Data
Type of Intersection
Minnesota SPFs
R2FT Based on Virginia Urban Total
Crash Data ()
Urban 4-Leg Signalized 034
Urban 4-Leg Minor Stop Control 022
Urban 3-Leg Signalized 031
Urban 3-Leg Minor Stop Control 01
29
Table 11 Minnesota SPFs for Rural TOTAL Crashes and Corresponding R2FT
Based on Virginia Data
Type of Intersection
Minnesota SPFs R2
FT Based on Virginia Rural Total Crash Data ()
Rural 4-Leg Signalized 029
Rural 4-Leg Minor Stop Control 013
Rural 3-Leg Signalized 029
Rural 3-Leg Minor Stop Control -010
Table 12 Minnesota SPFs for Rural FI Crashes and Corresponding R2FT Based
on Virginia Data
Type of Intersection
Minnesota SPFs R2
FT Based on Virginia Rural FI Crash Data ()
Rural 4-Leg Signalized 018
Rural 4-Leg Minor Stop Control 010
Rural 3-Leg Signalized 018
Rural 3-Leg Minor Stop Control 001
Development and Evaluation of Specific Virginia SPFs
In keeping with the suggestion given in the Safety Analyst Userrsquos Manual the model form used to develop the intersection SPFs is given in Equation 4 as
1 2k e x MajAADT x MinAADTβ βα=
where
k = predicted crash frequency per intersection per year MajAADT = AADT on the major road (vehday) MinAADT = AADT on the minor road (vehday) α = intercept β1 = coefficient of mayor AADT β2 = coefficient of minor AADT
30
The statewide SPFs developed for Virginia are given in Tables 13 through 16 Due to lack of data the analysis for all-way stop intersections could not be undertaken These tables also give the Freeman-Tukey R2
FT coefficient for each of the Virginia SPFs and the corresponding Minnesota SPF and Freeman-Tukey R2
FT based on the Virginia data The R2FT coefficients
obtained indicate that the Virginia-specific SPFs fit the Virginia data better than the suggested Minnesota SPFs for all types of intersections and crash severity except those for FI crashes on urban three-leg signalized rural four-leg signalized and rural four-leg minor stop control intersections where the corresponding RFT
2 values are similar In Table 15 it can be seen that the Minnesota R2
FT value is negative for the rural three-leg minor stop control intersections The negative RFT
2 value is possible because these calculations were not performed on the same data points that were used to create the Minnesota SPFs (Miller 2009) Table 13 SPF Models for Urban TOTAL crashes and R2
FT results for Virginia Statewide (VDOT-maintained roads)
SPF model with TOTAL Crash values
R2FT TOTAL
Crash Data
Site Virginia Statewide Minnesota VA MN
Urban 4-Leg Signalized 056 034
Urban 4-Leg Minor Stop Control
032 022
Urban 3-Leg Signalized 037 031
Urban 3-Leg Minor Stop Control
023 010
Table 14 SPF Models for Urban FI crashes and R2
FT results for Virginia Statewide (VDOT-maintained roads)
SPF model with FI Crash values R2FT FI Crash Data ()
Site
Virginia Statewide Minnesota VA MN
Urban 4-Leg Signalized 041 032
Urban 4-Leg Minor Stop Control
019 008
Urban 3-Leg Signalized 026 026
Urban 3-Leg Minor Stop Control
013 010
31
Table 15 SPF Models for Rural TOTAL Crashes and R2FT Results for Virginia Statewide (VDOT-
maintained roads) SPF model with TOTAL Crash values R2
FT TOTAL Crash Data
Site
Virginia Statewide Minnesota VA MN
Rural 4-Leg Signalized 0321 0290
Rural 4-Leg Minor Stop Control
0167 0132
Rural 3-Leg Signalized 0305 0291
Rural 3-Leg Minor Stop Control
0104 -0102
Table 16 SPF Models for Rural FI crashes and R2
FT results for Virginia Statewide (VDOT-maintained roads) SPF model with FI Crash values R2
FT TOTAL Crash Data
Site
Virginia Statewide Minnesota VA MN
Rural 4-Leg Signalized 0181 0181
Rural 4-Leg Minor Stop Control
0098 0097
Rural 3-Leg Signalized 0170 0180
Rural 3-Leg Minor Stop Control
0048 0012
Figures 7 through 10 show visual representations of how well the Virginia SPFs fit the
Virginia data in comparison with the suggested Minnesota SPFs In general the Virginia SPFs tend to fit the Virginia data better than the Minnesota SPFs although both sets of SPFs tend to have similar fits at low volumes (AADTmajor lt 2000) except for the SPF for total crashes on urban four-leg signalized intersections shown in Figure 7 The primary reason the Minnesota SPFs do not fit the Virginia data as well as the Virginia SPFs may be the dissimilarities of the roadside environment and the characteristics of the different databases
32
0
2
4
6
8
10
12
14
0 20000 40000 60000 80000 100000 120000
AADT Major
Tota
l Cra
shes
Per
Yea
r
Minnesota VA Actual Observed Virginia
Minnesota Model
Virginia M odel
Figure 7 Total crashes per year vs major AADT for urban 4-leg signalized intersections
with minor AADT of 700
0
5
10
15
20
25
30
35
0 20000 40000 60000 80000 100000 120000
AADT Major
Tota
l Cra
shes
per
Yea
r
Minnesota VA Actual Observed Virginia
Minnesota Model
Virginia Model
Figure 8 Total crashes per year vs major AADT for urban 4-leg signalized intersections
with minor AADT of 8000
33
0
2
4
6
8
10
12
14
0 20000 40000 60000 80000 100000 120000
AADT Major
Tota
l Cra
shes
Per
Yea
r
Minnesota VA Actual Observed Virginia
Virginia Model
Minnesota Model
Figure 9 Total crashes per year vs major AADT for rural 4-leg signalized intersections with
minor AADT of 79
0
5
10
15
20
25
0 20000 40000 60000 80000 100000 120000
AADT Major
Tota
l Cra
shes
per
Yea
r
Minnesota VA Actual Observed Virginia
Minnesota Model
Virginia Model
Figure 10 Total crashes per year vs minor AADT for rural 4-leg signalized intersections with major AADT of 5000
As discussed in the Methodology section in addition to the statewide Virginia SPFs
specific SPFs were developed for each operational region to consider the different topographical characteristics that exist across Virginia The complete set of SPFs together with the associated p values for the regression coefficients are shown in Tables A-1 and A-2 of Appendix A All p values are less than 005 with most being less than 00001 except for some of the rural four-leg signalized intersections regional specific SPFs These p values indicate that the estimated coefficients are statistically significant at the 95 confidence level or better A possible reason
34
for higher p values for a small number of SPFs may be the sample size used for developing these SPFs
To test the transferability and fit of the Virginia statewide specific SPFs several
statistical parameters were determined for the 70 (estimation) data set and the 30 (validation) data set separately The corresponding values for each of these parameters were then compared The results are shown in Tables 17 and 18 for urban and rural intersections respectively The results for the regional SPFs are shown in Tables A-3 through A-8 of Appendix A The results indicate that the developed models are transferable to the 30 validation data set For example the MSE values for the 70 estimation data are similar to the MSPE values for the 30 validation data In addition the mean prediction bias MPB values for the 30 validation data are close to zero (-076 le MPB ge -0004) in Table 17 and (-0067 le MPB ge 00513) in Table 18
Table 17 Goodness of Fit Results for Urban Statewide SPFs
Data Estimation data 70 Validation Data 30 Subtype Site MSE r2 R2
FT MPB MAD MSPE R2FT
Total VA 41150 0529 0557 -0760 4329 38490 0575
Total MN
68636 0506 0336 -3145 5421 68156 0315
FI VA
7043 0385 0406 -0458 1938 7671 0475
Urban 4-Leg Signalized
FI MN 7702 0372 0324 -0316 2124 8981 0376
Total VA 2238 0315 0313 -0034 0897 2383 0292
Total MN 2510 0287 0215 0091 0982 2730 0182
FI VA 0530 0194 0193 -0004 0432 0533 0194
Urban 4-Leg Minor Stop Control
FI MN 0560 0182 0080 0128 0522 0577 0052
Total VA 24900 0375 0370 -0645 3519 27591 0369
Total MN 29322 0365 0308 -2238 3661 33079 0272
FI VA 4467 0275 0259 -0185 1527 4875 0262
Urban 3-Leg Signalized
FI MN 4528 0267 0261 -0294 1526 4937 0261
Total VA 1854 0254 0230 -0043 0893 2038 0239
Total MN 2388 0237 0104 -0541 0902 2600 0107
FI VA 0428 0151 0133 -0021 0431 0476 0157
Urban 3-Leg Minor Stop Control
FI MN 0478 0140 0097 -0184 0385 0537 0104
35
Table 18 Goodness of Fit Results for Rural Statewide SPFs
Data Estimation Data 70
Validation Data 30
Subtype Site MSE r2 R2FT MPB MAD MSPE R2
FT
Total VA 10990 0353 0321 0513 2210 10070 -0073
Total MN 12400 0339 0290 -0154 2071 8460 0035
FI VA 2350 0196 0181 0045 1189 2600 -0034
Rural 4-Leg Signalized
FI MN 2400 0188 0181 -0043 1164 2420 0004
Total VA 1090 0182 0167 -0067 0794 1190 0171
Total MN 1190 0167 0132 -0348 0774 1320 0115
FI VA 0480 0112 0098 -0022 0504 0530 0110
Rural 4-Leg Minor Stop Control
FI MN 0500 0104 0097 -0158 0459 0560 0093
Total VA 5490 0328 0305 -0010 1651 5760 0179
Total MN NA NA NA NA NA NA NA
FI VA 1450 0181 0170 -0041 0902 1710 0099
Rural 3-Leg Signalized
FI MN NA NA NA NA NA NA NA
Total VA 0690 0144 0104 -0008 0613 0730 0102
Total MN 0890 0141 -0102 -0404 0555 0940 -0104
FI VA 0250 0071 0048 -0009 0345 0260 0048
Rural 3-Leg Minor Stop Control
FI MN 0270 0068 0012 -0144 0270 0290 0003
Pruning of Virginia-Specific SPFs A total of 64 SPFs were initially developed using the appropriate data for Virginia as shown in Tables A-1 and A-2 of Appendix A Considering that not all regional models might be necessary the pruning process described in the methodology section was carried out to prune the number of SPFs to the minimum effective number as seen in Tables 19 and 20 for urban and rural intersections respectively The pruning process resulted in 19 SPFs for urban sites and 15 for rural sites To facilitate the use of the correct SPF for a specific type of intersection located in a specific region the lists of the appropriate SPFs to be used are given in Tables B-1 and B-2 of Appendix B for the urban and rural intersections respectively
As can be seen in Tables 19 and 20 and Tables A-1 and A-2 of Appendix A there are some trends worth discussing for the benefit of the study and possible future research With regards to the three different operational regions the Western region retained many more of the specific regional urban SPFs than any other region For example the Western regional SPFs were retained for all urban intersection sites whereas for the Eastern region the only SPFs
36
retained were those for urban four-leg signalized FI crashes and urban four-leg minor stop control for total and FI crashes Similarly the only urban SPF retained for the Northern region was that for urban four-leg minor stop control for total crashes For the rural intersection sites all of the Western regional SPFs were retained except those for rural three-leg signalized total and FI crashes and rural four-leg minor stop control FI crashes The majority of the Eastern region rural SPFs were discarded except those for rural four-leg signalized total and FI crashes while for the Northern region all regional SPFs were discarded
The Western region retained more specific regional SPFs than the other two regions This suggests that the intersections in the Western region exhibit more unique characteristics than those for the other regions This may be due to the more mountainous terrain in the Western region compared to those in the Eastern and Northern regions This supports the philosophy of developing specific SPFs based on the topography of different regions
Site Prioritization
To illustrate the benefits of using the EB method to prioritize intersection sites for safety
improvements the top 25 urban sites from the Bristol and Northern Virginia districts were identified by using crash rates critical crash ratio and the EB method The PSI for each site identified was then determined The results obtained are shown in Tables 21 and 22 for the Bristol and the Northern Virginia districts respectively The results indicate that for the Northern Virginia District the PSIs for the top 25 sites are 258 1317 and 27440 crashes per year and for the Bristol District 432 646 and 1496 crashes per year for the crash rates critical crash ratio and EB methods respectively The important thing in Tables 21 and 22 is the sum of the PSI columns ranked by the three methods The sum of each of the PSIs for the crash rate and critical crash ratio method is lower than that for the EB method These results suggest that the use of the EB method in the planning process will identify intersection sites with the highest PSIs and therefore where detailed assessments to determine feasible and effective safety treatments should be undertaken
37
Table 19 MSPE Values for Virginia Urban Statewide and Urban Regional SPFs Used for Pruning
Data Pruning
Subtype
Site
MSPE [MSPEVA-
MSPEOR]1 [abs(MSPEVA-
MSPEOR)]2 [abs(MSPEVA-
MSPEOR)MSPEVA]3
RetainDiscardTotal VA 3849 Northern 4486 -637 637 0165497532 Discard Western 1791 2058 2058 0534684334 Retain Eastern 3745 104 104 0027020005 Discard FI VA 7671 Northern 95 -1829 1829 0238430452 Discard Western 517 2501 2501 0326033112 Retain
Urban 4-Leg Signalized
Eastern 541 2261 2261 0294746448 Retain Total VA 23834 Northern 202 03634 03634 015247126 Retain Western 105 13334 13334 0559452882 Retain Eastern 115 12334 12334 0517496014 Retain FI VA 05327 Northern 048 00527 00527 0098929979 Discard Western 033 02027 02027 0380514361 Retain
Urban 4-Leg Minor Stop Control
Eastern 036 01727 01727 0324197485 Retain Total VA 275911 Northern 2687 07211 07211 0026135239 Discard Western 2441 31811 31811 0115294425 Retain Eastern 3878 -111889 111889 0405525695 Discard FI VA 48754 Northern 448 03954 03954 0081101038 Discard Western 339 14854 14854 0304672437 Retain
Urban 3-Leg Signalized
Eastern 586 -09846 09846 020195266 Discard Total VA 20379 Northern 219 -01521 01521 0074635654 Discard Western 164 03979 03979 0195250012 Retain Eastern 223 -01921 01921 0094263703 Discard FI VA 04756 Northern 05 -00244 00244 0051303616 Discard Western 038 00956 00956 0201009251 Retain
Urban 3-Leg Minor Stop Control
Eastern 05 -00244 00244 0051303616 Discard 1 Difference between mean square prediction error (MSPE) of Virginia statewide model and OR model 2 Absolute value of the difference between Virginia statewide model MSPE and operational region model MSPE 3 Absolute value of the difference between Virginia statewide model MSPE and operational region model MSPE divided by the Virginia statewide MSPE for comparison
Retained SPFs Discarded if value is negative Discarded if less than 01
38
Table 20 MSPE Values for Virginia Rural Statewide and Rural Regional SPFs Used for Pruning Data Pruning
Subtype
Site
MSPE
[MSPEVA-MSPEOR]1
[abs(MSPEVA-MSPEOR)]2
[abs(MSPEVA-MSPEOR)MSPEVA]3
RetainDiscard
Total VA 1007 Northern 3422 -2415 2415 2398212512 Discard Western 605 402 402 0399205561 Retain Eastern 512 495 495 0491559086 Retain FI VA 26 Northern 976 -716 716 2753846154 Discard Western 159 101 101 0388461538 Retain
Rural 4-Leg Signalized
Eastern 137 123 123 0473076923 Retain Total VA 119 Northern 164 -045 045 0378151261 Discard Western 102 017 017 0142857143 Retain Eastern 114 005 005 0042016807 Discard FI VA 053 Northern 052 001 001 0018867925 Discard Western 048 005 005 0094339623 Discard
Rural 4-Leg Minor Stop Control
Eastern 049 004 004 0075471698 Discard Total VA 576 Northern 1475 -899 899 1560763889 Discard Western 674 -098 098 0170138889 Discard Eastern 626 -05 05 0086805556 Discard FI VA 171 Northern 212 -041 041 0239766082 Discard Western 403 -232 232 1356725146 Discard
Rural 3-Leg Signalized
Eastern 157 014 014 0081871345 Discard Total VA 073 Northern 093 -02 02 0273972603 Discard Western 053 02 02 0273972603 Retain Eastern 069 004 004 0054794521 Discard FI VA 026 Northern 03 -004 004 0153846154 Discard Western 023 003 003 0115384615 Retain
Rural 3-Leg Minor Stop Control
Eastern 027 -001 001 0038461538 Discard 1 Difference between mean square prediction error (MSPE) of Virginia statewide model and OR model 2 Absolute value of the difference between Virginia statewide model MSPE and operational region model MSPE 3 Absolute value of the difference between Virginia statewide model MSPE and operational region model MSPE divided by the Virginia statewide MSPE for comparison
Retained SPFs Discarded if value is negative Discarded if less than 01
39
Table 21 PSIs for Top 25 Sites in District 1 Urban (Bristol) FI
Crashes Ranking Based on Crash
Rates Ranking Based on Crash Ratio Ranking Based on EB
Method
Rank Intersection Node
Crash Rate1 PSI2 Intersection
Node Crash Ratio3 PSI Intersection
Node PSI
1 596726 22112 00000 651193 39672 00000 596095 21413
2 606469 20079 00000 606238 39298 06297 596393 08787
3 706818 12504 00000 651075 31264 00000 651130 08453
4 651193 11550 00000 596726 29227 00000 596701 07112 5 651075 09369 00000 606469 28039 00000 651802 06929 6 606238 08382 06297 651233 25831 03612 636331 06726 7 651807 07089 00000 651130 22718 08453 596395 06579 8 651233 06068 03612 706818 22555 00000 596937 06415 9 651230 05990 00000 651230 20301 00000 606238 06297
10 651783 05756 00000 651210 18882 04747 661033 06061 11 636093 04960 00000 636331 17913 06726 596372 05417 12 651274 04475 00000 651807 16847 00000 636372 04808 13 651130 04179 08453 651805 15814 00000 651210 04747 14 651210 03918 04747 651223 15627 03589 636491 04649 15 636331 03393 06726 651783 15009 00000 596420 04633 16 651223 03363 03589 596095 14865 21413 596403 04579 17 606232 03331 00000 636405 14769 00000 651603 04531 18 651127 03053 00000 661033 14555 06061 636056 04351 19 651999 03048 00000 596353 14215 03717 712033 04110 20 596449 02962 00000 636093 13782 00000 704691 04102 21 636405 02811 00000 651879 13192 00000 651838 04100 22 651883 02698 00000 651274 12975 00000 651894 03878 23 596353 02686 03717 651127 12972 00000 596353 03717 24 651805 02663 00000 651999 12959 00000 651233 03612 25 661033 02500 06061 596449 12702 00000 651889 03601
sum 43202 sum 64615 sum 149606 1Number of crashes per year per 1000000 total approach volume 2Potential for safety improvement (crashes yr) the difference between the EB-adjusted long-term crashes and the SPF-estimated crashes 3Ratio of actual crash rate to critical crash rate
40
Table 22 PSIs for Top 25 Sites in District 9 Urban (Northern Virginia District) FI
Crashes Ranking Based on Crash
Rates Ranking Based on Crash Ratio Ranking Based on EB
Method
Rank Intersection Node
Crash Rate1 PSI2 Intersection
Node Crash Ratio3 PSI Intersection
Node PSI
1 718192 191841 00000 718192 257523 00000 264119 150122 2 702946 178194 00000 547722 152371 11175 263375 140091 3 271531 64846 00000 263628 102794 00000 278648 137239 4 263628 52858 00000 263728 100092 00000 276819 131395 5 263728 42215 00000 719754 95274 09444 263290 130743 6 266955 35294 00000 702946 79268 00000 722678 127897 7 547722 34932 11175 263403 77252 05184 264725 118671 8 702612 30441 00000 704237 77175 07648 267028 116627 9 273886 29539 00000 263729 74681 00000 265204 115925
10 716747 27632 00000 271531 72327 00000 274766 115679 11 263626 27139 00000 263135 66458 18068 263249 113372 12 269485 26567 00000 716747 64461 00000 547044 110769 13 728954 26344 00000 266955 56657 00000 549349 107180 14 263729 25208 00000 546138 52003 31028 268210 105630 15 546988 21922 00000 547544 51924 32529 263347 104257 16 274338 21446 00000 263626 50389 00000 276351 102313 17 429308 21354 00000 269485 49897 00000 428167 100064 18 720401 21197 00000 728954 49702 00000 264344 98789 19 267295 20954 00000 548686 49572 03621 277764 91554 20 267536 20874 00000 711601 47985 04440 263467 89259 21 265938 20484 00000 266970 47730 00000 263090 89199 22 273354 20108 00000 546462 46856 03620 703414 88610 23 268345 19362 00000 265938 46726 00000 428629 87379 24 719754 19073 09444 720401 44833 00000 272219 85659 25 263403 19015 05184 728496 43666 04990 428544 85610
Sum 25803 sum 131747 sum 2744033 1Number of crashes per year per 1000000 total approach volume 2Potential for safety improvement (crashes yr) the difference between the EB-adjusted long-term crashes and the SPF-estimated crashes 3Ratio of actual crash rate to critical crash rate
41
CONCLUSIONS
bull The development of SPFs for intersections is necessary for Virginia because the SafetyAnalyst-suggested SPFs which are based on Minnesota data do not represent the Virginia data well Regarding the fit of the SPFs to Virginia data the R2
FT values shown in Tables 13 through 16 for Minnesota and Virginia indicate that the Virginia-specific SPFs fit the Virginia data better than the Minnesota models This may be due to the dissimilarities of the roadside environment such as difference in topography and the characteristics of the different Virginia and Minnesota databases
bull In some cases the specific regional SPFs fit the regional data better than the statewide
SPFs suggesting that the specific SPFs should be considered for use when available These group divisions that have similar roadway characteristics and driver expectations in some cases tend to improve the fit
bull In identifying intersection sites for safety improvements it is clearly beneficial for the EB
method to be used with the suitable SPFs rather than a crash rate or critical ratio method Results of the site prioritization show a much higher potential for crash reduction when the EB method is used with the appropriate SPFs rather than a procedure based on crash rates or critical rates
RECOMMENDATIONS
1 VDOTrsquos TED should use the Virginia-specific SPFs when using the SafetyAnalyst tools The results of this study have shown that the Virginia-specific SPFs reflected the Virginia data better than the SafetyAnalyst-recommended Minnesota SPFs
2 VDOTrsquos TED should investigate the feasibility of using multiple SPFs in SafetyAnalyst If
feasible regional SPFs should be used If it is not currently feasible to use multiple SPFs VDOTrsquos TED should ask that the FHWA include regional information in SafetyAnalyst so as to allow the use of regional SPFs For the specific regional SPFs to be applied to Virginia and other states the SafetyAnalyst tool should be capable of incorporating the necessary data that support the regional models
3 As soon as it is feasible to use regional SPFs VDOTrsquos TED should use the 19 SPFs
developed for urban intersections and the 15 developed for rural intersections when using the tools in SafetyAnalyst Although the statewide SPFs are available for use by an analyst the specific regional models included in the final set of SPFs will predict crashes better than the statewide SPFs The regional analysis will not only ease the use of specific regional SPFs but will also be of benefit when predicting the potential for safety improvement of a specific site
4 For future similar SPF studies VDOTrsquos TED should be directly involved in screening the
traffic data for accuracy and consistency as was done in this study The direct involvement of the TED in the screening of the traffic data significantly contributed to the accuracy of the
42
data and greatly contributed to the confidence the researchers place on the data used in the study
5 The Virginia Transportation Research Council (VTRC) should conduct a study as soon as
feasible to verify whether incorporating independent variables for which data are available other than AADT such as intersection geometry and other characteristics will result in SPFs that better fit the Virginia data Although the currently suggested SafetyAnalyst SPFs use only the AADTs as the independent variables it is likely that provision will be made for use of SPFs that incorporate other independent variables such as number of approaches entering lanes and the other variables for which data are available as these SPFs are likely to give better fit to crash data
6 As soon as feasible VTRC should undertake a study to develop SPFs for the urban system
intersections which are not currently maintained by VDOT as these intersections may have different crash characteristics than those maintained by VDOT This would facilitate the use of SafetyAnalyst in programming sites that are currently not being maintained by VDOT
BENEFITS AND IMPLEMENTATION PROSPECTS
Significant benefits will be accrued by the use of the Virginia-specific SPFs developed in this study This is clearly illustrated in two ways First in examining the transferability of the suggested SPFs in SafetyAnalyst it is clear that these SPFs do not fit the Virginia data very well The results also indicate that the Virginia-specific SPFs fit the Virginia data much better than the suggested SafetyAnalyst SPFs Second the availability of the Virginia-specific SPFs will enhance the use of the EB procedure given in SafetyAnalyst for prioritizing sites for safety improvements This study has also shown that the EB method better identifies sites with higher potential for crash reduction than those identified by crash rates For example the illustrated examples given for the Bristol and Northern Virginia districts show that the potential reduction in FI crashes when the top 25 sites are identified by the EB method is 28936 (1496 + 27440) crashes per year whereas that obtained when the critical crash ratio method is used for prioritization is only 1963 (646 + 1317) and that obtained with the crash rate method is only 690 (432 + 258) crashes per year This gives a net benefit of 26973 potential crashes per year compared to the critical crash ratio method and 28246 compared to the crash rate method Assuming an average cost of FI crashes of $95629 (FHWA 2005) and only 10 of the estimated net benefit PSI of 28246 crashes per year is achieved the total savings of more than $27 million per year could be accrued The prospects for implementation of the recommendations are very high as the study was requested by VDOTrsquos TED which is planning to incorporate these SPFs in the use of the tools provided in SafetyAnalyst
43
ACKNOWLEDGMENTS
The authors appreciate the opportunity afforded them by VDOT and VTRC to conduct this study Special thanks to Stephen Read (VDOT) Dr In-Kyu Lim (VDOT) Dr Young-Jun Kweon (VTRC) and VDOTrsquos Central Office for their interest and support in SPFs and their help in the selection of intersection sites Many thanks to Lewis Woodson (VTRC) and James Hill (University of Virginia) for all their help and input throughout the study
REFERENCES Cogburn P VDOT Interagency Coordination 2007 Virginia Emergency Management
Conference Virginia Department of Transportation Richmond April 2007 Colorado Department of Transportation DTD Applied Research and Innovation Branch Safety
Performance Functions for Intersections CDOT-2009-10 Denver December 2009 Fridstroslashm L Ifver J Ingebrigtsen S Kulmala R and Thomsen LK Measuring the
Contribution of Randomness Exposure Weather and Daylight to the Variation in Road Accidents Counts Accident Analysis and Prevention Vol 27 No 1 1995 pp 1-20
Federal Highway Administration Cost of Crashes by Severity Table FHWA-HRT-05-051
Washington DC 2005 Federal Highway Administration SafetyAnalyst Home Page httpwwwsafetyanalystorg
Accessed February 2010 Garber N and Hoel L Traffic amp Highway Engineering 4th ed Cenage Learning Toronto
Canada 2009 Garber NJ Haas PR and Gosse C Development of Safety Performance Functions for Two-
Lane Roads Maintained by the Virginia Department of Transportation VTRC 10-R25 Virginia Transportation Research Council Charlottesville 2010
Hamidi A Fontaine MD and Demetsky MJ A Planning-Level Methodology for Identifying
High-Crash Sections of Virginiarsquos Primary System VTRC 11-R4 Virginia Transportation Research Council Charlottesville 2010
Harwood D Council FM Hauer E Hughes WE and Vogt A Prediction of the Expected
Safety Performance of Rural Two-lane Highways Federal Highway Administration McLean VA December 2000
Harwood DW Bauer KM Richard KR Gilmore DK Persaud B and Lyon C
Development of SPFs for Safety Analyst Interim Tools Technical Memorandum
44
Prepared by Midwest Research Institute for the Federal Highway Administration McLean VA 2004
ITT Corporation SafetyAnalyst Userrsquos Manual Turner-Fairbank Highway Research Center
McLean VA 2008 Jonsson T Ivan J and Zhang C Crash Prediction Models for Intersections on Rural
Multilane Highways Differences by Collision Type In Transportation Research Record Journal of the Transportation Research Board No 2019 Transportation Research Board of the National Academies Washington DC 2007 pp 91-98
Kweon Y-J and Lim I-K Appropriate Regression Model Types for the Empirical Bayes
Method and SafetyAnalyst In Proceedings of the 89th Annual Meeting of the Transportation Research Board Transportation Research Board of the National Academies Washington DC 2010
Kononov J Bailey B and Allery B Exploratory Examination of the Functional Form of
Safety Performance Functions of Urban Freeways Colorado Department of Transportation and San Diego State University Denver CO 2008
Lyon C Haq A Persaud B and Kodama S Safety Performance Functions for Signalized
Intersections in Large Urban Areas Development and Application to Evaluation of Left-Turn Priority Treatment In Transportation Research Record Journal of the Transportation Research Board No 1908 Transportation Research Board of the National Academies Washington DC 2005 pp 165-171
Lord D and Persaud B Estimating the Safety Performance of Urban Road Transportation
Networks Center for Transportation Safety Texas Transportation Institute Texas AampM University and Department of Civil Engineering Ryerson University College Station TX 2003 pp 609-620
Miaou S-P Lu A and Lum H S Pitfalls of using R2 to Evaluate Goodness of Fit of
Accident Prediction Models In Transportation Research Record Journal of the Transportation Research Board No 1542 Transportation Research Board of the National Academies Washington DC 2005 1996 pp 6-13
Miller P Re Negative R squared Email Archive Division of Biostatistics Washington
University in St Louis February 2 2005 February 2 2005 httpwwwbiostatwustleduarchiveshtmljmp-l2005msg00075html Accessed February 2010
Persaud B Lord D and Palmisano J Calibration and Transferability of Accident Prediction
Models for Urban Intersections In Transportation Research Record Journal of the Transportation Research Board No 1784 Transportation Research Board of the National Academies Washington DC 2002 pp 57-64
45
Persaud B and Nguyen T Disaggregate Safety Performance Models for Signalized Intersections on Ontario Provincial Roads In Transportation Research Record Journal of the Transportation Research Board No 1635 Transportation Research Board of the National Academies Washington DC 1998 pp 113-120
Pham T and Ragland D Summary of Crash Prediction Models Also known as Safety
Performance Functions (SPFs) California Partners for Advanced Traffic and Highways and University of California Berkeley Berkeley 2005
SAS Institute Inc SAS OnlineDoc Version Eight Cary NC
httpwwwtecnionacildocssasril Accessed 2009 Tegge RA Jo J-H and Ouyang Y Development and Application of Safety Performance
Functions for Illinois ICT-10-066 Illinois Center for Transportation University of Illinois Urbana-Champaign March 2010
Virginiarsquos Surface Transportation Safety Executive Committee Commonwealth of Virginiarsquos
Strategic Highway Safety Plan 2006-2010 Virginia Department of Transportation Richmond 2006
Washington S Persaud B Lyon C and Oh J Validation of Accident Models for
Intersections FHWA-RD-03-037 Federal Highway Administration McLean VA 2005
46
47
APPENDIX A
STATISTICAL PARAMETERS AND GOODNESS-OF-FIT RESULTS
Table A-1 Statistical Parameters for Urban Intersections SPFs Parameter Estimates
Data Intercept
Coefficient of Mayor AADT
Coefficient of Minor AADT
Subtype Site Intercept (α)
StndError
P value
lnMajor (β1)
StndError
P value
lnMinor (β2)
StndError
P value
Total VA -76234 048 lt0001 06742 005 lt0001 03453 003 lt0001
OR1 -83067 056 lt0001 07522 005 lt0001 0328 003 lt0001OR10 -123913 122 lt0001 10631 013 lt0001 04567 006 lt0001OR 100 -88553 077 lt0001 07825 007 lt0001 03706 004 lt0001FI VA -85256 057 lt0001 06477 006 lt0001 03579 004 lt0001OR1 -96546 063 lt0001 07603 006 lt0001 03597 004 lt0001OR10 -114284 15 lt0001 08662 016 lt0001 04412
Urban 4-Leg Signalized
OR 100 -99582 100 lt0001 07484 009 lt0001 04017 005 lt0001Total VA -60723 022 lt0001 04558 002 lt0001 0347 004 lt0001
OR1 -6059 044 lt0001 0505 004 lt0001 02773 006 lt0001OR10 -67031 057 lt0001 03986 007 lt0001 04999 009 lt0001OR 100 -65388 032 lt0001 04689 004 lt0001 043 006 lt0001FI VA -76917 032 lt0001 05001 003 lt0001 03695 005 lt0001OR1 -81437 060 lt0001 05813 005 lt0001 03188 008 lt0001OR10 -80333 063 lt0001 03446 007 lt0001 06218 010 lt0001
Urban 4-Leg Minor Stop Control
OR 100 -83166 051 lt0001 05253 006 lt0001 04695 008 lt0001Total VA -6543 082 lt0001 06591 008 lt0001 02119 002 lt0001
OR1 -4999 103 lt0001 05555 009 lt0001 01554 003 lt0001OR10 -96143 127 lt0001 08677 012 lt0001 03297 005 lt0001OR 100 -67518 110 lt0001 06157 011 lt0001 02969 005 lt0001FI VA -84268 068 lt0001 07147 006 lt0001 02481 002 lt0001OR1 -73982 099 lt0001 06496 009 lt0001 02088 003 lt0001OR10 -110104 155 lt0001 0908 015 lt0001 03226 006 lt0001
Urban 3-Leg Signalized
OR 100 -7266 107 lt0001 05508 011 lt0001 03107 006 lt0001Total VA -54696 013 lt0001 04874 002 lt0001 01985 001 lt0001
OR1 -5361 018 lt0001 04959 002 lt0001 01676 002 lt0001OR10 -5773 034 lt0001 04877 003 lt0001 02314 004 lt0001OR 100 -51642 021 lt0001 04338 003 lt0001 02309 003 lt0001FI VA -74642 018 lt0001 05791 002 lt0001 02091 002 lt0001OR1 -76877 027 lt0001 06204 003 lt0001 0181 002 lt0001OR10 -69458 047 lt0001 05096 004 lt0001 02212 005 lt0001
Urban 3-Leg Minor Stop Control
OR 100 -69883 031 lt0001 05169 004 lt0001 02308 003 lt0001 Standard Error
48
Table A-2 Statistical Parameters for Rural Intersections SPFs Parameter Estimates
Data Intercept
Coefficient of Mayor AADT
Coefficient of Minor AADT
Subtype Site Intercept (α)
StndError
P value
lnMajor (β1)
Stnd Error
P value
lnMinor (β2)
Stnd Error
P value
Total VA -69589 118 lt0001 06746 009 lt0001 0253 009 00047
OR1 -1604 237 04974 02284 021 02791 01514 012 0211 OR10 -63951 183 00005 05508 014 00001 03106 014 00224 OR 100 -06468 220 07692 02262 016 01635 -00158 017 09274 FI VA -87116 128 lt0001 07839 011 lt0001 02166 009 0013 OR1 -33285 246 01767 03601 024 0126 00597 013 06478 OR10 -80583 175 lt0001 06809 018 00001 02557 013 0057
Rural 4-Leg Signalized
OR 100 -48381 221 00287 04243 018 00193 01523 018 03943 Total VA -5494 020 lt0001 03533 002 lt0001 03935 003 lt0001
OR1 -62351 058 lt0001 04167 006 lt0001 04507 008 lt0001OR10 -53594 028 lt0001 03379 003 lt0001 03998 004 lt0001OR 100 -51255 027 lt0001 02914 003 lt0001 04075 004 lt0001FI VA -66927 030 lt0001 03899 003 lt0001 04156 004 lt0001OR1 -82561 095 lt0001 05221 009 lt0001 04962 012 lt0001OR10 -70797 044 lt0001 03789 004 lt0001 0497 005 lt0001
Rural 4-Leg Minor Stop Control
OR 100 -63326 038 lt0001 03223 004 lt0001 04424 005 lt0001Total VA -75754 084 lt0001 06465 008 lt0001 03332 008 lt0001
OR1 -58798 220 00075 05076 020 00143 0313 013 00161 OR10 -64368 110 lt0001 0544 011 lt0001 02863 006 lt0001OR 100 -9899 139 lt0001 08047 015 lt0001 04386 006 lt0001FI VA -87112 103 lt0001 07224 010 lt0001 02578 006 lt0001OR1 -9219 260 00004 07258 022 00011 03407 016 00326 OR10 -88607 146 lt0001 07059 016 lt0001 02809 008 00009
Rural 3-Leg Signalized
OR 100 -111835 185 lt0001 08669 018 lt0001 03977 008 lt0001Total VA -43293 008 lt0001 03366 001 lt0001 02087 001 lt0001
OR1 -50904 022 lt0001 0406 002 lt0001 02752 003 lt0001OR10 -40969 009 lt0001 03133 001 lt0001 02001 001 lt0001OR 100 -4231 016 lt0001 02997 002 lt0001 02308 003 lt0001FI VA -53415 011 lt0001 03394 001 lt0001 02237 001 lt0001OR1 -64457 031 lt0001 04195 003 lt0001 0307 004 lt0001OR10 -50831 014 lt0001 03245 002 lt0001 02014 002 lt0001
Rural 3-Leg Minor Stop Control
OR 100 -51046 024 lt0001 03163 003 lt0001 02112 003 lt0001
Standard Error
49
Table A-3 SPFs Goodness of Fit Results for Urban Northern Operational Region (No 1)
Data Estimation Data 70 Validation Data 30
Subtype Site MSE r2 R2FT MPB MAD MSPE R2
FT
Total VA 41150 0529 0557 -0760 4329 38490 0575
Total R1 4110 051 0551 -020 464 4486 054
FI VA 704 038 0406 -046 194 767 048
Urban 4-Leg Signalized
FI R1 809 039 0439 012 214 950 038
Total VA 224 031 0313 -003 090 238 029
Total R1 308 028 0286 008 095 200 032
FI VA 053 019 0193 000 043 053 019
Urban 4-Leg Minor Stop Control
FI R1 064 018 0187 003 043 048 021
Total VA 2490 038 0370 -064 352 2759 037
Total R1 3034 032 0305 -015 365 2687 037
FI VA 447 028 0259 -019 153 488 026
Urban 3-Leg Signalized
FI R1 559 025 0231 004 157 448 029
Total VA 185 025 0230 -004 089 204 024
Total R1 208 026 0239 -006 094 219 026
FI VA 043 015 0133 -002 043 048 016
Urban 3-Leg Minor Stop Control
FI R1 047 017 0156 -001 044 050 017
50
Table A-4 SPFs Goodness of Fit Results for Urban Western Operational Region (No 10)
Data Estimation Data 70 Validation Data 30
Subtype Site MSE r2 R2FT MPB MAD MSPE R2
FT
Total VA 41150 0529 0557 -0760 4329 38490 0575
Total R10 21976 0777 0735 1290 3233 17910 0686
FI VA 7043 0385 0406 -0458 1938 7671 0475
Urban 4-Leg Signalized
FI R10 4280 0526 0500 0377 1597 5170 0452
Total VA 2238 0315 0313 -0034 0897 2383 0292
Total R10 1161 0361 0300 -0032 0740 1050 0188
FI VA 0530 0194 0193 -0004 0432 0533 0194
Urban 4-Leg Minor Stop Control
FI R10 0312 0197 0187 0000 0382 0330 0009
Total VA 24900 0375 0370 -0645 3519 27591 0369
Total R10 14446 0451 0397 -0168 2801 24410 0255
FI VA 4467 0275 0259 -0185 1527 4875 0262
Urban 3-Leg Signalized
FI R10 3077 0266 0216 0039 1258 3390 0115
Total VA 1854 0254 0230 -0043 0893 2038 0239
Total R10 1391 0233 0197 -0054 0800 1640 0207
FI VA 0428 0151 0133 -0021 0431 0476 0157
Urban 3-Leg Minor Stop Control
FI R10 0354 0111 0089 -0019 0404 0380 0125
51
Table A-5 SPFs Goodness of Fit Results for Urban Eastern Operational Region (No 100)
Data Estimation Data 70 Validation Data 30
Subtype Site MSE r2 R2FT MPB MAD MSPE R2
FT
Total VA 41150 0529 0557 -0760 4329 38490 0575
Total R100 31108 0632 0630 0243 4717 37450 0005
FI VA 7043 0385 0406 -0458 1938 7671 0475
Urban 4-Leg Signalized
FI R100 5201 0480 0454 -0098 1864 5410 0244
Total VA 2238 0315 0313 -0034 0897 2383 0292
Total R100 1720 0443 0381 0087 0758 1150 0003
FI VA 0530 0194 0193 -0004 0432 0533 0194
Urban 4-Leg Minor Stop Control
FI R100 0509 0273 0254 0049 0383 0360 0173
Total VA 24900 0375 0370 -0645 3519 27591 0369
Total R100 17782 0410 0410 -1753 0908 38780 0004
FI VA 4467 0275 0259 -0185 1527 4875 0262
Urban 3-Leg Signalized
FI R100 3194 0243 0263 -0615 1645 5860 0236
Total VA 1854 0254 0230 -0043 0893 2038 0239
Total R100 1561 0233 0210 -0127 0902 2230 0002
FI VA 0428 0151 0133 -0021 0431 0476 0157
Urban 3-Leg Minor Stop Control
FI R100 0387 0131 0116 -0043 0444 0500 0141
52
Table A-6 SPFs Goodness of Fit Results for Rural Northern Operational Region (No 1)
Data Estimation Data 70
Validation Data 30
Subtype Site MSE r2 R2FT MPB MAD MSPE R2
FT
Total VA 10990 0353 0321 0513 2210 10070 -0073
Total R1 20080 0118 0092 -1389 3661 34220 0212
FI VA 2350 0196 0181 0045 1189 2600 -0034
Rural 4-Leg Signalized
FI R1 2920 0057 0052 -1173 1931 9760 0028
Total VA 1090 0182 0167 -0067 0794 1190 0171
Total R1 1990 0190 0245 0001 0942 1640 0173
FI VA 0480 0112 0098 -0022 0504 0530 0110
Rural 4-Leg Minor Stop Control
FI R1 0920 0093 0112 0020 0541 0520 0009
Total VA 5490 0328 0305 -0010 1651 5760 0179
Total R1 11110 0182 0254 -0679 2271 14750 0497
FI VA 1450 0181 0170 -0041 0902 1710 0099
Rural 3-Leg Signalized
FI R1 3230 0131 0153 -0116 1006 2120 0355
Total VA 0690 0144 0104 -0008 0613 0730 0102
Total R1 1210 0245 0196 0030 0712 0930 0126
FI VA 0250 0071 0048 -0009 0345 0260 0048
Rural 3-Leg Minor Stop Control
FI R1 0340 0124 0093 0016 0366 0300 0052
53
Table A-7 SPFs Goodness of Fit Results for Rural Western Operational Region (No 10)
Data Estimation Data 70 Validation Data 30
Subtype Site MSE r2 R2FT MPB MAD MSPE R2
FT
Total VA 10990 0353 0321 0513 2210 10070 -0073
Total R10 6020 0311 0268 0007 1748 6050 0382
FI VA 2350 0196 0181 0045 1189 2600 -0034
Rural 4-Leg Signalized
FI R10 1880 0158 0139 0097 0945 1590 0254
Total VA 1090 0182 0167 -0067 0794 1190 0171
Total R10 1300 0196 0163 0070 0760 1020 0078
FI VA 0480 0112 0098 -0022 0504 0530 0110
Rural 4-Leg Minor Stop Control
FI R10 0560 0142 0118 0025 0495 0480 0014
Total VA 5490 0328 0305 -0010 1651 5760 0179
Total R10 3690 0163 0170 -0432 0748 6740 0039
FI VA 1450 0181 0170 -0041 0902 1710 0099
Rural 3-Leg Signalized
FI R10 0890 0124 0117 -0391 0997 4030 -0066
Total VA 0690 0144 0104 -0008 0613 0730 0102
Total R10 0640 0126 0091 0025 0583 0580 0055
FI VA 0250 0071 0048 -0009 0345 0260 0048
Rural 3-Leg Minor Stop Control
FI R10 0240 0062 0041 0003 0335 0230 0028
54
Table A-8 SPFs Goodness of Fit Results for Rural Eastern Operational Region (No 100)
Data Estimation Data 70 Validation Data 30
Subtype Site MSE r2 R2FT MPB MAD MSPE R2
FT
Total VA 10990 0353 0321 0513 2210 10070 -0073
Total R100 10120 0042 0027 1207 1882 5120 -0307
FI VA 2350 0196 0181 0045 1189 2600 -0034
Rural 4-Leg Signalized
FI R100 2060 0053 0039 0119 0962 1370 -0023
Total VA 1090 0182 0167 -0067 0794 1190 0171
Total R100 0960 0170 0149 -0086 0746 1140 0209
FI VA 0480 0112 0098 -0022 0504 0530 0110
Rural 4-Leg Minor Stop Control
FI R100 0440 0106 0092 -0031 0475 0490 0121
Total VA 5490 0328 0305 -0010 1651 5760 0179
Total R100 2770 0492 0459 0601 1759 6260 0090
FI VA 1450 0181 0170 -0041 0902 1710 0099
Rural 3-Leg Signalized
FI R100 1040 0265 0255 0124 0923 1570 -0055
Total VA 0690 0144 0104 -0008 0613 0730 0102
Total R100 0640 0125 0087 -0037 0601 0690 0119
FI VA 0250 0071 0048 -0009 0345 0260 0048
Rural 3-Leg Minor Stop Control
FI R100 0250 0064 0038 -0013 0345 0270 0062
55
APPENDIX B
RECOMMENDED SAFETY PERFORMANCE FUNCTION MODELS
Table B-1 Recommended Urban SPFs Site Virginia SPF Models to Be Used for Urban Intersections
Urban 4-Leg Signalized Total Virginia generic total
Urban 4-Leg Signalized
Operational Region 1 generic total
Urban 4-Leg Signalized
Operational Region 10
use specified model developed
Urban 4-Leg Signalized
Operational Region 100 generic total
Urban 4-Leg Signalized FI Virginia generic FI
Urban 4-Leg Signalized
Operational Region 1 generic FI
Urban 4-Leg Signalized
Operational Region 10
use specified model developed
Urban 4-Leg Signalized
Operational Region 100
use specified model developed
Urban 4-Leg Minor Stop Control
Total Virginia generic total
Urban 4-Leg Minor Stop Control
Operational Region 1
use specified model developed
Urban 4-Leg Minor Stop Control
Operational Region 10
use specified model developed
Urban 4-Leg Minor Stop Control
Operational Region 100
use specified model developed
Urban 4-Leg Minor Stop Control
FI Virginia generic FI e^-76917MajADT^05001MinADT^03695
Urban 4-Leg Minor Stop Control
Operational Region 1
use specified model developed
Urban 4-Leg Minor Stop Control
Operational Region 10
use specified model developed
Urban 4-Leg Minor Stop Control
Operational Region 100
use specified model developed
56
Table B-1 Recommended Urban SPFs (Continued)
Site Virginia SPF Models to Be Used for Urban Intersections
Urban 3-Leg Signalized
Total Virginia
use generic model developed for total
crashes
Urban 3-Leg Signalized
Operational Region 1
use generic model developed for total
crashes
Urban 3-Leg Signalized
Operational Region 10
use specific regional model
developed
Urban 3-Leg Signalized
Operational Region 100
use generic model developed for total
crashes
Urban 3-Leg Signalized FI Virginia
use generic model developed for FI
crashes
Urban 3-Leg Signalized
Operational Region 1
use generic model developed for FI
crashes
Urban 3-Leg Signalized
Operational Region 10
use specific regional model
developed
Urban 3-Leg Signalized
Operational Region 100
use generic model developed for FI
crashes
Urban 3-Leg Minor Stop Control
Total Virginia
use generic model developed for total
crashes
Urban 3-Leg Minor Stop Control
Operational Region 1
use generic model developed for total
crashes
Urban 3-Leg Minor Stop Control
Operational Region 10
use specific regional model
developed
Urban 3-Leg Minor Stop Control
Operational Region 100
use generic model developed for total
crashes
Urban 3-Leg Minor Stop Control
FI Virginia use generic model developed for FI
crashes
Urban 3-Leg Minor Stop Control
Operational Region 1
use generic model developed for FI
crashes
Urban 3-Leg Minor Stop Control
Operational Region 10
use specific regional model
developed
Urban 3-Leg Minor Stop Control
Operational Region 100
use generic model developed for FI
crashes
57
Table B-2 Recommended Rural SPFs Site Virginia SPF Models to Be Used for Rural Intersections
Rural 4-Leg Signalized Total Virginia
use generic model developed for total
crashes
Rural 4-Leg Signalized
Operational Region 1
use generic model developed for total
crashes
Rural 4-Leg Signalized
Operational Region 10
use specific regional model developed
Rural 4-Leg Signalized
Operational Region 100
use specific regional model developed
Rural 4-Leg Signalized FI Virginia use generic model
developed for FI crashes
Rural 4-Leg Signalized
Operational Region 1
use generic model developed for FI crashes
Rural 4-Leg Signalized
Operational Region 10
use specific regional model developed
Rural 4-Leg Signalized
Operational Region 100
use specific regional model developed
Rural 4-Leg Minor Stop Control Total Virginia
use generic model developed for total
crashes
Rural 4-Leg Minor Stop Control
Operational Region 1
use generic model developed for total
crashes e^-549MajADT^035MinADT^039
Rural 4-Leg Minor Stop Control
Operational Region 10
use specific regional model developed
Rural 4-Leg Minor Stop Control
Operational Region 100
use generic model developed for total
crashes
Rural 4-Leg Minor Stop Control FI Virginia use generic model
developed for FI crashes
Rural 4-Leg Minor Stop Control
Operational Region 1
use generic model developed for FI crashes
Rural 4-Leg Minor Stop Control
Operational Region 10
use generic model developed for FI crashes
Rural 4-Leg Minor Stop Control
Operational Region 100
use generic model developed for FI crashes
58
Table B-2 Recommended Rural SPFs (Continued)
Site Virginia SPF Models to Be Used for Rural Intersections
Rural 3-Leg Signalized Total Virginia use generic model
developed for total crashes
Rural 3-Leg Signalized
Operational Region 1
use generic model developed for total crashes
Rural 3-Leg Signalized
Operational Region 10
use generic model developed for total crashes
Rural 3-Leg Signalized
Operational Region 100
use generic model developed for total crashes
Rural 3-Leg Signalized FI Virginia use generic model
developed for FI crashes
Rural 3-Leg Signalized
Operational Region 1
use generic model developed for FI crashes
Rural 3-Leg Signalized
Operational Region 10
use generic model developed for FI crashes
Rural 3-Leg Signalized
Operational Region 100
use generic model developed for FI crashes
Rural 3-Leg Minor Stop Control Total Virginia use generic model
developed for total crashes
Rural 3-Leg Minor Stop Control
Operational Region 1
use generic model developed for total crashes
Rural 3-Leg Minor Stop Control
Operational Region 10
use specific regional model developed
Rural 3-Leg Minor Stop Control
Operational Region 100
use generic model developed for total crashes
Rural 3-Leg Minor Stop Control FI Virginia use generic model
developed for FI crashes
Rural 3-Leg Minor Stop Control
Operational Region 1
use generic model developed for FI crashes
Rural 3-Leg Minor Stop Control
Operational Region 10
use specific regional model developed
Rural 3-Leg Minor Stop Control
Operational Region 100
use generic model developed for FI crashes

14
s = subtype index (s = urban four-leg signalized intersection rural three-leg minor stop controlled intersection etc) t = severity index (t = TOT [total crashes] FI [fatal + injury crashes] PDO [property damage only]) y = year index (i = 1 [base year] 2 hellip Y) csty = yearly calibration factor for crash subtype s severity t and year y MajAADT = AADT on the major road (vehday) MinAADT = AADT on the minor road (vehday)
istyκ~ = (unadjusted) predicted number of crashes at intersection i for crash subtype s severity t and year y
istyκ = (adjusted) predicted number of crashes at intersection i for crash subtype s severity t and year y α = intercept
1β = coefficient of major AADT 2β = coefficient of minor AADT
These yearly calibration factors were then used to determine the predicted number of
crashes at an intersection based on the SPF for the severity of crashes and type of intersection being considered The PSI for each intersection was then determined using the steps described in Equations 19 through 22 (ITT Corporation 2008) Steps for Calculating PSI for Subtype s
1 Calculate the (adjusted) predicted number of crashes
amp~
21ˆˆˆ ststst
isyisysty
istystyisty
MinAADTMajAADTec
yticββα
κκ
timestimestimes=
foralltimes= (Eq 19)
2 Calculate yearly correction factor Cisty
ytiCyist
istyisty amp
)1(
forall==κ
κ
(Eq 20)
3 Calculate EB weight
tid
w Y
y istystist amp
11
1
foralltimes+
=sum =
κ (Eq 21)
4 Calculate the EB-adjusted estimated number of crashes for year 1
15
tiC
KwwX Y
y isty
Y
y istyistyististyist amp)1(
1
1)1()1( forallminus+times=
sumsum
=
=== κ (Eq 22)
5 Determine the PSI for each intersection If istYX gt istYκ include intersection i in the list for prioritization using istYPSI = istYX
where i = intersection index (i = 1hellip N) s = subtype index (s = urban four-leg signalized intersection rural three-leg minor stop
controlled intersection etc) t = severity index (t = TOT [total crashes] FI [fatal + injury crashes] PDO [property damage
only]) y = year index (y = 1 [base year] 2 hellip Y) cy = yearly calibration factor for crash subtype s severity t and year y d = dispersion parameter w = weight MajAADT = AADT on the major road (vehday) MinAADT = AADT on the minor road (vehday) PSI = potential for safety improvement
istyC = yearly correction factor
istyκ~ = (unadjusted) predicted number of crashes at intersection i for crash subtype s severity t and year y
istyκ = (adjusted) predicted number of crashes at intersection i for crash subtype s severity t and year y
istyX = EB-adjusted estimated number of crashes α = intercept
1β = coefficient of major AADT 2β = coefficient of minor AADT
The prioritization lists for urban two-lane roads in the Northern Virginia and Bristol
districts were then developed based on the PSIs obtained for three prioritization procedures These alternative prioritization procedures were the average crash rates (ACRs) for the study period (see Equation 23) the critical crash ratio (CCR) (see Eqs 24 through 27) (Garber and Hoel 2009) and the EB method The list was developed with the intersections having the highest PSI listed first followed by other intersections in descending order The execution of the EB method prioritization process was achieved through use of the computer codes in SAS Finally the effectiveness of using the EB method for prioritizing sites for safety improvement was illustrated by comparing the PSIs from using intersection crash rates critical crash and the EB procedures
16
Procedure for Crash Rate Method The ACR for the intersection is given as
( )(1000000)( )( )(365)T
TCACRN V
= (Eq 23)
where ACR = the average crash rate for the intersection under consideration (crashes1000000
approach volume) TC = number of crashes over the study period at the intersection N = duration of study period (yr) VT = average daily total approach volume at the intersection Procedure for Critical Rate Method
The critical rate method was accomplished by first computing the traffic base (TB) of the intersection under consideration using Equation 24 The ACR for the intersection under consideration is then computed using its TB as shown in Equation 25 The intersection critical crash rate (ICCR) is then determined using Equation 26 The critical crash ratio (CCR) for the intersection is then computed as the ratio of ICR and the average crash rate (AVR) for all intersections under the same category (intersection type urbanrural etc) as that for the intersection being considered using Equation 27 TB is given as
365
1 000 000
NxVxTB = (Eq 24)
where TB = the total approach volume over the study period of N years at the intersection under consideration (veh1000000) V = average daily approach volume at the intersection under consideration ACR is obtained as
TCACRTB
= (Eq 25)
where ACR = ACR at the intersection under consideration over the study period of N years
17
TB = the total approach volume over the study period of N years at the intersection under consideration (veh1000000) The critical crash rate (ICCR) for the intersection under consideration is given as
05 AVRICCR AVR TFTB TB
= + + (Eq 26)
where AVR = ACR for intersections within the state and of the same designation (eg rural three-leg with minor stop control) as that for the intersection under consideration TF = number of standard deviations for the confidence level being used in the analysis (usually 196 for 95 confidence level) TB = the total approach volume over the study period of N years at the intersection under consideration (veh1000000) The critical crash ratio (CCR) for the intersection is then obtained as
ACRCCRICCR
= (Eq 27)
where ACR = ACR at the intersection under consideration over the study period of N years (see Eq 2) ICCR = critical crash rate for the intersection under consideration (see Eq 26)
Benefits and Implementation Expectations
The expected benefits from developing SPFs and prioritizing intersection sites were illustrated by comparing the PSIs for the prioritized sites when sites were prioritized using the EB method with those obtained when sites were prioritized using crash rates and the critical crash ratio This analysis was conducted for the combined fatal plus injury crashes SPFs An estimate of the cost savings attributable solely to the potential reduction of crashes was also computed by using crash costs given in an FHWA study (FHWA 2005)
18
RESULTS AND DISCUSSION
Literature Review
SafetyAnalyst
The SafetyAnalyst Userrsquos Manual (ITT Corporation 2008) has SPFs that are suggested for intersections that are based on Minnesota data Tables 7 and 8 show the regression coefficients (α β1 and β2) for the SPFs developed for total and combined FI crashes respectively The values for the goodness of fit parameter RFT
2 are also given Although these RFT2 are all less
than 045 with a few less than 010 it has been suggested that the SPFs used in SafetyAnalyst could provide a realistic estimate of an expected crash frequency as a function of traffic volume and roadway geometry (Pham and Ragland 2005)
Methodological and Research References
Several studies similar to this study have been conducted in Canada Colorado California Texas New York and Minnesota For example a study was conducted using data from Colorado California and Texas to examine the functional form of the SPFs for urban freeways (Kononov et al 2008) Five years of crash data were acquired from the respective departments of transportation and the highway safety information system from Colorado The study revealed that the amount of crashes increased moderately with congestion in segments on urban freeways This study however did not include intersections
A study by Lyon et al was conducted in Toronto Ontario Canada to develop SPFs for urban signalized intersections (Lyon et al 2005) Collision data were gathered for five years and included 1950 urban intersections SPFs were developed for different severity levels impact types and intersection types such as four-leg and three-leg intersections The format used to develop the SPFs is shown in Equation 28 This format is somewhat different from that of Equation 4 suggested in Safety Analyst
Collisionsyear = α (F1)β1(F2)β2 exp (β3X1 + β4X2 + ) (Eq 28) where α and βi = the coefficients estimated in the SPF calibration process F1 and F2 = the entering AADTs on the major and minor roads respectively Xi = other independent variables (such as single lane versus multilane approaches with and without left-turn lanes or right-turn lanes high and low pedestrian activities or in some cases F1 or F2 or both)
19
Table 7 SafetyAnalystrsquos SPFs for Intersections (Total Crashes) Site
subtype Code
Site subtype Description
State Regression coefficients
LogIntercept (α)
Regression coefficients
LogAADTmaj (β1)
Regression coefficients LogAADT
min (β2)
Over - dispersion Parameter
(k)
RFT2
() Number of Sites
Max AADTmaj
(vehday)
Max AADTmin
(vehday)
Rural 201 Rural 3-leg with minor-
road STOP control MN -878 071 024 107 133 1706 28500 27000
202 Rural 3-leg with all-way STOP control
MN -1237 122 027 047 41 41 25300 6803
203 Rural 3-leg with signal control
MN -657 066 02 033 26 136 36400 11500
204 Rural 4-leg with minor-road STOP control
MN -896 065 047 07 299 2114 35500 26700
205 Rural 4-leg with all-way STOP control
MN -1237 122 027 047 41 41 25300 6803
206 Rural 4-leg with signal control
MN -657 066 02 033 26 136 36400 11500
Urban 251 Urban 3-leg with minor-
road STOP control MN -535 034 028 128 59 397 68000 18900
252 Urban 3-leg with all-way STOP control
MN -1237 122 027 047 41 41 25300 6803
253 Urban 3-leg with signal control
MN -985 097 018 023 414 33 50000 25807
254 Urban 4-leg with minor-road STOP control
MN -312 027 016 086 76 333 58870 81000
255 Urban 4-leg with all-way STOP control
MN -1237 122 027 047 41 41 25300 6803
256 Urban 4-leg with signal control
MN -347 042 014 032 264 418 75000 81000
ITT Corporation 2008
20
Table 8 SafetyAnalystrsquos SPFs for Intersections (Fatal and Injury Crashes) Site
subtype Code
Site subtype Description
State Regression coefficients
LogIntercept (α)
Regression coefficients
LogAADTmaj (β1)
Regression coefficients LogAADT
min (β2)
Over - dispersion Parameter
(k)
RFT2
() No of Sites
Max AADTmaj
(vehday)
Max AADTmin
(vehday)
Rural 201 Rural 3-leg with minor-
road STOP control MN -935 071 021 123 91 1706 28500 27000
202 Rural 3-leg with all-way STOP control
MN -1002 127 -022 089 248 41 25300 6803
203 Rural 3-leg with signal control
MN -783 075 014 05 215 136 36400 11500
204 Rural 4-leg with minor-road STOP control
MN -936 066 04 0 146 2114 35500 26700
205 Rural 4-leg with all-way STOP control
MN -1002 127 -022 089 248 41 25300 6803
206 Rural 4-leg with signal control
MN -783 075 014 05 215 136 36400 11500
Urban 251 Urban 3-leg with minor-
road STOP control MN -845 049 039 123 81 397 68000 18900
252 Urban 3-leg with all-way STOP control
MN -1002 127 -022 089 248 41 25300 6803
253 Urban 3-leg with signal control
MN -1022 091 021 027 362 33 50000 25807
254 Urban 4-leg with minor-road STOP control
MN -435 029 019 099 57 333 58870 81000
255 Urban 4-leg with all-way STOP control
MN -1002 127 -022 089 248 41 25300 6803
256 Urban 4-leg with signal control
MN -511 049 016 03 295 418 75000 81000
ITT Corporation 2008
21
The study examined the impact of two left turn priority treatments which were flashing advanced green (FAG) and left turn green arrow (LTGA) on left turn collisions These treatments were implemented at 35 intersections in the city of Toronto Two types of collisions were investigated left turns with and without side impact The results indicated that there was an insignificant difference in the impact of the left turn priority treatments on both types of crashes
Lord and Persaud (2003) conducted a study that related SPFs to transportation planning models They noted that traffic safety is not usually accounted for when agencies are conducting a planning analysis to remodel build upgrade or modify their facilities Five-year intersection data from Canada were used Models were developed and statistical measures such as the over dispersion parameter were calculated and conclusions were made from the results The SPFs developed for the study were applied to two sample networks created with the help of a transportation planning software package The research showed that it is possible to make estimation for traffic safety at the planning stage of a project This will allow users to take safety into consideration when designing and possibly create alternatives to change existing designs for more comprehensive projects or development The study also indicated that there are limitations when applying the SPFs to computerized transportation networks The study concluded that although it is possible to predict or estimate crashes on digital transportation networks the accuracy of prediction relies greatly on how precise the traffic flow estimates are
Jonsson et al (2007) performed an SPF study that took into consideration the type and severity of crashes andmdashmost importantmdashthe causal factors for these crashes The study was conducted for intersections on rural four-lane highways in the state of California Four collision types were tested in the study opposite-direction same-direction intersecting-direction and single-vehicle crashes In addition a set of data from the state of New York was used with the same parameters to analyze the severity distribution of crash types The data for California included 1084 intersections on four-lane rural highways and that from New York included 675 intersections mainly stop controlled or without any control Generalized linear modeling was performed with the data after quality analysis Two model forms were estimated with the variables seen in Equations 29 and 30
(Eq 29)
(Eq 30)
where NAcc = predicted number of crashesyr at intersections AADTmajor = AADT on major road AADTminor= AADT traffic flow on minor road Βi = model parameters Xi = variables that describe the intersections (such as terrain lighting left turn number of though lanes and divided or undivided among others)
nn xxxormajorAcc exAADTxAADTN ββββββ ++++=
min4433021
nn xxxormajorAcc exAADTAADTN βββββ +++++=
min332201)(
22
The two different models are different representations of the traffic flow The first represents the AADT of major and minor roads as separate variables but in the second model they are represented as one variable by the sum of the major and minor roads AADTs Results showed that the first model performed better for the multiple-vehicle crashes and the second model fitted better for the single-vehicle crashes In addition the appropriate predictor variables differed depending on the crash type This study is also of interest as it incorporated additional parameters to those in the suggested SPFs now included in SafetyAnalyst and therefore could lead to possible future SPF research for the state of Virginia
Persaud and Nguyen (1998) conducted a study on signalized intersections in Ontario Canada They developed aggregate and disaggregate models to estimate safety performance of three- and four-leg intersections in which crash severity (injury and PDO) environmental class (semi-urban and rural) and time period (daily weekday morning peak and weekday afternoon peak) were considered in the analysis An important aspect of that study is that it supplemented the existing models used for estimating SPFs instead of replacing them because it took into consideration features that were generally not considered in the then existing developed models Two model levels were considered for the study Level 1 was based on the sum of AADTs for all approaches with separate estimates for rear-end right angle and turning movement crashes At this level the equations were adjusted for three- and four-leg intersections by crash severity for all combined impact types and also separately for the three major impact types which were angle rear-end and turning movement In addition models were further separated by time period (daily weekday morning and afternoon peak) and for four-leg intersections which were also classified by environment class such as semi-urban and rural Level 2 allowed estimates to be obtained for specific crash patterns that were defined by movements of the vehicles involved before collision and the same were estimated as a function of the flows that were relevant to each of the patterns For this level models were estimated for four-leg intersections for 12 multi-vehicle and three single-vehicle patterns that were described by the movements of involved vehicles before collision The developed models were intended to estimate the parameters P and d shown in Equations 31 and 33
The safety of the intersection was estimated using the long-term mean based on the EB approach The long term mean (m) was obtained by combining crash count (x) of an intersection in the most recent years (n) with the estimates of the expected annual number of crashes (P) as shown in Equation 31 W1 and W2 in Equations 31 through 33 represent the weights estimated from the mean and variance of the regression estimates
(Eq 31)
(Eq 32)
(Eq 33)
m =W1(x) +W2(P)
2dW
d nP=
+
1PW
d nP=
+
23
(Eq 34)
To estimate the variance of m the following formula was used
(Eq 35)
In Equations 32 through 35 P and d represent the fundamental parameters Two models were selected for SPFs For Level 1 and single-vehicle Level 2 (Eq 36) For multi-vehicle in Level 2 (Eq 37) where P = expected number of crashes of a given type α and β = regression parameters to be estimated S (Level 1) = sum of all entering flows for a given time period for Level 1 analysis S (Level 2) = sum of the daily through right or left turn flows for a given time period for Level 2 (single-vehicle) analysis S1 and S2 = AADTs for small and large flows for a specific crash pattern in Level 2 (multi-vehicle) analysis
The models in either level can be used in the EB procedure to provide estimates for intersections that need to be treated or for the evaluation of the effectiveness of safety countermeasures It should be noted that the quality of the estimates for the study was strongly related to how the parameters were selected and used in the SPFs and unlike other available road models the ones presented in this study can be separated by time period and crash pattern Persaud et al (2002) conducted a study to demonstrate the complexity involved in the calibration of crash prediction models or SPFs for urban intersections Toronto data for three- and four-leg signalized intersections were used to estimate the models for the study The performance of these models was then compared with other models from Vancouver and California The models from these places were recalibrated to fit Toronto by using the Interactive Highway Safety Design Model (IHSDM) and a calibration procedure as proposed by Harwood et al (2000) The results varied significantly and were also mixed The study noted that the calibration of models is not a simple task and due to the importance of the SPFs they must be properly calibrated Several things must be accounted for when performing this procedure in order to obtain good quality data analysis The first thing is to extract a large sample of high quality data A software or program to link all the traffic crash and road characteristics data must exist because the same is usually kept stored in different databases In addition several
2Pd
Var P=
2( )
d xVar m dnP
+=
+
P =αSβ
P =αS1β1 S2
β 2
24
years of crash data must be obtained in order to have a good amount of samples that account for variations The actual process of model calibration is complicated therefore careful attention must be paid when analyzing the same because of the importance of the outcomes of the study The authors of the study made an exploratory analysis and it revealed that the relationship between the crashes and each covariate should be described either by the power function or the gamma function for all intersection types to be analyzed Equations 38 through 40 are the selected model forms used in the study F1 = Power F2 = Gamma (Eq 38) F1 = Gamma F2 = Power (Eq 39) F1 = Power F2 = Power (Eq 40) where E (K) = expected annual number of crashes between 1990 and 1995 F1 F2 = average entering AADT of major and minor roads respectively for the period 1990 to 1995 α β1 β2 β3 β4 = coefficients to be estimated
An NB structure was used to analyze the models and the overdispersion parameter (γ) was analyzed using Equation 41
γ=
2)K(E)K(Var (Eq 41)
Variance increases as γ decreases therefore the value of γ can also be used to make a comparison for the goodness of fit of several models fitted to the same data The larger the value of γ the smaller the variance therefore a more accurate model is given The authors suggest that γ would be enough to calculate the goodness of fit index of any SPF but if one desires to know how accurate the prediction estimate is other measures should also be computed The authors suggested using R2
α as proposed by Miaou et al (1996) which is a dispersion parameter based R2 computed as shown in Equation 42
γγ
minus=αmin2 1R (Eq 42)
where γ = overdispersion parameter for calibrated model γmin = smallest possible overdispersion parameter
The authors suggested that a disaggregation by traffic volume is preferable than using
only a single calibration factor for that is what the IHSDM currently has A recommendation is made to account for safety variation in traffic conditions over time by calibrating the models every two to three years as suggested by Harwood et al (2000)
E(K) =αF1β1 F2
β 2e(β 3F2 )
E(K) =αF1β1 F2
β 2e(β 4 F1 )
E(K) =αF1β1 F2
β 2
25
The Illinois Department of Transportation and the University of Illinois Urbana-Champaign conducted a research study to develop and implement SPFs for road segments and intersections in Illinois (Tegge et al 2010) These SPFs were developed in a way suitable for easy implementation in SafetyAnalyst The crash data (number of crashes and crash severity) and roadway data (number of lanes traffic volume area type and functional class) were collected and used for development of the SPFs Seventeen peer groups were used for developing the SPFs for segments and eight for intersections The intersections peer groups were minor leg stop control all-way stop control signalized and undetermined for rural and urban segments separately The SPFs for segments were developed using NB distribution for crashes and Poisson distribution for intersections The SAS GENMOD procedure was used to develop the SPFs for a five-year analysis period from 2001 to 2005 The model form for the intersection SPFs is the same as that given in the SafetyAnalyst Userrsquos Manual The SPFs were also developed for different crash severities such as fatal crashes type A injury crashes type B injury crashes and fatal plus injury crashes The EB method was used to determine the sites with the higher PSIs Two analysis techniques were used to obtain the PSIs The first considered segments and intersections as individual elements and the second used the sliding window approach The site specific analysis treated each individual segment and intersection as a separate entity Each segment is then compared with every other segment instead of having them grouped together The sliding window approach defined a set length The window lengths were 025 mile and 1 mile for urban and rural segments respectively
The largest impact on crash frequency was found to be the AADT and was therefore the only variable modeled as a logarithm (lnAADT) By doing this the AADT accounted for most of the prediction whereas the rest of the variables refined the prediction further Other variables used included access control functional class lane width surface type area type speed limit and median type The study recommended that a multivariate analysis be conducted for such studies to show how certain variables could contribute to the crashes Other variables could include roadway lighting weather and pavement conditions and roadway geometry The study also concluded that knowledge of roadway characteristics that increase the risk of fatal or injury crashes will facilitate the setting up of safety criteria that can help engineers in the designing of safer roadways Further knowledge of driver behaviors that lead to fatal and severe injury crashes can facilitate the training of enforcement officers to identify these behaviors
The Colorado Department of Transportation (CDOT) (2009) conducted a study to develop SPFs for intersections in the state Their model form is the same as that in SafetyAnalyst The SPFs were developed for many categories based on the number of legs divided undivided rural and urban including urban four-lane divided signalized six-lane divided signalized urban three-leg signalized two-lane undivided unsignalized and urban three-leg unsignalized When a median or left-turn lane is present a roadway is considered divided The sites selected for the study reflected variability in traffic volume and geometry in order to have a diverse representation of intersections throughout the state SPFs were developed for total and for fatal plus injury crash types A five-year study period from 2000 through 2005 was used Crash and AADT data were collected for development of the SPFs CDOT used a NB error structure to develop the SPFs and the EB procedure to estimate the expected safety performance of an intersection site for different safety management purposes Overdispersion parameters were computed and used as a goodness of fit measure According to their data
26
overdispersion parameters indicated that their models provided a reasonable fit to the Colorado data
Results indicated that for signalized intersections roads with six lanes on major approaches have more collisions than those with four lanes on major approaches CDOT recommended that the SPFs should be recalibrated in the future using data from future years as crash frequencies may change over time because of a variety of issues The report also recommended that separate calibration factors should be developed for different regions and different topographies Research in Virginia
In Virginia two other similar studies have recently been published One by Garber et al (2010) for two-lane roads and another by Hamidi et al (2010) to identify high-crash sections on Virginiarsquos primary system by developing a planning-level methodology The study by Garber et al developed SPFs for two-lane segments of 1 mile or less and the study by Hamidi et al developed SPFs for longer segments of two-lane roads that can be used for corridor analysis
Evaluation of the Recommended Minnesota SPFs
Figures 3 through 6 show representative graphs that were used to visually examine how well the Virginia data fitted the suggested Minnesota SPFs Figures 3 and 4 are for urban four-leg signalized intersections and Figures 5 and 6 are for rural four-leg signalized intersections These graphs suggest that the Minnesota SPFs do not fully represent the Virginia data Tables 9 through 12 show the Freeman-Tukey R2
FT coefficients computed for the different Minnesota SPFs using the Virginia data The low Freeman-Tukey R2
FT coefficients obtained and the visual inspection of the graphs suggested that a better fit to the Virginia data could be obtained by developing specific Virginia SPFs using Virginia data It was therefore decided to develop specific SPFs for Virginia
0
2
4
6
8
10
12
14
0 20000 40000 60000 80000 100000 120000
AADT Major
Tota
l Cra
shes
Per
Yea
r
Minnesota VA Actual Observed
Minnesota Model
Figure 3 Total crashes per year vs major AADT for urban 4-leg signalized intersections
with minor AADT of 700
27
0
5
10
15
20
25
30
35
0 20000 40000 60000 80000 100000 120000
AADT Major
Tota
l Cra
shes
per
Yea
r
Minnesota VA Actual Observed
Minnesota Model
Figure 4 Total crashes per year vs major AADT for urban 4-leg signalized intersections
with minor AADT of 4500
0
2
4
6
8
10
12
14
0 20000 40000 60000 80000 100000 120000
AADT Major
Tota
l Cra
shes
Per
Yea
r
Minnesota VA Actual Observed
Minnesota Model
Figure 5 Total crashes per year vs major AADT for rural 4-leg signalized intersections with
minor AADT of 795
28
0
2
4
6
8
10
12
14
16
18
0 20000 40000 60000 80000 100000 120000
AADT Major
Tota
l Cra
shes
per
Yea
r
Minnesota VA Actual Observed
Minnesota Model
Figure 6 Total crashes per year vs major AADT for rural 4-leg signalized intersections with
minor AADT of 5000
Table 9 Minnesota SPFs for Urban FI Crashes and Corresponding R2FT Based
on Virginia Data
Intersection Type
Minnesota FI SPFs R2
FT Based on Virginia Urban FI Crash Data ()
Urban 4-Leg Signalized 032
Urban 4-Leg Minor Stop Control 008
Urban 3-Leg Signalized 026
Urban 3-LegMinor Stop Control 01
Table 10 Minnesota SPFs for Urban TOTAL crashes and Corresponding R2
FT Based on Virginia Data
Type of Intersection
Minnesota SPFs
R2FT Based on Virginia Urban Total
Crash Data ()
Urban 4-Leg Signalized 034
Urban 4-Leg Minor Stop Control 022
Urban 3-Leg Signalized 031
Urban 3-Leg Minor Stop Control 01
29
Table 11 Minnesota SPFs for Rural TOTAL Crashes and Corresponding R2FT
Based on Virginia Data
Type of Intersection
Minnesota SPFs R2
FT Based on Virginia Rural Total Crash Data ()
Rural 4-Leg Signalized 029
Rural 4-Leg Minor Stop Control 013
Rural 3-Leg Signalized 029
Rural 3-Leg Minor Stop Control -010
Table 12 Minnesota SPFs for Rural FI Crashes and Corresponding R2FT Based
on Virginia Data
Type of Intersection
Minnesota SPFs R2
FT Based on Virginia Rural FI Crash Data ()
Rural 4-Leg Signalized 018
Rural 4-Leg Minor Stop Control 010
Rural 3-Leg Signalized 018
Rural 3-Leg Minor Stop Control 001
Development and Evaluation of Specific Virginia SPFs
In keeping with the suggestion given in the Safety Analyst Userrsquos Manual the model form used to develop the intersection SPFs is given in Equation 4 as
1 2k e x MajAADT x MinAADTβ βα=
where
k = predicted crash frequency per intersection per year MajAADT = AADT on the major road (vehday) MinAADT = AADT on the minor road (vehday) α = intercept β1 = coefficient of mayor AADT β2 = coefficient of minor AADT
30
The statewide SPFs developed for Virginia are given in Tables 13 through 16 Due to lack of data the analysis for all-way stop intersections could not be undertaken These tables also give the Freeman-Tukey R2
FT coefficient for each of the Virginia SPFs and the corresponding Minnesota SPF and Freeman-Tukey R2
FT based on the Virginia data The R2FT coefficients
obtained indicate that the Virginia-specific SPFs fit the Virginia data better than the suggested Minnesota SPFs for all types of intersections and crash severity except those for FI crashes on urban three-leg signalized rural four-leg signalized and rural four-leg minor stop control intersections where the corresponding RFT
2 values are similar In Table 15 it can be seen that the Minnesota R2
FT value is negative for the rural three-leg minor stop control intersections The negative RFT
2 value is possible because these calculations were not performed on the same data points that were used to create the Minnesota SPFs (Miller 2009) Table 13 SPF Models for Urban TOTAL crashes and R2
FT results for Virginia Statewide (VDOT-maintained roads)
SPF model with TOTAL Crash values
R2FT TOTAL
Crash Data
Site Virginia Statewide Minnesota VA MN
Urban 4-Leg Signalized 056 034
Urban 4-Leg Minor Stop Control
032 022
Urban 3-Leg Signalized 037 031
Urban 3-Leg Minor Stop Control
023 010
Table 14 SPF Models for Urban FI crashes and R2
FT results for Virginia Statewide (VDOT-maintained roads)
SPF model with FI Crash values R2FT FI Crash Data ()
Site
Virginia Statewide Minnesota VA MN
Urban 4-Leg Signalized 041 032
Urban 4-Leg Minor Stop Control
019 008
Urban 3-Leg Signalized 026 026
Urban 3-Leg Minor Stop Control
013 010
31
Table 15 SPF Models for Rural TOTAL Crashes and R2FT Results for Virginia Statewide (VDOT-
maintained roads) SPF model with TOTAL Crash values R2
FT TOTAL Crash Data
Site
Virginia Statewide Minnesota VA MN
Rural 4-Leg Signalized 0321 0290
Rural 4-Leg Minor Stop Control
0167 0132
Rural 3-Leg Signalized 0305 0291
Rural 3-Leg Minor Stop Control
0104 -0102
Table 16 SPF Models for Rural FI crashes and R2
FT results for Virginia Statewide (VDOT-maintained roads) SPF model with FI Crash values R2
FT TOTAL Crash Data
Site
Virginia Statewide Minnesota VA MN
Rural 4-Leg Signalized 0181 0181
Rural 4-Leg Minor Stop Control
0098 0097
Rural 3-Leg Signalized 0170 0180
Rural 3-Leg Minor Stop Control
0048 0012
Figures 7 through 10 show visual representations of how well the Virginia SPFs fit the
Virginia data in comparison with the suggested Minnesota SPFs In general the Virginia SPFs tend to fit the Virginia data better than the Minnesota SPFs although both sets of SPFs tend to have similar fits at low volumes (AADTmajor lt 2000) except for the SPF for total crashes on urban four-leg signalized intersections shown in Figure 7 The primary reason the Minnesota SPFs do not fit the Virginia data as well as the Virginia SPFs may be the dissimilarities of the roadside environment and the characteristics of the different databases
32
0
2
4
6
8
10
12
14
0 20000 40000 60000 80000 100000 120000
AADT Major
Tota
l Cra
shes
Per
Yea
r
Minnesota VA Actual Observed Virginia
Minnesota Model
Virginia M odel
Figure 7 Total crashes per year vs major AADT for urban 4-leg signalized intersections
with minor AADT of 700
0
5
10
15
20
25
30
35
0 20000 40000 60000 80000 100000 120000
AADT Major
Tota
l Cra
shes
per
Yea
r
Minnesota VA Actual Observed Virginia
Minnesota Model
Virginia Model
Figure 8 Total crashes per year vs major AADT for urban 4-leg signalized intersections
with minor AADT of 8000
33
0
2
4
6
8
10
12
14
0 20000 40000 60000 80000 100000 120000
AADT Major
Tota
l Cra
shes
Per
Yea
r
Minnesota VA Actual Observed Virginia
Virginia Model
Minnesota Model
Figure 9 Total crashes per year vs major AADT for rural 4-leg signalized intersections with
minor AADT of 79
0
5
10
15
20
25
0 20000 40000 60000 80000 100000 120000
AADT Major
Tota
l Cra
shes
per
Yea
r
Minnesota VA Actual Observed Virginia
Minnesota Model
Virginia Model
Figure 10 Total crashes per year vs minor AADT for rural 4-leg signalized intersections with major AADT of 5000
As discussed in the Methodology section in addition to the statewide Virginia SPFs
specific SPFs were developed for each operational region to consider the different topographical characteristics that exist across Virginia The complete set of SPFs together with the associated p values for the regression coefficients are shown in Tables A-1 and A-2 of Appendix A All p values are less than 005 with most being less than 00001 except for some of the rural four-leg signalized intersections regional specific SPFs These p values indicate that the estimated coefficients are statistically significant at the 95 confidence level or better A possible reason
34
for higher p values for a small number of SPFs may be the sample size used for developing these SPFs
To test the transferability and fit of the Virginia statewide specific SPFs several
statistical parameters were determined for the 70 (estimation) data set and the 30 (validation) data set separately The corresponding values for each of these parameters were then compared The results are shown in Tables 17 and 18 for urban and rural intersections respectively The results for the regional SPFs are shown in Tables A-3 through A-8 of Appendix A The results indicate that the developed models are transferable to the 30 validation data set For example the MSE values for the 70 estimation data are similar to the MSPE values for the 30 validation data In addition the mean prediction bias MPB values for the 30 validation data are close to zero (-076 le MPB ge -0004) in Table 17 and (-0067 le MPB ge 00513) in Table 18
Table 17 Goodness of Fit Results for Urban Statewide SPFs
Data Estimation data 70 Validation Data 30 Subtype Site MSE r2 R2
FT MPB MAD MSPE R2FT
Total VA 41150 0529 0557 -0760 4329 38490 0575
Total MN
68636 0506 0336 -3145 5421 68156 0315
FI VA
7043 0385 0406 -0458 1938 7671 0475
Urban 4-Leg Signalized
FI MN 7702 0372 0324 -0316 2124 8981 0376
Total VA 2238 0315 0313 -0034 0897 2383 0292
Total MN 2510 0287 0215 0091 0982 2730 0182
FI VA 0530 0194 0193 -0004 0432 0533 0194
Urban 4-Leg Minor Stop Control
FI MN 0560 0182 0080 0128 0522 0577 0052
Total VA 24900 0375 0370 -0645 3519 27591 0369
Total MN 29322 0365 0308 -2238 3661 33079 0272
FI VA 4467 0275 0259 -0185 1527 4875 0262
Urban 3-Leg Signalized
FI MN 4528 0267 0261 -0294 1526 4937 0261
Total VA 1854 0254 0230 -0043 0893 2038 0239
Total MN 2388 0237 0104 -0541 0902 2600 0107
FI VA 0428 0151 0133 -0021 0431 0476 0157
Urban 3-Leg Minor Stop Control
FI MN 0478 0140 0097 -0184 0385 0537 0104
35
Table 18 Goodness of Fit Results for Rural Statewide SPFs
Data Estimation Data 70
Validation Data 30
Subtype Site MSE r2 R2FT MPB MAD MSPE R2
FT
Total VA 10990 0353 0321 0513 2210 10070 -0073
Total MN 12400 0339 0290 -0154 2071 8460 0035
FI VA 2350 0196 0181 0045 1189 2600 -0034
Rural 4-Leg Signalized
FI MN 2400 0188 0181 -0043 1164 2420 0004
Total VA 1090 0182 0167 -0067 0794 1190 0171
Total MN 1190 0167 0132 -0348 0774 1320 0115
FI VA 0480 0112 0098 -0022 0504 0530 0110
Rural 4-Leg Minor Stop Control
FI MN 0500 0104 0097 -0158 0459 0560 0093
Total VA 5490 0328 0305 -0010 1651 5760 0179
Total MN NA NA NA NA NA NA NA
FI VA 1450 0181 0170 -0041 0902 1710 0099
Rural 3-Leg Signalized
FI MN NA NA NA NA NA NA NA
Total VA 0690 0144 0104 -0008 0613 0730 0102
Total MN 0890 0141 -0102 -0404 0555 0940 -0104
FI VA 0250 0071 0048 -0009 0345 0260 0048
Rural 3-Leg Minor Stop Control
FI MN 0270 0068 0012 -0144 0270 0290 0003
Pruning of Virginia-Specific SPFs A total of 64 SPFs were initially developed using the appropriate data for Virginia as shown in Tables A-1 and A-2 of Appendix A Considering that not all regional models might be necessary the pruning process described in the methodology section was carried out to prune the number of SPFs to the minimum effective number as seen in Tables 19 and 20 for urban and rural intersections respectively The pruning process resulted in 19 SPFs for urban sites and 15 for rural sites To facilitate the use of the correct SPF for a specific type of intersection located in a specific region the lists of the appropriate SPFs to be used are given in Tables B-1 and B-2 of Appendix B for the urban and rural intersections respectively
As can be seen in Tables 19 and 20 and Tables A-1 and A-2 of Appendix A there are some trends worth discussing for the benefit of the study and possible future research With regards to the three different operational regions the Western region retained many more of the specific regional urban SPFs than any other region For example the Western regional SPFs were retained for all urban intersection sites whereas for the Eastern region the only SPFs
36
retained were those for urban four-leg signalized FI crashes and urban four-leg minor stop control for total and FI crashes Similarly the only urban SPF retained for the Northern region was that for urban four-leg minor stop control for total crashes For the rural intersection sites all of the Western regional SPFs were retained except those for rural three-leg signalized total and FI crashes and rural four-leg minor stop control FI crashes The majority of the Eastern region rural SPFs were discarded except those for rural four-leg signalized total and FI crashes while for the Northern region all regional SPFs were discarded
The Western region retained more specific regional SPFs than the other two regions This suggests that the intersections in the Western region exhibit more unique characteristics than those for the other regions This may be due to the more mountainous terrain in the Western region compared to those in the Eastern and Northern regions This supports the philosophy of developing specific SPFs based on the topography of different regions
Site Prioritization
To illustrate the benefits of using the EB method to prioritize intersection sites for safety
improvements the top 25 urban sites from the Bristol and Northern Virginia districts were identified by using crash rates critical crash ratio and the EB method The PSI for each site identified was then determined The results obtained are shown in Tables 21 and 22 for the Bristol and the Northern Virginia districts respectively The results indicate that for the Northern Virginia District the PSIs for the top 25 sites are 258 1317 and 27440 crashes per year and for the Bristol District 432 646 and 1496 crashes per year for the crash rates critical crash ratio and EB methods respectively The important thing in Tables 21 and 22 is the sum of the PSI columns ranked by the three methods The sum of each of the PSIs for the crash rate and critical crash ratio method is lower than that for the EB method These results suggest that the use of the EB method in the planning process will identify intersection sites with the highest PSIs and therefore where detailed assessments to determine feasible and effective safety treatments should be undertaken
37
Table 19 MSPE Values for Virginia Urban Statewide and Urban Regional SPFs Used for Pruning
Data Pruning
Subtype
Site
MSPE [MSPEVA-
MSPEOR]1 [abs(MSPEVA-
MSPEOR)]2 [abs(MSPEVA-
MSPEOR)MSPEVA]3
RetainDiscardTotal VA 3849 Northern 4486 -637 637 0165497532 Discard Western 1791 2058 2058 0534684334 Retain Eastern 3745 104 104 0027020005 Discard FI VA 7671 Northern 95 -1829 1829 0238430452 Discard Western 517 2501 2501 0326033112 Retain
Urban 4-Leg Signalized
Eastern 541 2261 2261 0294746448 Retain Total VA 23834 Northern 202 03634 03634 015247126 Retain Western 105 13334 13334 0559452882 Retain Eastern 115 12334 12334 0517496014 Retain FI VA 05327 Northern 048 00527 00527 0098929979 Discard Western 033 02027 02027 0380514361 Retain
Urban 4-Leg Minor Stop Control
Eastern 036 01727 01727 0324197485 Retain Total VA 275911 Northern 2687 07211 07211 0026135239 Discard Western 2441 31811 31811 0115294425 Retain Eastern 3878 -111889 111889 0405525695 Discard FI VA 48754 Northern 448 03954 03954 0081101038 Discard Western 339 14854 14854 0304672437 Retain
Urban 3-Leg Signalized
Eastern 586 -09846 09846 020195266 Discard Total VA 20379 Northern 219 -01521 01521 0074635654 Discard Western 164 03979 03979 0195250012 Retain Eastern 223 -01921 01921 0094263703 Discard FI VA 04756 Northern 05 -00244 00244 0051303616 Discard Western 038 00956 00956 0201009251 Retain
Urban 3-Leg Minor Stop Control
Eastern 05 -00244 00244 0051303616 Discard 1 Difference between mean square prediction error (MSPE) of Virginia statewide model and OR model 2 Absolute value of the difference between Virginia statewide model MSPE and operational region model MSPE 3 Absolute value of the difference between Virginia statewide model MSPE and operational region model MSPE divided by the Virginia statewide MSPE for comparison
Retained SPFs Discarded if value is negative Discarded if less than 01
38
Table 20 MSPE Values for Virginia Rural Statewide and Rural Regional SPFs Used for Pruning Data Pruning
Subtype
Site
MSPE
[MSPEVA-MSPEOR]1
[abs(MSPEVA-MSPEOR)]2
[abs(MSPEVA-MSPEOR)MSPEVA]3
RetainDiscard
Total VA 1007 Northern 3422 -2415 2415 2398212512 Discard Western 605 402 402 0399205561 Retain Eastern 512 495 495 0491559086 Retain FI VA 26 Northern 976 -716 716 2753846154 Discard Western 159 101 101 0388461538 Retain
Rural 4-Leg Signalized
Eastern 137 123 123 0473076923 Retain Total VA 119 Northern 164 -045 045 0378151261 Discard Western 102 017 017 0142857143 Retain Eastern 114 005 005 0042016807 Discard FI VA 053 Northern 052 001 001 0018867925 Discard Western 048 005 005 0094339623 Discard
Rural 4-Leg Minor Stop Control
Eastern 049 004 004 0075471698 Discard Total VA 576 Northern 1475 -899 899 1560763889 Discard Western 674 -098 098 0170138889 Discard Eastern 626 -05 05 0086805556 Discard FI VA 171 Northern 212 -041 041 0239766082 Discard Western 403 -232 232 1356725146 Discard
Rural 3-Leg Signalized
Eastern 157 014 014 0081871345 Discard Total VA 073 Northern 093 -02 02 0273972603 Discard Western 053 02 02 0273972603 Retain Eastern 069 004 004 0054794521 Discard FI VA 026 Northern 03 -004 004 0153846154 Discard Western 023 003 003 0115384615 Retain
Rural 3-Leg Minor Stop Control
Eastern 027 -001 001 0038461538 Discard 1 Difference between mean square prediction error (MSPE) of Virginia statewide model and OR model 2 Absolute value of the difference between Virginia statewide model MSPE and operational region model MSPE 3 Absolute value of the difference between Virginia statewide model MSPE and operational region model MSPE divided by the Virginia statewide MSPE for comparison
Retained SPFs Discarded if value is negative Discarded if less than 01
39
Table 21 PSIs for Top 25 Sites in District 1 Urban (Bristol) FI
Crashes Ranking Based on Crash
Rates Ranking Based on Crash Ratio Ranking Based on EB
Method
Rank Intersection Node
Crash Rate1 PSI2 Intersection
Node Crash Ratio3 PSI Intersection
Node PSI
1 596726 22112 00000 651193 39672 00000 596095 21413
2 606469 20079 00000 606238 39298 06297 596393 08787
3 706818 12504 00000 651075 31264 00000 651130 08453
4 651193 11550 00000 596726 29227 00000 596701 07112 5 651075 09369 00000 606469 28039 00000 651802 06929 6 606238 08382 06297 651233 25831 03612 636331 06726 7 651807 07089 00000 651130 22718 08453 596395 06579 8 651233 06068 03612 706818 22555 00000 596937 06415 9 651230 05990 00000 651230 20301 00000 606238 06297
10 651783 05756 00000 651210 18882 04747 661033 06061 11 636093 04960 00000 636331 17913 06726 596372 05417 12 651274 04475 00000 651807 16847 00000 636372 04808 13 651130 04179 08453 651805 15814 00000 651210 04747 14 651210 03918 04747 651223 15627 03589 636491 04649 15 636331 03393 06726 651783 15009 00000 596420 04633 16 651223 03363 03589 596095 14865 21413 596403 04579 17 606232 03331 00000 636405 14769 00000 651603 04531 18 651127 03053 00000 661033 14555 06061 636056 04351 19 651999 03048 00000 596353 14215 03717 712033 04110 20 596449 02962 00000 636093 13782 00000 704691 04102 21 636405 02811 00000 651879 13192 00000 651838 04100 22 651883 02698 00000 651274 12975 00000 651894 03878 23 596353 02686 03717 651127 12972 00000 596353 03717 24 651805 02663 00000 651999 12959 00000 651233 03612 25 661033 02500 06061 596449 12702 00000 651889 03601
sum 43202 sum 64615 sum 149606 1Number of crashes per year per 1000000 total approach volume 2Potential for safety improvement (crashes yr) the difference between the EB-adjusted long-term crashes and the SPF-estimated crashes 3Ratio of actual crash rate to critical crash rate
40
Table 22 PSIs for Top 25 Sites in District 9 Urban (Northern Virginia District) FI
Crashes Ranking Based on Crash
Rates Ranking Based on Crash Ratio Ranking Based on EB
Method
Rank Intersection Node
Crash Rate1 PSI2 Intersection
Node Crash Ratio3 PSI Intersection
Node PSI
1 718192 191841 00000 718192 257523 00000 264119 150122 2 702946 178194 00000 547722 152371 11175 263375 140091 3 271531 64846 00000 263628 102794 00000 278648 137239 4 263628 52858 00000 263728 100092 00000 276819 131395 5 263728 42215 00000 719754 95274 09444 263290 130743 6 266955 35294 00000 702946 79268 00000 722678 127897 7 547722 34932 11175 263403 77252 05184 264725 118671 8 702612 30441 00000 704237 77175 07648 267028 116627 9 273886 29539 00000 263729 74681 00000 265204 115925
10 716747 27632 00000 271531 72327 00000 274766 115679 11 263626 27139 00000 263135 66458 18068 263249 113372 12 269485 26567 00000 716747 64461 00000 547044 110769 13 728954 26344 00000 266955 56657 00000 549349 107180 14 263729 25208 00000 546138 52003 31028 268210 105630 15 546988 21922 00000 547544 51924 32529 263347 104257 16 274338 21446 00000 263626 50389 00000 276351 102313 17 429308 21354 00000 269485 49897 00000 428167 100064 18 720401 21197 00000 728954 49702 00000 264344 98789 19 267295 20954 00000 548686 49572 03621 277764 91554 20 267536 20874 00000 711601 47985 04440 263467 89259 21 265938 20484 00000 266970 47730 00000 263090 89199 22 273354 20108 00000 546462 46856 03620 703414 88610 23 268345 19362 00000 265938 46726 00000 428629 87379 24 719754 19073 09444 720401 44833 00000 272219 85659 25 263403 19015 05184 728496 43666 04990 428544 85610
Sum 25803 sum 131747 sum 2744033 1Number of crashes per year per 1000000 total approach volume 2Potential for safety improvement (crashes yr) the difference between the EB-adjusted long-term crashes and the SPF-estimated crashes 3Ratio of actual crash rate to critical crash rate
41
CONCLUSIONS
bull The development of SPFs for intersections is necessary for Virginia because the SafetyAnalyst-suggested SPFs which are based on Minnesota data do not represent the Virginia data well Regarding the fit of the SPFs to Virginia data the R2
FT values shown in Tables 13 through 16 for Minnesota and Virginia indicate that the Virginia-specific SPFs fit the Virginia data better than the Minnesota models This may be due to the dissimilarities of the roadside environment such as difference in topography and the characteristics of the different Virginia and Minnesota databases
bull In some cases the specific regional SPFs fit the regional data better than the statewide
SPFs suggesting that the specific SPFs should be considered for use when available These group divisions that have similar roadway characteristics and driver expectations in some cases tend to improve the fit
bull In identifying intersection sites for safety improvements it is clearly beneficial for the EB
method to be used with the suitable SPFs rather than a crash rate or critical ratio method Results of the site prioritization show a much higher potential for crash reduction when the EB method is used with the appropriate SPFs rather than a procedure based on crash rates or critical rates
RECOMMENDATIONS
1 VDOTrsquos TED should use the Virginia-specific SPFs when using the SafetyAnalyst tools The results of this study have shown that the Virginia-specific SPFs reflected the Virginia data better than the SafetyAnalyst-recommended Minnesota SPFs
2 VDOTrsquos TED should investigate the feasibility of using multiple SPFs in SafetyAnalyst If
feasible regional SPFs should be used If it is not currently feasible to use multiple SPFs VDOTrsquos TED should ask that the FHWA include regional information in SafetyAnalyst so as to allow the use of regional SPFs For the specific regional SPFs to be applied to Virginia and other states the SafetyAnalyst tool should be capable of incorporating the necessary data that support the regional models
3 As soon as it is feasible to use regional SPFs VDOTrsquos TED should use the 19 SPFs
developed for urban intersections and the 15 developed for rural intersections when using the tools in SafetyAnalyst Although the statewide SPFs are available for use by an analyst the specific regional models included in the final set of SPFs will predict crashes better than the statewide SPFs The regional analysis will not only ease the use of specific regional SPFs but will also be of benefit when predicting the potential for safety improvement of a specific site
4 For future similar SPF studies VDOTrsquos TED should be directly involved in screening the
traffic data for accuracy and consistency as was done in this study The direct involvement of the TED in the screening of the traffic data significantly contributed to the accuracy of the
42
data and greatly contributed to the confidence the researchers place on the data used in the study
5 The Virginia Transportation Research Council (VTRC) should conduct a study as soon as
feasible to verify whether incorporating independent variables for which data are available other than AADT such as intersection geometry and other characteristics will result in SPFs that better fit the Virginia data Although the currently suggested SafetyAnalyst SPFs use only the AADTs as the independent variables it is likely that provision will be made for use of SPFs that incorporate other independent variables such as number of approaches entering lanes and the other variables for which data are available as these SPFs are likely to give better fit to crash data
6 As soon as feasible VTRC should undertake a study to develop SPFs for the urban system
intersections which are not currently maintained by VDOT as these intersections may have different crash characteristics than those maintained by VDOT This would facilitate the use of SafetyAnalyst in programming sites that are currently not being maintained by VDOT
BENEFITS AND IMPLEMENTATION PROSPECTS
Significant benefits will be accrued by the use of the Virginia-specific SPFs developed in this study This is clearly illustrated in two ways First in examining the transferability of the suggested SPFs in SafetyAnalyst it is clear that these SPFs do not fit the Virginia data very well The results also indicate that the Virginia-specific SPFs fit the Virginia data much better than the suggested SafetyAnalyst SPFs Second the availability of the Virginia-specific SPFs will enhance the use of the EB procedure given in SafetyAnalyst for prioritizing sites for safety improvements This study has also shown that the EB method better identifies sites with higher potential for crash reduction than those identified by crash rates For example the illustrated examples given for the Bristol and Northern Virginia districts show that the potential reduction in FI crashes when the top 25 sites are identified by the EB method is 28936 (1496 + 27440) crashes per year whereas that obtained when the critical crash ratio method is used for prioritization is only 1963 (646 + 1317) and that obtained with the crash rate method is only 690 (432 + 258) crashes per year This gives a net benefit of 26973 potential crashes per year compared to the critical crash ratio method and 28246 compared to the crash rate method Assuming an average cost of FI crashes of $95629 (FHWA 2005) and only 10 of the estimated net benefit PSI of 28246 crashes per year is achieved the total savings of more than $27 million per year could be accrued The prospects for implementation of the recommendations are very high as the study was requested by VDOTrsquos TED which is planning to incorporate these SPFs in the use of the tools provided in SafetyAnalyst
43
ACKNOWLEDGMENTS
The authors appreciate the opportunity afforded them by VDOT and VTRC to conduct this study Special thanks to Stephen Read (VDOT) Dr In-Kyu Lim (VDOT) Dr Young-Jun Kweon (VTRC) and VDOTrsquos Central Office for their interest and support in SPFs and their help in the selection of intersection sites Many thanks to Lewis Woodson (VTRC) and James Hill (University of Virginia) for all their help and input throughout the study
REFERENCES Cogburn P VDOT Interagency Coordination 2007 Virginia Emergency Management
Conference Virginia Department of Transportation Richmond April 2007 Colorado Department of Transportation DTD Applied Research and Innovation Branch Safety
Performance Functions for Intersections CDOT-2009-10 Denver December 2009 Fridstroslashm L Ifver J Ingebrigtsen S Kulmala R and Thomsen LK Measuring the
Contribution of Randomness Exposure Weather and Daylight to the Variation in Road Accidents Counts Accident Analysis and Prevention Vol 27 No 1 1995 pp 1-20
Federal Highway Administration Cost of Crashes by Severity Table FHWA-HRT-05-051
Washington DC 2005 Federal Highway Administration SafetyAnalyst Home Page httpwwwsafetyanalystorg
Accessed February 2010 Garber N and Hoel L Traffic amp Highway Engineering 4th ed Cenage Learning Toronto
Canada 2009 Garber NJ Haas PR and Gosse C Development of Safety Performance Functions for Two-
Lane Roads Maintained by the Virginia Department of Transportation VTRC 10-R25 Virginia Transportation Research Council Charlottesville 2010
Hamidi A Fontaine MD and Demetsky MJ A Planning-Level Methodology for Identifying
High-Crash Sections of Virginiarsquos Primary System VTRC 11-R4 Virginia Transportation Research Council Charlottesville 2010
Harwood D Council FM Hauer E Hughes WE and Vogt A Prediction of the Expected
Safety Performance of Rural Two-lane Highways Federal Highway Administration McLean VA December 2000
Harwood DW Bauer KM Richard KR Gilmore DK Persaud B and Lyon C
Development of SPFs for Safety Analyst Interim Tools Technical Memorandum
44
Prepared by Midwest Research Institute for the Federal Highway Administration McLean VA 2004
ITT Corporation SafetyAnalyst Userrsquos Manual Turner-Fairbank Highway Research Center
McLean VA 2008 Jonsson T Ivan J and Zhang C Crash Prediction Models for Intersections on Rural
Multilane Highways Differences by Collision Type In Transportation Research Record Journal of the Transportation Research Board No 2019 Transportation Research Board of the National Academies Washington DC 2007 pp 91-98
Kweon Y-J and Lim I-K Appropriate Regression Model Types for the Empirical Bayes
Method and SafetyAnalyst In Proceedings of the 89th Annual Meeting of the Transportation Research Board Transportation Research Board of the National Academies Washington DC 2010
Kononov J Bailey B and Allery B Exploratory Examination of the Functional Form of
Safety Performance Functions of Urban Freeways Colorado Department of Transportation and San Diego State University Denver CO 2008
Lyon C Haq A Persaud B and Kodama S Safety Performance Functions for Signalized
Intersections in Large Urban Areas Development and Application to Evaluation of Left-Turn Priority Treatment In Transportation Research Record Journal of the Transportation Research Board No 1908 Transportation Research Board of the National Academies Washington DC 2005 pp 165-171
Lord D and Persaud B Estimating the Safety Performance of Urban Road Transportation
Networks Center for Transportation Safety Texas Transportation Institute Texas AampM University and Department of Civil Engineering Ryerson University College Station TX 2003 pp 609-620
Miaou S-P Lu A and Lum H S Pitfalls of using R2 to Evaluate Goodness of Fit of
Accident Prediction Models In Transportation Research Record Journal of the Transportation Research Board No 1542 Transportation Research Board of the National Academies Washington DC 2005 1996 pp 6-13
Miller P Re Negative R squared Email Archive Division of Biostatistics Washington
University in St Louis February 2 2005 February 2 2005 httpwwwbiostatwustleduarchiveshtmljmp-l2005msg00075html Accessed February 2010
Persaud B Lord D and Palmisano J Calibration and Transferability of Accident Prediction
Models for Urban Intersections In Transportation Research Record Journal of the Transportation Research Board No 1784 Transportation Research Board of the National Academies Washington DC 2002 pp 57-64
45
Persaud B and Nguyen T Disaggregate Safety Performance Models for Signalized Intersections on Ontario Provincial Roads In Transportation Research Record Journal of the Transportation Research Board No 1635 Transportation Research Board of the National Academies Washington DC 1998 pp 113-120
Pham T and Ragland D Summary of Crash Prediction Models Also known as Safety
Performance Functions (SPFs) California Partners for Advanced Traffic and Highways and University of California Berkeley Berkeley 2005
SAS Institute Inc SAS OnlineDoc Version Eight Cary NC
httpwwwtecnionacildocssasril Accessed 2009 Tegge RA Jo J-H and Ouyang Y Development and Application of Safety Performance
Functions for Illinois ICT-10-066 Illinois Center for Transportation University of Illinois Urbana-Champaign March 2010
Virginiarsquos Surface Transportation Safety Executive Committee Commonwealth of Virginiarsquos
Strategic Highway Safety Plan 2006-2010 Virginia Department of Transportation Richmond 2006
Washington S Persaud B Lyon C and Oh J Validation of Accident Models for
Intersections FHWA-RD-03-037 Federal Highway Administration McLean VA 2005
46
47
APPENDIX A
STATISTICAL PARAMETERS AND GOODNESS-OF-FIT RESULTS
Table A-1 Statistical Parameters for Urban Intersections SPFs Parameter Estimates
Data Intercept
Coefficient of Mayor AADT
Coefficient of Minor AADT
Subtype Site Intercept (α)
StndError
P value
lnMajor (β1)
StndError
P value
lnMinor (β2)
StndError
P value
Total VA -76234 048 lt0001 06742 005 lt0001 03453 003 lt0001
OR1 -83067 056 lt0001 07522 005 lt0001 0328 003 lt0001OR10 -123913 122 lt0001 10631 013 lt0001 04567 006 lt0001OR 100 -88553 077 lt0001 07825 007 lt0001 03706 004 lt0001FI VA -85256 057 lt0001 06477 006 lt0001 03579 004 lt0001OR1 -96546 063 lt0001 07603 006 lt0001 03597 004 lt0001OR10 -114284 15 lt0001 08662 016 lt0001 04412
Urban 4-Leg Signalized
OR 100 -99582 100 lt0001 07484 009 lt0001 04017 005 lt0001Total VA -60723 022 lt0001 04558 002 lt0001 0347 004 lt0001
OR1 -6059 044 lt0001 0505 004 lt0001 02773 006 lt0001OR10 -67031 057 lt0001 03986 007 lt0001 04999 009 lt0001OR 100 -65388 032 lt0001 04689 004 lt0001 043 006 lt0001FI VA -76917 032 lt0001 05001 003 lt0001 03695 005 lt0001OR1 -81437 060 lt0001 05813 005 lt0001 03188 008 lt0001OR10 -80333 063 lt0001 03446 007 lt0001 06218 010 lt0001
Urban 4-Leg Minor Stop Control
OR 100 -83166 051 lt0001 05253 006 lt0001 04695 008 lt0001Total VA -6543 082 lt0001 06591 008 lt0001 02119 002 lt0001
OR1 -4999 103 lt0001 05555 009 lt0001 01554 003 lt0001OR10 -96143 127 lt0001 08677 012 lt0001 03297 005 lt0001OR 100 -67518 110 lt0001 06157 011 lt0001 02969 005 lt0001FI VA -84268 068 lt0001 07147 006 lt0001 02481 002 lt0001OR1 -73982 099 lt0001 06496 009 lt0001 02088 003 lt0001OR10 -110104 155 lt0001 0908 015 lt0001 03226 006 lt0001
Urban 3-Leg Signalized
OR 100 -7266 107 lt0001 05508 011 lt0001 03107 006 lt0001Total VA -54696 013 lt0001 04874 002 lt0001 01985 001 lt0001
OR1 -5361 018 lt0001 04959 002 lt0001 01676 002 lt0001OR10 -5773 034 lt0001 04877 003 lt0001 02314 004 lt0001OR 100 -51642 021 lt0001 04338 003 lt0001 02309 003 lt0001FI VA -74642 018 lt0001 05791 002 lt0001 02091 002 lt0001OR1 -76877 027 lt0001 06204 003 lt0001 0181 002 lt0001OR10 -69458 047 lt0001 05096 004 lt0001 02212 005 lt0001
Urban 3-Leg Minor Stop Control
OR 100 -69883 031 lt0001 05169 004 lt0001 02308 003 lt0001 Standard Error
48
Table A-2 Statistical Parameters for Rural Intersections SPFs Parameter Estimates
Data Intercept
Coefficient of Mayor AADT
Coefficient of Minor AADT
Subtype Site Intercept (α)
StndError
P value
lnMajor (β1)
Stnd Error
P value
lnMinor (β2)
Stnd Error
P value
Total VA -69589 118 lt0001 06746 009 lt0001 0253 009 00047
OR1 -1604 237 04974 02284 021 02791 01514 012 0211 OR10 -63951 183 00005 05508 014 00001 03106 014 00224 OR 100 -06468 220 07692 02262 016 01635 -00158 017 09274 FI VA -87116 128 lt0001 07839 011 lt0001 02166 009 0013 OR1 -33285 246 01767 03601 024 0126 00597 013 06478 OR10 -80583 175 lt0001 06809 018 00001 02557 013 0057
Rural 4-Leg Signalized
OR 100 -48381 221 00287 04243 018 00193 01523 018 03943 Total VA -5494 020 lt0001 03533 002 lt0001 03935 003 lt0001
OR1 -62351 058 lt0001 04167 006 lt0001 04507 008 lt0001OR10 -53594 028 lt0001 03379 003 lt0001 03998 004 lt0001OR 100 -51255 027 lt0001 02914 003 lt0001 04075 004 lt0001FI VA -66927 030 lt0001 03899 003 lt0001 04156 004 lt0001OR1 -82561 095 lt0001 05221 009 lt0001 04962 012 lt0001OR10 -70797 044 lt0001 03789 004 lt0001 0497 005 lt0001
Rural 4-Leg Minor Stop Control
OR 100 -63326 038 lt0001 03223 004 lt0001 04424 005 lt0001Total VA -75754 084 lt0001 06465 008 lt0001 03332 008 lt0001
OR1 -58798 220 00075 05076 020 00143 0313 013 00161 OR10 -64368 110 lt0001 0544 011 lt0001 02863 006 lt0001OR 100 -9899 139 lt0001 08047 015 lt0001 04386 006 lt0001FI VA -87112 103 lt0001 07224 010 lt0001 02578 006 lt0001OR1 -9219 260 00004 07258 022 00011 03407 016 00326 OR10 -88607 146 lt0001 07059 016 lt0001 02809 008 00009
Rural 3-Leg Signalized
OR 100 -111835 185 lt0001 08669 018 lt0001 03977 008 lt0001Total VA -43293 008 lt0001 03366 001 lt0001 02087 001 lt0001
OR1 -50904 022 lt0001 0406 002 lt0001 02752 003 lt0001OR10 -40969 009 lt0001 03133 001 lt0001 02001 001 lt0001OR 100 -4231 016 lt0001 02997 002 lt0001 02308 003 lt0001FI VA -53415 011 lt0001 03394 001 lt0001 02237 001 lt0001OR1 -64457 031 lt0001 04195 003 lt0001 0307 004 lt0001OR10 -50831 014 lt0001 03245 002 lt0001 02014 002 lt0001
Rural 3-Leg Minor Stop Control
OR 100 -51046 024 lt0001 03163 003 lt0001 02112 003 lt0001
Standard Error
49
Table A-3 SPFs Goodness of Fit Results for Urban Northern Operational Region (No 1)
Data Estimation Data 70 Validation Data 30
Subtype Site MSE r2 R2FT MPB MAD MSPE R2
FT
Total VA 41150 0529 0557 -0760 4329 38490 0575
Total R1 4110 051 0551 -020 464 4486 054
FI VA 704 038 0406 -046 194 767 048
Urban 4-Leg Signalized
FI R1 809 039 0439 012 214 950 038
Total VA 224 031 0313 -003 090 238 029
Total R1 308 028 0286 008 095 200 032
FI VA 053 019 0193 000 043 053 019
Urban 4-Leg Minor Stop Control
FI R1 064 018 0187 003 043 048 021
Total VA 2490 038 0370 -064 352 2759 037
Total R1 3034 032 0305 -015 365 2687 037
FI VA 447 028 0259 -019 153 488 026
Urban 3-Leg Signalized
FI R1 559 025 0231 004 157 448 029
Total VA 185 025 0230 -004 089 204 024
Total R1 208 026 0239 -006 094 219 026
FI VA 043 015 0133 -002 043 048 016
Urban 3-Leg Minor Stop Control
FI R1 047 017 0156 -001 044 050 017
50
Table A-4 SPFs Goodness of Fit Results for Urban Western Operational Region (No 10)
Data Estimation Data 70 Validation Data 30
Subtype Site MSE r2 R2FT MPB MAD MSPE R2
FT
Total VA 41150 0529 0557 -0760 4329 38490 0575
Total R10 21976 0777 0735 1290 3233 17910 0686
FI VA 7043 0385 0406 -0458 1938 7671 0475
Urban 4-Leg Signalized
FI R10 4280 0526 0500 0377 1597 5170 0452
Total VA 2238 0315 0313 -0034 0897 2383 0292
Total R10 1161 0361 0300 -0032 0740 1050 0188
FI VA 0530 0194 0193 -0004 0432 0533 0194
Urban 4-Leg Minor Stop Control
FI R10 0312 0197 0187 0000 0382 0330 0009
Total VA 24900 0375 0370 -0645 3519 27591 0369
Total R10 14446 0451 0397 -0168 2801 24410 0255
FI VA 4467 0275 0259 -0185 1527 4875 0262
Urban 3-Leg Signalized
FI R10 3077 0266 0216 0039 1258 3390 0115
Total VA 1854 0254 0230 -0043 0893 2038 0239
Total R10 1391 0233 0197 -0054 0800 1640 0207
FI VA 0428 0151 0133 -0021 0431 0476 0157
Urban 3-Leg Minor Stop Control
FI R10 0354 0111 0089 -0019 0404 0380 0125
51
Table A-5 SPFs Goodness of Fit Results for Urban Eastern Operational Region (No 100)
Data Estimation Data 70 Validation Data 30
Subtype Site MSE r2 R2FT MPB MAD MSPE R2
FT
Total VA 41150 0529 0557 -0760 4329 38490 0575
Total R100 31108 0632 0630 0243 4717 37450 0005
FI VA 7043 0385 0406 -0458 1938 7671 0475
Urban 4-Leg Signalized
FI R100 5201 0480 0454 -0098 1864 5410 0244
Total VA 2238 0315 0313 -0034 0897 2383 0292
Total R100 1720 0443 0381 0087 0758 1150 0003
FI VA 0530 0194 0193 -0004 0432 0533 0194
Urban 4-Leg Minor Stop Control
FI R100 0509 0273 0254 0049 0383 0360 0173
Total VA 24900 0375 0370 -0645 3519 27591 0369
Total R100 17782 0410 0410 -1753 0908 38780 0004
FI VA 4467 0275 0259 -0185 1527 4875 0262
Urban 3-Leg Signalized
FI R100 3194 0243 0263 -0615 1645 5860 0236
Total VA 1854 0254 0230 -0043 0893 2038 0239
Total R100 1561 0233 0210 -0127 0902 2230 0002
FI VA 0428 0151 0133 -0021 0431 0476 0157
Urban 3-Leg Minor Stop Control
FI R100 0387 0131 0116 -0043 0444 0500 0141
52
Table A-6 SPFs Goodness of Fit Results for Rural Northern Operational Region (No 1)
Data Estimation Data 70
Validation Data 30
Subtype Site MSE r2 R2FT MPB MAD MSPE R2
FT
Total VA 10990 0353 0321 0513 2210 10070 -0073
Total R1 20080 0118 0092 -1389 3661 34220 0212
FI VA 2350 0196 0181 0045 1189 2600 -0034
Rural 4-Leg Signalized
FI R1 2920 0057 0052 -1173 1931 9760 0028
Total VA 1090 0182 0167 -0067 0794 1190 0171
Total R1 1990 0190 0245 0001 0942 1640 0173
FI VA 0480 0112 0098 -0022 0504 0530 0110
Rural 4-Leg Minor Stop Control
FI R1 0920 0093 0112 0020 0541 0520 0009
Total VA 5490 0328 0305 -0010 1651 5760 0179
Total R1 11110 0182 0254 -0679 2271 14750 0497
FI VA 1450 0181 0170 -0041 0902 1710 0099
Rural 3-Leg Signalized
FI R1 3230 0131 0153 -0116 1006 2120 0355
Total VA 0690 0144 0104 -0008 0613 0730 0102
Total R1 1210 0245 0196 0030 0712 0930 0126
FI VA 0250 0071 0048 -0009 0345 0260 0048
Rural 3-Leg Minor Stop Control
FI R1 0340 0124 0093 0016 0366 0300 0052
53
Table A-7 SPFs Goodness of Fit Results for Rural Western Operational Region (No 10)
Data Estimation Data 70 Validation Data 30
Subtype Site MSE r2 R2FT MPB MAD MSPE R2
FT
Total VA 10990 0353 0321 0513 2210 10070 -0073
Total R10 6020 0311 0268 0007 1748 6050 0382
FI VA 2350 0196 0181 0045 1189 2600 -0034
Rural 4-Leg Signalized
FI R10 1880 0158 0139 0097 0945 1590 0254
Total VA 1090 0182 0167 -0067 0794 1190 0171
Total R10 1300 0196 0163 0070 0760 1020 0078
FI VA 0480 0112 0098 -0022 0504 0530 0110
Rural 4-Leg Minor Stop Control
FI R10 0560 0142 0118 0025 0495 0480 0014
Total VA 5490 0328 0305 -0010 1651 5760 0179
Total R10 3690 0163 0170 -0432 0748 6740 0039
FI VA 1450 0181 0170 -0041 0902 1710 0099
Rural 3-Leg Signalized
FI R10 0890 0124 0117 -0391 0997 4030 -0066
Total VA 0690 0144 0104 -0008 0613 0730 0102
Total R10 0640 0126 0091 0025 0583 0580 0055
FI VA 0250 0071 0048 -0009 0345 0260 0048
Rural 3-Leg Minor Stop Control
FI R10 0240 0062 0041 0003 0335 0230 0028
54
Table A-8 SPFs Goodness of Fit Results for Rural Eastern Operational Region (No 100)
Data Estimation Data 70 Validation Data 30
Subtype Site MSE r2 R2FT MPB MAD MSPE R2
FT
Total VA 10990 0353 0321 0513 2210 10070 -0073
Total R100 10120 0042 0027 1207 1882 5120 -0307
FI VA 2350 0196 0181 0045 1189 2600 -0034
Rural 4-Leg Signalized
FI R100 2060 0053 0039 0119 0962 1370 -0023
Total VA 1090 0182 0167 -0067 0794 1190 0171
Total R100 0960 0170 0149 -0086 0746 1140 0209
FI VA 0480 0112 0098 -0022 0504 0530 0110
Rural 4-Leg Minor Stop Control
FI R100 0440 0106 0092 -0031 0475 0490 0121
Total VA 5490 0328 0305 -0010 1651 5760 0179
Total R100 2770 0492 0459 0601 1759 6260 0090
FI VA 1450 0181 0170 -0041 0902 1710 0099
Rural 3-Leg Signalized
FI R100 1040 0265 0255 0124 0923 1570 -0055
Total VA 0690 0144 0104 -0008 0613 0730 0102
Total R100 0640 0125 0087 -0037 0601 0690 0119
FI VA 0250 0071 0048 -0009 0345 0260 0048
Rural 3-Leg Minor Stop Control
FI R100 0250 0064 0038 -0013 0345 0270 0062
55
APPENDIX B
RECOMMENDED SAFETY PERFORMANCE FUNCTION MODELS
Table B-1 Recommended Urban SPFs Site Virginia SPF Models to Be Used for Urban Intersections
Urban 4-Leg Signalized Total Virginia generic total
Urban 4-Leg Signalized
Operational Region 1 generic total
Urban 4-Leg Signalized
Operational Region 10
use specified model developed
Urban 4-Leg Signalized
Operational Region 100 generic total
Urban 4-Leg Signalized FI Virginia generic FI
Urban 4-Leg Signalized
Operational Region 1 generic FI
Urban 4-Leg Signalized
Operational Region 10
use specified model developed
Urban 4-Leg Signalized
Operational Region 100
use specified model developed
Urban 4-Leg Minor Stop Control
Total Virginia generic total
Urban 4-Leg Minor Stop Control
Operational Region 1
use specified model developed
Urban 4-Leg Minor Stop Control
Operational Region 10
use specified model developed
Urban 4-Leg Minor Stop Control
Operational Region 100
use specified model developed
Urban 4-Leg Minor Stop Control
FI Virginia generic FI e^-76917MajADT^05001MinADT^03695
Urban 4-Leg Minor Stop Control
Operational Region 1
use specified model developed
Urban 4-Leg Minor Stop Control
Operational Region 10
use specified model developed
Urban 4-Leg Minor Stop Control
Operational Region 100
use specified model developed
56
Table B-1 Recommended Urban SPFs (Continued)
Site Virginia SPF Models to Be Used for Urban Intersections
Urban 3-Leg Signalized
Total Virginia
use generic model developed for total
crashes
Urban 3-Leg Signalized
Operational Region 1
use generic model developed for total
crashes
Urban 3-Leg Signalized
Operational Region 10
use specific regional model
developed
Urban 3-Leg Signalized
Operational Region 100
use generic model developed for total
crashes
Urban 3-Leg Signalized FI Virginia
use generic model developed for FI
crashes
Urban 3-Leg Signalized
Operational Region 1
use generic model developed for FI
crashes
Urban 3-Leg Signalized
Operational Region 10
use specific regional model
developed
Urban 3-Leg Signalized
Operational Region 100
use generic model developed for FI
crashes
Urban 3-Leg Minor Stop Control
Total Virginia
use generic model developed for total
crashes
Urban 3-Leg Minor Stop Control
Operational Region 1
use generic model developed for total
crashes
Urban 3-Leg Minor Stop Control
Operational Region 10
use specific regional model
developed
Urban 3-Leg Minor Stop Control
Operational Region 100
use generic model developed for total
crashes
Urban 3-Leg Minor Stop Control
FI Virginia use generic model developed for FI
crashes
Urban 3-Leg Minor Stop Control
Operational Region 1
use generic model developed for FI
crashes
Urban 3-Leg Minor Stop Control
Operational Region 10
use specific regional model
developed
Urban 3-Leg Minor Stop Control
Operational Region 100
use generic model developed for FI
crashes
57
Table B-2 Recommended Rural SPFs Site Virginia SPF Models to Be Used for Rural Intersections
Rural 4-Leg Signalized Total Virginia
use generic model developed for total
crashes
Rural 4-Leg Signalized
Operational Region 1
use generic model developed for total
crashes
Rural 4-Leg Signalized
Operational Region 10
use specific regional model developed
Rural 4-Leg Signalized
Operational Region 100
use specific regional model developed
Rural 4-Leg Signalized FI Virginia use generic model
developed for FI crashes
Rural 4-Leg Signalized
Operational Region 1
use generic model developed for FI crashes
Rural 4-Leg Signalized
Operational Region 10
use specific regional model developed
Rural 4-Leg Signalized
Operational Region 100
use specific regional model developed
Rural 4-Leg Minor Stop Control Total Virginia
use generic model developed for total
crashes
Rural 4-Leg Minor Stop Control
Operational Region 1
use generic model developed for total
crashes e^-549MajADT^035MinADT^039
Rural 4-Leg Minor Stop Control
Operational Region 10
use specific regional model developed
Rural 4-Leg Minor Stop Control
Operational Region 100
use generic model developed for total
crashes
Rural 4-Leg Minor Stop Control FI Virginia use generic model
developed for FI crashes
Rural 4-Leg Minor Stop Control
Operational Region 1
use generic model developed for FI crashes
Rural 4-Leg Minor Stop Control
Operational Region 10
use generic model developed for FI crashes
Rural 4-Leg Minor Stop Control
Operational Region 100
use generic model developed for FI crashes
58
Table B-2 Recommended Rural SPFs (Continued)
Site Virginia SPF Models to Be Used for Rural Intersections
Rural 3-Leg Signalized Total Virginia use generic model
developed for total crashes
Rural 3-Leg Signalized
Operational Region 1
use generic model developed for total crashes
Rural 3-Leg Signalized
Operational Region 10
use generic model developed for total crashes
Rural 3-Leg Signalized
Operational Region 100
use generic model developed for total crashes
Rural 3-Leg Signalized FI Virginia use generic model
developed for FI crashes
Rural 3-Leg Signalized
Operational Region 1
use generic model developed for FI crashes
Rural 3-Leg Signalized
Operational Region 10
use generic model developed for FI crashes
Rural 3-Leg Signalized
Operational Region 100
use generic model developed for FI crashes
Rural 3-Leg Minor Stop Control Total Virginia use generic model
developed for total crashes
Rural 3-Leg Minor Stop Control
Operational Region 1
use generic model developed for total crashes
Rural 3-Leg Minor Stop Control
Operational Region 10
use specific regional model developed
Rural 3-Leg Minor Stop Control
Operational Region 100
use generic model developed for total crashes
Rural 3-Leg Minor Stop Control FI Virginia use generic model
developed for FI crashes
Rural 3-Leg Minor Stop Control
Operational Region 1
use generic model developed for FI crashes
Rural 3-Leg Minor Stop Control
Operational Region 10
use specific regional model developed
Rural 3-Leg Minor Stop Control
Operational Region 100
use generic model developed for FI crashes

15
tiC
KwwX Y
y isty
Y
y istyistyististyist amp)1(
1
1)1()1( forallminus+times=
sumsum
=
=== κ (Eq 22)
5 Determine the PSI for each intersection If istYX gt istYκ include intersection i in the list for prioritization using istYPSI = istYX
where i = intersection index (i = 1hellip N) s = subtype index (s = urban four-leg signalized intersection rural three-leg minor stop
controlled intersection etc) t = severity index (t = TOT [total crashes] FI [fatal + injury crashes] PDO [property damage
only]) y = year index (y = 1 [base year] 2 hellip Y) cy = yearly calibration factor for crash subtype s severity t and year y d = dispersion parameter w = weight MajAADT = AADT on the major road (vehday) MinAADT = AADT on the minor road (vehday) PSI = potential for safety improvement
istyC = yearly correction factor
istyκ~ = (unadjusted) predicted number of crashes at intersection i for crash subtype s severity t and year y
istyκ = (adjusted) predicted number of crashes at intersection i for crash subtype s severity t and year y
istyX = EB-adjusted estimated number of crashes α = intercept
1β = coefficient of major AADT 2β = coefficient of minor AADT
The prioritization lists for urban two-lane roads in the Northern Virginia and Bristol
districts were then developed based on the PSIs obtained for three prioritization procedures These alternative prioritization procedures were the average crash rates (ACRs) for the study period (see Equation 23) the critical crash ratio (CCR) (see Eqs 24 through 27) (Garber and Hoel 2009) and the EB method The list was developed with the intersections having the highest PSI listed first followed by other intersections in descending order The execution of the EB method prioritization process was achieved through use of the computer codes in SAS Finally the effectiveness of using the EB method for prioritizing sites for safety improvement was illustrated by comparing the PSIs from using intersection crash rates critical crash and the EB procedures
16
Procedure for Crash Rate Method The ACR for the intersection is given as
( )(1000000)( )( )(365)T
TCACRN V
= (Eq 23)
where ACR = the average crash rate for the intersection under consideration (crashes1000000
approach volume) TC = number of crashes over the study period at the intersection N = duration of study period (yr) VT = average daily total approach volume at the intersection Procedure for Critical Rate Method
The critical rate method was accomplished by first computing the traffic base (TB) of the intersection under consideration using Equation 24 The ACR for the intersection under consideration is then computed using its TB as shown in Equation 25 The intersection critical crash rate (ICCR) is then determined using Equation 26 The critical crash ratio (CCR) for the intersection is then computed as the ratio of ICR and the average crash rate (AVR) for all intersections under the same category (intersection type urbanrural etc) as that for the intersection being considered using Equation 27 TB is given as
365
1 000 000
NxVxTB = (Eq 24)
where TB = the total approach volume over the study period of N years at the intersection under consideration (veh1000000) V = average daily approach volume at the intersection under consideration ACR is obtained as
TCACRTB
= (Eq 25)
where ACR = ACR at the intersection under consideration over the study period of N years
17
TB = the total approach volume over the study period of N years at the intersection under consideration (veh1000000) The critical crash rate (ICCR) for the intersection under consideration is given as
05 AVRICCR AVR TFTB TB
= + + (Eq 26)
where AVR = ACR for intersections within the state and of the same designation (eg rural three-leg with minor stop control) as that for the intersection under consideration TF = number of standard deviations for the confidence level being used in the analysis (usually 196 for 95 confidence level) TB = the total approach volume over the study period of N years at the intersection under consideration (veh1000000) The critical crash ratio (CCR) for the intersection is then obtained as
ACRCCRICCR
= (Eq 27)
where ACR = ACR at the intersection under consideration over the study period of N years (see Eq 2) ICCR = critical crash rate for the intersection under consideration (see Eq 26)
Benefits and Implementation Expectations
The expected benefits from developing SPFs and prioritizing intersection sites were illustrated by comparing the PSIs for the prioritized sites when sites were prioritized using the EB method with those obtained when sites were prioritized using crash rates and the critical crash ratio This analysis was conducted for the combined fatal plus injury crashes SPFs An estimate of the cost savings attributable solely to the potential reduction of crashes was also computed by using crash costs given in an FHWA study (FHWA 2005)
18
RESULTS AND DISCUSSION
Literature Review
SafetyAnalyst
The SafetyAnalyst Userrsquos Manual (ITT Corporation 2008) has SPFs that are suggested for intersections that are based on Minnesota data Tables 7 and 8 show the regression coefficients (α β1 and β2) for the SPFs developed for total and combined FI crashes respectively The values for the goodness of fit parameter RFT
2 are also given Although these RFT2 are all less
than 045 with a few less than 010 it has been suggested that the SPFs used in SafetyAnalyst could provide a realistic estimate of an expected crash frequency as a function of traffic volume and roadway geometry (Pham and Ragland 2005)
Methodological and Research References
Several studies similar to this study have been conducted in Canada Colorado California Texas New York and Minnesota For example a study was conducted using data from Colorado California and Texas to examine the functional form of the SPFs for urban freeways (Kononov et al 2008) Five years of crash data were acquired from the respective departments of transportation and the highway safety information system from Colorado The study revealed that the amount of crashes increased moderately with congestion in segments on urban freeways This study however did not include intersections
A study by Lyon et al was conducted in Toronto Ontario Canada to develop SPFs for urban signalized intersections (Lyon et al 2005) Collision data were gathered for five years and included 1950 urban intersections SPFs were developed for different severity levels impact types and intersection types such as four-leg and three-leg intersections The format used to develop the SPFs is shown in Equation 28 This format is somewhat different from that of Equation 4 suggested in Safety Analyst
Collisionsyear = α (F1)β1(F2)β2 exp (β3X1 + β4X2 + ) (Eq 28) where α and βi = the coefficients estimated in the SPF calibration process F1 and F2 = the entering AADTs on the major and minor roads respectively Xi = other independent variables (such as single lane versus multilane approaches with and without left-turn lanes or right-turn lanes high and low pedestrian activities or in some cases F1 or F2 or both)
19
Table 7 SafetyAnalystrsquos SPFs for Intersections (Total Crashes) Site
subtype Code
Site subtype Description
State Regression coefficients
LogIntercept (α)
Regression coefficients
LogAADTmaj (β1)
Regression coefficients LogAADT
min (β2)
Over - dispersion Parameter
(k)
RFT2
() Number of Sites
Max AADTmaj
(vehday)
Max AADTmin
(vehday)
Rural 201 Rural 3-leg with minor-
road STOP control MN -878 071 024 107 133 1706 28500 27000
202 Rural 3-leg with all-way STOP control
MN -1237 122 027 047 41 41 25300 6803
203 Rural 3-leg with signal control
MN -657 066 02 033 26 136 36400 11500
204 Rural 4-leg with minor-road STOP control
MN -896 065 047 07 299 2114 35500 26700
205 Rural 4-leg with all-way STOP control
MN -1237 122 027 047 41 41 25300 6803
206 Rural 4-leg with signal control
MN -657 066 02 033 26 136 36400 11500
Urban 251 Urban 3-leg with minor-
road STOP control MN -535 034 028 128 59 397 68000 18900
252 Urban 3-leg with all-way STOP control
MN -1237 122 027 047 41 41 25300 6803
253 Urban 3-leg with signal control
MN -985 097 018 023 414 33 50000 25807
254 Urban 4-leg with minor-road STOP control
MN -312 027 016 086 76 333 58870 81000
255 Urban 4-leg with all-way STOP control
MN -1237 122 027 047 41 41 25300 6803
256 Urban 4-leg with signal control
MN -347 042 014 032 264 418 75000 81000
ITT Corporation 2008
20
Table 8 SafetyAnalystrsquos SPFs for Intersections (Fatal and Injury Crashes) Site
subtype Code
Site subtype Description
State Regression coefficients
LogIntercept (α)
Regression coefficients
LogAADTmaj (β1)
Regression coefficients LogAADT
min (β2)
Over - dispersion Parameter
(k)
RFT2
() No of Sites
Max AADTmaj
(vehday)
Max AADTmin
(vehday)
Rural 201 Rural 3-leg with minor-
road STOP control MN -935 071 021 123 91 1706 28500 27000
202 Rural 3-leg with all-way STOP control
MN -1002 127 -022 089 248 41 25300 6803
203 Rural 3-leg with signal control
MN -783 075 014 05 215 136 36400 11500
204 Rural 4-leg with minor-road STOP control
MN -936 066 04 0 146 2114 35500 26700
205 Rural 4-leg with all-way STOP control
MN -1002 127 -022 089 248 41 25300 6803
206 Rural 4-leg with signal control
MN -783 075 014 05 215 136 36400 11500
Urban 251 Urban 3-leg with minor-
road STOP control MN -845 049 039 123 81 397 68000 18900
252 Urban 3-leg with all-way STOP control
MN -1002 127 -022 089 248 41 25300 6803
253 Urban 3-leg with signal control
MN -1022 091 021 027 362 33 50000 25807
254 Urban 4-leg with minor-road STOP control
MN -435 029 019 099 57 333 58870 81000
255 Urban 4-leg with all-way STOP control
MN -1002 127 -022 089 248 41 25300 6803
256 Urban 4-leg with signal control
MN -511 049 016 03 295 418 75000 81000
ITT Corporation 2008
21
The study examined the impact of two left turn priority treatments which were flashing advanced green (FAG) and left turn green arrow (LTGA) on left turn collisions These treatments were implemented at 35 intersections in the city of Toronto Two types of collisions were investigated left turns with and without side impact The results indicated that there was an insignificant difference in the impact of the left turn priority treatments on both types of crashes
Lord and Persaud (2003) conducted a study that related SPFs to transportation planning models They noted that traffic safety is not usually accounted for when agencies are conducting a planning analysis to remodel build upgrade or modify their facilities Five-year intersection data from Canada were used Models were developed and statistical measures such as the over dispersion parameter were calculated and conclusions were made from the results The SPFs developed for the study were applied to two sample networks created with the help of a transportation planning software package The research showed that it is possible to make estimation for traffic safety at the planning stage of a project This will allow users to take safety into consideration when designing and possibly create alternatives to change existing designs for more comprehensive projects or development The study also indicated that there are limitations when applying the SPFs to computerized transportation networks The study concluded that although it is possible to predict or estimate crashes on digital transportation networks the accuracy of prediction relies greatly on how precise the traffic flow estimates are
Jonsson et al (2007) performed an SPF study that took into consideration the type and severity of crashes andmdashmost importantmdashthe causal factors for these crashes The study was conducted for intersections on rural four-lane highways in the state of California Four collision types were tested in the study opposite-direction same-direction intersecting-direction and single-vehicle crashes In addition a set of data from the state of New York was used with the same parameters to analyze the severity distribution of crash types The data for California included 1084 intersections on four-lane rural highways and that from New York included 675 intersections mainly stop controlled or without any control Generalized linear modeling was performed with the data after quality analysis Two model forms were estimated with the variables seen in Equations 29 and 30
(Eq 29)
(Eq 30)
where NAcc = predicted number of crashesyr at intersections AADTmajor = AADT on major road AADTminor= AADT traffic flow on minor road Βi = model parameters Xi = variables that describe the intersections (such as terrain lighting left turn number of though lanes and divided or undivided among others)
nn xxxormajorAcc exAADTxAADTN ββββββ ++++=
min4433021
nn xxxormajorAcc exAADTAADTN βββββ +++++=
min332201)(
22
The two different models are different representations of the traffic flow The first represents the AADT of major and minor roads as separate variables but in the second model they are represented as one variable by the sum of the major and minor roads AADTs Results showed that the first model performed better for the multiple-vehicle crashes and the second model fitted better for the single-vehicle crashes In addition the appropriate predictor variables differed depending on the crash type This study is also of interest as it incorporated additional parameters to those in the suggested SPFs now included in SafetyAnalyst and therefore could lead to possible future SPF research for the state of Virginia
Persaud and Nguyen (1998) conducted a study on signalized intersections in Ontario Canada They developed aggregate and disaggregate models to estimate safety performance of three- and four-leg intersections in which crash severity (injury and PDO) environmental class (semi-urban and rural) and time period (daily weekday morning peak and weekday afternoon peak) were considered in the analysis An important aspect of that study is that it supplemented the existing models used for estimating SPFs instead of replacing them because it took into consideration features that were generally not considered in the then existing developed models Two model levels were considered for the study Level 1 was based on the sum of AADTs for all approaches with separate estimates for rear-end right angle and turning movement crashes At this level the equations were adjusted for three- and four-leg intersections by crash severity for all combined impact types and also separately for the three major impact types which were angle rear-end and turning movement In addition models were further separated by time period (daily weekday morning and afternoon peak) and for four-leg intersections which were also classified by environment class such as semi-urban and rural Level 2 allowed estimates to be obtained for specific crash patterns that were defined by movements of the vehicles involved before collision and the same were estimated as a function of the flows that were relevant to each of the patterns For this level models were estimated for four-leg intersections for 12 multi-vehicle and three single-vehicle patterns that were described by the movements of involved vehicles before collision The developed models were intended to estimate the parameters P and d shown in Equations 31 and 33
The safety of the intersection was estimated using the long-term mean based on the EB approach The long term mean (m) was obtained by combining crash count (x) of an intersection in the most recent years (n) with the estimates of the expected annual number of crashes (P) as shown in Equation 31 W1 and W2 in Equations 31 through 33 represent the weights estimated from the mean and variance of the regression estimates
(Eq 31)
(Eq 32)
(Eq 33)
m =W1(x) +W2(P)
2dW
d nP=
+
1PW
d nP=
+
23
(Eq 34)
To estimate the variance of m the following formula was used
(Eq 35)
In Equations 32 through 35 P and d represent the fundamental parameters Two models were selected for SPFs For Level 1 and single-vehicle Level 2 (Eq 36) For multi-vehicle in Level 2 (Eq 37) where P = expected number of crashes of a given type α and β = regression parameters to be estimated S (Level 1) = sum of all entering flows for a given time period for Level 1 analysis S (Level 2) = sum of the daily through right or left turn flows for a given time period for Level 2 (single-vehicle) analysis S1 and S2 = AADTs for small and large flows for a specific crash pattern in Level 2 (multi-vehicle) analysis
The models in either level can be used in the EB procedure to provide estimates for intersections that need to be treated or for the evaluation of the effectiveness of safety countermeasures It should be noted that the quality of the estimates for the study was strongly related to how the parameters were selected and used in the SPFs and unlike other available road models the ones presented in this study can be separated by time period and crash pattern Persaud et al (2002) conducted a study to demonstrate the complexity involved in the calibration of crash prediction models or SPFs for urban intersections Toronto data for three- and four-leg signalized intersections were used to estimate the models for the study The performance of these models was then compared with other models from Vancouver and California The models from these places were recalibrated to fit Toronto by using the Interactive Highway Safety Design Model (IHSDM) and a calibration procedure as proposed by Harwood et al (2000) The results varied significantly and were also mixed The study noted that the calibration of models is not a simple task and due to the importance of the SPFs they must be properly calibrated Several things must be accounted for when performing this procedure in order to obtain good quality data analysis The first thing is to extract a large sample of high quality data A software or program to link all the traffic crash and road characteristics data must exist because the same is usually kept stored in different databases In addition several
2Pd
Var P=
2( )
d xVar m dnP
+=
+
P =αSβ
P =αS1β1 S2
β 2
24
years of crash data must be obtained in order to have a good amount of samples that account for variations The actual process of model calibration is complicated therefore careful attention must be paid when analyzing the same because of the importance of the outcomes of the study The authors of the study made an exploratory analysis and it revealed that the relationship between the crashes and each covariate should be described either by the power function or the gamma function for all intersection types to be analyzed Equations 38 through 40 are the selected model forms used in the study F1 = Power F2 = Gamma (Eq 38) F1 = Gamma F2 = Power (Eq 39) F1 = Power F2 = Power (Eq 40) where E (K) = expected annual number of crashes between 1990 and 1995 F1 F2 = average entering AADT of major and minor roads respectively for the period 1990 to 1995 α β1 β2 β3 β4 = coefficients to be estimated
An NB structure was used to analyze the models and the overdispersion parameter (γ) was analyzed using Equation 41
γ=
2)K(E)K(Var (Eq 41)
Variance increases as γ decreases therefore the value of γ can also be used to make a comparison for the goodness of fit of several models fitted to the same data The larger the value of γ the smaller the variance therefore a more accurate model is given The authors suggest that γ would be enough to calculate the goodness of fit index of any SPF but if one desires to know how accurate the prediction estimate is other measures should also be computed The authors suggested using R2
α as proposed by Miaou et al (1996) which is a dispersion parameter based R2 computed as shown in Equation 42
γγ
minus=αmin2 1R (Eq 42)
where γ = overdispersion parameter for calibrated model γmin = smallest possible overdispersion parameter
The authors suggested that a disaggregation by traffic volume is preferable than using
only a single calibration factor for that is what the IHSDM currently has A recommendation is made to account for safety variation in traffic conditions over time by calibrating the models every two to three years as suggested by Harwood et al (2000)
E(K) =αF1β1 F2
β 2e(β 3F2 )
E(K) =αF1β1 F2
β 2e(β 4 F1 )
E(K) =αF1β1 F2
β 2
25
The Illinois Department of Transportation and the University of Illinois Urbana-Champaign conducted a research study to develop and implement SPFs for road segments and intersections in Illinois (Tegge et al 2010) These SPFs were developed in a way suitable for easy implementation in SafetyAnalyst The crash data (number of crashes and crash severity) and roadway data (number of lanes traffic volume area type and functional class) were collected and used for development of the SPFs Seventeen peer groups were used for developing the SPFs for segments and eight for intersections The intersections peer groups were minor leg stop control all-way stop control signalized and undetermined for rural and urban segments separately The SPFs for segments were developed using NB distribution for crashes and Poisson distribution for intersections The SAS GENMOD procedure was used to develop the SPFs for a five-year analysis period from 2001 to 2005 The model form for the intersection SPFs is the same as that given in the SafetyAnalyst Userrsquos Manual The SPFs were also developed for different crash severities such as fatal crashes type A injury crashes type B injury crashes and fatal plus injury crashes The EB method was used to determine the sites with the higher PSIs Two analysis techniques were used to obtain the PSIs The first considered segments and intersections as individual elements and the second used the sliding window approach The site specific analysis treated each individual segment and intersection as a separate entity Each segment is then compared with every other segment instead of having them grouped together The sliding window approach defined a set length The window lengths were 025 mile and 1 mile for urban and rural segments respectively
The largest impact on crash frequency was found to be the AADT and was therefore the only variable modeled as a logarithm (lnAADT) By doing this the AADT accounted for most of the prediction whereas the rest of the variables refined the prediction further Other variables used included access control functional class lane width surface type area type speed limit and median type The study recommended that a multivariate analysis be conducted for such studies to show how certain variables could contribute to the crashes Other variables could include roadway lighting weather and pavement conditions and roadway geometry The study also concluded that knowledge of roadway characteristics that increase the risk of fatal or injury crashes will facilitate the setting up of safety criteria that can help engineers in the designing of safer roadways Further knowledge of driver behaviors that lead to fatal and severe injury crashes can facilitate the training of enforcement officers to identify these behaviors
The Colorado Department of Transportation (CDOT) (2009) conducted a study to develop SPFs for intersections in the state Their model form is the same as that in SafetyAnalyst The SPFs were developed for many categories based on the number of legs divided undivided rural and urban including urban four-lane divided signalized six-lane divided signalized urban three-leg signalized two-lane undivided unsignalized and urban three-leg unsignalized When a median or left-turn lane is present a roadway is considered divided The sites selected for the study reflected variability in traffic volume and geometry in order to have a diverse representation of intersections throughout the state SPFs were developed for total and for fatal plus injury crash types A five-year study period from 2000 through 2005 was used Crash and AADT data were collected for development of the SPFs CDOT used a NB error structure to develop the SPFs and the EB procedure to estimate the expected safety performance of an intersection site for different safety management purposes Overdispersion parameters were computed and used as a goodness of fit measure According to their data
26
overdispersion parameters indicated that their models provided a reasonable fit to the Colorado data
Results indicated that for signalized intersections roads with six lanes on major approaches have more collisions than those with four lanes on major approaches CDOT recommended that the SPFs should be recalibrated in the future using data from future years as crash frequencies may change over time because of a variety of issues The report also recommended that separate calibration factors should be developed for different regions and different topographies Research in Virginia
In Virginia two other similar studies have recently been published One by Garber et al (2010) for two-lane roads and another by Hamidi et al (2010) to identify high-crash sections on Virginiarsquos primary system by developing a planning-level methodology The study by Garber et al developed SPFs for two-lane segments of 1 mile or less and the study by Hamidi et al developed SPFs for longer segments of two-lane roads that can be used for corridor analysis
Evaluation of the Recommended Minnesota SPFs
Figures 3 through 6 show representative graphs that were used to visually examine how well the Virginia data fitted the suggested Minnesota SPFs Figures 3 and 4 are for urban four-leg signalized intersections and Figures 5 and 6 are for rural four-leg signalized intersections These graphs suggest that the Minnesota SPFs do not fully represent the Virginia data Tables 9 through 12 show the Freeman-Tukey R2
FT coefficients computed for the different Minnesota SPFs using the Virginia data The low Freeman-Tukey R2
FT coefficients obtained and the visual inspection of the graphs suggested that a better fit to the Virginia data could be obtained by developing specific Virginia SPFs using Virginia data It was therefore decided to develop specific SPFs for Virginia
0
2
4
6
8
10
12
14
0 20000 40000 60000 80000 100000 120000
AADT Major
Tota
l Cra
shes
Per
Yea
r
Minnesota VA Actual Observed
Minnesota Model
Figure 3 Total crashes per year vs major AADT for urban 4-leg signalized intersections
with minor AADT of 700
27
0
5
10
15
20
25
30
35
0 20000 40000 60000 80000 100000 120000
AADT Major
Tota
l Cra
shes
per
Yea
r
Minnesota VA Actual Observed
Minnesota Model
Figure 4 Total crashes per year vs major AADT for urban 4-leg signalized intersections
with minor AADT of 4500
0
2
4
6
8
10
12
14
0 20000 40000 60000 80000 100000 120000
AADT Major
Tota
l Cra
shes
Per
Yea
r
Minnesota VA Actual Observed
Minnesota Model
Figure 5 Total crashes per year vs major AADT for rural 4-leg signalized intersections with
minor AADT of 795
28
0
2
4
6
8
10
12
14
16
18
0 20000 40000 60000 80000 100000 120000
AADT Major
Tota
l Cra
shes
per
Yea
r
Minnesota VA Actual Observed
Minnesota Model
Figure 6 Total crashes per year vs major AADT for rural 4-leg signalized intersections with
minor AADT of 5000
Table 9 Minnesota SPFs for Urban FI Crashes and Corresponding R2FT Based
on Virginia Data
Intersection Type
Minnesota FI SPFs R2
FT Based on Virginia Urban FI Crash Data ()
Urban 4-Leg Signalized 032
Urban 4-Leg Minor Stop Control 008
Urban 3-Leg Signalized 026
Urban 3-LegMinor Stop Control 01
Table 10 Minnesota SPFs for Urban TOTAL crashes and Corresponding R2
FT Based on Virginia Data
Type of Intersection
Minnesota SPFs
R2FT Based on Virginia Urban Total
Crash Data ()
Urban 4-Leg Signalized 034
Urban 4-Leg Minor Stop Control 022
Urban 3-Leg Signalized 031
Urban 3-Leg Minor Stop Control 01
29
Table 11 Minnesota SPFs for Rural TOTAL Crashes and Corresponding R2FT
Based on Virginia Data
Type of Intersection
Minnesota SPFs R2
FT Based on Virginia Rural Total Crash Data ()
Rural 4-Leg Signalized 029
Rural 4-Leg Minor Stop Control 013
Rural 3-Leg Signalized 029
Rural 3-Leg Minor Stop Control -010
Table 12 Minnesota SPFs for Rural FI Crashes and Corresponding R2FT Based
on Virginia Data
Type of Intersection
Minnesota SPFs R2
FT Based on Virginia Rural FI Crash Data ()
Rural 4-Leg Signalized 018
Rural 4-Leg Minor Stop Control 010
Rural 3-Leg Signalized 018
Rural 3-Leg Minor Stop Control 001
Development and Evaluation of Specific Virginia SPFs
In keeping with the suggestion given in the Safety Analyst Userrsquos Manual the model form used to develop the intersection SPFs is given in Equation 4 as
1 2k e x MajAADT x MinAADTβ βα=
where
k = predicted crash frequency per intersection per year MajAADT = AADT on the major road (vehday) MinAADT = AADT on the minor road (vehday) α = intercept β1 = coefficient of mayor AADT β2 = coefficient of minor AADT
30
The statewide SPFs developed for Virginia are given in Tables 13 through 16 Due to lack of data the analysis for all-way stop intersections could not be undertaken These tables also give the Freeman-Tukey R2
FT coefficient for each of the Virginia SPFs and the corresponding Minnesota SPF and Freeman-Tukey R2
FT based on the Virginia data The R2FT coefficients
obtained indicate that the Virginia-specific SPFs fit the Virginia data better than the suggested Minnesota SPFs for all types of intersections and crash severity except those for FI crashes on urban three-leg signalized rural four-leg signalized and rural four-leg minor stop control intersections where the corresponding RFT
2 values are similar In Table 15 it can be seen that the Minnesota R2
FT value is negative for the rural three-leg minor stop control intersections The negative RFT
2 value is possible because these calculations were not performed on the same data points that were used to create the Minnesota SPFs (Miller 2009) Table 13 SPF Models for Urban TOTAL crashes and R2
FT results for Virginia Statewide (VDOT-maintained roads)
SPF model with TOTAL Crash values
R2FT TOTAL
Crash Data
Site Virginia Statewide Minnesota VA MN
Urban 4-Leg Signalized 056 034
Urban 4-Leg Minor Stop Control
032 022
Urban 3-Leg Signalized 037 031
Urban 3-Leg Minor Stop Control
023 010
Table 14 SPF Models for Urban FI crashes and R2
FT results for Virginia Statewide (VDOT-maintained roads)
SPF model with FI Crash values R2FT FI Crash Data ()
Site
Virginia Statewide Minnesota VA MN
Urban 4-Leg Signalized 041 032
Urban 4-Leg Minor Stop Control
019 008
Urban 3-Leg Signalized 026 026
Urban 3-Leg Minor Stop Control
013 010
31
Table 15 SPF Models for Rural TOTAL Crashes and R2FT Results for Virginia Statewide (VDOT-
maintained roads) SPF model with TOTAL Crash values R2
FT TOTAL Crash Data
Site
Virginia Statewide Minnesota VA MN
Rural 4-Leg Signalized 0321 0290
Rural 4-Leg Minor Stop Control
0167 0132
Rural 3-Leg Signalized 0305 0291
Rural 3-Leg Minor Stop Control
0104 -0102
Table 16 SPF Models for Rural FI crashes and R2
FT results for Virginia Statewide (VDOT-maintained roads) SPF model with FI Crash values R2
FT TOTAL Crash Data
Site
Virginia Statewide Minnesota VA MN
Rural 4-Leg Signalized 0181 0181
Rural 4-Leg Minor Stop Control
0098 0097
Rural 3-Leg Signalized 0170 0180
Rural 3-Leg Minor Stop Control
0048 0012
Figures 7 through 10 show visual representations of how well the Virginia SPFs fit the
Virginia data in comparison with the suggested Minnesota SPFs In general the Virginia SPFs tend to fit the Virginia data better than the Minnesota SPFs although both sets of SPFs tend to have similar fits at low volumes (AADTmajor lt 2000) except for the SPF for total crashes on urban four-leg signalized intersections shown in Figure 7 The primary reason the Minnesota SPFs do not fit the Virginia data as well as the Virginia SPFs may be the dissimilarities of the roadside environment and the characteristics of the different databases
32
0
2
4
6
8
10
12
14
0 20000 40000 60000 80000 100000 120000
AADT Major
Tota
l Cra
shes
Per
Yea
r
Minnesota VA Actual Observed Virginia
Minnesota Model
Virginia M odel
Figure 7 Total crashes per year vs major AADT for urban 4-leg signalized intersections
with minor AADT of 700
0
5
10
15
20
25
30
35
0 20000 40000 60000 80000 100000 120000
AADT Major
Tota
l Cra
shes
per
Yea
r
Minnesota VA Actual Observed Virginia
Minnesota Model
Virginia Model
Figure 8 Total crashes per year vs major AADT for urban 4-leg signalized intersections
with minor AADT of 8000
33
0
2
4
6
8
10
12
14
0 20000 40000 60000 80000 100000 120000
AADT Major
Tota
l Cra
shes
Per
Yea
r
Minnesota VA Actual Observed Virginia
Virginia Model
Minnesota Model
Figure 9 Total crashes per year vs major AADT for rural 4-leg signalized intersections with
minor AADT of 79
0
5
10
15
20
25
0 20000 40000 60000 80000 100000 120000
AADT Major
Tota
l Cra
shes
per
Yea
r
Minnesota VA Actual Observed Virginia
Minnesota Model
Virginia Model
Figure 10 Total crashes per year vs minor AADT for rural 4-leg signalized intersections with major AADT of 5000
As discussed in the Methodology section in addition to the statewide Virginia SPFs
specific SPFs were developed for each operational region to consider the different topographical characteristics that exist across Virginia The complete set of SPFs together with the associated p values for the regression coefficients are shown in Tables A-1 and A-2 of Appendix A All p values are less than 005 with most being less than 00001 except for some of the rural four-leg signalized intersections regional specific SPFs These p values indicate that the estimated coefficients are statistically significant at the 95 confidence level or better A possible reason
34
for higher p values for a small number of SPFs may be the sample size used for developing these SPFs
To test the transferability and fit of the Virginia statewide specific SPFs several
statistical parameters were determined for the 70 (estimation) data set and the 30 (validation) data set separately The corresponding values for each of these parameters were then compared The results are shown in Tables 17 and 18 for urban and rural intersections respectively The results for the regional SPFs are shown in Tables A-3 through A-8 of Appendix A The results indicate that the developed models are transferable to the 30 validation data set For example the MSE values for the 70 estimation data are similar to the MSPE values for the 30 validation data In addition the mean prediction bias MPB values for the 30 validation data are close to zero (-076 le MPB ge -0004) in Table 17 and (-0067 le MPB ge 00513) in Table 18
Table 17 Goodness of Fit Results for Urban Statewide SPFs
Data Estimation data 70 Validation Data 30 Subtype Site MSE r2 R2
FT MPB MAD MSPE R2FT
Total VA 41150 0529 0557 -0760 4329 38490 0575
Total MN
68636 0506 0336 -3145 5421 68156 0315
FI VA
7043 0385 0406 -0458 1938 7671 0475
Urban 4-Leg Signalized
FI MN 7702 0372 0324 -0316 2124 8981 0376
Total VA 2238 0315 0313 -0034 0897 2383 0292
Total MN 2510 0287 0215 0091 0982 2730 0182
FI VA 0530 0194 0193 -0004 0432 0533 0194
Urban 4-Leg Minor Stop Control
FI MN 0560 0182 0080 0128 0522 0577 0052
Total VA 24900 0375 0370 -0645 3519 27591 0369
Total MN 29322 0365 0308 -2238 3661 33079 0272
FI VA 4467 0275 0259 -0185 1527 4875 0262
Urban 3-Leg Signalized
FI MN 4528 0267 0261 -0294 1526 4937 0261
Total VA 1854 0254 0230 -0043 0893 2038 0239
Total MN 2388 0237 0104 -0541 0902 2600 0107
FI VA 0428 0151 0133 -0021 0431 0476 0157
Urban 3-Leg Minor Stop Control
FI MN 0478 0140 0097 -0184 0385 0537 0104
35
Table 18 Goodness of Fit Results for Rural Statewide SPFs
Data Estimation Data 70
Validation Data 30
Subtype Site MSE r2 R2FT MPB MAD MSPE R2
FT
Total VA 10990 0353 0321 0513 2210 10070 -0073
Total MN 12400 0339 0290 -0154 2071 8460 0035
FI VA 2350 0196 0181 0045 1189 2600 -0034
Rural 4-Leg Signalized
FI MN 2400 0188 0181 -0043 1164 2420 0004
Total VA 1090 0182 0167 -0067 0794 1190 0171
Total MN 1190 0167 0132 -0348 0774 1320 0115
FI VA 0480 0112 0098 -0022 0504 0530 0110
Rural 4-Leg Minor Stop Control
FI MN 0500 0104 0097 -0158 0459 0560 0093
Total VA 5490 0328 0305 -0010 1651 5760 0179
Total MN NA NA NA NA NA NA NA
FI VA 1450 0181 0170 -0041 0902 1710 0099
Rural 3-Leg Signalized
FI MN NA NA NA NA NA NA NA
Total VA 0690 0144 0104 -0008 0613 0730 0102
Total MN 0890 0141 -0102 -0404 0555 0940 -0104
FI VA 0250 0071 0048 -0009 0345 0260 0048
Rural 3-Leg Minor Stop Control
FI MN 0270 0068 0012 -0144 0270 0290 0003
Pruning of Virginia-Specific SPFs A total of 64 SPFs were initially developed using the appropriate data for Virginia as shown in Tables A-1 and A-2 of Appendix A Considering that not all regional models might be necessary the pruning process described in the methodology section was carried out to prune the number of SPFs to the minimum effective number as seen in Tables 19 and 20 for urban and rural intersections respectively The pruning process resulted in 19 SPFs for urban sites and 15 for rural sites To facilitate the use of the correct SPF for a specific type of intersection located in a specific region the lists of the appropriate SPFs to be used are given in Tables B-1 and B-2 of Appendix B for the urban and rural intersections respectively
As can be seen in Tables 19 and 20 and Tables A-1 and A-2 of Appendix A there are some trends worth discussing for the benefit of the study and possible future research With regards to the three different operational regions the Western region retained many more of the specific regional urban SPFs than any other region For example the Western regional SPFs were retained for all urban intersection sites whereas for the Eastern region the only SPFs
36
retained were those for urban four-leg signalized FI crashes and urban four-leg minor stop control for total and FI crashes Similarly the only urban SPF retained for the Northern region was that for urban four-leg minor stop control for total crashes For the rural intersection sites all of the Western regional SPFs were retained except those for rural three-leg signalized total and FI crashes and rural four-leg minor stop control FI crashes The majority of the Eastern region rural SPFs were discarded except those for rural four-leg signalized total and FI crashes while for the Northern region all regional SPFs were discarded
The Western region retained more specific regional SPFs than the other two regions This suggests that the intersections in the Western region exhibit more unique characteristics than those for the other regions This may be due to the more mountainous terrain in the Western region compared to those in the Eastern and Northern regions This supports the philosophy of developing specific SPFs based on the topography of different regions
Site Prioritization
To illustrate the benefits of using the EB method to prioritize intersection sites for safety
improvements the top 25 urban sites from the Bristol and Northern Virginia districts were identified by using crash rates critical crash ratio and the EB method The PSI for each site identified was then determined The results obtained are shown in Tables 21 and 22 for the Bristol and the Northern Virginia districts respectively The results indicate that for the Northern Virginia District the PSIs for the top 25 sites are 258 1317 and 27440 crashes per year and for the Bristol District 432 646 and 1496 crashes per year for the crash rates critical crash ratio and EB methods respectively The important thing in Tables 21 and 22 is the sum of the PSI columns ranked by the three methods The sum of each of the PSIs for the crash rate and critical crash ratio method is lower than that for the EB method These results suggest that the use of the EB method in the planning process will identify intersection sites with the highest PSIs and therefore where detailed assessments to determine feasible and effective safety treatments should be undertaken
37
Table 19 MSPE Values for Virginia Urban Statewide and Urban Regional SPFs Used for Pruning
Data Pruning
Subtype
Site
MSPE [MSPEVA-
MSPEOR]1 [abs(MSPEVA-
MSPEOR)]2 [abs(MSPEVA-
MSPEOR)MSPEVA]3
RetainDiscardTotal VA 3849 Northern 4486 -637 637 0165497532 Discard Western 1791 2058 2058 0534684334 Retain Eastern 3745 104 104 0027020005 Discard FI VA 7671 Northern 95 -1829 1829 0238430452 Discard Western 517 2501 2501 0326033112 Retain
Urban 4-Leg Signalized
Eastern 541 2261 2261 0294746448 Retain Total VA 23834 Northern 202 03634 03634 015247126 Retain Western 105 13334 13334 0559452882 Retain Eastern 115 12334 12334 0517496014 Retain FI VA 05327 Northern 048 00527 00527 0098929979 Discard Western 033 02027 02027 0380514361 Retain
Urban 4-Leg Minor Stop Control
Eastern 036 01727 01727 0324197485 Retain Total VA 275911 Northern 2687 07211 07211 0026135239 Discard Western 2441 31811 31811 0115294425 Retain Eastern 3878 -111889 111889 0405525695 Discard FI VA 48754 Northern 448 03954 03954 0081101038 Discard Western 339 14854 14854 0304672437 Retain
Urban 3-Leg Signalized
Eastern 586 -09846 09846 020195266 Discard Total VA 20379 Northern 219 -01521 01521 0074635654 Discard Western 164 03979 03979 0195250012 Retain Eastern 223 -01921 01921 0094263703 Discard FI VA 04756 Northern 05 -00244 00244 0051303616 Discard Western 038 00956 00956 0201009251 Retain
Urban 3-Leg Minor Stop Control
Eastern 05 -00244 00244 0051303616 Discard 1 Difference between mean square prediction error (MSPE) of Virginia statewide model and OR model 2 Absolute value of the difference between Virginia statewide model MSPE and operational region model MSPE 3 Absolute value of the difference between Virginia statewide model MSPE and operational region model MSPE divided by the Virginia statewide MSPE for comparison
Retained SPFs Discarded if value is negative Discarded if less than 01
38
Table 20 MSPE Values for Virginia Rural Statewide and Rural Regional SPFs Used for Pruning Data Pruning
Subtype
Site
MSPE
[MSPEVA-MSPEOR]1
[abs(MSPEVA-MSPEOR)]2
[abs(MSPEVA-MSPEOR)MSPEVA]3
RetainDiscard
Total VA 1007 Northern 3422 -2415 2415 2398212512 Discard Western 605 402 402 0399205561 Retain Eastern 512 495 495 0491559086 Retain FI VA 26 Northern 976 -716 716 2753846154 Discard Western 159 101 101 0388461538 Retain
Rural 4-Leg Signalized
Eastern 137 123 123 0473076923 Retain Total VA 119 Northern 164 -045 045 0378151261 Discard Western 102 017 017 0142857143 Retain Eastern 114 005 005 0042016807 Discard FI VA 053 Northern 052 001 001 0018867925 Discard Western 048 005 005 0094339623 Discard
Rural 4-Leg Minor Stop Control
Eastern 049 004 004 0075471698 Discard Total VA 576 Northern 1475 -899 899 1560763889 Discard Western 674 -098 098 0170138889 Discard Eastern 626 -05 05 0086805556 Discard FI VA 171 Northern 212 -041 041 0239766082 Discard Western 403 -232 232 1356725146 Discard
Rural 3-Leg Signalized
Eastern 157 014 014 0081871345 Discard Total VA 073 Northern 093 -02 02 0273972603 Discard Western 053 02 02 0273972603 Retain Eastern 069 004 004 0054794521 Discard FI VA 026 Northern 03 -004 004 0153846154 Discard Western 023 003 003 0115384615 Retain
Rural 3-Leg Minor Stop Control
Eastern 027 -001 001 0038461538 Discard 1 Difference between mean square prediction error (MSPE) of Virginia statewide model and OR model 2 Absolute value of the difference between Virginia statewide model MSPE and operational region model MSPE 3 Absolute value of the difference between Virginia statewide model MSPE and operational region model MSPE divided by the Virginia statewide MSPE for comparison
Retained SPFs Discarded if value is negative Discarded if less than 01
39
Table 21 PSIs for Top 25 Sites in District 1 Urban (Bristol) FI
Crashes Ranking Based on Crash
Rates Ranking Based on Crash Ratio Ranking Based on EB
Method
Rank Intersection Node
Crash Rate1 PSI2 Intersection
Node Crash Ratio3 PSI Intersection
Node PSI
1 596726 22112 00000 651193 39672 00000 596095 21413
2 606469 20079 00000 606238 39298 06297 596393 08787
3 706818 12504 00000 651075 31264 00000 651130 08453
4 651193 11550 00000 596726 29227 00000 596701 07112 5 651075 09369 00000 606469 28039 00000 651802 06929 6 606238 08382 06297 651233 25831 03612 636331 06726 7 651807 07089 00000 651130 22718 08453 596395 06579 8 651233 06068 03612 706818 22555 00000 596937 06415 9 651230 05990 00000 651230 20301 00000 606238 06297
10 651783 05756 00000 651210 18882 04747 661033 06061 11 636093 04960 00000 636331 17913 06726 596372 05417 12 651274 04475 00000 651807 16847 00000 636372 04808 13 651130 04179 08453 651805 15814 00000 651210 04747 14 651210 03918 04747 651223 15627 03589 636491 04649 15 636331 03393 06726 651783 15009 00000 596420 04633 16 651223 03363 03589 596095 14865 21413 596403 04579 17 606232 03331 00000 636405 14769 00000 651603 04531 18 651127 03053 00000 661033 14555 06061 636056 04351 19 651999 03048 00000 596353 14215 03717 712033 04110 20 596449 02962 00000 636093 13782 00000 704691 04102 21 636405 02811 00000 651879 13192 00000 651838 04100 22 651883 02698 00000 651274 12975 00000 651894 03878 23 596353 02686 03717 651127 12972 00000 596353 03717 24 651805 02663 00000 651999 12959 00000 651233 03612 25 661033 02500 06061 596449 12702 00000 651889 03601
sum 43202 sum 64615 sum 149606 1Number of crashes per year per 1000000 total approach volume 2Potential for safety improvement (crashes yr) the difference between the EB-adjusted long-term crashes and the SPF-estimated crashes 3Ratio of actual crash rate to critical crash rate
40
Table 22 PSIs for Top 25 Sites in District 9 Urban (Northern Virginia District) FI
Crashes Ranking Based on Crash
Rates Ranking Based on Crash Ratio Ranking Based on EB
Method
Rank Intersection Node
Crash Rate1 PSI2 Intersection
Node Crash Ratio3 PSI Intersection
Node PSI
1 718192 191841 00000 718192 257523 00000 264119 150122 2 702946 178194 00000 547722 152371 11175 263375 140091 3 271531 64846 00000 263628 102794 00000 278648 137239 4 263628 52858 00000 263728 100092 00000 276819 131395 5 263728 42215 00000 719754 95274 09444 263290 130743 6 266955 35294 00000 702946 79268 00000 722678 127897 7 547722 34932 11175 263403 77252 05184 264725 118671 8 702612 30441 00000 704237 77175 07648 267028 116627 9 273886 29539 00000 263729 74681 00000 265204 115925
10 716747 27632 00000 271531 72327 00000 274766 115679 11 263626 27139 00000 263135 66458 18068 263249 113372 12 269485 26567 00000 716747 64461 00000 547044 110769 13 728954 26344 00000 266955 56657 00000 549349 107180 14 263729 25208 00000 546138 52003 31028 268210 105630 15 546988 21922 00000 547544 51924 32529 263347 104257 16 274338 21446 00000 263626 50389 00000 276351 102313 17 429308 21354 00000 269485 49897 00000 428167 100064 18 720401 21197 00000 728954 49702 00000 264344 98789 19 267295 20954 00000 548686 49572 03621 277764 91554 20 267536 20874 00000 711601 47985 04440 263467 89259 21 265938 20484 00000 266970 47730 00000 263090 89199 22 273354 20108 00000 546462 46856 03620 703414 88610 23 268345 19362 00000 265938 46726 00000 428629 87379 24 719754 19073 09444 720401 44833 00000 272219 85659 25 263403 19015 05184 728496 43666 04990 428544 85610
Sum 25803 sum 131747 sum 2744033 1Number of crashes per year per 1000000 total approach volume 2Potential for safety improvement (crashes yr) the difference between the EB-adjusted long-term crashes and the SPF-estimated crashes 3Ratio of actual crash rate to critical crash rate
41
CONCLUSIONS
bull The development of SPFs for intersections is necessary for Virginia because the SafetyAnalyst-suggested SPFs which are based on Minnesota data do not represent the Virginia data well Regarding the fit of the SPFs to Virginia data the R2
FT values shown in Tables 13 through 16 for Minnesota and Virginia indicate that the Virginia-specific SPFs fit the Virginia data better than the Minnesota models This may be due to the dissimilarities of the roadside environment such as difference in topography and the characteristics of the different Virginia and Minnesota databases
bull In some cases the specific regional SPFs fit the regional data better than the statewide
SPFs suggesting that the specific SPFs should be considered for use when available These group divisions that have similar roadway characteristics and driver expectations in some cases tend to improve the fit
bull In identifying intersection sites for safety improvements it is clearly beneficial for the EB
method to be used with the suitable SPFs rather than a crash rate or critical ratio method Results of the site prioritization show a much higher potential for crash reduction when the EB method is used with the appropriate SPFs rather than a procedure based on crash rates or critical rates
RECOMMENDATIONS
1 VDOTrsquos TED should use the Virginia-specific SPFs when using the SafetyAnalyst tools The results of this study have shown that the Virginia-specific SPFs reflected the Virginia data better than the SafetyAnalyst-recommended Minnesota SPFs
2 VDOTrsquos TED should investigate the feasibility of using multiple SPFs in SafetyAnalyst If
feasible regional SPFs should be used If it is not currently feasible to use multiple SPFs VDOTrsquos TED should ask that the FHWA include regional information in SafetyAnalyst so as to allow the use of regional SPFs For the specific regional SPFs to be applied to Virginia and other states the SafetyAnalyst tool should be capable of incorporating the necessary data that support the regional models
3 As soon as it is feasible to use regional SPFs VDOTrsquos TED should use the 19 SPFs
developed for urban intersections and the 15 developed for rural intersections when using the tools in SafetyAnalyst Although the statewide SPFs are available for use by an analyst the specific regional models included in the final set of SPFs will predict crashes better than the statewide SPFs The regional analysis will not only ease the use of specific regional SPFs but will also be of benefit when predicting the potential for safety improvement of a specific site
4 For future similar SPF studies VDOTrsquos TED should be directly involved in screening the
traffic data for accuracy and consistency as was done in this study The direct involvement of the TED in the screening of the traffic data significantly contributed to the accuracy of the
42
data and greatly contributed to the confidence the researchers place on the data used in the study
5 The Virginia Transportation Research Council (VTRC) should conduct a study as soon as
feasible to verify whether incorporating independent variables for which data are available other than AADT such as intersection geometry and other characteristics will result in SPFs that better fit the Virginia data Although the currently suggested SafetyAnalyst SPFs use only the AADTs as the independent variables it is likely that provision will be made for use of SPFs that incorporate other independent variables such as number of approaches entering lanes and the other variables for which data are available as these SPFs are likely to give better fit to crash data
6 As soon as feasible VTRC should undertake a study to develop SPFs for the urban system
intersections which are not currently maintained by VDOT as these intersections may have different crash characteristics than those maintained by VDOT This would facilitate the use of SafetyAnalyst in programming sites that are currently not being maintained by VDOT
BENEFITS AND IMPLEMENTATION PROSPECTS
Significant benefits will be accrued by the use of the Virginia-specific SPFs developed in this study This is clearly illustrated in two ways First in examining the transferability of the suggested SPFs in SafetyAnalyst it is clear that these SPFs do not fit the Virginia data very well The results also indicate that the Virginia-specific SPFs fit the Virginia data much better than the suggested SafetyAnalyst SPFs Second the availability of the Virginia-specific SPFs will enhance the use of the EB procedure given in SafetyAnalyst for prioritizing sites for safety improvements This study has also shown that the EB method better identifies sites with higher potential for crash reduction than those identified by crash rates For example the illustrated examples given for the Bristol and Northern Virginia districts show that the potential reduction in FI crashes when the top 25 sites are identified by the EB method is 28936 (1496 + 27440) crashes per year whereas that obtained when the critical crash ratio method is used for prioritization is only 1963 (646 + 1317) and that obtained with the crash rate method is only 690 (432 + 258) crashes per year This gives a net benefit of 26973 potential crashes per year compared to the critical crash ratio method and 28246 compared to the crash rate method Assuming an average cost of FI crashes of $95629 (FHWA 2005) and only 10 of the estimated net benefit PSI of 28246 crashes per year is achieved the total savings of more than $27 million per year could be accrued The prospects for implementation of the recommendations are very high as the study was requested by VDOTrsquos TED which is planning to incorporate these SPFs in the use of the tools provided in SafetyAnalyst
43
ACKNOWLEDGMENTS
The authors appreciate the opportunity afforded them by VDOT and VTRC to conduct this study Special thanks to Stephen Read (VDOT) Dr In-Kyu Lim (VDOT) Dr Young-Jun Kweon (VTRC) and VDOTrsquos Central Office for their interest and support in SPFs and their help in the selection of intersection sites Many thanks to Lewis Woodson (VTRC) and James Hill (University of Virginia) for all their help and input throughout the study
REFERENCES Cogburn P VDOT Interagency Coordination 2007 Virginia Emergency Management
Conference Virginia Department of Transportation Richmond April 2007 Colorado Department of Transportation DTD Applied Research and Innovation Branch Safety
Performance Functions for Intersections CDOT-2009-10 Denver December 2009 Fridstroslashm L Ifver J Ingebrigtsen S Kulmala R and Thomsen LK Measuring the
Contribution of Randomness Exposure Weather and Daylight to the Variation in Road Accidents Counts Accident Analysis and Prevention Vol 27 No 1 1995 pp 1-20
Federal Highway Administration Cost of Crashes by Severity Table FHWA-HRT-05-051
Washington DC 2005 Federal Highway Administration SafetyAnalyst Home Page httpwwwsafetyanalystorg
Accessed February 2010 Garber N and Hoel L Traffic amp Highway Engineering 4th ed Cenage Learning Toronto
Canada 2009 Garber NJ Haas PR and Gosse C Development of Safety Performance Functions for Two-
Lane Roads Maintained by the Virginia Department of Transportation VTRC 10-R25 Virginia Transportation Research Council Charlottesville 2010
Hamidi A Fontaine MD and Demetsky MJ A Planning-Level Methodology for Identifying
High-Crash Sections of Virginiarsquos Primary System VTRC 11-R4 Virginia Transportation Research Council Charlottesville 2010
Harwood D Council FM Hauer E Hughes WE and Vogt A Prediction of the Expected
Safety Performance of Rural Two-lane Highways Federal Highway Administration McLean VA December 2000
Harwood DW Bauer KM Richard KR Gilmore DK Persaud B and Lyon C
Development of SPFs for Safety Analyst Interim Tools Technical Memorandum
44
Prepared by Midwest Research Institute for the Federal Highway Administration McLean VA 2004
ITT Corporation SafetyAnalyst Userrsquos Manual Turner-Fairbank Highway Research Center
McLean VA 2008 Jonsson T Ivan J and Zhang C Crash Prediction Models for Intersections on Rural
Multilane Highways Differences by Collision Type In Transportation Research Record Journal of the Transportation Research Board No 2019 Transportation Research Board of the National Academies Washington DC 2007 pp 91-98
Kweon Y-J and Lim I-K Appropriate Regression Model Types for the Empirical Bayes
Method and SafetyAnalyst In Proceedings of the 89th Annual Meeting of the Transportation Research Board Transportation Research Board of the National Academies Washington DC 2010
Kononov J Bailey B and Allery B Exploratory Examination of the Functional Form of
Safety Performance Functions of Urban Freeways Colorado Department of Transportation and San Diego State University Denver CO 2008
Lyon C Haq A Persaud B and Kodama S Safety Performance Functions for Signalized
Intersections in Large Urban Areas Development and Application to Evaluation of Left-Turn Priority Treatment In Transportation Research Record Journal of the Transportation Research Board No 1908 Transportation Research Board of the National Academies Washington DC 2005 pp 165-171
Lord D and Persaud B Estimating the Safety Performance of Urban Road Transportation
Networks Center for Transportation Safety Texas Transportation Institute Texas AampM University and Department of Civil Engineering Ryerson University College Station TX 2003 pp 609-620
Miaou S-P Lu A and Lum H S Pitfalls of using R2 to Evaluate Goodness of Fit of
Accident Prediction Models In Transportation Research Record Journal of the Transportation Research Board No 1542 Transportation Research Board of the National Academies Washington DC 2005 1996 pp 6-13
Miller P Re Negative R squared Email Archive Division of Biostatistics Washington
University in St Louis February 2 2005 February 2 2005 httpwwwbiostatwustleduarchiveshtmljmp-l2005msg00075html Accessed February 2010
Persaud B Lord D and Palmisano J Calibration and Transferability of Accident Prediction
Models for Urban Intersections In Transportation Research Record Journal of the Transportation Research Board No 1784 Transportation Research Board of the National Academies Washington DC 2002 pp 57-64
45
Persaud B and Nguyen T Disaggregate Safety Performance Models for Signalized Intersections on Ontario Provincial Roads In Transportation Research Record Journal of the Transportation Research Board No 1635 Transportation Research Board of the National Academies Washington DC 1998 pp 113-120
Pham T and Ragland D Summary of Crash Prediction Models Also known as Safety
Performance Functions (SPFs) California Partners for Advanced Traffic and Highways and University of California Berkeley Berkeley 2005
SAS Institute Inc SAS OnlineDoc Version Eight Cary NC
httpwwwtecnionacildocssasril Accessed 2009 Tegge RA Jo J-H and Ouyang Y Development and Application of Safety Performance
Functions for Illinois ICT-10-066 Illinois Center for Transportation University of Illinois Urbana-Champaign March 2010
Virginiarsquos Surface Transportation Safety Executive Committee Commonwealth of Virginiarsquos
Strategic Highway Safety Plan 2006-2010 Virginia Department of Transportation Richmond 2006
Washington S Persaud B Lyon C and Oh J Validation of Accident Models for
Intersections FHWA-RD-03-037 Federal Highway Administration McLean VA 2005
46
47
APPENDIX A
STATISTICAL PARAMETERS AND GOODNESS-OF-FIT RESULTS
Table A-1 Statistical Parameters for Urban Intersections SPFs Parameter Estimates
Data Intercept
Coefficient of Mayor AADT
Coefficient of Minor AADT
Subtype Site Intercept (α)
StndError
P value
lnMajor (β1)
StndError
P value
lnMinor (β2)
StndError
P value
Total VA -76234 048 lt0001 06742 005 lt0001 03453 003 lt0001
OR1 -83067 056 lt0001 07522 005 lt0001 0328 003 lt0001OR10 -123913 122 lt0001 10631 013 lt0001 04567 006 lt0001OR 100 -88553 077 lt0001 07825 007 lt0001 03706 004 lt0001FI VA -85256 057 lt0001 06477 006 lt0001 03579 004 lt0001OR1 -96546 063 lt0001 07603 006 lt0001 03597 004 lt0001OR10 -114284 15 lt0001 08662 016 lt0001 04412
Urban 4-Leg Signalized
OR 100 -99582 100 lt0001 07484 009 lt0001 04017 005 lt0001Total VA -60723 022 lt0001 04558 002 lt0001 0347 004 lt0001
OR1 -6059 044 lt0001 0505 004 lt0001 02773 006 lt0001OR10 -67031 057 lt0001 03986 007 lt0001 04999 009 lt0001OR 100 -65388 032 lt0001 04689 004 lt0001 043 006 lt0001FI VA -76917 032 lt0001 05001 003 lt0001 03695 005 lt0001OR1 -81437 060 lt0001 05813 005 lt0001 03188 008 lt0001OR10 -80333 063 lt0001 03446 007 lt0001 06218 010 lt0001
Urban 4-Leg Minor Stop Control
OR 100 -83166 051 lt0001 05253 006 lt0001 04695 008 lt0001Total VA -6543 082 lt0001 06591 008 lt0001 02119 002 lt0001
OR1 -4999 103 lt0001 05555 009 lt0001 01554 003 lt0001OR10 -96143 127 lt0001 08677 012 lt0001 03297 005 lt0001OR 100 -67518 110 lt0001 06157 011 lt0001 02969 005 lt0001FI VA -84268 068 lt0001 07147 006 lt0001 02481 002 lt0001OR1 -73982 099 lt0001 06496 009 lt0001 02088 003 lt0001OR10 -110104 155 lt0001 0908 015 lt0001 03226 006 lt0001
Urban 3-Leg Signalized
OR 100 -7266 107 lt0001 05508 011 lt0001 03107 006 lt0001Total VA -54696 013 lt0001 04874 002 lt0001 01985 001 lt0001
OR1 -5361 018 lt0001 04959 002 lt0001 01676 002 lt0001OR10 -5773 034 lt0001 04877 003 lt0001 02314 004 lt0001OR 100 -51642 021 lt0001 04338 003 lt0001 02309 003 lt0001FI VA -74642 018 lt0001 05791 002 lt0001 02091 002 lt0001OR1 -76877 027 lt0001 06204 003 lt0001 0181 002 lt0001OR10 -69458 047 lt0001 05096 004 lt0001 02212 005 lt0001
Urban 3-Leg Minor Stop Control
OR 100 -69883 031 lt0001 05169 004 lt0001 02308 003 lt0001 Standard Error
48
Table A-2 Statistical Parameters for Rural Intersections SPFs Parameter Estimates
Data Intercept
Coefficient of Mayor AADT
Coefficient of Minor AADT
Subtype Site Intercept (α)
StndError
P value
lnMajor (β1)
Stnd Error
P value
lnMinor (β2)
Stnd Error
P value
Total VA -69589 118 lt0001 06746 009 lt0001 0253 009 00047
OR1 -1604 237 04974 02284 021 02791 01514 012 0211 OR10 -63951 183 00005 05508 014 00001 03106 014 00224 OR 100 -06468 220 07692 02262 016 01635 -00158 017 09274 FI VA -87116 128 lt0001 07839 011 lt0001 02166 009 0013 OR1 -33285 246 01767 03601 024 0126 00597 013 06478 OR10 -80583 175 lt0001 06809 018 00001 02557 013 0057
Rural 4-Leg Signalized
OR 100 -48381 221 00287 04243 018 00193 01523 018 03943 Total VA -5494 020 lt0001 03533 002 lt0001 03935 003 lt0001
OR1 -62351 058 lt0001 04167 006 lt0001 04507 008 lt0001OR10 -53594 028 lt0001 03379 003 lt0001 03998 004 lt0001OR 100 -51255 027 lt0001 02914 003 lt0001 04075 004 lt0001FI VA -66927 030 lt0001 03899 003 lt0001 04156 004 lt0001OR1 -82561 095 lt0001 05221 009 lt0001 04962 012 lt0001OR10 -70797 044 lt0001 03789 004 lt0001 0497 005 lt0001
Rural 4-Leg Minor Stop Control
OR 100 -63326 038 lt0001 03223 004 lt0001 04424 005 lt0001Total VA -75754 084 lt0001 06465 008 lt0001 03332 008 lt0001
OR1 -58798 220 00075 05076 020 00143 0313 013 00161 OR10 -64368 110 lt0001 0544 011 lt0001 02863 006 lt0001OR 100 -9899 139 lt0001 08047 015 lt0001 04386 006 lt0001FI VA -87112 103 lt0001 07224 010 lt0001 02578 006 lt0001OR1 -9219 260 00004 07258 022 00011 03407 016 00326 OR10 -88607 146 lt0001 07059 016 lt0001 02809 008 00009
Rural 3-Leg Signalized
OR 100 -111835 185 lt0001 08669 018 lt0001 03977 008 lt0001Total VA -43293 008 lt0001 03366 001 lt0001 02087 001 lt0001
OR1 -50904 022 lt0001 0406 002 lt0001 02752 003 lt0001OR10 -40969 009 lt0001 03133 001 lt0001 02001 001 lt0001OR 100 -4231 016 lt0001 02997 002 lt0001 02308 003 lt0001FI VA -53415 011 lt0001 03394 001 lt0001 02237 001 lt0001OR1 -64457 031 lt0001 04195 003 lt0001 0307 004 lt0001OR10 -50831 014 lt0001 03245 002 lt0001 02014 002 lt0001
Rural 3-Leg Minor Stop Control
OR 100 -51046 024 lt0001 03163 003 lt0001 02112 003 lt0001
Standard Error
49
Table A-3 SPFs Goodness of Fit Results for Urban Northern Operational Region (No 1)
Data Estimation Data 70 Validation Data 30
Subtype Site MSE r2 R2FT MPB MAD MSPE R2
FT
Total VA 41150 0529 0557 -0760 4329 38490 0575
Total R1 4110 051 0551 -020 464 4486 054
FI VA 704 038 0406 -046 194 767 048
Urban 4-Leg Signalized
FI R1 809 039 0439 012 214 950 038
Total VA 224 031 0313 -003 090 238 029
Total R1 308 028 0286 008 095 200 032
FI VA 053 019 0193 000 043 053 019
Urban 4-Leg Minor Stop Control
FI R1 064 018 0187 003 043 048 021
Total VA 2490 038 0370 -064 352 2759 037
Total R1 3034 032 0305 -015 365 2687 037
FI VA 447 028 0259 -019 153 488 026
Urban 3-Leg Signalized
FI R1 559 025 0231 004 157 448 029
Total VA 185 025 0230 -004 089 204 024
Total R1 208 026 0239 -006 094 219 026
FI VA 043 015 0133 -002 043 048 016
Urban 3-Leg Minor Stop Control
FI R1 047 017 0156 -001 044 050 017
50
Table A-4 SPFs Goodness of Fit Results for Urban Western Operational Region (No 10)
Data Estimation Data 70 Validation Data 30
Subtype Site MSE r2 R2FT MPB MAD MSPE R2
FT
Total VA 41150 0529 0557 -0760 4329 38490 0575
Total R10 21976 0777 0735 1290 3233 17910 0686
FI VA 7043 0385 0406 -0458 1938 7671 0475
Urban 4-Leg Signalized
FI R10 4280 0526 0500 0377 1597 5170 0452
Total VA 2238 0315 0313 -0034 0897 2383 0292
Total R10 1161 0361 0300 -0032 0740 1050 0188
FI VA 0530 0194 0193 -0004 0432 0533 0194
Urban 4-Leg Minor Stop Control
FI R10 0312 0197 0187 0000 0382 0330 0009
Total VA 24900 0375 0370 -0645 3519 27591 0369
Total R10 14446 0451 0397 -0168 2801 24410 0255
FI VA 4467 0275 0259 -0185 1527 4875 0262
Urban 3-Leg Signalized
FI R10 3077 0266 0216 0039 1258 3390 0115
Total VA 1854 0254 0230 -0043 0893 2038 0239
Total R10 1391 0233 0197 -0054 0800 1640 0207
FI VA 0428 0151 0133 -0021 0431 0476 0157
Urban 3-Leg Minor Stop Control
FI R10 0354 0111 0089 -0019 0404 0380 0125
51
Table A-5 SPFs Goodness of Fit Results for Urban Eastern Operational Region (No 100)
Data Estimation Data 70 Validation Data 30
Subtype Site MSE r2 R2FT MPB MAD MSPE R2
FT
Total VA 41150 0529 0557 -0760 4329 38490 0575
Total R100 31108 0632 0630 0243 4717 37450 0005
FI VA 7043 0385 0406 -0458 1938 7671 0475
Urban 4-Leg Signalized
FI R100 5201 0480 0454 -0098 1864 5410 0244
Total VA 2238 0315 0313 -0034 0897 2383 0292
Total R100 1720 0443 0381 0087 0758 1150 0003
FI VA 0530 0194 0193 -0004 0432 0533 0194
Urban 4-Leg Minor Stop Control
FI R100 0509 0273 0254 0049 0383 0360 0173
Total VA 24900 0375 0370 -0645 3519 27591 0369
Total R100 17782 0410 0410 -1753 0908 38780 0004
FI VA 4467 0275 0259 -0185 1527 4875 0262
Urban 3-Leg Signalized
FI R100 3194 0243 0263 -0615 1645 5860 0236
Total VA 1854 0254 0230 -0043 0893 2038 0239
Total R100 1561 0233 0210 -0127 0902 2230 0002
FI VA 0428 0151 0133 -0021 0431 0476 0157
Urban 3-Leg Minor Stop Control
FI R100 0387 0131 0116 -0043 0444 0500 0141
52
Table A-6 SPFs Goodness of Fit Results for Rural Northern Operational Region (No 1)
Data Estimation Data 70
Validation Data 30
Subtype Site MSE r2 R2FT MPB MAD MSPE R2
FT
Total VA 10990 0353 0321 0513 2210 10070 -0073
Total R1 20080 0118 0092 -1389 3661 34220 0212
FI VA 2350 0196 0181 0045 1189 2600 -0034
Rural 4-Leg Signalized
FI R1 2920 0057 0052 -1173 1931 9760 0028
Total VA 1090 0182 0167 -0067 0794 1190 0171
Total R1 1990 0190 0245 0001 0942 1640 0173
FI VA 0480 0112 0098 -0022 0504 0530 0110
Rural 4-Leg Minor Stop Control
FI R1 0920 0093 0112 0020 0541 0520 0009
Total VA 5490 0328 0305 -0010 1651 5760 0179
Total R1 11110 0182 0254 -0679 2271 14750 0497
FI VA 1450 0181 0170 -0041 0902 1710 0099
Rural 3-Leg Signalized
FI R1 3230 0131 0153 -0116 1006 2120 0355
Total VA 0690 0144 0104 -0008 0613 0730 0102
Total R1 1210 0245 0196 0030 0712 0930 0126
FI VA 0250 0071 0048 -0009 0345 0260 0048
Rural 3-Leg Minor Stop Control
FI R1 0340 0124 0093 0016 0366 0300 0052
53
Table A-7 SPFs Goodness of Fit Results for Rural Western Operational Region (No 10)
Data Estimation Data 70 Validation Data 30
Subtype Site MSE r2 R2FT MPB MAD MSPE R2
FT
Total VA 10990 0353 0321 0513 2210 10070 -0073
Total R10 6020 0311 0268 0007 1748 6050 0382
FI VA 2350 0196 0181 0045 1189 2600 -0034
Rural 4-Leg Signalized
FI R10 1880 0158 0139 0097 0945 1590 0254
Total VA 1090 0182 0167 -0067 0794 1190 0171
Total R10 1300 0196 0163 0070 0760 1020 0078
FI VA 0480 0112 0098 -0022 0504 0530 0110
Rural 4-Leg Minor Stop Control
FI R10 0560 0142 0118 0025 0495 0480 0014
Total VA 5490 0328 0305 -0010 1651 5760 0179
Total R10 3690 0163 0170 -0432 0748 6740 0039
FI VA 1450 0181 0170 -0041 0902 1710 0099
Rural 3-Leg Signalized
FI R10 0890 0124 0117 -0391 0997 4030 -0066
Total VA 0690 0144 0104 -0008 0613 0730 0102
Total R10 0640 0126 0091 0025 0583 0580 0055
FI VA 0250 0071 0048 -0009 0345 0260 0048
Rural 3-Leg Minor Stop Control
FI R10 0240 0062 0041 0003 0335 0230 0028
54
Table A-8 SPFs Goodness of Fit Results for Rural Eastern Operational Region (No 100)
Data Estimation Data 70 Validation Data 30
Subtype Site MSE r2 R2FT MPB MAD MSPE R2
FT
Total VA 10990 0353 0321 0513 2210 10070 -0073
Total R100 10120 0042 0027 1207 1882 5120 -0307
FI VA 2350 0196 0181 0045 1189 2600 -0034
Rural 4-Leg Signalized
FI R100 2060 0053 0039 0119 0962 1370 -0023
Total VA 1090 0182 0167 -0067 0794 1190 0171
Total R100 0960 0170 0149 -0086 0746 1140 0209
FI VA 0480 0112 0098 -0022 0504 0530 0110
Rural 4-Leg Minor Stop Control
FI R100 0440 0106 0092 -0031 0475 0490 0121
Total VA 5490 0328 0305 -0010 1651 5760 0179
Total R100 2770 0492 0459 0601 1759 6260 0090
FI VA 1450 0181 0170 -0041 0902 1710 0099
Rural 3-Leg Signalized
FI R100 1040 0265 0255 0124 0923 1570 -0055
Total VA 0690 0144 0104 -0008 0613 0730 0102
Total R100 0640 0125 0087 -0037 0601 0690 0119
FI VA 0250 0071 0048 -0009 0345 0260 0048
Rural 3-Leg Minor Stop Control
FI R100 0250 0064 0038 -0013 0345 0270 0062
55
APPENDIX B
RECOMMENDED SAFETY PERFORMANCE FUNCTION MODELS
Table B-1 Recommended Urban SPFs Site Virginia SPF Models to Be Used for Urban Intersections
Urban 4-Leg Signalized Total Virginia generic total
Urban 4-Leg Signalized
Operational Region 1 generic total
Urban 4-Leg Signalized
Operational Region 10
use specified model developed
Urban 4-Leg Signalized
Operational Region 100 generic total
Urban 4-Leg Signalized FI Virginia generic FI
Urban 4-Leg Signalized
Operational Region 1 generic FI
Urban 4-Leg Signalized
Operational Region 10
use specified model developed
Urban 4-Leg Signalized
Operational Region 100
use specified model developed
Urban 4-Leg Minor Stop Control
Total Virginia generic total
Urban 4-Leg Minor Stop Control
Operational Region 1
use specified model developed
Urban 4-Leg Minor Stop Control
Operational Region 10
use specified model developed
Urban 4-Leg Minor Stop Control
Operational Region 100
use specified model developed
Urban 4-Leg Minor Stop Control
FI Virginia generic FI e^-76917MajADT^05001MinADT^03695
Urban 4-Leg Minor Stop Control
Operational Region 1
use specified model developed
Urban 4-Leg Minor Stop Control
Operational Region 10
use specified model developed
Urban 4-Leg Minor Stop Control
Operational Region 100
use specified model developed
56
Table B-1 Recommended Urban SPFs (Continued)
Site Virginia SPF Models to Be Used for Urban Intersections
Urban 3-Leg Signalized
Total Virginia
use generic model developed for total
crashes
Urban 3-Leg Signalized
Operational Region 1
use generic model developed for total
crashes
Urban 3-Leg Signalized
Operational Region 10
use specific regional model
developed
Urban 3-Leg Signalized
Operational Region 100
use generic model developed for total
crashes
Urban 3-Leg Signalized FI Virginia
use generic model developed for FI
crashes
Urban 3-Leg Signalized
Operational Region 1
use generic model developed for FI
crashes
Urban 3-Leg Signalized
Operational Region 10
use specific regional model
developed
Urban 3-Leg Signalized
Operational Region 100
use generic model developed for FI
crashes
Urban 3-Leg Minor Stop Control
Total Virginia
use generic model developed for total
crashes
Urban 3-Leg Minor Stop Control
Operational Region 1
use generic model developed for total
crashes
Urban 3-Leg Minor Stop Control
Operational Region 10
use specific regional model
developed
Urban 3-Leg Minor Stop Control
Operational Region 100
use generic model developed for total
crashes
Urban 3-Leg Minor Stop Control
FI Virginia use generic model developed for FI
crashes
Urban 3-Leg Minor Stop Control
Operational Region 1
use generic model developed for FI
crashes
Urban 3-Leg Minor Stop Control
Operational Region 10
use specific regional model
developed
Urban 3-Leg Minor Stop Control
Operational Region 100
use generic model developed for FI
crashes
57
Table B-2 Recommended Rural SPFs Site Virginia SPF Models to Be Used for Rural Intersections
Rural 4-Leg Signalized Total Virginia
use generic model developed for total
crashes
Rural 4-Leg Signalized
Operational Region 1
use generic model developed for total
crashes
Rural 4-Leg Signalized
Operational Region 10
use specific regional model developed
Rural 4-Leg Signalized
Operational Region 100
use specific regional model developed
Rural 4-Leg Signalized FI Virginia use generic model
developed for FI crashes
Rural 4-Leg Signalized
Operational Region 1
use generic model developed for FI crashes
Rural 4-Leg Signalized
Operational Region 10
use specific regional model developed
Rural 4-Leg Signalized
Operational Region 100
use specific regional model developed
Rural 4-Leg Minor Stop Control Total Virginia
use generic model developed for total
crashes
Rural 4-Leg Minor Stop Control
Operational Region 1
use generic model developed for total
crashes e^-549MajADT^035MinADT^039
Rural 4-Leg Minor Stop Control
Operational Region 10
use specific regional model developed
Rural 4-Leg Minor Stop Control
Operational Region 100
use generic model developed for total
crashes
Rural 4-Leg Minor Stop Control FI Virginia use generic model
developed for FI crashes
Rural 4-Leg Minor Stop Control
Operational Region 1
use generic model developed for FI crashes
Rural 4-Leg Minor Stop Control
Operational Region 10
use generic model developed for FI crashes
Rural 4-Leg Minor Stop Control
Operational Region 100
use generic model developed for FI crashes
58
Table B-2 Recommended Rural SPFs (Continued)
Site Virginia SPF Models to Be Used for Rural Intersections
Rural 3-Leg Signalized Total Virginia use generic model
developed for total crashes
Rural 3-Leg Signalized
Operational Region 1
use generic model developed for total crashes
Rural 3-Leg Signalized
Operational Region 10
use generic model developed for total crashes
Rural 3-Leg Signalized
Operational Region 100
use generic model developed for total crashes
Rural 3-Leg Signalized FI Virginia use generic model
developed for FI crashes
Rural 3-Leg Signalized
Operational Region 1
use generic model developed for FI crashes
Rural 3-Leg Signalized
Operational Region 10
use generic model developed for FI crashes
Rural 3-Leg Signalized
Operational Region 100
use generic model developed for FI crashes
Rural 3-Leg Minor Stop Control Total Virginia use generic model
developed for total crashes
Rural 3-Leg Minor Stop Control
Operational Region 1
use generic model developed for total crashes
Rural 3-Leg Minor Stop Control
Operational Region 10
use specific regional model developed
Rural 3-Leg Minor Stop Control
Operational Region 100
use generic model developed for total crashes
Rural 3-Leg Minor Stop Control FI Virginia use generic model
developed for FI crashes
Rural 3-Leg Minor Stop Control
Operational Region 1
use generic model developed for FI crashes
Rural 3-Leg Minor Stop Control
Operational Region 10
use specific regional model developed
Rural 3-Leg Minor Stop Control
Operational Region 100
use generic model developed for FI crashes

16
Procedure for Crash Rate Method The ACR for the intersection is given as
( )(1000000)( )( )(365)T
TCACRN V
= (Eq 23)
where ACR = the average crash rate for the intersection under consideration (crashes1000000
approach volume) TC = number of crashes over the study period at the intersection N = duration of study period (yr) VT = average daily total approach volume at the intersection Procedure for Critical Rate Method
The critical rate method was accomplished by first computing the traffic base (TB) of the intersection under consideration using Equation 24 The ACR for the intersection under consideration is then computed using its TB as shown in Equation 25 The intersection critical crash rate (ICCR) is then determined using Equation 26 The critical crash ratio (CCR) for the intersection is then computed as the ratio of ICR and the average crash rate (AVR) for all intersections under the same category (intersection type urbanrural etc) as that for the intersection being considered using Equation 27 TB is given as
365
1 000 000
NxVxTB = (Eq 24)
where TB = the total approach volume over the study period of N years at the intersection under consideration (veh1000000) V = average daily approach volume at the intersection under consideration ACR is obtained as
TCACRTB
= (Eq 25)
where ACR = ACR at the intersection under consideration over the study period of N years
17
TB = the total approach volume over the study period of N years at the intersection under consideration (veh1000000) The critical crash rate (ICCR) for the intersection under consideration is given as
05 AVRICCR AVR TFTB TB
= + + (Eq 26)
where AVR = ACR for intersections within the state and of the same designation (eg rural three-leg with minor stop control) as that for the intersection under consideration TF = number of standard deviations for the confidence level being used in the analysis (usually 196 for 95 confidence level) TB = the total approach volume over the study period of N years at the intersection under consideration (veh1000000) The critical crash ratio (CCR) for the intersection is then obtained as
ACRCCRICCR
= (Eq 27)
where ACR = ACR at the intersection under consideration over the study period of N years (see Eq 2) ICCR = critical crash rate for the intersection under consideration (see Eq 26)
Benefits and Implementation Expectations
The expected benefits from developing SPFs and prioritizing intersection sites were illustrated by comparing the PSIs for the prioritized sites when sites were prioritized using the EB method with those obtained when sites were prioritized using crash rates and the critical crash ratio This analysis was conducted for the combined fatal plus injury crashes SPFs An estimate of the cost savings attributable solely to the potential reduction of crashes was also computed by using crash costs given in an FHWA study (FHWA 2005)
18
RESULTS AND DISCUSSION
Literature Review
SafetyAnalyst
The SafetyAnalyst Userrsquos Manual (ITT Corporation 2008) has SPFs that are suggested for intersections that are based on Minnesota data Tables 7 and 8 show the regression coefficients (α β1 and β2) for the SPFs developed for total and combined FI crashes respectively The values for the goodness of fit parameter RFT
2 are also given Although these RFT2 are all less
than 045 with a few less than 010 it has been suggested that the SPFs used in SafetyAnalyst could provide a realistic estimate of an expected crash frequency as a function of traffic volume and roadway geometry (Pham and Ragland 2005)
Methodological and Research References
Several studies similar to this study have been conducted in Canada Colorado California Texas New York and Minnesota For example a study was conducted using data from Colorado California and Texas to examine the functional form of the SPFs for urban freeways (Kononov et al 2008) Five years of crash data were acquired from the respective departments of transportation and the highway safety information system from Colorado The study revealed that the amount of crashes increased moderately with congestion in segments on urban freeways This study however did not include intersections
A study by Lyon et al was conducted in Toronto Ontario Canada to develop SPFs for urban signalized intersections (Lyon et al 2005) Collision data were gathered for five years and included 1950 urban intersections SPFs were developed for different severity levels impact types and intersection types such as four-leg and three-leg intersections The format used to develop the SPFs is shown in Equation 28 This format is somewhat different from that of Equation 4 suggested in Safety Analyst
Collisionsyear = α (F1)β1(F2)β2 exp (β3X1 + β4X2 + ) (Eq 28) where α and βi = the coefficients estimated in the SPF calibration process F1 and F2 = the entering AADTs on the major and minor roads respectively Xi = other independent variables (such as single lane versus multilane approaches with and without left-turn lanes or right-turn lanes high and low pedestrian activities or in some cases F1 or F2 or both)
19
Table 7 SafetyAnalystrsquos SPFs for Intersections (Total Crashes) Site
subtype Code
Site subtype Description
State Regression coefficients
LogIntercept (α)
Regression coefficients
LogAADTmaj (β1)
Regression coefficients LogAADT
min (β2)
Over - dispersion Parameter
(k)
RFT2
() Number of Sites
Max AADTmaj
(vehday)
Max AADTmin
(vehday)
Rural 201 Rural 3-leg with minor-
road STOP control MN -878 071 024 107 133 1706 28500 27000
202 Rural 3-leg with all-way STOP control
MN -1237 122 027 047 41 41 25300 6803
203 Rural 3-leg with signal control
MN -657 066 02 033 26 136 36400 11500
204 Rural 4-leg with minor-road STOP control
MN -896 065 047 07 299 2114 35500 26700
205 Rural 4-leg with all-way STOP control
MN -1237 122 027 047 41 41 25300 6803
206 Rural 4-leg with signal control
MN -657 066 02 033 26 136 36400 11500
Urban 251 Urban 3-leg with minor-
road STOP control MN -535 034 028 128 59 397 68000 18900
252 Urban 3-leg with all-way STOP control
MN -1237 122 027 047 41 41 25300 6803
253 Urban 3-leg with signal control
MN -985 097 018 023 414 33 50000 25807
254 Urban 4-leg with minor-road STOP control
MN -312 027 016 086 76 333 58870 81000
255 Urban 4-leg with all-way STOP control
MN -1237 122 027 047 41 41 25300 6803
256 Urban 4-leg with signal control
MN -347 042 014 032 264 418 75000 81000
ITT Corporation 2008
20
Table 8 SafetyAnalystrsquos SPFs for Intersections (Fatal and Injury Crashes) Site
subtype Code
Site subtype Description
State Regression coefficients
LogIntercept (α)
Regression coefficients
LogAADTmaj (β1)
Regression coefficients LogAADT
min (β2)
Over - dispersion Parameter
(k)
RFT2
() No of Sites
Max AADTmaj
(vehday)
Max AADTmin
(vehday)
Rural 201 Rural 3-leg with minor-
road STOP control MN -935 071 021 123 91 1706 28500 27000
202 Rural 3-leg with all-way STOP control
MN -1002 127 -022 089 248 41 25300 6803
203 Rural 3-leg with signal control
MN -783 075 014 05 215 136 36400 11500
204 Rural 4-leg with minor-road STOP control
MN -936 066 04 0 146 2114 35500 26700
205 Rural 4-leg with all-way STOP control
MN -1002 127 -022 089 248 41 25300 6803
206 Rural 4-leg with signal control
MN -783 075 014 05 215 136 36400 11500
Urban 251 Urban 3-leg with minor-
road STOP control MN -845 049 039 123 81 397 68000 18900
252 Urban 3-leg with all-way STOP control
MN -1002 127 -022 089 248 41 25300 6803
253 Urban 3-leg with signal control
MN -1022 091 021 027 362 33 50000 25807
254 Urban 4-leg with minor-road STOP control
MN -435 029 019 099 57 333 58870 81000
255 Urban 4-leg with all-way STOP control
MN -1002 127 -022 089 248 41 25300 6803
256 Urban 4-leg with signal control
MN -511 049 016 03 295 418 75000 81000
ITT Corporation 2008
21
The study examined the impact of two left turn priority treatments which were flashing advanced green (FAG) and left turn green arrow (LTGA) on left turn collisions These treatments were implemented at 35 intersections in the city of Toronto Two types of collisions were investigated left turns with and without side impact The results indicated that there was an insignificant difference in the impact of the left turn priority treatments on both types of crashes
Lord and Persaud (2003) conducted a study that related SPFs to transportation planning models They noted that traffic safety is not usually accounted for when agencies are conducting a planning analysis to remodel build upgrade or modify their facilities Five-year intersection data from Canada were used Models were developed and statistical measures such as the over dispersion parameter were calculated and conclusions were made from the results The SPFs developed for the study were applied to two sample networks created with the help of a transportation planning software package The research showed that it is possible to make estimation for traffic safety at the planning stage of a project This will allow users to take safety into consideration when designing and possibly create alternatives to change existing designs for more comprehensive projects or development The study also indicated that there are limitations when applying the SPFs to computerized transportation networks The study concluded that although it is possible to predict or estimate crashes on digital transportation networks the accuracy of prediction relies greatly on how precise the traffic flow estimates are
Jonsson et al (2007) performed an SPF study that took into consideration the type and severity of crashes andmdashmost importantmdashthe causal factors for these crashes The study was conducted for intersections on rural four-lane highways in the state of California Four collision types were tested in the study opposite-direction same-direction intersecting-direction and single-vehicle crashes In addition a set of data from the state of New York was used with the same parameters to analyze the severity distribution of crash types The data for California included 1084 intersections on four-lane rural highways and that from New York included 675 intersections mainly stop controlled or without any control Generalized linear modeling was performed with the data after quality analysis Two model forms were estimated with the variables seen in Equations 29 and 30
(Eq 29)
(Eq 30)
where NAcc = predicted number of crashesyr at intersections AADTmajor = AADT on major road AADTminor= AADT traffic flow on minor road Βi = model parameters Xi = variables that describe the intersections (such as terrain lighting left turn number of though lanes and divided or undivided among others)
nn xxxormajorAcc exAADTxAADTN ββββββ ++++=
min4433021
nn xxxormajorAcc exAADTAADTN βββββ +++++=
min332201)(
22
The two different models are different representations of the traffic flow The first represents the AADT of major and minor roads as separate variables but in the second model they are represented as one variable by the sum of the major and minor roads AADTs Results showed that the first model performed better for the multiple-vehicle crashes and the second model fitted better for the single-vehicle crashes In addition the appropriate predictor variables differed depending on the crash type This study is also of interest as it incorporated additional parameters to those in the suggested SPFs now included in SafetyAnalyst and therefore could lead to possible future SPF research for the state of Virginia
Persaud and Nguyen (1998) conducted a study on signalized intersections in Ontario Canada They developed aggregate and disaggregate models to estimate safety performance of three- and four-leg intersections in which crash severity (injury and PDO) environmental class (semi-urban and rural) and time period (daily weekday morning peak and weekday afternoon peak) were considered in the analysis An important aspect of that study is that it supplemented the existing models used for estimating SPFs instead of replacing them because it took into consideration features that were generally not considered in the then existing developed models Two model levels were considered for the study Level 1 was based on the sum of AADTs for all approaches with separate estimates for rear-end right angle and turning movement crashes At this level the equations were adjusted for three- and four-leg intersections by crash severity for all combined impact types and also separately for the three major impact types which were angle rear-end and turning movement In addition models were further separated by time period (daily weekday morning and afternoon peak) and for four-leg intersections which were also classified by environment class such as semi-urban and rural Level 2 allowed estimates to be obtained for specific crash patterns that were defined by movements of the vehicles involved before collision and the same were estimated as a function of the flows that were relevant to each of the patterns For this level models were estimated for four-leg intersections for 12 multi-vehicle and three single-vehicle patterns that were described by the movements of involved vehicles before collision The developed models were intended to estimate the parameters P and d shown in Equations 31 and 33
The safety of the intersection was estimated using the long-term mean based on the EB approach The long term mean (m) was obtained by combining crash count (x) of an intersection in the most recent years (n) with the estimates of the expected annual number of crashes (P) as shown in Equation 31 W1 and W2 in Equations 31 through 33 represent the weights estimated from the mean and variance of the regression estimates
(Eq 31)
(Eq 32)
(Eq 33)
m =W1(x) +W2(P)
2dW
d nP=
+
1PW
d nP=
+
23
(Eq 34)
To estimate the variance of m the following formula was used
(Eq 35)
In Equations 32 through 35 P and d represent the fundamental parameters Two models were selected for SPFs For Level 1 and single-vehicle Level 2 (Eq 36) For multi-vehicle in Level 2 (Eq 37) where P = expected number of crashes of a given type α and β = regression parameters to be estimated S (Level 1) = sum of all entering flows for a given time period for Level 1 analysis S (Level 2) = sum of the daily through right or left turn flows for a given time period for Level 2 (single-vehicle) analysis S1 and S2 = AADTs for small and large flows for a specific crash pattern in Level 2 (multi-vehicle) analysis
The models in either level can be used in the EB procedure to provide estimates for intersections that need to be treated or for the evaluation of the effectiveness of safety countermeasures It should be noted that the quality of the estimates for the study was strongly related to how the parameters were selected and used in the SPFs and unlike other available road models the ones presented in this study can be separated by time period and crash pattern Persaud et al (2002) conducted a study to demonstrate the complexity involved in the calibration of crash prediction models or SPFs for urban intersections Toronto data for three- and four-leg signalized intersections were used to estimate the models for the study The performance of these models was then compared with other models from Vancouver and California The models from these places were recalibrated to fit Toronto by using the Interactive Highway Safety Design Model (IHSDM) and a calibration procedure as proposed by Harwood et al (2000) The results varied significantly and were also mixed The study noted that the calibration of models is not a simple task and due to the importance of the SPFs they must be properly calibrated Several things must be accounted for when performing this procedure in order to obtain good quality data analysis The first thing is to extract a large sample of high quality data A software or program to link all the traffic crash and road characteristics data must exist because the same is usually kept stored in different databases In addition several
2Pd
Var P=
2( )
d xVar m dnP
+=
+
P =αSβ
P =αS1β1 S2
β 2
24
years of crash data must be obtained in order to have a good amount of samples that account for variations The actual process of model calibration is complicated therefore careful attention must be paid when analyzing the same because of the importance of the outcomes of the study The authors of the study made an exploratory analysis and it revealed that the relationship between the crashes and each covariate should be described either by the power function or the gamma function for all intersection types to be analyzed Equations 38 through 40 are the selected model forms used in the study F1 = Power F2 = Gamma (Eq 38) F1 = Gamma F2 = Power (Eq 39) F1 = Power F2 = Power (Eq 40) where E (K) = expected annual number of crashes between 1990 and 1995 F1 F2 = average entering AADT of major and minor roads respectively for the period 1990 to 1995 α β1 β2 β3 β4 = coefficients to be estimated
An NB structure was used to analyze the models and the overdispersion parameter (γ) was analyzed using Equation 41
γ=
2)K(E)K(Var (Eq 41)
Variance increases as γ decreases therefore the value of γ can also be used to make a comparison for the goodness of fit of several models fitted to the same data The larger the value of γ the smaller the variance therefore a more accurate model is given The authors suggest that γ would be enough to calculate the goodness of fit index of any SPF but if one desires to know how accurate the prediction estimate is other measures should also be computed The authors suggested using R2
α as proposed by Miaou et al (1996) which is a dispersion parameter based R2 computed as shown in Equation 42
γγ
minus=αmin2 1R (Eq 42)
where γ = overdispersion parameter for calibrated model γmin = smallest possible overdispersion parameter
The authors suggested that a disaggregation by traffic volume is preferable than using
only a single calibration factor for that is what the IHSDM currently has A recommendation is made to account for safety variation in traffic conditions over time by calibrating the models every two to three years as suggested by Harwood et al (2000)
E(K) =αF1β1 F2
β 2e(β 3F2 )
E(K) =αF1β1 F2
β 2e(β 4 F1 )
E(K) =αF1β1 F2
β 2
25
The Illinois Department of Transportation and the University of Illinois Urbana-Champaign conducted a research study to develop and implement SPFs for road segments and intersections in Illinois (Tegge et al 2010) These SPFs were developed in a way suitable for easy implementation in SafetyAnalyst The crash data (number of crashes and crash severity) and roadway data (number of lanes traffic volume area type and functional class) were collected and used for development of the SPFs Seventeen peer groups were used for developing the SPFs for segments and eight for intersections The intersections peer groups were minor leg stop control all-way stop control signalized and undetermined for rural and urban segments separately The SPFs for segments were developed using NB distribution for crashes and Poisson distribution for intersections The SAS GENMOD procedure was used to develop the SPFs for a five-year analysis period from 2001 to 2005 The model form for the intersection SPFs is the same as that given in the SafetyAnalyst Userrsquos Manual The SPFs were also developed for different crash severities such as fatal crashes type A injury crashes type B injury crashes and fatal plus injury crashes The EB method was used to determine the sites with the higher PSIs Two analysis techniques were used to obtain the PSIs The first considered segments and intersections as individual elements and the second used the sliding window approach The site specific analysis treated each individual segment and intersection as a separate entity Each segment is then compared with every other segment instead of having them grouped together The sliding window approach defined a set length The window lengths were 025 mile and 1 mile for urban and rural segments respectively
The largest impact on crash frequency was found to be the AADT and was therefore the only variable modeled as a logarithm (lnAADT) By doing this the AADT accounted for most of the prediction whereas the rest of the variables refined the prediction further Other variables used included access control functional class lane width surface type area type speed limit and median type The study recommended that a multivariate analysis be conducted for such studies to show how certain variables could contribute to the crashes Other variables could include roadway lighting weather and pavement conditions and roadway geometry The study also concluded that knowledge of roadway characteristics that increase the risk of fatal or injury crashes will facilitate the setting up of safety criteria that can help engineers in the designing of safer roadways Further knowledge of driver behaviors that lead to fatal and severe injury crashes can facilitate the training of enforcement officers to identify these behaviors
The Colorado Department of Transportation (CDOT) (2009) conducted a study to develop SPFs for intersections in the state Their model form is the same as that in SafetyAnalyst The SPFs were developed for many categories based on the number of legs divided undivided rural and urban including urban four-lane divided signalized six-lane divided signalized urban three-leg signalized two-lane undivided unsignalized and urban three-leg unsignalized When a median or left-turn lane is present a roadway is considered divided The sites selected for the study reflected variability in traffic volume and geometry in order to have a diverse representation of intersections throughout the state SPFs were developed for total and for fatal plus injury crash types A five-year study period from 2000 through 2005 was used Crash and AADT data were collected for development of the SPFs CDOT used a NB error structure to develop the SPFs and the EB procedure to estimate the expected safety performance of an intersection site for different safety management purposes Overdispersion parameters were computed and used as a goodness of fit measure According to their data
26
overdispersion parameters indicated that their models provided a reasonable fit to the Colorado data
Results indicated that for signalized intersections roads with six lanes on major approaches have more collisions than those with four lanes on major approaches CDOT recommended that the SPFs should be recalibrated in the future using data from future years as crash frequencies may change over time because of a variety of issues The report also recommended that separate calibration factors should be developed for different regions and different topographies Research in Virginia
In Virginia two other similar studies have recently been published One by Garber et al (2010) for two-lane roads and another by Hamidi et al (2010) to identify high-crash sections on Virginiarsquos primary system by developing a planning-level methodology The study by Garber et al developed SPFs for two-lane segments of 1 mile or less and the study by Hamidi et al developed SPFs for longer segments of two-lane roads that can be used for corridor analysis
Evaluation of the Recommended Minnesota SPFs
Figures 3 through 6 show representative graphs that were used to visually examine how well the Virginia data fitted the suggested Minnesota SPFs Figures 3 and 4 are for urban four-leg signalized intersections and Figures 5 and 6 are for rural four-leg signalized intersections These graphs suggest that the Minnesota SPFs do not fully represent the Virginia data Tables 9 through 12 show the Freeman-Tukey R2
FT coefficients computed for the different Minnesota SPFs using the Virginia data The low Freeman-Tukey R2
FT coefficients obtained and the visual inspection of the graphs suggested that a better fit to the Virginia data could be obtained by developing specific Virginia SPFs using Virginia data It was therefore decided to develop specific SPFs for Virginia
0
2
4
6
8
10
12
14
0 20000 40000 60000 80000 100000 120000
AADT Major
Tota
l Cra
shes
Per
Yea
r
Minnesota VA Actual Observed
Minnesota Model
Figure 3 Total crashes per year vs major AADT for urban 4-leg signalized intersections
with minor AADT of 700
27
0
5
10
15
20
25
30
35
0 20000 40000 60000 80000 100000 120000
AADT Major
Tota
l Cra
shes
per
Yea
r
Minnesota VA Actual Observed
Minnesota Model
Figure 4 Total crashes per year vs major AADT for urban 4-leg signalized intersections
with minor AADT of 4500
0
2
4
6
8
10
12
14
0 20000 40000 60000 80000 100000 120000
AADT Major
Tota
l Cra
shes
Per
Yea
r
Minnesota VA Actual Observed
Minnesota Model
Figure 5 Total crashes per year vs major AADT for rural 4-leg signalized intersections with
minor AADT of 795
28
0
2
4
6
8
10
12
14
16
18
0 20000 40000 60000 80000 100000 120000
AADT Major
Tota
l Cra
shes
per
Yea
r
Minnesota VA Actual Observed
Minnesota Model
Figure 6 Total crashes per year vs major AADT for rural 4-leg signalized intersections with
minor AADT of 5000
Table 9 Minnesota SPFs for Urban FI Crashes and Corresponding R2FT Based
on Virginia Data
Intersection Type
Minnesota FI SPFs R2
FT Based on Virginia Urban FI Crash Data ()
Urban 4-Leg Signalized 032
Urban 4-Leg Minor Stop Control 008
Urban 3-Leg Signalized 026
Urban 3-LegMinor Stop Control 01
Table 10 Minnesota SPFs for Urban TOTAL crashes and Corresponding R2
FT Based on Virginia Data
Type of Intersection
Minnesota SPFs
R2FT Based on Virginia Urban Total
Crash Data ()
Urban 4-Leg Signalized 034
Urban 4-Leg Minor Stop Control 022
Urban 3-Leg Signalized 031
Urban 3-Leg Minor Stop Control 01
29
Table 11 Minnesota SPFs for Rural TOTAL Crashes and Corresponding R2FT
Based on Virginia Data
Type of Intersection
Minnesota SPFs R2
FT Based on Virginia Rural Total Crash Data ()
Rural 4-Leg Signalized 029
Rural 4-Leg Minor Stop Control 013
Rural 3-Leg Signalized 029
Rural 3-Leg Minor Stop Control -010
Table 12 Minnesota SPFs for Rural FI Crashes and Corresponding R2FT Based
on Virginia Data
Type of Intersection
Minnesota SPFs R2
FT Based on Virginia Rural FI Crash Data ()
Rural 4-Leg Signalized 018
Rural 4-Leg Minor Stop Control 010
Rural 3-Leg Signalized 018
Rural 3-Leg Minor Stop Control 001
Development and Evaluation of Specific Virginia SPFs
In keeping with the suggestion given in the Safety Analyst Userrsquos Manual the model form used to develop the intersection SPFs is given in Equation 4 as
1 2k e x MajAADT x MinAADTβ βα=
where
k = predicted crash frequency per intersection per year MajAADT = AADT on the major road (vehday) MinAADT = AADT on the minor road (vehday) α = intercept β1 = coefficient of mayor AADT β2 = coefficient of minor AADT
30
The statewide SPFs developed for Virginia are given in Tables 13 through 16 Due to lack of data the analysis for all-way stop intersections could not be undertaken These tables also give the Freeman-Tukey R2
FT coefficient for each of the Virginia SPFs and the corresponding Minnesota SPF and Freeman-Tukey R2
FT based on the Virginia data The R2FT coefficients
obtained indicate that the Virginia-specific SPFs fit the Virginia data better than the suggested Minnesota SPFs for all types of intersections and crash severity except those for FI crashes on urban three-leg signalized rural four-leg signalized and rural four-leg minor stop control intersections where the corresponding RFT
2 values are similar In Table 15 it can be seen that the Minnesota R2
FT value is negative for the rural three-leg minor stop control intersections The negative RFT
2 value is possible because these calculations were not performed on the same data points that were used to create the Minnesota SPFs (Miller 2009) Table 13 SPF Models for Urban TOTAL crashes and R2
FT results for Virginia Statewide (VDOT-maintained roads)
SPF model with TOTAL Crash values
R2FT TOTAL
Crash Data
Site Virginia Statewide Minnesota VA MN
Urban 4-Leg Signalized 056 034
Urban 4-Leg Minor Stop Control
032 022
Urban 3-Leg Signalized 037 031
Urban 3-Leg Minor Stop Control
023 010
Table 14 SPF Models for Urban FI crashes and R2
FT results for Virginia Statewide (VDOT-maintained roads)
SPF model with FI Crash values R2FT FI Crash Data ()
Site
Virginia Statewide Minnesota VA MN
Urban 4-Leg Signalized 041 032
Urban 4-Leg Minor Stop Control
019 008
Urban 3-Leg Signalized 026 026
Urban 3-Leg Minor Stop Control
013 010
31
Table 15 SPF Models for Rural TOTAL Crashes and R2FT Results for Virginia Statewide (VDOT-
maintained roads) SPF model with TOTAL Crash values R2
FT TOTAL Crash Data
Site
Virginia Statewide Minnesota VA MN
Rural 4-Leg Signalized 0321 0290
Rural 4-Leg Minor Stop Control
0167 0132
Rural 3-Leg Signalized 0305 0291
Rural 3-Leg Minor Stop Control
0104 -0102
Table 16 SPF Models for Rural FI crashes and R2
FT results for Virginia Statewide (VDOT-maintained roads) SPF model with FI Crash values R2
FT TOTAL Crash Data
Site
Virginia Statewide Minnesota VA MN
Rural 4-Leg Signalized 0181 0181
Rural 4-Leg Minor Stop Control
0098 0097
Rural 3-Leg Signalized 0170 0180
Rural 3-Leg Minor Stop Control
0048 0012
Figures 7 through 10 show visual representations of how well the Virginia SPFs fit the
Virginia data in comparison with the suggested Minnesota SPFs In general the Virginia SPFs tend to fit the Virginia data better than the Minnesota SPFs although both sets of SPFs tend to have similar fits at low volumes (AADTmajor lt 2000) except for the SPF for total crashes on urban four-leg signalized intersections shown in Figure 7 The primary reason the Minnesota SPFs do not fit the Virginia data as well as the Virginia SPFs may be the dissimilarities of the roadside environment and the characteristics of the different databases
32
0
2
4
6
8
10
12
14
0 20000 40000 60000 80000 100000 120000
AADT Major
Tota
l Cra
shes
Per
Yea
r
Minnesota VA Actual Observed Virginia
Minnesota Model
Virginia M odel
Figure 7 Total crashes per year vs major AADT for urban 4-leg signalized intersections
with minor AADT of 700
0
5
10
15
20
25
30
35
0 20000 40000 60000 80000 100000 120000
AADT Major
Tota
l Cra
shes
per
Yea
r
Minnesota VA Actual Observed Virginia
Minnesota Model
Virginia Model
Figure 8 Total crashes per year vs major AADT for urban 4-leg signalized intersections
with minor AADT of 8000
33
0
2
4
6
8
10
12
14
0 20000 40000 60000 80000 100000 120000
AADT Major
Tota
l Cra
shes
Per
Yea
r
Minnesota VA Actual Observed Virginia
Virginia Model
Minnesota Model
Figure 9 Total crashes per year vs major AADT for rural 4-leg signalized intersections with
minor AADT of 79
0
5
10
15
20
25
0 20000 40000 60000 80000 100000 120000
AADT Major
Tota
l Cra
shes
per
Yea
r
Minnesota VA Actual Observed Virginia
Minnesota Model
Virginia Model
Figure 10 Total crashes per year vs minor AADT for rural 4-leg signalized intersections with major AADT of 5000
As discussed in the Methodology section in addition to the statewide Virginia SPFs
specific SPFs were developed for each operational region to consider the different topographical characteristics that exist across Virginia The complete set of SPFs together with the associated p values for the regression coefficients are shown in Tables A-1 and A-2 of Appendix A All p values are less than 005 with most being less than 00001 except for some of the rural four-leg signalized intersections regional specific SPFs These p values indicate that the estimated coefficients are statistically significant at the 95 confidence level or better A possible reason
34
for higher p values for a small number of SPFs may be the sample size used for developing these SPFs
To test the transferability and fit of the Virginia statewide specific SPFs several
statistical parameters were determined for the 70 (estimation) data set and the 30 (validation) data set separately The corresponding values for each of these parameters were then compared The results are shown in Tables 17 and 18 for urban and rural intersections respectively The results for the regional SPFs are shown in Tables A-3 through A-8 of Appendix A The results indicate that the developed models are transferable to the 30 validation data set For example the MSE values for the 70 estimation data are similar to the MSPE values for the 30 validation data In addition the mean prediction bias MPB values for the 30 validation data are close to zero (-076 le MPB ge -0004) in Table 17 and (-0067 le MPB ge 00513) in Table 18
Table 17 Goodness of Fit Results for Urban Statewide SPFs
Data Estimation data 70 Validation Data 30 Subtype Site MSE r2 R2
FT MPB MAD MSPE R2FT
Total VA 41150 0529 0557 -0760 4329 38490 0575
Total MN
68636 0506 0336 -3145 5421 68156 0315
FI VA
7043 0385 0406 -0458 1938 7671 0475
Urban 4-Leg Signalized
FI MN 7702 0372 0324 -0316 2124 8981 0376
Total VA 2238 0315 0313 -0034 0897 2383 0292
Total MN 2510 0287 0215 0091 0982 2730 0182
FI VA 0530 0194 0193 -0004 0432 0533 0194
Urban 4-Leg Minor Stop Control
FI MN 0560 0182 0080 0128 0522 0577 0052
Total VA 24900 0375 0370 -0645 3519 27591 0369
Total MN 29322 0365 0308 -2238 3661 33079 0272
FI VA 4467 0275 0259 -0185 1527 4875 0262
Urban 3-Leg Signalized
FI MN 4528 0267 0261 -0294 1526 4937 0261
Total VA 1854 0254 0230 -0043 0893 2038 0239
Total MN 2388 0237 0104 -0541 0902 2600 0107
FI VA 0428 0151 0133 -0021 0431 0476 0157
Urban 3-Leg Minor Stop Control
FI MN 0478 0140 0097 -0184 0385 0537 0104
35
Table 18 Goodness of Fit Results for Rural Statewide SPFs
Data Estimation Data 70
Validation Data 30
Subtype Site MSE r2 R2FT MPB MAD MSPE R2
FT
Total VA 10990 0353 0321 0513 2210 10070 -0073
Total MN 12400 0339 0290 -0154 2071 8460 0035
FI VA 2350 0196 0181 0045 1189 2600 -0034
Rural 4-Leg Signalized
FI MN 2400 0188 0181 -0043 1164 2420 0004
Total VA 1090 0182 0167 -0067 0794 1190 0171
Total MN 1190 0167 0132 -0348 0774 1320 0115
FI VA 0480 0112 0098 -0022 0504 0530 0110
Rural 4-Leg Minor Stop Control
FI MN 0500 0104 0097 -0158 0459 0560 0093
Total VA 5490 0328 0305 -0010 1651 5760 0179
Total MN NA NA NA NA NA NA NA
FI VA 1450 0181 0170 -0041 0902 1710 0099
Rural 3-Leg Signalized
FI MN NA NA NA NA NA NA NA
Total VA 0690 0144 0104 -0008 0613 0730 0102
Total MN 0890 0141 -0102 -0404 0555 0940 -0104
FI VA 0250 0071 0048 -0009 0345 0260 0048
Rural 3-Leg Minor Stop Control
FI MN 0270 0068 0012 -0144 0270 0290 0003
Pruning of Virginia-Specific SPFs A total of 64 SPFs were initially developed using the appropriate data for Virginia as shown in Tables A-1 and A-2 of Appendix A Considering that not all regional models might be necessary the pruning process described in the methodology section was carried out to prune the number of SPFs to the minimum effective number as seen in Tables 19 and 20 for urban and rural intersections respectively The pruning process resulted in 19 SPFs for urban sites and 15 for rural sites To facilitate the use of the correct SPF for a specific type of intersection located in a specific region the lists of the appropriate SPFs to be used are given in Tables B-1 and B-2 of Appendix B for the urban and rural intersections respectively
As can be seen in Tables 19 and 20 and Tables A-1 and A-2 of Appendix A there are some trends worth discussing for the benefit of the study and possible future research With regards to the three different operational regions the Western region retained many more of the specific regional urban SPFs than any other region For example the Western regional SPFs were retained for all urban intersection sites whereas for the Eastern region the only SPFs
36
retained were those for urban four-leg signalized FI crashes and urban four-leg minor stop control for total and FI crashes Similarly the only urban SPF retained for the Northern region was that for urban four-leg minor stop control for total crashes For the rural intersection sites all of the Western regional SPFs were retained except those for rural three-leg signalized total and FI crashes and rural four-leg minor stop control FI crashes The majority of the Eastern region rural SPFs were discarded except those for rural four-leg signalized total and FI crashes while for the Northern region all regional SPFs were discarded
The Western region retained more specific regional SPFs than the other two regions This suggests that the intersections in the Western region exhibit more unique characteristics than those for the other regions This may be due to the more mountainous terrain in the Western region compared to those in the Eastern and Northern regions This supports the philosophy of developing specific SPFs based on the topography of different regions
Site Prioritization
To illustrate the benefits of using the EB method to prioritize intersection sites for safety
improvements the top 25 urban sites from the Bristol and Northern Virginia districts were identified by using crash rates critical crash ratio and the EB method The PSI for each site identified was then determined The results obtained are shown in Tables 21 and 22 for the Bristol and the Northern Virginia districts respectively The results indicate that for the Northern Virginia District the PSIs for the top 25 sites are 258 1317 and 27440 crashes per year and for the Bristol District 432 646 and 1496 crashes per year for the crash rates critical crash ratio and EB methods respectively The important thing in Tables 21 and 22 is the sum of the PSI columns ranked by the three methods The sum of each of the PSIs for the crash rate and critical crash ratio method is lower than that for the EB method These results suggest that the use of the EB method in the planning process will identify intersection sites with the highest PSIs and therefore where detailed assessments to determine feasible and effective safety treatments should be undertaken
37
Table 19 MSPE Values for Virginia Urban Statewide and Urban Regional SPFs Used for Pruning
Data Pruning
Subtype
Site
MSPE [MSPEVA-
MSPEOR]1 [abs(MSPEVA-
MSPEOR)]2 [abs(MSPEVA-
MSPEOR)MSPEVA]3
RetainDiscardTotal VA 3849 Northern 4486 -637 637 0165497532 Discard Western 1791 2058 2058 0534684334 Retain Eastern 3745 104 104 0027020005 Discard FI VA 7671 Northern 95 -1829 1829 0238430452 Discard Western 517 2501 2501 0326033112 Retain
Urban 4-Leg Signalized
Eastern 541 2261 2261 0294746448 Retain Total VA 23834 Northern 202 03634 03634 015247126 Retain Western 105 13334 13334 0559452882 Retain Eastern 115 12334 12334 0517496014 Retain FI VA 05327 Northern 048 00527 00527 0098929979 Discard Western 033 02027 02027 0380514361 Retain
Urban 4-Leg Minor Stop Control
Eastern 036 01727 01727 0324197485 Retain Total VA 275911 Northern 2687 07211 07211 0026135239 Discard Western 2441 31811 31811 0115294425 Retain Eastern 3878 -111889 111889 0405525695 Discard FI VA 48754 Northern 448 03954 03954 0081101038 Discard Western 339 14854 14854 0304672437 Retain
Urban 3-Leg Signalized
Eastern 586 -09846 09846 020195266 Discard Total VA 20379 Northern 219 -01521 01521 0074635654 Discard Western 164 03979 03979 0195250012 Retain Eastern 223 -01921 01921 0094263703 Discard FI VA 04756 Northern 05 -00244 00244 0051303616 Discard Western 038 00956 00956 0201009251 Retain
Urban 3-Leg Minor Stop Control
Eastern 05 -00244 00244 0051303616 Discard 1 Difference between mean square prediction error (MSPE) of Virginia statewide model and OR model 2 Absolute value of the difference between Virginia statewide model MSPE and operational region model MSPE 3 Absolute value of the difference between Virginia statewide model MSPE and operational region model MSPE divided by the Virginia statewide MSPE for comparison
Retained SPFs Discarded if value is negative Discarded if less than 01
38
Table 20 MSPE Values for Virginia Rural Statewide and Rural Regional SPFs Used for Pruning Data Pruning
Subtype
Site
MSPE
[MSPEVA-MSPEOR]1
[abs(MSPEVA-MSPEOR)]2
[abs(MSPEVA-MSPEOR)MSPEVA]3
RetainDiscard
Total VA 1007 Northern 3422 -2415 2415 2398212512 Discard Western 605 402 402 0399205561 Retain Eastern 512 495 495 0491559086 Retain FI VA 26 Northern 976 -716 716 2753846154 Discard Western 159 101 101 0388461538 Retain
Rural 4-Leg Signalized
Eastern 137 123 123 0473076923 Retain Total VA 119 Northern 164 -045 045 0378151261 Discard Western 102 017 017 0142857143 Retain Eastern 114 005 005 0042016807 Discard FI VA 053 Northern 052 001 001 0018867925 Discard Western 048 005 005 0094339623 Discard
Rural 4-Leg Minor Stop Control
Eastern 049 004 004 0075471698 Discard Total VA 576 Northern 1475 -899 899 1560763889 Discard Western 674 -098 098 0170138889 Discard Eastern 626 -05 05 0086805556 Discard FI VA 171 Northern 212 -041 041 0239766082 Discard Western 403 -232 232 1356725146 Discard
Rural 3-Leg Signalized
Eastern 157 014 014 0081871345 Discard Total VA 073 Northern 093 -02 02 0273972603 Discard Western 053 02 02 0273972603 Retain Eastern 069 004 004 0054794521 Discard FI VA 026 Northern 03 -004 004 0153846154 Discard Western 023 003 003 0115384615 Retain
Rural 3-Leg Minor Stop Control
Eastern 027 -001 001 0038461538 Discard 1 Difference between mean square prediction error (MSPE) of Virginia statewide model and OR model 2 Absolute value of the difference between Virginia statewide model MSPE and operational region model MSPE 3 Absolute value of the difference between Virginia statewide model MSPE and operational region model MSPE divided by the Virginia statewide MSPE for comparison
Retained SPFs Discarded if value is negative Discarded if less than 01
39
Table 21 PSIs for Top 25 Sites in District 1 Urban (Bristol) FI
Crashes Ranking Based on Crash
Rates Ranking Based on Crash Ratio Ranking Based on EB
Method
Rank Intersection Node
Crash Rate1 PSI2 Intersection
Node Crash Ratio3 PSI Intersection
Node PSI
1 596726 22112 00000 651193 39672 00000 596095 21413
2 606469 20079 00000 606238 39298 06297 596393 08787
3 706818 12504 00000 651075 31264 00000 651130 08453
4 651193 11550 00000 596726 29227 00000 596701 07112 5 651075 09369 00000 606469 28039 00000 651802 06929 6 606238 08382 06297 651233 25831 03612 636331 06726 7 651807 07089 00000 651130 22718 08453 596395 06579 8 651233 06068 03612 706818 22555 00000 596937 06415 9 651230 05990 00000 651230 20301 00000 606238 06297
10 651783 05756 00000 651210 18882 04747 661033 06061 11 636093 04960 00000 636331 17913 06726 596372 05417 12 651274 04475 00000 651807 16847 00000 636372 04808 13 651130 04179 08453 651805 15814 00000 651210 04747 14 651210 03918 04747 651223 15627 03589 636491 04649 15 636331 03393 06726 651783 15009 00000 596420 04633 16 651223 03363 03589 596095 14865 21413 596403 04579 17 606232 03331 00000 636405 14769 00000 651603 04531 18 651127 03053 00000 661033 14555 06061 636056 04351 19 651999 03048 00000 596353 14215 03717 712033 04110 20 596449 02962 00000 636093 13782 00000 704691 04102 21 636405 02811 00000 651879 13192 00000 651838 04100 22 651883 02698 00000 651274 12975 00000 651894 03878 23 596353 02686 03717 651127 12972 00000 596353 03717 24 651805 02663 00000 651999 12959 00000 651233 03612 25 661033 02500 06061 596449 12702 00000 651889 03601
sum 43202 sum 64615 sum 149606 1Number of crashes per year per 1000000 total approach volume 2Potential for safety improvement (crashes yr) the difference between the EB-adjusted long-term crashes and the SPF-estimated crashes 3Ratio of actual crash rate to critical crash rate
40
Table 22 PSIs for Top 25 Sites in District 9 Urban (Northern Virginia District) FI
Crashes Ranking Based on Crash
Rates Ranking Based on Crash Ratio Ranking Based on EB
Method
Rank Intersection Node
Crash Rate1 PSI2 Intersection
Node Crash Ratio3 PSI Intersection
Node PSI
1 718192 191841 00000 718192 257523 00000 264119 150122 2 702946 178194 00000 547722 152371 11175 263375 140091 3 271531 64846 00000 263628 102794 00000 278648 137239 4 263628 52858 00000 263728 100092 00000 276819 131395 5 263728 42215 00000 719754 95274 09444 263290 130743 6 266955 35294 00000 702946 79268 00000 722678 127897 7 547722 34932 11175 263403 77252 05184 264725 118671 8 702612 30441 00000 704237 77175 07648 267028 116627 9 273886 29539 00000 263729 74681 00000 265204 115925
10 716747 27632 00000 271531 72327 00000 274766 115679 11 263626 27139 00000 263135 66458 18068 263249 113372 12 269485 26567 00000 716747 64461 00000 547044 110769 13 728954 26344 00000 266955 56657 00000 549349 107180 14 263729 25208 00000 546138 52003 31028 268210 105630 15 546988 21922 00000 547544 51924 32529 263347 104257 16 274338 21446 00000 263626 50389 00000 276351 102313 17 429308 21354 00000 269485 49897 00000 428167 100064 18 720401 21197 00000 728954 49702 00000 264344 98789 19 267295 20954 00000 548686 49572 03621 277764 91554 20 267536 20874 00000 711601 47985 04440 263467 89259 21 265938 20484 00000 266970 47730 00000 263090 89199 22 273354 20108 00000 546462 46856 03620 703414 88610 23 268345 19362 00000 265938 46726 00000 428629 87379 24 719754 19073 09444 720401 44833 00000 272219 85659 25 263403 19015 05184 728496 43666 04990 428544 85610
Sum 25803 sum 131747 sum 2744033 1Number of crashes per year per 1000000 total approach volume 2Potential for safety improvement (crashes yr) the difference between the EB-adjusted long-term crashes and the SPF-estimated crashes 3Ratio of actual crash rate to critical crash rate
41
CONCLUSIONS
bull The development of SPFs for intersections is necessary for Virginia because the SafetyAnalyst-suggested SPFs which are based on Minnesota data do not represent the Virginia data well Regarding the fit of the SPFs to Virginia data the R2
FT values shown in Tables 13 through 16 for Minnesota and Virginia indicate that the Virginia-specific SPFs fit the Virginia data better than the Minnesota models This may be due to the dissimilarities of the roadside environment such as difference in topography and the characteristics of the different Virginia and Minnesota databases
bull In some cases the specific regional SPFs fit the regional data better than the statewide
SPFs suggesting that the specific SPFs should be considered for use when available These group divisions that have similar roadway characteristics and driver expectations in some cases tend to improve the fit
bull In identifying intersection sites for safety improvements it is clearly beneficial for the EB
method to be used with the suitable SPFs rather than a crash rate or critical ratio method Results of the site prioritization show a much higher potential for crash reduction when the EB method is used with the appropriate SPFs rather than a procedure based on crash rates or critical rates
RECOMMENDATIONS
1 VDOTrsquos TED should use the Virginia-specific SPFs when using the SafetyAnalyst tools The results of this study have shown that the Virginia-specific SPFs reflected the Virginia data better than the SafetyAnalyst-recommended Minnesota SPFs
2 VDOTrsquos TED should investigate the feasibility of using multiple SPFs in SafetyAnalyst If
feasible regional SPFs should be used If it is not currently feasible to use multiple SPFs VDOTrsquos TED should ask that the FHWA include regional information in SafetyAnalyst so as to allow the use of regional SPFs For the specific regional SPFs to be applied to Virginia and other states the SafetyAnalyst tool should be capable of incorporating the necessary data that support the regional models
3 As soon as it is feasible to use regional SPFs VDOTrsquos TED should use the 19 SPFs
developed for urban intersections and the 15 developed for rural intersections when using the tools in SafetyAnalyst Although the statewide SPFs are available for use by an analyst the specific regional models included in the final set of SPFs will predict crashes better than the statewide SPFs The regional analysis will not only ease the use of specific regional SPFs but will also be of benefit when predicting the potential for safety improvement of a specific site
4 For future similar SPF studies VDOTrsquos TED should be directly involved in screening the
traffic data for accuracy and consistency as was done in this study The direct involvement of the TED in the screening of the traffic data significantly contributed to the accuracy of the
42
data and greatly contributed to the confidence the researchers place on the data used in the study
5 The Virginia Transportation Research Council (VTRC) should conduct a study as soon as
feasible to verify whether incorporating independent variables for which data are available other than AADT such as intersection geometry and other characteristics will result in SPFs that better fit the Virginia data Although the currently suggested SafetyAnalyst SPFs use only the AADTs as the independent variables it is likely that provision will be made for use of SPFs that incorporate other independent variables such as number of approaches entering lanes and the other variables for which data are available as these SPFs are likely to give better fit to crash data
6 As soon as feasible VTRC should undertake a study to develop SPFs for the urban system
intersections which are not currently maintained by VDOT as these intersections may have different crash characteristics than those maintained by VDOT This would facilitate the use of SafetyAnalyst in programming sites that are currently not being maintained by VDOT
BENEFITS AND IMPLEMENTATION PROSPECTS
Significant benefits will be accrued by the use of the Virginia-specific SPFs developed in this study This is clearly illustrated in two ways First in examining the transferability of the suggested SPFs in SafetyAnalyst it is clear that these SPFs do not fit the Virginia data very well The results also indicate that the Virginia-specific SPFs fit the Virginia data much better than the suggested SafetyAnalyst SPFs Second the availability of the Virginia-specific SPFs will enhance the use of the EB procedure given in SafetyAnalyst for prioritizing sites for safety improvements This study has also shown that the EB method better identifies sites with higher potential for crash reduction than those identified by crash rates For example the illustrated examples given for the Bristol and Northern Virginia districts show that the potential reduction in FI crashes when the top 25 sites are identified by the EB method is 28936 (1496 + 27440) crashes per year whereas that obtained when the critical crash ratio method is used for prioritization is only 1963 (646 + 1317) and that obtained with the crash rate method is only 690 (432 + 258) crashes per year This gives a net benefit of 26973 potential crashes per year compared to the critical crash ratio method and 28246 compared to the crash rate method Assuming an average cost of FI crashes of $95629 (FHWA 2005) and only 10 of the estimated net benefit PSI of 28246 crashes per year is achieved the total savings of more than $27 million per year could be accrued The prospects for implementation of the recommendations are very high as the study was requested by VDOTrsquos TED which is planning to incorporate these SPFs in the use of the tools provided in SafetyAnalyst
43
ACKNOWLEDGMENTS
The authors appreciate the opportunity afforded them by VDOT and VTRC to conduct this study Special thanks to Stephen Read (VDOT) Dr In-Kyu Lim (VDOT) Dr Young-Jun Kweon (VTRC) and VDOTrsquos Central Office for their interest and support in SPFs and their help in the selection of intersection sites Many thanks to Lewis Woodson (VTRC) and James Hill (University of Virginia) for all their help and input throughout the study
REFERENCES Cogburn P VDOT Interagency Coordination 2007 Virginia Emergency Management
Conference Virginia Department of Transportation Richmond April 2007 Colorado Department of Transportation DTD Applied Research and Innovation Branch Safety
Performance Functions for Intersections CDOT-2009-10 Denver December 2009 Fridstroslashm L Ifver J Ingebrigtsen S Kulmala R and Thomsen LK Measuring the
Contribution of Randomness Exposure Weather and Daylight to the Variation in Road Accidents Counts Accident Analysis and Prevention Vol 27 No 1 1995 pp 1-20
Federal Highway Administration Cost of Crashes by Severity Table FHWA-HRT-05-051
Washington DC 2005 Federal Highway Administration SafetyAnalyst Home Page httpwwwsafetyanalystorg
Accessed February 2010 Garber N and Hoel L Traffic amp Highway Engineering 4th ed Cenage Learning Toronto
Canada 2009 Garber NJ Haas PR and Gosse C Development of Safety Performance Functions for Two-
Lane Roads Maintained by the Virginia Department of Transportation VTRC 10-R25 Virginia Transportation Research Council Charlottesville 2010
Hamidi A Fontaine MD and Demetsky MJ A Planning-Level Methodology for Identifying
High-Crash Sections of Virginiarsquos Primary System VTRC 11-R4 Virginia Transportation Research Council Charlottesville 2010
Harwood D Council FM Hauer E Hughes WE and Vogt A Prediction of the Expected
Safety Performance of Rural Two-lane Highways Federal Highway Administration McLean VA December 2000
Harwood DW Bauer KM Richard KR Gilmore DK Persaud B and Lyon C
Development of SPFs for Safety Analyst Interim Tools Technical Memorandum
44
Prepared by Midwest Research Institute for the Federal Highway Administration McLean VA 2004
ITT Corporation SafetyAnalyst Userrsquos Manual Turner-Fairbank Highway Research Center
McLean VA 2008 Jonsson T Ivan J and Zhang C Crash Prediction Models for Intersections on Rural
Multilane Highways Differences by Collision Type In Transportation Research Record Journal of the Transportation Research Board No 2019 Transportation Research Board of the National Academies Washington DC 2007 pp 91-98
Kweon Y-J and Lim I-K Appropriate Regression Model Types for the Empirical Bayes
Method and SafetyAnalyst In Proceedings of the 89th Annual Meeting of the Transportation Research Board Transportation Research Board of the National Academies Washington DC 2010
Kononov J Bailey B and Allery B Exploratory Examination of the Functional Form of
Safety Performance Functions of Urban Freeways Colorado Department of Transportation and San Diego State University Denver CO 2008
Lyon C Haq A Persaud B and Kodama S Safety Performance Functions for Signalized
Intersections in Large Urban Areas Development and Application to Evaluation of Left-Turn Priority Treatment In Transportation Research Record Journal of the Transportation Research Board No 1908 Transportation Research Board of the National Academies Washington DC 2005 pp 165-171
Lord D and Persaud B Estimating the Safety Performance of Urban Road Transportation
Networks Center for Transportation Safety Texas Transportation Institute Texas AampM University and Department of Civil Engineering Ryerson University College Station TX 2003 pp 609-620
Miaou S-P Lu A and Lum H S Pitfalls of using R2 to Evaluate Goodness of Fit of
Accident Prediction Models In Transportation Research Record Journal of the Transportation Research Board No 1542 Transportation Research Board of the National Academies Washington DC 2005 1996 pp 6-13
Miller P Re Negative R squared Email Archive Division of Biostatistics Washington
University in St Louis February 2 2005 February 2 2005 httpwwwbiostatwustleduarchiveshtmljmp-l2005msg00075html Accessed February 2010
Persaud B Lord D and Palmisano J Calibration and Transferability of Accident Prediction
Models for Urban Intersections In Transportation Research Record Journal of the Transportation Research Board No 1784 Transportation Research Board of the National Academies Washington DC 2002 pp 57-64
45
Persaud B and Nguyen T Disaggregate Safety Performance Models for Signalized Intersections on Ontario Provincial Roads In Transportation Research Record Journal of the Transportation Research Board No 1635 Transportation Research Board of the National Academies Washington DC 1998 pp 113-120
Pham T and Ragland D Summary of Crash Prediction Models Also known as Safety
Performance Functions (SPFs) California Partners for Advanced Traffic and Highways and University of California Berkeley Berkeley 2005
SAS Institute Inc SAS OnlineDoc Version Eight Cary NC
httpwwwtecnionacildocssasril Accessed 2009 Tegge RA Jo J-H and Ouyang Y Development and Application of Safety Performance
Functions for Illinois ICT-10-066 Illinois Center for Transportation University of Illinois Urbana-Champaign March 2010
Virginiarsquos Surface Transportation Safety Executive Committee Commonwealth of Virginiarsquos
Strategic Highway Safety Plan 2006-2010 Virginia Department of Transportation Richmond 2006
Washington S Persaud B Lyon C and Oh J Validation of Accident Models for
Intersections FHWA-RD-03-037 Federal Highway Administration McLean VA 2005
46
47
APPENDIX A
STATISTICAL PARAMETERS AND GOODNESS-OF-FIT RESULTS
Table A-1 Statistical Parameters for Urban Intersections SPFs Parameter Estimates
Data Intercept
Coefficient of Mayor AADT
Coefficient of Minor AADT
Subtype Site Intercept (α)
StndError
P value
lnMajor (β1)
StndError
P value
lnMinor (β2)
StndError
P value
Total VA -76234 048 lt0001 06742 005 lt0001 03453 003 lt0001
OR1 -83067 056 lt0001 07522 005 lt0001 0328 003 lt0001OR10 -123913 122 lt0001 10631 013 lt0001 04567 006 lt0001OR 100 -88553 077 lt0001 07825 007 lt0001 03706 004 lt0001FI VA -85256 057 lt0001 06477 006 lt0001 03579 004 lt0001OR1 -96546 063 lt0001 07603 006 lt0001 03597 004 lt0001OR10 -114284 15 lt0001 08662 016 lt0001 04412
Urban 4-Leg Signalized
OR 100 -99582 100 lt0001 07484 009 lt0001 04017 005 lt0001Total VA -60723 022 lt0001 04558 002 lt0001 0347 004 lt0001
OR1 -6059 044 lt0001 0505 004 lt0001 02773 006 lt0001OR10 -67031 057 lt0001 03986 007 lt0001 04999 009 lt0001OR 100 -65388 032 lt0001 04689 004 lt0001 043 006 lt0001FI VA -76917 032 lt0001 05001 003 lt0001 03695 005 lt0001OR1 -81437 060 lt0001 05813 005 lt0001 03188 008 lt0001OR10 -80333 063 lt0001 03446 007 lt0001 06218 010 lt0001
Urban 4-Leg Minor Stop Control
OR 100 -83166 051 lt0001 05253 006 lt0001 04695 008 lt0001Total VA -6543 082 lt0001 06591 008 lt0001 02119 002 lt0001
OR1 -4999 103 lt0001 05555 009 lt0001 01554 003 lt0001OR10 -96143 127 lt0001 08677 012 lt0001 03297 005 lt0001OR 100 -67518 110 lt0001 06157 011 lt0001 02969 005 lt0001FI VA -84268 068 lt0001 07147 006 lt0001 02481 002 lt0001OR1 -73982 099 lt0001 06496 009 lt0001 02088 003 lt0001OR10 -110104 155 lt0001 0908 015 lt0001 03226 006 lt0001
Urban 3-Leg Signalized
OR 100 -7266 107 lt0001 05508 011 lt0001 03107 006 lt0001Total VA -54696 013 lt0001 04874 002 lt0001 01985 001 lt0001
OR1 -5361 018 lt0001 04959 002 lt0001 01676 002 lt0001OR10 -5773 034 lt0001 04877 003 lt0001 02314 004 lt0001OR 100 -51642 021 lt0001 04338 003 lt0001 02309 003 lt0001FI VA -74642 018 lt0001 05791 002 lt0001 02091 002 lt0001OR1 -76877 027 lt0001 06204 003 lt0001 0181 002 lt0001OR10 -69458 047 lt0001 05096 004 lt0001 02212 005 lt0001
Urban 3-Leg Minor Stop Control
OR 100 -69883 031 lt0001 05169 004 lt0001 02308 003 lt0001 Standard Error
48
Table A-2 Statistical Parameters for Rural Intersections SPFs Parameter Estimates
Data Intercept
Coefficient of Mayor AADT
Coefficient of Minor AADT
Subtype Site Intercept (α)
StndError
P value
lnMajor (β1)
Stnd Error
P value
lnMinor (β2)
Stnd Error
P value
Total VA -69589 118 lt0001 06746 009 lt0001 0253 009 00047
OR1 -1604 237 04974 02284 021 02791 01514 012 0211 OR10 -63951 183 00005 05508 014 00001 03106 014 00224 OR 100 -06468 220 07692 02262 016 01635 -00158 017 09274 FI VA -87116 128 lt0001 07839 011 lt0001 02166 009 0013 OR1 -33285 246 01767 03601 024 0126 00597 013 06478 OR10 -80583 175 lt0001 06809 018 00001 02557 013 0057
Rural 4-Leg Signalized
OR 100 -48381 221 00287 04243 018 00193 01523 018 03943 Total VA -5494 020 lt0001 03533 002 lt0001 03935 003 lt0001
OR1 -62351 058 lt0001 04167 006 lt0001 04507 008 lt0001OR10 -53594 028 lt0001 03379 003 lt0001 03998 004 lt0001OR 100 -51255 027 lt0001 02914 003 lt0001 04075 004 lt0001FI VA -66927 030 lt0001 03899 003 lt0001 04156 004 lt0001OR1 -82561 095 lt0001 05221 009 lt0001 04962 012 lt0001OR10 -70797 044 lt0001 03789 004 lt0001 0497 005 lt0001
Rural 4-Leg Minor Stop Control
OR 100 -63326 038 lt0001 03223 004 lt0001 04424 005 lt0001Total VA -75754 084 lt0001 06465 008 lt0001 03332 008 lt0001
OR1 -58798 220 00075 05076 020 00143 0313 013 00161 OR10 -64368 110 lt0001 0544 011 lt0001 02863 006 lt0001OR 100 -9899 139 lt0001 08047 015 lt0001 04386 006 lt0001FI VA -87112 103 lt0001 07224 010 lt0001 02578 006 lt0001OR1 -9219 260 00004 07258 022 00011 03407 016 00326 OR10 -88607 146 lt0001 07059 016 lt0001 02809 008 00009
Rural 3-Leg Signalized
OR 100 -111835 185 lt0001 08669 018 lt0001 03977 008 lt0001Total VA -43293 008 lt0001 03366 001 lt0001 02087 001 lt0001
OR1 -50904 022 lt0001 0406 002 lt0001 02752 003 lt0001OR10 -40969 009 lt0001 03133 001 lt0001 02001 001 lt0001OR 100 -4231 016 lt0001 02997 002 lt0001 02308 003 lt0001FI VA -53415 011 lt0001 03394 001 lt0001 02237 001 lt0001OR1 -64457 031 lt0001 04195 003 lt0001 0307 004 lt0001OR10 -50831 014 lt0001 03245 002 lt0001 02014 002 lt0001
Rural 3-Leg Minor Stop Control
OR 100 -51046 024 lt0001 03163 003 lt0001 02112 003 lt0001
Standard Error
49
Table A-3 SPFs Goodness of Fit Results for Urban Northern Operational Region (No 1)
Data Estimation Data 70 Validation Data 30
Subtype Site MSE r2 R2FT MPB MAD MSPE R2
FT
Total VA 41150 0529 0557 -0760 4329 38490 0575
Total R1 4110 051 0551 -020 464 4486 054
FI VA 704 038 0406 -046 194 767 048
Urban 4-Leg Signalized
FI R1 809 039 0439 012 214 950 038
Total VA 224 031 0313 -003 090 238 029
Total R1 308 028 0286 008 095 200 032
FI VA 053 019 0193 000 043 053 019
Urban 4-Leg Minor Stop Control
FI R1 064 018 0187 003 043 048 021
Total VA 2490 038 0370 -064 352 2759 037
Total R1 3034 032 0305 -015 365 2687 037
FI VA 447 028 0259 -019 153 488 026
Urban 3-Leg Signalized
FI R1 559 025 0231 004 157 448 029
Total VA 185 025 0230 -004 089 204 024
Total R1 208 026 0239 -006 094 219 026
FI VA 043 015 0133 -002 043 048 016
Urban 3-Leg Minor Stop Control
FI R1 047 017 0156 -001 044 050 017
50
Table A-4 SPFs Goodness of Fit Results for Urban Western Operational Region (No 10)
Data Estimation Data 70 Validation Data 30
Subtype Site MSE r2 R2FT MPB MAD MSPE R2
FT
Total VA 41150 0529 0557 -0760 4329 38490 0575
Total R10 21976 0777 0735 1290 3233 17910 0686
FI VA 7043 0385 0406 -0458 1938 7671 0475
Urban 4-Leg Signalized
FI R10 4280 0526 0500 0377 1597 5170 0452
Total VA 2238 0315 0313 -0034 0897 2383 0292
Total R10 1161 0361 0300 -0032 0740 1050 0188
FI VA 0530 0194 0193 -0004 0432 0533 0194
Urban 4-Leg Minor Stop Control
FI R10 0312 0197 0187 0000 0382 0330 0009
Total VA 24900 0375 0370 -0645 3519 27591 0369
Total R10 14446 0451 0397 -0168 2801 24410 0255
FI VA 4467 0275 0259 -0185 1527 4875 0262
Urban 3-Leg Signalized
FI R10 3077 0266 0216 0039 1258 3390 0115
Total VA 1854 0254 0230 -0043 0893 2038 0239
Total R10 1391 0233 0197 -0054 0800 1640 0207
FI VA 0428 0151 0133 -0021 0431 0476 0157
Urban 3-Leg Minor Stop Control
FI R10 0354 0111 0089 -0019 0404 0380 0125
51
Table A-5 SPFs Goodness of Fit Results for Urban Eastern Operational Region (No 100)
Data Estimation Data 70 Validation Data 30
Subtype Site MSE r2 R2FT MPB MAD MSPE R2
FT
Total VA 41150 0529 0557 -0760 4329 38490 0575
Total R100 31108 0632 0630 0243 4717 37450 0005
FI VA 7043 0385 0406 -0458 1938 7671 0475
Urban 4-Leg Signalized
FI R100 5201 0480 0454 -0098 1864 5410 0244
Total VA 2238 0315 0313 -0034 0897 2383 0292
Total R100 1720 0443 0381 0087 0758 1150 0003
FI VA 0530 0194 0193 -0004 0432 0533 0194
Urban 4-Leg Minor Stop Control
FI R100 0509 0273 0254 0049 0383 0360 0173
Total VA 24900 0375 0370 -0645 3519 27591 0369
Total R100 17782 0410 0410 -1753 0908 38780 0004
FI VA 4467 0275 0259 -0185 1527 4875 0262
Urban 3-Leg Signalized
FI R100 3194 0243 0263 -0615 1645 5860 0236
Total VA 1854 0254 0230 -0043 0893 2038 0239
Total R100 1561 0233 0210 -0127 0902 2230 0002
FI VA 0428 0151 0133 -0021 0431 0476 0157
Urban 3-Leg Minor Stop Control
FI R100 0387 0131 0116 -0043 0444 0500 0141
52
Table A-6 SPFs Goodness of Fit Results for Rural Northern Operational Region (No 1)
Data Estimation Data 70
Validation Data 30
Subtype Site MSE r2 R2FT MPB MAD MSPE R2
FT
Total VA 10990 0353 0321 0513 2210 10070 -0073
Total R1 20080 0118 0092 -1389 3661 34220 0212
FI VA 2350 0196 0181 0045 1189 2600 -0034
Rural 4-Leg Signalized
FI R1 2920 0057 0052 -1173 1931 9760 0028
Total VA 1090 0182 0167 -0067 0794 1190 0171
Total R1 1990 0190 0245 0001 0942 1640 0173
FI VA 0480 0112 0098 -0022 0504 0530 0110
Rural 4-Leg Minor Stop Control
FI R1 0920 0093 0112 0020 0541 0520 0009
Total VA 5490 0328 0305 -0010 1651 5760 0179
Total R1 11110 0182 0254 -0679 2271 14750 0497
FI VA 1450 0181 0170 -0041 0902 1710 0099
Rural 3-Leg Signalized
FI R1 3230 0131 0153 -0116 1006 2120 0355
Total VA 0690 0144 0104 -0008 0613 0730 0102
Total R1 1210 0245 0196 0030 0712 0930 0126
FI VA 0250 0071 0048 -0009 0345 0260 0048
Rural 3-Leg Minor Stop Control
FI R1 0340 0124 0093 0016 0366 0300 0052
53
Table A-7 SPFs Goodness of Fit Results for Rural Western Operational Region (No 10)
Data Estimation Data 70 Validation Data 30
Subtype Site MSE r2 R2FT MPB MAD MSPE R2
FT
Total VA 10990 0353 0321 0513 2210 10070 -0073
Total R10 6020 0311 0268 0007 1748 6050 0382
FI VA 2350 0196 0181 0045 1189 2600 -0034
Rural 4-Leg Signalized
FI R10 1880 0158 0139 0097 0945 1590 0254
Total VA 1090 0182 0167 -0067 0794 1190 0171
Total R10 1300 0196 0163 0070 0760 1020 0078
FI VA 0480 0112 0098 -0022 0504 0530 0110
Rural 4-Leg Minor Stop Control
FI R10 0560 0142 0118 0025 0495 0480 0014
Total VA 5490 0328 0305 -0010 1651 5760 0179
Total R10 3690 0163 0170 -0432 0748 6740 0039
FI VA 1450 0181 0170 -0041 0902 1710 0099
Rural 3-Leg Signalized
FI R10 0890 0124 0117 -0391 0997 4030 -0066
Total VA 0690 0144 0104 -0008 0613 0730 0102
Total R10 0640 0126 0091 0025 0583 0580 0055
FI VA 0250 0071 0048 -0009 0345 0260 0048
Rural 3-Leg Minor Stop Control
FI R10 0240 0062 0041 0003 0335 0230 0028
54
Table A-8 SPFs Goodness of Fit Results for Rural Eastern Operational Region (No 100)
Data Estimation Data 70 Validation Data 30
Subtype Site MSE r2 R2FT MPB MAD MSPE R2
FT
Total VA 10990 0353 0321 0513 2210 10070 -0073
Total R100 10120 0042 0027 1207 1882 5120 -0307
FI VA 2350 0196 0181 0045 1189 2600 -0034
Rural 4-Leg Signalized
FI R100 2060 0053 0039 0119 0962 1370 -0023
Total VA 1090 0182 0167 -0067 0794 1190 0171
Total R100 0960 0170 0149 -0086 0746 1140 0209
FI VA 0480 0112 0098 -0022 0504 0530 0110
Rural 4-Leg Minor Stop Control
FI R100 0440 0106 0092 -0031 0475 0490 0121
Total VA 5490 0328 0305 -0010 1651 5760 0179
Total R100 2770 0492 0459 0601 1759 6260 0090
FI VA 1450 0181 0170 -0041 0902 1710 0099
Rural 3-Leg Signalized
FI R100 1040 0265 0255 0124 0923 1570 -0055
Total VA 0690 0144 0104 -0008 0613 0730 0102
Total R100 0640 0125 0087 -0037 0601 0690 0119
FI VA 0250 0071 0048 -0009 0345 0260 0048
Rural 3-Leg Minor Stop Control
FI R100 0250 0064 0038 -0013 0345 0270 0062
55
APPENDIX B
RECOMMENDED SAFETY PERFORMANCE FUNCTION MODELS
Table B-1 Recommended Urban SPFs Site Virginia SPF Models to Be Used for Urban Intersections
Urban 4-Leg Signalized Total Virginia generic total
Urban 4-Leg Signalized
Operational Region 1 generic total
Urban 4-Leg Signalized
Operational Region 10
use specified model developed
Urban 4-Leg Signalized
Operational Region 100 generic total
Urban 4-Leg Signalized FI Virginia generic FI
Urban 4-Leg Signalized
Operational Region 1 generic FI
Urban 4-Leg Signalized
Operational Region 10
use specified model developed
Urban 4-Leg Signalized
Operational Region 100
use specified model developed
Urban 4-Leg Minor Stop Control
Total Virginia generic total
Urban 4-Leg Minor Stop Control
Operational Region 1
use specified model developed
Urban 4-Leg Minor Stop Control
Operational Region 10
use specified model developed
Urban 4-Leg Minor Stop Control
Operational Region 100
use specified model developed
Urban 4-Leg Minor Stop Control
FI Virginia generic FI e^-76917MajADT^05001MinADT^03695
Urban 4-Leg Minor Stop Control
Operational Region 1
use specified model developed
Urban 4-Leg Minor Stop Control
Operational Region 10
use specified model developed
Urban 4-Leg Minor Stop Control
Operational Region 100
use specified model developed
56
Table B-1 Recommended Urban SPFs (Continued)
Site Virginia SPF Models to Be Used for Urban Intersections
Urban 3-Leg Signalized
Total Virginia
use generic model developed for total
crashes
Urban 3-Leg Signalized
Operational Region 1
use generic model developed for total
crashes
Urban 3-Leg Signalized
Operational Region 10
use specific regional model
developed
Urban 3-Leg Signalized
Operational Region 100
use generic model developed for total
crashes
Urban 3-Leg Signalized FI Virginia
use generic model developed for FI
crashes
Urban 3-Leg Signalized
Operational Region 1
use generic model developed for FI
crashes
Urban 3-Leg Signalized
Operational Region 10
use specific regional model
developed
Urban 3-Leg Signalized
Operational Region 100
use generic model developed for FI
crashes
Urban 3-Leg Minor Stop Control
Total Virginia
use generic model developed for total
crashes
Urban 3-Leg Minor Stop Control
Operational Region 1
use generic model developed for total
crashes
Urban 3-Leg Minor Stop Control
Operational Region 10
use specific regional model
developed
Urban 3-Leg Minor Stop Control
Operational Region 100
use generic model developed for total
crashes
Urban 3-Leg Minor Stop Control
FI Virginia use generic model developed for FI
crashes
Urban 3-Leg Minor Stop Control
Operational Region 1
use generic model developed for FI
crashes
Urban 3-Leg Minor Stop Control
Operational Region 10
use specific regional model
developed
Urban 3-Leg Minor Stop Control
Operational Region 100
use generic model developed for FI
crashes
57
Table B-2 Recommended Rural SPFs Site Virginia SPF Models to Be Used for Rural Intersections
Rural 4-Leg Signalized Total Virginia
use generic model developed for total
crashes
Rural 4-Leg Signalized
Operational Region 1
use generic model developed for total
crashes
Rural 4-Leg Signalized
Operational Region 10
use specific regional model developed
Rural 4-Leg Signalized
Operational Region 100
use specific regional model developed
Rural 4-Leg Signalized FI Virginia use generic model
developed for FI crashes
Rural 4-Leg Signalized
Operational Region 1
use generic model developed for FI crashes
Rural 4-Leg Signalized
Operational Region 10
use specific regional model developed
Rural 4-Leg Signalized
Operational Region 100
use specific regional model developed
Rural 4-Leg Minor Stop Control Total Virginia
use generic model developed for total
crashes
Rural 4-Leg Minor Stop Control
Operational Region 1
use generic model developed for total
crashes e^-549MajADT^035MinADT^039
Rural 4-Leg Minor Stop Control
Operational Region 10
use specific regional model developed
Rural 4-Leg Minor Stop Control
Operational Region 100
use generic model developed for total
crashes
Rural 4-Leg Minor Stop Control FI Virginia use generic model
developed for FI crashes
Rural 4-Leg Minor Stop Control
Operational Region 1
use generic model developed for FI crashes
Rural 4-Leg Minor Stop Control
Operational Region 10
use generic model developed for FI crashes
Rural 4-Leg Minor Stop Control
Operational Region 100
use generic model developed for FI crashes
58
Table B-2 Recommended Rural SPFs (Continued)
Site Virginia SPF Models to Be Used for Rural Intersections
Rural 3-Leg Signalized Total Virginia use generic model
developed for total crashes
Rural 3-Leg Signalized
Operational Region 1
use generic model developed for total crashes
Rural 3-Leg Signalized
Operational Region 10
use generic model developed for total crashes
Rural 3-Leg Signalized
Operational Region 100
use generic model developed for total crashes
Rural 3-Leg Signalized FI Virginia use generic model
developed for FI crashes
Rural 3-Leg Signalized
Operational Region 1
use generic model developed for FI crashes
Rural 3-Leg Signalized
Operational Region 10
use generic model developed for FI crashes
Rural 3-Leg Signalized
Operational Region 100
use generic model developed for FI crashes
Rural 3-Leg Minor Stop Control Total Virginia use generic model
developed for total crashes
Rural 3-Leg Minor Stop Control
Operational Region 1
use generic model developed for total crashes
Rural 3-Leg Minor Stop Control
Operational Region 10
use specific regional model developed
Rural 3-Leg Minor Stop Control
Operational Region 100
use generic model developed for total crashes
Rural 3-Leg Minor Stop Control FI Virginia use generic model
developed for FI crashes
Rural 3-Leg Minor Stop Control
Operational Region 1
use generic model developed for FI crashes
Rural 3-Leg Minor Stop Control
Operational Region 10
use specific regional model developed
Rural 3-Leg Minor Stop Control
Operational Region 100
use generic model developed for FI crashes
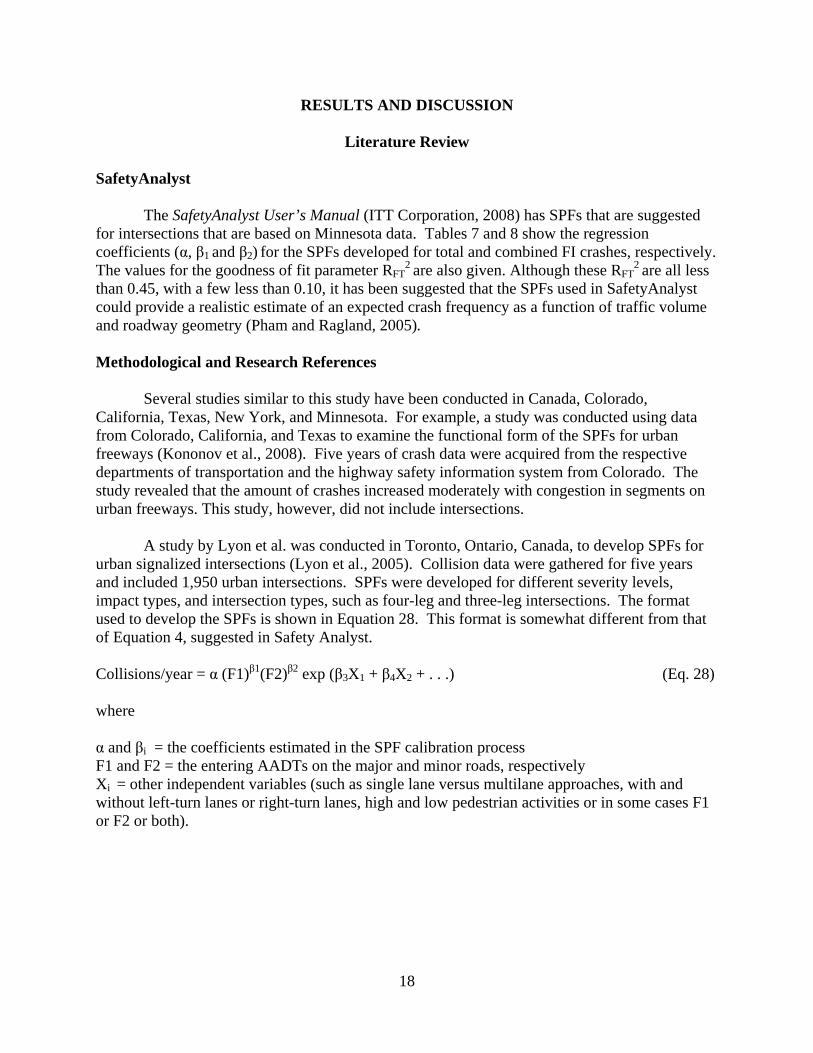
18
RESULTS AND DISCUSSION
Literature Review
SafetyAnalyst
The SafetyAnalyst Userrsquos Manual (ITT Corporation 2008) has SPFs that are suggested for intersections that are based on Minnesota data Tables 7 and 8 show the regression coefficients (α β1 and β2) for the SPFs developed for total and combined FI crashes respectively The values for the goodness of fit parameter RFT
2 are also given Although these RFT2 are all less
than 045 with a few less than 010 it has been suggested that the SPFs used in SafetyAnalyst could provide a realistic estimate of an expected crash frequency as a function of traffic volume and roadway geometry (Pham and Ragland 2005)
Methodological and Research References
Several studies similar to this study have been conducted in Canada Colorado California Texas New York and Minnesota For example a study was conducted using data from Colorado California and Texas to examine the functional form of the SPFs for urban freeways (Kononov et al 2008) Five years of crash data were acquired from the respective departments of transportation and the highway safety information system from Colorado The study revealed that the amount of crashes increased moderately with congestion in segments on urban freeways This study however did not include intersections
A study by Lyon et al was conducted in Toronto Ontario Canada to develop SPFs for urban signalized intersections (Lyon et al 2005) Collision data were gathered for five years and included 1950 urban intersections SPFs were developed for different severity levels impact types and intersection types such as four-leg and three-leg intersections The format used to develop the SPFs is shown in Equation 28 This format is somewhat different from that of Equation 4 suggested in Safety Analyst
Collisionsyear = α (F1)β1(F2)β2 exp (β3X1 + β4X2 + ) (Eq 28) where α and βi = the coefficients estimated in the SPF calibration process F1 and F2 = the entering AADTs on the major and minor roads respectively Xi = other independent variables (such as single lane versus multilane approaches with and without left-turn lanes or right-turn lanes high and low pedestrian activities or in some cases F1 or F2 or both)
19
Table 7 SafetyAnalystrsquos SPFs for Intersections (Total Crashes) Site
subtype Code
Site subtype Description
State Regression coefficients
LogIntercept (α)
Regression coefficients
LogAADTmaj (β1)
Regression coefficients LogAADT
min (β2)
Over - dispersion Parameter
(k)
RFT2
() Number of Sites
Max AADTmaj
(vehday)
Max AADTmin
(vehday)
Rural 201 Rural 3-leg with minor-
road STOP control MN -878 071 024 107 133 1706 28500 27000
202 Rural 3-leg with all-way STOP control
MN -1237 122 027 047 41 41 25300 6803
203 Rural 3-leg with signal control
MN -657 066 02 033 26 136 36400 11500
204 Rural 4-leg with minor-road STOP control
MN -896 065 047 07 299 2114 35500 26700
205 Rural 4-leg with all-way STOP control
MN -1237 122 027 047 41 41 25300 6803
206 Rural 4-leg with signal control
MN -657 066 02 033 26 136 36400 11500
Urban 251 Urban 3-leg with minor-
road STOP control MN -535 034 028 128 59 397 68000 18900
252 Urban 3-leg with all-way STOP control
MN -1237 122 027 047 41 41 25300 6803
253 Urban 3-leg with signal control
MN -985 097 018 023 414 33 50000 25807
254 Urban 4-leg with minor-road STOP control
MN -312 027 016 086 76 333 58870 81000
255 Urban 4-leg with all-way STOP control
MN -1237 122 027 047 41 41 25300 6803
256 Urban 4-leg with signal control
MN -347 042 014 032 264 418 75000 81000
ITT Corporation 2008
20
Table 8 SafetyAnalystrsquos SPFs for Intersections (Fatal and Injury Crashes) Site
subtype Code
Site subtype Description
State Regression coefficients
LogIntercept (α)
Regression coefficients
LogAADTmaj (β1)
Regression coefficients LogAADT
min (β2)
Over - dispersion Parameter
(k)
RFT2
() No of Sites
Max AADTmaj
(vehday)
Max AADTmin
(vehday)
Rural 201 Rural 3-leg with minor-
road STOP control MN -935 071 021 123 91 1706 28500 27000
202 Rural 3-leg with all-way STOP control
MN -1002 127 -022 089 248 41 25300 6803
203 Rural 3-leg with signal control
MN -783 075 014 05 215 136 36400 11500
204 Rural 4-leg with minor-road STOP control
MN -936 066 04 0 146 2114 35500 26700
205 Rural 4-leg with all-way STOP control
MN -1002 127 -022 089 248 41 25300 6803
206 Rural 4-leg with signal control
MN -783 075 014 05 215 136 36400 11500
Urban 251 Urban 3-leg with minor-
road STOP control MN -845 049 039 123 81 397 68000 18900
252 Urban 3-leg with all-way STOP control
MN -1002 127 -022 089 248 41 25300 6803
253 Urban 3-leg with signal control
MN -1022 091 021 027 362 33 50000 25807
254 Urban 4-leg with minor-road STOP control
MN -435 029 019 099 57 333 58870 81000
255 Urban 4-leg with all-way STOP control
MN -1002 127 -022 089 248 41 25300 6803
256 Urban 4-leg with signal control
MN -511 049 016 03 295 418 75000 81000
ITT Corporation 2008
21
The study examined the impact of two left turn priority treatments which were flashing advanced green (FAG) and left turn green arrow (LTGA) on left turn collisions These treatments were implemented at 35 intersections in the city of Toronto Two types of collisions were investigated left turns with and without side impact The results indicated that there was an insignificant difference in the impact of the left turn priority treatments on both types of crashes
Lord and Persaud (2003) conducted a study that related SPFs to transportation planning models They noted that traffic safety is not usually accounted for when agencies are conducting a planning analysis to remodel build upgrade or modify their facilities Five-year intersection data from Canada were used Models were developed and statistical measures such as the over dispersion parameter were calculated and conclusions were made from the results The SPFs developed for the study were applied to two sample networks created with the help of a transportation planning software package The research showed that it is possible to make estimation for traffic safety at the planning stage of a project This will allow users to take safety into consideration when designing and possibly create alternatives to change existing designs for more comprehensive projects or development The study also indicated that there are limitations when applying the SPFs to computerized transportation networks The study concluded that although it is possible to predict or estimate crashes on digital transportation networks the accuracy of prediction relies greatly on how precise the traffic flow estimates are
Jonsson et al (2007) performed an SPF study that took into consideration the type and severity of crashes andmdashmost importantmdashthe causal factors for these crashes The study was conducted for intersections on rural four-lane highways in the state of California Four collision types were tested in the study opposite-direction same-direction intersecting-direction and single-vehicle crashes In addition a set of data from the state of New York was used with the same parameters to analyze the severity distribution of crash types The data for California included 1084 intersections on four-lane rural highways and that from New York included 675 intersections mainly stop controlled or without any control Generalized linear modeling was performed with the data after quality analysis Two model forms were estimated with the variables seen in Equations 29 and 30
(Eq 29)
(Eq 30)
where NAcc = predicted number of crashesyr at intersections AADTmajor = AADT on major road AADTminor= AADT traffic flow on minor road Βi = model parameters Xi = variables that describe the intersections (such as terrain lighting left turn number of though lanes and divided or undivided among others)
nn xxxormajorAcc exAADTxAADTN ββββββ ++++=
min4433021
nn xxxormajorAcc exAADTAADTN βββββ +++++=
min332201)(
22
The two different models are different representations of the traffic flow The first represents the AADT of major and minor roads as separate variables but in the second model they are represented as one variable by the sum of the major and minor roads AADTs Results showed that the first model performed better for the multiple-vehicle crashes and the second model fitted better for the single-vehicle crashes In addition the appropriate predictor variables differed depending on the crash type This study is also of interest as it incorporated additional parameters to those in the suggested SPFs now included in SafetyAnalyst and therefore could lead to possible future SPF research for the state of Virginia
Persaud and Nguyen (1998) conducted a study on signalized intersections in Ontario Canada They developed aggregate and disaggregate models to estimate safety performance of three- and four-leg intersections in which crash severity (injury and PDO) environmental class (semi-urban and rural) and time period (daily weekday morning peak and weekday afternoon peak) were considered in the analysis An important aspect of that study is that it supplemented the existing models used for estimating SPFs instead of replacing them because it took into consideration features that were generally not considered in the then existing developed models Two model levels were considered for the study Level 1 was based on the sum of AADTs for all approaches with separate estimates for rear-end right angle and turning movement crashes At this level the equations were adjusted for three- and four-leg intersections by crash severity for all combined impact types and also separately for the three major impact types which were angle rear-end and turning movement In addition models were further separated by time period (daily weekday morning and afternoon peak) and for four-leg intersections which were also classified by environment class such as semi-urban and rural Level 2 allowed estimates to be obtained for specific crash patterns that were defined by movements of the vehicles involved before collision and the same were estimated as a function of the flows that were relevant to each of the patterns For this level models were estimated for four-leg intersections for 12 multi-vehicle and three single-vehicle patterns that were described by the movements of involved vehicles before collision The developed models were intended to estimate the parameters P and d shown in Equations 31 and 33
The safety of the intersection was estimated using the long-term mean based on the EB approach The long term mean (m) was obtained by combining crash count (x) of an intersection in the most recent years (n) with the estimates of the expected annual number of crashes (P) as shown in Equation 31 W1 and W2 in Equations 31 through 33 represent the weights estimated from the mean and variance of the regression estimates
(Eq 31)
(Eq 32)
(Eq 33)
m =W1(x) +W2(P)
2dW
d nP=
+
1PW
d nP=
+
23
(Eq 34)
To estimate the variance of m the following formula was used
(Eq 35)
In Equations 32 through 35 P and d represent the fundamental parameters Two models were selected for SPFs For Level 1 and single-vehicle Level 2 (Eq 36) For multi-vehicle in Level 2 (Eq 37) where P = expected number of crashes of a given type α and β = regression parameters to be estimated S (Level 1) = sum of all entering flows for a given time period for Level 1 analysis S (Level 2) = sum of the daily through right or left turn flows for a given time period for Level 2 (single-vehicle) analysis S1 and S2 = AADTs for small and large flows for a specific crash pattern in Level 2 (multi-vehicle) analysis
The models in either level can be used in the EB procedure to provide estimates for intersections that need to be treated or for the evaluation of the effectiveness of safety countermeasures It should be noted that the quality of the estimates for the study was strongly related to how the parameters were selected and used in the SPFs and unlike other available road models the ones presented in this study can be separated by time period and crash pattern Persaud et al (2002) conducted a study to demonstrate the complexity involved in the calibration of crash prediction models or SPFs for urban intersections Toronto data for three- and four-leg signalized intersections were used to estimate the models for the study The performance of these models was then compared with other models from Vancouver and California The models from these places were recalibrated to fit Toronto by using the Interactive Highway Safety Design Model (IHSDM) and a calibration procedure as proposed by Harwood et al (2000) The results varied significantly and were also mixed The study noted that the calibration of models is not a simple task and due to the importance of the SPFs they must be properly calibrated Several things must be accounted for when performing this procedure in order to obtain good quality data analysis The first thing is to extract a large sample of high quality data A software or program to link all the traffic crash and road characteristics data must exist because the same is usually kept stored in different databases In addition several
2Pd
Var P=
2( )
d xVar m dnP
+=
+
P =αSβ
P =αS1β1 S2
β 2
24
years of crash data must be obtained in order to have a good amount of samples that account for variations The actual process of model calibration is complicated therefore careful attention must be paid when analyzing the same because of the importance of the outcomes of the study The authors of the study made an exploratory analysis and it revealed that the relationship between the crashes and each covariate should be described either by the power function or the gamma function for all intersection types to be analyzed Equations 38 through 40 are the selected model forms used in the study F1 = Power F2 = Gamma (Eq 38) F1 = Gamma F2 = Power (Eq 39) F1 = Power F2 = Power (Eq 40) where E (K) = expected annual number of crashes between 1990 and 1995 F1 F2 = average entering AADT of major and minor roads respectively for the period 1990 to 1995 α β1 β2 β3 β4 = coefficients to be estimated
An NB structure was used to analyze the models and the overdispersion parameter (γ) was analyzed using Equation 41
γ=
2)K(E)K(Var (Eq 41)
Variance increases as γ decreases therefore the value of γ can also be used to make a comparison for the goodness of fit of several models fitted to the same data The larger the value of γ the smaller the variance therefore a more accurate model is given The authors suggest that γ would be enough to calculate the goodness of fit index of any SPF but if one desires to know how accurate the prediction estimate is other measures should also be computed The authors suggested using R2
α as proposed by Miaou et al (1996) which is a dispersion parameter based R2 computed as shown in Equation 42
γγ
minus=αmin2 1R (Eq 42)
where γ = overdispersion parameter for calibrated model γmin = smallest possible overdispersion parameter
The authors suggested that a disaggregation by traffic volume is preferable than using
only a single calibration factor for that is what the IHSDM currently has A recommendation is made to account for safety variation in traffic conditions over time by calibrating the models every two to three years as suggested by Harwood et al (2000)
E(K) =αF1β1 F2
β 2e(β 3F2 )
E(K) =αF1β1 F2
β 2e(β 4 F1 )
E(K) =αF1β1 F2
β 2
25
The Illinois Department of Transportation and the University of Illinois Urbana-Champaign conducted a research study to develop and implement SPFs for road segments and intersections in Illinois (Tegge et al 2010) These SPFs were developed in a way suitable for easy implementation in SafetyAnalyst The crash data (number of crashes and crash severity) and roadway data (number of lanes traffic volume area type and functional class) were collected and used for development of the SPFs Seventeen peer groups were used for developing the SPFs for segments and eight for intersections The intersections peer groups were minor leg stop control all-way stop control signalized and undetermined for rural and urban segments separately The SPFs for segments were developed using NB distribution for crashes and Poisson distribution for intersections The SAS GENMOD procedure was used to develop the SPFs for a five-year analysis period from 2001 to 2005 The model form for the intersection SPFs is the same as that given in the SafetyAnalyst Userrsquos Manual The SPFs were also developed for different crash severities such as fatal crashes type A injury crashes type B injury crashes and fatal plus injury crashes The EB method was used to determine the sites with the higher PSIs Two analysis techniques were used to obtain the PSIs The first considered segments and intersections as individual elements and the second used the sliding window approach The site specific analysis treated each individual segment and intersection as a separate entity Each segment is then compared with every other segment instead of having them grouped together The sliding window approach defined a set length The window lengths were 025 mile and 1 mile for urban and rural segments respectively
The largest impact on crash frequency was found to be the AADT and was therefore the only variable modeled as a logarithm (lnAADT) By doing this the AADT accounted for most of the prediction whereas the rest of the variables refined the prediction further Other variables used included access control functional class lane width surface type area type speed limit and median type The study recommended that a multivariate analysis be conducted for such studies to show how certain variables could contribute to the crashes Other variables could include roadway lighting weather and pavement conditions and roadway geometry The study also concluded that knowledge of roadway characteristics that increase the risk of fatal or injury crashes will facilitate the setting up of safety criteria that can help engineers in the designing of safer roadways Further knowledge of driver behaviors that lead to fatal and severe injury crashes can facilitate the training of enforcement officers to identify these behaviors
The Colorado Department of Transportation (CDOT) (2009) conducted a study to develop SPFs for intersections in the state Their model form is the same as that in SafetyAnalyst The SPFs were developed for many categories based on the number of legs divided undivided rural and urban including urban four-lane divided signalized six-lane divided signalized urban three-leg signalized two-lane undivided unsignalized and urban three-leg unsignalized When a median or left-turn lane is present a roadway is considered divided The sites selected for the study reflected variability in traffic volume and geometry in order to have a diverse representation of intersections throughout the state SPFs were developed for total and for fatal plus injury crash types A five-year study period from 2000 through 2005 was used Crash and AADT data were collected for development of the SPFs CDOT used a NB error structure to develop the SPFs and the EB procedure to estimate the expected safety performance of an intersection site for different safety management purposes Overdispersion parameters were computed and used as a goodness of fit measure According to their data
26
overdispersion parameters indicated that their models provided a reasonable fit to the Colorado data
Results indicated that for signalized intersections roads with six lanes on major approaches have more collisions than those with four lanes on major approaches CDOT recommended that the SPFs should be recalibrated in the future using data from future years as crash frequencies may change over time because of a variety of issues The report also recommended that separate calibration factors should be developed for different regions and different topographies Research in Virginia
In Virginia two other similar studies have recently been published One by Garber et al (2010) for two-lane roads and another by Hamidi et al (2010) to identify high-crash sections on Virginiarsquos primary system by developing a planning-level methodology The study by Garber et al developed SPFs for two-lane segments of 1 mile or less and the study by Hamidi et al developed SPFs for longer segments of two-lane roads that can be used for corridor analysis
Evaluation of the Recommended Minnesota SPFs
Figures 3 through 6 show representative graphs that were used to visually examine how well the Virginia data fitted the suggested Minnesota SPFs Figures 3 and 4 are for urban four-leg signalized intersections and Figures 5 and 6 are for rural four-leg signalized intersections These graphs suggest that the Minnesota SPFs do not fully represent the Virginia data Tables 9 through 12 show the Freeman-Tukey R2
FT coefficients computed for the different Minnesota SPFs using the Virginia data The low Freeman-Tukey R2
FT coefficients obtained and the visual inspection of the graphs suggested that a better fit to the Virginia data could be obtained by developing specific Virginia SPFs using Virginia data It was therefore decided to develop specific SPFs for Virginia
0
2
4
6
8
10
12
14
0 20000 40000 60000 80000 100000 120000
AADT Major
Tota
l Cra
shes
Per
Yea
r
Minnesota VA Actual Observed
Minnesota Model
Figure 3 Total crashes per year vs major AADT for urban 4-leg signalized intersections
with minor AADT of 700
27
0
5
10
15
20
25
30
35
0 20000 40000 60000 80000 100000 120000
AADT Major
Tota
l Cra
shes
per
Yea
r
Minnesota VA Actual Observed
Minnesota Model
Figure 4 Total crashes per year vs major AADT for urban 4-leg signalized intersections
with minor AADT of 4500
0
2
4
6
8
10
12
14
0 20000 40000 60000 80000 100000 120000
AADT Major
Tota
l Cra
shes
Per
Yea
r
Minnesota VA Actual Observed
Minnesota Model
Figure 5 Total crashes per year vs major AADT for rural 4-leg signalized intersections with
minor AADT of 795
28
0
2
4
6
8
10
12
14
16
18
0 20000 40000 60000 80000 100000 120000
AADT Major
Tota
l Cra
shes
per
Yea
r
Minnesota VA Actual Observed
Minnesota Model
Figure 6 Total crashes per year vs major AADT for rural 4-leg signalized intersections with
minor AADT of 5000
Table 9 Minnesota SPFs for Urban FI Crashes and Corresponding R2FT Based
on Virginia Data
Intersection Type
Minnesota FI SPFs R2
FT Based on Virginia Urban FI Crash Data ()
Urban 4-Leg Signalized 032
Urban 4-Leg Minor Stop Control 008
Urban 3-Leg Signalized 026
Urban 3-LegMinor Stop Control 01
Table 10 Minnesota SPFs for Urban TOTAL crashes and Corresponding R2
FT Based on Virginia Data
Type of Intersection
Minnesota SPFs
R2FT Based on Virginia Urban Total
Crash Data ()
Urban 4-Leg Signalized 034
Urban 4-Leg Minor Stop Control 022
Urban 3-Leg Signalized 031
Urban 3-Leg Minor Stop Control 01
29
Table 11 Minnesota SPFs for Rural TOTAL Crashes and Corresponding R2FT
Based on Virginia Data
Type of Intersection
Minnesota SPFs R2
FT Based on Virginia Rural Total Crash Data ()
Rural 4-Leg Signalized 029
Rural 4-Leg Minor Stop Control 013
Rural 3-Leg Signalized 029
Rural 3-Leg Minor Stop Control -010
Table 12 Minnesota SPFs for Rural FI Crashes and Corresponding R2FT Based
on Virginia Data
Type of Intersection
Minnesota SPFs R2
FT Based on Virginia Rural FI Crash Data ()
Rural 4-Leg Signalized 018
Rural 4-Leg Minor Stop Control 010
Rural 3-Leg Signalized 018
Rural 3-Leg Minor Stop Control 001
Development and Evaluation of Specific Virginia SPFs
In keeping with the suggestion given in the Safety Analyst Userrsquos Manual the model form used to develop the intersection SPFs is given in Equation 4 as
1 2k e x MajAADT x MinAADTβ βα=
where
k = predicted crash frequency per intersection per year MajAADT = AADT on the major road (vehday) MinAADT = AADT on the minor road (vehday) α = intercept β1 = coefficient of mayor AADT β2 = coefficient of minor AADT
30
The statewide SPFs developed for Virginia are given in Tables 13 through 16 Due to lack of data the analysis for all-way stop intersections could not be undertaken These tables also give the Freeman-Tukey R2
FT coefficient for each of the Virginia SPFs and the corresponding Minnesota SPF and Freeman-Tukey R2
FT based on the Virginia data The R2FT coefficients
obtained indicate that the Virginia-specific SPFs fit the Virginia data better than the suggested Minnesota SPFs for all types of intersections and crash severity except those for FI crashes on urban three-leg signalized rural four-leg signalized and rural four-leg minor stop control intersections where the corresponding RFT
2 values are similar In Table 15 it can be seen that the Minnesota R2
FT value is negative for the rural three-leg minor stop control intersections The negative RFT
2 value is possible because these calculations were not performed on the same data points that were used to create the Minnesota SPFs (Miller 2009) Table 13 SPF Models for Urban TOTAL crashes and R2
FT results for Virginia Statewide (VDOT-maintained roads)
SPF model with TOTAL Crash values
R2FT TOTAL
Crash Data
Site Virginia Statewide Minnesota VA MN
Urban 4-Leg Signalized 056 034
Urban 4-Leg Minor Stop Control
032 022
Urban 3-Leg Signalized 037 031
Urban 3-Leg Minor Stop Control
023 010
Table 14 SPF Models for Urban FI crashes and R2
FT results for Virginia Statewide (VDOT-maintained roads)
SPF model with FI Crash values R2FT FI Crash Data ()
Site
Virginia Statewide Minnesota VA MN
Urban 4-Leg Signalized 041 032
Urban 4-Leg Minor Stop Control
019 008
Urban 3-Leg Signalized 026 026
Urban 3-Leg Minor Stop Control
013 010
31
Table 15 SPF Models for Rural TOTAL Crashes and R2FT Results for Virginia Statewide (VDOT-
maintained roads) SPF model with TOTAL Crash values R2
FT TOTAL Crash Data
Site
Virginia Statewide Minnesota VA MN
Rural 4-Leg Signalized 0321 0290
Rural 4-Leg Minor Stop Control
0167 0132
Rural 3-Leg Signalized 0305 0291
Rural 3-Leg Minor Stop Control
0104 -0102
Table 16 SPF Models for Rural FI crashes and R2
FT results for Virginia Statewide (VDOT-maintained roads) SPF model with FI Crash values R2
FT TOTAL Crash Data
Site
Virginia Statewide Minnesota VA MN
Rural 4-Leg Signalized 0181 0181
Rural 4-Leg Minor Stop Control
0098 0097
Rural 3-Leg Signalized 0170 0180
Rural 3-Leg Minor Stop Control
0048 0012
Figures 7 through 10 show visual representations of how well the Virginia SPFs fit the
Virginia data in comparison with the suggested Minnesota SPFs In general the Virginia SPFs tend to fit the Virginia data better than the Minnesota SPFs although both sets of SPFs tend to have similar fits at low volumes (AADTmajor lt 2000) except for the SPF for total crashes on urban four-leg signalized intersections shown in Figure 7 The primary reason the Minnesota SPFs do not fit the Virginia data as well as the Virginia SPFs may be the dissimilarities of the roadside environment and the characteristics of the different databases
32
0
2
4
6
8
10
12
14
0 20000 40000 60000 80000 100000 120000
AADT Major
Tota
l Cra
shes
Per
Yea
r
Minnesota VA Actual Observed Virginia
Minnesota Model
Virginia M odel
Figure 7 Total crashes per year vs major AADT for urban 4-leg signalized intersections
with minor AADT of 700
0
5
10
15
20
25
30
35
0 20000 40000 60000 80000 100000 120000
AADT Major
Tota
l Cra
shes
per
Yea
r
Minnesota VA Actual Observed Virginia
Minnesota Model
Virginia Model
Figure 8 Total crashes per year vs major AADT for urban 4-leg signalized intersections
with minor AADT of 8000
33
0
2
4
6
8
10
12
14
0 20000 40000 60000 80000 100000 120000
AADT Major
Tota
l Cra
shes
Per
Yea
r
Minnesota VA Actual Observed Virginia
Virginia Model
Minnesota Model
Figure 9 Total crashes per year vs major AADT for rural 4-leg signalized intersections with
minor AADT of 79
0
5
10
15
20
25
0 20000 40000 60000 80000 100000 120000
AADT Major
Tota
l Cra
shes
per
Yea
r
Minnesota VA Actual Observed Virginia
Minnesota Model
Virginia Model
Figure 10 Total crashes per year vs minor AADT for rural 4-leg signalized intersections with major AADT of 5000
As discussed in the Methodology section in addition to the statewide Virginia SPFs
specific SPFs were developed for each operational region to consider the different topographical characteristics that exist across Virginia The complete set of SPFs together with the associated p values for the regression coefficients are shown in Tables A-1 and A-2 of Appendix A All p values are less than 005 with most being less than 00001 except for some of the rural four-leg signalized intersections regional specific SPFs These p values indicate that the estimated coefficients are statistically significant at the 95 confidence level or better A possible reason
34
for higher p values for a small number of SPFs may be the sample size used for developing these SPFs
To test the transferability and fit of the Virginia statewide specific SPFs several
statistical parameters were determined for the 70 (estimation) data set and the 30 (validation) data set separately The corresponding values for each of these parameters were then compared The results are shown in Tables 17 and 18 for urban and rural intersections respectively The results for the regional SPFs are shown in Tables A-3 through A-8 of Appendix A The results indicate that the developed models are transferable to the 30 validation data set For example the MSE values for the 70 estimation data are similar to the MSPE values for the 30 validation data In addition the mean prediction bias MPB values for the 30 validation data are close to zero (-076 le MPB ge -0004) in Table 17 and (-0067 le MPB ge 00513) in Table 18
Table 17 Goodness of Fit Results for Urban Statewide SPFs
Data Estimation data 70 Validation Data 30 Subtype Site MSE r2 R2
FT MPB MAD MSPE R2FT
Total VA 41150 0529 0557 -0760 4329 38490 0575
Total MN
68636 0506 0336 -3145 5421 68156 0315
FI VA
7043 0385 0406 -0458 1938 7671 0475
Urban 4-Leg Signalized
FI MN 7702 0372 0324 -0316 2124 8981 0376
Total VA 2238 0315 0313 -0034 0897 2383 0292
Total MN 2510 0287 0215 0091 0982 2730 0182
FI VA 0530 0194 0193 -0004 0432 0533 0194
Urban 4-Leg Minor Stop Control
FI MN 0560 0182 0080 0128 0522 0577 0052
Total VA 24900 0375 0370 -0645 3519 27591 0369
Total MN 29322 0365 0308 -2238 3661 33079 0272
FI VA 4467 0275 0259 -0185 1527 4875 0262
Urban 3-Leg Signalized
FI MN 4528 0267 0261 -0294 1526 4937 0261
Total VA 1854 0254 0230 -0043 0893 2038 0239
Total MN 2388 0237 0104 -0541 0902 2600 0107
FI VA 0428 0151 0133 -0021 0431 0476 0157
Urban 3-Leg Minor Stop Control
FI MN 0478 0140 0097 -0184 0385 0537 0104
35
Table 18 Goodness of Fit Results for Rural Statewide SPFs
Data Estimation Data 70
Validation Data 30
Subtype Site MSE r2 R2FT MPB MAD MSPE R2
FT
Total VA 10990 0353 0321 0513 2210 10070 -0073
Total MN 12400 0339 0290 -0154 2071 8460 0035
FI VA 2350 0196 0181 0045 1189 2600 -0034
Rural 4-Leg Signalized
FI MN 2400 0188 0181 -0043 1164 2420 0004
Total VA 1090 0182 0167 -0067 0794 1190 0171
Total MN 1190 0167 0132 -0348 0774 1320 0115
FI VA 0480 0112 0098 -0022 0504 0530 0110
Rural 4-Leg Minor Stop Control
FI MN 0500 0104 0097 -0158 0459 0560 0093
Total VA 5490 0328 0305 -0010 1651 5760 0179
Total MN NA NA NA NA NA NA NA
FI VA 1450 0181 0170 -0041 0902 1710 0099
Rural 3-Leg Signalized
FI MN NA NA NA NA NA NA NA
Total VA 0690 0144 0104 -0008 0613 0730 0102
Total MN 0890 0141 -0102 -0404 0555 0940 -0104
FI VA 0250 0071 0048 -0009 0345 0260 0048
Rural 3-Leg Minor Stop Control
FI MN 0270 0068 0012 -0144 0270 0290 0003
Pruning of Virginia-Specific SPFs A total of 64 SPFs were initially developed using the appropriate data for Virginia as shown in Tables A-1 and A-2 of Appendix A Considering that not all regional models might be necessary the pruning process described in the methodology section was carried out to prune the number of SPFs to the minimum effective number as seen in Tables 19 and 20 for urban and rural intersections respectively The pruning process resulted in 19 SPFs for urban sites and 15 for rural sites To facilitate the use of the correct SPF for a specific type of intersection located in a specific region the lists of the appropriate SPFs to be used are given in Tables B-1 and B-2 of Appendix B for the urban and rural intersections respectively
As can be seen in Tables 19 and 20 and Tables A-1 and A-2 of Appendix A there are some trends worth discussing for the benefit of the study and possible future research With regards to the three different operational regions the Western region retained many more of the specific regional urban SPFs than any other region For example the Western regional SPFs were retained for all urban intersection sites whereas for the Eastern region the only SPFs
36
retained were those for urban four-leg signalized FI crashes and urban four-leg minor stop control for total and FI crashes Similarly the only urban SPF retained for the Northern region was that for urban four-leg minor stop control for total crashes For the rural intersection sites all of the Western regional SPFs were retained except those for rural three-leg signalized total and FI crashes and rural four-leg minor stop control FI crashes The majority of the Eastern region rural SPFs were discarded except those for rural four-leg signalized total and FI crashes while for the Northern region all regional SPFs were discarded
The Western region retained more specific regional SPFs than the other two regions This suggests that the intersections in the Western region exhibit more unique characteristics than those for the other regions This may be due to the more mountainous terrain in the Western region compared to those in the Eastern and Northern regions This supports the philosophy of developing specific SPFs based on the topography of different regions
Site Prioritization
To illustrate the benefits of using the EB method to prioritize intersection sites for safety
improvements the top 25 urban sites from the Bristol and Northern Virginia districts were identified by using crash rates critical crash ratio and the EB method The PSI for each site identified was then determined The results obtained are shown in Tables 21 and 22 for the Bristol and the Northern Virginia districts respectively The results indicate that for the Northern Virginia District the PSIs for the top 25 sites are 258 1317 and 27440 crashes per year and for the Bristol District 432 646 and 1496 crashes per year for the crash rates critical crash ratio and EB methods respectively The important thing in Tables 21 and 22 is the sum of the PSI columns ranked by the three methods The sum of each of the PSIs for the crash rate and critical crash ratio method is lower than that for the EB method These results suggest that the use of the EB method in the planning process will identify intersection sites with the highest PSIs and therefore where detailed assessments to determine feasible and effective safety treatments should be undertaken
37
Table 19 MSPE Values for Virginia Urban Statewide and Urban Regional SPFs Used for Pruning
Data Pruning
Subtype
Site
MSPE [MSPEVA-
MSPEOR]1 [abs(MSPEVA-
MSPEOR)]2 [abs(MSPEVA-
MSPEOR)MSPEVA]3
RetainDiscardTotal VA 3849 Northern 4486 -637 637 0165497532 Discard Western 1791 2058 2058 0534684334 Retain Eastern 3745 104 104 0027020005 Discard FI VA 7671 Northern 95 -1829 1829 0238430452 Discard Western 517 2501 2501 0326033112 Retain
Urban 4-Leg Signalized
Eastern 541 2261 2261 0294746448 Retain Total VA 23834 Northern 202 03634 03634 015247126 Retain Western 105 13334 13334 0559452882 Retain Eastern 115 12334 12334 0517496014 Retain FI VA 05327 Northern 048 00527 00527 0098929979 Discard Western 033 02027 02027 0380514361 Retain
Urban 4-Leg Minor Stop Control
Eastern 036 01727 01727 0324197485 Retain Total VA 275911 Northern 2687 07211 07211 0026135239 Discard Western 2441 31811 31811 0115294425 Retain Eastern 3878 -111889 111889 0405525695 Discard FI VA 48754 Northern 448 03954 03954 0081101038 Discard Western 339 14854 14854 0304672437 Retain
Urban 3-Leg Signalized
Eastern 586 -09846 09846 020195266 Discard Total VA 20379 Northern 219 -01521 01521 0074635654 Discard Western 164 03979 03979 0195250012 Retain Eastern 223 -01921 01921 0094263703 Discard FI VA 04756 Northern 05 -00244 00244 0051303616 Discard Western 038 00956 00956 0201009251 Retain
Urban 3-Leg Minor Stop Control
Eastern 05 -00244 00244 0051303616 Discard 1 Difference between mean square prediction error (MSPE) of Virginia statewide model and OR model 2 Absolute value of the difference between Virginia statewide model MSPE and operational region model MSPE 3 Absolute value of the difference between Virginia statewide model MSPE and operational region model MSPE divided by the Virginia statewide MSPE for comparison
Retained SPFs Discarded if value is negative Discarded if less than 01
38
Table 20 MSPE Values for Virginia Rural Statewide and Rural Regional SPFs Used for Pruning Data Pruning
Subtype
Site
MSPE
[MSPEVA-MSPEOR]1
[abs(MSPEVA-MSPEOR)]2
[abs(MSPEVA-MSPEOR)MSPEVA]3
RetainDiscard
Total VA 1007 Northern 3422 -2415 2415 2398212512 Discard Western 605 402 402 0399205561 Retain Eastern 512 495 495 0491559086 Retain FI VA 26 Northern 976 -716 716 2753846154 Discard Western 159 101 101 0388461538 Retain
Rural 4-Leg Signalized
Eastern 137 123 123 0473076923 Retain Total VA 119 Northern 164 -045 045 0378151261 Discard Western 102 017 017 0142857143 Retain Eastern 114 005 005 0042016807 Discard FI VA 053 Northern 052 001 001 0018867925 Discard Western 048 005 005 0094339623 Discard
Rural 4-Leg Minor Stop Control
Eastern 049 004 004 0075471698 Discard Total VA 576 Northern 1475 -899 899 1560763889 Discard Western 674 -098 098 0170138889 Discard Eastern 626 -05 05 0086805556 Discard FI VA 171 Northern 212 -041 041 0239766082 Discard Western 403 -232 232 1356725146 Discard
Rural 3-Leg Signalized
Eastern 157 014 014 0081871345 Discard Total VA 073 Northern 093 -02 02 0273972603 Discard Western 053 02 02 0273972603 Retain Eastern 069 004 004 0054794521 Discard FI VA 026 Northern 03 -004 004 0153846154 Discard Western 023 003 003 0115384615 Retain
Rural 3-Leg Minor Stop Control
Eastern 027 -001 001 0038461538 Discard 1 Difference between mean square prediction error (MSPE) of Virginia statewide model and OR model 2 Absolute value of the difference between Virginia statewide model MSPE and operational region model MSPE 3 Absolute value of the difference between Virginia statewide model MSPE and operational region model MSPE divided by the Virginia statewide MSPE for comparison
Retained SPFs Discarded if value is negative Discarded if less than 01
39
Table 21 PSIs for Top 25 Sites in District 1 Urban (Bristol) FI
Crashes Ranking Based on Crash
Rates Ranking Based on Crash Ratio Ranking Based on EB
Method
Rank Intersection Node
Crash Rate1 PSI2 Intersection
Node Crash Ratio3 PSI Intersection
Node PSI
1 596726 22112 00000 651193 39672 00000 596095 21413
2 606469 20079 00000 606238 39298 06297 596393 08787
3 706818 12504 00000 651075 31264 00000 651130 08453
4 651193 11550 00000 596726 29227 00000 596701 07112 5 651075 09369 00000 606469 28039 00000 651802 06929 6 606238 08382 06297 651233 25831 03612 636331 06726 7 651807 07089 00000 651130 22718 08453 596395 06579 8 651233 06068 03612 706818 22555 00000 596937 06415 9 651230 05990 00000 651230 20301 00000 606238 06297
10 651783 05756 00000 651210 18882 04747 661033 06061 11 636093 04960 00000 636331 17913 06726 596372 05417 12 651274 04475 00000 651807 16847 00000 636372 04808 13 651130 04179 08453 651805 15814 00000 651210 04747 14 651210 03918 04747 651223 15627 03589 636491 04649 15 636331 03393 06726 651783 15009 00000 596420 04633 16 651223 03363 03589 596095 14865 21413 596403 04579 17 606232 03331 00000 636405 14769 00000 651603 04531 18 651127 03053 00000 661033 14555 06061 636056 04351 19 651999 03048 00000 596353 14215 03717 712033 04110 20 596449 02962 00000 636093 13782 00000 704691 04102 21 636405 02811 00000 651879 13192 00000 651838 04100 22 651883 02698 00000 651274 12975 00000 651894 03878 23 596353 02686 03717 651127 12972 00000 596353 03717 24 651805 02663 00000 651999 12959 00000 651233 03612 25 661033 02500 06061 596449 12702 00000 651889 03601
sum 43202 sum 64615 sum 149606 1Number of crashes per year per 1000000 total approach volume 2Potential for safety improvement (crashes yr) the difference between the EB-adjusted long-term crashes and the SPF-estimated crashes 3Ratio of actual crash rate to critical crash rate
40
Table 22 PSIs for Top 25 Sites in District 9 Urban (Northern Virginia District) FI
Crashes Ranking Based on Crash
Rates Ranking Based on Crash Ratio Ranking Based on EB
Method
Rank Intersection Node
Crash Rate1 PSI2 Intersection
Node Crash Ratio3 PSI Intersection
Node PSI
1 718192 191841 00000 718192 257523 00000 264119 150122 2 702946 178194 00000 547722 152371 11175 263375 140091 3 271531 64846 00000 263628 102794 00000 278648 137239 4 263628 52858 00000 263728 100092 00000 276819 131395 5 263728 42215 00000 719754 95274 09444 263290 130743 6 266955 35294 00000 702946 79268 00000 722678 127897 7 547722 34932 11175 263403 77252 05184 264725 118671 8 702612 30441 00000 704237 77175 07648 267028 116627 9 273886 29539 00000 263729 74681 00000 265204 115925
10 716747 27632 00000 271531 72327 00000 274766 115679 11 263626 27139 00000 263135 66458 18068 263249 113372 12 269485 26567 00000 716747 64461 00000 547044 110769 13 728954 26344 00000 266955 56657 00000 549349 107180 14 263729 25208 00000 546138 52003 31028 268210 105630 15 546988 21922 00000 547544 51924 32529 263347 104257 16 274338 21446 00000 263626 50389 00000 276351 102313 17 429308 21354 00000 269485 49897 00000 428167 100064 18 720401 21197 00000 728954 49702 00000 264344 98789 19 267295 20954 00000 548686 49572 03621 277764 91554 20 267536 20874 00000 711601 47985 04440 263467 89259 21 265938 20484 00000 266970 47730 00000 263090 89199 22 273354 20108 00000 546462 46856 03620 703414 88610 23 268345 19362 00000 265938 46726 00000 428629 87379 24 719754 19073 09444 720401 44833 00000 272219 85659 25 263403 19015 05184 728496 43666 04990 428544 85610
Sum 25803 sum 131747 sum 2744033 1Number of crashes per year per 1000000 total approach volume 2Potential for safety improvement (crashes yr) the difference between the EB-adjusted long-term crashes and the SPF-estimated crashes 3Ratio of actual crash rate to critical crash rate
41
CONCLUSIONS
bull The development of SPFs for intersections is necessary for Virginia because the SafetyAnalyst-suggested SPFs which are based on Minnesota data do not represent the Virginia data well Regarding the fit of the SPFs to Virginia data the R2
FT values shown in Tables 13 through 16 for Minnesota and Virginia indicate that the Virginia-specific SPFs fit the Virginia data better than the Minnesota models This may be due to the dissimilarities of the roadside environment such as difference in topography and the characteristics of the different Virginia and Minnesota databases
bull In some cases the specific regional SPFs fit the regional data better than the statewide
SPFs suggesting that the specific SPFs should be considered for use when available These group divisions that have similar roadway characteristics and driver expectations in some cases tend to improve the fit
bull In identifying intersection sites for safety improvements it is clearly beneficial for the EB
method to be used with the suitable SPFs rather than a crash rate or critical ratio method Results of the site prioritization show a much higher potential for crash reduction when the EB method is used with the appropriate SPFs rather than a procedure based on crash rates or critical rates
RECOMMENDATIONS
1 VDOTrsquos TED should use the Virginia-specific SPFs when using the SafetyAnalyst tools The results of this study have shown that the Virginia-specific SPFs reflected the Virginia data better than the SafetyAnalyst-recommended Minnesota SPFs
2 VDOTrsquos TED should investigate the feasibility of using multiple SPFs in SafetyAnalyst If
feasible regional SPFs should be used If it is not currently feasible to use multiple SPFs VDOTrsquos TED should ask that the FHWA include regional information in SafetyAnalyst so as to allow the use of regional SPFs For the specific regional SPFs to be applied to Virginia and other states the SafetyAnalyst tool should be capable of incorporating the necessary data that support the regional models
3 As soon as it is feasible to use regional SPFs VDOTrsquos TED should use the 19 SPFs
developed for urban intersections and the 15 developed for rural intersections when using the tools in SafetyAnalyst Although the statewide SPFs are available for use by an analyst the specific regional models included in the final set of SPFs will predict crashes better than the statewide SPFs The regional analysis will not only ease the use of specific regional SPFs but will also be of benefit when predicting the potential for safety improvement of a specific site
4 For future similar SPF studies VDOTrsquos TED should be directly involved in screening the
traffic data for accuracy and consistency as was done in this study The direct involvement of the TED in the screening of the traffic data significantly contributed to the accuracy of the
42
data and greatly contributed to the confidence the researchers place on the data used in the study
5 The Virginia Transportation Research Council (VTRC) should conduct a study as soon as
feasible to verify whether incorporating independent variables for which data are available other than AADT such as intersection geometry and other characteristics will result in SPFs that better fit the Virginia data Although the currently suggested SafetyAnalyst SPFs use only the AADTs as the independent variables it is likely that provision will be made for use of SPFs that incorporate other independent variables such as number of approaches entering lanes and the other variables for which data are available as these SPFs are likely to give better fit to crash data
6 As soon as feasible VTRC should undertake a study to develop SPFs for the urban system
intersections which are not currently maintained by VDOT as these intersections may have different crash characteristics than those maintained by VDOT This would facilitate the use of SafetyAnalyst in programming sites that are currently not being maintained by VDOT
BENEFITS AND IMPLEMENTATION PROSPECTS
Significant benefits will be accrued by the use of the Virginia-specific SPFs developed in this study This is clearly illustrated in two ways First in examining the transferability of the suggested SPFs in SafetyAnalyst it is clear that these SPFs do not fit the Virginia data very well The results also indicate that the Virginia-specific SPFs fit the Virginia data much better than the suggested SafetyAnalyst SPFs Second the availability of the Virginia-specific SPFs will enhance the use of the EB procedure given in SafetyAnalyst for prioritizing sites for safety improvements This study has also shown that the EB method better identifies sites with higher potential for crash reduction than those identified by crash rates For example the illustrated examples given for the Bristol and Northern Virginia districts show that the potential reduction in FI crashes when the top 25 sites are identified by the EB method is 28936 (1496 + 27440) crashes per year whereas that obtained when the critical crash ratio method is used for prioritization is only 1963 (646 + 1317) and that obtained with the crash rate method is only 690 (432 + 258) crashes per year This gives a net benefit of 26973 potential crashes per year compared to the critical crash ratio method and 28246 compared to the crash rate method Assuming an average cost of FI crashes of $95629 (FHWA 2005) and only 10 of the estimated net benefit PSI of 28246 crashes per year is achieved the total savings of more than $27 million per year could be accrued The prospects for implementation of the recommendations are very high as the study was requested by VDOTrsquos TED which is planning to incorporate these SPFs in the use of the tools provided in SafetyAnalyst
43
ACKNOWLEDGMENTS
The authors appreciate the opportunity afforded them by VDOT and VTRC to conduct this study Special thanks to Stephen Read (VDOT) Dr In-Kyu Lim (VDOT) Dr Young-Jun Kweon (VTRC) and VDOTrsquos Central Office for their interest and support in SPFs and their help in the selection of intersection sites Many thanks to Lewis Woodson (VTRC) and James Hill (University of Virginia) for all their help and input throughout the study
REFERENCES Cogburn P VDOT Interagency Coordination 2007 Virginia Emergency Management
Conference Virginia Department of Transportation Richmond April 2007 Colorado Department of Transportation DTD Applied Research and Innovation Branch Safety
Performance Functions for Intersections CDOT-2009-10 Denver December 2009 Fridstroslashm L Ifver J Ingebrigtsen S Kulmala R and Thomsen LK Measuring the
Contribution of Randomness Exposure Weather and Daylight to the Variation in Road Accidents Counts Accident Analysis and Prevention Vol 27 No 1 1995 pp 1-20
Federal Highway Administration Cost of Crashes by Severity Table FHWA-HRT-05-051
Washington DC 2005 Federal Highway Administration SafetyAnalyst Home Page httpwwwsafetyanalystorg
Accessed February 2010 Garber N and Hoel L Traffic amp Highway Engineering 4th ed Cenage Learning Toronto
Canada 2009 Garber NJ Haas PR and Gosse C Development of Safety Performance Functions for Two-
Lane Roads Maintained by the Virginia Department of Transportation VTRC 10-R25 Virginia Transportation Research Council Charlottesville 2010
Hamidi A Fontaine MD and Demetsky MJ A Planning-Level Methodology for Identifying
High-Crash Sections of Virginiarsquos Primary System VTRC 11-R4 Virginia Transportation Research Council Charlottesville 2010
Harwood D Council FM Hauer E Hughes WE and Vogt A Prediction of the Expected
Safety Performance of Rural Two-lane Highways Federal Highway Administration McLean VA December 2000
Harwood DW Bauer KM Richard KR Gilmore DK Persaud B and Lyon C
Development of SPFs for Safety Analyst Interim Tools Technical Memorandum
44
Prepared by Midwest Research Institute for the Federal Highway Administration McLean VA 2004
ITT Corporation SafetyAnalyst Userrsquos Manual Turner-Fairbank Highway Research Center
McLean VA 2008 Jonsson T Ivan J and Zhang C Crash Prediction Models for Intersections on Rural
Multilane Highways Differences by Collision Type In Transportation Research Record Journal of the Transportation Research Board No 2019 Transportation Research Board of the National Academies Washington DC 2007 pp 91-98
Kweon Y-J and Lim I-K Appropriate Regression Model Types for the Empirical Bayes
Method and SafetyAnalyst In Proceedings of the 89th Annual Meeting of the Transportation Research Board Transportation Research Board of the National Academies Washington DC 2010
Kononov J Bailey B and Allery B Exploratory Examination of the Functional Form of
Safety Performance Functions of Urban Freeways Colorado Department of Transportation and San Diego State University Denver CO 2008
Lyon C Haq A Persaud B and Kodama S Safety Performance Functions for Signalized
Intersections in Large Urban Areas Development and Application to Evaluation of Left-Turn Priority Treatment In Transportation Research Record Journal of the Transportation Research Board No 1908 Transportation Research Board of the National Academies Washington DC 2005 pp 165-171
Lord D and Persaud B Estimating the Safety Performance of Urban Road Transportation
Networks Center for Transportation Safety Texas Transportation Institute Texas AampM University and Department of Civil Engineering Ryerson University College Station TX 2003 pp 609-620
Miaou S-P Lu A and Lum H S Pitfalls of using R2 to Evaluate Goodness of Fit of
Accident Prediction Models In Transportation Research Record Journal of the Transportation Research Board No 1542 Transportation Research Board of the National Academies Washington DC 2005 1996 pp 6-13
Miller P Re Negative R squared Email Archive Division of Biostatistics Washington
University in St Louis February 2 2005 February 2 2005 httpwwwbiostatwustleduarchiveshtmljmp-l2005msg00075html Accessed February 2010
Persaud B Lord D and Palmisano J Calibration and Transferability of Accident Prediction
Models for Urban Intersections In Transportation Research Record Journal of the Transportation Research Board No 1784 Transportation Research Board of the National Academies Washington DC 2002 pp 57-64
45
Persaud B and Nguyen T Disaggregate Safety Performance Models for Signalized Intersections on Ontario Provincial Roads In Transportation Research Record Journal of the Transportation Research Board No 1635 Transportation Research Board of the National Academies Washington DC 1998 pp 113-120
Pham T and Ragland D Summary of Crash Prediction Models Also known as Safety
Performance Functions (SPFs) California Partners for Advanced Traffic and Highways and University of California Berkeley Berkeley 2005
SAS Institute Inc SAS OnlineDoc Version Eight Cary NC
httpwwwtecnionacildocssasril Accessed 2009 Tegge RA Jo J-H and Ouyang Y Development and Application of Safety Performance
Functions for Illinois ICT-10-066 Illinois Center for Transportation University of Illinois Urbana-Champaign March 2010
Virginiarsquos Surface Transportation Safety Executive Committee Commonwealth of Virginiarsquos
Strategic Highway Safety Plan 2006-2010 Virginia Department of Transportation Richmond 2006
Washington S Persaud B Lyon C and Oh J Validation of Accident Models for
Intersections FHWA-RD-03-037 Federal Highway Administration McLean VA 2005
46
47
APPENDIX A
STATISTICAL PARAMETERS AND GOODNESS-OF-FIT RESULTS
Table A-1 Statistical Parameters for Urban Intersections SPFs Parameter Estimates
Data Intercept
Coefficient of Mayor AADT
Coefficient of Minor AADT
Subtype Site Intercept (α)
StndError
P value
lnMajor (β1)
StndError
P value
lnMinor (β2)
StndError
P value
Total VA -76234 048 lt0001 06742 005 lt0001 03453 003 lt0001
OR1 -83067 056 lt0001 07522 005 lt0001 0328 003 lt0001OR10 -123913 122 lt0001 10631 013 lt0001 04567 006 lt0001OR 100 -88553 077 lt0001 07825 007 lt0001 03706 004 lt0001FI VA -85256 057 lt0001 06477 006 lt0001 03579 004 lt0001OR1 -96546 063 lt0001 07603 006 lt0001 03597 004 lt0001OR10 -114284 15 lt0001 08662 016 lt0001 04412
Urban 4-Leg Signalized
OR 100 -99582 100 lt0001 07484 009 lt0001 04017 005 lt0001Total VA -60723 022 lt0001 04558 002 lt0001 0347 004 lt0001
OR1 -6059 044 lt0001 0505 004 lt0001 02773 006 lt0001OR10 -67031 057 lt0001 03986 007 lt0001 04999 009 lt0001OR 100 -65388 032 lt0001 04689 004 lt0001 043 006 lt0001FI VA -76917 032 lt0001 05001 003 lt0001 03695 005 lt0001OR1 -81437 060 lt0001 05813 005 lt0001 03188 008 lt0001OR10 -80333 063 lt0001 03446 007 lt0001 06218 010 lt0001
Urban 4-Leg Minor Stop Control
OR 100 -83166 051 lt0001 05253 006 lt0001 04695 008 lt0001Total VA -6543 082 lt0001 06591 008 lt0001 02119 002 lt0001
OR1 -4999 103 lt0001 05555 009 lt0001 01554 003 lt0001OR10 -96143 127 lt0001 08677 012 lt0001 03297 005 lt0001OR 100 -67518 110 lt0001 06157 011 lt0001 02969 005 lt0001FI VA -84268 068 lt0001 07147 006 lt0001 02481 002 lt0001OR1 -73982 099 lt0001 06496 009 lt0001 02088 003 lt0001OR10 -110104 155 lt0001 0908 015 lt0001 03226 006 lt0001
Urban 3-Leg Signalized
OR 100 -7266 107 lt0001 05508 011 lt0001 03107 006 lt0001Total VA -54696 013 lt0001 04874 002 lt0001 01985 001 lt0001
OR1 -5361 018 lt0001 04959 002 lt0001 01676 002 lt0001OR10 -5773 034 lt0001 04877 003 lt0001 02314 004 lt0001OR 100 -51642 021 lt0001 04338 003 lt0001 02309 003 lt0001FI VA -74642 018 lt0001 05791 002 lt0001 02091 002 lt0001OR1 -76877 027 lt0001 06204 003 lt0001 0181 002 lt0001OR10 -69458 047 lt0001 05096 004 lt0001 02212 005 lt0001
Urban 3-Leg Minor Stop Control
OR 100 -69883 031 lt0001 05169 004 lt0001 02308 003 lt0001 Standard Error
48
Table A-2 Statistical Parameters for Rural Intersections SPFs Parameter Estimates
Data Intercept
Coefficient of Mayor AADT
Coefficient of Minor AADT
Subtype Site Intercept (α)
StndError
P value
lnMajor (β1)
Stnd Error
P value
lnMinor (β2)
Stnd Error
P value
Total VA -69589 118 lt0001 06746 009 lt0001 0253 009 00047
OR1 -1604 237 04974 02284 021 02791 01514 012 0211 OR10 -63951 183 00005 05508 014 00001 03106 014 00224 OR 100 -06468 220 07692 02262 016 01635 -00158 017 09274 FI VA -87116 128 lt0001 07839 011 lt0001 02166 009 0013 OR1 -33285 246 01767 03601 024 0126 00597 013 06478 OR10 -80583 175 lt0001 06809 018 00001 02557 013 0057
Rural 4-Leg Signalized
OR 100 -48381 221 00287 04243 018 00193 01523 018 03943 Total VA -5494 020 lt0001 03533 002 lt0001 03935 003 lt0001
OR1 -62351 058 lt0001 04167 006 lt0001 04507 008 lt0001OR10 -53594 028 lt0001 03379 003 lt0001 03998 004 lt0001OR 100 -51255 027 lt0001 02914 003 lt0001 04075 004 lt0001FI VA -66927 030 lt0001 03899 003 lt0001 04156 004 lt0001OR1 -82561 095 lt0001 05221 009 lt0001 04962 012 lt0001OR10 -70797 044 lt0001 03789 004 lt0001 0497 005 lt0001
Rural 4-Leg Minor Stop Control
OR 100 -63326 038 lt0001 03223 004 lt0001 04424 005 lt0001Total VA -75754 084 lt0001 06465 008 lt0001 03332 008 lt0001
OR1 -58798 220 00075 05076 020 00143 0313 013 00161 OR10 -64368 110 lt0001 0544 011 lt0001 02863 006 lt0001OR 100 -9899 139 lt0001 08047 015 lt0001 04386 006 lt0001FI VA -87112 103 lt0001 07224 010 lt0001 02578 006 lt0001OR1 -9219 260 00004 07258 022 00011 03407 016 00326 OR10 -88607 146 lt0001 07059 016 lt0001 02809 008 00009
Rural 3-Leg Signalized
OR 100 -111835 185 lt0001 08669 018 lt0001 03977 008 lt0001Total VA -43293 008 lt0001 03366 001 lt0001 02087 001 lt0001
OR1 -50904 022 lt0001 0406 002 lt0001 02752 003 lt0001OR10 -40969 009 lt0001 03133 001 lt0001 02001 001 lt0001OR 100 -4231 016 lt0001 02997 002 lt0001 02308 003 lt0001FI VA -53415 011 lt0001 03394 001 lt0001 02237 001 lt0001OR1 -64457 031 lt0001 04195 003 lt0001 0307 004 lt0001OR10 -50831 014 lt0001 03245 002 lt0001 02014 002 lt0001
Rural 3-Leg Minor Stop Control
OR 100 -51046 024 lt0001 03163 003 lt0001 02112 003 lt0001
Standard Error
49
Table A-3 SPFs Goodness of Fit Results for Urban Northern Operational Region (No 1)
Data Estimation Data 70 Validation Data 30
Subtype Site MSE r2 R2FT MPB MAD MSPE R2
FT
Total VA 41150 0529 0557 -0760 4329 38490 0575
Total R1 4110 051 0551 -020 464 4486 054
FI VA 704 038 0406 -046 194 767 048
Urban 4-Leg Signalized
FI R1 809 039 0439 012 214 950 038
Total VA 224 031 0313 -003 090 238 029
Total R1 308 028 0286 008 095 200 032
FI VA 053 019 0193 000 043 053 019
Urban 4-Leg Minor Stop Control
FI R1 064 018 0187 003 043 048 021
Total VA 2490 038 0370 -064 352 2759 037
Total R1 3034 032 0305 -015 365 2687 037
FI VA 447 028 0259 -019 153 488 026
Urban 3-Leg Signalized
FI R1 559 025 0231 004 157 448 029
Total VA 185 025 0230 -004 089 204 024
Total R1 208 026 0239 -006 094 219 026
FI VA 043 015 0133 -002 043 048 016
Urban 3-Leg Minor Stop Control
FI R1 047 017 0156 -001 044 050 017
50
Table A-4 SPFs Goodness of Fit Results for Urban Western Operational Region (No 10)
Data Estimation Data 70 Validation Data 30
Subtype Site MSE r2 R2FT MPB MAD MSPE R2
FT
Total VA 41150 0529 0557 -0760 4329 38490 0575
Total R10 21976 0777 0735 1290 3233 17910 0686
FI VA 7043 0385 0406 -0458 1938 7671 0475
Urban 4-Leg Signalized
FI R10 4280 0526 0500 0377 1597 5170 0452
Total VA 2238 0315 0313 -0034 0897 2383 0292
Total R10 1161 0361 0300 -0032 0740 1050 0188
FI VA 0530 0194 0193 -0004 0432 0533 0194
Urban 4-Leg Minor Stop Control
FI R10 0312 0197 0187 0000 0382 0330 0009
Total VA 24900 0375 0370 -0645 3519 27591 0369
Total R10 14446 0451 0397 -0168 2801 24410 0255
FI VA 4467 0275 0259 -0185 1527 4875 0262
Urban 3-Leg Signalized
FI R10 3077 0266 0216 0039 1258 3390 0115
Total VA 1854 0254 0230 -0043 0893 2038 0239
Total R10 1391 0233 0197 -0054 0800 1640 0207
FI VA 0428 0151 0133 -0021 0431 0476 0157
Urban 3-Leg Minor Stop Control
FI R10 0354 0111 0089 -0019 0404 0380 0125
51
Table A-5 SPFs Goodness of Fit Results for Urban Eastern Operational Region (No 100)
Data Estimation Data 70 Validation Data 30
Subtype Site MSE r2 R2FT MPB MAD MSPE R2
FT
Total VA 41150 0529 0557 -0760 4329 38490 0575
Total R100 31108 0632 0630 0243 4717 37450 0005
FI VA 7043 0385 0406 -0458 1938 7671 0475
Urban 4-Leg Signalized
FI R100 5201 0480 0454 -0098 1864 5410 0244
Total VA 2238 0315 0313 -0034 0897 2383 0292
Total R100 1720 0443 0381 0087 0758 1150 0003
FI VA 0530 0194 0193 -0004 0432 0533 0194
Urban 4-Leg Minor Stop Control
FI R100 0509 0273 0254 0049 0383 0360 0173
Total VA 24900 0375 0370 -0645 3519 27591 0369
Total R100 17782 0410 0410 -1753 0908 38780 0004
FI VA 4467 0275 0259 -0185 1527 4875 0262
Urban 3-Leg Signalized
FI R100 3194 0243 0263 -0615 1645 5860 0236
Total VA 1854 0254 0230 -0043 0893 2038 0239
Total R100 1561 0233 0210 -0127 0902 2230 0002
FI VA 0428 0151 0133 -0021 0431 0476 0157
Urban 3-Leg Minor Stop Control
FI R100 0387 0131 0116 -0043 0444 0500 0141
52
Table A-6 SPFs Goodness of Fit Results for Rural Northern Operational Region (No 1)
Data Estimation Data 70
Validation Data 30
Subtype Site MSE r2 R2FT MPB MAD MSPE R2
FT
Total VA 10990 0353 0321 0513 2210 10070 -0073
Total R1 20080 0118 0092 -1389 3661 34220 0212
FI VA 2350 0196 0181 0045 1189 2600 -0034
Rural 4-Leg Signalized
FI R1 2920 0057 0052 -1173 1931 9760 0028
Total VA 1090 0182 0167 -0067 0794 1190 0171
Total R1 1990 0190 0245 0001 0942 1640 0173
FI VA 0480 0112 0098 -0022 0504 0530 0110
Rural 4-Leg Minor Stop Control
FI R1 0920 0093 0112 0020 0541 0520 0009
Total VA 5490 0328 0305 -0010 1651 5760 0179
Total R1 11110 0182 0254 -0679 2271 14750 0497
FI VA 1450 0181 0170 -0041 0902 1710 0099
Rural 3-Leg Signalized
FI R1 3230 0131 0153 -0116 1006 2120 0355
Total VA 0690 0144 0104 -0008 0613 0730 0102
Total R1 1210 0245 0196 0030 0712 0930 0126
FI VA 0250 0071 0048 -0009 0345 0260 0048
Rural 3-Leg Minor Stop Control
FI R1 0340 0124 0093 0016 0366 0300 0052
53
Table A-7 SPFs Goodness of Fit Results for Rural Western Operational Region (No 10)
Data Estimation Data 70 Validation Data 30
Subtype Site MSE r2 R2FT MPB MAD MSPE R2
FT
Total VA 10990 0353 0321 0513 2210 10070 -0073
Total R10 6020 0311 0268 0007 1748 6050 0382
FI VA 2350 0196 0181 0045 1189 2600 -0034
Rural 4-Leg Signalized
FI R10 1880 0158 0139 0097 0945 1590 0254
Total VA 1090 0182 0167 -0067 0794 1190 0171
Total R10 1300 0196 0163 0070 0760 1020 0078
FI VA 0480 0112 0098 -0022 0504 0530 0110
Rural 4-Leg Minor Stop Control
FI R10 0560 0142 0118 0025 0495 0480 0014
Total VA 5490 0328 0305 -0010 1651 5760 0179
Total R10 3690 0163 0170 -0432 0748 6740 0039
FI VA 1450 0181 0170 -0041 0902 1710 0099
Rural 3-Leg Signalized
FI R10 0890 0124 0117 -0391 0997 4030 -0066
Total VA 0690 0144 0104 -0008 0613 0730 0102
Total R10 0640 0126 0091 0025 0583 0580 0055
FI VA 0250 0071 0048 -0009 0345 0260 0048
Rural 3-Leg Minor Stop Control
FI R10 0240 0062 0041 0003 0335 0230 0028
54
Table A-8 SPFs Goodness of Fit Results for Rural Eastern Operational Region (No 100)
Data Estimation Data 70 Validation Data 30
Subtype Site MSE r2 R2FT MPB MAD MSPE R2
FT
Total VA 10990 0353 0321 0513 2210 10070 -0073
Total R100 10120 0042 0027 1207 1882 5120 -0307
FI VA 2350 0196 0181 0045 1189 2600 -0034
Rural 4-Leg Signalized
FI R100 2060 0053 0039 0119 0962 1370 -0023
Total VA 1090 0182 0167 -0067 0794 1190 0171
Total R100 0960 0170 0149 -0086 0746 1140 0209
FI VA 0480 0112 0098 -0022 0504 0530 0110
Rural 4-Leg Minor Stop Control
FI R100 0440 0106 0092 -0031 0475 0490 0121
Total VA 5490 0328 0305 -0010 1651 5760 0179
Total R100 2770 0492 0459 0601 1759 6260 0090
FI VA 1450 0181 0170 -0041 0902 1710 0099
Rural 3-Leg Signalized
FI R100 1040 0265 0255 0124 0923 1570 -0055
Total VA 0690 0144 0104 -0008 0613 0730 0102
Total R100 0640 0125 0087 -0037 0601 0690 0119
FI VA 0250 0071 0048 -0009 0345 0260 0048
Rural 3-Leg Minor Stop Control
FI R100 0250 0064 0038 -0013 0345 0270 0062
55
APPENDIX B
RECOMMENDED SAFETY PERFORMANCE FUNCTION MODELS
Table B-1 Recommended Urban SPFs Site Virginia SPF Models to Be Used for Urban Intersections
Urban 4-Leg Signalized Total Virginia generic total
Urban 4-Leg Signalized
Operational Region 1 generic total
Urban 4-Leg Signalized
Operational Region 10
use specified model developed
Urban 4-Leg Signalized
Operational Region 100 generic total
Urban 4-Leg Signalized FI Virginia generic FI
Urban 4-Leg Signalized
Operational Region 1 generic FI
Urban 4-Leg Signalized
Operational Region 10
use specified model developed
Urban 4-Leg Signalized
Operational Region 100
use specified model developed
Urban 4-Leg Minor Stop Control
Total Virginia generic total
Urban 4-Leg Minor Stop Control
Operational Region 1
use specified model developed
Urban 4-Leg Minor Stop Control
Operational Region 10
use specified model developed
Urban 4-Leg Minor Stop Control
Operational Region 100
use specified model developed
Urban 4-Leg Minor Stop Control
FI Virginia generic FI e^-76917MajADT^05001MinADT^03695
Urban 4-Leg Minor Stop Control
Operational Region 1
use specified model developed
Urban 4-Leg Minor Stop Control
Operational Region 10
use specified model developed
Urban 4-Leg Minor Stop Control
Operational Region 100
use specified model developed
56
Table B-1 Recommended Urban SPFs (Continued)
Site Virginia SPF Models to Be Used for Urban Intersections
Urban 3-Leg Signalized
Total Virginia
use generic model developed for total
crashes
Urban 3-Leg Signalized
Operational Region 1
use generic model developed for total
crashes
Urban 3-Leg Signalized
Operational Region 10
use specific regional model
developed
Urban 3-Leg Signalized
Operational Region 100
use generic model developed for total
crashes
Urban 3-Leg Signalized FI Virginia
use generic model developed for FI
crashes
Urban 3-Leg Signalized
Operational Region 1
use generic model developed for FI
crashes
Urban 3-Leg Signalized
Operational Region 10
use specific regional model
developed
Urban 3-Leg Signalized
Operational Region 100
use generic model developed for FI
crashes
Urban 3-Leg Minor Stop Control
Total Virginia
use generic model developed for total
crashes
Urban 3-Leg Minor Stop Control
Operational Region 1
use generic model developed for total
crashes
Urban 3-Leg Minor Stop Control
Operational Region 10
use specific regional model
developed
Urban 3-Leg Minor Stop Control
Operational Region 100
use generic model developed for total
crashes
Urban 3-Leg Minor Stop Control
FI Virginia use generic model developed for FI
crashes
Urban 3-Leg Minor Stop Control
Operational Region 1
use generic model developed for FI
crashes
Urban 3-Leg Minor Stop Control
Operational Region 10
use specific regional model
developed
Urban 3-Leg Minor Stop Control
Operational Region 100
use generic model developed for FI
crashes
57
Table B-2 Recommended Rural SPFs Site Virginia SPF Models to Be Used for Rural Intersections
Rural 4-Leg Signalized Total Virginia
use generic model developed for total
crashes
Rural 4-Leg Signalized
Operational Region 1
use generic model developed for total
crashes
Rural 4-Leg Signalized
Operational Region 10
use specific regional model developed
Rural 4-Leg Signalized
Operational Region 100
use specific regional model developed
Rural 4-Leg Signalized FI Virginia use generic model
developed for FI crashes
Rural 4-Leg Signalized
Operational Region 1
use generic model developed for FI crashes
Rural 4-Leg Signalized
Operational Region 10
use specific regional model developed
Rural 4-Leg Signalized
Operational Region 100
use specific regional model developed
Rural 4-Leg Minor Stop Control Total Virginia
use generic model developed for total
crashes
Rural 4-Leg Minor Stop Control
Operational Region 1
use generic model developed for total
crashes e^-549MajADT^035MinADT^039
Rural 4-Leg Minor Stop Control
Operational Region 10
use specific regional model developed
Rural 4-Leg Minor Stop Control
Operational Region 100
use generic model developed for total
crashes
Rural 4-Leg Minor Stop Control FI Virginia use generic model
developed for FI crashes
Rural 4-Leg Minor Stop Control
Operational Region 1
use generic model developed for FI crashes
Rural 4-Leg Minor Stop Control
Operational Region 10
use generic model developed for FI crashes
Rural 4-Leg Minor Stop Control
Operational Region 100
use generic model developed for FI crashes
58
Table B-2 Recommended Rural SPFs (Continued)
Site Virginia SPF Models to Be Used for Rural Intersections
Rural 3-Leg Signalized Total Virginia use generic model
developed for total crashes
Rural 3-Leg Signalized
Operational Region 1
use generic model developed for total crashes
Rural 3-Leg Signalized
Operational Region 10
use generic model developed for total crashes
Rural 3-Leg Signalized
Operational Region 100
use generic model developed for total crashes
Rural 3-Leg Signalized FI Virginia use generic model
developed for FI crashes
Rural 3-Leg Signalized
Operational Region 1
use generic model developed for FI crashes
Rural 3-Leg Signalized
Operational Region 10
use generic model developed for FI crashes
Rural 3-Leg Signalized
Operational Region 100
use generic model developed for FI crashes
Rural 3-Leg Minor Stop Control Total Virginia use generic model
developed for total crashes
Rural 3-Leg Minor Stop Control
Operational Region 1
use generic model developed for total crashes
Rural 3-Leg Minor Stop Control
Operational Region 10
use specific regional model developed
Rural 3-Leg Minor Stop Control
Operational Region 100
use generic model developed for total crashes
Rural 3-Leg Minor Stop Control FI Virginia use generic model
developed for FI crashes
Rural 3-Leg Minor Stop Control
Operational Region 1
use generic model developed for FI crashes
Rural 3-Leg Minor Stop Control
Operational Region 10
use specific regional model developed
Rural 3-Leg Minor Stop Control
Operational Region 100
use generic model developed for FI crashes
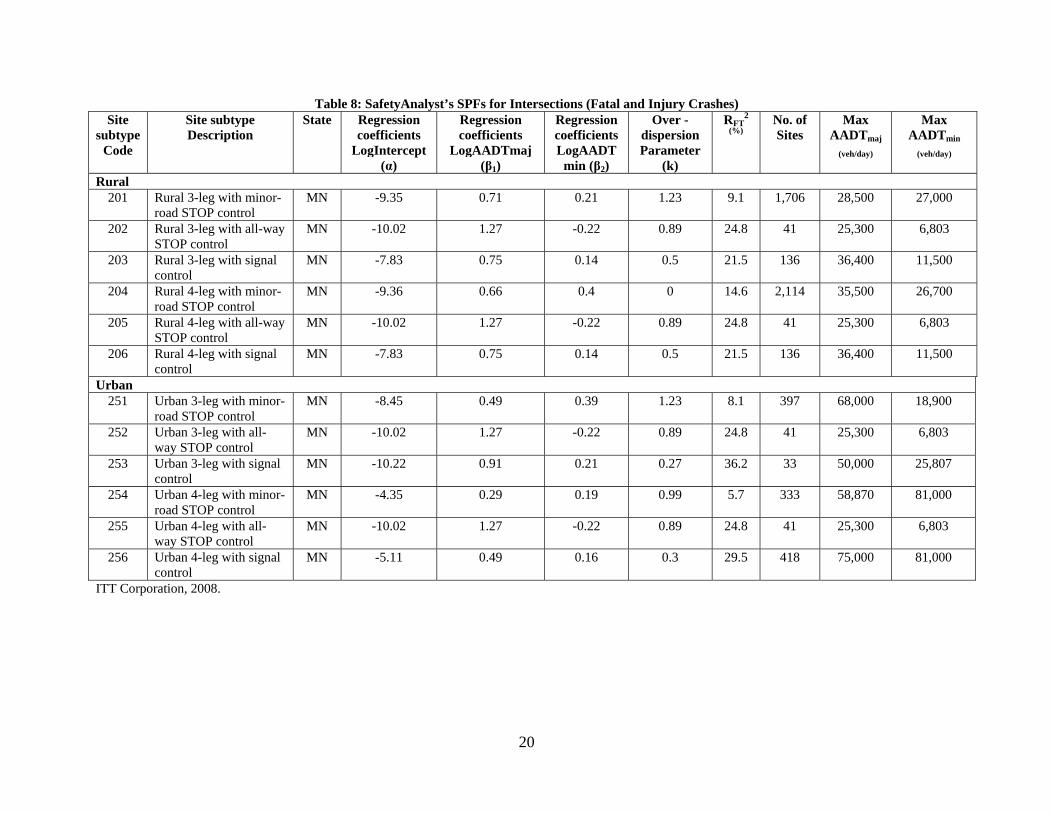
20
Table 8 SafetyAnalystrsquos SPFs for Intersections (Fatal and Injury Crashes) Site
subtype Code
Site subtype Description
State Regression coefficients
LogIntercept (α)
Regression coefficients
LogAADTmaj (β1)
Regression coefficients LogAADT
min (β2)
Over - dispersion Parameter
(k)
RFT2
() No of Sites
Max AADTmaj
(vehday)
Max AADTmin
(vehday)
Rural 201 Rural 3-leg with minor-
road STOP control MN -935 071 021 123 91 1706 28500 27000
202 Rural 3-leg with all-way STOP control
MN -1002 127 -022 089 248 41 25300 6803
203 Rural 3-leg with signal control
MN -783 075 014 05 215 136 36400 11500
204 Rural 4-leg with minor-road STOP control
MN -936 066 04 0 146 2114 35500 26700
205 Rural 4-leg with all-way STOP control
MN -1002 127 -022 089 248 41 25300 6803
206 Rural 4-leg with signal control
MN -783 075 014 05 215 136 36400 11500
Urban 251 Urban 3-leg with minor-
road STOP control MN -845 049 039 123 81 397 68000 18900
252 Urban 3-leg with all-way STOP control
MN -1002 127 -022 089 248 41 25300 6803
253 Urban 3-leg with signal control
MN -1022 091 021 027 362 33 50000 25807
254 Urban 4-leg with minor-road STOP control
MN -435 029 019 099 57 333 58870 81000
255 Urban 4-leg with all-way STOP control
MN -1002 127 -022 089 248 41 25300 6803
256 Urban 4-leg with signal control
MN -511 049 016 03 295 418 75000 81000
ITT Corporation 2008
21
The study examined the impact of two left turn priority treatments which were flashing advanced green (FAG) and left turn green arrow (LTGA) on left turn collisions These treatments were implemented at 35 intersections in the city of Toronto Two types of collisions were investigated left turns with and without side impact The results indicated that there was an insignificant difference in the impact of the left turn priority treatments on both types of crashes
Lord and Persaud (2003) conducted a study that related SPFs to transportation planning models They noted that traffic safety is not usually accounted for when agencies are conducting a planning analysis to remodel build upgrade or modify their facilities Five-year intersection data from Canada were used Models were developed and statistical measures such as the over dispersion parameter were calculated and conclusions were made from the results The SPFs developed for the study were applied to two sample networks created with the help of a transportation planning software package The research showed that it is possible to make estimation for traffic safety at the planning stage of a project This will allow users to take safety into consideration when designing and possibly create alternatives to change existing designs for more comprehensive projects or development The study also indicated that there are limitations when applying the SPFs to computerized transportation networks The study concluded that although it is possible to predict or estimate crashes on digital transportation networks the accuracy of prediction relies greatly on how precise the traffic flow estimates are
Jonsson et al (2007) performed an SPF study that took into consideration the type and severity of crashes andmdashmost importantmdashthe causal factors for these crashes The study was conducted for intersections on rural four-lane highways in the state of California Four collision types were tested in the study opposite-direction same-direction intersecting-direction and single-vehicle crashes In addition a set of data from the state of New York was used with the same parameters to analyze the severity distribution of crash types The data for California included 1084 intersections on four-lane rural highways and that from New York included 675 intersections mainly stop controlled or without any control Generalized linear modeling was performed with the data after quality analysis Two model forms were estimated with the variables seen in Equations 29 and 30
(Eq 29)
(Eq 30)
where NAcc = predicted number of crashesyr at intersections AADTmajor = AADT on major road AADTminor= AADT traffic flow on minor road Βi = model parameters Xi = variables that describe the intersections (such as terrain lighting left turn number of though lanes and divided or undivided among others)
nn xxxormajorAcc exAADTxAADTN ββββββ ++++=
min4433021
nn xxxormajorAcc exAADTAADTN βββββ +++++=
min332201)(
22
The two different models are different representations of the traffic flow The first represents the AADT of major and minor roads as separate variables but in the second model they are represented as one variable by the sum of the major and minor roads AADTs Results showed that the first model performed better for the multiple-vehicle crashes and the second model fitted better for the single-vehicle crashes In addition the appropriate predictor variables differed depending on the crash type This study is also of interest as it incorporated additional parameters to those in the suggested SPFs now included in SafetyAnalyst and therefore could lead to possible future SPF research for the state of Virginia
Persaud and Nguyen (1998) conducted a study on signalized intersections in Ontario Canada They developed aggregate and disaggregate models to estimate safety performance of three- and four-leg intersections in which crash severity (injury and PDO) environmental class (semi-urban and rural) and time period (daily weekday morning peak and weekday afternoon peak) were considered in the analysis An important aspect of that study is that it supplemented the existing models used for estimating SPFs instead of replacing them because it took into consideration features that were generally not considered in the then existing developed models Two model levels were considered for the study Level 1 was based on the sum of AADTs for all approaches with separate estimates for rear-end right angle and turning movement crashes At this level the equations were adjusted for three- and four-leg intersections by crash severity for all combined impact types and also separately for the three major impact types which were angle rear-end and turning movement In addition models were further separated by time period (daily weekday morning and afternoon peak) and for four-leg intersections which were also classified by environment class such as semi-urban and rural Level 2 allowed estimates to be obtained for specific crash patterns that were defined by movements of the vehicles involved before collision and the same were estimated as a function of the flows that were relevant to each of the patterns For this level models were estimated for four-leg intersections for 12 multi-vehicle and three single-vehicle patterns that were described by the movements of involved vehicles before collision The developed models were intended to estimate the parameters P and d shown in Equations 31 and 33
The safety of the intersection was estimated using the long-term mean based on the EB approach The long term mean (m) was obtained by combining crash count (x) of an intersection in the most recent years (n) with the estimates of the expected annual number of crashes (P) as shown in Equation 31 W1 and W2 in Equations 31 through 33 represent the weights estimated from the mean and variance of the regression estimates
(Eq 31)
(Eq 32)
(Eq 33)
m =W1(x) +W2(P)
2dW
d nP=
+
1PW
d nP=
+
23
(Eq 34)
To estimate the variance of m the following formula was used
(Eq 35)
In Equations 32 through 35 P and d represent the fundamental parameters Two models were selected for SPFs For Level 1 and single-vehicle Level 2 (Eq 36) For multi-vehicle in Level 2 (Eq 37) where P = expected number of crashes of a given type α and β = regression parameters to be estimated S (Level 1) = sum of all entering flows for a given time period for Level 1 analysis S (Level 2) = sum of the daily through right or left turn flows for a given time period for Level 2 (single-vehicle) analysis S1 and S2 = AADTs for small and large flows for a specific crash pattern in Level 2 (multi-vehicle) analysis
The models in either level can be used in the EB procedure to provide estimates for intersections that need to be treated or for the evaluation of the effectiveness of safety countermeasures It should be noted that the quality of the estimates for the study was strongly related to how the parameters were selected and used in the SPFs and unlike other available road models the ones presented in this study can be separated by time period and crash pattern Persaud et al (2002) conducted a study to demonstrate the complexity involved in the calibration of crash prediction models or SPFs for urban intersections Toronto data for three- and four-leg signalized intersections were used to estimate the models for the study The performance of these models was then compared with other models from Vancouver and California The models from these places were recalibrated to fit Toronto by using the Interactive Highway Safety Design Model (IHSDM) and a calibration procedure as proposed by Harwood et al (2000) The results varied significantly and were also mixed The study noted that the calibration of models is not a simple task and due to the importance of the SPFs they must be properly calibrated Several things must be accounted for when performing this procedure in order to obtain good quality data analysis The first thing is to extract a large sample of high quality data A software or program to link all the traffic crash and road characteristics data must exist because the same is usually kept stored in different databases In addition several
2Pd
Var P=
2( )
d xVar m dnP
+=
+
P =αSβ
P =αS1β1 S2
β 2
24
years of crash data must be obtained in order to have a good amount of samples that account for variations The actual process of model calibration is complicated therefore careful attention must be paid when analyzing the same because of the importance of the outcomes of the study The authors of the study made an exploratory analysis and it revealed that the relationship between the crashes and each covariate should be described either by the power function or the gamma function for all intersection types to be analyzed Equations 38 through 40 are the selected model forms used in the study F1 = Power F2 = Gamma (Eq 38) F1 = Gamma F2 = Power (Eq 39) F1 = Power F2 = Power (Eq 40) where E (K) = expected annual number of crashes between 1990 and 1995 F1 F2 = average entering AADT of major and minor roads respectively for the period 1990 to 1995 α β1 β2 β3 β4 = coefficients to be estimated
An NB structure was used to analyze the models and the overdispersion parameter (γ) was analyzed using Equation 41
γ=
2)K(E)K(Var (Eq 41)
Variance increases as γ decreases therefore the value of γ can also be used to make a comparison for the goodness of fit of several models fitted to the same data The larger the value of γ the smaller the variance therefore a more accurate model is given The authors suggest that γ would be enough to calculate the goodness of fit index of any SPF but if one desires to know how accurate the prediction estimate is other measures should also be computed The authors suggested using R2
α as proposed by Miaou et al (1996) which is a dispersion parameter based R2 computed as shown in Equation 42
γγ
minus=αmin2 1R (Eq 42)
where γ = overdispersion parameter for calibrated model γmin = smallest possible overdispersion parameter
The authors suggested that a disaggregation by traffic volume is preferable than using
only a single calibration factor for that is what the IHSDM currently has A recommendation is made to account for safety variation in traffic conditions over time by calibrating the models every two to three years as suggested by Harwood et al (2000)
E(K) =αF1β1 F2
β 2e(β 3F2 )
E(K) =αF1β1 F2
β 2e(β 4 F1 )
E(K) =αF1β1 F2
β 2
25
The Illinois Department of Transportation and the University of Illinois Urbana-Champaign conducted a research study to develop and implement SPFs for road segments and intersections in Illinois (Tegge et al 2010) These SPFs were developed in a way suitable for easy implementation in SafetyAnalyst The crash data (number of crashes and crash severity) and roadway data (number of lanes traffic volume area type and functional class) were collected and used for development of the SPFs Seventeen peer groups were used for developing the SPFs for segments and eight for intersections The intersections peer groups were minor leg stop control all-way stop control signalized and undetermined for rural and urban segments separately The SPFs for segments were developed using NB distribution for crashes and Poisson distribution for intersections The SAS GENMOD procedure was used to develop the SPFs for a five-year analysis period from 2001 to 2005 The model form for the intersection SPFs is the same as that given in the SafetyAnalyst Userrsquos Manual The SPFs were also developed for different crash severities such as fatal crashes type A injury crashes type B injury crashes and fatal plus injury crashes The EB method was used to determine the sites with the higher PSIs Two analysis techniques were used to obtain the PSIs The first considered segments and intersections as individual elements and the second used the sliding window approach The site specific analysis treated each individual segment and intersection as a separate entity Each segment is then compared with every other segment instead of having them grouped together The sliding window approach defined a set length The window lengths were 025 mile and 1 mile for urban and rural segments respectively
The largest impact on crash frequency was found to be the AADT and was therefore the only variable modeled as a logarithm (lnAADT) By doing this the AADT accounted for most of the prediction whereas the rest of the variables refined the prediction further Other variables used included access control functional class lane width surface type area type speed limit and median type The study recommended that a multivariate analysis be conducted for such studies to show how certain variables could contribute to the crashes Other variables could include roadway lighting weather and pavement conditions and roadway geometry The study also concluded that knowledge of roadway characteristics that increase the risk of fatal or injury crashes will facilitate the setting up of safety criteria that can help engineers in the designing of safer roadways Further knowledge of driver behaviors that lead to fatal and severe injury crashes can facilitate the training of enforcement officers to identify these behaviors
The Colorado Department of Transportation (CDOT) (2009) conducted a study to develop SPFs for intersections in the state Their model form is the same as that in SafetyAnalyst The SPFs were developed for many categories based on the number of legs divided undivided rural and urban including urban four-lane divided signalized six-lane divided signalized urban three-leg signalized two-lane undivided unsignalized and urban three-leg unsignalized When a median or left-turn lane is present a roadway is considered divided The sites selected for the study reflected variability in traffic volume and geometry in order to have a diverse representation of intersections throughout the state SPFs were developed for total and for fatal plus injury crash types A five-year study period from 2000 through 2005 was used Crash and AADT data were collected for development of the SPFs CDOT used a NB error structure to develop the SPFs and the EB procedure to estimate the expected safety performance of an intersection site for different safety management purposes Overdispersion parameters were computed and used as a goodness of fit measure According to their data
26
overdispersion parameters indicated that their models provided a reasonable fit to the Colorado data
Results indicated that for signalized intersections roads with six lanes on major approaches have more collisions than those with four lanes on major approaches CDOT recommended that the SPFs should be recalibrated in the future using data from future years as crash frequencies may change over time because of a variety of issues The report also recommended that separate calibration factors should be developed for different regions and different topographies Research in Virginia
In Virginia two other similar studies have recently been published One by Garber et al (2010) for two-lane roads and another by Hamidi et al (2010) to identify high-crash sections on Virginiarsquos primary system by developing a planning-level methodology The study by Garber et al developed SPFs for two-lane segments of 1 mile or less and the study by Hamidi et al developed SPFs for longer segments of two-lane roads that can be used for corridor analysis
Evaluation of the Recommended Minnesota SPFs
Figures 3 through 6 show representative graphs that were used to visually examine how well the Virginia data fitted the suggested Minnesota SPFs Figures 3 and 4 are for urban four-leg signalized intersections and Figures 5 and 6 are for rural four-leg signalized intersections These graphs suggest that the Minnesota SPFs do not fully represent the Virginia data Tables 9 through 12 show the Freeman-Tukey R2
FT coefficients computed for the different Minnesota SPFs using the Virginia data The low Freeman-Tukey R2
FT coefficients obtained and the visual inspection of the graphs suggested that a better fit to the Virginia data could be obtained by developing specific Virginia SPFs using Virginia data It was therefore decided to develop specific SPFs for Virginia
0
2
4
6
8
10
12
14
0 20000 40000 60000 80000 100000 120000
AADT Major
Tota
l Cra
shes
Per
Yea
r
Minnesota VA Actual Observed
Minnesota Model
Figure 3 Total crashes per year vs major AADT for urban 4-leg signalized intersections
with minor AADT of 700
27
0
5
10
15
20
25
30
35
0 20000 40000 60000 80000 100000 120000
AADT Major
Tota
l Cra
shes
per
Yea
r
Minnesota VA Actual Observed
Minnesota Model
Figure 4 Total crashes per year vs major AADT for urban 4-leg signalized intersections
with minor AADT of 4500
0
2
4
6
8
10
12
14
0 20000 40000 60000 80000 100000 120000
AADT Major
Tota
l Cra
shes
Per
Yea
r
Minnesota VA Actual Observed
Minnesota Model
Figure 5 Total crashes per year vs major AADT for rural 4-leg signalized intersections with
minor AADT of 795
28
0
2
4
6
8
10
12
14
16
18
0 20000 40000 60000 80000 100000 120000
AADT Major
Tota
l Cra
shes
per
Yea
r
Minnesota VA Actual Observed
Minnesota Model
Figure 6 Total crashes per year vs major AADT for rural 4-leg signalized intersections with
minor AADT of 5000
Table 9 Minnesota SPFs for Urban FI Crashes and Corresponding R2FT Based
on Virginia Data
Intersection Type
Minnesota FI SPFs R2
FT Based on Virginia Urban FI Crash Data ()
Urban 4-Leg Signalized 032
Urban 4-Leg Minor Stop Control 008
Urban 3-Leg Signalized 026
Urban 3-LegMinor Stop Control 01
Table 10 Minnesota SPFs for Urban TOTAL crashes and Corresponding R2
FT Based on Virginia Data
Type of Intersection
Minnesota SPFs
R2FT Based on Virginia Urban Total
Crash Data ()
Urban 4-Leg Signalized 034
Urban 4-Leg Minor Stop Control 022
Urban 3-Leg Signalized 031
Urban 3-Leg Minor Stop Control 01
29
Table 11 Minnesota SPFs for Rural TOTAL Crashes and Corresponding R2FT
Based on Virginia Data
Type of Intersection
Minnesota SPFs R2
FT Based on Virginia Rural Total Crash Data ()
Rural 4-Leg Signalized 029
Rural 4-Leg Minor Stop Control 013
Rural 3-Leg Signalized 029
Rural 3-Leg Minor Stop Control -010
Table 12 Minnesota SPFs for Rural FI Crashes and Corresponding R2FT Based
on Virginia Data
Type of Intersection
Minnesota SPFs R2
FT Based on Virginia Rural FI Crash Data ()
Rural 4-Leg Signalized 018
Rural 4-Leg Minor Stop Control 010
Rural 3-Leg Signalized 018
Rural 3-Leg Minor Stop Control 001
Development and Evaluation of Specific Virginia SPFs
In keeping with the suggestion given in the Safety Analyst Userrsquos Manual the model form used to develop the intersection SPFs is given in Equation 4 as
1 2k e x MajAADT x MinAADTβ βα=
where
k = predicted crash frequency per intersection per year MajAADT = AADT on the major road (vehday) MinAADT = AADT on the minor road (vehday) α = intercept β1 = coefficient of mayor AADT β2 = coefficient of minor AADT
30
The statewide SPFs developed for Virginia are given in Tables 13 through 16 Due to lack of data the analysis for all-way stop intersections could not be undertaken These tables also give the Freeman-Tukey R2
FT coefficient for each of the Virginia SPFs and the corresponding Minnesota SPF and Freeman-Tukey R2
FT based on the Virginia data The R2FT coefficients
obtained indicate that the Virginia-specific SPFs fit the Virginia data better than the suggested Minnesota SPFs for all types of intersections and crash severity except those for FI crashes on urban three-leg signalized rural four-leg signalized and rural four-leg minor stop control intersections where the corresponding RFT
2 values are similar In Table 15 it can be seen that the Minnesota R2
FT value is negative for the rural three-leg minor stop control intersections The negative RFT
2 value is possible because these calculations were not performed on the same data points that were used to create the Minnesota SPFs (Miller 2009) Table 13 SPF Models for Urban TOTAL crashes and R2
FT results for Virginia Statewide (VDOT-maintained roads)
SPF model with TOTAL Crash values
R2FT TOTAL
Crash Data
Site Virginia Statewide Minnesota VA MN
Urban 4-Leg Signalized 056 034
Urban 4-Leg Minor Stop Control
032 022
Urban 3-Leg Signalized 037 031
Urban 3-Leg Minor Stop Control
023 010
Table 14 SPF Models for Urban FI crashes and R2
FT results for Virginia Statewide (VDOT-maintained roads)
SPF model with FI Crash values R2FT FI Crash Data ()
Site
Virginia Statewide Minnesota VA MN
Urban 4-Leg Signalized 041 032
Urban 4-Leg Minor Stop Control
019 008
Urban 3-Leg Signalized 026 026
Urban 3-Leg Minor Stop Control
013 010
31
Table 15 SPF Models for Rural TOTAL Crashes and R2FT Results for Virginia Statewide (VDOT-
maintained roads) SPF model with TOTAL Crash values R2
FT TOTAL Crash Data
Site
Virginia Statewide Minnesota VA MN
Rural 4-Leg Signalized 0321 0290
Rural 4-Leg Minor Stop Control
0167 0132
Rural 3-Leg Signalized 0305 0291
Rural 3-Leg Minor Stop Control
0104 -0102
Table 16 SPF Models for Rural FI crashes and R2
FT results for Virginia Statewide (VDOT-maintained roads) SPF model with FI Crash values R2
FT TOTAL Crash Data
Site
Virginia Statewide Minnesota VA MN
Rural 4-Leg Signalized 0181 0181
Rural 4-Leg Minor Stop Control
0098 0097
Rural 3-Leg Signalized 0170 0180
Rural 3-Leg Minor Stop Control
0048 0012
Figures 7 through 10 show visual representations of how well the Virginia SPFs fit the
Virginia data in comparison with the suggested Minnesota SPFs In general the Virginia SPFs tend to fit the Virginia data better than the Minnesota SPFs although both sets of SPFs tend to have similar fits at low volumes (AADTmajor lt 2000) except for the SPF for total crashes on urban four-leg signalized intersections shown in Figure 7 The primary reason the Minnesota SPFs do not fit the Virginia data as well as the Virginia SPFs may be the dissimilarities of the roadside environment and the characteristics of the different databases
32
0
2
4
6
8
10
12
14
0 20000 40000 60000 80000 100000 120000
AADT Major
Tota
l Cra
shes
Per
Yea
r
Minnesota VA Actual Observed Virginia
Minnesota Model
Virginia M odel
Figure 7 Total crashes per year vs major AADT for urban 4-leg signalized intersections
with minor AADT of 700
0
5
10
15
20
25
30
35
0 20000 40000 60000 80000 100000 120000
AADT Major
Tota
l Cra
shes
per
Yea
r
Minnesota VA Actual Observed Virginia
Minnesota Model
Virginia Model
Figure 8 Total crashes per year vs major AADT for urban 4-leg signalized intersections
with minor AADT of 8000
33
0
2
4
6
8
10
12
14
0 20000 40000 60000 80000 100000 120000
AADT Major
Tota
l Cra
shes
Per
Yea
r
Minnesota VA Actual Observed Virginia
Virginia Model
Minnesota Model
Figure 9 Total crashes per year vs major AADT for rural 4-leg signalized intersections with
minor AADT of 79
0
5
10
15
20
25
0 20000 40000 60000 80000 100000 120000
AADT Major
Tota
l Cra
shes
per
Yea
r
Minnesota VA Actual Observed Virginia
Minnesota Model
Virginia Model
Figure 10 Total crashes per year vs minor AADT for rural 4-leg signalized intersections with major AADT of 5000
As discussed in the Methodology section in addition to the statewide Virginia SPFs
specific SPFs were developed for each operational region to consider the different topographical characteristics that exist across Virginia The complete set of SPFs together with the associated p values for the regression coefficients are shown in Tables A-1 and A-2 of Appendix A All p values are less than 005 with most being less than 00001 except for some of the rural four-leg signalized intersections regional specific SPFs These p values indicate that the estimated coefficients are statistically significant at the 95 confidence level or better A possible reason
34
for higher p values for a small number of SPFs may be the sample size used for developing these SPFs
To test the transferability and fit of the Virginia statewide specific SPFs several
statistical parameters were determined for the 70 (estimation) data set and the 30 (validation) data set separately The corresponding values for each of these parameters were then compared The results are shown in Tables 17 and 18 for urban and rural intersections respectively The results for the regional SPFs are shown in Tables A-3 through A-8 of Appendix A The results indicate that the developed models are transferable to the 30 validation data set For example the MSE values for the 70 estimation data are similar to the MSPE values for the 30 validation data In addition the mean prediction bias MPB values for the 30 validation data are close to zero (-076 le MPB ge -0004) in Table 17 and (-0067 le MPB ge 00513) in Table 18
Table 17 Goodness of Fit Results for Urban Statewide SPFs
Data Estimation data 70 Validation Data 30 Subtype Site MSE r2 R2
FT MPB MAD MSPE R2FT
Total VA 41150 0529 0557 -0760 4329 38490 0575
Total MN
68636 0506 0336 -3145 5421 68156 0315
FI VA
7043 0385 0406 -0458 1938 7671 0475
Urban 4-Leg Signalized
FI MN 7702 0372 0324 -0316 2124 8981 0376
Total VA 2238 0315 0313 -0034 0897 2383 0292
Total MN 2510 0287 0215 0091 0982 2730 0182
FI VA 0530 0194 0193 -0004 0432 0533 0194
Urban 4-Leg Minor Stop Control
FI MN 0560 0182 0080 0128 0522 0577 0052
Total VA 24900 0375 0370 -0645 3519 27591 0369
Total MN 29322 0365 0308 -2238 3661 33079 0272
FI VA 4467 0275 0259 -0185 1527 4875 0262
Urban 3-Leg Signalized
FI MN 4528 0267 0261 -0294 1526 4937 0261
Total VA 1854 0254 0230 -0043 0893 2038 0239
Total MN 2388 0237 0104 -0541 0902 2600 0107
FI VA 0428 0151 0133 -0021 0431 0476 0157
Urban 3-Leg Minor Stop Control
FI MN 0478 0140 0097 -0184 0385 0537 0104
35
Table 18 Goodness of Fit Results for Rural Statewide SPFs
Data Estimation Data 70
Validation Data 30
Subtype Site MSE r2 R2FT MPB MAD MSPE R2
FT
Total VA 10990 0353 0321 0513 2210 10070 -0073
Total MN 12400 0339 0290 -0154 2071 8460 0035
FI VA 2350 0196 0181 0045 1189 2600 -0034
Rural 4-Leg Signalized
FI MN 2400 0188 0181 -0043 1164 2420 0004
Total VA 1090 0182 0167 -0067 0794 1190 0171
Total MN 1190 0167 0132 -0348 0774 1320 0115
FI VA 0480 0112 0098 -0022 0504 0530 0110
Rural 4-Leg Minor Stop Control
FI MN 0500 0104 0097 -0158 0459 0560 0093
Total VA 5490 0328 0305 -0010 1651 5760 0179
Total MN NA NA NA NA NA NA NA
FI VA 1450 0181 0170 -0041 0902 1710 0099
Rural 3-Leg Signalized
FI MN NA NA NA NA NA NA NA
Total VA 0690 0144 0104 -0008 0613 0730 0102
Total MN 0890 0141 -0102 -0404 0555 0940 -0104
FI VA 0250 0071 0048 -0009 0345 0260 0048
Rural 3-Leg Minor Stop Control
FI MN 0270 0068 0012 -0144 0270 0290 0003
Pruning of Virginia-Specific SPFs A total of 64 SPFs were initially developed using the appropriate data for Virginia as shown in Tables A-1 and A-2 of Appendix A Considering that not all regional models might be necessary the pruning process described in the methodology section was carried out to prune the number of SPFs to the minimum effective number as seen in Tables 19 and 20 for urban and rural intersections respectively The pruning process resulted in 19 SPFs for urban sites and 15 for rural sites To facilitate the use of the correct SPF for a specific type of intersection located in a specific region the lists of the appropriate SPFs to be used are given in Tables B-1 and B-2 of Appendix B for the urban and rural intersections respectively
As can be seen in Tables 19 and 20 and Tables A-1 and A-2 of Appendix A there are some trends worth discussing for the benefit of the study and possible future research With regards to the three different operational regions the Western region retained many more of the specific regional urban SPFs than any other region For example the Western regional SPFs were retained for all urban intersection sites whereas for the Eastern region the only SPFs
36
retained were those for urban four-leg signalized FI crashes and urban four-leg minor stop control for total and FI crashes Similarly the only urban SPF retained for the Northern region was that for urban four-leg minor stop control for total crashes For the rural intersection sites all of the Western regional SPFs were retained except those for rural three-leg signalized total and FI crashes and rural four-leg minor stop control FI crashes The majority of the Eastern region rural SPFs were discarded except those for rural four-leg signalized total and FI crashes while for the Northern region all regional SPFs were discarded
The Western region retained more specific regional SPFs than the other two regions This suggests that the intersections in the Western region exhibit more unique characteristics than those for the other regions This may be due to the more mountainous terrain in the Western region compared to those in the Eastern and Northern regions This supports the philosophy of developing specific SPFs based on the topography of different regions
Site Prioritization
To illustrate the benefits of using the EB method to prioritize intersection sites for safety
improvements the top 25 urban sites from the Bristol and Northern Virginia districts were identified by using crash rates critical crash ratio and the EB method The PSI for each site identified was then determined The results obtained are shown in Tables 21 and 22 for the Bristol and the Northern Virginia districts respectively The results indicate that for the Northern Virginia District the PSIs for the top 25 sites are 258 1317 and 27440 crashes per year and for the Bristol District 432 646 and 1496 crashes per year for the crash rates critical crash ratio and EB methods respectively The important thing in Tables 21 and 22 is the sum of the PSI columns ranked by the three methods The sum of each of the PSIs for the crash rate and critical crash ratio method is lower than that for the EB method These results suggest that the use of the EB method in the planning process will identify intersection sites with the highest PSIs and therefore where detailed assessments to determine feasible and effective safety treatments should be undertaken
37
Table 19 MSPE Values for Virginia Urban Statewide and Urban Regional SPFs Used for Pruning
Data Pruning
Subtype
Site
MSPE [MSPEVA-
MSPEOR]1 [abs(MSPEVA-
MSPEOR)]2 [abs(MSPEVA-
MSPEOR)MSPEVA]3
RetainDiscardTotal VA 3849 Northern 4486 -637 637 0165497532 Discard Western 1791 2058 2058 0534684334 Retain Eastern 3745 104 104 0027020005 Discard FI VA 7671 Northern 95 -1829 1829 0238430452 Discard Western 517 2501 2501 0326033112 Retain
Urban 4-Leg Signalized
Eastern 541 2261 2261 0294746448 Retain Total VA 23834 Northern 202 03634 03634 015247126 Retain Western 105 13334 13334 0559452882 Retain Eastern 115 12334 12334 0517496014 Retain FI VA 05327 Northern 048 00527 00527 0098929979 Discard Western 033 02027 02027 0380514361 Retain
Urban 4-Leg Minor Stop Control
Eastern 036 01727 01727 0324197485 Retain Total VA 275911 Northern 2687 07211 07211 0026135239 Discard Western 2441 31811 31811 0115294425 Retain Eastern 3878 -111889 111889 0405525695 Discard FI VA 48754 Northern 448 03954 03954 0081101038 Discard Western 339 14854 14854 0304672437 Retain
Urban 3-Leg Signalized
Eastern 586 -09846 09846 020195266 Discard Total VA 20379 Northern 219 -01521 01521 0074635654 Discard Western 164 03979 03979 0195250012 Retain Eastern 223 -01921 01921 0094263703 Discard FI VA 04756 Northern 05 -00244 00244 0051303616 Discard Western 038 00956 00956 0201009251 Retain
Urban 3-Leg Minor Stop Control
Eastern 05 -00244 00244 0051303616 Discard 1 Difference between mean square prediction error (MSPE) of Virginia statewide model and OR model 2 Absolute value of the difference between Virginia statewide model MSPE and operational region model MSPE 3 Absolute value of the difference between Virginia statewide model MSPE and operational region model MSPE divided by the Virginia statewide MSPE for comparison
Retained SPFs Discarded if value is negative Discarded if less than 01
38
Table 20 MSPE Values for Virginia Rural Statewide and Rural Regional SPFs Used for Pruning Data Pruning
Subtype
Site
MSPE
[MSPEVA-MSPEOR]1
[abs(MSPEVA-MSPEOR)]2
[abs(MSPEVA-MSPEOR)MSPEVA]3
RetainDiscard
Total VA 1007 Northern 3422 -2415 2415 2398212512 Discard Western 605 402 402 0399205561 Retain Eastern 512 495 495 0491559086 Retain FI VA 26 Northern 976 -716 716 2753846154 Discard Western 159 101 101 0388461538 Retain
Rural 4-Leg Signalized
Eastern 137 123 123 0473076923 Retain Total VA 119 Northern 164 -045 045 0378151261 Discard Western 102 017 017 0142857143 Retain Eastern 114 005 005 0042016807 Discard FI VA 053 Northern 052 001 001 0018867925 Discard Western 048 005 005 0094339623 Discard
Rural 4-Leg Minor Stop Control
Eastern 049 004 004 0075471698 Discard Total VA 576 Northern 1475 -899 899 1560763889 Discard Western 674 -098 098 0170138889 Discard Eastern 626 -05 05 0086805556 Discard FI VA 171 Northern 212 -041 041 0239766082 Discard Western 403 -232 232 1356725146 Discard
Rural 3-Leg Signalized
Eastern 157 014 014 0081871345 Discard Total VA 073 Northern 093 -02 02 0273972603 Discard Western 053 02 02 0273972603 Retain Eastern 069 004 004 0054794521 Discard FI VA 026 Northern 03 -004 004 0153846154 Discard Western 023 003 003 0115384615 Retain
Rural 3-Leg Minor Stop Control
Eastern 027 -001 001 0038461538 Discard 1 Difference between mean square prediction error (MSPE) of Virginia statewide model and OR model 2 Absolute value of the difference between Virginia statewide model MSPE and operational region model MSPE 3 Absolute value of the difference between Virginia statewide model MSPE and operational region model MSPE divided by the Virginia statewide MSPE for comparison
Retained SPFs Discarded if value is negative Discarded if less than 01
39
Table 21 PSIs for Top 25 Sites in District 1 Urban (Bristol) FI
Crashes Ranking Based on Crash
Rates Ranking Based on Crash Ratio Ranking Based on EB
Method
Rank Intersection Node
Crash Rate1 PSI2 Intersection
Node Crash Ratio3 PSI Intersection
Node PSI
1 596726 22112 00000 651193 39672 00000 596095 21413
2 606469 20079 00000 606238 39298 06297 596393 08787
3 706818 12504 00000 651075 31264 00000 651130 08453
4 651193 11550 00000 596726 29227 00000 596701 07112 5 651075 09369 00000 606469 28039 00000 651802 06929 6 606238 08382 06297 651233 25831 03612 636331 06726 7 651807 07089 00000 651130 22718 08453 596395 06579 8 651233 06068 03612 706818 22555 00000 596937 06415 9 651230 05990 00000 651230 20301 00000 606238 06297
10 651783 05756 00000 651210 18882 04747 661033 06061 11 636093 04960 00000 636331 17913 06726 596372 05417 12 651274 04475 00000 651807 16847 00000 636372 04808 13 651130 04179 08453 651805 15814 00000 651210 04747 14 651210 03918 04747 651223 15627 03589 636491 04649 15 636331 03393 06726 651783 15009 00000 596420 04633 16 651223 03363 03589 596095 14865 21413 596403 04579 17 606232 03331 00000 636405 14769 00000 651603 04531 18 651127 03053 00000 661033 14555 06061 636056 04351 19 651999 03048 00000 596353 14215 03717 712033 04110 20 596449 02962 00000 636093 13782 00000 704691 04102 21 636405 02811 00000 651879 13192 00000 651838 04100 22 651883 02698 00000 651274 12975 00000 651894 03878 23 596353 02686 03717 651127 12972 00000 596353 03717 24 651805 02663 00000 651999 12959 00000 651233 03612 25 661033 02500 06061 596449 12702 00000 651889 03601
sum 43202 sum 64615 sum 149606 1Number of crashes per year per 1000000 total approach volume 2Potential for safety improvement (crashes yr) the difference between the EB-adjusted long-term crashes and the SPF-estimated crashes 3Ratio of actual crash rate to critical crash rate
40
Table 22 PSIs for Top 25 Sites in District 9 Urban (Northern Virginia District) FI
Crashes Ranking Based on Crash
Rates Ranking Based on Crash Ratio Ranking Based on EB
Method
Rank Intersection Node
Crash Rate1 PSI2 Intersection
Node Crash Ratio3 PSI Intersection
Node PSI
1 718192 191841 00000 718192 257523 00000 264119 150122 2 702946 178194 00000 547722 152371 11175 263375 140091 3 271531 64846 00000 263628 102794 00000 278648 137239 4 263628 52858 00000 263728 100092 00000 276819 131395 5 263728 42215 00000 719754 95274 09444 263290 130743 6 266955 35294 00000 702946 79268 00000 722678 127897 7 547722 34932 11175 263403 77252 05184 264725 118671 8 702612 30441 00000 704237 77175 07648 267028 116627 9 273886 29539 00000 263729 74681 00000 265204 115925
10 716747 27632 00000 271531 72327 00000 274766 115679 11 263626 27139 00000 263135 66458 18068 263249 113372 12 269485 26567 00000 716747 64461 00000 547044 110769 13 728954 26344 00000 266955 56657 00000 549349 107180 14 263729 25208 00000 546138 52003 31028 268210 105630 15 546988 21922 00000 547544 51924 32529 263347 104257 16 274338 21446 00000 263626 50389 00000 276351 102313 17 429308 21354 00000 269485 49897 00000 428167 100064 18 720401 21197 00000 728954 49702 00000 264344 98789 19 267295 20954 00000 548686 49572 03621 277764 91554 20 267536 20874 00000 711601 47985 04440 263467 89259 21 265938 20484 00000 266970 47730 00000 263090 89199 22 273354 20108 00000 546462 46856 03620 703414 88610 23 268345 19362 00000 265938 46726 00000 428629 87379 24 719754 19073 09444 720401 44833 00000 272219 85659 25 263403 19015 05184 728496 43666 04990 428544 85610
Sum 25803 sum 131747 sum 2744033 1Number of crashes per year per 1000000 total approach volume 2Potential for safety improvement (crashes yr) the difference between the EB-adjusted long-term crashes and the SPF-estimated crashes 3Ratio of actual crash rate to critical crash rate
41
CONCLUSIONS
bull The development of SPFs for intersections is necessary for Virginia because the SafetyAnalyst-suggested SPFs which are based on Minnesota data do not represent the Virginia data well Regarding the fit of the SPFs to Virginia data the R2
FT values shown in Tables 13 through 16 for Minnesota and Virginia indicate that the Virginia-specific SPFs fit the Virginia data better than the Minnesota models This may be due to the dissimilarities of the roadside environment such as difference in topography and the characteristics of the different Virginia and Minnesota databases
bull In some cases the specific regional SPFs fit the regional data better than the statewide
SPFs suggesting that the specific SPFs should be considered for use when available These group divisions that have similar roadway characteristics and driver expectations in some cases tend to improve the fit
bull In identifying intersection sites for safety improvements it is clearly beneficial for the EB
method to be used with the suitable SPFs rather than a crash rate or critical ratio method Results of the site prioritization show a much higher potential for crash reduction when the EB method is used with the appropriate SPFs rather than a procedure based on crash rates or critical rates
RECOMMENDATIONS
1 VDOTrsquos TED should use the Virginia-specific SPFs when using the SafetyAnalyst tools The results of this study have shown that the Virginia-specific SPFs reflected the Virginia data better than the SafetyAnalyst-recommended Minnesota SPFs
2 VDOTrsquos TED should investigate the feasibility of using multiple SPFs in SafetyAnalyst If
feasible regional SPFs should be used If it is not currently feasible to use multiple SPFs VDOTrsquos TED should ask that the FHWA include regional information in SafetyAnalyst so as to allow the use of regional SPFs For the specific regional SPFs to be applied to Virginia and other states the SafetyAnalyst tool should be capable of incorporating the necessary data that support the regional models
3 As soon as it is feasible to use regional SPFs VDOTrsquos TED should use the 19 SPFs
developed for urban intersections and the 15 developed for rural intersections when using the tools in SafetyAnalyst Although the statewide SPFs are available for use by an analyst the specific regional models included in the final set of SPFs will predict crashes better than the statewide SPFs The regional analysis will not only ease the use of specific regional SPFs but will also be of benefit when predicting the potential for safety improvement of a specific site
4 For future similar SPF studies VDOTrsquos TED should be directly involved in screening the
traffic data for accuracy and consistency as was done in this study The direct involvement of the TED in the screening of the traffic data significantly contributed to the accuracy of the
42
data and greatly contributed to the confidence the researchers place on the data used in the study
5 The Virginia Transportation Research Council (VTRC) should conduct a study as soon as
feasible to verify whether incorporating independent variables for which data are available other than AADT such as intersection geometry and other characteristics will result in SPFs that better fit the Virginia data Although the currently suggested SafetyAnalyst SPFs use only the AADTs as the independent variables it is likely that provision will be made for use of SPFs that incorporate other independent variables such as number of approaches entering lanes and the other variables for which data are available as these SPFs are likely to give better fit to crash data
6 As soon as feasible VTRC should undertake a study to develop SPFs for the urban system
intersections which are not currently maintained by VDOT as these intersections may have different crash characteristics than those maintained by VDOT This would facilitate the use of SafetyAnalyst in programming sites that are currently not being maintained by VDOT
BENEFITS AND IMPLEMENTATION PROSPECTS
Significant benefits will be accrued by the use of the Virginia-specific SPFs developed in this study This is clearly illustrated in two ways First in examining the transferability of the suggested SPFs in SafetyAnalyst it is clear that these SPFs do not fit the Virginia data very well The results also indicate that the Virginia-specific SPFs fit the Virginia data much better than the suggested SafetyAnalyst SPFs Second the availability of the Virginia-specific SPFs will enhance the use of the EB procedure given in SafetyAnalyst for prioritizing sites for safety improvements This study has also shown that the EB method better identifies sites with higher potential for crash reduction than those identified by crash rates For example the illustrated examples given for the Bristol and Northern Virginia districts show that the potential reduction in FI crashes when the top 25 sites are identified by the EB method is 28936 (1496 + 27440) crashes per year whereas that obtained when the critical crash ratio method is used for prioritization is only 1963 (646 + 1317) and that obtained with the crash rate method is only 690 (432 + 258) crashes per year This gives a net benefit of 26973 potential crashes per year compared to the critical crash ratio method and 28246 compared to the crash rate method Assuming an average cost of FI crashes of $95629 (FHWA 2005) and only 10 of the estimated net benefit PSI of 28246 crashes per year is achieved the total savings of more than $27 million per year could be accrued The prospects for implementation of the recommendations are very high as the study was requested by VDOTrsquos TED which is planning to incorporate these SPFs in the use of the tools provided in SafetyAnalyst
43
ACKNOWLEDGMENTS
The authors appreciate the opportunity afforded them by VDOT and VTRC to conduct this study Special thanks to Stephen Read (VDOT) Dr In-Kyu Lim (VDOT) Dr Young-Jun Kweon (VTRC) and VDOTrsquos Central Office for their interest and support in SPFs and their help in the selection of intersection sites Many thanks to Lewis Woodson (VTRC) and James Hill (University of Virginia) for all their help and input throughout the study
REFERENCES Cogburn P VDOT Interagency Coordination 2007 Virginia Emergency Management
Conference Virginia Department of Transportation Richmond April 2007 Colorado Department of Transportation DTD Applied Research and Innovation Branch Safety
Performance Functions for Intersections CDOT-2009-10 Denver December 2009 Fridstroslashm L Ifver J Ingebrigtsen S Kulmala R and Thomsen LK Measuring the
Contribution of Randomness Exposure Weather and Daylight to the Variation in Road Accidents Counts Accident Analysis and Prevention Vol 27 No 1 1995 pp 1-20
Federal Highway Administration Cost of Crashes by Severity Table FHWA-HRT-05-051
Washington DC 2005 Federal Highway Administration SafetyAnalyst Home Page httpwwwsafetyanalystorg
Accessed February 2010 Garber N and Hoel L Traffic amp Highway Engineering 4th ed Cenage Learning Toronto
Canada 2009 Garber NJ Haas PR and Gosse C Development of Safety Performance Functions for Two-
Lane Roads Maintained by the Virginia Department of Transportation VTRC 10-R25 Virginia Transportation Research Council Charlottesville 2010
Hamidi A Fontaine MD and Demetsky MJ A Planning-Level Methodology for Identifying
High-Crash Sections of Virginiarsquos Primary System VTRC 11-R4 Virginia Transportation Research Council Charlottesville 2010
Harwood D Council FM Hauer E Hughes WE and Vogt A Prediction of the Expected
Safety Performance of Rural Two-lane Highways Federal Highway Administration McLean VA December 2000
Harwood DW Bauer KM Richard KR Gilmore DK Persaud B and Lyon C
Development of SPFs for Safety Analyst Interim Tools Technical Memorandum
44
Prepared by Midwest Research Institute for the Federal Highway Administration McLean VA 2004
ITT Corporation SafetyAnalyst Userrsquos Manual Turner-Fairbank Highway Research Center
McLean VA 2008 Jonsson T Ivan J and Zhang C Crash Prediction Models for Intersections on Rural
Multilane Highways Differences by Collision Type In Transportation Research Record Journal of the Transportation Research Board No 2019 Transportation Research Board of the National Academies Washington DC 2007 pp 91-98
Kweon Y-J and Lim I-K Appropriate Regression Model Types for the Empirical Bayes
Method and SafetyAnalyst In Proceedings of the 89th Annual Meeting of the Transportation Research Board Transportation Research Board of the National Academies Washington DC 2010
Kononov J Bailey B and Allery B Exploratory Examination of the Functional Form of
Safety Performance Functions of Urban Freeways Colorado Department of Transportation and San Diego State University Denver CO 2008
Lyon C Haq A Persaud B and Kodama S Safety Performance Functions for Signalized
Intersections in Large Urban Areas Development and Application to Evaluation of Left-Turn Priority Treatment In Transportation Research Record Journal of the Transportation Research Board No 1908 Transportation Research Board of the National Academies Washington DC 2005 pp 165-171
Lord D and Persaud B Estimating the Safety Performance of Urban Road Transportation
Networks Center for Transportation Safety Texas Transportation Institute Texas AampM University and Department of Civil Engineering Ryerson University College Station TX 2003 pp 609-620
Miaou S-P Lu A and Lum H S Pitfalls of using R2 to Evaluate Goodness of Fit of
Accident Prediction Models In Transportation Research Record Journal of the Transportation Research Board No 1542 Transportation Research Board of the National Academies Washington DC 2005 1996 pp 6-13
Miller P Re Negative R squared Email Archive Division of Biostatistics Washington
University in St Louis February 2 2005 February 2 2005 httpwwwbiostatwustleduarchiveshtmljmp-l2005msg00075html Accessed February 2010
Persaud B Lord D and Palmisano J Calibration and Transferability of Accident Prediction
Models for Urban Intersections In Transportation Research Record Journal of the Transportation Research Board No 1784 Transportation Research Board of the National Academies Washington DC 2002 pp 57-64
45
Persaud B and Nguyen T Disaggregate Safety Performance Models for Signalized Intersections on Ontario Provincial Roads In Transportation Research Record Journal of the Transportation Research Board No 1635 Transportation Research Board of the National Academies Washington DC 1998 pp 113-120
Pham T and Ragland D Summary of Crash Prediction Models Also known as Safety
Performance Functions (SPFs) California Partners for Advanced Traffic and Highways and University of California Berkeley Berkeley 2005
SAS Institute Inc SAS OnlineDoc Version Eight Cary NC
httpwwwtecnionacildocssasril Accessed 2009 Tegge RA Jo J-H and Ouyang Y Development and Application of Safety Performance
Functions for Illinois ICT-10-066 Illinois Center for Transportation University of Illinois Urbana-Champaign March 2010
Virginiarsquos Surface Transportation Safety Executive Committee Commonwealth of Virginiarsquos
Strategic Highway Safety Plan 2006-2010 Virginia Department of Transportation Richmond 2006
Washington S Persaud B Lyon C and Oh J Validation of Accident Models for
Intersections FHWA-RD-03-037 Federal Highway Administration McLean VA 2005
46
47
APPENDIX A
STATISTICAL PARAMETERS AND GOODNESS-OF-FIT RESULTS
Table A-1 Statistical Parameters for Urban Intersections SPFs Parameter Estimates
Data Intercept
Coefficient of Mayor AADT
Coefficient of Minor AADT
Subtype Site Intercept (α)
StndError
P value
lnMajor (β1)
StndError
P value
lnMinor (β2)
StndError
P value
Total VA -76234 048 lt0001 06742 005 lt0001 03453 003 lt0001
OR1 -83067 056 lt0001 07522 005 lt0001 0328 003 lt0001OR10 -123913 122 lt0001 10631 013 lt0001 04567 006 lt0001OR 100 -88553 077 lt0001 07825 007 lt0001 03706 004 lt0001FI VA -85256 057 lt0001 06477 006 lt0001 03579 004 lt0001OR1 -96546 063 lt0001 07603 006 lt0001 03597 004 lt0001OR10 -114284 15 lt0001 08662 016 lt0001 04412
Urban 4-Leg Signalized
OR 100 -99582 100 lt0001 07484 009 lt0001 04017 005 lt0001Total VA -60723 022 lt0001 04558 002 lt0001 0347 004 lt0001
OR1 -6059 044 lt0001 0505 004 lt0001 02773 006 lt0001OR10 -67031 057 lt0001 03986 007 lt0001 04999 009 lt0001OR 100 -65388 032 lt0001 04689 004 lt0001 043 006 lt0001FI VA -76917 032 lt0001 05001 003 lt0001 03695 005 lt0001OR1 -81437 060 lt0001 05813 005 lt0001 03188 008 lt0001OR10 -80333 063 lt0001 03446 007 lt0001 06218 010 lt0001
Urban 4-Leg Minor Stop Control
OR 100 -83166 051 lt0001 05253 006 lt0001 04695 008 lt0001Total VA -6543 082 lt0001 06591 008 lt0001 02119 002 lt0001
OR1 -4999 103 lt0001 05555 009 lt0001 01554 003 lt0001OR10 -96143 127 lt0001 08677 012 lt0001 03297 005 lt0001OR 100 -67518 110 lt0001 06157 011 lt0001 02969 005 lt0001FI VA -84268 068 lt0001 07147 006 lt0001 02481 002 lt0001OR1 -73982 099 lt0001 06496 009 lt0001 02088 003 lt0001OR10 -110104 155 lt0001 0908 015 lt0001 03226 006 lt0001
Urban 3-Leg Signalized
OR 100 -7266 107 lt0001 05508 011 lt0001 03107 006 lt0001Total VA -54696 013 lt0001 04874 002 lt0001 01985 001 lt0001
OR1 -5361 018 lt0001 04959 002 lt0001 01676 002 lt0001OR10 -5773 034 lt0001 04877 003 lt0001 02314 004 lt0001OR 100 -51642 021 lt0001 04338 003 lt0001 02309 003 lt0001FI VA -74642 018 lt0001 05791 002 lt0001 02091 002 lt0001OR1 -76877 027 lt0001 06204 003 lt0001 0181 002 lt0001OR10 -69458 047 lt0001 05096 004 lt0001 02212 005 lt0001
Urban 3-Leg Minor Stop Control
OR 100 -69883 031 lt0001 05169 004 lt0001 02308 003 lt0001 Standard Error
48
Table A-2 Statistical Parameters for Rural Intersections SPFs Parameter Estimates
Data Intercept
Coefficient of Mayor AADT
Coefficient of Minor AADT
Subtype Site Intercept (α)
StndError
P value
lnMajor (β1)
Stnd Error
P value
lnMinor (β2)
Stnd Error
P value
Total VA -69589 118 lt0001 06746 009 lt0001 0253 009 00047
OR1 -1604 237 04974 02284 021 02791 01514 012 0211 OR10 -63951 183 00005 05508 014 00001 03106 014 00224 OR 100 -06468 220 07692 02262 016 01635 -00158 017 09274 FI VA -87116 128 lt0001 07839 011 lt0001 02166 009 0013 OR1 -33285 246 01767 03601 024 0126 00597 013 06478 OR10 -80583 175 lt0001 06809 018 00001 02557 013 0057
Rural 4-Leg Signalized
OR 100 -48381 221 00287 04243 018 00193 01523 018 03943 Total VA -5494 020 lt0001 03533 002 lt0001 03935 003 lt0001
OR1 -62351 058 lt0001 04167 006 lt0001 04507 008 lt0001OR10 -53594 028 lt0001 03379 003 lt0001 03998 004 lt0001OR 100 -51255 027 lt0001 02914 003 lt0001 04075 004 lt0001FI VA -66927 030 lt0001 03899 003 lt0001 04156 004 lt0001OR1 -82561 095 lt0001 05221 009 lt0001 04962 012 lt0001OR10 -70797 044 lt0001 03789 004 lt0001 0497 005 lt0001
Rural 4-Leg Minor Stop Control
OR 100 -63326 038 lt0001 03223 004 lt0001 04424 005 lt0001Total VA -75754 084 lt0001 06465 008 lt0001 03332 008 lt0001
OR1 -58798 220 00075 05076 020 00143 0313 013 00161 OR10 -64368 110 lt0001 0544 011 lt0001 02863 006 lt0001OR 100 -9899 139 lt0001 08047 015 lt0001 04386 006 lt0001FI VA -87112 103 lt0001 07224 010 lt0001 02578 006 lt0001OR1 -9219 260 00004 07258 022 00011 03407 016 00326 OR10 -88607 146 lt0001 07059 016 lt0001 02809 008 00009
Rural 3-Leg Signalized
OR 100 -111835 185 lt0001 08669 018 lt0001 03977 008 lt0001Total VA -43293 008 lt0001 03366 001 lt0001 02087 001 lt0001
OR1 -50904 022 lt0001 0406 002 lt0001 02752 003 lt0001OR10 -40969 009 lt0001 03133 001 lt0001 02001 001 lt0001OR 100 -4231 016 lt0001 02997 002 lt0001 02308 003 lt0001FI VA -53415 011 lt0001 03394 001 lt0001 02237 001 lt0001OR1 -64457 031 lt0001 04195 003 lt0001 0307 004 lt0001OR10 -50831 014 lt0001 03245 002 lt0001 02014 002 lt0001
Rural 3-Leg Minor Stop Control
OR 100 -51046 024 lt0001 03163 003 lt0001 02112 003 lt0001
Standard Error
49
Table A-3 SPFs Goodness of Fit Results for Urban Northern Operational Region (No 1)
Data Estimation Data 70 Validation Data 30
Subtype Site MSE r2 R2FT MPB MAD MSPE R2
FT
Total VA 41150 0529 0557 -0760 4329 38490 0575
Total R1 4110 051 0551 -020 464 4486 054
FI VA 704 038 0406 -046 194 767 048
Urban 4-Leg Signalized
FI R1 809 039 0439 012 214 950 038
Total VA 224 031 0313 -003 090 238 029
Total R1 308 028 0286 008 095 200 032
FI VA 053 019 0193 000 043 053 019
Urban 4-Leg Minor Stop Control
FI R1 064 018 0187 003 043 048 021
Total VA 2490 038 0370 -064 352 2759 037
Total R1 3034 032 0305 -015 365 2687 037
FI VA 447 028 0259 -019 153 488 026
Urban 3-Leg Signalized
FI R1 559 025 0231 004 157 448 029
Total VA 185 025 0230 -004 089 204 024
Total R1 208 026 0239 -006 094 219 026
FI VA 043 015 0133 -002 043 048 016
Urban 3-Leg Minor Stop Control
FI R1 047 017 0156 -001 044 050 017
50
Table A-4 SPFs Goodness of Fit Results for Urban Western Operational Region (No 10)
Data Estimation Data 70 Validation Data 30
Subtype Site MSE r2 R2FT MPB MAD MSPE R2
FT
Total VA 41150 0529 0557 -0760 4329 38490 0575
Total R10 21976 0777 0735 1290 3233 17910 0686
FI VA 7043 0385 0406 -0458 1938 7671 0475
Urban 4-Leg Signalized
FI R10 4280 0526 0500 0377 1597 5170 0452
Total VA 2238 0315 0313 -0034 0897 2383 0292
Total R10 1161 0361 0300 -0032 0740 1050 0188
FI VA 0530 0194 0193 -0004 0432 0533 0194
Urban 4-Leg Minor Stop Control
FI R10 0312 0197 0187 0000 0382 0330 0009
Total VA 24900 0375 0370 -0645 3519 27591 0369
Total R10 14446 0451 0397 -0168 2801 24410 0255
FI VA 4467 0275 0259 -0185 1527 4875 0262
Urban 3-Leg Signalized
FI R10 3077 0266 0216 0039 1258 3390 0115
Total VA 1854 0254 0230 -0043 0893 2038 0239
Total R10 1391 0233 0197 -0054 0800 1640 0207
FI VA 0428 0151 0133 -0021 0431 0476 0157
Urban 3-Leg Minor Stop Control
FI R10 0354 0111 0089 -0019 0404 0380 0125
51
Table A-5 SPFs Goodness of Fit Results for Urban Eastern Operational Region (No 100)
Data Estimation Data 70 Validation Data 30
Subtype Site MSE r2 R2FT MPB MAD MSPE R2
FT
Total VA 41150 0529 0557 -0760 4329 38490 0575
Total R100 31108 0632 0630 0243 4717 37450 0005
FI VA 7043 0385 0406 -0458 1938 7671 0475
Urban 4-Leg Signalized
FI R100 5201 0480 0454 -0098 1864 5410 0244
Total VA 2238 0315 0313 -0034 0897 2383 0292
Total R100 1720 0443 0381 0087 0758 1150 0003
FI VA 0530 0194 0193 -0004 0432 0533 0194
Urban 4-Leg Minor Stop Control
FI R100 0509 0273 0254 0049 0383 0360 0173
Total VA 24900 0375 0370 -0645 3519 27591 0369
Total R100 17782 0410 0410 -1753 0908 38780 0004
FI VA 4467 0275 0259 -0185 1527 4875 0262
Urban 3-Leg Signalized
FI R100 3194 0243 0263 -0615 1645 5860 0236
Total VA 1854 0254 0230 -0043 0893 2038 0239
Total R100 1561 0233 0210 -0127 0902 2230 0002
FI VA 0428 0151 0133 -0021 0431 0476 0157
Urban 3-Leg Minor Stop Control
FI R100 0387 0131 0116 -0043 0444 0500 0141
52
Table A-6 SPFs Goodness of Fit Results for Rural Northern Operational Region (No 1)
Data Estimation Data 70
Validation Data 30
Subtype Site MSE r2 R2FT MPB MAD MSPE R2
FT
Total VA 10990 0353 0321 0513 2210 10070 -0073
Total R1 20080 0118 0092 -1389 3661 34220 0212
FI VA 2350 0196 0181 0045 1189 2600 -0034
Rural 4-Leg Signalized
FI R1 2920 0057 0052 -1173 1931 9760 0028
Total VA 1090 0182 0167 -0067 0794 1190 0171
Total R1 1990 0190 0245 0001 0942 1640 0173
FI VA 0480 0112 0098 -0022 0504 0530 0110
Rural 4-Leg Minor Stop Control
FI R1 0920 0093 0112 0020 0541 0520 0009
Total VA 5490 0328 0305 -0010 1651 5760 0179
Total R1 11110 0182 0254 -0679 2271 14750 0497
FI VA 1450 0181 0170 -0041 0902 1710 0099
Rural 3-Leg Signalized
FI R1 3230 0131 0153 -0116 1006 2120 0355
Total VA 0690 0144 0104 -0008 0613 0730 0102
Total R1 1210 0245 0196 0030 0712 0930 0126
FI VA 0250 0071 0048 -0009 0345 0260 0048
Rural 3-Leg Minor Stop Control
FI R1 0340 0124 0093 0016 0366 0300 0052
53
Table A-7 SPFs Goodness of Fit Results for Rural Western Operational Region (No 10)
Data Estimation Data 70 Validation Data 30
Subtype Site MSE r2 R2FT MPB MAD MSPE R2
FT
Total VA 10990 0353 0321 0513 2210 10070 -0073
Total R10 6020 0311 0268 0007 1748 6050 0382
FI VA 2350 0196 0181 0045 1189 2600 -0034
Rural 4-Leg Signalized
FI R10 1880 0158 0139 0097 0945 1590 0254
Total VA 1090 0182 0167 -0067 0794 1190 0171
Total R10 1300 0196 0163 0070 0760 1020 0078
FI VA 0480 0112 0098 -0022 0504 0530 0110
Rural 4-Leg Minor Stop Control
FI R10 0560 0142 0118 0025 0495 0480 0014
Total VA 5490 0328 0305 -0010 1651 5760 0179
Total R10 3690 0163 0170 -0432 0748 6740 0039
FI VA 1450 0181 0170 -0041 0902 1710 0099
Rural 3-Leg Signalized
FI R10 0890 0124 0117 -0391 0997 4030 -0066
Total VA 0690 0144 0104 -0008 0613 0730 0102
Total R10 0640 0126 0091 0025 0583 0580 0055
FI VA 0250 0071 0048 -0009 0345 0260 0048
Rural 3-Leg Minor Stop Control
FI R10 0240 0062 0041 0003 0335 0230 0028
54
Table A-8 SPFs Goodness of Fit Results for Rural Eastern Operational Region (No 100)
Data Estimation Data 70 Validation Data 30
Subtype Site MSE r2 R2FT MPB MAD MSPE R2
FT
Total VA 10990 0353 0321 0513 2210 10070 -0073
Total R100 10120 0042 0027 1207 1882 5120 -0307
FI VA 2350 0196 0181 0045 1189 2600 -0034
Rural 4-Leg Signalized
FI R100 2060 0053 0039 0119 0962 1370 -0023
Total VA 1090 0182 0167 -0067 0794 1190 0171
Total R100 0960 0170 0149 -0086 0746 1140 0209
FI VA 0480 0112 0098 -0022 0504 0530 0110
Rural 4-Leg Minor Stop Control
FI R100 0440 0106 0092 -0031 0475 0490 0121
Total VA 5490 0328 0305 -0010 1651 5760 0179
Total R100 2770 0492 0459 0601 1759 6260 0090
FI VA 1450 0181 0170 -0041 0902 1710 0099
Rural 3-Leg Signalized
FI R100 1040 0265 0255 0124 0923 1570 -0055
Total VA 0690 0144 0104 -0008 0613 0730 0102
Total R100 0640 0125 0087 -0037 0601 0690 0119
FI VA 0250 0071 0048 -0009 0345 0260 0048
Rural 3-Leg Minor Stop Control
FI R100 0250 0064 0038 -0013 0345 0270 0062
55
APPENDIX B
RECOMMENDED SAFETY PERFORMANCE FUNCTION MODELS
Table B-1 Recommended Urban SPFs Site Virginia SPF Models to Be Used for Urban Intersections
Urban 4-Leg Signalized Total Virginia generic total
Urban 4-Leg Signalized
Operational Region 1 generic total
Urban 4-Leg Signalized
Operational Region 10
use specified model developed
Urban 4-Leg Signalized
Operational Region 100 generic total
Urban 4-Leg Signalized FI Virginia generic FI
Urban 4-Leg Signalized
Operational Region 1 generic FI
Urban 4-Leg Signalized
Operational Region 10
use specified model developed
Urban 4-Leg Signalized
Operational Region 100
use specified model developed
Urban 4-Leg Minor Stop Control
Total Virginia generic total
Urban 4-Leg Minor Stop Control
Operational Region 1
use specified model developed
Urban 4-Leg Minor Stop Control
Operational Region 10
use specified model developed
Urban 4-Leg Minor Stop Control
Operational Region 100
use specified model developed
Urban 4-Leg Minor Stop Control
FI Virginia generic FI e^-76917MajADT^05001MinADT^03695
Urban 4-Leg Minor Stop Control
Operational Region 1
use specified model developed
Urban 4-Leg Minor Stop Control
Operational Region 10
use specified model developed
Urban 4-Leg Minor Stop Control
Operational Region 100
use specified model developed
56
Table B-1 Recommended Urban SPFs (Continued)
Site Virginia SPF Models to Be Used for Urban Intersections
Urban 3-Leg Signalized
Total Virginia
use generic model developed for total
crashes
Urban 3-Leg Signalized
Operational Region 1
use generic model developed for total
crashes
Urban 3-Leg Signalized
Operational Region 10
use specific regional model
developed
Urban 3-Leg Signalized
Operational Region 100
use generic model developed for total
crashes
Urban 3-Leg Signalized FI Virginia
use generic model developed for FI
crashes
Urban 3-Leg Signalized
Operational Region 1
use generic model developed for FI
crashes
Urban 3-Leg Signalized
Operational Region 10
use specific regional model
developed
Urban 3-Leg Signalized
Operational Region 100
use generic model developed for FI
crashes
Urban 3-Leg Minor Stop Control
Total Virginia
use generic model developed for total
crashes
Urban 3-Leg Minor Stop Control
Operational Region 1
use generic model developed for total
crashes
Urban 3-Leg Minor Stop Control
Operational Region 10
use specific regional model
developed
Urban 3-Leg Minor Stop Control
Operational Region 100
use generic model developed for total
crashes
Urban 3-Leg Minor Stop Control
FI Virginia use generic model developed for FI
crashes
Urban 3-Leg Minor Stop Control
Operational Region 1
use generic model developed for FI
crashes
Urban 3-Leg Minor Stop Control
Operational Region 10
use specific regional model
developed
Urban 3-Leg Minor Stop Control
Operational Region 100
use generic model developed for FI
crashes
57
Table B-2 Recommended Rural SPFs Site Virginia SPF Models to Be Used for Rural Intersections
Rural 4-Leg Signalized Total Virginia
use generic model developed for total
crashes
Rural 4-Leg Signalized
Operational Region 1
use generic model developed for total
crashes
Rural 4-Leg Signalized
Operational Region 10
use specific regional model developed
Rural 4-Leg Signalized
Operational Region 100
use specific regional model developed
Rural 4-Leg Signalized FI Virginia use generic model
developed for FI crashes
Rural 4-Leg Signalized
Operational Region 1
use generic model developed for FI crashes
Rural 4-Leg Signalized
Operational Region 10
use specific regional model developed
Rural 4-Leg Signalized
Operational Region 100
use specific regional model developed
Rural 4-Leg Minor Stop Control Total Virginia
use generic model developed for total
crashes
Rural 4-Leg Minor Stop Control
Operational Region 1
use generic model developed for total
crashes e^-549MajADT^035MinADT^039
Rural 4-Leg Minor Stop Control
Operational Region 10
use specific regional model developed
Rural 4-Leg Minor Stop Control
Operational Region 100
use generic model developed for total
crashes
Rural 4-Leg Minor Stop Control FI Virginia use generic model
developed for FI crashes
Rural 4-Leg Minor Stop Control
Operational Region 1
use generic model developed for FI crashes
Rural 4-Leg Minor Stop Control
Operational Region 10
use generic model developed for FI crashes
Rural 4-Leg Minor Stop Control
Operational Region 100
use generic model developed for FI crashes
58
Table B-2 Recommended Rural SPFs (Continued)
Site Virginia SPF Models to Be Used for Rural Intersections
Rural 3-Leg Signalized Total Virginia use generic model
developed for total crashes
Rural 3-Leg Signalized
Operational Region 1
use generic model developed for total crashes
Rural 3-Leg Signalized
Operational Region 10
use generic model developed for total crashes
Rural 3-Leg Signalized
Operational Region 100
use generic model developed for total crashes
Rural 3-Leg Signalized FI Virginia use generic model
developed for FI crashes
Rural 3-Leg Signalized
Operational Region 1
use generic model developed for FI crashes
Rural 3-Leg Signalized
Operational Region 10
use generic model developed for FI crashes
Rural 3-Leg Signalized
Operational Region 100
use generic model developed for FI crashes
Rural 3-Leg Minor Stop Control Total Virginia use generic model
developed for total crashes
Rural 3-Leg Minor Stop Control
Operational Region 1
use generic model developed for total crashes
Rural 3-Leg Minor Stop Control
Operational Region 10
use specific regional model developed
Rural 3-Leg Minor Stop Control
Operational Region 100
use generic model developed for total crashes
Rural 3-Leg Minor Stop Control FI Virginia use generic model
developed for FI crashes
Rural 3-Leg Minor Stop Control
Operational Region 1
use generic model developed for FI crashes
Rural 3-Leg Minor Stop Control
Operational Region 10
use specific regional model developed
Rural 3-Leg Minor Stop Control
Operational Region 100
use generic model developed for FI crashes
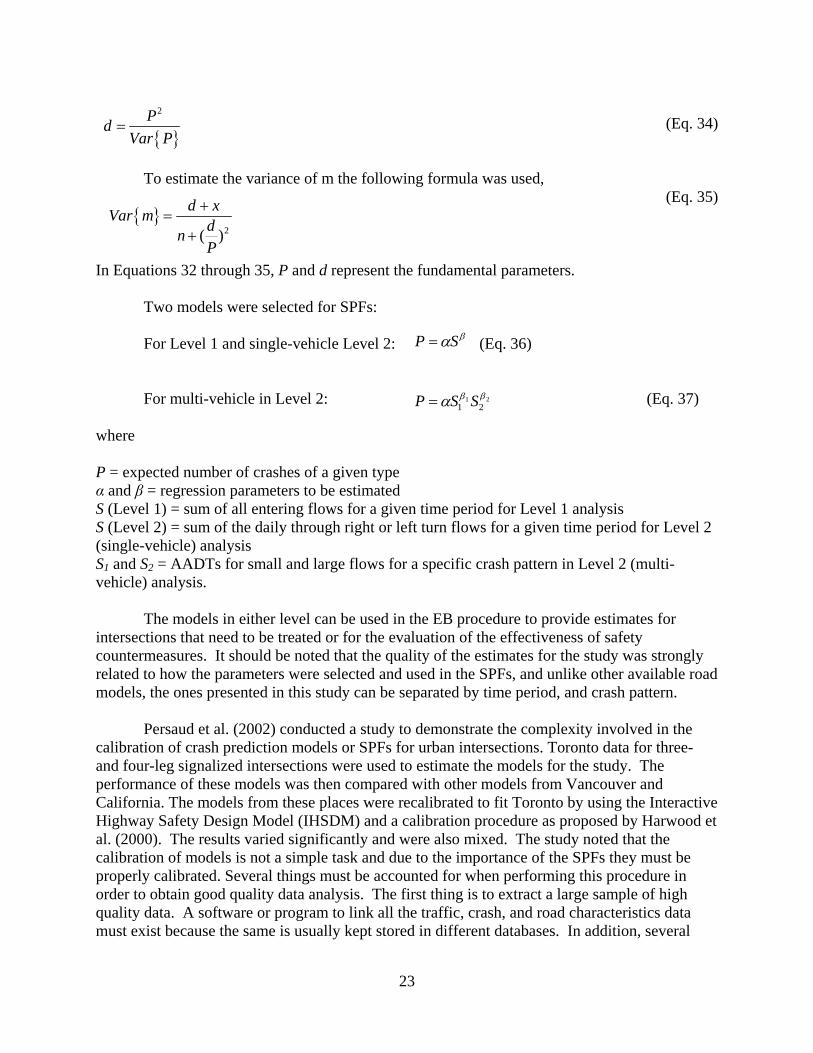

25
The Illinois Department of Transportation and the University of Illinois Urbana-Champaign conducted a research study to develop and implement SPFs for road segments and intersections in Illinois (Tegge et al 2010) These SPFs were developed in a way suitable for easy implementation in SafetyAnalyst The crash data (number of crashes and crash severity) and roadway data (number of lanes traffic volume area type and functional class) were collected and used for development of the SPFs Seventeen peer groups were used for developing the SPFs for segments and eight for intersections The intersections peer groups were minor leg stop control all-way stop control signalized and undetermined for rural and urban segments separately The SPFs for segments were developed using NB distribution for crashes and Poisson distribution for intersections The SAS GENMOD procedure was used to develop the SPFs for a five-year analysis period from 2001 to 2005 The model form for the intersection SPFs is the same as that given in the SafetyAnalyst Userrsquos Manual The SPFs were also developed for different crash severities such as fatal crashes type A injury crashes type B injury crashes and fatal plus injury crashes The EB method was used to determine the sites with the higher PSIs Two analysis techniques were used to obtain the PSIs The first considered segments and intersections as individual elements and the second used the sliding window approach The site specific analysis treated each individual segment and intersection as a separate entity Each segment is then compared with every other segment instead of having them grouped together The sliding window approach defined a set length The window lengths were 025 mile and 1 mile for urban and rural segments respectively
The largest impact on crash frequency was found to be the AADT and was therefore the only variable modeled as a logarithm (lnAADT) By doing this the AADT accounted for most of the prediction whereas the rest of the variables refined the prediction further Other variables used included access control functional class lane width surface type area type speed limit and median type The study recommended that a multivariate analysis be conducted for such studies to show how certain variables could contribute to the crashes Other variables could include roadway lighting weather and pavement conditions and roadway geometry The study also concluded that knowledge of roadway characteristics that increase the risk of fatal or injury crashes will facilitate the setting up of safety criteria that can help engineers in the designing of safer roadways Further knowledge of driver behaviors that lead to fatal and severe injury crashes can facilitate the training of enforcement officers to identify these behaviors
The Colorado Department of Transportation (CDOT) (2009) conducted a study to develop SPFs for intersections in the state Their model form is the same as that in SafetyAnalyst The SPFs were developed for many categories based on the number of legs divided undivided rural and urban including urban four-lane divided signalized six-lane divided signalized urban three-leg signalized two-lane undivided unsignalized and urban three-leg unsignalized When a median or left-turn lane is present a roadway is considered divided The sites selected for the study reflected variability in traffic volume and geometry in order to have a diverse representation of intersections throughout the state SPFs were developed for total and for fatal plus injury crash types A five-year study period from 2000 through 2005 was used Crash and AADT data were collected for development of the SPFs CDOT used a NB error structure to develop the SPFs and the EB procedure to estimate the expected safety performance of an intersection site for different safety management purposes Overdispersion parameters were computed and used as a goodness of fit measure According to their data
26
overdispersion parameters indicated that their models provided a reasonable fit to the Colorado data
Results indicated that for signalized intersections roads with six lanes on major approaches have more collisions than those with four lanes on major approaches CDOT recommended that the SPFs should be recalibrated in the future using data from future years as crash frequencies may change over time because of a variety of issues The report also recommended that separate calibration factors should be developed for different regions and different topographies Research in Virginia
In Virginia two other similar studies have recently been published One by Garber et al (2010) for two-lane roads and another by Hamidi et al (2010) to identify high-crash sections on Virginiarsquos primary system by developing a planning-level methodology The study by Garber et al developed SPFs for two-lane segments of 1 mile or less and the study by Hamidi et al developed SPFs for longer segments of two-lane roads that can be used for corridor analysis
Evaluation of the Recommended Minnesota SPFs
Figures 3 through 6 show representative graphs that were used to visually examine how well the Virginia data fitted the suggested Minnesota SPFs Figures 3 and 4 are for urban four-leg signalized intersections and Figures 5 and 6 are for rural four-leg signalized intersections These graphs suggest that the Minnesota SPFs do not fully represent the Virginia data Tables 9 through 12 show the Freeman-Tukey R2
FT coefficients computed for the different Minnesota SPFs using the Virginia data The low Freeman-Tukey R2
FT coefficients obtained and the visual inspection of the graphs suggested that a better fit to the Virginia data could be obtained by developing specific Virginia SPFs using Virginia data It was therefore decided to develop specific SPFs for Virginia
0
2
4
6
8
10
12
14
0 20000 40000 60000 80000 100000 120000
AADT Major
Tota
l Cra
shes
Per
Yea
r
Minnesota VA Actual Observed
Minnesota Model
Figure 3 Total crashes per year vs major AADT for urban 4-leg signalized intersections
with minor AADT of 700
27
0
5
10
15
20
25
30
35
0 20000 40000 60000 80000 100000 120000
AADT Major
Tota
l Cra
shes
per
Yea
r
Minnesota VA Actual Observed
Minnesota Model
Figure 4 Total crashes per year vs major AADT for urban 4-leg signalized intersections
with minor AADT of 4500
0
2
4
6
8
10
12
14
0 20000 40000 60000 80000 100000 120000
AADT Major
Tota
l Cra
shes
Per
Yea
r
Minnesota VA Actual Observed
Minnesota Model
Figure 5 Total crashes per year vs major AADT for rural 4-leg signalized intersections with
minor AADT of 795
28
0
2
4
6
8
10
12
14
16
18
0 20000 40000 60000 80000 100000 120000
AADT Major
Tota
l Cra
shes
per
Yea
r
Minnesota VA Actual Observed
Minnesota Model
Figure 6 Total crashes per year vs major AADT for rural 4-leg signalized intersections with
minor AADT of 5000
Table 9 Minnesota SPFs for Urban FI Crashes and Corresponding R2FT Based
on Virginia Data
Intersection Type
Minnesota FI SPFs R2
FT Based on Virginia Urban FI Crash Data ()
Urban 4-Leg Signalized 032
Urban 4-Leg Minor Stop Control 008
Urban 3-Leg Signalized 026
Urban 3-LegMinor Stop Control 01
Table 10 Minnesota SPFs for Urban TOTAL crashes and Corresponding R2
FT Based on Virginia Data
Type of Intersection
Minnesota SPFs
R2FT Based on Virginia Urban Total
Crash Data ()
Urban 4-Leg Signalized 034
Urban 4-Leg Minor Stop Control 022
Urban 3-Leg Signalized 031
Urban 3-Leg Minor Stop Control 01
29
Table 11 Minnesota SPFs for Rural TOTAL Crashes and Corresponding R2FT
Based on Virginia Data
Type of Intersection
Minnesota SPFs R2
FT Based on Virginia Rural Total Crash Data ()
Rural 4-Leg Signalized 029
Rural 4-Leg Minor Stop Control 013
Rural 3-Leg Signalized 029
Rural 3-Leg Minor Stop Control -010
Table 12 Minnesota SPFs for Rural FI Crashes and Corresponding R2FT Based
on Virginia Data
Type of Intersection
Minnesota SPFs R2
FT Based on Virginia Rural FI Crash Data ()
Rural 4-Leg Signalized 018
Rural 4-Leg Minor Stop Control 010
Rural 3-Leg Signalized 018
Rural 3-Leg Minor Stop Control 001
Development and Evaluation of Specific Virginia SPFs
In keeping with the suggestion given in the Safety Analyst Userrsquos Manual the model form used to develop the intersection SPFs is given in Equation 4 as
1 2k e x MajAADT x MinAADTβ βα=
where
k = predicted crash frequency per intersection per year MajAADT = AADT on the major road (vehday) MinAADT = AADT on the minor road (vehday) α = intercept β1 = coefficient of mayor AADT β2 = coefficient of minor AADT
30
The statewide SPFs developed for Virginia are given in Tables 13 through 16 Due to lack of data the analysis for all-way stop intersections could not be undertaken These tables also give the Freeman-Tukey R2
FT coefficient for each of the Virginia SPFs and the corresponding Minnesota SPF and Freeman-Tukey R2
FT based on the Virginia data The R2FT coefficients
obtained indicate that the Virginia-specific SPFs fit the Virginia data better than the suggested Minnesota SPFs for all types of intersections and crash severity except those for FI crashes on urban three-leg signalized rural four-leg signalized and rural four-leg minor stop control intersections where the corresponding RFT
2 values are similar In Table 15 it can be seen that the Minnesota R2
FT value is negative for the rural three-leg minor stop control intersections The negative RFT
2 value is possible because these calculations were not performed on the same data points that were used to create the Minnesota SPFs (Miller 2009) Table 13 SPF Models for Urban TOTAL crashes and R2
FT results for Virginia Statewide (VDOT-maintained roads)
SPF model with TOTAL Crash values
R2FT TOTAL
Crash Data
Site Virginia Statewide Minnesota VA MN
Urban 4-Leg Signalized 056 034
Urban 4-Leg Minor Stop Control
032 022
Urban 3-Leg Signalized 037 031
Urban 3-Leg Minor Stop Control
023 010
Table 14 SPF Models for Urban FI crashes and R2
FT results for Virginia Statewide (VDOT-maintained roads)
SPF model with FI Crash values R2FT FI Crash Data ()
Site
Virginia Statewide Minnesota VA MN
Urban 4-Leg Signalized 041 032
Urban 4-Leg Minor Stop Control
019 008
Urban 3-Leg Signalized 026 026
Urban 3-Leg Minor Stop Control
013 010
31
Table 15 SPF Models for Rural TOTAL Crashes and R2FT Results for Virginia Statewide (VDOT-
maintained roads) SPF model with TOTAL Crash values R2
FT TOTAL Crash Data
Site
Virginia Statewide Minnesota VA MN
Rural 4-Leg Signalized 0321 0290
Rural 4-Leg Minor Stop Control
0167 0132
Rural 3-Leg Signalized 0305 0291
Rural 3-Leg Minor Stop Control
0104 -0102
Table 16 SPF Models for Rural FI crashes and R2
FT results for Virginia Statewide (VDOT-maintained roads) SPF model with FI Crash values R2
FT TOTAL Crash Data
Site
Virginia Statewide Minnesota VA MN
Rural 4-Leg Signalized 0181 0181
Rural 4-Leg Minor Stop Control
0098 0097
Rural 3-Leg Signalized 0170 0180
Rural 3-Leg Minor Stop Control
0048 0012
Figures 7 through 10 show visual representations of how well the Virginia SPFs fit the
Virginia data in comparison with the suggested Minnesota SPFs In general the Virginia SPFs tend to fit the Virginia data better than the Minnesota SPFs although both sets of SPFs tend to have similar fits at low volumes (AADTmajor lt 2000) except for the SPF for total crashes on urban four-leg signalized intersections shown in Figure 7 The primary reason the Minnesota SPFs do not fit the Virginia data as well as the Virginia SPFs may be the dissimilarities of the roadside environment and the characteristics of the different databases
32
0
2
4
6
8
10
12
14
0 20000 40000 60000 80000 100000 120000
AADT Major
Tota
l Cra
shes
Per
Yea
r
Minnesota VA Actual Observed Virginia
Minnesota Model
Virginia M odel
Figure 7 Total crashes per year vs major AADT for urban 4-leg signalized intersections
with minor AADT of 700
0
5
10
15
20
25
30
35
0 20000 40000 60000 80000 100000 120000
AADT Major
Tota
l Cra
shes
per
Yea
r
Minnesota VA Actual Observed Virginia
Minnesota Model
Virginia Model
Figure 8 Total crashes per year vs major AADT for urban 4-leg signalized intersections
with minor AADT of 8000
33
0
2
4
6
8
10
12
14
0 20000 40000 60000 80000 100000 120000
AADT Major
Tota
l Cra
shes
Per
Yea
r
Minnesota VA Actual Observed Virginia
Virginia Model
Minnesota Model
Figure 9 Total crashes per year vs major AADT for rural 4-leg signalized intersections with
minor AADT of 79
0
5
10
15
20
25
0 20000 40000 60000 80000 100000 120000
AADT Major
Tota
l Cra
shes
per
Yea
r
Minnesota VA Actual Observed Virginia
Minnesota Model
Virginia Model
Figure 10 Total crashes per year vs minor AADT for rural 4-leg signalized intersections with major AADT of 5000
As discussed in the Methodology section in addition to the statewide Virginia SPFs
specific SPFs were developed for each operational region to consider the different topographical characteristics that exist across Virginia The complete set of SPFs together with the associated p values for the regression coefficients are shown in Tables A-1 and A-2 of Appendix A All p values are less than 005 with most being less than 00001 except for some of the rural four-leg signalized intersections regional specific SPFs These p values indicate that the estimated coefficients are statistically significant at the 95 confidence level or better A possible reason
34
for higher p values for a small number of SPFs may be the sample size used for developing these SPFs
To test the transferability and fit of the Virginia statewide specific SPFs several
statistical parameters were determined for the 70 (estimation) data set and the 30 (validation) data set separately The corresponding values for each of these parameters were then compared The results are shown in Tables 17 and 18 for urban and rural intersections respectively The results for the regional SPFs are shown in Tables A-3 through A-8 of Appendix A The results indicate that the developed models are transferable to the 30 validation data set For example the MSE values for the 70 estimation data are similar to the MSPE values for the 30 validation data In addition the mean prediction bias MPB values for the 30 validation data are close to zero (-076 le MPB ge -0004) in Table 17 and (-0067 le MPB ge 00513) in Table 18
Table 17 Goodness of Fit Results for Urban Statewide SPFs
Data Estimation data 70 Validation Data 30 Subtype Site MSE r2 R2
FT MPB MAD MSPE R2FT
Total VA 41150 0529 0557 -0760 4329 38490 0575
Total MN
68636 0506 0336 -3145 5421 68156 0315
FI VA
7043 0385 0406 -0458 1938 7671 0475
Urban 4-Leg Signalized
FI MN 7702 0372 0324 -0316 2124 8981 0376
Total VA 2238 0315 0313 -0034 0897 2383 0292
Total MN 2510 0287 0215 0091 0982 2730 0182
FI VA 0530 0194 0193 -0004 0432 0533 0194
Urban 4-Leg Minor Stop Control
FI MN 0560 0182 0080 0128 0522 0577 0052
Total VA 24900 0375 0370 -0645 3519 27591 0369
Total MN 29322 0365 0308 -2238 3661 33079 0272
FI VA 4467 0275 0259 -0185 1527 4875 0262
Urban 3-Leg Signalized
FI MN 4528 0267 0261 -0294 1526 4937 0261
Total VA 1854 0254 0230 -0043 0893 2038 0239
Total MN 2388 0237 0104 -0541 0902 2600 0107
FI VA 0428 0151 0133 -0021 0431 0476 0157
Urban 3-Leg Minor Stop Control
FI MN 0478 0140 0097 -0184 0385 0537 0104
35
Table 18 Goodness of Fit Results for Rural Statewide SPFs
Data Estimation Data 70
Validation Data 30
Subtype Site MSE r2 R2FT MPB MAD MSPE R2
FT
Total VA 10990 0353 0321 0513 2210 10070 -0073
Total MN 12400 0339 0290 -0154 2071 8460 0035
FI VA 2350 0196 0181 0045 1189 2600 -0034
Rural 4-Leg Signalized
FI MN 2400 0188 0181 -0043 1164 2420 0004
Total VA 1090 0182 0167 -0067 0794 1190 0171
Total MN 1190 0167 0132 -0348 0774 1320 0115
FI VA 0480 0112 0098 -0022 0504 0530 0110
Rural 4-Leg Minor Stop Control
FI MN 0500 0104 0097 -0158 0459 0560 0093
Total VA 5490 0328 0305 -0010 1651 5760 0179
Total MN NA NA NA NA NA NA NA
FI VA 1450 0181 0170 -0041 0902 1710 0099
Rural 3-Leg Signalized
FI MN NA NA NA NA NA NA NA
Total VA 0690 0144 0104 -0008 0613 0730 0102
Total MN 0890 0141 -0102 -0404 0555 0940 -0104
FI VA 0250 0071 0048 -0009 0345 0260 0048
Rural 3-Leg Minor Stop Control
FI MN 0270 0068 0012 -0144 0270 0290 0003
Pruning of Virginia-Specific SPFs A total of 64 SPFs were initially developed using the appropriate data for Virginia as shown in Tables A-1 and A-2 of Appendix A Considering that not all regional models might be necessary the pruning process described in the methodology section was carried out to prune the number of SPFs to the minimum effective number as seen in Tables 19 and 20 for urban and rural intersections respectively The pruning process resulted in 19 SPFs for urban sites and 15 for rural sites To facilitate the use of the correct SPF for a specific type of intersection located in a specific region the lists of the appropriate SPFs to be used are given in Tables B-1 and B-2 of Appendix B for the urban and rural intersections respectively
As can be seen in Tables 19 and 20 and Tables A-1 and A-2 of Appendix A there are some trends worth discussing for the benefit of the study and possible future research With regards to the three different operational regions the Western region retained many more of the specific regional urban SPFs than any other region For example the Western regional SPFs were retained for all urban intersection sites whereas for the Eastern region the only SPFs
36
retained were those for urban four-leg signalized FI crashes and urban four-leg minor stop control for total and FI crashes Similarly the only urban SPF retained for the Northern region was that for urban four-leg minor stop control for total crashes For the rural intersection sites all of the Western regional SPFs were retained except those for rural three-leg signalized total and FI crashes and rural four-leg minor stop control FI crashes The majority of the Eastern region rural SPFs were discarded except those for rural four-leg signalized total and FI crashes while for the Northern region all regional SPFs were discarded
The Western region retained more specific regional SPFs than the other two regions This suggests that the intersections in the Western region exhibit more unique characteristics than those for the other regions This may be due to the more mountainous terrain in the Western region compared to those in the Eastern and Northern regions This supports the philosophy of developing specific SPFs based on the topography of different regions
Site Prioritization
To illustrate the benefits of using the EB method to prioritize intersection sites for safety
improvements the top 25 urban sites from the Bristol and Northern Virginia districts were identified by using crash rates critical crash ratio and the EB method The PSI for each site identified was then determined The results obtained are shown in Tables 21 and 22 for the Bristol and the Northern Virginia districts respectively The results indicate that for the Northern Virginia District the PSIs for the top 25 sites are 258 1317 and 27440 crashes per year and for the Bristol District 432 646 and 1496 crashes per year for the crash rates critical crash ratio and EB methods respectively The important thing in Tables 21 and 22 is the sum of the PSI columns ranked by the three methods The sum of each of the PSIs for the crash rate and critical crash ratio method is lower than that for the EB method These results suggest that the use of the EB method in the planning process will identify intersection sites with the highest PSIs and therefore where detailed assessments to determine feasible and effective safety treatments should be undertaken
37
Table 19 MSPE Values for Virginia Urban Statewide and Urban Regional SPFs Used for Pruning
Data Pruning
Subtype
Site
MSPE [MSPEVA-
MSPEOR]1 [abs(MSPEVA-
MSPEOR)]2 [abs(MSPEVA-
MSPEOR)MSPEVA]3
RetainDiscardTotal VA 3849 Northern 4486 -637 637 0165497532 Discard Western 1791 2058 2058 0534684334 Retain Eastern 3745 104 104 0027020005 Discard FI VA 7671 Northern 95 -1829 1829 0238430452 Discard Western 517 2501 2501 0326033112 Retain
Urban 4-Leg Signalized
Eastern 541 2261 2261 0294746448 Retain Total VA 23834 Northern 202 03634 03634 015247126 Retain Western 105 13334 13334 0559452882 Retain Eastern 115 12334 12334 0517496014 Retain FI VA 05327 Northern 048 00527 00527 0098929979 Discard Western 033 02027 02027 0380514361 Retain
Urban 4-Leg Minor Stop Control
Eastern 036 01727 01727 0324197485 Retain Total VA 275911 Northern 2687 07211 07211 0026135239 Discard Western 2441 31811 31811 0115294425 Retain Eastern 3878 -111889 111889 0405525695 Discard FI VA 48754 Northern 448 03954 03954 0081101038 Discard Western 339 14854 14854 0304672437 Retain
Urban 3-Leg Signalized
Eastern 586 -09846 09846 020195266 Discard Total VA 20379 Northern 219 -01521 01521 0074635654 Discard Western 164 03979 03979 0195250012 Retain Eastern 223 -01921 01921 0094263703 Discard FI VA 04756 Northern 05 -00244 00244 0051303616 Discard Western 038 00956 00956 0201009251 Retain
Urban 3-Leg Minor Stop Control
Eastern 05 -00244 00244 0051303616 Discard 1 Difference between mean square prediction error (MSPE) of Virginia statewide model and OR model 2 Absolute value of the difference between Virginia statewide model MSPE and operational region model MSPE 3 Absolute value of the difference between Virginia statewide model MSPE and operational region model MSPE divided by the Virginia statewide MSPE for comparison
Retained SPFs Discarded if value is negative Discarded if less than 01
38
Table 20 MSPE Values for Virginia Rural Statewide and Rural Regional SPFs Used for Pruning Data Pruning
Subtype
Site
MSPE
[MSPEVA-MSPEOR]1
[abs(MSPEVA-MSPEOR)]2
[abs(MSPEVA-MSPEOR)MSPEVA]3
RetainDiscard
Total VA 1007 Northern 3422 -2415 2415 2398212512 Discard Western 605 402 402 0399205561 Retain Eastern 512 495 495 0491559086 Retain FI VA 26 Northern 976 -716 716 2753846154 Discard Western 159 101 101 0388461538 Retain
Rural 4-Leg Signalized
Eastern 137 123 123 0473076923 Retain Total VA 119 Northern 164 -045 045 0378151261 Discard Western 102 017 017 0142857143 Retain Eastern 114 005 005 0042016807 Discard FI VA 053 Northern 052 001 001 0018867925 Discard Western 048 005 005 0094339623 Discard
Rural 4-Leg Minor Stop Control
Eastern 049 004 004 0075471698 Discard Total VA 576 Northern 1475 -899 899 1560763889 Discard Western 674 -098 098 0170138889 Discard Eastern 626 -05 05 0086805556 Discard FI VA 171 Northern 212 -041 041 0239766082 Discard Western 403 -232 232 1356725146 Discard
Rural 3-Leg Signalized
Eastern 157 014 014 0081871345 Discard Total VA 073 Northern 093 -02 02 0273972603 Discard Western 053 02 02 0273972603 Retain Eastern 069 004 004 0054794521 Discard FI VA 026 Northern 03 -004 004 0153846154 Discard Western 023 003 003 0115384615 Retain
Rural 3-Leg Minor Stop Control
Eastern 027 -001 001 0038461538 Discard 1 Difference between mean square prediction error (MSPE) of Virginia statewide model and OR model 2 Absolute value of the difference between Virginia statewide model MSPE and operational region model MSPE 3 Absolute value of the difference between Virginia statewide model MSPE and operational region model MSPE divided by the Virginia statewide MSPE for comparison
Retained SPFs Discarded if value is negative Discarded if less than 01
39
Table 21 PSIs for Top 25 Sites in District 1 Urban (Bristol) FI
Crashes Ranking Based on Crash
Rates Ranking Based on Crash Ratio Ranking Based on EB
Method
Rank Intersection Node
Crash Rate1 PSI2 Intersection
Node Crash Ratio3 PSI Intersection
Node PSI
1 596726 22112 00000 651193 39672 00000 596095 21413
2 606469 20079 00000 606238 39298 06297 596393 08787
3 706818 12504 00000 651075 31264 00000 651130 08453
4 651193 11550 00000 596726 29227 00000 596701 07112 5 651075 09369 00000 606469 28039 00000 651802 06929 6 606238 08382 06297 651233 25831 03612 636331 06726 7 651807 07089 00000 651130 22718 08453 596395 06579 8 651233 06068 03612 706818 22555 00000 596937 06415 9 651230 05990 00000 651230 20301 00000 606238 06297
10 651783 05756 00000 651210 18882 04747 661033 06061 11 636093 04960 00000 636331 17913 06726 596372 05417 12 651274 04475 00000 651807 16847 00000 636372 04808 13 651130 04179 08453 651805 15814 00000 651210 04747 14 651210 03918 04747 651223 15627 03589 636491 04649 15 636331 03393 06726 651783 15009 00000 596420 04633 16 651223 03363 03589 596095 14865 21413 596403 04579 17 606232 03331 00000 636405 14769 00000 651603 04531 18 651127 03053 00000 661033 14555 06061 636056 04351 19 651999 03048 00000 596353 14215 03717 712033 04110 20 596449 02962 00000 636093 13782 00000 704691 04102 21 636405 02811 00000 651879 13192 00000 651838 04100 22 651883 02698 00000 651274 12975 00000 651894 03878 23 596353 02686 03717 651127 12972 00000 596353 03717 24 651805 02663 00000 651999 12959 00000 651233 03612 25 661033 02500 06061 596449 12702 00000 651889 03601
sum 43202 sum 64615 sum 149606 1Number of crashes per year per 1000000 total approach volume 2Potential for safety improvement (crashes yr) the difference between the EB-adjusted long-term crashes and the SPF-estimated crashes 3Ratio of actual crash rate to critical crash rate
40
Table 22 PSIs for Top 25 Sites in District 9 Urban (Northern Virginia District) FI
Crashes Ranking Based on Crash
Rates Ranking Based on Crash Ratio Ranking Based on EB
Method
Rank Intersection Node
Crash Rate1 PSI2 Intersection
Node Crash Ratio3 PSI Intersection
Node PSI
1 718192 191841 00000 718192 257523 00000 264119 150122 2 702946 178194 00000 547722 152371 11175 263375 140091 3 271531 64846 00000 263628 102794 00000 278648 137239 4 263628 52858 00000 263728 100092 00000 276819 131395 5 263728 42215 00000 719754 95274 09444 263290 130743 6 266955 35294 00000 702946 79268 00000 722678 127897 7 547722 34932 11175 263403 77252 05184 264725 118671 8 702612 30441 00000 704237 77175 07648 267028 116627 9 273886 29539 00000 263729 74681 00000 265204 115925
10 716747 27632 00000 271531 72327 00000 274766 115679 11 263626 27139 00000 263135 66458 18068 263249 113372 12 269485 26567 00000 716747 64461 00000 547044 110769 13 728954 26344 00000 266955 56657 00000 549349 107180 14 263729 25208 00000 546138 52003 31028 268210 105630 15 546988 21922 00000 547544 51924 32529 263347 104257 16 274338 21446 00000 263626 50389 00000 276351 102313 17 429308 21354 00000 269485 49897 00000 428167 100064 18 720401 21197 00000 728954 49702 00000 264344 98789 19 267295 20954 00000 548686 49572 03621 277764 91554 20 267536 20874 00000 711601 47985 04440 263467 89259 21 265938 20484 00000 266970 47730 00000 263090 89199 22 273354 20108 00000 546462 46856 03620 703414 88610 23 268345 19362 00000 265938 46726 00000 428629 87379 24 719754 19073 09444 720401 44833 00000 272219 85659 25 263403 19015 05184 728496 43666 04990 428544 85610
Sum 25803 sum 131747 sum 2744033 1Number of crashes per year per 1000000 total approach volume 2Potential for safety improvement (crashes yr) the difference between the EB-adjusted long-term crashes and the SPF-estimated crashes 3Ratio of actual crash rate to critical crash rate
41
CONCLUSIONS
bull The development of SPFs for intersections is necessary for Virginia because the SafetyAnalyst-suggested SPFs which are based on Minnesota data do not represent the Virginia data well Regarding the fit of the SPFs to Virginia data the R2
FT values shown in Tables 13 through 16 for Minnesota and Virginia indicate that the Virginia-specific SPFs fit the Virginia data better than the Minnesota models This may be due to the dissimilarities of the roadside environment such as difference in topography and the characteristics of the different Virginia and Minnesota databases
bull In some cases the specific regional SPFs fit the regional data better than the statewide
SPFs suggesting that the specific SPFs should be considered for use when available These group divisions that have similar roadway characteristics and driver expectations in some cases tend to improve the fit
bull In identifying intersection sites for safety improvements it is clearly beneficial for the EB
method to be used with the suitable SPFs rather than a crash rate or critical ratio method Results of the site prioritization show a much higher potential for crash reduction when the EB method is used with the appropriate SPFs rather than a procedure based on crash rates or critical rates
RECOMMENDATIONS
1 VDOTrsquos TED should use the Virginia-specific SPFs when using the SafetyAnalyst tools The results of this study have shown that the Virginia-specific SPFs reflected the Virginia data better than the SafetyAnalyst-recommended Minnesota SPFs
2 VDOTrsquos TED should investigate the feasibility of using multiple SPFs in SafetyAnalyst If
feasible regional SPFs should be used If it is not currently feasible to use multiple SPFs VDOTrsquos TED should ask that the FHWA include regional information in SafetyAnalyst so as to allow the use of regional SPFs For the specific regional SPFs to be applied to Virginia and other states the SafetyAnalyst tool should be capable of incorporating the necessary data that support the regional models
3 As soon as it is feasible to use regional SPFs VDOTrsquos TED should use the 19 SPFs
developed for urban intersections and the 15 developed for rural intersections when using the tools in SafetyAnalyst Although the statewide SPFs are available for use by an analyst the specific regional models included in the final set of SPFs will predict crashes better than the statewide SPFs The regional analysis will not only ease the use of specific regional SPFs but will also be of benefit when predicting the potential for safety improvement of a specific site
4 For future similar SPF studies VDOTrsquos TED should be directly involved in screening the
traffic data for accuracy and consistency as was done in this study The direct involvement of the TED in the screening of the traffic data significantly contributed to the accuracy of the
42
data and greatly contributed to the confidence the researchers place on the data used in the study
5 The Virginia Transportation Research Council (VTRC) should conduct a study as soon as
feasible to verify whether incorporating independent variables for which data are available other than AADT such as intersection geometry and other characteristics will result in SPFs that better fit the Virginia data Although the currently suggested SafetyAnalyst SPFs use only the AADTs as the independent variables it is likely that provision will be made for use of SPFs that incorporate other independent variables such as number of approaches entering lanes and the other variables for which data are available as these SPFs are likely to give better fit to crash data
6 As soon as feasible VTRC should undertake a study to develop SPFs for the urban system
intersections which are not currently maintained by VDOT as these intersections may have different crash characteristics than those maintained by VDOT This would facilitate the use of SafetyAnalyst in programming sites that are currently not being maintained by VDOT
BENEFITS AND IMPLEMENTATION PROSPECTS
Significant benefits will be accrued by the use of the Virginia-specific SPFs developed in this study This is clearly illustrated in two ways First in examining the transferability of the suggested SPFs in SafetyAnalyst it is clear that these SPFs do not fit the Virginia data very well The results also indicate that the Virginia-specific SPFs fit the Virginia data much better than the suggested SafetyAnalyst SPFs Second the availability of the Virginia-specific SPFs will enhance the use of the EB procedure given in SafetyAnalyst for prioritizing sites for safety improvements This study has also shown that the EB method better identifies sites with higher potential for crash reduction than those identified by crash rates For example the illustrated examples given for the Bristol and Northern Virginia districts show that the potential reduction in FI crashes when the top 25 sites are identified by the EB method is 28936 (1496 + 27440) crashes per year whereas that obtained when the critical crash ratio method is used for prioritization is only 1963 (646 + 1317) and that obtained with the crash rate method is only 690 (432 + 258) crashes per year This gives a net benefit of 26973 potential crashes per year compared to the critical crash ratio method and 28246 compared to the crash rate method Assuming an average cost of FI crashes of $95629 (FHWA 2005) and only 10 of the estimated net benefit PSI of 28246 crashes per year is achieved the total savings of more than $27 million per year could be accrued The prospects for implementation of the recommendations are very high as the study was requested by VDOTrsquos TED which is planning to incorporate these SPFs in the use of the tools provided in SafetyAnalyst
43
ACKNOWLEDGMENTS
The authors appreciate the opportunity afforded them by VDOT and VTRC to conduct this study Special thanks to Stephen Read (VDOT) Dr In-Kyu Lim (VDOT) Dr Young-Jun Kweon (VTRC) and VDOTrsquos Central Office for their interest and support in SPFs and their help in the selection of intersection sites Many thanks to Lewis Woodson (VTRC) and James Hill (University of Virginia) for all their help and input throughout the study
REFERENCES Cogburn P VDOT Interagency Coordination 2007 Virginia Emergency Management
Conference Virginia Department of Transportation Richmond April 2007 Colorado Department of Transportation DTD Applied Research and Innovation Branch Safety
Performance Functions for Intersections CDOT-2009-10 Denver December 2009 Fridstroslashm L Ifver J Ingebrigtsen S Kulmala R and Thomsen LK Measuring the
Contribution of Randomness Exposure Weather and Daylight to the Variation in Road Accidents Counts Accident Analysis and Prevention Vol 27 No 1 1995 pp 1-20
Federal Highway Administration Cost of Crashes by Severity Table FHWA-HRT-05-051
Washington DC 2005 Federal Highway Administration SafetyAnalyst Home Page httpwwwsafetyanalystorg
Accessed February 2010 Garber N and Hoel L Traffic amp Highway Engineering 4th ed Cenage Learning Toronto
Canada 2009 Garber NJ Haas PR and Gosse C Development of Safety Performance Functions for Two-
Lane Roads Maintained by the Virginia Department of Transportation VTRC 10-R25 Virginia Transportation Research Council Charlottesville 2010
Hamidi A Fontaine MD and Demetsky MJ A Planning-Level Methodology for Identifying
High-Crash Sections of Virginiarsquos Primary System VTRC 11-R4 Virginia Transportation Research Council Charlottesville 2010
Harwood D Council FM Hauer E Hughes WE and Vogt A Prediction of the Expected
Safety Performance of Rural Two-lane Highways Federal Highway Administration McLean VA December 2000
Harwood DW Bauer KM Richard KR Gilmore DK Persaud B and Lyon C
Development of SPFs for Safety Analyst Interim Tools Technical Memorandum
44
Prepared by Midwest Research Institute for the Federal Highway Administration McLean VA 2004
ITT Corporation SafetyAnalyst Userrsquos Manual Turner-Fairbank Highway Research Center
McLean VA 2008 Jonsson T Ivan J and Zhang C Crash Prediction Models for Intersections on Rural
Multilane Highways Differences by Collision Type In Transportation Research Record Journal of the Transportation Research Board No 2019 Transportation Research Board of the National Academies Washington DC 2007 pp 91-98
Kweon Y-J and Lim I-K Appropriate Regression Model Types for the Empirical Bayes
Method and SafetyAnalyst In Proceedings of the 89th Annual Meeting of the Transportation Research Board Transportation Research Board of the National Academies Washington DC 2010
Kononov J Bailey B and Allery B Exploratory Examination of the Functional Form of
Safety Performance Functions of Urban Freeways Colorado Department of Transportation and San Diego State University Denver CO 2008
Lyon C Haq A Persaud B and Kodama S Safety Performance Functions for Signalized
Intersections in Large Urban Areas Development and Application to Evaluation of Left-Turn Priority Treatment In Transportation Research Record Journal of the Transportation Research Board No 1908 Transportation Research Board of the National Academies Washington DC 2005 pp 165-171
Lord D and Persaud B Estimating the Safety Performance of Urban Road Transportation
Networks Center for Transportation Safety Texas Transportation Institute Texas AampM University and Department of Civil Engineering Ryerson University College Station TX 2003 pp 609-620
Miaou S-P Lu A and Lum H S Pitfalls of using R2 to Evaluate Goodness of Fit of
Accident Prediction Models In Transportation Research Record Journal of the Transportation Research Board No 1542 Transportation Research Board of the National Academies Washington DC 2005 1996 pp 6-13
Miller P Re Negative R squared Email Archive Division of Biostatistics Washington
University in St Louis February 2 2005 February 2 2005 httpwwwbiostatwustleduarchiveshtmljmp-l2005msg00075html Accessed February 2010
Persaud B Lord D and Palmisano J Calibration and Transferability of Accident Prediction
Models for Urban Intersections In Transportation Research Record Journal of the Transportation Research Board No 1784 Transportation Research Board of the National Academies Washington DC 2002 pp 57-64
45
Persaud B and Nguyen T Disaggregate Safety Performance Models for Signalized Intersections on Ontario Provincial Roads In Transportation Research Record Journal of the Transportation Research Board No 1635 Transportation Research Board of the National Academies Washington DC 1998 pp 113-120
Pham T and Ragland D Summary of Crash Prediction Models Also known as Safety
Performance Functions (SPFs) California Partners for Advanced Traffic and Highways and University of California Berkeley Berkeley 2005
SAS Institute Inc SAS OnlineDoc Version Eight Cary NC
httpwwwtecnionacildocssasril Accessed 2009 Tegge RA Jo J-H and Ouyang Y Development and Application of Safety Performance
Functions for Illinois ICT-10-066 Illinois Center for Transportation University of Illinois Urbana-Champaign March 2010
Virginiarsquos Surface Transportation Safety Executive Committee Commonwealth of Virginiarsquos
Strategic Highway Safety Plan 2006-2010 Virginia Department of Transportation Richmond 2006
Washington S Persaud B Lyon C and Oh J Validation of Accident Models for
Intersections FHWA-RD-03-037 Federal Highway Administration McLean VA 2005
46
47
APPENDIX A
STATISTICAL PARAMETERS AND GOODNESS-OF-FIT RESULTS
Table A-1 Statistical Parameters for Urban Intersections SPFs Parameter Estimates
Data Intercept
Coefficient of Mayor AADT
Coefficient of Minor AADT
Subtype Site Intercept (α)
StndError
P value
lnMajor (β1)
StndError
P value
lnMinor (β2)
StndError
P value
Total VA -76234 048 lt0001 06742 005 lt0001 03453 003 lt0001
OR1 -83067 056 lt0001 07522 005 lt0001 0328 003 lt0001OR10 -123913 122 lt0001 10631 013 lt0001 04567 006 lt0001OR 100 -88553 077 lt0001 07825 007 lt0001 03706 004 lt0001FI VA -85256 057 lt0001 06477 006 lt0001 03579 004 lt0001OR1 -96546 063 lt0001 07603 006 lt0001 03597 004 lt0001OR10 -114284 15 lt0001 08662 016 lt0001 04412
Urban 4-Leg Signalized
OR 100 -99582 100 lt0001 07484 009 lt0001 04017 005 lt0001Total VA -60723 022 lt0001 04558 002 lt0001 0347 004 lt0001
OR1 -6059 044 lt0001 0505 004 lt0001 02773 006 lt0001OR10 -67031 057 lt0001 03986 007 lt0001 04999 009 lt0001OR 100 -65388 032 lt0001 04689 004 lt0001 043 006 lt0001FI VA -76917 032 lt0001 05001 003 lt0001 03695 005 lt0001OR1 -81437 060 lt0001 05813 005 lt0001 03188 008 lt0001OR10 -80333 063 lt0001 03446 007 lt0001 06218 010 lt0001
Urban 4-Leg Minor Stop Control
OR 100 -83166 051 lt0001 05253 006 lt0001 04695 008 lt0001Total VA -6543 082 lt0001 06591 008 lt0001 02119 002 lt0001
OR1 -4999 103 lt0001 05555 009 lt0001 01554 003 lt0001OR10 -96143 127 lt0001 08677 012 lt0001 03297 005 lt0001OR 100 -67518 110 lt0001 06157 011 lt0001 02969 005 lt0001FI VA -84268 068 lt0001 07147 006 lt0001 02481 002 lt0001OR1 -73982 099 lt0001 06496 009 lt0001 02088 003 lt0001OR10 -110104 155 lt0001 0908 015 lt0001 03226 006 lt0001
Urban 3-Leg Signalized
OR 100 -7266 107 lt0001 05508 011 lt0001 03107 006 lt0001Total VA -54696 013 lt0001 04874 002 lt0001 01985 001 lt0001
OR1 -5361 018 lt0001 04959 002 lt0001 01676 002 lt0001OR10 -5773 034 lt0001 04877 003 lt0001 02314 004 lt0001OR 100 -51642 021 lt0001 04338 003 lt0001 02309 003 lt0001FI VA -74642 018 lt0001 05791 002 lt0001 02091 002 lt0001OR1 -76877 027 lt0001 06204 003 lt0001 0181 002 lt0001OR10 -69458 047 lt0001 05096 004 lt0001 02212 005 lt0001
Urban 3-Leg Minor Stop Control
OR 100 -69883 031 lt0001 05169 004 lt0001 02308 003 lt0001 Standard Error
48
Table A-2 Statistical Parameters for Rural Intersections SPFs Parameter Estimates
Data Intercept
Coefficient of Mayor AADT
Coefficient of Minor AADT
Subtype Site Intercept (α)
StndError
P value
lnMajor (β1)
Stnd Error
P value
lnMinor (β2)
Stnd Error
P value
Total VA -69589 118 lt0001 06746 009 lt0001 0253 009 00047
OR1 -1604 237 04974 02284 021 02791 01514 012 0211 OR10 -63951 183 00005 05508 014 00001 03106 014 00224 OR 100 -06468 220 07692 02262 016 01635 -00158 017 09274 FI VA -87116 128 lt0001 07839 011 lt0001 02166 009 0013 OR1 -33285 246 01767 03601 024 0126 00597 013 06478 OR10 -80583 175 lt0001 06809 018 00001 02557 013 0057
Rural 4-Leg Signalized
OR 100 -48381 221 00287 04243 018 00193 01523 018 03943 Total VA -5494 020 lt0001 03533 002 lt0001 03935 003 lt0001
OR1 -62351 058 lt0001 04167 006 lt0001 04507 008 lt0001OR10 -53594 028 lt0001 03379 003 lt0001 03998 004 lt0001OR 100 -51255 027 lt0001 02914 003 lt0001 04075 004 lt0001FI VA -66927 030 lt0001 03899 003 lt0001 04156 004 lt0001OR1 -82561 095 lt0001 05221 009 lt0001 04962 012 lt0001OR10 -70797 044 lt0001 03789 004 lt0001 0497 005 lt0001
Rural 4-Leg Minor Stop Control
OR 100 -63326 038 lt0001 03223 004 lt0001 04424 005 lt0001Total VA -75754 084 lt0001 06465 008 lt0001 03332 008 lt0001
OR1 -58798 220 00075 05076 020 00143 0313 013 00161 OR10 -64368 110 lt0001 0544 011 lt0001 02863 006 lt0001OR 100 -9899 139 lt0001 08047 015 lt0001 04386 006 lt0001FI VA -87112 103 lt0001 07224 010 lt0001 02578 006 lt0001OR1 -9219 260 00004 07258 022 00011 03407 016 00326 OR10 -88607 146 lt0001 07059 016 lt0001 02809 008 00009
Rural 3-Leg Signalized
OR 100 -111835 185 lt0001 08669 018 lt0001 03977 008 lt0001Total VA -43293 008 lt0001 03366 001 lt0001 02087 001 lt0001
OR1 -50904 022 lt0001 0406 002 lt0001 02752 003 lt0001OR10 -40969 009 lt0001 03133 001 lt0001 02001 001 lt0001OR 100 -4231 016 lt0001 02997 002 lt0001 02308 003 lt0001FI VA -53415 011 lt0001 03394 001 lt0001 02237 001 lt0001OR1 -64457 031 lt0001 04195 003 lt0001 0307 004 lt0001OR10 -50831 014 lt0001 03245 002 lt0001 02014 002 lt0001
Rural 3-Leg Minor Stop Control
OR 100 -51046 024 lt0001 03163 003 lt0001 02112 003 lt0001
Standard Error
49
Table A-3 SPFs Goodness of Fit Results for Urban Northern Operational Region (No 1)
Data Estimation Data 70 Validation Data 30
Subtype Site MSE r2 R2FT MPB MAD MSPE R2
FT
Total VA 41150 0529 0557 -0760 4329 38490 0575
Total R1 4110 051 0551 -020 464 4486 054
FI VA 704 038 0406 -046 194 767 048
Urban 4-Leg Signalized
FI R1 809 039 0439 012 214 950 038
Total VA 224 031 0313 -003 090 238 029
Total R1 308 028 0286 008 095 200 032
FI VA 053 019 0193 000 043 053 019
Urban 4-Leg Minor Stop Control
FI R1 064 018 0187 003 043 048 021
Total VA 2490 038 0370 -064 352 2759 037
Total R1 3034 032 0305 -015 365 2687 037
FI VA 447 028 0259 -019 153 488 026
Urban 3-Leg Signalized
FI R1 559 025 0231 004 157 448 029
Total VA 185 025 0230 -004 089 204 024
Total R1 208 026 0239 -006 094 219 026
FI VA 043 015 0133 -002 043 048 016
Urban 3-Leg Minor Stop Control
FI R1 047 017 0156 -001 044 050 017
50
Table A-4 SPFs Goodness of Fit Results for Urban Western Operational Region (No 10)
Data Estimation Data 70 Validation Data 30
Subtype Site MSE r2 R2FT MPB MAD MSPE R2
FT
Total VA 41150 0529 0557 -0760 4329 38490 0575
Total R10 21976 0777 0735 1290 3233 17910 0686
FI VA 7043 0385 0406 -0458 1938 7671 0475
Urban 4-Leg Signalized
FI R10 4280 0526 0500 0377 1597 5170 0452
Total VA 2238 0315 0313 -0034 0897 2383 0292
Total R10 1161 0361 0300 -0032 0740 1050 0188
FI VA 0530 0194 0193 -0004 0432 0533 0194
Urban 4-Leg Minor Stop Control
FI R10 0312 0197 0187 0000 0382 0330 0009
Total VA 24900 0375 0370 -0645 3519 27591 0369
Total R10 14446 0451 0397 -0168 2801 24410 0255
FI VA 4467 0275 0259 -0185 1527 4875 0262
Urban 3-Leg Signalized
FI R10 3077 0266 0216 0039 1258 3390 0115
Total VA 1854 0254 0230 -0043 0893 2038 0239
Total R10 1391 0233 0197 -0054 0800 1640 0207
FI VA 0428 0151 0133 -0021 0431 0476 0157
Urban 3-Leg Minor Stop Control
FI R10 0354 0111 0089 -0019 0404 0380 0125
51
Table A-5 SPFs Goodness of Fit Results for Urban Eastern Operational Region (No 100)
Data Estimation Data 70 Validation Data 30
Subtype Site MSE r2 R2FT MPB MAD MSPE R2
FT
Total VA 41150 0529 0557 -0760 4329 38490 0575
Total R100 31108 0632 0630 0243 4717 37450 0005
FI VA 7043 0385 0406 -0458 1938 7671 0475
Urban 4-Leg Signalized
FI R100 5201 0480 0454 -0098 1864 5410 0244
Total VA 2238 0315 0313 -0034 0897 2383 0292
Total R100 1720 0443 0381 0087 0758 1150 0003
FI VA 0530 0194 0193 -0004 0432 0533 0194
Urban 4-Leg Minor Stop Control
FI R100 0509 0273 0254 0049 0383 0360 0173
Total VA 24900 0375 0370 -0645 3519 27591 0369
Total R100 17782 0410 0410 -1753 0908 38780 0004
FI VA 4467 0275 0259 -0185 1527 4875 0262
Urban 3-Leg Signalized
FI R100 3194 0243 0263 -0615 1645 5860 0236
Total VA 1854 0254 0230 -0043 0893 2038 0239
Total R100 1561 0233 0210 -0127 0902 2230 0002
FI VA 0428 0151 0133 -0021 0431 0476 0157
Urban 3-Leg Minor Stop Control
FI R100 0387 0131 0116 -0043 0444 0500 0141
52
Table A-6 SPFs Goodness of Fit Results for Rural Northern Operational Region (No 1)
Data Estimation Data 70
Validation Data 30
Subtype Site MSE r2 R2FT MPB MAD MSPE R2
FT
Total VA 10990 0353 0321 0513 2210 10070 -0073
Total R1 20080 0118 0092 -1389 3661 34220 0212
FI VA 2350 0196 0181 0045 1189 2600 -0034
Rural 4-Leg Signalized
FI R1 2920 0057 0052 -1173 1931 9760 0028
Total VA 1090 0182 0167 -0067 0794 1190 0171
Total R1 1990 0190 0245 0001 0942 1640 0173
FI VA 0480 0112 0098 -0022 0504 0530 0110
Rural 4-Leg Minor Stop Control
FI R1 0920 0093 0112 0020 0541 0520 0009
Total VA 5490 0328 0305 -0010 1651 5760 0179
Total R1 11110 0182 0254 -0679 2271 14750 0497
FI VA 1450 0181 0170 -0041 0902 1710 0099
Rural 3-Leg Signalized
FI R1 3230 0131 0153 -0116 1006 2120 0355
Total VA 0690 0144 0104 -0008 0613 0730 0102
Total R1 1210 0245 0196 0030 0712 0930 0126
FI VA 0250 0071 0048 -0009 0345 0260 0048
Rural 3-Leg Minor Stop Control
FI R1 0340 0124 0093 0016 0366 0300 0052
53
Table A-7 SPFs Goodness of Fit Results for Rural Western Operational Region (No 10)
Data Estimation Data 70 Validation Data 30
Subtype Site MSE r2 R2FT MPB MAD MSPE R2
FT
Total VA 10990 0353 0321 0513 2210 10070 -0073
Total R10 6020 0311 0268 0007 1748 6050 0382
FI VA 2350 0196 0181 0045 1189 2600 -0034
Rural 4-Leg Signalized
FI R10 1880 0158 0139 0097 0945 1590 0254
Total VA 1090 0182 0167 -0067 0794 1190 0171
Total R10 1300 0196 0163 0070 0760 1020 0078
FI VA 0480 0112 0098 -0022 0504 0530 0110
Rural 4-Leg Minor Stop Control
FI R10 0560 0142 0118 0025 0495 0480 0014
Total VA 5490 0328 0305 -0010 1651 5760 0179
Total R10 3690 0163 0170 -0432 0748 6740 0039
FI VA 1450 0181 0170 -0041 0902 1710 0099
Rural 3-Leg Signalized
FI R10 0890 0124 0117 -0391 0997 4030 -0066
Total VA 0690 0144 0104 -0008 0613 0730 0102
Total R10 0640 0126 0091 0025 0583 0580 0055
FI VA 0250 0071 0048 -0009 0345 0260 0048
Rural 3-Leg Minor Stop Control
FI R10 0240 0062 0041 0003 0335 0230 0028
54
Table A-8 SPFs Goodness of Fit Results for Rural Eastern Operational Region (No 100)
Data Estimation Data 70 Validation Data 30
Subtype Site MSE r2 R2FT MPB MAD MSPE R2
FT
Total VA 10990 0353 0321 0513 2210 10070 -0073
Total R100 10120 0042 0027 1207 1882 5120 -0307
FI VA 2350 0196 0181 0045 1189 2600 -0034
Rural 4-Leg Signalized
FI R100 2060 0053 0039 0119 0962 1370 -0023
Total VA 1090 0182 0167 -0067 0794 1190 0171
Total R100 0960 0170 0149 -0086 0746 1140 0209
FI VA 0480 0112 0098 -0022 0504 0530 0110
Rural 4-Leg Minor Stop Control
FI R100 0440 0106 0092 -0031 0475 0490 0121
Total VA 5490 0328 0305 -0010 1651 5760 0179
Total R100 2770 0492 0459 0601 1759 6260 0090
FI VA 1450 0181 0170 -0041 0902 1710 0099
Rural 3-Leg Signalized
FI R100 1040 0265 0255 0124 0923 1570 -0055
Total VA 0690 0144 0104 -0008 0613 0730 0102
Total R100 0640 0125 0087 -0037 0601 0690 0119
FI VA 0250 0071 0048 -0009 0345 0260 0048
Rural 3-Leg Minor Stop Control
FI R100 0250 0064 0038 -0013 0345 0270 0062
55
APPENDIX B
RECOMMENDED SAFETY PERFORMANCE FUNCTION MODELS
Table B-1 Recommended Urban SPFs Site Virginia SPF Models to Be Used for Urban Intersections
Urban 4-Leg Signalized Total Virginia generic total
Urban 4-Leg Signalized
Operational Region 1 generic total
Urban 4-Leg Signalized
Operational Region 10
use specified model developed
Urban 4-Leg Signalized
Operational Region 100 generic total
Urban 4-Leg Signalized FI Virginia generic FI
Urban 4-Leg Signalized
Operational Region 1 generic FI
Urban 4-Leg Signalized
Operational Region 10
use specified model developed
Urban 4-Leg Signalized
Operational Region 100
use specified model developed
Urban 4-Leg Minor Stop Control
Total Virginia generic total
Urban 4-Leg Minor Stop Control
Operational Region 1
use specified model developed
Urban 4-Leg Minor Stop Control
Operational Region 10
use specified model developed
Urban 4-Leg Minor Stop Control
Operational Region 100
use specified model developed
Urban 4-Leg Minor Stop Control
FI Virginia generic FI e^-76917MajADT^05001MinADT^03695
Urban 4-Leg Minor Stop Control
Operational Region 1
use specified model developed
Urban 4-Leg Minor Stop Control
Operational Region 10
use specified model developed
Urban 4-Leg Minor Stop Control
Operational Region 100
use specified model developed
56
Table B-1 Recommended Urban SPFs (Continued)
Site Virginia SPF Models to Be Used for Urban Intersections
Urban 3-Leg Signalized
Total Virginia
use generic model developed for total
crashes
Urban 3-Leg Signalized
Operational Region 1
use generic model developed for total
crashes
Urban 3-Leg Signalized
Operational Region 10
use specific regional model
developed
Urban 3-Leg Signalized
Operational Region 100
use generic model developed for total
crashes
Urban 3-Leg Signalized FI Virginia
use generic model developed for FI
crashes
Urban 3-Leg Signalized
Operational Region 1
use generic model developed for FI
crashes
Urban 3-Leg Signalized
Operational Region 10
use specific regional model
developed
Urban 3-Leg Signalized
Operational Region 100
use generic model developed for FI
crashes
Urban 3-Leg Minor Stop Control
Total Virginia
use generic model developed for total
crashes
Urban 3-Leg Minor Stop Control
Operational Region 1
use generic model developed for total
crashes
Urban 3-Leg Minor Stop Control
Operational Region 10
use specific regional model
developed
Urban 3-Leg Minor Stop Control
Operational Region 100
use generic model developed for total
crashes
Urban 3-Leg Minor Stop Control
FI Virginia use generic model developed for FI
crashes
Urban 3-Leg Minor Stop Control
Operational Region 1
use generic model developed for FI
crashes
Urban 3-Leg Minor Stop Control
Operational Region 10
use specific regional model
developed
Urban 3-Leg Minor Stop Control
Operational Region 100
use generic model developed for FI
crashes
57
Table B-2 Recommended Rural SPFs Site Virginia SPF Models to Be Used for Rural Intersections
Rural 4-Leg Signalized Total Virginia
use generic model developed for total
crashes
Rural 4-Leg Signalized
Operational Region 1
use generic model developed for total
crashes
Rural 4-Leg Signalized
Operational Region 10
use specific regional model developed
Rural 4-Leg Signalized
Operational Region 100
use specific regional model developed
Rural 4-Leg Signalized FI Virginia use generic model
developed for FI crashes
Rural 4-Leg Signalized
Operational Region 1
use generic model developed for FI crashes
Rural 4-Leg Signalized
Operational Region 10
use specific regional model developed
Rural 4-Leg Signalized
Operational Region 100
use specific regional model developed
Rural 4-Leg Minor Stop Control Total Virginia
use generic model developed for total
crashes
Rural 4-Leg Minor Stop Control
Operational Region 1
use generic model developed for total
crashes e^-549MajADT^035MinADT^039
Rural 4-Leg Minor Stop Control
Operational Region 10
use specific regional model developed
Rural 4-Leg Minor Stop Control
Operational Region 100
use generic model developed for total
crashes
Rural 4-Leg Minor Stop Control FI Virginia use generic model
developed for FI crashes
Rural 4-Leg Minor Stop Control
Operational Region 1
use generic model developed for FI crashes
Rural 4-Leg Minor Stop Control
Operational Region 10
use generic model developed for FI crashes
Rural 4-Leg Minor Stop Control
Operational Region 100
use generic model developed for FI crashes
58
Table B-2 Recommended Rural SPFs (Continued)
Site Virginia SPF Models to Be Used for Rural Intersections
Rural 3-Leg Signalized Total Virginia use generic model
developed for total crashes
Rural 3-Leg Signalized
Operational Region 1
use generic model developed for total crashes
Rural 3-Leg Signalized
Operational Region 10
use generic model developed for total crashes
Rural 3-Leg Signalized
Operational Region 100
use generic model developed for total crashes
Rural 3-Leg Signalized FI Virginia use generic model
developed for FI crashes
Rural 3-Leg Signalized
Operational Region 1
use generic model developed for FI crashes
Rural 3-Leg Signalized
Operational Region 10
use generic model developed for FI crashes
Rural 3-Leg Signalized
Operational Region 100
use generic model developed for FI crashes
Rural 3-Leg Minor Stop Control Total Virginia use generic model
developed for total crashes
Rural 3-Leg Minor Stop Control
Operational Region 1
use generic model developed for total crashes
Rural 3-Leg Minor Stop Control
Operational Region 10
use specific regional model developed
Rural 3-Leg Minor Stop Control
Operational Region 100
use generic model developed for total crashes
Rural 3-Leg Minor Stop Control FI Virginia use generic model
developed for FI crashes
Rural 3-Leg Minor Stop Control
Operational Region 1
use generic model developed for FI crashes
Rural 3-Leg Minor Stop Control
Operational Region 10
use specific regional model developed
Rural 3-Leg Minor Stop Control
Operational Region 100
use generic model developed for FI crashes

30
The statewide SPFs developed for Virginia are given in Tables 13 through 16 Due to lack of data the analysis for all-way stop intersections could not be undertaken These tables also give the Freeman-Tukey R2
FT coefficient for each of the Virginia SPFs and the corresponding Minnesota SPF and Freeman-Tukey R2
FT based on the Virginia data The R2FT coefficients
obtained indicate that the Virginia-specific SPFs fit the Virginia data better than the suggested Minnesota SPFs for all types of intersections and crash severity except those for FI crashes on urban three-leg signalized rural four-leg signalized and rural four-leg minor stop control intersections where the corresponding RFT
2 values are similar In Table 15 it can be seen that the Minnesota R2
FT value is negative for the rural three-leg minor stop control intersections The negative RFT
2 value is possible because these calculations were not performed on the same data points that were used to create the Minnesota SPFs (Miller 2009) Table 13 SPF Models for Urban TOTAL crashes and R2
FT results for Virginia Statewide (VDOT-maintained roads)
SPF model with TOTAL Crash values
R2FT TOTAL
Crash Data
Site Virginia Statewide Minnesota VA MN
Urban 4-Leg Signalized 056 034
Urban 4-Leg Minor Stop Control
032 022
Urban 3-Leg Signalized 037 031
Urban 3-Leg Minor Stop Control
023 010
Table 14 SPF Models for Urban FI crashes and R2
FT results for Virginia Statewide (VDOT-maintained roads)
SPF model with FI Crash values R2FT FI Crash Data ()
Site
Virginia Statewide Minnesota VA MN
Urban 4-Leg Signalized 041 032
Urban 4-Leg Minor Stop Control
019 008
Urban 3-Leg Signalized 026 026
Urban 3-Leg Minor Stop Control
013 010
31
Table 15 SPF Models for Rural TOTAL Crashes and R2FT Results for Virginia Statewide (VDOT-
maintained roads) SPF model with TOTAL Crash values R2
FT TOTAL Crash Data
Site
Virginia Statewide Minnesota VA MN
Rural 4-Leg Signalized 0321 0290
Rural 4-Leg Minor Stop Control
0167 0132
Rural 3-Leg Signalized 0305 0291
Rural 3-Leg Minor Stop Control
0104 -0102
Table 16 SPF Models for Rural FI crashes and R2
FT results for Virginia Statewide (VDOT-maintained roads) SPF model with FI Crash values R2
FT TOTAL Crash Data
Site
Virginia Statewide Minnesota VA MN
Rural 4-Leg Signalized 0181 0181
Rural 4-Leg Minor Stop Control
0098 0097
Rural 3-Leg Signalized 0170 0180
Rural 3-Leg Minor Stop Control
0048 0012
Figures 7 through 10 show visual representations of how well the Virginia SPFs fit the
Virginia data in comparison with the suggested Minnesota SPFs In general the Virginia SPFs tend to fit the Virginia data better than the Minnesota SPFs although both sets of SPFs tend to have similar fits at low volumes (AADTmajor lt 2000) except for the SPF for total crashes on urban four-leg signalized intersections shown in Figure 7 The primary reason the Minnesota SPFs do not fit the Virginia data as well as the Virginia SPFs may be the dissimilarities of the roadside environment and the characteristics of the different databases
32
0
2
4
6
8
10
12
14
0 20000 40000 60000 80000 100000 120000
AADT Major
Tota
l Cra
shes
Per
Yea
r
Minnesota VA Actual Observed Virginia
Minnesota Model
Virginia M odel
Figure 7 Total crashes per year vs major AADT for urban 4-leg signalized intersections
with minor AADT of 700
0
5
10
15
20
25
30
35
0 20000 40000 60000 80000 100000 120000
AADT Major
Tota
l Cra
shes
per
Yea
r
Minnesota VA Actual Observed Virginia
Minnesota Model
Virginia Model
Figure 8 Total crashes per year vs major AADT for urban 4-leg signalized intersections
with minor AADT of 8000
33
0
2
4
6
8
10
12
14
0 20000 40000 60000 80000 100000 120000
AADT Major
Tota
l Cra
shes
Per
Yea
r
Minnesota VA Actual Observed Virginia
Virginia Model
Minnesota Model
Figure 9 Total crashes per year vs major AADT for rural 4-leg signalized intersections with
minor AADT of 79
0
5
10
15
20
25
0 20000 40000 60000 80000 100000 120000
AADT Major
Tota
l Cra
shes
per
Yea
r
Minnesota VA Actual Observed Virginia
Minnesota Model
Virginia Model
Figure 10 Total crashes per year vs minor AADT for rural 4-leg signalized intersections with major AADT of 5000
As discussed in the Methodology section in addition to the statewide Virginia SPFs
specific SPFs were developed for each operational region to consider the different topographical characteristics that exist across Virginia The complete set of SPFs together with the associated p values for the regression coefficients are shown in Tables A-1 and A-2 of Appendix A All p values are less than 005 with most being less than 00001 except for some of the rural four-leg signalized intersections regional specific SPFs These p values indicate that the estimated coefficients are statistically significant at the 95 confidence level or better A possible reason
34
for higher p values for a small number of SPFs may be the sample size used for developing these SPFs
To test the transferability and fit of the Virginia statewide specific SPFs several
statistical parameters were determined for the 70 (estimation) data set and the 30 (validation) data set separately The corresponding values for each of these parameters were then compared The results are shown in Tables 17 and 18 for urban and rural intersections respectively The results for the regional SPFs are shown in Tables A-3 through A-8 of Appendix A The results indicate that the developed models are transferable to the 30 validation data set For example the MSE values for the 70 estimation data are similar to the MSPE values for the 30 validation data In addition the mean prediction bias MPB values for the 30 validation data are close to zero (-076 le MPB ge -0004) in Table 17 and (-0067 le MPB ge 00513) in Table 18
Table 17 Goodness of Fit Results for Urban Statewide SPFs
Data Estimation data 70 Validation Data 30 Subtype Site MSE r2 R2
FT MPB MAD MSPE R2FT
Total VA 41150 0529 0557 -0760 4329 38490 0575
Total MN
68636 0506 0336 -3145 5421 68156 0315
FI VA
7043 0385 0406 -0458 1938 7671 0475
Urban 4-Leg Signalized
FI MN 7702 0372 0324 -0316 2124 8981 0376
Total VA 2238 0315 0313 -0034 0897 2383 0292
Total MN 2510 0287 0215 0091 0982 2730 0182
FI VA 0530 0194 0193 -0004 0432 0533 0194
Urban 4-Leg Minor Stop Control
FI MN 0560 0182 0080 0128 0522 0577 0052
Total VA 24900 0375 0370 -0645 3519 27591 0369
Total MN 29322 0365 0308 -2238 3661 33079 0272
FI VA 4467 0275 0259 -0185 1527 4875 0262
Urban 3-Leg Signalized
FI MN 4528 0267 0261 -0294 1526 4937 0261
Total VA 1854 0254 0230 -0043 0893 2038 0239
Total MN 2388 0237 0104 -0541 0902 2600 0107
FI VA 0428 0151 0133 -0021 0431 0476 0157
Urban 3-Leg Minor Stop Control
FI MN 0478 0140 0097 -0184 0385 0537 0104
35
Table 18 Goodness of Fit Results for Rural Statewide SPFs
Data Estimation Data 70
Validation Data 30
Subtype Site MSE r2 R2FT MPB MAD MSPE R2
FT
Total VA 10990 0353 0321 0513 2210 10070 -0073
Total MN 12400 0339 0290 -0154 2071 8460 0035
FI VA 2350 0196 0181 0045 1189 2600 -0034
Rural 4-Leg Signalized
FI MN 2400 0188 0181 -0043 1164 2420 0004
Total VA 1090 0182 0167 -0067 0794 1190 0171
Total MN 1190 0167 0132 -0348 0774 1320 0115
FI VA 0480 0112 0098 -0022 0504 0530 0110
Rural 4-Leg Minor Stop Control
FI MN 0500 0104 0097 -0158 0459 0560 0093
Total VA 5490 0328 0305 -0010 1651 5760 0179
Total MN NA NA NA NA NA NA NA
FI VA 1450 0181 0170 -0041 0902 1710 0099
Rural 3-Leg Signalized
FI MN NA NA NA NA NA NA NA
Total VA 0690 0144 0104 -0008 0613 0730 0102
Total MN 0890 0141 -0102 -0404 0555 0940 -0104
FI VA 0250 0071 0048 -0009 0345 0260 0048
Rural 3-Leg Minor Stop Control
FI MN 0270 0068 0012 -0144 0270 0290 0003
Pruning of Virginia-Specific SPFs A total of 64 SPFs were initially developed using the appropriate data for Virginia as shown in Tables A-1 and A-2 of Appendix A Considering that not all regional models might be necessary the pruning process described in the methodology section was carried out to prune the number of SPFs to the minimum effective number as seen in Tables 19 and 20 for urban and rural intersections respectively The pruning process resulted in 19 SPFs for urban sites and 15 for rural sites To facilitate the use of the correct SPF for a specific type of intersection located in a specific region the lists of the appropriate SPFs to be used are given in Tables B-1 and B-2 of Appendix B for the urban and rural intersections respectively
As can be seen in Tables 19 and 20 and Tables A-1 and A-2 of Appendix A there are some trends worth discussing for the benefit of the study and possible future research With regards to the three different operational regions the Western region retained many more of the specific regional urban SPFs than any other region For example the Western regional SPFs were retained for all urban intersection sites whereas for the Eastern region the only SPFs
36
retained were those for urban four-leg signalized FI crashes and urban four-leg minor stop control for total and FI crashes Similarly the only urban SPF retained for the Northern region was that for urban four-leg minor stop control for total crashes For the rural intersection sites all of the Western regional SPFs were retained except those for rural three-leg signalized total and FI crashes and rural four-leg minor stop control FI crashes The majority of the Eastern region rural SPFs were discarded except those for rural four-leg signalized total and FI crashes while for the Northern region all regional SPFs were discarded
The Western region retained more specific regional SPFs than the other two regions This suggests that the intersections in the Western region exhibit more unique characteristics than those for the other regions This may be due to the more mountainous terrain in the Western region compared to those in the Eastern and Northern regions This supports the philosophy of developing specific SPFs based on the topography of different regions
Site Prioritization
To illustrate the benefits of using the EB method to prioritize intersection sites for safety
improvements the top 25 urban sites from the Bristol and Northern Virginia districts were identified by using crash rates critical crash ratio and the EB method The PSI for each site identified was then determined The results obtained are shown in Tables 21 and 22 for the Bristol and the Northern Virginia districts respectively The results indicate that for the Northern Virginia District the PSIs for the top 25 sites are 258 1317 and 27440 crashes per year and for the Bristol District 432 646 and 1496 crashes per year for the crash rates critical crash ratio and EB methods respectively The important thing in Tables 21 and 22 is the sum of the PSI columns ranked by the three methods The sum of each of the PSIs for the crash rate and critical crash ratio method is lower than that for the EB method These results suggest that the use of the EB method in the planning process will identify intersection sites with the highest PSIs and therefore where detailed assessments to determine feasible and effective safety treatments should be undertaken
37
Table 19 MSPE Values for Virginia Urban Statewide and Urban Regional SPFs Used for Pruning
Data Pruning
Subtype
Site
MSPE [MSPEVA-
MSPEOR]1 [abs(MSPEVA-
MSPEOR)]2 [abs(MSPEVA-
MSPEOR)MSPEVA]3
RetainDiscardTotal VA 3849 Northern 4486 -637 637 0165497532 Discard Western 1791 2058 2058 0534684334 Retain Eastern 3745 104 104 0027020005 Discard FI VA 7671 Northern 95 -1829 1829 0238430452 Discard Western 517 2501 2501 0326033112 Retain
Urban 4-Leg Signalized
Eastern 541 2261 2261 0294746448 Retain Total VA 23834 Northern 202 03634 03634 015247126 Retain Western 105 13334 13334 0559452882 Retain Eastern 115 12334 12334 0517496014 Retain FI VA 05327 Northern 048 00527 00527 0098929979 Discard Western 033 02027 02027 0380514361 Retain
Urban 4-Leg Minor Stop Control
Eastern 036 01727 01727 0324197485 Retain Total VA 275911 Northern 2687 07211 07211 0026135239 Discard Western 2441 31811 31811 0115294425 Retain Eastern 3878 -111889 111889 0405525695 Discard FI VA 48754 Northern 448 03954 03954 0081101038 Discard Western 339 14854 14854 0304672437 Retain
Urban 3-Leg Signalized
Eastern 586 -09846 09846 020195266 Discard Total VA 20379 Northern 219 -01521 01521 0074635654 Discard Western 164 03979 03979 0195250012 Retain Eastern 223 -01921 01921 0094263703 Discard FI VA 04756 Northern 05 -00244 00244 0051303616 Discard Western 038 00956 00956 0201009251 Retain
Urban 3-Leg Minor Stop Control
Eastern 05 -00244 00244 0051303616 Discard 1 Difference between mean square prediction error (MSPE) of Virginia statewide model and OR model 2 Absolute value of the difference between Virginia statewide model MSPE and operational region model MSPE 3 Absolute value of the difference between Virginia statewide model MSPE and operational region model MSPE divided by the Virginia statewide MSPE for comparison
Retained SPFs Discarded if value is negative Discarded if less than 01
38
Table 20 MSPE Values for Virginia Rural Statewide and Rural Regional SPFs Used for Pruning Data Pruning
Subtype
Site
MSPE
[MSPEVA-MSPEOR]1
[abs(MSPEVA-MSPEOR)]2
[abs(MSPEVA-MSPEOR)MSPEVA]3
RetainDiscard
Total VA 1007 Northern 3422 -2415 2415 2398212512 Discard Western 605 402 402 0399205561 Retain Eastern 512 495 495 0491559086 Retain FI VA 26 Northern 976 -716 716 2753846154 Discard Western 159 101 101 0388461538 Retain
Rural 4-Leg Signalized
Eastern 137 123 123 0473076923 Retain Total VA 119 Northern 164 -045 045 0378151261 Discard Western 102 017 017 0142857143 Retain Eastern 114 005 005 0042016807 Discard FI VA 053 Northern 052 001 001 0018867925 Discard Western 048 005 005 0094339623 Discard
Rural 4-Leg Minor Stop Control
Eastern 049 004 004 0075471698 Discard Total VA 576 Northern 1475 -899 899 1560763889 Discard Western 674 -098 098 0170138889 Discard Eastern 626 -05 05 0086805556 Discard FI VA 171 Northern 212 -041 041 0239766082 Discard Western 403 -232 232 1356725146 Discard
Rural 3-Leg Signalized
Eastern 157 014 014 0081871345 Discard Total VA 073 Northern 093 -02 02 0273972603 Discard Western 053 02 02 0273972603 Retain Eastern 069 004 004 0054794521 Discard FI VA 026 Northern 03 -004 004 0153846154 Discard Western 023 003 003 0115384615 Retain
Rural 3-Leg Minor Stop Control
Eastern 027 -001 001 0038461538 Discard 1 Difference between mean square prediction error (MSPE) of Virginia statewide model and OR model 2 Absolute value of the difference between Virginia statewide model MSPE and operational region model MSPE 3 Absolute value of the difference between Virginia statewide model MSPE and operational region model MSPE divided by the Virginia statewide MSPE for comparison
Retained SPFs Discarded if value is negative Discarded if less than 01
39
Table 21 PSIs for Top 25 Sites in District 1 Urban (Bristol) FI
Crashes Ranking Based on Crash
Rates Ranking Based on Crash Ratio Ranking Based on EB
Method
Rank Intersection Node
Crash Rate1 PSI2 Intersection
Node Crash Ratio3 PSI Intersection
Node PSI
1 596726 22112 00000 651193 39672 00000 596095 21413
2 606469 20079 00000 606238 39298 06297 596393 08787
3 706818 12504 00000 651075 31264 00000 651130 08453
4 651193 11550 00000 596726 29227 00000 596701 07112 5 651075 09369 00000 606469 28039 00000 651802 06929 6 606238 08382 06297 651233 25831 03612 636331 06726 7 651807 07089 00000 651130 22718 08453 596395 06579 8 651233 06068 03612 706818 22555 00000 596937 06415 9 651230 05990 00000 651230 20301 00000 606238 06297
10 651783 05756 00000 651210 18882 04747 661033 06061 11 636093 04960 00000 636331 17913 06726 596372 05417 12 651274 04475 00000 651807 16847 00000 636372 04808 13 651130 04179 08453 651805 15814 00000 651210 04747 14 651210 03918 04747 651223 15627 03589 636491 04649 15 636331 03393 06726 651783 15009 00000 596420 04633 16 651223 03363 03589 596095 14865 21413 596403 04579 17 606232 03331 00000 636405 14769 00000 651603 04531 18 651127 03053 00000 661033 14555 06061 636056 04351 19 651999 03048 00000 596353 14215 03717 712033 04110 20 596449 02962 00000 636093 13782 00000 704691 04102 21 636405 02811 00000 651879 13192 00000 651838 04100 22 651883 02698 00000 651274 12975 00000 651894 03878 23 596353 02686 03717 651127 12972 00000 596353 03717 24 651805 02663 00000 651999 12959 00000 651233 03612 25 661033 02500 06061 596449 12702 00000 651889 03601
sum 43202 sum 64615 sum 149606 1Number of crashes per year per 1000000 total approach volume 2Potential for safety improvement (crashes yr) the difference between the EB-adjusted long-term crashes and the SPF-estimated crashes 3Ratio of actual crash rate to critical crash rate
40
Table 22 PSIs for Top 25 Sites in District 9 Urban (Northern Virginia District) FI
Crashes Ranking Based on Crash
Rates Ranking Based on Crash Ratio Ranking Based on EB
Method
Rank Intersection Node
Crash Rate1 PSI2 Intersection
Node Crash Ratio3 PSI Intersection
Node PSI
1 718192 191841 00000 718192 257523 00000 264119 150122 2 702946 178194 00000 547722 152371 11175 263375 140091 3 271531 64846 00000 263628 102794 00000 278648 137239 4 263628 52858 00000 263728 100092 00000 276819 131395 5 263728 42215 00000 719754 95274 09444 263290 130743 6 266955 35294 00000 702946 79268 00000 722678 127897 7 547722 34932 11175 263403 77252 05184 264725 118671 8 702612 30441 00000 704237 77175 07648 267028 116627 9 273886 29539 00000 263729 74681 00000 265204 115925
10 716747 27632 00000 271531 72327 00000 274766 115679 11 263626 27139 00000 263135 66458 18068 263249 113372 12 269485 26567 00000 716747 64461 00000 547044 110769 13 728954 26344 00000 266955 56657 00000 549349 107180 14 263729 25208 00000 546138 52003 31028 268210 105630 15 546988 21922 00000 547544 51924 32529 263347 104257 16 274338 21446 00000 263626 50389 00000 276351 102313 17 429308 21354 00000 269485 49897 00000 428167 100064 18 720401 21197 00000 728954 49702 00000 264344 98789 19 267295 20954 00000 548686 49572 03621 277764 91554 20 267536 20874 00000 711601 47985 04440 263467 89259 21 265938 20484 00000 266970 47730 00000 263090 89199 22 273354 20108 00000 546462 46856 03620 703414 88610 23 268345 19362 00000 265938 46726 00000 428629 87379 24 719754 19073 09444 720401 44833 00000 272219 85659 25 263403 19015 05184 728496 43666 04990 428544 85610
Sum 25803 sum 131747 sum 2744033 1Number of crashes per year per 1000000 total approach volume 2Potential for safety improvement (crashes yr) the difference between the EB-adjusted long-term crashes and the SPF-estimated crashes 3Ratio of actual crash rate to critical crash rate
41
CONCLUSIONS
bull The development of SPFs for intersections is necessary for Virginia because the SafetyAnalyst-suggested SPFs which are based on Minnesota data do not represent the Virginia data well Regarding the fit of the SPFs to Virginia data the R2
FT values shown in Tables 13 through 16 for Minnesota and Virginia indicate that the Virginia-specific SPFs fit the Virginia data better than the Minnesota models This may be due to the dissimilarities of the roadside environment such as difference in topography and the characteristics of the different Virginia and Minnesota databases
bull In some cases the specific regional SPFs fit the regional data better than the statewide
SPFs suggesting that the specific SPFs should be considered for use when available These group divisions that have similar roadway characteristics and driver expectations in some cases tend to improve the fit
bull In identifying intersection sites for safety improvements it is clearly beneficial for the EB
method to be used with the suitable SPFs rather than a crash rate or critical ratio method Results of the site prioritization show a much higher potential for crash reduction when the EB method is used with the appropriate SPFs rather than a procedure based on crash rates or critical rates
RECOMMENDATIONS
1 VDOTrsquos TED should use the Virginia-specific SPFs when using the SafetyAnalyst tools The results of this study have shown that the Virginia-specific SPFs reflected the Virginia data better than the SafetyAnalyst-recommended Minnesota SPFs
2 VDOTrsquos TED should investigate the feasibility of using multiple SPFs in SafetyAnalyst If
feasible regional SPFs should be used If it is not currently feasible to use multiple SPFs VDOTrsquos TED should ask that the FHWA include regional information in SafetyAnalyst so as to allow the use of regional SPFs For the specific regional SPFs to be applied to Virginia and other states the SafetyAnalyst tool should be capable of incorporating the necessary data that support the regional models
3 As soon as it is feasible to use regional SPFs VDOTrsquos TED should use the 19 SPFs
developed for urban intersections and the 15 developed for rural intersections when using the tools in SafetyAnalyst Although the statewide SPFs are available for use by an analyst the specific regional models included in the final set of SPFs will predict crashes better than the statewide SPFs The regional analysis will not only ease the use of specific regional SPFs but will also be of benefit when predicting the potential for safety improvement of a specific site
4 For future similar SPF studies VDOTrsquos TED should be directly involved in screening the
traffic data for accuracy and consistency as was done in this study The direct involvement of the TED in the screening of the traffic data significantly contributed to the accuracy of the
42
data and greatly contributed to the confidence the researchers place on the data used in the study
5 The Virginia Transportation Research Council (VTRC) should conduct a study as soon as
feasible to verify whether incorporating independent variables for which data are available other than AADT such as intersection geometry and other characteristics will result in SPFs that better fit the Virginia data Although the currently suggested SafetyAnalyst SPFs use only the AADTs as the independent variables it is likely that provision will be made for use of SPFs that incorporate other independent variables such as number of approaches entering lanes and the other variables for which data are available as these SPFs are likely to give better fit to crash data
6 As soon as feasible VTRC should undertake a study to develop SPFs for the urban system
intersections which are not currently maintained by VDOT as these intersections may have different crash characteristics than those maintained by VDOT This would facilitate the use of SafetyAnalyst in programming sites that are currently not being maintained by VDOT
BENEFITS AND IMPLEMENTATION PROSPECTS
Significant benefits will be accrued by the use of the Virginia-specific SPFs developed in this study This is clearly illustrated in two ways First in examining the transferability of the suggested SPFs in SafetyAnalyst it is clear that these SPFs do not fit the Virginia data very well The results also indicate that the Virginia-specific SPFs fit the Virginia data much better than the suggested SafetyAnalyst SPFs Second the availability of the Virginia-specific SPFs will enhance the use of the EB procedure given in SafetyAnalyst for prioritizing sites for safety improvements This study has also shown that the EB method better identifies sites with higher potential for crash reduction than those identified by crash rates For example the illustrated examples given for the Bristol and Northern Virginia districts show that the potential reduction in FI crashes when the top 25 sites are identified by the EB method is 28936 (1496 + 27440) crashes per year whereas that obtained when the critical crash ratio method is used for prioritization is only 1963 (646 + 1317) and that obtained with the crash rate method is only 690 (432 + 258) crashes per year This gives a net benefit of 26973 potential crashes per year compared to the critical crash ratio method and 28246 compared to the crash rate method Assuming an average cost of FI crashes of $95629 (FHWA 2005) and only 10 of the estimated net benefit PSI of 28246 crashes per year is achieved the total savings of more than $27 million per year could be accrued The prospects for implementation of the recommendations are very high as the study was requested by VDOTrsquos TED which is planning to incorporate these SPFs in the use of the tools provided in SafetyAnalyst
43
ACKNOWLEDGMENTS
The authors appreciate the opportunity afforded them by VDOT and VTRC to conduct this study Special thanks to Stephen Read (VDOT) Dr In-Kyu Lim (VDOT) Dr Young-Jun Kweon (VTRC) and VDOTrsquos Central Office for their interest and support in SPFs and their help in the selection of intersection sites Many thanks to Lewis Woodson (VTRC) and James Hill (University of Virginia) for all their help and input throughout the study
REFERENCES Cogburn P VDOT Interagency Coordination 2007 Virginia Emergency Management
Conference Virginia Department of Transportation Richmond April 2007 Colorado Department of Transportation DTD Applied Research and Innovation Branch Safety
Performance Functions for Intersections CDOT-2009-10 Denver December 2009 Fridstroslashm L Ifver J Ingebrigtsen S Kulmala R and Thomsen LK Measuring the
Contribution of Randomness Exposure Weather and Daylight to the Variation in Road Accidents Counts Accident Analysis and Prevention Vol 27 No 1 1995 pp 1-20
Federal Highway Administration Cost of Crashes by Severity Table FHWA-HRT-05-051
Washington DC 2005 Federal Highway Administration SafetyAnalyst Home Page httpwwwsafetyanalystorg
Accessed February 2010 Garber N and Hoel L Traffic amp Highway Engineering 4th ed Cenage Learning Toronto
Canada 2009 Garber NJ Haas PR and Gosse C Development of Safety Performance Functions for Two-
Lane Roads Maintained by the Virginia Department of Transportation VTRC 10-R25 Virginia Transportation Research Council Charlottesville 2010
Hamidi A Fontaine MD and Demetsky MJ A Planning-Level Methodology for Identifying
High-Crash Sections of Virginiarsquos Primary System VTRC 11-R4 Virginia Transportation Research Council Charlottesville 2010
Harwood D Council FM Hauer E Hughes WE and Vogt A Prediction of the Expected
Safety Performance of Rural Two-lane Highways Federal Highway Administration McLean VA December 2000
Harwood DW Bauer KM Richard KR Gilmore DK Persaud B and Lyon C
Development of SPFs for Safety Analyst Interim Tools Technical Memorandum
44
Prepared by Midwest Research Institute for the Federal Highway Administration McLean VA 2004
ITT Corporation SafetyAnalyst Userrsquos Manual Turner-Fairbank Highway Research Center
McLean VA 2008 Jonsson T Ivan J and Zhang C Crash Prediction Models for Intersections on Rural
Multilane Highways Differences by Collision Type In Transportation Research Record Journal of the Transportation Research Board No 2019 Transportation Research Board of the National Academies Washington DC 2007 pp 91-98
Kweon Y-J and Lim I-K Appropriate Regression Model Types for the Empirical Bayes
Method and SafetyAnalyst In Proceedings of the 89th Annual Meeting of the Transportation Research Board Transportation Research Board of the National Academies Washington DC 2010
Kononov J Bailey B and Allery B Exploratory Examination of the Functional Form of
Safety Performance Functions of Urban Freeways Colorado Department of Transportation and San Diego State University Denver CO 2008
Lyon C Haq A Persaud B and Kodama S Safety Performance Functions for Signalized
Intersections in Large Urban Areas Development and Application to Evaluation of Left-Turn Priority Treatment In Transportation Research Record Journal of the Transportation Research Board No 1908 Transportation Research Board of the National Academies Washington DC 2005 pp 165-171
Lord D and Persaud B Estimating the Safety Performance of Urban Road Transportation
Networks Center for Transportation Safety Texas Transportation Institute Texas AampM University and Department of Civil Engineering Ryerson University College Station TX 2003 pp 609-620
Miaou S-P Lu A and Lum H S Pitfalls of using R2 to Evaluate Goodness of Fit of
Accident Prediction Models In Transportation Research Record Journal of the Transportation Research Board No 1542 Transportation Research Board of the National Academies Washington DC 2005 1996 pp 6-13
Miller P Re Negative R squared Email Archive Division of Biostatistics Washington
University in St Louis February 2 2005 February 2 2005 httpwwwbiostatwustleduarchiveshtmljmp-l2005msg00075html Accessed February 2010
Persaud B Lord D and Palmisano J Calibration and Transferability of Accident Prediction
Models for Urban Intersections In Transportation Research Record Journal of the Transportation Research Board No 1784 Transportation Research Board of the National Academies Washington DC 2002 pp 57-64
45
Persaud B and Nguyen T Disaggregate Safety Performance Models for Signalized Intersections on Ontario Provincial Roads In Transportation Research Record Journal of the Transportation Research Board No 1635 Transportation Research Board of the National Academies Washington DC 1998 pp 113-120
Pham T and Ragland D Summary of Crash Prediction Models Also known as Safety
Performance Functions (SPFs) California Partners for Advanced Traffic and Highways and University of California Berkeley Berkeley 2005
SAS Institute Inc SAS OnlineDoc Version Eight Cary NC
httpwwwtecnionacildocssasril Accessed 2009 Tegge RA Jo J-H and Ouyang Y Development and Application of Safety Performance
Functions for Illinois ICT-10-066 Illinois Center for Transportation University of Illinois Urbana-Champaign March 2010
Virginiarsquos Surface Transportation Safety Executive Committee Commonwealth of Virginiarsquos
Strategic Highway Safety Plan 2006-2010 Virginia Department of Transportation Richmond 2006
Washington S Persaud B Lyon C and Oh J Validation of Accident Models for
Intersections FHWA-RD-03-037 Federal Highway Administration McLean VA 2005
46
47
APPENDIX A
STATISTICAL PARAMETERS AND GOODNESS-OF-FIT RESULTS
Table A-1 Statistical Parameters for Urban Intersections SPFs Parameter Estimates
Data Intercept
Coefficient of Mayor AADT
Coefficient of Minor AADT
Subtype Site Intercept (α)
StndError
P value
lnMajor (β1)
StndError
P value
lnMinor (β2)
StndError
P value
Total VA -76234 048 lt0001 06742 005 lt0001 03453 003 lt0001
OR1 -83067 056 lt0001 07522 005 lt0001 0328 003 lt0001OR10 -123913 122 lt0001 10631 013 lt0001 04567 006 lt0001OR 100 -88553 077 lt0001 07825 007 lt0001 03706 004 lt0001FI VA -85256 057 lt0001 06477 006 lt0001 03579 004 lt0001OR1 -96546 063 lt0001 07603 006 lt0001 03597 004 lt0001OR10 -114284 15 lt0001 08662 016 lt0001 04412
Urban 4-Leg Signalized
OR 100 -99582 100 lt0001 07484 009 lt0001 04017 005 lt0001Total VA -60723 022 lt0001 04558 002 lt0001 0347 004 lt0001
OR1 -6059 044 lt0001 0505 004 lt0001 02773 006 lt0001OR10 -67031 057 lt0001 03986 007 lt0001 04999 009 lt0001OR 100 -65388 032 lt0001 04689 004 lt0001 043 006 lt0001FI VA -76917 032 lt0001 05001 003 lt0001 03695 005 lt0001OR1 -81437 060 lt0001 05813 005 lt0001 03188 008 lt0001OR10 -80333 063 lt0001 03446 007 lt0001 06218 010 lt0001
Urban 4-Leg Minor Stop Control
OR 100 -83166 051 lt0001 05253 006 lt0001 04695 008 lt0001Total VA -6543 082 lt0001 06591 008 lt0001 02119 002 lt0001
OR1 -4999 103 lt0001 05555 009 lt0001 01554 003 lt0001OR10 -96143 127 lt0001 08677 012 lt0001 03297 005 lt0001OR 100 -67518 110 lt0001 06157 011 lt0001 02969 005 lt0001FI VA -84268 068 lt0001 07147 006 lt0001 02481 002 lt0001OR1 -73982 099 lt0001 06496 009 lt0001 02088 003 lt0001OR10 -110104 155 lt0001 0908 015 lt0001 03226 006 lt0001
Urban 3-Leg Signalized
OR 100 -7266 107 lt0001 05508 011 lt0001 03107 006 lt0001Total VA -54696 013 lt0001 04874 002 lt0001 01985 001 lt0001
OR1 -5361 018 lt0001 04959 002 lt0001 01676 002 lt0001OR10 -5773 034 lt0001 04877 003 lt0001 02314 004 lt0001OR 100 -51642 021 lt0001 04338 003 lt0001 02309 003 lt0001FI VA -74642 018 lt0001 05791 002 lt0001 02091 002 lt0001OR1 -76877 027 lt0001 06204 003 lt0001 0181 002 lt0001OR10 -69458 047 lt0001 05096 004 lt0001 02212 005 lt0001
Urban 3-Leg Minor Stop Control
OR 100 -69883 031 lt0001 05169 004 lt0001 02308 003 lt0001 Standard Error
48
Table A-2 Statistical Parameters for Rural Intersections SPFs Parameter Estimates
Data Intercept
Coefficient of Mayor AADT
Coefficient of Minor AADT
Subtype Site Intercept (α)
StndError
P value
lnMajor (β1)
Stnd Error
P value
lnMinor (β2)
Stnd Error
P value
Total VA -69589 118 lt0001 06746 009 lt0001 0253 009 00047
OR1 -1604 237 04974 02284 021 02791 01514 012 0211 OR10 -63951 183 00005 05508 014 00001 03106 014 00224 OR 100 -06468 220 07692 02262 016 01635 -00158 017 09274 FI VA -87116 128 lt0001 07839 011 lt0001 02166 009 0013 OR1 -33285 246 01767 03601 024 0126 00597 013 06478 OR10 -80583 175 lt0001 06809 018 00001 02557 013 0057
Rural 4-Leg Signalized
OR 100 -48381 221 00287 04243 018 00193 01523 018 03943 Total VA -5494 020 lt0001 03533 002 lt0001 03935 003 lt0001
OR1 -62351 058 lt0001 04167 006 lt0001 04507 008 lt0001OR10 -53594 028 lt0001 03379 003 lt0001 03998 004 lt0001OR 100 -51255 027 lt0001 02914 003 lt0001 04075 004 lt0001FI VA -66927 030 lt0001 03899 003 lt0001 04156 004 lt0001OR1 -82561 095 lt0001 05221 009 lt0001 04962 012 lt0001OR10 -70797 044 lt0001 03789 004 lt0001 0497 005 lt0001
Rural 4-Leg Minor Stop Control
OR 100 -63326 038 lt0001 03223 004 lt0001 04424 005 lt0001Total VA -75754 084 lt0001 06465 008 lt0001 03332 008 lt0001
OR1 -58798 220 00075 05076 020 00143 0313 013 00161 OR10 -64368 110 lt0001 0544 011 lt0001 02863 006 lt0001OR 100 -9899 139 lt0001 08047 015 lt0001 04386 006 lt0001FI VA -87112 103 lt0001 07224 010 lt0001 02578 006 lt0001OR1 -9219 260 00004 07258 022 00011 03407 016 00326 OR10 -88607 146 lt0001 07059 016 lt0001 02809 008 00009
Rural 3-Leg Signalized
OR 100 -111835 185 lt0001 08669 018 lt0001 03977 008 lt0001Total VA -43293 008 lt0001 03366 001 lt0001 02087 001 lt0001
OR1 -50904 022 lt0001 0406 002 lt0001 02752 003 lt0001OR10 -40969 009 lt0001 03133 001 lt0001 02001 001 lt0001OR 100 -4231 016 lt0001 02997 002 lt0001 02308 003 lt0001FI VA -53415 011 lt0001 03394 001 lt0001 02237 001 lt0001OR1 -64457 031 lt0001 04195 003 lt0001 0307 004 lt0001OR10 -50831 014 lt0001 03245 002 lt0001 02014 002 lt0001
Rural 3-Leg Minor Stop Control
OR 100 -51046 024 lt0001 03163 003 lt0001 02112 003 lt0001
Standard Error
49
Table A-3 SPFs Goodness of Fit Results for Urban Northern Operational Region (No 1)
Data Estimation Data 70 Validation Data 30
Subtype Site MSE r2 R2FT MPB MAD MSPE R2
FT
Total VA 41150 0529 0557 -0760 4329 38490 0575
Total R1 4110 051 0551 -020 464 4486 054
FI VA 704 038 0406 -046 194 767 048
Urban 4-Leg Signalized
FI R1 809 039 0439 012 214 950 038
Total VA 224 031 0313 -003 090 238 029
Total R1 308 028 0286 008 095 200 032
FI VA 053 019 0193 000 043 053 019
Urban 4-Leg Minor Stop Control
FI R1 064 018 0187 003 043 048 021
Total VA 2490 038 0370 -064 352 2759 037
Total R1 3034 032 0305 -015 365 2687 037
FI VA 447 028 0259 -019 153 488 026
Urban 3-Leg Signalized
FI R1 559 025 0231 004 157 448 029
Total VA 185 025 0230 -004 089 204 024
Total R1 208 026 0239 -006 094 219 026
FI VA 043 015 0133 -002 043 048 016
Urban 3-Leg Minor Stop Control
FI R1 047 017 0156 -001 044 050 017
50
Table A-4 SPFs Goodness of Fit Results for Urban Western Operational Region (No 10)
Data Estimation Data 70 Validation Data 30
Subtype Site MSE r2 R2FT MPB MAD MSPE R2
FT
Total VA 41150 0529 0557 -0760 4329 38490 0575
Total R10 21976 0777 0735 1290 3233 17910 0686
FI VA 7043 0385 0406 -0458 1938 7671 0475
Urban 4-Leg Signalized
FI R10 4280 0526 0500 0377 1597 5170 0452
Total VA 2238 0315 0313 -0034 0897 2383 0292
Total R10 1161 0361 0300 -0032 0740 1050 0188
FI VA 0530 0194 0193 -0004 0432 0533 0194
Urban 4-Leg Minor Stop Control
FI R10 0312 0197 0187 0000 0382 0330 0009
Total VA 24900 0375 0370 -0645 3519 27591 0369
Total R10 14446 0451 0397 -0168 2801 24410 0255
FI VA 4467 0275 0259 -0185 1527 4875 0262
Urban 3-Leg Signalized
FI R10 3077 0266 0216 0039 1258 3390 0115
Total VA 1854 0254 0230 -0043 0893 2038 0239
Total R10 1391 0233 0197 -0054 0800 1640 0207
FI VA 0428 0151 0133 -0021 0431 0476 0157
Urban 3-Leg Minor Stop Control
FI R10 0354 0111 0089 -0019 0404 0380 0125
51
Table A-5 SPFs Goodness of Fit Results for Urban Eastern Operational Region (No 100)
Data Estimation Data 70 Validation Data 30
Subtype Site MSE r2 R2FT MPB MAD MSPE R2
FT
Total VA 41150 0529 0557 -0760 4329 38490 0575
Total R100 31108 0632 0630 0243 4717 37450 0005
FI VA 7043 0385 0406 -0458 1938 7671 0475
Urban 4-Leg Signalized
FI R100 5201 0480 0454 -0098 1864 5410 0244
Total VA 2238 0315 0313 -0034 0897 2383 0292
Total R100 1720 0443 0381 0087 0758 1150 0003
FI VA 0530 0194 0193 -0004 0432 0533 0194
Urban 4-Leg Minor Stop Control
FI R100 0509 0273 0254 0049 0383 0360 0173
Total VA 24900 0375 0370 -0645 3519 27591 0369
Total R100 17782 0410 0410 -1753 0908 38780 0004
FI VA 4467 0275 0259 -0185 1527 4875 0262
Urban 3-Leg Signalized
FI R100 3194 0243 0263 -0615 1645 5860 0236
Total VA 1854 0254 0230 -0043 0893 2038 0239
Total R100 1561 0233 0210 -0127 0902 2230 0002
FI VA 0428 0151 0133 -0021 0431 0476 0157
Urban 3-Leg Minor Stop Control
FI R100 0387 0131 0116 -0043 0444 0500 0141
52
Table A-6 SPFs Goodness of Fit Results for Rural Northern Operational Region (No 1)
Data Estimation Data 70
Validation Data 30
Subtype Site MSE r2 R2FT MPB MAD MSPE R2
FT
Total VA 10990 0353 0321 0513 2210 10070 -0073
Total R1 20080 0118 0092 -1389 3661 34220 0212
FI VA 2350 0196 0181 0045 1189 2600 -0034
Rural 4-Leg Signalized
FI R1 2920 0057 0052 -1173 1931 9760 0028
Total VA 1090 0182 0167 -0067 0794 1190 0171
Total R1 1990 0190 0245 0001 0942 1640 0173
FI VA 0480 0112 0098 -0022 0504 0530 0110
Rural 4-Leg Minor Stop Control
FI R1 0920 0093 0112 0020 0541 0520 0009
Total VA 5490 0328 0305 -0010 1651 5760 0179
Total R1 11110 0182 0254 -0679 2271 14750 0497
FI VA 1450 0181 0170 -0041 0902 1710 0099
Rural 3-Leg Signalized
FI R1 3230 0131 0153 -0116 1006 2120 0355
Total VA 0690 0144 0104 -0008 0613 0730 0102
Total R1 1210 0245 0196 0030 0712 0930 0126
FI VA 0250 0071 0048 -0009 0345 0260 0048
Rural 3-Leg Minor Stop Control
FI R1 0340 0124 0093 0016 0366 0300 0052
53
Table A-7 SPFs Goodness of Fit Results for Rural Western Operational Region (No 10)
Data Estimation Data 70 Validation Data 30
Subtype Site MSE r2 R2FT MPB MAD MSPE R2
FT
Total VA 10990 0353 0321 0513 2210 10070 -0073
Total R10 6020 0311 0268 0007 1748 6050 0382
FI VA 2350 0196 0181 0045 1189 2600 -0034
Rural 4-Leg Signalized
FI R10 1880 0158 0139 0097 0945 1590 0254
Total VA 1090 0182 0167 -0067 0794 1190 0171
Total R10 1300 0196 0163 0070 0760 1020 0078
FI VA 0480 0112 0098 -0022 0504 0530 0110
Rural 4-Leg Minor Stop Control
FI R10 0560 0142 0118 0025 0495 0480 0014
Total VA 5490 0328 0305 -0010 1651 5760 0179
Total R10 3690 0163 0170 -0432 0748 6740 0039
FI VA 1450 0181 0170 -0041 0902 1710 0099
Rural 3-Leg Signalized
FI R10 0890 0124 0117 -0391 0997 4030 -0066
Total VA 0690 0144 0104 -0008 0613 0730 0102
Total R10 0640 0126 0091 0025 0583 0580 0055
FI VA 0250 0071 0048 -0009 0345 0260 0048
Rural 3-Leg Minor Stop Control
FI R10 0240 0062 0041 0003 0335 0230 0028
54
Table A-8 SPFs Goodness of Fit Results for Rural Eastern Operational Region (No 100)
Data Estimation Data 70 Validation Data 30
Subtype Site MSE r2 R2FT MPB MAD MSPE R2
FT
Total VA 10990 0353 0321 0513 2210 10070 -0073
Total R100 10120 0042 0027 1207 1882 5120 -0307
FI VA 2350 0196 0181 0045 1189 2600 -0034
Rural 4-Leg Signalized
FI R100 2060 0053 0039 0119 0962 1370 -0023
Total VA 1090 0182 0167 -0067 0794 1190 0171
Total R100 0960 0170 0149 -0086 0746 1140 0209
FI VA 0480 0112 0098 -0022 0504 0530 0110
Rural 4-Leg Minor Stop Control
FI R100 0440 0106 0092 -0031 0475 0490 0121
Total VA 5490 0328 0305 -0010 1651 5760 0179
Total R100 2770 0492 0459 0601 1759 6260 0090
FI VA 1450 0181 0170 -0041 0902 1710 0099
Rural 3-Leg Signalized
FI R100 1040 0265 0255 0124 0923 1570 -0055
Total VA 0690 0144 0104 -0008 0613 0730 0102
Total R100 0640 0125 0087 -0037 0601 0690 0119
FI VA 0250 0071 0048 -0009 0345 0260 0048
Rural 3-Leg Minor Stop Control
FI R100 0250 0064 0038 -0013 0345 0270 0062
55
APPENDIX B
RECOMMENDED SAFETY PERFORMANCE FUNCTION MODELS
Table B-1 Recommended Urban SPFs Site Virginia SPF Models to Be Used for Urban Intersections
Urban 4-Leg Signalized Total Virginia generic total
Urban 4-Leg Signalized
Operational Region 1 generic total
Urban 4-Leg Signalized
Operational Region 10
use specified model developed
Urban 4-Leg Signalized
Operational Region 100 generic total
Urban 4-Leg Signalized FI Virginia generic FI
Urban 4-Leg Signalized
Operational Region 1 generic FI
Urban 4-Leg Signalized
Operational Region 10
use specified model developed
Urban 4-Leg Signalized
Operational Region 100
use specified model developed
Urban 4-Leg Minor Stop Control
Total Virginia generic total
Urban 4-Leg Minor Stop Control
Operational Region 1
use specified model developed
Urban 4-Leg Minor Stop Control
Operational Region 10
use specified model developed
Urban 4-Leg Minor Stop Control
Operational Region 100
use specified model developed
Urban 4-Leg Minor Stop Control
FI Virginia generic FI e^-76917MajADT^05001MinADT^03695
Urban 4-Leg Minor Stop Control
Operational Region 1
use specified model developed
Urban 4-Leg Minor Stop Control
Operational Region 10
use specified model developed
Urban 4-Leg Minor Stop Control
Operational Region 100
use specified model developed
56
Table B-1 Recommended Urban SPFs (Continued)
Site Virginia SPF Models to Be Used for Urban Intersections
Urban 3-Leg Signalized
Total Virginia
use generic model developed for total
crashes
Urban 3-Leg Signalized
Operational Region 1
use generic model developed for total
crashes
Urban 3-Leg Signalized
Operational Region 10
use specific regional model
developed
Urban 3-Leg Signalized
Operational Region 100
use generic model developed for total
crashes
Urban 3-Leg Signalized FI Virginia
use generic model developed for FI
crashes
Urban 3-Leg Signalized
Operational Region 1
use generic model developed for FI
crashes
Urban 3-Leg Signalized
Operational Region 10
use specific regional model
developed
Urban 3-Leg Signalized
Operational Region 100
use generic model developed for FI
crashes
Urban 3-Leg Minor Stop Control
Total Virginia
use generic model developed for total
crashes
Urban 3-Leg Minor Stop Control
Operational Region 1
use generic model developed for total
crashes
Urban 3-Leg Minor Stop Control
Operational Region 10
use specific regional model
developed
Urban 3-Leg Minor Stop Control
Operational Region 100
use generic model developed for total
crashes
Urban 3-Leg Minor Stop Control
FI Virginia use generic model developed for FI
crashes
Urban 3-Leg Minor Stop Control
Operational Region 1
use generic model developed for FI
crashes
Urban 3-Leg Minor Stop Control
Operational Region 10
use specific regional model
developed
Urban 3-Leg Minor Stop Control
Operational Region 100
use generic model developed for FI
crashes
57
Table B-2 Recommended Rural SPFs Site Virginia SPF Models to Be Used for Rural Intersections
Rural 4-Leg Signalized Total Virginia
use generic model developed for total
crashes
Rural 4-Leg Signalized
Operational Region 1
use generic model developed for total
crashes
Rural 4-Leg Signalized
Operational Region 10
use specific regional model developed
Rural 4-Leg Signalized
Operational Region 100
use specific regional model developed
Rural 4-Leg Signalized FI Virginia use generic model
developed for FI crashes
Rural 4-Leg Signalized
Operational Region 1
use generic model developed for FI crashes
Rural 4-Leg Signalized
Operational Region 10
use specific regional model developed
Rural 4-Leg Signalized
Operational Region 100
use specific regional model developed
Rural 4-Leg Minor Stop Control Total Virginia
use generic model developed for total
crashes
Rural 4-Leg Minor Stop Control
Operational Region 1
use generic model developed for total
crashes e^-549MajADT^035MinADT^039
Rural 4-Leg Minor Stop Control
Operational Region 10
use specific regional model developed
Rural 4-Leg Minor Stop Control
Operational Region 100
use generic model developed for total
crashes
Rural 4-Leg Minor Stop Control FI Virginia use generic model
developed for FI crashes
Rural 4-Leg Minor Stop Control
Operational Region 1
use generic model developed for FI crashes
Rural 4-Leg Minor Stop Control
Operational Region 10
use generic model developed for FI crashes
Rural 4-Leg Minor Stop Control
Operational Region 100
use generic model developed for FI crashes
58
Table B-2 Recommended Rural SPFs (Continued)
Site Virginia SPF Models to Be Used for Rural Intersections
Rural 3-Leg Signalized Total Virginia use generic model
developed for total crashes
Rural 3-Leg Signalized
Operational Region 1
use generic model developed for total crashes
Rural 3-Leg Signalized
Operational Region 10
use generic model developed for total crashes
Rural 3-Leg Signalized
Operational Region 100
use generic model developed for total crashes
Rural 3-Leg Signalized FI Virginia use generic model
developed for FI crashes
Rural 3-Leg Signalized
Operational Region 1
use generic model developed for FI crashes
Rural 3-Leg Signalized
Operational Region 10
use generic model developed for FI crashes
Rural 3-Leg Signalized
Operational Region 100
use generic model developed for FI crashes
Rural 3-Leg Minor Stop Control Total Virginia use generic model
developed for total crashes
Rural 3-Leg Minor Stop Control
Operational Region 1
use generic model developed for total crashes
Rural 3-Leg Minor Stop Control
Operational Region 10
use specific regional model developed
Rural 3-Leg Minor Stop Control
Operational Region 100
use generic model developed for total crashes
Rural 3-Leg Minor Stop Control FI Virginia use generic model
developed for FI crashes
Rural 3-Leg Minor Stop Control
Operational Region 1
use generic model developed for FI crashes
Rural 3-Leg Minor Stop Control
Operational Region 10
use specific regional model developed
Rural 3-Leg Minor Stop Control
Operational Region 100
use generic model developed for FI crashes
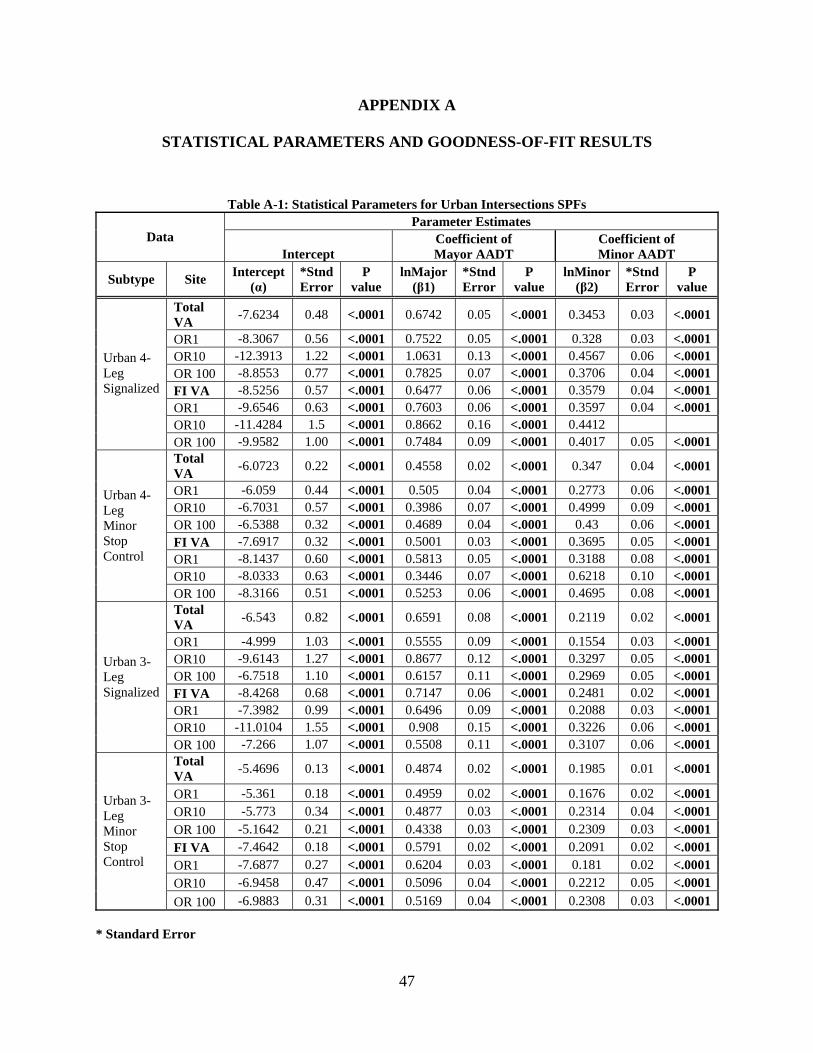
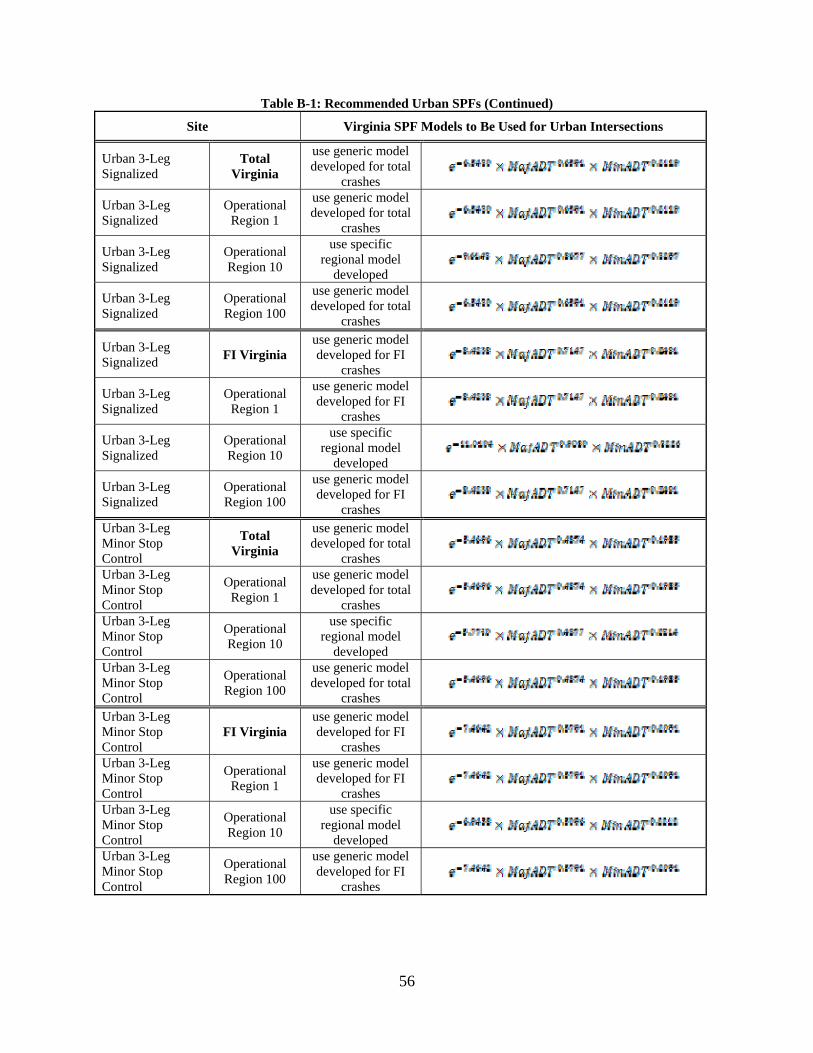