Embed Size (px)
Citation preview

Safety Performance Functions to Assess the Safety Risk of Urban Residential Collector Roads
Sudip Barua Graduate Research Assistant
Department of Civil and Environmental Engineering University of Alberta, Edmonton, AB, Canada
780-399-8073 Email: [email protected]
Karim El-Basyouny, PhD City of Edmonton Assistant Professor of Urban Traffic Safety
Department of Civil and Environmental Engineering University of Alberta, Edmonton, AB, Canada
780-492-9564 Email: [email protected]
Md. Tazul Islam, MSc Graduate Research Assistant
Department of Civil and Environmental Engineering University of Alberta, Edmonton, AB, Canada
780-492-0658 Email: [email protected]
Paper prepared for presentation at the Technical Session of the 2014 Conference of the Transportation Association of Canada
Montreal, Quebec

2
ABSTRACT
Previous research shows that various geometric and non-geometric road elements significantly affect collision occurrence and severity on highways and arterial roads; however, little is known about how these elements affect the safety performance of urban residential collector roads. Therefore, this study investigated the impact of these elements on collision occurrence and collision severity for urban residential collector roads. An extensive data collection effort was conducted to synthesize collision records, traffic counts, road geometry, traffic control and other features of residential collector road segments in the city of Edmonton (COE), Alberta, Canada. Negative binomial safety performance functions (SPFs) were developed for total collision occurrence and collision severity using four years of data. The proposed models were estimated using the maximum likelihood estimation technique under a Bayesian context. An outlier test was performed to improve the models’ goodness-of-fit. Scaled Deviance (SD) and the Pearson
2χ statistic were used to assess the models’ goodness-of-fit. Results reveal that the exposure covariates (segment length and traffic volume) are highly significant and positively related to the predicted collisions in all of the SPFs. The property damage only (PDO) collision model has the same significant covariates as the total collisions model, indicating that the number of PDO collisions is predominantly higher than other collisions. For predicted total and PDO collisions, there is a statistically significant positive relationship between collisions and access-point density, stop-controlled intersection density, the presence of a horizontal curve, the presence of a licensed premises, the presence of a seniors’ centre and the presence of on-street parking. In contrast, there is a significant negative relationship between the presence of median and predicted total and PDO collisions. For severe (i.e., fatal and injury) collisions, there is a statistically significant positive relationship between collisions and segment length, traffic volume, number of lanes, access-point density, stop-controlled intersection density, bus stop density, the presence of a horizontal curve, the presence of a licensed premises, the presence of a seniors’ centre and the presence of on-street parking. On the contrary, there is a significant negative relationship between predicted severe collisions and the presence of a median, the presence of a centre line and the presence of manned enforcement sites. From a model application perspective, the city authority could use this information to assess the associated safety risk of different geometric and non-geometric road elements on residential collector roads and, hence, prioritize collision prone road segments.
Keywords: Safety performance functions, negative binomial distribution, residential collector roads, maximum likelihood estimation, Bayesian approach.

3
1. INTRODUCTION
Safety performance functions (SPFs), also known as collision prediction models (CPMs), are widely considered a key tool for estimating the safety levels of different road entities (i.e., intersections and road segments). SPFs are mathematical models statistically developed to link collision occurrence to a roadway’s traffic and geometric characteristics. There are several key reasons that SPFs are widely used in safety studies: i) SPFs can be used in a Bayesian framework to address the regression-to-the-mean bias; ii) over-dispersion due to unobserved or unmeasured heterogeneity in collision data can be addressed using SPFs; iii) SPFs account for the fundamental nonlinear relationship between collision frequency and traffic volume [1]; iv) SPFs help analysts understand the relationships between collisions and particular attributes [2, 3, 4, 5]; v) SPFs help analysts to predict site-specific collisions and, hence, identify and rank road segments that are truly hazardous [6, 7, 8]; and vi) SPFs help analysts to evaluate the effectiveness of various safety countermeasures by facilitating the Empirical Bayesian (EB) and Full Bayesian (FB) approach [9, 10, 11].
Various SPFs were developed in the literature to assess the effects of various geometric and non-geometric road elements on collision occurrence and severity on highways [12, 13, 14, 15] and arterial roads [3, 16, 17, 18]. For instance, Ahmed et al. [12] examined the safety effects of roadway geometry on collision occurrence along mountainous freeways and found that roadway geometry is significantly associated with collision risk. Furthermore, results revealed that a highway segment with a higher degree of curvature, wider medians and a greater number of lanes appears to be associated with a lower collision rate. Haleem and Gan [13] investigated the effects of road geometric, traffic, environmental, vehicle-related and driver-related characteristics on collision severity on urban freeways. The authors found that the at-fault drivers’ age, traffic volume, distance of the collision to the nearest ramp, vehicle type, side of impact and percentage of trucks involved significantly influenced collision severity on urban freeways. A study by Easa and You [14] focused on the effects on collision occurrence of the three dimensional alignments (i.e., horizontal and vertical curve and grade) of two-lane rural highways in Washington state. Results indicated that the degree of curvature, roadway width (lanes plus shoulders), access density, product of grade value and grade length, road section length and traffic volume are the most significant predictors of collisions on horizontal curves on three dimensional road alignments. An earlier study by Sawalha and Sayed [16] included the development of SPFs to estimate the safety performance of urban arterial roadways in the greater Vancouver regional districts. The authors found that traffic- and road-related variables (i.e., traffic volume, un-signalized intersection density, driveway density, pedestrian crosswalk density, number of traffic lanes, type of median and type of land-use) had a significant effect on collision occurrence.
A recent study by Manuel et al. [5] investigated the safety effects of road width on urban collectors in the city of Edmonton (COE); however, little was derived from that study regarding how other geometric and non-geometric road elements affect the safety performance of urban residential collector roads. Therefore, the present study investigated the impact of these elements on total collision occurrence and collision severity on urban residential collector roads. Several SPFs were developed for total collision occurrence and collision severity. An extensive data collection effort was made to synthesize collision records, traffic counts, road geometry, traffic
4
control and other feature data of residential collector road segments in the COE, Alberta, Canada. The widely accepted negative binomial (NB) distribution assumption was used to develop the SPFs. An outlier test was performed to improve the models’ goodness-of-fit. 2. DATA DESCRIPTION
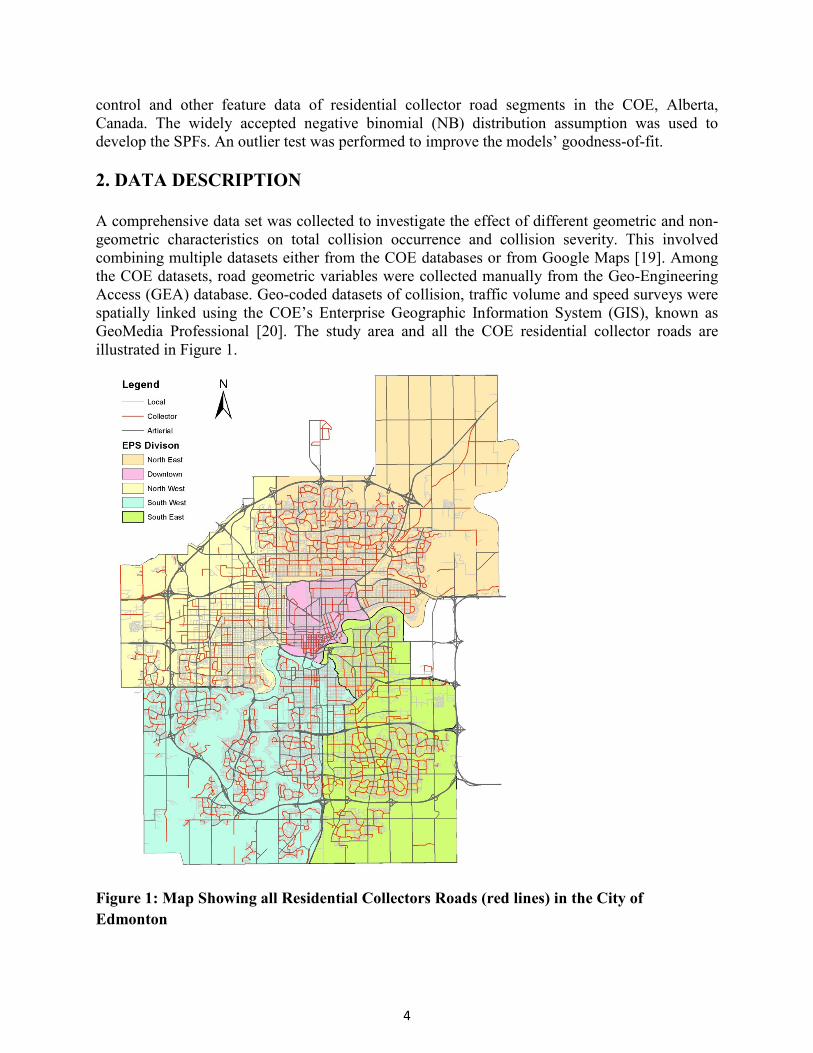
A comprehensive data set was collected to investigate the effect of different geometric and non-geometric characteristics on total collision occurrence and collision severity. This involved combining multiple datasets either from the COE databases or from Google Maps [19]. Among the COE datasets, road geometric variables were collected manually from the Geo-Engineering Access (GEA) database. Geo-coded datasets of collision, traffic volume and speed surveys were spatially linked using the COE’s Enterprise Geographic Information System (GIS), known as GeoMedia Professional [20]. The study area and all the COE residential collector roads are illustrated in Figure 1.
Figure 1: Map Showing all Residential Collectors Roads (red lines) in the City of Edmonton

5
For this study, the unit of analysis was urban residential collector road segments between collector-collector and (or) collector-arterial intersections. One specific challenge faced during data preparation was that the above road-segment definition differs from the road-segment definition in the COE Linear Referencing System (LRS) datum. Figure 2(a) shows the LRS road-segment definition: a stretch of road between two intersections, regardless of intersection type (arterial-collector, collector-collector or collector-local). Alternatively, Figure 2(b) shows the new definition of road segment: seven LRS road segments (marked by the square) become one road segment under the new definition adopted in the current study. For the purpose of analysis, all relevant data was linked to each road segment.
(a) LRS Road Segment Definition
(b) New Road Segment Definition
Figure 2: Illustration of Road Segment Definition
2.1 Collision Data
Collision data was obtained from the COE’s Motor Vehicle Collision Information System (MVCIS) database. This database is populated with police records of collisions that occurred on public roads within the COE boundary. The number of collisions is the most objective measure of a roadway’s safety performance. For the purpose of this study, collision data needed to be in a spatial format to facilitate linking with other datasets. Collision data from January 2006 to September 2012 was available in geo-coded format. The literature suggests that the period used to identify black spots (also known as hazardous road segments or hot spots) varies from 1-5 years. A period of 3-5 years is frequently used in the literature for hot spot identification. Research by Cheng and Washington [21] suggests that the increased accuracy obtained by using a period longer than 3 years is marginal and declines rapidly as the length of the period increases. In the current study, collision data from the last four years was used, with the calendar year defined as October to September, because the latest available data at the time of the study was September 2012. In addition to total collisions, two collision severities were considered: severe collisions, consisting of injury and fatal collisions, and property-damage-only (PDO) collisions.

6
2.2 AADT Data
The COE collects traffic data using the Vaisala Nu-Metrics Portable Traffic Analyzer NC200, which provides vehicle count and classification data. The device can be installed and removed in minutes and is less noticeable to drivers, which results in more accurate information. The traffic count data was geo-coded with estimated traffic volume (AADT) values. The geo-coded traffic count data was spatially linked to the road segments for the analysis.
2.3 Road Geometry and Other Attributes
Special features, such as school zones, seniors’ centres, bus stops and licensed premises, were considered in the current study to assess the effects of different land use patterns on collision occurrence. A travel distance of 400 metres (m) was taken along the roads from the point of these special features to indicate the presence or absence of these features on a road segment. A spatial tool, known as the Feature Manipulation Engine (FME), was used for data aggregation. The roadway geometric data for segment length, number of access points and presence of manned enforcement was extracted from the COE’s Spatial Land Inventory Management (SLIM) database through the GeoMedia GIS software. Data for the number of lanes, lane width, presence of a horizontal curve, presence of lane markings, presence of a midblock change, number of intersections (signalized, stop-controlled, uncontrolled), presence of a bicycle lane, presence of a median, presence of a centre line and presence of parking in the road segment was manually extracted from the COE’s GEA database and Google Maps [19].
2.4 Summary
Based on the road segment definition mentioned earlier, it was determined that the COE has a total of 1,400 residential collector road segments. After linking all of the related data discussed above, it was found that not all of the data was available for all of the road segments. Specifically, traffic count data was limited for the residential collector road segments. A total of 406 road segments were found to have the data required to perform the safety analysis; therefore, those 406 road segments were used to develop the SPFs. A statistical data summary is shown in Table 1.

7
Table 1: Statistical Summary of the Dataset
Variables Mean Std. Deviation Minimum Maximum Collision Data Total Collision Frequency 8.825 10.740 0 120 Severe Collisions 1.227 1.872 0 12 PDO Collisions 7.599 9.310 0 108 Traffic Flow Data Traffic Flow (AADT) 3912.32 3172.67 100 21500 Road Geometry Data Length (m) 634.662 433.512 88.965 3435.579 Access-point density 6.762 5.113 0 24.741 Number of Lane 2.422 0.816 2 4 Road Width (m) 11.829 2.757 6 20.2 Presence of Median (=1, if present, =0, else)
0.150 0.358 0 1
Presence of Mid-block Change (=1, if present, =0, else)
0.180 0.384 0 1
Presence of Horizontal Curve (=1, if present, =0, else)
0.426 0.495 0 1
Signalized Intersection Density 0.032 0.272 0 3.093 Stop-controlled Intersection Density 1.273 2.246 0 12.331 Uncontrolled Intersection Density 5.580 4.769 0 26.873 Presence of Centre Line (=1, if present on two sides, =0, else)
0.409 0.492 0 1
Non-geometric Data Presence of Bike Path (=1, if present, =0, else)
0.106 0.308 0 1
No Street Parking (=1, if yes, =0, else)
0.382 0.486 0 1
Parking in One Side (=1, if yes, =0, else)
0.101 0.302 0 1
Parking in Both Side (=1, if yes, =0, else)
0.512 0.500 0 1
Presence of Bus Stop (=1, if present, =0, else)
0.931 0.254 0 1
Bus Stop Density 11.426 8.804 0 68.372 Presence of Licensed Premises (=1, if present, =0, else)
0.542 0.499 0 1
Presence of School Zone (=1, if present, =0, else)
0.525 0.500 0 1
Presence of Seniors' Centre (=1, if present, =0, else)
0.158 0.365 0 1
Presence of Manned Enforcement (=1, if present, =0, else)
0.655 0.476 0 1

8
3. METHODOLOGY
3.1 Model Specification
As collisions are discrete, nonnegative and random events, the Poisson distribution is commonly used to develop the SPF. Let, iY denote the number of collisions at the road segment
)...,,3,2,1( nii = (for the present dataset, 392=n , because 14 road segments were identified as outliers and were subsequently removed from the dataset). Assume that the number of collisions at the n road segments is independent and that
)(~| iii PoissonY θθ (1) Where, iθ is the Poisson parameter. The probability of a road segment i having iy collisions is given by
!}|{Pr
i
yi
iii ye
yYiiθ
θθ−
== (2)
The Poisson parameter, iθ is commonly specified as an exponential function of road segment-specific attributes, such as exposure, traffic and geometric characteristics [22], and is usually expressed as
)(exp 'βθ ii X= (3) Where, '
iX is a row vector of covariates representing segment-specific attributes and β is a vector of regression parameters to be estimated from the data. In the Poisson regression model, it is assumed that the mean and variance of the count variables are constrained to be equal, such that
iii YVarYE θ== )()( . (4) However, when modeling collision count datasets, this assumption is often violated as most collision data is likely to be over-dispersed (the variance is greater than the mean) [23, 24, 25]. A Poisson distribution for over-dispersed data can underestimate the standard errors of the regression coefficients, which can lead to inflated values of the t-test, thereby, affecting the significance level of the model regression coefficients. This leads to an incorrect selection of covariates resulting in poor model fits. To overcome the problems associated with the Poisson regression models, several researchers proposed the use of the Poisson-Gamma (PG) hierarchy leading to the NB regression model [24]. The main reason for the extensive use of this model is that it is simple to compute, since the Gamma distribution is a conjugate prior to Poisson leading to a Gamma posterior distribution, which considerably simplifies the posterior analysis. To address over-dispersion for unobserved or unmeasured heterogeneity, it is assumed that
)(exp iii uµθ = (5)
iii u+= )(ln)(ln µθ (6) Where, iµ is an exponential function of segment-specific attributes, such as exposure, traffic and geometric characteristics.
ji
J
jji XVL ∑
=
+++=3
210 )(ln)(ln)(ln ββββµ (7)

9
Where, jiX denotes the matrix of covariates, j is the number of variables )...,,3( Jj = , L is the road segment length, V is traffic volume (AADT), 0β is the intercept, and 1β , 2β , and jβ denote the vector of regression coefficients. The term )(exp iu represents a multiplicative random effect due to unobserved heterogeneity, which follows a Gamma distribution with an inverse dispersion parameter (also known as the shape parameter), k .
),(~|)(exp kkGammakui (8) The dispersion (or over-dispersion) parameter is usually referred to as
k1
=α (9)
The probability density function of the PG or NB model is given by iy
i
i
ii
iiii y
ykyY
+
+Γ
+Γ==
µκµ
µκκ
κκ
µκ
)(!)(
},|{Pr (10)
Under the PG or NB model, the mean and variance are given by iiYE µ=)( (11)
κµ
µ2
)( iiiYVar += (12)
To assess the safety performance, three NB SPFs were developed:
• Model for total collisions • Model for severe (injury and fatal) collisions • Model for PDO collisions
The statistical software SAS version 9.3 [26] was used to obtain the maximum likelihood estimates of the model parameters. The parameters of the models were estimated using the GENMOD procedure [26]. 3.2 Model Assessment
Several measures can be used to assess the models’ goodness-of-fit. Two commonly used measures are the Scaled Deviance (SD) and the Pearson 2χ statistic. SD is defined as the likelihood ratio test statistic measuring twice the difference between the log-likelihoods of the studied model and the full or saturated model. Both the SD and Pearson 2χ statistic have exact
2χ distributions for normal linear models, but are asymptotically 2χ distributed with k degrees of freedom for other distributions of the exponential family, where k is the sample size minus the number of estimated parameters [3]. McCullagh and Nelder [27] showed that for the NB error structure, the SD statistic is as defined as
( )∑=
++
+−
=
n
i i
ii
i
ii
yy
yySD
1lnln2
κµκ
κµ
(13)
The Pearson 2χ statistic is defined as

10
[ ]∑= +
−=
n
i ii
iiyPearson
12
22
κµµ
µχ (14)
Both the SD and Pearson 2χ statistic are asymptotically 2χ distributed with pn − degrees of freedom [28], where n is the sample size and p is the number of parameters. The goodness-of-fit measures can also be obtained using the GENMOD procedure [26]. 3.3 Outlier Analysis
Datasets often have unusual or extreme observations (known as outliers), which can lead to biased and (or) unexpected results. An outlier (also known as an abnormality, a discordant, a deviant, an anomaly, etc.) is a data point that is vastly different from the majority of the other data points. According to Hawkins [29], an outlier is an observation that deviates so much from the other observations that it arouses suspicions that it was taken by a different mechanism. In the current study, to observe the anomalies in the available dataset, an outlier analysis was conducted using the methodology suggested by Sawalha and Sayed [3] with Cook's distance measure. This measure takes into account both leverage and influence during outlier identification. For more information regarding the outlier analysis, refer to Sawalha and Sayed [3]. By using this methodology, 14 road segments were identified as outliers, and were subsequently removed from the dataset. 4. RESULTS AND DISCUSSIONS
4.1 Model for Total Collisions This model was developed for total collisions based on traffic volume (AADT), geometric road characteristics and other non-geometric road characteristics. Table 2 represents the model’s parameter estimates, standard errors (SE), p-values and goodness-of-fit measures. The over-dispersion parameter is statistically significant, justifying the NB assumption. The SD and Pearson 2χ -statistics are 444.253 and 411.856, respectively. With 381 (=392-11) degrees of freedom and at the 99% confidence level, the SD and Pearson 2χ statistics are smaller than the critical 2χ , indicating that the model fits the data well. The modeling results reveal that traffic volume (AADT) and length are statistically significant at a 95% confidence level and positively correlated with total collisions. According to the parameter estimates, there is a 5.8% increase in predicted collisions per 10% increase in traffic volume. In terms of length, there is a 6.5% increase in predicted collisions per 10% increase in length. There is a statistically significant positive relationship between collisions and access-point density, stop-controlled intersection density, the presence of a horizontal curve, the presence of a licensed premises, the presence of a seniors’ centre and the presence of on-street parking. According to the parameter estimates, a 1% increase in access-point density and stop-controlled

11
intersection density increases collisions by 2.1% and 3.6%, respectively. Literature also suggests that road segments with a large number of access points have a significant impact on, and are positively correlated with, collision frequency [30]. Table 2: Parameter Estimates, Standard Errors (SE), p-values and Goodness-of-Fit Measures of the Total Collisions Model
ln(𝜇) = −3.0291 + 0.6521 ln(𝐿) + 0.5857 ln(𝑉) + 0.0211 𝐴𝑃𝐷 − 0.4233𝑃𝑀 + 0.1607𝐻𝐶+ 0.0352𝑆𝐶𝐼𝐷 + 0.4113𝐿𝑃 + 0.234𝑃𝑆𝐶 + 0.2956𝑃𝑂𝑆 + 0.2224𝑃𝐵𝑆
DF Scaled Deviance Pearson 2χ 381,01.0
2χ Shape Parameter, k
381 444.253 411.856 448.142 5.61 Parameter Estimate SE p-value Intercept -3.0291 0.3744 <.0001 Length ( )ln(L ) 0.6521 0.0551 <.0001 AADT ( )ln(V ) 0.5857 0.0439 <.0001 Access-point density (APD) 0.0211 0.0073 0.0036 Presence of Median (PM) -0.4233 0.0985 <.0001 Presence of Horizontal Curve (HC) 0.1607 0.0676 0.0174 Stop-controlled Intersection Density (SCID) 0.0352 0.0145 0.0149 Licensed Premises (LP) 0.4113 0.0656 <.0001 Presence of Seniors’ Centre (PSC) 0.234 0.0829 0.0048 Parking One Side (POS) 0.2956 0.106 0.0053 Parking Both Side (PBS) 0.2224 0.0684 0.0011 Dispersion, 1/k 0.1781 0.0259
There is a significant increase (17.4%) in the predicted collisions with the presence of a horizontal curve. A possible rationale for this finding is that roads designed with a horizontal curve accommodate the adequate centripetal force to neutralize the centrifugal force created by a vehicle for a certain speed. If a vehicle speed crosses that design speed, then ran-off-road collisions might occur. Furthermore, the presence of ground snow, which is common in Edmonton, makes the road slippery and may skid the wheel of a vehicle entering a horizontal curve, hence, increasing the probability of a collision. In terms of land use, the presence of a licensed premises increases collisions by 50.8%; this finding indicates that the collision risk increases within the vicinity of a licensed premises. The presence of a seniors’ centre increases collisions by 26.4%. A seniors’ centre is a facility that introduces vulnerable road users; therefore, collisions are more likely to occur in the vicinity of a seniors’ centre. On-street parking is statistically significant and positively correlated with collision occurrence. According to the parameter estimates, parking on one side of the road increases collisions by 34.3%, while parking on both sides of the road increases collisions by 24.9% (compared to no street parking); this finding is intuitive and in line with previous evidence [2]. By contrast, there is a significant negative relationship between predicted collisions and the presence of a median.

12
According to the parameter estimates, the presence of a median decreases collisions by 52.7%, which is a finding consistent with previous studies [31]. This result is expected and intuitive because medians help to prevent conflicts by separating opposing lanes of traffic and providing refuge for pedestrians and bicyclists when crossing the road. 4.2 Model for Severe Collisions
This model was developed for severe (fatal and injury) collisions based on traffic volume (AADT), geometric road characteristics and other non-geometric road characteristics. Table 3 represents the model’s parameter estimates, standard errors (SE), p-values and goodness-of-fit measures. Table 3: Parameter Estimates, Standard Errors (SE), p-values and Goodness-of-Fit Measures of the Severe Collisions Model
ln(𝜇) = −6.9559 + 0.7779 ln(𝐿) + 0.8178 ln(𝑉) + 0.2095𝑁𝐿 − 0.8168𝑃𝑀 + 0.0605𝑆𝐶𝐼𝐷+ 0.0122𝐵𝑆𝐷 + 0.58𝐿𝑃 + 0.3417𝑃𝑆𝐶 − 0.2914𝑃𝑀𝐸 − 0.3303𝑃𝐶𝐿
DF Scaled Deviance Pearson
2χ 381,05.0
2χ Shape Parameter, k
381 407.894 411.6473 427.513 12.953 Parameter Estimate SE p-value Intercept -6.9559 0.6928 <.0001 Length ( )ln(L ) 0.7779 0.0956 <.0001 AADT ( )ln(V ) 0.8178 0.0903 <.0001 Number of Lane (NL) 0.2095 0.0739 0.0046 Presence of Median (PM) -0.8168 0.1842 <.0001 Stop-controlled Intersection Density (SCID) 0.0605 0.0211 0.0041 Bus Stop Density (BSD) 0.0122 0.0067 0.07 Licensed Premises (LP) 0.58 0.1307 <.0001 Presence of Seniors’ Centre (PSC) 0.3417 0.133 0.0102 Presence of Manned Enforcement (PME) -0.2914 0.1383 0.0351 Presence of Centre Line (PCL) -0.3303 0.1319 0.0123 Dispersion, 1/k 0.0772 0.0724
The over-dispersion parameter is statistically significant, justifying the NB assumption. The SD and Pearson 2χ -statistics are 407.894 and 411.6473, respectively. With 381 (=392-11) degrees of freedom and at the 95% confidence level, the SD and Pearson 2χ statistics are smaller than the critical 2χ , indicating that the model fits the data well. The modeling results reveal that traffic volume (AADT) and length are statistically significant at a 95% confidence level and positively correlated with severe collisions. According to the parameter estimates, there is an 8.1% increase in predicted severe collisions per 10% increase in traffic volume. In terms of length, there is a 7.7% increase in predicted severe collisions per 10% increase in length. These results are consistent with previous study findings [2, 31].

13
There is a statistically significant positive relationship between severe collisions and bus stop density, stop-controlled intersection density, the presence of a licensed premises and the presence of a seniors’ centre. According to the parameter estimates, a 1% increase in bus stop density and stop-controlled intersection density increases severe collisions by 1.2% and 6.2%, respectively. Furthermore, there is a significant increase (23.3%) in predicted severe collisions because of an increased number of lanes. A possible rationale for this finding is that more lanes increases traffic flow and traffic conflict areas, hence, increasing the probability of severe collisions. In terms of land use, the presence of a licensed premises increases severe collisions by 78.6%, while the presence of a seniors’ centre increases severe collisions by 40.7%. By contrast, there is a significant negative relationship between predicted severe collisions and the presence of a median, the presence of a centre line and the presence of manned enforcement. According to the parameter estimates, the presence of a median and the presence of a centre line decreases severe collisions by 55.8% and 28.1%, respectively. The presence of manned enforcement decreases severe collisions by 25.3%, which conforms to the findings by Tay [32]. The presence of manned enforcement deters people from driving aggressively or erratically, thereby, making drivers more cautious and compliant to the posted speed limit, hence, reducing the probability of severe collisions. 4.3 Model for PDO Collisions
This model was developed for PDO collisions based on traffic volume (AADT), geometric road characteristics and other non-geometric road characteristics. Table 4 represents the model’s parameter estimates, standard errors (SE), p-values and goodness-of-fit measures. The over-dispersion parameter is statistically significant, justifying the NB assumption. The shape parameter k is significant, demonstrating the presence of over-dispersion in the data. The SD and Pearson 2χ -statistics are 444.4464 and 415.7685, respectively. With 381 (=392-11) degrees of freedom and at the 99% confidence level, the SD and Pearson 2χ statistics are smaller than the critical 2χ , indicating that the model fits the data well. The modeling results reveal that traffic volume (AADT) and length are statistically significant at 95% confidence level and positively correlated with PDO collisions. According to the parameter estimates, there is 5.6% increase in predicted PDO collisions per 10% increase in traffic volume. In terms of length, there is 6.6% increase in predicted PDO collisions per 10% increase in length. There is a statistically significant positive relationship between collisions and access-point density, stop-controlled intersection density, the presence of a horizontal curve, the presence of a licensed premises, the presence of a seniors’ centre and the presence of on-street parking. According to the parameter estimates, a 1% increase in access-point density and stop-controlled intersection density increases PDO collisions by 2.2% and 3.2%, respectively. Furthermore, there is a significant increase (18.8%) in the predicted PDO collisions because of the presence of a horizontal curve.

14
Table 2: Parameter Estimates, Standard Errors (SE), p-values and Goodness-of-Fit Measures of the PDO Collision Model
ln(𝜇) = −3.0014 + 0.66 ln(𝐿) + 0.5645 ln(𝑉) + 0.0221𝐴𝑃𝐷 − 0.4079𝑃𝑀 + 0.1719𝐻𝐶+ 0.0318𝑆𝐶𝐼𝐷 + 0.3748𝐿𝑃 + 0.2378𝑃𝑆𝐶 + 0.3201𝑃𝑂𝑆 + 0.2539𝑃𝐵𝑆
DF Scaled Deviance Pearson
2χ 381,01.0
2χ Shape Parameter, k
381 444.4464 415.7685 448.142 5.28 Parameter Estimate SE p-value Intercept -3.0014 0.3921 <.0001 Length ( )ln(L ) 0.66 0.0579 <.0001 AADT ( )ln(V ) 0.5645 0.046 <.0001 Access-point density (APD) 0.0221 0.0076 0.0035 Presence of Median (PM) -0.4079 0.1038 <.0001 Presence of Horizontal Curve (HC) 0.1719 0.0709 0.0154 Stop-controlled Intersection Density (SCID) 0.0318 0.0151 0.0353 Licensed Premises (LP) 0.3748 0.0691 <.0001 Presence of Seniors’ Centre (PSC) 0.2378 0.087 0.0063 Parking One Side (POS) 0.3201 0.1113 0.004 Parking Both Side (PBS) 0.2539 0.0718 0.0004 Dispersion, 1/k 0.1893 0.0284
In terms of land use, the presence of a licensed premises increases PDO collisions by 45.5%, while the presence of a seniors’ centre increases PDO collisions by 26.8%. On-street parking is also statistically significant and positively correlated with PDO collisions. According to the parameter estimates, parking on one side of the road increases PDO collisions by 37.7%, while parking on both sides increases PDO collisions by 28.9% (compared to no street parking). By contrast, there is a significant negative relationship between predicted PDO collisions and the presence of a median. According to the parameter estimates, the presence of a median decreases PDO collision by 33.5%. 5. CONCLUSION AND FUTURE RESEARCH
This paper described modeling efforts to analyze Edmonton’s residential collector road segments. An extensive data collection effort was made to synthesize collision records, traffic counts, road geometry, traffic control and other feature data of Edmonton’s residential collector roads. A total of 406 road segments were identified as having the complete dataset required to develop the SPFs. Three SPFs were developed: i) a total collisions model; ii) a severe collisions model; and iii) a PDO collisions model. The results reveal that the exposure covariates (segment length and traffic volume) are highly significant and positively related to the predicted collisions in all of the models. The PDO collision model has the same significant covariates as the total collisions model, indicating that the number of PDO collisions is predominantly higher than other collisions. For predicted total and PDO collisions, there is a statistically significant positive relationship between collisions and access-point density, stop-controlled intersection density, the

15
presence of a horizontal curve, the presence of a licensed premises, the presence of a seniors’ centre and the presence of on-street parking. By contrast, there is a significant negative relationship between predicted total and PDO collisions and the presence of a median. For severe collisions, there is a statistically significant positive relationship between collisions and segment length, traffic volume, number of lanes, access-point density, stop-controlled intersection density, bus stop density, the presence of a horizontal curve, the presence of a license premises, the presence of a seniors’ centre and the presence of on-street parking. On the contrary, there is a significant negative relationship between predicted severe collisions and the presence of a median, the presence of a centre line and the presence of manned enforcement sites. In contrast to the total and PDO collisions, the presence of a centre line is significant and negatively related to severe collisions. This has important implications for transportation authorities: most of the road segments in the current study are two-lane roads; therefore, a centre line pavement marking might better guide drivers to avoid head-on collisions, which are often severe. Similarly, the presence of a manned enforcement site on a road segment is significant and negatively related to severe collisions, indicating that the presence of manned enforcement reduces speeding and subsequent severe collisions.
From a model application perspective, the city authority could use this information to assess the associated safety risk of different geometric and non-geometric road elements on residential collector roads and, hence, prioritize collision prone road segments.
The results presented in this paper are based on a single dataset. Even though these results are intuitive and conform to those in the literature, further research with different datasets is required to confirm the paper's findings. The work in this paper could be extended by focusing on different collision types (e.g., angle, rear end, head on, etc.), which may provide a much more clear and detailed understanding of safety conditions and help transportation authorities to estimate the associated safety risk and facilitate the selection of potential countermeasures for specific collision types (a particular countermeasure is often tied to a particular collision type).
ACKNOWLEDGEMENTS
This study was sponsored by the City of Edmonton and the Office of Traffic Safety. The authors would like to thank the City of Edmonton and the Office of Traffic Safety staff for providing the data and other assistance.
REFERENCES
[1] American Association of State Highway and Transportation Officials (AASHTO), "Highway Safety Manual," AASHTO, Washington, DC, USA, 2010.
[2] P. Greibe, "Accident prediction models for urban roads," Accident Analysis and Prevention , vol. 35, p. 273–285, 2003.

16
[3] Z. Sawalha and T. Sayed, "Traffic accidents modeling: some statistical issues," Canadian Journal of Civil Engineering, vol. 33, no. 9, pp. 1115-1124, 2006.
[4] A. Hadayeghi, A. Shalaby and B. Persaud, "Macrolevel Accident Prediction Models for Evaluating Safety of Urban Transportation Systems," Transportation Research Record, no. 1840, pp. 87-95, 2003.
[5] A. Manuel, K. El-Basyouny and M. T. Islam, "Investigating the safety effects of road width on urban collector roadways," Safety Science , vol. 62, p. 305–311, 2014.
[6] E. Hauer, "Empirical Bayes Approach to the Estimation of Unsafety: The Multivariate Regression Method," Accident Analysis and Prevention, vol. 24, no. 5, p. 457–477, 1992.
[7] E. Hauer, "Identification of Sites with Promise," Transportation Research Record: Journal of the Transportation Research Board, no. 1542, pp. 54-60, 1996.
[8] E. Hauer, D. W. Harwood, F. M. Council and M. S. Griffith, "Estimating Safety by the Empirical Bayes Method: A Tutorial," Transportation Research Record: Journal of the Transportation Research Board, no. 1784, pp. 126-131, 2002.
[9] O. Yanmaz-Tuzel and K. Ozbay, "A comparative Full Bayesian before-and-after analysis and application to urban road safety countermeasures in New Jersey," Accident Analysis and Prevention 42 , vol. 42, p. 2099–2107, 2010.
[10] K. El-Basyouny and T. Sayed, "A Full Bayes Approach to Before-After Safety Evaluation with Matched Comparisons: A Case Study of Stop-Sign In-Fill Program," Transportation Research Record: Journal of the Transportation Research Board, no. 2148, p. 1–8, 2010.
[11] K. El-Basyouny and T. Sayed, "Measuring Direct and Indirect Treatment Effects Using Safety Performance Intervention Functions," Safety Science, vol. 50, p. 1125–1132, 2012.
[12] M. Ahmed, H. Huang, M. Abdel-Aty and B. Guevara, "Exploring a Bayesian hierarchical approach for developing safety performance functions for a mountainous freeway," Accident Analysis and Prevention, vol. 43, p. 1581–1589, 2011.
[13] K. Haleem and A. Gan, "Effect of driver’s age and side of impact on crash severity along urban freeways: A mixed logit approach," Journal of Safety Research , vol. 46, p. 67–76, 2013.
[14] S. M. Easa and Q. C. You, "Collision Prediction Models for Three-Dimensional Two-Lane Highways- Horizontal Curves," Transportation Research Record: Journal of the Transportation Research Board, no. 2092, p. 48–56, 2009.

17
[15] A. Pande, M. Abdel-Aty and A. Das, "A classification tree based modeling approach for segment related crashes on multilane highways," Journal of Safety Research, vol. 41, p. 391–397, 2010.
[16] Z. Sawalha and T. Sayed, "Evaluating safety of urban arterial roadways," Journal of Transportation Engineering, vol. 127, no. 2, p. 151–158, 2001.
[17] K. El-Basyouny and T. Sayed, "Urban Arterial Accident Prediction Models with Spatial Effects," Transportation Research Record: Journal of the Transportation Research Board, no. 2102, p. 27–33, 2009.
[18] K. El-Basyouny and T. Sayed, "Accident prediction models with random corridor parameters," Accident Analysis and Prevention , vol. 41, p. 1118–1123, 2009.
[19] Google Inc., Google Map, Mountain View, CA, United States of America, 2013.
[20] Intergraph Corporation, " Product Sheet: GeoMedia® Professional," Safe Software, 2007.
[21] W. Cheng and S. Washington, "Experimental Evaluation of Hotspot Identification Methods," Accident Analysis and Prevention, vol. 37, pp. 870-881, 2005.
[22] S. Miaou and D. Lord, "Modeling traffic crash-flow relationships for intersections: dispersion parameter, functional form, and Bayes versus empirical Bayes," Transportation Research Record, no. 1840, pp. 31-40, 2003.
[23] R. Kulmala, "Safety at Rural Three-and Four-arm Junctions. Development of Accident Prediction Models," Technical Research Centre of Finland, VTT 233, Espoo, 1995.
[24] A. Cameron and P. Trivedi, Regression Analysis of Count Data. Econometric Society Monographs, New York: Cambridge University Press, 1998.
[25] R. Winkelmann, Econometric Analysis of Count Data, Germany: Springer, 2003.
[26] SAS Institute Inc., "Version 9.3, PROC GENMOD & PROC GLIMMIX," Cary, USA., 2011.
[27] P. McCullagh and J. Nelder, Generalized Linear Models, New York: Chapman and Hall, 1998.
[28] M. Aitkin, D. Anderson, B. Francis and J. Hinde, Statistical Modeling in GLIM, New York: Oxford University Press, 1989.

18
[29] D. Hawkins, Identification of Outliers, Chapman and Hall, 1980.
[30] C. M. Wang Xuesong, "Safety analysis on urban arterials considering operational conditions in Shanghai," Procedia Engineering , vol. 45, p. 836 – 840, 2012.
[31] M. Ma, X. Yan, M. Abdel-Aty, H. Huang and X. Wang, "Safety Analysis of Urban Arterials Under Mixed-Traffic Patterns in Beijing," Transportation Research Record: Journal of the Transportation Research Board, no. 2193, p. 105–115, 2010.
[32] R. Tay, " The Effectiveness of Automated and Manned Traffic Enforcement," International Journal of Sustainable Transportation, vol. 3:3, pp. 178-186, 2009.