Embed Size (px)
Citation preview

Safety and SecuritySector Skills Plan
2012 – 2016SASSETA ContactsTelephone Numbers:Call Centre: 086 110 2477Fax Number: 27 (0) 11 805 6630Switchboard: 27 (0)11 347 0200E-Mail: [email protected]
Physical Address:Riverview Office Park, Janadel Avenue (off Bekker Road), Halfway Gardens Midrand, 1685
Postal Address:P.O. Box 7612, Halfway House, 1685
0800 20 50 61
higher education& trainingDepartment:Higher Education and Training
2 S a f e t y a n d S e c u r i t y S e c t o r S k i l l s P l a n
Foreword by the SASSETA CEOIt is a great pleasure to present this Sector Skills Plan (SSP) update for 2012-2013 financial years to our stakeholders. The development of the Sector Skills Plan is a process, and as such this docu-ment is a work in progress. The Seta is committed to improving the quality of its SSP such that it is adopted and owned by all our stakeholders. To this end, the SETA will continue engaging all its stakeholders with a view to solicit inputs which will inform the contents of the final document.
This document is prepared in accordance with the Skills Development Act (SDA) section 10(1) (a) which requires each Sector Education and Training Authority (SETA) to develop a Sector Skills Plan (SSP) within the framework of the National Skills Development Strategy III (NSDS III).
The Department of Higher Education and Training (DHET) expects each SETA to submit a credible economic and labour market review of its sector by the 31 August 2012. The DHET, has indicated that the improvements to the 5 year SSP must be developed within the framework of the Medium Term Strategic Framework (MTSF) as well key strategies such as the New Growth Path, IPAP II, the HRDSA, NSDS III and other government priorities, which in combination are centred on employ-ment creation, fighting poverty and promoting equity thus supporting economic development and social stability and cohesion through production of relevant scarce and critical skills. Furthermore, the expectation of the DHET is that the improved SSP should reflect any new developments since the submission of the first 5 year SSP, that impact on skills development for the sector.
SASSETA has put in place a systems and process to improve this draft SSP document and exten-sive desk research has been conducted with a focus on researching the seven sub-sectors. Further data gathering methods included interviews with key informants within each of the sub-sectors and a survey was also conducted.
In our quest to improve the SSP we considered all the national imperatives that guide skills devel-opment and economic growth in our country. The Seta is committed to supporting government to fight the triple challenges of unemployment, deepening poverty and the forever widening gap of inequalities in our society. Accordingly, the SETA will intensify its efforts to train people on scarce skills like artisans and other related pivotal skills. Furthermore the SETA will develop a strategy to operationalise major government policy drivers such as the New Growth Path, IPAP II, the National Skills Accord, the National Skills Development Strategy III and recent Strategic Infrastructural Pro-jects (SIPs).
This SSP is a strategic document in that it informed the content of, and shaped, our Strategic Plan and Annual Performance Plan. A great effort has been made to try and align the SSP, Strategic Plan and Annual Performance Plan and where there are gaps further efforts will be made to strive to bridge them.

S a f e t y a n d S e c u r i t y S e c t o r S k i l l s P l a n 3
The SETA has started implementing the NSDS III directives around forming partnerships with uni-versities and public FET colleges. This document map out the strategy to be employed in engaging these institutions. To date the SETA has signed an MoU with Nelson Mandela Metropolitan Univer-sity aimed at assisting the SETA to beef up its research capacity and to deliver on projects contained in our Strategic Plan and Annual Performance Plan. Discussion with other universities are at an advance stage and it is envisaged that MoUs will be signed with Universities of Zululand, Stellen-bosch, Witwatersrand and Cape Peninsula Universtity of Technology. Our Annual Performance Plan sets us a target of engaging with 7 universities this financial year. The SETA has signed MOUs with a cluster of 12 FET colleges within Gert Sibande District, Ehlanzeni and Ekangala in Mpumalanga Province. The SETA has prioritised the opening of offices in the FET colleges. An agreement has been brokered in this regard with EThekwini FET college in KwaZulu Natal and an office is expected to be set up by 31 March 2013. The SETA is planning to conduct large-scale SSP road shows once the final document is complete. This will help ensure effective communication and buy in from all our stakeholders. I am calling on all stakeholders to make use of this opportunity to engage with the SETA to enable us to continu-ously improve the quality of our SSP.
Ntombekhaya QamataActing CEO SASSETA
November 2012
4 S a f e t y a n d S e c u r i t y S e c t o r S k i l l s P l a n
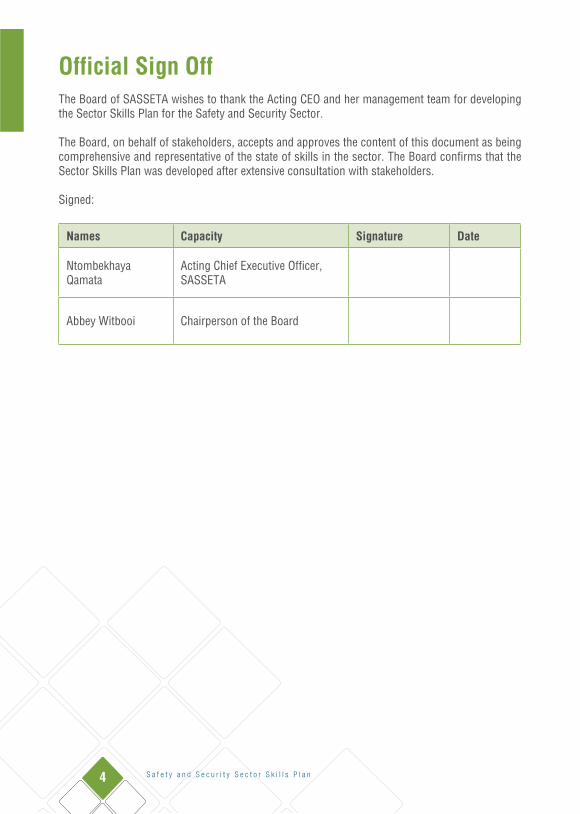
Official Sign OffThe Board of SASSETA wishes to thank the Acting CEO and her management team for developing the Sector Skills Plan for the Safety and Security Sector.
The Board, on behalf of stakeholders, accepts and approves the content of this document as being comprehensive and representative of the state of skills in the sector. The Board confirms that the Sector Skills Plan was developed after extensive consultation with stakeholders.
Signed:
Names Capacity Signature Date
Ntombekhaya Qamata
Acting Chief Executive Officer, SASSETA
Abbey Witbooi Chairperson of the Board

S a f e t y a n d S e c u r i t y S e c t o r S k i l l s P l a n 5
LIST OF ACRONYMS AND ABBREVIATIONS AFU Asset Forfeiture Unit
AIDS Acquired Immunodeficiency Syndrome
ATR Annual Training Report
CAS Crime Administration System
CCTV Close Circuit Television
CJCP Centre for Crime and Justice Prevention
CJP Criminal Justice Programme
CSIR Centre for Scientific and Industrial Research
CSVR Centre for the Study of Violence and Reconciliation
DCS Department of Correctional Services
DHET Department of Higher Education and Training
DoD Department of Defence and Military Veterans
DoJCD Department of Justice and Constitutional Development
DoL Department of Labour
DPP Directors of Public Prosecutions
FET Further Education and Training
GBVP Gender-based Violence Programme
HDI Historically Disadvantaged Individuals
HIV Human Immunodeficiency Virus
HRDSSA Human Resource Development Strategy for South Africa
ICD Independent Complaints Directorate
IDASA Institute for Democracy in Africa
IPID Independent Police Investigative Directorate
ISS Institute for Security Studies
JCPS Justice, Crime Prevention & Security
KZN KwaZulu Natal
NDP National Development Plan
NIA National Intelligence Agency
NICRO National Institute for Crime Prevention and Rehabilitation of Offenders
NPS National Prosecution Service
NQF National Qualifications Framework
6 S a f e t y a n d S e c u r i t y S e c t o r S k i l l s P l a n
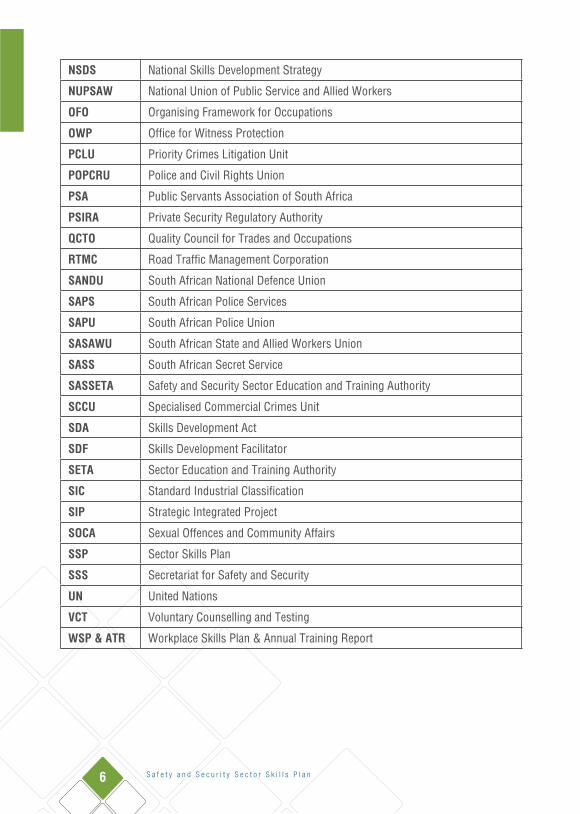
NSDS National Skills Development Strategy
NUPSAW National Union of Public Service and Allied Workers
OFO Organising Framework for Occupations
OWP Office for Witness Protection
PCLU Priority Crimes Litigation Unit
POPCRU Police and Civil Rights Union
PSA Public Servants Association of South Africa
PSIRA Private Security Regulatory Authority
QCTO Quality Council for Trades and Occupations
RTMC Road Traffic Management Corporation
SANDU South African National Defence Union
SAPS South African Police Services
SAPU South African Police Union
SASAWU South African State and Allied Workers Union
SASS South African Secret Service
SASSETA Safety and Security Sector Education and Training Authority
SCCU Specialised Commercial Crimes Unit
SDA Skills Development Act
SDF Skills Development Facilitator
SETA Sector Education and Training Authority
SIC Standard Industrial Classification
SIP Strategic Integrated Project
SOCA Sexual Offences and Community Affairs
SSP Sector Skills Plan
SSS Secretariat for Safety and Security
UN United Nations
VCT Voluntary Counselling and Testing
WSP & ATR Workplace Skills Plan & Annual Training Report
S a f e t y a n d S e c u r i t y S e c t o r S k i l l s P l a n 7
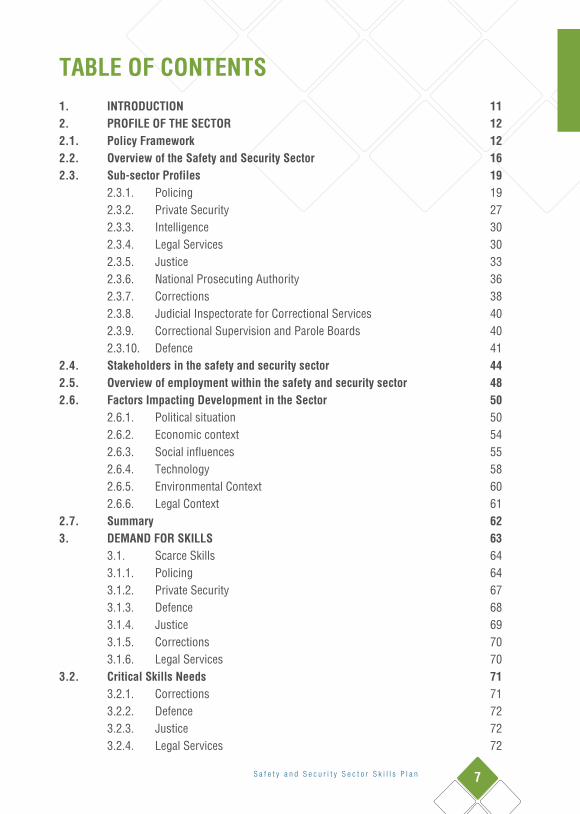
TABLE OF CONTENTS1. INTRODUCTION 112. PROFILE OF THE SECTOR 122.1. Policy Framework 12 2.2. Overview of the Safety and Security Sector 162.3. Sub-sector Profiles 19 2.3.1. Policing 19 2.3.2. Private Security 27 2.3.3. Intelligence 30 2.3.4. Legal Services 30 2.3.5. Justice 33 2.3.6. National Prosecuting Authority 36 2.3.7. Corrections 38 2.3.8. Judicial Inspectorate for Correctional Services 40 2.3.9. Correctional Supervision and Parole Boards 40 2.3.10. Defence 412.4. Stakeholders in the safety and security sector 442.5. Overview of employment within the safety and security sector 482.6. Factors Impacting Development in the Sector 50 2.6.1. Political situation 50 2.6.2. Economic context 54 2.6.3. Social influences 55 2.6.4. Technology 58 2.6.5. Environmental Context 60 2.6.6. Legal Context 612.7. Summary 623. DEMAND FOR SKILLS 63 3.1. Scarce Skills 64 3.1.1. Policing 64 3.1.2. Private Security 67 3.1.3. Defence 68 3.1.4. Justice 69 3.1.5. Corrections 70 3.1.6. Legal Services 703.2. Critical Skills Needs 71 3.2.1. Corrections 71 3.2.2. Defence 72 3.2.3. Justice 72 3.2.4. Legal Services 72
8 S a f e t y a n d S e c u r i t y S e c t o r S k i l l s P l a n
3.2.5. Policing 73 3.2.6. Private Security 733.3. Supply of Skills 73 3.3.1. Output of Public Education and Training Institutions 74 3.3.2. SASSETA Initiatives 78 3.3.3. Skills Supply in the public sector 79 3.3.4. Supply of new skills by training and development institutions 80 3.3.5. Conclusion 834. Sector Development Strategy: strategic objectives and outputs 844.1. Strategic Objective 1: Safety and Security Sector institutional mechanism for skills planning developed 844.2. Strategic Objective 2: Capacity of Human Resource Development Units strengthened 864.3. Strategic Objective 3: Supply of scarce and critical skills improved 874.4. Strategic objective 4: Quality education and training provision 884.5. Strategic Objective 5: Expanded Workplace Provision 914.6. Strategic Objective 6: Monitoring & Evaluation of skills development interventions 925. M&E Framework 94Addendum 1: Alignment of SSP with Strategic Plan 107

S a f e t y a n d S e c u r i t y S e c t o r S k i l l s P l a n 9
LIST OF TABLES Table 1: SASSETA Scope of Coverage 17Table 2: Main business activities for Policing sub-sector 19Table 3: SAPS Core functions 20Table 4: Distribution of SAPS employees by occupational bands, March 2012 22Table 5: Profile of employees with disabilities, March 2012 23Table 6: Vacancy rate for critical occupations at SAPS 23Table 7: SAPS Annual turnover rates, 1 April 2011 – 31 March 2012 24Table 8: IPID Employment by salary band 25Table 9: Employment Equity at IPID 26Table 10: PSIRA employment data – March 2011 28Table 11: Services offered in the Private Security sub-sector 28Table 12: Registered businesses in the private security sub-sector 29Table 13: Legal Aid staff in March 2010 32Table 14: Number of active Sheriffs in SA in February 2011 32Table 15: Number of active deputy Sheriffs in SA in February 2011 33Table 16: Public Entities reporting to the Minister of Justice 34Table 17: Employment profile of the DoJ&CD, March 2012 35Table 18: NPA employees in March 2012 37Table 19: NPA employment profile, March 2012 38Table 20: Department of Correctional Services employees, March 2012 39Table 21: JICS staff, March 2012 40Table 22: Composition of Correctional Supervision and Parole Boards, September 2012 41Table 23: Employment profile of the Ministry of Defence and Military Veterans, March 2012 42Table 24: Critical Occupations in the Department of Defence and Military Veterans, March 2012 43Table 25: Employment Equity in the Ministry of Defence and Military Veterans 43Table 26: National government departments with a reliance on safety and security sector 44Table 27: Overview of employment in safety and security sector 48Table 28: Safety and security sector equity profile 49Table 29: Dimensions of police corruption 52Table 30: Overview of national unrests where police intervention was needed 54Table 31: Sick leave in the public service 56Table 32: Annual turnover rate by critical occupations 65
10 S a f e t y a n d S e c u r i t y S e c t o r S k i l l s P l a n
Table 33: SAPS Scarce Skills (using OFO 2012) 66Table 34: Private Security Scarce Skills (using OFO 2012) 67Table 35: Defence Scarce Skills (using OFO 2012) 68Table 36: DoJCD Scarce Skills (using OFO 2012) 69Table 37: Corrections Scarce Skills (using OFO 2012) 70Table 38: Scarce skills (using OFO 2012) 70Table 39: Comparison on training reported in ATRs for 2010 and 2011 74Table 40: Results of the National Senior Certificate 75Table 41: Results of the National Certificate Examinations at FET colleges 76Table 42: Results of the National Certificate (Vocational) Examinations at FET colleges 76Table 43: Enrolment in Law qualifications at All Universities 77Table 44: Graduates in Law quakifications at All Universities 77Table 45: Output of learning programmes supported by SASSETA 2005 – 2010 78Table 46: Accreditation status of quaifications 80Table 47: SASSETA registered qualifications 82Table 45: Qualifications registered as SASSETA learnerships but quality assured by other SETAs 83
LIST OF FIGURES Figure 1: Safety and Security Sub-sectors 16Figure 2: Integrated Criminal Justice System 17Figure 3: Number of police stations in each province 21Figure 4: Reasons why staff are leaving SAPS 64Figure 7: Members attending training during financial year 2011/12 79
S a f e t y a n d S e c u r i t y S e c t o r S k i l l s P l a n 11
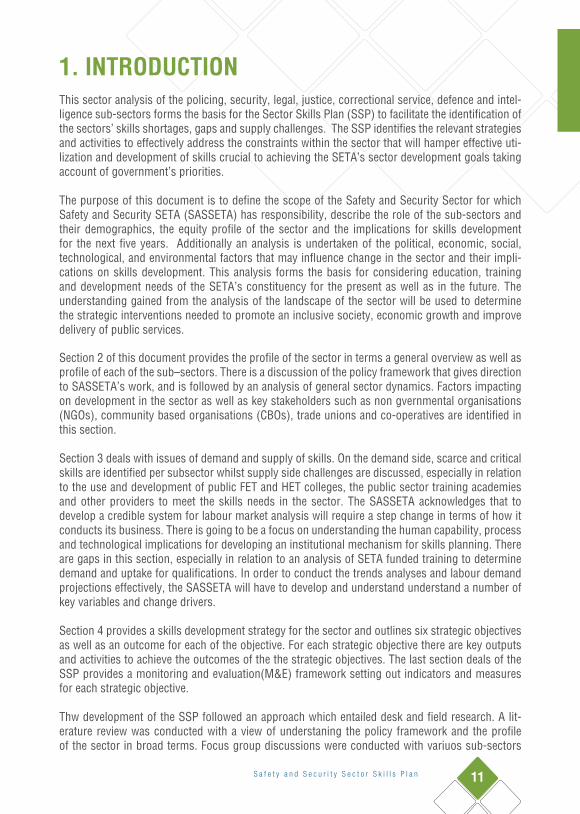
1. INTRODUCTIONThis sector analysis of the policing, security, legal, justice, correctional service, defence and intel-ligence sub-sectors forms the basis for the Sector Skills Plan (SSP) to facilitate the identification of the sectors’ skills shortages, gaps and supply challenges. The SSP identifies the relevant strategies and activities to effectively address the constraints within the sector that will hamper effective uti-lization and development of skills crucial to achieving the SETA’s sector development goals taking account of government’s priorities.
The purpose of this document is to define the scope of the Safety and Security Sector for which Safety and Security SETA (SASSETA) has responsibility, describe the role of the sub-sectors and their demographics, the equity profile of the sector and the implications for skills development for the next five years. Additionally an analysis is undertaken of the political, economic, social, technological, and environmental factors that may influence change in the sector and their impli-cations on skills development. This analysis forms the basis for considering education, training and development needs of the SETA’s constituency for the present as well as in the future. The understanding gained from the analysis of the landscape of the sector will be used to determine the strategic interventions needed to promote an inclusive society, economic growth and improve delivery of public services.
Section 2 of this document provides the profile of the sector in terms a general overview as well as profile of each of the sub–sectors. There is a discussion of the policy framework that gives direction to SASSETA’s work, and is followed by an analysis of general sector dynamics. Factors impacting on development in the sector as well as key stakeholders such as non gvernmental organisations (NGOs), community based organisations (CBOs), trade unions and co-operatives are identified in this section.
Section 3 deals with issues of demand and supply of skills. On the demand side, scarce and critical skills are identified per subsector whilst supply side challenges are discussed, especially in relation to the use and development of public FET and HET colleges, the public sector training academies and other providers to meet the skills needs in the sector. The SASSETA acknowledges that to develop a credible system for labour market analysis will require a step change in terms of how it conducts its business. There is going to be a focus on understanding the human capability, process and technological implications for developing an institutional mechanism for skills planning. There are gaps in this section, especially in relation to an analysis of SETA funded training to determine demand and uptake for qualifications. In order to conduct the trends analyses and labour demand projections effectively, the SASSETA will have to develop and understand understand a number of key variables and change drivers.
Section 4 provides a skills development strategy for the sector and outlines six strategic objectives as well as an outcome for each of the objective. For each strategic objective there are key outputs and activities to achieve the outcomes of the the strategic objectives. The last section deals of the SSP provides a monitoring and evaluation(M&E) framework setting out indicators and measures for each strategic objective.
Thw development of the SSP followed an approach which entailed desk and field research. A lit-erature review was conducted with a view of understaning the policy framework and the profile of the sector in broad terms. Focus group discussions were conducted with variuos sub-sectors
12 S a f e t y a n d S e c u r i t y S e c t o r S k i l l s P l a n
whilst focussed interviews were held with informants from various sub sectors. A survey was also circulated to two sub-sectors.
The SASSETA has a research strategy and a programme which which will continually enrich the SSP to be a document that profiles the sector and unpacks its dynamics whilst clearly articulating the labour demand and supply situation.
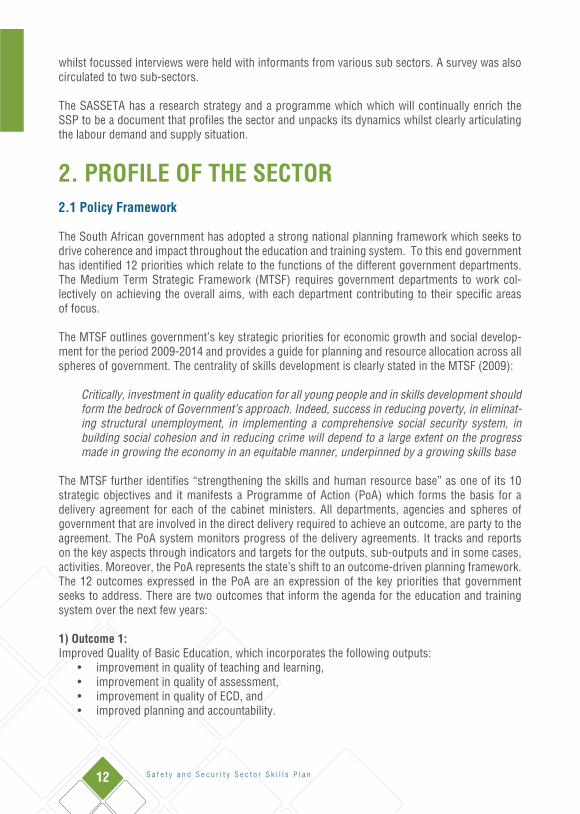
2. PROFILE OF THE SECTOR2.1 Policy Framework
The South African government has adopted a strong national planning framework which seeks to drive coherence and impact throughout the education and training system. To this end government has identified 12 priorities which relate to the functions of the different government departments. The Medium Term Strategic Framework (MTSF) requires government departments to work col-lectively on achieving the overall aims, with each department contributing to their specific areas of focus.
The MTSF outlines government’s key strategic priorities for economic growth and social develop-ment for the period 2009-2014 and provides a guide for planning and resource allocation across all spheres of government. The centrality of skills development is clearly stated in the MTSF (2009):
Critically, investment in quality education for all young people and in skills development should form the bedrock of Government’s approach. Indeed, success in reducing poverty, in eliminat-ing structural unemployment, in implementing a comprehensive social security system, in building social cohesion and in reducing crime will depend to a large extent on the progress made in growing the economy in an equitable manner, underpinned by a growing skills base
The MTSF further identifies “strengthening the skills and human resource base” as one of its 10 strategic objectives and it manifests a Programme of Action (PoA) which forms the basis for a delivery agreement for each of the cabinet ministers. All departments, agencies and spheres of government that are involved in the direct delivery required to achieve an outcome, are party to the agreement. The PoA system monitors progress of the delivery agreements. It tracks and reports on the key aspects through indicators and targets for the outputs, sub-outputs and in some cases, activities. Moreover, the PoA represents the state’s shift to an outcome-driven planning framework. The 12 outcomes expressed in the PoA are an expression of the key priorities that government seeks to address. There are two outcomes that inform the agenda for the education and training system over the next few years:
1) Outcome 1: Improved Quality of Basic Education, which incorporates the following outputs:
• improvementinqualityofteachingandlearning,• improvementinqualityofassessment,• improvementinqualityofECD,and• improvedplanningandaccountability.

S a f e t y a n d S e c u r i t y S e c t o r S k i l l s P l a n 13
2) Outcome 5:A skilled and capable workforce to support an inclusive growth path, which incorporates the following outputs:
• acredibleinstitutionalmechanismforskillsplanning,• accesstoprogrammesleadingtointermediateandhighlevellearning,• access tooccupationallydirectedprogrammes inneededareasand therebyexpand the
availability of intermediate level skills (with a special focus on artisan skills), • accesstohighleveloccupationally-directedprogrammesinneededareas,• research,developmentandinnovationinhumandevelopmentforagrowing
knowledge economy
In addition, the SASSETA will have to support its constituent government departments and agen-cies in meeting PoA outcome dealing with Safety and Security issues.• Outcome 3:
All people in South Africa are and feel safe, which incorporates the following outputs:• reduceoveralllevelsofseriouscrimesandinparticularcontactcrime• aneffectiveCriminalJusticeSystem(CJS)• corruptionwithin the Justice, CrimePrevention&Security (JCPS) cluster combated to
enhance its effectiveness and its ability to serve as a deterrent against crime• perceptionsofcrimeamongthepopulationmanagedandimproved• levelsofcorruptionreducedimprovinginvestorperception,trustandwillingnesstoinvest
in South Africa• effectiveandintegratedbordermanagement• cyber-crimecombated
These outcomes cut across the education and training system as well as the Justice and Crime Pre-vention cluster and have important implications for planning in that they link inputs to performance. The outcomes also become a basis for monitoring and evaluation, with an emphasis on monitoring outcomes and assessing impact i.e. a changed state of affairs rather than merely outputs.
Furthermore the imperative for an improved quality and relevant education and training system is also given expression in the following strategy documents:
• TheNewGrowthPath:Programme4ofthemicroeconomicpackage–steppingupeduca-tion and skills development
• IndustrialPolicyActionPlanII:Programme10–developingdemandsideskillsstrategiesfor industrial development
• DiagnosticOverviewoftheNationalPlanningCommission(NPC)–thequalityofeducationand training as a major constraint to national growth and development
• HumanResourceDevelopmentStrategySA• NationalSkillsDevelopmentStrategyIII.
The latter two documents talk directly to the mandate of sector education and training authorities. The Human Resource Development Strategy for South Africa (HRDS-SA) (2010-2030) is a macro-strategy which seeks to locate education and training within the broader developmental agenda of the country and therefore ensure common alignment of various government programmes in ad-dressing human development challenges. The HRD-SA establishes broad outcomes for equitable access to education and training and the development of skilled people. The National Skills Development Strategy (NSDS III) gives expression to the HRDS-SA and govern-

14 S a f e t y a n d S e c u r i t y S e c t o r S k i l l s P l a n
ment’s strategic objectives and provides an overarching framework for sector skills planning and the implementation of skills development. Sector skills plans should be aligned to government and industry development initiatives, address the needs of unemployed youth, provide for new occupa-tional qualifications, addressing the challenges within FET Colleges and building strong partnership to deliver on the strategy. The skills development landscape is guided by the NSDS III which was launched by the Minister of Higher Education in January 2011.
Key focal elements of the NSDS III are:• Establishingacredibleinstitutionalmechanismforskillsplanning–strengtheningand coordinating research and data gathering to support effective skills planning.• Increasingaccesstooccupationally-directedprogrammes–supportingskillsdevelopment
within the intermediate and high skills levels, with special emphasis on artisan develop-ment.
• PromotingthegrowthofapublicFETcollegesystemthatisresponsivetosector,local,re-gional and national skills needs and priorities – strengthening and upgrading FET colleges to improve access, articulation, and quality of provision to ensure that graduates of these colleges are competent and attractive to employers.
• Addressing the low level of youth and adult language and numeracy skills to enableadditional training – addressing the scourge of youth unemployment, made worse by a weak basic education system, by equipping school leavers with the necessary literacy and numeracy skills that will enable them to access appropriate further training and develop-ment to facilitate entry into the labour market.
• Encouraging better use ofworkplace-based skills development – improved productivitythrough targeted training in critical skills in the workplace, linked both to the needs of the enterprise and to the broader industrial policy framework of government.
• Encouraging and supporting cooperatives, small enterprises,worker-initiated,NGO andcommunity training initiatives to encourage sustainable entrepreneurship and social devel-opment.
• Increasingpublicsectorcapacityforimprovedservicedeliveryandsupportingthebuildingof a developmental state through improved cooperation with SETAs to support targeted and strategic skills development initiatives.
• Buildingcareerandvocationalguidance–clarificationofcareerpaths,anddisseminationof appropriate information to learners from school level up.
• Furthermore,someoftheindividualsub-sectorsareanticipatingchangestotheiroperatingenvironment, some of which may impact on their operations and/or skills requirements. Most of the expected changes in policy are specific to each sub-sector, and do not cut across. For that reason, a limited number of examples are cited in the SSP, but a more comprehensive assessment of the changes to legal and policy context would need to be undertaken at sub-sector level to get the full picture.
Some of the key legislative changes that may impact on skills development are:• AmendmentstotheSkillsDevelopmentAct-totakeintoaccountthe various changes that have taken place in the skills development landscape.• TheLegalPracticesAct,toreplacetheAttorney’sActandtheAdmissionofAdvocatesAct.• AmendmentstotheFirearmsControlAct–tobroadenthescopeofexisting legislation and close loopholes.

S a f e t y a n d S e c u r i t y S e c t o r S k i l l s P l a n 15
The New Growth Path (NGP) presents a 10 programme micro economic package of which this is the fourth. This programme focuses on meeting the shortages in important skills for the economy and sets targets for:
• thetrainingofengineersunderpinnedbyimprovedscienceandmathematicseducationandexpanded bridging programmes for HE courses.
• thetrainingofartisansparticularlyinconstruction,mining,manufacturingandnewindus-tries such as in the green economy through the participation of state owned enterprises and under the management of SETAs .
• improvedskillsforworkersineveryjobthroughtheprovisionofcertificatedprogrammes,facilitated, financed and managed by SETAs.
• expandedresourcedFETcollegesystemthatproduceshighergraduationrates.• provisionofICTskillsinschooling,adulteducationandpublicservice.• skillsdevelopmentpolicyframeworkforincreasedsupplyofhighlyskilledlabourthrough
education and training and a streamlined immigration system that is linked to a skills trans-fer programme and on-going upgrade of local education.
Although the Industrial Policy Action Plan 2 published by the Department of Trade and Industry (DTI) is principally aimed at manufacturing industries, certain elements may also be relevant to the SASSETA sector. In particular, the emphasis on improved productivity in the workplace and the preferential procurement framework should be borne in mind by government departments and supported as appropriate. The IPAP proposes the following:
• Strengtheneddemand ledskillsplanning thedevelopmentof adedicated IPAPNationalArtisan Development Programme for priority manufacturing sectors through investment in dedicated research capacity to measure and project skills demand, expedited design and accreditation of occupational appropriate curricula and qualifications through the Quality Council for Trades and Occupations (QCTO), expansion of appropriate training sites to include skills centres, trade test centres, work experience placement and resourced FET colleges (human, equipment and machinery).
• StreamlinedskillsdeliverysystemthroughSOEskillsdeliveryforadedicatedindustryskillspartnerships for artisans, technicians and engineers in growth and new or emerging sec-tors that is based on a partnership of SOEs, corporates, HEIs and FET colleges.
• Supportingnationalcentresofexcellenceinprioritysectors,relevantSETAsviewedaskeyto ensuring financial and operational sustainability of these.
The National Planning Commission presents a number of challenges and constraints to national growth and development and identifies the quality of education and training as a major constraint in this regard. It concludes that long term sustainable success of the country requires investment in human resource development through financial investment in education and skills training. One of the pillars of the National Development Plan (NDP) is the need for a “capable and developmental state” which is the role the state should play in correcting historical inequalities. The plan recog-nises that for the state to intervene effectively, it must be “professional, competent and responsive to the needs of all citizens.” The SASSETA as a component of a state that supports other state institutions thus has a role to play in ensuring a capable and developmental state.

16 S a f e t y a n d S e c u r i t y S e c t o r S k i l l s P l a n
2.2 Overview of the Safety and Security Sector
The safety and security sector, as made up by sub-sectors under the skills development custodian-ship of the Safety and Security SETA, is principally responsible for prevention and combating of crime as well as for the administration of justice. The core of the sector includes Policing, Cor-rectional Services, Justice, Defence, Intelligence Activities, Legal Services and Private Security and Investigation Activities. The SETA’s mandate has been expanded to include municipal policing and traffic departments. Figure 1 highlights the SASSETA sub-sectors.
Figure 1: Safety and Security Sub-sectors
The long term vision of the sector is to have safer communities within the broader society, and the cyclical relationship depicted in Figure 1 depicts a vision of how the sub-sectors should be working closely and in an integrated manner to achieve the aim of crime prevention and combatting, secu-rity, peace, and rehabilitation of offenders within society.
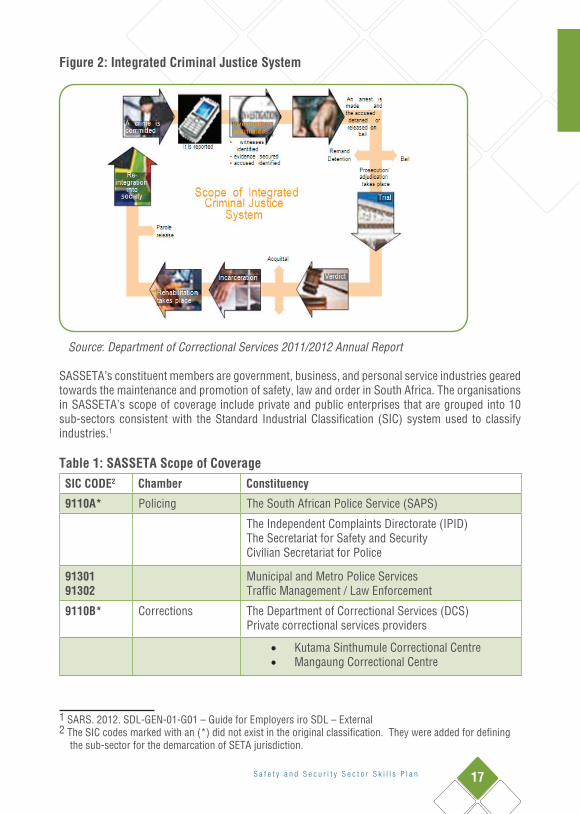
The constituencies of the SETA have a common responsibility for the administration and execution of different aspects of the safety and security functions within the Republic. Their functions are defined discretely, but their effectiveness depends on a coordinated and cooperative approach to the administration of the security and criminal justice system. The stakeholders represented within SASSETA collectively have a responsibility to work together to ensure the safety and security of society within the borders of South Africa to meet the vision of the JCPS Cluster. Figure 2 highlights the integrated nature of the criminal justice system.
S a f e t y a n d S e c u r i t y S e c t o r S k i l l s P l a n 17
Figure 2: Integrated Criminal Justice System
Source: Department of Correctional Services 2011/2012 Annual Report
SASSETA’s constituent members are government, business, and personal service industries geared towards the maintenance and promotion of safety, law and order in South Africa. The organisations in SASSETA’s scope of coverage include private and public enterprises that are grouped into 10 sub-sectors consistent with the Standard Industrial Classification (SIC) system used to classify industries.1
Table 1: SASSETA Scope of Coverage
SIC CODE2 Chamber Constituency
9110A* Policing The South African Police Service (SAPS)
The Independent Complaints Directorate (IPID)The Secretariat for Safety and SecurityCivilian Secretariat for Police
9130191302
Municipal and Metro Police ServicesTraffic Management / Law Enforcement
9110B* Corrections The Department of Correctional Services (DCS) Private correctional services providers
• Kutama Sinthumule Correctional Centre • Mangaung Correctional Centre
1 SARS. 2012. SDL-GEN-01-G01 – Guide for Employers iro SDL – External2 The SIC codes marked with an (*) did not exist in the original classification. They were added for defining the sub-sector for the demarcation of SETA jurisdiction.

18 S a f e t y a n d S e c u r i t y S e c t o r S k i l l s P l a n
SIC CODE2 Chamber Constituency
Judicial Inspectorate for Correctional ServicesCorrectional Supervision and Parole Boards
9110C* Justice The Department of Justice and Constitutional Develop-ment (DoJCD)National Prosecuting Authority (NPA)Special Investigations Unit (SIU)
9110D* Defence The Department of Defence (DOD)South African National Defence Force (SANDF)SA Navy
91104 IntelligenceActivities
The National Intelligence Agency (NIA)
91105 The South African Secret Service (SASS)
88110 Legal Services Legal and paralegal services
Sheriffs
88111 Legal Aid Services
88920 Private Security and Investigation Activities
Private security, investigation, and polygraph services
Source: South African Revenue Service Seta Sector Codes
For governance purposes, SASSETA has constituted six Chambers representing the sub-sectors. The Chambers ensure that the needs of their respective sub–sectors are collectively addressed and contribute to the achievement of the SASSETA SSP objectives. They meet quarterly to discuss is-sues of importance and to plan activities that will benefit the sub-sector. Each chamber comprises of equal numbers of employer and labour representatives, and SASSETA personnel. The chambers are:
• PrivateSecurity-representingthecountry’sprivatesecurity,labourunions,personalpro-tection and intruder detection companies.
• CorrectionsChamber -whosestakeholders include theDepartmentofCorrectionalSer-vices, private prisons, private and public detention centres Police and Civil Rights Union (POPCRU) and Public Servants Association of South Africa (PSA).
• LegalServiceschamber-representingattorneys,paralegals,sheriffs,intellectualpropertypractitioners and commercial legal advisors.
• JusticeChamber,forjudicialofficers,DepartmentofJusticeandConstitutionalDevelop-ment, NPA, National Education Health and Allied Workers Union (NEHAWU), South African State and Allied Workers Union (SASAWU), National Union of Public Service and Allied Workers (NUPSAW), PSA, registrars/masters and public defenders.
• Policing Chamber, for the South Africa Police Services, POPCRU, South African PoliceUnion (SAPU), RTMC and IPID.
• DefenceChamber– representing theDepartment ofDefence andmilitary veterans, andSouth African National Defence Union (SANDU).
The SETA is negotiating the establishment of a State Security Chamber.
S a f e t y a n d S e c u r i t y S e c t o r S k i l l s P l a n 19
2.3. Sub-sector Profiles
The sector is located within the broader context of developments in the country. The sector stake-holders emphasise the importance of not viewing crime management and combating in isolation from other social developments. For example, development policy and planning must take into account the implications of crime from the earliest stages. Many communities, both formal and informal, are being established with no provision for security services. Police stations are not integrated in the planning of the community, and only come about once problems arise within the new community. Equally, education and other policies must integrate social responsibility, so that crime is viewed as the scourge it is on society by the youngest members of society, and so that they realise their potential as part of a crime combatting collective.
This section discusses the shape, size and dynamics of each of the sub-sectors.
2.3.1. Policing
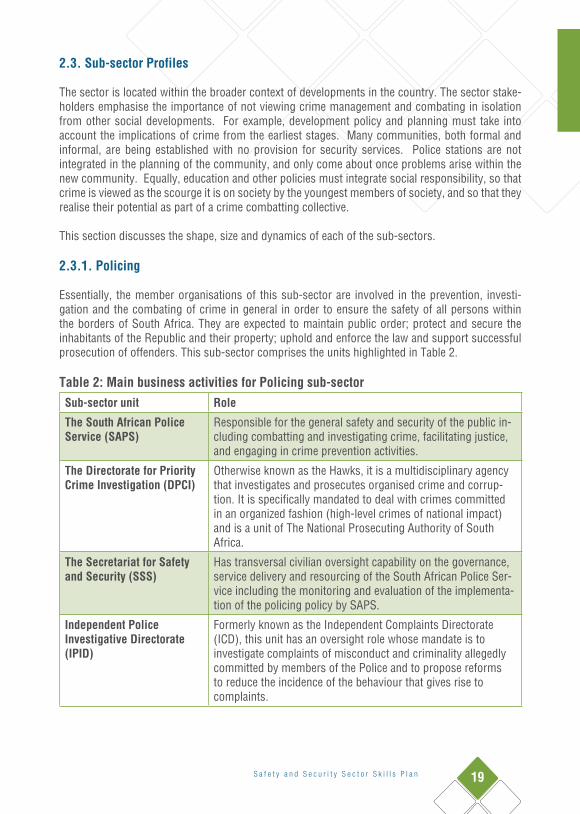
Essentially, the member organisations of this sub-sector are involved in the prevention, investi-gation and the combating of crime in general in order to ensure the safety of all persons within the borders of South Africa. They are expected to maintain public order; protect and secure the inhabitants of the Republic and their property; uphold and enforce the law and support successful prosecution of offenders. This sub-sector comprises the units highlighted in Table 2.
Table 2: Main business activities for Policing sub-sectorSub-sector unit Role
The South African Police Service (SAPS)
Responsible for the general safety and security of the public in-cluding combatting and investigating crime, facilitating justice, and engaging in crime prevention activities.
The Directorate for Priority Crime Investigation (DPCI)
Otherwise known as the Hawks, it is a multidisciplinary agency that investigates and prosecutes organised crime and corrup-tion. It is specifically mandated to deal with crimes committed in an organized fashion (high-level crimes of national impact) and is a unit of The National Prosecuting Authority of South Africa.
The Secretariat for Safety and Security (SSS)
Has transversal civilian oversight capability on the governance, service delivery and resourcing of the South African Police Ser-vice including the monitoring and evaluation of the implementa-tion of the policing policy by SAPS.
Independent PoliceInvestigative Directorate (IPID)
Formerly known as the Independent Complaints Directorate (ICD), this unit has an oversight role whose mandate is to investigate complaints of misconduct and criminality allegedly committed by members of the Police and to propose reforms to reduce the incidence of the behaviour that gives rise to complaints.
20 S a f e t y a n d S e c u r i t y S e c t o r S k i l l s P l a n
Municipal and Metro Police Services
Deal with day to day crime combating as well as perform func-tions that are not covered by SAPS e.g. traffic management, enforcing municipal bylaws and regulations.
Traffic Management / Law Enforcement
Responsible for national road traffic management and law enforcement.
The units function within the framework provided by the Justice, Crime Prevention and Security (JCPS) Cabinet Cluster which coordinates joint crime prevention initiatives in South Africa and all function under the political leadership of the Minister of Safety and Security.
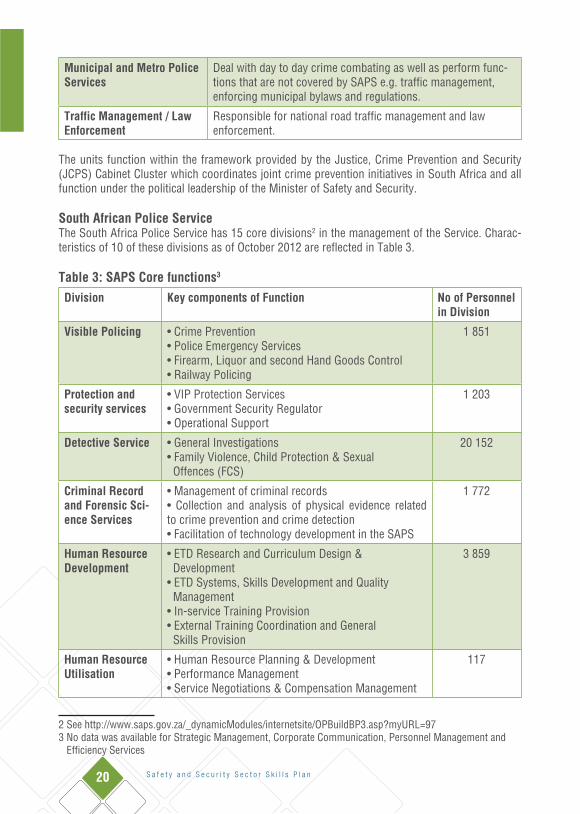
South African Police ServiceThe South Africa Police Service has 15 core divisions2 in the management of the Service. Charac-teristics of 10 of these divisions as of October 2012 are reflected in Table 3.
Table 3: SAPS Core functions3
Division Key components of Function No of Personnel in Division
Visible Policing •CrimePrevention•PoliceEmergencyServices•Firearm,LiquorandsecondHandGoodsControl•RailwayPolicing
1 851
Protection and security services
•VIPProtectionServices•GovernmentSecurityRegulator•OperationalSupport
1 203
Detective Service •GeneralInvestigations•FamilyViolence,ChildProtection&Sexual Offences (FCS)
20 152
Criminal Record and Forensic Sci-ence Services
•Managementofcriminalrecords• Collection and analysis of physical evidence relatedto crime prevention and crime detection •FacilitationoftechnologydevelopmentintheSAPS
1 772
Human Resource Development
•ETDResearchandCurriculumDesign& Development •ETDSystems,SkillsDevelopmentandQuality Management •In-serviceTrainingProvision•ExternalTrainingCoordinationandGeneral Skills Provision
3 859
Human Resource Utilisation
•HumanResourcePlanning&Development•PerformanceManagement•ServiceNegotiations&CompensationManagement
117
2 See http://www.saps.gov.za/_dynamicModules/internetsite/OPBuildBP3.asp?myURL=973 No data was available for Strategic Management, Corporate Communication, Personnel Management and Efficiency Services
S a f e t y a n d S e c u r i t y S e c t o r S k i l l s P l a n 21
Supply Chain Management
•Procurement,ProvisioningAdministration,Inventory & Armoury Management •FacilityandServicesManagement•VehicleFleet&RadioTechnicalManagement
1 348
Financial and administration services
•FinancialServices•AuxiliaryServices
617
Inspectorate •Inspections,EvaluationsandInterventions•InvestigationofComplaintsagainsttheService
125
Technology man-agement services
- 228
Total 31 272
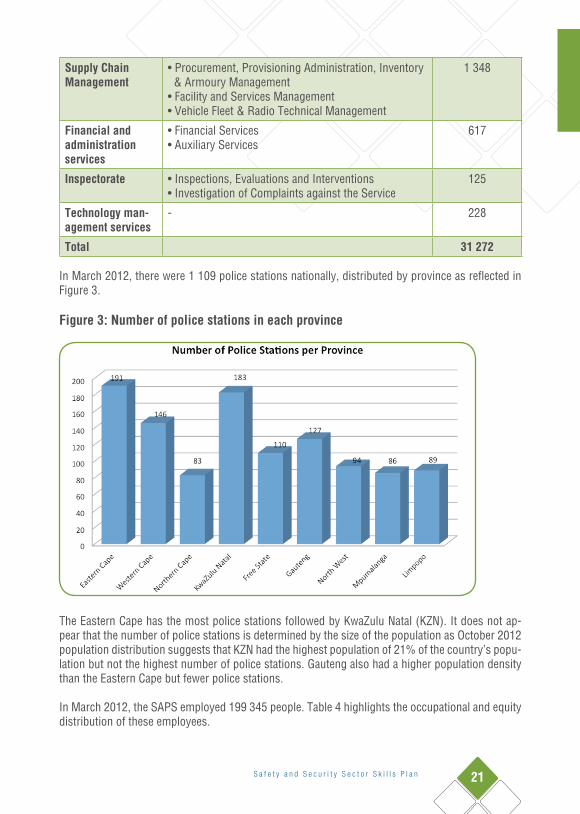
In March 2012, there were 1 109 police stations nationally, distributed by province as reflected in Figure 3.
Figure 3: Number of police stations in each province
The Eastern Cape has the most police stations followed by KwaZulu Natal (KZN). It does not ap-pear that the number of police stations is determined by the size of the population as October 2012 population distribution suggests that KZN had the highest population of 21% of the country’s popu-lation but not the highest number of police stations. Gauteng also had a higher population density than the Eastern Cape but fewer police stations.
In March 2012, the SAPS employed 199 345 people. Table 4 highlights the occupational and equity distribution of these employees.

22 S a f e t y a n d S e c u r i t y S e c t o r S k i l l s P l a n
Table 4: Distribution of SAPS employees by occupational bands, March 2012
Occupational Categories
Male Female
African Coloured Indian Total Blacks White African Coloured Indian Total
Blacks White Total
Legislators, senior officials and managers
308 57 36 401 129 158 19 10 187 54 771
Profession-als 3 128 436 277 3 841 1 565 2 292 384 227 2 903 1 697 10 006
Clerks 6 735 928 311 7 974 576 15 746 3 063 799 19 608 4 809 32 967
Service and sales workers
86 005 11 714 3 048 100 767 11 458 27 152 3 475 508 31 135 2 971 146 331
Craft andrelated trades workers
538 113 43 694 306 33 0 0 33 7 1 040
Plant and machine operators and assemblers
196 9 5 210 8 12 0 0 12 0 230
Elementary occupations 3 576 561 20 4 157 43 3 295 469 9 3 773 27 8 000
TOTAL 100 486 13 818 3 740 118 044 14 085 48 688 7 410 1 553 57 651 9 565 199 345
Source: SAPS Annual Report 2011/2012
Women constitute 34% of the SAPS work force.
Professions in the SAPS include aircraft pilots, policett officials, psychologists, counsellors, admin-istrators, chemists and engineers. The SAPS rank structure is as follows4:
1. Senior Management - Commissioned officers• General• LieutenantGeneral• MajorGeneral• Brigadier
2. Commissioned Officers• Colonel• LieutenantColonel• Major• Captain• Lieutenant
3. Non-commissioned officers
• WarrantOfficer• Sergeant• Constable
4http://www.saps.gov.za/

S a f e t y a n d S e c u r i t y S e c t o r S k i l l s P l a n 23
Salaries range from R70 000/annum for lower skilled Levels 1-2 employees, to R824 000 for senior management and executive authority (Levels 13 – 16).
Information on the distribution of personnel by occupational categories in Table 4 above shows that service and sales workers constitute the highest number of personnel, with plant and machine operators and assemblers being the least number of employees.
Less than 1% of SAPS’ employees have a disability and the distribution of employees with disabili-ties by gender and equity profile is reflected in Table 5.
Table 5: Profile of employees with disabilities, March 2012Male Female
African Coloured Indian Total Blacks
White African Coloured Indian Total Blacks
White Total
509 107 29 645 392 177 40 10 227 206 1 470
Source: SAPS Annual Report 2011/2012
SAPS’ vacancy rate for critical occupations is very low at 0.5%, as reflected in Table 6. However, the shortage of critical skills also includes police officials, whose responsibility for crime prevention and combatting includes visible physical presence.
Table 6: Vacancy rate for critical occupations at SAPS
Critical Occupations Year-end establishment
Number of Employees
Vacancy Rate (%)
Aircraft pilots & related associate professionals 47 46 2,1
Architects town and traffic planners 3 3 0
Chemists 1174 1 173 0,1
Engineers and related professionals 130 130 0
General legal administration & related professionals 418 418 0
Natural sciences related 6 6 0
Police 146 018 145 229 0.5
Psychologists and vocational counsellors 97 96 1
Total 147 893 147 101 0.5
Source: SAPS 2011/2012 Annual Report
The vacancies among police officers seems to have been created by dismissals. Table 7 shows that between April 2011 to 31 March 2012, there were 1 873 terminations among police officers. Proportionally, there was also a high percentage of terminations among architects, town and traffic planners.
24 S a f e t y a n d S e c u r i t y S e c t o r S k i l l s P l a n
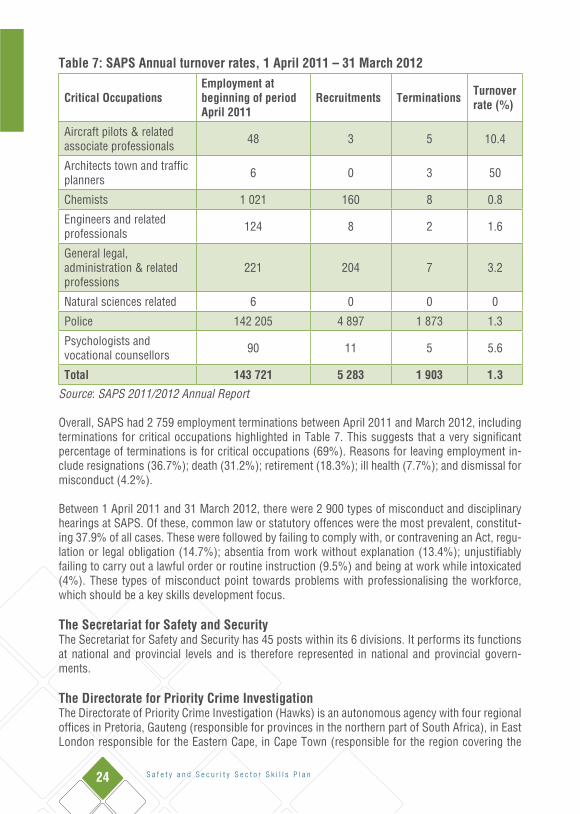
Table 7: SAPS Annual turnover rates, 1 April 2011 – 31 March 2012
Critical OccupationsEmployment at beginning of period April 2011
Recruitments Terminations Turnover rate (%)
Aircraft pilots & related associate professionals 48 3 5 10.4
Architects town and traffic planners 6 0 3 50
Chemists 1 021 160 8 0.8
Engineers and related professionals 124 8 2 1.6
General legal, administration & related professions
221 204 7 3.2
Natural sciences related 6 0 0 0
Police 142 205 4 897 1 873 1.3
Psychologists and vocational counsellors 90 11 5 5.6
Total 143 721 5 283 1 903 1.3Source: SAPS 2011/2012 Annual Report
Overall, SAPS had 2 759 employment terminations between April 2011 and March 2012, including terminations for critical occupations highlighted in Table 7. This suggests that a very significant percentage of terminations is for critical occupations (69%). Reasons for leaving employment in-clude resignations (36.7%); death (31.2%); retirement (18.3%); ill health (7.7%); and dismissal for misconduct (4.2%).
Between 1 April 2011 and 31 March 2012, there were 2 900 types of misconduct and disciplinary hearings at SAPS. Of these, common law or statutory offences were the most prevalent, constitut-ing 37.9% of all cases. These were followed by failing to comply with, or contravening an Act, regu-lation or legal obligation (14.7%); absentia from work without explanation (13.4%); unjustifiably failing to carry out a lawful order or routine instruction (9.5%) and being at work while intoxicated (4%). These types of misconduct point towards problems with professionalising the workforce, which should be a key skills development focus.
The Secretariat for Safety and SecurityThe Secretariat for Safety and Security has 45 posts within its 6 divisions. It performs its functions at national and provincial levels and is therefore represented in national and provincial govern-ments.
The Directorate for Priority Crime InvestigationThe Directorate of Priority Crime Investigation (Hawks) is an autonomous agency with four regional offices in Pretoria, Gauteng (responsible for provinces in the northern part of South Africa), in East London responsible for the Eastern Cape, in Cape Town (responsible for the region covering the
S a f e t y a n d S e c u r i t y S e c t o r S k i l l s P l a n 25
Western and Northern Cape) and the Durban office which covers KwaZulu-Natal and the Free State provinces. The agency comprises about 500 employees.
Civilian Secretariat for PoliceThe Civilian Secretariat for police does not have a budget vote and operates as a cost centre under the SAPS Programme 1: Administration. Its role is to “provide an efficient and effective civilian oversight over SAPS and enhance the role of the Minister of Police.”5 In March 2012, the Secretariat had only 55 posts and 53 of them were filled. One Secretariat employee had a disability. The Sec-retariat has more female (56%) than male (44%) employees. There is also a very high retention of employees in the Secretariat as none of the employees left their job between April 2011 and March 2012. There also seems to be an impeccable work ethic as there were no disciplinary hearings reported on during the same period.
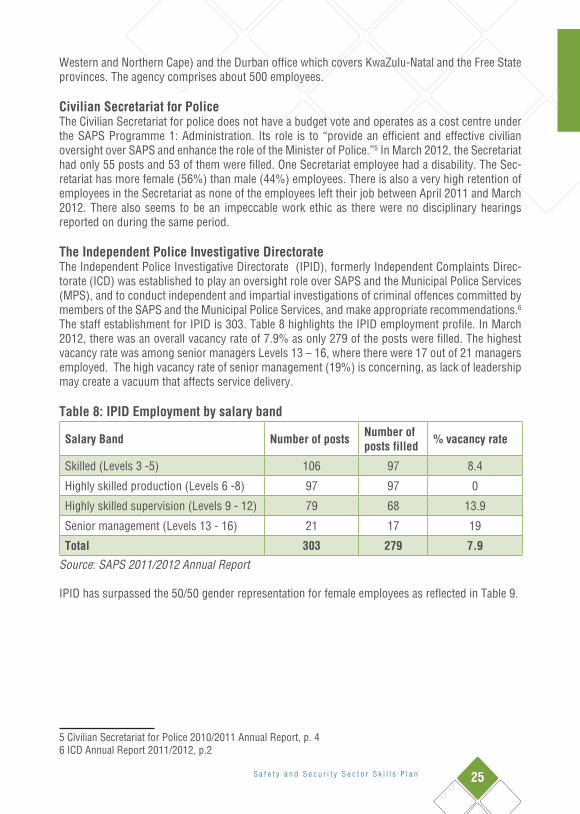
The Independent Police Investigative Directorate The Independent Police Investigative Directorate (IPID), formerly Independent Complaints Direc-torate (ICD) was established to play an oversight role over SAPS and the Municipal Police Services (MPS), and to conduct independent and impartial investigations of criminal offences committed by members of the SAPS and the Municipal Police Services, and make appropriate recommendations.6 The staff establishment for IPID is 303. Table 8 highlights the IPID employment profile. In March 2012, there was an overall vacancy rate of 7.9% as only 279 of the posts were filled. The highest vacancy rate was among senior managers Levels 13 – 16, where there were 17 out of 21 managers employed. The high vacancy rate of senior management (19%) is concerning, as lack of leadership may create a vacuum that affects service delivery.
Table 8: IPID Employment by salary band
Salary Band Number of posts Number of posts filled % vacancy rate
Skilled (Levels 3 -5) 106 97 8.4
Highly skilled production (Levels 6 -8) 97 97 0
Highly skilled supervision (Levels 9 - 12) 79 68 13.9
Senior management (Levels 13 - 16) 21 17 19
Total 303 279 7.9Source: SAPS 2011/2012 Annual Report
IPID has surpassed the 50/50 gender representation for female employees as reflected in Table 9.
5 Civilian Secretariat for Police 2010/2011 Annual Report, p. 46 ICD Annual Report 2011/2012, p.2

26 S a f e t y a n d S e c u r i t y S e c t o r S k i l l s P l a n
Table 9: Employment Equity at IPID
Occupational categories
Male FemaleTotal
African Coloured Indian White African Coloured Indian White
Legislators, senior officials and managers
10 - - 1 7 - - - 18
Professionals 28 3 3 8 20 1 - 4 67
Technicians and associate professionals
49 1 - 1 43 2 1 - 97
Clerks 33 - - - 53 9 2 - 97
Total 120 4 3 10 123 12 3 4 279
Employees with disabilities
2 - - - 2 - - - 4
Source: SAPS 2011/2012 Annual Report
Females constitute 51% of the workforce. There are only four employees with a disability, consti-tuting only 1% of the workforce. Compared to other sub-sectors in the sector, with less than 1% employees with disabilities on their workforce, IPID has done well in this area
From April 2011 to March 2012, there was an overall 11.3% turnover among staff, with 25 senior managers leaving the Directorate. The most prevalent reasons for leaving are transfer to other public service departments (80.7%) and resignations (16.1%).
Municipal and Metro Police ServicesMetro police were established as special police services for cities and they augment the work done by SAPS as well as perform other duties that SAPS do not cover e.g. enforcing municipal bylaws and regulations and policing road traffic. It is very difficult to find data about the size and shape of the metro police sub-sector - there also seems to be a dearth of consolidated studies on the subsec-tor. Limited data available from the metro websites indicates that there are 2 5007 metro police in the Johannesburg metro and 1 6008 in the Tshwane metro. The recent Corruption Watch report on the Johannesburg metro police indicates that there are 2 986 police officers in the metro.9 This lack of easily available data on the size and shape of metro police is a worrying factor considering that all metros have websites and annual reports where they could account to tax payers what the staff complement for the metro is including traffic officers.
7 Joburg Metro website: http://www.joburg.org.za/index.php?option=com_content&task=view&id=38&Itemid=678 State of the city address, March 2012: http://www.tshwane.gov.za/AboutTshwane/Council/ OfficeofExecutiveMayor/Pages/State-of-the-City-Address-2012.aspx9 Corruption Watch. 2012. The law for sale: Endemic corruption in the Johannesburg Metropolitan Police Department
S a f e t y a n d S e c u r i t y S e c t o r S k i l l s P l a n 27
Across various municipalities in South Africa there are traffic management and municipal policing functions that generally reside within Community Safety divisions. Whilst local municipalities are a competency of the Local Government SETA, the municipal policing and traffic management units within municipalities are a constituency of the SASSETA given their safety and security focus. The SASSETA would have to devise strategies to source additional data perhaps through the South African Local Government Association (SALGA) and the Department of Provincial and Local Gov-ernment.
Provincial government also has traffic management as a competency and more work needs to be done to understand the profile of the sub-sector in this regard.
Traffic Management/Law EnforcementThe Road Traffic Management Corporation (RTMC) is responsible for coordinated strategic planing, regulation, facilitation and law enforcement in road traffic matters by the national, provincial and local spheres of government. The areas of responsibility for the RTMC in relation to road traffic law enforcement are:
• To harmonise road traffic law enforcement between authorities and all spheres of govern-ment.
• To manage, co-ordinate and oversee road traffic safety communication and education programmes and campaigns.
• To manage and co-ordinate the effective, efficient and uniform training of road traffic officials in South-Africa.10
In March 2011, RTMC had a staff complement of 137, including interns. Africans constituted 84% of the work force, which was predominantly female (55%). Unfortunately, the RTMC does not indi-cate how many traffic officers there are. The expectation is that this entity would be able to provide information on the number of all traffic officers in the country including metro and municipal police officers. There is work that SASSETA can do in the training sub-sectors in the management of data, including performance reporting.
2.3.2. Private Security
Persistently high levels of crime have led to a changing landscape of policing in South Africa and many other countries. Policing entities no longer operate in isolation from one another and increas-ingly an integrated and diverse complexity of entities may engage with each other on a daily basis. For instance, a community may be secured not only by the state police, but by private security patrols, metro police and neighbourhood watch organisations or other voluntary community patrol systems working to secure the same area, possibly in a co-operative ‘network’. Thus within this environment the importance of the private security industry can’t be underscored.
The Private Security Sub-sector is regulated by the Private Security Industry Regulatory Authority (PSIRA) whose mandate is derived from the Private Security Industry Regulatory Act 56 of 2001. PSIRA has a staff establishment of 224 and a vacancy rate of 12% as reflected in Table 10.
10 http://www.rtmc.co.za/RTMC/RTLECET.jsp

28 S a f e t y a n d S e c u r i t y S e c t o r S k i l l s P l a n
Table 10: PSIRA employment data – March 2011
Division Number of posts Number of posts filled % vacancy rate
Directorate 4 4 -
Finance and Admin 56 49 12
Law Enforcement 150 131 12
Human Resources 5 4 0.2
Information Technology 2 2 -
Communications 7 7 -
Total 224 189 12Source: PSIRA Annual Report 2010/11
The staff complement of 189 reflects only the permanent staff. PSIRA also has 14 temporary staff, which makes the staff complement in March 2011 to be 203. The Finance and Admin and law en-forcement divisions are very understaffed. In March 2011 33% of all (203) PSIRA staff were male, and Africans constituted 75% of the total workforce. Annual staff turnover between 1 April 2010 and 31st March 2011 was quite high at 29%, 28% of which was in the Law enforcement division. Resignations constituted the highest reason for termination of employment, with 71% of the work-force that left resigning. PSIRA staff are based at their head office as well as in provincial offices throughout the country.
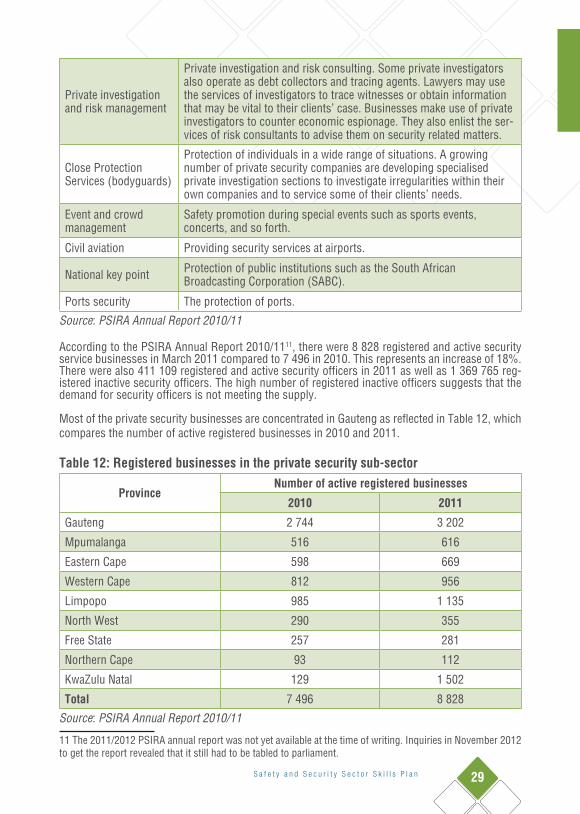
The private security industry is involved in private policing activities and these include a range of activities including guarding, armed response, private investigation, risk/ consultancy, manufacture and distribution of security equipment and so forth. Due to the nature of the services performed by the Private Security industry, this sub-sector is closely affiliated to the Policing and Correctional Services sub-sectors. The sub-sector’s clients include state institutions, which are increasingly made of private providers of security services. The private security services include but are not limited to the following:
Table 11: Services offered in the Private Security sub-sectorService Description of activities
GuardingGuarding of fixed assets and property such as buildings, shopping complexes and schools. Other services include the patrolling of pri-vately owned public spaces and the policing of strike action.
Armed responseInstallation of electronic security systems linked to a central control room, which is responsible for deploying armed response personnel when required.
Assets-in-transit Comprises companies who run both cash-in-transit and guarding services.
Electronic hardware Installing of alarms and other security devices
S a f e t y a n d S e c u r i t y S e c t o r S k i l l s P l a n 29
Private investigation and risk management
Private investigation and risk consulting. Some private investigators also operate as debt collectors and tracing agents. Lawyers may use the services of investigators to trace witnesses or obtain information that may be vital to their clients’ case. Businesses make use of private investigators to counter economic espionage. They also enlist the ser-vices of risk consultants to advise them on security related matters.
Close Protection Services (bodyguards)
Protection of individuals in a wide range of situations. A growing number of private security companies are developing specialised private investigation sections to investigate irregularities within their own companies and to service some of their clients’ needs.
Event and crowd management
Safety promotion during special events such as sports events, concerts, and so forth.
Civil aviation Providing security services at airports.
National key point Protection of public institutions such as the South African Broadcasting Corporation (SABC).
Ports security The protection of ports.
Source: PSIRA Annual Report 2010/11
According to the PSIRA Annual Report 2010/1111, there were 8 828 registered and active security service businesses in March 2011 compared to 7 496 in 2010. This represents an increase of 18%. There were also 411 109 registered and active security officers in 2011 as well as 1 369 765 reg-istered inactive security officers. The high number of registered inactive officers suggests that the demand for security officers is not meeting the supply.
Most of the private security businesses are concentrated in Gauteng as reflected in Table 12, which compares the number of active registered businesses in 2010 and 2011.
Table 12: Registered businesses in the private security sub-sector
ProvinceNumber of active registered businesses
2010 2011
Gauteng 2 744 3 202
Mpumalanga 516 616
Eastern Cape 598 669
Western Cape 812 956
Limpopo 985 1 135
North West 290 355
Free State 257 281
Northern Cape 93 112
KwaZulu Natal 129 1 502
Total 7 496 8 828
Source: PSIRA Annual Report 2010/11
11 The 2011/2012 PSIRA annual report was not yet available at the time of writing. Inquiries in November 2012 to get the report revealed that it still had to be tabled to parliament.

30 S a f e t y a n d S e c u r i t y S e c t o r S k i l l s P l a n
There was substantial increase in the number of registered security businesses in KwaZulu Natal. This is an interesting phenomenon given that national crime statistics suggests that crime rates in the province are on the decline. The proliferation of private security companies in the province could mean that residents are responding to the high police : population ratio as explained earlier in the report, that KZN has the highest population density but compared to other less densely popu-lated towns like Limpopo, the city has fewer police officers.
2.3.3. Intelligence
The intelligence establishment obtains information for the state for national stability and security. The mandate of intelligence services is the collection and analysis of intelligence which can be broken down into in the following areas:
• Counterintelligence which protects the country from other countries’ intelligence gathering operations,
• Political intelligence that is necessary to shape the government’s foreign policy, • Economic intelligence on events and developments that have an effect on the
currency or on the economy in general, • Border intelligence to ensure the integrity of the border, • Terrorism intelligence in order to avert any acts of terror, • Intelligence on special events to ensure that the country is secure to
successfully host events, and • Organized crime and corruption to combat organized crime activities.
The need for secrecy in intelligence services means that the activities and performance of intel-ligence agencies can’t be as transparent as those of other government departments as this may compromise their efficacy. Thus the intelligence services do not disclose the number of people in its employ, nor do they disclose publicly where their members are posted. Being an information service where the primary resource is its people, these measures are intended to ensure the safety of members who often find themselves in volatile and hostile environments.
2.3.4. Legal Services
The constituent organisations that compose this sub-sector are predominantly private enterprises that are closely associated with the justice sub-sector, the Law Society of South Africa, the General Council of the Bar, Legal Aid South Africa and the Sheriffs. The legal practice sub-sector consists of independent private practices or legal firms that use the services of advocates, attorneys and paralegal practitioners but excludes legal professionals employed in corporate services. The sub-sector provides an array of legal services to its clientele. While legal firms may offer a wide range of legal services, many lawyers specialise in a specific area where the selection of services includes the following:
• Litigation – the representation of a client’s interests during dispute resolution proceedings.• Defence – the representation of a client during a criminal trial and anything in connection therewith.• Alternative dispute resolution – the resolution of disputes through means other than having
a matter adjudicated by a Court, including mediation and arbitration.• Provision of general legal advice – this is often done by law clinics and paralegal practitioners.• Other areas of specialization include the drafting and management of contracts, the Admin-
istration of trusts and estates, Conveyance, Personal injury and Road Accident Fund claims, Patent and trade mark law, and Labour relations.

S a f e t y a n d S e c u r i t y S e c t o r S k i l l s P l a n 31
The Law Society of South Africa (LSSA) was established in 1998 has six constituent members – the Black Lawyers Association (BLA), the Cape Law Society, the KwaZulu-Natal Law Society, the Law Soci-ety of the Free State, the Law Society of the Northern Provinces and the National Association of Demo-cratic Lawyers (Nadel). Its predecessor was the Association of Law Societies of the Republic of South Africa, which existed from 1938 to 1998. The LSSA represents the attorneys’ profession in South Africa, which comprises 20 000 attorneys and 5 000 candidate attorneys as at August 2010. In terms of the Attorneys Act, 1979 attorneys must register with the provincial law society where they practice, so attor-neys are members of the four provincial law societies referred to above. The provincial law societies also register the articles of clerkship for candidate attorneys. They are the regulatory and disciplinary bodies for attorneys. If a member of the public is dissatisfied with the service received from his/her attorney, he/she can lodge a complaint with the relevant provincial law society where the attorney is registered12.
The General Council of the Bar of South Africa (GCB) is a federal body representing the organized ad-vocates’ profession in South Africa, and has ten constituent societies of practising advocates called Bars. There is a Bar at the seat of every provincial and local division of the High Court of South Africa. The legal profession in South Africa is divided into advocates (barristers) and attorneys (solicitors). No dual practice is permitted. The advocates’ profession in South Africa is a referral profession. This means that a client approaches an attorney who, in turn, instructs an advocate13.
Advocates appear in most major cases in South African courts. These include the Constitutional Court, the Supreme Court of Appeal, Provincial High Courts, the Labour and Labour Appeal Courts, Land Claims and Tax Courts and the Magistrates’ Courts. Advocates appear in appeals in all supe-rior courts in South Africa. They also appear in trials and applications in the High Courts and other superior courts situated in the 9 provinces in South Africa. In addition advocates appear in arbitra-tions which include commercial, building, engineering and employment arbitrations. Advocates are also instructed to provide written or oral opinions on matters involving Southern African Law. Where advocates are engaged in South African courts, they are instructed by attorneys.
Members of the Bar typically specialize in the following areas of law:• Constitutional Litigation• Commercial Litigation• General Civil Litigation• Criminal Litigation• Trial and Appeals• Human Rights Law and Litigation• Company and Tax Law• Labour Law• Competition Law• Mining Law• Insurance Law• Personal Injury and Medical Negligence Law• Media and Broadcasting Law• Broadcasting Law• Property Law• Patents and Copyright Law• Computer and Telecommunications Law• Family law• Alternative Dispute Resolution
12 Law Society Website, http://www.lssa.org.za/?q=con,67,History13 GCB Website: http://www.sabar.co.za

32 S a f e t y a n d S e c u r i t y S e c t o r S k i l l s P l a n
Legal Aid South Africa is an independent statutory body established by the Legal Aid Act (1969) as amended with the objective to render or make available legal representation to indigent persons. The core business of Legal Aid SA is to deliver legal services from 64 Justice Centres established throughout South Africa, through six Regional Operational Offices and a National Office. Legal Aid South Africa had a staff complement of more than 2 400 in 2010 as reflected in Table 13.
Table 13: Legal Aid staff in March 201014
Provinces Number of posts
Number of posts filled
Number of permanent posts filled
Vacancy rate (%)
Number of posts filled to additional
establishmentNational Office 175 151 149 14.86 2Eastern Cape 364 357 345 5.22 12Free State/North West 363 342 335 7.71 7KwaZulu-Natal 388 400 379 2.32 21Gauteng 463 451 437 5.62 14
Limpopo/Mpumalanga 301 291 281 6.64 10
Western Cape/Northern Cape 459 459 432 5.88 27
Total 2 513 2 451 2 358 6.17 93Source: Legal Aid 2009/2010 Annual Report
Male employees constituted 51% of the work force and there were 1% employees with disabilities.
The Sheriff is an impartial and independent official of the Court appointed by the Minister for Justice and Constitutional Development. The Sheriff or Deputy Sheriff must serve or execute all documents issued by the courts and these include summons, notices, warrants and court orders. In February 2011, there were 248 active sheriffs, distributed nationally and demographically as highlighted in Table 14.
Table 14: Number of active Sheriffs in SA in February 2011Provinces Total Male Female White Black Indian Coloured
Gauteng 37 29 8 28 2 5 2KwaZulu Natal 26 18 8 15 4 6 -Mpumalanga 23 20 3 17 6 - -Limpopo 18 17 1 11 7 - -
Free State 26 23 3 24 2 - -
North West 21 17 4 15 5 - 1
Eastern Cape 43 34 9 19 23 - 1
Northern Cape 17 15 2 16 - - 1Western Cape 37 33 4 29 - - 8Total 248 206 42 174 49 11 13
Source: SA Board for Sheriffs 2010/11 Annual Report
14 This information is dated, but the most updated annual report from Legal Aid is the 2009/2010 one.

S a f e t y a n d S e c u r i t y S e c t o r S k i l l s P l a n 33
As Table 14 highlights, the Sherriff system has some major issues to deal with regarding transfor-mation as it is still a very predominantly male and white dominated profession. This situation is also the same with active deputy sheriffs, where males constitute 83% of the 953 strong work force, which comprises 61% white deputy sheriffs as reflected in Table 15.
Table 15: Number of active deputy Sheriffs in SA in February 2011
Provinces Total Male Female White Black Indian Coloured
Gauteng 238 209 29 171 48 4 15
KwaZulu Natal 129 116 13 51 35 40 3
Mpumalanga 58 41 17 36 21 - 1
Limpopo 57 42 15 30 27 - -
Free State 65 53 12 50 15 - -
North West 73 57 16 35 34 - 4
Eastern Cape 94 73 21 48 37 - 9
Northern Cape 42 30 12 35 - 1 6
Western Cape 197 174 23 125 4 - 68
Total 953 795 158 581 221 45 106
Source: SA Board for Sheriffs 2010/11 Annual Report
2.3.5. Justice
The sub-sector is constituted within the Ministry of Justice and Constitutional Development, as a single department with a constitutional mandate to uphold and protect the Constitution and the rule of law in the interest of a safer and more secure South Africa. The Department of Justice and Con-stitutional Development (DoJ&CD) has six programmes, namely: Administration, Court Services, State Legal Services, Auxiliary and Associated Services, Magistrates and Judges.
The main activities of the Justice sub-sector are to:• Facilitate and adjudicate the criminal matters and the resolution of civil disputes.• Prosecute criminal offences in all criminal courts and the investigation of certain offences.• Deliver legal and advocacy services to the community to promote access to justice.• Provide and manage of court facilities.• Deliver legal advisory services to, and representation of the state.• Develop the Constitutional, including the education of the public and government officials
with regard to constitutional rights and obligations, and monitoring the implementation of the Constitution.
• Develop legislation.• Facilitate the administration of deceased and insolvent estates, curatorship and tutorship,
the liquidation of companies and close corporations, the registration of trusts and the man-agement of the Guardian’s Fund.
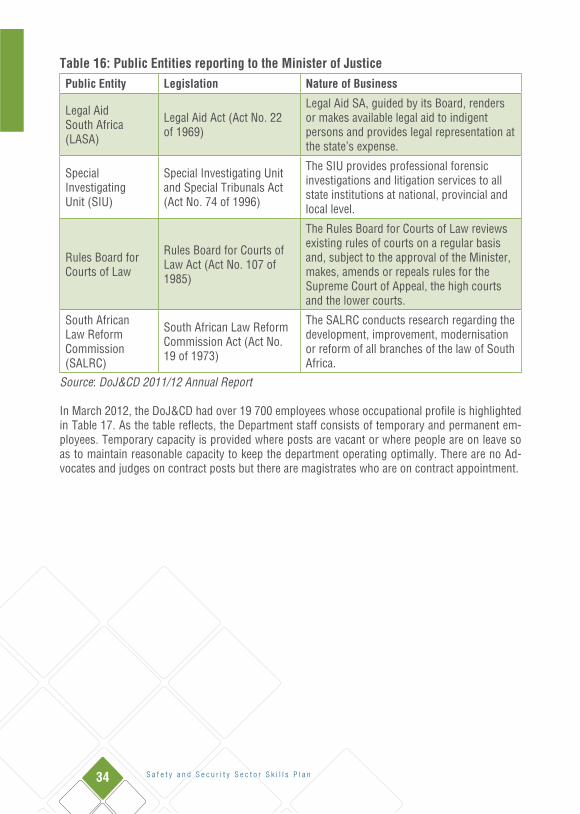
Several public entities highlighted in Table 16 report to the Minister of Justice.
34 S a f e t y a n d S e c u r i t y S e c t o r S k i l l s P l a n
Table 16: Public Entities reporting to the Minister of JusticePublic Entity Legislation Nature of Business
Legal AidSouth Africa(LASA)
Legal Aid Act (Act No. 22 of 1969)
Legal Aid SA, guided by its Board, renders or makes available legal aid to indigent persons and provides legal representation at the state’s expense.
SpecialInvestigatingUnit (SIU)
Special Investigating Unit and Special Tribunals Act (Act No. 74 of 1996)
The SIU provides professional forensic investigations and litigation services to all state institutions at national, provincial and local level.
Rules Board forCourts of Law
Rules Board for Courts of Law Act (Act No. 107 of 1985)
The Rules Board for Courts of Law reviews existing rules of courts on a regular basis and, subject to the approval of the Minister, makes, amends or repeals rules for the Supreme Court of Appeal, the high courts and the lower courts.
South AfricanLaw ReformCommission(SALRC)
South African Law ReformCommission Act (Act No. 19 of 1973)
The SALRC conducts research regarding the development, improvement, modernisation or reform of all branches of the law of South Africa.
Source: DoJ&CD 2011/12 Annual Report
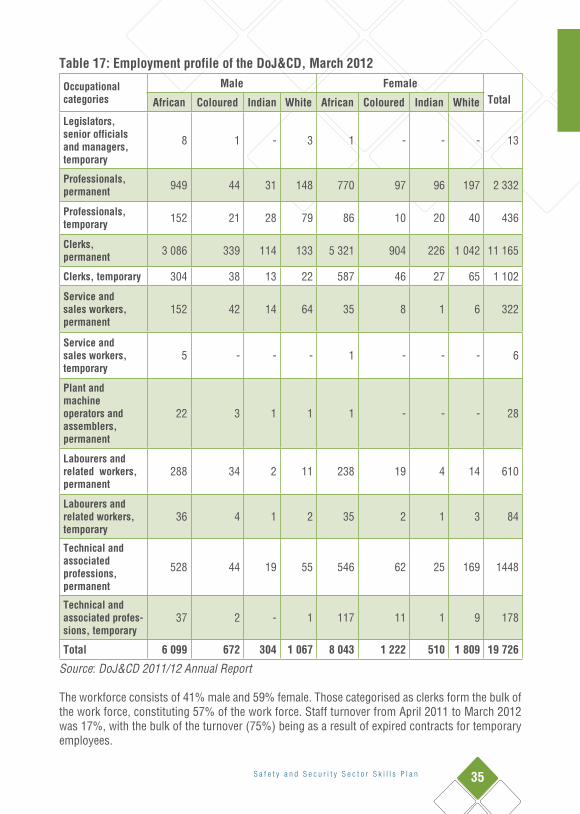
In March 2012, the DoJ&CD had over 19 700 employees whose occupational profile is highlighted in Table 17. As the table reflects, the Department staff consists of temporary and permanent em-ployees. Temporary capacity is provided where posts are vacant or where people are on leave so as to maintain reasonable capacity to keep the department operating optimally. There are no Ad-vocates and judges on contract posts but there are magistrates who are on contract appointment.
S a f e t y a n d S e c u r i t y S e c t o r S k i l l s P l a n 35
Table 17: Employment profile of the DoJ&CD, March 2012
Occupational categories
Male FemaleTotalAfrican Coloured Indian White African Coloured Indian White
Legislators, senior officials and managers, temporary
8 1 - 3 1 - - - 13
Professionals, permanent 949 44 31 148 770 97 96 197 2 332
Professionals, temporary 152 21 28 79 86 10 20 40 436
Clerks, permanent 3 086 339 114 133 5 321 904 226 1 042 11 165
Clerks, temporary 304 38 13 22 587 46 27 65 1 102
Service and sales workers, permanent
152 42 14 64 35 8 1 6 322
Service and sales workers, temporary
5 - - - 1 - - - 6
Plant and machine operators and assemblers, permanent
22 3 1 1 1 - - - 28
Labourers and related workers, permanent
288 34 2 11 238 19 4 14 610
Labourers and related workers, temporary
36 4 1 2 35 2 1 3 84
Technical and associated professions, permanent
528 44 19 55 546 62 25 169 1448
Technical and associated profes-sions, temporary
37 2 - 1 117 11 1 9 178
Total 6 099 672 304 1 067 8 043 1 222 510 1 809 19 726
Source: DoJ&CD 2011/12 Annual Report
The workforce consists of 41% male and 59% female. Those categorised as clerks form the bulk of the work force, constituting 57% of the work force. Staff turnover from April 2011 to March 2012 was 17%, with the bulk of the turnover (75%) being as a result of expired contracts for temporary employees.

36 S a f e t y a n d S e c u r i t y S e c t o r S k i l l s P l a n
2.3.6. National Prosecuting Authority
The National Prosecuting Authority (NPA) was created through Section 179 of the Constitution of the Republic of South Africa, 1996 (Act No. 108 of 1996. The National Prosecuting Authority has powers to:
• Institute and conduct criminal proceedings on behalf of the State. • Carry out any necessary functions incidental to instituting and conducting such criminal
proceedings (this includes investigation). • Discontinue criminal proceedings 15
The NPA is the the fourth programme of the Department of Justice and Constitutional Develop-ment and therefore supports all the efforts of the DoJ&CD to improve, modernise and strengthen the work of the Criminal Justice System. The obectives of the NPA are to reduce the overall levels of serious crime in particular contact and trio crimes; to suport a more effective Criminal Justice System; reduce corruption within the JCPS cluster so that the cluster becomes more effective and able to combat crime and boost investor confidence; manage perceptions of crime among citizens; and combat cyber crime.
The NPA has six units:1. Asset Forfeiture Unit (AFU) which focuses on the implementation of Chapters 5 and 6 of
the Prevention of Organised Crime Act, 1998(Act No. 121 of 1998.)(POCA). The AFU seizes assets that were acquired through criminal activity.
2. The National Prosecution Service (NPS) manages the performance of Directors of Public Prosecutions (DPPs) and Lower Courts countrywide.
3. Office for Witness Protection (OWP) provides specialised services to all Law Enforcement Agencies in RSA, Prosecution Services (NPA) and any judicial proceedings. They also provide assistance and co-operation to other Countries, Tribunals and Special Courts in the field of Witness Protection. They provide support services to vulnerable and intimi-dated witnesses and related persons in any judicial proceedings and in the Criminal Justice Systems. All OWP functions and duties are classified SECRET in terms of the Witness Protection Act.
4. Sexual Offences and Community Affairs (SOCA) Unit focuses on eradicating all forms of gender-based violence against women and children. SOCA has four sections: The Sexual Offences Section; The Domestic Violence Section; The Maintenance Section; and The Child Justice Section.
5. Specialised Commercial Crimes Unit (SCCU) focuses on serious economic crimes and corruption.
6. Priority Crimes Litigation Unit (PCLU) focuses on investigation and prosecution of serious national and international crimes, including acts of terrorism and sabotage, high treason, sedition, and foreign military crimes committed by mercenaries
In March 2012, the NPA had over 5 000 employees comprising both contract and permanent em-ployees, as reflected in Table 18.
15 NPA website: http://www.npa.gov.za/ReadContent381.aspx
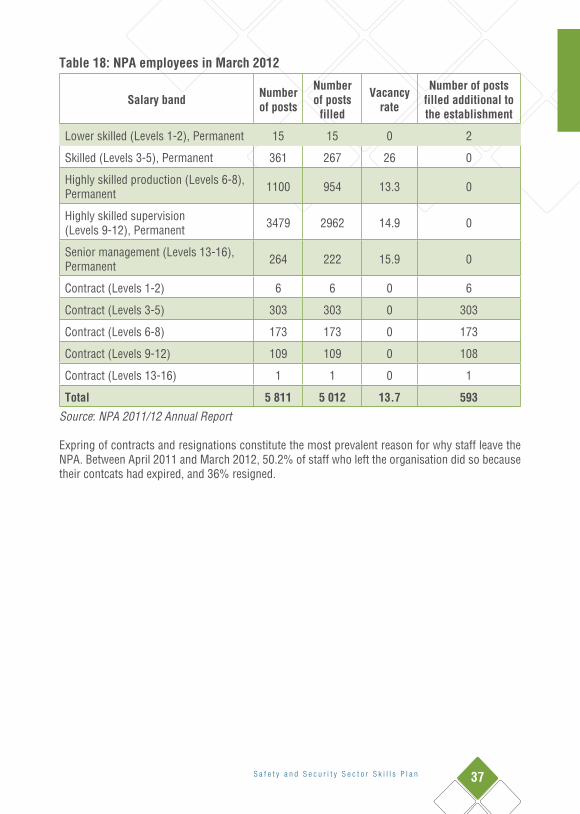
S a f e t y a n d S e c u r i t y S e c t o r S k i l l s P l a n 37
Table 18: NPA employees in March 2012
Salary band Number of posts
Number of posts
filled
Vacancy rate
Number of posts filled additional to the establishment
Lower skilled (Levels 1-2), Permanent 15 15 0 2
Skilled (Levels 3-5), Permanent 361 267 26 0
Highly skilled production (Levels 6-8), Permanent 1100 954 13.3 0
Highly skilled supervision (Levels 9-12), Permanent 3479 2962 14.9 0
Senior management (Levels 13-16), Permanent 264 222 15.9 0
Contract (Levels 1-2) 6 6 0 6
Contract (Levels 3-5) 303 303 0 303
Contract (Levels 6-8) 173 173 0 173
Contract (Levels 9-12) 109 109 0 108
Contract (Levels 13-16) 1 1 0 1
Total 5 811 5 012 13.7 593Source: NPA 2011/12 Annual Report
Expring of contracts and resignations constitute the most prevalent reason for why staff leave the NPA. Between April 2011 and March 2012, 50.2% of staff who left the organisation did so because their contcats had expired, and 36% resigned.

38 S a f e t y a n d S e c u r i t y S e c t o r S k i l l s P l a n
NPA’s equity profile is highlighted in Table 19.
Table 19: NPA employment profile, March 2012
Occupational categories
Male Female TotalAfrican Coloured Indian White African Coloured Indian White
Legislators, senior officials and Managers
41 8 5 55 18 2 8 16 153
Professionals 1392 159 69 351 797 187 146 480 3581
Technicians and associate professionals
239 27 8 21 457 69 21 62 904
Clerks 17 0 0 1 82 28 5 21 154
Service and sales workers 49 13 5 42 31 2 4 17 163
Elementary occupations 20 3 0 5 19 2 2 2 53
Other 2 0 0 0 2 0 0 0 4
TOTAL 1760 210 87 475 1406 290 186 598 5012
Employees with disabilities 1 0 0 2 1 1 0 1 6
Source: NPA 2011/12 Annual Report
Male employees constitute 51% of the NPA workforce and employees with disabilities make up only 0.1% of the workforce.
2.3.7. Corrections
The Corrections sub-sector is located within the Department of Correctional Service (DCS), whose operations are guided by seven key programmes:
• Administration - support functions for all service delivery by the Department including ad-ministrative, management, financial, ICT, and research and policy co-ordination.
• Security - provides safe and healthy conditions for all persons incarcerated, consistent with human dignity, and provides security for personnel and the public.
• Correction - provides needs-based correctional sentence plans and interventions, based on an assessment of the security risk and criminal profile of individuals.
• Development - provides needs-based personal development services to all offenders• Care - offers needs-based care programmes aimed at maintaining the well-being of incar-
cerated persons in the Department’s care.• Social Reintegration - supplies services focused on offenders’ preparation for release, their
effective supervision after release on parole, and on the facilitation of their social reintegra-tion into their communities
• Facilities - ensures that physical infrastructure supports safe custody, humane conditions, and the provision of corrective services, care and development, and general administration
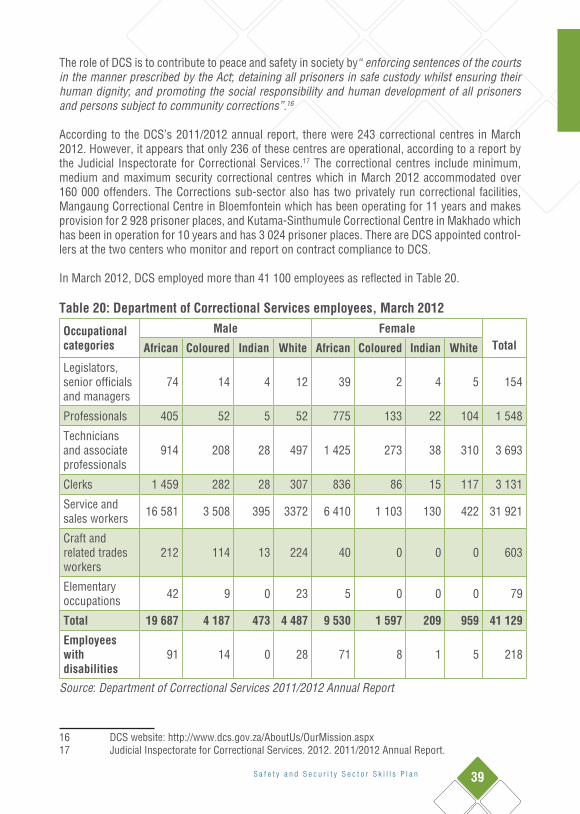
S a f e t y a n d S e c u r i t y S e c t o r S k i l l s P l a n 39
The role of DCS is to contribute to peace and safety in society by “enforcing sentences of the courts in the manner prescribed by the Act; detaining all prisoners in safe custody whilst ensuring their human dignity; and promoting the social responsibility and human development of all prisoners and persons subject to community corrections”.16
According to the DCS’s 2011/2012 annual report, there were 243 correctional centres in March 2012. However, it appears that only 236 of these centres are operational, according to a report by the Judicial Inspectorate for Correctional Services.17 The correctional centres include minimum, medium and maximum security correctional centres which in March 2012 accommodated over 160 000 offenders. The Corrections sub-sector also has two privately run correctional facilities, Mangaung Correctional Centre in Bloemfontein which has been operating for 11 years and makes provision for 2 928 prisoner places, and Kutama-Sinthumule Correctional Centre in Makhado which has been in operation for 10 years and has 3 024 prisoner places. There are DCS appointed control-lers at the two centers who monitor and report on contract compliance to DCS.
In March 2012, DCS employed more than 41 100 employees as reflected in Table 20.
Table 20: Department of Correctional Services employees, March 2012
Occupational categories
Male FemaleTotalAfrican Coloured Indian White African Coloured Indian White
Legislators, senior officials and managers
74 14 4 12 39 2 4 5 154
Professionals 405 52 5 52 775 133 22 104 1 548
Technicians and associate professionals
914 208 28 497 1 425 273 38 310 3 693
Clerks 1 459 282 28 307 836 86 15 117 3 131
Service and sales workers 16 581 3 508 395 3372 6 410 1 103 130 422 31 921
Craft and related trades workers
212 114 13 224 40 0 0 0 603
Elementary occupations 42 9 0 23 5 0 0 0 79
Total 19 687 4 187 473 4 487 9 530 1 597 209 959 41 129
Employees with disabilities
91 14 0 28 71 8 1 5 218
Source: Department of Correctional Services 2011/2012 Annual Report
16 DCS website: http://www.dcs.gov.za/AboutUs/OurMission.aspx17 Judicial Inspectorate for Correctional Services. 2012. 2011/2012 Annual Report.

40 S a f e t y a n d S e c u r i t y S e c t o r S k i l l s P l a n
Africans dominated the workforce (71%) and male employees constituted 80% of the establish-ment. DCS equity in relation to employees with disability is only 0.5%. Thirty nine thousand four hundred and forty-four (39 444) posts are regarded to be in critical occupations, and 38 675 of these were filled, signalling a vacancy rate of 2% for critical occupations. From April 2011 to March 2012, the staff turnover rate was only 2.9%. Resignation and retirement are the most prevalent reasons why employees left the department.
2.3.8. Judicial Inspectorate for Correctional ServicesThe Judicial Inspectorate for Correctional Services (JICS) is an independent office, mandated by Section 85 of the Correctional Services Act, 1998 (as amended). The JCIS, under the direction of the Inspecting Judge, facilitates the inspection of correctional centres to evaluate the treatment of inmates and conditions in correctional centres. The inspecting Judge appoints inspectors who conduct the situation analysis in correctional facilities and report back to him. In March 2012, the JICS had a funded fixed establishment of 4518, and 15 employees on contract. The post levels are reflected in Table 21. The staff comprises 79% black African, 18% Coloured, 2% white and 1% Indian. Female staff make up 49% of the staff complement.
Table 21: JICS staff, March 2012Post Level Number of posts
Inspecting Judge 1
Deputy Commissioner (CEO) 1
Director 1
Deputy Director 3
Assistant Director 8
Managers 9
Administrative support staff 22
Staff on fixed term contract 15
Total 60Source: JICS 2011/12 Annual report
2.3.9 Correctional Supervision and Parole Boards
Parole is the placement option from prison into the system of community corrections, where an offender is released before serving the full correctional period and they return to normal community life with controlled conditions under the supervision of correctional officials. Evaluations of parole granting and correctional supervision are implemented by the Correctional Supervision and Parole Boards. There are 53 Correctional Supervision and Parole Boards across the country. These Boards are chaired by community members who are regarded as suitable and capable of carrying out the responsibilities and are provided with intensive training by DCS, on the processes, legislative im-plications and policies. Two members of the community are appointed as members of the Board.
18 The JICS 2011/12 Annual report specifies this as 44 but it seems they have a miscalculation as the posts add up to 45
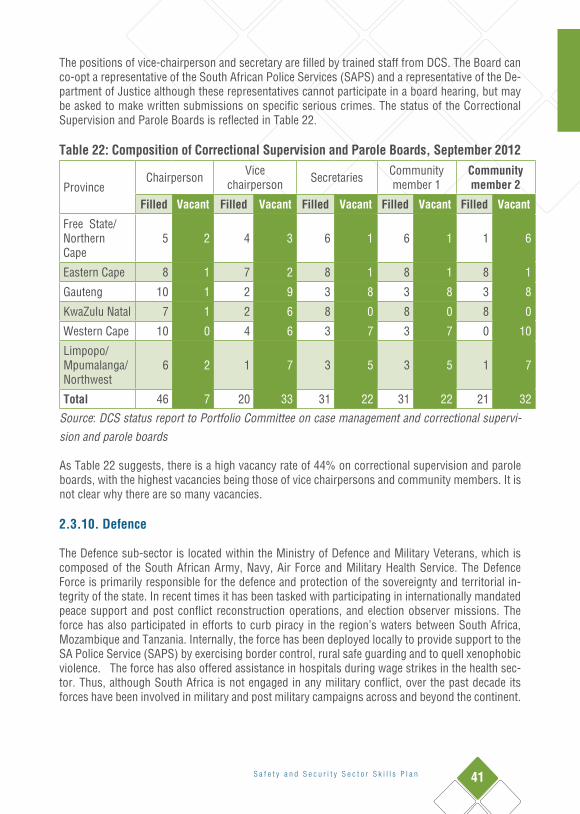
S a f e t y a n d S e c u r i t y S e c t o r S k i l l s P l a n 41
The positions of vice-chairperson and secretary are filled by trained staff from DCS. The Board can co-opt a representative of the South African Police Services (SAPS) and a representative of the De-partment of Justice although these representatives cannot participate in a board hearing, but may be asked to make written submissions on specific serious crimes. The status of the Correctional Supervision and Parole Boards is reflected in Table 22.
Table 22: Composition of Correctional Supervision and Parole Boards, September 2012
ProvinceChairperson Vice
chairperson Secretaries Community member 1
Community member 2
Filled Vacant Filled Vacant Filled Vacant Filled Vacant Filled Vacant
Free State/Northern Cape
5 2 4 3 6 1 6 1 1 6
Eastern Cape 8 1 7 2 8 1 8 1 8 1
Gauteng 10 1 2 9 3 8 3 8 3 8
KwaZulu Natal 7 1 2 6 8 0 8 0 8 0
Western Cape 10 0 4 6 3 7 3 7 0 10
Limpopo/Mpumalanga/Northwest
6 2 1 7 3 5 3 5 1 7
Total 46 7 20 33 31 22 31 22 21 32
Source: DCS status report to Portfolio Committee on case management and correctional supervi-sion and parole boards
As Table 22 suggests, there is a high vacancy rate of 44% on correctional supervision and parole boards, with the highest vacancies being those of vice chairpersons and community members. It is not clear why there are so many vacancies.
2.3.10. Defence
The Defence sub-sector is located within the Ministry of Defence and Military Veterans, which is composed of the South African Army, Navy, Air Force and Military Health Service. The Defence Force is primarily responsible for the defence and protection of the sovereignty and territorial in-tegrity of the state. In recent times it has been tasked with participating in internationally mandated peace support and post conflict reconstruction operations, and election observer missions. The force has also participated in efforts to curb piracy in the region’s waters between South Africa, Mozambique and Tanzania. Internally, the force has been deployed locally to provide support to the SA Police Service (SAPS) by exercising border control, rural safe guarding and to quell xenophobic violence. The force has also offered assistance in hospitals during wage strikes in the health sec-tor. Thus, although South Africa is not engaged in any military conflict, over the past decade its forces have been involved in military and post military campaigns across and beyond the continent.

42 S a f e t y a n d S e c u r i t y S e c t o r S k i l l s P l a n
The following public and state entities report to the Minister of Defence and Military Veterans:• ARMSCOR• Castle Control Board• Department of Military Veterans• Defence Force Service Commission (DFSC)• Office of the Military Ombud• Reserve Force Council.
In March 2012, the Ministry of Defence and Military Veterans employed more than 78 700 employees in their programmes as reflected in Table 23.
Table 23: Employment profile of the Ministry of Defence and Military Veterans, March 2012
Programme Number of Posts
Number of Employees
Vacancy Rate (%)
Number of Posts Filled Additional to the establishment
Defence Administration 4 897 3 715 24.14 1 182
Landward Defence 44 548 39 445 11.46 5 103
Air Defence 12 815 11 245 12.25 1 570
Maritime Defence 7 197 7 585 -5.39 -388
Military Health Services 9 878 9 098 7.90 780
Defence Intelligence 1 112 773 30.49 339
General Support 5 475 5 016 8.38 459
Force Employment 2 426 1 867 23.04 559
Total 88 348 78 744 10.87 9 604Source: Department of Defence and Military Veterans 2011/2012 Annual Report
Landward Defence has the highest staff establishment as well as the most number of employees. Air Defence also employs a substantial number of employees. The vacancy rate of 10.87% for the department is quite high. Of the 88 348 posts in the Department, only 18% are regarded as consti-tuting critical occupations as reflected in Table 24.
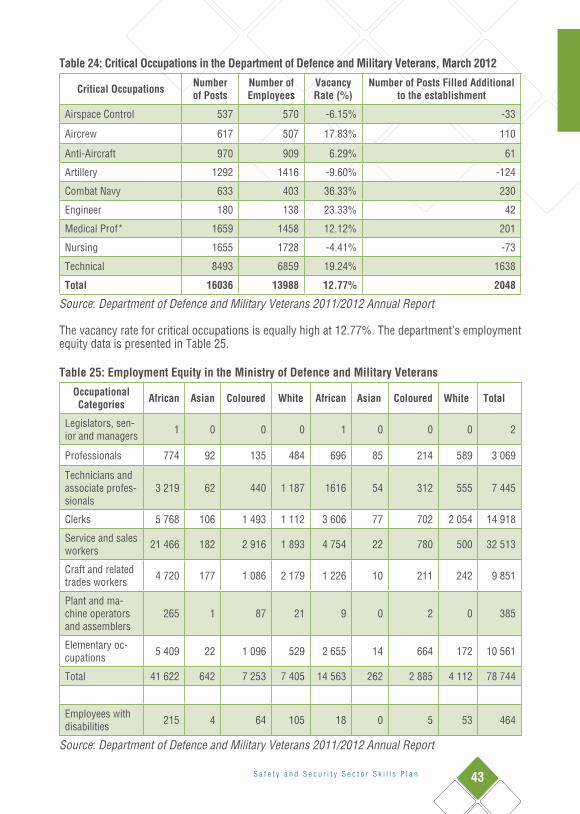
S a f e t y a n d S e c u r i t y S e c t o r S k i l l s P l a n 43
Table 24: Critical Occupations in the Department of Defence and Military Veterans, March 2012
Critical Occupations Number of Posts
Number of Employees
Vacancy Rate (%)
Number of Posts Filled Additional to the establishment
Airspace Control 537 570 -6.15% -33
Aircrew 617 507 17.83% 110
Anti-Aircraft 970 909 6.29% 61
Artillery 1292 1416 -9.60% -124
Combat Navy 633 403 36.33% 230
Engineer 180 138 23.33% 42
Medical Prof* 1659 1458 12.12% 201
Nursing 1655 1728 -4.41% -73
Technical 8493 6859 19.24% 1638
Total 16036 13988 12.77% 2048
Source: Department of Defence and Military Veterans 2011/2012 Annual Report
The vacancy rate for critical occupations is equally high at 12.77%. The department’s employment equity data is presented in Table 25.
Table 25: Employment Equity in the Ministry of Defence and Military VeteransOccupational Categories African Asian Coloured White African Asian Coloured White Total
Legislators, sen-ior and managers 1 0 0 0 1 0 0 0 2
Professionals 774 92 135 484 696 85 214 589 3 069
Technicians and associate profes-sionals
3 219 62 440 1 187 1616 54 312 555 7 445
Clerks 5 768 106 1 493 1 112 3 606 77 702 2 054 14 918
Service and sales workers 21 466 182 2 916 1 893 4 754 22 780 500 32 513
Craft and related trades workers 4 720 177 1 086 2 179 1 226 10 211 242 9 851
Plant and ma-chine operators and assemblers
265 1 87 21 9 0 2 0 385
Elementary oc-cupations 5 409 22 1 096 529 2 655 14 664 172 10 561
Total 41 622 642 7 253 7 405 14 563 262 2 885 4 112 78 744
Employees with disabilities 215 4 64 105 18 0 5 53 464
Source: Department of Defence and Military Veterans 2011/2012 Annual Report

44 S a f e t y a n d S e c u r i t y S e c t o r S k i l l s P l a n
Africans constitute over 71% of the work force, while men form the dominant workforce in num-bers, with more than 72% of employees being male. Employees with disabilities constitute only 0.5% of the workforce.
The Department has a high level of contract workers. From April 2011 to March 2012, of the 3 989 terminations, the highest (43.82%) were because of contracts that had come to an end.
2.4. Stakeholders in the safety and security sector
National government departments There are a number of national government Departments and public entities whose service delivery mandate relies on and supports the safety and security sector. Table 26 sets out broadly, the de-partments and public entities that have a vested interest in the safety and security sector.
Table 26: National government departments with a reliance on safety and security sector Department/Public Entity Safety and security needs
Agriculture, Forestry and Fisheries
• Fisheries monitoring, compliance and surveillance – military veterans are currently being used to combat poaching in the Western Cape area.
• Fisheries compliance officers work with SAPS in the investiga-tion of poaching and quota violations. They also give evidence in courts when perpetrators are being prosecuted.
• Combatting, investigating and prosecuting stock thieves• Combatting farm attacks• Investigating and prosecution of perpetrators of farm attacks
Basic Education • Contributes to awareness raising regarding criminal activities especially among minors. Learning areas such as Life Orienta-tion raise consciousness about crime, rights and justice.
Higher Education and Training
• Shapes policy and development for supply of skills.
Environmental Affairs • DEA’s environmental enforcement officials hand over cases of non-compliance with environmental legislation to the NPA prosecution.
• Environmental enforcement officials also work with SAPS in the investigation of environmental crimes.
Financial Intelligence Centre
• FIC works with safety and security role players to• Gather intelligence which can lead to prosecution of financial
gain achieved from poaching• Combat money laundering activities

S a f e t y a n d S e c u r i t y S e c t o r S k i l l s P l a n 45
Department/Public Entity Safety and security needs
Home Affairs • Border control • Immigration control • Determination of asylum applications• Investigating marriages of convenience and marriages where
women aren’t aware of such unions which are deducted for im-migration purposes
• The Counter Corruption and Security Services in DHA work with Crime Intelligence Unit, the Organised Crime Unit, and other SAPS units and members of the National Prosecuting Authority to prevent and combat corruption to protect and promote the integrity of the department.
Social Development • The Department can work with SAPS in the roll out of their Victim Empowerment programmes as well as programmes to combat drug abuse and reduce social crimes.
• SAPS assistance would also be useful in curbing human trafficking.• NPA will facilitate the prosecution of human traffickers.
South African Revenue Service
• SARS customs officials and investigators work closely with SAPS and the NPA to enforce relevant laws and prosecute of-fenders.
Women, Children and People with Disabilities
• SAPS’ Family Violence, Child Protection and Sexual Offences (FCS) units are of interest to the Department in the fight against crime perpetrated on women and children
• The Department can work closely with SAPS and prosecuting agencies to develop policies and education programmes on Gender based violence
Road Accident Fund • The Road Accident fund works with SAPS and NPA to investi-gate and prosecute fraudulent claims.
Collaboration between the aforementioned government departments and public entities with the safety and security sector will not only enable all parties to create an integrated and more effec-tive safety and security environment where institutions share information and limit the chances of perpetrators to escape justice. Working together would also enable them to pool resources and achieve better efficiency in dealing with crime.
Employee representativesEmployees in the safety and security sector are represented by the following labour unions:
• Police and Civil Rights Union (POPCRU) – POPCRU is for employees working for the SAPS DCS and Traffic Departments.
• South African Police Union (SAPU) also targets the same employees as POPCRU.• South African National Defence Union (SANDU) represents member employees from the
South African Defence Force.• Public Servants Association of South Africa (PSA) represents public service workers which
includes those working in the safety and security sector.• National Union of Public Service and Allied Workers (NUPSAW) also represents public
service employees.• South African State and Allied Workers Union (SASAWU) like NUPSAW and PSA represent
workers in the public service.
46 S a f e t y a n d S e c u r i t y S e c t o r S k i l l s P l a n
Labour representatives are useful stakeholders in the endorsement and promotion of education and training interventions for their members. They can also help with the collection of information about skills levels and needs of members.
Organisations using research to devise interventionsThere are various organisations including non-governmental organisations who conduct independ-ent research to provide critical analysis and reflective critique of the sector and use the research to devise informed interventions. These include:
• Institute for Democracy in Africa (IDASA) is a non-profit public interest organisation which has among its many programmes a safety and security programme aimed at promoting citizen safety through research informed interventions at local level.
• Institute for Security Studies (ISS) is a pan-African applied policy research institute with its headquarters in Pretoria, and offices in Cape Town, South Africa, Nairobi, Kenya, Addis Ababa, Ethiopia and Dakar, Senegal. ISS’s focus is to mainstream African human security into public policy processes and to influence decision makers within Africa and beyond. The Institute provides timely, empirical research and contextual analysis of relevant human security issues to policy makers, area specialists, advocacy groups, and the media. The Institute has some solid research papers on private security, crime and criminal justice, and children and security.
• Centre for the Study of Violence and Reconciliation (CSVR) is a multi-disciplinary institute involved in research, policy formation, community interventions, service delivery, educa-tion and training, and the provision of consultancy services. CSVR’s main goal is to con-tribute to building reconciliation, democracy and a human rights culture and in preventing violence in South Africa and in other countries in Africa. CSVR have conducted research and contributed to the discussion on use of force by the police as well as crime statistics. Some of CSVR programmes relevant to the safety and security sector are:• Criminal Justice Programme (CJP), which conducts research to deepen the under-
standing of the nature of violence, especially sexual violence - in South Africa’s cor-rectional centres, and explore ways in which to mitigate it. CJP works with the DCS to heighten awareness of violence in correctional centres and to provide support in the development and implementation of violence prevention and management strategies.
• The Gender-based Violence Programme (GBVP), through research, explores the root causes of gender-based violence and formulates informed strategies to address it for use by civil society and government.
• Youth Violence prevention programme targets youth and currently focuses on violence in schools, particularly violence between or against female youths. This programme also has a training component using a manual that was developed from research input. Training is provided to teachers, parents and learners.
• Centre for Scientific and Industrial Research (CSIR) is a leading scientific and technology research, development and implementation organisation. A key research area for the CSIR is national defence science, engineering and technology (SET). The CSIR is recognised by the national Department of Defence and others stakeholders in the defence sector as a leading R&D agency. CSIR research focus areas in defence are aeronautics systems, optronic sensor systems, command, control and information warfare, radar and electronic warfare, technology for special operations and landward sciences. The CSIR also engages in skills development - CSIR engineering and specialists contribute to developing capacity, competence and expertise among South Africa’s armed forces.
• The Centre for Crime and Justice Prevention (CJCP) is Section 21 Company that develops,

S a f e t y a n d S e c u r i t y S e c t o r S k i l l s P l a n 47
informs and promotes evidence-based crime prevention practice, with a particular focus on children and youth. CJCP integrates research and theory with the design, implementation and management of social crime prevention practice. They also provide training to high level public service officials.
• Other research organisations including consulting companies who do not work exclusively in the safety and security sector but have good research skills can also help in conducting sector profile research to inform SETA planning in terms of its skills development mandate.
Research institutions who engage in sector analysis are significant in that for situational analyses, they mostly provide sharp analysis and critique that demands accountability from authorities and employees in the sector. This can have the positive impact of improving service delivery to enhance public confidence. Research institutions engaged in innovation research help to keep the sector at par with the latest technology trends and equipment that ensures an up to date sector regarding any threats that may be considered by belligerent parties towards the country. It is useful for SASSETA to conduct a thorough audit that can inform the size and extent of these institutions so that they can guide SASSETA’s work in capacitating the sector. Their research can inform the SETA on what the sector priorities are.
Non-governmental organisations supporting the sectorSeveral non-governmental organisations (NGOs) support the safety and security sector by engag-ing in community education programmes, supporting victims of crime, and facilitating the rehabili-tation of offenders and their reintegration into the community. A few of the key NGOs are:
• The National Institute for Crime Prevention and Rehabilitation of Offenders (NICRO), which has offices in all nine provinces, with 50 accessible service points throughout South Africa. NICRO’s Head Office is in Cape Town. NICRO supports the criminal justice system through several projects: • Diversion, where offenders are diverted away from the courts so as not to receive a
criminal record; • Non-Custodial Sentencing, where the offender serves his/her sentence in the commu-
nity and not in prison. Offenders in this category are low risk and will have committed theft, attempted theft, assault with the intent to commit grievous bodily harm, common assault, housebreaking, attempted housebreaking and driving under the influence;
• Offender Reintegration, is prison-based support to enhance an offender’s chance of successfully reintegrating back into society.
• NICRO also has school and community based education programmes.• Khulisa Social Solutions has a business Unit focusing on Crime Prevention, Access to
Justice and Peace-Making. This Unit applies a holistic approach to victim empowerment, crime prevention and access to justice. Khulisa works in schools and prisons in the imple-mentation of their projects.
• Rape Crisis Cape Town deals with sexual violence and trauma, offering counselling, court preparation, public education, awareness raising, training of Criminal Justice System and Department of Health personnel, lobbying for changes in policy and legislation, monitoring of implementation of such changes and networking with other organisations and institu-tions in the field.
• Corruption Watch conducts research on corruption in the criminal justice system.• Business Against Crime was established by organised business in 1996 in response to a
request from then President Nelson Mandela who invited business to join hands with Gov-ernment in the fight against crime. It is a special purpose vehicle, with the sole mandate to engage and give support to Government on crime-related matters.
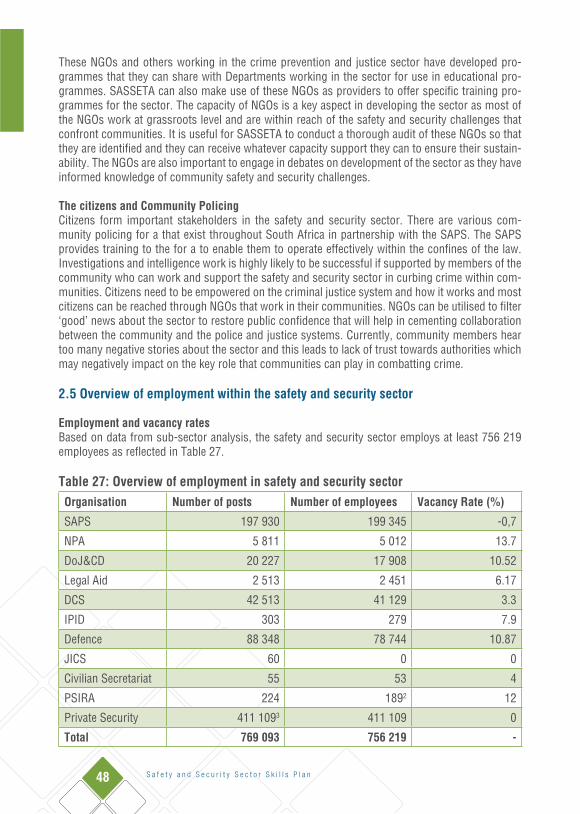
48 S a f e t y a n d S e c u r i t y S e c t o r S k i l l s P l a n
These NGOs and others working in the crime prevention and justice sector have developed pro-grammes that they can share with Departments working in the sector for use in educational pro-grammes. SASSETA can also make use of these NGOs as providers to offer specific training pro-grammes for the sector. The capacity of NGOs is a key aspect in developing the sector as most of the NGOs work at grassroots level and are within reach of the safety and security challenges that confront communities. It is useful for SASSETA to conduct a thorough audit of these NGOs so that they are identified and they can receive whatever capacity support they can to ensure their sustain-ability. The NGOs are also important to engage in debates on development of the sector as they have informed knowledge of community safety and security challenges.
The citizens and Community PolicingCitizens form important stakeholders in the safety and security sector. There are various com-munity policing for a that exist throughout South Africa in partnership with the SAPS. The SAPS provides training to the for a to enable them to operate effectively within the confines of the law. Investigations and intelligence work is highly likely to be successful if supported by members of the community who can work and support the safety and security sector in curbing crime within com-munities. Citizens need to be empowered on the criminal justice system and how it works and most citizens can be reached through NGOs that work in their communities. NGOs can be utilised to filter ‘good’ news about the sector to restore public confidence that will help in cementing collaboration between the community and the police and justice systems. Currently, community members hear too many negative stories about the sector and this leads to lack of trust towards authorities which may negatively impact on the key role that communities can play in combatting crime.
2.5 Overview of employment within the safety and security sector
Employment and vacancy ratesBased on data from sub-sector analysis, the safety and security sector employs at least 756 219 employees as reflected in Table 27.
Table 27: Overview of employment in safety and security sectorOrganisation Number of posts Number of employees Vacancy Rate (%)
SAPS 197 930 199 345 -0,7
NPA 5 811 5 012 13.7
DoJ&CD 20 227 17 908 10.52
Legal Aid 2 513 2 451 6.17
DCS 42 513 41 129 3.3
IPID 303 279 7.9
Defence 88 348 78 744 10.87
JICS 60 0 0
Civilian Secretariat 55 53 4
PSIRA 224 1892 12
Private Security 411 1093 411 109 0
Total 769 093 756 219 -

S a f e t y a n d S e c u r i t y S e c t o r S k i l l s P l a n 49
From the data available, unsurprisingly, the private security sub-sector employs the most employ-ees compared to the public sector which employs only 344 921 employees based on sub-sectors where data is available. This figure may increase if the number of traffic officers is established, but it is unlikely to surpass that of the private security sub-sector. The number of employees in the private security sub-sector can be attributed to the fact that the total sum of employees is based on employment by 8 828 businesses, as opposed to the nine government departments and public entities whose data is available. Comparatively, the average employees employed by government departments is far greater than that of private security businesses, which is 47 employees per business.
The average vacancy rate for the nine government departments and public entities is 6.7%, with NPA, DoJ&CD and Defence having the highest vacancy rates. Most of the public sector employers rely heavily on contract staff, which may affect continuity and is problematic in relation to skills development as investments in capacity building will be made without extracting long term gain from them, if the trained staff do not stay within the same department of field of work.
Equity in the sectorConsidering public sector employees and PSIRA management, where equity data is available, col-lectively, the sector has not yet achieved gender parity - women constitute only 34% of the work force in the reviewed sub-sectors. However, some institutions e.g. DoJ&CD, IPID, Civilian Secre-tariat for Police and PSIRA have exceeded gender parity as female employees in these organisa-tions surpass male. Table 28 depicts employment equity data.
Table 28: Safety and security sector equity profile
Departments Female Male African Coloured Indian WhiteEmployees with disabilities
SAPS 67 216 132 129 149 174 21 228 5 293 23 650 1 470
NPA 2 480 2 532 3 166 500 273 1 073 6
DoJ&CD 11 584 8 142 14 142 1 894 814 2 876 0
Legal Aid 1 190 1 261 1 578 336 172 365 23
DCS 12 295 28 834 29 217 5 784 682 5 446 218
IPID 142 137 243 16 6 14 4
Defence 21 822 56 922 56 185 10 138 904 11 517 464
JICS 29 31 47 11 1 1 -
Civilian Secretariat for Police 31 11 44 2 3 4 0
PSIRA 1364 67 153 13 5 32 0
Total 116 925 230 066 252 949 39 922 8 153 44 978 2 185 Africans constitute the most dominant group, with 73% of the work force, and Indians form the smallest group with only 2% of the work force. The sector has a long way in meeting targets for employing people with disabilities – only 0.6% of the sector employees have disabilities.

50 S a f e t y a n d S e c u r i t y S e c t o r S k i l l s P l a n
2.6. Factors Impacting Development in the Sector
This section will present a political, economic, social, technological, and environmental (PESTE) analysis of factors impacting the development of the sector and where applicable, what SASSETA’s role is in mitigating some of the challenges emerging from these factors.
2.6.1. Political situation
The four biggest factors affecting the sector from a political point of view are political uncertainty, inconsistencies in the parole system, corruption in the civil service and poor service delivery.
There are two dominant issues related to political uncertainly: political direction of the country and policy direction of the ruling party regarding nationalisation. Considering political direction, the Grant Thornton International Business Report (IBR), based on a quarterly survey of 12 000 busi-nesses across 40 economies has found that of the 29% respondents affected by political uncer-tainly, 26% are putting off investment decisions and 24% are considering investing offshore rather than in South Africa. Political uncertainly and clear direction on the nationalisation of mines are regarded as killing investor appetite in South African mining.19 Lack of investment equals stagna-tion in employment which leads to economic depravity and in some cases to an increase in criminal activity, which will strain the criminal justice system..
Regarding the parole system, public outcry over the release of convicted Commissioner Jackie Selebi and Shabir Schaik on parole and public speculations that political interference had led to their parole release has positively led to legislative amendments to make the medical parole process more stringent. A new Correctional Services Act, was signed into law in 2011, provisioning for a wider group of people to have the ability to nominate a prisoner for medical parole, not just the at-tending doctor. Independent doctors not linked to correctional services will make the final call on whether an inmate qualifies for medical parole. The new act is also explicit about the conditions that will be considered for medical parole.20 SASSETA’s role in capacitating the new parole board will continue to be critical. It will be critical to provide needs based training based on a proper skills audit.
In relation to corruption, the phenomenon has become endemic in South Africa, both in the private and public sector. Corruption taking place in the public service is political as it is mainly being driven by officials who are abusing state resources for personal gain. Corruption in government is prevalent and it manifests itself through the following forms:
• Bribery - taking money to give people preferential treatment, for example, officials accept-ing bribes to move people up on the housing waiting list.
• Embezzlement - stealing money or resources that are supposed to be under your control, e.g. social security grants being stolen by officials and using public money to buy personal goods like a car/airline ticket.
• Fraud - making false claims for benefits, e.g. applying for false social grants and pocketing the money.
19 Mail & Guardian. 5 July 2012. Nationalisation back-and-forth damages the economy. Available at: http://mg.co.za/article/2012-07-05-nationalisation-to-and-fro-damages-the-economy20 Hlongwane, S. 24 Febryary 2012. New medical parole board, new rules as Correctional Services moves to avoid another Shaik ‘brouhaha’. Daily Maverick. Available at: http://dailymaverick.co.za/article/2012-02-24-new-medical-parole-board-new-rules-correctional-services-moves-to-avoid-another-shaik-brouhaha

S a f e t y a n d S e c u r i t y S e c t o r S k i l l s P l a n 51
• Extortion - forcing someone to give benefits in exchange for acting/ not acting in a particu-lar way, e.g. police officers taking money from criminals to lose their case evidence.
• Abuse of power - using one’s power or position of authority to improperly benefit or dis-criminate against another person, e.g. when a teacher asks for sexual favours in return for passing a student.
• Abuse of privileged information - using information an official has access to because of their job to benefit someone who can make money from it, for example, knowing govern-ment wants some vacant land for a new housing development and telling a friend to buy the land so that they can sell it at a huge profit.
• Favouritism - unfairly providing services or resources to friends, e.g. a head of department makes sure that all her/his friends in the department go overseas with her/him on official trips.
• Nepotism - giving jobs or services unfairly to family members, e.g. procuring a company owned by a spouse without going through the proper procurement procedures.21
The challenge for the criminal justice system is policing and prosecuting corruption across govern-ment, but also within the sector, which has some of the most rampant corruption which has very grave consequences for social relations in the community. Newham and Faull (2011)22 report that corruption in the SAPS is a systemic problem with no real system to monitor it since the closure of the Anti-corruption Unit. There is lack of a strong system to track corruption in the SAPS. Corrup-tion by police can be reported to a 10111 emergency number for the Public Service Commission, and this disables SAPS’ ability to monitor all the corruption allegations and investigations taking place throughout the organisation. SAPS management have not always acted decisively on corrup-tion against police officers. For example, between 2001 and 2008, the then Independent Complaints Directorate (ICD) recommended disciplinary action in 928 cases of misconduct by police officials but SAPS only took action in 48 of these cases. As a result, officials implicated in corruption continue to work in the system. Police corruption is complex as it is practiced at individual and organisational levels, and within a public service which is generally corrupt. Newham and Faull map out several dimensions of police corruption derived from Newburn (1999). These dimensions indicate just how diverse police corruption is, and how strategies to tackle this corruption has to be equally diverse.
21 Education and Training Unit for Democracy and Development. No date. Combatting corruption in Govern-ment. Available at: http://www.etu.org.za/toolbox/docs/govern/corruption.html22 Newham & Faull. 2011. Predator or protector? Tackling police corruption in South Africa. Institute for secu-
rity studies. Monograph 182.
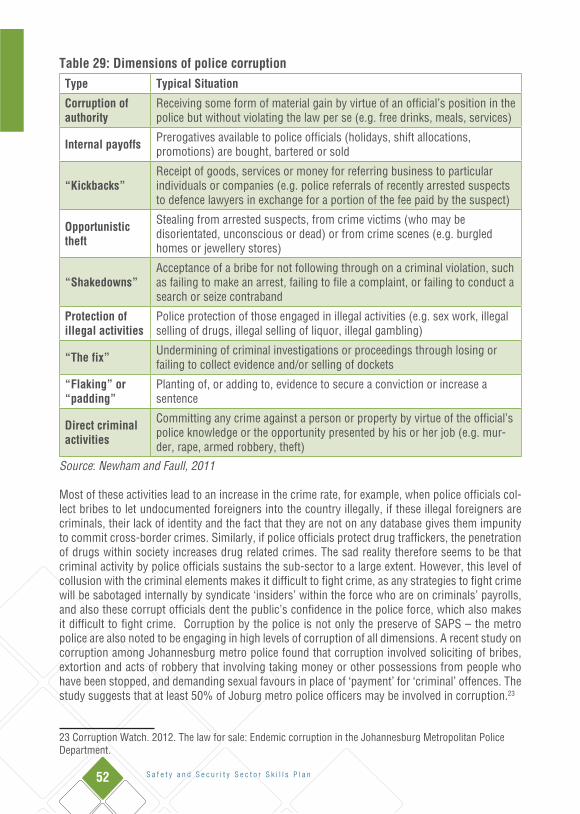
52 S a f e t y a n d S e c u r i t y S e c t o r S k i l l s P l a n
Table 29: Dimensions of police corruption Type Typical Situation
Corruption ofauthority
Receiving some form of material gain by virtue of an official’s position in the police but without violating the law per se (e.g. free drinks, meals, services)
Internal payoffs Prerogatives available to police officials (holidays, shift allocations,promotions) are bought, bartered or sold
“Kickbacks”Receipt of goods, services or money for referring business to particularindividuals or companies (e.g. police referrals of recently arrested suspects to defence lawyers in exchange for a portion of the fee paid by the suspect)
Opportunistic theft
Stealing from arrested suspects, from crime victims (who may bedisorientated, unconscious or dead) or from crime scenes (e.g. burgledhomes or jewellery stores)
“Shakedowns”Acceptance of a bribe for not following through on a criminal violation, such as failing to make an arrest, failing to file a complaint, or failing to conduct a search or seize contraband
Protection ofillegal activities
Police protection of those engaged in illegal activities (e.g. sex work, illegalselling of drugs, illegal selling of liquor, illegal gambling)
“The fix” Undermining of criminal investigations or proceedings through losing orfailing to collect evidence and/or selling of dockets
“Flaking” or“padding”
Planting of, or adding to, evidence to secure a conviction or increase asentence
Direct criminalactivities
Committing any crime against a person or property by virtue of the official’s police knowledge or the opportunity presented by his or her job (e.g. mur-der, rape, armed robbery, theft)
Source: Newham and Faull, 2011
Most of these activities lead to an increase in the crime rate, for example, when police officials col-lect bribes to let undocumented foreigners into the country illegally, if these illegal foreigners are criminals, their lack of identity and the fact that they are not on any database gives them impunity to commit cross-border crimes. Similarly, if police officials protect drug traffickers, the penetration of drugs within society increases drug related crimes. The sad reality therefore seems to be that criminal activity by police officials sustains the sub-sector to a large extent. However, this level of collusion with the criminal elements makes it difficult to fight crime, as any strategies to fight crime will be sabotaged internally by syndicate ‘insiders’ within the force who are on criminals’ payrolls, and also these corrupt officials dent the public’s confidence in the police force, which also makes it difficult to fight crime. Corruption by the police is not only the preserve of SAPS – the metro police are also noted to be engaging in high levels of corruption of all dimensions. A recent study on corruption among Johannesburg metro police found that corruption involved soliciting of bribes, extortion and acts of robbery that involving taking money or other possessions from people who have been stopped, and demanding sexual favours in place of ‘payment’ for ‘criminal’ offences. The study suggests that at least 50% of Joburg metro police officers may be involved in corruption.23
23 Corruption Watch. 2012. The law for sale: Endemic corruption in the Johannesburg Metropolitan Police Department.

S a f e t y a n d S e c u r i t y S e c t o r S k i l l s P l a n 53
When corruption is as rampant as suggested within SAPS and Johannesburg metro police, this creates an environment where the practice becomes pervasive and ‘normal’. In order for some forms of corruption like disappearing of dockets and assisting prisoners to escape to persist, it involves collusion across the criminal justice system. Some lawyers pocket huge sums of money to defend criminals in the guise of practicing law. Corruption is also prevalent in the correctional services. According to the 2010-11 JICS report, there were 2,646 complaints of corruption during its annual reporting period. At least 10 agencies, including the SIU, the Public Service Commission, the Office of the Public Prosecutor, and the Office of the Auditor General were involved in anticor-ruption activities.24
Considering poor service delivery, the impact is at private and business level, and it has also im-pacted the sector’s already limited human capacity. According to the Grant Thornton’s IBR, poor service delivery is negatively impacting businesses. Fifty-nine per cent of all SA business owners surveyed in the second quarter of 2012 were to varying degrees affected, depending on their busi-ness location, with the Eastern Cape (EC) businesses battling the most - 65% of business execu-tives surveyed in the EC confirmed that poor government service delivery is a concern. The other businesses concerned are in Gauteng (54%); KZN (52%) and Western Cape (50%). The service delivery areas impacting businesses are utilities (electricity and water - mentioned by 32% of re-spondents), and billing, e.g. rates and taxes, mentioned by 25% of respondents.25
While some businesses deal with their own frustrations and devise mitigating strategies to counter poor service delivery, the communities who have engaged in widespread service delivery protests do not usually have alternatives to address poor service provision, and resort to protests. These unanticipated protests and their violent nature has led to the deployment of the police force to quell the protests, putting a strain on police capacity. The 2012 SAPS crime statistics confirm a 24.8% increase between 2011 and 2012 in the demand for crowd management during unrest, with most crowd management services required in the Northwest during this period.26 Table 30 highlights a general increase in unrests, with a reduction only in Limpopo and the Northern Cape.
These unrests not only affect the police force but the justice and legal systems as well. Often, wit-nesses to the arrests made during protests are community members who are sympathetic to the arrested protesters so it may be difficult to rely on them as reliable and credible witnesses. This is worsened by allegations of torture for admission of guilt that have accompanied these arrests. Clearly, the violent service delivery protests that have characterised the years from 2009 – 2012 point to the need for dedicated preparation of the police force on how to deal with such protests in a manner that does not further incite the community and further damage already predominantly negative perceptions of the police force by communities. Protests are likely to increase as citizens more and more demand a better quality of life and improved accountability to justify so many years into the democratic dispensation.
24 http://www.globalsecurity.org/military/world/rsa/corruption.htm25 Nagar, D. June 2012. Macroeconomic impediments crippling South African businesses. Grant Thornton: http://www.gt.co.za/news/2012/07/macroeconomic-impediments-crippling-south-african-businesses/26 SAPS. 2012. Crime Statistics Overview, 2011/2012. Available at: http://www.saps.gov.za/statistics/reports/crimestats/2012/crime_stats.htm

54 S a f e t y a n d S e c u r i t y S e c t o r S k i l l s P l a n
Table 30: Overview of national unrests where police intervention was neededCrowd Management (Unrest)
Province 2009-10 2010-11 2011-12 % Difference2010/11 vs 2011/12
Gauteng 253 185 255 37.8
Limpopo 49 61 54 -11.5
North West 125 105 185 76.2
Mpumalanga 112 107 109 1.8
KwaZulu-Natal 146 124 143 15.3
Eastern Cape 86 63 101 60.3
Free State 72 118 125 5.9
Western Cape 123 137 180 31.4
Northern Cape 42 73 62 -15.1
Totals 1008 973 1214 24.8Source: Crime Statistics Overview RSA, 2011/2012, SAPS
2.6.2. Economic context
The New Growth Path identified infrastructure development as one of its imperatives and as part of government’s ambitious R850 billion infrastructure plan, 17 Strategic Integration Projects (SIPs) have been announced. The projects cover a range of economic and social infrastructure across all nine provinces with emphasis on poorer regions. It is anticipated that as these projects are being implemented, there will be an increased need for skills across various sectors. In the SASSETA context, the all sub-sectors that are likely to be impacted. The envisaged investments will most defi-nitely lead to improved economic activity in new areas and as populations in such areas increase, the need for policing services is likely to increase, putting pressure on the existing police force. The private security sector will benefit from new businesses wanting to improve security on their investments in the wake of a stretched public police force. The sector needs to be prepared for these demands so as to make a meaningful contribution.
Various SASSETA sub-sectors are likely to be impacted differently by economic fluctuations. Gov-ernment operational budgets are slow to respond to changes in the economic climate, particularly downswings. If tax revenues decline, the most significant and visible changes will be reflected in the ability of departments to render services effectively. Programmes may be scaled back, and new initiatives delayed or cancelled due to budget restrictions. Personnel and other fixed costs are more rigid, and tend not to change dramatically as a result of short or medium term economic impacts.
At a socio-economic level, the financial hardships that affect workers have strained the policing sub-sector as the police have had to be utilised for crowd control, for example during the Marikana Lonmin Mine strikes. Police reaction to this strike and the death of 34 miners suggests that the po-lice needs better preparation on the management of crowds during strike actions. The suggestions emerging from the enquiry that there has been ‘flaking’ or ‘padding’, that is, planting of evidence at the scene of the shootings at Marikana further entrenches the argument that police need training to understand the consequences of manipulating crime scenes and to avoid repeats of what happened at Marikana. The police force needs to be supported to respect the laws that they are mandated to uphold.

S a f e t y a n d S e c u r i t y S e c t o r S k i l l s P l a n 55
In the private sector, the impact of the economy is more direct and results are more immediate. South Africa’s service sector was not affected as much by the global economic recession as the manufacturing sector. In fact, the direct economic impact of the recession on jobs may have led to a higher demand for protection of property and goods, which could explain the increase in the demand for private security services. This is corroborated by the 2012 SAPS crime statistics, which suggests that nationally, there was only a small 2% drop nationally of residential burglary, between 2010 and 2011; a 0.9% reduction in residential property crime; and 0.2% reduction in non-residential property burglaries in the same period. According to PSIRA, demand for private security services peaked by 18.35% in March 2011 from 7 496 in April 2010. Accordingly, the number of registered active security officers went up by 5.13% between April 2010 and March 2011. The num-ber of inactive registered security officers also went up by 27.98%. PSIRA administration could not cope with the increase in registered security businesses - because administrative capacity has not increased, PSIRA could not conduct a sufficient he number of inspections on businesses.
Elsewhere, particularly in Zimbabwe, the Democratic Republic of Congo, Malawi, and Somalia, economic hardships have led to an exodus to South Africa, the economic powerhouse of the region. Although not substantiated by concrete statistics, various estimates predict that the South African immigrant population is between one to six million.27 Immigrants integrate into South African com-munities, and the fact that the unemployment rate is high (25.5% in the third quarter of 2012) some South African communities direct their anger at lack of employment towards foreigners who access employment when South African locals are unemployed. This led to xenophobic violence in many parts of the country from 2007, targeted at foreign shop owners and foreign neighbours in townships. The police force was called in to help contain the violent unrest associated with at-tacks on foreign nationals during 2008, although there were accusations that the police also had a hand in the rampant border crossings by illegal foreigners as will be discussed in the section on environmental context. Capacity building interventions within the crime and justice sector ought to focus on the conundrum caused by being part of an aggrieved community, which in most cases the police force and the legal personnel are, and being a promoter of safety and security. It is very difficult for the police force to confront communities where they live in who are expressing genuine dissatisfaction about the economic impact on their livelihood of illegal immigrants, when in some cases the police and the legal system are contributing to the illegal foreigner challenge.
2.6.3. Social influences
HIV and AIDS are cross cutting challenges confronting all the sub-sectors. The pandemic arises in different contexts across the sub-sectors. First, workers may be exposed directly as a function of their employment. For example, SAPS officers may be exposed at crime scenes or during forensic examinations of contaminated products. In correctional services, the prison environment is often prone to violence, which may expose correctional officers during the conduct of their duties to control or assist inmates involved in physical altercations.
The second way in which the pandemic affects stakeholders is the incidence of the disease among their workers. HIV/AIDS affects working age adults disproportionately, and has led to high levels of morbidity and mortality within the 25 – 40 age group. The defence force in particular considers its members who are deployed outside South Africa to be especially vulnerable due to spending extended periods away from their families.
27 Truen.S and Chizadza.S. 2012. The South Africa-SADC Remittance Channel. DNA Economics for FinMark Trust.

56 S a f e t y a n d S e c u r i t y S e c t o r S k i l l s P l a n
Finally, HIV/AIDS has negative impacts within the communities served by the legal and security services. The incidence of child headed households is increasing at a fast pace. The problem is compounded by other social pressures such as poverty, poor education, and youth unemploy-ment. The number of young offenders is increasing, which further exacerbates an already complex dilemma. Young offenders may themselves be exposed to HIV or other diseases as a result of their incarceration.
All departments are addressing the risk of HIV and AIDS in several ways. For the SAPS, this includes:
• Detectives, forensic scientists and fingerprint experts are supplied with surgical gloves.• During safety, health and environment training, police officers are trained on the need for
gloves and safe working procedures are explained.• All forensic scientists have access to post-exposure prophylactic drugs that are paid for by
the SAPS.• All occupational accidents involving body fluids and blood contamination for fingerprint
experts are reported and dealt with by the Section: SHE Management, Head Office.
The NPA is focusing on female employees and employees between 20 to 45 years as the national prevalence data indicates they are the most at risk. NPA offers HIV and AIDS awareness, education and they also distribute condoms to employees. The Department of Defence also tackles the matter for all risk groups through education, and additional strategies like deploying trained operational emergency care practitioners with troops.
Sickness has also impacted the sector, particularly in the public service where annual loss of pro-ductivity from sick leave is high across all occupational levels as reflected in Table 31.
Table 31: Sick leave in the public service
Departments
Total Days sick Leave
Total Days sick Leave with medical certification
Lower skilled(Levels 1-2)
Skilled (Levels3-5)
Highly skilledproduction(Levels 6-8)
Highly skilledsupervision(Levels 9-12)
Seniormanagement(Levels 13-16)
SAPS5 1 214 785 1 138 539 20 416 621 970 469 536 99 850 3 013
NPA 26 254 23 366 121 1 808 6 458 14 755 3112
DoJ&CD 132 792 111 943.66 191 75 026 30 470 22 354 4 751
Legal Aid 16 050 - - - - - -
DCS 352 857 270 994.18 88 27 643 291 612 32 604 910
IPID 1 677 1 448.93 - 622 547 426 82
Defence 36 909 - - - - - -
JICS 199 - - - - - -
Total 1 781 523 1 161 905 20 816 727 069 798 623 169 989 11 868
In the eight departments and entities highlighted in Table 31, 4 880 years of work were lost to sick leave in one year. Sick leave was particularly high within SAPS. Interestingly, senior managers seem to take less sick leave than the other occupational groups.
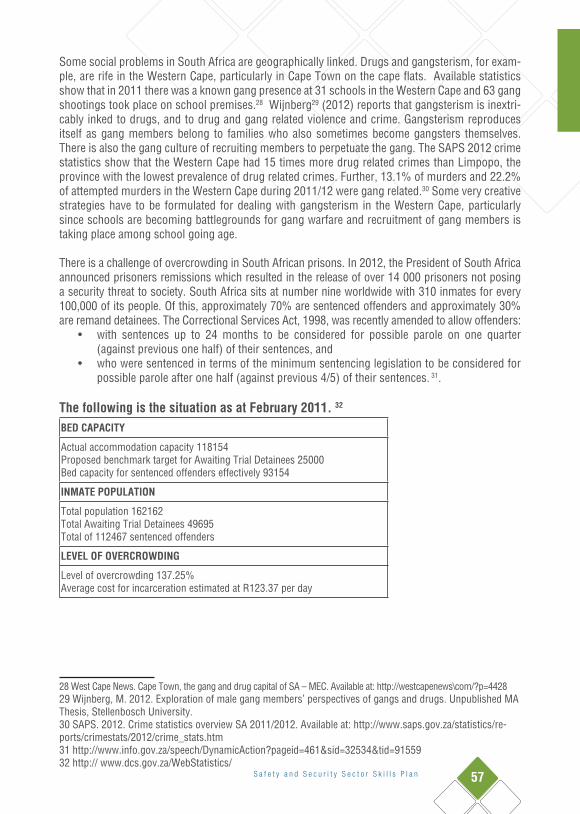
S a f e t y a n d S e c u r i t y S e c t o r S k i l l s P l a n 57
Some social problems in South Africa are geographically linked. Drugs and gangsterism, for exam-ple, are rife in the Western Cape, particularly in Cape Town on the cape flats. Available statistics show that in 2011 there was a known gang presence at 31 schools in the Western Cape and 63 gang shootings took place on school premises.28 Wijnberg29 (2012) reports that gangsterism is inextri-cably inked to drugs, and to drug and gang related violence and crime. Gangsterism reproduces itself as gang members belong to families who also sometimes become gangsters themselves. There is also the gang culture of recruiting members to perpetuate the gang. The SAPS 2012 crime statistics show that the Western Cape had 15 times more drug related crimes than Limpopo, the province with the lowest prevalence of drug related crimes. Further, 13.1% of murders and 22.2% of attempted murders in the Western Cape during 2011/12 were gang related.30 Some very creative strategies have to be formulated for dealing with gangsterism in the Western Cape, particularly since schools are becoming battlegrounds for gang warfare and recruitment of gang members is taking place among school going age.
There is a challenge of overcrowding in South African prisons. In 2012, the President of South Africa announced prisoners remissions which resulted in the release of over 14 000 prisoners not posing a security threat to society. South Africa sits at number nine worldwide with 310 inmates for every 100,000 of its people. Of this, approximately 70% are sentenced offenders and approximately 30% are remand detainees. The Correctional Services Act, 1998, was recently amended to allow offenders:
• with sentences up to 24 months to be considered for possible parole on one quarter (against previous one half) of their sentences, and
• who were sentenced in terms of the minimum sentencing legislation to be considered for possible parole after one half (against previous 4/5) of their sentences. 31.
The following is the situation as at February 2011. 32
BED CAPACITY
Actual accommodation capacity 118154Proposed benchmark target for Awaiting Trial Detainees 25000Bed capacity for sentenced offenders effectively 93154
INMATE POPULATION
Total population 162162Total Awaiting Trial Detainees 49695Total of 112467 sentenced offenders
LEVEL OF OVERCROWDING
Level of overcrowding 137.25%Average cost for incarceration estimated at R123.37 per day
28 West Cape News. Cape Town, the gang and drug capital of SA – MEC. Available at: http://westcapenews\com/?p=442829 Wijnberg, M. 2012. Exploration of male gang members’ perspectives of gangs and drugs. Unpublished MA Thesis, Stellenbosch University.30 SAPS. 2012. Crime statistics overview SA 2011/2012. Available at: http://www.saps.gov.za/statistics/re-ports/crimestats/2012/crime_stats.htm31 http://www.info.gov.za/speech/DynamicAction?pageid=461&sid=32534&tid=9155932 http:// www.dcs.gov.za/WebStatistics/
58 S a f e t y a n d S e c u r i t y S e c t o r S k i l l s P l a n
2.6.4. Technology
In a world where technological advances are occurring at increasingly faster rates, the security services are at varying stages of adaptation. Whereas the role of technology is acknowledged by all sub-sectors, their states of readiness differ. The DCS and SANDF have up to date systems but lack the capacity to use them to their fullest extent. In some cases, workers themselves are resistant to the introduction of technology, as they fear being displaced. This threat is very real in the Justice and Legal sectors, where some of the information management functions can be better managed if they are automated, thus rendering some of the support functions redundant. Retraining of staff may mitigate this effect to some extent, but over the long-term, the effect may be unavoidable. Criminals are becoming technologically smart, and accordingly, the sector has to respond by beat-ing criminals at their own game. The rise of transnational organised crime groups is spurred on by technological innovations, especially advances in telecommunications and the use of computers in business. Technology is being used to commit ‘cybercrime’, including the notorious 419 scam. The Southern African Banking Risk Information Centre (SABRIC) ranked South Africa as the 3rd most victimised country in online banking manipulation and phishing, after the US and UK.33
The private security and investigations industry has seen great advances in technological surveil-lance. Both domestic and commercial security systems are becoming increasingly mechanised and automated. Security technology is also getting integrated with cellular technology, creating emergency response systems and panic buttons via the cellphone. The implications for employ-ment and skills are mixed. On the one hand, workers need to be skilled up to engage with the new technologies. This may require upgrading of existing workers and/or employing new employees with different sets of skills. At the same time, increased reliance on technology for surveillance may lead to lowered demand for security guards on the ground.
Despite technological advances that enable information to be released and accessed quicker, and to be shared across subsectors, the sector seems to have information management challenges that need to be addressed. Examples of challenges with information management include:
• Some of the sub-sectors for example PSIRA and the South African Board for Sheriffs had not finalised their 2011/2012 annual reports at the time of writing this sector update in November 2012.
• Although most of the sub-sector organisations have websites, it is difficult to find vital information on some of these websites, for example, it was impossible to find information on metro police from the Metro websites.
• Update of web information is lagging. The latest SAPS statistics presented are for 2011, yet basic statistics about number of inmates and their demographic profile can be updated every month so that it stays up to date.
• On each sub-sector website, the link between that subsector within the justice, crime pre-vention and security cluster is not made very clear. Only the Department of Justice website has a section on its website on Departments in the JCPS cluster.
• There is no comprehensive description of the JCPS cluster on any of the sub-sector web-sites. This description should be key and it must form an integral part of each website.
• The integrity of SAPS data has been questioned by criminal justice researchers and others.
33 Khalil Goga, CIA. 4 June 2012. Globalisation and transnational organised crime in South Africa: http://www.consultancyafrica.com/

S a f e t y a n d S e c u r i t y S e c t o r S k i l l s P l a n 59
Bruce (2010)34 has made suggestions that crime statistics have been viewed as a matter of image management by government, hence, the lower the crime rates depicted, the better the government is portrayed. Bruce further argues that making crime statistics a perfor-mance measure is a limited approach as the level of confidence society has determines whether they report all crime activity or not. He further argues that there are stations where crime statistics are manipulated and that there is non-recording of crime statistics which is intended to depict a false reduction of crime. Such manipulation of statistics, if it is taking place, defeats the purpose of the safety and security sector to maintain peace and safety as perpetrators of crime will remain within communities where they threaten the safety of the citizens. Further, lack of integrity of crime statistics hampers the development of the appropriate response to criminal activity as those working on strategy development will be working with false data which is likely to lead to a weak, inappropriate and ineffective response to the problem.
• In their annual report, PSIRA do not indicate the demographics of their members. This is useful data for SASSETA to understand what the human capacity needs of the industry are, particularly for the large number of inactive security personnel. Further, critical analysis of membership is not given, for example, it is not explained why security businesses in KZN multiplied 12 times.
• Jaynes (2012)35 describes how the Central Firearms Registry (CFR) is so under-capacitated that information on private security company (PSC) stockpiles is not properly recorded. Consequently, there is lack of information on stockpiles of arms among the private security companies. Further, there is no knowledge on the use or misuse of firearms among PSCs. Neither PSIRA nor SAPS keep records of cases of death and injury involving PSC firearms. There is a high risk associated with this lack of record keeping as PSIRA or SAPS cannot know whether PSC firearms are ending up being used to perpetrate crimes against citizens. In the wake of limited human capacity, Management Information Systems can be shared within the JCPS cluster to keep track of vital sector statistics. Using a common MIS will also result in reduction in labour costs.
A technology related issue whose significance goes beyond technology is integration of data. There is no integrated analysis of sub-sector statistics. For example, the relationship between SAPS crime statistics, caseloads at Legal AID, NPA and DoJ&CD and Corrections is not made explicit but pre-sented as discrete data by the department concerned. For strategic planning purposes for the sec-tor, it would be useful if some correlational analysis is conducted with the data across sub-sectors so that this informs cluster planning and is used for sectoral performance management. Lancaster (2012) emphasises this when she argues that information available in annual reports does not tell us how well the criminal justice system is doing because “each department records different information in ways that cannot be linked”.36 The South African Law Commission (SALC) has tried to track and trace the relationship between police cases and convictions and in 2001, they tracked cases from the moment they were recorded by the police, and followed these to the courts to measure conviction rates. Their research found that for every 100 violent crimes (murder, rape and aggravated robbery) reported to the police, only six cases had been convicted after more than two
34 Bruce, D., Centre for the Study of Violence and Reconciliation. 2010. The ones in the pile were the ones going down: The reliability of violent crime statistics. SA Crime Quarterly No 31.35 Jaynes, N. 2012. Flying below the radar? The armed private security sector in South Africa. Open Society Foundation for South Africa.36 Lancaster, L. 2012. The problem with South African Criminal Justice Performance Indicators. Available at: C:\Users\Public\Documents\Documents\SASSETA\Readings\ISS\ISS - News - The Problem with South African Criminal Justice Performance Indicators.mht

60 S a f e t y a n d S e c u r i t y S e c t o r S k i l l s P l a n
years. 37 Work on the Integrated and Seamless National Criminal Justice Information System that was recommended from the Review of the South African Criminal Justice System in 2007 came to a standstill after the change in administration from President Mbeki’s term in office. The completion and operationalization of this information system is key to evaluate the effectiveness of the criminal justice system as well as to improve accountability within the sub-sectors. If this information sys-tem is completed, SASSETA can play an important role in facilitating training on its management, and on linking it to the government wide monitoring and evaluation system which will map out how performance reporting for the sector can be integrated in a more holistic and meaningful way.
The impact of cyber crimes has been felt significantly in the sector. With the rise in the use of technology and technology related crimes, the sector is having to grapple with tightening legislation around such crimes, ensuring sound investigation of such crimes by the SAPA, credible prosecu-tion of the crimes, and once convincted, the effective management of the convists of the crimes within correctional facilities.
2.6.5. Environmental Context
The factors that impact the sector mostly relate to organised crime in its various forms. The most prevalent form of organised crime is money laundering, manifested locally through tenderpreneur-ship, corruption by government officials in service delivery portfolios, poaching activity and human trafficking.
Consultancy Intelligence Africa38 has highlighted that the global opening of borders has not only meant free movement of people between borders, but it has also made it easy for criminals to oper-ate transnationally. It is estimated that South Africa loses about 10% of its gross domestic product (GDP) yearly, to the “illicit economy.” CIA identified four factors that facilitate organised crime in South Africa; increased border trade; technology; finance and networks. South Africa’s position as a global economic player has been beneficial in terms of economic growth but it has also exposed the country to cross-border criminal activity. The increased volume of business, for example the fact that thousands of containers carrying goods arrive at South Africa’s ports daily makes it pos-sible for criminal syndicates to hide illicit goods in these consignments as the process of checking containers may not be thorough because of the high volumes. Money can also now be moved easily across borders, and this money can be from illicit activities like drug trafficking. Sadly, the remit-tance market, while beneficial for some immigrants, can also be used for illicit activities like small sums of money helping fund terrorist activities. The Financial Intelligence Centre is coordinating efforts against money laundering.
The urban/rural divide is a serious concern for all stakeholders. Rural communities are less able to access the services of both the public and private sectors, and yet often their needs are equal to those of the urban population. Government services are especially important to rural communities who are generally poor, and thus don’t always have the means to access private legal and security services. However, the government does not have adequate infrastructure to render its services effectively in rural areas. In some instances, services are located in towns that are too far or too costly for those who may wish to access them. This is an area that government departments identi-fied as requiring urgent attention. As people move to urban areas, they put pressure on the existing services and there is generally an increased needs for skills.37 Ibid.38 Khalil Goga, CIA. 4 June 2012. Globalisation and transnational organised crime in South Africa: http://www.consultancyafrica.com/

S a f e t y a n d S e c u r i t y S e c t o r S k i l l s P l a n 61
The high levels of crime put a strain on the entire safety and security sector. South Africa has high levels of overcrowding in its prisons. Up to date information is not easy to come by, but according to the most recent statistical information, available from DCS, in February 2011, the prison accom-modation capacity was 118 154 but there were 162 162 offenders. The bed capacity for sentenced offenders was 93 154 yet there were 112 467 sentenced offenders in prison.
The IPID 2010/2011 annual report reports that IPID investigated 1 052 cases of deaths in custody or as a result of police action, and in the 2011/2012 period they investigated 839 such cases. In the same periods, 30 and 18 SAPS members respectively were convicted in relation to this offence. Although there was a significant downward trend in such cases, recently, police use of lethal force has come under the spotlight after the death of Andries Tatane during a service delivery protest, and 34 miners were shot dead by police during an unprotected wage strike at Lonmin’s Marikana mine. Bruce (2011)39 suggests that although some of the victims of lethal force may be violent criminals, those who are wrongly suspected may also be recipients of this force, and this will lead to citizen reduction of faith in the police service. Violent policing undermines any possibility for cooperation from the citizens. Besides gaining public confidence lack of use of violence by the police force also reduces civil liability of government.
2.6.5. Legal Context
The Parliament of the Republic of South Africa passes new laws whilst certain pieces of legislation are being continually changed or updated. Any change in legislation inevitably has implications for the sector. The Justice subsector has a duty to ensure that the legislation is translated into differ-ent official languages, where there is currently a huge backlog. The National Prosecuting Authority must prepare its Prosecutors on how to porsecute in linr with the changes whilst the SAPS has to enforce the legislation.
Impact tends to differ from one piece of legislation to the other. For example, the Childrens’s Act (35 of 2005) has required changes in terms of how the SAPS conducts itself around the incarceration of children whilst the Corrections sub-sector is operationally impacted in terms of which corrections officers may have access to the children.
There are certain changes in legislation which directly impacts on the sector’s workforce. Within the Corrections and Defence subsectors there have been changes in legislation which affected the terms and conditions of employment in the sector. For example, within Corrections, there are peo-ple who are employed in terms of the Public Service Act (no 103 of 1994) as well as those employed in terms of the Correctionsl Services Act (111 of 1998). There are implications in terms of the kind of work performed, the types of training required by each cohort of employees as well as the loca-tion of staff. It is not easy to migrate from being employed under one act to the other and this has some implications for upward mobility of those employed in terms of the Correctional Services Act not finding it easy to move beyond certain levels. Senior people cannot move into PSA managerial roles There are centre and non-centre based staff and this limits the involvements of workers in the operations across the organisation. There may be people with appropriate skills but who may not work across the within the corrections centres where there is real need. Additionally, the core business of the correctional services at the moment is classified under general public services and not security. In orther words they do not fall under the security services bargaining council desite being within the safety and security sector.
39 Bruce, D. 2011. Beyond section 49: Control of the use of lethal force. SA Crime Quarterly No. 36.
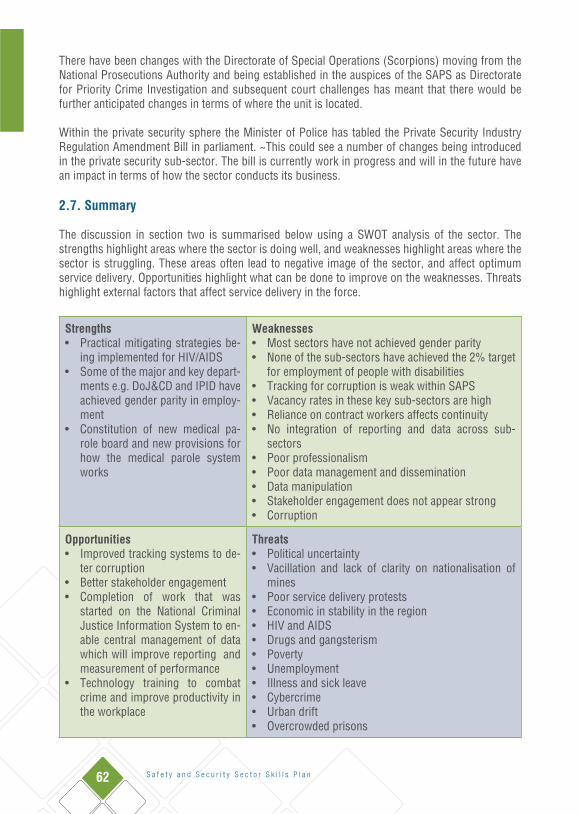
62 S a f e t y a n d S e c u r i t y S e c t o r S k i l l s P l a n
There have been changes with the Directorate of Special Operations (Scorpions) moving from the National Prosecutions Authority and being established in the auspices of the SAPS as Directorate for Priority Crime Investigation and subsequent court challenges has meant that there would be further anticipated changes in terms of where the unit is located.
Within the private security sphere the Minister of Police has tabled the Private Security Industry Regulation Amendment Bill in parliament. ~This could see a number of changes being introduced in the private security sub-sector. The bill is currently work in progress and will in the future have an impact in terms of how the sector conducts its business.
2.7. Summary
The discussion in section two is summarised below using a SWOT analysis of the sector. The strengths highlight areas where the sector is doing well, and weaknesses highlight areas where the sector is struggling. These areas often lead to negative image of the sector, and affect optimum service delivery. Opportunities highlight what can be done to improve on the weaknesses. Threats highlight external factors that affect service delivery in the force.
Strengths• Practical mitigating strategies be-
ing implemented for HIV/AIDS• Some of the major and key depart-
ments e.g. DoJ&CD and IPID have achieved gender parity in employ-ment
• Constitution of new medical pa-role board and new provisions for how the medical parole system works
Weaknesses• Most sectors have not achieved gender parity• None of the sub-sectors have achieved the 2% target
for employment of people with disabilities• Tracking for corruption is weak within SAPS• Vacancy rates in these key sub-sectors are high• Reliance on contract workers affects continuity• No integration of reporting and data across sub-
sectors• Poor professionalism• Poor data management and dissemination• Data manipulation• Stakeholder engagement does not appear strong• Corruption
Opportunities• Improved tracking systems to de-
ter corruption• Better stakeholder engagement• Completion of work that was
started on the National Criminal Justice Information System to en-able central management of data which will improve reporting and measurement of performance
• Technology training to combat crime and improve productivity in the workplace
Threats• Political uncertainty• Vacillation and lack of clarity on nationalisation of
mines• Poor service delivery protests• Economic in stability in the region• HIV and AIDS • Drugs and gangsterism• Poverty• Unemployment• Illness and sick leave• Cybercrime• Urban drift• Overcrowded prisons
S a f e t y a n d S e c u r i t y S e c t o r S k i l l s P l a n 63
3. DEMAND FOR SKILLSThe purpose of this chapter is to describe the pattern of skills demand in the various sub sectors that make up the safety and security sector in South Africa. It is important to understand the de-mand for skills so that existing supply can be analysed in the context of what skills are required.
Demand for skills is not a simple concept to identify as it has a number of factors influencing it but a sufficient estimate can be gained by examining:
• Current employment. What skills are currently demanded based on existing and funded posts? • Replacement demand is the demand for skills that is created as existing employees leave the
sector. This can be due to the employees moving to another sector, illness, death or retire-ment. Measurement of replacement demand is very difficult but can be proxied by replace-ment demand due to retirement or terminations depending on what information is available.
Where information exists within the sector, the above factors were analysed to provide an indication of the pattern of skills demanded as well as those skills that are considered scarce or critical. While there are many similarities between the sub-sectors of SASSETA, there are also many unique fac-tors driving the demand for skills. Therefore, each sub-sector is analysed separately below.
Some of the key factors driving demand for skills in the Safety and Security Sector arise from these developments. While there are unique factors from sub-sector to sub-sector, there are also cross cutting issues that need to be acknowledged. They are:
• The image of the public sector as an employer. Since a large part of the sector is made up of government departments, their image and ability to attract talent may create the impression of or exacerbate existing security concerns. In key professional occupations, the public sector is usually not the first employer of choice.
• Remuneration packages are often not competitive in the public sector. This can be due to grading, where a post is graded as a middle management post but in the private sector substantially higher wages can be earned. This is a particular problem for professionals such as psychologists and nurses.
• Working conditions in departments such as Corrections makes it difficult to attract profes-sional skills.
• Quality of graduates from tertiary institutions. • Lengthy recruitment processes in public sector departments create difficulties in filling
posts in areas where there is no real scarcity in the labour market. By the time decisions are taken, prospective appointees have moved on to other work opportunities.
• Demand for skills in rural areas outstrips supply as people are reluctant to work outside of the major metropolitan areas. Government has scarce skills allowances to compensate for this, but the other factors cited above may limit the effectiveness of this strategy.
• Employment equity. Huge strides have been made in the sector over the last decade and a half in terms of transforming the sector.

64 S a f e t y a n d S e c u r i t y S e c t o r S k i l l s P l a n
3.1. Scarce Skills
The SASSETA undertook an analysis of WSPs followed by a survey, focussed interviews and Cham-ber focus group discussions to determine and prioritise scarce skills areas. The SASSETA appreci-ates the value of understanding its scarce skills areas in the sector and are refocusing its attention on this subject. Whereas previously the identification of scarce skills was not done in a coordinated manner, there is a concerted effort to ensure that labour market analysis is done credibly and professionally.
3.1.1. PolicingThe policing sub-sector identified a number of occupations where they are experiencing difficulties recruiting people qualified and competent people. While high level skills are required in a number of these occupations, they are low ranked positions within the SAPS and obviously remuneration is not competitive. The SAPS also fails to retain those that are recruited because these are highly sought after, often moving to work in other countries or within financial services industry and other government departments.
It is important to understand employment patterns as well as reasons why vacancies exist within an organisation. Scarcity of skills can be fuelled by high attrition rates coupled with a lack of sufficient supply in a particular labour market. Out of 2,579 occupations 39% terminations were as a result of resignations, followed by death (31%) and retirement (18%). Ill health terminations constituted 8% of all terminations. In order to understand the labour market demand in the sub-sector, it will be important to track these over a number of years to understand patterns and trends that emerge. It will also be vital to analyse the age of the workforce within the sub-sector to determine if there is going to be a huge jump in the near future due to high retirement rates. In terms of resignations, it has been reported that there lacks a coherent retention strategy. The problem is further com-pounded by low remuneration rates for high level professional skills which are well remunerated in other sectors of the economy. It is thus of importance to study the reasons for the resignations so that strategies are deployed to address retention of scarce skills. Currently the meagre scarce skills allowance paid to certain occupations has been found to be inadequate to encourage retention of skills in the sub-sector.
Figure 4: Reasons why staff are leaving SAPS
Source: SAPS Annual Report 2011/2012

S a f e t y a n d S e c u r i t y S e c t o r S k i l l s P l a n 65
The SAPS is losing key people in occupations that are critical to its operations. Although the num-bers are small relative to the total staff compliment of the organisation of about 200,000, occupa-tions such as pilots are hard to fill and are reflecting relatively high turnover rates. Whilst most positions appear to be filled through external recruitment, there is still some significant work re-quired to train up the recruits on the systems and processes of the SAPS to enable them to function effectively within the organisation. That is why is makes more sense to develop people internally so that over time there is a cohort of SAPS personnel that understand and are well rooted in the culture, systems and values of the organisation. The table below provides an annual staff turnover comparison.
Table 32: Annual turnover rate by critical occupationsCritical Occupations Employment Recruitment Termination
Aircraft pilots and associated professionals 48 3 5
Architects, town and traffic planners 6 0 3
Chemists 1021 160 8
Engineers and related professionals 124 8 2
General legal administration and related professionals
221 204 7
Natural sciences related 6 0 0
Police 142205 4897 1873
Psychologists and vocational counselors 90 11 5
Total 143721 5283 1903
Source: SAPS Annual Report 2011/2012
Given the attrition rates identified as well difficulties in recruiting qualified and competent people is key occupations, the SAPS has identified the following priority scarce skills. These were reported in the WSP and clarified during focus group discussions with the organisation.

66 S a f e t y a n d S e c u r i t y S e c t o r S k i l l s P l a n
Table 33: SAPS Scarce Skills (using OFO 2012)
OFO Code Occupation No. Required Intervention NQF Level
311901 Forensic Technician (Biology, Toxicology) 270 Degree 7
542304 Armour Officer 80 Skills Programme 5
215101 Electrical Engineer 3 Degree 8
214603 Metallurgical Engineer 5 Degree 8
214201 Civil Engineer 1 Degree 8
214401 Mechanical Engineer (incl. Ballistics) 538 Degree 8
216101 Architect 12 Degree 8
315305 Helicopter Pilot 8 License
315303 Aeroplane Pilot 2 Specialised training
542202 Spec Forces Operations Officer (Special Task Force) 80 Training Course
641201 Bricklayer 8 Apprenticeship
651202 Welder 4 Apprenticeship
641502 Carpenter 6 Apprenticeship
671101 Electrician 4 Apprenticeship
643101 Painter 3 Apprenticeship
642201 Wall and Floor Tiler 2 Apprenticeship
542101 Combat Operator (Telecommunication Operator Radio) 110 Training Course
214904 Quantity Surveyor 5 Degree 8
216401 Urban and Regional Planner 2 Degree 8
335501 Forensic Detective (Polygraph, Documents) 97 Skills Programme 5
242201 Criminal Intelligence Analyst(Criminalistic Experts) 463 Skills Programme 5
226302Safety, Health, Environment and Quality (SHE&Q) Practitioner (Road Safety Auditors, Crash Construction)
10 Training Course
Road Safety Crash Construction 6 10
Source: SAPS WSP, Focus Group Discussions 2012
There are some gaps that will be addressed in the future update. Skills demand data for municipal and metro policing sub-sector has not been made available and the SASSETA will have to further engage with the LGSETA to ensure that such data is transferred when municipalities submit their WSPs.

S a f e t y a n d S e c u r i t y S e c t o r S k i l l s P l a n 67
3.1.2. Private SecurityThe Private Security sub-sector has quite diverse skills requirements. With technology playing an increasingly active role in the sub-sector, personnel have to upgrade their skills to remain relevant. There is a reported oversupply of basic security skills in the sector more experienced security personnel with specialised skills are in high demand. Security personnel are being generally being trained on PSIRA grades which are relatively easy to access as compared with the SASSETA ac-credited qualifications. There is an increase of monitoring of sites through CCTV. This will result in replacement of staff with technology. There is increasing complexity in terms of what the client needs and security companies have to demonstrate skills to provide turnkey solutions. Should private security regulatory bill be promulgated it could have significant impact on the demand for skills.
The Broad Based Black Economic Empowerment legislations are putting special emphasis on women in management positions and there is going to be a need for women to come up the ranks and be developed into managerial roles. In contrast however, it appears the clients are requiring more males as guards because of the increasing crimes. There is approximately 90% requirements for males and 10% females especially for potentially dangerous areas. The Marikana style wage negotiations could emerge in the sub-sector and drive demand for higher salaries. Employers are cautioning this against the openness of most organisations to using technology instead of humans for guarding and other security services.
The following scarce skills have been identified in the sector:
Table 34: Private Security Scarce Skills (using OFO 2012)OFO Code Occupation No. Required Intervention NQF Level
541402 Alarm, Security or Surveillance Monitor 242 Skills programme 4
311401 Electronic Engineering Technician 38 Diploma 6
Electrical Engineer 2 Degree 8
721201 Electrical and Electronic Equipment Assembler 2 Skills programme 4
242402 Occupational Instructor (firearm) 16 Skills programme
541906 Security Consultant 34 Skills Programme 5
Source: Private Security Focus Group discussion, WSP, 2012
A full list of scarce skills for the sector is presented in the table below. One of the SETAs immediate objectives is to update the list with latest data and to ensure credibility of estimated demand using scenario planning analysis.

68 S a f e t y a n d S e c u r i t y S e c t o r S k i l l s P l a n
3.1.3. DefenceThe Department of Defence develops its own staff to meet its unique internal demand for skills. The Department considers itself to be training organisation as all personnel are generally developed in-ternally, firstly in general combat techniques and then specialisation afterwards. The uniqueness of the sub-sector is created by the need to ensure that staff can operate in combat mode. For example, a medical doctor, nurse or even a chef that is employed within the SA Army should be able to oper-ate in combat mode, otherwise they are useless for the organisation.
The sub-sector has high standards for entry as they use very specialized equipment and this re-quires high aptitude. It is reported that getting the right people in the door is the biggest problem, especially in the Air Force. The scarce skills problem in the sub-sector is compounded by the fact that people developed within this environment are highly sought after locally and abroad. When people are being trained they sign a contract to work a set number of years and there have been instances where some have been paid out to leave by employers. To train a pilot, a Special Forces combat officer of a diver is quite an involved and expensive exercise and it is reported that such skills are highly marketable against uncompetitive salaries paid in the sub-sector.
The Department of Defence spends millions on skills development annually to address its skills needs. The following table outlines scarce skills in the sub-sector.
Table 35: Defence Scarce Skills (using OFO 2012)OFO Code Occupation No. Required Intervention NQF Level
134703 Coxswain (Warship) Training Course 6
315301 Aircraft Navigator Specialised training 7
542304 Armour Soldier Skills Programme 5
215101 Electrical Engineer Degree 8
214603 Metallurgical Engineer Degree 8
214201 Civil Engineer Degree 8
214401 Mechanical Engineer(incl. Ballistics) Degree 8
216101 Architect Degree 8
315305 Helicopter Pilot License 8
315303 Aeroplane Pilot Specialised training 8
542101 Naval Combat Operator Training Course 6
641201 Bricklayer Apprenticeship 5
651202 Welder Apprenticeship 5
641502 Carpenter Apprenticeship 5
671101 Electrician Apprenticeship 5
643101 Painter Apprenticeship 5
315401 Air Traffic Controller Apprenticeship 5

S a f e t y a n d S e c u r i t y S e c t o r S k i l l s P l a n 69
263401 Clinical Psychologist (Neuro) Degree 8
221209 Radiologist Degree 7
325701 Environmental and Occupa-tional Health Inspector Degree 8
221101 General Medical Practitioner Degree 8
221201 Anaesthetist Degree 8
Source: Defence Focus Group discussion, 2012
3.1.4. JusticeThere are a number of factors behind demand for skills in the sub-sector, Technology is one of the driving factors in that as people commit cyber crimes there is a need to ensure they are prosecuted appropriately. However there isn’t a sufficient supply of prosecutors competent and qualified to prosecute cyber crimes. The proliferation of foreign officers in the country has also led to a higher demand for interpreters in foreign languages. In addition, the constitution of the country requires that people are afforded the specific rights. This includes the right of deaf people to have access to sign language interpreters. There aren’t sufficient sign language interpreters across the justice department including in courts.
There is also a constitutional requirement for legislation to be available in all official languages however the sub-sector lacks qualified and competent linguists who can translate legislation. The new changes in legislation and new laws being passed obviously create more backlogs.
The competition commission has identified a need for competent competition lawyers with appro-priate investigation skills. Moreover, the country’s transformation imperatives require the advance-ment of women, black people and the youth and this is also applicable in the judiciary.
The following is a list of scarce skills identified in the sub-sector.
Table 36: DoJCD Scarce Skills (using OFO 2012)OFO Code Occupation No. Required Intervention NQF Level
261101 Prosecutor (Cyber Law) Degree 7
264301 Sign Language Interpreter Certificate 5
261201 Judge (Black, Young, Female) Mentoring
262201 Librarian (Courts) Internship 7
261102 Administrative Lawyer (Legislation drafter) Internship 7
264301 Interpreter (Foreign languages)
261101 Lawyer (Competition, Cyber) Degree 7
264303 Linguist Degree 6
Source: Justice Focus Group discussion, 2012

70 S a f e t y a n d S e c u r i t y S e c t o r S k i l l s P l a n
3.1.5. CorrectionsThe following are scarce skills identified in the corrections sector
Table 37: Corrections Scarce Skills (using OFO 2012)OFO Code Occupation No. Required Intervention NQF Level
322101 Enrolled Nurse Diploma 6
226201 Hospital Pharmacist Degree 7
333905 Supply Chain Practitioner Diploma 5
221101 General Medical Practitioner Degree 8
263507 Social Worker Internship 6
263401 Clinical Psychologist Internship 8
641201 Bricklayer Apprenticeship
651202 Welder Apprenticeship
641502 Carpenter Apprenticeship
671101 Electrician Apprenticeship
643101 Painter Apprenticeship
314201 Agricultural Technician Diploma 6
235101 Education or Training Advisor Degree 7
242402 Occupational Instructor / Trainer Diploma 6
232103 Agricultural Sciences Teacher(Grades 10 - 12) Degree 7
Source: Corrections Focus Group discussion, 2012
3.1.6. Legal ServicesThe legal sector has identified the following scarce skills.Table 38: Scarce skills (using OFO 2012)OFO Code Occupation No. Required Intervention NQF Level
334201 Legal Secretary Diploma 6
261101 Lawyer (Environment, Competition, Cyber Marine) 250 Degree 7
241101 Accountant/ Auditors 50 Degree 8
As reflected in the individual sub-sector analyses below, much of the scarcity identified here does not arise within the broader labour market, but rather is relative to the peculiar circumstances of the public sector, and its inability to compete effectively within the local and international labour market. Although scarce skills have been identified, the different sub-sectors have ways of address-ing these and the SASSETA will have to work closely with these organisations to identify how they support can be provided.

S a f e t y a n d S e c u r i t y S e c t o r S k i l l s P l a n 71
3.2. Critical Skills NeedsThe Safety and Security Sector is a very stressful environment and personnel may be exposed to very dangerous situations or criminals. There could have negative impact on the staff morale and performance over time. The SASSETA has identified a need for sports and recreational facilities for staff working in the sector. As young people are being recruited into the sector, it is vital that there are also provided with sporting activities to keep them healthy and active for their hectic jobs.
A large number of critical skills have been identified within the various sub-sectors. Although the educational profile of the sector was not available, stakeholders expressed concern about the basic competencies of workers across all the sub-sectors. Notwithstanding the different skills gaps that emerged within different sub-sectors, there are cross-cutting critical skills where gaps have been identified. These include:
• Basic literacy and numeracy – this need cuts across all the sub-sectors, from police of-ficers taking witness statements to law graduates who are unable to write simple briefs. In the private security sector due to low barriers to entry, the numeracy and literacy levels are relatively lower to those in other sub-sectors.
• Information and Communication Technology (ICT) – There is increased use of technology in the sector which requires but requires workers to be competent in the use of technol-ogy from basic word-processing to more complex applications, as relevant to their work stations. CCTV caremars, survaillance and other technologies are becoming common in the private security sector. Emerging cyber crimes are also creating a requirement for the practitioners and officers in the sector to be informed about technology.
• Management and leadership – this is considered core to addressing many of the chal-lenges that exist within the various departments. Leadership development is critical from the top (DG, MD, CEO, etc) down to local level, such as a police station or a correctional facility. The specific areas of management and leadership are: Project Management, Finan-cial Management, HR Management, and Operations Management.
Sector stakeholders suggested that these 3 areas are at the core of most of the skills deficiencies identified within each sub-sector. Thus, even though numerous technical skills gaps exist, many of them arise due to limitations in some or all of these priority areas.
The sub-sectors of the Safety and Security SETA vary widely in their operations and their skills needs. It was therefore not possible to identify common threads between them and their training needs are presented separately in this section. Whereas the scarce skills identified in Chapter 3 relate to the lack of workers with the requisite skills, this section addresses the areas where the existing workforce needs to be up skilled to meet the operational needs of the employer. Some of the stakeholders within SASSETA have their own training infrastructure, and therefore, much of the training needs identified here inform the training plans of that sub-sector.
3.2.1. Corrections The sub-sector identified a need for RPL amongst some experienced Corrections Officers and peo-ple operating in Artisanal type environments. The following critical skills were identified in the sub-sector:
• Forensic skills for nurses• Presentation and report writing skills for Corrections Officers• Management and Leadership training for those in managerial roles• Sign language and foreign languages training for Corrections Officers

72 S a f e t y a n d S e c u r i t y S e c t o r S k i l l s P l a n
• Dog handling for Corrections Officers• Explosives detection and management for Security Managere• Systems maintenance skills for IT staff in the Department• Security management skills for Correctional Centre managers
3.2.2. DefenceThe following critical skills were identified in the sub-sector:
• ICT skills including skills for specialised defence packages• Assessing and moderating training for officers in the training centres• Policy and legislative drafting skills for managers involved in the generation of policies and
legislative changes• Leanership and management training incluing mentoring and coaching • Project management training for officers assigned project management duties• Monitoring and evaluation• Human Resource Management including human resource development and planning• Work study systems and processes for Work Study Officers• Risk, compliance and management training for officers• QCTO requirements for qualifications development (availabitiy of qualification development
partners(QDP) and other related processes.
3.2.3. JusticeA driver for demand of skills in the sector is the process of amending or promulgating new legisla-tion. With every change there is training that must take place, especially in the National Prosecutions Authority and often there are backlogs. The following critical skills were identified in the sub-sector:
• Case flow management, • Report writing • Foreign language interpretations• Management and Leadership training including mentoring and coaching• Cyber Crime investigation and prosecution• Maritime law• Computer literacy• Human Resource Management• Financial Management• Office Management
3.2.4. Legal ServicesThe following critical skills were identified in the sub-sector:
• Mediation and Alternative Dispute Resolution• Financial and business management skills for attorneys• Environmental, Cyber and Maritime Law• Court procedures for Attorneys• Conflict management• Foreign languages• Case management• Writing skills for Candidate and Junior Attorneys and Advocates

S a f e t y a n d S e c u r i t y S e c t o r S k i l l s P l a n 73
3.2.5. PolicingThe following critical skills were identified in the sub-sector:
• Report writing• Computer skills for officers• Scientific Analysis• Forensic investigation for detectives• Facial reconstruction training for officers• Explosives and ballistics training • Firearms handling for officers • Cyber crime investigation • Online child pornography investigation skills• Advanced driving skills for officers• Mentoring, Coaching and Counselling
3.2.6. Private Security A need was identified in the sub-sector for RPL process of experienced guards. The following criti-cal skills were identified in the sub-sector:
• Management and supervisory training• Communication• ICT skills including CCTV training• National Key Point Security• Customer care• Report writing• Investigation• Dog handling
3.3. SUPPLY OF SKILLS The supply pipeline for the sector is derived from both public and private institutions. New entrants to the sector range from matriculants to university graduates, given the wide range of skills and oc-cupations found within the sector. In addition, the SASSETA funds various learning programmes to help improve the supply pipeline. In order to meet the skills demand, the SASSETA has developed a number of qualifications that it quality assures through its SAQA accredited ETQA unit. The SETA accredits training providers to deliver these programmes. The analysis presented here considers the general output of the education system, and the specific needs of some of the sub-sector based on the input of stakeholders. A need for further research has been identified by SASSETA to im-prove this section particularly the output of the training academies of the government departments and the public sector organisations operating in the sector. The SETA has also identified a need to work closely with FET colleges, especially those in rural areas to offer programmeswhere there is high demand of skills and scarcity of supply.
An initial analysis of the 2010 and 2011 ATRs has demonstrated that training tends to take place across all the occupational groups. Whereas the training of security officers is the highest, the fig-ures have to be treated with caution as they represent a mix of short courses which address critical skills needs and longer term academic programmes that address scarce skills needs. Moreover, the extent of submission of ATRs at sub-sector level has not been established to determine the reli-ability of the data for trends analysis purposes.
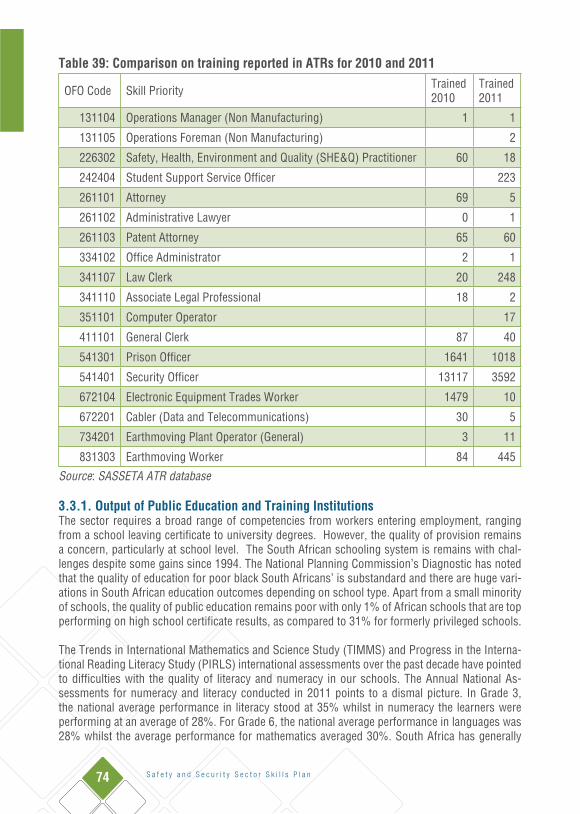
74 S a f e t y a n d S e c u r i t y S e c t o r S k i l l s P l a n
Table 39: Comparison on training reported in ATRs for 2010 and 2011
OFO Code Skill Priority Trained 2010
Trained 2011
131104 Operations Manager (Non Manufacturing) 1 1
131105 Operations Foreman (Non Manufacturing) 2
226302 Safety, Health, Environment and Quality (SHE&Q) Practitioner 60 18
242404 Student Support Service Officer 223
261101 Attorney 69 5
261102 Administrative Lawyer 0 1
261103 Patent Attorney 65 60
334102 Office Administrator 2 1
341107 Law Clerk 20 248
341110 Associate Legal Professional 18 2
351101 Computer Operator 17
411101 General Clerk 87 40
541301 Prison Officer 1641 1018
541401 Security Officer 13117 3592
672104 Electronic Equipment Trades Worker 1479 10
672201 Cabler (Data and Telecommunications) 30 5
734201 Earthmoving Plant Operator (General) 3 11
831303 Earthmoving Worker 84 445
Source: SASSETA ATR database
3.3.1. Output of Public Education and Training InstitutionsThe sector requires a broad range of competencies from workers entering employment, ranging from a school leaving certificate to university degrees. However, the quality of provision remains a concern, particularly at school level. The South African schooling system is remains with chal-lenges despite some gains since 1994. The National Planning Commission’s Diagnostic has noted that the quality of education for poor black South Africans’ is substandard and there are huge vari-ations in South African education outcomes depending on school type. Apart from a small minority of schools, the quality of public education remains poor with only 1% of African schools that are top performing on high school certificate results, as compared to 31% for formerly privileged schools.
The Trends in International Mathematics and Science Study (TIMMS) and Progress in the Interna-tional Reading Literacy Study (PIRLS) international assessments over the past decade have pointed to difficulties with the quality of literacy and numeracy in our schools. The Annual National As-sessments for numeracy and literacy conducted in 2011 points to a dismal picture. In Grade 3, the national average performance in literacy stood at 35% whilst in numeracy the learners were performing at an average of 28%. For Grade 6, the national average performance in languages was 28% whilst the average performance for mathematics averaged 30%. South Africa has generally

S a f e t y a n d S e c u r i t y S e c t o r S k i l l s P l a n 75
relied on measuring the performance of learners at the end of schooling and this does not allow for a comprehensive understanding of what goes on lower down in the system on a year by year basis. The matric pass rate went up from 60.6% in 2009 to 67.8% in 2010 and 70.2% in 2011.
Many of the scarce skills cited in the section on demand require a basic foundation in maths and science in order to pursue further studies to gain the requisite qualifications. For example, forensic investigators, engineers, surveillance technicians, and medical practitioners all require a good pass in maths to gain entrance into university or a university of technology. The table below shows that on average, most candidates sitting for maths and science examinations received a mark above 30%. The intrduction of mathematics literacy has also created some problems whereby due to a lack of good career guidance and subject choice advice, many learners realise very late that the subject does not qualify them for most technical or business degrees at universities. This is an area that the Department for Basic Education needs to prioritise for redress and further development.
Table 40: Results of the National Senior Certificate2009 2010 2011
Learning Area
Total Wrote
Achieved above 30%
% Total Wrote
Achieved above 30%
% Total Wrote
Achieved above 30%
%
Mathematics 290407 133505 46.0% 263034 124749 47.4% 224635 104033 46.3%
Mathematics Literacy 277677 207326 74.7% 280836 241576 86.0% 180585 96441 53.4%
Physical Science 220882 81356 36.8% 205364 98260 47.8% 180585 96441 53.4%
Source: Education Statistics in South Africa, 2012
The two tables below give the results of FET examinations in 2009 in subjects that are directly rel-evant to the sector. Other generic subjects may also be contributors to the supply of labour (such as training of artisans, which is relevant to the defence force); however, for purposes of the sector skills plan, the analysis is limited to the scope of coverage of the SETA. As with the school leaving certificate, performance in those subjects related to scarce skills is generally poor. The SETA will endeavour to conduct more research in this field and conduct more engagement with FET colleges as part of its partnerships programme.
In addition, the available programmes are not linked to the needs of employers. They meet a very small proportion of the needs identified as scarce skills. At present, most of the training offered in the sector is offered through private providers. This may be attributable to the fact that the range of offerings at FET and HE institutions is insufficient to meet the needs of the sector. Furthermore, private providers are perceived to be more responsive and better able to tailor their programmes to the client.

76 S a f e t y a n d S e c u r i t y S e c t o r S k i l l s P l a n
Table 41: Results of the National Certificate Examinations at FET collegesLevel Entered Wrote Pass % Pass
Public Administration N3 7978 6259 3055 48.81
Social Care N3 10 5 5 100
Introductory Public Admin N4 285 268 204 76.12
Public Administration N4 3044 2467 1599 64.82
Legal Practice N5 284 244 141 57.79
Public Administration N5 1463 1302 957 73.5
Public Finance N5 1435 1292 893 69.12
Legal Practice N6 133 118 93 78.81
Public Administration N6 938 818 683 83.5
Public Finance N6 716 628 416 66.24
Public Law N6 1254 1073 462 43.06
Mathematics N2 5616 4055 1188 29.3
Aircraft Maintenance Theory N3 328 306 139 45.42
Aircraft Metalwork Theory N3 52 45 18 40
Source: FET Colleges Report 2009
Table 42: Results of the National Certificate (Vocational) Examinations at FET collegesLevel Entered Wrote Pass % Pass
Criminology L2 147 94 30 31.9
Introduction to Governance L2 2147 1428 645 45.2
Introduction to Law L2 2127 1499 474 31.6
Introduction to Policing Practice L2 2064 1459 1000 68.5
Principles of Criminal Justice L2 2108 1452 770 53
Criminal Justice Structures and Mandates L3 305 265 232 87.6
Criminal Law L3 306 269 194 72.1
Criminology L3 6 3 2 66.7
Governance L3 307 271 147 54.2
Theory of Policing Practices L3 299 258 152 58.9
Source: FET Colleges Report 2009
In higher education institutions, there appears to be an upward trend of enrolment in law qualifica-tions. The total number of enrolments in legal qualifications increased from just over 40,000 in 2008 to 47,086 in 2010. The number of those registered Masters degrees in law increased from 2,339 in 2008 to 3,026 in 2010 implying the number of those seking specialisation is increasing. It is how-ever difficult to acertain if these people are specialising in the areas demonstrating scarcity such

S a f e t y a n d S e c u r i t y S e c t o r S k i l l s P l a n 77
as maritime law, cyber law and competition law. In terms of those doing bachelor degrees which are generally a requirement for qualifying as an attorney, the enrolments in universities increased from 33,078 in 208 to 36,637 in 2010 indicating that continued interest in law degrees. Most of the qualifications available from universities are relevant to the private legal profession and to the public service in general. However, specialist qualifications are more difficult to come by, and are generally developed in the workplace once candidates are already in employment. This suggests that public providers are not currently able to respond adequately to changes in the labour market.
Table 43: Enrolment in Law qualifications at All Universities
Year Occassional Studies
Certiticate/Diploma Degree Honours
/ Postgrad. Diploma Masters Doctorate Total
2010 1,397 4,112 36,637 1,513 3,026 402 47,086
2009 1,201 3,190 32,871 1,539 2,641 357 41,799
2008 1,334 2,167 33,078 1,468 2,339 317 40,703
Source: SA Higher Education Management Information System, 2012
With the increasing rate of enrolments in law qualifications at HEIs, it is important that learners in the schooling system are provided with sound career guidance so that when they choose law as a career they are well informed about the choices and specialisations within the legal environment so that they can start to bridge the skills gaps being experienced in certain fields. New areas of specialisation such as environmental law, cyber crime investigation, and other occupations that may be driven by innovations in technology or in the law are the main areas of concern as learners are often not sufficiently informed about these career options to pursue studies relevant to them.
The number of graduates from the university system is a good measure of supply of skills into the sector. There has been a decline in the number of law graduates between 2008 (5,578) and 2010 (5,290). This is against a continued increase in enrolments. The pattern of the output of universities shows that there is a significant drop from those acquiring first degrees to those progressing to higher qualifications. As with enrolment, the trend is downwards over the period 2008-10 across all qualification levels. In general, the absolute numbers of qualified graduates is not as much of a concern as the quality of their training, as well as the fields of specialisation that they choose.
Table 44: Graduates in Law quakifications at All Universities
Year Certiticate / Diploma Degree Honours /
Postgrad. Diploma Masters Doctorate Total
2010 325 4,021 347 558 39 5,290
2009 293 4,011 513 549 41 5,406
2008 258 4,173 588 529 29 5,578
Source: SA Higher Education Management Information System, 2012
Despite the continued increase in the number of enrolments law qualifications, and dropping gradu-ate output rates, the legal services sub-sector has cited the lack of writing skills by law graduates as one of the challenges they are facing. This obviously has its roots in the schooling system where learners develop such skills. The SETA can play an important role not only in facilitating the links between providers and industry, but in supporting the development of capacity within the institu-tions to be able to respond to labour market requirements.

78 S a f e t y a n d S e c u r i t y S e c t o r S k i l l s P l a n
3.3.2. SASSETA InitiativesThe SASSETA and its stakeholders have also undertaken training under the auspices of the NSDS II. Training supported by SASSETA is based on needs identified by employers, which are aligned to the priorities of the NSDS. Apart from the mandatory grants that employers receive for undertaking training based on the individual needs of each employer, SASSETA provided Discretionary Grants for training aimed at addressing scarce and critical needs identified within the sector. These grants could be applied towards learnerships, bursaries for tertiary studies, workplace experience grants for learners needing to complete their qualifications, and internship grants. The SASSETA is in the process of disaggregating the data provided in the following table to make it more sub-sector specific and to outline the specific programmes that were enrolled upon.
Table 45: Output of learning programmes supported by SASSETA 2005 – 2010NSDS Indicator Entered Completed
2.7 Workers supported on ABET Level 1 – 4 5,567 3,482
2.8No of workers that have entered learning programmes leading to entry, medium and high level skills – including learnerships, bursa-ries, artisans and skills programmes
12,321 11,482
3.2 No organisations supported by SETAs (NGO’s CBO’s, Co-ops etc.) 1,132
4.1No of unemployed people that have entered learning programmes leading to entry, medium and high level skills – including learner-ships, bursaries, artisans and skills programmes
10,905 9,392
4.2 No of learners assisted in workplace experience grants 311
4.3 No of young people that have entered new venture programmes 168
No of young people that are in operation 12 months after comple-tion of programme 0
5.1 No of Institutions assisted and type of support and linked to criteria 4
5.2 No of Institutions accredited to manage delivery of new venture creation qualification 0
Source: SASSETA QMR report
The learning programmes that were supported by the SASSETA focussed on both employed and unemployed. The focus on unemployed learners is so that they are provided with an opportunity in life. Employers use various ways to recruit these learners including through the online channels and print media (namely, newspapers).
The main challenges experienced with learners currently are:• Learners dropping out• Learners are making money out of the learnership therefore they do not see the need to
be focused• Upon gaining experience, the learners go and work for another company.
Strategic interventions being considered in order to overcome these challenges are:• The promise of employment after learnership • Learners who quit / drop out (from a learnership without valid reasons) will be blocked
from applying for another learnership in future.

S a f e t y a n d S e c u r i t y S e c t o r S k i l l s P l a n 79
3.3.3. Skills Supply in the public sectorThe public sector organisations operating in the safety and security sector typically have their own learning academies and colleges where their staff are trained. A bulk of ther skills development budgets are spent within these facilities and all offer some programmes which are quality assured by SASSETA ETQA while others are developed internally to meet operational and functional require-ments.
The SAPS spends over R 1 billion on skills development initiatives using their departmental budget. During the financial year 2011/12, approximately 2.75% of total employee compensation of around R 42 billion was attributed to skills development. A significant portion of the skills development budget is spent on operational training through the SAPS’s internal academies and training col-leges. Over 200,000 people attended various forms of skills development interventions during 2011/12 as outlined in the figure below.
Figure 5: Members attending training during financial year 2011/12
Source: SAPS Annual Report 2011/2012
While there are some private training providers who offer qwualifications in policing, these are not recognised by the SAPS as they are not designed to meet their operational requirements. Often graduates from these qualifications struggle to find employment within the police service. There are plans in the future to ensure that only the SAPS academies may offer such qualifications.
The Department of Defence and Military Veterans spent over R 154 million on training of their staff in the 2012 financial year. (R 118 million: 2011) . The Department develops all its people internally to ensure that they meet the combat requirements. All staff working in the arms of servie of the Depepartment must undergo military training before they choose their area of specialization. Thus Doctor, chefs, engineers, special forces, etc employed in the Department are trained soldiers. This unique circumstances makes the Department a skills development organization.

80 S a f e t y a n d S e c u r i t y S e c t o r S k i l l s P l a n
The Military Skills Development System (MSDS) is the Department’s flagship training programme. It was implemented in January 2003 with the aim to provide the SANDF with military trained hu-man resources as required for force preparation and force employment specifications. It forms the Department’s primary contribution to youth development and alleviates unemployment and poverty by preparing young people between the age of 18 and 26 years for reward- ing careers either in the SANDF or for decent employment in the broader public and private sectors. The MSDS is a two- year contract based service system and is the main feeder system for the Regulars and Reserves.
Since the inception of the MSDS, as at the end of the 2011 financial year 33 536 youths had par-ticipated in the system of the SANDF. Of the total intake, 8 542 are currently serving in the MSDS, 6 770 have separated from the SANDF, of whom 4 821 are serving in the Reserves, and 18 224 translated to the Regulars where they are undergoing advanced training in various disciplines and are being utilised accordingly. In 2012 an additional 2446 people were enrolled into the MSDS. The Department sees value in providing the marketable skills to those that cannot be accomoated within the programme.
The Departmenf trained over 52,000 staff members over during the 2011 financial year. Of those trained:• 5 050 undergone learnership programmes• 28 152 other forms of training including degree programmes• 19 719 skills programmes and other short courses
3.3.4. Supply of new skills by training and development institutionsThe SASSETA accredits a number of training providers to deliver its registered qualifications and skills programmes. The SETA should ensure that there is sufficient capacity to deliver programmes that meet the sector skills needs. In other words, there should be sufficient facilitation, assessing and moderation skills when programmes are being rolled out to avoid backlogs and to ensure that provision is attained. The table below presents a qualifications with the highest number of providers accredited. While the National Certificate: General Security Practices may have the highest number of accredited providers, this does not necessarily mean there is also a high demand for the qualifi-cation. This mearly reflects the business opportunity that providers have identified and are all trying to meet market demand. The SETA will n the future identify the utilization rates of qualifications so that only those where there is market need are developed.
Table 46: Accreditation status of quaificationsQualification Total
National Certificate: General Security Practices 911
Access control 498
National Certificate: General Security Practices 299
Further Education and Training Certificate: Specialist Security Practices 293
Asset protection 120
National Certificate: Paralegal Practice 105
National Certificate: Policing 69
Further Education and Training Certificate: Corrections Services 33
Further Education and Training Certificate: Road Traffic Law Enforcement 35
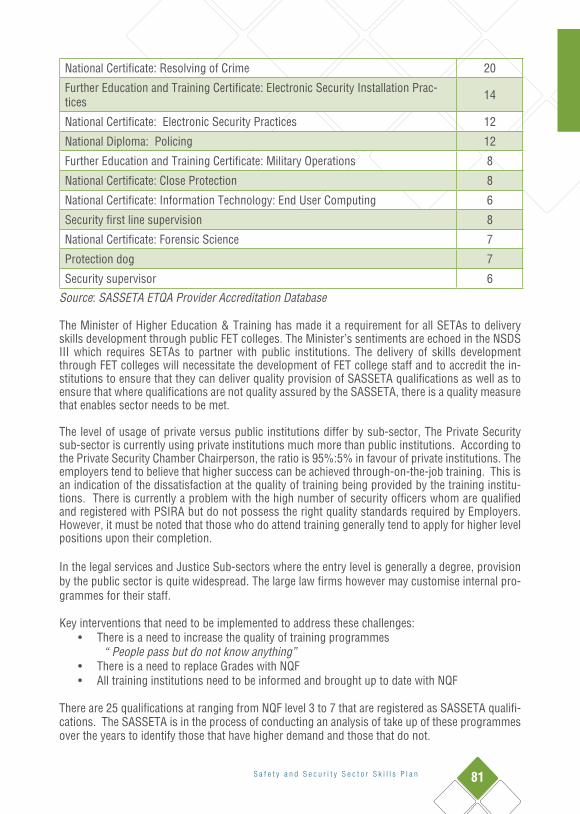
S a f e t y a n d S e c u r i t y S e c t o r S k i l l s P l a n 81
National Certificate: Resolving of Crime 20
Further Education and Training Certificate: Electronic Security Installation Prac-tices 14
National Certificate: Electronic Security Practices 12
National Diploma: Policing 12
Further Education and Training Certificate: Military Operations 8
National Certificate: Close Protection 8
National Certificate: Information Technology: End User Computing 6
Security first line supervision 8
National Certificate: Forensic Science 7
Protection dog 7
Security supervisor 6
Source: SASSETA ETQA Provider Accreditation Database
The Minister of Higher Education & Training has made it a requirement for all SETAs to delivery skills development through public FET colleges. The Minister’s sentiments are echoed in the NSDS III which requires SETAs to partner with public institutions. The delivery of skills development through FET colleges will necessitate the development of FET college staff and to accredit the in-stitutions to ensure that they can deliver quality provision of SASSETA qualifications as well as to ensure that where qualifications are not quality assured by the SASSETA, there is a quality measure that enables sector needs to be met.
The level of usage of private versus public institutions differ by sub-sector, The Private Security sub-sector is currently using private institutions much more than public institutions. According to the Private Security Chamber Chairperson, the ratio is 95%:5% in favour of private institutions. The employers tend to believe that higher success can be achieved through-on-the-job training. This is an indication of the dissatisfaction at the quality of training being provided by the training institu-tions. There is currently a problem with the high number of security officers whom are qualified and registered with PSIRA but do not possess the right quality standards required by Employers. However, it must be noted that those who do attend training generally tend to apply for higher level positions upon their completion.
In the legal services and Justice Sub-sectors where the entry level is generally a degree, provision by the public sector is quite widespread. The large law firms however may customise internal pro-grammes for their staff.
Key interventions that need to be implemented to address these challenges:• There is a need to increase the quality of training programmes
“People pass but do not know anything” • There is a need to replace Grades with NQF• All training institutions need to be informed and brought up to date with NQF
There are 25 qualifications at ranging from NQF level 3 to 7 that are registered as SASSETA qualifi-cations. The SASSETA is in the process of conducting an analysis of take up of these programmes over the years to identify those that have higher demand and those that do not.

82 S a f e t y a n d S e c u r i t y S e c t o r S k i l l s P l a n
Table 47: SASSETA registered qualifications
TITLE OF QUALIFICATION NQF LEVEL SAQA ID DHET Registration No.
National Certificate: Defensive Mission Control Level 5 63309 29Q290015432405
National Certificate: Statutory Intelligence Practice Level 5 60329 Q060022XX1495
National Diploma: South African Special Forces Operations Level 5 48879 Q290003XX2975
National Diploma: Applied Military Intelligence Level 5 49852 29Q29001327240
National Diploma: Legal Interpreting Level 5 50023 29Q290012282405
National Certificate: Policing Level 5 50122 Q190009002407 Implemented
National Certificate: Use of Firearms Level 4 21854 Q290017221524
National Certificate: Resolving of Crime Level 5 59989 Q290001301225Implemented
Further Education and Training Certificate: Elec-tronic Security Installation Practices Level 4 58697 Q190010XX1204
29Q290039301364
National Certificate: General Security Practices Level 3 58577 29Q290038431243
FETC : Specialist Security Practices Level 4 57713 29Q290040541374
Further Education and Training Certificate :Cor-rections Science Level 4 64389 Q19190014231204
Implemented
National Diploma: Corrections Science Level 5 48553 Q19190015362405Implemented
National Certificate: Locksmithing Level 3 50541 29Q290036241233
National Certificate : Forensic Science Level 5 57651 29Q290035341905Implemented
National Certificate: Paralegal Practice/ Private Sector Commercial Sector/ Community Based/ Non- Governmental Sector
Level 5 49597 Q290002231315Implemented
National Diploma: Statutory Intelligence Practice: Analysis Level 6 49102 Q290005XX2596
National Diploma: Statutory Intelligence: Collec-tionNational Diploma: Statutory Intelligence Practice: National Diploma: Statutory Intelligence Practice: Counterintelligence
Level 6Level 6
4910049100
Q290006XX2586Q290006XX2586
National Diploma: Electronic Warfare In the process of registration as a Learnership Level 5 50500
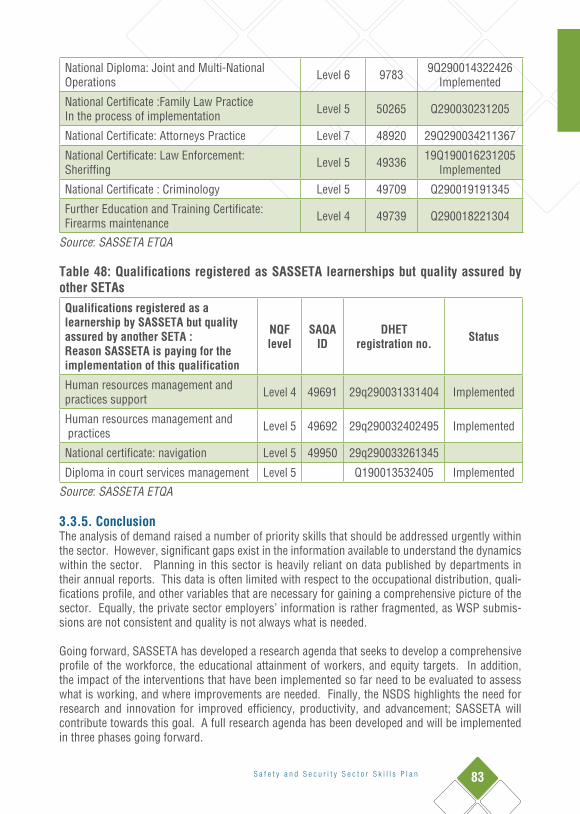
S a f e t y a n d S e c u r i t y S e c t o r S k i l l s P l a n 83
National Diploma: Joint and Multi-National Operations Level 6 9783 9Q290014322426
Implemented
National Certificate :Family Law PracticeIn the process of implementation Level 5 50265 Q290030231205
National Certificate: Attorneys Practice Level 7 48920 29Q290034211367
National Certificate: Law Enforcement: Sheriffing Level 5 49336 19Q190016231205
Implemented
National Certificate : Criminology Level 5 49709 Q290019191345
Further Education and Training Certificate: Firearms maintenance Level 4 49739 Q290018221304
Source: SASSETA ETQA
Table 48: Qualifications registered as SASSETA learnerships but quality assured by other SETAs Qualifications registered as a learnership by SASSETA but quality assured by another SETA : Reason SASSETA is paying for the implementation of this qualification
NQF level
SAQA ID
DHET registration no. Status
Human resources management and practices support Level 4 49691 29q290031331404 Implemented
Human resources management and practices Level 5 49692 29q290032402495 Implemented
National certificate: navigation Level 5 49950 29q290033261345
Diploma in court services management Level 5 Q190013532405 Implemented
Source: SASSETA ETQA
3.3.5. ConclusionThe analysis of demand raised a number of priority skills that should be addressed urgently within the sector. However, significant gaps exist in the information available to understand the dynamics within the sector. Planning in this sector is heavily reliant on data published by departments in their annual reports. This data is often limited with respect to the occupational distribution, quali-fications profile, and other variables that are necessary for gaining a comprehensive picture of the sector. Equally, the private sector employers’ information is rather fragmented, as WSP submis-sions are not consistent and quality is not always what is needed.
Going forward, SASSETA has developed a research agenda that seeks to develop a comprehensive profile of the workforce, the educational attainment of workers, and equity targets. In addition, the impact of the interventions that have been implemented so far need to be evaluated to assess what is working, and where improvements are needed. Finally, the NSDS highlights the need for research and innovation for improved efficiency, productivity, and advancement; SASSETA will contribute towards this goal. A full research agenda has been developed and will be implemented in three phases going forward.

84 S a f e t y a n d S e c u r i t y S e c t o r S k i l l s P l a n
4. Sector Development Strategy: strategic objectives and outputsThis section sets out the strategic objectives and outputs that the SASSETA has set to ensure suc-cessful and progressive skills development in the safety and security sector.
4.1. Strategic Objective 1: Safety and Security Sector institutional mechanism for skills planning developed
Outcome: A credible institutional mechanism for skills planning is developed to provide reliable information on supply and demand for skills in the Safety and Security sector
The SASSETA has an important role to play in developing a credible system for skills planning and labour market analysis as identified in the NSDSIII. Research is a critical component of developing that system and work must start immediately on ensuring that such a system clearly articulating the labour supply and demand is developed.
Output 1: Information management capacity strengthened to enable better skills planningThe SASSETA needs to consolidate all the data it has to identify gaps. The information manage-ment function within the SASSETA has recently been restructured to make it more responsive to business needs. In addition, the forthcoming realignment of the research function will ensure that there is a holistic view of information in the organisation. There will be analysis capacity required to map the data from learning programmes with data from WSPs and ATRs. Research should be focussed on gaps identified. In addition, the SASSETA receives data from various sources and there is a requirement for consolidation of such data to derive intelligence and insights. Achieving this output will involve:
• Restructuring of the research function to build labour market analysis forecasting and trends in demand for skills
• Capacitation of the IT function to manage the SASSETA information effectively• Development and sourcing of systems and IT tools for better coordination and analysis of
data
Output 2: Comprehensive research conducted annually in each sub-sector to establish skills needs. There will be focus on sourcing labour market demand data from the members of the SETA. The SASSETA needs to understand current and anticipated changes in demand for key occupations especially in relation to attrition as a result of: age of employees; morbidity; and other terminations. In respect of other terminations there will be focus on understanding why that happens. The SAS-SETA will also have to build a comprehensive profile of the sector around qualification levels, race, gender, disability, earnings levels, entry level qualifications and other recruitment criteria; problems in filling posts; career paths, etc. There is a need for specific research that identifies trends and developments in each sub-sector. Once all this data is obtained there needs to be systematic or-ganisation of the data and analysis to inform planning.
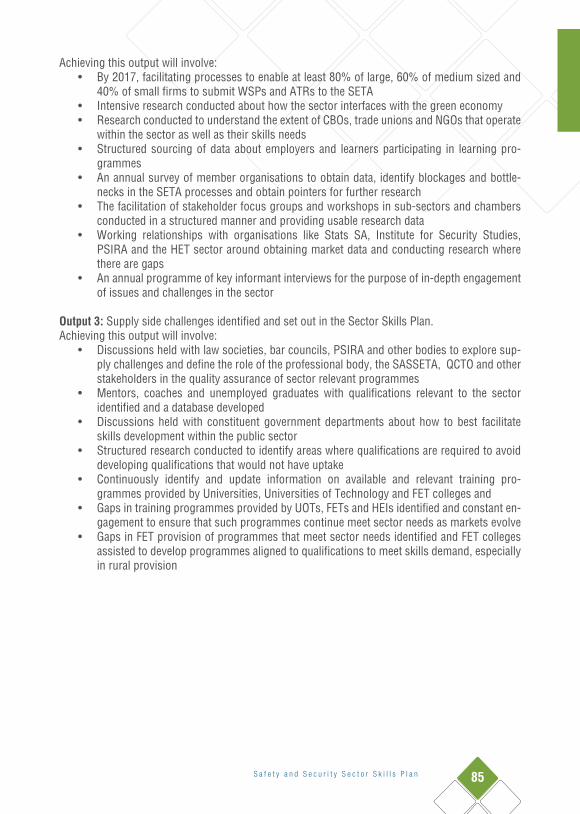
S a f e t y a n d S e c u r i t y S e c t o r S k i l l s P l a n 85
Achieving this output will involve:• By 2017, facilitating processes to enable at least 80% of large, 60% of medium sized and
40% of small firms to submit WSPs and ATRs to the SETA• Intensive research conducted about how the sector interfaces with the green economy• Research conducted to understand the extent of CBOs, trade unions and NGOs that operate
within the sector as well as their skills needs• Structured sourcing of data about employers and learners participating in learning pro-
grammes• An annual survey of member organisations to obtain data, identify blockages and bottle-
necks in the SETA processes and obtain pointers for further research• The facilitation of stakeholder focus groups and workshops in sub-sectors and chambers
conducted in a structured manner and providing usable research data• Working relationships with organisations like Stats SA, Institute for Security Studies,
PSIRA and the HET sector around obtaining market data and conducting research where there are gaps
• An annual programme of key informant interviews for the purpose of in-depth engagement of issues and challenges in the sector
Output 3: Supply side challenges identified and set out in the Sector Skills Plan.Achieving this output will involve:
• Discussions held with law societies, bar councils, PSIRA and other bodies to explore sup-ply challenges and define the role of the professional body, the SASSETA, QCTO and other stakeholders in the quality assurance of sector relevant programmes
• Mentors, coaches and unemployed graduates with qualifications relevant to the sector identified and a database developed
• Discussions held with constituent government departments about how to best facilitate skills development within the public sector
• Structured research conducted to identify areas where qualifications are required to avoid developing qualifications that would not have uptake
• Continuously identify and update information on available and relevant training pro-grammes provided by Universities, Universities of Technology and FET colleges and
• Gaps in training programmes provided by UOTs, FETs and HEIs identified and constant en-gagement to ensure that such programmes continue meet sector needs as markets evolve
• Gaps in FET provision of programmes that meet sector needs identified and FET colleges assisted to develop programmes aligned to qualifications to meet skills demand, especially in rural provision
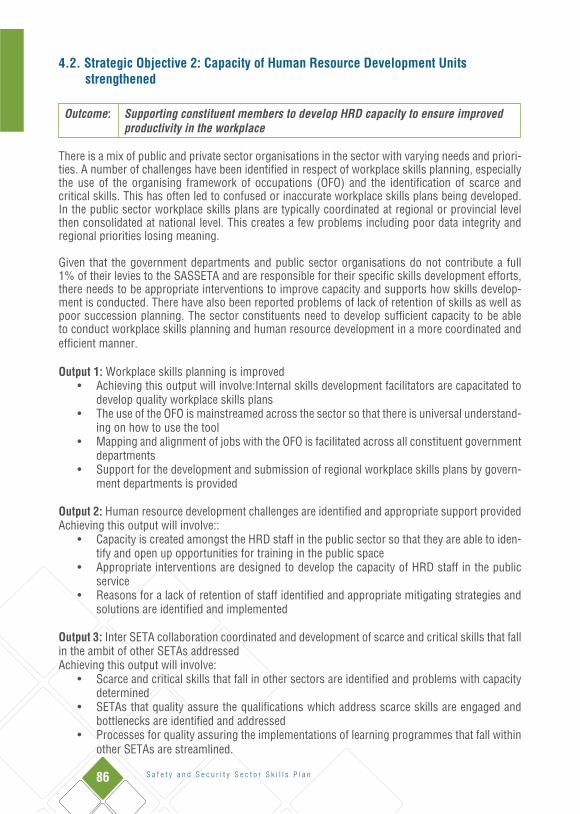
86 S a f e t y a n d S e c u r i t y S e c t o r S k i l l s P l a n
4.2. Strategic Objective 2: Capacity of Human Resource Development Units strengthened
Outcome: Supporting constituent members to develop HRD capacity to ensure improved productivity in the workplace
There is a mix of public and private sector organisations in the sector with varying needs and priori-ties. A number of challenges have been identified in respect of workplace skills planning, especially the use of the organising framework of occupations (OFO) and the identification of scarce and critical skills. This has often led to confused or inaccurate workplace skills plans being developed. In the public sector workplace skills plans are typically coordinated at regional or provincial level then consolidated at national level. This creates a few problems including poor data integrity and regional priorities losing meaning.
Given that the government departments and public sector organisations do not contribute a full 1% of their levies to the SASSETA and are responsible for their specific skills development efforts, there needs to be appropriate interventions to improve capacity and supports how skills develop-ment is conducted. There have also been reported problems of lack of retention of skills as well as poor succession planning. The sector constituents need to develop sufficient capacity to be able to conduct workplace skills planning and human resource development in a more coordinated and efficient manner.
Output 1: Workplace skills planning is improved • Achieving this output will involve:Internal skills development facilitators are capacitated to
develop quality workplace skills plans• The use of the OFO is mainstreamed across the sector so that there is universal understand-
ing on how to use the tool• Mapping and alignment of jobs with the OFO is facilitated across all constituent government
departments• Support for the development and submission of regional workplace skills plans by govern-
ment departments is provided
Output 2: Human resource development challenges are identified and appropriate support providedAchieving this output will involve::
• Capacity is created amongst the HRD staff in the public sector so that they are able to iden-tify and open up opportunities for training in the public space
• Appropriate interventions are designed to develop the capacity of HRD staff in the public service
• Reasons for a lack of retention of staff identified and appropriate mitigating strategies and solutions are identified and implemented
Output 3: Inter SETA collaboration coordinated and development of scarce and critical skills that fall in the ambit of other SETAs addressedAchieving this output will involve:
• Scarce and critical skills that fall in other sectors are identified and problems with capacity determined
• SETAs that quality assure the qualifications which address scarce skills are engaged and bottlenecks are identified and addressed
• Processes for quality assuring the implementations of learning programmes that fall within other SETAs are streamlined.
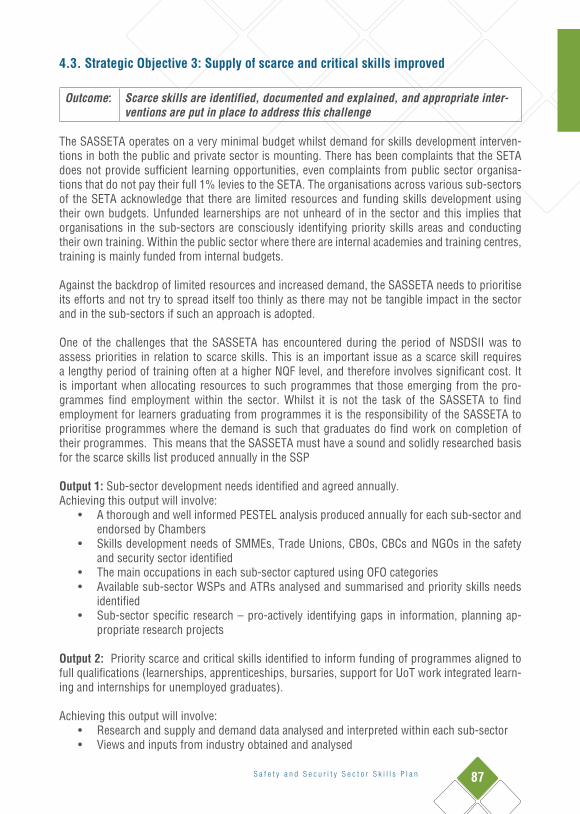
S a f e t y a n d S e c u r i t y S e c t o r S k i l l s P l a n 87
4.3. Strategic Objective 3: Supply of scarce and critical skills improved
Outcome: Scarce skills are identified, documented and explained, and appropriate inter-ventions are put in place to address this challenge
The SASSETA operates on a very minimal budget whilst demand for skills development interven-tions in both the public and private sector is mounting. There has been complaints that the SETA does not provide sufficient learning opportunities, even complaints from public sector organisa-tions that do not pay their full 1% levies to the SETA. The organisations across various sub-sectors of the SETA acknowledge that there are limited resources and funding skills development using their own budgets. Unfunded learnerships are not unheard of in the sector and this implies that organisations in the sub-sectors are consciously identifying priority skills areas and conducting their own training. Within the public sector where there are internal academies and training centres, training is mainly funded from internal budgets.
Against the backdrop of limited resources and increased demand, the SASSETA needs to prioritise its efforts and not try to spread itself too thinly as there may not be tangible impact in the sector and in the sub-sectors if such an approach is adopted.
One of the challenges that the SASSETA has encountered during the period of NSDSII was to assess priorities in relation to scarce skills. This is an important issue as a scarce skill requires a lengthy period of training often at a higher NQF level, and therefore involves significant cost. It is important when allocating resources to such programmes that those emerging from the pro-grammes find employment within the sector. Whilst it is not the task of the SASSETA to find employment for learners graduating from programmes it is the responsibility of the SASSETA to prioritise programmes where the demand is such that graduates do find work on completion of their programmes. This means that the SASSETA must have a sound and solidly researched basis for the scarce skills list produced annually in the SSP
Output 1: Sub-sector development needs identified and agreed annually. Achieving this output will involve:
• A thorough and well informed PESTEL analysis produced annually for each sub-sector and endorsed by Chambers
• Skills development needs of SMMEs, Trade Unions, CBOs, CBCs and NGOs in the safety and security sector identified
• The main occupations in each sub-sector captured using OFO categories• Available sub-sector WSPs and ATRs analysed and summarised and priority skills needs
identified• Sub-sector specific research – pro-actively identifying gaps in information, planning ap-
propriate research projects
Output 2: Priority scarce and critical skills identified to inform funding of programmes aligned to full qualifications (learnerships, apprenticeships, bursaries, support for UoT work integrated learn-ing and internships for unemployed graduates).
Achieving this output will involve: • Research and supply and demand data analysed and interpreted within each sub-sector• Views and inputs from industry obtained and analysed

88 S a f e t y a n d S e c u r i t y S e c t o r S k i l l s P l a n
• Data obtained from provinces and municipal districts via PSDF forums, clusters, SDFs, and regional variations documented
• Mapping of OFO with HR systems conducted and OFO templates completed to enable cross sector analysis and planning
• Independent research conducted where data gaps exist and the research engaged with in the sub-sectors and chambers
• Agreement on priority scarce skills brokered in chamber stakeholder meetings
Output 3: Appropriate programmes agreed to address the scarce an critical skills needs.
Achieving this output will involve:• The most appropriate and cost effective interventions required to address scarce skills
(learnerships; apprenticeships; bursaries; work integrated learning, internships) identified and agreed
• Targets and plans agreed, taking account of equity, transformation and development chal-lenges and targets
• Agreements and MoU’s entered into with other SETAs to address artisanal skills and cross-sectoral scarce skills
Output 4: Skills development support provided to SMMEs, Trade Unions, CBOs and NGOs operat-ing in the safety and security sector
Achieving this output will involve:
• A basket of learning interventions targeting SMMEs, Co-operatives, CBOs and NGOs devel-oped to address skills development needs
• Access to information facilitated for the SMMEs regarding opportunities on how to grow their businesses
Output 5: Unemployed graduates targeted for re-skilling to address scarce and critical skills needs
Achieving this output will involve:
• Learning Programmes to re-skill and re-tool unemployed graduates identified and agreed• Targets and plans developed for the various sub-sectors of the SASSETA
4.4. Strategic objective 4: Quality education and training provision
Outcome: Skills development provision challenges are identified and addressed to ensure improved access to quality and relevant education and training in the sector including in rural areas
The sector relies on public and private providers for education and training in the sector. There have been a number of challenges identified with the quality of LLB graduates and there needs to be improvements in that regard. The SASSETA is establishing formal partnerships with universities, especially their law faculties to address the challenge of poor quality of LLB graduates.
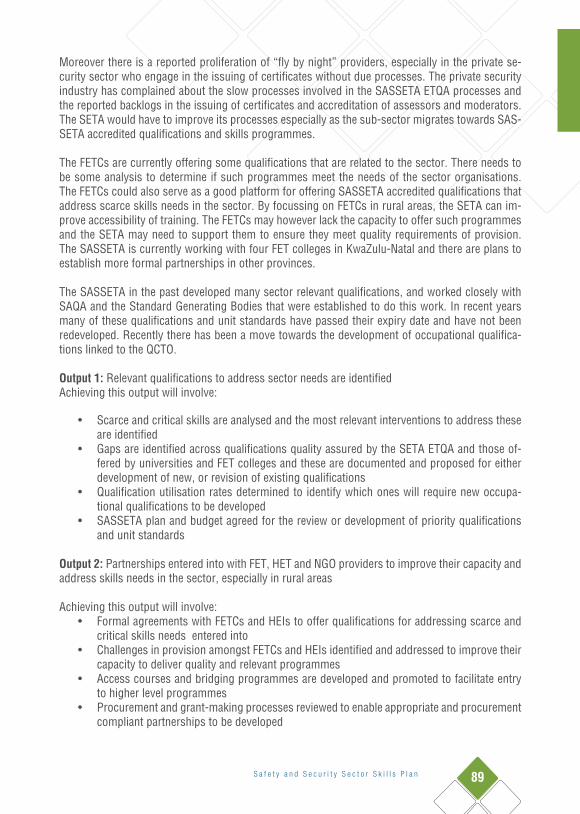
S a f e t y a n d S e c u r i t y S e c t o r S k i l l s P l a n 89
Moreover there is a reported proliferation of “fly by night” providers, especially in the private se-curity sector who engage in the issuing of certificates without due processes. The private security industry has complained about the slow processes involved in the SASSETA ETQA processes and the reported backlogs in the issuing of certificates and accreditation of assessors and moderators. The SETA would have to improve its processes especially as the sub-sector migrates towards SAS-SETA accredited qualifications and skills programmes.
The FETCs are currently offering some qualifications that are related to the sector. There needs to be some analysis to determine if such programmes meet the needs of the sector organisations. The FETCs could also serve as a good platform for offering SASSETA accredited qualifications that address scarce skills needs in the sector. By focussing on FETCs in rural areas, the SETA can im-prove accessibility of training. The FETCs may however lack the capacity to offer such programmes and the SETA may need to support them to ensure they meet quality requirements of provision. The SASSETA is currently working with four FET colleges in KwaZulu-Natal and there are plans to establish more formal partnerships in other provinces.
The SASSETA in the past developed many sector relevant qualifications, and worked closely with SAQA and the Standard Generating Bodies that were established to do this work. In recent years many of these qualifications and unit standards have passed their expiry date and have not been redeveloped. Recently there has been a move towards the development of occupational qualifica-tions linked to the QCTO.
Output 1: Relevant qualifications to address sector needs are identifiedAchieving this output will involve:
• Scarce and critical skills are analysed and the most relevant interventions to address these are identified
• Gaps are identified across qualifications quality assured by the SETA ETQA and those of-fered by universities and FET colleges and these are documented and proposed for either development of new, or revision of existing qualifications
• Qualification utilisation rates determined to identify which ones will require new occupa-tional qualifications to be developed
• SASSETA plan and budget agreed for the review or development of priority qualifications and unit standards
Output 2: Partnerships entered into with FET, HET and NGO providers to improve their capacity and address skills needs in the sector, especially in rural areas
Achieving this output will involve:• Formal agreements with FETCs and HEIs to offer qualifications for addressing scarce and
critical skills needs entered into• Challenges in provision amongst FETCs and HEIs identified and addressed to improve their
capacity to deliver quality and relevant programmes• Access courses and bridging programmes are developed and promoted to facilitate entry
to higher level programmes • Procurement and grant-making processes reviewed to enable appropriate and procurement
compliant partnerships to be developed
90 S a f e t y a n d S e c u r i t y S e c t o r S k i l l s P l a n
• Articulation supported to higher level qualification: credits gained in SASSETA funded pro-grammes to count towards other career related qualifications
• Marketing and advocacy campaign to raise understanding of FET and HE offerings to meet industry needs
• Bursary processes streamlined and marketed so that learners from rural areas know how to access them
Output 3: Learning opportunities for youth and unemployed graduates are opened up, especially in rural areas
Achieving this output will involve:
• Learning opportunities in scarce skills areas are created for youth in FETCs and HETs in rural areas so that they have the skills to enter the labour market
• Unemployed graduates are offered additional skills in scarce skills areas to enable them to access economic opportunities
Output 4: SASSETA roles and responsibilities in terms of QCTO and NAMB processes agreed and necessary support given to providers
Achieving this output will involve:
• SASSETA role as a Quality Management Partner within the QCTO realm agreed and opera-tionalised
• Necessary support is provided to education and training providers operating in the sector in respect of QCTO and NAMB processes
• QA processes are reviewed and improved to ensure effective and efficient service provision to the sector stakeholders
• The role of sector professional and regulatory bodies in skills development clarified• The role of the SASSETA in the professionalisation of the sub-sectors is clarified and agreed• SASSETA ETQA programme aligned to the sub-sector development needs is developed
Output 5: Sources of education and training supply identified Achieving this output will involve:
• Identify suppliers of education and training (HE; FET; private and NGO providers) who offer programmes relevant to the needs of the sector
• Research conducted on sector-relevant programmes of FET and HE institutions, including gaps and weaknesses that would need to be addressed to meet sector needs
• Accreditation and/or programme approval of relevant FET qualifications and programmes (e.g. Some N courses) with support and guidance provided where requirements are not immediately met

S a f e t y a n d S e c u r i t y S e c t o r S k i l l s P l a n 91
4.5. Strategic Objective 5: Expanded Workplace Provision
Outcome: More learning opportunities for the youth and unemployed graduates are opened up in the sector including utilizing the public sector as a training space
The sector is blessed with member organisations that are spread across all corners of the country. Whereas the SETA has limited resources to fund training, there needs to be focus on identifying workplaces that can be used as training spaces. Whilst some workplaces in the sector are of high security in nature and require clearances, there are many that can be effectively be used as train-ing spaces. The Departments of Corrections, Justice, Defence and the SAPS have stations and workplaces across the country which could be used effectively as training spaces, exposing young and unemployed people to the professional environments and experiential learning opportunities.
Government is in the process of investing hundreds of billions in the strategic infrastructure pro-jects (SIPs). These initiatives are going to provide environment conducive for learning and experi-ential learning. It will be imperative to identify all opportunities that are relevant to the sector pre-sented by the SIPs. Moreover there will be a need to ensure a coordinated inter-Seta collaboration to address seize the SIPs opportunities as well as other cross sectoral challenges.
Output 1: Workplace learning and experience opportunities identified in the SIPs and strategies developed to place learners
Achieving this output will involve:
• Analysis conducted of all SIPs and interfaces with the safety and security sector identified• Inter-seta collaboration to develop key messages and processes around skills development
put in place with clear guidelines• Opportunities for learning and workplace experience identified• Lead departments for the implementation of the SIPs identified and engaged to ensure
that skills development requirements are addressed and mainstreamed during procure-ment processes
Output 2: Workplace learning and experience opportunities identified in rural and urban areasAchieving this output will involve:
• Workplace training and experience placement opportunities identified in each sub-sector including work integrated learning opportunities for students and work experience oppor-tunities for lecturers – FET colleges and technology diplomas
• Unemployed graduates identified and placed for experiential learning opportunities in scarce skills occupations
• Coaches, mentors and workplace assessors trained to enhance experiential learning and credit workplace learning
• PIVOTAL and other grants made available to support experiential learning opportunities• Workplace learning and experience monitored and improved to enhance competence
92 S a f e t y a n d S e c u r i t y S e c t o r S k i l l s P l a n
4.6. Strategic Objective 6: Monitoring & Evaluation of skills development interventions
Outcome: Impact of skills development interventions across the safety and security sector is measured and key learnings for improvement are obtained
There has been limited evaluation research conducted to determine the outcomes and impact of the extensive skills development interventions in the sector. Each year the SASSETA spends mil-lions of rand whilst public sector organisations in the sector spend hundreds of millions of rand of their ring-fenced 1% skills levy on skills development interventions. It is essential that stakeholders within the sector and others charged with oversight responsibilities are provided with evidence of outcomes and impact arising from SASETA funded interventions. There has been several com-plaints about lack of relevance, contextual understanding and quality of training provided in the sector and there needs to be systems and processes to guard against that as well as development of early warning signals to pick up problematic provision. It will be important to measure if the investment in skills development is yielding positive returns for the sector.
Output 1: Impact studies and evaluations conducted to understand the impact of the learning pro-grammes in the sector
Achieving this output will involve:
• Impact evaluations of SETA funded programmes conducted • Tracer studies conducted on employed and unemployed learners who participated in SETA
funded learnership, internship and other programmes • Unemployed learners who have completed SASSETA programmes identified for matching
with employers in the public sector requiring entry level recruits for further training. E.g Police, Corrections, Defence, Traffic & Metro Policing
• Analysis of unfunded learnerships conducted
Output 2: Systems and processes within the SASSETA for the monitoring of SASSETA funded skills development are reviewed and strengthened
Achieving this output will involve:
• An effective programme evaluation system linked to a management information system put in place.
• A programme of baseline studies and impact evaluations is developed and agreed for the period of NSDSIII.
• Checks and balances as well as a system of early warning signals are put in place for moni-toring training provision
• A comprehensive report is produced on the outcomes and impact of SASSETA funded training during the period of NSDSII.
Output 3: Safety and security public sector spend in skills development analysed
Achieving this output will involve:
• Analysis of spend of the ring-fenced 1% levy by constituent public sector organisations conducted • Return on investment on public sector spend on skills development is conducted• Value for money analysis is conducted to determine the cost effectiveness of providers
used in the public service including Palama and private providers
S a f e t y a n d S e c u r i t y S e c t o r S k i l l s P l a n 93
Safety and SecuritySector Skills Plan
2012 – 2016
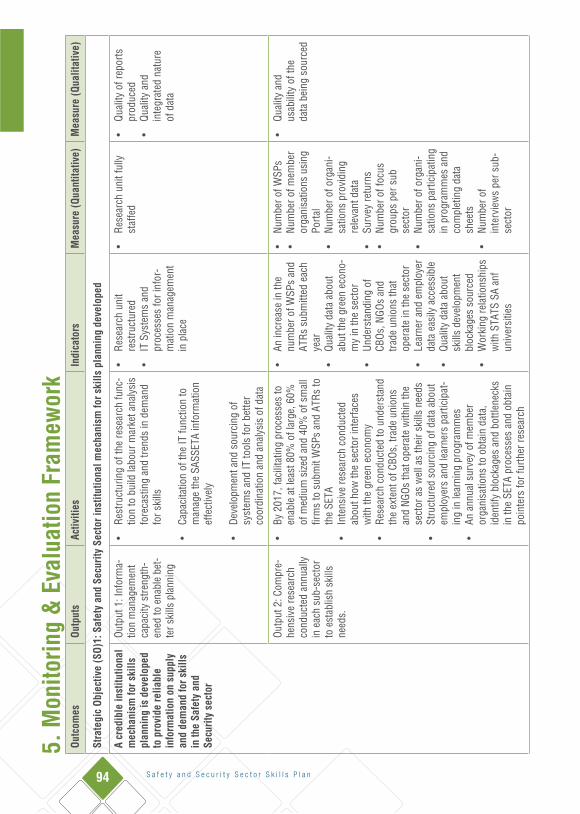
94 S a f e t y a n d S e c u r i t y S e c t o r S k i l l s P l a n
5. M
onito
ring
& E
valu
atio
n Fr
amew
ork
Outc
omes
Outp
uts
Activ
ities
Indi
cato
rsM
easu
re (Q
uant
itativ
e)M
easu
re (Q
ualit
ativ
e)
Stra
tegi
c Ob
ject
ive
(SO)
1: S
afet
y an
d Se
curit
y Se
ctor
inst
itutio
nal m
echa
nism
for s
kills
pla
nnin
g de
velo
ped
A cr
edib
le in
stitu
tiona
l m
echa
nism
for s
kills
pl
anni
ng is
dev
elop
ed
to p
rovi
de re
liabl
e in
form
atio
n on
sup
ply
and
dem
and
for s
kills
in
the
Safe
ty a
nd
Secu
rity
sect
or
Outp
ut 1
: Inf
orm
a-tio
n m
anag
emen
t ca
paci
ty s
treng
th-
ened
to e
nabl
e be
t-te
r ski
lls p
lann
ing
•Re
stru
ctur
ing
of th
e re
sear
ch fu
nc-
tion
to b
uild
labo
ur m
arke
t ana
lysi
s fo
reca
stin
g an
d tre
nds
in d
eman
d fo
r ski
lls
•Ca
paci
tatio
n of
the
IT fu
nctio
n to
m
anag
e th
e SA
SSET
A in
form
atio
n ef
fect
ivel
y
•De
velo
pmen
t and
sou
rcin
g of
sy
stem
s an
d IT
tool
s fo
r bet
ter
coor
dina
tion
and
anal
ysis
of d
ata
•Re
sear
ch u
nit
rest
ruct
ured
•IT
Sys
tem
s an
d pr
oces
ses
for i
nfor
-m
atio
n m
anag
emen
t in
pla
ce
•Re
sear
ch u
nit f
ully
st
affe
d•
Qual
ity o
f rep
orts
pr
oduc
ed•
Qual
ity a
nd
inte
grat
ed n
atur
e of
dat
a
Outp
ut 2
: Com
pre-
hens
ive
rese
arch
co
nduc
ted
annu
ally
in
eac
h su
b-se
ctor
to
est
ablis
h sk
ills
need
s.
•By
201
7, fa
cilit
atin
g pr
oces
ses
to
enab
le a
t lea
st 8
0% o
f lar
ge, 6
0%
of m
ediu
m s
ized
and
40%
of s
mal
l fir
ms
to s
ubm
it W
SPs
and
ATRs
to
the
SETA
•In
tens
ive
rese
arch
con
duct
ed
abou
t how
the
sect
or in
terfa
ces
with
the
gree
n ec
onom
y•
Rese
arch
con
duct
ed to
und
erst
and
the
exte
nt o
f CBO
s, tr
ade
unio
ns
and
NGOs
that
ope
rate
with
in th
e se
ctor
as
wel
l as
thei
r ski
lls n
eeds
•St
ruct
ured
sou
rcin
g of
dat
a ab
out
empl
oyer
s an
d le
arne
rs p
artic
ipat
-in
g in
lear
ning
pro
gram
mes
•An
ann
ual s
urve
y of
mem
ber
orga
nisa
tions
to o
btai
n da
ta,
iden
tify
bloc
kage
s an
d bo
ttlen
ecks
in
the
SETA
pro
cess
es a
nd o
btai
n po
inte
rs fo
r fur
ther
rese
arch
•An
incr
ease
in th
e nu
mbe
r of W
SPs
and
ATRs
sub
mitt
ed e
ach
year
•
Qual
ity d
ata
abou
t ab
ut th
e gr
een
econ
o-m
y in
the
sect
or•
Unde
rsta
ndin
g of
CB
Os, N
GOs
and
trade
uni
ons
that
op
erat
e in
the
sect
or•
Lear
ner a
nd e
mpl
oyer
da
ta e
asily
acc
essi
ble
•Qu
ality
dat
a ab
out
skill
s de
velo
pmen
t bl
ocka
ges
sour
ced
•W
orki
ng re
latio
nshi
ps
with
STA
TS S
A an
f un
iver
sitie
s
•Nu
mbe
r of W
SPs
•Nu
mbe
r of m
embe
r or
gani
satio
ns u
sing
Po
rtal
•Nu
mbe
r of o
rgan
i-sa
tions
pro
vidi
ng
rele
vant
dat
a•
Surv
ey re
turn
s•
Num
ber o
f foc
us
grou
ps p
er s
ub
sect
or•
Num
ber o
f org
ani-
satio
ns p
artic
ipat
ing
in p
rogr
amm
es a
nd
com
plet
ing
data
sh
eets
•Nu
mbe
r of
inte
rvie
ws
per s
ub-
sect
or
•Qu
ality
and
us
abili
ty o
f the
da
ta b
eing
sou
rced
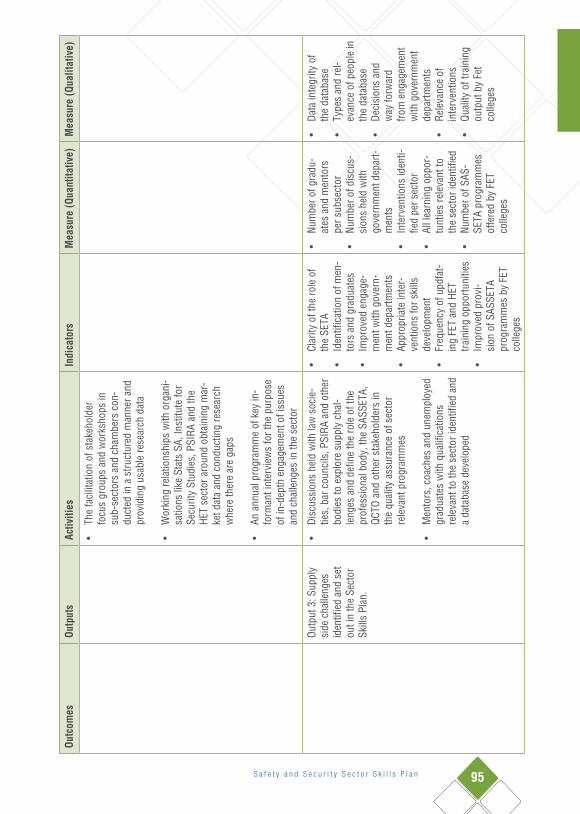
S a f e t y a n d S e c u r i t y S e c t o r S k i l l s P l a n 95
Outc
omes
Outp
uts
Activ
ities
Indi
cato
rsM
easu
re (Q
uant
itativ
e)M
easu
re (Q
ualit
ativ
e)
•Th
e fa
cilit
atio
n of
sta
keho
lder
fo
cus
grou
ps a
nd w
orks
hops
in
sub-
sect
ors
and
cham
bers
con
-du
cted
in a
stru
ctur
ed m
anne
r and
pr
ovid
ing
usab
le re
sear
ch d
ata
•W
orki
ng re
latio
nshi
ps w
ith o
rgan
i-sa
tions
like
Sta
ts S
A, In
stitu
te fo
r Se
curit
y St
udie
s, P
SIRA
and
the
HET
sect
or a
roun
d ob
tain
ing
mar
-ke
t dat
a an
d co
nduc
ting
rese
arch
w
here
ther
e ar
e ga
ps
•An
ann
ual p
rogr
amm
e of
key
in-
form
ant i
nter
view
s fo
r the
pur
pose
of
in-d
epth
eng
agem
ent o
f iss
ues
and
chal
leng
es in
the
sect
or
Outp
ut 3
: Sup
ply
side
cha
lleng
es
iden
tifie
d an
d se
t ou
t in
the
Sect
or
Skill
s Pl
an.
•Di
scus
sion
s he
ld w
ith la
w s
ocie
-tie
s, b
ar c
ounc
ils, P
SIRA
and
oth
er
bodi
es to
exp
lore
sup
ply
chal
-le
nges
and
def
ine
the
role
of t
he
prof
essi
onal
bod
y, th
e SA
SSET
A,
QCTO
and
oth
er s
take
hold
ers
in
the
qual
ity a
ssur
ance
of s
ecto
r re
leva
nt p
rogr
amm
es
•M
ento
rs, c
oach
es a
nd u
nem
ploy
ed
grad
uate
s w
ith q
ualif
icat
ions
re
leva
nt to
the
sect
or id
entif
ied
and
a da
taba
se d
evel
oped
•Cl
arity
of t
he ro
le o
f th
e SE
TA•
Iden
tific
atio
n of
men
-to
rs a
nd g
radu
ates
•Im
prov
ed e
ngag
e-m
ent w
ith g
over
n-m
ent d
epar
tmen
ts•
Appr
opria
te in
ter-
vent
ions
for s
kills
de
velo
pmen
t•
Freq
uenc
y of
upd
fat-
ing
FET
and
HET
train
ing
oppo
rtuni
ties
•Im
prov
ed p
rovi
-si
on o
f SAS
SETA
pr
ogra
mm
es b
y FE
T co
llege
s
•Nu
mbe
r of g
radu
-at
es a
nd m
ento
rs
per s
ubse
ctor
•Nu
mbe
r of d
iscu
s-si
ons
held
with
go
vern
men
t dep
art-
men
ts•
Inte
rven
tions
iden
ti-fie
d pe
r sec
tor
•Al
l lea
rnin
g op
por-
tunt
ies
rele
vant
to
the
sect
or id
entif
ied
•Nu
mbe
r of S
AS-
SETA
pro
gram
mes
of
fere
d by
FET
co
llege
s
•Da
ta in
tegr
ity o
f th
e da
taba
se•
Type
s an
d re
l-ev
ance
of p
eopl
e in
th
e da
taba
se•
Deci
sion
s an
d w
ay fo
rwar
d fro
m e
ngag
emen
t w
ith g
over
nmen
t de
partm
ents
•Re
leva
nce
of
inte
rven
tions
•Qu
ality
of t
rain
ing
outp
ut b
y Fe
t co
llege
s
5. M
onito
ring
& E
valu
atio
n Fr
amew
ork
Outc
omes
Outp
uts
Activ
ities
Indi
cato
rsM
easu
re (Q
uant
itativ
e)M
easu
re (Q
ualit
ativ
e)
Stra
tegi
c Ob
ject
ive
(SO)
1: S
afet
y an
d Se
curit
y Se
ctor
inst
itutio
nal m
echa
nism
for s
kills
pla
nnin
g de
velo
ped
A cr
edib
le in
stitu
tiona
l m
echa
nism
for s
kills
pl
anni
ng is
dev
elop
ed
to p
rovi
de re
liabl
e in
form
atio
n on
sup
ply
and
dem
and
for s
kills
in
the
Safe
ty a
nd
Secu
rity
sect
or
Outp
ut 1
: Inf
orm
a-tio
n m
anag
emen
t ca
paci
ty s
treng
th-
ened
to e
nabl
e be
t-te
r ski
lls p
lann
ing
•Re
stru
ctur
ing
of th
e re
sear
ch fu
nc-
tion
to b
uild
labo
ur m
arke
t ana
lysi
s fo
reca
stin
g an
d tre
nds
in d
eman
d fo
r ski
lls
•Ca
paci
tatio
n of
the
IT fu
nctio
n to
m
anag
e th
e SA
SSET
A in
form
atio
n ef
fect
ivel
y
•De
velo
pmen
t and
sou
rcin
g of
sy
stem
s an
d IT
tool
s fo
r bet
ter
coor
dina
tion
and
anal
ysis
of d
ata
•Re
sear
ch u
nit
rest
ruct
ured
•IT
Sys
tem
s an
d pr
oces
ses
for i
nfor
-m
atio
n m
anag
emen
t in
pla
ce
•Re
sear
ch u
nit f
ully
st
affe
d•
Qual
ity o
f rep
orts
pr
oduc
ed•
Qual
ity a
nd
inte
grat
ed n
atur
e of
dat
a
Outp
ut 2
: Com
pre-
hens
ive
rese
arch
co
nduc
ted
annu
ally
in
eac
h su
b-se
ctor
to
est
ablis
h sk
ills
need
s.
•By
201
7, fa
cilit
atin
g pr
oces
ses
to
enab
le a
t lea
st 8
0% o
f lar
ge, 6
0%
of m
ediu
m s
ized
and
40%
of s
mal
l fir
ms
to s
ubm
it W
SPs
and
ATRs
to
the
SETA
•In
tens
ive
rese
arch
con
duct
ed
abou
t how
the
sect
or in
terfa
ces
with
the
gree
n ec
onom
y•
Rese
arch
con
duct
ed to
und
erst
and
the
exte
nt o
f CBO
s, tr
ade
unio
ns
and
NGOs
that
ope
rate
with
in th
e se
ctor
as
wel
l as
thei
r ski
lls n
eeds
•St
ruct
ured
sou
rcin
g of
dat
a ab
out
empl
oyer
s an
d le
arne
rs p
artic
ipat
-in
g in
lear
ning
pro
gram
mes
•An
ann
ual s
urve
y of
mem
ber
orga
nisa
tions
to o
btai
n da
ta,
iden
tify
bloc
kage
s an
d bo
ttlen
ecks
in
the
SETA
pro
cess
es a
nd o
btai
n po
inte
rs fo
r fur
ther
rese
arch
•An
incr
ease
in th
e nu
mbe
r of W
SPs
and
ATRs
sub
mitt
ed e
ach
year
•
Qual
ity d
ata
abou
t ab
ut th
e gr
een
econ
o-m
y in
the
sect
or•
Unde
rsta
ndin
g of
CB
Os, N
GOs
and
trade
uni
ons
that
op
erat
e in
the
sect
or•
Lear
ner a
nd e
mpl
oyer
da
ta e
asily
acc
essi
ble
•Qu
ality
dat
a ab
out
skill
s de
velo
pmen
t bl
ocka
ges
sour
ced
•W
orki
ng re
latio
nshi
ps
with
STA
TS S
A an
f un
iver
sitie
s
•Nu
mbe
r of W
SPs
•Nu
mbe
r of m
embe
r or
gani
satio
ns u
sing
Po
rtal
•Nu
mbe
r of o
rgan
i-sa
tions
pro
vidi
ng
rele
vant
dat
a•
Surv
ey re
turn
s•
Num
ber o
f foc
us
grou
ps p
er s
ub
sect
or•
Num
ber o
f org
ani-
satio
ns p
artic
ipat
ing
in p
rogr
amm
es a
nd
com
plet
ing
data
sh
eets
•Nu
mbe
r of
inte
rvie
ws
per s
ub-
sect
or
•Qu
ality
and
us
abili
ty o
f the
da
ta b
eing
sou
rced
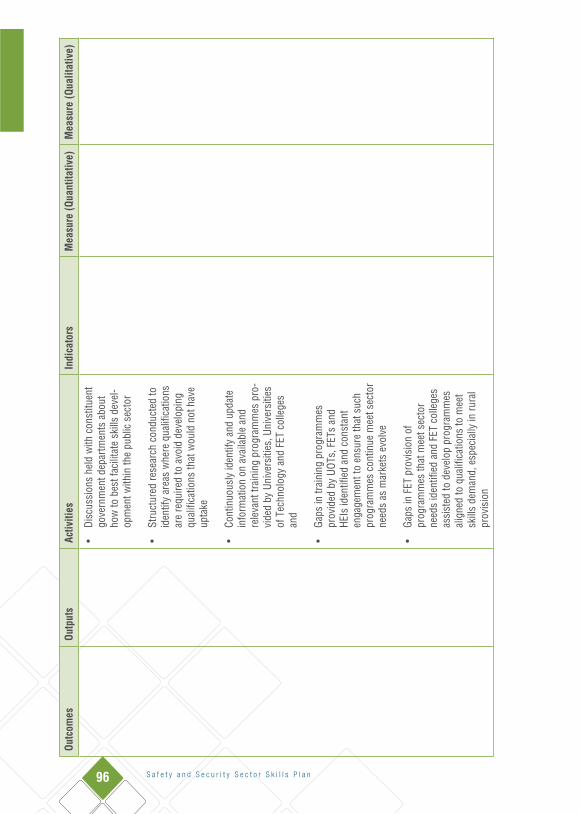
96 S a f e t y a n d S e c u r i t y S e c t o r S k i l l s P l a n
Outc
omes
Outp
uts
Activ
ities
Indi
cato
rsM
easu
re (Q
uant
itativ
e)M
easu
re (Q
ualit
ativ
e)
•Di
scus
sion
s he
ld w
ith c
onst
ituen
t go
vern
men
t dep
artm
ents
abo
ut
how
to b
est f
acili
tate
ski
lls d
evel
-op
men
t with
in th
e pu
blic
sec
tor
•St
ruct
ured
rese
arch
con
duct
ed to
id
entif
y ar
eas
whe
re q
ualif
icat
ions
ar
e re
quire
d to
avo
id d
evel
opin
g qu
alifi
catio
ns th
at w
ould
not
hav
e up
take
•Co
ntin
uous
ly id
entif
y an
d up
date
in
form
atio
n on
ava
ilabl
e an
d re
leva
nt tr
aini
ng p
rogr
amm
es p
ro-
vide
d by
Uni
vers
ities
, Uni
vers
ities
of
Tec
hnol
ogy
and
FET
colle
ges
and
•Ga
ps in
trai
ning
pro
gram
mes
pr
ovid
ed b
y UO
Ts, F
ETs
and
HEIs
iden
tifie
d an
d co
nsta
nt
enga
gem
ent t
o en
sure
that
suc
h pr
ogra
mm
es c
ontin
ue m
eet s
ecto
r ne
eds
as m
arke
ts e
volv
e
•Ga
ps in
FET
pro
visi
on o
f pr
ogra
mm
es th
at m
eet s
ecto
r ne
eds
iden
tifie
d an
d FE
T co
llege
s as
sist
ed to
dev
elop
pro
gram
mes
al
igne
d to
qua
lific
atio
ns to
mee
t sk
ills
dem
and,
esp
ecia
lly in
rura
l pr
ovis
ion
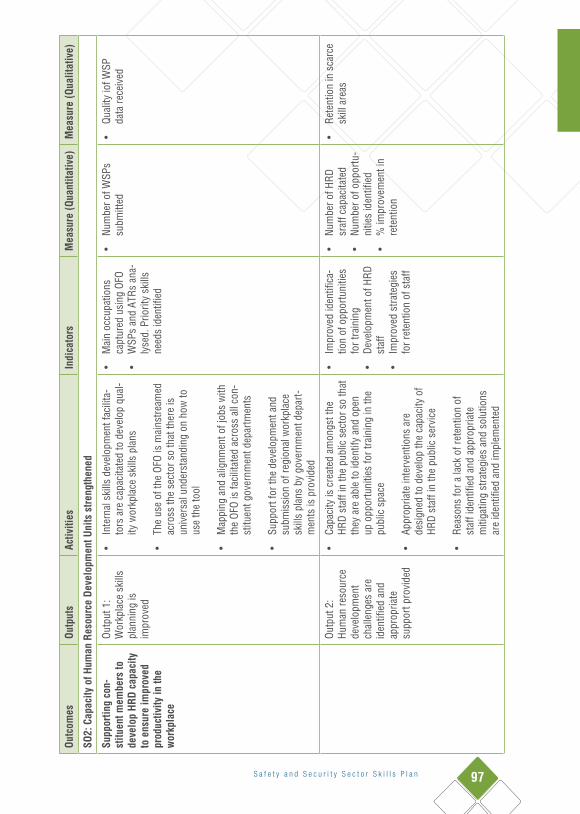
S a f e t y a n d S e c u r i t y S e c t o r S k i l l s P l a n 97
Outc
omes
Outp
uts
Activ
ities
Indi
cato
rsM
easu
re (Q
uant
itativ
e)M
easu
re (Q
ualit
ativ
e)
SO2:
Cap
acity
of H
uman
Res
ourc
e De
velo
pmen
t Uni
ts s
treng
then
ed
Supp
ortin
g co
n-st
ituen
t mem
bers
to
deve
lop
HRD
capa
city
to
ens
ure
impr
oved
pr
oduc
tivity
in th
e w
orkp
lace
Outp
ut 1
: W
orkp
lace
ski
lls
plan
ning
is
impr
oved
•In
tern
al s
kills
dev
elop
men
t fac
ilita
-to
rs a
re c
apac
itate
d to
dev
elop
qua
l-ity
wor
kpla
ce s
kills
pla
ns
•Th
e us
e of
the
OFO
is m
ains
tream
ed
acro
ss th
e se
ctor
so
that
ther
e is
un
iver
sal u
nder
stan
ding
on
how
to
use
the
tool
•M
appi
ng a
nd a
lignm
ent o
f job
s w
ith
the
OFO
is fa
cilit
ated
acr
oss
all c
on-
stitu
ent g
over
nmen
t dep
artm
ents
•Su
ppor
t for
the
deve
lopm
ent a
nd
subm
issi
on o
f reg
iona
l wor
kpla
ce
skill
s pl
ans
by g
over
nmen
t dep
art-
men
ts is
pro
vide
d
•M
ain
occu
patio
ns
capt
ured
usi
ng O
FO
•W
SPs
and
ATRs
ana
-ly
sed.
Prio
rity
skill
s ne
eds
iden
tifie
d
•Nu
mbe
r of W
SPs
subm
itted
•Qu
ality
iof W
SP
data
rece
ived
Outp
ut 2
: Hu
man
reso
urce
de
velo
pmen
t ch
alle
nges
are
id
entif
ied
and
appr
opria
te
supp
ort p
rovi
ded
•Ca
paci
ty is
cre
ated
am
ongs
t the
HR
D st
aff i
n th
e pu
blic
sec
tor s
o th
at
they
are
abl
e to
iden
tify
and
open
up
opp
ortu
nitie
s fo
r tra
inin
g in
the
publ
ic s
pace
•Ap
prop
riate
inte
rven
tions
are
de
sign
ed to
dev
elop
the
capa
city
of
HRD
staf
f in
the
publ
ic s
ervi
ce
•Re
ason
s fo
r a la
ck o
f ret
entio
n of
st
aff i
dent
ified
and
app
ropr
iate
m
itiga
ting
stra
tegi
es a
nd s
olut
ions
ar
e id
entif
ied
and
impl
emen
ted
•Im
prov
ed id
entif
ica-
tion
of o
ppor
tuni
ties
for t
rain
ing
•De
velo
pmen
t of H
RD
staf
f•
Impr
oved
stra
tegi
es
for r
eten
tion
of s
taff
•Nu
mbe
r of H
RD
sraf
f cap
acita
ted
•Nu
mbe
r of o
ppor
tu-
nitie
s id
entif
ied
•%
impr
ovem
ent i
n re
tent
ion
•Re
tent
ion
in s
carc
e sk
ill a
reas

98 S a f e t y a n d S e c u r i t y S e c t o r S k i l l s P l a n
Outc
omes
Outp
uts
Activ
ities
Indi
cato
rsM
easu
re (Q
uant
itativ
e)M
easu
re (Q
ualit
ativ
e)
Outp
ut 3
: Int
er
SETA
col
labo
ra-
tion
coor
dina
ted
and
deve
lopm
ent
of s
carc
e an
d cr
itica
l ski
lls th
at
fall
in th
e am
bit
of o
ther
SET
As
addr
esse
d
•Sc
arce
and
crit
ical
ski
lls th
at fa
ll in
oth
er s
ecto
rs a
re id
entif
ied
and
prob
lem
s w
ith c
apac
ity d
eter
min
ed
•SE
TAs
that
qua
lity
assu
re th
e qu
alifi
catio
ns w
hich
add
ress
sca
rce
skill
s ar
e en
gage
d an
d bo
ttlen
ecks
ar
e id
entif
ied
and
addr
esse
d
•Pr
oces
ses
for q
ualit
y as
surin
g th
e im
plem
enta
tions
of l
earn
ing
prog
ram
mes
that
fall
with
in o
ther
SE
TAs
are
stre
amlin
ed
•Sc
arce
and
crit
ical
sk
ills
that
fall
in o
ther
se
ctor
s ar
e id
entif
ied
annu
ally
•En
gage
men
t with
ot
her S
ETAs
•Pr
oces
ses
for Q
A an
d im
plem
enta
tion
agre
ed a
nd d
evel
oped
•Qu
ality
of p
roce
ses
for h
andl
ing
inte
r se
ta im
plem
enta
-tio
n

S a f e t y a n d S e c u r i t y S e c t o r S k i l l s P l a n 99
Outc
omes
Outp
uts
Activ
ities
Indi
cato
rsM
easu
re (Q
uant
itativ
e)M
easu
re (Q
ualit
ativ
e)
SO 3
: Sup
ply
of s
carc
e an
d cr
itica
l ski
lls im
prov
ed
Scar
ce a
nd c
ritic
al
skill
s ar
e id
entif
ied
and
addr
esse
d in
the
safe
ty a
nd s
ecur
ity
sect
or
Outp
ut 1
: Sub
-se
ctor
dev
elop
-m
ent n
eeds
id
entif
ied
and
agre
ed a
nnua
lly.
•A
thor
ough
and
wel
l inf
orm
ed
PEST
EL a
naly
sis
prod
uced
an-
nual
ly fo
r eac
h su
b-se
ctor
and
en
dors
ed b
y Ch
ambe
rs
•Sk
ills
deve
lopm
ent n
eeds
of
SMM
Es, T
rade
Uni
ons,
CBO
s,
CBCs
and
NGO
s in
the
safe
ty a
nd
secu
rity
sect
or id
entif
ied
•Su
b-se
ctor
spe
cific
rese
arch
–
pro-
activ
ely
iden
tifyi
ng g
aps
in
info
rmat
ion,
pla
nnin
g ap
prop
riate
re
sear
ch p
roje
cts
•PE
STEL
ana
lysi
s pr
o-du
ced
annu
ally
for e
ach
sub-
sect
or
•Sk
illd
deve
lopm
ent
need
s of
SM
MEs
, Tra
de
Unio
ns, C
BOs,
CBC
s an
d NG
Os id
entif
ied
annu
ally
•An
alys
is o
f the
SSP
to
ensu
re k
ey s
trate
gic
goal
s ar
e ad
dres
sed
•Jo
b va
canc
ies
and
recr
uitm
ent t
imes
an
alys
ed•
Supp
ly a
nd d
eman
d pr
ojec
tions
and
mod
els
appr
opria
te to
eac
h su
b-se
ctor
•Nu
mbe
r of s
ub-
sect
ors
with
thor
-ou
ghly
rese
arch
ed
need
s id
entif
ied
•Qu
ality
of r
esea
rch
cond
ucte
d
Outp
ut 2
: Pr
iorit
y sc
arce
and
crit
ical
sk
ills
iden
tifie
d to
in
form
fund
ing
of p
rogr
amm
es
alig
ned
to fu
ll qu
alifi
catio
ns
(lear
ners
hips
, ap
pren
tices
hips
, bu
rsar
ies,
sup
port
for U
oT w
ork
in-
tegr
ated
lear
ning
an
d in
tern
ship
s fo
r une
mpl
oyed
gr
adua
tes)
.
•Re
sear
ch a
nd s
uppl
y an
d de
man
d da
ta a
naly
sed
and
inte
rpre
ted
with
in e
ach
sub-
sect
or
•Vi
ews
and
inpu
ts fr
om in
dust
ry
obta
ined
and
ana
lyse
d
•Da
ta o
btai
ned
from
pro
vinc
es
and
mun
icip
al d
istri
cts
via
PSDF
fo
rum
s, c
lust
ers,
SDF
s, a
nd
regi
onal
var
iatio
ns d
ocum
ente
d
•M
appi
ng o
f OFO
with
HR
syst
ems
cond
ucte
d an
d OF
O te
mpl
ates
co
mpl
eted
to e
nabl
e cr
oss
sect
or
anal
ysis
and
pla
nnin
g
•Re
sear
ch c
ondu
cted
an
nual
ly to
und
erst
and
supp
ly a
nd d
eman
d•
Impr
oved
sou
rcin
g an
d an
alys
is o
f ind
ustry
dat
a•
Impr
oved
sou
ring
and
anal
ysis
of p
rovi
ncia
l an
d re
gion
al d
ata
•Im
prov
ed u
se o
f OFO
by
the
sect
or c
onst
ituen
ts•
Gaps
plu
gged
•Nu
mbe
r of r
esea
ch
stud
ies
cond
ucte
d•
Freq
uenc
y of
dat
a so
urci
ng•
Num
ber o
f org
ani-
satio
ns u
sing
OFO
ef
fect
ivel
y
•Qu
ality
of s
uppl
y an
d de
man
d re
sear
ch d
ata
•Qu
ality
of W
SPs
deve
lope
d an
d re
ceiv
ed u
sing
OF
O
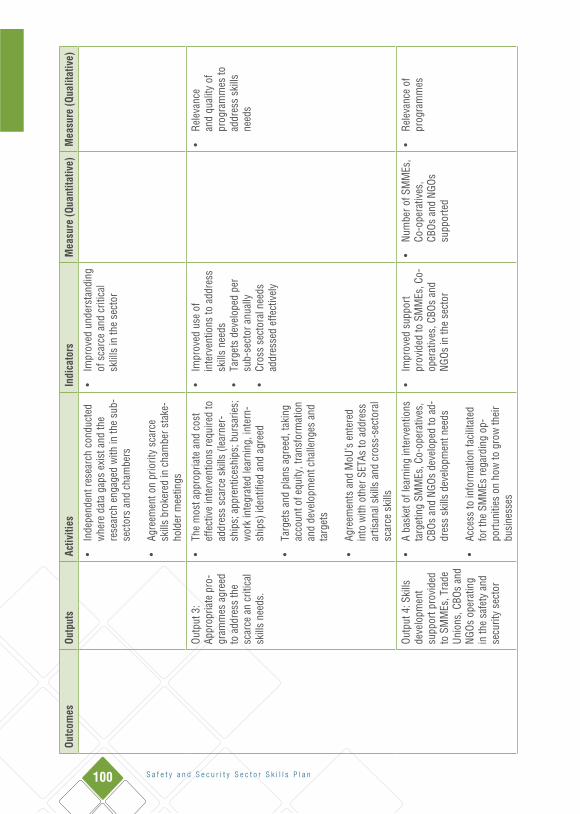
100 S a f e t y a n d S e c u r i t y S e c t o r S k i l l s P l a n
Outc
omes
Outp
uts
Activ
ities
Indi
cato
rsM
easu
re (Q
uant
itativ
e)M
easu
re (Q
ualit
ativ
e)
•In
depe
nden
t res
earc
h co
nduc
ted
whe
re d
ata
gaps
exi
st a
nd th
e re
sear
ch e
ngag
ed w
ith in
the
sub-
sect
ors
and
cham
bers
•Ag
reem
ent o
n pr
iorit
y sc
arce
sk
ills
brok
ered
in c
ham
ber s
take
-ho
lder
mee
tings
•Im
prov
ed u
nder
stan
ding
of
sca
rce
and
criti
cal
sklil
ls in
the
sect
or
Outp
ut 3
: Ap
prop
riate
pro
-gr
amm
es a
gree
d to
add
ress
the
scar
ce a
n cr
itica
l sk
ills
need
s.
•Th
e m
ost a
ppro
pria
te a
nd c
ost
effe
ctiv
e in
terv
entio
ns re
quire
d to
ad
dres
s sc
arce
ski
lls (l
earn
er-
ship
s; a
ppre
ntic
eshi
ps; b
ursa
ries;
w
ork
inte
grat
ed le
arni
ng, i
nter
n-sh
ips)
iden
tifie
d an
d ag
reed
•Ta
rget
s an
d pl
ans
agre
ed, t
akin
g ac
coun
t of e
quity
, tra
nsfo
rmat
ion
and
deve
lopm
ent c
halle
nges
and
ta
rget
s
•Ag
reem
ents
and
MoU
’s e
nter
ed
into
with
oth
er S
ETAs
to a
ddre
ss
artis
anal
ski
lls a
nd c
ross
-sec
tora
l sc
arce
ski
lls
•Im
prov
ed u
se o
f in
terv
entio
ns to
add
ress
sk
ills
need
s•
Targ
ets
deve
lope
d pe
r su
b-se
ctor
anu
ally
•Cr
oss
sect
oral
nee
ds
addr
esse
d ef
fect
ivel
y
•Re
leva
nce
and
qual
ity o
f pr
ogra
mm
es to
ad
dres
s sk
ills
need
s
Outp
ut 4
: Ski
lls
deve
lopm
ent
supp
ort p
rovi
ded
to S
MM
Es, T
rade
Un
ions
, CBO
s an
d NG
Os o
pera
ting
in th
e sa
fety
and
se
curit
y se
ctor
•A
bask
et o
f lea
rnin
g in
terv
entio
ns
targ
etin
g SM
MEs
, Co-
oper
ativ
es,
CBOs
and
NGO
s de
velo
ped
to a
d-dr
ess
skill
s de
velo
pmen
t nee
ds
•Ac
cess
to in
form
atio
n fa
cilit
ated
fo
r the
SM
MEs
rega
rdin
g op
-po
rtuni
ties
on h
ow to
gro
w th
eir
busi
ness
es
•Im
prov
ed s
uppo
rt pr
ovid
ed to
SM
MEs
, Co-
oper
ativ
es, C
BOs
and
NGOs
in th
e se
ctor
•Nu
mbe
r of S
MM
Es,
Co-o
pera
tives
, CB
Os a
nd N
GOs
supp
orte
d
•Re
leva
nce
of
prog
ram
mes

S a f e t y a n d S e c u r i t y S e c t o r S k i l l s P l a n 101
Outc
omes
Outp
uts
Activ
ities
Indi
cato
rsM
easu
re (Q
uant
itativ
e)M
easu
re (Q
ualit
ativ
e)
Outp
ut 5
: Une
m-
ploy
ed g
radu
ates
ta
rget
ed fo
r re-
skill
ing
to a
ddre
ss
scar
ce a
nd c
ritic
al
skill
s ne
eds
•Le
arni
ng P
rogr
amm
es to
re-s
kill
and
re-to
ol u
nem
ploy
ed g
radu
ates
id
entif
ied
and
agre
ed
•Ta
rget
s an
d pl
ans
deve
lope
d fo
r th
e va
rious
sub
-sec
tors
of t
he
SASS
ETA
•Re
skill
ing
of g
radu
ates
•Ta
rget
s fo
r res
killi
ng p
er
sub
sect
or s
et a
nnua
lly
•Nu
mbe
r of g
radu
-at
es re
train
ed•
Rele
vanc
e of
trai
n-in
g pr
ogra
mm
es

102 S a f e t y a n d S e c u r i t y S e c t o r S k i l l s P l a n
Outc
omes
Outp
uts
Activ
ities
Indi
cato
rsM
easu
re (Q
uant
itativ
e)M
easu
re (Q
ualit
ativ
e)
SO4:
Qua
lity
educ
atio
n an
d tra
inin
g pr
ovis
ion
Skill
s de
velo
p-m
ent p
rovi
sion
ch
alle
nges
are
id
entif
ied
and
ad-
dres
sed
to e
nsur
e im
prov
ed a
cces
s to
qua
lity
and
rele
vant
edu
ca-
tion
and
train
ing
in th
e se
ctor
in
clud
ing
in ru
ral
area
s
Outp
ut 1
: Re
leva
nt q
ualif
ica-
tions
to a
ddre
ss
sect
or n
eeds
are
id
entif
ied
•Sc
arce
and
crit
ical
ski
lls a
re
anal
ysed
and
the
mos
t rel
evan
t in
terv
entio
ns to
add
ress
thes
e ar
e id
entif
ied
•Ga
ps a
re id
entif
ied
acro
ss q
ualif
ica-
tions
qua
lity
assu
red
by th
e SE
TA
ETQA
and
thos
e of
fere
d by
uni
vers
i-tie
s an
d FE
T co
llege
s an
d th
ese
are
docu
men
ted
and
prop
osed
for e
ither
de
velo
pmen
t of n
ew, o
r rev
isio
n of
ex
istin
g qu
alifi
catio
ns
•Qu
alifi
catio
n ut
ilisa
tion
rate
s de
ter-
min
ed to
iden
tify
whi
ch o
nes
will
re
quire
new
occ
upat
iona
l qua
lific
a-tio
ns to
be
deve
lope
d
•SA
SSET
A pl
an a
nd b
udge
t agr
eed
for t
he re
view
or d
evel
opm
ent
of p
riorit
y qu
alifi
catio
ns a
nd u
nit
stan
dard
s
•Im
prov
ed u
se o
f SAS
-SE
TA q
ualif
icat
ions
and
le
arni
ng p
rogr
amm
es
•Nu
mbe
r of n
ew p
ro-
gram
mes
dev
elop
ed•
Num
ber o
f pro
-gr
amm
es re
vise
d
•Re
leva
nce
of
inte
rven
tions
to
addr
ess
skill
s ne
eds
Outp
ut 2
: Pa
rtner
ship
s en
tere
d in
to w
ith
FET,
HET
and
NG
O pr
ovid
ers
to
impr
ove
thei
r ca-
paci
ty a
nd a
ddre
ss
skill
s ne
eds
in th
e se
ctor
, esp
ecia
lly
in ru
ral a
reas
•Fo
rmal
agr
eem
ents
with
FET
Cs
and
HEIs
to o
ffer q
ualif
icat
ions
for
addr
essi
ng s
carc
e an
d cr
itica
l ski
lls
need
s e
nter
ed in
to
•Ch
alle
nges
in p
rovi
sion
am
ongs
t FE
TCs
and
HEIs
iden
tifie
d an
d ad
dres
sed
to im
prov
e th
eir c
apac
-ity
to d
eliv
er q
ualit
y an
d re
leva
nt
prog
ram
mes
•Im
prov
ed c
oope
ratio
n ith
FE
TCs
and
HEIs
•Im
prov
ed c
apac
ity o
f FE
TCs
and
HEIs
to o
ffer
prog
ram
mes
for t
he
sect
or•
Impr
oved
acc
ess
to
prog
ram
mes
•St
ream
lined
pro
cure
men
t an
d gr
ant p
roce
sses
•Nu
mbe
r of p
ro-
gram
mes
offe
red
by
FETC
s an
d HE
Is•
Num
ber o
f lea
rner
s ac
cesi
ng th
ese
prog
ram
mes
•Nu
mbe
r of
orga
ni-
satio
ns /
lear
ners
ac
cess
ing
gran
ts
•Re
leva
nce
of
prog
ram
mes
•
Scar
city
of s
kills
un
der w
hich
le
arne
rs a
re b
eing
tra
ined
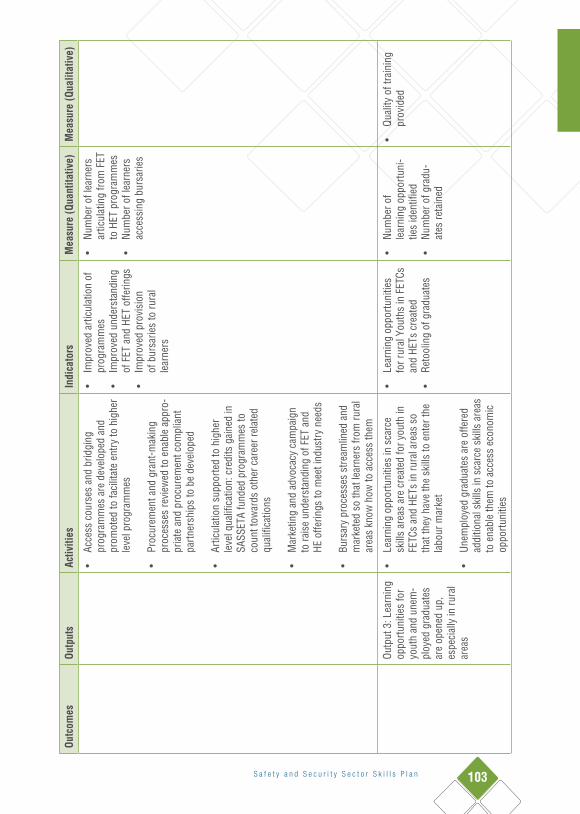
S a f e t y a n d S e c u r i t y S e c t o r S k i l l s P l a n 103
Outc
omes
Outp
uts
Activ
ities
Indi
cato
rsM
easu
re (Q
uant
itativ
e)M
easu
re (Q
ualit
ativ
e)
SO4:
Qua
lity
educ
atio
n an
d tra
inin
g pr
ovis
ion
Skill
s de
velo
p-m
ent p
rovi
sion
ch
alle
nges
are
id
entif
ied
and
ad-
dres
sed
to e
nsur
e im
prov
ed a
cces
s to
qua
lity
and
rele
vant
edu
ca-
tion
and
train
ing
in th
e se
ctor
in
clud
ing
in ru
ral
area
s
Outp
ut 1
: Re
leva
nt q
ualif
ica-
tions
to a
ddre
ss
sect
or n
eeds
are
id
entif
ied
•Sc
arce
and
crit
ical
ski
lls a
re
anal
ysed
and
the
mos
t rel
evan
t in
terv
entio
ns to
add
ress
thes
e ar
e id
entif
ied
•Ga
ps a
re id
entif
ied
acro
ss q
ualif
ica-
tions
qua
lity
assu
red
by th
e SE
TA
ETQA
and
thos
e of
fere
d by
uni
vers
i-tie
s an
d FE
T co
llege
s an
d th
ese
are
docu
men
ted
and
prop
osed
for e
ither
de
velo
pmen
t of n
ew, o
r rev
isio
n of
ex
istin
g qu
alifi
catio
ns
•Qu
alifi
catio
n ut
ilisa
tion
rate
s de
ter-
min
ed to
iden
tify
whi
ch o
nes
will
re
quire
new
occ
upat
iona
l qua
lific
a-tio
ns to
be
deve
lope
d
•SA
SSET
A pl
an a
nd b
udge
t agr
eed
for t
he re
view
or d
evel
opm
ent
of p
riorit
y qu
alifi
catio
ns a
nd u
nit
stan
dard
s
•Im
prov
ed u
se o
f SAS
-SE
TA q
ualif
icat
ions
and
le
arni
ng p
rogr
amm
es
•Nu
mbe
r of n
ew p
ro-
gram
mes
dev
elop
ed•
Num
ber o
f pro
-gr
amm
es re
vise
d
•Re
leva
nce
of
inte
rven
tions
to
addr
ess
skill
s ne
eds
Outp
ut 2
: Pa
rtner
ship
s en
tere
d in
to w
ith
FET,
HET
and
NG
O pr
ovid
ers
to
impr
ove
thei
r ca-
paci
ty a
nd a
ddre
ss
skill
s ne
eds
in th
e se
ctor
, esp
ecia
lly
in ru
ral a
reas
•Fo
rmal
agr
eem
ents
with
FET
Cs
and
HEIs
to o
ffer q
ualif
icat
ions
for
addr
essi
ng s
carc
e an
d cr
itica
l ski
lls
need
s e
nter
ed in
to
•Ch
alle
nges
in p
rovi
sion
am
ongs
t FE
TCs
and
HEIs
iden
tifie
d an
d ad
dres
sed
to im
prov
e th
eir c
apac
-ity
to d
eliv
er q
ualit
y an
d re
leva
nt
prog
ram
mes
•Im
prov
ed c
oope
ratio
n ith
FE
TCs
and
HEIs
•Im
prov
ed c
apac
ity o
f FE
TCs
and
HEIs
to o
ffer
prog
ram
mes
for t
he
sect
or•
Impr
oved
acc
ess
to
prog
ram
mes
•St
ream
lined
pro
cure
men
t an
d gr
ant p
roce
sses
•Nu
mbe
r of p
ro-
gram
mes
offe
red
by
FETC
s an
d HE
Is•
Num
ber o
f lea
rner
s ac
cesi
ng th
ese
prog
ram
mes
•Nu
mbe
r of
orga
ni-
satio
ns /
lear
ners
ac
cess
ing
gran
ts
•Re
leva
nce
of
prog
ram
mes
•
Scar
city
of s
kills
un
der w
hich
le
arne
rs a
re b
eing
tra
ined
Outc
omes
Outp
uts
Activ
ities
Indi
cato
rsM
easu
re (Q
uant
itativ
e)M
easu
re (Q
ualit
ativ
e)
•Ac
cess
cou
rses
and
brid
ging
pr
ogra
mm
es a
re d
evel
oped
and
pr
omot
ed to
faci
litat
e en
try to
hig
her
leve
l pro
gram
mes
•Pr
ocur
emen
t and
gra
nt-m
akin
g pr
oces
ses
revi
ewed
to e
nabl
e ap
pro-
pria
te a
nd p
rocu
rem
ent c
ompl
iant
pa
rtner
ship
s to
be
deve
lope
d
•Ar
ticul
atio
n su
ppor
ted
to h
ighe
r le
vel q
ualif
icat
ion:
cre
dits
gai
ned
in
SASS
ETA
fund
ed p
rogr
amm
es to
co
unt t
owar
ds o
ther
car
eer r
elat
ed
qual
ifica
tions
•M
arke
ting
and
advo
cacy
cam
paig
n to
rais
e un
ders
tand
ing
of F
ET a
nd
HE o
fferin
gs to
mee
t ind
ustry
nee
ds
•Bu
rsar
y pr
oces
ses
stre
amlin
ed a
nd
mar
kete
d so
that
lear
ners
from
rura
l ar
eas
know
how
to a
cces
s th
em
•Im
prov
ed a
rticu
latio
n of
pr
ogra
mm
es•
Impr
oved
und
erst
andi
ng
of F
ET a
nd H
ET o
fferin
gs•
Impr
oved
pro
visi
on
of b
ursa
ries
to ru
ral
lear
ners
•Nu
mbe
r of l
earn
ers
artic
ulat
ing
from
FET
to
HET
pro
gram
mes
•Nu
mbe
r of l
earn
ers
acce
ssin
g bu
rsar
ies
Outp
ut 3
: Lea
rnin
g op
portu
nitie
s fo
r yo
uth
and
unem
-pl
oyed
gra
duat
es
are
open
ed u
p,
espe
cial
ly in
rura
l ar
eas
•Le
arni
ng o
ppor
tuni
ties
in s
carc
e sk
ills
area
s ar
e cr
eate
d fo
r you
th in
FE
TCs
and
HETs
in ru
ral a
reas
so
that
they
hav
e th
e sk
ills
to e
nter
the
labo
ur m
arke
t
•Un
empl
oyed
gra
duat
es a
re o
ffere
d ad
ditio
nal s
kills
in s
carc
e sk
ills
area
s to
ena
ble
them
to a
cces
s ec
onom
ic
oppo
rtuni
ties
•Le
arni
ng o
ppor
tuni
ties
for r
ural
You
ths
in F
ETCs
an
d HE
Ts c
reat
ed•
Reto
olin
g of
gra
duat
es
•Nu
mbe
r of
lear
ning
opp
ortu
ni-
ties
iden
tifie
d•
Num
ber o
f gra
du-
ates
reta
ined
•Qu
ality
of t
rain
ing
prov
ided
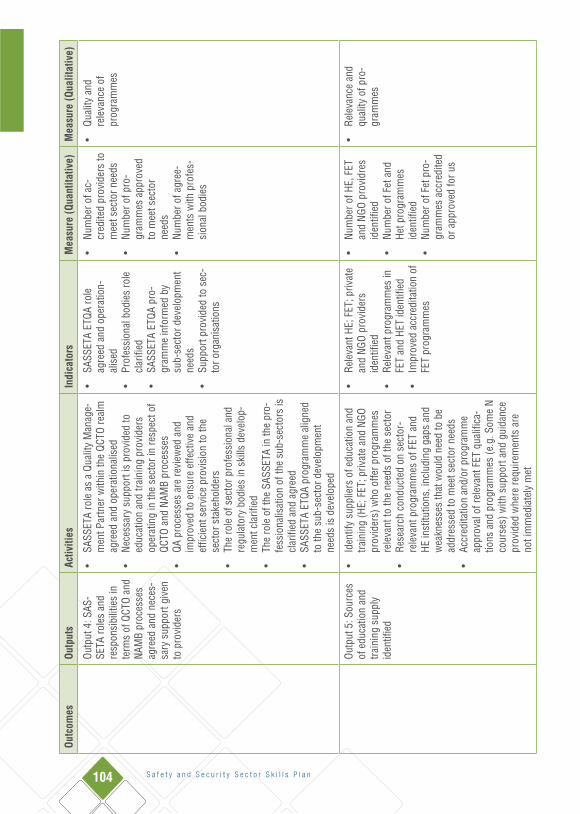
104 S a f e t y a n d S e c u r i t y S e c t o r S k i l l s P l a n
Outc
omes
Outp
uts
Activ
ities
Indi
cato
rsM
easu
re (Q
uant
itativ
e)M
easu
re (Q
ualit
ativ
e)
Outp
ut 4
: SAS
-SE
TA ro
les
and
resp
onsi
bilit
ies
in
term
s of
QCT
O an
d NA
MB
proc
esse
s ag
reed
and
nec
es-
sary
sup
port
give
n to
pro
vide
rs
•SA
SSET
A ro
le a
s a
Qual
ity M
anag
e-m
ent P
artn
er w
ithin
the
QCTO
real
m
agre
ed a
nd o
pera
tiona
lised
•
Nece
ssar
y su
ppor
t is
prov
ided
to
educ
atio
n an
d tra
inin
g pr
ovid
ers
oper
atin
g in
the
sect
or in
resp
ect o
f QC
TO a
nd N
AMB
proc
esse
s•
QA p
roce
sses
are
revi
ewed
and
im
prov
ed to
ens
ure
effe
ctiv
e an
d ef
ficie
nt s
ervi
ce p
rovi
sion
to th
e se
ctor
sta
keho
lder
s•
The
role
of s
ecto
r pro
fess
iona
l and
re
gula
tory
bod
ies
in s
kills
dev
elop
-m
ent c
larif
ied
•Th
e ro
le o
f the
SAS
SETA
in th
e pr
o-fe
ssio
nalis
atio
n of
the
sub-
sect
ors
is
clar
ified
and
agr
eed
•SA
SSET
A ET
QA p
rogr
amm
e al
igne
d to
the
sub-
sect
or d
evel
opm
ent
need
s is
dev
elop
ed
•SA
SSET
A ET
QA ro
le
agre
ed a
nd o
pera
tion-
alis
ed
•Pr
ofes
sion
al b
odie
s ro
le
clar
ified
•SA
SSET
A ET
QA p
ro-
gram
me
info
rmed
by
sub-
sect
or d
evel
opm
ent
need
s•
Supp
ort p
rovi
ded
to s
ec-
tor o
rgan
isat
ions
•Nu
mbe
r of a
c-cr
edite
d pr
ovid
ers
to
mee
t sec
tor n
eeds
•Nu
mbe
r of p
ro-
gram
mes
app
rove
d to
mee
t sec
tor
need
s•
Num
ber o
f agr
ee-
men
ts w
ith p
rofe
s-si
onal
bod
ies
•Qu
ality
and
re
leva
nce
of
prog
ram
mes
Outp
ut 5
: Sou
rces
of
edu
catio
n an
d tra
inin
g su
pply
id
entif
ied
•Id
entif
y su
pplie
rs o
f edu
catio
n an
d tra
inin
g (H
E; F
ET; p
rivat
e an
d NG
O pr
ovid
ers)
who
offe
r pro
gram
mes
re
leva
nt to
the
need
s of
the
sect
or•
Rese
arch
con
duct
ed o
n se
ctor
-re
leva
nt p
rogr
amm
es o
f FET
and
HE
inst
itutio
ns, i
nclu
ding
gap
s an
d w
eakn
esse
s th
at w
ould
nee
d to
be
addr
esse
d to
mee
t sec
tor n
eeds
•
Accr
edita
tion
and/
or p
rogr
amm
e ap
prov
al o
f rel
evan
t FET
qua
lific
a-tio
ns a
nd p
rogr
amm
es (e
.g. S
ome
N co
urse
s) w
ith s
uppo
rt an
d gu
idan
ce
prov
ided
whe
re re
quire
men
ts a
re
not i
mm
edia
tely
met
•Re
leva
nt H
E; F
ET; p
rivat
e an
d NG
O pr
ovid
ers
iden
tifie
d•
Rele
vant
pro
gram
mes
in
FET
and
HET
iden
tifie
d•
Impr
oved
acc
redi
tatio
n of
FE
T pr
ogra
mm
es
•Nu
mbe
r of H
E, F
ET
and
NGO
prov
idre
s id
entif
ied
•Nu
mbe
r of F
et a
nd
Het p
rogr
amm
es
iden
tifie
d•
Num
ber o
f Fet
pro
-gr
amm
es a
ccre
dite
d or
app
rove
d fo
r us
•Re
leva
nce
and
qual
ity o
f pro
-gr
amm
es

S a f e t y a n d S e c u r i t y S e c t o r S k i l l s P l a n 105
Outc
omes
Outp
uts
Activ
ities
Indi
cato
rsM
easu
re (Q
uant
itativ
e)M
easu
re (Q
ualit
ativ
e)
Outp
ut 4
: SAS
-SE
TA ro
les
and
resp
onsi
bilit
ies
in
term
s of
QCT
O an
d NA
MB
proc
esse
s ag
reed
and
nec
es-
sary
sup
port
give
n to
pro
vide
rs
•SA
SSET
A ro
le a
s a
Qual
ity M
anag
e-m
ent P
artn
er w
ithin
the
QCTO
real
m
agre
ed a
nd o
pera
tiona
lised
•
Nece
ssar
y su
ppor
t is
prov
ided
to
educ
atio
n an
d tra
inin
g pr
ovid
ers
oper
atin
g in
the
sect
or in
resp
ect o
f QC
TO a
nd N
AMB
proc
esse
s•
QA p
roce
sses
are
revi
ewed
and
im
prov
ed to
ens
ure
effe
ctiv
e an
d ef
ficie
nt s
ervi
ce p
rovi
sion
to th
e se
ctor
sta
keho
lder
s•
The
role
of s
ecto
r pro
fess
iona
l and
re
gula
tory
bod
ies
in s
kills
dev
elop
-m
ent c
larif
ied
•Th
e ro
le o
f the
SAS
SETA
in th
e pr
o-fe
ssio
nalis
atio
n of
the
sub-
sect
ors
is
clar
ified
and
agr
eed
•SA
SSET
A ET
QA p
rogr
amm
e al
igne
d to
the
sub-
sect
or d
evel
opm
ent
need
s is
dev
elop
ed
•SA
SSET
A ET
QA ro
le
agre
ed a
nd o
pera
tion-
alis
ed
•Pr
ofes
sion
al b
odie
s ro
le
clar
ified
•SA
SSET
A ET
QA p
ro-
gram
me
info
rmed
by
sub-
sect
or d
evel
opm
ent
need
s•
Supp
ort p
rovi
ded
to s
ec-
tor o
rgan
isat
ions
•Nu
mbe
r of a
c-cr
edite
d pr
ovid
ers
to
mee
t sec
tor n
eeds
•Nu
mbe
r of p
ro-
gram
mes
app
rove
d to
mee
t sec
tor
need
s•
Num
ber o
f agr
ee-
men
ts w
ith p
rofe
s-si
onal
bod
ies
•Qu
ality
and
re
leva
nce
of
prog
ram
mes
Outp
ut 5
: Sou
rces
of
edu
catio
n an
d tra
inin
g su
pply
id
entif
ied
•Id
entif
y su
pplie
rs o
f edu
catio
n an
d tra
inin
g (H
E; F
ET; p
rivat
e an
d NG
O pr
ovid
ers)
who
offe
r pro
gram
mes
re
leva
nt to
the
need
s of
the
sect
or•
Rese
arch
con
duct
ed o
n se
ctor
-re
leva
nt p
rogr
amm
es o
f FET
and
HE
inst
itutio
ns, i
nclu
ding
gap
s an
d w
eakn
esse
s th
at w
ould
nee
d to
be
addr
esse
d to
mee
t sec
tor n
eeds
•
Accr
edita
tion
and/
or p
rogr
amm
e ap
prov
al o
f rel
evan
t FET
qua
lific
a-tio
ns a
nd p
rogr
amm
es (e
.g. S
ome
N co
urse
s) w
ith s
uppo
rt an
d gu
idan
ce
prov
ided
whe
re re
quire
men
ts a
re
not i
mm
edia
tely
met
•Re
leva
nt H
E; F
ET; p
rivat
e an
d NG
O pr
ovid
ers
iden
tifie
d•
Rele
vant
pro
gram
mes
in
FET
and
HET
iden
tifie
d•
Impr
oved
acc
redi
tatio
n of
FE
T pr
ogra
mm
es
•Nu
mbe
r of H
E, F
ET
and
NGO
prov
idre
s id
entif
ied
•Nu
mbe
r of F
et a
nd
Het p
rogr
amm
es
iden
tifie
d•
Num
ber o
f Fet
pro
-gr
amm
es a
ccre
dite
d or
app
rove
d fo
r us
•Re
leva
nce
and
qual
ity o
f pro
-gr
amm
es
Outc
omes
Outp
uts
Activ
ities
Indi
cato
rsM
easu
re (Q
uant
itativ
e)M
easu
re (Q
ualit
ativ
e)
SO 5
: Exp
ande
d W
orkp
lace
Pro
visi
on
Mor
e le
arni
ng
oppo
rtuni
ties
for t
he y
outh
an
d un
empl
oyed
gr
adua
tes
are
open
ed u
p in
the
sect
or in
clud
-in
g ut
ilizi
ng th
e pu
blic
sec
tor a
s a
train
ing
spac
e
Outp
ut 1
: Wor
k-pl
ace
lear
ning
an
d ex
perie
nce
oppo
rtuni
ties
iden
tifie
d in
the
SIPs
and
stra
te-
gies
dev
elop
ed
to p
lace
lear
ners
•An
alys
is c
ondu
cted
of a
ll SI
Ps a
nd in
terfa
ces
with
the
safe
ty a
nd s
ecur
ity s
ecto
r ide
ntifi
ed
•In
ter-
seta
col
labo
ratio
n to
dev
elop
key
mes
-sa
ges
and
proc
esse
s ar
ound
ski
lls d
evel
opm
ent
put i
n pl
ace
with
cle
ar g
uide
lines
•Op
portu
nitie
s fo
r lea
rnin
g an
d w
orkp
lace
exp
eri-
ence
iden
tifie
d
•Le
ad d
epar
tmen
ts fo
r the
impl
emen
tatio
n of
the
SIPs
iden
tifie
d an
d en
gage
d to
ens
ure
that
ski
lls
deve
lopm
ent r
equi
rem
ents
are
add
ress
ed a
nd
mai
nstre
amed
dur
ing
proc
urem
ent p
roce
sses
•Re
leva
nt S
IPS
for t
he s
ecto
r id
entie
d •
Clar
ity o
f gu
idel
ines
for
colla
bora
tion
•Op
portu
nitie
s fo
r lea
rnin
g m
axim
ised
•M
ains
tream
ing
of s
kills
dev
elop
-m
ent i
n SI
PS
•Nu
mbe
r of r
elev
ant
SIPs
iden
tifie
d•
Num
ber o
f lea
rn-
ing
oppo
rtuni
ties
iden
tifie
d
•Qu
ality
of g
uide
-lin
es d
evel
oped
•Fl
uidi
ty o
f pro
cure
-m
ent p
roce
sses
to
mai
nstre
am s
kills
de
velo
pmen
t
Outp
ut 2
: Wor
k-pl
ace
lear
ning
an
d ex
perie
nce
oppo
rtuni
ties
iden
tifie
d in
ru
ral a
nd u
rban
ar
eas
•W
orkp
lace
trai
ning
and
exp
erie
nce
plac
emen
t op
portu
nitie
s id
entif
ied
in e
ach
sub-
sect
or
incl
udin
g w
ork
inte
grat
ed le
arni
ng o
ppor
tuni
ties
for s
tude
nts
and
wor
k ex
perie
nce
oppo
rtuni
-tie
s fo
r lec
ture
rs –
FET
col
lege
s an
d te
chno
logy
di
plom
as
•Un
empl
oyed
gra
duat
es id
entif
ied
and
plac
ed
for e
xper
ient
ial l
earn
ing
oppo
rtuni
ties
in s
carc
e sk
ills
occu
patio
ns
•Co
ache
s, m
ento
rs a
nd w
orkp
lace
ass
esso
rs
train
ed to
enh
ance
exp
erie
ntia
l lea
rnin
g an
d cr
edit
wor
kpla
ce le
arni
ng
•PI
VOTA
L an
d ot
her g
rant
s m
ade
avai
labl
e to
su
ppor
t exp
erie
ntia
l lea
rnin
g op
portu
nitie
s
•W
orkp
lace
lear
ning
and
exp
erie
nce
mon
itore
d an
d im
prov
ed to
enh
ance
com
pete
nce
•Pl
acem
ent o
f le
arne
rs in
w
orkp
lace
s•
Plac
emen
t of
grad
uate
s fo
r ex
perie
ntia
l le
arni
ng•
Trai
ning
of m
en-
tors
and
coa
ches
•Gr
ants
pro
vide
d fo
r lea
rnin
g•
Enha
nced
co
mpe
tenc
e of
le
arne
rs
•Nu
mbe
r of l
earn
ers
plac
ed•
Num
ber o
f gra
du-
ates
pla
ced
•Nu
mbe
r of m
ento
rs
train
ed•
Num
ber o
f gra
nts
prov
ided
•Nu
mbe
r of l
earn
ers
com
pete
nt
•Su
stai
nabi
lity
of
jobs
•Pl
acem
ent i
n sc
arce
ski
lls a
reas
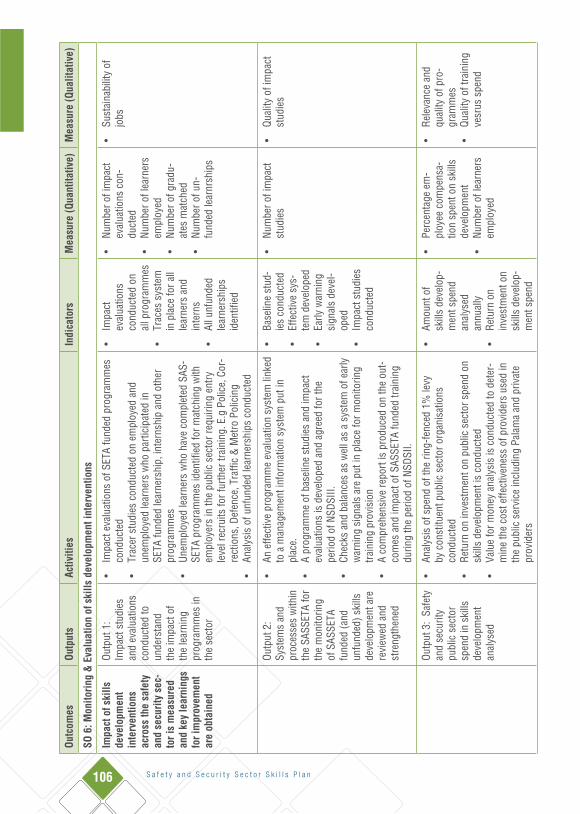
106 S a f e t y a n d S e c u r i t y S e c t o r S k i l l s P l a n
Outc
omes
Outp
uts
Activ
ities
Indi
cato
rsM
easu
re (Q
uant
itativ
e)M
easu
re (Q
ualit
ativ
e)
SO 6
: Mon
itorin
g &
Eva
luat
ion
of s
kills
dev
elop
men
t int
erve
ntio
ns
Impa
ct o
f ski
lls
deve
lopm
ent
inte
rven
tions
ac
ross
the
safe
ty
and
secu
rity
sec-
tor i
s m
easu
red
and
key
lear
ning
s fo
r im
prov
emen
t ar
e ob
tain
ed
Outp
ut 1
: Im
pact
stu
dies
an
d ev
alua
tions
co
nduc
ted
to
unde
rsta
nd
the
impa
ct o
f th
e le
arni
ng
prog
ram
mes
in
the
sect
or
•Im
pact
eva
luat
ions
of S
ETA
fund
ed p
rogr
amm
es
cond
ucte
d •
Trac
er s
tudi
es c
ondu
cted
on
empl
oyed
and
un
empl
oyed
lear
ners
who
par
ticip
ated
in
SETA
fund
ed le
arne
rshi
p, in
tern
ship
and
oth
er
prog
ram
mes
•
Unem
ploy
ed le
arne
rs w
ho h
ave
com
plet
ed S
AS-
SETA
pro
gram
mes
iden
tifie
d fo
r mat
chin
g w
ith
empl
oyer
s in
the
publ
ic s
ecto
r req
uirin
g en
try
leve
l rec
ruits
for f
urth
er tr
aini
ng. E
.g P
olic
e, C
or-
rect
ions
, Def
ence
, Tra
ffic
& M
etro
Pol
icin
g•
Anal
ysis
of u
nfun
ded
lear
ners
hips
con
duct
ed
•Im
pact
ev
alua
tions
co
nduc
ted
on
all p
rogr
amm
es•
Trac
es s
yste
m
in p
lace
for a
ll le
arne
rs a
nd
inte
rns
•Al
l unf
unde
d le
arne
rshi
ps
iden
tifie
d
•Nu
mbe
r of i
mpa
ct
eval
uatio
ns c
on-
duct
ed•
Num
ber o
f lea
rner
s em
ploy
ed•
Num
ber o
f gra
du-
ates
mat
ched
•Nu
mbe
r of u
n-fu
nded
lear
nrsh
ips
•Su
stai
nabi
lity
of
jobs
Outp
ut 2
: Sy
stem
s an
d pr
oces
ses
with
in
the
SASS
ETA
for
the
mon
itorin
g of
SAS
SETA
fu
nded
(and
un
fund
ed) s
kills
de
velo
pmen
t are
re
view
ed a
nd
stre
ngth
ened
•An
effe
ctiv
e pr
ogra
mm
e ev
alua
tion
syst
em li
nked
to
a m
anag
emen
t inf
orm
atio
n sy
stem
put
in
plac
e.•
A pr
ogra
mm
e of
bas
elin
e st
udie
s an
d im
pact
ev
alua
tions
is d
evel
oped
and
agr
eed
for t
he
perio
d of
NSD
SIII.
•
Chec
ks a
nd b
alan
ces
as w
ell a
s a
syst
em o
f ear
ly
war
ning
sig
nals
are
put
in p
lace
for m
onito
ring
train
ing
prov
isio
n•
A co
mpr
ehen
sive
repo
rt is
pro
duce
d on
the
out-
com
es a
nd im
pact
of S
ASSE
TA fu
nded
trai
ning
du
ring
the
perio
d of
NSD
SII.
•Ba
selin
e st
ud-
ies
cond
ucte
d•
Effe
ctiv
e sy
s-te
m d
evel
oped
•Ea
rly w
arni
ng
sign
als
deve
l-op
ed•
Impa
ct s
tudi
es
cond
ucte
d
•Nu
mbe
r of i
mpa
ct
stud
ies
•Qu
ality
of i
mpa
ct
stud
ies
Outp
ut 3
: Sa
fety
an
d se
curit
y pu
blic
sec
tor
spen
d in
ski
lls
deve
lopm
ent
anal
ysed
•An
alys
is o
f spe
nd o
f the
ring
-fenc
ed 1
% le
vy
by c
onst
ituen
t pub
lic s
ecto
r org
anis
atio
ns
cond
ucte
d •
Retu
rn o
n in
vest
men
t on
publ
ic s
ecto
r spe
nd o
n sk
ills
deve
lopm
ent i
s co
nduc
ted
•Va
lue
for m
oney
ana
lysi
s is
con
duct
ed to
det
er-
min
e th
e co
st e
ffect
iven
ess
of p
rovi
ders
use
d in
th
e pu
blic
ser
vice
incl
udin
g Pa
lam
a an
d pr
ivat
e pr
ovid
ers
•Am
ount
of
skill
s de
velo
p-m
ent s
pend
an
alys
ed
annu
ally
•Re
turn
on
inve
stm
ent o
n sk
ills
deve
lop-
men
t spe
nd
•Pe
rcen
tage
em
-pl
oyee
com
pens
a-tio
n sp
ent o
n sk
ills
deve
lopm
ent
•Nu
mbe
r of l
earn
ers
empl
oyed
•Re
leva
nce
and
qual
ity o
f pro
-gr
amm
es•
Qual
ity o
f tra
inin
g ve
srus
spe
nd

S a f e t y a n d S e c u r i t y S e c t o r S k i l l s P l a n 107
Addendum 1: Alignment of SSP with Strategic Plan
As highlighted in the foreword, a concerted effort has been made to align the SETA Strategic Plan and its SSP. While the sector skills plan is essentially the skills development strategy for the sector, the strategic plan is focused on the requirements that the SETA has to deliver against the SSP. It is important to understand that even though the documents are aligned, they serve different pur-poses. For example, while the SSP may deal broadly with the issue of quality education and training across the sector, the SETA in the strategic plan focusses their attention on the public FET and HEIs as well as rural reach to achieve this. The attached Strategic Plan (Annexure A) depicts the said alignment in that all the strategic oriented goals and strategic objectives are directly linked to the SSP skills demands and NSDS III imperatives.
NO. Strategic Goal: Strategic Plan
Strategic Plan Goal Statement Alignment with SSP
1 A credible institutional mechanism for skills Planning
A credible institutional mechanism for skills Planning within the safety and security sector established within 5 years.
Strategic Objective 1: Safety and Security Sector institutional mechanism for skills planning developed
2 FET Colleges & Universities that are responsive to the needs of the sector.
Increased growth and capacity of FET colleges to provide relevant programmes within the sector
Strategic Objective 4: Qual-ity education and training provision. Includes outputs dealing with FET colleges and universities
3 Employability of youth in the sector
Empowerment of youth with skills development opportunities enabling them to be marketable in the labour market
Opportunities for the youth is a common theme across strategic objectives 3,4, and 5
4 Skilled and productive workforce in the safety and security sector
Enhanced productivity in the safety and security sector through imple-mentation of skills development interventions
Strategic Objective 3: improved supply of scarce and critical skills
5 Optimal capacitated SMMEs, Trade Unions, CBOs, CBCs and NGOs in the safety and security sector
Improved skills targeting identified skills needs for cooperatives, small business, Unions, NGOs and CBO to fulfill and sustain their mandate.
Output 4 under strategic objective 3 deals spe-cifically with cooperatives, small business, Unions, NGOs and CBOs.
6 Improved skills development service in the sector
Effective and efficient service delivery through Corporate Governance and Institutional Capacity by 2015
Aligned with strategic objective 6, which deals with monitoring and evalu-ation as well as supporting the achievement of all the other strategic objectives.
Safety and SecuritySector Skills Plan
2012 – 2016SASSETA ContactsTelephone Numbers:Call Centre: 086 110 2477Fax Number: 27 (0) 11 805 6630Switchboard: 27 (0)11 347 0200E-Mail: [email protected]
Physical Address:Riverview Office Park, Janadel Avenue (off Bekker Road), Halfway Gardens Midrand, 1685
Postal Address:P.O. Box 7612, Halfway House, 1685
0800 20 50 61
higher education& trainingDepartment:Higher Education and Training