Embed Size (px)
Citation preview

This document contains certain forward-looking statements based on current expectations of Indiabulls Housing Finance Ltd.’s [CIN: L65922DL2005PLC136029] management. Actual results may vary significantly from the forward-looking statements in this document due to various risks and uncertainties. These risks and uncertainties include the effect of economic and political conditions in India, and outside India; volatility in interest rates and in the securities markets; new regulations and government policies that might impact the business of Indiabulls Housing Finance Ltd.; the general state of the Indian economy; and the management’s ability to implement the company’s strategy. Indiabulls Housing Finance Ltd. doesn’t undertake any obligation to update these forward-looking statements.
This document does not constitute an offer or recommendation to buy or sell any securities of Indiabulls Housing Finance Ltd. or any of its subsidiaries or associate companies. This document also doesn’t constitute an offer or recommendation to buy or sell any financial products offered by Indiabulls Housing Finance Ltd.
Investor Contact Media Contact
Ramnath Shenoy Rahat Ahmed
[email protected] [email protected]
+91 22 6189 1444 +91 22 6189 1155
2
Safe Harbour Statement

3
Pg. No.
1. Business Update 04
2. Indian Home Loans Market 08
3. Financial and Operational Highlights 20
4. Home Loans Distribution Model 32
5. LAP Grading 39
6. Static Credit Performance Analysis of LAP and HL Pools 45
7. Liabilities Profile 52
8. Corporate Social Responsibility 58
9. Board of Directors, Ratings, Business Value Proposition, Key Ratios, Valuations and Shareholding 60
10. Detailed Financials 68
11. Update on OakNorth Bank 71
Contents

4
Business Update

Our Journey
5
2000: Started as an NBFC
• Mortgage finance focused growth plan. Home loans to prime salaried segments, Retail mortgage constitutes 70% of loan book
• In-house sales team ramped up to over 1,000 employees • Credit rating upgraded to AA • Balance sheet crosses ₹ 200 Bn, RoE : 17%
• Credit rating upgraded to AA+ • PAT crosses ₹ 10 Bn • Balance sheet crosses ₹ 300 Bn, RoE: 22%
• Credit rating of AA- • Loan book crosses ₹ 100 Bn • Exit from unsecured personal and business loans
2008
2004-06: IPO and listing, Multi-product lending: Launched secured mortgage and commercial vehicle loans
2009-11
14.1
105.06
2012-13
48.1
2011-12 64.2
84.6
• Conversion to HFC • India’s 3rd largest HFC by size • PAT ₹12.7 Bn, RoE: 26%
2014-15
• Credit rating upgraded to AAA [CARE and Brickworks] • Gross disbursements cross ₹ 1,000 Bn • Balance sheet: ₹ 572.3 Bn, PAT: ₹ 19.0 Bn • RoE: 29%
198.4
2015-16
• Balance sheet: ₹ 764.4 Bn, PAT: ₹ 23.4 Bn • ₹ 40 Bn raised through QIP issue • Net worth: ₹ 107 Bn
283.9
2016-17
422.9
• Balance sheet: ₹ 1.04 Tn.; Net worth: ₹ 121 Bn • Launched India’s first digital home loans platform:
eHome Loans • IBHFL included in Nifty50 index
2017-18
480.5*
• Credit rating upgraded to AAA by CRISIL [a Standard & Poor’s Company] and ICRA [a Moody’s Company]
• Balance sheet: ₹ 1.32 Tn • PAT: ₹ 38.5 Bn, RoE: 30%
IPO: Initial Public Offering; QIP: Qualified Institutional Placement; HFC: Housing Finance Company; NBFC: Non- Banking Financial Company
Market Cap
[₹ Bn]
* As on 13th July, 2018

Business Update
6
Key Financial Highlights: FY 17-18
FY 17-18 FY 16-17 YoY
Growth [%] Balance Sheet [₹ Bn] 1,319.03 1,037.05 27.2% Loan Assets [₹ Bn] 1,225.78 913.01 34.3%
Total Revenues [₹ Bn] 146.40 117.02 25.1% NII [₹ Bn] 57.85 47.68 21.3%
PAT [₹ Bn] 38.47 29.06 32.4%
EPS [₹] 90.51 68.80 31.6%

Focus on prime, mid-income customer segment with steadily rising disposable incomes
Consumer focused scalable lending model
Focus on customer acquisition rather than single-loan relationship Strong fee generation opportunities through distribution of risk-cover and investment products
Product suite spanning home loans and other mortgage loans to individuals and businesses Demonstrated track of sustained 3%+ spreads and RoEs of 25%+
Technology leadership Analytics and technology-led innovation to deliver superior customer experience along with enhanced
earning opportunities and operating efficiencies
7
Unique Franchise in Indian Mortgage Market
Strengths similar to Banks
• Access to deep pools of capital: debt and equity • Funding efficiencies from highest AAA credit rating • Evolved regulations, processes and risk management practices
Scalability of Mortgage
• Focused on the most scalable and secure asset class: Home Loans • India’s mortgage-to-GDP of only 9.7% • China’s mortgage market is 14x that of India’s while its GDP is
only 5x

8
Indian Home Loans Market
Indian Housing Landscape
9
9.7% 17% 26% 26% 29%
41%
81% 88%
India Thailand Korea China Malaysia Hong Kong USA UK
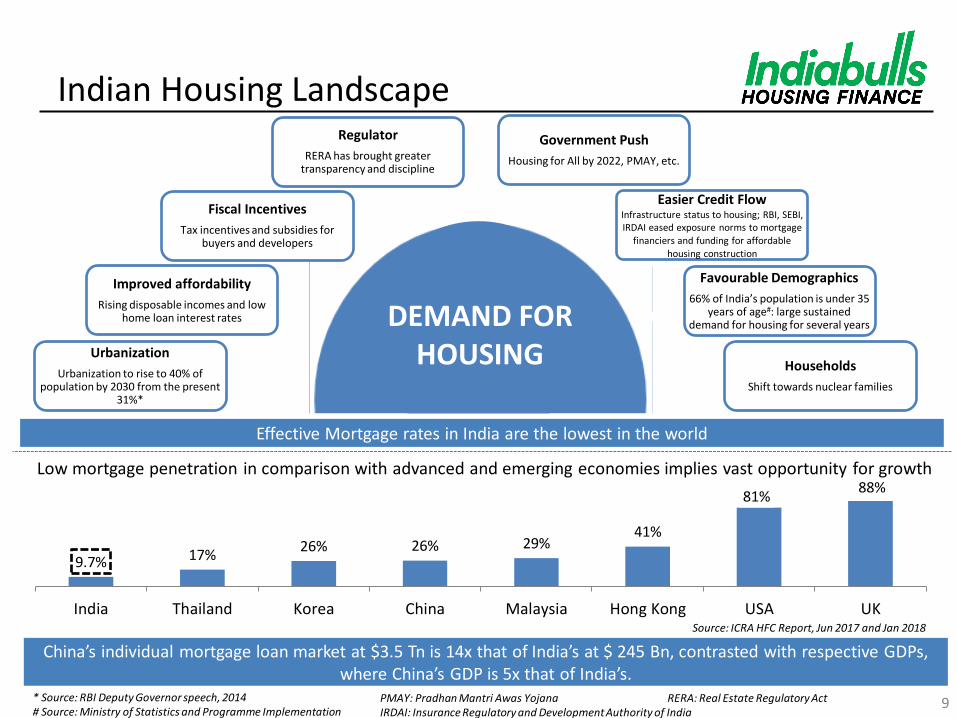
Urbanization
Urbanization to rise to 40% of population by 2030 from the present
31%*
Improved affordability
Rising disposable incomes and low home loan interest rates
Fiscal Incentives
Tax incentives and subsidies for buyers and developers
Regulator
RERA has brought greater transparency and discipline
Government Push
Housing for All by 2022, PMAY, etc.
Easier Credit Flow Infrastructure status to housing; RBI, SEBI, IRDAI eased exposure norms to mortgage
financiers and funding for affordable housing construction
Favourable Demographics
66% of India’s population is under 35 years of age#: large sustained
demand for housing for several years
Households
Shift towards nuclear families
* Source: RBI Deputy Governor speech, 2014 # Source: Ministry of Statistics and Programme Implementation
Low mortgage penetration in comparison with advanced and emerging economies implies vast opportunity for growth
DEMAND FOR HOUSING
Source: ICRA HFC Report, Jun 2017 and Jan 2018
PMAY: Pradhan Mantri Awas Yojana RERA: Real Estate Regulatory Act IRDAI: Insurance Regulatory and Development Authority of India
Effective Mortgage rates in India are the lowest in the world
China’s individual mortgage loan market at $3.5 Tn is 14x that of India’s at $ 245 Bn, contrasted with respective GDPs, where China’s GDP is 5x that of India’s.
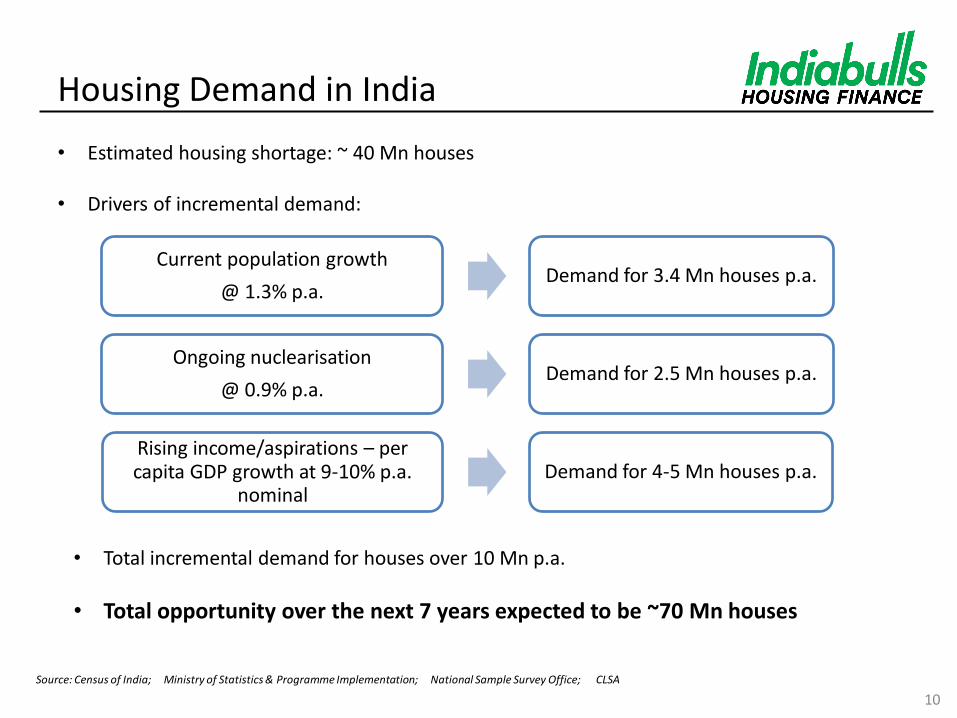
Rising income/aspirations – per capita GDP growth at 9-10% p.a.
nominal Demand for 4-5 Mn houses p.a.
Housing Demand in India
10
• Estimated housing shortage: ~ 40 Mn houses
• Drivers of incremental demand:
Current population growth
@ 1.3% p.a. Demand for 3.4 Mn houses p.a.
• Total incremental demand for houses over 10 Mn p.a.
• Total opportunity over the next 7 years expected to be ~70 Mn houses
Ongoing nuclearisation
@ 0.9% p.a. Demand for 2.5 Mn houses p.a.
Source: Census of India; Ministry of Statistics & Programme Implementation; National Sample Survey Office; CLSA
Housing: From Social Objective to Centrepiece Economic Policy
11
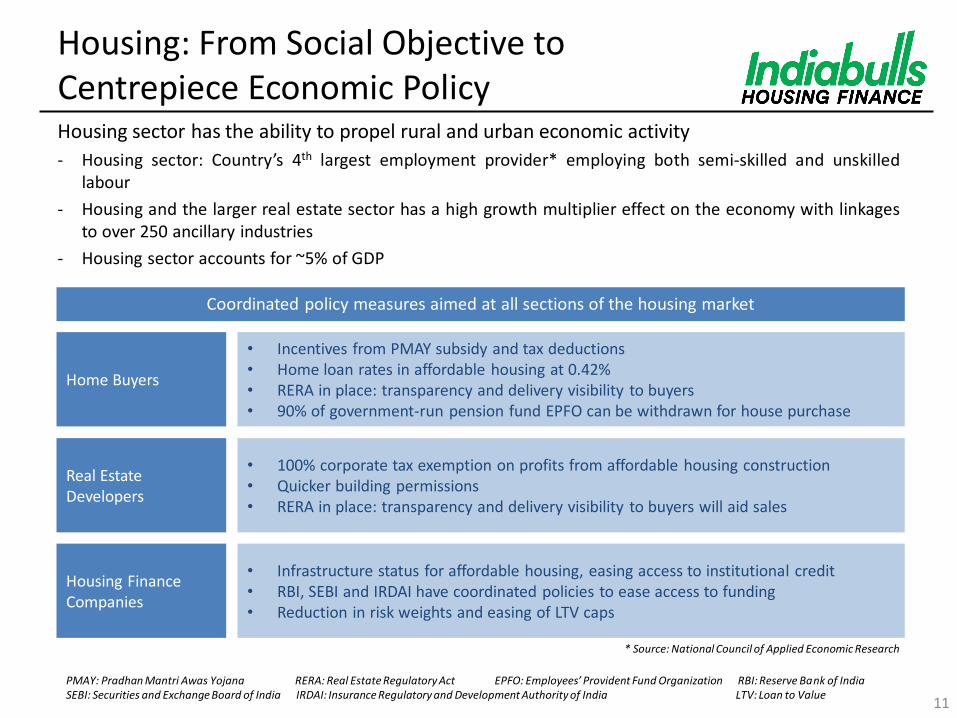
Housing sector has the ability to propel rural and urban economic activity
- Housing sector: Country’s 4th largest employment provider* employing both semi-skilled and unskilled labour
- Housing and the larger real estate sector has a high growth multiplier effect on the economy with linkages to over 250 ancillary industries
- Housing sector accounts for ~5% of GDP
* Source: National Council of Applied Economic Research
• Incentives from PMAY subsidy and tax deductions • Home loan rates in affordable housing at 0.42% • RERA in place: transparency and delivery visibility to buyers • 90% of government-run pension fund EPFO can be withdrawn for house purchase
Home Buyers
• Infrastructure status for affordable housing, easing access to institutional credit • RBI, SEBI and IRDAI have coordinated policies to ease access to funding • Reduction in risk weights and easing of LTV caps
Housing Finance Companies
• 100% corporate tax exemption on profits from affordable housing construction • Quicker building permissions • RERA in place: transparency and delivery visibility to buyers will aid sales
Real Estate Developers
Coordinated policy measures aimed at all sections of the housing market
PMAY: Pradhan Mantri Awas Yojana RERA: Real Estate Regulatory Act EPFO: Employees’ Provident Fund Organization RBI: Reserve Bank of India SEBI: Securities and Exchange Board of India IRDAI: Insurance Regulatory and Development Authority of India LTV: Loan to Value

12
Years Opening Loan
Principal Interest Payment
[@ 8.50%]
Principal Repayment [pre-payment at least up till ₹ 150,000
p.a. to maximise tax benefit]
Tax Saved* Net Amount Paid [Net of Tax Savings]
1 2,169,844 182,780 150,000 102,829 229,951
2 2,019,844 169,521 150,000 98,732 220,789
3 1,869,844 156,263 150,000 94,635 211,628
4 1,719,844 143,004 150,000 90,538 202,466
5 1,569,844 129,746 150,000 86,441 193,305
6 1,419,844 116,487 150,000 82,344 184,143
7 1,269,844 103,228 150,000 78,248 174,980
8 1,119,844 89,970 150,000 74,151 165,819
9 969,844 76,711 150,000 70,054 156,657
10 819,844 63,452 162,513 65,957 160,008
11 657,332 49,088 176,877 61,518 164,447
12 480,455 33,453 192,512 56,687 169,278
13 287,943 16,437 209,528 51,429 174,536
14 78,415 1,474 78,415 24,686 55,203
Total 1,331,614 2,169,844 1,038,249 2,463,209
* Tax saved = 30.90% of [interest paid up to ₹ 250,000 + principal paid up to ₹ 150,000] Effective Interest Rate
on Home Loan 0.42% p.a.
Illustration for Indiabulls Housing’s average Home Loan
- House value : ₹ 3,500,000 - Home loan amount : ₹ 2,400,000 [Loan to value of 70%] - PMAY subsidy : ₹ 230,156 - Net loan amount : ₹ 2,169,844
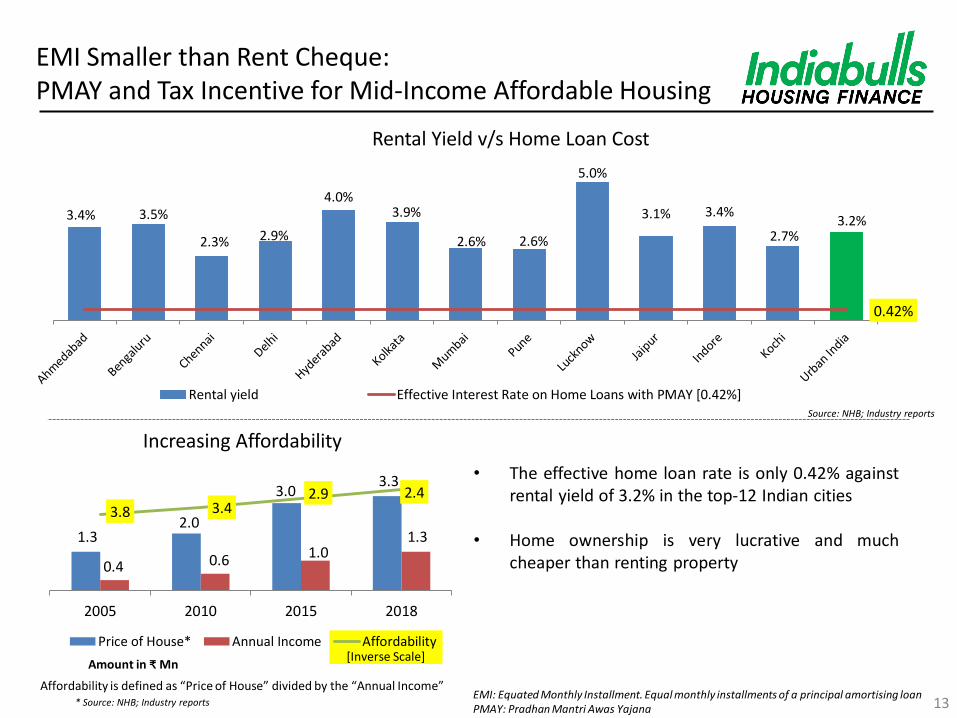
PMAY and Tax Incentives for Mid-Income Affordable Housing
• Interest subsidy benefit under PMAY scheme extended by up till March 2019
PMAY: Pradhan Mantri Awas Yojana; [Amounts in ₹]
[Inverse Scale]
1.3 2.0
3.0 3.3
0.4 0.6 1.0 1.3
3.8 3.4 2.9 2.4
2005 2010 2015 2018
Price of House* Annual Income Affordability
3.4% 3.5%
2.3% 2.9%
4.0% 3.9%
2.6% 2.6%
5.0%
3.1% 3.4%
2.7% 3.2%
0.42%
Rental yield Effective Interest Rate on Home Loans with PMAY [0.42%]
13
• The effective home loan rate is only 0.42% against
rental yield of 3.2% in the top-12 Indian cities
• Home ownership is very lucrative and much cheaper than renting property
Rental Yield v/s Home Loan Cost
Increasing Affordability
* Source: NHB; Industry reports
Source: NHB; Industry reports
Affordability is defined as “Price of House” divided by the “Annual Income”
Amount in ₹ Mn
EMI Smaller than Rent Cheque: PMAY and Tax Incentive for Mid-Income Affordable Housing
EMI: Equated Monthly Installment. Equal monthly installments of a principal amortising loan PMAY: Pradhan Mantri Awas Yajana

33% 34% 36% 37%
38% 39% 40%
40% 42%
17%
22%
18% 16%
13% 11% 11%
7%
11%
Mar-10 Mar-11 Mar-12 Mar-13 Mar-14 Mar-15 Mar-16 Mar-17 Mar-18
Banks' Share HFCs' Share System Credit Growth
Mortgage Market Growth
Source: RBI Database, NHB Reports & Industry Estimates
Growing HFC Market Share in a Steadily Expanding Home Loans Market
ICRA expects banks to grow by 13-15% and HFCs to grow at 23-25%
- ICRA’s report of Mar 2018 states that mortgage penetration has increased steadily from ~7% as on March 31st, 2007 to ~10%
- Housing finance market to double over the next 5 years, pushing mortgage penetration levels up by around 300-500 bps
- HFCs reported a 24% YoY growth for the year ended Mar 18 [20% in FY17]
- GNPA of HFC’s home loan portfolios stable at 0.7%, while that of total portfolio reduced to 1.1% in Mar 18 from 1.2% in Dec 17
HFC CAGR: 21%
18%
[Amounts in ₹ Bn]
4,595 5,538 6,249
8,887 7,526
17% CAGR
12,384
16,750
14
14,405
10,650

Strong Growth in Mid-Income Affordable Housing
15
• Affordable housing sales registers huge momentum in top eight cities across sub-categories
- Residential sales in sub ₹ 3.0 Mn category saw a jump of 33% YoY in H2CY171
- Share of sub ₹ 3.0 Mn category housing in overall residential sales increased to 27% in H2CY17 from 24% in H2CY161
- Residential sales in MMR and NCR-Delhi market grew by 32% and 28% YoY respectively in H2CY171
• Traction in launches of mid-income affordable housing segment
- 44% of launches in CY17 were in the affordable housing category with houses priced under ₹ 4.0 Mn3
- Launches in mid and affordable segment continued its domination in Q4FY18, with 74% of units launched at a price tag of under ₹ 8.0 Mn3
1: Liases Foras Q3FY18 Residential Report, 2018 2: FICCI Report 2018: State of Low-income Housing Finance Market 3: Anarock Report, 2018

Growth Momentum in Residential Real Estate
• Property price inflation remained at low single-digits across top 8 cities5
• Average price of housing units in most cities are now inching closer or below the Knight Frank Affordability Benchmark of 4.5 times the annual household income2
• Bengaluru witnessed a 45% spike in demand for premium residential units4
• Uptick in HIG sales was driven by Mumbai and NCR registering over 20% YoY growth in H2CY175
• Housing sales across top eight Indian cities recorded a 13% jump in FY18, vs 5% last year1 ‒ MMR – 25%, Delhi-NCR – 19%, Hyderabad – 17%
• Sales in top 7 cities rose 24% in Q2CY18 over Q1CY18 • Time required to sell unsold inventory has reduced by 6 months in Q3FY18, compared
with Q4FY172
• Launches up ~50% in Q2CY18 over Q1CY183 • Share of Tier I developers in Q4FY18 increased to 40% from 35% in Q3FY18, increasing
share of organized developers 1
HL: Home Loans HIG: High Income Group
Launches
Premium Market Uptick
Increasing Affordability
Sales Pick-up
16 1: Liases Foras Report, 2018 2 :Knight Frank, 2018 3: Anarock Report, 2018 4: ET Article, Sep 17 5: Liases Foras Q3FY18 Residential Report, 2018

Commercial Office Space Absorption
1: CBRE India Office Q1CY18, 2018 2: JLL Report, Feb 18 3: CRISIL 4: Knight Frank 5: Cushman & Wakefield, Jan18
• Leasing activity grew 25% YoY in Q1CY18 with 10.8 million sq. ft. leased1 • Tech corporates, BFSI sector and e-commerce contributed to 64% of the leasing2
• Office space addition grew 3x YoY to 9.7 million sq. ft. during Q1CY181
• Supply in top 8 Indian cities estimated to grow by 15% CAGR from 2017-202
• Rents saw appreciation in most major markets with growth of 5% YoY3
• Rentals expected to grow between 5%–8% YoY in high demand micro–markets of top 8 cities2
• Overall office space vacancy in India at 10-year low in CY174 • Key Indian IT hubs such as Bengaluru, Pune and Hyderabad have vacancy in mid-single digit
levels 4
• Private equity investments in real estate reached a 9-year high to ₹ 428 Bn in CY175
• PE investment in office sector grew three-fold to ₹ 132 Bn in CY17 from ₹ 40 Bn in CY165
Low Vacancy
Pick-up in Leasing
Addition in Supply
PE Funding
Increasing Rentals
17

Subsidy eligibility under Pradhan Mantri Awas Yojana [PMAY] covers up to ₹ 12 lakh of home loan – reduces effective home loan rates to 0.42% for mid-income affordable housing
Pradhan Mantri Awas Yojana [PMAY]
Tax Incentives Increased tax incentives and PMAY subsidies reduces effective home loan yields to 0.42% for a 8.50% home loan 100% tax exemption on profits from construction of affordable housing will attract organized developers and increase supply
Budget 2016-17
Favorable Demographics
66% of India’s population is under 35 years of age. Urban housing requirement estimated to grow to 45 million units by 2022
Urbanisation to rise to 40% of population by 2030 from the present 31% Accelerating Urbanization
Improving Affordability
Rising disposable income, low housing loan interest rates and tepid property price inflation resulting in rapidly increasing affordability Housing for All by 2022; Smart cities plan; Atal Mission for Rejuvenation and Urban Transformation; Pradhan Mantri Awas Yojana [PMAY]
Government Policy Thrust
Funding Drivers RBI, SEBI and IRDAI – regulatory focus on increasing funding avenues to HFCs; Distribution tax on securitization abolished
Measures in the last 24 months: Boost to the Housing Sector
Key Structural Drivers of Housing Growth
PMAY projects to be out of purview of GST. Service tax exemption on construction of affordable housing projects will lead to reduction in prices, increasing affordability
Fiscal Incentives
Regulator Real Estate [Regulatory & Development] Act, 2016 enables a structured, transparent and disciplined sector
Strong Structural Drivers and Government Focus
EPF Corpus Withdrawal
Homebuyers can withdraw from their accumulated EPF corpus for both the down payment on their house as well as for paying their home loan EMIs
EPF: Employees’ Provident Fund SEBI: The Securities and Exchange Board of India GST: Goods and Services Tax IRDA:I Insurance Regulatory and Development Authority of India RBI: The Reserve Bank of India 18

• HFCs are regulated by National Housing Bank [NHB], a wholly owned subsidiary of the Reserve Bank of
India [RBI]
• New regulatory guidelines are uniformly applied to both banks and HFCs
No Regulatory Arbitrage: Regulatory Regime for HFCs at par with Banks
SI: Systemically Important; dpd : days past due 19
Parameters HFCs Banks
NPA Recognition 90 dpd 90 dpd
CRAR 12% 9%
- Tier 1 6% 6%
Standard Asset Provisions
Housing Loans 0.4%
[0.25% incrementally]
0.4% [0.25% incrementally]
Others 1% 0.25-1%
SARFAESI Coverage Yes Yes
20
Financial and Operational Highlights
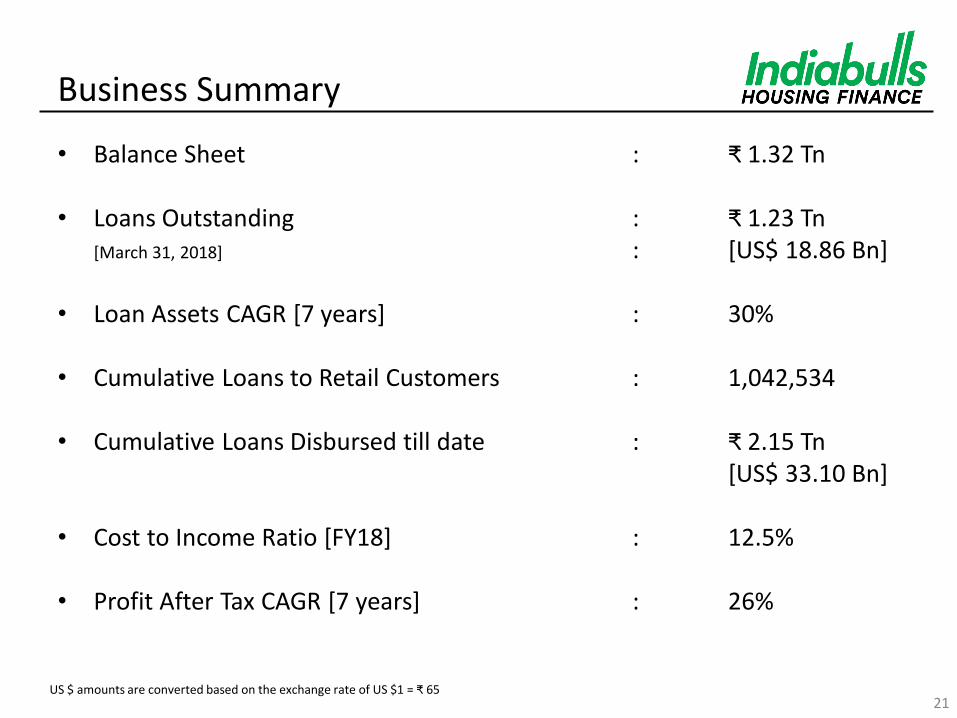
Business Summary
• Balance Sheet : ₹ 1.32 Tn
• Loans Outstanding : ₹ 1.23 Tn [March 31, 2018] : [US$ 18.86 Bn]
• Loan Assets CAGR [7 years] : 30% • Cumulative Loans to Retail Customers : 1,042,534 • Cumulative Loans Disbursed till date : ₹ 2.15 Tn [US$ 33.10 Bn]
• Cost to Income Ratio [FY18] : 12.5%
• Profit After Tax CAGR [7 years] : 26%
21 US $ amounts are converted based on the exchange rate of US $1 = ₹ 65

7.51 10.06 12.66 15.69 19.01 23.45
29.06
38.47
FY 11 FY12 FY13 FY14 FY15 FY16 FY17 FY18
13 15 19 24 30
38 48
58
FY11 FY12 FY13 FY14 FY15 FY16 FY17 FY18
253 322 391 444 572
764
1,037
1,319
Mar-11 Mar-12 Mar-13 Mar-14 Mar-15 Mar-16 Mar-17 Mar-18
22
25 38 48
59 73
92
117
146
FY11 FY12 FY13 FY14 FY15 FY16 FY17 FY18
CAGR: 27%
Amounts in ₹ Bn
Consistent Track Record
198 275 344 412 522
687 913
1,226
Mar-11 Mar-12 Mar-13 Mar-14 Mar-15 Mar-16 Mar-17 Mar-18
Balance Sheet
CAGR: 30%
Loan Assets
CAGR: 29%
Revenue
CAGR: 24%
NII
CAGR: 26%
PAT
21.0% 18.7% 18.0% 17.1% 16.4% 14.3% 13.3% 12.5%
FY11 FY12 FY13 FY14 FY15 FY16 FY17 FY18
Cost-to-Income Ratio
121 bps of average annual decline

Broad-based Sources of Revenue
23
78.5%
12.8%
5.7%
3.0%
Interest Income from on-balance sheet loan book [11.3% papm*] Income from Investments [7.0% papm]
Income on Sold Down book and Loan Syndication [3.0% papm] Fee Income [1.6% of disbursements], penal interest and recovery
• SME LAP and Corporate Mortgage Loans: Processing fees of 1.5% to 2.0% + Pre-payment charges • Attachment of insurance products: 85% penetration in new loans. Increasing proportion of renewal insurance from loan book • Fee income, including all of the above, to grow from the present 1.6% • Besides fee income, total revenue also includes penal interest charges, and loan recoveries of principal and accumulated interest
Fee Income
[~1.6 % of disbursals]
• IBHFL is one of the largest sellers of mortgage pools: Sold ₹ 101.0 Bn of loans in FY18 compared with ₹ 42.2 Bn in FY17 • Interest income from loan syndication is an additional source of revenue • Sell down releases capital, hence RoE accretive, and is an additional source of funding: Locks in a healthy spread [3.0%] with perfectly
matched, co-terminus funding. IBHFL accrues the spread over the course of the loan tenure and does not upfront sell-down income • Banks, the primary investors, buy both PSL and Non-PSL retail pools from both home loans and LAP
Loan Sell Down
[~3% spread]
• A prudent measure and generates investment income • Assurance of ready high liquidity with active treasury minimizing carry • Flexibility to ward-off impact from any sudden changes in the funding landscape
Liquidity Buffer
[~7% from investments]
* Average yield on on-balance sheet book during FY18

Balance Sheet Assets
24
Total Assets
As at March 31, 2018 ₹ 1.32 Tn [US$ 20.29 Bn]
As at March 31, 2017 ₹ 1.04 Tn [US$ 15.95 Bn]
84%
12% 4%
Loan Book: 84% Cash & Liquid Investments*: 12% Other Assets: 4%
*Cash, Cash Equivalents and Investments in Liquid Debt Instruments US $ amounts are converted based on the exchange rate of US $1 = ₹ 65

FY 16-17
Asset Composition
25
• Home loans, which form the majority of incremental disbursals, are disbursed at an average ticket size of ₹ 2.4 Mn; average LTV of 71% [at origination]
FY 17-18
Corporate Mortgage Loans
78%
22%
79%
21%
Mortgage Loans

0.84% 0.85%
0.77%
0.49% 0.49% 0.43%
0.35% 0.36% 0.34%
Mar 16 Mar 17 Mar-18
Gross NPA General & Specific Provisions Net NPA
Asset Quality
26
• ₹ 4 Bn of counter-cyclical provisioning stock • Standard Asset Provision and Counter-cyclical Provisions are over and above General and Specific Provision pool
and are not netted off against Gross NPAs in calculation of Net NPAs • Standard asset provisioning rates are 0.4% for housing loans [incrementally 0.25%] and 1.0% for non-housing
loans
[as % of Total Loan Assets] Provisioning Cover : 185% of GNPA
dpd: days past due
As at Mar 31, 2018
[in ₹ Bn] NPA [90+ dpd*]: 9.48 Provisions for Contingencies: 17.58 Of which NPAs: 5.28 Other provisioning: 12.30 Regulatory Provisioning: 8.92 Excess Provisioning over Regulatory Provisioning: 8.66

Retail Mortgage Loans' Sourcing
• 27% of home loans’ sourcing is now through eHome Loans. Including LAP, 22% of all retail mortgage loans’ sourcing is now through eHome Loans
• Over 90% of incremental sourcing is done in-house by on-rolls employees and eHome Loans
65% 8%
5%
22%
Direct Sales Team External Channels Branch Walk-ins eHome Loans
Direct Sales Team: on-rolls sales employees 27

Consumer Focused Mid-Income Housing Loans: Granular, Low-risk, Prime Home Loans
28 Amounts converted to US $ at an exchange rate of US $1= ₹ 65
Mid-income granular home loans: volume driven business • Most scalable opportunity: Mid-income home loan disbursements for the industry grew by 33% in FY17 • Customer acquisition + long-term relationship rather than single-loan engagement: On-going cross-sell
and fee generation
Ticket Size Core Customer Segment Typical Annual
Household Income
Distribution
Count Amount
₹ 1.5 Mn – ₹ 5 Mn [$ 23,000 - $ 77,000]
Urban Mid-Income Affordable Home Loans
Prime mid-income, tier I city, salaried
₹ 0.6 – ₹ 1.8 Mn [$9,000 - $ 27,500]
50% 55%
< ₹ 1.5 Mn [$ 23,000]
Smart City Home Loans Prime mid-income, tier II town, salaried
₹ 0.4 Mn – ₹ 1.0 Mn [$6,000 - $ 15,000]
43% 16%
> ₹ 5 Mn [$ 77,000]
Self-employed Home Loans Small business owner, established business track
record
> ₹ 1.8 Mn [$ 27,500]
7% 29%

Home Loan Profile: Focus on Mid-Income Affordable Housing
29
Average Loan Size ₹ 2.4 Mn
Maximum Loan to Value 80%
Average Loan to Value 73% [at origination]
Average Loan Term 15 years
Average Customer Age 38 years
Primary Security Mortgage of property financed
Repayment Type Monthly amortizing
• PMAY covers Middle Income Group [MIG] - defined as households with annual income up to ₹ 1.8 Mn - for purchase of a house of carpet area of up to 2,150 Sq. Ft.
• Effective home loan rate for ₹ 2.4 Mn home loan, IBHFL’s average ticket size, is only 0.42%
PMAY: Pradhan Mantri Awas Yojana MIG: Middle Income Group

Smart City Home Loan: Technology-led cost-effective
Geographical Expansion through eHome Loans platform
30
Minimum Loan Size ₹ 1.0 Mn
Average Loan Size ₹ 1.5 Mn
Maximum Loan Size ₹ 4.0 Mn
Maximum Loan to Value 80% [at origination]
Maximum Loan Term 20 years
Average Customer Age 39 years
Primary Security Mortgage of property financed
Repayment Type Monthly amortizing
• 80 Smart City Home Loan branches in new towns and cities now contribute 11% to incremental home loans’ disbursals. On track to have 100 Smart City Home Loan branches by Sep 2018
• Smart City Home Loans rides on the eHome Loans infrastructure with lean spoke branches logging in digital/ scanned loan applications, these are underwritten at centralised regional credit hubs
• Smart City Home Loans is driving expansion into geographies with low competitive intensity, contributing better margins at low cost-to-income without dilution in credit standards

Conservative Loan Against Property Profile
31
Average Loan Size ₹ 7.3 Mn
Maximum Loan to Value 65%
Average Loan to Value 49% [at origination]
Average Loan Term 7 years
Primary Security Mortgage of property financed
Repayment Type Monthly amortizing
Average Age of Business 7 years
Basis of Credit Appraisal Business cash flow analysis based

32
Home Loans Distribution Model:
Analytics and Technology-led Next Phase of Growth

Evolution of Home Loans Distribution Model Thus Far
Pre 2005: Branch-based
Fulfillment [Dominance of PSBs]
2005-16: Point-of-Sale Fulfillment
[Advantage Private Lenders]
• Entirely branch based. Multiple customer visits to the branch.
• Long-drawn process usually taking 20+ days
• Tedious process for subsequent disbursals
• Multiple visits for on-going loan management, tax documents etc
• Lead generation at residential construction sites
• Doorstep service and loan fulfilment
• For Banks: Branches became merely CASA servicing points as branches lost ability to source home loans
• End-to-end process down to 7 to 10 days
• Online components ease loan management
33

34
Financial Targets
Long-term sustained loan book growth: 20% - 25%
Reduced credit costs: <= 0.50%
Increased fee generation: 2%+ from present 1.6%
Sustained earnings growth: 20% - 25%
Low cost-to-income: < 8.0%
Greater developer loyalty: 20% more loans/project
Integrated Home Loan Technology Platform
Operational Impact
One app for all needs
Automated underwriting
Product personalisation
Real-time access to GST, tax info
Social Media Integration
Access to Source Data
Shorter working capital cycles
Developers and DSAs
Cross-sell: Insurance, MFs
Fee Generation
Customer delight: Reduced TAT. Round-the-clock access
Enhanced productivity and operating efficiencies
Proportion of self-employed segment maintained
Increased customer engagement and touchpoints
Collapse developer working capital cycle
Enhanced DSA productivity and earning opportunities
Customers Analytics
Indiabulls Integrated Home Loan Technology Platform

Customer Outreach Inbound/Outbound Contact Centre
Brick & Mortar: Pan-India Branch Network
Ring of touchpoints encircling target customers
Digital Channels • eHomeLoans • Online marketing and social media
External Channel Partners: DSAs
Feet-on-street: 3,500 on-rolls DST Presence on construction sites
BTL Outreach: Loan Melas, Kiosks
CUSTOMER
Indiabulls Integrated Home Loan Technology Platform
Robust credit underwriting rigour, risk management
practices and process integrity
Branch
Service Centre
Master Service Centre
Central Credit Committee
Operational risk mitigation • Outsourced or digital document
storage
ISO certified key departments and processes
• Loan operations • Customer care • Data centre • Administration • Human Resources
• Credit underwriting • Environment
Management Services
DSA: Direct Sales Agent DST: Direct Sales Team BTL: Below the Line
Credit Decisioning Hierarchy
eHomeLoans: 1-day turnaround • End-to-end home loan app: loan application, document
upload and eSign
Digitized Workflow: 2-day turnaround • Scanned application, digital workflow
Field Investigation
Fraud Control
Unit
Legal Team Technical
Service Group
Technology-driven, elastic, scalable loan processing capacity
Scoring Model: Instant turnaround [August 2018]
• Based on banking history, income and credit bureau data
Hub & Spoke
Spoke Sourcing
Regional hub decisioning
65
% o
f d
isb
urs
als
Approved Project Funding [APF]
Digital app-enabled workforce and workflow
35
% o
f d
isb
urs
als
Non - APF
Comprehensive Customer Coverage; Scalable Processing Capacity and Robust Risk Management
35

Pan-India Brick-and-Mortar Branch Network
Smart City Branches
Service Centers
Branches
Master Service Centers [MSC]
Head office
• Core credit committee
• Loans above pre-defined limits go to the committee
• Regional credit hub
• Detailed credit analysis
• Underwrites high value cases
• Walk-in branches
• Customer interaction and service delivery
• Credit authority for low-ticket sizes
• Customer interaction and service delivery
• Recommends proposals
• No credit authority
36
September 2018: 100 smart city home loans branches from 80 branches at
the end of FY18
Smart City Home Loan Branches
• Technology enabled lean branches with only sales staff
• Online loan application file completion
• Underwriting at ‘hub’ credit centres
•
•
•
•
•
•
•
•
•
•
• •
•
•
•
•
•
•
•
•
•
•
• •
•
•
•
•
• •
•

Auto population of demographics through Aadhaar: • Name • Date of Birth • Address
Other minimal information filled by one-click interactive options:
KYC Validation via Aadhaar
Aadhaar e-KYC also provides: • Photograph, ID and Address proof
Online Processing fee payment options
Lead Sources
Website
App
Social Media
Chat bots
SMS Channel
Sales/ Branch
References
Partners
Aggregators
eHome Loan App and Portal
Application form Document upload
Income proof directly from bank’s system: using Perfios facility One click document upload from • Diglocker • Google Drive • Dropbox
e-sign
Aadhaar enabled e-signs replace 70+ physical signatures OTP and Biometric facility
IB Systems
Data directly flows to multiple systems of IB for action
Government certified document storage
Customer Toughpoints
• Father’s name • Spouse name
• Loan Details • Property Details • Employment details
Email fraud detection
KYC – biometric/ OTP
Automatically Triggers: • Decision Engine • Verification
reports
Financial data
IB
e-sign – biometric/ OTP Online payment
Third party integrations
eHome Loans: Digitised Workflow, Analytics driven
Underwriting, Aadhaar and Digital Payments Infrastructure
37

eHome Loans: Digitised Workflow, Analytics driven
Underwriting, Aadhaar and Digital Payments Infrastructure
Parallel reports triggered: • Property legal
and technical checks
• Field verification
Post application the following are triggered automatically: • Detailed credit history from credit
bureaus • Bank statement analysis • Deduplication • Verification reports • Business Rule engine for scoring
Sanctioning
Verifications Automated Credit Decisioning
e-sign and instant Disbursement
Host -to-host integration with sponsor banks for direct and instant disbursement to customer/ builders • IMPS • RTGS • NEFT Provide instant digital insurance certificate of aggregator insurance companies
Third party integrations
Servicing
Self Service 65% of service requests can be instantly resolved on following multiple customer touch points • Facebook • Twitter • Customer app/ portal • Kiosk • AI enabled Chat BOT • Voice Recognition
Intimation of Payment demands raised by builder will come instantly to IB Remind and Follow up service to meet builder payment demands
On the go reports: Teams can file real time reports through the integrated app
Auto credit decision for majority applicants
All the above information goes into the decision engine for auto decision
IB
All reports and tracking on app
Email fraud detection Financial data analysis
On request for disbursement, customer can e-sign the complete loan kit
Digital mandate for auto debit for equated monthly installment for loan servicing
e-sign – biometric/ OTP
Digital mandate for debit
Builder on IB
platform
Instant Disbursal
38
39
LAP Grading A Pioneering Initiative for Improved Risk Management and Greater Transparency

Loan Against Property Grading from CRISIL and ICRA
40
• 12th quarter of industry-pioneering LAP grading initiative
• Sourcing quality sustained through transition to GST
• LAP grading engagement with CRISIL [a Standard and Poor’s Company] and ICRA [a Moody’s Investors Service Company]
- CRISIL grades LAP loans on aspects such as past payment track record; nature of business and financial performance; nature of property; and loan attributes like ticket size, lending scheme, loan tenure, etc.
- ICRA grades LAP loans on aspects such as financial strength; business and management; collateral strength, quality and enforceability; and attributes of the loan itself
- Engagement with CRISIL and ICRA was initiated nearly three years ago in Q1FY16
• Concurrent grading by multiple rating agencies
- Offers IBHFL a broader and deeper perspective and a means to further improve loan portfolio
- Rating agencies are important stakeholders: exercise will increase comfort and transparency on the asset class
• Grading exercise has been built into a comprehensive risk model
- Learnings from the grading exercises is being used to develop an analytical credit scoring model
- Portfolio performance and delinquency is being tracked against loan grades
- Proactive customer management: retention, upsell/ cross-sell, delinquency management
- Learning is being fed back to improve loan underwriting and continuously upgrade lending policy

Detailed assessment of key factors determining quality of LAP loans
41
Financial Strength
• Interest and debt service cover • Revenues, margin and profitability • Networth and leverage • Growth track of key financial parameters
Collateral Quality
• Property type and location • Valuation of property • Ownership and title chain of property • Adherence to local zoning and planning permissions
Business Management
• Business sector and sectoral prospects • Business duration and track record • Debt service track record • Experience and qualification of promoters and
proprietors • Management strength and experience
Underwriting Process Adherence
• Independent verification and valuation • Third party database checks
‒ CERSAI ‒ Registrar of companies ‒ Credit bureau checks ‒ CIBIL mortgage checks ‒ RBI willful defaulter list ‒ Experian Hunter fraud check
CRISIL LAP Grading Methodology
CERSAI: Central Registry of Securitisation Asset Reconstruction and Security Interest of India; CIBIL: Credit Information Bureau India Limited; RBI: Reserve Bank of India

42
12th Report updated as of Apr 16, 2018 CRISIL LAP Grading
Grading Segment Characteristics
Grading Scale
Quality of LAP Loans#
Disbursals Apr 15 –Mar 18
Interest Service
Coverage Ratio [ISCR]
Total Outstanding Liabilities/
Total Networth
Loan to Value [LTV]
EBITDA Margins
LAP1 Highest 9.59% 10.6 – 13.5 1.3 – 1.4 49% 15% – 18%
LAP2 High 82.24% 8.5– 10.5 2.1 – 2.2 50% 12% – 15%
LAP3 Average 7.70% 8.6 – 11.1 2.9 – 3.1 53% 9% – 12%
LAP4 Below Average 0.21% 14.1– 19.1 1.6 – 1.7 47% 13% – 16%
LAP5 Poor 0.26% 9.2– 11.8 2.3 – 2.4 51% 12% - 16%
* CRISIL LAP grading engagement began in Q1FY16 and up till the publication of this earnings update, CRISIL had graded 84% of the disbursals from Apr 15 to Mar 18 # Adjudged by CRISIL in relation to other LAP loans extended to other borrowers
Over 99% of incremental LAP loans are within the top three grades
• For three years now, incremental LAP loans are graded by CRISIL Ratings
• Sourcing quality sustained through demonetisation and GST transition
• Grading is based on customized scale developed by CRISIL Ratings for IBHFL’s LAP loans to small business owners
• CRISIL grades the loans on aspects such as financial strength; business and management; collateral; and underwriting process
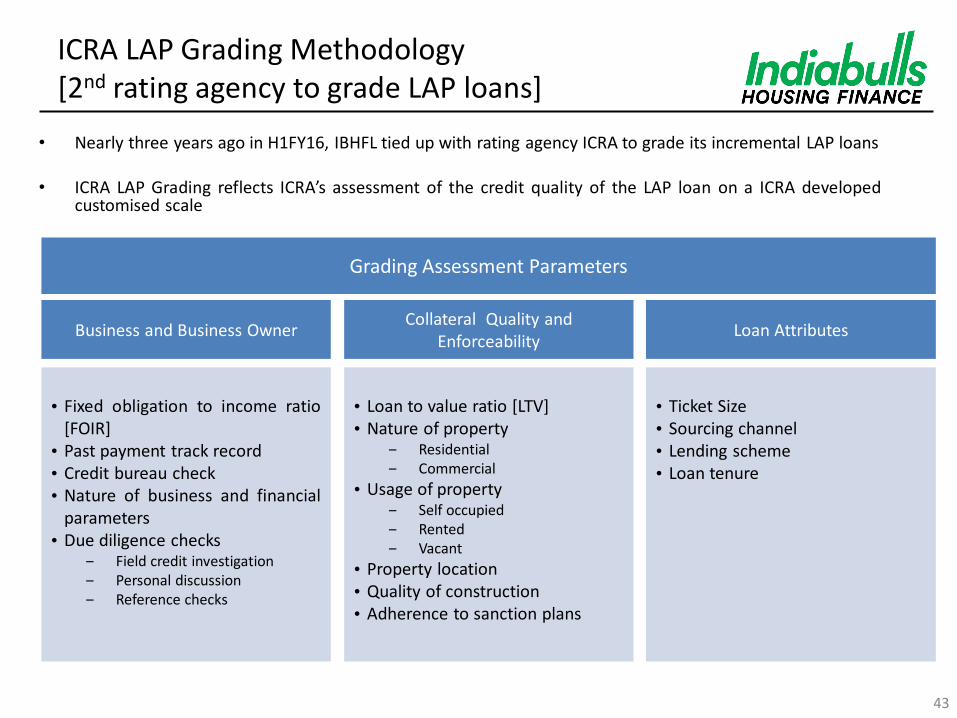
ICRA LAP Grading Methodology [2nd rating agency to grade LAP loans]
• Nearly three years ago in H1FY16, IBHFL tied up with rating agency ICRA to grade its incremental LAP loans
• ICRA LAP Grading reflects ICRA’s assessment of the credit quality of the LAP loan on a ICRA developed customised scale
Business and Business Owner
• Fixed obligation to income ratio
[FOIR] • Past payment track record • Credit bureau check • Nature of business and financial
parameters • Due diligence checks
‒ Field credit investigation ‒ Personal discussion ‒ Reference checks
Collateral Quality and Enforceability
• Loan to value ratio [LTV] • Nature of property
‒ Residential ‒ Commercial
• Usage of property ‒ Self occupied ‒ Rented ‒ Vacant
• Property location • Quality of construction • Adherence to sanction plans
Loan Attributes
• Ticket Size • Sourcing channel • Lending scheme • Loan tenure
Grading Assessment Parameters
43

44
Grading Characteristics
Grading Scale Level of credit
worthiness Grading
Distribution Median LTV Median FOIR
LAP1 Excellent 12.2% 25% 32%
LAP2 Good 67.5% 54% 50%
LAP3 Average 20.1% 65% 58%
LAP4 Below Average 0.1% 61% 64%
LAP5 Inadequate - - -
• For nearly three years, incremental LAP loans are graded by ICRA
• Sourcing quality sustained through demonetisation and GST transition
• Grading is based on customized scale developed by ICRA for IBHFL’s LAP loans to small business owners
• ICRA grades the loans on aspects such as business and business owner quality; collateral quality enforceability; and loan strengths
Over 99% of incremental LAP loans are within the top three grades
10th Report updated as of Apr 12, 2018 ICRA LAP Grading

45
Static Credit Performance Analysis of LAP and HL Pools

Monthly Monitoring Report of ₹ 215.2 Bn of Sold Down Portfolio: from Rating Agencies CRISIL, ICRA and CARE
Monthly monitoring of sold down pool performance
• CRISIL, a Standard & Poor’s Company, ICRA, a Moody’s Investors Service Company and CARE publishes pool performance of 14 PTC pools rated by them
• Both CRISIL and ICRA publish pool performance for DA Pools. This engagement ensures that all pools are monitored on a monthly basis.
• Pool collections monitored at an account level
₋ Number of live pools: 94
₋ Sold down principal of live pools: ₹ 215.2 Bn
₋ Current principal outstanding: ₹ 105.4 Bn
46
Rating Agency Number of Pools Sold Down Principal
[₹ Bn]
ICRA* 83 190.0
CRISIL* 81 163.4
CARE 3 6.9
* The exercise excludes pools sold down in the immediate preceding quarter [Q4 FY 2017-18] DA: Direct Assignment PTC: Pass Through Certificates
* The number of pools monitored by ICRA and CRISIL include both DA and PTC

Monthly Monitoring Report of ₹ 215.2 Bn of Sold Down Portfolio as on March 31, 2018
Home Loans [HL] • Average vintage of sold down pools of ₹ 100.6 Bn of principal is 39 months • The pools have amortised 62% since disbursal • The cumulative collection ratio [CCR] is at 99.9% • Monthly collection ratio [MCR] is in line with CCR at 100.1%
Loan against Property [LAP] • Average vintage of sold down pools of ₹ 114.6 Bn of principal is 35 months • The pools have amortised 57% since disbursal • The cumulative collection ratio [CCR] is at 99.7% • Monthly collection ratio [MCR] is in line with CCR at 100.9%
47
Initial Pool Details of Initial POS
Summary Number of
Pools Disbursement
[₹ Bn]
Sold Down Principal
[₹ Bn]
Months on Book
Pool Principal
[₹ Bn] Amortisation* 90+ dpd % 180+ dpd % CCR MCR
HL Pools 53 119.4 100.6 39 45.2 62% 0.02% 0.01% 99.9% 100.1% LAP Pools 41 138.5 114.6 35 60.2 57% 0.07% 0.03% 99.7% 100.9%
Total 94 257.9 215.2 37 105.4 59% 0.05% 0.02% 99.8% 100.5%
MPS: Months post securitisation MCR: Monthly collection ratio *Amortisation is calculated on Disbursement CCR: Cumulative collection ratio dpd: days past due

48
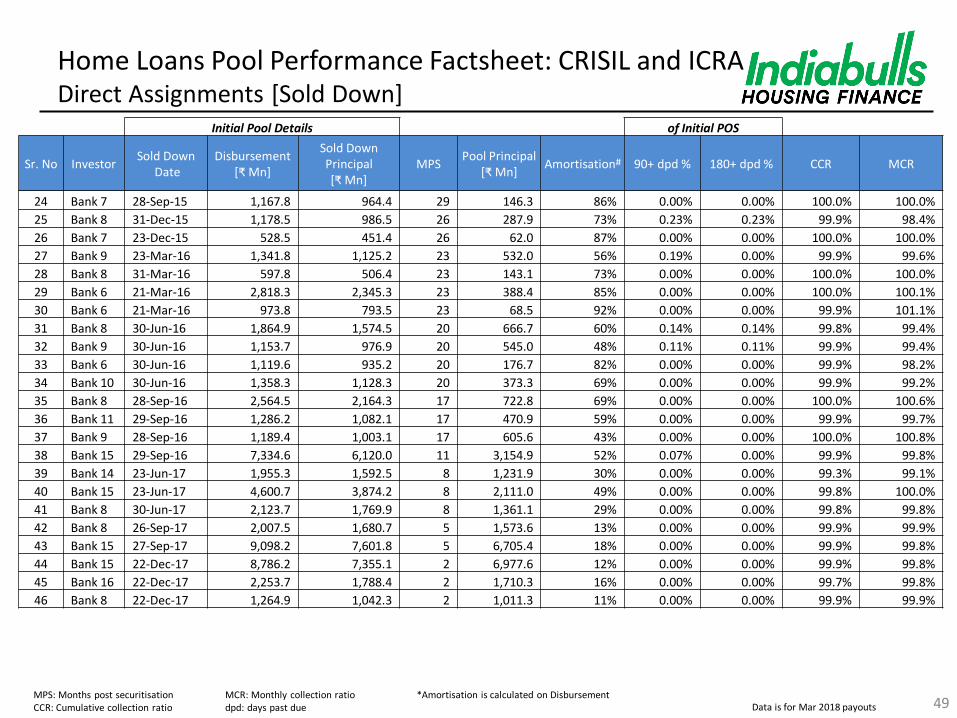
Home Loans Pool Performance Factsheet: CRISIL and ICRA Direct Assignments [Sold Down]
Data is for Mar 2018 payouts
Initial Pool Details of Initial POS
Sr. No Investor Sold Down
Date Disbursement
[₹ Mn]
Sold Down Principal [₹ Mn]
MPS Pool Principal
[₹ Mn] Amortisation# 90+ dpd % 180+ dpd % CCR MCR
1 Bank 4 20-Mar-14 3,451.6 2,923.4 48 557.6 82% 0.00% 0.00% 99.9% 101.6%
2 Bank 5 28-Mar-14* 2,119.7 1,677.5 48 229.4 88% 0.00% 0.00% 99.9% 98.3%
3 Bank 5 27-Jun-14* 1,072.1 900.0 44 178.4 82% 0.00% 0.00% 99.5% 99.0%
4 Bank 6 30-Jul-14 1,023.7 800.1 44 187.9 78% 0.00% 0.00% 99.9% 99.7%
5 Bank 5 30-Sep-14 1,299.1 965.7 41 96.7 92% 0.00% 0.00% 100.0% 98.2%
6 Bank 8 24-Sep-15 1,164.0 1,001.4 29 456.6 56% 0.09% 0.09% 99.9% 99.5%
7 Bank 9 31-Dec-15 4,496.4 3,742.3 26 1,225.9 70% 0.12% 0.06% 99.9% 99.5%
8 Bank 8 29-Feb-16 1,053.0 894.0 24 268.7 72% 0.00% 0.00% 99.9% 98.5%
9 Bank 8 28-Mar-16 620.4 530.4 23 223.9 60% 0.00% 0.00% 99.9% 100.4%
10 Bank 14 28-Jun-13* 8,001.1 6,303.0 56 657.2 91% 0.07% 0.04% 99.9% 99.0%
11 Bank 4 29-Oct-13 1,654.5 1,351.3 52 135.3 91% 0.00% 0.00% 99.9% 98.9%
12 Bank 10 31-Dec-13* 2,319.7 1,921.8 50 319.1 85% 0.00% 0.00% 99.9% 100.0%
13 Bank 4 27-Dec-13 2,731.5 2,309.9 50 267.3 89% 0.00% 0.00% 99.9% 99.4%
14 Bank 3 31-Dec-13* 857.1 717.0 50 296.3 62% 0.00% 0.00% 99.9% 101.9%
15 Bank 6 28-Mar-14* 1,011.2 826.5 48 148.4 83% 0.00% 0.00% 99.9% 99.3%
16 Bank 5 26-Dec-14 840.8 679.6 39 86.4 89% 0.00% 0.00% 100.0% 100.0%
17 Bank 4 30-Dec-14 2,345.9 1,982.9 38 144.6 93% 0.00% 0.00% 100.0% 112.6%
18 Bank 4 01-Mar-15 1,877.0 1,563.1 36 268.5 84% 0.05% 0.05% 99.9% 107.8%
19 Bank 4 11-Jun-15 1,000.3 855.2 34 172.1 81% 0.00% 0.00% 99.8% 99.0%
20 Bank 4 23-Jun-15 2,328.0 1,869.1 33 308.9 85% 0.12% 0.12% 99.9% 101.0%
21 Bank 7 29-Jun-15 999.8 845.3 32 118.0 87% 0.00% 0.00% 99.9% 100.0%
22 Bank 8 25-Aug-15 729.1 613.4 31 225.3 66% 0.00% 0.00% 100.0% 99.7%
23 Bank 7 01-Sep-15 1,380.1 1,159.3 30 193.0 84% 0.00% 0.00% 99.9% 101.9%
MPS: Months post securitisation MCR: Monthly collection ratio # Amortisation is calculated on Disbursement CCR: Cumulative collection ratio dpd: days past due *Pools monitored only by ICRA
49
Home Loans Pool Performance Factsheet: CRISIL and ICRA Direct Assignments [Sold Down]
Data is for Mar 2018 payouts MPS: Months post securitisation MCR: Monthly collection ratio *Amortisation is calculated on Disbursement CCR: Cumulative collection ratio dpd: days past due
Initial Pool Details of Initial POS
Sr. No Investor Sold Down
Date Disbursement
[₹ Mn]
Sold Down Principal [₹ Mn]
MPS Pool Principal
[₹ Mn] Amortisation# 90+ dpd % 180+ dpd % CCR MCR
24 Bank 7 28-Sep-15 1,167.8 964.4 29 146.3 86% 0.00% 0.00% 100.0% 100.0%
25 Bank 8 31-Dec-15 1,178.5 986.5 26 287.9 73% 0.23% 0.23% 99.9% 98.4%
26 Bank 7 23-Dec-15 528.5 451.4 26 62.0 87% 0.00% 0.00% 100.0% 100.0%
27 Bank 9 23-Mar-16 1,341.8 1,125.2 23 532.0 56% 0.19% 0.00% 99.9% 99.6%
28 Bank 8 31-Mar-16 597.8 506.4 23 143.1 73% 0.00% 0.00% 100.0% 100.0%
29 Bank 6 21-Mar-16 2,818.3 2,345.3 23 388.4 85% 0.00% 0.00% 100.0% 100.1%
30 Bank 6 21-Mar-16 973.8 793.5 23 68.5 92% 0.00% 0.00% 99.9% 101.1%
31 Bank 8 30-Jun-16 1,864.9 1,574.5 20 666.7 60% 0.14% 0.14% 99.8% 99.4%
32 Bank 9 30-Jun-16 1,153.7 976.9 20 545.0 48% 0.11% 0.11% 99.9% 99.4%
33 Bank 6 30-Jun-16 1,119.6 935.2 20 176.7 82% 0.00% 0.00% 99.9% 98.2%
34 Bank 10 30-Jun-16 1,358.3 1,128.3 20 373.3 69% 0.00% 0.00% 99.9% 99.2%
35 Bank 8 28-Sep-16 2,564.5 2,164.3 17 722.8 69% 0.00% 0.00% 100.0% 100.6%
36 Bank 11 29-Sep-16 1,286.2 1,082.1 17 470.9 59% 0.00% 0.00% 99.9% 99.7%
37 Bank 9 28-Sep-16 1,189.4 1,003.1 17 605.6 43% 0.00% 0.00% 100.0% 100.8%
38 Bank 15 29-Sep-16 7,334.6 6,120.0 11 3,154.9 52% 0.07% 0.00% 99.9% 99.8%
39 Bank 14 23-Jun-17 1,955.3 1,592.5 8 1,231.9 30% 0.00% 0.00% 99.3% 99.1%
40 Bank 15 23-Jun-17 4,600.7 3,874.2 8 2,111.0 49% 0.00% 0.00% 99.8% 100.0%
41 Bank 8 30-Jun-17 2,123.7 1,769.9 8 1,361.1 29% 0.00% 0.00% 99.8% 99.8%
42 Bank 8 26-Sep-17 2,007.5 1,680.7 5 1,573.6 13% 0.00% 0.00% 99.9% 99.9%
43 Bank 15 27-Sep-17 9,098.2 7,601.8 5 6,705.4 18% 0.00% 0.00% 99.9% 99.8%
44 Bank 15 22-Dec-17 8,786.2 7,355.1 2 6,977.6 12% 0.00% 0.00% 99.9% 99.8%
45 Bank 16 22-Dec-17 2,253.7 1,788.4 2 1,710.3 16% 0.00% 0.00% 99.7% 99.8%
46 Bank 8 22-Dec-17 1,264.9 1,042.3 2 1,011.3 11% 0.00% 0.00% 99.9% 99.9%

50
LAP Pool Performance Factsheet: CRISIL and ICRA Direct Assignments [Sold Down]
Data is for Mar 2018 payouts
Initial Pool Details of Initial POS
Sr. No Investor Sold Down
Date Disbursement
[₹ Mn]
Sold Down Principal [₹ Mn]
MPS Pool Principal
[₹ Mn] Amortisation# 90+ dpd % 180+ dpd % CCR MCR
1 Bank 3 31-Dec-13* 2,244.2 1,786.4 50 195.2 90% 0.00% 0.00% 99.9% 109.2% 2 Bank 10 07-Feb-14 4,298.2 3,298.3 50 395.4 90% 0.10% 0.01% 99.9% 104.2% 3 Bank 4 28-Mar-14 2,716.0 2,144.5 48 240.9 90% 0.00% 0.00% 99.9% 98.3% 4 Bank 4 20-Jun-14 2,310.9 1,893.7 44 201.7 90% 0.07% 0.07% 99.9% 102.6% 5 Bank 4 27-Jun-14 1,854.7 1,535.7 44 344.2 79% 0.12% 0.12% 99.9% 99.3% 6 Bank 10 29-Dec-14 4,540.4 3,716.1 38 697.8 83% 0.15% 0.15% 99.9% 105.3% 7 Bank 2 30-Mar-15 10,671.9 8,695.3 35 2,398.7 75% 0.25% 0.06% 99.8% 99.3% 8 Bank 4 30-Jun-15 1,450.6 1,127.7 32 263.8 80% 0.00% 0.00% 100.0% 100.0% 9 Bank 12 28-Sep-15 2,201.9 1,807.1 29 505.1 75% 0.00% 0.00% 99.9% 99.9%
10 Bank 12 28-Sep-15 2,345.4 2,002.8 29 648.6 69% 0.00% 0.00% 99.8% 98.6% 11 Bank 1 28-Sep-15 3,594.8 2,849.6 29 733.5 77% 0.00% 0.00% 99.8% 107.6% 12 Bank 8 29-Sep-15 4,302.8 3,641.3 30 989.2 74% 0.26% 0.00% 99.8% 98.3% 13 Bank 12 09-Dec-15 333.1 241.5 27 57.2 81% 0.00% 0.00% 99.9% 98.6% 14 Bank 12 09-Dec-15 506.3 434.9 27 201.1 56% 0.00% 0.00% 100.0% 100.0% 15 Bank 12 23-Dec-15 1,561.8 1,336.9 26 411.0 71% 0.00% 0.00% 99.9% 100.3% 16 Bank 1 31-Dec-15 1,203.8 997.7 27 321.7 70% 0.00% 0.00% 99.9% 104.6% 17 Bank 1 31-Dec-15 2,785.4 2,224.8 27 652.1 74% 0.00% 0.00% 99.7% 104.9% 18 Bank 1 03-Mar-16 956.7 774.4 24 282.1 67% 0.00% 0.00% 99.9% 98.7% 19 Bank 12 10-Mar-16 1,753.5 1,499.8 24 473.1 70% 0.00% 0.00% 99.9% 101.1% 20 Bank 9 30-Jun-16 2,503.4 2,094.0 20 1,038.2 54% 0.37% 0.37% 99.7% 100.1% 21 Bank 10 30-Jun-16 4,059.2 3,314.6 20 1,511.8 59% 0.41% 0.41% 99.8% 99.4% 22 Bank 13 26-Sep-16 1,523.7 1,248.0 18 624.9 54% 0.00% 0.00% 99.7% 100.0% 23 Bank 13 26-Sep-16 2,162.9 1,748.0 18 599.1 69% 0.00% 0.00% 100.0% 103.0% 24 Bank 8 30-Sep-16 3,311.7 2,733.2 17 1,255.1 58% 0.44% 0.00% 99.7% 99.1% 25 Bank 14 30-Mar-17 4,158.7 3,405.1 11 2,296.4 39% 0.00% 0.00% 99.9% 100.2% 26 Bank 1 20-Mar-12 2,360.3 2,223.4 72 146.7 94% 0.00% 0.00% 99.9% 105.9% 27 Bank 8 30-Jun-17 4,060.1 3,327.2 9 2,696.9 26% 0.00% 0.00% 99.4% 98.7% 28 Bank 10 28-Jun-17 6,265.8 4,694.4 8 3,385.9 40% 0.00% 0.00% 99.8% 100.3% 29 Bank 5 26-Sep-17 12,376.8 9,477.0 5 8,094.3 27% 0.00% 0.00% 99.6% 99.9% 30 Bank 5 26-Sep-17 7,061.2 5,808.2 5 4,787.9 25% 0.00% 0.00% 99.0% 99.0% 31 Bank 5 29-Dec-17 4,367.6 3,569.0 2 3,364.8 14% 0.00% 0.00% 99.4% 99.8% 32 Bank 5 29-Dec-17 4,445.9 3,539.8 2 3,330.4 17% 0.00% 0.00% 100.0% 99.9% 33 Bank 12 29-Dec-17 1,606.3 1,298.1 2 1,169.6 19% 0.00% 0.00% 100.0% 100.0% 34 Bank 12 29-Dec-17 2,171.3 1,719.8 2 1,472.5 25% 0.00% 0.00% 100.0% 100.0%
MPS: Months post securitisation MCR: Monthly collection ratio # Amortisation is calculated on Disbursement CCR: Cumulative collection ratio dpd: days past due *Pool monitored only by ICRA

51
Home Loans and LAP Pool Performance Factsheet Pass-Through Certificates HL Pools
Initial Pool Details of Initial POS
Sr No Investor Sold Down
Date Disbursement
[₹ Mn]
Sold Down Principal [₹ Mn]
MPS Pool Principal
[₹ Mn] Amortisation* 90+ dpd % 180+ dpd % CCR MCR
Outstanding Rating from
1 Bank 2 20-Mar-14 3,353.9 3,151.7 48 1,417.4 58% 0.00% 0.00% 100.0% 99.5% ICRA
2 Bank 9 29-Jun-17 3,544.7 3,299.6 8 2,864.7 19% 0.00% 0.00% 98.7% 98.8% ICRA
3 Bank 2 30-Dec-13 1,095.9 993.3 51 352.6 68% 0.00% 0.00% 100.0% 99.8% CRISIL
4 Bank 14 01-Mar-15 2,940.5 2,724.4 37 1,153.1 61% 0.00% 0.00% 100.0% 99.7% CRISIL
5 Bank 3 31-Dec-12 1,286.5 1,186.2 63 298.5 77% 0.00% 0.00% 99.9% 100.2% CRISIL
6 Bank 3 28-Mar-13 1,146.0 1,070.9 60 380.7 67% 0.00% 0.00% 100.0% 99.8% CRISIL
7 Bank 14 27-Sep-13 3,119.0 2,864.4 54 953.0 69% 0.00% 0.00% 99.9% 99.8% CRISIL
Initial Pool Details of Initial POS
Sr No Investor Sold Down
Date Disbursement
[₹ Mn]
Sold Down Principal [₹ Mn]
MPS Pool Principal
[₹ Mn] Amortisation* 90+ dpd % 180+ dpd % CCR MCR
Outstanding Rating from
1 Bank 2 30-Dec-13 1,114.1 986.0 50 149.1 87% 0.00% 0.00% 99.8% 101.0% CARE
2 Bank 2 20-Mar-14 4,403.3 3,850.0 48 628.6 86% 0.00% 0.00% 99.9% 107.1% CARE
3 Bank 3 31-Mar-16 2,279.9 2,091.0 23 1,116.4 51% 0.00% 0.00% 99.7% 99.8% CARE
4 Bank 9 27-Sep-17 6,640.4 6,096.8 5 5,690.3 14% 0.00% 0.00% 99.7% 99.6% ICRA
5 Bank 14 30-Sep-16 1,437.3 1,359.8 17 666.8 54% 0.00% 0.00% 99.6% 99.8% CRISIL
6 Bank 9 30-Dec-16 5,458.2 5,126.9 14 3,855.3 29% 0.00% 0.00% 99.6% 99.9% CRISIL
7 Bank 9 27-Mar-17 3,100.7 2,923.5 11 2,334.2 25% 0.00% 0.00% 99.8% 99.5% CRISIL
LAP Pools
MPS: Months post securitisation MCR: Monthly collection ratio *Amortisation is calculated on Disbursement CCR: Cumulative collection ratio dpd: days past due Data is for Mar 2018 payouts
52
Liabilities Profile

10%
84%
6%
Shareholders' Funds Borrowings Other Liabilities
Liabilities
53 US $ amounts are converted based on the exchange rate of US $1 = ₹ 65
Total Liabilities
As at March 31, 2018 ₹ 1.32 Tn [US$ 20.29 Bn]
As at March 31, 2017 ₹ 1.04 Tn [US$ 15.95 Bn]

Funding Mix
US $ amounts are converted based on the exchange rate of US $1 = ₹ 65
ECB: External Commercial Borrowing
Total Borrowings
As at March 31, 2018 ₹ 1.10 Tn [US$ 16.96 Bn]
As at March 31, 2017 ₹ 0.85 Tn [US$ 13.12 Bn]
38%
51% 54%
49%
37% 34%
11% 9% 10%
2% 3% 2%
Mar-16 Mar-17 Mar-18
ECB
Sell Down
Bank Loans
Debentures and Securities
54

Strengthening Liability Profile Borrowings [₹ Bn]
Net Gearing: Borrowings Net of ‘Cash & Cash Equivalents’ and ‘Investments in Liquid Debt Instruments’
Total Funding [₹ Bn] Net Incremental in 12 Months
Contribution to Incremental Borrowings in last 12 Months Mar 18 Mar 17
Bank Loans 417.1 346.6 70.6 24.6%
Debentures and Securities 656.2 480.5 175.7 61.2%
ECB 29.3 25.9 3.3 1.2%
Total Borrowing 1,102.6 853.0 249.6 87.0%
Sell Down 124.2 86.9 37.3 13.0%
Total 1,226.8 939.9 286.9 100.0%
55
611 853
1,103
4.7 5.7 7.0
-
200
400
600
800
1,000
1,200
Mar-16 Mar-17 Mar-18
Borrowings
Net Gearing
ICMA: International Capital Market Association
• ₹ 536.2 Bn of debentures and securities raised in 24 months since March 2016 is 2.4 times of ₹ 220 Bn raised in 36 months spanning FY 14 to FY 16.
• Issued ₹ 27.5 Bn of tier II bonds in FY 18 • Issued India’s 1st Social Affordable Housing Offshore[Masala] Bond aggregating to ₹ 3.15 Bn, will conform to the
Social Bond Principles 2017 issued by ICMA; with assurance provided by KPMG. Social Affordable Housing Bond’s aggregating to ₹ 15.4 Bn issued in FY 18 have been fully allocated towards affordable housing
• Amongst its lenders, the company now counts 507 strong relationships: 21 PSU banks, 22 Private and Foreign banks and 464 Mutual Funds, Provident Funds, Pension Funds, Insurance Companies and Corporates
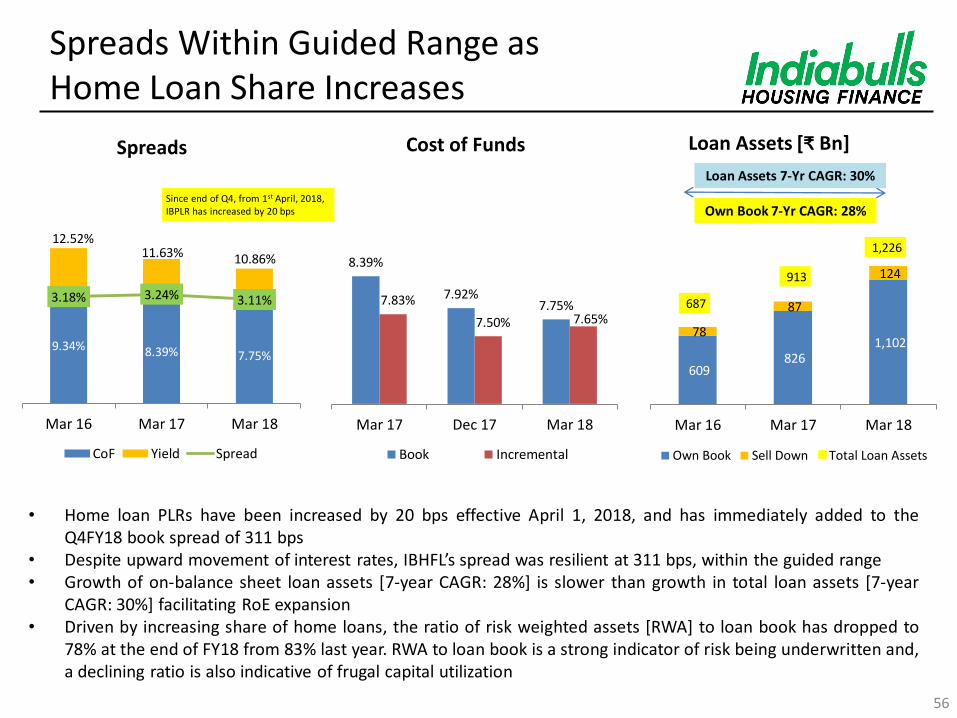
Spreads Within Guided Range as Home Loan Share Increases
Cost of Funds
Loan Assets [₹ Bn]
Spreads
• Home loan PLRs have been increased by 20 bps effective April 1, 2018, and has immediately added to the Q4FY18 book spread of 311 bps
• Despite upward movement of interest rates, IBHFL’s spread was resilient at 311 bps, within the guided range • Growth of on-balance sheet loan assets [7-year CAGR: 28%] is slower than growth in total loan assets [7-year
CAGR: 30%] facilitating RoE expansion • Driven by increasing share of home loans, the ratio of risk weighted assets [RWA] to loan book has dropped to
78% at the end of FY18 from 83% last year. RWA to loan book is a strong indicator of risk being underwritten and, a declining ratio is also indicative of frugal capital utilization
Loan Assets 7-Yr CAGR: 30%
Own Book 7-Yr CAGR: 28%
56
Since end of Q4, from 1st April, 2018, IBPLR has increased by 20 bps
8.39%
7.92% 7.75% 7.83%
7.50% 7.65%
Mar 17 Dec 17 Mar 18
Book Incremental
9.34% 8.39% 7.75%
12.52% 11.63% 10.86%
3.18% 3.24% 3.11%
Mar 16 Mar 17 Mar 18
CoF Yield Spread
609 826
1,102 78
87
124
687
913
1,226
Mar 16 Mar 17 Mar 18
Own Book Sell Down Total Loan Assets

Optimally Matched Balance Sheet Maturity Profile [As of March 31, 2018]
[Amounts in ₹ Bn]
• *Assets in the ‘Up to 1 Yr’ bucket includes ₹ 165.35 Bn [as of March 31, 2018] of Cash, Cash equivalents and investments in liquid debt instruments
• The maturity profile reflects adjustments for prepayments and renewals in accordance with the guidelines issued by the National Housing Bank.
*
The company had cash, cash equivalents and investments in liquid debt instruments of ₹ 165.35 Bn as at 31st Mar, 2018. The company receives income from its cash, cash equivalents and investments in liquid debt instruments through the quarter, most of which appears in ‘Other Income’ 57
355
609
383 347
587
414
Up to 1 yr 1 - 5 yrs Over 5 yrs
Assets Liabilities

Corporate Social Responsibility
58

Skill Development
Sanitation
Health
Paushtik Aahar: - Free nutrition supplements to the
underprivileged and malnourished
- 30,000 individuals per month
- 90,000 beneficiaries in this quarter
- 4,29,485 beneficiaries till date
Kumud: - Sanitary napkins distributed to over 9,116
women and adolescent girls this quarter
- Hygiene awareness sessions conducted
- Total 70,220 beneficiaries till date
Free Mobile Medical Vans - Free primary doorstep healthcare facility - 4 vans added to existing fleet of 26 - 2,37,789 patients diagnosed this quarter - Total 16,31,018 patients successfully treated
Free Charitable Medical Clinic - 5 free clinics treated over 25,423 patients
Health Check-up Camp - Conducted in Thane, Raigad and Palghar
districts with 8,329 beneficiaries this quarter
Free Dialysis Treatment - 10,000 free dialysis treatment to be provided;
2,570 provided this quarter; 3,499 till date
Nutrition
Renewable Energy
Mokhada
Indiabulls Foundation: Corporate Social Responsibility
Transforming Mokhada [a taluka adopted to bring about sustainable change]
- 3 mobile medical vans and 1 clinic benefitting 31,153 beneficiaries this quarter
- Mini health camps every month benefiting 5,787 individuals till date
- Focus majorly on improving nutritional condition of children, pregnant women and lactating mothers
- 44, 983 beneficiaries this quarter
- 2,44,083 beneficiaries till date
Renewable Energy Plants: - Free of cost round-the-clock seamless
electricity to 6 tribal ashram schools, 4 schools in pipeline
- Benefits 3,920 tribals students every year
- 13,400 beneficiaries till date
Best Overall Excellence in CSR award at National Awards for Excellence in CSR & Sustainability 2016
59 59
Women Empowerment:
- 600 rural women from 7 states trained
- 3-month professional training certified by National Skill Development Corporation
- Over 75% of them have been placed in hospitals and nursing homes

Board of Directors, Ratings, Business Value Proposition, Key Ratios, Valuations, and
Shareholding
60
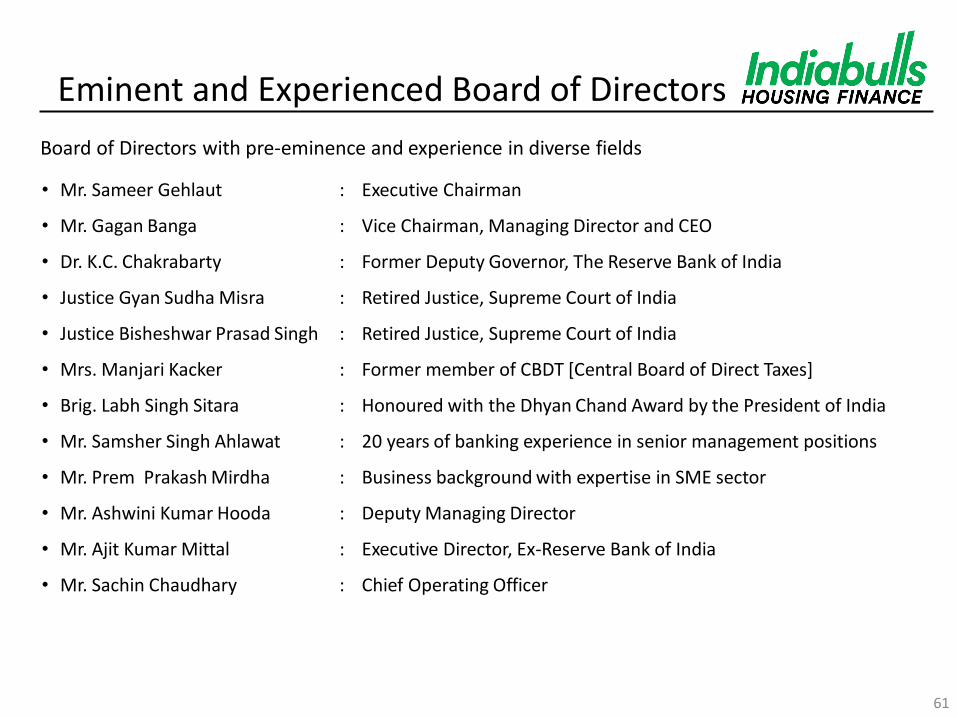
Eminent and Experienced Board of Directors
• Mr. Sameer Gehlaut : Executive Chairman
• Mr. Gagan Banga : Vice Chairman, Managing Director and CEO
• Dr. K.C. Chakrabarty : Former Deputy Governor, The Reserve Bank of India
• Justice Gyan Sudha Misra : Retired Justice, Supreme Court of India
• Justice Bisheshwar Prasad Singh : Retired Justice, Supreme Court of India
• Mrs. Manjari Kacker : Former member of CBDT [Central Board of Direct Taxes]
• Brig. Labh Singh Sitara : Honoured with the Dhyan Chand Award by the President of India
• Mr. Samsher Singh Ahlawat : 20 years of banking experience in senior management positions
• Mr. Prem Prakash Mirdha : Business background with expertise in SME sector
• Mr. Ashwini Kumar Hooda : Deputy Managing Director
• Mr. Ajit Kumar Mittal : Executive Director, Ex-Reserve Bank of India
• Mr. Sachin Chaudhary : Chief Operating Officer
Board of Directors with pre-eminence and experience in diverse fields
61

Long Term Credit Rating
CRISIL [a Standard & Poor’s Company] AAA
ICRA [a Moody’s Investor Service Company] AAA
CARE Ratings AAA
Brickwork Ratings AAA
Credit Ratings
62
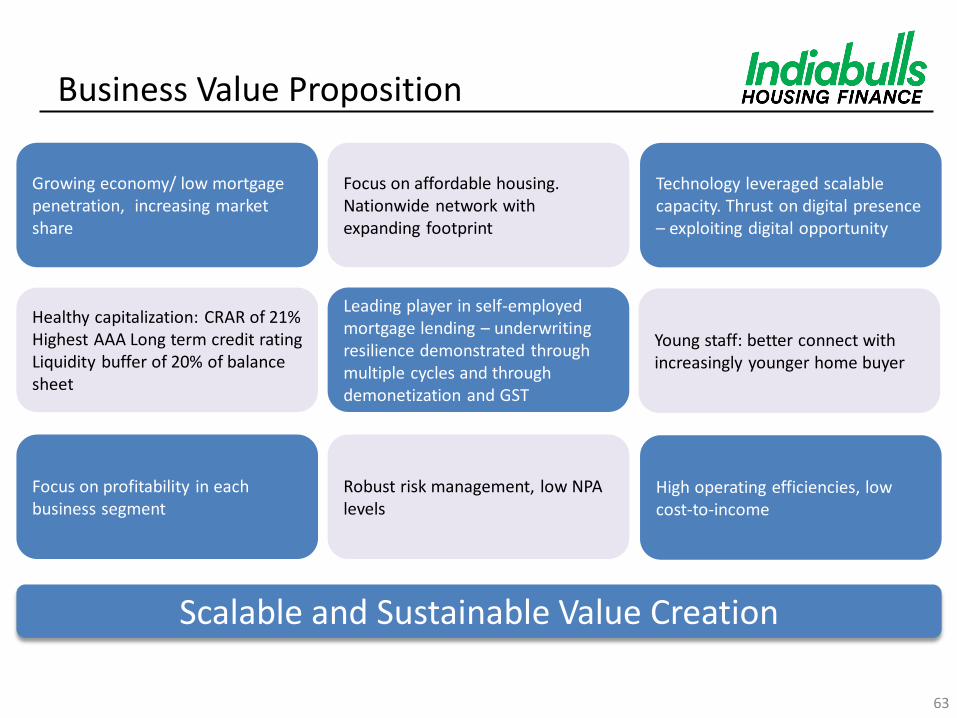
Business Value Proposition
Growing economy/ low mortgage penetration, increasing market share
Focus on affordable housing. Nationwide network with expanding footprint
Focus on profitability in each business segment
Healthy capitalization: CRAR of 21% Highest AAA Long term credit rating Liquidity buffer of 20% of balance sheet
Leading player in self-employed mortgage lending – underwriting resilience demonstrated through multiple cycles and through demonetization and GST
Robust risk management, low NPA levels
Young staff: better connect with increasingly younger home buyer
High operating efficiencies, low cost-to-income
Technology leveraged scalable capacity. Thrust on digital presence – exploiting digital opportunity
Scalable and Sustainable Value Creation
63
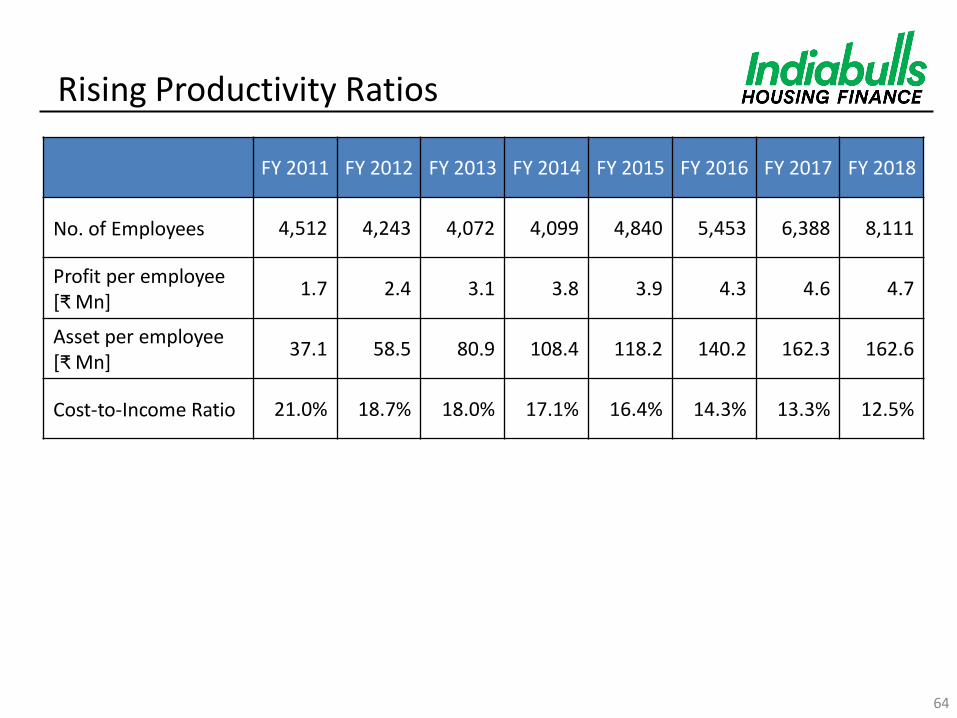
Rising Productivity Ratios
FY 2011 FY 2012 FY 2013 FY 2014 FY 2015 FY 2016 FY 2017 FY 2018
No. of Employees 4,512 4,243 4,072 4,099 4,840 5,453 6,388 8,111
Profit per employee [₹ Mn]
1.7 2.4 3.1 3.8 3.9 4.3 4.6 4.7
Asset per employee [₹ Mn]
37.1 58.5 80.9 108.4 118.2 140.2 162.3 162.6
Cost-to-Income Ratio 21.0% 18.7% 18.0% 17.1% 16.4% 14.3% 13.3% 12.5%
64
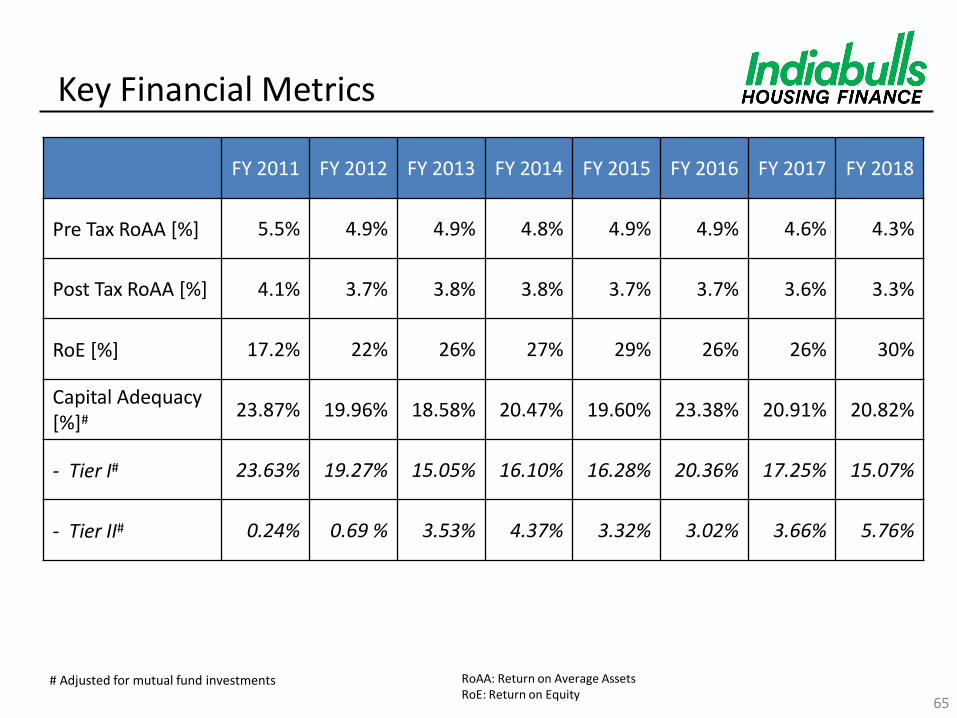
Key Financial Metrics
65
# Adjusted for mutual fund investments
FY 2011 FY 2012 FY 2013 FY 2014 FY 2015 FY 2016 FY 2017 FY 2018
Pre Tax RoAA [%] 5.5% 4.9% 4.9% 4.8% 4.9% 4.9% 4.6% 4.3%
Post Tax RoAA [%] 4.1% 3.7% 3.8% 3.8% 3.7% 3.7% 3.6% 3.3%
RoE [%] 17.2% 22% 26% 27% 29% 26% 26% 30%
Capital Adequacy [%]#
23.87% 19.96% 18.58% 20.47% 19.60% 23.38% 20.91% 20.82%
- Tier I# 23.63% 19.27% 15.05% 16.10% 16.28% 20.36% 17.25% 15.07%
- Tier II# 0.24% 0.69 % 3.53% 4.37% 3.32% 3.02% 3.66% 5.76%
RoAA: Return on Average Assets RoE: Return on Equity

66
Valuations and Returns
Mar-11 Mar-12 Mar-13 Mar-14 Mar-15 Mar-16 Mar-17 Mar-18
Market Price per Share [₹] 155 207 272 286 558 674 998 1,126*
Market Capitalisation [₹ Bn]
48.1 64.5 84.9 95.4 198.4 284.0 422.9 480.5
PE Ratio [times] 6.5 6.5 6.8 6.0 10.2 11.3 14.5 12.4
Dividend per Share [₹] # 10 13 20 29 35 36 36 42
Dividend Yield 6.5% 6.3% 7.4% 10.2% 6.3% 5.3% 3.6% 3.7%
Foreign Institutional Shareholding [%]
43.5% 38.7% 45.2% 41.1% 51.8% 58.9% 63.6% 53.9%
Domestic Institutional Shareholding [%]
3.3% 2.4% 3.6% 3.4% 3.3% 2.7% 4.8% 14.3%
*As on 13th July, 2018
# Normalized to reflect periods the dividends pertain to
PE: Price to Earnings [12 months trailing]
IBHFL is a part of Nifty 50, MSCI India and FTSE4Good indices

Shareholding Pattern
67 MF: Mutual Funds; IFI: Indian Financial Institutions As on 31st March, 2018
• Domestic institutional shareholding has increased 5.3x to 14.3% from 2.7% in March 2016
23.5%
53.9%
14.3%
8.3%
Founder Foreign Institutional Shareholding MFs/Banks/IFI Public
68
Detailed Financials
69
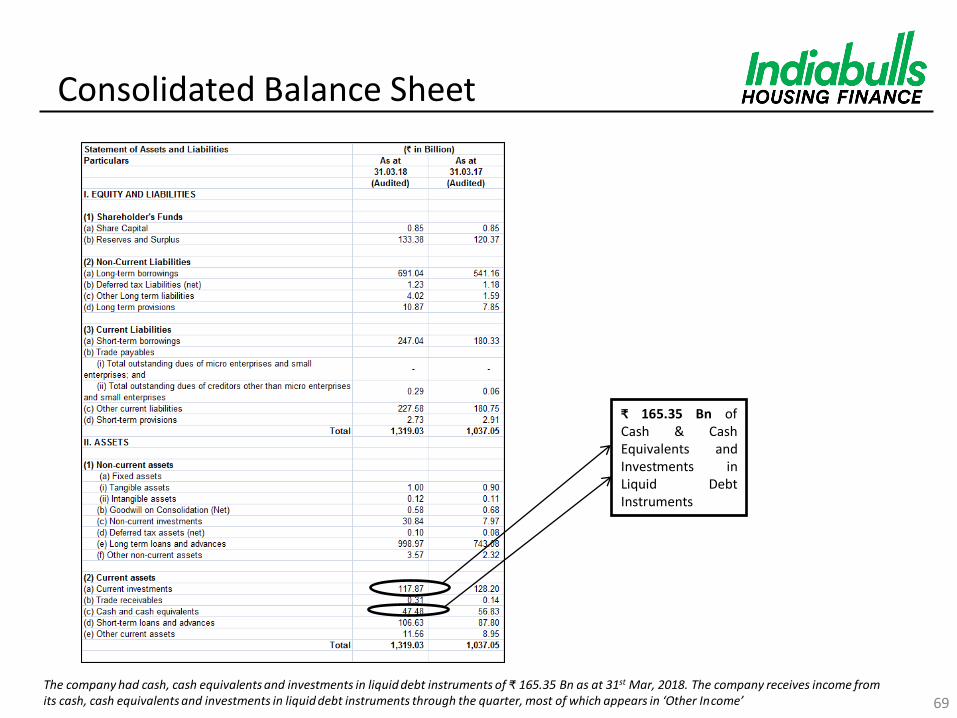
₹ 165.35 Bn of Cash & Cash Equivalents and Investments in Liquid Debt Instruments
Consolidated Balance Sheet
The company had cash, cash equivalents and investments in liquid debt instruments of ₹ 165.35 Bn as at 31st Mar, 2018. The company receives income from its cash, cash equivalents and investments in liquid debt instruments through the quarter, most of which appears in ‘Other Income’
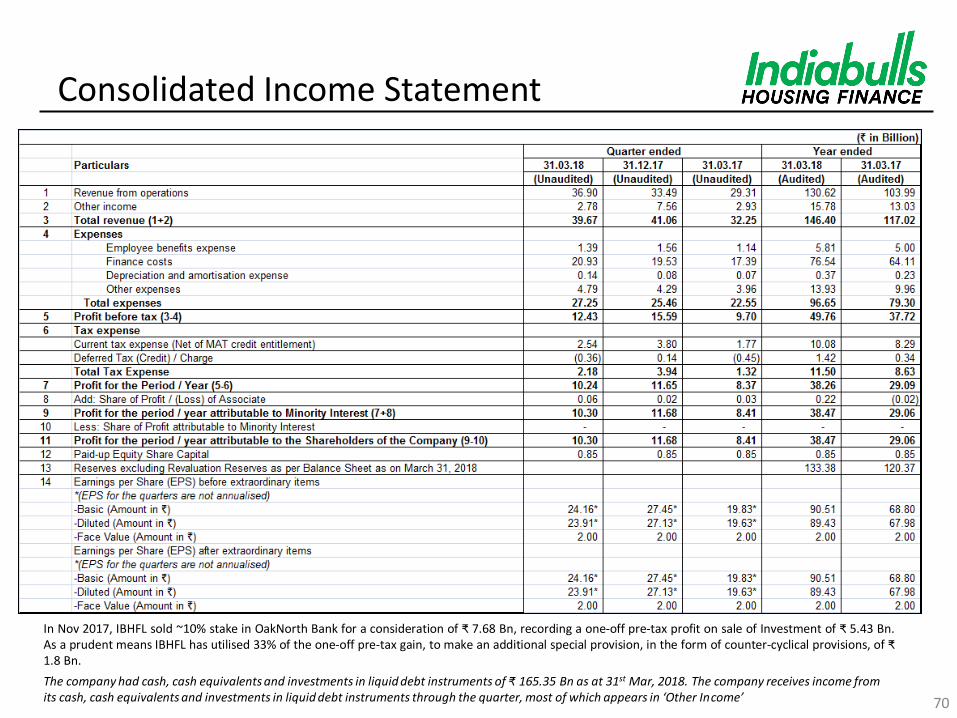
Consolidated Income Statement
70
In Nov 2017, IBHFL sold ~10% stake in OakNorth Bank for a consideration of ₹ 7.68 Bn, recording a one-off pre-tax profit on sale of Investment of ₹ 5.43 Bn. As a prudent means IBHFL has utilised 33% of the one-off pre-tax gain, to make an additional special provision, in the form of counter-cyclical provisions, of ₹ 1.8 Bn.
The company had cash, cash equivalents and investments in liquid debt instruments of ₹ 165.35 Bn as at 31st Mar, 2018. The company receives income from its cash, cash equivalents and investments in liquid debt instruments through the quarter, most of which appears in ‘Other Income’
71
Update on OakNorth Bank
Update on OakNorth Bank
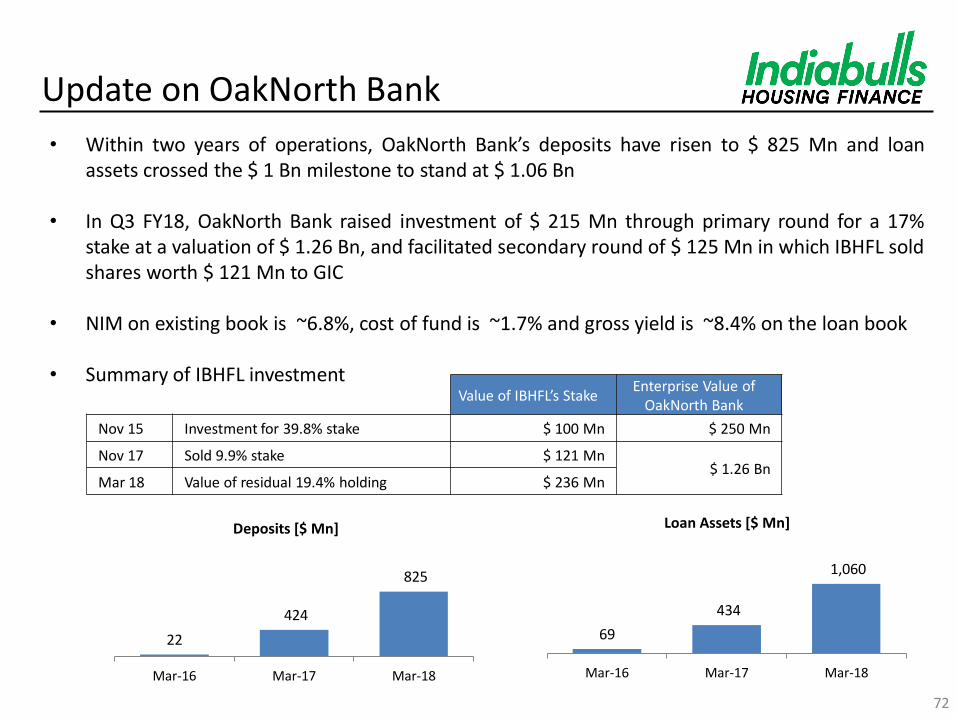
• Within two years of operations, OakNorth Bank’s deposits have risen to $ 825 Mn and loan assets crossed the $ 1 Bn milestone to stand at $ 1.06 Bn
• In Q3 FY18, OakNorth Bank raised investment of $ 215 Mn through primary round for a 17% stake at a valuation of $ 1.26 Bn, and facilitated secondary round of $ 125 Mn in which IBHFL sold shares worth $ 121 Mn to GIC
• NIM on existing book is ~6.8%, cost of fund is ~1.7% and gross yield is ~8.4% on the loan book
• Summary of IBHFL investment
72
22
424
825
Mar-16 Mar-17 Mar-18
Deposits [$ Mn]
69
434
1,060
Mar-16 Mar-17 Mar-18
Loan Assets [$ Mn]
Value of IBHFL’s Stake Enterprise Value of
OakNorth Bank
Nov 15 Investment for 39.8% stake $ 100 Mn $ 250 Mn
Nov 17 Sold 9.9% stake $ 121 Mn $ 1.26 Bn
Mar 18 Value of residual 19.4% holding $ 236 Mn

Thank you