Embed Size (px)
Citation preview

GOLD
R193
G173
B128
BLACK
R0
G0
B0
SAND
R219
G207
B149
GREEN
R171
G167
B17
ORANGE
R236
G129
B0
YELLOW
R250
G185
B0
RED
R141 G25
B8
BLUE
R70
G137
B164
Presented by
Alan Clark, Chief Executive
Domenic De Lorenzo, Chief Financial Officer

© SABMiller 2016
GOLD
R193
G173
B128
BLACK
R0
G0
B0
SAND
R219
G207
B149
GREEN
R171
G167
B17
ORANGE
R236
G129
B0
YELLOW
R250
G185
B0
RED
R141 G25
B8
BLUE
R70
G137
B164
1
This presentation includes ‘forward-looking statements’ with respect to certain of SABMiller plc’s plans, current goals and
expectations relating to its future financial condition, performance and results. These statements contain the words “anticipate”,
“believe”, “intend”, “estimate”, “expect” and words of similar meaning. All statements other than statements of historical facts
included in this presentation, including, without limitation, those regarding the Company’s financial position, business strategy,
plans and objectives of management for future operations (including development plans and objectives relating to the Company’s
products and services) are forward-looking statements. Such forward-looking statements involve known and unknown risks,
uncertainties and other important factors that could cause the actual results, performance or achievements of the Company to be
materially different from future results, performance or achievements expressed or implied by such forward-looking statements.
Such forward-looking statements are based on numerous assumptions regarding the Company’s present and future business
strategies and the environment in which the Company will operate in the future. These forward-looking statements speak only as at
the date of this document. The Company expressly disclaims any obligation or undertaking to disseminate any updates or revisions
to any forward-looking statements contained herein to reflect any change in the Company’s expectations with regard thereto or any
change in events, conditions or circumstances on which any such statement is based. The past business and financial
performance of SABMiller plc is not to be relied on as an indication of its future performance.
All references to “EBITA” in this presentation refer to earnings before interest, tax, amortisation of intangible assets (excluding
computer software) and exceptional items. EBITA also includes the group’s share of associates’ and joint ventures’ EBITA on the
same basis. All references to “organic” mean as adjusted to exclude the impact of acquisitions and disposals, while all references
to “constant currency” mean as adjusted to exclude the impact of movements in foreign currency exchange rates in the translation
of our results. References to “underlying” mean on an organic, constant currency basis.

© SABMiller 2016
GOLD
R193
G173
B128
BLACK
R0
G0
B0
SAND
R219
G207
B149
GREEN
R171
G167
B17
ORANGE
R236
G129
B0
YELLOW
R250
G185
B0
RED
R141 G25
B8
BLUE
R70
G137
B164
2
Underlying group NPR growth of 5%, with group NPR per hectolitre up 3%
Beverage volumes up 2%, with group lager volumes up 1%
Subsidiaries achieved 8% NPR growth with volumes up 5%
Increased H2 momentum, particularly in subsidiaries
Topline growth led by Africa and Latin America
Strong profitability performance against FX headwinds
Currency headwind of 17% to reported group EBITA
Underlying EBITA growth of 8% and margin expansion of 60 bps
Adjusted constant currency EPS up 12%
Full year dividend per share of 122 US cents, up 8% on prior year, with final
dividend of 93.75 US cents per share payable on 12 August 2016.1
1 AB InBev and SABMiller do not anticipate completion of the recommended acquisition prior to this date. The full year dividend and the
final dividend are permitted dividends within the terms of SABMiller and AB InBev’s joint Rule 2.7 announcement on 11 November 2015.

© SABMiller 2016
GOLD
R193
G173
B128
BLACK
R0
G0
B0
SAND
R219
G207
B149
GREEN
R171
G167
B17
ORANGE
R236
G129
B0
YELLOW
R250
G185
B0
RED
R141 G25
B8
BLUE
R70
G137
B164
− Agreement on the terms of a recommended acquisition of SABMiller by AB InBev
− Recommended cash offer of £44 per SABMiller share with partial share and cash alternative
− Subject to certain conditions including regulatory approvals in a number of jurisdictions and
shareholder approvals. Expected to complete in the second half of 2016
− Reverse break fee of US$3 billion payable to SABMiller in certain circumstances
− Upon acquisition of SABMiller, AB InBev has agreed the sale of:
− SABMiller’s 58% stake in MillerCoors to Molson Coors
− SABMiller’s 49% stake in China Resources Snow Breweries to China Resources Beer
− Peroni, Grolsch, Meantime and their related business to Asahi
3

© SABMiller 2016
GOLD
R193
G173
B128
BLACK
R0
G0
B0
SAND
R219
G207
B149
GREEN
R171
G167
B17
ORANGE
R236
G129
B0
YELLOW
R250
G185
B0
RED
R141 G25
B8
BLUE
R70
G137
B164
1 CAGR covering a period from 2014 to 2016 2 Core lager, excluding premium core lager brands 3 Only wheat beer, ales and stouts 4 Includes traditional beer and economy segment core lager (Africa only)
Improve
premium mix
Global Brands Volume: +9%
Extend refreshment
occasions
Capture wine and
spirits occasions3
Ensure affordability4
Traditional beer (Africa): +3%
Affordable for lager only: +40%
Key drivers in F16 subsidiaries’ volumes growth v prior year
+5%
+14% +11%
Grow core lager2
Classic Lager Brands: +2%
Easy Drinking Lager Brands: +13%
+4%
+22%
Extend Refreshment
Occasions
Flying Fish
CAGR1
+12%
Pilsner Urquell
Super Premium
Wine & Spirit
Occasions CAGR1
+23%
Fat Yak
CAGR1
+6%
Castle Lager
Core Lager
CAGR1
+99%
4

© SABMiller 2016
GOLD
R193
G173
B128
BLACK
R0
G0
B0
SAND
R219
G207
B149
GREEN
R171
G167
B17
ORANGE
R236
G129
B0
YELLOW
R250
G185
B0
RED
R141 G25
B8
BLUE
R70
G137
B164
5
Accelerated growth in volume, particularly in easy-drinking core lagers
Strong growth and LAE share gain in Colombia
Continued momentum of affordability initiatives in Honduras and El Salvador
Further NPR per hl expansion
Continued improvement in our premium mix, with strong global brands performance
Selective pricing, including Peru
EBITA margins constrained by transaction FX
Easy drinking brands volume
growth in the year
Pilsener Light
Aguila Light 22%
50%
2016
11%
2014
4%
21%
2015
Colombia - premium brands volume growth
© SABMiller 2016
GOLD
R193
G173
B128
BLACK
R0
G0
B0
SAND
R219
G207
B149
GREEN
R171
G167
B17
ORANGE
R236
G129
B0
YELLOW
R250
G185
B0
RED
R141 G25
B8
BLUE
R70
G137
B164
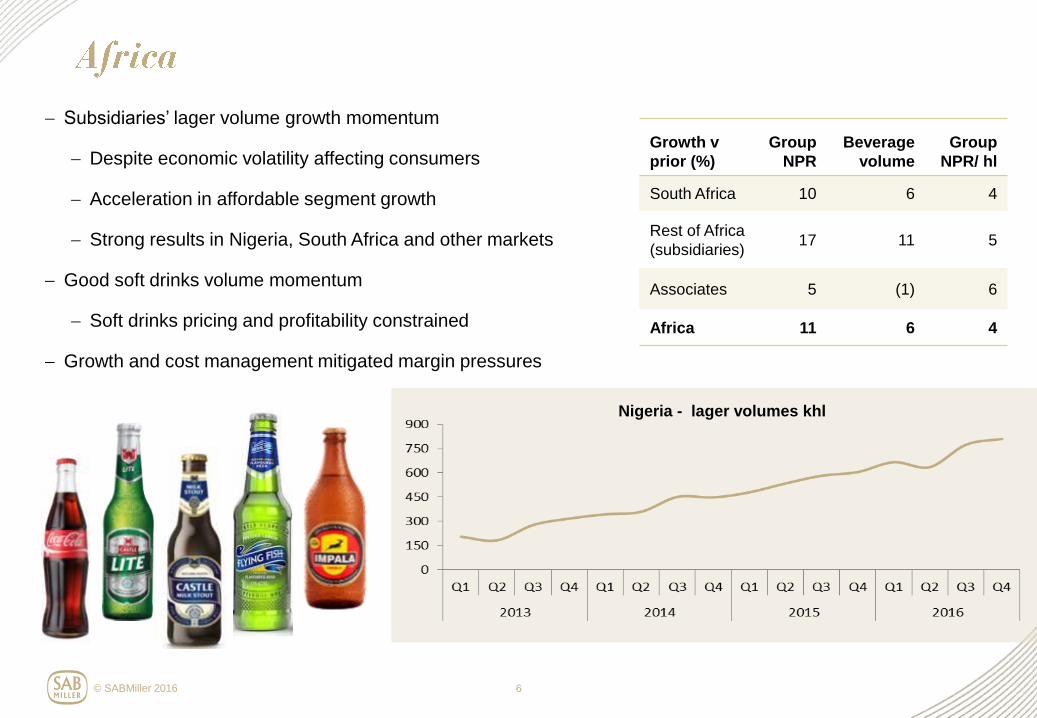
Subsidiaries’ lager volume growth momentum
Despite economic volatility affecting consumers
Acceleration in affordable segment growth
Strong results in Nigeria, South Africa and other markets
Good soft drinks volume momentum
Soft drinks pricing and profitability constrained
Growth and cost management mitigated margin pressures
6
Growth v
prior (%)
Group
NPR
Beverage
volume
Group
NPR/ hl
South Africa 10 6 4
Rest of Africa
(subsidiaries) 17 11 5
Associates 5 (1) 6
Africa 11 6 4
Nigeria - lager volumes khl

© SABMiller 2016
GOLD
R193
G173
B128
BLACK
R0
G0
B0
SAND
R219
G207
B149
GREEN
R171
G167
B17
ORANGE
R236
G129
B0
YELLOW
R250
G185
B0
RED
R141 G25
B8
BLUE
R70
G137
B164
Australia:
− CUB volume and market share growth
− NPR per hl up 3%
− Premium lager volumes up 16%
− Improved pricing
− Good profit growth, with higher margin
− Price/mix improvement
− Continuing cost optimisation
China:
− Consumer beer demand remains soft
− Continued shift to one-way packaging and ongoing premiumisation
7
121%
Yak family
67%
Peroni
family
Great
Northern
14%
Australia – premium brands volume growth
25%
2016 2015
26%
2014
30%
Australia – premium brands
share of lager volume

© SABMiller 2016
GOLD
R193
G173
B128
BLACK
R0
G0
B0
SAND
R219
G207
B149
GREEN
R171
G167
B17
ORANGE
R236
G129
B0
YELLOW
R250
G185
B0
RED
R141 G25
B8
BLUE
R70
G137
B164
Underlying volume trend improvement by our subsidiaries
Marked improvement in Poland and Czech in H2
Continued strong performance in Western Europe and Romania
Improved efficiency driving EBITA margin expansion
Efes decline in an increasingly difficult operating environment
8
1
2
3
4
2007 2009 2010 2008 2012 2011 2014 2013 2015 2016 2001 2002 2005 2003 2006 2004
Kozel volumes (m hl)
Domestic
International

© SABMiller 2016
GOLD
R193
G173
B128
BLACK
R0
G0
B0
SAND
R219
G207
B149
GREEN
R171
G167
B17
ORANGE
R236
G129
B0
YELLOW
R250
G185
B0
RED
R141 G25
B8
BLUE
R70
G137
B164
− MillerCoors’ volumes fell primarily due to economy segment weakness
− Sustained improvement in premium light brand performances
− Redd’s brand family in its third year of growth
− Continued growth of Blue Moon and Leinenkugel’s
− NPR per hl up 1%, with softer pricing environment and slower mix gains
Cost and efficiency management continues to drive EBITA margin expansion
9
MillerCoors
2016 premium light segment gains bps
MillerCoors
EBITA margin expansion
2016 80 bp
2015 100 bp
2014 140 bp 4040
7060
40303030
Q2 Q1 Q3 Q4
Miller Lite Coors Light source: Nielsen

© SABMiller 2016
GOLD
R193
G173
B128
BLACK
R0
G0
B0
SAND
R219
G207
B149
GREEN
R171
G167
B17
ORANGE
R236
G129
B0
YELLOW
R250
G185
B0
RED
R141 G25
B8
BLUE
R70
G137
B164
10
NPR growth2
Lager volume growth in
Africa and Latin America subsidiaries Subsidiaries’ NPR premium brands growth1
EBITA growth2
6%
1%1%
7%
4%
2%
2016 2015 2014
Africa Latin America
3%
2016
12%
2015
8%
2014
5%5%
3%
8%
6%
3%
2016 2015 2014
Subsidiaries
Group
8%
6%7%
10%
7%8%
2014 2016 2015
1 Constant currency 2 Organic, constant currency
GOLD
R193
G173
B128
BLACK
R0
G0
B0
SAND
R219
G207
B149
GREEN
R171
G167
B17
ORANGE
R236
G129
B0
YELLOW
R250
G185
B0
RED
R141 G25
B8
BLUE
R70
G137
B164
Domenic De Lorenzo,
Chief Financial Officer

© SABMiller 2016
GOLD
R193
G173
B128
BLACK
R0
G0
B0
SAND
R219
G207
B149
GREEN
R171
G167
B17
ORANGE
R236
G129
B0
YELLOW
R250
G185
B0
RED
R141 G25
B8
BLUE
R70
G137
B164
1Global brands: on a subsidiary basis, excluding home markets 2Includes traditional beer and Economy segment core lager in Africa 3Cummulative net cost reduction benefits achieved since March 2014
*On a subsidiary basis
Drive superior top-
line growth through
strengthening our brand
portfolios and expanding
the beer category
Build a globally integrated
organisation to optimise
resource, win in market
and reduce costs
Actively shape our
global mix to drive a
superior growth profile
1
2
3
Subsidiary lager NPR growth
Global brands NPR growth*1
Premium brands NPR growth*
Affordable segment volume growth*2
8%
13%
11%
22%
Group EBITA growth
Group EBITA margin expansion
Cumulative cost & efficiency3 savings
Net working capital % NPR improvement
8%
60bp
$547m
190bp
Coca-Cola Beverages Africa transaction approved, with
conditions, by the South African Competition Tribunal
% of EBITA from developing markets
Soft drinks volume growth
Capex: proportion of spend in Africa & Latam
69%
6%
75%

© SABMiller 2016
GOLD
R193
G173
B128
BLACK
R0
G0
B0
SAND
R219
G207
B149
GREEN
R171
G167
B17
ORANGE
R236
G129
B0
YELLOW
R250
G185
B0
RED
R141 G25
B8
BLUE
R70
G137
B164
1 for Adjusted EPS, constant currency excluding the impact of the Tsogo Sun disposal only
13
12%
8%
5%
2%
Group NPR EBITA Adjusted EPS Volumes
Organic, constant currency1

© SABMiller 2016
GOLD
R193
G173
B128
BLACK
R0
G0
B0
SAND
R219
G207
B149
GREEN
R171
G167
B17
ORANGE
R236
G129
B0
YELLOW
R250
G185
B0
RED
R141 G25
B8
BLUE
R70
G137
B164
1 for Adjusted EPS, constant currency excluding the impact of the Tsogo Sun disposal only
14
(6%)
(9%)(8%)
2%
12%
8%
5%
2%
EBITA Group NPR Volumes Adjusted EPS
Reported Organic, constant currency1

© SABMiller 2016
GOLD
R193
G173
B128
BLACK
R0
G0
B0
SAND
R219
G207
B149
GREEN
R171
G167
B17
ORANGE
R236
G129
B0
YELLOW
R250
G185
B0
RED
R141 G25
B8
BLUE
R70
G137
B164
1 The 2016 full year dividend and the final dividend are permitted dividends within the terms of SABMiller and AB InBev’s joint Rule 2.7 announcement on 11 November 2015
15
8%8%
4%
(6%)
(1%)
2%
F16 F15 F14 1
Year ended 31 March 2014 2015 2016
Adjusted EPS (US cents) 242.0 239.1 224.1
Dividend per share (US cents)1 105.0 113.0 122.0
Dividend cover 2.3x 2.1x 1.8x
Adjusted EPS Dividend per share growth
Reported growth v prior

© SABMiller 2016
GOLD
R193
G173
B128
BLACK
R0
G0
B0
SAND
R219
G207
B149
GREEN
R171
G167
B17
ORANGE
R236
G129
B0
YELLOW
R250
G185
B0
RED
R141 G25
B8
BLUE
R70
G137
B164
Beverage
volume
+2%
Lager
+1%
Other
+5%
Subsidiaries
+4%
Associates /
JVs
-3%
Subsidiaries
+7%
Associates /
JVs
+2%
Growth % H1 H2
Subsidiaries 3 7
Associates / JVs (3) (1)
Total 1 4
Total beverage volume growth v prior
16

© SABMiller 2016
GOLD
R193
G173
B128
BLACK
R0
G0
B0
SAND
R219
G207
B149
GREEN
R171
G167
B17
ORANGE
R236
G129
B0
YELLOW
R250
G185
B0
RED
R141 G25
B8
BLUE
R70
G137
B164
* on an organic, constant currency basis
8% 11% 3% 2% - NPR growth*
17
Gro
up
NP
R
Ye
ar
end
ed
31 M
arc
h 2
01
6 (
US
$ m
illio
ns)
(3,524)
Acquisitions
61
Mar 2016
organic,
constant
currency
24,149
North
America
(7) 1%
Latin
America
463
27,612
3%
5%
Mar 2015
(adj. for
disposals)
26,177
NPR growth +5%, volume +2%, price/mix +3%
Mar 2016
reported
FX
(1)%
Europe
73 2%
0%
Asia Pacific
111
4%
(1)%
Africa
795
4%
6%
Price / mix
Volume growth
5%
NPR growth +5%, volume +2%, price/mix +3%

© SABMiller 2016
GOLD
R193
G173
B128
BLACK
R0
G0
B0
SAND
R219
G207
B149
GREEN
R171
G167
B17
ORANGE
R236
G129
B0
YELLOW
R250
G185
B0
RED
R141 G25
B8
BLUE
R70
G137
B164
18
* on an organic, constant currency basis
60 bps (20) bps 10 bps 200 bps 60 bps 20 bps
North
America
18.5%
Europe
16.6%
Asia
Pacific
20.6%
Africa
25.2%
Latin
America
37.6%
Group
24.1%
margin expansion/(contraction)* bps
EBITA and growth* v prior EBITA margin and expansion v prior
865
636
753
1,708
1,959
Corporate
North America
Europe
Asia Pacific
Africa
Latin America
8%
1%
5%
13%
11%
5,810
(111)
7%

© SABMiller 2016
GOLD
R193
G173
B128
BLACK
R0
G0
B0
SAND
R219
G207
B149
GREEN
R171
G167
B17
ORANGE
R236
G129
B0
YELLOW
R250
G185
B0
RED
R141 G25
B8
BLUE
R70
G137
B164
Net cumulative C&E benefits of US$547 million achieved since March 2014
Represents 52% of 2020 target of US$1,050 million
19
Net cumulative cost savings of US$1,043 million realised since April 2010
496
547
547
221
496
321
15967
F12 F11 Cumulative
savings
since F11
326
F15 F14 F16 F13
1,043
162
92
175
Business capability programme (BCP)
original target cumulative savings
US$300m p.a. by F14
Cost & efficiency programme (C&E)
original target cumulative savings
US$500m p.a. by F18
Incremental in-year BCP benefits
Incremental in-year C&E benefits
(US
$ m
illio
ns)
Refer to the Cost and efficiency programme section on page 25 in the Appendix

© SABMiller 2016
GOLD
R193
G173
B128
BLACK
R0
G0
B0
SAND
R219
G207
B149
GREEN
R171
G167
B17
ORANGE
R236
G129
B0
YELLOW
R250
G185
B0
RED
R141 G25
B8
BLUE
R70
G137
B164
US$m (reported) March 16 March 15
Group EBITDA 7,097 7,762
Adjusted EBITDA1 6,114 6,677
Working capital inflow, incl. provisions 61 132
Capex2 (1,313) (1,572)
Free cash flow3 2,969 3,233
Free cash flow % Adjusted EBITDA 49% 48%
1 F15 Adjusted EBITDA excludes the receipt of the proceeds from the sale of the group’s investment in Tsogo Sun. Adjusted EBITDA comprises subsidiary EBITDA together with the group’s
share of MillerCoors’ EBITDA (refer to Preliminary Announcement). Given the significance of the MillerCoors business and the access to its cash generation, the inclusion of MillerCoors’
EBITDA provides a useful measure of the group’s overall cash generation. 2 Includes additions of intangible assets (excluding goodwill) and property, plant and equipment. 3 Comprises net cash generated from operating activities less cash paid for the purchase of property, plant and equipment, and intangible assets, net investments in existing associates and
joint ventures (in both cases only where there is no change in the group’s effective ownership percentage) and dividends paid to non-controlling interests plus cash received from the sale of
property, plant and equipment and intangible assets and dividends received.
− Adverse currency impact on reported Adjusted EBITDA of US$1,085 million
− Capex of US$1,313 million focused on investment behind growth markets in Africa and Latin America
− Adverse currency movements only partially offset by lower capex, tax and net interest paid
20

© SABMiller 2016
GOLD
R193
G173
B128
BLACK
R0
G0
B0
SAND
R219
G207
B149
GREEN
R171
G167
B17
ORANGE
R236
G129
B0
YELLOW
R250
G185
B0
RED
R141 G25
B8
BLUE
R70
G137
B164
1 This is the ratio of net debt as at 31 March 2016 to adjusted EBITDA (subsidiaries’ EBITDA plus the group’s share of MillerCoors’ EBITDA) for the financial year.
US$m March 16 March 15
Net debt (9,638) (10,465)
Gearing (%) 40.0 43.0
Net debt / Adjusted EBITDA1 1.6 1.6
Weighted average interest rate for
gross debt portfolio (%) 3.2 3.5
21
15%
4%
54% 10%
6%
11%
Other
Colombian peso
US dollar
Euro
Australian dollar
South Africa rand
Currency profile 31 March 2016

© SABMiller 2016
GOLD
R193
G173
B128
BLACK
R0
G0
B0
SAND
R219
G207
B149
GREEN
R171
G167
B17
ORANGE
R236
G129
B0
YELLOW
R250
G185
B0
RED
R141 G25
B8
BLUE
R70
G137
B164
22
1 Subsidiaries plus our share of MillerCoors 2 On a constant currency translational basis
We expect to deliver good underlying performance in the year ahead
We anticipate continuing volatility in key currencies against the US dollar, particularly in Africa
Input costs per hl1 expected to increase mid single digits2
For both total raw materials per hl and total COGS per hl
Full year capex is expected to be similar to prior years
Tax rate between 26% and 27%
Finance costs are expected to be broadly similar to the year just ended
Cost savings programme on track to achieve 2020 target of US$ 1,050 million

GOLD
R193
G173
B128
BLACK
R0
G0
B0
SAND
R219
G207
B149
GREEN
R171
G167
B17
ORANGE
R236
G129
B0
YELLOW
R250
G185
B0
RED
R141 G25
B8
BLUE
R70
G137
B164

GOLD
R193
G173
B128
BLACK
R0
G0
B0
SAND
R219
G207
B149
GREEN
R171
G167
B17
ORANGE
R236
G129
B0
YELLOW
R250
G185
B0
RED
R141 G25
B8
BLUE
R70
G137
B164

© SABMiller 2016
GOLD
R193
G173
B128
BLACK
R0
G0
B0
SAND
R219
G207
B149
GREEN
R171
G167
B17
ORANGE
R236
G129
B0
YELLOW
R250
G185
B0
RED
R141 G25
B8
BLUE
R70
G137
B164
Cost and efficiency programme
The following was announced on 9 October 2015:
“SABMiller announces that it has increased its target annual run rate cost savings from its cost and efficiency programme, announced in May 2014, from US$500 million by 31 March 2018 to at least
US$1,050 million by 31 March 2020.
“The cost and efficiency programme, which covers SABMiller’s integrated supply chain comprising procurement, manufacturing and distribution, delivered US$221 million of annualised savings in its first
year to 31 March 2015, and is expected to deliver in excess of US$430 million of annualised savings in its second year to 31 March 2016. The original target issued in 2014 was US$500 million
annualised savings by 2018.
“The increase in annual run rate cost savings announced today, of at least US$550 million, will further build on the initial success of the 2014 programme and bring the aggregate annual run rate cost
savings for this programme to at least US$1,050 million by 2020. This is across a total addressable cost base of approximately US$10 billion.
“The additional savings will come from SABMiller’s integrated supply chain, with approximately 70% of the additional savings announced today coming from procurement and 30% from manufacturing
and distribution. The savings will mainly be realised by:
− increasing the spend centrally managed by SABMiller’s specialist procurement team to at least 90%, from 46% in the year ended 31 March 2014 and 69% for the year ended 31 March 2015;
− completing the roll out of procurement operating models to increase efficiency through greater transparency, cost management, compliance and delivery of savings; and
− driving further efficiencies in manufacturing and distribution based on best in class benchmarks and standardised processes.
“SABMiller expects to incur incremental non-recurring costs of US$26 million in total by 2020 and no dis-benefits are expected to arise from the programme.”
Bases of belief and sources of information from the 9 October 2015 announcement:
The cost and efficiency programme announced and launched in 2014 delivered cost savings of US$221 million by 31 March 2015 as disclosed in SABMiller’s Annual Report and Accounts by reference
to a total addressable cost base for the year ended 31 March 2014 of approximately US$10 billion.
Total addressable cost base refers to all third party spend and labour force and infrastructure costs in manufacturing and distribution. The labour force costs in manufacturing include the group’s share of
relevant MillerCoors costs. The total addressable cost base excludes capital expenditure and depreciation.
The incremental cost savings estimates shown above are based on savings compared to the group's cost base for the year to 31 March 2015 which was not materially different from that for the year to
31 March 2014.
The estimated cost savings have been prepared based on internal information on costs by function, type and country and detailed analysis of the future operating model. The delivery of historical cost
reduction programmes has also been taken into account in preparing these estimates. The estimates have been prepared by functional and country teams, including senior executives in the organisation.
These programmes have been developed over the past 6-12 months and have included input from external consultants. In circumstances where data has been limited for commercial or other reasons,
estimates and assumptions have been developed to support the analysis.
In arriving at the Quantified Financial Benefits Statement, the directors of SABMiller have assumed that:
− there will be no change in the ownership or control of SABMiller;
− there will be no material change to macro-economic, political or legal conditions in the markets or regions in which in the SABMiller group operates which will materially impact on the implementation
of or costs to achieve the proposed cost savings; andthere will be no material change in exchange rates or commodity prices.
25

© SABMiller 2016
GOLD
R193
G173
B128
BLACK
R0
G0
B0
SAND
R219
G207
B149
GREEN
R171
G167
B17
ORANGE
R236
G129
B0
YELLOW
R250
G185
B0
RED
R141 G25
B8
BLUE
R70
G137
B164
All figures include our share of associates and joint ventures 1for adjusted EPS, constant currency adjusted for Tsogo Sun disposal only
26
Year ended 31 March 2016 Reported Organic, constant
currency1
Group net producer revenue (NPR) (8)% 5%
Group NPR per hl (10)% 3%
EBITA (9)% 8%
EBITA margin progression (10) Bps 60 bps
Adjusted EPS1 (6)% 12%
Year ended 31 March 2016 Reported Organic
Total volumes 2% 2%
Lager volumes 1% 1%
Soft drinks volumes 6% 6%

© SABMiller 2016
GOLD
R193
G173
B128
BLACK
R0
G0
B0
SAND
R219
G207
B149
GREEN
R171
G167
B17
ORANGE
R236
G129
B0
YELLOW
R250
G185
B0
RED
R141 G25
B8
BLUE
R70
G137
B164
27
Year ended 31 March 2016, year on year growth Group NPR
%
EBITA
%
Adjusted EPS
%
Reported growth rate (8.1) (8.7) (6.3)
Impact of currency translation 13.4 16.6 18.0
Reported, constant currency growth rate 5.3 7.9 11.7
Impact of acquisitions and disposals 0.2 0.3 0.7
Organic, constant currency growth rate1 5.5 8.2 12.4
All figures include our share of associates and joint ventures 1for adjusted EPS, constant currency adjusted for Tsogo Sun disposal only

© SABMiller 2016
GOLD
R193
G173
B128
BLACK
R0
G0
B0
SAND
R219
G207
B149
GREEN
R171
G167
B17
ORANGE
R236
G129
B0
YELLOW
R250
G185
B0
RED
R141 G25
B8
BLUE
R70
G137
B164
Figures prepared on a LTM organic, constant currency basis
28
4%
3%
7%
8%
6%
5%
2%
1%
0%
-1%
Total beverage
volumes
F16 Q4 F16 Q3 F16 Q2 F16 Q1
Total subsidiaries
lager volumes
Subsidiaries NPR
Group NPR
Total lager
volumes
8%
1%
5%
4%
2%

© SABMiller 2016
GOLD
R193
G173
B128
BLACK
R0
G0
B0
SAND
R219
G207
B149
GREEN
R171
G167
B17
ORANGE
R236
G129
B0
YELLOW
R250
G185
B0
RED
R141 G25
B8
BLUE
R70
G137
B164
29
Latin America
Year ended 31 March 2016
(US$ millions / k hectolitres)
2016 2015
Reported
growth
%
Organic*
growth
%
Total beverage volume 67,239 64,021 5 5
of which:
Lager volume 46,627 44,156 6 6
Soft drinks volume 20,612 19,865 4 4
Group NPR 5,211 5,768 (10) 8
Group NPR / hl 77 90 (14) 3
EBITA 1,959 2,224 (12) 7
EBITA margin (%) 37.6% 38.6% (100) bps (20) bps
Lager volume growth
underpinned by our affordability
strategy together with targeting
new consumption occasions and
increasing frequency.
Group NPR per hl
driven by selective price
increases and favourable brand
mix, with premium segment
volumes up 7%.
Margin contraction of 20 bps
transactional currency pressure
on imported raw materials, offset
fixed cost productivity and
improved efficiencies in
manufacturing and distribution.
* Organic, constant currency growth

© SABMiller 2016
GOLD
R193
G173
B128
BLACK
R0
G0
B0
SAND
R219
G207
B149
GREEN
R171
G167
B17
ORANGE
R236
G129
B0
YELLOW
R250
G185
B0
RED
R141 G25
B8
BLUE
R70
G137
B164
30
Africa
Year ended 31 March 2016
(US$ millions / k hectolitres)
2016 2015
Reported
growth
%
Organic*
growth
%
Total beverage volume 96,364 90,932 6 6
of which:
Lager volume 50,803 48,413 5 5
Soft drinks volume 37,786 34,901 8 8
Group NPR 6,781 7,462 (9) 11
Group NPR / hl 70 82 (14) 4
EBITA 1,708 1,907 (10) 11
EBITA margin (%) 25.2% 25.6% (40) bps 10 bps
Topline growth
Supported by our affordability
strategy, selective price increases
and continued premiumisation in
South Africa. Premium segment
growth of 11% in the region.
More challenging macro-
economic backdrop
Currency depreciation, increasing
inflation and economic volatility
have affected key markts in the
region and put pressure on EBITA
margin.
Footprint expansion
Continued capital investment in
the region, with increased
brewery capacity in Nigeria and
Ghana and construction of new
malting plants in South Africa and
Zambia.
* Organic, constant currency growth

© SABMiller 2016
GOLD
R193
G173
B128
BLACK
R0
G0
B0
SAND
R219
G207
B149
GREEN
R171
G167
B17
ORANGE
R236
G129
B0
YELLOW
R250
G185
B0
RED
R141 G25
B8
BLUE
R70
G137
B164
31
Asia Pacific
Year ended 31 March 2016
(US$ millions / k hectolitres)
2016 2015
Reported
growth
%
Organic*
growth
%
Total beverage volume1 70,343 71,273 (1) (1)
of which:
Lager volume 70,255 71,180 (1) (1)
Group NPR 3,650 3,867 (6) 3
Group NPR / hl 52 54 (4) 4
EBITA 753 768 (2) 13
EBITA margin (%) 20.6% 19.9% 70 bps 200 bps
Group NPR increased by 3%
driven by price realisation and
premiumisation, with group
NPR/hl up 4%. Improved
beverage volume momentum in
the second half with Australia up
3%.
Premiumisation and innovation
Premium lager segment volume
growth was 19%2, primarily
reflecting the focus on
rebalancing the portfolio in
Australia, supported by product
innovation.
EBITA margin expansion
EBITA growth of 13% with margin
expansion of 200 bps reflecting
price realisation in Australia,
positive mix and continued cost
optimisation and efficiency
across the region.
* Organic, constant currency growth 1 Soft drinks volume immaterial 2 Subsidiaries only

© SABMiller 2016
GOLD
R193
G173
B128
BLACK
R0
G0
B0
SAND
R219
G207
B149
GREEN
R171
G167
B17
ORANGE
R236
G129
B0
YELLOW
R250
G185
B0
RED
R141 G25
B8
BLUE
R70
G137
B164
32
Europe
Year ended 31 March 2016
(US$ millions / k hectolitres)
2016 2015
Reported
growth
%
Organic*
growth
%
Total beverage volume 58,923 59,088 - -
of which:
Lager volume 43,147 43,595 (1) (1)
Soft drinks volume 15,776 15,493 2 2
Group NPR 3,832 4,398 (13) 2
Group NPR / hl 65 74 (13) 2
EBITA 636 700 (9) 5
EBITA margin (%) 16.6% 15.9% 70 bps 60 bps
Topline growth held back by
Poland and Efes
Excluding Poland, subsidiary NPR
up 6% with NPR/hl up 2% in what
continues to be a relatively low
inflationary environment.
EBITA growth and margin
expansion
Cost reductions achieved through
our cost and efficiency
programme supported subsidiary
EBITA growth of 6% and mitigated
the EBITA decline of 3% in our
associates.
Poland recovery plan
Challenging first half reflected
significant competitor activity.
Second half lager volume up 6%
underpinned by a strengthened
and streamlined sales model
which supported sequential
improvements in market share.
* Organic, constant currency growth

© SABMiller 2016
GOLD
R193
G173
B128
BLACK
R0
G0
B0
SAND
R219
G207
B149
GREEN
R171
G167
B17
ORANGE
R236
G129
B0
YELLOW
R250
G185
B0
RED
R141 G25
B8
BLUE
R70
G137
B164
33
North America
Year ended 31 March 2016
(US$ millions / k hectolitres)
2016 2015
Reported
growth
%
Organic*
growth
%
Total beverage volume** 37,999 38,548 (1) (1)
of which:
Lager volume 37,960 38,508 (1) (1)
Group NPR 4,676 4,682 - -
Group NPR / hl 123 121 1 1
EBITA 865 858 1 1
EBITA margin (%) 18.5% 18.3% 20 bps 20 bps
Group NPR in line with prior
as lower sales volumes were
offset by favourable sales mix and
favourable net pricing in
MillerCoors.
Positive sales mix
driven by recovery in our premium
lights segment (continued share
gain), further supported by growth
in above premium through Redd‘s
and the launch of Henry‘s Hard
Soda brand in the fourth quarter.
EBITA and margin growth
Strong margin expansion of 80
bps in MillerCoors was partially
offset by increased investment to
support the expansion of our
operations in Brazil and Canada.
The MillerCoors performance
reflected the lower cost of
commodities and production
process efficiencies. * Organic, constant currency growth
** Soft drinks volume immaterial
GOLD
R193
G173
B128
BLACK
R0
G0
B0
SAND
R219
G207
B149
GREEN
R171
G167
B17
ORANGE
R236
G129
B0
YELLOW
R250
G185
B0
RED
R141 G25
B8
BLUE
R70
G137
B164

© SABMiller 2016
GOLD
R193
G173
B128
BLACK
R0
G0
B0
SAND
R219
G207
B149
GREEN
R171
G167
B17
ORANGE
R236
G129
B0
YELLOW
R250
G185
B0
RED
R141 G25
B8
BLUE
R70
G137
B164
35
Non GAAP summary table (EBITA and EBITDA shown before exceptionals). Note: Financial definitions are available in the Preliminary Announcement, including non-GAAP metrics. 1 All figures reported except Adjusted EPS in constant currency (US cents) and Adjusted constant currency EPS growth 2 Comprises net cash generated from operating activities less cash paid for the purchase of property, plant and equipment, and intangible assets, net investments in existing associates
and joint ventures (in both cases only where there is no change in the group’s effective ownership percentage) and dividends paid to non-controlling interests plus cash received from
the sale of property, plant and equipment and intangible assets and dividends received. 35
Year ended 31 March 2016 2014 2015 2016
Lager volumes (hl’m) 245 246 249
Total volumes (hl’m) 318 324 331
Group net producer revenue (NPR) 26,719 26,288 24,149
Group EBITA 6,460 6,367 5,810
Group EBITA margin 24.2% 24.2% 24.1%
Group EBITDA 7,884 7,762 7,097
Group EBITDA margin 29.5% 29.5% 29.4%
Adjusted earnings 3,865 3,835 3,604
Adjusted EPS (US cents) 242.0 239.1 224.1
Adjusted EPS in constant currency (US cents) n/a 253.9 267.0
Adjusted constant currency EPS growth n/a 5% 12%
Dividend per share (US cents) 105.0 113.0 122.0
Capital expenditure (subsidiaries only) 1,485 1,572 1,313
Free cash flow2 2,563 3,233 2,969
Net debt (subsidiaries only) 14,303 10,465 9,638
Effective tax rate (%) 26.0 26.0 26.3%

© SABMiller 2016
GOLD
R193
G173
B128
BLACK
R0
G0
B0
SAND
R219
G207
B149
GREEN
R171
G167
B17
ORANGE
R236
G129
B0
YELLOW
R250
G185
B0
RED
R141 G25
B8
BLUE
R70
G137
B164
22%
28%
15%
16%
19%
36
1 before corporate costs
33%
29%
13%
11%
14%
Latin America Africa Asia Pacific Europe North America
Group NPR
Year ended 31 March 2016
EBITA

© SABMiller 2016
GOLD
R193
G173
B128
BLACK
R0
G0
B0
SAND
R219
G207
B149
GREEN
R171
G167
B17
ORANGE
R236
G129
B0
YELLOW
R250
G185
B0
RED
R141 G25
B8
BLUE
R70
G137
B164
37
Organic, constant currency growth %
Year ended 31 March 2016
Latin
America Africa
Asia
Pacific Europe
North
America Group
Total beverage volume 5 6 (1) - (1) 2
Lager volume 6 5 (1) (1) (1) 1
Soft drinks volume 4 8 - 2 (3) 6
Group NPR 8 11 3 2 - 5
Group NPR / hl 3 4 4 2 1 3
EBITA 7 11 13 5 1 8
EBITA margin (bps change) (20) 10 200 60 20 60

© SABMiller 2016
GOLD
R193
G173
B128
BLACK
R0
G0
B0
SAND
R219
G207
B149
GREEN
R171
G167
B17
ORANGE
R236
G129
B0
YELLOW
R250
G185
B0
RED
R141 G25
B8
BLUE
R70
G137
B164
1 before exceptionals
Non GAAP summary table (EBIT, EBITA and EBITDA shown before exceptionals).
Note: Financial definitions are available in the Preliminary Announcement, including non-GAAP metrics.
38
Year ended
31 March 2016
(US$m)
Latin America Africa Asia Pacific Europe North America Corporate Group
Group revenue 7,018 8,250 4,973 5,092 5,317 - 30,650
Excise and similar taxes (1,807) (1,469) (1,323) (1,260) (642) - (6,501)
Group NPR 5,211 6,781 3,650 3,832 4,675 - 24,149
Group EBITDA1 2,233 2,077 963
895 1,004 (75) 7,097
Depreciation (274) (369) (210) (259) (139) (36) (1,287)
EBITA1 1,959 1,708 753 636 865 (111) 5,810
less: Amortisation
(excl. computer software) (86) (15) (154) (47) (48) - (350)
EBIT1 1,873 1,693 599 589 817 (111) 5,460
Exceptionals in EBIT - (422) 29 - (68) (196) (657)
Operating profit 1,873 1,271 628 589 749 (307) 4,803

© SABMiller 2016
GOLD
R193
G173
B128
BLACK
R0
G0
B0
SAND
R219
G207
B149
GREEN
R171
G167
B17
ORANGE
R236
G129
B0
YELLOW
R250
G185
B0
RED
R141 G25
B8
BLUE
R70
G137
B164
Year ended 31 March
2016
(US$m)
Latin America
Africa Asia
Pacific Europe
North America
Corporate Subs. Share of MC JV
Subs + Share of MC JV
Other Assocs./
JVs
Total Group
Group revenue 7,018 6,126 2,793 3,721 175 - 19,833 5,142 24,975 5,675 30,650
Excise and similar taxes
(1,807) (1,160) (1,061) (906) (4) - (4,938) (638) (5,576) (925) (6,501)
Group NPR 5,211 4,966 1,732 2,815 171 - 14,895 4,504 19,399 4,750 24,149
Group EBITDA1 2,233 1,576 649 727 (5) (75) 5,105 1,009 6,114 983 7,097
Depreciation (274) (249) (62) (195) - (36) (816) (139) (955) (332) (1,287)
EBITA1 1,959 1,327 587 532 (5) (111) 4,289 870 5,159 651 5,810
less: Amortisation
(excl. computer software)
(86) (15) (153) (21) (4) - (279) (44) (323) (27) (350)
EBIT1 1,873 1,312 434 511 (9) (111) 4,010 826 4,836 624 5,460
Exceptionals in EBIT - (389) 29 - - (196) (556) (68) (624) (33) (657)
Operating profit 1,873 923 463 511 (9) (307) 3,454 758 4,212 591 4,803
39
1 before exceptionals
Non GAAP summary table (EBIT, EBITA and EBITDA shown before exceptionals).
Note: Financial definitions are available in the Preliminary Announcement, including non-GAAP metrics.
© SABMiller 2016
GOLD
R193
G173
B128
BLACK
R0
G0
B0
SAND
R219
G207
B149
GREEN
R171
G167
B17
ORANGE
R236
G129
B0
YELLOW
R250
G185
B0
RED
R141 G25
B8
BLUE
R70
G137
B164
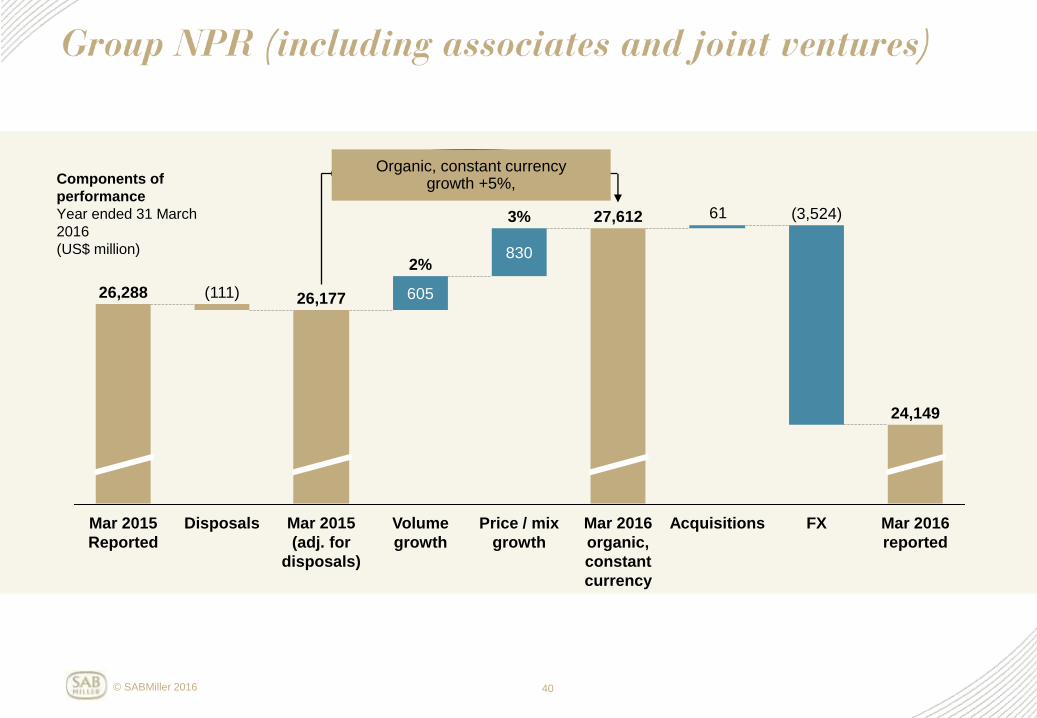
40
Components of
performance
Year ended 31 March
2016
(US$ million)
61
830
605
(3,524)
Acquisitions
24,149
FX
Organic, constant currency growth +5.5%,
Mar 2016
reported
27,612
Price / mix
growth
3%
Volume
growth
2%
Mar 2015
(adj. for
disposals)
26,177
Disposals
(111)
Mar 2015
Reported
26,288
Mar 2016
organic,
constant
currency
Organic, constant currency growth +5%,

© SABMiller 2016
GOLD
R193
G173
B128
BLACK
R0
G0
B0
SAND
R219
G207
B149
GREEN
R171
G167
B17
ORANGE
R236
G129
B0
YELLOW
R250
G185
B0
RED
R141 G25
B8
BLUE
R70
G137
B164
41
Components of
performance
Year ended 31 March
2016
(US$ million)
12
517
Organic, constant currency growth +8.2%,
Mar 2016
reported
5,810
FX
(1,054)
Acquisitions Mar 2016
organic,
constant
currency
6,852
Underlying
growth
Mar 2015 (adj.
for disposals)
6,335
Disposals
(32)
Mar 2015
Reported
6,367
Organic, constant currency growth +8%

© SABMiller 2016
GOLD
R193
G173
B128
BLACK
R0
G0
B0
SAND
R219
G207
B149
GREEN
R171
G167
B17
ORANGE
R236
G129
B0
YELLOW
R250
G185
B0
RED
R141 G25
B8
BLUE
R70
G137
B164
42
Year ended 31 March 2016
Average rate* Appreciation/ (Depreciation)
Closing rate Appreciation/ (Depreciation)
2016 2015 % 2016 2015 %
Australian dollar (AUD) 1.36 1.15 (16) 1.31 1.31 1
South African rand (ZAR) 13.78 11.08 (20) 14.77 12.13 (18)
Colombian peso (COP) 2,922 2,097 (28) 3,022 2,576 (14)
Euro (€) 0.90 0.78 (13) 0.88 0.93 6
Czech koruna (CZK) 24.66 21.56 (13) 23.76 25.59 8
Peruvian nuevo sol (PEN) 3.29 2.90 (12) 3.31 3.10
(7)
Polish zloty (PLN) 3.81 3.26 (15) 3.73 3.80 2
Turkish lira (TRY) 2.81 2.22 (21) 2.82 2.60 (8)
* Revenue weighted average rates

© SABMiller 2016
GOLD
R193
G173
B128
BLACK
R0
G0
B0
SAND
R219
G207
B149
GREEN
R171
G167
B17
ORANGE
R236
G129
B0
YELLOW
R250
G185
B0
RED
R141 G25
B8
BLUE
R70
G137
B164
43
Year ended 31 March 2016
8%
Dividend per
share (US dollar)
EPS (South
Africa rand)
17%
EPS (British
pounds)
1%
EPS (US dollar)
(6)%

GOLD
R193
G173
B128
BLACK
R0
G0
B0
SAND
R219
G207
B149
GREEN
R171
G167
B17
ORANGE
R236
G129
B0
YELLOW
R250
G185
B0
RED
R141 G25
B8
BLUE
R70
G137
B164