Embed Size (px)
Citation preview

So you want to level up?Paul SwinneyJune 2021

About Centre for Cities
Centre for Cities is a research and policy institute dedicated to improving the economicsuccess of UK cities and large towns.
We are a charity that works with local authorities, business and Whitehall to develop andimplement policy that supports the performance of urban economies. We do this throughimpartial research and knowledge exchange.
For more information, please visit www.centreforcities.org/about
About the author
Paul Swinney, Director of Policy and Research [email protected]
Partnerships
Centre for Cities is always keen to work in partnership with like-minded organisations whoshare our commitment to helping cities to thrive, and supporting policy makers to achievethat aim.
As a registered charity (No 1119841) we rely on external support to deliverour programme of quality research and events.
To find out more please visit: www.centreforcities.org/about/partnerships

Centre for Cities • So you want to level up? • June 2021
3
00Executive summary
This Government’s ambition to ‘level up’ is well known and was a central promise in theDecember 2019 election. While it is a phrase that is much used, it is one that has not yetbeen defined. And, because there are inequalities on many measures across the country,it has been inferred to mean a great many things.
In advance of the forthcoming Levelling Up White Paper, this briefing sets out whatlevelling up should achieve and how the Government should go about achieving it. Itargues that levelling up should have the following goals:
1. Level up standards of living across the country. There is no inherent reason whyone part of the country should have poorer skills or lower life expectancy than another.There are direct levers the Government can pull to change this.
2. Help every place reach its ‘productivity potential.’ The scale of this challenge variesacross the country, as does the gap between current and potential performance, and solevelling up the economy cannot mean making everywhere the same.
Productivity potential varies because different parts of the country play very differentroles in the economy. While we should want rural Cornwall, for example, to perform asbest as it possibly can, we should not expect it to be as productive as central Manchester.These differences come about because of the inherent advantages that different parts ofthe country offer to businesses. Cornwall offers spectacular scenery. Manchester offersaccess to a large number of workers and a network of other businesses to interact with,particularly in its city centre. There is very little governments can do to change theseinherent advantages, despite what politicians are fond of promising.
The problem for the UK economy is that most of its big cities make very poor use of theirinherent advantages, and they trail far behind their comparators such as Munich andMilan as a result. We should expect big productivity differences between Manchester andCumbria but we should not expect them between Manchester and Bristol. Currently,neither of these things is true. This weighs heavily on both regional prosperity and the

Centre for Cities • So you want to level up? • June 2021
4
performance of the national economy, costing the latter close to an estimated £50 billionper year.
So while it is right to improve Hartlepool’s economy, for example, as much as policy hasthe power to do so, the message to the Government is clear: it will not level up theeconomy unless it tackles the underperformance of Birmingham, Manchester andGlasgow in particular. This is sometimes seen as an argument for ignoring smallerplaces. It is not – it is a plea not to ignore the long-running underperformance of some ofBritain’s largest economies.
The good news for policy-makers is that the much stronger performance of equivalentlarge cities on the continent shows that this is very much achievable. To do so, it needs toimprove the benefits that these cities offer to businesses to make them more attractiveplaces for the private sector to invest.
To deliver on both of these goals, the Government should:
Increase skills spending in parts of the country that lag the current nationalaverage.
•
End austerity for local government to improve the day-to-day services that peopleacross the country experience.
•
Reform local government and devolve powers to give local areas more power overservices and spending.
•
Facilitate bus franchising across the country to improve services, but focustransport infrastructure predominantly in and around big cities where pressure onthe network is greatest.
•
Invest in struggling city centres to make them more attractive places to dobusiness through a City Centre Productivity Fund.
•
Target R&D spending in places that currently underperform but have enoughexisting activity to suggest that increased public spending would have greatestimpact.
•

Centre for Cities • So you want to level up? • June 2021
5
01Introduction
This autumn the Government will publish its Levelling Up White Paper, which will set outhow it intends to deliver on a slogan that has been the keystone of commentary and visionfor its domestic policy.
This White Paper and the clarity it intends to bring will be much welcome. While theGovernment speaks frequently of levelling up, it is as yet undefined, which has meant thatministers have struggled both to articulate what it means and what they hope to achievewhen questioned.
There have been a number of policies badged under the levelling up banner, such as theLevelling Up Fund and freeports. But the lack of definition and strategy for delivering on awell-defined aim has meant that policy action so far has boiled down to ad-hoc pots ofmoney or, in the case of freeports or the civil service campus in Darlington, symbolicprizes for a handful of areas. These policy actions have not matched up to theGovernment’s stated ambition in its recent Plan for Growth to have one internationallycompetitive city per region.
This briefing sets out what levelling up should aim to achieve and a strategy for achievingit. It argues that it should look to improve living standards and opportunity everywhere,especially in places where it is lagging on a range of metrics, but that key elements shouldbe focused on the underperformance of cities.
1

Centre for Cities • So you want to level up? • June 2021
6
02What is the problem?
There is variation across the country on a range of indicators
Looking at maps of a whole range of indicators shows why there is a political desire tolevel up the country. Figure 1 picks out three – life expectancy, the share of people withno formal qualifications, and productivity – and shows that there is variation across thecountry in all three.
Figure 1: The North lags the South on a range of indicators
Source: ONS

Centre for Cities • So you want to level up? • June 2021
7
For example:
These are stark differences. And the likely immediate reaction of any policymaker will bea desire to reduce these differences. But they must be circumspect in the ability of policyto be able to do this.
In principle, a policy of levelling up can even out the maps of life expectancy and skills.This is because there is no fundamental reason why someone living in one part of thecountry is more likely to have no formal qualifications than in another part, for example.There is no reason why geography should be a driver of these patterns.
To do so, the Government could set a floor target to pull every local authority above interms of life expectancy and skills. It could then pull a number of direct levers to achievethis. For example, it could commit more funds to further education in places where theshare of people with no formal qualifications is particularly high and it could commit moreresources (and/or introduce reform) to NHS services where life expectancy is low, alongwith more money to fund day-to-day public services to support this.
While we should not accept the current variation in productivity,we should both expect to see, and be comfortable with,differences in it
We should, however, expect to see variation in the productivity map because differentlocations in the country play different roles in the national economy. This means thatlooking at a map of productivity is misleading because it does not compare like with like.Instead we should be comparing and contrasting urban with urban and rural with rural,rather than expecting them to all be equal.
The roles different places play results from the inherent benefits (and costs) that theyoffer to businesses. Where businesses locate depends on their trade-off of costs andbenefits that a location offers.
Broadly, cities offer access – access to workers, access to customers and access toknowledge through the face-to-face interactions that cities and city centres in particularencourage. But costs tend to be higher too, for example through rents, congestion andpollution. More knowledge-based service activities tend to favour these benefits over thecosts because the benefits make them more productive. This is why the 62 largest cities
Health – the average male resident in Westminster lives 10 years more thansomeone in Glasgow local authority.
•
Skills – In 2019, 30 per cent of working-age people did not have five good GCSEsor equivalent in Barrow-on-Furness, and 22 per cent had degree. This comparesto 9 per cent and 59 per cent respectively in St Albans.
•
Productivity – on average, a worker in Milton Keynes produced in three days whata worker in Blackburn takes five days to produce in 2018.
•
2
3

Centre for Cities • So you want to level up? • June 2021
8
and towns in Britain account for 9 per cent of land, but 59 per cent of jobs and 71 percent of knowledge-based services jobs. In contrast, 49 per cent of jobs in productionfirms, which prioritise cheaper land and access to road transport, are in these 62 places
This pattern results from what is known as agglomeration, which is discussed in moredetail in Box 1, and explains why such a disproportionate share of the economy is found incity centres in particular.
4
Centre for Cities • So you want to level up? • June 2021
9
Box 1: How agglomeration affects the location of businesses withincities
Agglomeration is the process by which concentrating economic activity in one placeincreases the productivity of that activity. Benefits are characterised into threetypes: learning, which reflects the ability to share ideas and information; sharing,the sharing of inputs such as roads and broadband; and matching, the matching ofworkers to jobs and jobs to workers.
These benefits of agglomeration play out over very different geographies.
On the latter, this is why we see much activity – and high-skilled activity in particular– locate within city centres. In 2015, city centres in Britain collectively accounted for0.1 per cent of all land. But they accounted for 14 per cent of all jobs and 25 percent of all jobs in more productive services businesses.
The firms most influenced by agglomeration are ‘exporting’ businesses – those thatsell to regional, national and international markets. Because they sell to so manymarkets, they are more likely to choose their location based on the benefits andcosts set out above.
The location of local services businesses, on the other hand (such as hairdressersand restaurants), is instead governed by where their customer base is located.Their location decisions are much less likely to be directly influenced byagglomeration, and more by centres of population.
It is exporter businesses, and high-skilled ones in particular, that are crucial fordetermining productivity because of their ability to absorb new innovations. Thatmeans that its ability to attract or grow its exporting base determines the overallproductivity performance of a city.
5
The labour pool that businesses have access to stretches well beyond itsboundaries. Although this is likely to vary depending on geography, previousresearch suggests that this effect extends up to a drive time of 80 minutesfrom a British city, with the effect becoming weaker as distance from a cityincreases.
•
6
The ability to exchange ideas and information, known as ‘knowledgespillovers’ tends to operate over very small geographies. For example, forthe advertising industry in Manhattan it has been estimated that theseknowledge spillovers operate over a distance of just over 750 metres, whileother research finds that these agglomeration effects are strongest over adistance of one mile.
•
7
8
9

Centre for Cities • So you want to level up? • June 2021
10
Crucially for levelling up, while the Government can introduce policies to enhancethese existing benefits, fundamentally it cannot intervene to make every place havethese benefits (beyond building a new large city in Cornwall, say). This limits the power ofpolicy to influence where firms locate, despite politicians frequently claiming theopposite.
In making the most of these benefits (and offsetting higher costs), the theory ofagglomeration says that city-based businesses should be more productive than firmselsewhere. Manchester should be far more productive than Cumbria.
In the UK though this theory only holds in the Greater South East. Cities in this part of thecountry are more productive than their non-urban neighbours, as Figure 2 shows. But thisis not the case everywhere in the country. While Cities and large towns elsewhere aremore productive than more remote areas, but not more productive than their immediateneighbours. Surprisingly, these cities (such as Bradford and Newcastle) are lessproductive on average than even some of the more rural parts of the Greater South East(such as King’s Lynn and West Norfolk and West Suffolk).
Figure 2: Cities elsewhere in Britain lag behind those in the Greater SouthEast
Source: ONS
Note: Four local authorities that border a city have been classed as more rural because of their size. These are CountyDurham, Northumberland, Scottish Borders and Powys.
Big cities sit at the heart of regional productivity woes
The main cause of this gap in performance is the lagging performance of the biggestcities. Previous Centre for Cities’ research shows that the main difference between urbanBritain and cities in France, Germany and the US is that as a group, productivity in largercities in Britain lags the national average, rather than leading it.
10
11
Centre for Cities • So you want to level up? • June 2021
11
This is not because smaller cities in Britain are unusually productive. It is becauseBirmingham, Glasgow and Manchester in particular are considerably less productive thaninternational counterparts such as Brussels, Gothenburg and Munich. For example, in2011 Manchester was 30 per cent less productive than Marseille, and 63 per cent lessproductive than Munich.
These big cities are considerably below the ‘productivitypotential’ that their size would suggest
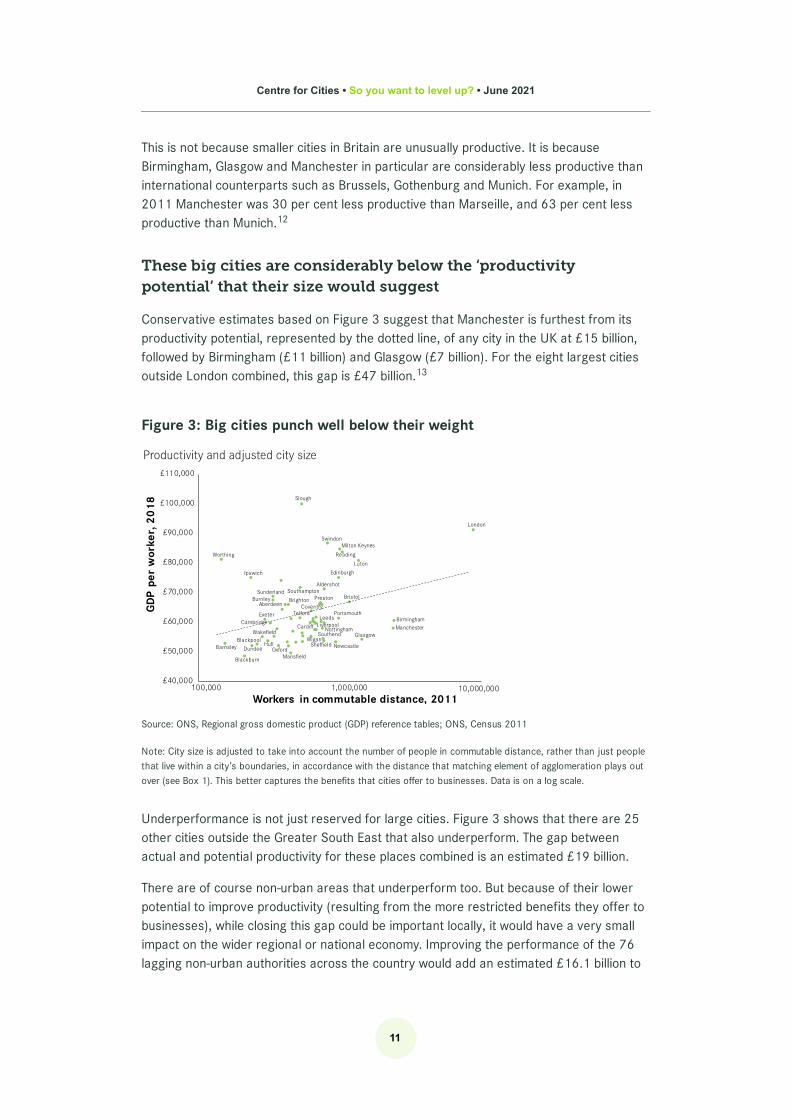
Conservative estimates based on Figure 3 suggest that Manchester is furthest from itsproductivity potential, represented by the dotted line, of any city in the UK at £15 billion,followed by Birmingham (£11 billion) and Glasgow (£7 billion). For the eight largest citiesoutside London combined, this gap is £47 billion.
Figure 3: Big cities punch well below their weight
Source: ONS, Regional gross domestic product (GDP) reference tables; ONS, Census 2011
Note: City size is adjusted to take into account the number of people in commutable distance, rather than just peoplethat live within a city’s boundaries, in accordance with the distance that matching element of agglomeration plays outover (see Box 1). This better captures the benefits that cities offer to businesses. Data is on a log scale.
Underperformance is not just reserved for large cities. Figure 3 shows that there are 25other cities outside the Greater South East that also underperform. The gap betweenactual and potential productivity for these places combined is an estimated £19 billion.
There are of course non-urban areas that underperform too. But because of their lowerpotential to improve productivity (resulting from the more restricted benefits they offer tobusinesses), while closing this gap could be important locally, it would have a very smallimpact on the wider regional or national economy. Improving the performance of the 76lagging non-urban authorities across the country would add an estimated £16.1 billion to
12
13

Centre for Cities • So you want to level up? • June 2021
12
the national economy – just slightly more than closing the output gap of Manchesteralone.
Using this breakdown, these conservative estimates suggest that the British economy is£83 billion, or 4 per cent, smaller per year than it should be because of theunderperformance of places outside the Greater South East. Big cities are the biggestcontributor to this gap. Despite covering 7 per cent of land in underperforming areas inthe rest of Britain, they account for 57 per cent of this underperformance (see Figure 4).Box 2 discusses the role of large city centres in this.
Figure 4: Big cities account for most of Britain’s lost output
Source: ONS
14

Centre for Cities • So you want to level up? • June 2021
13
Box 2: The underperformance of big city centres
While productivity data does not yet exist at the city centre level, proxy measures ofproductivity suggest there is a much stronger relationship between city centre sizeand productivity than the one seen at the city level. Figure 5 shows that the largerthe city centre, the larger the share of jobs in that city centre that is high skilled. Asagglomeration would predict, this suggests that the ‘knowledge spillover’ benefits incity centres increase with the amount of economic activity within them, and sobecome more attractive to high-skilled activities. Agglomeration within English andWelsh city centres is plain to see.
Despite this relationship, this chart suggests the underperformance of Birminghamand Manchester city centres in particular. Not only is the gap between centralLondon and the next largest city centres very wide, but Manchester andBirmingham city centres are no larger than those in Bristol and Leeds, despite thecity populations of the former being more than three times larger than the latter.
This means that, while Manchester and Birmingham city centres in their own rightare very high-skilled economies and have gone through a period of rejuvenation inthe last 30 years, they currently are too small. The main focus of helping thesecities achieve their productivity potential should be to enlarge their successful citycentre economies.
Figure 5: Larger city centres have higher shares of high skilled jobs
Source: ONS, Census 2011
Note: Data for Scotland is not available. The number of jobs is on a log scale.
15

Centre for Cities • So you want to level up? • June 2021
14
In terms of levelling up productivity, the aim of policy should be to help places toachieve their productivity potential, which will differ from place to place, ratherthan trying to get every place to achieve the same level of productivity. In otherwords, the goal should not to make all authorities in the productivity map in Figure 1 thesame shade of green. We should expect big productivity differences between Manchesterand Cumbria. But we should not expect them between Manchester and Bristol. Currentlyneither of these things is true.
In particular, policy will not level up if it does not deal with the underperformance ofthese biggest cities (and in particular their city centres). The much strongerperformance of the European counterparts shows that closing this gap is realistic. Thesize of this gap shows that there is considerable gains to be made. Manchester needs toperform more like Munich than Mansfield. And Birmingham needs to be more like Brusselsthan Birkenhead.
Towns are unlikely to prosper without prospering neighbouringcities
It is important to underline here that this is not an argument for cities versus towns, asthe debate has sometimes been presented. Policy should be making interventionsdesigned to improve productivity in smaller places where their productivity is lagging.There are two points to consider within this.
The first is that previous work by Centre for Cities has shown that the performance oftowns is in part dependent on the performance of nearby cities. Most towns thatperform well – and there are many of them – tend to be located close to a successful city.And strongly performing towns near poorly performing cities are rare. Box 3 discussesthis in more detail, while Box 4 shows why we should not expect working patterns postCovid-19 to affect this either.
16

Centre for Cities • So you want to level up? • June 2021
15
Box 3: The relationship between cities and towns
Much commentary over recent years has pitted cities against towns, and hasclaimed that city growth has come at the expense of towns. This is not supported ontwo counts. First, the notion that cities have grown and are strong performers doesnot hold in both the data presented in this paper and when looking at data on long-term change. Second, research by Centre for Cities suggests that the fortunes oftowns are tied to a great extent to the fortunes of their neighbouring cities.
Not all towns have been ‘left behind’, with some performing very well. But there is ageography to this. Towns closer to cities (109 of the 164 towns sized between30,000 and 135,000) have better employment outcomes for their residents thantowns further away. It is rare to find a town far from a city that performs well on thismeasure. But being close to a city is not sufficient – those towns closer tosuccessful cities, on average, have better employment outcomes than those closeto less successful ones. This is not just seen in employment outcomes – they tendto have stronger economies in their own right, with larger shares of high-skilledexporting businesses in their economies.
Given this, pitting towns against cities is not helpful for the towns agenda. It will behard to improve the performance of towns without improving the performance ofthe city neighbours.
The second is that the number of people living in each area will determine the size of theimpact of any policy intervention. Hartlepool fits into Manchester 27 times over.Manchester’s output gap is many times larger again. This difference in scale means thatlevelling up – politically sensible as it may be – cannot be about intervening in towns aloneif it is to bring noticeable improvements in economic prosperity to many millions of peopleliving across the UK. Once again, policy will not level up if it does not deal with theunderperformance of these biggest cities.
17

Centre for Cities • So you want to level up? • June 2021
16
Box 4: Will work from home change all of this?
Many column inches have been devoted since the onset of Covid-19 to the idea thatremote working will make geography irrelevant, with the argument being thatworkers will able to work anywhere.
This argument is not new – it was first made at the turn of the century as virtualtechnologies developed. But since then the opposite has happened, with jobsconcentrating in successful city centres in particular.
This occurred because of the value of face to face interaction and the ‘knowledgespillovers’ that occur from this interaction, as discussed in Box 1. Given that the UKis likely to continue to specialise in knowledge-based activity that benefits mostfrom this interaction, location is likely to continue to be important. The continuedclustering of people in East Asian cities in the last 20 years, despite the epidemicsthat they have been challenged by over the last two decades, further supportsthis.
For those jobs that can be done remotely in principle, it may be the case that somedays a week are spent out of the office. But the requirement for that face-to-faceinteraction will mean that city centres will likely have an ever more significant role inthe economy in the coming years.
18
19

Centre for Cities • So you want to level up? • June 2021
17
03Defining levelling up
The Government should define levelling up by setting the following three targets:
While these should be goals in their own right, they are of course interlinked. Improvingskills, for example, is likely to improve productivity too.
Reduce the share of people without the equivalent of five good GCSEs to thecurrent national average of 17.8 per cent in every local authority that currentlysits above it.
•
Increase life expectancy to the current national average of 79.3 years inevery local authority that currently sits below it.
•
Bring all lagging places up to their productivity potential, with particularfocus on raising the contribution of the UK’s largest cities.
•

Centre for Cities • So you want to level up? • June 2021
18
04What needs to change
In order to help achieve these goals, efforts to level up should focus on six areas: skills,devolution, public services, local transport and city centres. As Figure 6 summarises,these policies should not be applied equally across all geographies.
Figure 6: How levelling up policies should play out across geography
1. Improve basic and intermediate skills
Why is this important?
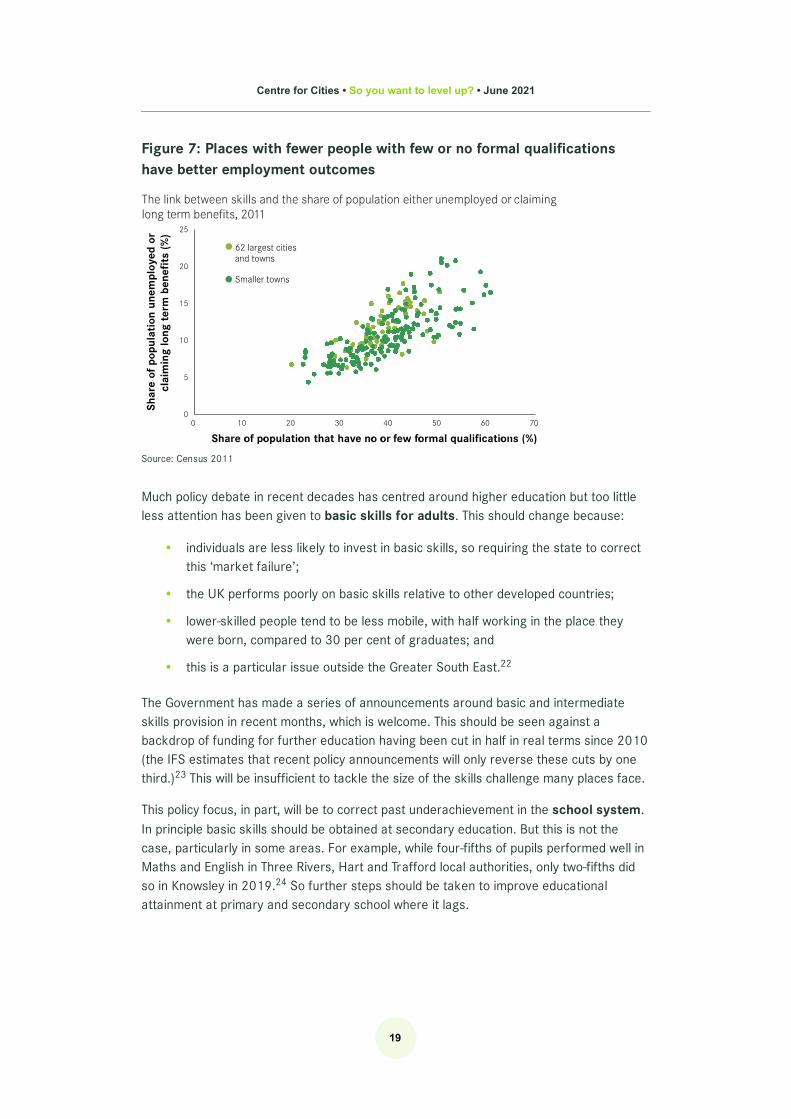
Skills are a strong predictor of employment outcomes across the country, be that in citiesor towns. Figure 7 shows that those places that have larger shares of people with few orno formal qualifications have a higher share of people either unemployed or claiming long-term benefits. They are also a strong predictor of economic performance – a placeoffering low numbers of high-skilled workers is much less likely to attract or grow a high-skilled business and pay higher wages.
20
21
Centre for Cities • So you want to level up? • June 2021
19
Figure 7: Places with fewer people with few or no formal qualificationshave better employment outcomes
Source: Census 2011
Much policy debate in recent decades has centred around higher education but too littleless attention has been given to basic skills for adults. This should change because:
The Government has made a series of announcements around basic and intermediateskills provision in recent months, which is welcome. This should be seen against abackdrop of funding for further education having been cut in half in real terms since 2010(the IFS estimates that recent policy announcements will only reverse these cuts by onethird.) This will be insufficient to tackle the size of the skills challenge many places face.
This policy focus, in part, will be to correct past underachievement in the school system.In principle basic skills should be obtained at secondary education. But this is not thecase, particularly in some areas. For example, while four-fifths of pupils performed well inMaths and English in Three Rivers, Hart and Trafford local authorities, only two-fifths didso in Knowsley in 2019. So further steps should be taken to improve educationalattainment at primary and secondary school where it lags.
individuals are less likely to invest in basic skills, so requiring the state to correctthis ‘market failure’;
•
the UK performs poorly on basic skills relative to other developed countries;•
lower-skilled people tend to be less mobile, with half working in the place theywere born, compared to 30 per cent of graduates; and
•
this is a particular issue outside the Greater South East.• 22
23
24

Centre for Cities • So you want to level up? • June 2021
20
Policy:
The Government has made a bold commitment to increase spending on R&D to bring it inline with other countries. Improving skills outcomes should be seen in the same light – thereasons for governments to intervene are similar as for R&D, and the UK is also not aleader in skills spending. Given this, the Government should commit to increasing moneyspent on skills, increasing it from the 5 per cent of GDP that is currently the case to 7 percent that is spent in Sweden. It should use this extra spending to do the following:
Post-16 education
Schools
Geography:
All parts of the country, with special focus on struggling areas.
25
The Government should back its recent announcements around skills with anincreased funding for further education beyond current plans at the SpendingReview. It should do this by introducing a Singapore-style voucher system,assigning a number of credits to every individual over 25 to improve their skills.Under this system, every individual without level 2 qualifications (equivalent togood GCSEs) would be assigned a certain amount of money per year for training,with the financial incentive gradually diminishing the more qualified a personis/becomes. Greater funding should be attached to students in areas of thecountry where the lack of basic skills is greatest.
•
It should give greater certainty over funding to further education colleges bysetting multi-year budgets rather than year-on-year ones (something theGovernment is currently reviewing).
•
To help drive up demand for courses, where possible they should be deliveredmore flexibly (e.g. through more evening or weekend courses), coupled withmoney to run local campaigns to encourage people to learn a new skill.
•
It should consider proposals from the Centre for Vocational Education Research tointroduce a human capital tax credit to match the well established R&D tax creditsystem.
•
The Government should expand the opportunity areas programme, which aims toimprove school performance in struggling areas, beyond the initial 12 areas thathave been designated.
•
It should also improve take up of extra-curricular activities to encourage thedevelopment of softer skills by making them free to access in areas with poorschool performance. Evidence suggests that the costs of attending such activitiesis one of the main barriers to uptake.
•
26

Centre for Cities • So you want to level up? • June 2021
21
2. Devolve power to reformed localgovernment
Why is this important?
Much of the policy that will help deliver levelling up, such as local transport, planning andthe delivery of public services, is likely to be better delivered at the geography that a localeconomy operates over rather than from Whitehall. But local government currently hasfew levers to pull, and those that it does have at its disposal are scattered acrossnumerous local authorities that carve up many local economies (for example, see Box 5).As well as better matching powers to the geography over which they operate, morepowers at a more local level should also serve to empower local people and make localpoliticians more accountable.
Box 5: Local governance in Nottingham
Nottingham is the best example of the fragmented nature of much of localgovernment in England. The built-up footprint of the city is covered by nine differentlocal authorities – one unitary, six districts and two county councils. Seven haveresponsibilities for local planning, for example, in their own patch of the city. To seethe implications of this, imagine a new city centre office development. Thedevelopment itself would be given planning by Nottingham City Council. But if thenew homes to house workers are to be built in next door Gedling, then it is GedlingDistrict Council that must grant planning for the dwellings. Transport from thesehomes to the border of Gedling is the responsibility of the county council, afterwhich it becomes the responsibility of Nottingham City Council. That is threeseparate councils to link people to jobs within one city.
Policy:
The Government should continue its devolution journey by devolving more power to localgovernment. It should do this by:
Reorganising local government to build institutional capacity and remove overlapand duplication. Centre for Cities recommends in England that the number of localauthorities should be reduced from 348 to 69, with every part of the countrycovered by a directly-elected mayor.
•
27
Levelling up reformed local government and existing Mayoral CombinedAuthorities in England to the powers London has had for the last 20 years. Thisshould come with funding to develop institutional capacity that London has had ahead start on building. And it should designate ‘protected’ devolved powers forlocal government that cannot easily be removed by Westminster, in line with theScottish devolution settlement for policies such as housing and transport.
•

Centre for Cities • So you want to level up? • June 2021
22
Geography:
As this is an issue for the devolved nations, the UK Government can only enact thesechanges in England. But the devolved nations should follow suit. While some powersshould be held at the nation level, the nations are not practising the devolution theypreach by simply hoarding the powers they have received from Whitehall in their ownnational parliaments.
3. Improve public services provision
Why is this important?
The quality of public services – or ‘social infrastructure’ – impacts on people’s day-to-daylives. Improving things like parks and childcare services has the potential to improvequality of life of many people across a broad geography, in contrast to more totemicpolicies such as freeports or towns funds, where only a handful of places ‘win’.
The limited data that is available on public services does not suggest that access to publicservices systematically varies across the country. While people living in rural areas arefurther from amenities such as libraries or doctors’ surgeries than urban dwellers, it is notclear that more deprived areas have worse access.
Two things are clear though. The first is that outcomes for people across the country dovary. The second is that it is day-to-day spending in deprived urban authorities in the northof England that has seen the largest cuts in funding of any area of government since2010. If the former is to change then both the funding and delivery of services in thelatter will need to change.
Many of the policies associated with levelling up to date have centred on pots of cash forlucky winners in a government bidding competition. These pots have been announced atthe same time as the Government’s spending projections in Budget 2021 suggesting thatausterity for local government will be prolonged and no solution to the social care crisishaving been offered (social care is taking up an increasing share of ever decreasing localauthority budgets, and so further squeezing spending on other areas).
Underpinning this by reforming local government funding. Central governmentmust remove the financial straitjacket it forces on local government, which giveslocal authorities little flexibility about how they chooses to spend budgets toaddress the varied challenges they face. To do this, it should give a localgovernment full control over business rates and council tax, allow it to set budgetsover a four-year period, rather than the current one-year horizon, and completeflexibility over how it spends money raised from sales, fees and charges.
•
28
29
30

Centre for Cities • So you want to level up? • June 2021
23
Policy:
The forthcoming Spending Review should end austerity for local service provision,especially local government spending. It should commit to year on year real-termsincreases over the cycle of the next Spending Review.
Geography:
All parts of the country, with the existing method of allocation increasing spending most inareas where need is highest.
4. Strengthen local transport
Why is this important?
A local transport system links workers to jobs. Improving transport widens the catchmentthat businesses can choose from, increases the number and choice of jobs available to aworker, and allows better matching of workers with particular skill sets to jobs that reflectthis skill set. This improves the attractiveness of a place to do business, as it deepens thepool of available workers, and as a place to live because of the greater choice of jobs. Agood system also offers better access to public services and other amenities.
Improving a transport system can be done in one of two ways. The first is to improve themanagement of the existing system to make it work more efficiently, through better co-ordination of different modes of transport, for example. The second is to invest in newinfrastructure.
The fragmented nature of local transport systems in most places outside London meansthat all places would likely benefit from better management of the system. But transportinfrastructure investment should be more targeted. Previous work by Centre for Citiesshows that while there is a clamour for transport infrastructure investment across thecountry, the data suggests that it is only in big cities where the network may be holdingback growth. The underdeveloped network in big cities is likely to explain at least part oftheir productivity underperformance, with the difficulty in getting around reducing the sizeof the labour pool and access to job opportunities.
Policy:
31
32
Mayoral Combined Authorities that have not done so already should improve therunning of the local transport system by franchising of the bus network in theirareas, and the Government should provide all assistance where necessary tomake this happen. London has long benefited from local control of buses. GreaterManchester will franchise its services from 2023. Other areas should ensure thatthey benefit from this too.
•

Centre for Cities • So you want to level up? • June 2021
24
Geography:
Franchising powers for all parts of England, new infrastructure investment in big cities.
5. Make city centres more attractive places todo business
Why is this important?
High-skilled jobs have been increasingly clustering in city centres in recent years becauseof the benefits they offer – they are where agglomeration is most clearly seen. But manycity centres outside the Greater South East have struggled to attract these businesses insufficient numbers, which has meant that these cities and wider subregions havestruggled too.
Given the UK economy’s likely continued specialisation in more knowledge-basedactivities, and the importance of face-to-face interaction for these industries, city centresare likely to play an ever-increasing role in the performance of the UK economy in thecoming years. This means making city centres outside the Greater South East moreattractive places to do business is likely to be an important part of raising productivityperformance.
The Government should extend these powers to other areas too, rather thanrequiring them to seek the consent of the Secretary of State. As part of thisplaces should be given longer to developing their franchising plans than the BusStrategy currently allows.
•
33
In contrast to improving how services are delivered, the Government should investin new transport infrastructure where the current system is under pressure. Datashows this to be in the big cities. The existing Transforming Cities Fund is a stepin the right direction to address these issues but further investment beyond theseallocations will be required if there is to be an expansion of a public transportsystem in cities such as Bristol and Leeds in particular.
•
31
The National Infrastructure Commission identified £31 billion additionalinvestment for new transport infrastructure in priority cities outside London up to2040. The Government should take up this recommendation, and the investmentshould be primarily focused on cities such as Manchester and Birmingham. The£31 billion should be available to these cities providing they meet two conditions:
•
Cities themselves contribute a share of the costs locally so that risks areshared between local and national government; and
•
This local contribution includes revenues from a city centre congestioncharge. If these cities are serious about improving their transport networks,they need to also take politically tough decisions locally to do so.
•
35

Centre for Cities • So you want to level up? • June 2021
25
Policy:
The Government should create at £5 billion City Centre Productivity Fund to improve theeconomies of city centres, funded from the existing National Productivity InfrastructureFund. A fund is appropriate here, in contrast to the introduction of other one-off funds bythe Government to date, because of the size of the capital spending required.
To access the money, local authorities would need to put together an application forfunding which demonstrates how their interventions will improve their city centres as aplace to do business. They should put forward a strategy for what they intend to do over amultiyear period. Ideally this would be presented in a number of phases, with the moneyfrom the fund focusing on Phase I, while future phases may be supported by otherinterventions once Phase I is complete.
The nature of the interventions will vary from place to place but are likely to be somecombination of: the demolition or conversion of dated commercial space, the creation ofnew office space, public realm and public transport. The local authority shoulddemonstrate how these interventions are integrated, rather than a series of freestandinginterventions that do not pull together as a single strategy.
Geography:
City centres and large town centres.
6. Research and development
Why is this important?
Innovation is the driver of long-term economic growth. The poor productivity performanceof many cities and large towns outside the Greater South East suggests that levels ofinnovation in these places and the use of new innovations developed elsewhere are notvery high.
Policy:
Increasing innovation spending in places that have more fundamental challenges isunlikely to have much impact on innovative activity. Instead the Government should focusits increased R&D spend in the places where it is most likely to have an impact – thoseplaces that have a degree of innovation happening in them already that further publicsupport may boost. Because of their scale, large cities are the most obviouscandidates for this.
Mechanically, this will have a local impact through the types of jobs it creates. What isless clear is whether an area directly benefits from the innovations that such jobsproduce, or whether they will be applied elsewhere. Given this, the Government should becautious about the local economic impact it expects to see from this increased spend.
36

Centre for Cities • So you want to level up? • June 2021
26
Geography:
Big cities with some existing innovation activity.
Boosting the demand side
All the policies above are supply-side interventions. The Government can also influencethe demand side by explicitly setting out a strategy to boost demand in certain areas andproviding certainty of public sector commitment and support. An example of this isthrough the retrofitting of homes. The problem with the Green Homes Grant is that is wasshort term and offered no certainty and a shortage of suppliers resulted. Certainty aroundthe net zero, R&D and other policy areas the Government deems important is likely toencourage private sector investment.
Centre for Cities • So you want to level up? • June 2021
27
05Appendices
Appendix 1: Changes in definitions
There are many different ways to define a city or large town, including the core localauthority, the primary urban area (used by Centre for Cities) and the travel to work area.Table 1 shows that there is little difference across the definitions, and so it is not thedefinition that is driving the performance patterns that we see. In Birmingham andGlasgow, the travel to work area has higher productivity than the core local authority. Thisis the opposite of what we should find given the expected impact of agglomeration.
Table 1: Different definitions of cities make little difference to theirunderperforming productivity
City Output per worker, 2018 (£)
Core local authority Primary urban area Approximate travelto work area
Birmingham 61,385 60,695 64,246
Glasgow 54,046 54,306 55,608
Manchester 61,384 58,070 61,105
Source: ONS
Note: Travel to Work Areas have bene approximated using local authorities (the lowest level that GDP data is available)
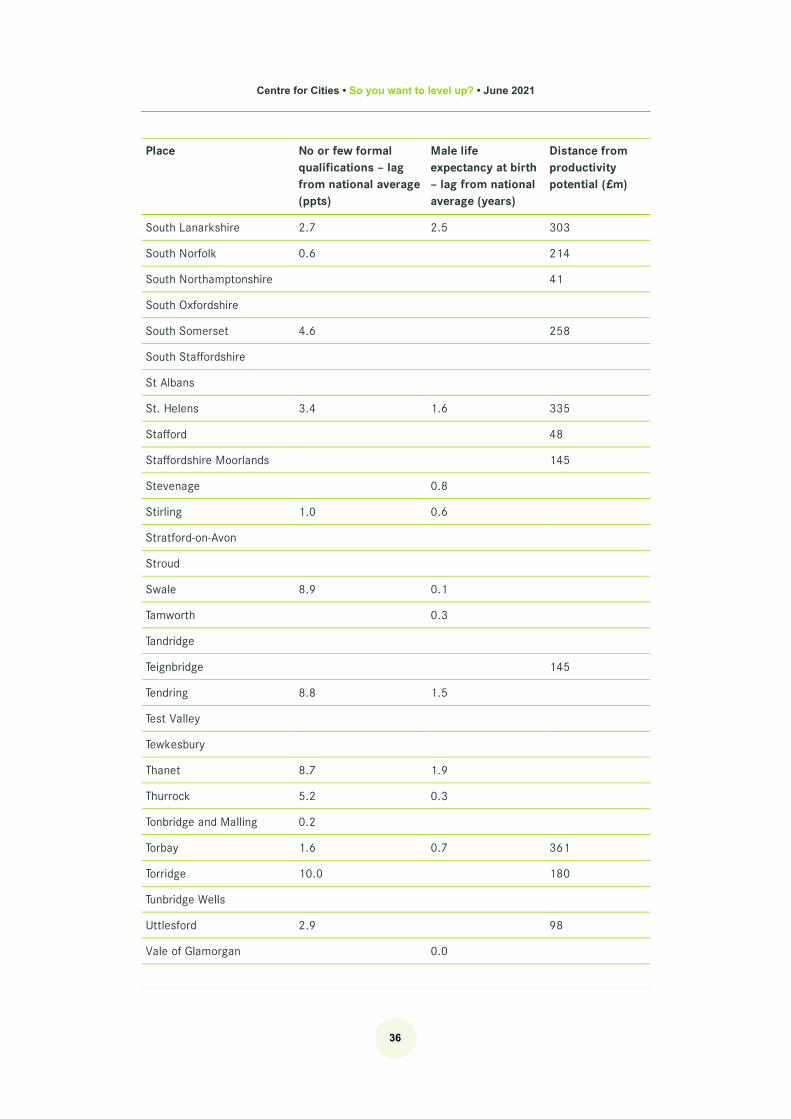
Appendix 2: How places perform against the levelling up targets
Table 2 shows how different places perform against the levelling up metrics set out in thispaper. If a place performs above the benchmark on a particular paper then no data isreported as it does not need to level up on this measure. For example, Aldershot has nodata across all three indicators because in outperforms the benchmark on each.

Centre for Cities • So you want to level up? • June 2021
28
Table 2: How far places are from the minimum threshold on the proposedgoals of levelling up
Place No or few formalqualifications – lagfrom national average(ppts)
Male lifeexpectancy at birth– lag from nationalaverage (years)
Distance fromproductivitypotential (£m)
City or large town
Aberdeen 2.4
Aldershot
Barnsley 0.6 1.2 -276
Basildon 10.2
Birkenhead 1.1 -653
Birmingham 7.2 1.4 -10599
Blackburn 8.0 2.4 -654
Blackpool 4.3 3.2 -642
Bournemouth -663
Bradford 10.3 1.5 -1859
Brighton
Bristol
Burnley 14.4 2.1
Cambridge -24
Cardiff 1.1 -729
Chatham 4.1 0.3
Coventry 1.0 0.8
Crawley
Derby 1.9 0.7 -662
Doncaster 6.6 1.3 -1090
Dundee 5.4 -484
Edinburgh 1.2
Exeter 0.6
Glasgow 2.0 4.1 -7384
Gloucester 4.9 1.4 -323
Huddersfield 4.4 0.8 -1282

Centre for Cities • So you want to level up? • June 2021
29
Place No or few formalqualifications – lagfrom national average(ppts)
Male lifeexpectancy at birth– lag from nationalaverage (years)
Distance fromproductivitypotential (£m)
Hull 4.7 3.3 -759
Ipswich 11.9
Leeds 1.1 -1861
Leicester 5.2 1.1 -1531
Liverpool 2.6 3.0 -1468
London
Luton 1.5 1.2
Manchester 1.9 1.5 -15274
Mansfield 4.9 1.3 -1154
Middlesbrough 6.2 2.1 -368
Milton Keynes 0.1
Newcastle 1.1 1.7 -4933
Newport 3.1 1.6 -1132
Northampton 0.6 -440
Norwich 6.0 -392
Nottingham 0.8 0.6 -1939
Oxford -1038
Peterborough 4.2 1.1 -38
Plymouth 1.4 0.3 -806
Portsmouth 0.9 -942
Preston 0.5
Reading
Sheffield 0.4 -3939
Slough 0.3 0.7
Southampton 0.2
Southend 6.5 -1096
Stoke 4.9 2.0 -373
Sunderland 3.6 2.1
Swansea 1.4 2.2 -994

Centre for Cities • So you want to level up? • June 2021
30
Place No or few formalqualifications – lagfrom national average(ppts)
Male lifeexpectancy at birth– lag from nationalaverage (years)
Distance fromproductivitypotential (£m)
Swindon 2.0
Telford 1.5 0.7 -77
Wakefield 4.9 1.0 -648
Warrington 0.1 -556
Wigan 0.4 1.4 -854
Worthing 0.3
York
Other authority
Aberdeenshire 0.1
Allerdale 0.1 241
Amber Valley 87
Angus 0.2 1.0
Argyll and Bute 1.4 57
Arun 77
Ashford
Aylesbury Vale
Babergh 4.1
Barrow-in-Furness 12.5 2.0
Basingstoke and Deane
Bassetlaw 9.3 0.6 413
Bath and North EastSomerset
489
Bedford 0.6
Blaenau Gwent 9.5 3.0 8
Bolsover 2.1 1.0
Boston 2.6 1.5 326
Bracknell Forest
Braintree 7.9
Breckland 5.0 111
Brentwood 1.3

Centre for Cities • So you want to level up? • June 2021
31
Place No or few formalqualifications – lagfrom national average(ppts)
Male lifeexpectancy at birth– lag from nationalaverage (years)
Distance fromproductivitypotential (£m)
Bridgend 3.0 1.6
Bromsgrove
Caerphilly 4.7 1.5
Calderdale 2.3 1.0
Cannock Chase 2.2 0.4 24
Canterbury 0.1 245
Carlisle 6.2 1.1 306
Carmarthenshire 1.5 472
Central Bedfordshire
Ceredigion 223
Charnwood
Chelmsford 1.0
Cheltenham 287
Cherwell
Cheshire East
Cheshire West and Chester
Chesterfield 1.1 307
Chichester 0.2
Chiltern
Clackmannanshire 3.8 2.4
Colchester 208
Conwy 4.2 0.5 332
Copeland 3.1 1.1 141
Corby 10.7 2.2
Cornwall 659
Cotswold 3.0
County Durham 1.3 1.1
Craven No data 200
Dacorum

Centre for Cities • So you want to level up? • June 2021
32
Place No or few formalqualifications – lagfrom national average(ppts)
Male lifeexpectancy at birth– lag from nationalaverage (years)
Distance fromproductivitypotential (£m)
Darlington 1.2 0.6
Daventry 11
Denbighshire 4.4 1.3 393
Derbyshire Dales 1.7 150
Dorset 0.1
Dover 0.1
Dumfries and Galloway 1.4 386
East Ayrshire 3.3 424
East Cambridgeshire
East Devon
East Hampshire
East Hertfordshire 47
East Lindsey 1.5 203
East Lothian 0.7
East Northamptonshire 225
East Riding of Yorkshire 1.8
East Staffordshire 2.9 0.5
East Suffolk 1.2
Eastbourne 4.1 183
Eden No data 113
Falkirk 6.8 2.2
Fenland 9.8 0.7 11
Fife 0.2 2.1
Flintshire 3.1 0.0 353
Folkestone and Hythe 1.6
Forest of Dean
Great Yarmouth 11.2 1.1 137
Guildford
Gwynedd 0.1 342

Centre for Cities • So you want to level up? • June 2021
33
Place No or few formalqualifications – lagfrom national average(ppts)
Male lifeexpectancy at birth– lag from nationalaverage (years)
Distance fromproductivitypotential (£m)
Halton 5.6 2.2
Hambleton 56
Harborough 22
Harlow 5.8 1.1
Harrogate 35
Hart No data
Hartlepool 4.4 2.5
Hastings 5.0 2.2 33
Herefordshire, County of 0.0 494
High Peak 251
Highland 1.6
Hinckley and Bosworth
Horsham
Huntingdonshire
Hyndburn 4.9 2.6
Inverclyde 3.3 4.1 222
Isle of Anglesey 0.3 76
Isle of Wight 1.7 234
Isles of Scilly No data 79.3
Kettering 5.4 165
King’s Lynn and WestNorfolk
3.3
Lancaster 1.1 58
Lewes
Lichfield 204
Lincoln 2.0
Maidstone 4.3
Maldon 7.3 43
Malvern Hills 30
Melton No data

Centre for Cities • So you want to level up? • June 2021
34
Place No or few formalqualifications – lagfrom national average(ppts)
Male lifeexpectancy at birth– lag from nationalaverage (years)
Distance fromproductivitypotential (£m)
Mendip 216
Merthyr Tydfil 11.9 1.9 75
Mid Devon 0.1 123
Mid Suffolk
Mid Sussex
Midlothian 1.4
Mole Valley
Monmouthshire
Moray 1.4 0.3
Na h-Eileanan Siar 1.9 226
New Forest
Newark and Sherwood 4.3 70
North Ayrshire 2.1 3.0 12
North Devon 201
North East Derbyshire 2.6
North East Lincolnshire 6.4 1.7 425
North Hertfordshire 4.8
North Kesteven
North Lanarkshire 6.3 4.1
North Lincolnshire 7.5 0.3
North Norfolk 2.5 156
North Somerset
North Warwickshire 0.9
North West Leicestershire
Northumberland 5.0 74
Nuneaton and Bedworth 1.4 258
Orkney Islands 0.2 22
Pembrokeshire 2.7
Perth and Kinross 0.2

Centre for Cities • So you want to level up? • June 2021
35
Place No or few formalqualifications – lagfrom national average(ppts)
Male lifeexpectancy at birth– lag from nationalaverage (years)
Distance fromproductivitypotential (£m)
Powys 781
Redditch 0.4
Reigate and Banstead
Rhondda Cynon Taf 6.4 1.8 320
Ribble Valley No data
Richmondshire 174
Rossendale 4.9 0.7
Rother 0.1 197
Rugby
Rushcliffe
Rutland 14
Ryedale 153
Scarborough 7.0 0.9 295
Scottish Borders 1.8 0.5 221
Sedgemoor 6.2 3
Sefton 0.5 309
Selby 6.2
Sevenoaks
Shetland Islands 59
Shropshire 175
Somerset West and Taunton 324
South Ayrshire 2.0 357
South Bucks
South Cambridgeshire
South Derbyshire
South Hams
South Holland 5.4
South Kesteven
South Lakeland
Centre for Cities • So you want to level up? • June 2021
36
Place No or few formalqualifications – lagfrom national average(ppts)
Male lifeexpectancy at birth– lag from nationalaverage (years)
Distance fromproductivitypotential (£m)
South Lanarkshire 2.7 2.5 303
South Norfolk 0.6 214
South Northamptonshire 41
South Oxfordshire
South Somerset 4.6 258
South Staffordshire
St Albans
St. Helens 3.4 1.6 335
Stafford 48
Staffordshire Moorlands 145
Stevenage 0.8
Stirling 1.0 0.6
Stratford-on-Avon
Stroud
Swale 8.9 0.1
Tamworth 0.3
Tandridge
Teignbridge 145
Tendring 8.8 1.5
Test Valley
Tewkesbury
Thanet 8.7 1.9
Thurrock 5.2 0.3
Tonbridge and Malling 0.2
Torbay 1.6 0.7 361
Torridge 10.0 180
Tunbridge Wells
Uttlesford 2.9 98
Vale of Glamorgan 0.0

Centre for Cities • So you want to level up? • June 2021
37
Place No or few formalqualifications – lagfrom national average(ppts)
Male lifeexpectancy at birth– lag from nationalaverage (years)
Distance fromproductivitypotential (£m)
Vale of White Horse
Warwick
Waverley
Wealden 20
Wellingborough 13.4 0.4 52
Welwyn Hatfield 331
West Berkshire
West Devon 167
West Dunbartonshire 6.7 4.3
West Lancashire 4.1 107
West Lindsey
West Lothian 4.9 1.5
West Oxfordshire
West Suffolk 3.6
Wiltshire
Winchester
Windsor and Maidenhead
Worcester 3.6 0.2
Wrexham 1.1 1.1
Wychavon 103
Wycombe
Wyre 2.2 1.0
Wyre Forest 5.2 0.2 217
Source: ONS; Centre for Cities calculations

Centre for Cities • So you want to level up? • June 2021
38
Endnotes
For example, see Public Services Committee (2021), ‘Levelling up’ and publicservices: Position paper, London: The Stationery Office; Payne S and Giles C,‘Confusion over the UK “levelling-up” plan prompts Boris Johnson to hire new adviser’,Financial Times, 3 May 2021.
1
Noting that sorting effects, with people self-selecting into certain areas, will havesome influence on the maps.
2
Different places offer different benefits to people too. City centres tend to bedisproportionately to younger people, while suburbs and areas around cities are moreappealing to older people. See Thomas E, Serwicka I and Swinney P (2015), UrbanDemographics: Why People Live Where They Do, London: Centre for Cities.
3
While manufacturing is more likely to be based out of town, it is interesting to observesplits in activity in this sector between knowledge and production. For example, whileSiemens makes its wind turbine blades in Hull because of the direct access to theNorth Sea, its UK headquarters is in Manchester. This spilt is seen within service firmstoo. For example, Barclay’s investment banking functions are in Canary Wharf, but itsadministration activities are in Liverpool and Sunderland.
4
For example, see Rosenthal S and Strange W (2004), Chapter 49 – Evidence on theNature and Sources of Agglomeration Economies, Handbook of Regional and UrbanEconomics, Volume 4, Pages 2119-2171
5
Rice P, Venables AJ and Patacchini E (2006), Spatial Determinants of Productivity:Analysis for the Regions of Great Britain, Regional Science and Urban Economics 36(6), 727-752. A study on the largest US cities suggests that agglomeration has aneffect over a 60 minute drive time, with the majority of the gains concentrated in thefirst 20 minutes. See Melo P, Graham D, Levinson D and Aarabi S (2015)Agglomeration, accessibility and productivity: Evidence for large metropolitan areas inthe US, Urban Studies
6
Arzaghi M & Henderson J (2008) Networking Off Madison Avenue, Review ofEconomic Studies (October 2008), pp. 1011-1038; Rosenthal S & Strange W (2003)Geography, Industrial Organization, and Agglomeration, Review of Economics andStatistics (May 2003), pp. 377-393
7
Swinney P and Serwicka I (2016), Trading Places: Why firms locate where they do,London: Centre for Cities
8
Swinney P (2018): The wrong tail? London: Centre for Cities9
For example, Shipman S, ‘Boris Johnson: I’ll stop brain drain to the cities’, The Times 9May 2021
10
Swinney P and Enenkel K (2020), Big cities and levelling up, London: Centre for Cities11
See Centre for Cities European Cities Datatool athttps://www.centreforcities.org/data-tool/dataset/european-
12

Centre for Cities • So you want to level up? • June 2021
39
cities#graph=table&indicator=gva-per-worker\\single\\2011&city=birmingham&city=glasgow&city=manchester&city=brussels&city=marseille&city=m
Bristol is not included in this list as it is the only large city that is meeting itsproductivity potential.
13
This assumes that the productivity potential of a lagging non-urban area is the sameas the productivity potential of the smallest city using the methodology in Swinney Pand Enenkel K (2020), Big cities and levelling up, London: Centre for Cities. This is agenerous benchmark – more rural authorities in particular should have a level ofproductivity potential below that of the smallest city.
14
Swinney P and Sivaev D (2013) Beyond the high street: Why our city centres reallymatter, London: Centre for Cities
15
Swinney P, McDonald R and Ramuni L (2018), Talk of the Town: The economic linksbetween cities and towns, London: Centre for Cities
16
Workplace jobs data from the 1951, 1971, 1991 and 2011 censuses show largecities in the North and Midlands to be the poorest performers across England andWales, and had fewer jobs in 2011 than they did 60 years earlier.
17
For example, see Swinney P and Sivaev D (2013) Beyond the high street: Why ourcity centres really matter, London: Centre for Cities
18
Centre for Cities (2021), Cities Outlook 2021, London: Centre for Cities19
This rate excludes students and retirees from the denominator as these groupsdistort the findings, especially in towns such as Bridlington where there are manyretirees and Durham where there are many students.
20
Gibbons S, Overman G and Pelkonen P (2010), Wage Disparities in Britain: People orPlace? London: LSE
21
Fouarge D, Schils T and de Grip A (2010), Why Do Low-Educated Workers Invest Lessin Further Training? Maastrict: Institute for the Study of Labor; OECD (2016), BuildingSkills for All: A Review of England. Paris: OECD; Bessis H (2016), Competing with theContinent, How UK cities compare with their European counterparts, London: Centrefor Cities; Bosquet C and Overman, H (2019) Why does birthplace matter so much?Journal of Urban Economics, 110. pp. 26-34. ISSN 0094-1190
22
Sibieta S, Tahir I and Waltmann B (2021), Big changes ahead for adult educationfunding? Definitely maybe, London: IFS
23
Measured as the number of pupils achieving 9-4 in Maths & English GCSEs24
Costa R, Datta N, Machin S and McNally S (2018), Investing in People: The Case forHuman Capital Tax Credits, London: LSE; OECD (2019), Getting Skills Right – GettingSkills Right: Future-Ready Adult Learning Systems, Paris: OECD
25
Cullinane C & Montacute R (2017) Life lessons: improving essential life skills foryoung people. London: Sutton Trust
26

Centre for Cities • So you want to level up? • June 2021
40
Jeffrey S and Swinney P (2020), Levelling up local government in England, London:Centre for Cities
27
Davern M, Gunn L, Whitzman C, Higgs C, Giles-Corti B, Simons K, Villanueva K, MavoaS, Roberts R & Badland H (2017) Using spatial measures to test a conceptual modelof social infrastructure that supports health and wellbeing, Cities & Health, 1:2, 194-209
28
For example, see Goodair B and Kenny M (2020), Townscapes: Wales, Cambridge:University of Cambridge
29
Centre for Cities (2019), Cities Outlook 2019, London: Centre for Cities30
Jeffrey S and Enenkel K (2020), Get Moving, London: Centre for Cities31
https://www.tomforth.co.uk/birminghamisasmallcity/32
Harvey D (2021) Get on board: Why Mayors should choose bus franchising, London:Centre for Cities
33
Jeffrey S and Enenkel K (2020), Get Moving, London: Centre for Cities34
Swinney P (2017), Why don’t we see growth up and down the country? London:Centre for Cities
35
Enenkel K, Ramuni L and Swinney P (2020), Identifying potential growth centresacross Great Britain, London: Centre for Cities
36

© Centre for Cities 2021
Centre for Cities9 Holyrood StreetSecond FloorLondon SE1 2EL
www.centreforcities.org
Centre for Cities is a registered charity (No 1119841) and a companylimited by guarantee registered in England (No 6215397)

![TTT TTTTTTTTTT TTTT TTTTTT TTTTTTT TTTTTT€¦ · 3odq]hlfkhqhunoluxqj 1.$uw ghu edxolfkhq 1xw]xqj $ev 1u %dx*% wa - allgemeines wohngebiet 2.0d ghu edxolfkhq 1xw]xqj $ev 1u %dx*%](https://img.dokumen.tips/doc/110x75/5f0732a07e708231d41bcb16/ttt-tttttttttt-tttt-tttttt-ttttttt-tttttt-3odqhlfkhqhunoluxqj-1uw-ghu-edxolfkhq.jpg)