Embed Size (px)
Citation preview
Deutsche Bank Markets Research
Japan
Synthetic Equity & Index Strategy
Japan Indices
Date 15 May 2014
Land of the Rising Equity Allocation
A closer look at new indices adopted by GPIF
________________________________________________________________________________________________________________
Deutsche Bank Securities Inc.
Deutsche Bank does and seeks to do business with companies covered in its research reports. Thus, investors should be aware that the firm may have a conflict of interest that could affect the objectivity of this report. Investors should consider this report as only a single factor in making their investment decision. DISCLOSURES AND ANALYST CERTIFICATIONS ARE LOCATED IN APPENDIX 1.MCI (P) 148/04/2014.
Contributors
Shan Lan
Strategist (+852) 22036716 [email protected]
Will Stephens
Strategist (+852) 22036719 [email protected]
Major asset allocation changes in Japanese pension funds are in sight Japan is the second largest country in the world in terms of pension fund assets, following the US. Major Japanese pension funds including GPIF (Government Pension Investment Fund) are facing mounting pressure to boost returns as pension payouts for the world’s oldest population swell and Prime Minister Shinzo Abe and the Bank of Japan seek to spur price gains. GPIF plans to complete its new five-yearly plan by June of this year. Based on the recommendations from the various committee members made public, significant changes in asset allocation are expected, including increasing allocation to equity by reducing the bond weighting in the portfolio.
Pension fund allocations may provide a catalyst after weakness YTD We estimate there could be significant new money injected into the domestic equity market, ranging from $50 bn to over $100 bn. We believe this has the potential to provide positive support for Japan’s equity market, following a disappointing start to the year.
New domestic benchmarks: more diversified and spotlight on smart beta GPIF recently announced that it will adjust some of its current equity allocation partially out of traditional passive (Topix) and active investments towards smart beta allocations (S&P GIVI Japan, Nomura Rafi and MSCI Japan Small Cap) and additional indices for passive investments including the recently introduced Nikkei 400. Globally, 2013 saw the rise of smart beta indices which bridge the gap between active and passive index management styles. We see the adoption of smart beta and increased focus on shareholder returns as a significant long-term positive for the Japanese equity markets.
Nikkei 400 – shareholder return a positive, but still quite similar profile to Topix The Nikkei 400 and its focus on shareholder returns have garnered significant attention. We believe it will be a much easier index for investors to replicate relative to the Topix, and should provide a simple transition, given its similar return profile and high correlation (99.8%) to the Topix. The upcoming introduction of futures should spur further acceptance of the Nikkei 400. We find that the impact of the increased focus on ROE in the Nikkei 400 is partially offset by its backward looking mechanism, market cap weighting and high level of diversification, resulting in it having very similar performance and fundamental characteristics to other broad indices such as the Topix and MSCI Japan. That said, we believe the Nikkei 400 and the increasingly proactive approach of Japanese pension funds should act as longer-term catalysts for renewed focus on motivating corporate Japan to deliver shareholder returns.

15 May 2014
Japan Indices
Page 2 Deutsche Bank Securities Inc.
Table Of Contents
Potential Asset Allocation Changes in Japanese Pension Funds .. 3 Major asset allocation changes are in sight ....................................................................... 3 New Domestic Equity Benchmarks: more diversified and spotlight on smart beta .......... 7 New asset allocation could potentially inject over $100 bn to domestic equity market ... 8 Equity allocations may act as a positive catalyst ............................................................. 10 Recent trends in Smart Beta investments. ....................................................................... 13
Benchmark Comparison .............................................................. 15 A glimpse at the new benchmarks .................................................................................. 15 Cross-index Performance ................................................................................................. 19
A Closer Look .............................................................................. 23 Nikkei 400 ......................................................................................................................... 23 Russell Nomura Prime ...................................................................................................... 26 S&P GIVI Japan ................................................................................................................ 29 RAFI .................................................................................................................................. 31 Topix ................................................................................................................................. 34 MSCI Japan ...................................................................................................................... 36 MSCI Japan Small Cap ..................................................................................................... 38
Listed Products tracking these indices ........................................ 41 List of ETFs tracking these indices ................................................................................... 42
15 May 2014
Japan Indices
Deutsche Bank Securities Inc. Page 3
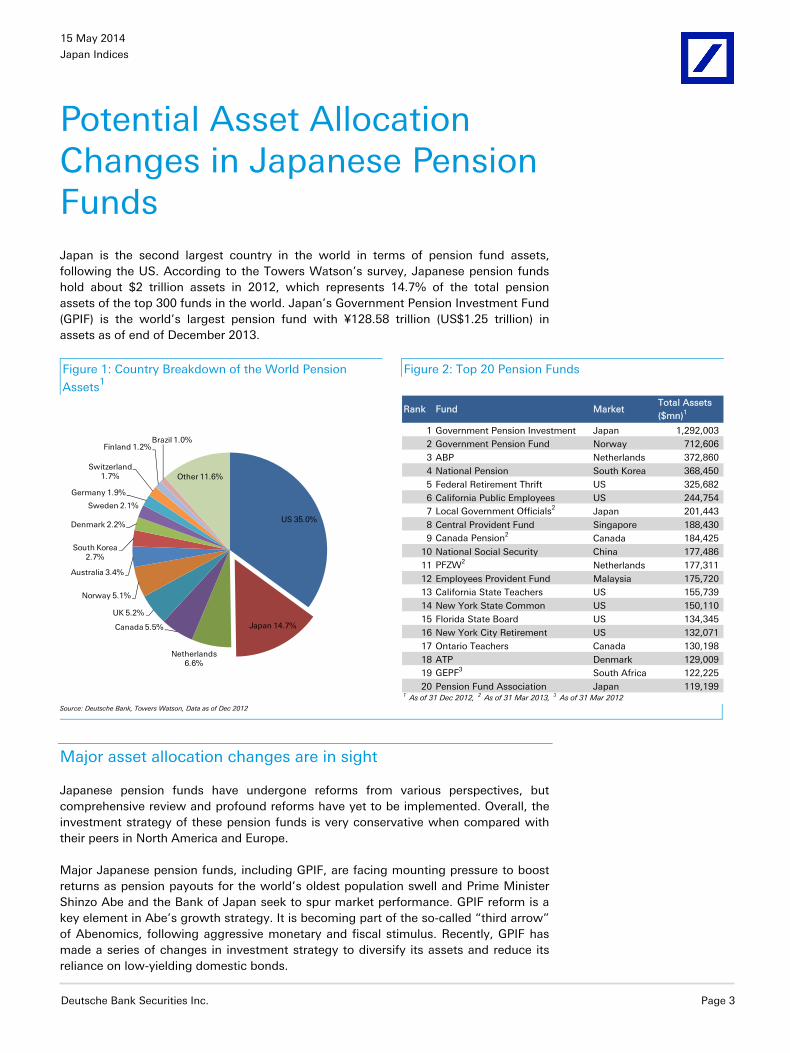
Potential Asset Allocation Changes in Japanese Pension Funds Japan is the second largest country in the world in terms of pension fund assets, following the US. According to the Towers Watson’s survey, Japanese pension funds hold about $2 trillion assets in 2012, which represents 14.7% of the total pension assets of the top 300 funds in the world. Japan’s Government Pension Investment Fund (GPIF) is the world’s largest pension fund with ¥128.58 trillion (US$1.25 trillion) in assets as of end of December 2013.
Figure 1: Country Breakdown of the World Pension
Assets1
Figure 2: Top 20 Pension Funds
US 35.0%
Japan 14.7%
Netherlands 6.6%
Canada 5.5%
UK 5.2%
Norway 5.1%
Australia 3.4%
South Korea 2.7%
Denmark 2.2%
Sweden 2.1%
Germany 1.9%
Switzerland 1.7%
Finland 1.2%Brazil 1.0%
Other 11.6%
Rank Fund MarketTotal Assets ($mn)1
1 Government Pension Investment Japan 1,292,003
2 Government Pension Fund Norway 712,606
3 ABP Netherlands 372,860
4 National Pension South Korea 368,450
5 Federal Retirement Thrift US 325,682
6 California Public Employees US 244,754
7 Local Government Officials2 Japan 201,443
8 Central Provident Fund Singapore 188,430
9 Canada Pension2 Canada 184,425
10 National Social Security China 177,486
11 PFZW2 Netherlands 177,311
12 Employees Provident Fund Malaysia 175,720
13 California State Teachers US 155,739
14 New York State Common US 150,110
15 Florida State Board US 134,345
16 New York City Retirement US 132,071
17 Ontario Teachers Canada 130,198
18 ATP Denmark 129,009
19 GEPF3 South Africa 122,225
20 Pension Fund Association Japan 119,199 1 As of 31 Dec 2012, 2 As of 31 Mar 2013, 3 As of 31 Mar 2012
Source: Deutsche Bank, Towers Watson, Data as of Dec 2012
Major asset allocation changes are in sight
Japanese pension funds have undergone reforms from various perspectives, but comprehensive review and profound reforms have yet to be implemented. Overall, the investment strategy of these pension funds is very conservative when compared with their peers in North America and Europe.
Major Japanese pension funds, including GPIF, are facing mounting pressure to boost returns as pension payouts for the world’s oldest population swell and Prime Minister Shinzo Abe and the Bank of Japan seek to spur market performance. GPIF reform is a key element in Abe’s growth strategy. It is becoming part of the so-called “third arrow” of Abenomics, following aggressive monetary and fiscal stimulus. Recently, GPIF has made a series of changes in investment strategy to diversify its assets and reduce its reliance on low-yielding domestic bonds.

15 May 2014
Japan Indices
Page 4 Deutsche Bank Securities Inc.
Figure 3: 2007-2012 Annualized Growth of Assets of Top 20 Funds (Split by fund
domicile – in local currency)
-1.2%
0.9%
2.4%
6.5%
7.8%
11.0%
11.1%
11.4%
12.5%
14.4%
16.5%
-2.0% 1.0% 4.0% 7.0% 10.0% 13.0% 16.0%
Japan
U.S.
Canada
Netherlands
South Africa
Singapore
Denmark
Malaysia
South Korea
Norway
China
Source: Deutsche Bank, Towers Watson
Figure 4: Asset Allocation Comparison (Average of Top 20 Funds vs GPIF)
0%
10%
20%
30%
40%
50%
60%
70%
Equities Bonds Alternatives & Cash
GPIF
Top 20 funds - Weighted Avg
Top 20 funds - Simple Avg
Source: Deutsche Bank, Towers Watson, data as of 2012, GPIF, data as of Dec 2013
Last year, a reform panel (The Panel for Sophisticating the Management of Public/Quasi-public Funds) was established under the minister in charge of economic revitalization pursuant to the “Japan revitalization strategy” which was formulated as part of Abe’s growth strategy (the third arrow”). This 7-member panel, led by Takatoshi Ito, the dean of the graduate school of Public Policy at Tokyo University, recommended a number of changes in its final report published in November 20131.
1 “Final Report”, Panel for Sophisticating the Management of Public/Quasi-public Funds, November 2013

15 May 2014
Japan Indices
Deutsche Bank Securities Inc. Page 5
Highlights include:
Wage / price inflation linkage: Since benefits paid out from some funds are linked to nominal wage growth rate and inflation rates, it is reasonable to set investment return targets as specific rates above the nominal wage growth rate or inflation rates.
Reduce bond weighting: Present investment portfolios of public and quasi-public funds that invest heavily in domestic bonds need to be revised to improve returns and hold down interest rate risks.
Increase exposure to alternatives: Under a long-term outlook on benefits and contributions in pension finance, GPIF and the like should diversify investments by investing in new types of assets (including real estate investment trusts, real estate, infrastructure, venture capital, private equity and commodities).
Increase active management: Currently, the ratio of active investments is generally low. GPIF, for example, has only about 20 percent of its domestic equity in actively managed portfolios. Consideration should be made to increase the ratio of active investments, depending on the size and characteristics of each fund.
- Less reliance on the Topix: As a benchmark for passive investments in stocks, many funds track the Topix index. Funds should consider improvements including tolerating some deviation from the index or using other indexes that enable more efficient investment.
Risk management and governance: The panel also recommended implementing new risk management measures and a better governance structure over the medium term. It also recommended reestablishing the fund as new type of legal entity.
In the same report, the reform panel outlined a roadmap for the reform of GPIF and addressed the improvements to be made across three timelines: 1) immediately, 2) in approximately one year, and 3) after legal revision has been completed.
Issues to be addressed immediately include
Revise investments within the current policy asset mix (flexible investment using the permissible range of deviation, reviewing active investment)
Consider investment return targets and degree of risk tolerance
Consider the use of new benchmarks in passive investments
Issues to be addressed in about one year include:
Decide on a new policy asset mix based on the results of the reexamination of pension finance
Invest in new types of assets (mainly in liquid assets and assets that can be evaluated without difficulty)
Establish “baby” funds for more flexible deployment of capital
Since the release of this report, the GPIF has taken actions dealing with the above mentioned issues that need to be addressed immediately. The domestic bond allocation has decreased from 58% to 55.2%, and the domestic stock allocation increased about 1%, from 16.2% to 17.2%. The international stock allocation has increased from 13.5% to 15.2%. As of Dec. 31, GPIF had 65.8% of its assets in domestic bonds and 10.6% in offshore debt. The total equity allocation is about 32.4%

15 May 2014
Japan Indices
Page 6 Deutsche Bank Securities Inc.
with international stocks representing 15% of the total assets. Please see Figure 5 below for a more detailed overview of their asset allocation.
Takatoshi Ito, head of the reform panel, said in an interview in February 2 that GPIF should put 50% its assets in stocks and increase its yearly return goal to 5 percent. Members of the advisory group also recommended adding new assets such as real-estate trusts, infrastructure and private-equity investments and commodities.
It is reported that GPIF said on Feb. 28 that it will put as much as $2.7 billion in infrastructure investments over the next five years, in partnership with Development Bank of Japan Inc. and Ontario Municipal Employees Retirement System 3.
Another important committee that has significant influence over GPIF’s asset allocation and operations is the Investment Advisory Committee (IAC), appointed by the Ministry of Health, Labour, and Welfare (“MHLW”). It monitors the implementation of GPIF’s polices and advises the president. On April 22, the MHLW announced a reshuffle of the investment committee. Keio University professor Yasuhiro Yonezawa will be the head of the committee, and three members from the above mentioned advisory group, who spearheaded changes in the fund’s strategy to achieve higher return, will also join the committee. The committee members will be reduced to 8, and only two of the 10 previous members will stay on the committee. The new committee will play a leading role in setting GPIF’s new investment allocation expected to be released in June.
There is also a 21-member government appointed advisory group including 6 IAC members, helping the MHLW conduct a 5-yearly review of GPIF’s basic portfolio. This year is the final year of the most recent 5-year mid-term plan. Major changes in asset allocation are expected with the introduction of the new mid-term plan. The transition will not happen in one day and we expect its impact should be gradual and last for some time. The new recommendations on the asset allocation are likely to be formalized by June, while the implementation is likely to begin immediately after the announcement.
2 “Japan’s GPIF Should Own $600 Billion of Stocks”, Anna Kitanaka and Shigeki Nozawa, Bloomberg news, 17-Feb-2014. 3 “GPIF Shakes Up Committee with Three Abe Panel Members”, Anna Kitanaka and Shigeki Nozawa, Bloomberg news, 22-Apr-2014.

15 May 2014
Japan Indices
Deutsche Bank Securities Inc. Page 7
Figure 5: Current Asset Allocation in GPIF’s Portfolio as of December 2013
Asset CategoryCurrent Target
Alloance Range (+/-)
Upper Bound
Lower Bound
Current Allocation
Market Value (Y billion)
Domestic Bonds 60% 8% 68% 52% 55.22% 71,003 International Bonds 11% 5% 16% 6% 10.60% 13,636 Total Bond 71% 65.8% 84,639
Domestic Stocks 12% 6% 18% 6% 17.22% 22,147 International Stocks 12% 5% 17% 7% 15.18% 19,522 Total Stock 24% 32.4% 41,669
Short-term Assets 5% 5% 5% 1.77% 2,271
Total 100.0% 100.0% 128,579
55.22%
10.60%
17.22%
15.18%
1.77%
Domestic Bonds
International Bonds
Domestic Stocks
International Stocks
Short-term Assets
Source: Deutsche Bank, GPIF
New Domestic Equity Benchmarks: more diversified and spotlight on smart beta
In April, GPIF altered its domestic stock strategy, and awarded 14 active mandates and 10 passive mandates for its Japanese equities allocations, eight of which had existing mandates from the fund 4. The fund will introduce a performance-based fee structure for active managers. GPIF is also planning active investments in a wider range of foreign bonds. These announced changes are quite consistent with the recommendations from the reform panel, in our view. Highlights of the main changes include:
For Passive investments, in addition to Topix, select three new indices: Nikkei 400, MSCI Japan, and Russell Nomura Prime.
For Active investment, in addition to the traditional active management, allocate some assets to Smart Beta active management, targeting to effectively capture mid- to long-term excess returns through indexing strategy. This represents the first time GPIF will employ the idea of smart beta.
4 “GPIF’s Selection of Domestic Equity Investment Managers and Revision of Manager Structure”, GPIF, 4-Apr-2014.

15 May 2014
Japan Indices
Page 8 Deutsche Bank Securities Inc.
For traditional active management, GPIF has selectively chosen managers from a wide range of investment strategies including strategies such as increasing shareholder value via engagement with company management.
Figure 6: Revision of Manager Structure for Domestic Equity Investment
TOPIX
Passive Investments (TOPIX)
JPX-Nikkei 400
MSCI Japan
Russell Nomura Prime
Smart Beta Active Management
Traditional Active Management
Traditional Active Management
Current New (Potential)
Pas
sive
In
vest
men
tsA
ctiv
e In
vest
men
ts
- MSCI Japan Small- Nomura RAFI Ref- S&P GIVI
Ind
exin
gS
trat
egy
Source: Deutsche Bank, GPIF
New asset allocation could potentially inject over $100 bn to domestic equity market
GPIF plans to complete its new five-yearly plan by June of this year. Based on the recommendations from the various committee members made public, we have analyzed three potential scenarios on GPIF’s new allocations. The purpose of this analysis is not to predict exactly what the new allocation will be, but rather to gauge the magnitude of the potential impact of the upcoming changes.
Scenario 1 assumes a more aggressive move to riskier assets (the allocation to equity will increase from the current 33% to 50%, while bond allocation will decrease from the current 65.8% to 40%). Scenario 3 reflects a more conservative change (Equity weight to increase from 33% to 40%, while bond weight to decrease to 57%). Scenario 2 is in between Scenario 1 and Scenario 3. In addition, we also assume the allocation to other assets including Real Estate and Private Equity to gradually increase from 1% to 5%. Again we are not trying to predict GPIF’s new allocation, but rather to analyze the impact if GPIF shifts assets between asset classes. As we do not expect the reshuffle of GPIF’s asset allocation to be a one-time event, our Scenario 1 can be viewed as a relatively longer-term asset allocation target, while Scenario 3 is more likely to reflect potential near-term changes. We estimate there could be significant new money injected to the domestic equity market ranging from $50 bn to over $100 bn.
The downside is obviously felt in the bond market if GPIF’s exposure to stocks comes at the expense of buying Japanese government bonds. Some have speculated that the Bank of Japan, already a big JGB buyer, may act to fill the void to prevent a precipitous market selloff.
The full impact of this major shift in GPIF’s asset allocation could potentially be much larger as other public and private pension funds and life insurers follow suit. As discussed above, Japan has the second largest base of pension assets in the world.

15 May 2014
Japan Indices
Deutsche Bank Securities Inc. Page 9
Besides GPIF, Japan has two other pension funds in the top 20 in the world (Figure 2). In addition, it is reported by Asia Asset Management 5 that Japanese mega trust banks, including Sumitomo Mitsui Trust Bank, Mitsubishi UFJ Trust and Banking, Mizuho Trust and Banking, and Resona Bank, will allocate more investment to equities, while reducing government bond holdings, in order to generate higher returns for clients. Corporate pensions make up approximately half of these accounts, equivalent in aggregate to 36 trillion yen (US$352.27 billion). For fiscal year 2014, which began on April 1, asset allocation for combined domestic and overseas equities has been raised to 58%, an increase of four percentage points. The allocation for foreign stocks will mirror that of local shares, at 29% of holdings.
Figure 7: Potential Asset Allocation Change in GPIF’s
Portfolio | Scenario 1 |
Figure 8: Estimated Flows | Scenario 1 |
35.00%
5.00%26.58%
23.42%
5.00%5.00%
Potential weights
Domestic Bonds International BondsDomestic Stocks International StocksShort-term Assets Other assets (incl. Infra & Real Estate)
55.22%
10.60%
17.22%
15.18%
1.77%
Current weights
(45,000) (30,000) (15,000) - 15,000 30,000
Bonds
Stocks
Short-term Assets
Other assets (incl. Infra & Real Estate)
Potential Flows (¥ billion)
Ass
et C
lass
Domestic International Overall
Source: Deutsche Bank, GPIF
Figure 9: Potential Asset Allocation Change in GPIF’s
Portfolio | Scenario 2 |
Figure 10: Estimated Flows | Scenario 2 |
43.00%
6.00%
23.92%
21.08%
3.00% 3.00%
Potential weights
Domestic Bonds International BondsDomestic Stocks International StocksShort-term Assets Other assets (incl. Infra & Real Estate)
55.22%
10.60%
17.22%
15.18%
1.77%
55.22%
10.60%
17.22%
15.18%
1.77%
Current weights
55.22%
10.60%
17.22%
15.18%
1.77%
Current weights
(30,000) (15,000) - 15,000 30,000
Bonds
Stocks
Short-term Assets
Other assets (incl. Infra & Real Estate)
Potential Flows (¥ billion)
Ass
et C
lass
Domestic International Overall
Source: Deutsche Bank, GPIF
5 “Japan’s mega trust banks up equities allocation”, Asia Asset Management, 29-Apr-2014

15 May 2014
Japan Indices
Page 10 Deutsche Bank Securities Inc.
Figure 11: Potential Asset Allocation Change in GPIF’s
Portfolio | Scenario 3 |
Figure 12: Estimated Flows | Scenario 3 |
49.00%
8.00%
21.26%
18.74%
2.00% 1.00%
Potential weights
Domestic Bonds International BondsDomestic Stocks International StocksShort-term Assets Other assets (incl. Infra & Real Estate)
55.22%
10.60%
17.22%
15.18%
1.77%
Current weights
(30,000) (15,000) - 15,000 30,000
Bonds
Stocks
Short-term Assets
Other assets (incl. Infra & Real Estate)
Potential Flows (¥ billion)
Ass
et C
lass
Domestic International Overall
Source: Deutsche Bank, GPIF
Equity allocations may act as a positive catalyst
These potential shifts could provide significant support for the market going forward. Japan’s markets have been under pressure year-to-date with the Nikkei 225 and Topix down 11.6% and 9.2% respectively. The Japanese benchmark indices are the worst performing global indices on the year. Concerns around Abenomics’ efficacy, disappointment with the lack of additional measures by the BOJ, the slowdown in Yen weakness and profit taking have weighed on the market in 2014. More recently, increased concerns surrounding the hike in the consumption tax have pressured the Nikkei, resulting in the index re-testing the key 14,000 level.
Figure 13: Nikkei Performance Relative to S&P 500 and MSCI World in JPY Terms
0%
10%
20%
30%
40%
50%
60%
70%
Dec
-12
Jan-
13
Feb-
13
Mar
-13
Mar
-13
Apr
-13
May
-13
May
-13
Jun-
13
Jul-1
3
Jul-1
3
Aug
-13
Sep
-13
Sep
-13
Oct
-13
Nov
-13
Dec
-13
Dec
-13
Jan-
14
Feb-
14
Feb-
14
Mar
-14
Apr
-14
Apr
-14
Nor
mal
ized
Ret
urns
(%)
S&P 500 (JPY Terms) MSCI World (JPY Terms) Topix JPX Nikkei 400
Source: Deutsche Bank, Bloomberg Finance LP
We have previously highlighted the potential risks to Japan’s equity markets through this period (“Sell in May? Positioning for Japan’s consumption tax hike”, 26 Mar 14). We feel there can be continued weakness over the immediate term, but believe that any weakness presents a compelling buying opportunity. Deutsche Bank remains positive on the medium- to longer-term outlook for Japan, based on our strong US Dollar thesis and the gains from reform.

15 May 2014
Japan Indices
Deutsche Bank Securities Inc. Page 11
Figure 14: Value Traded on the Tokyo Stock Exchange – last 10 years
-
10,000
20,000
30,000
40,000
50,000
60,000
Dec
-04
Jun-
05
Dec
-05
Jun-
06
Dec
-06
Jun-
07
Dec
-07
Jun-
08
Dec
-08
Jun-
09
Dec
-09
Jun-
10
Dec
-10
Jun-
11
Dec
-11
Jun-
12
Dec
-12
Jun-
13
Dec
-13
Val
ue T
rade
d (U
S$ m
n)
TSE1/TSE2 Daily Value Traded
Source: Deutsche Bank, Bloomberg Finance LP
The timing of this current weak patch is happening at the same time as GPIF’s potential re-allocation in favor of additional domestic equity exposure. We believe that a positive announcement on GPIF’s investment plans could provide a positive catalyst for the markets. While the exact potential buying impact remains uncertain, we believe it should be positive for sentiment, which has been waning in recent months.
The high end of our domestic flow estimate is approximately US$ 100bn. The TSE has seen average daily turnover of approximately US$ 21bn in 2014. While the timing and exact size of any GPIF additional allocation remains uncertain, we believe it should be positive from a flow perspective as well, especially for constituents of the newly proposed benchmarks, such as the Nikkei 400.
Figure 15: Rolling 3m Nikkei / USDJPY correlation – Last 5 years
-20%
0%
20%
40%
60%
80%
100%
Sep
-08
Dec
-08
Mar
-09
Jun-
09
Sep
-09
Dec
-09
Mar
-10
Jun-
10
Sep
-10
Dec
-10
Mar
-11
Jun-
11
Sep
-11
Dec
-11
Mar
-12
Jun-
12
Sep
-12
Dec
-12
Mar
-13
Jun-
13
Sep
-13
Dec
-13
Mar
-14Rol
ling
3m C
orre
latio
n (%
)
2009 2010 2011 2012 2013 2014 Avg-36.4% Avg-42.4%Avg-17.8% Avg-32.3% Avg-56.9% Avg-46.8%
Source: Deutsche Bank, Bloomberg Finance LP
In addition to providing a general boost in sentiment, the GPIF re-allocation may benefit the following thematic ideas. Currently there is significant uncertainty around the timing and size of any reallocation. These strategies would be more effective if the timing and the size of the allocation are known. Potential themes include:
Least liquid stocks. While a US$100bn additional allocation should be readily absorbed by the market given Japan’s $20bn+ daily turnover levels, not all stocks will be impacted equally. Given that the exact split and timing of the upcoming changes remain uncertain, one strategy would be to look at the least liquid stocks in Nikkei 400 and other indices which are receiving allocations as

15 May 2014
Japan Indices
Page 12 Deutsche Bank Securities Inc.
an interesting way to play pension re-allocation in Japan. Please see section “A closer look” later in the report for the highest flow impacted names for the Nikkei 400 and other indices.
Overlap vs unique constituents. We expect a significant amount of the allocation will go towards the Nikkei 400 and other new indices adopted by GPIF, and we see the indices gaining in significance over time. One strategy would be to look at stocks which are in more than one index. The estimated inflows should be summed up, so we would expect more significant flows than that from any single index. Please see Figure 18 for a comparison of the membership across all indices we discussed in this report. Figure 16 shows the top 20 illiquid stocks that are constituents in all the indices being adopted by GPIF except MSCI Japan small cap. On the other hand, if GPIF reallocates assets from one index to another, for example, moving assets from tracking Topix to tracking Nikkei 400, then those unique constituents in Nikkei 400 but not in Topix would receive more inflows. While these are interesting ideas, we have concerns about the relatively limited liquidity, high concentration in JASDAQ names, and the uncertainty around timing and sizing of any reallocation.
Inclusion/exclusion and reweights. The Nikkei 400 and other new indices adopted by GPIF will conduct annual or semi-annual rebalances this year. Looking for potential inclusion/exclusion or even re-weight names, such as those for Nikkei 400 driven by the 3-year ROE calculation may be an interesting trade. Rebalance dynamics for the Nikkei, Topix and MSCI Japan are somewhat well understood by the market at this point, but with the Nikkei 400 being a new index, and S&P GIVI and RAFI as less known indices, some interesting trading opportunities may develop surrounding their rebalances.
Figure 16: Top 20 Illiquid Stocks with overlap in all the indices*
Ticker NameFlow $
mm
Flow shares
mm Days
9042 JP Equity HANKYU HANSHIN HOLDINGS INC 178.22 32.53 19.46
9041 JP Equity KINTETSU CORP 167.62 47.73 14.36
8377 JP Equity HOKUHOKU FINANCIAL GROUP INC 66.45 34.48 14.27
8334 JP Equity GUNMA BANK LTD/THE 60.87 11.46 14.21
9364 JP Equity KAMIGUMI CO LTD 57.77 6.06 14.07
8369 JP Equity BANK OF KYOTO LTD/THE 77.27 9.49 14.01
9001 JP Equity TOBU RAILWAY CO LTD 135.02 27.60 13.50
9008 JP Equity KEIO CORP 96.87 13.70 12.93
9007 JP Equity ODAKYU ELECTRIC RAILWAY CO LTD 134.24 15.30 12.59
8333 JP Equity JOYO BANK LTD/THE 88.70 18.24 11.96
4581 JP Equity TAISHO PHARMACEUTICAL HOLDINGS CO LTD 87.75 1.19 11.74
9022 JP Equity CENTRAL JAPAN RAILWAY CO 540.46 4.41 11.65
9005 JP Equity TOKYU CORP 181.77 28.90 11.56
4088 JP Equity AIR WATER INC 59.53 4.24 11.46
8418 JP Equity YAMAGUCHI FINANCIAL GROUP INC 55.75 6.05 11.09
3382 JP Equity SEVEN & I HOLDINGS CO LTD 795.41 20.17 10.97
2897 JP Equity NISSIN FOODS HOLDINGS CO LTD 97.53 2.04 10.11
7309 JP Equity SHIMANO INC 201.46 2.02 9.96
8766 JP Equity TOKIO MARINE HOLDINGS INC 563.23 19.12 9.95
9020 JP Equity EAST JAPAN RAILWAY CO 668.36 9.17 9.72
*Except MSCI Japan Small Cap and Nikkei 225 Source: Deutsche Bank, Bloomberg Finance LP. N.B. based on AUM assumptions outlined in the “A closer look” section

15 May 2014
Japan Indices
Deutsche Bank Securities Inc. Page 13
Recent trends in Smart Beta investments6.
The past few years have witnessed the rise of alternative or smart beta indices which are bridging the gap between active and passive index management styles. We see the recent adoption of GPIF to include smart beta benchmarks as part of this global trend.
Smart beta lacks a precise definition and generally includes any rules-based strategy for equity market exposure that uses a scheme other than the market capitalization of the broad market to determine the index constituents and/or the weightings. These strategies offer alternative beta exposures based upon fundamental factors, technical factors, style factors, different weighting schemes, or any combination thereof. A strategy as simple as an Equal-Weight index is considered smart beta. One of the key attractions of this developing suite of indices is the cost efficiency compared to the management fees of active funds. Cynics may state that “smart beta” is sometimes just used as a clever marketing term; however we believe that if used wisely, these products are a valuable tool in portfolio construction.
Smart beta strategies saw massive growth in 2013 as investors sought higher risk-adjusted returns through lower-cost, index products. Around 25% of the ETF inflows in 2013 went to alternative beta products. In a recent survey of institutional investors by Cogent research, over half (53%) of managers intend to increase their allocations to smart beta products in the future.7 We expect this interest in smart beta products to continue to be a significant theme in 2014.
Figure 17: The Growth of Smart Beta ETFs Globally
-
5,000
10,000
15,000
20,000
25,000
30,000
35,000
40,000
45,000
US
$ m
illio
ns
Daily Cumulative Cash Flows
Source: Deutsche Bank, Bloomberg Finance LP, Reuters Data as of 30 April 2014 Smart-Beta ETFs is assumed as all non-market-cap and price based index ETFs
Traditionally investors have used market capitalization indices for relatively low-cost passive exposure to equity markets and paid managers to implement active strategies. Smart beta attempts to blend the best of both worlds by offering rules-based products intended to exploit systematic biases or inefficiencies in the market. Most importantly, these smart beta products are offered at a lower cost than actively managed strategies. Many investors use smart beta strategies packaged in an ETF wrapper, but smart beta strategies can also be traded as index swaps.
6 “Synthesizing Equity in 2014”, Pam Finelli, et. al., 17-Dec-2013 7 “Institutions Favor Smart Beta ETFs”, CME Group, 11-Dec-2013

15 May 2014
Japan Indices
Page 14 Deutsche Bank Securities Inc.
While market capitalization-weighted indices are well-diversified and liquid, their implicit bias towards large-cap stocks is sometimes considered less attractive. Market capitalization, a function of price, implicitly over-weights stocks that have been rising and under-weights stocks that have underperformed and may be undervalued. Numerous studies have shown alternative beta strategies have outperformed the market historically over long periods of time. The small-cap and value premiums are classic examples of this. While smart beta strategies have historically outperformed market capitalization strategies on a risk-adjusted basis, this is not always the case over shorter time horizons.
Critics of smart beta in fact argue that these strategies are just cleverly marketed ways of taking active positions on small-cap and value. According to James Montier of GMO, "when [smart beta] strategies are corrected for their exposure to 'value' and 'small,' they exhibit no statistically significant outperformance compared to the cap weighted benchmark." Montier continues to note that now is a particularly inconvenient time to use smart beta as "both value and small have very unattractive expected returns in the U.S. on our data."8
8 “No Silver Bullets in investing (just old snake oil in new bottles).” White Paper. GMO. December 2013.

15 May 2014
Japan Indices
Deutsche Bank Securities Inc. Page 15
Benchmark Comparison
A glimpse at the new benchmarks
The following table provides information on the constituent overlap across all the major indices. Broad indices, such as the Topix and the Russell Nomura Prime, have the most overlap with the remaining indices. With its focus on small caps, the MSCI Japan Small Cap Index has the least overlap with other indices as others don’t have specific small cap focus. Additionally, having a relatively small universe, the Nikkei 225 constituents also have lower overlap. The distinct eligibility criterion for some of the indices has resulted in a number of unique constituents to those particular indices which are not part of any other index. These are the S&P GIVI (19), MSCI Japan Small Cap (18) and Russell Nomura Prime (2). Topix also has 558 unique constituents which is a result of its very broad coverage.
Figure 18: Constituents overlap
Constituents OverlapNikkei 400
MSCI Japan
RN Prime S&P GIVIFTSE RAFI Japan
MSCI JP SC
TopixNikkei 225
Unique constituents
Nikkei 400 400 245 398 291 204 149 388 152 0
MSCI Japan 245 320 314 225 240 0 312 175 0
RN Prime 398 314 999 714 267 650 958 225 2
S&P GIVI 291 225 714 1007 174 615 917 128 19
FTSE RAFI Japan 204 240 267 174 267 26 267 175 0
MSCI JP SC 149 0 650 615 26 875 780 50 18
Topix 388 312 958 917 267 780 1797 225 558
Nikkei 225 152 175 225 128 175 50 225 225 0
Unique constituents 0 0 2 19 0 18 558 0 597
Source: urwqeDeutsche Bank, Bloomberg Finance LP
As we expect the Nikkei 400 is likely to become one of the more followed indices in Japan, we looked to conduct a detailed comparison of it relative to the three other major indices in Japan, the Nikkei 225, the Topix and MSCI Japan. In Figure 19, we summarize many of the key differences between the four indices. We highlight differences in index weight concentration, sector exposure and market cap profile. We also look at the potential ease of trading the new index by assessing how easy it should be to replicate as a cash portfolio, the overall liquidity profile of the index and how difficult it should be to trade the “tail” of the index. We also assess the various futures, options and total return swap options available for each index.

15 May 2014
Japan Indices
Page 16 Deutsche Bank Securities Inc.
Figure 19: Japan Major Index comparison Nikkei 400 Nikkei 225 Topix MSCI Japan
Constituents 400 225 1797 320
Rebalance Annual (Aug)
Annual (Oct) Annual (Oct) Semi-Annual (May/Nov)
Quarterly (Feb/Aug)
Concentration Top 5, 10 and 20 constituents account for 8.1, 15.2 and 27.8%
of the index. Top name is SoftBank at 1.91% of the index
Top 5, 10 and 20 constituents account for 25.4, 33.8 and
46.6% of the index. Top name is Fast Retailing at 8.7% of the
index
Top 5, 10 and 20 constituents account for 13.0, 19.5 and
28.8% of the index. Top name is Toyota at 4.7% of the index.
Overall very diverse given highest number of constituents.
Top 5, 10 and 20 constituents account for 15.6, 22.9 and
33.5% of the index. Top name is Toyota at 5.9% of the index
Sector Exposure Most diversified sector exposure of any of the major
indices (lowest standard deviation). Largest weighting to
Industrials, followed by Consumer Discretionary and
Financials. Underweight Cons Disc and overweight Indust
relative to other indices
Most concentrated sector exposure of the major indices (highest standard deviation of
exposure). Overweight Telecoms , IT, healthcare and Consumer Discretionary. Very underweight Financials (-11%
relative to other major indices).
Very diversified. Largest exposure to Financials, Cons Disc and Industrials. Lowest
sector exposure is to Energy. Overweight Cons Disc (by 2.7%) and underweight Industrials (by 1.9%) relative to the Nikkei 400.
Very diversified. Largest exposure to Consumer
Discretionary, Financials and Industrials. Largest exposure to Financials of any major index at
20%. Underweight Industrials and Consumer Staples relative
to other indices.
Index-Weighted Average Market Cap (US$ mn)
24,555 26,276 28,879 34,126
Market Cap Profile 65.5% and 29.9% of the index weight is from large cap and
mid-cap stocks. Small caps account for 4.6% by index
weight and 32% by number. Index-weighted average market
cap of US$ 24.5 bn
65.2% and 30.6% of the index weight is form large cap and
mid-cap stocks. Small caps account for 4.3% by index
weight and 19.6% by number. Index-weighted average market
cap of US$ 26.2 bn
Largest small-cap bias. 58.8% and 27.2% of the index weight is from large cap and mid-cap stocks. Small and micro caps
account for 14% by index weight and 80.5% by number.
Index-weighted average market cap of US$ 28.9 bn
Most significant large-cap bias. 69.1% and 30.2% of the index
weight is from large cap and mid-cap stocks. Small caps
account for only 0.6% by index weight and 3.8% by number.
Index-weighted average market cap of US$ 34.1 bn
Index-Weighted Average ADV (US$ mn)
111.5 163.4 124.0 147.2
Liquidity The Nikkei 400 has a mixed liquidity profile. It has the
lowest overall index weighted average liquidity, but the "tail"
of the index has superior liquidity to the Topix, though
lower than the Nikkei 225 and the MSCI Japan
The Nikkei 225 has the best liquidity profile of the four
indices, due the fact that it has the least number of stocks and
is top-heavy in very liquid stocks
The Topix has the worst liquidity profile given the large
number of stocks and significant exposure to small-
caps. Its overall average ADV is superior to the Nikkei 400, but
the tail of the Topix is very illiquid, with the last 5% of the
index having an average ADV of US$ 1.5mn per day
MSCI Japan has a very good liquidity profile given its bias
towards larger cap stocks and very low exposure to small-
caps.
Replication Should be relatively easy to replicate, especially relative to
the Topix. Though the liquidity of the last 1% of stocks is not great when compared to the Nikkei 225 and MSCI Japan
Very easy to replicate, though large weightings in Fast
Retailing and Softbank create basis risk for loose
benchmarking. Even the tail of the index is very liquid with
average ADV of US$ 42mn for the last 1% of the index
Very difficult to replicate given "long tail" of illiquid small and
micro-caps
Should be relatively easy to replicate, especially relative to
the Topix
Futures No. Expected to be launched in November
Yes. Extremely liquid. The main Nikkei 225 first contract (NK1)
trades US$ 10bn+ per day. Total futures first contracts on
the Nikkei trade US$ 22bn+ including minis, SGX and CME.
Yes. Not as liquid as the Nikkei, but trades ~US$ 6.9bn per day.
Relatively high open interest
Futures are available on Eurex but have limited liquidity.
Liquidity can be sourced by dealers
Options No. It has been reported by Risk magazine that a few OTC trades
have gone through
Liquid listed market and extremely liquid OTC market
Relatively liquid listed and OTC market, though significantly smaller than the Nikkei 225
N/A
Swaps Liquidity is still nascent Active - often used for hedging option books
Active - often used by local institutions
Active - popular among global investors
Source: Deutsche Bank, Bloomberg Finance LP. N.B. Large cap is defined as having full market cap of greater than US$10bn, followed by mid-cap greater than US$ 2bn, small-cap at greater than US$ 300mn and micro cap less than US$ 300mn.

15 May 2014
Japan Indices
Deutsche Bank Securities Inc. Page 17
JPX Nikkei 400: Benefits of the Topix without the Tail? As highlighted in the previous table, one of the consistent issues with the Topix is its high number of constituents and the fact that the “tail” consists of a large number of relatively illiquid small caps. This can be seen below in the stark difference between the distribution of large-, mid-, and small-caps contribution to index weighting and the total number of constituents across the four major indices. The Nikkei 400, while having a similar correlation profile and slightly superior long-term returns, should be easier to replicate and implement than the Topix. When futures contracts are introduced, which is expected to be in November, it should also be easier to hedge.
Figure 20: Stock Size Distribution – Index Weight Figure 21: Stock Size Distribution – No. of Constituents
0%
20%
40%
60%
80%
100%
NKY 400 NKY TPX MXJPMicro Cap Small Cap Mid Cap Large Cap
0%
20%
40%
60%
80%
100%
NKY 400 NKY TPX MXJP
Micro Cap Small Cap Mid Cap Large Cap
Source: Deutsche Bank, Bloomberg Finance LP. N.B. Large cap is defined as having full market cap of greater than US$10bn, followed by mid-cap greater than US$ 2bn, small-cap at greater than US$ 300mn and micro cap less than US$ 300mn
Source: Deutsche Bank, Bloomberg Finance LP. N.B. Large cap is defined as having full market cap of greater than US$10bn, followed by mid-cap greater than US$ 2bn, small-cap at greater than US$ 300mn and micro cap less than US$ 300mn
While the overall index-weighted liquidity profile of the Nikkei 400 is slightly less than the Topix with overall average index weighted ADV of US$ 111.5mn vs. US$ 124.0mn for the Topix, it should be easier to implement given the smaller tail impact. The overall ADV profile of the 4 major indices is shown in Figure 22. Fully replicating the Topix is much more difficult as the liquidity of the tail is much lower. Looking at the stocks which make up the 95% - 99% bucket of the Topix’ index weight, there are 576 stocks to trade, representing the 713th through 1,289th constituent of the index. The weighted average daily turnover of these stocks is US$ 1.7mn. Looking at the last 1% of the Topix, stocks 1,290 through 1,797, the weighted average stock has an ADV of US$ 0.656mn. This can be seen below in Figure 23.
The Nikkei 400 has weighted average ADV of US$ 8.4mn for the 95 – 99% bucket and US$ 3.6mn for the last 1% of the index. The Nikkei 225 and MSCI Japan show even higher liquidity in their tails, a function of their smaller number of constituents.
Figure 22: Index Average ADV Profile - Cumulative Figure 23: Index Avg ADV Profile –Weighting Buckets
64
128
256
512
1024
2048
0% 20% 40% 60% 80% 100%
Wei
ghte
d A
DV
(US
$ m
n, L
og)
Cumulative Index Weight (%)
JPX Nikkei 400 Nikkei 225 Topix MSCI Japan
0.5
2
8
32
128
512
0- 20% 20-40% 40-60% 60-80% 80-90% 90-95% 95-99% 99-100%W
eigh
ted
AD
V (U
S$m
n, L
og )
Index Weighting BucketsJPX Nikkei 400 Nikkei 225 Topix MSCI Japan
Source: Deutsche Bank, Bloomberg Finance LP. Represents the cumulative average liquidity profile of the index as you move from the largest constituents (LHS) to the smallest (RHS)
Source: Deutsche Bank, Bloomberg Finance LP. Represents the weighted average liquidity of the index at various weighting buckets. For example 99 – 100% represents the weighted liquidity of the last 1% of the index.

15 May 2014
Japan Indices
Page 18 Deutsche Bank Securities Inc.
Valuation Summary Figure 24 shows a valuation summary of the major traditional and smart beta indices in Japan. On a trailing basis, the Nikkei 400 looks relatively more attractive relative to peers, with lower P/E, in-line P/B and higher ROE. That said, the Nikkei 400 looks in-line with other major indices on a forward looking basis based on Bloomberg consensus data. On 1-year forward data (“FY1”), the index still has slightly above average ROE at 8.7% vs. 8.6% average. The index’s forward Price to Book ratio though is higher than average, at 1.2x versus an average of 1.1x. A similar trend can be seen in the 2-year forward (“FY2”) data. Similarly, the Nikkei 400’s trailing P/E of 14.0 is more attractive than the group average of 14.3, but the index is more expensive on a FY1 basis at 13.5x vs. 13.3x.
Figure 24: Japan Major Index Comparison Name P/E (TTM) P/E FY1 P/E FY2 P/B (TTM) P/B (FY1) P/B (FY2) ROE
(TTM)ROE (FY1) ROE (FY2) EV/EBITD
A (TTM) EV/EBITD
A (FY1)EV/EBITD
A (FY2)
JPX Nikkei Index 400 14.0 13.6 12.4 1.3 1.2 1.1 9.5 8.7 8.8 9.0 8.8 8.2
Nikkei 225 18.6 16.2 14.6 1.5 1.4 1.3 8.4 9.5 9.8 8.9 8.3 7.8
Topix Index 13.8 13.2 11.9 1.2 1.1 1.1 9.0 8.6 8.7 9.1 8.6 8.0
Topix Core 30 Idx 11.6 11.9 10.8 1.2 1.1 1.0 10.7 8.5 8.6 9.6 9.6 8.9
Topix 500 Index 13.6 13.2 11.9 1.2 1.1 1.1 9.2 8.6 8.7 9.2 8.7 8.1
Msci Japan 13.5 13.0 11.7 1.2 1.1 1.1 9.4 8.7 8.8 9.5 9.0 8.4
Msci Japan Small Cap 14.8 13.2 11.9 1.0 1.0 0.9 6.9 7.5 8.1 8.6 7.9 7.3
FTSE RAFI Japan 12.1 12.1 10.7 1.0 1.0 0.9 8.9 8.3 8.5 8.4 8.0 7.4
Average 14.0 13.3 12.0 1.2 1.1 1.1 9.0 8.5 8.7 9.0 8.6 8.0
Div Yld (TTM)
Div Yld (FY1)
Div Yld (FY2)
5-Year Change
3-Year Change
2-Year Change
1-Year Change
YTD Change
3m Change
1m Change
JPX Nikkei Index 400 1.9 2.1 2.2 39.5 42.2 55.9 -3.4 -8.5 0.5 4.4
Nikkei 225 1.7 1.8 1.9 58.4 49.3 60.5 -2.4 -11.6 0.6 3.6
Topix Index 2.0 2.0 2.2 37.2 40.9 56.4 -3.9 -9.1 -0.1 4.4
Topix Core 30 Idx 2.4 2.5 2.8 22.2 36.8 57.4 -5.5 -11.2 -1.1 5.1
Topix 500 Index 2.0 2.1 2.3 34.9 39.5 56.5 -3.9 -9.4 -0.1 4.5
Msci Japan 2.0 2.2 2.4 35.4 38.6 56.0 -4.5 -9.9 -0.6 4.1
Msci Japan Small Cap 2.0 1.9 2.1 45.6 16.8 21.0 -3.3 -5.0 -0.7 2.5
FTSE RAFI Japan 2.2 2.3 2.5 35.3 37.5 58.5 -3.7 -9.2 -0.3 4.6
S&P Givi Japan Jpy 47.4 47.1 57.9 -2.5 -7.1 0.8 4.0
Russell Nomura Prime 37.6 40.3 56.0 -3.7 -9.1 -0.1 4.5
Average 2.0 2.1 2.3 38.6 37.7 52.8 -3.8 -9.2 -0.2 4.2 Source: Deutsche Bank, Bloomberg Finance LP. N.B. Fundamental data was unavailable for Russell Nomura Prime and S&P GIVI indices.
Trailing vs. Forward ROE Metrics This differential is trailing versus forward metrics is likely due the Nikkei 400’s selection methodology which uses 3-year trailing ROE as an input. While it would be difficult to use a forward ROE methodology due to constant changes in consensus estimates, we do highlight that this opens up the index to being in situations such as the above, where the Nikkei 400 marginal ROE advantage may not be “worth” the additional valuation costs. This analysis assumes that consensus estimate data is correct, which of course it may not be.
Nikkei 400 Forward ROE vs. P/B The relative additional P/B premium of the above indices is charted relative to ROE in Figure 25 below. We added simple regression lines to give an indication of where the ROE vs. P/B trade-off curve is currently priced based on Bloomberg consensus estimates.

15 May 2014
Japan Indices
Deutsche Bank Securities Inc. Page 19
While a relatively small sample set, based on the universe above, the Nikkei 400 could be considered slightly expensive relative to other major benchmarks at this point in time.
Figure 25: Major Japan Indices – Forward ROE vs. Forward P/B
JPNK400
JPNK400
8.0
8.5
9.0
9.5
10.0
1.0 1.1 1.2 1.3 1.4 1.5
Forw
ard
ROE
(%)
Forward P/BSeries1 Series2 Linear (Series1) Linear (Series2)
Source: Deutsche Bank, Bloomberg Finance LP. N.B. ROE and P/B data was unavailable for Russell Nomura Prime and S&P GIVI indices.
While the ROE calculation may be backward looking, the increased focus on ROE and shareholder returns in general is likely to be positive for the market overall. If the Nikkei 400 develops further cachet, companies may be incentivized to improve returns in order to seek entry, which should be positive. The increased focus of major domestic investors, such as GPIF and other pension funds, should also pressure corporate Japan to look to improve returns.
Cross-index Performance
From a performance perspective, the Nikkei 400 has very similar performance to other broad-based market-capitalization weighted indices in Japan, such as the Topix and the Russell / Nomura Prime index. Over the last 3-years, the Nikkei 400 has seen price return of 42.2%, relatively in line with the Topix and Prime indices at 40.9% and 40.3%. On a 1-year basis, the Nikkei 400 has returned -3.4% vs. the Topix and Prime at -3.9% and -3.7%, respectively.
Figure 26: Traditional Benchmark Performance – 1 year Figure 27: Smart Beta Benchmark Performance – 1 year
-15%-10%-5%0%5%
10%15%20%
May
-13
Jun-
13
Jul-1
3
Aug
-13
Sep
-13
Oct
-13
Nov
-13
Dec
-13
Jan-
14
Feb-
14
Mar
-14
Apr
-14
May
-14
Nor
mal
ized
Ret
urn
(%)
R/N Prime TPX NKYMSCI Japan JPNK400
-15%-10%-5%0%5%
10%15%20%
May
-13
Jun-
13
Jul-1
3
Aug
-13
Sep
-13
Oct
-13
Nov
-13
Dec
-13
Jan-
14
Feb-
14
Mar
-14
Apr
-14
May
-14
Nor
mal
ized
Ret
urn
(%)
S&P GIVI RAFIMSCI Japan Small JPNK400
Source: Deutsche Bank, Bloomberg Finance LP, Nikkei Source: Deutsche Bank, Bloomberg Finance LP, Nikkei

15 May 2014
Japan Indices
Page 20 Deutsche Bank Securities Inc.
On a longer term basis, the Nikkei 400 has shown better relative price performance returning 39.5% on a 5-year basis versus the Topix and Prime with 37.2% and 37.6% price return. Our pro-forma Nikkei 400 data goes back to September 2006 and has declined -20.4% relative to -25.7% and -25.5% for the Topix and Russell / Nomura Prime indices, respectively.
Figure 28: Traditional Benchmark Performance – 2006 to
Current
Figure 29: Smart Beta Benchmark Performance – 2006 to
Current
-60%
-40%
-20%
0%
20%
Sep
-06
Mar
-07
Sep
-07
Mar
-08
Sep
-08
Mar
-09
Sep
-09
Mar
-10
Sep
-10
Mar
-11
Sep
-11
Mar
-12
Sep
-12
Mar
-13
Sep
-13
Mar
-14
Nor
mal
ized
Ret
urn
(%)
R/N Prime TPX NKYMSCI Japan JPNK400
-60%
-40%
-20%
0%
20%
Sep
-06
Mar
-07
Sep
-07
Mar
-08
Sep
-08
Mar
-09
Sep
-09
Mar
-10
Sep
-10
Mar
-11
Sep
-11
Mar
-12
Sep
-12
Mar
-13
Sep
-13
Mar
-14
Nor
mal
ized
Ret
urn
(%)
S&P GIVI RAFIMSCI Japan Small JPNK400
Source: Deutsche Bank, Bloomberg Finance LP, Nikkei Source: Deutsche Bank, Bloomberg Finance LP, Nikkei
Note that the above data primarily represents a period when the Nikkei 400 did not exist. As it becomes more widely accepted, its performance may diverge going forward. Also, if an increased focus on ROE begins to take hold in Japan, we may also see additional divergence in the index’s performance. This “ROE halo” impact may be tempered though by the backward looking nature of the index’s calculation methodology as we described earlier.
Performance has been more differentiated relative to other indices such as the Nikkei 225, likely due to its price weighting methodology and some of the previously highlighted smart beta indices, such as the RAFI and the GIVI.
Figure 30: Correlation to Nikkei 400 - Traditional
Benchmarks
Figure 31: Correlation to Nikkei 400 – Smart Beta
Benchmarks
90.0%
92.0%
94.0%
96.0%
98.0%
100.0%
Dec
-06
May
-07
Oct
-07
Mar
-08
Aug
-08
Jan-
09Ju
n-09
Nov
-09
Apr
-10
Sep
-10
Feb-
11Ju
l-11
Dec
-11
May
-12
Oct
-12
Mar
-13
Aug
-13
Jan-
14
3-m
onth
Cor
rela
tion
(%)
JPNK400 & TPX JPNK400 & R/N Prime JPNK400 & MSCI Jp JPNK400 & NKY
50%
60%
70%
80%
90%
100%
90%
92%
94%
96%
98%
100%
Sep
-06
Apr
-07
Nov
-07
Jun-
08Ja
n-09
Au g
-09
Mar
-10
Oct
-10
Ma y
-11
Dec
-11
Jul-1
2Fe
b-13
Sep
-13
Apr
-143-
mon
th C
orre
latio
n (%
)
JPNK400 & S&P GIVIJPNK400 & RAFIJPNK400 & MSCI Jp Small (RHS)
Source: Deutsche Bank, Bloomberg Finance LP, Nikkei Source: Deutsche Bank, Bloomberg Finance LP, Nikkei
In line with the similar performance profile, the Nikkei 400 has been very highly correlated with other traditional benchmark indices in Japan. Since September 2006, the Nikkei 400’s rolling 3-month correlation with the Topix, MSCI Japan and Russell

15 May 2014
Japan Indices
Deutsche Bank Securities Inc. Page 21
Nomura Prime indices has never been below 99%. The correlation has been lower with the Nikkei 225 and other non-traditional indices as can be seen above.
Figure 32: Nikkei 400 less Topix – Daily Return Differentials
-1.0%
-0.5%
0.0%
0.5%
1.0%
Sep
-06
Jan-
07
Ma y
-07
Sep
-07
Jan-
08
May
-08
Sep
-08
Jan-
09
May
-09
Sep
-09
Jan-
10M
ay-1
0
Sep
-10
Jan-
11
Ma y
-11
Sep
-11
Jan-
12
May
-12
Sep
-12
Jan-
13
Ma y
-13
Sep
-13
Jan-
14
Diff
eren
ce in
Dai
ly R
etur
ns (%
)
Daily Change Difference - JPNK400 less TPX Average = 0.004%
Source: Deutsche Bank, Bloomberg Finance LP, Nikkei
The performance similarity with the Topix can be seen in Figure 32 above, which charts the daily performance differential in the Nikkei 400 versus the Topix since September 2006. The average daily performance difference over that period is 0.004%, or 4/10 of a basis point. The largest divergence occurred following the Tohoku earthquake in March 2011 with a 67bps outperformance of the Nikkei 400 relative to the Topix.
Figure 33: Relative Correlation vs. USDJPY – Traditional
Benchmarks
Figure 34: Relative Correlation vs. USDJPY – Smart Beta
Benchmarks
-60%
-10%
40%
90%
Dec
-06
May
-07
Oct
-07
Mar
-08
Aug-
08Ja
n-09
Jun-
09N
ov-0
9A
pr-1
0Se
p-10
Feb-
11Ju
l-11
Dec
-11
May
-12
Oct
-12
Mar
-13
Aug
-13
Jan-
143-m
onth
Cor
rela
tion
(%)
TPX / JPY R/N Prime / JPYMSCI Jp / JPY JPNKY400 / JPY NKY / JPY
-60%-40%-20%
0%20%40%60%80%
Dec
-06
May
-07
Oct
-07
Mar
-08
Au g
-08
Jan-
09Ju
n-09
Nov
-09
Apr
-10
Sep
-10
Feb-
11Ju
l-11
Dec
-11
Ma y
-12
Oct
-12
Mar
-13
Aug
-13
Jan-
143-m
onth
Cor
rela
tion
(%)
S&P GIVI / JPY RAFI / JPYMSCI Jp Small / JPY JPNKY400 / JPY
Source: Deutsche Bank, Bloomberg Finance LP, Nikkei Source: Deutsche Bank, Bloomberg Finance LP, Nikkei
Figures 33 and 34, above, show the various Japanese benchmark’s correlation with USDJPY. All of the indices have a similar relationship to the Yen, with the exception of the MSCI Small Cap index.

15 May 2014
Japan Indices
Page 22 Deutsche Bank Securities Inc.
Figure 35: Rolling 3m Tracking Error vs. Nikkei 400 –
Traditional Benchmarks
Figure 36: Rolling 3m Tracking Error vs. Nikkei 400 –
Smart Beta Benchmarks
0%2%4%6%8%
10%12%14%16%
Sep
-06
Mar
-07
Sep
-07
Mar
-08
Sep
-08
Mar
-09
Sep
-09
Mar
-10
Sep
-10
Mar
-11
Sep
-11
Mar
-12
Sep
-12
Mar
-13
Sep
-13
Mar
-14Rol
ling
3-m
onth
Tra
ckin
g Er
ror (
%)
NKY R/N Prime MSCI Japan TPX
0%5%
10%15%20%25%30%35%
Dec
-06
Jun-
07D
ec-0
7Ju
n-08
Dec
-08
Jun-
09D
ec-0
9Ju
n-10
Dec
-10
Jun-
11D
ec-1
1Ju
n-12
Dec
-12
Jun-
13D
ec-1
3Rol
ling
3-m
onth
Tra
ckin
g Er
ror (
%)
S&P GIVI RAFI MSCI Japan Small
Source: Deutsche Bank, Bloomberg Finance LP, Nikkei Source: Deutsche Bank, Bloomberg Finance LP, Nikkei
Given the similar performance and correlation profiles, the large market-cap weighted indices show very small tracking error relative to Nikkei 400.This can be seen above in Figure 35.
Figure 37: Rolling 3m Realized Volatility – Traditional
Benchmarks
Figure 38: Rolling 3m Realized Volatility – Smart Beta
Benchmarks
0%10%20%30%40%50%60%70%80%
Sep-
06M
ar-0
7Se
p-07
Mar
-08
Sep-
08M
ar-0
9Se
p-09
Mar
-10
Sep-
10M
ar-1
1Se
p-11
Mar
-12
Sep-
12M
ar-1
3Se
p-13
Mar
-14
Rea
lized
Vol
atili
ty (%
)
R/N Prime TPX NKYMSCI Japan JPNK400
0%10%20%30%40%50%60%70%80%
Sep-
06M
ar-0
7Se
p-07
Mar
-08
Sep-
08M
ar-0
9Se
p-09
Mar
-10
Sep-
10M
ar-1
1Se
p-11
Mar
-12
Sep-
12M
ar-1
3Se
p-13
Mar
-14
Rea
lized
Vol
atili
ty (%
)
S&P GIVI RAFIMSCI Japan Small JPNK400
Source: Deutsche Bank, Bloomberg Finance LP, Nikkei Source: Deutsche Bank, Bloomberg Finance LP, Nikkei
The volatility profile of the traditional benchmarks is relatively similar. The Nikkei 225 has shown an average premium of 2 volatility points over the Nikkei 400 throughout the period. The Topix has shown an average 0.2% volatility premium, in line with its high correlation to the Nikkei 400.
Increasing adoption of Nikkei 400 may impact its dynamic with other indices As we have previously highlighted, the Nikkei 400 has very similar characteristics to the Topix and the Russell / Nomura Prime, and to a lesser extent, MSCI Japan. It may diverge going forward as it begins to become a more widely accepted index. This would especially be the case if ROE takes on a more important role in the Japanese market.

15 May 2014
Japan Indices
Deutsche Bank Securities Inc. Page 23
A Closer Look
Nikkei 400
JPX-Nikkei 400 is designed to encourage investment in stocks with high return on equity, which is a measure of how well companies use shareholders’ money to generate income. This new index aims to promote the quality, corporate governance and capital efficiency of Japanese companies using the power of the market. GPIF and other major pension funds have recently chosen this index as benchmark. Although they have not announced the size of their portfolio yet, we expect that it will be in the billions of dollars. In addition, there are now more than 20 funds (ETFs and Open-ended Funds) in Japan tracking the index, despite it only having launched in January 2014. It has attracted close to ¥87 billion (US$850 million) in inflows so far. The bulk of the flows has come from the three exchange-traded funds (ETFs) that Nomura Asset Management, Nikko Asset Management and Mitsubishi UFJ Asset Management set up to track the new index. The three ETFs garnered a combined ¥50 billion (US$490 million) in assets as of end of April. Osaka Exchange, Inc. (OSE) also announced that it will introduce futures based on JPX-Nikkei 400 by the end of November 2014.
Figure 39: Cumulative Inflows to ETFs Tracking Nikkei 400
-
100
200
300
400
500
600
US
$ m
illio
n
Nikkei Index 400 ETFs - Daily Cum. Flows
Source: Deutsche Bank, Bloomberg Finance LP
All these will put pressure on Japanese firms which don’t have a high ROE scores to perform better, otherwise they won’t be members of this important benchmark. Generally speaking, Japanese companies perform poorly on ROE metrics when compared with those in other countries in the region or in the US (9.49 for Nikkei 400, and 8.95 for Topix, vs. 15.08 for S&P 500, and 12.83 for MSCI Asia ex Japan). Japanese companies tend to hold on to less-profitable businesses and maintain large capital bases without investing for growth or distributing cash to investors. Some Japanese companies may start to change in response to this new index, however, the process may take a long time as relatively strong labor protection in the close-knit business society of Japan makes it very difficult to layoff workers and unload underperforming assets.

15 May 2014
Japan Indices
Page 24 Deutsche Bank Securities Inc.
Highlights of index methodology Eligible universe: Stocks listed in TSE (1st Section, 2nd section, Mothers, JASDAQ)
Excluding issues listed less than 3 yrs, Liabilities > assets, during any of the past 3 fiscal years, operating deficit, or overall deficit in all of the past 3 fiscal years, to be Delisted, etc.
Constituent selection/Index Calculation
1. The top 1000 issues will be selected: from those eligible based on trading value in the past 3 years and market cap on the base date for selection.
2. Scoring based on Quantitative Indicators: 1st: 1000 points – 1000th: 1 point. Then, overall score is determined by aggregating those ranking scores with the following weights. : 3 year average ROE (40%), 3-year cumulative operating profit (40%), market cap (20%).
3. Scoring based on Qualitative Indicators: the score is determined so that at most around 10 constituents are different from those chosen with only quantitative score above. Scores based on appointment of Independent Outside Directors (at least 2), Adoption or Scheduled Adoption of IFRS (pure IFRS), Disclosure of English Earnings Information via TDnet (Company Announcements Distribution Service in English).
4. Determination of Constituents: the 400 issues will be selected in descending order of high scores as constituents.
5. Each stock in the index is weighted by its free float market cap.
Sector weight comparison We also compare the sector/industry weights of the Nikkei 400 and Topix. The Nikkei 400 has a bias towards Capital Goods, but is underweight in Automobile & Components and Banks. The Nikkei 400 uses a sector classification system consisting of 6 sectors and 36 industries, which is different from Topix who uses Topix 17 series. They both are different from the GICS sector classification. To make the comparison consistent for all indices we analyze the sector weights based on GICS industry group.

15 May 2014
Japan Indices
Deutsche Bank Securities Inc. Page 25
Figure 40: Industry Group Weights: Nikkei 400 vs. Topix
1.9%
-2.3
%
0.5%
-1.5
%
0.1% 0.
6%
0.6% 1.
0%
0.9%
0.1%
-0.7
%
0.3% 0.
6%
-0.2
%
-0.2
%
-0.1
%
0.3%
0.3%
-1.0
%
0.1%
-0.5
%
-0.1
%
-0.6
%
-0.2
%
-3.0%
-2.0%
-1.0%
0.0%
1.0%
2.0%
3.0%
0.0%
3.0%
6.0%
9.0%
12.0%
15.0%
18.0%
Ind
ust
ry G
rou
p W
eig
hts
Nikkei 400TOPIXOver/under weight - rhs
Source: Deutsche Bank, Bloomberg Finance LP, Nikkei, Topix
Illiquid stocks and stocks with largest index weight As GPIF has not released their new asset allocation, we don’t know exactly how much it will allocate to each index. Based on Scenario One discussed above, and assuming that 50% of the additional allocation to passive will be into the Nikkei 400, then the inflow would be close to US$20bn. GPIF is likely to implement this change gradually over a certain period of time. To get a sense of the potential impact, we estimate the most impacted names in the index by total value to trade and days to trade, assuming US$15 bn new money to invest in the index. If the actual inflow is US$5bn, then the impact will be just one third of the numbers in the tables below.
Figure 41: Top 20 Most Illiquid Stocks
Ticker Name% Index Weight Flow $mm
Flow shares
mm Days
3167 JP Equity TOKAI Holdings Corp 0.015% 2.20 0.64 7.26
9031 JP Equity Nishi-Nippon Railroad Co Ltd 0.058% 8.75 2.28 6.37
8012 JP Equity Nagase & Co Ltd 0.060% 9.03 0.74 6.10
9045 JP Equity Keihan Electric Railway Co Ltd 0.102% 15.28 3.71 5.94
9042 JP Equity Hankyu Hanshin Holdings Inc 0.323% 48.51 8.86 5.30
8544 JP Equity Keiyo Bank Ltd/The 0.042% 6.29 1.43 5.14
8600 JP Equity TOMONY Holdings Inc 0.028% 4.24 1.00 5.10
9003 JP Equity Sotetsu Holdings Inc 0.072% 10.77 3.02 5.09
9948 JP Equity Arcs Co Ltd 0.040% 5.93 0.30 5.01
8051 JP Equity Yamazen Corp 0.022% 3.23 0.50 4.76
8356 JP Equity Juroku Bank Ltd/The 0.051% 7.60 2.18 4.63
2782 JP Equity Seria Co Ltd 0.041% 6.08 0.16 4.61
8385 JP Equity Iyo Bank Ltd/The 0.111% 16.70 1.86 4.57
7458 JP Equity Daiichikosho Co Ltd 0.055% 8.26 0.29 4.42
4045 JP Equity Toagosei Co Ltd 0.045% 6.79 1.62 4.39
3098 JP Equity Cocokara fine Inc 0.026% 3.84 0.14 4.13
8359 JP Equity Hachijuni Bank Ltd/The 0.117% 17.48 3.20 4.09
7451 JP Equity Mitsubishi Shokuhin Co Ltd 0.021% 3.20 0.14 4.04
9041 JP Equity Kintetsu Corp 0.311% 46.64 13.28 4.00
1417 JP Equity Mirait Holdings Corp 0.025% 3.69 0.42 3.92
Source: Deutsche Bank, Bloomberg Finance LP., Nikkei, Note: Assuming US$15bn of inflows

15 May 2014
Japan Indices
Page 26 Deutsche Bank Securities Inc.
Figure 42: Top 20 Largest Weights
Ticker Name% Index Weight Flow $mm
Flow shares
mm Days
9984 JP Equity SoftBank Corp 1.909% 286.37 3.86 0.26
6954 JP Equity FANUC Corp 1.766% 264.94 1.47 1.39
6501 JP Equity Hitachi Ltd 1.502% 225.33 31.69 1.62
9432 JP Equity Nippon Telegraph & Telephone Corp 1.476% 221.47 4.00 1.99
4502 JP Equity Takeda Pharmaceutical Co Ltd 1.471% 220.66 4.92 1.50
9433 JP Equity KDDI Corp 1.435% 215.20 4.04 1.38
7203 JP Equity Toyota Motor Corp 1.433% 214.94 3.98 0.49
3382 JP Equity Seven & I Holdings Co Ltd 1.432% 214.82 5.45 2.96
7267 JP Equity Honda Motor Co Ltd 1.405% 210.81 6.38 1.04
8411 JP Equity Mizuho Financial Group Inc 1.399% 209.86 107.28 1.45
2914 JP Equity Japan Tobacco Inc 1.372% 205.76 6.27 1.49
7751 JP Equity Canon Inc 1.332% 199.86 6.36 1.62
8316 JP Equity Sumitomo Mitsui Financial Group Inc 1.273% 190.98 4.84 0.60
8306 JP Equity Mitsubishi UFJ Financial Group Inc 1.273% 190.89 36.01 0.60
8802 JP Equity Mitsubishi Estate Co Ltd 1.259% 188.79 8.34 1.60
8058 JP Equity Mitsubishi Corp 1.211% 181.71 10.16 2.08
8801 JP Equity Mitsui Fudosan Co Ltd 1.210% 181.43 6.14 1.57
4503 JP Equity Astellas Pharma Inc 1.180% 177.00 15.92 2.16
9020 JP Equity East Japan Railway Co 1.180% 176.98 2.43 2.58
9437 JP Equity NTT DOCOMO Inc 1.135% 170.26 10.73 1.66
Source: Deutsche Bank, Bloomberg Finance LP, Nikkei Note: Assuming US$15bn of inflows
Russell Nomura Prime
Russell and Nomura Securities Co., Ltd. produce a family of Japan equity indexes, including the Prime index. The indexes are value weighted and include only common stocks domiciled in Japan. All indexes are subsets of the Russell/Nomura Total Market™ Index, which represents 98% of the investable Japan equity market.
Highlights of index methodology Eligible universe: The Prime index consists of the largest 1,000 securities by available market capitalization in the Russell/Nomura Total Market Index (TMI) containing the top 98% (approximately 1,400 stocks) of the available market capitalization in the Japanese market. Stocks under supervision (examination) and stocks under supervision (confirmation), REITs and Foreign stocks listed in Japan are excluded from the universe for TMI.
Constituent selection/Index Calculation
1. Negative list (exclusion of low liquidity stocks): Stocks ranked 2,001st or lower in terms of average monthly trading value in the year to the regular reconfiguration date of record are excluded.
2. Banding method (900–1,100 rule): Stocks ranked 900 or higher by float-adjusted market capitalization are included in the index, regardless of whether or not they were included in the index prior to the reconfiguration. Stocks ranked 901 to 1,100 are included in the index only if they were

15 May 2014
Japan Indices
Deutsche Bank Securities Inc. Page 27
included in the index prior to the reconfiguration, until 1,000 stocks have been selected. If 1,000 stocks have not been selected after going through the 1,100 stocks in this way, stocks ranked between 901 and 1,100 that were not included in the index prior to the reconfiguration are selected until a total of 1,000 stocks has been selected.
3. Each stock in the index is weighted by its free float market cap.
Sector weight comparison Among all the analyzed indices in this section, Russell Nomura Prime industry group weights are closest with that of Topix. The maximum overweight and underweight percentage across all the industry group are just 0.4% and 0.6% respectively. Again, as Russell and Topix use different sector classification system, to make the comparison consistent for all indices, we analyze the sector weights based on GICS industry group.
Figure 43: Industry Group Weights: Russell Nomura Prime vs. Topix
-0.1
%
-0.6
%
0.1%
0.4%
-0.1
%
0.2%
0.0%
0.3%
-0.3
%
0.0%
-0.2
%
0.1%
0.0%
0.2%
0.1%
0.0%
-0.1
% 0.1%
0.0% 0.
0%
-0.1
%
0.1%
0.0% 0.
1%
-0.8%
-0.6%
-0.4%
-0.2%
0.0%
0.2%
0.4%
0.6%
0.0%
3.0%
6.0%
9.0%
12.0%
15.0%
18.0%
Ind
ust
ry G
rou
p W
eig
hts
Russell Nomura Prime
TOPIX
Over/under weight - rhs
Source: Deutsche Bank, Bloomberg Finance LP, Russell, Topix
Illiquid stocks and stocks with largest index weight As explained above, we don’t know exactly how much GPIF will allocate to each index. Based on Scenario One discussed above, and assuming that 25% of the additional allocation to passive will be into the Nikkei 400, then the inflow would be close to US$10bn. GPIF is likely to implement this change gradually over a certain period of time. To get a sense of the potential impact, we estimate the most impacted names in the index by total value to trade and days to trade, assuming US$5 bn new money to invest in the index. If the actual inflow is US$2bn, then the impact will be just 40% of the numbers in the tables below.

15 May 2014
Japan Indices
Page 28 Deutsche Bank Securities Inc.
Figure 44: Top 20 Most Illiquid Stocks
Ticker Name% Index Weight
Flow $ mm
Flow shares
mm Days
9708 JP Equity IMPERIAL HOTEL,LTD. 0.009% 0.47 0.02 3.95
7914 JP Equity KYODO PRINTING CO.,LTD. 0.006% 0.32 0.12 2.78
8173 JP Equity JOSHIN DENKI CO.,LTD. 0.009% 0.47 0.06 2.74
8066 JP Equity MITANI CORPORATION 0.012% 0.60 0.03 2.69
3201 JP Equity THE JAPAN WOOL TEXTILE CO.,LTD. 0.014% 0.70 0.09 2.43
4958 JP Equity T.HASEGAWA CO.,LTD. 0.011% 0.57 0.04 2.36
8536 JP Equity THE HIGASHI-NIPPON BANK,LIMITED 0.011% 0.54 0.21 2.32
8342 JP Equity THE AOMORI BANK,LTD. 0.016% 0.82 0.30 2.28
8529 JP Equity THE DAISAN BANK,LTD. 0.008% 0.39 0.23 2.25
8395 JP Equity THE BANK OF SAGA LTD. 0.008% 0.39 0.19 2.22
4966 JP Equity C.UYEMURA & CO.,LTD. 0.009% 0.44 0.01 2.22
7279 JP Equity HI-LEX CORPORATION 0.017% 0.83 0.03 2.21
4628 JP Equity SK KAKEN CO.,LTD. 0.012% 0.62 0.01 2.18
6905 JP Equity COSEL CO.,LTD. 0.009% 0.44 0.04 2.15
8374 JP Equity THE MIE BANK,LTD. 0.007% 0.35 0.16 2.15
5192 JP Equity MITSUBOSHI BELTING LTD. 0.008% 0.42 0.08 2.11
8032 JP Equity JAPAN PULP AND PAPER COMPANY LIMITED 0.008% 0.42 0.12 2.09
3950 JP Equity THE PACK CORPORATION 0.009% 0.45 0.02 2.06
2908 JP Equity FUJICCO CO.,LTD. 0.007% 0.33 0.03 2.05
8392 JP Equity THE OITA BANK,LTD. 0.019% 0.95 0.26 2.04
Source: Deutsche Bank, Bloomberg Finance LP, Russell Note: Assuming US$5bn of inflows
Figure 45: Top 20 Largest Weights
Ticker Name% Index Weight
Flow $ mm
Flow shares
mm Days
7203 JP Equity TOYOTA MOTOR CORPORATION 3.972% 198.59 3.68 0.45
8306 JP Equity MITSUBISHI UFJ FINANCIAL GROUP,INC. 2.388% 119.42 22.50 0.38
9984 JP Equity SOFTBANK CORP. 2.106% 105.32 1.42 0.10
7267 JP Equity HONDA MOTOR CO.,LTD. 1.831% 91.55 2.77 0.45
8316 JP Equity SUMITOMO MITSUI FINANCIAL GROUP,INC. 1.828% 91.42 2.32 0.29
8411 JP Equity MIZUHO FINANCIAL GROUP,INC. 1.613% 80.66 41.19 0.56
9432 JP Equity NIPPON TELEGRAPH AND TELEPHONE CORPORATI 1.567% 78.35 1.41 0.70
6954 JP Equity FANUC CORPORATION 1.303% 65.17 0.36 0.34
7751 JP Equity CANON INC. 1.249% 62.47 1.98 0.51
2914 JP Equity JAPAN TOBACCO INC. 1.217% 60.83 1.85 0.44
6501 JP Equity HITACHI,LTD. 1.205% 60.25 8.47 0.43
4502 JP Equity TAKEDA PHARMACEUTICAL COMPANY LIMITED 1.184% 59.22 1.32 0.40
3382 JP Equity SEVEN & I HOLDINGS CO.,LTD. 1.064% 53.18 1.35 0.73
9433 JP Equity KDDI CORPORATION 1.032% 51.59 0.97 0.33
8802 JP Equity MITSUBISHI ESTATE COMPANY,LIMITED 0.918% 45.88 2.03 0.39
4503 JP Equity ASTELLAS PHARMA INC. 0.868% 43.39 3.90 0.53
8801 JP Equity MITSUI FUDOSAN CO.,LTD. 0.846% 42.30 1.43 0.36
9020 JP Equity EAST JAPAN RAILWAY COMPANY 0.840% 42.00 0.58 0.61
8058 JP Equity MITSUBISHI CORPORATION 0.839% 41.94 2.34 0.48
8031 JP Equity MITSUI & CO.,LTD. 0.835% 41.75 2.94 0.54
Source: Deutsche Bank, Bloomberg Finance LP, Russell Note: Assuming US$5bn of inflows

15 May 2014
Japan Indices
Deutsche Bank Securities Inc. Page 29
S&P GIVI Japan
The S&P GIVI (Global Intrinsic Value Index) is designed to provide an alternative measure of global stock market performance through the selection of a global low-risk stock portfolio and a weighting scheme where a stock’s index weight is determined by its calculated intrinsic value.
Highlights of index methodology Eligible universe: The S&P GIVI is constructed from the constituents of the S&P Global BMI, which covers all publicly listed equities with a minimum float-adjusted market cap of US$ 100 million and a minimum annual dollar value traded (ADVT) of US$ 50 million from each of its included countries. The index universe for the S&P GIVI is a low-risk subset of the S&P Global BMI, where 30% of the total float-adjusted market capitalization is removed, in order of the most volatile stocks as measured by regional market stock beta.
Constituent selection/Index Calculation
1. The intrinsic value of each stock is determined by its book value and its discounted projected earnings. The discount rate is calculated using a stock’s beta, derived from its previous five years of price returns and a risk free interest rate. There is cap on Intrinsic Value Weights if it is above its regional BMI float-adjusted market cap weight by a specific upper bound. The excess weight is redistributed to other stocks in the index in proportion to their original intrinsic value weight.
2. Low risk Stock Selection. The risk of each stock in the S&P BMI universe is measured by the regional market beta of the stock. For each country, the stocks are sorted by their betas and select 70% of the universe with the lowest betas. The 70% selection is measured by float-adjusted market capitalization. The resulting stock portfolio forms the S&P GIVI.
3. Buffer Rule for Index Constituents’ Beta. A 5% buffer is applied to stocks already in the index. For a constituent to be removed from the index during a rebalancing, it must be among the highest 25% of float-adjusted weights when ranked by beta. This 5% buffer reduces index portfolio turnover.
4. Following the S&P BMI, during the S&P GIVI September reconstitution, index constituents that fall below US$ 75 million float-adjusted market capitalization or trade less than US$ 35 million during the preceding 12 months are dropped from the index.
5. Each stock in the index is weighted by its calculated intrinsic value, rather than the market cap.
Sector weight comparison Unlike Topix and any other index being analyzed in this section, S&P GIVI has given largest weight to Automobiles & Components followed by Banks. Similarly, Capital Goods underweighted by 8.5% and ranked 4th. Most of the remaining industry groups weights are closely matching with that of Topix.

15 May 2014
Japan Indices
Page 30 Deutsche Bank Securities Inc.
Figure 46: Industry Group Weights: S&P GIVI vs. Topix
3.4%
5.1%
0.0%
-8.5
%
0.9%
0.5% 0.8%
0.6%
-2.3
%
0.2% 1.
2%
-0.4
% 1.0%
0.7%
-0.1
%
0.3%
0.1%
-0.7
%
0.3%
-0.2
%
0.1%
-0.1
%
-0.7
%
-2.3
%
-10.0%
-8.0%
-6.0%
-4.0%
-2.0%
0.0%
2.0%
4.0%
6.0%
0.0%
3.0%
6.0%
9.0%
12.0%
15.0%
18.0%
Ind
ust
ry G
rou
p W
eig
hts
S&P GIVITOPIXOver/under weight - rhs
Source: Deutsche Bank, Bloomberg Finance LP, S&P, Topix
Illiquid stocks and stocks with largest index weight As explained above, we don’t know exactly how much GPIF will allocate to each index. To get a sense of the potential impact, we estimate the most impacted names in the index by total value to trade and days to trade, assuming US$3 bn new money to invest in the index.
Figure 47: Top 20 Most Illiquid Stocks
Ticker Name% Index Weight
Flow $ mm
Flow shares
mm Days
8421 JP Equity Shinkin Central Bank 0.162% 4.85 0.00 34.162733 JP Equity Arata Corp 0.025% 0.74 0.23 10.222790 JP Equity Nafco Co Ltd 0.029% 0.87 0.06 10.179310 JP Equity Japan Transcity Corp 0.018% 0.53 0.17 8.22 8364 JP Equity Shimizu Bank 0.029% 0.87 0.04 7.72 8395 JP Equity Bank of Saga 0.044% 1.31 0.63 7.49 8173 JP Equity Joshin Denki Co 0.036% 1.07 0.13 6.27 9902 JP Equity Nichiden Corp 0.031% 0.92 0.04 5.99 9534 JP Equity Hokkaido Gas Co Ltd 0.016% 0.48 0.18 5.86 8543 JP Equity Minato Bank, The 0.062% 1.85 1.08 5.79 8374 JP Equity Mie Bank 0.031% 0.92 0.43 5.66 8529 JP Equity Daisan Bank 0.032% 0.96 0.58 5.59 8217 JP Equity Okuwa Co Ltd 0.033% 0.98 0.11 5.52 5909 JP Equity Corona Corp 0.019% 0.56 0.06 5.46 8536 JP Equity Higashi-Nippon Bank 0.041% 1.23 0.49 5.33 8349 JP Equity Tohoku Bank, The 0.017% 0.50 0.35 5.27 8343 JP Equity Akita Bank 0.066% 1.99 0.72 5.17 2288 JP Equity Marudai Food Co 0.046% 1.38 0.46 5.11 2692 JP Equity Itochu Shokuhin Co Ltd 0.015% 0.46 0.01 4.86 8541 JP Equity Ehime Bank 0.048% 1.44 0.66 4.85
Source: Deutsche Bank, Bloomberg Finance LP, S&P Note: Assuming US$3bn of inflows

15 May 2014
Japan Indices
Deutsche Bank Securities Inc. Page 31
Figure 48: Top 20 Largest Weights
Ticker Name% Index Weight
Flow $ mm
Flow shares
mm Days
7203 JP Equity Toyota Motor Corp 6.881% 206.42 3.82 0.47 7267 JP Equity Honda Motor Co 3.133% 93.98 2.84 0.46 8316 JP Equity Sumitomo Mitsui Financial Group 2.976% 89.27 2.26 0.28 8411 JP Equity Mizuho Financial Group Inc 2.887% 86.60 44.23 0.60 9432 JP Equity Nippon Tel & Tel Corp 1.975% 59.25 1.07 0.53 7751 JP Equity Canon Inc 1.521% 45.64 1.45 0.37 9984 JP Equity Softbank Corp 1.370% 41.11 0.55 0.04 7201 JP Equity Nissan Motor Co 1.288% 38.64 4.50 0.38 9437 JP Equity NTT DOCOMO 1.276% 38.28 2.41 0.37 9433 JP Equity KDDI Corp 1.185% 35.56 0.67 0.23 6501 JP Equity Hitachi 1.179% 35.38 4.97 0.25 2914 JP Equity Japan Tobacco Inc 1.137% 34.11 1.04 0.25 9020 JP Equity East Japan Railway Co 1.132% 33.96 0.47 0.49 3382 JP Equity Seven & I Holdings Co Ltd 1.104% 33.12 0.84 0.46 8766 JP Equity Tokio Marine Holdings Inc 1.099% 32.96 1.12 0.58 9022 JP Equity Central Japan Railway Co 1.080% 32.40 0.26 0.70 5108 JP Equity Bridgestone Corp 1.066% 31.98 0.89 0.33 4502 JP Equity Takeda Pharmaceutical Co Ltd 1.034% 31.03 0.69 0.21 6971 JP Equity Kyocera Corp 0.908% 27.25 0.58 0.45 4578 JP Equity Otsuka Holdings Co Ltd 0.821% 24.64 0.86 0.58
Source: Deutsche Bank, Bloomberg Finance LP, S&P Note: Assuming US$3bn of inflows
RAFI
GPIF hasn’t clearly specified the exact index for “Nomura RAFI reference index”. This may be a customized index designed by Nomura and Research Affiliates for GPIF, so the details are not publically available. The FTSE/RAFI Japan index, designed by FTSE and Research Affiliates, could be similar to Nomura RAFI reference index, although may not be exactly same. We hope to shed some light on the Nomura RAFI reference index by looking at the FTSE/RAFI Japan index.
The FTSE RAFI Index Series weights index constituents using specific fundamental factors, rather than market capitalization. Therefore at review constituent weights are not based on price valuations established by the market.
Highlights of index methodology Eligible universe: The FTSE RAFI Japan Index will be selected from the FTSE Global Equity Index with the largest RAFI fundamental values.
Constituent selection/Index Calculation
1. The representation of each stock in the universe is calculated as a percentage of each of the factors below: a) Sales (5 year average), b) Cash Flow (5 year average), c) Book Value, d) Dividends (5 year total dividend). If a stock has not paid dividends in the past five years, it will have a percentage representation of zero.

15 May 2014
Japan Indices
Page 32 Deutsche Bank Securities Inc.
2. The RAFI fundamental value is defined as 10,000,000 times the average of the four percentage representation figures above. However, for a stock with a zero dividend percentage, its RAFI fundamental value is defined as 10,000,000 times the average of the three remaining percentage representation figures (sales, cash flow and book value).
3. The RAFI fundamental value is calculated for each company as a whole, rather than for individual securities issued by the company. Where a company is represented within the FTSE RAFI Index Series by two or more lines of stock, the company’s RAFI fundamental value is allocated between these lines of stock in proportion to their investable market capitalizations
4. All stocks are ranked in descending order by their RAFI fundamental value. Companies are selected by their RAFI fundamental values, according to each specific index criteria.
5. To calculate the FTSE RAFI adjustment factor, FTSE divides the investable RAFI fundamental value of each constituent by its investable market capitalization as at the close of business on the Monday 4 weeks prior to the review effective date. This is the weighting factor used in the FTSE RAFI Index Series calculation.
6. The FTSE RAFI adjustment factor is applied to the investable market capitalization: price * shares * investability weighting * FTSE RAFI adjustment factor. This cancels out the market capitalization effect and the RAFI fundamental value is captured.
Sector weight comparison Although weight differences do not appear too large (less than 2%), all the heavy weights like Capital Goods, Automobile & Components and Banks are given higher weights in FTSE RAFI Japan Index when compared to Topix. Most of the underweighted industry groups are from the bottom of the weight ranking.
Figure 49: Industry Group Weights: FTSE RAFI Japan vs. Topix
1.0%
0.7%
0.7%
1.6%
0.1%
0.9% 0.9%
-0.7
%
-0.6
%
1.8%
1.3%
-0.9
%
1.1%
0.0%
-1.7
%
-1.3
%
-1.2
% -0.9
% -0.4
%
-0.5
%
-0.6
%
-0.4
%
-0.4
%
-0.7
%
-2.0%
-1.5%
-1.0%
-0.5%
0.0%
0.5%
1.0%
1.5%
2.0%
0.0%
3.0%
6.0%
9.0%
12.0%
15.0%
18.0%
Ind
ust
ry G
rou
p W
eig
hts
FTSE RAFI Japan
TOPIX
Over/under weight - rhs
Source: Deutsche Bank, Bloomberg Finance LP, FTSE, Topix

15 May 2014
Japan Indices
Deutsche Bank Securities Inc. Page 33
Illiquid stocks and stocks with largest index weight As explained above, we don’t know exactly how much GPIF will allocate to each index. To get a sense of the potential impact, we estimate the most impacted names in the index by total value to trade and days to trade, assuming US$3 bn inflow.
Figure 50: Top 20 Most Illiquid Stocks
Ticker Name% Index Weight
Flow $ mm
Flow shares
mm Days
8020 JP Equity Kanematsu Corpn 0.102% 3.05 1.98 0.98 5007 JP Equity Cosmo Oil 0.143% 4.29 2.29 0.83 2768 JP Equity Sojitz 0.297% 8.90 5.64 0.81 8015 JP Equity Toyota Tsusho 0.580% 17.40 0.66 0.79 8630 JP Equity NKSJ Holdings 0.614% 18.43 0.74 0.74 7911 JP Equity Toppan Printing 0.234% 7.03 1.02 0.72 9501 JP Equity Tokyo Electric Power 0.982% 29.46 7.80 0.72 5012 JP Equity TonenGeneral Sekiyu 0.243% 7.29 0.77 0.70 8334 JP Equity Gunma Bank 0.100% 2.99 0.56 0.70 8725 JP Equity MS&AD Insurance Group Holdings 0.656% 19.67 0.88 0.70 9062 JP Equity Nippon Express 0.284% 8.53 1.80 0.69 9504 JP Equity Chugoku Electric Power 0.197% 5.90 0.45 0.69 7240 JP Equity NOK 0.099% 2.96 0.18 0.68 9364 JP Equity Kamigumi 0.092% 2.77 0.29 0.67 8369 JP Equity Bank of Kyoto 0.123% 3.68 0.45 0.67 9042 JP Equity Hankyu Hanshin Holdings 0.200% 6.00 1.10 0.66 5019 JP Equity Idemitsu Kosan 0.164% 4.92 0.22 0.64 9502 JP Equity Chubu Elec Power 0.388% 11.63 1.02 0.64 4188 JP Equity Mitsubishi Chemical Holdings 0.419% 12.58 3.14 0.64 9005 JP Equity Tokyu Corp 0.331% 9.93 1.58 0.63
Source: Deutsche Bank, Bloomberg Finance LP, FTSE Note: Assuming US$3bn of inflows

15 May 2014
Japan Indices
Page 34 Deutsche Bank Securities Inc.
Figure 51: Top 20 Largest Weights
Ticker Name% Index Weight
Flow $ mm
Flow shares
mm Days
7203 JP Equity Toyota Motor 4.312% 129.35 2.40 0.29 8306 JP Equity Mitsubishi UFJ Financial 3.438% 103.15 19.44 0.32 7267 JP Equity Honda Motor Co 2.579% 77.37 2.34 0.38 8316 JP Equity Sumitomo Mitsui Financial Group 2.045% 61.35 1.55 0.19 8411 JP Equity Mizuho Financial Group 2.017% 60.51 30.90 0.42 6501 JP Equity Hitachi 1.769% 53.08 7.46 0.38 9432 JP Equity NTT 1.736% 52.09 0.94 0.47 7751 JP Equity Canon 1.631% 48.94 1.55 0.40 6758 JP Equity Sony Corp 1.568% 47.05 2.68 0.29 8058 JP Equity Mitsubishi Corp 1.559% 46.76 2.61 0.54 8031 JP Equity Mitsui & Co 1.460% 43.80 3.09 0.57 7201 JP Equity Nissan Motor 1.337% 40.10 4.67 0.39 4502 JP Equity Takeda Pharmaceutical 1.282% 38.46 0.86 0.26 6752 JP Equity Panasonic Corp 1.224% 36.73 3.35 0.32 9020 JP Equity East Japan Railway 1.208% 36.24 0.50 0.53 3382 JP Equity Seven & I Holdings 1.136% 34.07 0.86 0.47 6502 JP Equity Toshiba Corp 1.088% 32.65 8.34 0.34 9437 JP Equity NTT Docomo 1.033% 30.99 1.95 0.30 8053 JP Equity Sumitomo Corp 0.999% 29.96 2.31 0.49 9984 JP Equity Softbank 0.996% 29.89 0.40 0.03
Source: Deutsche Bank, Bloomberg Finance LP, FTSE Note: Assuming US$3bn of inflows
Topix
Sector weights Topix is the most broad index among all the indices being analyzed here. Capital Goods, Automobile & Components and Banks are the top 3 weighted industry groups with 15.6%, 12.3% and 9.2% index weight respectively.
Figure 52: Industry Group Weights: Topix
0.0%
3.0%
6.0%
9.0%
12.0%
15.0%
18.0%
Ind
ust
ry G
rou
p W
eig
hts
TOPIX
Source: Deutsche Bank, Bloomberg Finance LP, FTSE, Topix

15 May 2014
Japan Indices
Deutsche Bank Securities Inc. Page 35
Illiquid stocks and stocks with largest index weight As explained above, we don’t know exactly how much GPIF will allocate to each index. To get a sense of the potential impact, we estimate the most impacted names in the index by total value to trade and days to trade, assuming US$40bn inflow to Topix. If the actual inflow is US$8bn, then the impact will be just 20% of the numbers in the tables below.
Figure 53: Top 20 Most Illiquid Stocks
Ticker Name% Index Weight
Flow $ mm
Flow shares mm Days
9982 JP Equity Takihyo Co Ltd 0.004% 1.61 0.40 34.14
9731 JP Equity Hakuyosha Co Ltd 0.002% 0.64 0.27 33.41
8081 JP Equity Kanaden Corp 0.004% 1.69 0.24 33.20
8158 JP Equity Soda Nikka Co Ltd 0.003% 1.07 0.25 32.56
7715 JP Equity Nagano Keiki Co Ltd 0.003% 1.04 0.16 31.80
2009 JP Equity Torigoe Co Ltd/The 0.004% 1.49 0.22 30.71
9993 JP Equity Yamazawa Co Ltd 0.002% 0.85 0.06 29.76
4362 JP Equity Nippon Fine Chemical Co Ltd 0.003% 1.31 0.21 29.72
7504 JP Equity Kohsoku Corp 0.003% 1.28 0.14 27.81
2207 JP Equity Meito Sangyo Co Ltd 0.003% 1.29 0.12 27.55
3878 JP Equity Tomoegawa Co Ltd 0.002% 0.76 0.40 27.45
1780 JP Equity Yamaura Corp 0.001% 0.37 0.13 26.81
7481 JP Equity OIE Sangyo Co Ltd 0.002% 0.63 0.08 26.76
4410 JP Equity Harima Chemicals Group Inc 0.002% 0.95 0.22 26.76
9306 JP Equity Toyo Logistics Co Ltd 0.003% 1.05 0.42 26.53
8065 JP Equity Sato Shoji Corp 0.003% 1.37 0.22 26.48
6973 JP Equity Kyoei Sangyo Co Ltd/Tokyo 0.001% 0.51 0.29 25.42
2204 JP Equity Nakamuraya Co Ltd 0.006% 2.49 0.64 25.34
4687 JP Equity TDC Software Engineering Inc 0.001% 0.42 0.05 25.20
8173 JP Equity Joshin Denki Co Ltd 0.011% 4.28 0.53 25.09
Source: Deutsche Bank, Bloomberg Finance LP, Topix Note: Assuming US$40bn of inflows

15 May 2014
Japan Indices
Page 36 Deutsche Bank Securities Inc.
Figure 54: Top 20 Largest Weights
Ticker Name% Index Weight
Flow $ mm
Flow shares mm Days
7203 JP Equity Toyota Motor Corp 4.632% 1,852.91 34.34 4.22
8306 JP Equity Mitsubishi UFJ Financial Group Inc 2.445% 978.03 184.49 3.08
9984 JP Equity SoftBank Corp 2.220% 887.82 11.96 0.82
7267 JP Equity Honda Motor Co Ltd 1.835% 734.14 22.21 3.61
8316 JP Equity Sumitomo Mitsui Financial Group Inc 1.816% 726.55 18.42 2.28
8411 JP Equity Mizuho Financial Group Inc 1.546% 618.24 316.05 4.27
9432 JP Equity Nippon Telegraph & Telephone Corp 1.325% 529.84 9.57 4.76
2914 JP Equity Japan Tobacco Inc 1.258% 503.00 15.32 3.64
6954 JP Equity FANUC Corp 1.238% 495.39 2.75 2.59
7751 JP Equity Canon Inc 1.125% 449.89 14.31 3.64
4502 JP Equity Takeda Pharmaceutical Co Ltd 1.086% 434.42 9.68 2.96
6501 JP Equity Hitachi Ltd 1.056% 422.29 59.39 3.03
9433 JP Equity KDDI Corp 1.006% 402.39 7.56 2.58
3382 JP Equity Seven & I Holdings Co Ltd 1.004% 401.67 10.19 5.54
8802 JP Equity Mitsubishi Estate Co Ltd 0.964% 385.78 17.05 3.26
8058 JP Equity Mitsubishi Corp 0.849% 339.78 19.00 3.90
8801 JP Equity Mitsui Fudosan Co Ltd 0.848% 339.24 11.48 2.93
4503 JP Equity Astellas Pharma Inc 0.827% 330.96 29.76 4.04
9020 JP Equity East Japan Railway Co 0.827% 330.93 4.54 4.82
9437 JP Equity NTT DOCOMO Inc 0.796% 318.35 20.07 3.10
Source: Deutsche Bank, Bloomberg Finance LP,Topix Note: Assuming US$40bn of inflows
MSCI Japan
Sector weight comparison MSCI Japan has given higher weights to Automobile & Components and Real Estate as compared to Topix, while Capital Goods is underweighted by 1.2%. Weight differences are not too large for the remaining industry groups between MSCI Japan and Topix.
Figure 55: Industry Group Weights: MSCI Japan vs. Topix
-1.2
%
1.9%
0.3% 0.5%
-0.8
% 0.4%
1.3%
0.5%
-0.3
%
-0.3
%
-0.1
%
-0.1
%
0.2% 0.4%
-0.4
%
-0.2
%
-0.4
% -0.1
%
0.0%
-0.2
%
-0.3
%
-0.1
%
-0.3
%
-0.4
%
-1.5%
-1.0%
-0.5%
0.0%
0.5%
1.0%
1.5%
2.0%
2.5%
0.0%
3.0%
6.0%
9.0%
12.0%
15.0%
18.0%
Ind
ust
ry G
rou
p W
eig
hts
MSCI JapanTOPIXOver/under weight - rhs
Source: Deutsche Bank, Bloomberg Finance LP, MSCI, Topix

15 May 2014
Japan Indices
Deutsche Bank Securities Inc. Page 37
Illiquid stocks and stocks with largest index weight As explained above, we don’t know exactly how much GPIF will allocate to each index. To get a sense of the potential impact, we estimate the most impacted names in the index by total value to trade and days to trade, assuming US$5 bn inflow.
Figure 56: Top 20 Most Illiquid Stocks
Ticker Name% Index Weight
Flow $ mm
Flow shares
mm Days
9042 JP Equity Hankyu Hanshin Holdings Inc 0.247% 12.35 2.25 1.35
8385 JP Equity Iyo Bank Ltd/The 0.092% 4.59 0.51 1.25
9006 JP Equity Keikyu Corp 0.153% 7.66 0.92 1.19
9008 JP Equity Keio Corp 0.161% 8.06 1.14 1.08
9041 JP Equity Kintetsu Corp 0.251% 12.54 3.57 1.07
9364 JP Equity Kamigumi Co Ltd 0.088% 4.38 0.46 1.07
8359 JP Equity Hachijuni Bank Ltd/The 0.090% 4.48 0.82 1.05
9007 JP Equity Odakyu Electric Railway Co Ltd 0.217% 10.83 1.23 1.02
9001 JP Equity Tobu Railway Co Ltd 0.197% 9.85 2.01 0.98
8369 JP Equity Bank of Kyoto Ltd/The 0.103% 5.17 0.63 0.94
8377 JP Equity Hokuhoku Financial Group Inc 0.087% 4.36 2.26 0.94
8334 JP Equity Gunma Bank Ltd/The 0.080% 3.98 0.75 0.93
8382 JP Equity Chugoku Bank Ltd/The 0.082% 4.12 0.31 0.91
8955 JP Equity Japan Prime Realty Investment Corp 0.109% 5.43 0.00 0.90
9005 JP Equity Tokyu Corp 0.282% 14.10 2.24 0.90
9504 JP Equity Chugoku Electric Power Co Inc/The 0.153% 7.65 0.58 0.89
2702 JP Equity McDonald's Holdings Co Japan Ltd 0.073% 3.63 0.13 0.89
8333 JP Equity Joyo Bank Ltd/The 0.129% 6.43 1.32 0.87
8951 JP Equity Nippon Building Fund Inc 0.302% 15.10 0.00 0.86
8960 JP Equity United Urban Investment Corp 0.141% 7.07 0.00 0.85
Source: Deutsche Bank, Bloomberg Finance LP, MSCI Note: Assuming US$5bn of inflows

15 May 2014
Japan Indices
Page 38 Deutsche Bank Securities Inc.
Figure 57: Top 20 Largest Weights
Ticker Name% Index Weight
Flow $ mm
Flow shares
mm Days
7203 JP Equity Toyota Motor Corp 5.866% 293.32 5.43 0.67
9984 JP Equity SoftBank Corp 2.811% 140.55 1.89 0.13
8306 JP Equity Mitsubishi UFJ Financial Group Inc 2.664% 133.19 25.10 0.42
7267 JP Equity Honda Motor Co Ltd 2.125% 106.23 3.21 0.52
8316 JP Equity Sumitomo Mitsui Financial Group Inc 1.979% 98.95 2.51 0.31
8411 JP Equity Mizuho Financial Group Inc 1.773% 88.65 45.27 0.61
2914 JP Equity Japan Tobacco Inc 1.423% 71.17 2.17 0.51
7751 JP Equity Canon Inc 1.405% 70.27 2.23 0.57
4502 JP Equity Takeda Pharmaceutical Co Ltd 1.397% 69.85 1.55 0.48
6954 JP Equity FANUC Corp 1.359% 67.97 0.38 0.36
6501 JP Equity Hitachi Ltd 1.355% 67.74 9.52 0.49
3382 JP Equity Seven & I Holdings Co Ltd 1.171% 58.55 1.48 0.81
9433 JP Equity KDDI Corp 1.129% 56.46 1.06 0.36
8802 JP Equity Mitsubishi Estate Co Ltd 1.116% 55.82 2.46 0.47
8058 JP Equity Mitsubishi Corp 0.991% 49.53 2.77 0.57
8801 JP Equity Mitsui Fudosan Co Ltd 0.975% 48.77 1.65 0.42
8031 JP Equity Mitsui & Co Ltd 0.971% 48.54 3.42 0.63
9020 JP Equity East Japan Railway Co 0.965% 48.24 0.66 0.70
9437 JP Equity NTT DOCOMO Inc 0.955% 47.77 3.01 0.47
6752 JP Equity Panasonic Corp 0.953% 47.63 4.35 0.42
Source: Deutsche Bank, Bloomberg Finance LP, MSCI Note: Assuming US$5bn of inflows
MSCI Japan Small Cap
Sector weight comparison Industry group weight differences are fairly large in case of MSCI Japan Small Cap Index in comparison to Topix. Capital Goods, Materials and Real Estate are over weighted by more than 4% in each case while Banks, Technology Hardware & Equipment and Automobiles & Components are under weighted in the MSCI Japan Small Cap Index. Also, this index does not have any constituent from Telecommunication Services industry group.

15 May 2014
Japan Indices
Deutsche Bank Securities Inc. Page 39
Figure 58: Industry Group Weights: MSCI Japan Small Cap vs. Topix 4.
2%4.
2% 6.2%
-3.3
%
-2.2
%
2.6%
0.1% 0.5%
-8.2
%
1.4%
0.8% 2.
3%
1.0%
-1.4
%
-2.4
%
1.3%
0.7% 1.2%
0.6%
0.5%
-0.6
%
-1.9
%
-2.2
%
-5.3
%
-10.0%
-8.0%
-6.0%
-4.0%
-2.0%
0.0%
2.0%
4.0%
6.0%
8.0%
0.0%
3.0%
6.0%
9.0%
12.0%
15.0%
18.0%
21.0%
Ind
ust
ry G
rou
p W
eig
hts
MSCI Japan Small Cap
TOPIX
Over/under weight - rhs
Source: Deutsche Bank, Bloomberg Finance LP, MSCI, Topix
Illiquid stocks and stocks with largest index weight As explained above, we don’t know exactly how much GPIF will allocate to each index. To get a sense of the potential impact, we estimate the most impacted names in the index by total value to trade and days to trade, assuming US$3 bn inflow.
Figure 59: Top 20 Most Illiquid Stocks
Ticker Name% Index Weight
Flow $ mm
Flow shares
mm Days
9663 JP Equity Nagawa Co Ltd 0.029% 0.88 0.04 16.06 7914 JP Equity Kyodo Printing Co Ltd 0.041% 1.24 0.46 10.66 8173 JP Equity Joshin Denki Co Ltd 0.059% 1.78 0.22 10.45 3201 JP Equity Japan Wool Textile Co Ltd/The 0.091% 2.72 0.37 9.42 8395 JP Equity Bank of Saga Ltd/The 0.053% 1.60 0.77 9.12 7161 JP Equity Jimoto Holdings Inc 0.075% 2.26 1.14 8.93 2692 JP Equity Itochu-Shokuhin Co Ltd 0.028% 0.84 0.02 8.88 5192 JP Equity Mitsuboshi Belting Co Ltd 0.055% 1.66 0.32 8.38 8536 JP Equity Higashi-Nippon Bank Ltd/The 0.064% 1.92 0.77 8.29 4966 JP Equity C Uyemura & Co Ltd 0.053% 1.60 0.03 8.12 8325 JP Equity Hokuetsu Bank Ltd/The 0.086% 2.58 1.26 8.12 8032 JP Equity Japan Pulp & Paper Co Ltd 0.054% 1.63 0.48 8.11 2908 JP Equity Fujicco Co Ltd 0.044% 1.31 0.11 8.00 8089 JP Equity Nice Holdings Inc 0.025% 0.75 0.37 7.98 8392 JP Equity Oita Bank Ltd/The 0.122% 3.67 1.01 7.89 7893 JP Equity Pronexus Inc 0.026% 0.79 0.12 7.73 6905 JP Equity Cosel Co Ltd 0.052% 1.56 0.14 7.68 6454 JP Equity Max Co Ltd 0.076% 2.29 0.21 7.64 4216 JP Equity Asahi Organic Chemicals Industry Co Ltd 0.030% 0.89 0.41 7.59 9066 JP Equity Nissin Corp 0.040% 1.19 0.42 7.57
Source: Deutsche Bank, Bloomberg Finance LP, MSCI Note: Assuming US$3bn of inflows

15 May 2014
Japan Indices
Page 40 Deutsche Bank Securities Inc.
Figure 60: Top 20 Largest Weights
Ticker Name% Index Weight
Flow $ mm
Flow shares
mm Days
3269 JP Equity Advance Residence Investment Corp 0.597% 17.92 0.01 2.87 6361 JP Equity Ebara Corp 0.559% 16.76 2.82 0.87 6479 JP Equity Minebea Co Ltd 0.550% 16.50 2.04 0.61 7453 JP Equity Ryohin Keikaku Co Ltd 0.537% 16.11 0.14 0.52 8954 JP Equity Orix JREIT Inc 0.529% 15.86 0.01 2.24 8964 JP Equity Frontier Real Estate Investment Corp 0.520% 15.60 0.00 2.95 4684 JP Equity Obic Co Ltd 0.445% 13.35 0.44 2.39 4751 JP Equity CyberAgent Inc 0.443% 13.30 0.32 0.24 5714 JP Equity Dowa Holdings Co Ltd 0.443% 13.29 1.58 1.15 9962 JP Equity MISUMI Group Inc 0.424% 12.71 0.52 1.48 6674 JP Equity GS Yuasa Corp 0.423% 12.69 2.24 0.87 4631 JP Equity DIC Corp 0.415% 12.45 4.69 0.90 4042 JP Equity Tosoh Corp 0.415% 12.45 3.26 1.10 4555 JP Equity Sawai Pharmaceutical Co Ltd 0.414% 12.43 0.20 1.00 3279 JP Equity Activia Properties Inc 0.399% 11.97 0.00 2.62 8967 JP Equity Japan Logistics Fund Inc 0.398% 11.95 0.01 1.65 3281 JP Equity GLP J-Reit 0.397% 11.90 0.01 1.64 6770 JP Equity Alps Electric Co Ltd 0.393% 11.80 1.04 0.38 4272 JP Equity Nippon Kayaku Co Ltd 0.393% 11.79 0.99 1.55 4021 JP Equity Nissan Chemical Industries Ltd 0.393% 11.79 0.79 1.01
Source: Deutsche Bank, Bloomberg Finance LP, MSCI Note: Assuming US$3bn of inflows

15 May 2014
Japan Indices
Deutsche Bank Securities Inc. Page 41
Listed Products tracking these indices Figure 61: Major Futures Contracts in Japan Exchange Contract Bloom-
berg Code FX Multi-plier Expiry Contract
Value (US$)3m ADV
(US$ mn)First Contract Open Interest (US$ mn, 3m
Avg)
CFTC Approved
Settle-ment
Listed Options?
OSE Nikkei 225 NK1 JPY 1,000 Quarterly 140,335 11,200.66 49,914 Yes Cash Yes
OSE Nikkei 225 Mini NO1 JPY 100 Quarterly 14,029 4,262.89 4,554 Yes Cash
TSE Topix TP1 JPY 10,000 Quarterly 113,907 7,214.38 59,068 Yes Cash Yes
SGX Nikkei 225 (SGX) NI1 JPY 500 Quarterly 69,826
7,176.41
18,337 Yes Cash
CME Nikkei 225 (CME) NX1 USD 5 Quarterly
72,075
1,367.03
4,666 Yes Cash
Source: Deutsche Bank, Bloomberg Finance. N.B. only includes

Japan
Ind
ices
15 M
ay 201
4
Pag
e 42
D
eutsch
e Ban
k Secu
rities Inc.
List of ETFs tracking these indices
ETF Name BBG CodeReuters
CodeIssuer Underlying Index Exchanges Listed TER
AUM (US$mn)
JPX Nikkei Index 400Next Funds JPX-Nikkei Index 400 ETF 1591 JP 1591.T Nomura Asset Management JPX Nikkei Index 400 TSE 0.15% 217.6 Maxis JPX- Nikkei index 400 ETF 1593 JP 1593.T Mitsubishi UFJ Asset Mg JPX Nikkei Index 400 TSE 0.05% 153.6 Listed Index Fund JPX-Nikkei Index 400 1592 JP 1592.T Nikko Asset Management JPX Nikkei Index 400 TSE na 120.1 Daiwa ETF - JPX Nikkei 400 1599 JP 1599.T Daiwa Asset Management JPX Nikkei Index 400 TSE 0.23% 49.6 MSCI JapaniShares MSCI Japan ETF EWJ US EWJ BlackRock MSCI Japan NYX - Ny,ASX 0.48% 13,488.8 iShares MSCI Japan EUR Hedged UCITS ETF IJPE LN IJPE.L Blackrock MSCI Japan 100% Hedged to EUR Index BI,LSE,NYX - Pa,SWX,XTF 0.64% 4,071.1 iShares MSCI Japan UCITS ETF (Inc) IJPN LN IJPN.L BlackRock MSCI Japan BI,LSE,NYX - Am,NYX - Pa,SWX,XTF 0.59% 2,055.9 iShares MSCI Japan - B UCITS ETF CSJP SW CSJP.S BlackRock MSCI Japan BI,LSE,NYX - Pa,SWX,XTF 0.48% 1,355.9 UBS-ETF MSCI Japan "A" JPNCHA SW JPNCHA.S UBS MSCI Japan BI,LSE,OMX,SWX,XTF 0.35% 795.4 db x-trackers MSCI Japan Index UCITS ETF XMJP GR XMJP.DE Deutsche AWM MSCI Japan BI,BME,LSE,NYX - Pa,OMX,SWX,XTF,SGX 0.50% 696.3 iShares MSCI Japan GBP Hedged UCITS ETF IJPH LN IJPH.L BlackRock MSCI Japan 100% Hedged to GBP Index LSE 0.64% 621.8 db x-trackers MSCI Japan Currency-Hedged Equity Fund DBJP US DBJP.K Deutsche AWM MSCI Japan US Dollar Hedged Net NYX - Ny 0.50% 441.3 db x-trackers MSCI Japan EUR Hedged TRN Index UCITS ETF XMK9 IM XMK9.MI Deutsche AWM MSCI Japan Monthly Euro Hedged Index BI,XTF 0.60% 426.1 iShares MSCI Japan CHF Hedged UCITS ETF IJPC SW IJPC.S BlackRock MSCI Japan 100% Hedged to CHF Index SWX 0.64% 399.5 Amundi ETF MSCI Japan UCITS ETF CJ1 FP CJ1.PA Amundi MSCI Japan BI,LSE,NYX - Pa,SWX,XTF 0.45% 296.2 HSBC MSCI Japan ETF HMJP LN HMJP.L HSBC MSCI Japan LSE,NYX - Pa,SWX,XTF 0.40% 190.6 iShares MSCI Japan UCITS ETF (Acc) SJPA LN SJPA.L BlackRock MSCI Japan BI,LSE,NYX - Am,SWX,XTF 0.48% 164.0 UBS ETF - MSCI Japan 100% hedged to USD UCITS ETF A-acc JPUSBH SW JPUSBH.S UBS MSCI Japan 100% hedged to USD SWX 0.45% 113.4 UBS ETF - MSCI Japan 100% hedged to CHF UCITS ETF A-acc JPCHBH SW JPCHBH.S UBS MSCI Japan 100% hedged to CHF SWX 0.45% 89.7 iShares MSCI Japan USD Hedged UCITS ETF IJPD LN IJPD.L BlackRock MSCI Japan 100% Hedged to USD Index LSE,SWX 0.64% 71.3 MSCI Japan Source ETF SMSJPN GR SMSJPN.DE Source MSCI Japan LSE,XTF 0.40% 57.3 UBS ETF - MSCI Japan 100% hedged to EUR UCITS ETF A-acc JPEUBH SW JPEUBH.S UBS MSCI Japan 100% hedged to EUR SWX,XTF 0.45% 56.2 db x-trackers MSCI Japan TRN Index UCITS ETF GBP Hedged XMJG LN XMJG.L Deutsche AWM MSCI Japan Monthly GBP Hedged Index LSE 0.60% 49.1 UBS ETF - MSCI Japan 100% hedged to GBP UCITS ETF A-acc UC62 LN UC62.L UBS MSCI Japan 100% hedged to GBP LSE,SWX 0.45% 47.5 iShares MSCI Japan Large Cap UCITS ETF CSJPL SW CSJPL.S BlackRock MSCI Japan Large Cap BI,LSE,NYX - Pa,SWX,XTF 0.48% 44.7 UBS ETFs plc - MSCI Japan TRN Index SF (JPY) A-acc JPJYAS SW JPJYAS.S UBS MSCI Japan BI,LSE,SWX,XTF 0.33% 39.8 ComStage ETF MSCI Japan TRN CBNDDUJN GR CBMINJP.DE ComStage MSCI Japan SWX,XTF 0.45% 27.1 ProShares Ultra MSCI Japan EZJ US EZJ ProShares MSCI Japan NYX - Ny 0.95% 26.1 Deka MSCI Japan UCITS ETF ETFJPAC GR ETFJPAC.DE Deka Investment GmbH MSCI Japan XTF 0.50% 18.7 Nikko Listed Index Fund Japan Equity MSCI Japan 1544 JP 1544.T Nikko Asset Management MSCI Japan TSE 0.16% 14.6 ProShares UltraShort MSCI Japan EWV US EWV ProShares MSCI Japan NYX - Ny 0.95% 11.0 Deka MSCI Japan LC UCITS ETF ETFJPLC GR ETFJPLC.DE Deka Investment GmbH MSCI Japan Large Cap XTF 0.50% 9.9 Deka MSCI Japan MC UCITS ETF ETFJPMC GR ETFJPMC.DE Deka Investment GmbH MSCI Japan Mid Cap XTF 0.50% 8.2 iShares Currency Hedged MSCI Japan ETF HEWJ US HEWJ.K BlackRock MSCI Japan NYX - Ny 0.48% 8.1 Direxion Daily Japan Bull 3x Shares JPNL US JPNL DirexionShares MSCI Japan NYX - Ny 0.95% 7.7 UBS-ETF MSCI Japan Infrastructure A UIMZ GY JAIEUA.DE UBS MSCI Japan Infrastructure Index BI,LSE,SWX,XTF 0.48% 5.8 Direxion Daily Japan Bear 3x Shares JPNS US JPNS DirexionShares MSCI Japan NYX - Ny 0.95% 3.1 MSCI Japan Small CapiShares MSCI Japan Small-Cap ETF SCJ US SCJ BlackRock MSCI Japan Small Cap NYX - Ny 0.48% 150.1 iShares MSCI Japan SmallCap UCITS ETF (Inc) ISJP LN ISJP.L BlackRock MSCI Japan Small Cap LSE,SWX,XTF 0.59% 116.7 iShares MSCI Japan Small Cap UCITS ETF CSJPS SW CSJPS.S BlackRock MSCI Japan Small Cap BI,LSE,NYX - Pa,SWX,XTF 0.58% 63.5 Nikkei 225Nomura Nikkei 225 ETF 1321 JP 1321.OS Nomura Asset Management Nikkei 225 OSE 0.24% 17,888.9 Nikko Exchange Traded Index 225 1330 JP 1330.T Nikko Asset Management Nikkei 225 TSE 0.23% 8,753.0 Daiwa ETF - Nikkei 225 1320 JP 1320.OS Daiwa Asset Management Nikkei 225 OSE 0.17% 7,612.6 Maxis Nikkei 225 ETF 1346 JP 1346.OS Mitsubishi UFJ Asset Mg Nikkei 225 OSE 0.17% 4,111.0 Next Funds Nikkei 225 Leveraged Index ETF 1570 JP 1570.OS Nomura Asset Management Nikkei 225 Leveraged Index OSE 0.80% 2,547.5 iShares Nikkei 225 1329 JP 1329.T BlackRock Nikkei 225 TSE 0.30% 878.4 iShares NIKKEI 225 (DE) NKYEX GR N225EX.DE BlackRock NIKKEI 225 XTF 0.51% 212.0 Simplex Nikkei225 Bull 2x ETF 1579 JP 1579.T Simplex Asset Management Co Ltd Nikkei225 Leveraged Index TSE 0.75% 204.0 Next Funds Nikkei 225 Inverse Index ETF 1571 JP 1571.OS Nomura Asset Management Nikkei 225 Inverse Index OSE 0.80% 137.7 MAXIS Nikkei 225 Index Fund NKY US NKY Precidian Nikkei 225 NYX - Ny 0.50% 116.9 iShares Nikkei 225 UCITS ETF CSNKY SW CSNKY.S BlackRock NIKKEI 225 BI,LSE,NYX - Pa,SWX,XTF 0.48% 87.0 Simplex Nikkei225 Bear -1x ETF 1580 JP 1580.T Simplex Asset Management Co Ltd Nikkei225 Inverse Index TSE 0.75% 83.4 ComStage ETF NIKKEI 225 CBNKY GR CBN225.DE ComStage NIKKEI 225 SWX,XTF 0.45% 75.4 Nikko Listed Index Fund Nikkei 225 Mini 1578 JP 1578.T Nikko Asset Management Nikkei 225 TSE 0.23% 50.9 db x-trackers Nikkei 225 UCITS ETF (DR) 1D XDJP GR XDJP.DE Deutsche AWM NIKKEI 225 BI,LSE,SWX,XTF 0.25% 14.9 Nikkei 225 Covered Call ETF 1565 JP 1565.T Simplex Asset Management Co Ltd Nikkei 225 Covered Call Index TSE 0.28% 3.7
Source:Deutsche Bank, Bloomberg Finance LP, Reuters.

Japan
Ind
ices
15 M
ay 201
4
Deu
tsche B
ank S
ecurities In
c. P
age 4
3
ETF Name BBG CodeReuters
CodeIssuer Underlying Index Exchanges Listed TER
AUM (US$mn)
Russell/Nomura PRIMESPDR Russell/Nomura PRIME Japan ETF JPP US JPP State Street Russell/Nomura PRIME NYX - Ny 0.50% 127.7 TOPIXTOPIX ETF 1306 JP 1306.T Nomura Asset Management TOPIX TSE 0.12% 14,962.3 Daiwa ETF - Topix 1305 JP 1305.T Daiwa Asset Management TOPIX TSE 0.12% 10,802.8 Nikko ETF Topix 1308 JP 1308.T Nikko Asset Management TOPIX TSE 0.09% 6,532.7 MAXIS TOPIX ETF 1348 JP 1348.T Mitsubishi UFJ Asset Mg TOPIX TSE 0.08% 1,763.1 Amundi ETF Topix Eur Hedged Daily UCITS ETF TPXH FP TPXH.PA Amundi TOPIX TR Daily Euro Hedg BI,NYX - Pa,SWX,XTF 0.48% 1,032.3 Lyxor ETF Japan Topix JPN FP JPN.PA Lyxor TOPIX BI,BME,LSE,NYX - Pa,SWX,XTF,SGX 0.45% 664.0 Nomura Topix Banks 1615 JP 1615.T Nomura Asset Management TOPIX Banks Index TSE 0.23% 412.7 Topix Bull 2x ETF 1568 JP 1568.T Simplex Asset Management Co Ltd TOPIX Leveraged (2x) Index TSE 0.75% 352.3 Daiwa ETF - TOPIX Ex-Financials ETF 1585 JP 1585.T Daiwa Asset Management TOPIX Ex-Financials Index TSE 0.19% 202.6 Lyxor ETF Japan (Topix) Daily hedged JPNH FP JPNH.PA Lyxor TOPIX BI,NYX - Pa,XTF 0.45% 112.1 Nomura Topix Core 30 1311 JP 1311.T Nomura Asset Management TOPIX Core 30 TSE 0.22% 76.4 Nikko Listed Index Fund Topix Ex-Financials 1586 JP 1586.T Nikko Asset Management TOPIX Ex-Financials Index TSE 0.09% 61.6 Next Funds Topix-17 Construction & Materials ETF 1619 JP 1619.T Nomura Asset Management TOPIX-17 Construction & Materials TSE 0.32% 57.6 NZAM ETF TOPIX Ex-Financials 1596 JP 1596.T NZAM TOPIX Ex-Financials Index TSE 0.11% 56.7 Next Funds Topix-17 Real Estate ETF 1633 JP 1633.T Nomura Asset Management TOPIX-17 Real Estate TSE 0.32% 52.6 Topix Bear -1x ETF 1569 JP 1569.T Simplex Asset Management Co Ltd TOPIX Inverse (-1x) Index TSE 0.75% 51.9 Next Funds Topix-17 Retail Trade ETF 1630 JP 1630.T Nomura Asset Management TOPIX-17 Retail Trade TSE 0.32% 49.4 Next Funds Topix-17 Automobiles & Transportation Equipment ETF 1622 JP 1622.T Nomura Asset Management TOPIX-17 Automobiles & Transportation Equipment TSE 0.32% 47.9 Next Funds Topix-17 IT & Services, Others ETF 1626 JP 1626.T Nomura Asset Management TOPIX-17 IT & Services, Other TSE 0.32% 42.9 Maxis Topix Core 30 ETF 1344 JP 1344.T Mitsubishi UFJ Asset Mg TOPIX Core 30 TSE 0.19% 34.7 EasyETF Topix (EUR) EJP FP EJP.PA BNP Paribas TOPIX NYX - Pa 0.50% 32.2 Next Funds Topix-17 Transportation & Logistics ETF 1628 JP 1628.T Nomura Asset Management TOPIX-17 Transportation & Logistics TSE 0.32% 23.0 Next Funds Topix-17 Foods ETF 1617 JP 1617.T Nomura Asset Management TOPIX-17 Foods Index TSE 0.32% 22.0 ComStage ETF TOPIX CBTPX GR CBTOPX.DE ComStage TOPIX SWX,XTF 0.45% 20.3 Next Funds Topix-17 Commercial & Wholesale Trade ETF 1629 JP 1629.T Nomura Asset Management TOPIX-17 Commerical & Wholesale Trade TSE 0.32% 17.6 Next Funds Topix-17 Machinery ETF 1624 JP 1624.T Nomura Asset Management TOPIX-17 Machinery TSE 0.32% 16.9 Nomura Topix Elec Appliances 1613 JP 1613.T Nomura Asset Management TOPIX Electirc Applicances Index TSE 0.22% 16.8 YOURMIRAI Topix Asia Focus ETF 1562 JP 1562.T Sumitomo Mitsui Asset Management TOPIX Active in Asia Index TSE 0.42% 15.8 Daiwa ETF - Topix Elec Appliances 1610 JP 1610.T Daiwa Asset Management TOPIX Electirc Applicances Index TSE 0.22% 15.4 Daiwa ETF - Topix Core 30 1310 JP 1310.T Daiwa Asset Management TOPIX Core 30 TSE 0.22% 15.3 Next Funds TOPIX-17 Banks ETF 1631 JP 1631.T Nomura Asset Management TOPIX-17 Banks TSE 0.32% 13.1 Nikko Topix Small Japan Small Cap Equity 1318 JP 1318.T Nikko Asset Management TOPIX Small TSE 0.50% 12.5 Daiwa ETF - Topix-17 Electric Appliances & Precision Instruments ETF 1642 JP 1642.T Daiwa Asset Management TOPIX-17 Electric Appliances & Precision Instruments TSE 0.28% 10.9 Nikko Mollp Topix 100 Japan Large Cap Equity 1316 JP 1316.T Nikko Asset Management TOPIX 100 TSE 0.20% 10.5 Nikko Topix Mid400 Japan Mid Cap Equity 1317 JP 1317.T Nikko Asset Management TOPIX Mid400 TSE 0.50% 10.5 Next Funds Topix-17 Electric Appliances & Precision Instruments ETF 1625 JP 1625.T Nomura Asset Management TOPIX-17 Electric Appliances & Precision Instruments TSE 0.32% 10.1 Next Funds Topix-17 Steel & Non Ferrous ETF 1623 JP 1623.T Nomura Asset Management TOPIX-17 Steel & Nonferrous TSE 0.32% 9.7 Daiwa ETF - Topix-17 Construction & Materials ETF 1636 JP 1636.T Daiwa Asset Management TOPIX-17 Construction & Materials TSE 0.28% 9.0 Next Funds Topix-17 Financials (ex Banks) ETF 1632 JP 1632.T Nomura Asset Management TOPIX-17 Financials (ex Banks) TSE 0.32% 8.2 Daiwa ETF - Topix Banks 1612 JP 1612.T Daiwa Asset Management TOPIX Banks Index TSE 0.22% 7.2 Next Funds Topix-17 Raw Materials & Chemicals ETF 1620 JP 1620.T Nomura Asset Management TOPIX-17 Raw Materials & Chemicals TSE 0.32% 6.1 Daiwa ETF - Topix-17 Automobiles & Transportation Equipment ETF 1639 JP 1639.T Daiwa Asset Management TOPIX-17 Automobiles & Transportation Equipment TSE 0.28% 6.0 Next Funds Topix-17 Pharmaceutical ETF 1621 JP 1621.T Nomura Asset Management TOPIX-17 Pharmaceutical TSE 0.32% 5.8 Daiwa ETF - Topix-17 Banks ETF 1648 JP 1648.T Daiwa Asset Management TOPIX-17 Banks TSE 0.28% 5.7 Daiwa ETF - Topix-17 Commercial & Wholesale Trade ETF 1646 JP 1646.T Daiwa Asset Management TOPIX-17 Commerical & Wholesale Trade TSE 0.28% 5.4 Daiwa ETF - Topix-17 Raw Materials & Chemicals Etf 1637 JP 1637.T Daiwa Asset Management TOPIX-17 Raw Materials & Chemicals TSE 0.28% 5.1 Samsung KODEX Japan ETF 101280 KS 101280.KS Samsung Asset Management TOPIX 100 KSE 0.35% 5.0 Daiwa ETF - Topix-17 Machinery ETF 1641 JP 1641.T Daiwa Asset Management TOPIX-17 Machinery TSE 0.28% 4.8 Daiwa ETF - Topix-17 IT & Services, Others ETF 1643 JP 1643.T Daiwa Asset Management TOPIX-17 IT & Services, Other TSE 0.28% 4.2 Next Funds Topix-17 Energy Resources ETF 1618 JP 1618.T Nomura Asset Management TOPIX-17 Energy Resources TSE 0.32% 4.1 Daiwa ETF - Topix-17 Foods ETF 1634 JP 1634.T Daiwa Asset Management TOPIX-17 Foods Index TSE 0.28% 4.1 Next Funds Topix-17 Electric Power & Gas ETF 1627 JP 1627.T Nomura Asset Management TOPIX-17 Electric Power & Gas TSE 0.32% 3.9 Daiwa ETF - Topix-17 Pharmaceutical ETF 1638 JP 1638.T Daiwa Asset Management TOPIX-17 Pharmaceutical TSE 0.28% 3.8 Daiwa ETF - Topix-17 Transportation & Logistics ETF 1645 JP 1645.T Daiwa Asset Management TOPIX-17 Transportation & Logistics TSE 0.28% 3.0 Daiwa ETF - Topix-17 Retail Trade ETF 1647 JP 1647.T Daiwa Asset Management TOPIX-17 Retail Trade TSE 0.28% 2.9 Daiwa ETF - Topix-17 Real Estate ETF 1650 JP 1650.T Daiwa Asset Management TOPIX-17 Real Estate TSE 0.28% 2.8 Daiwa ETF - Topix-17 Financials (ex Banks) ETF 1649 JP 1649.T Daiwa Asset Management TOPIX-17 Financials (ex Banks) TSE 0.28% 2.7 Daiwa ETF - Topix-17 Energy Resources ETF 1635 JP 1635.T Daiwa Asset Management TOPIX-17 Energy Resources TSE 0.28% 2.5 Daiwa ETF - Topix-17 Steel & Nonferrous ETF 1640 JP 1640.T Daiwa Asset Management TOPIX-17 Steel & Nonferrous TSE 0.28% 2.1 Daiwa ETF - Topix-17 Electric Power & Gas ETF 1644 JP 1644.T Daiwa Asset Management TOPIX-17 Electric Power & Gas TSE 0.28% 1.9
Source:Deutsche Bank, Bloomberg Finance LP, Reuters.

15 May 2014
Japan Indices
Page 44 Deutsche Bank Securities Inc.
Glossary Exchange Name Short name Australian Securities Exchange ASX BME BME Borsa Italiana BI Deutsche Borse XTF Korea Stock Exchange KSE London Stock Exchange LSE NYSE Arca NYX - Ny NYSE Euronext Amsterdam NYX - Am NYSE Euronext Paris NYX - Pa Osaka Stock Exchange OSE Singapore Exchange SGX SIX Swiss Exchange SWX Stockholmborsen OMX Tokyo Stock Exchange TSE

15 May 2014
Japan Indices
Deutsche Bank Securities Inc. Page 45
Appendix 1 Important Disclosures Additional information available upon request For disclosures pertaining to recommendations or estimates made on securities other than the primary subject of this research, please see the most recently published company report or visit our global disclosure look-up page on our website at http://gm.db.com/ger/disclosure/DisclosureDirectory.eqsr Analyst Certification
The views expressed in this report accurately reflect the personal views of the undersigned lead analyst(s). In addition, the undersigned lead analyst(s) has not and will not receive any compensation for providing a specific recommendation or view in this report. Shan Lan/Will Stephens
Equity rating key Equity rating dispersion and banking relationships
Buy: Based on a current 12- month view of total share-holder return (TSR = percentage change in share price from current price to projected target price plus pro-jected dividend yield ) , we recommend that investors buy the stock. Sell: Based on a current 12-month view of total share-holder return, we recommend that investors sell the stock Hold: We take a neutral view on the stock 12-months out and, based on this time horizon, do not recommend either a Buy or Sell. Notes:
1. Newly issued research recommendations and target prices always supersede previously published research. 2. Ratings definitions prior to 27 January, 2007 were:
Buy: Expected total return (including dividends) of 10% or more over a 12-month period Hold: Expected total return (including dividends) between -10% and 10% over a 12-month period Sell: Expected total return (including dividends) of -10% or worse over a 12-month period
34 %
63 %
3 %29 % 19 %0 %
0102030405060708090
Buy Hold Sell
Japan Universe
Companies Covered Cos. w/ Banking Relationship

15 May 2014
Japan Indices
Page 46 Deutsche Bank Securities Inc.
Regulatory Disclosures
1.Important Additional Conflict Disclosures
Aside from within this report, important conflict disclosures can also be found at https://gm.db.com/equities under the "Disclosures Lookup" and "Legal" tabs. Investors are strongly encouraged to review this information before investing.
2. Short-Term Trade Ideas
Deutsche Bank equity research analysts sometimes have shorter-term trade ideas (known as SOLAR ideas) that are consistent or inconsistent with Deutsche Bank's existing longer term ratings. These trade ideas can be found at the SOLAR link at http://gm.db.com.
3. Country-Specific Disclosures
Australia and New Zealand: This research, and any access to it, is intended only for "wholesale clients" within the meaning of the Australian Corporations Act and New Zealand Financial Advisors Act respectively. Brazil: The views expressed above accurately reflect personal views of the authors about the subject company(ies) and its(their) securities, including in relation to Deutsche Bank. The compensation of the equity research analyst(s) is indirectly affected by revenues deriving from the business and financial transactions of Deutsche Bank. In cases where at least one Brazil based analyst (identified by a phone number starting with +55 country code) has taken part in the preparation of this research report, the Brazil based analyst whose name appears first assumes primary responsibility for its content from a Brazilian regulatory perspective and for its compliance with CVM Instruction # 483. EU countries: Disclosures relating to our obligations under MiFiD can be found at http://www.globalmarkets.db.com/riskdisclosures. Japan: Disclosures under the Financial Instruments and Exchange Law: Company name - Deutsche Securities Inc. Registration number - Registered as a financial instruments dealer by the Head of the Kanto Local Finance Bureau (Kinsho) No. 117. Member of associations: JSDA, Type II Financial Instruments Firms Association, The Financial Futures Association of Japan, Japan Investment Advisers Association. Commissions and risks involved in stock transactions - for stock transactions, we charge stock commissions and consumption tax by multiplying the transaction amount by the commission rate agreed with each customer. Stock transactions can lead to losses as a result of share price fluctuations and other factors. Transactions in foreign stocks can lead to additional losses stemming from foreign exchange fluctuations. "Moody's", "Standard & Poor's", and "Fitch" mentioned in this report are not registered credit rating agencies in Japan unless Japan or "Nippon" is specifically designated in the name of the entity. Reports on Japanese listed companies not written by analysts of Deutsche Securities Inc. (DSI) are written by Deutsche Bank Group's analysts with the coverage companies specified by DSI. Qatar: Deutsche Bank AG in the Qatar Financial Centre (registered no. 00032) is regulated by the Qatar Financial Centre Regulatory Authority. Deutsche Bank AG - QFC Branch may only undertake the financial services activities that fall within the scope of its existing QFCRA license. Principal place of business in the QFC: Qatar Financial Centre, Tower, West Bay, Level 5, PO Box 14928, Doha, Qatar. This information has been distributed by Deutsche Bank AG. Related financial products or services are only available to Business Customers, as defined by the Qatar Financial Centre Regulatory Authority. Russia: This information, interpretation and opinions submitted herein are not in the context of, and do not constitute, any appraisal or evaluation activity requiring a license in the Russian Federation. Kingdom of Saudi Arabia: Deutsche Securities Saudi Arabia LLC Company, (registered no. 07073-37) is regulated by the Capital Market Authority. Deutsche Securities Saudi Arabia may only undertake the financial services activities that fall within the scope of its existing CMA license. Principal place of business in Saudi Arabia: King Fahad Road, Al Olaya District, P.O. Box 301809, Faisaliah Tower - 17th Floor, 11372 Riyadh, Saudi Arabia. United Arab Emirates: Deutsche Bank AG in the Dubai International Financial Centre (registered no. 00045) is regulated by the Dubai Financial Services Authority. Deutsche Bank AG - DIFC Branch may only undertake the financial services activities that fall within the scope of its existing DFSA license. Principal place of business in the DIFC: Dubai International Financial Centre, The Gate Village, Building 5, PO Box 504902, Dubai, U.A.E. This information has been distributed by Deutsche Bank AG. Related financial products or services are only available to Professional Clients, as defined by the Dubai Financial Services Authority.

David Folkerts-Landau
Group Chief Economist Member of the Group Executive Committee
Guy Ashton
Global Chief Operating Officer Research
Marcel Cassard Global Head
FICC Research & Global Macro Economics
Richard Smith and Steve Pollard Co-Global Heads Equity Research
Michael Spencer Regional Head
Asia Pacific Research
Ralf Hoffmann Regional Head
Deutsche Bank Research, Germany
Andreas Neubauer Regional Head
Equity Research, Germany
Steve Pollard Regional Head
Americas Research
International Locations
Deutsche Bank AG Deutsche Bank Place Level 16 Corner of Hunter & Phillip Streets Sydney, NSW 2000 Australia Tel: (61) 2 8258 1234
Deutsche Bank AG Große Gallusstraße 10-14 60272 Frankfurt am Main Germany Tel: (49) 69 910 00
Deutsche Bank AG Filiale Hongkong International Commerce Centre, 1 Austin Road West,Kowloon, Hong Kong Tel: (852) 2203 8888
Deutsche Securities Inc. 2-11-1 Nagatacho Sanno Park Tower Chiyoda-ku, Tokyo 100-6171 Japan Tel: (81) 3 5156 6770
Deutsche Bank AG London 1 Great Winchester Street London EC2N 2EQ United Kingdom Tel: (44) 20 7545 8000
Deutsche Bank Securities Inc. 60 Wall Street New York, NY 10005 United States of America Tel: (1) 212 250 2500
Global Disclaimer The information and opinions in this report were prepared by Deutsche Bank AG or one of its affiliates (collectively "Deutsche Bank"). The information herein is believed to be reliable and has been obtained from public sources believed to be reliable. Deutsche Bank makes no representation as to the accuracy or completeness of such information.
Deutsche Bank may engage in securities transactions, on a proprietary basis or otherwise, in a manner inconsistent with the view taken in this research report. In addition, others within Deutsche Bank, including strategists and sales staff, may take a view that is inconsistent with that taken in this research report.
Deutsche Bank may be an issuer, advisor, manager, distributor or administrator of, or provide other services to, an ETF included in this report, for which it receives compensation.
Opinions, estimates and projections in this report constitute the current judgement of the author as of the date of this report. They do not necessarily reflect the opinions of Deutsche Bank and are subject to change without notice. Deutsche Bank has no obligation to update, modify or amend this report or to otherwise notify a recipient thereof in the event that any opinion, forecast or estimate set forth herein, changes or subsequently becomes inaccurate. Prices and availability of financial instruments are subject to change without notice. This report is provided for informational purposes only. It is not an offer or a solicitation of an offer to buy or sell any financial instruments or to participate in any particular trading strategy. Target prices are inherently imprecise and a product of the analyst judgement.
In August 2009, Deutsche Bank instituted a new policy whereby analysts may choose not to set or maintain a target price of certain issuers under coverage with a Hold rating. In particular, this will typically occur for "Hold" rated stocks having a market cap smaller than most other companies in its sector or region. We believe that such policy will allow us to make best use of our resources. Please visit our website at http://gm.db.com to determine the target price of any stock.
The financial instruments discussed in this report may not be suitable for all investors and investors must make their own informed investment decisions. Stock transactions can lead to losses as a result of price fluctuations and other factors. If a financial instrument is denominated in a currency other than an investor's currency, a change in exchange rates may adversely affect the investment.
All prices are those current at the end of the previous trading session unless otherwise indicated. Prices are sourced from local exchanges via Reuters, Bloomberg and other vendors. Data is sourced from Deutsche Bank and subject companies.
Past performance is not necessarily indicative of future results. Deutsche Bank may with respect to securities covered by this report, sell to or buy from customers on a principal basis, and consider this report in deciding to trade on a proprietary basis.
Derivative transactions involve numerous risks including, among others, market, counterparty default and illiquidity risk. The appropriateness or otherwise of these products for use by investors is dependent on the investors' own circumstances including their tax position, their regulatory environment and the nature of their other assets and liabilities and as such investors should take expert legal and financial advice before entering into any transaction similar to or inspired by the contents of this publication. Trading in options involves risk and is not suitable for all investors. Prior to buying or selling an option investors must review the "Characteristics and Risks of Standardized Options," at http://www.theocc.com/components/docs/riskstoc.pdf If you are unable to access the website please contact Deutsche Bank AG at +1 (212) 250-7994, for a copy of this important document.
The risk of loss in futures trading and options, foreign or domestic, can be substantial. As a result of the high degree of leverage obtainable in futures and options trading, losses may be incurred that are greater than the amount of funds initially deposited.
Unless governing law provides otherwise, all transactions should be executed through the Deutsche Bank entity in the investor's home jurisdiction. In the U.S. this report is approved and/or distributed by Deutsche Bank Securities Inc., a member of the NYSE, the NASD, NFA and SIPC. In Germany this report is approved and/or communicated by Deutsche Bank AG Frankfurt authorized by the BaFin. In the United Kingdom this report is approved and/or communicated by Deutsche Bank AG London, a member of the London Stock Exchange and regulated by the Financial Conduct Authority for the conduct of investment business in the UK and authorized by the BaFin. This report is distributed in Hong Kong by Deutsche Bank AG, Hong Kong Branch, in Korea by Deutsche Securities Korea Co. This report is distributed in Singapore by Deutsche Bank AG, Singapore Branch or Deutsche Securities Asia Limited, Singapore Branch (One Raffles Quay #18-00 South Tower Singapore 048583, +65 6423 8001), and recipients in Singapore of this report are to contact Deutsche Bank AG, Singapore Branch or Deutsche Securities Asia Limited, Singapore Branch in respect of any matters arising from, or in connection with, this report. Where this report is issued or promulgated in Singapore to a person who is not an accredited investor, expert investor or institutional investor (as defined in the applicable Singapore laws and regulations), Deutsche Bank AG, Singapore Branch or Deutsche Securities Asia Limited, Singapore Branch accepts legal responsibility to such person for the contents of this report. In Japan this report is approved and/or distributed by Deutsche Securities Inc. The information contained in this report does not constitute the provision of investment advice. In Australia, retail clients should obtain a copy of a Product Disclosure Statement (PDS) relating to any financial product referred to in this report and consider the PDS before making any decision about whether to acquire the product. Deutsche Bank AG Johannesburg is incorporated in the Federal Republic of Germany (Branch Register Number in South Africa: 1998/003298/10). Additional information relative to securities, other financial products or issuers discussed in this report is available upon request. This report may not be reproduced, distributed or published by any person for any purpose without Deutsche Bank's prior written consent. Please cite source when quoting.
Copyright © 2014 Deutsche Bank AG

![Introduction - QUANTITATIVE RESEARCH AND TRADINGjonathankinlay.com › wp-content › uploads › Canonical...ETFs = TemporalData[ETFs] DateListPlot[ETFs] TemporalData 2008 2010 2012](https://img.dokumen.tips/doc/110x75/60be3b7b4d2c2d25820ec04a/introduction-quantitative-research-and-t-a-wp-content-a-uploads-a-canonical.jpg)