Embed Size (px)
Citation preview

CT.G ROADMAP 1
Rural Options at Discharge Model of Active Planning (ROADMAP):
Protocol and Statistical Analysis Plan

CT.G ROADMAP 2
Methods
Settings
This study was conducted in Montana, a state with a population of 989,417 people living
on 145,546 square miles for an average density of 6.8 persons per square mile. St. Patrick
Hospital (SPH) was the central site for this study. SPH, a member of the Providence Health and
Services System, is a regional referral hospital (RRH) serving Western Montana and Eastern
Idaho. SPH is located in Missoula, Montana, a city of 66,768 in a county of 109,299 people.
SPH uses the Epic® electronic medical record system. This study focused on patients discharged
from the RRH to one of four Montana counties served by critical access hospitals (CAH) that
also used the Epic® electronic medical records system, including Beaverhead, Lake, Powell, and
Sanders Counties.
The Montana Department of Public Health and Human Services designated all four of
the counties involved in this study as rural counties (counties with less than 50 people per
square mile). Furthermore, all four were non-metropolitan counties and three of the counties
met the criteria of being a frontier county (population of less than 6 people per square mile).
Travel time to Missoula from the principal town of the four counties ranged from 79 (76 miles)
to 145 (172 miles) minutes. Portions of Lake and Sanders Counties are included in the Flathead
Reservation, which is home to the Salish, Pend d’Oreille and Kootenai Tribes. Table 1 provides
basic demographic data from the most recent U.S. Census for each of the four counties
included in the present study.

CT.G ROADMAP 3
Table 1
Characteristics of Geographic Area
County Beaverhead Powell Lake Sanders
Land Area (sq. miles) 5,541 2,326 1,490 2,760
Population 9,246 7,027 28,746 11,413
Density/Sq. Mile 1.7 3.0 19.3 4.1
White 94.9% 92.4% 68.2% 92.1%
Native American 1.8% 4.6% 23.4% 4.3%
Hispanic or Latino 3.7% 2.3% 4.0% 2.6%
Households 4,110 2,411 11,829 5,149
Mean Number in
Household 2.11 2.31 2.38 2.17
Median Household
Income $41,614 $40,802 $38,019 $32.881
Per Capita Income 22,872 $19,736 $21,521 $19,188
Percent Below Poverty 15.1% 15.3% 22.4% 22.0
Principal City Population 4,134 3,111 4,488 1,313
Patient Population
All patients from these four selected counties admitted to SPH for treatment and at
least one overnight stay during the period of October 19, 2015 through November 30, 2016
were eligible. Patients were included if they were being discharged home or to a swing-bed
arrangement in their home county critical access hospital. Researchers excluded patients, if
they were younger than 18 years old or older than 75 years old, were prisoners of the State
correctional facility in Powell County, came from or were being discharged to a nursing home or
other long-term care facility, were admitted with a primary diagnosis of a psychiatric
impairment or substance abuse, were actively dying, or presented cognitive impairments that
would significantly limit their ability to consent or to complete the measurement instruments
(Flesch-Kincaid Reading Level = 7.5). Figure 1 presents a patient flow diagram.

CT.G ROADMAP 4
Figure 1: Patient flow diagram of the ROADMAP study.
Enrollment. A Research Transitions Coordinator (RTC) received a daily report of patients
admitted into SPH. She reviewed the report to identify eligible patients. Based on the review,
she developed a list of eligible patients. She then reviewed the list to identify patients who met
any of the exclusion criterial; this produced a list of patient who met inclusion criteria to recruit
into the study. Next, the RTC went to each patient’s room to explain the study, to identify any
additional factors that might exclude the patient, and to determine a patient’s willingness to
participate. If a patient met inclusion criteria and expressed interest, the RTC reviewed the
informed consent material and enrolled the patient.
The RTCs screened 751 patients from the four counties. Of those, 570 patients were
excluded as ineligible based on exclusion criteria, 54 who met the inclusion criteria declined to
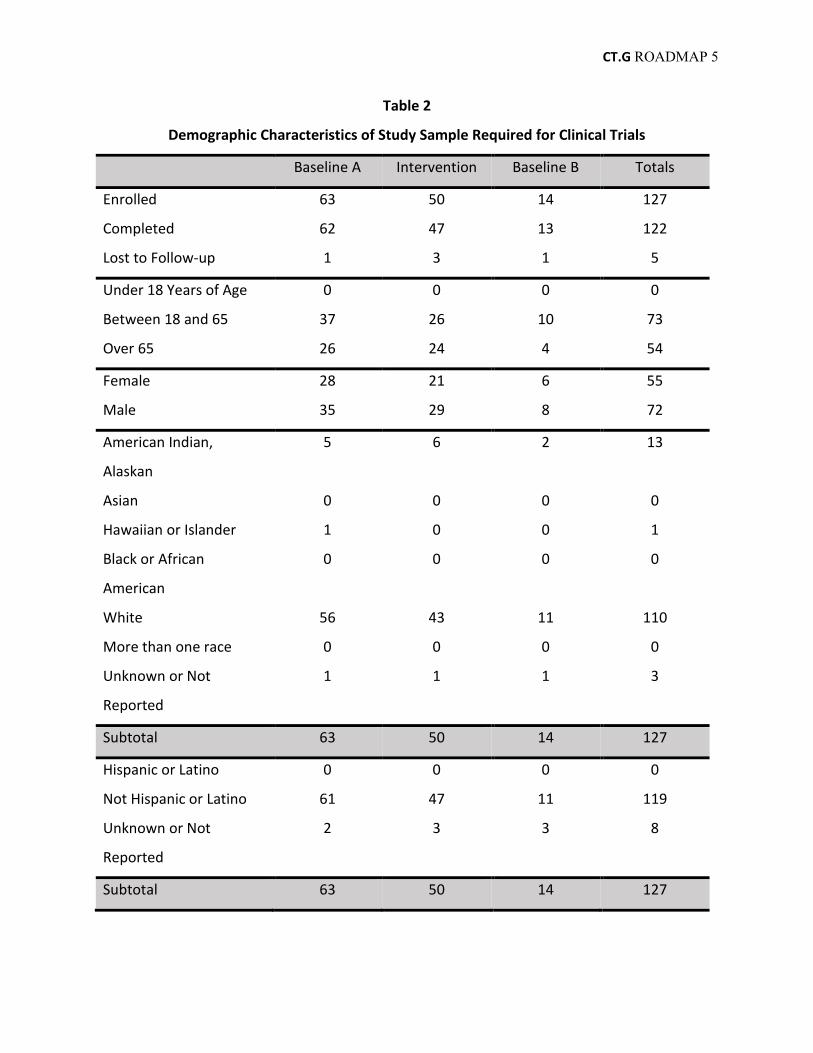
participate in the study, and 127 enrolled in the study. Table 2 presents demographic
information of participants by experimental condition as required by ClinicalTrials.Gov.
CT.G ROADMAP 5
Table 2
Demographic Characteristics of Study Sample Required for Clinical Trials
Baseline A Intervention Baseline B Totals
Enrolled 63 50 14 127
Completed 62 47 13 122
Lost to Follow-up 1 3 1 5
Under 18 Years of Age 0 0 0 0
Between 18 and 65 37 26 10 73
Over 65 26 24 4 54
Female 28 21 6 55
Male 35 29 8 72
American Indian,
Alaskan
5 6 2 13
Asian 0 0 0 0
Hawaiian or Islander 1 0 0 1
Black or African
American
0 0 0 0
White 56 43 11 110
More than one race 0 0 0 0
Unknown or Not
Reported
1 1 1 3
Subtotal 63 50 14 127
Hispanic or Latino 0 0 0 0
Not Hispanic or Latino 61 47 11 119
Unknown or Not
Reported
2 3 3 8
Subtotal 63 50 14 127

CT.G ROADMAP 6
In addition, Table 3 presents the number of patients excluded by criterion and Table 4
shows the number of patient enrolled in the study from each county by experimental condition.
Table 3
Number of Patients Excluded by Criteria
Exclusion Criteria Number of
Patients
Age 242
Not an Inpatient 41
Substance Abuse – Mental
Illness 65
Prisoner 29
Extended Care Facility 12
Not Going Home 26
Extended Observation 28
Cognitive Impairment 24
Actively Dying 16
Other 65
Total 570

CT.G ROADMAP 7
Table 4
Participants by County
Baseline Intervention Baseline Total
Sanders 10 21 4 35
Beaverhead 8 8 0 16
Powell 11 6 2 19
Lake 34 15 8 57
Total 63 50 14 127
Procedures
SPH’s established discharge planning procedures and practices served as the standard
comparator. From the patient’s perspective, this involved three elements, including verification
of financial means, discharge planning, and patient instructions. Generally, patients who lacked
health insurance or other means for paying medical and hospital costs were “flagged” at
admission. This alerted the Medical Assistance Program (MAP). Staff from MAP went to the
patient’s room to discuss options and outline a plan for payment. For example, a MAP staff
member might work with a patient to enroll in Medicaid so that his or her costs might be
covered. Six Discharge Planners (DP) served patients in the hospital. When a Discharge Planner
initiated work with a patient, she reviewed the patient’s file to determine what treatment the
patient was to receive and examined any history that may be relevant to recovery. Next, the
DP typically visited the patient in the hospital room to assess the patient's situation. This
included determining if the patient had a place to go after treatment (e.g., home, shelter, etc.)
and if they had someone to provide transportation there when discharged. Depending on the
patient's situation, the DP might consult with the patient's physicians, nurses, or other care
providers, and might work to arrange transportation or temporary shelter. The DP entered
findings and actions into the patient’s EPIC file. Finally, treatment staff used information in
EPIC to prepare an After Visit Summary (AVS) for the patient that included a description of the
patient’s treatment, a list of medications and instructions for their use, and patient educational
CT.G ROADMAP 8
materials about the treatment and self-care. Depending on the patient’s condition and
treatment, the AVS might include a follow-up referral (and sometimes a scheduled
appointment for the patient). Finally, the AVS was given to the patient when they left the
hospital. All patients enrolled in the study received these standard services.
Enhanced discharge and rural transition planning. Researchers engaged patients and
other stakeholders in a structured process of contextual assessment and innovation to develop
an Enhanced Discharge and Rural Transition model, protocol, and procedures (separate
manuscript that can be cited). Figure 2 outlines the components of both the standard practice
and the enhanced model. Researchers added 11 components to the standard practices,
including: a Rural Transitions Needs Assessment, a resource bank for each rural community
linked to categories of the needs assessment, a Patient Transition Agenda, an electronic
episode of care in Epic® to support patient transition, patient-centered communication
procedures between SPH staff and Local Community Transition Coordinators (LCTC), a
discharge orders verification procedure, a transitions planning protocol, transitions follow-up
procedures, a long-range goals assessment also linked to community resources, communication
procedures to alert the patient’s PCP of their hospitalization and transition home, and a
coordination mechanism between LCTCs at the CAHs and the Research Discharge Coordinators
at the RRH to facilitate teamwork.

CT.G ROADMAP 9
Figure 2: Tentative model describing the Enhanced Discharge and Rural Transitions Process. The shaded boxes at the top of the figure represent the standard practice. The open boxes at the bottom represent the experimental procedures. All patients received the standard procedures. Patients in the experimental conditions also received the enhanced procedures.
In general, the enhanced model was based on the existing discharge planning protocol
but extended it by creating new roles and functions that focused on addressing patient needs
that might interfere with recovery at home. Procedurally, a Research Transitions Coordinator
located at the regional referral hospital used a tablet computer to conduct a Rural Transitions
Needs Assessment with a patient. The patient’s identified needs were linked to services and
supports listed in a Community Resource Bank. Together, these formed a patient’s Transition
Agenda. The RTC posted the Agenda in an Episode of Care (EOC) tab in Epic®.
The RTC then notified the LCTC in the patient’s home community that SPH had admitted
and was treating a patient from their community. The LCTC reviewed the Transition Agenda
and prepared for the patient's return to the community. Once home, the LCTC contacted the
patient to check on his or her status, and to work with the patient to develop and execute a
Rural Transition Plan.

CT.G ROADMAP 10
Needs Assessment and patient transitions agenda. The RTC reviewed the Epic® medical
record for patients meeting inclusion criteria to familiarize herself with the patient’s situation
before visiting them in their room. For patients in the intervention condition, once a patient
was enrolled in the study, the RTC worked with the patient (and caregivers as deemed
appropriate by the patient) to complete a structured Rural Transitions Needs Assessment using
an electronic tablet to rate his or her confidence in their ability to meet each of 18 transition
needs (e.g., housing, groceries and meals, medications, self-care, etc.). The RTC read an item
from a tablet computer screen and asked the patient to rate it. Then the RTC recorded the
patient’s rating by checking the relevant box. These rating were stored electronically in the
tablet. The assessment was structured to provide brief educational information about the need
and asked the patient to rate their confidence in meeting the need on a scale of "0" to "4,"
where "0" meant not confident and "4" meant very confident. A patient could also rate the
need as not applicable (NA). Figure 3 presents an example of two such items.
Not Confident Very Confident NA
A safe and comfortable place to live contributes to your healing and recovery. How confident are you that you have a safe and comfortable place to live when you leave the hospital?
0 1 2 3 4 □
You should eat a healthy diet to provide the nutrients your body needs to heal. You may need someone to help you get groceries or prepare meals for a while. How confident are you that you have someone you can count on to help you get groceries and prepare meals when you get home?
0 1 2 3 4 □
Figure 3: Sample of items from the Rural Transition Needs Assessment and rating scale.
Items rated "2" or less were treated as potential patient needs. If a patient rated an
item as "2" or less, the RTC would ask, “Can you tell me a bit more about this?” She would
record responses as additional information. If a patient rated an item as 3 or higher (or NA) but
that rating seemed incongruent with information learned from the file review or discussion
with the patient, the RTC would ask, “Can you tell me more about how you will meet that

CT.G ROADMAP 11
need?” This prompt sometimes led to a change in rating. Again, these explanatory responses
were recorded as additional information. LCTCs used this additional information in preparing
the draft Transitions Plan.
The patient’s endorsed needs were linked to a database of resources, the Local
Resource Bank, known to provide services and supports in identified areas of need. Together,
the needs and linked services created a patient Transition Agenda (PTA). Figure 4 shows a
sample Patient Transition Agenda.
Figure 4: A screen shot of a patient's Transition Agenda listing services available in his hometown that he could use to address each identified need in the areas of medication, home modifications, and rehabilitation services.
Electronic Episode of Care. The RTC posted the patient's Transitions Agenda in the EOC
tab in Epic® and notified (via EPIC® in-basket email and phone) the LCTC serving the county to
which the patient was scheduled to return that a patient from the county was being treated at
SPH and provided an estimated date of discharge. This early involvement, a component
insisted on by the key stakeholders from the CAHs, allowed the LCTC to review a patient's
treatment, risk factors, likely needs, and available resources to meet those needs while the
patient was still in the hospital. In addition, the LCTC reviewed the patient’s AVS in EPIC and
prepared a Discharge Orders Verification Checklist that listed orders and recommendations for
the patient's recovery at home (e.g., medications, oxygen orders, etc.).

CT.G ROADMAP 12
Verifying discharge orders and scheduling a Transitions Conference. Once discharged
home (or to a swing bed placement), the LCTC contacted the patient to check on his or her
status and to schedule a Transition Conference. The LCTC used the brief Discharge Orders
Checklist to review the status of each discharge order with a patient. This was completed
simply by asking the patient to indicate that an order had been implemented or not. If the
checklist revealed any immediate gaps in implementation, the LCTC could take action to help
the patient address any obstacles in securing the services. If no immediate gaps were
identified, the LCTC scheduled a Transitions Conference with the patient. Then, the LCTC
notified the patient's primary care provider (PCP) that one of their patients had been treated at
SPH, had enrolled in the Enhanced Discharge and Rural Transitions study, and provided
directions for locating the patient's Episode of Care tab in Epic ®.
Patient Transitions Conference. The Patient Transition Conference involved the LCTC
meeting with the patient in their home to review the Transitions Agenda and develop a
Transitions Plan. While the preferred setting for the Transitions Conference was the patient’s
home, this meeting could also take place at the local CAH or even over the phone. Meeting at
the patient’s home was preferred because it was seen as helping the LCTC to understand a
patient better and thought to lead to recognition of needs not previously identified. It was also
seen as helping the LCTC judge what types of supports are most likely to fit the patient’s
context; thus, be more likely to be followed by the patient and caregivers. Furthermore, the
Patient Design Team unanimously and strongly encouraged its inclusion in the model.
Patient Centered Transitions Plan and Supports. During the Transitions Conference,
the LCTC reviewed the patient’s Transition Agenda with the patient. She confirmed the
identified needs, dropped ones that the patient felt no longer applied, and added any that had
emerged from the patient's experience in returning home. Together, they reviewed the
patient’s personal resources (e.g., family, friends, etc.) and services available locally to address
the needs, considered their utility and acceptability for the patient, and developed a plan for
securing needed supports. The steps were recorded in a Transition Plan form that listed the
need discussed, the services chosen, and the person responsible for executing each element of
the plan (e.g., patient to call senior center to arrange transportation).

CT.G ROADMAP 13
In general, the LCTC provided support to the patient for up to 30 days but could extend
support for up to 90 days. During that time, the LCTC completed the steps to which she had
committed and monitored the patient's progress in achieving other objectives. Progress was
recorded in the Episode of Care. After 30 days, the LCTC discussed closing the case with the
patient. If the patient agreed, the LCTC discussed a patient's long-range goals and together
they identified other community supports that the patient might find useful in achieving any
related objectives. The LCTC prepared a case summary letter that was sent to the patient,
posted in the Episode of Care, and sent to the patient's PCP.
Instructional manual, orientation and training. Researchers developed a written
manual using a behavioral instructional format (e.g., Merkel, 1980) to orient and train all staff
involved in the project. This involved conducting a detailed task analysis to specify the major
jobs and tasks required to implement and maintain the experimental procedures. Each job was
further analyzed into its component steps. Researchers prepared behavioral instructions that
described each step. These instructions also presented examples of how to perform each step
and explained the function or outcomes associated with completing each step.
Staff serving as RTCs and LCTCs read the manual and participated in a day-long
orientation and training session to review and discuss the procedures. In addition, SPH
Information Technology staff trained all research staff in the use of Epic® and the newly created
Episode of Care component. Finally, the RTCs and LCTCs participated in weekly teleconferences
during which they discussed the program's implementation.
Design
We used a quasi-experimental time series design with switching replications (Cook &
Campbell, 1984). This design involved starting enrolled patients from each of the four counties
in a baseline condition. Then, once a stable rate of enrollment had been reached, the
introduction of the experimental procedures was staggered across patients from each county
over time. That is, all patients from one county were enrolled into the intervention while those
from the other counties remained in baseline. Later, patients from a second and third county
were added to the intervention condition while those from the remaining county remained in
baseline; and so on. Finally, a return to baseline condition was initiated for patients from all

CT.G ROADMAP 14
four counties. This design protects against most threats to the internal validity of findings and
many threats to their external validity. It is particularly helpful in protecting against threats
posed by seasonal variables. A final "return to baseline" phase was also included in the study to
add to protections from threats posed by interactions.
Baseline and experimental conditions. Patients in baseline conditions received the
standard discharge services. Patients enrolled in the experimental condition received the
standard discharge services and the Enhanced Discharge Planning and Rural Transition
Supports.
Measures. All patients completed the PAM10 (Hibbard & Mahoney, 2005) and provided
selected demographic information at the time of enrollment. Other demographic information
was collected from each enrolled patient’s medical record. In addition, we collected the LACE+
rating from the medical record and the rating of needs from our Rural Transition Needs
Assessment. The LACE+ is a compilation of medical and treatment factors (e.g., chronic
conditions, previous hospitalizations) derived from a patient's medical record that are used to
assess risk for re-hospitalization (van Walraven, Wong, & Forster, 2012).
Researchers prepared an evaluation package that included the three-item Care
Transition Measure (Coleman, Mahoney, & Parry, 2005), the 12 item Short Form of the Medical
Outcome Study (Stewart and Ware, 1992), and a Rural Transitions Measure (RTM14; Montana
Team, 2016). The RTM14 asked patients to report whether they strongly agree, agree,
disagree, or strongly disagree with each of 14 statements reflecting services provided after
discharge to facilitate an effective transition home. Researchers also asked patients to report
the number of times that they had seen a PCP, visited an emergency department of any
hospital, been admitted to SPH, or been admitted to any other hospital since they were
discharged or since their last report.
Data collection. We asked patients to complete the instruments in the evaluation
package at 3, 7, 14, 21, 30, 60, and 90 days after they were discharged from the RRH. RTCs
gave patients the 3 and 7 day evaluation packages in the RRH to complete at home. The
research staff mailed the remainder of the evaluation packages to patients three days before
the end of each measurement period. Each evaluation package included an instrument and a

CT.G ROADMAP 15
self-addressed stamped envelope for returning a completed questionnaire. In addition, the
first six instruments included a $10 honoraria and the last packet included a $40 honoraria.
Finally, we used information in the Epic® patient records to collect demographic data
and information on emergency department visits, outpatient admissions, and hospitalizations
at the participating hospitals. Finally, RTCs and LCTC kept notes detailing the patient situation
and experiences that were posted in the EOC tab in Epic®.
Statistical Analysis Plan
The primary hypotheses address the question of whether the intervention makes a
difference in the frequency of hospitalizations and emergency department visits. There are at
least two ways to view the measurement of these outcomes. The first is to examine the total
number of hospital or emergency department visits in each condition. The second is to
examine the proportion of patients who have at least one hospital or emergency department
visits in each condition.
In addition, there are several intermediary outcomes we anticipate. These relate to the
physical and mental health of patients, the rating of the quality of discharge planning services,
and the rating of the delivery of rural transition services. We will test the following hypotheses
using specified procedures:
1) Hospital re-admissions
a) Number of hospital admission
i) H0i: There is no difference in the cumulative number of hospital admissions for day i
(null hypothesis); H1i: The cumulative number of hospital admissions for the
standard discharge group is greater than that for the enhanced discharge group; for
days i = 3, 7, 14, 21, 30, 60, 90.
ii) We will assess the groups for differences using Poisson regression model.
b) Proportion of patients with at least one hospital admission
i) H0i: There is no difference in the proportion of patients who report a hospital
readmission for day i (null hypothesis); H1i: The proportion of patients who report a
hospital readmission for the standard discharge group is greater than that for the
enhanced discharge group; for days i = 3, 7, 14, 21, 30, 60, 90.
CT.G ROADMAP 16
ii) We will assess the groups for differences using logistic regression.
2) Emergency department visits
a) Number of emergency department visits
i) H0i: There is no difference in the cumulative number of ED visits for day i (null
hypothesis); H1i: The cumulative number of ED visits for the standard discharge
group is greater than that for the enhanced discharge group; for days i = 3, 7, 14, 21,
30, 60, 90.
ii) We will assess the groups for differences using Poisson regression model.
b) Proportion of emergency department visits
i) H1i: The proportion of patients who report at least one ED visits for the standard
discharge group is greater than that for the enhanced discharge group; for days i = 3,
7, 14, 21, 30, 60, 90.
ii) We will assess the groups for differences using logistic regression model.
3) Primary care provider (PCP) visits
a) Number of PCP visits
i) H0i: There is no difference in the cumulative number of PCP visits for day i (null
hypothesis); H1i: The cumulative number of PCP visits for the standard discharge
group is greater than that for the enhanced discharge group; for days i = 3, 7, 14, 21,
30, 60, 90.
ii) We will assess the groups for differences using Poisson regression model.
b) Proportion of PCP visits
i) H0i: There is no difference in the proportion of patients who report at least one PCP
visits for day i (null hypothesis); H1i: The proportion of patients who report at least
one PCP visits for the standard discharge group is greater than that for the enhanced
discharge group; for days i = 3, 7, 14, 21, 30, 60, 90.
ii) We will assess the groups for differences using logistic regression model.
4) Physical health as measured by the Short Form (SF12) functional health score

CT.G ROADMAP 17
a) Hoi: There is no difference in mean SF-12 Physical Health scores between the standard
and enhanced discharge groups (null hypothesis); H1i: The mean SF-12 Physical Health
scores differ between the standard and enhanced discharge groups.
b) We will use a repeated measures ANOVA model (over the 7 time periods) to model the
SF-12 Physical Health score as a function of treatment group.
5) Mental Health as measured by the Short Form (SF12) Mental Health Score
a) Hoi: There is no difference in mean SF-12 Mental Health scores between the standard
and enhanced discharge groups (null hypothesis); H1i: The mean SF-12 Mental Health
scores differ between the standard and enhanced discharge groups.
b) We will use a repeated measures ANOVA model (over the 7 time periods) to model the
SF-12 Mental Health score as a function of treatment group.
6) Care Transition Measure (CTM3) of discharge coordination services
a) Hoi: There is no difference in mean CTM3 scores between the standard and enhanced
discharge groups (null hypothesis); H1i: The mean CTM3 scores differ between the
standard and enhanced discharge groups.
b) We will use a repeated measures ANOVA model (one time period at 3 days post
discharge) to model to assess these hypotheses.
7) Rural Transition Measure (RTM14) of the delivery of transition services and supports
a) H0: There is no difference in the mean RTM14 score between the standard and
enhanced discharge groups (null hypothesis); H1: Patients in the enhanced discharge
group will have a higher mean RTM14 rating than patients in the standard discharge
group.
b) We will use a repeated measures ANOVA model (over the 6 time periods) to model the
RTM14 score as a function of treatment group.

CT.G ROADMAP 18
References
Coleman, EA, Mahoney E, Parry C. Assessing the Quality of Preparation for Post-Hospital Care
from the Patient's Perspective: The Care Transitions Measure. Medical Care. 2005;
43(3):246-255.
Hibbard, J.H., E.R. Mahoney, J. Stockard, M. Tusler. 2005. Development and testing of a short
form of the Patient Activation Measure. Health Services Research. 2005; 40: 1918 -30.
Montana Team (2016). Rural Transitions Needs Assessment: Deciding the help you need.
Missoula, MT: Rural Institute.
Stewart, A. & Ware, J.E. (1992). Measuring Functioning and Well-Being: The Medical Outcomes
Study Approach. Durham, NC: Duke University Press Books.
van Walraven , C., J. Wong, A. J. Forster (2012). LACE+ index: Extension of a validated index to
predict early death or urgent readmission after hospital discharge using administrative
data. Open Medicine, 6(3) e90.