Embed Size (px)
Citation preview

1
Running Head: Flux analysis of soybeans fed altered provisions 1
Corresponding author: Doug K. Allen; 975 North Warson Road, Saint Louis, MO, 63132; ph: 2
314-587-1460; email: [email protected] 3
Journal Research Area: Biochemical Processes and Macromolecular Structures 4
5
Plant Physiology Preview. Published on January 11, 2013, as DOI:10.1104/pp.112.203299
Copyright 2013 by the American Society of Plant Biologists

2
Title: Carbon and Nitrogen Provisions Alter the Metabolic Flux in Developing Soybean 6
Embryos 7
8
Authors: Doug K. Allen* and Jamey D. Young 9
10
Institution Addresses: USDA-ARS, Plant Genetic Research Unit, St. Louis MO 63132 11
(D.K.A.); Donald Danforth Plant Science Center, St. Louis MO 63132 (D.K.A.); and Department 12
of Chemical and Biomolecular Engineering and Department of Molecular Physiology and 13
Biophysics, Vanderbilt University, Nashville TN 37235 (J.D.Y.) 14
15

3
Financial source: 1 This work was supported by the U.S. Department of Agriculture-Agricultural 16
Research Service and the U.S. National Science Foundation (grant no. EF- 1105249) 17
*Corresponding author; Doug K. Allen, e-mail [email protected] 18
19

4
Abstract: 20
Soybean seeds store significant amounts of their biomass as protein, levels of which 21
reflect the carbon and nitrogen received by the developing embryo. The relationship between 22
carbon and nitrogen supply during filling and seed composition was examined through a series of 23
embryo culturing experiments. Three distinct ratios of carbon to nitrogen supply (C:N ratio) were 24
further explored through metabolic flux analysis. Labeling experiments utilizing [U-13C5]-25
glutamine, [U-13C4]-asparagine, and [1,2-13C2]-glucose were performed to assess embryo 26
metabolism under altered feeding conditions and to create corresponding flux maps. 27
Additionally, [U-14C12]-sucrose, [U-14C6]-glucose, [U-14C5]-glutamine, and [U-14C4]-asparagine 28
were used to monitor differences in carbon allocation. The analyses revealed that: i) protein 29
concentration as a percentage of total soybean embryo biomass coincided with C:N ratio; ii) 30
altered nitrogen supply did not dramatically impact relative amino acid or storage protein subunit 31
profiles; and iii) glutamine supply contributed 10 to 23% of the carbon for biomass production, 32
including 9 to 19% of carbon to fatty acid biosynthesis and 32 to 46% of carbon to amino acids. 33
Seed metabolism accommodated different levels of protein biosynthesis while maintaining a 34
consistent rate of dry weight accumulation. Flux through ATP-citrate lyase, combined with malic 35
enzyme activity, contributed significantly to acetyl CoA production. These fluxes changed with 36
plastidic pyruvate kinase to maintain a supply of pyruvate for amino and fatty acids. The flux 37
maps were independently validated by nitrogen balancing and highlight the robustness of 38
primary metabolism. 39

5
INTRODUCTION 40
The legume soybean is one of the most important oilseed crops - providing large amounts 41
of protein for food and feed applications and supplying a significant proportion of the vegetable 42
oil used for cooking and for chemical feed stocks. Given these demands, there is considerable 43
interest in manipulation of the underlying biochemical pathways that produce oil and protein in 44
the seed. The proportions of these storage reserves are established by both the supply of maternal 45
precursors and the metabolic processes of the developing embryo. Embryos receive sugars and 46
amino acids and convert them into storage reserves through primary metabolism. Thus, the 47
accumulation of protein and oil is controlled by both the maternal (Fabre and Planchon, 2000; 48
Nakasathien et al., 2000; Pipolo et al., 2004) and seed (Wilcox, 1998; Narvel et al., 2000; 49
Hernandez-Sebastia et al., 2005) genotypes, which complicates efforts to gain fundamental 50
understanding of the process. 51
This complexity can be partially circumvented by studying the growth of cultured 52
embryos. In planta, embryos receive carbon and nitrogen apoplastically (Thorne, 1980, 1981). 53
An environment suitable for embryo growth can be recreated within a laboratory setting using 54
known apoplastic nutrients (Hsu et al., 1984; Rainbird et al., 1984). Experimentally providing 55
precise levels of substrates to filling embryos (i.e. reproductive stage R5 to R5.5) allows them to 56
grow in a controlled way (Thompson et al., 1977; Obendorf and Wettlaufer, 1984), leads to 57
compositions similar to in planta (Hsu and Obendorf, 1982; Allen et al., 2009; Bates et al., 58
2009), and confines the ‘maternal’ influence to defined substrate concentrations. In this design, 59
the influence of carbon and nitrogen provisions on seed metabolism and production of storage 60
reserves can be probed. 61
The impact of carbon and nitrogen availability on protein levels in seeds has been studied 62
in maturing plants, which remobilize leaf nitrogen to increase protein in the seed (Saravitz and 63
Raper, 1995). Likewise, cultured embryos supplied with increasing amounts of nitrogen produce 64
more protein in both wild type (Saravitz and Raper, 1995; Nakasathien et al., 2000; Pipolo et al., 65
2004) and high protein mutants (Hayati et al., 1996). Although plant-supplied substrates impact 66
resource allocation and affect final storage reserve compositions within the soybean seed, there 67
are no existing quantitative flux models that describe how changes in provisions alter the 68
underlying metabolism. 69

6
Metabolic flux analysis (MFA) aims to provide a quantitative description of the flow of 70
matter within a biological network and relies on 13C or other isotopes to track – or enrich - 71
metabolites according to biochemical fluxes and pathways (Stephanopoulos et al., 1998). The 72
metabolic reactions in the network rearrange carbon atoms as metabolites are interconverted, 73
without accumulation or depletion of the intermediates. Thus, adherence to the laws of mass 74
conservation allow calculation of in vivo fluxes. The flux models establish network function 75
(Ratcliffe and Shachar-Hill, 2006) and can occasionally identify unique roles for enzymes 76
(Schwender et al., 2004). Most MFA studies in plants have focused on seeds (Troufflard et al., 77
2007; Iyer et al., 2008; Allen et al., 2009; Lonien and Schwender, 2009; Alonso et al., 2010, 78
2011) because of their pseudo-steady-state metabolism and economic importance, although plant 79
cell suspensions have been used (Rontein et al., 2002; Baxter et al., 2007; Williams et al., 2008; 80
Masakapalli et al., 2010) because of their experimental versatility. Together, these studies have 81
quantified roles for metabolic pathways, such as the use of the tricarboxylic acid cycle (TCA) 82
(Schwender, 2008; Sweetlove et al., 2008; Allen et al., 2009; Kruger and Ratcliffe, 2009; 83
Sweetlove et al., 2010) to produce ATP (Alonso et al., 2007a) or to supply citrate for cytosolic 84
acetyl-CoA when operating as an incomplete cycle (Schwender et al., 2006). Additionally, MFA 85
has been used to assess the impact of genetic and environmental perturbations in plants (Rontein 86
et al., 2002; Spielbauer et al., 2006; Junker et al., 2007; Alonso et al., 2007b; Iyer et al., 2008; 87
Williams et al., 2008; Lonien and Schwender, 2009) and, therefore, should be useful in probing 88
the influence of carbon and nitrogen on the resulting composition of the filling embryo. 89
This study examines how the flux through primary metabolism within developing 90
soybeans is altered by changes in carbon and nitrogen supply. The modeling produced detailed 91
flux maps that described redistribution of resources within the seed and that matched observed 92
biomass compositions (i.e. amino acid fluxes to biomass were fitted as part of the modeling). 93
Developing seeds were supplied varying levels of substrate (unlabeled or 14C-enriched) in 94
different carbon to nitrogen ratios (C:N) and were analyzed for the production of oil, protein and 95
carbohydrate. Next, the flow of carbon through primary metabolism was monitored in separate 96
culture experiments providing either glucose, glutamine or asparagine labeled with 13C. Three 97
labeling experiments with four to five replicates for each of the three C:N conditions resulted in 98
approximately 40 independent, 13C-enriched cultures. The enrichment of amino acids and the 99
direct measurement of biomass were used as inputs for modeling steady state fluxes of the 100

7
developing embryo. The analyses indicate: i) soybean protein concentration ranged from 101
approximately 14 to 47% of total biomass and changed consistently as a function of C:N ratio; ii) 102
altered nitrogen supply did not dramatically alter storage protein subunit profiles or affect the 103
relative levels for most amino acids; and iii) glutamine supply contributed 10 to 23% of the 104
carbon for biomass production, including 9 to 19% of carbon to fatty acid biosynthesis and 105
approximately 32 to 46% of carbon to amino acids. The results suggest that seed metabolism can 106
accommodate different levels of protein production, although it may constrain total biomass 107
accumulation. Additionally, ATP-citrate lyase and malic enzyme flux changes are offset with 108
plastidic pyruvate kinase to maintain flow through pyruvate and to acetyl-CoA for the C:N 109
conditions. The flux maps have been independently validated by nitrogen balancing and are 110
discussed in the context of metabolic engineering. 111
RESULTS 112
Carbon to Nitrogen Ratio Influence over Seed Growth Rate 113
Soybean plants were grown under summer-like conditions to generate seeds for embryo 114
culturing. Once the embryos had finished cell division, started linear seed filling (Egli, 1998) and 115
weighed 30 to 40 mg fresh weight, the embryos were dissected from the seed coat and cultured 116
in medium with unlabeled, 14C-, or 13C-labeled substrates (Table I). Fourteen days of culturing 117
resulted in growth rates between 4.7 to 7.9 mg dry weight per day per embryo and approximately 118
90 to 100 mg of added biomass (Table II), consistent with both in planta growth measured at 5 to 119
7 mg dry weight per day per embryo (Rubel et al., 1972; Egli et al., 1985) and previous culturing 120
studies in soybean (Hsu and Obendorf, 1982; Allen et al., 2009). Biomass production and 121
doubling rates (3.65 +/- 0.17 doublings per 14 day culture) were independent of C:N ratio except 122
possibly in the extreme cases (Figure 1A, Table II). The embryos provided with the lowest C:N 123
ratio generally grew at a slower rate and, along with the highest C:N ratio cultures (i.e. C:N = 60 124
& 91), were visually different from other cultures and thus not used for further studies. The light 125
level and temperature for all cultures were maintained at 30 to 35 µmol m-2 s-1 and 26 to 27 ºC to 126
minimize changes in metabolism of the growing embryos. These culturing conditions are 127
sufficient to meet metabolic and isotopic steady state assumptions (Allen et al., 2009) and, in this 128
study, produced growth that accounted for greater than 93% of all embryo biomass. 129
130
Effect of C:N Ratio on Protein Concentration 131

8
Different levels of carbon and organic nitrogen in the culture medium resulted in 132
different biomass compositions (Figure 1B and Table II). Embryos receiving more organic 133
nitrogen (i.e. lower C:N ratio; defined in Figure 2A) produced more protein per unit of biomass, 134
consistent with other reports (Saravitz and Raper, 1995; Hayati et al., 1996). Protein changed 135
from approximately 47% to 14% of total biomass (Table II, Supplement I) as the carbon supplied 136
from amino acids was reduced from 40% to 3% of total (Table I). 137
The profile and subunit composition of storage proteins were inspected by separating 138
equal amounts of either total protein or biomass by SDS-PAGE. Images in Figure 2B and 2C, 139
representative of three gels each, revealed a similar storage protein pattern for different C:N 140
ratios. Densitometry analyses confirmed the change in protein levels across C:N ratios (Figure 141
2D). At the lowest supplied N, the production of a storage protein at 48 kD was diminished. 142
Proteomic analysis of this band identified it as the beta subunit of β-conglycinin (Supplement II). 143
This subunit lacks sulfur-containing amino acids but has similar nitrogen content to other 144
subunits, therefore its disappearance was unexpected. While, different inorganic nitrogen forms 145
have been found to alter concentration of beta subunits (Paek et al., 1997), regulation of β-146
conglycinin is both transcriptional and post-transcriptional (Harada et al., 1989) and specific to 147
individual α, α’ and β subunits. Thus, the variable quality and quantity of subunits in β-148
conglycinin and glycinin (Wilson, 1987) remain a point of interest (Yaklich, 2001). 149
The amino acid profiles (micromoles of amino acid relative to production of one 150
milligram of biomass) from hydrolyzed protein were compared for three different C:N ratios 151
(13:1, 21:1 and 37:1) and used to calculate amino acid biosynthetic rates per milligram of 152
biomass. Although total protein content increased with decreasing C:N ratios, the overall 153
composition of the protein-bound amino acids did not drastically change with the exception of 154
arginine (Figure 2E, Table III, Supplement III). The increased protein levels in embryos cultured 155
in media with a C:N ratio of 13:1 resulted in larger fluxes for most amino acids (on average, the 156
13:1 C:N ratio resulted in amino acid biosynthetic fluxes 71% greater than the 37:1 C:N ratio). 157
The data indicated that total protein concentration responded to nitrogen levels but that relative 158
amino acid composition varied more modestly. The protein levels for flux analysis were 159
determined using Jones factors for the measured amino acid compositions as described in the 160
methods and Supplement I (Salo-Väänänen and Koivistoinen, 1996). 161

9
Seed storage compounds contain different amounts of carbon [i.e. a typical 162
triacylglycerol with triolein composition, (C57H104O6) is 77% carbon by weight; glucose 163
polymers in carbohydrates (C6H12O6 minus H2O) are 44% carbon; and protein with the observed 164
amino acid composition is 51% carbon], therefore 14C-labeling was used to monitor the changes 165
in carbon allocation into biomass (Table IV). Soybeans were cultured in media containing a 166
combination of [U-14C12]-sucrose, [U-14C6]-glucose, [U-14C5]-glutamine and [U-14C4]-asparagine 167
at levels consistent with the molar composition of carbon for each substrate (Goffman et al., 168
2005). Embryos were grown for 14 days before the biomass was processed as described in the 169
methods. Briefly, oil, ethanol-soluble material and protein were sequentially extracted. The 170
ethanol fraction was further subjected to ion exchange chromatography and HPLC to establish its 171
contents. HPLC indicated that the only significant radioactivity in the cationic fraction eluted 172
completely in the column void volume and may have represented a small amount of hydrophobic 173
protein solubilized by the 80% ethanol (i.e. amino acid pools which did not come in the void 174
volume were sensitively detected by UV (254 nm) and were present at low concentrations that 175
did not result in measureable DPM values). Neither sugars, which represent part of the 176
carbohydrate pool, nor organic acids changed with C:N ratio, consistent with their roles as stored 177
intermediates in metabolism that have measureable levels in the vacuole. Organic acids 178
accounted for 3.2 to 3.4% of total biomass (Table IV), indicating possible vacuolar pools of 179
malate or citrate in soybeans as has been reported in plant cells (Adams and Rinne, 1981; Adams 180
et al., 1982; Gout et al., 1993; Martinoia et al., 2007; Sweetlove et al., 2010; Etxeberria et al., 181
2012). 182
Total dry weight accumulation was not dependent on C:N conditions (4.8 to 5.1 mg 183
biomass/day/embryo) and resulted in similar amounts of total 14C incorporation (56,942 to 184
59,626 DPM/mg dry weight; Table IV). Quantitative extraction of protein required urea 185
(detergents alone were insufficient), which co-extracts some carbohydrates and results in 186
modestly overestimated protein levels but reduced differences between them for C:N conditions 187
(Supplement I). Together, the measurements of dry weight accumulation and composition (Table 188
II) and 14C-labeling experiments (Table IV) indicated that seed filling is capable of sustaining 189
increased protein production but may restrict the total stored carbon in biomass. 190
191
13C-Labeling in Biomass 192

10
13C-labeling experiments were performed to assess the carbon sources used for protein 193
production. In each culturing experiment, only one labeled substrate was provided while the 194
other carbon substrates remained unlabeled (i.e. isotopic natural abundance). Therefore, any 195
change in 13C abundance in amino acids derived from hydrolyzed protein reflected the fractional 196
contribution of a particular carbon source. The amount of labeled, protein-derived, amino acids 197
was examined by gas chromatography mass spectrometry, except for arginine, lysine and 198
cysteine, which were approximated by levels of other amino acids that share the same precursors 199
(i.e. glutamate, isoleucine, and serine, respectively). Together the average isotopic enrichments 200
and the measured flux to amino acids were used to determine what fraction of each carbon 201
source flows to which amino acids (Supplement IV). Amino acids were grouped by family for 202
simple interpretation (Figure 3), with isoleucine and lysine split between the pyruvate and 203
aspartate families, consistent with their known biosynthetic origins. 204
Labeling experiments for the C:N ratios of 13:1, 21:1, and 37:1 revealed the carbon 205
allocation into the four amino acid families (Figure 3, with only 21:1 shown in upper panel, and 206
Supplement IV ). Carbon partitioning varied between the three C:N ratios (Figure 3, lower panel 207
and Supplement IV) with sugars providing more carbon at higher C:N ratios. The contribution of 208
each carbon source to a particular amino acid family relative to other carbon sources is indicated 209
by looking across the rows (i.e., the sum across each row is 100; Figure 3). Triose/pentose 210
phosphate-derived amino acids were made predominantly from sugars (95 to 96% of their carbon 211
composition) with small contributions to this family from glutamine (3 to 4%) and asparagine (1 212
to 2%) for the biosynthesis of glycine, consistent with our previous findings (Allen et al., 2009). 213
The low labeling in histidine, serine and glycine from [U-13C]-glutamine provision (Supplement 214
V) indicated that the phosphoenolpyruvate carboxykinase (PEPCK) and gluconeogenic pathways 215
are less active in embryo sink tissues. Furthermore, the absence of gluconeogenic activities 216
across all three C:N ratios suggested that this form of metabolic activity was not induced or 217
regulated by glutamine, which serves as a precursor of organic acids in developing seeds. 218
Glutamine provided 32-46% of carbon for amino acids (shaded cells in the Figure 3 inset 219
table). Glutamine was a significant source of carbon for the glutamate (71 to 87%), aspartate (26 220
to 44%) and pyruvate (13 to 24%) amino acid families and provided significantly more carbon to 221
amino acids as the C:N ratio decreased. Since glutamine contributed significantly to biosynthesis 222
of three of the four amino acid families, we examined the specific allocation of glutamine carbon 223
11
(Supplement VI). Glutamine partitioned predominantly into glutamate-derived amino acids (64 224
to 66% of supplied carbon) and to a lesser extent into aspartate (18 to 19%) and pyruvate (14 to 225
16%) amino acid families. The relative allocation varied by less than 3% amongst the C:N 226
conditions (Supplement VI). Thus, the increased use of glutamine carbon (relative to sugars) at 227
low C:N ratios reflected a concomitant increase in flux from glutamine to each amino acid 228
family. Amino acids derived from pyruvate (alanine, valine, leucine, isoleucine, and lysine) had 229
significant incorporation of carbon from the glutamine source (i.e. varied levels from 6 to 18% of 230
total carbon; Figure 4). Likewise, fatty acids derived from pyruvate consisted of 9 to 19% 231
glutamine-derived carbon (Figure 4), a doubling through the range of the C:N experiments. 232
Computationally fitted uptake fluxes indicated that glutamine supply provided between 10 to 233
23% of all carbon for biomass, changing inversely with C:N conditions. Coordinated increases in 234
the absolute values (i.e. unchanged relative flux values) have been reported in primary 235
metabolism of plant tissues where other environmental perturbations were considered (Williams 236
et al., 2008) and emphasizes the plasticity of primary metabolism. 237
238
Generation of Flux Maps for Three C:N Ratios from Multiple Labeling Experiments 239
Metabolic flux analysis (MFA) was used to investigate changes in storage reserve 240
composition of filling soybean embryos. MFA is a computational approach that mathematically 241
balances the flow of carbon through metabolite pools in a given stoichiometric network. The 242
network description included the carbon atom rearrangements catalyzed by enzymes and 243
therefore accounted for isotope label redistribution through different metabolic pathways. 244
Through a χ2 fitting process, the values for fluxes (i.e. the computational variables) were 245
optimized to recapitulate both the experimentally measured label and flux data, resulting in “best 246
estimates” of global flux values. The combination of isotopic labeling experiments with MFA 247
provided a quantitative description of the flow of metabolites through biochemical pathways. 248
Three independent labeling experiments using [U-13C4]-asparagine, [U-13C5]-glutamine, 249
or [1,2-13C2]-glucose were used to assess central carbon metabolism under variable carbon and 250
nitrogen supply. Measurements used for modeling were taken from label deposition into amino 251
acids from hydrolyzed protein, which is commonly evaluated for flux analysis (Dauner et al., 252
2001). In total, between the 3 to 5 replicates for each of the three conditions, 6337 isotopomer 253
measurements were recorded (i.e. 152 distinct mass isotopomers for multiple conditions and 254

12
replicates; Supplement V). Each model comprised 63 metabolites with 70 net and 20 exchange 255
fluxes. The optimized flux network for each of the three culture variations (Figure 5, Table V, 256
and Supplement VII) was based upon a previous model (Allen et al., 2009) that represented the 257
key carbon transitions in primary metabolism and was expanded with information from a third 258
labeling experiment. Figure 5 and Table V depict the fluxes that varied significantly with C:N 259
ratio while Supplement VII provides the entire description of the model and fluxes. Fluxes that 260
increased most dramatically with the highest provision of glutamine (i.e. C:N of 13:1) are 261
designated by thick black arrows (Figure 5). 262
Differences in label incorporation in alanine and other pyruvate-derived amino acids 263
were modeled as separate pyruvate kinase and malic enzyme activities in the cytosol and plastid. 264
The existence of non-equilibrated pyruvate pools in developing seeds is supported through 265
isotopic labeling experiments (Schwender et al., 2006; Williams et al., 2008). Furthermore, 266
plastidic pyruvate kinase-based production of pyruvate is an important metabolic step for fatty 267
acid biosynthesis (Andre et al., 2007). The data also indicated that citrate transport and cleavage 268
by ATP-citrate lyase and malic enzyme supply carbon for amino and fatty acids. Small fluxes 269
through threonine aldolase and the glyoxylate cycle were supported by labeling data but did not 270
change with the C:N conditions. Labeling in other parts of metabolism was inspected for further 271
evidence of compartmentation (Wahrheit et al., 2011; Zamboni, 2011). However, additional 272
subcellular details, such as vacuolar pools or duplication of cytosolic and plastidic components 273
of glycolysis or pentose phosphate pathways, were not necessary to develop models that passed 274
statistical criteria [sum of squared residuals (SSR) of 221, 228 and 209 for 13:1, 21:1 and 37:1 275
that are less than the upper 95%-confidence cutoff of 298] and were therefore not included. 276
A comparison of fitted and simulated data indicated no gross errors (Figure 6). The 277
largest deviations were from measurements of proline and C1 efflux. The evaluation of standards 278
and reports by others (Antoniewicz et al., 2007) have indicated that proline is less trustworthy. 279
C1 efflux was loosely established from differences in its production and utilization that do not 280
sensitively contribute to other flux estimates. The statistical agreement between fitted and 281
measured data supported the accuracy of the model. Further additions to the network resulted in 282
over-parameterization that was indicated by SSR values significantly below the cutoff value (less 283
than noise-based error) and by large CIs. Advanced experimental techniques (Allen et al., 2012) 284

13
or alternative labeling strategies that probe particular paths of interest would be necessary to 285
further increase the network complexity. 286
287
The Effect of Combined Labeling Experiments on Confidence Intervals for Flux Estimates 288
The coordinated modeling of multiple independent labeling experiments has been done 289
previously (Schwender et al., 2006; Allen et al., 2009; Masakapalli et al., 2010) and has resulted 290
in confident flux estimates. We combined different labeling data sets into our simulations for 291
central metabolism. The confidence intervals (CIs) (Antoniewicz et al., 2006; Young et al., 2008) 292
established from one, two, or all three labeling experiments were compared to the flux value 293
from which they were derived along with the degrees of freedom and the sum of squared 294
residuals (Table VI). The number of fluxes (out of 90 modeled) that had a confidence interval 295
less than the magnitude of the flux estimate were counted. The use of three labeling experiments 296
generated 60 fluxes with CIs less than the flux magnitude. As the number of labeling 297
experiments used in the simulation decreased, the system became poorly parameterized and 298
fewer fluxes were sensitively determined (Table VI), i.e., their CIs became larger than their flux 299
value. Sorting the data by highest percentage of confidently established net fluxes (last column; 300
Table VI) revealed that inclusion of the glutamine labeling experiment better determined a 301
greater number of fluxes than either of the other two experiments (Table VI). 302
303
Flux Through Plastidic Pyruvate in Developing Soybean Embryos 304
Each of the models reported significant flux through glycolysis from hexose to pyruvate 305
(plastidic pyruvate kinase flux was 70 to 76% of total flux to pyruvate; PYRp), indicating that 306
sugars are an important source of carbon for fatty acid metabolism. Together, the actions of 307
glycolysis and pyruvate dehydrogenase provide two reducing equivalents and one ATP that are 308
stoichiometrically required for the incorporation of an acetyl-CoA group in fatty acid 309
biosynthesis. However, sugars are not the only source of carbon since supplied glutamine can 310
also be used for the biosynthesis of pyruvate-derived compounds. Changes in the supplied C:N 311
ratio affected the contribution of glutamine (GLN) as a source of carbon for C4 dicarboxylic 312
acids (such as malate), plastidic pyruvate (PYRp), pyruvate-derived amino acids (VAL and 313
LEU), and fatty acids. These four classes of metabolites incorporated more glutamine-derived 314
carbon when less sugar was supplied (Figure 4). 315

14
Significant changes in dicarboxylic acid-derived products were seen as the C:N ratio 316
decreased and the soybean embryos relied more heavily on glutamine as their carbon source 317
(Figure 7A). Results from 13C-glutamine labeling experiments revealed that the labeling of all 4 318
carbons in threonine increased with the decreased C:N ratios, indicating a significant proportion 319
of fully labeled precursors such as C4 dicarboxylic acids like oxaloacetate or malate. Changes 320
were also seen in pyruvate-derived amino acids (Figure 7B). Leucine displayed an enrichment in 321
[M+2]+ and [M+4]+ isotopomers, indicating derivation from acetyl-CoA that was labeled in both 322
carbon positions. This double labeling of acetyl-CoA is consistent with malic enzyme and 323
pyruvate dehydrogenase using malate (MAL) that was labeled in multiple positions. The flux 324
models indicated that citrate cleaved by ATP-citrate lyase provides 33 to 46% of the acetyl 325
groups for fatty acid metabolism and can supply dicarboxylic acids used to generate pyruvate 326
with malic enzyme (Figure 5). Together ATP-citrate lyase and plastidic malic enzyme contribute 327
43 to 51% of the carbon used for biosynthesis of pyruvate-derived products (i.e. pyruvate-328
derived amino acids and fatty acids). Based upon the relative contributions of plastidic malic 329
enzyme and pyruvate kinase to the pyruvate supply, malic enzyme and ATP citrate lyase provide 330
47 to 59% of the carbon for acetyl-CoA production. Flux from alpha ketoglutarate (aKG) to 331
malate increased by 90% with a change from high to low C:N ratio (1.05 to 1.98 micromoles per 332
mg dry weight), resulting in utilization of more labeled organic acids for amino and fatty acid 333
biosynthesis relative to plastidic pyruvate kinase (Figure 5, Table 5, Supplement VII). 334
335
Using MFA to Distinguish Amino Acid Biosynthetic Precursors 336
While asparagine in the apoplastic space of developing soybean embryos represents the 337
second largest source of nitrogen for the developing seed (Rainbird et al., 1984), flux analysis 338
and labeling experiments indicated that it made a smaller contribution to metabolism. Asparagine 339
uptake was approximately 9 to 37% of glutamine uptake flux. Nonetheless, 13C-labeled 340
asparagine was also an informative tracer for probing metabolism and deciphering between 341
alternative network descriptions. Feeding labeled asparagine resulted in methionine (MET) and 342
threonine (THR) labeling percentages that significantly differed from the combination of labeled 343
aspartate and asparagine (ASX; Supplement VIII). Supplying labeled 13C-asparagine (at 21:1 344
C:N) resulted in a five-fold greater final label of ASX over MET or THR (Supplement VIII, 345
black bars). Conversely, labeled glutamine experiments resulted in a two-fold lower level of 346

15
labeled ASX (Supplement VIII; hatched bars). The data indicated that aspartate and asparagine 347
are not in isotopic equilibrium and that aspartate is not derived predominantly from supplied 348
asparagine. The data also support ATP-citrate lyase-based generation of oxaloacetate in the 349
plastid as the cytosolic pool of oxaloacetate could not be fitted as a precursor to labeling in THR, 350
ILE or ASX (Supplement IX) when all three labeling experiments were considered. 351
The use of [U-13C4]-asparagine did not result in labeled products of PEP or pyruvate-352
derived metabolites. Aromatic amino acids were less than 1% labeled and pyruvate-derived 353
amino acids were labeled at only low levels (<5%) due to malic enzyme activity (Supplement V). 354
These observations resulted in optimized flux maps with limited PEPCK (or reversible PEPC) 355
activity (exchange flux of 3-21% of net PEPC flux), consistent with sink metabolism in 356
developing seeds lacking gluconeogenesis. 357
Multiple network descriptions were considered to describe carbon allocation for amino 358
and fatty acid metabolism. We observed that [U-13C5]-glutamine labeling resulted in asymmetric 359
enrichment in aspartate family amino acids such as threonine and isoleucine: a pattern further 360
confirmed qualitatively by inspection of methionine. Previously observed reversibility in 361
isocitrate dehydrogenase (Schwender et al., 2006; Allen et al., 2009) was required to create 362
citrate with higher mass isotopomer fractions. Four example networks that represent different 363
alternatives are summarized in Figure 8 with additional description provided in Supplement IX. 364
The table in Figure 8 indicated that the sum of squared residuals (SSR) were minimized when the 365
model included ATP-citrate lyase accompanied by reversible isocitrate dehydrogenase. Provision 366
of [U-13C5] glutamine resulted in [M+3]+ mass isotopomers of THR and ILE that could not be 367
simulated through malate transport (Figure 8B) and resulted in a higher SSR. A network 368
containing compartmentalized phosphoenolpyruvate with a pyruvate transporter (Figure 8C) 369
resulted in incompatibility between pyruvate-derived amino acids from different subcellular 370
locations (i.e. ALA and VAL) and also gave a higher SSR value. When pyruvate transport and 371
phosphoenolpyruvate subcellular descriptions were together included with the optimized model 372
(Figure 8D), the flux estimates remained consistent with the optimized model (Figure 8A) and 373
indicated that pyruvate transport was not significant. These steps further confirmed the optimized 374
model description (Figure 8A). The small pyruvate transport flux was not added to the final 375
model because genes for plastidial pyruvate transporters in oilseeds have not been established 376
(Linka and Weber, 2010) and the flux is poorly determined (CI in the inset table was larger for 377

16
pPK in model D). Similarly, steps to describe hypothetical vacuolar pools were not included as 378
they were not necessary to fit the data (Figure 6) and would require further experimental labeling 379
descriptions to avoid low confidence determination. 380
381
Oxidative and Non-oxidative Activities in Pentose Phosphate Metabolism 382
Experiments with [1,2-13C2]-glucose resulted in similar quantities of [M+1]+ (12-15%) 383
and [M+2]+ (11-14%) mass isotopomers in histidine (Supplement X). These labeled species of 384
histidine support the existence of both an oxidative and a reversible, non-oxidative operation of 385
the pentose phosphate pathway or alternative sources of pentoses. The [M+2]+ labeling would 386
result from conversion of glucose-6-phosphate (hexose P) into ribulose-5-phosphate (Ru5P) 387
using transketolase (tk1/tk2) and aldolase (ta) enzymes, both of which maintain an intact bond 388
between the first and second carbons of labeled hexose. On the other hand, oxidative metabolic 389
steps break this bond and produce [M+1]+ labeling. The presence of both [M+1]+ and [M+2]+ 390
isotopomers may indicate partial pentose phosphate pathway activities in both the plastid and 391
cytosol that are connected by pentose or other transported molecules (Linka and Weber, 2010; 392
Weber and Linka, 2011) as the oxidative and reductive pathways are controlled by multiple 393
levels of regulation (Buchanan, 1980; Buchanan and Luan, 2005). Given the presence of 394
RuBisCO in green oilseeds (Ruuska et al., 2004) the detailed operation of pentose phosphate 395
pathways will require more labeling experiments. Because the differences in histidine labeling 396
between C:N ratios were small (Supplement X) and not significant the poorly determined fluxes 397
in this part of metabolism were not further considered. 398
399
DISCUSSION 400
Primary metabolism results in diverse storage compositions in seeds. The creation of 401
organic nitrogen and more highly reduced carbon compounds is energetically costly for a plant, 402
therefore the optimal use of elements benefits plant growth. Given both the importance and the 403
differing contributions of carbon and nitrogen to various storage reserves, we altered provision of 404
these compounds as one parameter - the C:N ratio. We varied the molar ratio of carbon to 405
nitrogen (provided as sugars and amino acids) and found altered production of storage biomass, 406
with protein going from 14 to 47% of total biomass. The change in protein and associated 407
metabolic fluxes indicated that seeds are not merely a receptacle for stored reserves, but are 408

17
dynamically involved in influencing final composition. Glutamine is a major source of both 409
carbon and nitrogen for developing soybeans. Our culture experiments revealed that 410
approximately 10 to 23% of all carbon (32 to 46% of amino acid carbon and 9 to 19% of carbon 411
in fatty acids) and 63 to 91% of all nitrogen comes from glutamine, values that are greater than 412
in other plant systems. Furthermore, the data support the hypothesis that seed nitrogen demand is 413
greater than available supply and may limit protein yield (Sinclair and De Wit, 1975; Egli and 414
Bruening, 2007; Rotundo et al., 2009; Rotundo and Westgate, 2009). 415
Storage reserves are generated by primary metabolism, implying that carbon, energy and 416
redox allocation are regulated differently in different plant seeds (e.g. maize, soybean, oilseed 417
rape). Correlations between the two pairs of protein and yield and of protein and other reserves 418
in soybeans have been discussed (Wilcox and Shibles, 2001; Clemente and Cahoon, 2009), 419
although associated fluxes through primary metabolism have not considered variations in carbon 420
and nitrogen. While we have previously used 13C-metabolic flux analysis to generate flux map 421
descriptions of soybeans (cv. Amsoy), this study probed the influence of substrates on seed filling 422
metabolism (in cv. Jack soybeans) in order to better assess fluxes that direct seed reserve 423
composition. 424
425
Limitations and Validation 426
Solving flux analysis problems is both a forward and inverse mathematical problem, 427
involving relationships between parameters (fluxes) that can be non-linear with high degrees of 428
branching. The derivation of the maximum information about a flux map involves a priori 429
sensitivity analysis. When possible, different labeling experiments are performed, but this is 430
limited by commercial availability of labeled metabolites and by biological relevance of 431
substrates in vivo (Metallo et al., 2009). Past work dedicated to optimal experimental design 432
(Mollney et al., 1999; Libourel et al., 2007; Masakapalli et al., 2010) has specified that the 433
choice and number of labeling experiments is an important consideration that depends upon 434
whether all or only specific fluxes are of interest. Performing a combined labeling experiment 435
(i.e. multiple labeled substrates per experiment) can provide nearly as much information as 436
separate labeling experiments and minimizes the number of experimental replicates (Libourel et 437
al., 2007). However the multiple labeling sources result in more complex labeling patterns that 438
are less intuitive and challenging to evaluate. 439

18
Investigations using isotopic labeling contribute to our understanding of metabolism and, 440
when coupled with metabolic flux analysis, can help uncover new enzyme activities or describe 441
unique pathway regulation (Schwender et al., 2004). MFA is also used to evaluate the impact of 442
environmental (Williams et al., 2008) and genotypical (Spielbauer et al., 2006; Alonso et al., 443
2007b; Lonien and Schwender, 2009) changes. However, conclusions from flux analyses remain 444
a function of the assumptions and conditions used in modeling and experiments. Namely, 445
estimation of fluxes requires pseudo-steady state metabolism over the labeling duration with a 446
consistent environment for each set of experiments. Therefore, diurnal cycles and temperature 447
variations are not reflected in these experiments. Additionally, the media provided to embryo 448
cultures may lack some micronutrients received in planta. These considerations are presumed to 449
be less critical since the use of substrates at levels similar to those measured in planta (Hsu et al., 450
1984; Rainbird et al., 1984) combined with salts and vitamins (Obendorf et al., 1978) can 451
capably mimic the production of storage reserves (Allen et al., 2009). Embryo cultures have been 452
used to study the metabolism of developing soybeans (Thompson et al., 1977; Obendorf et al., 453
1979; Hsu and Obendorf, 1982; Sriram et al., 2004; Allen et al., 2007; Iyer et al., 2008; Allen et 454
al., 2009). Furthermore, the changes in protein levels reported here are consistent with other 455
studies that investigated nitrogen sources (Saravitz and Raper, 1995; Nakasathien et al., 2000; 456
Pipolo et al., 2004). Therefore, flux estimates should be consistent with general features of in 457
planta seed metabolism and relevant for metabolic engineering efforts. 458
Additionally, inferred fluxes are derived numerically by probing the mathematically 459
feasible solution space posed through network constraints and, therefore, represent “best 460
estimates”. Evaluation of all points within a continuous solution space is not possible. However 461
by providing label measurements, the models consistently and rapidly converge to the same 462
solution from many different starting points. Reassurance in flux estimates was also achieved by 463
independently validating the balance of nitrogen. Nitrogen, like carbon, must be conserved, but 464
is not used as a constraint for modeling. From modeled flux values, we found that nitrogen 465
uptake ranged from 86 to 93% of the nitrogen used in metabolite generation. The balance 466
exceeded 100% in some cases when the standard error in measured fluxes was considered 467
(Supplement XI). 468
469
ATP Production Changes to Accommodate Protein Biosynthetic Demands 470

19
Protein polymerization is an energetically expensive process requiring approximately 4.3 471
units of ATP per amino acid added to an elongating peptide (Stephanopoulos et al., 1998). The 472
change in amino acid production and accompanying ATP expense of protein polymerization 473
were compared between the altered fluxes (i.e. thicker arrows, Figure 5, which resulted from 474
altered glutamine uptake). The altered fluxes provided an additional 7.3 to 8.6 µmol ATP per mg 475
dry weight depending upon the presumed P:O relationship (Hinkle, 2005). The biosynthetic 476
fluxes to amino acids increased by 1.5 µmol amino acids per mg dry weight (between the 37:1 to 477
13:1 C:N ratios). This increased amino acid polymerization required an additional 6.45 µmol 478
ATP (i.e. 1.50 * 4.3). Though cellular maintenance and futile cycles are not considered, the 479
altered ATP demand (6.45 µmol mg DW-1) was less than the calculated increase in ATP 480
production (7.3 – 8.6 µmol mg DW-1), indicating that metabolism can accommodate the increase 481
in protein production. 482
483
Carbon Partitioning through Pyruvate for Oil and Protein 484
Fatty acid labeling derived from glutamine doubles with increased nitrogen provision 485
(Figure 4). The flux maps indicated that this was a consequence of changes in plastidic pyruvate 486
kinase activity relative to plastidic malic enzyme and citrate lyase activities (Figure 5, Table V, 487
Supplement VII). The flux through pyruvate and to acetyl-CoA may be an important point of 488
regulation that can partially account for the reported negative correlations between oil and 489
protein (Wilcox and Shibles, 2001) because carbon re-allocated from fatty acid biosynthesis to 490
pyruvate-derived amino acid production could result in more dramatic change in protein levels. 491
Additionally acetyl-CoA is a central node of metabolism important to a number of secondary 492
metabolites. Some acetyl-CoA could be used to produce saponins, sterols and mevalonate-493
derived products (Berhow et al., 2006; Kim et al., 2006), or to decorate amino sugars, histones or 494
other proteins and polymers. 495
The role of glutamine in soybean carbon metabolism has been noted (Allen et al., 2009). 496
Others have recently suggested the importance of malic enzyme for redox provision to fatty acids 497
in maize (Alonso et al., 2011) and of ATP-citrate lyase in fatty acid elongation (Schwender et al., 498
2006) or fatty acid biosynthesis of soybean (Nelson and Rinne, 1975; Nelson and Rinne, 1977a, 499
1977b) and brassica (Rangasamy and Ratledge, 2000). In comparison to other plant tissues 500
analyzed by flux analysis [Table VII and (Rontein et al., 2002; Schwender et al., 2006; Alonso et 501

20
al., 2007a; Williams et al., 2008; Allen et al., 2009; Lonien and Schwender, 2009; Alonso et al., 502
2010; Xiong et al., 2010; Alonso et al., 2011)], modeled malic enzyme in soybean provides more 503
carbon for oil (23 to 29% of flux to plastidic pyruvate) than in other developing seeds. Thus 504
systems that take up less glutamine may have alternate roles for anaplerotic reactions that reflect 505
evolved differences in carbon utilization strategies. In our models, soybean has both fluxes for 506
malic enzyme that are comparable to the rate of glutamine uptake and higher ratios of glutamine 507
consumption relative to fatty acid biosynthesis, indicating that both are important for pyruvate-508
derived products (Table VII). Furthermore, an increased demand for nitrogen through 509
aminotransferase reactions will generate organic acids that can serve as sources of carbon, such 510
as malate and citrate. Thus, the transport and cleavage of citrate along with the activities of 511
pyruvate kinase and malic enzyme coordinate both glycolysis and sugar utilization with the 512
uptake of amino acids. 513
Malic enzyme, in combination with pyruvate dehydrogenase, yields acetyl-CoA and two 514
reducing equivalents, which match the stoichiometric demands necessary to sustain fatty acid 515
biosynthesis. Additionally, an increase in production of pyruvate-derived amino acids (valine, 516
isoleucine, lysine and leucine) for protein comes at the expense of oil biosynthesis, but relies less 517
on pyruvate dehydrogenase and utilizes less NADPH. An increase in protein production could be 518
compensated for by malic enzyme activity. However, increased flux through malic enzyme to 519
fatty acids would require an additional supply of ATP and reduce carbon use efficiency by 520
generation of CO2. The calculated carbon conversion efficiencies of 85 to 87% for our C:N 521
models are similar to previous embryo studies (Allen et al., 2009) and consistent with examples 522
of carbon refixation in soybean reproductive tissues (Quebedeaux and Chollet, 1975; Sambo et 523
al., 1977; Satterlee and Koller, 1984; Sugimoto et al., 1987; Willms et al., 1999; Allen et al., 524
2009) and other legumes (Flinn et al., 1977; Furbank et al., 2004). Tissues that limit CO2 escape, 525
such as the seed coat or pod wall, may serve to concentrate inorganic carbon and enhance its 526
refixation via PEPC or RuBisCO, although these carbon recovery mechanisms frequently require 527
additional ATP. To date no studies have considered the combined fluxes through multiple 528
tissues. 529
530

21
CONCLUSION 531
Three metabolic flux models associated with isotopic labeling experiments over diverse 532
carbon and nitrogen conditions demonstrated the plasticity of central carbon metabolism. 533
Maternally provided substrates coordinated with the operation of primary metabolism resulted in 534
production of different oil, protein and carbohydrate concentrations. Changes in protein levels 535
were accommodated by more modest differences in fluxes through metabolic steps. Notably, the 536
fluxes from glutamine to C4 acids and other amino acids generally increased as protein levels 537
increased, indicating the use of additional carbon from glutamine supplied by the media. The 538
increased fluxes from glutamine to C4 acids, amino acids and pyruvate-derived products - such 539
as oil - further imply that sink strength does not limit protein production in soybeans. The 540
elasticity of central carbon metabolism represents a significant impediment to metabolic 541
engineering because the changes needed to achieve biotechnological goals may be subtle. 542
Conversely, this work implies that small changes in multiple enzymatic steps can have a 543
dramatic impact at the phenotypic level, consistent with theories of distributed control of 544
metabolism. 545
546
MATERIALS AND METHODS 547
Labeled Isotopes 548
[U-13C5]-glutamine, [1,2-13C2]-glucose, and [U-13C4]-asparagine were purchased from 549
Sigma (St. Louis, MO). [U-14C6]-glucose and [U-14C5]-glutamine were purchased from Moravek 550
Biochemical (Brea, CA). [U-14C12]-sucrose and [U-14C4]-asparagine were purchased from 551
American Radiolabeled Chemicals (St. Louis, MO). 552
553
Plant Material, Growth and Culturing Conditions 554
Soybean seeds (G. max, cv. Jack) were obtained from the USDA-ARS National Plant 555
Germplasm System (Urbana, IL). Three soybeans were planted in a 1 gallon pot containing 556
Fafard 4M (Fafard, Agawam, MA) and maintained in greenhouse or growth chambers 557
mimicking summer in St. Louis, MO. Pots were thinned to two seedlings after several weeks, 558
and the remaining seeds grown at 25 to 27 ºC/21 to 23 ºC day/night temperature and maintained 559
at >35% humidity. Sunlight was supplemented with additional light (400 to 1000 W/m2) to 560
maintain a 14-hours daylight and 10-h night photoperiod. Plants were watered daily and received 561

22
Jack’s 15-16-17 (JR Peters Inc. Allentown, PA) fertilizer three times a week. Early in the R5 562
reproductive stage of embryo development (i.e. early seed-filling stage), pods were harvested 563
and directly placed on ice. 564
The pods were immediately surface sterilized by washing in 5% bleach followed by 565
sterile water. Embryos (approximately 30 to 40 mg fresh weight and 10 mg dry weight) were 566
removed from pods, dissected from seed coats and transferred to sterile culture media containing 567
150 mM sucrose, 75 mM glucose, 45 mM glutamine and 16 mM asparagine, which represents 568
the carbon and nitrogen sources for the carbon to nitrogen ratio of 21:1. Other carbon:nitrogen 569
ratios were varied as reported in the text. For each labeling experiment, the labeled substrate was 570
provided as 100% of that particular carbon source, i.e., in the case of glutamine labeling, all 571
unlabeled glutamine was supplanted by [U-13C5]-glutamine while other carbon sources remained 572
unlabeled. A modified Linsmaier and Skoog medium (Thompson et al., 1977; Hsu and 573
Obendorf, 1982) was supplied along with Gamborg’s vitamins (Sigma, St. Louis, MO) and 5 574
mM MES buffer adjusted to pH 5.8. The salts and vitamins were identical for all cultures. Each 575
embryo was cultured in a 250 mL Erlenmeyer flask with foam plug for 14 days at approximately 576
30 to 35 µmol m-2 s-1 continuous light at 26 to 27 ºC. At the conclusion of the culturing period, 577
embryos were washed then quickly sliced into pieces, frozen in liquid nitrogen, lyophilized to 578
dryness and stored at -80 ºC until further processing. 579
580
Quantification of Protein, Starch and Lipid 581
Protein was quantified by elemental carbon to nitrogen ratio analysis. The composition of 582
carbon (C) and nitrogen (N) in biomass was determined at Duke Environmental Stable Isotope 583
Laboratory at Duke University by dry combustion using a CE Instruments NC2100 elemental 584
analyzer (ThermoQuest Italia, Milan). From each seed, 2-4 mg of tissue was accurately weighed 585
and combusted at 900 °C in an elemental analyzer in the presence of chemical catalysts to 586
produce CO2 and NOx. The measured nitrogen fraction was converted to protein by 587
multiplication using a factor for all cultures within the initial C:N curve as described in the main 588
text. This multiplication factor is commonly used for reporting protein and therefore appropriate 589
for biological comparisons, however for flux analysis more accurate factors that reflect actual 590
amino acid composition of soybeans were used. Factors of 5.05, 5.30 and 5.55 for the cultured 591
C:N variations of 13:1, 21:1 and 37:1, respectively, were determined experimentally from amino 592

23
acid analysis of molar composition. This calculation assumes an equivalent amount of glutamine 593
to glutamate and of asparagine to aspartate, which is consistent with their prevalence in soybean 594
storage protein amino acid sequences. Amino acid compositional analysis was established by 595
converting amino acids to their Accq-Tag-derivatives (Waters, Milford, MA) and measuring 596
peaks relative to external standards. 597
Amino acid quantification was performed by the Proteomics and Mass Spectrometry 598
Facility within the Donald Danforth Plant Science Center, St. Louis MO. Samples were 599
hydrolyzed for 24 hours at 116 ºC in the presence of 6N HCL containing 0.5% phenol in sealed 600
glass tubes, dried and resuspended in 20 mM HCl (20 microliters). Derivatization with the 601
AccQ-Tag reagent was performed per manufacturer’s instructions (Waters, Milford, MA), 602
including addition of 70 microliters of AccQ-Fluor Borate Buffer and 20 microliters of 603
derivatization reagent to 10 microliters of each sample. Following incubation for one minute at 604
room temp, samples were heated at 55 ºC for ten minutes then separated and identified with 605
standards and quantified by UV detection at 260 nm using reversed-phase UPLC. 606
UPLC was performed using a Waters Acquity Ultra Performance LC with 2996 PDA UV 607
detector. A 9.5 minute UPLC method using Water’s proprietary AccQ-Tag Ultra column 608
(2.1x100 mm) with gradient using 5% proprietary Water’s buffer A in milli-Q water and 100% 609
proprietary Water’s buffer B at a flow rate of 0.7ml/min. The gradient was initiated with 99.9% 610
Buffer A/0.1% Buffer B and held for 0.54 min, Buffer A was decreased to 90.9% in 5.2 min, 611
further decreased to 78.8% in 2 min, then decreased to 40.4% in 0.3 min, held for 0.64 min, and 612
after which the column was regenerated and equilibrated. 613
Lipids were analyzed by transesterification to fatty acid methyl esters (FAMEs) with 614
subsequent quantification using triheptadecanoin internal standard (Li et al., 2006). Briefly, seed 615
biomass of approximately 5-10 mg was weighed and combined with 5% sulfuric acid in 616
methanol prepared directly before use. Butylated hydroxyl-toluene (25 μl of a 0.2% solution in 617
methanol) was added to prevent oxidation. The reactions were incubated at 95 ºC for 2 hours 618
with occasional vortexing. After cooling, 1.5 ml of 0.9% NaCl (w/v) was added. Hexane was 619
used to extract the methyl esters from the reaction liquid. FAMEs were concentrated by nitrogen 620
evaporation and then quantitated by gas chromatography flame ionization detection (GC-FID). 621
Gas chromatography (GC) employed a DB23 column (30 m, 0.25 mm i.d., 0.25 micron film; 622
J&W Scientific, Folsom, CA). The GC was operated in a split mode (40:1) and the flame 623
24
ionization detector temp was 260 ºC with an oven program that ramped from 150 ºC to 240 ºC at 624
a rate of 10 ºC/min followed by a programmed hold time of 5 minutes. Peak area comparison 625
with the internal standard was used for quantification. 626
Starch was quantified enzymatically by measuring spectroscopic glucose absorbance 627
according to the manufacturer’s protocol (Megazyme, Wicklow, Ireland), a modified version of 628
AOAC official method 996.11. Alternatively, biomass that had been extracted for oil and protein 629
measurements was hydrated by incubation in 0.1 M sodium acetate buffer pH 4.8-5.0 at 121 ºC 630
for 1 hour. Amyloglucosidase, amylase, and isomylase were added from a fresh stock solution of 631
10 mg each in 15 ml acetate buffer or using reagents provided by the manufacturer (Megazyme, 632
Wicklow, Ireland). After incubation for 1 hour at 55 ºC, 1 ml of ethanol was added, and enzymes 633
were heat denatured for 15 minutes at 95 ºC. The solution was centrifuged; supernatant removed 634
and extracted twice more with 80% ethanol before spectroscopic measurement. 635
636
SDS-PAGE Analysis 637
Proteins from 2 mg/ml dry weight of cultured soybeans were extracted with 2x Laemmli 638
sample buffer + 5% β-mercaptoethanol and boiled for 15 minutes. Gels were processed either for 639
equivalent amounts of dry weight (25 micrograms) or for equivalent amounts of protein loaded 640
per lane (10 micrograms, as determined by prior total nitrogen analysis of dry material). Samples 641
and SeeBlue_2 molecular weight markers (Invitrogen, Carlsbad, CA) were separated on a 10-642
well, 4-12 % Nu-PAGE gel with MOPS buffer run at 200 V constant for 35 minutes. Protein 643
bands were visualized with Simply Blue coomassie blue stain (Invitrogen) for 2 hours and 644
destained with H2O. Bands were quantified using Genetix Gelpix (Boston, MA) analyzer. 645
646
Radiolabeled Embryo Culturing and Processing 647
Soy embryos were aseptically cultured for 14 days with [U-14C12]-sucrose, [U-14C6]-648
glucose, [U-14C5]-glutamine, and [U-14C4]-asparagine provided in proportional representation of 649
the molar carbon composition of the substrates in media. Embryos were removed from cultures, 650
washed briefly with H2O, quickly sliced into small pieces, frozen with liquid nitrogen, 651
lyophilized and then pulverized into a fine powder with a bead mill (Retsch, Newton, PA) and a 652
4 mm stainless steel ball. Dry powder (10 to 15 mg) was placed into a 2 ml plastic screw cap 653
tube and sequentially extracted using a bead mill and centrifugation at each step. All extractions 654

25
were repeated four times for quantitative recovery, and supernatants were combined unless 655
indicated otherwise. Initially the pellet was extracted with 80% ethanol. The 80% ethanol extract 656
was separated into water and oil phases with the addition of equal volumes of chloroform and 657
water. The oily chloroform phase was later combined with additional oil fractions, including two 658
extractions with hexane:isopropanol:chloroform (2:1:3, v:v:v) followed by two extractions of 659
hexane:isopropanol (v:v). The 80% ethanol fraction was further fractionated to separate 660
unmetabolized neutral sugars, glutamine and asparagine taken up from the media from organic 661
acids, remaining amino acids and solubilized hydrophobic proteins. Cationic, anionic, and 662
neutral fractions were separated by ion exchange chromatography (Yazdi-Samadi et al., 1977) 663
using Dowex 50 and Dowex 1 columns (Sigma, Milwaukee, WI) with HPLC used to inspect the 664
cationic fraction for hydrophobic proteins and amino acids. Protein was extracted with 7.5 M 665
urea, 0.07% β-ME, 10 mM Tris pH 8.1 twice followed by two further extractions excluding the 666
urea; aliquots were combined. The remaining pellet, which represents carbohydrates, was 667
solubilized with ScintiGest (Fisher Scientific, USA) overnight at 50 ºC. Each sample (0.5 ml) 668
was counted by scintillation using Hionic-Fluor (Perkin-Elmer, Waltham, MA). 669
670
GC-MS Analyses of Isotopic Labeling 671
Protein was extracted from biomass using a buffer containing 10 mM Tris pH 8.5, 138 672
mM NaCl, 2.7 mM KCl, 295 mg/L NaEDTA, 700 µL β-mercaptoethanol, 202 mg/L NaAzide 673
and 125 mg/L sodium dodecyl sulfate. Extracts were precipitated by addition of 1/10th volume of 674
50% trichloroacetic acid (w/v) and incubated on ice for 30 minutes. The supernatant was 675
discarded and the pellet carefully washed in 1:1 ethanol:ether. After drying with nitrogen, 676
proteins were hydrolyzed by addition of 6 N HCl in the presence of a nitrogen headspace at 100 677
ºC for 24 hours. HCl was evaporated under a stream of nitrogen. The amino acids were dried and 678
derivatized with N-methyl-N-(tertbutyldimethylsilyl)-trifluoroacetamide (100 μL) in the 679
presence of an equal volume of acetonitrile. The derivatization ensued for 1 hour at 120 ºC, after 680
which an aliquot was analyzed by GC-MS. Accepted fragments for label quantification were 681
based upon standards and previous analyses (Antoniewicz et al., 2007). 682
For fatty acid labeling, dried seed tissue was ground in liquid nitrogen using a mortar and 683
pestle, and a 10-15 mg sample was weighed and homogenized with hexane:isopropanol 2:1 (v:) 684
on a Retsch MM 301 bead mill (Retsch) at a frequency of 3000/min for 5 minutes. After 685

26
centrifugation at 12000 x g, supernatant was decanted and the extraction process repeated three 686
additional times. Pooled extracts were dried and derivatized to butylamides for labeling analysis 687
as previously described (Allen et al., 2007). Briefly, lipids were amidated by reacting at 100 ºC 688
with 2 ml n-butylamine (Sigma) and 3 ml hexane as a co-solvent. Reactions were allowed to 689
proceed several days and quenched with addition of concentrated HCl, resulting in phase 690
partitioning of unreacted butylamine-HCl and amide products. The hexane phase was collected 691
and analyzed by GC-MS as detailed in (Allen et al., 2007) using the same mass spectrometer as 692
for amino acid label evaluation. 693
694
Metabolic Modeling 695
A flux model was built based upon biochemical reaction networks for central carbon 696
metabolism in developing seeds with slight modification of a previous soybean model to account 697
for additional labeling experiments with [U-13C4]-asparagine. Implementation of the isotopomer 698
model that included all carbon rearrangements within reactions, mass conservation of metabolic 699
intermediates, parameter (flux) fitting and statistical and sensitivity analysis were performed 700
using the INCA software platform under development (J.D. Young Vanderbilt University, 701
Nashville, TN, USA) (Young et al., 2008). The INCA software platform is MATLAB-based, 702
utilizing statistical and optimization toolboxes but with additional in-house developed 703
algorithms. Identical to other isotopic labeling-based metabolic flux analysis software, INCA 704
requires provision of: stoichiometric description of the network model, individual experiments 705
that indicate the form of proffered label, mass spectrometer isotopic labeling measurements, and 706
direct flux measurements. INCA can perform Monte Carlo or parameter continuation-based 707
assessment of non-linear confidence intervals and is being developed for further extensions. 708
Flux model values were constrained by a network topology that imposed stoichiometric 709
relationships between molecules and the measured biomass composition of embryos, including 710
protein and oil and the remainder attributed to carbohydrates such as cell wall and starch. 13C 711
isotopic descriptions provided additional constraining information through the fitting process that 712
established the best estimates for fluxes from minimization of the sum of squared differences of 713
all label measurements. Choice of free variables was randomly established through the software 714
and feasible starting points assigned by orthogonal projection of random flux values into the flux 715
solution space (Schuster and Schuster, 1993; Young et al., 2008; Allen et al., 2009). Labeled 716

27
isotopomer measurements and labeled substrates entered into the model were corrected for 717
natural abundance of heteroatoms (i.e. N, O, S, Si) as well as carbon that was not a part of the 718
labeling experiment (i.e. carbon in the derivative; (Lee et al., 1991; Fernandez et al., 1996)). 719
720
Statistical Analysis 721
Each experiment was performed with 5 biological replicates (n=5). For each variant in 722
carbon to nitrogen ratio, three labeling experiments were performed that complement each other, 723
indicating a total of 15 experiments per condition. However, biological replication assesses the 724
precision of measurement but not necessarily biases in processing or instrument measurement 725
that impact measurement accuracy. To assess the accuracy of the measurements, standards of 726
unlabeled metabolites were measured and fragments from GC-MS were chosen accordingly and 727
in agreement with previous descriptions of acceptable measurements from our lab (Allen et al., 728
2009) as well as others (Dauner and Sauer, 2000; Antoniewicz et al., 2007). Model simulations 729
were performed by assigning a minimal 0.25% error for all measurements that had greater 730
precision than this. Confidence intervals are reported for each flux estimate (95%) in accordance 731
with described methods (Antoniewicz et al., 2006). 732
733
SUPPLEMENTAL MATERIAL 734
Supplement I. Changes in protein levels and fatty acid composition 735
Supplement II. Proteomic analysis of soybean storage protein subunits 736
Supplement III. Amino acid concentrations of cultured soybeans 737
Supplement IV. Calculation of 13C-labeling in biomass fractions 738
Supplement V. 13C-labeling measurements 739
Supplement VI. Carbon allocation from glutamine 740
Supplement VII. Metabolic flux maps, values, CI’s and reaction descriptions 741
Supplement VIII. Labeling in C4 dicarboxylic acids 742
Supplement IX. Description of the modeling process 743
Supplement X. Labeling in histidine 744
Supplement XI. Balance of nitrogen 745
746

28
ACKNOWLEDGEMENTS 747
The authors gratefully acknowledge James Gierse for excellent technical help with 748
experiments and the Proteomics and Mass Spectrometry Facility at the Donald Danforth Plant 749
Science Center for amino acid analysis. Any product or trademark mentioned here does not 750
imply a warranty, guarantee or endorsement by the USDA over other suitable products. 751
752
LITERATURE CITED 753
Adams CA, Broman TH, Rinne RW (1982) Use of [3,4-C]glucose to assess in vivo 754
competition for phosphoenolpyruvate between phosphoenolpyruvate carboxylase and 755
pyruvate kinase in developing soybean seeds. Plant and Cell Physiology 23: 959-965 756
Adams CA, Rinne RW (1981) Interactions of phosphoenolpyruvate carboxylase and pyruvic 757
kinase in developing soybean seeds. Plant and Cell Physiology 22: 1011-1021 758
Allen DK, Laclair RW, Ohlrogge JB, Shachar-Hill Y (2012) Isotope labelling of Rubisco 759
subunits provides in vivo information on subcellular biosynthesis and exchange of amino 760
acids between compartments. Plant, Cell & Environment: DOI: 10.1111/j.1365-761
3040.2012.02485.x 762
Allen DK, Libourel IGL, Shachar-Hill Y (2009) Metabolic flux analysis in plants: Coping 763
with complexity. Plant, Cell and Environment 32: 1241-1257 764
Allen DK, Ohlrogge JB, Shachar-Hill Y (2009) The role of light in soybean seed filling 765
metabolism. Plant Journal 58: 220-234 766
Allen DK, Shachar-Hill Y, Ohlrogge JB (2007) Compartment-specific labeling information in 767 13C metabolic flux analysis of plants. Phytochemistry 68: 2197-2210 768
Alonso AP, Goffman FD, Ohlrogge JB, Shachar-Hill Y (2007a) Carbon conversion efficiency 769
and central metabolic fluxes in developing sunflower (Helianthus annuus L.) embryos. 770
Plant Journal 52: 296-308 771
Alonso AP, Raymond P, Hernould M, Rondeau-Mouro C, de Graaf A, Chourey P, Lahaye 772
M, Shachar-Hill Y, Rolin D, Dieuaide-Noubhani M (2007b) A metabolic flux analysis 773
to study the role of sucrose synthase in the regulation of the carbon partitioning in central 774
metabolism in maize root tips. Metabolic Engineering 9: 419-432 775
Alonso AP, Val DL, Shachar-Hill Y (2010) Understanding fatty acid synthesis in developing 776
maize embryos using metabolic flux analysis. Metabolic Engineering 12: 488-497 777
Alonso AP, Val DL, Shachar-Hill Y (2011) Central metabolic fluxes in the endosperm of 778
developing maize seeds and their implications for metabolic engineering. Metabolic 779
Engineering 13: 96-107 780
Andre C, Froehlich JE, Moll MR, Benning C (2007) A heteromeric plastidic pyruvate kinase 781
complex involved in seed oil biosynthesis in Arabidopsis. Plant Cell 19: 2006-2022 782
Antoniewicz MR, Kelleher JK, Stephanopoulos G (2006) Determination of confidence 783
intervals of metabolic fluxes estimated from stable isotope measurements. Metabolic 784
Engineering 8: 324-337 785
Antoniewicz MR, Kelleher JK, Stephanopoulos G (2007) Accurate assessment of amino acid 786
mass isotopomer distributions for metabolic flux analysis. Analytical Chemistry 79: 787
7554-7559 788

29
Bates PD, Durrett TP, Ohlrogge JB, Pollard M (2009) Analysis of acyl fluxes through 789
multiple pathways of triacylglycerol synthesis in developing soybean embryos. Plant 790
Physiology 150: 55-72 791
Baxter CJ, Liu JL, Fernie AR, Sweetlove LJ (2007) Determination of metabolic fluxes in a 792
non-steady-state system. Phytochemistry 68: 2313-2319 793
Berhow MA, Kong SB, Vermillion KE, Duval SM (2006) Complete Quantification of Group 794
A and Group B Soyasaponins in Soybeans. Journal of Agricultural and Food Chemistry 795
54: 2035-2044 796
Buchanan BB (1980) Role of light in the regulation of chloroplast enzymes. Annual Review of 797
Plant Physiology and Plant Molecular Biology 31: 341-374 798
Buchanan BB, Luan S (2005) Redox regulation in the chloroplast thylakoid lumen: a new 799
frontier in photosynthesis research. Journal of Experimental Botany 56: 1439-1447 800
Clemente TE, Cahoon EB (2009) Soybean Oil: Genetic Approaches for Modification of 801
Functionality and Total Content. Plant Physiology 151: 1030-1040 802
Dauner M, Bailey JE, Sauer U (2001) Metabolic flux analysis with a comprehensive 803
isotopomer model in Bacillus subtilis. Biotechnology and Bioengineering 76: 144-156 804
Dauner M, Sauer U (2000) GC-MS analysis of amino acids rapidly provides rich information 805
for isotopomer balancing. Biotechnology Progress 16: 642-649 806
Egli DB (1998) Seed Biology and the Yield of Grain Crops. CAB International, New York 807
Egli DB, Bruening WP (2007) Accumulation of nitrogen and dry matter by soybean seeds with 808
genetic differences in protein concentration. Crop Science 47: 359-366 809
Egli DB, Guffy RD, Meckel LW, Leggett JE (1985) The effect of source sink alterations on 810
soybean seed growth. Annals of Botany 55: 395-402 811
Etxeberria E, Pozueta-Romero J, Gonzalez P (2012) In and out of the plant storage vacuole. 812
Plant Science 190: 52-61 813
Fabre F, Planchon C (2000) Nitrogen nutrition, yield and protein content in soybean. Plant 814
Science 152: 51-58 815
Fernandez CA, Des Rosiers C, Previs SF, David F, Brunengraber H (1996) Correction of 816
13C mass isotopomer distributions for natural stable isotope abundance. Journal of Mass 817
Spectrometry 31: 255-262 818
Flinn AM, Atkins CA, Pate JS (1977) Significance of photosynthetic and respiratory exchanges 819
in carbon economy of developing pea fruit. Plant Physiology 60: 412-418 820
Furbank RT, White R, Palta JA, Turner NC (2004) Internal recycling of respiratory CO2 in 821
pods of chickpea (Cicer arietinum L.): the role of pod wall, seed coat, and embryo. 822
Journal of Experimental Botany 55: 1687-1696 823
Goffman FD, Alonso AP, Schwender J, Shachar-Hill Y, Ohlrogge JB (2005) Light enables a 824
very high efficiency of carbon storage in developing embryos of rapeseed. Plant 825
Physiology 138: 2269-2279 826
Gout E, Bligny R, Pascal N, Douce R (1993) 13C nuclear magnetic resonance studies of malate 827
and citrate synthesis and compartmentation in higher plant cells. Journal of Biological 828
Chemistry 268: 3986-3992 829
Harada JJ, Barker SJ, Goldberg RB (1989) Soybean beta-conglycinin genes are clustered in 830
several DNA regions and are regulated by transcriptional and posttranscriptional 831
processes. The Plant Cell 1: 415-425 832
30
Hayati R, Egli DB, CraftsBrandner SJ (1996) Independence of nitrogen supply and seed 833
growth in soybean: Studies using an in vitro culture system. Journal of Experimental 834
Botany 47: 33-40 835
Hernandez-Sebastia C, Marsolais F, Saravitz C, Israel D, Dewey RE, Huber SC (2005) Free 836
amino acid profiles suggest a possible role for asparagine in the control of storage-837
product accumulation in developing seeds of low- and high-protein soybean lines. Journal 838
of Experimental Botany 56: 1951-1963 839
Hinkle PC (2005) P/O ratios of mitochondrial oxidative phosphorylation. Biochimica Et 840
Biophysica Acta-Bioenergetics 1706: 1-11 841
Hsu FC, Bennett AB, Spanswick RM (1984) Concentrations of sucrose and nitrogenous 842
compounds in the apoplast of developing soybean seed coats and embryos. Plant 843
Physiology 75: 181-186 844
Hsu FC, Obendorf RL (1982) Compositional analysis of in vitro matured soybean seeds. Plant 845
Science Letters 27: 129-135 846
Iyer VV, Sriram G, Fulton DB, Zhou R, Westgate ME, Shanks JV (2008) Metabolic flux 847
maps comparing the effect of temperature on protein and oil biosynthesis in developing 848
soybean cotyledons. Plant Cell and Environment 31: 506-517 849
Junker BH, Lonien J, Heady LE, Rogers A, Schwender J (2007) Parallel determination of 850
enzyme activities and in vivo fluxes in Brassica napus embryos grown on organic or 851
inorganic nitrogen source. Phytochemistry 68: 2232-2242 852
Kim S-L, Berhow MA, Kim J-T, Chi H-Y, Lee S-J, Chung I-M (2006) Evaluation of 853
Soyasaponin, Isoflavone, Protein, Lipid, and Free Sugar Accumulation in Developing 854
Soybean Seeds. Journal of Agricultural and Food Chemistry 54: 10003-10010 855
Kruger NJ, Ratcliffe RG (2009) Insights into plant metabolic networks from steady-state 856
metabolic flux analysis. Biochimie 91: 697-702 857
Lee WNP, Byerley LO, Bergner EA, Edmond J (1991) Mass isotopomer analysis: Theoretical 858
and practical considerations. Biological Mass Spectrometry 20: 451-458 859
Li YH, Beisson F, Pollard M, Ohlrogge J (2006) Oil content of Arabidopsis seeds: The 860
influence of seed anatomy, light and plant-to-plant variation. Phytochemistry 67: 904-915 861
Libourel IGL, Gehan JP, Shachar-Hill Y (2007) Design of substrate label for steady state flux 862
measurements in plant systems using the metabolic network of Brassica napus embryos. 863
Phytochemistry 68: 2211-2221 864
Linka N, Weber APM (2010) Intracellular Metabolite Transporters in Plants. Molecular Plant 865
3: 21-53 866
Lonien J, Schwender J (2009) Analysis of metabolic flux phenotypes for two arabidopsis 867
mutants with severe impairment in seed storage lipid synthesis. Plant Physiology 151: 868
1617-1634 869
Martinoia E, Maeshima M, Neuhaus HE (2007) Vacuolar transporters and their essential role 870
in plant metabolism. Journal of Experimental Botany 58: 83-102 871
Masakapalli SK, le Lay P, Huddleston JE, Pollock NL, Kruger NJ, George Ratcliffe R 872
(2010) Subcellular flux analysis of central metabolism in a heterotrophic Arabidopsis cell 873
suspension using steady-state stable isotope labeling. Plant Physiology 152: 602-619 874
Metallo CM, Walther JL, Stephanopoulos G (2009) Evaluation of 13C isotopic tracers for 875
metabolic flux analysis in mammalian cells. Journal of Biotechnology 144: 167-174 876

31
Mollney M, Wiechert W, Kownatzki D, de Graaf AA (1999) Bidirectional reaction steps in 877
metabolic networks: IV. Optimal design of isotopomer labeling experiments. 878
Biotechnology and Bioengineering 66: 86-103 879
Nakasathien S, Israel DW, Wilson RF, Kwanyuen P (2000) Regulation of seed protein 880
concentration in soybean by supra-optimal nitrogen supply. Crop Science 40: 1277-1284 881
Narvel JM, Fehr WR, Ininda J, Welke GA, Hammond EG, Duvick DN, Cianzio SR (2000) 882
Inheritance of elevated palmitate in soybean seed oil. Crop Science 40: 635-639 883
Nelson DR, Rinne RW (1975) Citrate Cleavage Enzymes from Developing Soybean 884
Cotyledons: Incorporation of Citrate Carbon into Fatty Acids. Plant Physiology 55: 69-72 885
Nelson DR, Rinne RW (1977a) In vivo citrate studies with developing soybean cotyledons. 886
Plant and Cell Physiology 18: 399-404 887
Nelson DR, Rinne RW (1977b) The role of citrate in lipid synthesis in developing soybean 888
cotyledons. Plant and Cell Physiology 18: 1021-1027 889
Obendorf RL, Rytko GT, Byrne MC, Ackah EE (1978) Growth and maturation of soybean 890
seeds in liquid-media. Plant Physiology 61: 35-35 891
Obendorf RL, Timpo EE, Byrne MC, Hsu FC (1979) Culture of immature soybean seeds. 892
Plant Physiology 63: 17-17 893
Obendorf RL, Wettlaufer SH (1984) Precocious germination during in vitro growth of soybean 894
seeds. Plant Physiology 76: 1023-1028 895
Paek NC, Imsande J, Shoemaker RC, Shibles R (1997) Nutritional control of soybean seed 896
storage protein. Crop Science 37: 498-503 897
Pipolo AE, Sinclair TR, Camara GMS (2004) Protein and oil concentration of soybean seed 898
cultured in vitro using nutrient solutions of differing glutamine concentration. Annals of 899
Applied Biology 144: 223-227 900
Quebedeaux B, Chollet R (1975) Growth and development of soybean (Glycine-max [L] merr) 901
pods - CO2 exchange and enzyme studies. Plant Physiology 55: 745-748 902
Rainbird RM, Thorne JH, Hardy RWF (1984) Role of amides, amino-acids, and ureides in 903
the nutrition of developing soybean seeds. Plant Physiol 74: 329-334 904
Rangasamy D, Ratledge C (2000) Genetic enhancement of fatty acid synthesis by targeting rat 905
liver ATP:citrate lyase into plastids of tobacco. Plant Physiol 122: 1231-1238 906
Ratcliffe RG, Shachar-Hill Y (2006) Measuring multiple fluxes through plant metabolic 907
networks. Plant J 45: 490-511 908
Rontein D, Dieuaide-Noubhani M, Dufourc EJ, Raymond P, Rolin D (2002) The metabolic 909
architecture of plant cells - Stability of central metabolism and flexibility of anabolic 910
pathways during the growth cycle of tomato cells. Journal of Biological Chemistry 277: 911
43948-43960 912
Rontein D, Dieuaide-Noubhani M, Dufourc EJ, Raymond P, Rolin D (2002) The metabolic 913
architecture of plant cells. Stability of central metabolism and flexibility of anabolic 914
pathways during the growth cycle of tomato cells. J Biol Chem 277: 43948-43960 915
Rotundo JL, Borrás L, Westgate ME, Orf JH (2009) Relationship between assimilate supply 916
per seed during seed filling and soybean seed composition. Field Crops Research 112: 917
90-96 918
Rotundo JL, Westgate ME (2009) Meta-analysis of environmental effects on soybean seed 919
composition. Field Crops Research 110: 147-156 920
Rubel A, Rinne RW, Canvin DT (1972) Protein, oil, and fatty-acid in developing soybean 921
seeds. Crop Science 12: 739-741 922

32
Ruuska SA, Schwender J, Ohlrogge JB (2004) The capacity of green oilseeds to utilize 923
photosynthesis to drive biosynthetic processes. Plant Physiol 136: 2700-2709 924
Salo-Väänänen PP, Koivistoinen PE (1996) Determination of protein in foods: Comparison of 925
net protein and crude protein (N x 6.25) values. Food Chemistry 57: 27-31 926
Sambo EY, Moorby J, Milthorpe FL (1977) Photosynthesis and respiration of developing 927
soybean pods. Australian Journal of Plant Physiology 4: 713-721 928
Saravitz CH, Raper CD (1995) Responses to sucrose and glutamine by soybean embryos 929
grown in vitro. Physiologia Plantarum 93: 799-805 930
Satterlee LD, Koller HR (1984) Response of soybean fruit respiration to changes in whole plant 931
light and CO2 environment. Crop Science 24: 1007-1010 932
Schuster R, Schuster S (1993) Refined algorithm and computer-program for calculating all 933
nonnegative fluxes admissible in steady-states of biochemical reaction systems with or 934
without some flux rates fixed. Computer Applications in the Biosciences 9: 79-85 935
Schwender J (2008) Metabolic flux analysis as a tool in metabolic engineering of plants. 936
Current Opinion in Biotechnology 19: 131-137 937
Schwender J, Goffman F, Ohlrogge JB, Shachar-Hill Y (2004) Rubisco without the Calvin 938
cycle improves the carbon efficiency of developing green seeds. Nature 432: 779-782 939
Schwender J, Shachar-Hill Y, Ohlrogge JB (2006) Mitochondrial metabolism in developing 940
embryos of Brassica napus. J Biol Chem 281: 34040-34047 941
Schwender J, Shachar-Hill Y, Ohlrogge JB (2006) Mitochondrial metabolism in developing 942
embryos of Brassica napus. Journal of Biological Chemistry 281: 34040-34047 943
Sinclair TS, De Wit CT (1975) Photosynthate and nitrogen requirements for speed production 944
by various crops. Science 189: 565-567 945
Spielbauer G, Margl L, Hannah LC, Romisch W, Ettenhuber C, Bacher A, Gierl A, 946
Eisenreich W, Genschel U (2006) Robustness of central carbohydrate metabolism in 947
developing maize kernels. Phytochemistry 67: 1460-1475 948
Sriram G, Fulton DB, Iyer VV, Peterson JM, Zhou RL, Westgate ME, Spalding MH, 949
Shanks JV (2004) Quantification of compartmented metabolic fluxes in developing 950
soybean embryos by employing Biosynthetic ally directed fractional C-13 labeling, [C-951
13, H-1] two-dimensional nuclear magnetic resonance, and comprehensive isotopomer 952
balancing. Plant Physiology 136: 3043-3057 953
Stephanopoulos G, Aristidou A, Nielsen J (1998) Metabolic engineering: Principles and 954
Methodologies. Academic Press, San Diego 955
Sugimoto T, Tanaka K, Momma M, Saio K (1987) Photosynthetic activity in the developing 956
cotyledon of soybean seeds. Agricultural and Biological Chemistry 51: 1227-1230 957
Sweetlove LJ, Beard KFM, Nunes-Nesi A, Fernie AR, Ratcliffe RG (2010) Not just a circle: 958
Flux modes in the plant TCA cycle. Trends in Plant Science 15: 462-470 959
Sweetlove LJ, Fell D, Fernie AR (2008) Getting to grips with the plant metabolic network. 960
Biochemical Journal 409: 27-41 961
Thompson JF, Madison JT, Muenster AME (1977) In vitro culture of immature cotyledons of 962
soya bean (Glycine-max-L-Merr). Annals of Botany 41: 29-39 963
Thorne JH (1980) Kinetics of photosynthate-C-14 uptake by developing soybean fruit. Plant 964
Physiol 65: 975-979 965
Thorne JH (1981) Morphology and ultrastructure of maternal seed tissues of soybean in relation 966
to the import of photosynthate. Plant Physiology 67: 1016-1025 967
33
Troufflard S, Roscher A, Thomasset B, Barbotin JN, Rawsthorne S, Portais JC (2007) In 968
vivo C-13 NMR determines metabolic fluxes and steady state in, linseed embryos. 969
Phytochemistry 68: 2341-2350 970
Wahrheit J, Nicolae A, Heinzle E (2011) Eukaryotic metabolism: measuring compartment 971
fluxes. Biotechnol J 6: 1071-1085 972
Weber APM, Linka N (2011) Connecting the plastid: Transporters of the plastid envelope and 973
their role in linking plastidial with cytosolic metabolism. In, Vol 62, pp 53-77 974
Wilcox JR (1998) Increasing seed protein in soybean with eight cycles of recurrent selection. 975
Crop Science 38: 1536-1540 976
Wilcox JR, Shibles RM (2001) Interrelationships among seed quality attributes in soybean. 977
Crop Science 41: 11-14 978
Williams TCR, Miguet L, Masakapalli SK, Kruger NJ, Sweetlove LJ, Ratcliffe RG (2008) 979
Metabolic network fluxes in heterotrophic Arabidopsis cells: Stability of the flux 980
distribution under different oxygenation conditions. Plant Physiology 148: 704-718 981
Willms JR, Salon C, Layzell DB (1999) Evidence for light-stimulated fatty acid synthesis in 982
soybean fruit. Plant Physiology 120: 1117-1127 983
Wilson RF (1987) Soybeans: Improvement, Production and Uses. American Society of 984
Agronomy 985
Xiong W, Liu L, Wu C, Yang C, Wu Q (2010) 13C-tracer and gas chromatography-mass 986
spectrometry analyses reveal metabolic flux distribution in the oleaginous microalga 987
Chlorella protothecoides. Plant Physiol 154: 1001-1011 988
Yaklich RW (2001) β-conglycinin and glycinin in high-protein soybean seeds. Journal of 989
Agricultural and Food Chemistry 49: 729-735 990
Yazdi-Samadi B, Rinne RW, Seif RD (1977) Components of developing soybean seeds - oil, 991
protein, sugars, starch, organic-acids, and amino-acids. Agronomy Journal 69: 481-486 992
Young JD, Walther JL, Antoniewicz MR, Yon H, Stephanopoulos G (2008) An Elementary 993
Metabolite Unit (EMU) based method of isotopically nonstationary flux analysis. 994
Biotechnology and Bioengineering 99: 686-699 995
Zamboni N (2011) 13C metabolic flux analysis in complex systems. Current Opinion in 996
Biotechnology 22: 103-108 997
998
999
1000

34
Figure Legends: 1001
1002
Figure 1. Variation in biomass growth and composition of developing soybean embryos 1003
from provision of altered amounts of carbon and nitrogen. The A) amount of biomass 1004
produced and B) the percent of storage in the forms of protein, oil, and starch were measured 1005
across molar carbon to nitrogen ratios (C:N) that varied from 6:1 to 91:1. Each point with error 1006
bars represents 3 to 6 separate culture replicates; in total 184 cultures were examined. 1007
1008
Figure 2. Fluxes to protein-derived amino acids. The protein composition and amino acid 1009
concentrations derived from protein were experimentally determined and used to calculate 1010
metabolic fluxes. A) A sample calculation for carbon to nitrogen ratio for values described. B) 1011
The analysis of ten micrograms total protein by SDS-PAGE. The 48 kD missing band described 1012
in the text is highlighted by an asterisk. C) Analysis of 25 micrograms of biomass. D) Analysis 1013
of equivalent amounts of dry weight over increasing C:N ratios by gel densitometry analysis. E) 1014
Individual amino acid fluxes relative to the production of one milligram of biomass. 1015
1016
Figure 3. Carbon source allocation into amino acid families. Provision of fully labeled 1017
substrates (glutamine or asparagine) resulted in the redistribution of label to amino acids and was 1018
used to establish the source of carbon for each amino acid family. Distribution of label to each 1019
amino acid along with carbon composition and corresponding biosynthetic fluxes were used to 1020
calculate the fractional contributions of different carbon sources to amino acids (see Supplement 1021
IV for details). Amino acids were grouped according to biosynthetic families by averaging. The 1022
results of the 21:1 carbon to nitrogen ratio culture are provided in the upper panel, with the 13:1 1023
and 37:1 C:N ratio that indicated similar trends provided in the table. The contributions of 1024
glutamine carbon to the glutamate, aspartate and pyruvate amino acid families are highlighted by 1025
the shaded regions in the table. 1026
1027
Figure 4. Fatty acid synthesis utilizes glutamine carbon in soybeans. [U-13C5]-labeled 1028
glutamine supplied to filling embryos resulted in pyruvate-derived metabolic products that were 1029 13C-labeled. The average proportion of labeled carbon was measured in the terminal acetate 1030
groups from both fatty acids and pyruvate-derived amino acids. The percentage of carbon labeled 1031
was similar between the two pyruvate-derived compound classes at each C:N ratio. The amount 1032
of incorporated carbon derived from glutamine increases with decreasing C:N ratio. 1033
1034
Figure 5. Metabolic flux maps of developing soybean embryos supplied three different 1035
carbon to nitrogen ratios. The values have units of micromoles of metabolite per mg dry 1036
weight produced. For easy visualization, arrows that are increased in thickness and darkness 1037
emphasize differences in fluxes. Colored numbers indicate the fluxes from the 13:1 (blue), 21:1 1038
(green), and 37:1 (red) C to N ratios. Flux values that changed most significantly are provided in 1039
Table V and a complete list of all fluxes, 95% CIs and a flux map that includes metabolism into 1040
PEP is provided in Supplement VII. Metabolite abbreviations are in CAPS and key enzymes are 1041
provided in italics. 1042
1043
Figure 6. Measured versus fitted data. The experimentally determined mass isotopomers were 1044
compared to the simulated values from metabolic flux analysis for each of the three flux maps. 1045

35
Measurements were in agreement, indicating that gross errors were not present and that the 1046
models were a reasonable description of metabolism. 1047
1048
Figure 7. 13C label in threonine and leucine. [U-13C5]-glutamine was provided to developing 1049
embryos in different amounts to reflect three different C:N ratios (13:1, 21:1, 37:1). The mass 1050
isotopomer distribution in threonine and leucine, which are made from C4 dicarboxylic acids and 1051
acetyl-CoA, are presented. Labeling of all 4 carbons in threonine (i.e. [M+4]+) indicated a 1052
significant amount of labeling in organic acid precursors, such as malate and citrate. Leucine was 1053
labeled in even-weighted mass isotopomers, indicating that these fractions were derived from 1054
acetyl-CoA which was labeled in both carbons. 1055
1056
Figure 8. Alternate pathways for carbon import into plastids for amino and fatty acid 1057
biosynthesis. Development of the optimal model was the result of considering many network 1058
descriptions with the three combined labeling experiments for C:N of 37:1: A) Optimal model as 1059
described in the text; B) Export of malate; C) Export of citrate but with additional 1060
compartmentation of PEP and a hypothetical pyruvate transporter, but without reversible 1061
isocitrate dehydrogenase; D) Optimal model plus inclusion of PEP compartmentation and a 1062
pyruvate transporter (cPYR�PYR is positive flux) which results in overfitting. The table 1063
includes the sum of squared residuals (SSR) of each model and the flux values for 6 key 1064
enzymes along with their CIs in brackets. 1065
1066

Table I. Provision of varied carbon to nitrogen molar ratios in culture medium. Growth and total biomass compositions were determined from (cv.) Jack soybean embryos grown on media supplied with various mM of sucrose, glucose, glutamine and asparagine. An example calculation of the resulting C:N ratio, taking into account carbon coming from supplied amino acids, is shown in Figure 2. Culture compositions in boldface were chosen for 13C-metabolic flux analysis. Other culture parameters are described in “Materials and Methods”.
C:N Ratio
% of Carbon
Supplied as Amino
Acids
Substrate Provided (mM)
Sucrose Glucose Glutamine Asparagine
6 40% 90 45 140 50 13 18% 140 70 83 12 13 18% 140 70 70 25 18 13% 140 70 50 18 19 13% 150 75 50 18 21 11% 150 75 45 16 33 7% 170 85 30 12 37 6% 170 85 25 12 60 4% 200 100 16 10 91 3% 180 90 11 4

Table II. Biomass composition of Jack soybean embryos from altered carbon and nitrogen provision. Protein, oil and starch content were determined (unless indicated otherwise, ND) and percent was calculated as mg/100mg*100. Protein was established by carbon nitrogen analysis, total oil was established with GC-FID, and starch was determined by spectrophotometrically monitoring starch hydrolysis to glucose. Cell wall and soluble metabolites are presumed to represent the remainder of composition. Bold C:N ratios were used in further experiments.
C:N Ratio
Biomass (mg DW/d/embryo)
Doubling Number
Protein (%)
Oil (%)
Starch (%)
6 5.2 ± 0.3 3.4 ± 0.2 47.3 ± 1.2 8.5 ± 0.4 ND 13 6.9 ± 0.9 3.8 ± 0.3 41.2 ± 3.0 12.5 ± 1.4 5.2 ± 0.9 18 6.4 ± 1.2 2.8 ± 0.4 36.2 ± 1.4 13.9 ± 0.7 7.4 ± 1.7 19 7.6 ± 0.6 3.2 ± 0.4 35.8 ± 2.6 ND ND 21 6.6 ± 1.0 3.7 ± 0.6 34.1 ± 3.1 13.1 ± 2.0 6.8 ± 0.9 33 5.8 ± 1.0 3.4 ±0.6 27.4 ± 2.5 13.1 ± 1.9 10.0 ± 1.7 37 7.6 ± 1.6 3.9 ± 0.6 23.8 ± 2.5 13.6 ± 1.8 9.5 ±1.5 60 7.7 ± 0.8 4.2 ± 0.2 16.5 ± 1.6 12.2 ± 2.6 10.3 ± 2.4 91 6.5 ± 0.9 3.8 ± 0.4 14.0 ± 2.1 13.9 ± 0.8 ND

Table III. Fluxes to protein-bound amino acids, acetyl groups and hexose units. The fluxes to amino acids from hydrolyzed protein were determined experimentally by a combination of C:N and amino acid analyses, as described in the methods, and resulted in higher flux values for all amino acids in C:N 13:1. The model fluxes were determined relative to the measured fatty acid fluxes determined per two acetyl units (i.e. four acetyl carbons) and carbohydrates representing the remainder of biomass determined on a per hexose unit basis. All fluxes reported as micromoles metabolite per milligram dry weight.
Metabolite 13 21 37
Flux S.E Flux S.E Flux S.E Alanine 0.24 0.01 0.19 0.01 0.16 0.02 Arginine 0.48 0.02 0.31 0.00 0.14 0.01
Aspartate+Asparagine 0.34 0.04 0.25 0.02 0.22 0.01 Glutamate+Glutamine 0.31 0.02 0.32 0.01 0.25 0.01
Glycine 0.43 0.01 0.33 0.01 0.23 0.01 Histidine 0.13 0.00 0.11 0.00 0.07 0.00 Isoleucine 0.19 0.00 0.16 0.00 0.12 0.00 Leucine 0.29 0.00 0.25 0.00 0.18 0.01 Cysteine 0.07 0.00 0.07 0.00 0.06 0.00 Lysine 0.15 0.01 0.13 0.01 0.12 0.00
Methionine 0.06 0.00 0.08 0.01 0.06 0.01 Phenylalanine 0.27 0.01 0.22 0.01 0.13 0.00
Proline 0.22 0.00 0.18 0.00 0.13 0.00 Serine 0.11 0.02 0.10 0.01 0.06 0.00
Threonine 0.12 0.01 0.11 0.01 0.08 0.00 Tyrosine 0.02 0.01 0.02 0.02 0.01 0.01
Valine 0.24 0.00 0.21 0.00 0.15 0.00 Carbohydrates 2.86 0.11 3.26 0.13 3.86 0.09
Fatty Acids 1.89 0.07 1.97 0.09 2.05 0.12

Table IV. 14C-labeling of embryos cultured with altered concentrations of substrates. Embryos cultured in 14C-labeled substrates were grown for 14 days and then processed (see methods) to assess biomass composition and production. A comparison of the numbers with those measured by other means is provided in Supplement I.
C:N Ratio
Biomass growth
(mg day-1 embryo-1)
Biomass (DPM)
Organic Acids
(DPM)
Protein (DPM)
Oil (DPM)
Carbohydrates (DPM)
13 5.0 ± 1.3 59626 ± 1497 1915 ± 185 27809 ± 2684 9279 ± 513 20623 ± 1791 21 4.8 ± 0.7 57932 ± 6209 2005 ± 198 24324 ± 4217 10523 ± 717 21080 ± 3973 37 5.1 ± 0.4 56942 ± 2918 1955 ± 191 20860 ± 1070 14163 ± 1273 19963 ± 2151

Table V. Net fluxes of pathway intermediates determined through metabolic flux analysis in developing soybean embryos provided three different carbon to nitrogen ratios. Rates are shown in units of micromoles per mg dry weight produced. 95% confidence intervals are shown in brackets. A complete list of all fluxes including exchange fluxes is given in Supplement VI. Abbreviations: PEPC/PEPCK: phosphoenolpyruvate carboxylase/carboxykinase; AAT: asparagine aminotransferase.
Reaction Description
13:1 21:1 37:1
Flux Value
95% Confidence
Interval
Flux
Value
95% Confidence
Interval
Flux
Value
95% Confidence
Interval
PEPC/PEPCK 0.86 [0.75, 0.96] 1.12 [1.02, 1.19] 0.91 [0.80, 1.00] Mitochondrial malic enzyme 0.56 [0.50, 0.62] 0.55 [0.50, 0.61] 0.37 [0.32, 0.42]
Plastidic malic enzyme 1.06 [1.01, 1.11] 1.06 [1.02,1.10] 0.87 [0.81, 0.92] Cytosolic pyruvate kinase 2.04 [1.95, 2.15] 1.97 [1.89, 2.05] 1.77 [1.71, 1.86] Plastidic pyruvate kinase 2.65 [2.54, 2.75] 2.69 [2.60, 2.79] 2.97 [2.86, 3.08]
Glutamate production 2.11 [2.02, 2.20] 1.33 [1.30, 1.67] 0.80 [0.77, 0.88] Glutamate dehydrogenase 3.51 [3.35, 3.67] 2.17 [2.11, 2.54] 1.33 [1.28, 1.42]
Citrate synthase 2.35 [2.22, 2.48] 2.24 [2.14, 2.35] 1.93 [1.86, 2.01] ATP citrate lyase 1.74 [1.67, 1.81] 1.66 [1.58, 1.73] 1.36 [1.29, 1.42]
Isocitrate dehydrogenase 0.57 [0.44, 0.70] 0.49 [0.43, 0.58] 0.52 [0.47, 0.57] 2-oxoglutarate dehydrogenase 1.98 [1.78, 2.16] 1.33 [1.25, 1.45] 1.05 [0.98, 1.12]
Fumarase 2.01 [1.85, 2.18] 1.42 [1.35, 1.52] 1.11 [1.05, 1.17] Threonine aldolase 0.03 [0.02, 0.04] 0.02 [0.01, 0.03] 0.04 [0.03, 0.05] Asparaginase/AAT 0.01 [-0.04, 0.06] 0.17 [0.09, 0.21] 0.24 [0.20, 0.28]
Threonine biosynthesis 0.34 [0.33, 0.36] 0.30 [0.28, 0.31] 0.24 [0.23, 0.25] Carbon dioxide production 10.76 [9.60, 11.94] 8.84 [8.12, 9.69] 8.37 [7.48, 9.38]
Isocitrate lyase 0.03 [0.00, 0.08] 0.10 [0.07, 0.12] 0.06 [0.04, 0.08] Glyoxylate-glycine transaminase 0.01 [-0.08, 0.03] 0.01 [-0.06, 0.02] 0.00 [-0.09, 0.01]
Malate synthase 0.02 [0.00, 0.12] 0.09 [0.06, 0.15] 0.05 [0.03, 0.14]

Table VI. Additional labeling experiments affect flux sensitivity. Fluxes were determined through the combination of one, two or three labeling experiments. The 95% confidence intervals (CIs) were calculated from the flux values using a parameter continuation method described elsewhere (Antoniewicz et. al 2006). The CIs were then compared to the value of their corresponding flux. The number of net fluxes that have CIs that are smaller than the magnitude of the flux are presented along with the sum of squared residuals and degrees of freedom (i.e. overdetermination). All simulations were based upon the presented model (90 fluxes including 70 net fluxes and 20 exchange fluxes) and using measurements from C:N 21:1. Nineteen net fluxes, though not constrained, represent fluxes to biomass (e.g. amino acid biosynthetic fluxes to protein) and therefore have smaller measured errors and are established regardless of labeling. Therefore, the number of highly confident fluxes calculated minus the nineteen biosynthetic fluxes are shown in parenthesis. The number of fluxes determined with high confidence increases with the number of labeling experiments and the degrees of freedom.
Simulated Experiments Simulation Results (90 fluxes)
[1,2-13C]-glucose
[U-13C]-glutamine
[U-13C]-asparagine
Degrees of Freedom
SSR # of Fluxes
with 95% CI < flux value
X X X 252 221 60 (41) X X 157 163 56 (37) X X 157 151 55 (36)
X X 157 71 53 (34) X 62 106 50 (31) X 62 26 33 (14)
X 62 19.5 32 (13)
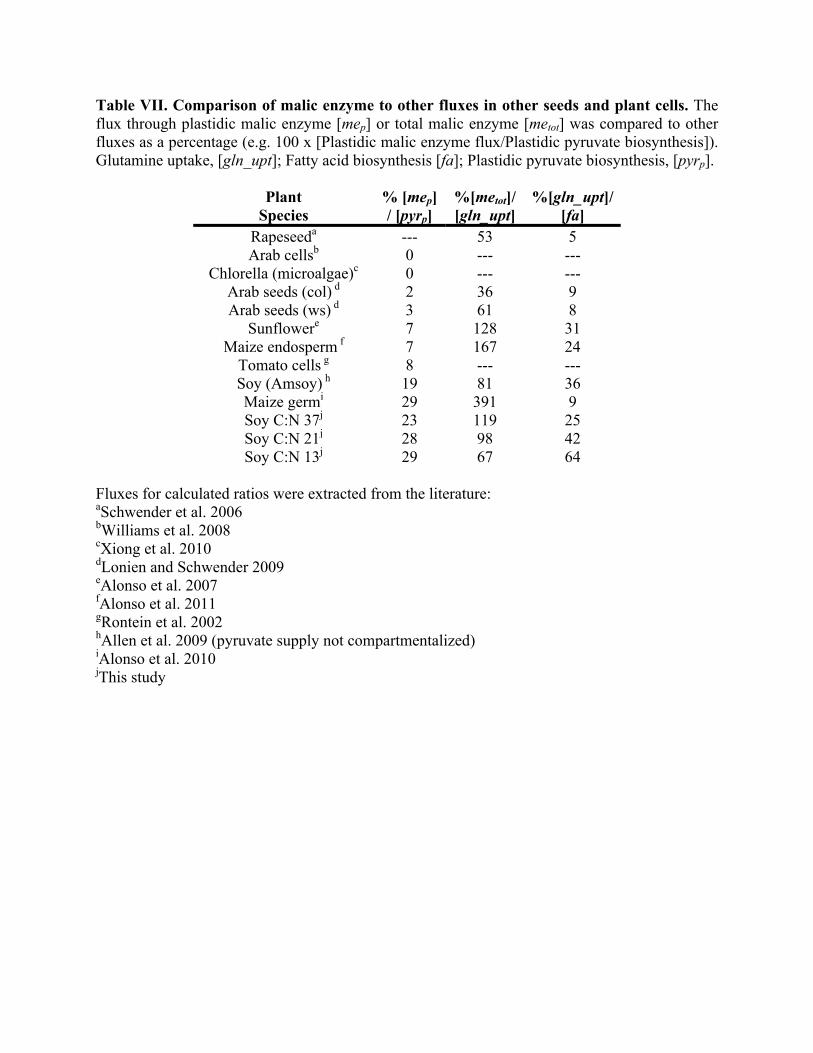
Table VII. Comparison of malic enzyme to other fluxes in other seeds and plant cells. The flux through plastidic malic enzyme [mep] or total malic enzyme [metot] was compared to other fluxes as a percentage (e.g. 100 x [Plastidic malic enzyme flux/Plastidic pyruvate biosynthesis]). Glutamine uptake, [gln_upt]; Fatty acid biosynthesis [fa]; Plastidic pyruvate biosynthesis, [pyrp].
Plant Species
% [mep] / [pyrp]
%[metot]/ [gln_upt]
%[gln_upt]/ [fa]
Rapeseeda --- 53 5 Arab cellsb 0 --- ---
Chlorella (microalgae)c 0 --- --- Arab seeds (col) d 2 36 9 Arab seeds (ws) d 3 61 8
Sunflowere 7 128 31 Maize endosperm f 7 167 24
Tomato cells g 8 --- --- Soy (Amsoy) h 19 81 36 Maize germi 29 391 9 Soy C:N 37j 23 119 25 Soy C:N 21j 28 98 42 Soy C:N 13j 29 67 64
Fluxes for calculated ratios were extracted from the literature: aSchwender et al. 2006 bWilliams et al. 2008 cXiong et al. 2010 dLonien and Schwender 2009 eAlonso et al. 2007 fAlonso et al. 2011 gRontein et al. 2002 hAllen et al. 2009 (pyruvate supply not compartmentalized) iAlonso et al. 2010 jThis study

Figure 1. Variation in biomass growth and composition of developing soybean embryos from provision of altered amounts of carbon and nitrogen. The A) amount of biomass produced and B) the percent of storage in the forms of protein, oil, and starch were measured across molar carbon to nitrogen ratios (C:N) that varied from 6:1 to 91:1. Each point with error bars represents 3 to 6 separate culture replicates; in total 184 cultures were examined.

Figure 2. Fluxes to protein-derived amino acids. The protein composition and amino acid concentrations derived from protein were experimentally determined and used to calculate metabolic fluxes. A) A sample calculation for carbon to nitrogen ratio for values described. B) The analysis of ten micrograms total protein by SDS-PAGE. The 48 kD missing band described in the text is highlighted by an asterisk. C) Analysis of 25 micrograms of biomass. D) Analysis of equivalent amounts of dry weight over increasing C:N ratios by gel densitometry analysis. E) Individual amino acid fluxes relative to the production of one milligram of biomass.
*

Amino Acid Family
Source of Carbon Glutamine Asparagine Sugar
C:N 13:1 Triose/Pentose
Phosphate 4 1 95
Glutamate 87 2 12 Aspartate 44 15 41 Pyruvate 24 2 75
C:N 21:1 Triose/Pentose
Phosphate 3 1 96
Glutamate 79 3 18 Aspartate 33 18 49 Pyruvate 18 4 78
C:N 37:1 Triose/Pentose
Phosphate 3 2 95
Glutamate 71 4 25 Aspartate 26 22 52 Pyruvate 13 5 82
Figure 3. Carbon source allocation into amino acid families. Provision of fully labeled substrates (glutamine or asparagine) resulted in the redistribution of label to amino acids and was used to establish the source of carbon for each amino acid family. Distribution of label to each amino acid along with carbon composition and corresponding biosynthetic fluxes were used to calculate the fractional contributions of different carbon sources to amino acids (see Supplement IV for details). Amino acids were grouped according to biosynthetic families by averaging. The

results of the 21:1 carbon to nitrogen ratio culture are provided in the upper panel, with the 13:1 and 37:1 C:N ratio that indicated similar trends provided in the table. The contributions of glutamine carbon to the glutamate, aspartate and pyruvate amino acid families are highlighted by the shaded regions in the table.

Figure 4. Fatty acid synthesis utilizes glutamine carbon in soybeans. [U-13C5]-labeled glutamine supplied to filling embryos resulted in pyruvate-derived metabolic products that were 13C-labeled. The average proportion of labeled carbon was measured in the terminal acetate groups from both fatty acids and pyruvate-derived amino acids. The percentage of carbon labeled was similar between the two pyruvate-derived compound classes at each C:N ratio. The amount of incorporated carbon derived from glutamine increases with decreasing C:N ratio.

Figure 5. Metabolic flux maps of developing soybean embryos supplied three different carbon to nitrogen ratios. The values have units of micromoles of metabolite per mg dry weight produced. For easy visualization, arrows that are increased in thickness and darkness emphasize differences in fluxes. Colored numbers indicate the fluxes from the 13:1 (blue), 21:1 (green), and 37:1 (red) C to N ratios. Flux values that changed most significantly are provided in Table V and a complete list of all fluxes, 95% CIs and a flux map that includes metabolism into PEP is provided in Supplement VII. Metabolite abbreviations are in CAPS and key enzymes are provided in italics.

Figure 6. Measured versus fitted data. The experimentally determined mass isotopomers were compared to the simulated values from metabolic flux analysis for each of the three flux maps. Measurements were in agreement, indicating that gross errors were not present and that the models were a reasonable description of metabolism.

Figure 7. 13C label in threonine and leucine. [U-13C5]-glutamine was provided to developing embryos in different amounts to reflect three different C:N ratios (13:1, 21:1, 37:1). The mass isotopomer distribution in threonine and leucine, which are made from C4 dicarboxylic acids and acetyl-CoA, are presented. Labeling of all 4 carbons in threonine (i.e. [M+4]+) indicated a significant amount of labeling in organic acid precursors, such as malate and citrate. Leucine was labeled in even-weighted mass isotopomers, indicating that these fractions were derived from acetyl-CoA which was labeled in both carbons.

Model A B C D Model SSR 209 335 275 171*
CitSyn 1.93 [1.86, 2.01] 0.60 [0.57, 0.62] 1.18 [1.03, 2.56] 1.99 [1.60, 2.19] ME 0.87 [0.81, 0.92] 1.13 [1.04, 1.22] 0.00 [0.00, 1.36] 0.92 [0.51, 1.11]
CitLys 1.36 [1.29, 1.42] --- 0.53 [0.40, 0.55] 1.39 [0.98, 1.59] pPYRt --- --- 2.60 [0.00, 3.15] -0.08 [-1.06, 2.75]
cPK 1.77 [1.71, 1.86] 0.73 [0.68, 0.77] 3.93 [3.57, 4.39] 2.09 [1.30, 4.54] pPK 2.97 [2.86, 3.08] 4.06 [3.97, 4.16] 2.07 [1.62, 2.43] 2.96 [0.94, 3.57]
* Model D may be overparameterized and the plastidic pyruvate transporter (pPYRt) is statistically carrying a flux of zero indicating its limited contribution to metabolism whereas other fluxes are approximately the same as in the optimal model A that does not contain this transporter. Figure 8. Alternate pathways for carbon import into plastids for amino and fatty acid biosynthesis. Development of the optimal model was the result of considering many network descriptions with the three combined labeling experiments for C:N of 37:1: A) Optimal model as described in the text; B) Export of malate; C) Export of citrate but with additional compartmentation of PEP and a hypothetical pyruvate transporter, but without reversible isocitrate dehydrogenase; D) Optimal model plus inclusion of PEP compartmentation and a pyruvate transporter (cPYRPYR is positive flux) which results in overfitting. The table includes the sum of squared residuals (SSR) of each model and the flux values for 6 key enzymes along with their CIs in brackets.