Embed Size (px)
Citation preview
Required Report - public distributionDate: 03/26/2004
GAIN Report Number: RS4304RS3316Russian FederationHRI Food Service SectorReport2004
Approved by:Jeffrey Hesse, ATO DirectorU.S. Embassy MoscowPrepared by:Qualitel Data Services, ATO Staff
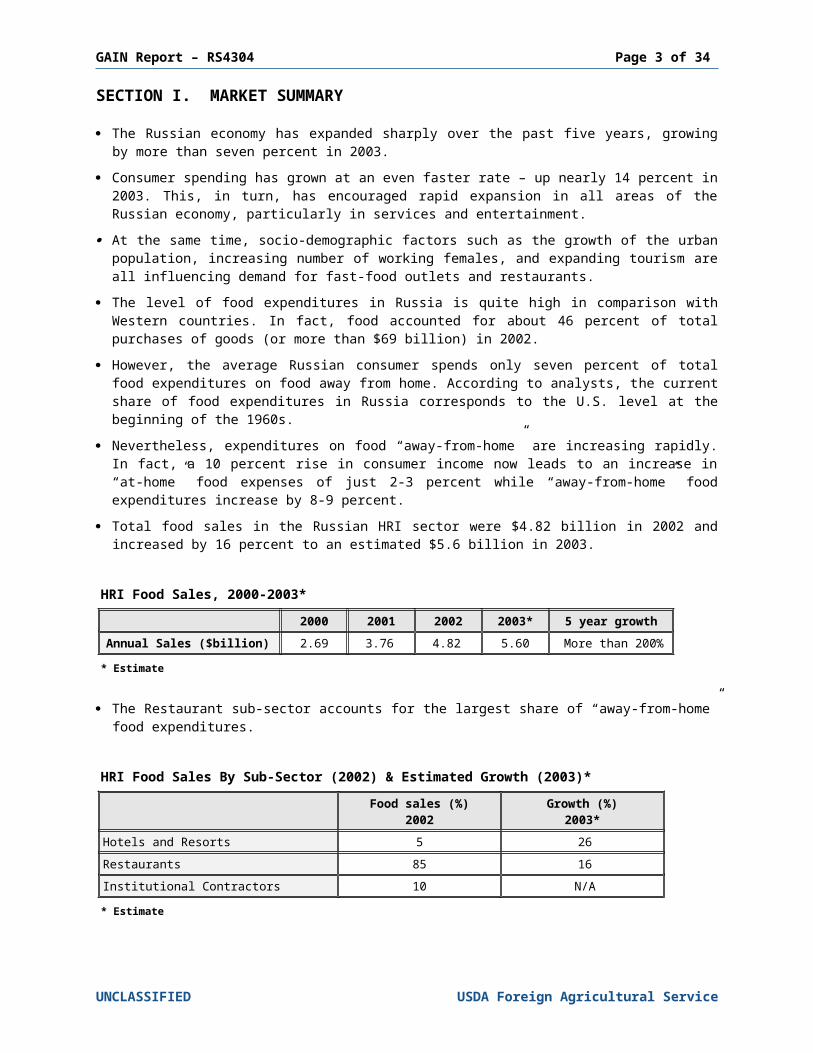
Report Highlights:Sharp increases in consumer incomes and expanding tourism are creating a boom in Russia’s HRI sector, with total sales in 2002 up by 28 percent. However, further expansion is expected as the average Russian consumer spends only seven percent of total food expenditures on meals away from home. Buoyed by the growth in the HRI sector, imports of consumer-oriented food products also increased sharply in 2002 – up 21 percent to $5.6 billion. Growing consumer demand and favorable changes in Euro/Dollar and Ruble/Dollar exchange rates are creating opportunities for a wide range of U.S. food and beverage products.
Includes PSD Changes: NoIncludes Trade Matrix: No
Annual ReportMoscow ATO [RS4]
[RS]
USDA Foreign Agricultural Service
GAIN ReportGlobal Agriculture Information Network
Template Version 2.09

GAIN Report – RS4304 Page 2 of 27
TABLE OF CONTENTSSECTION I. MARKET SUMMARY...........................................................................3
HRI SUB-SECTORS................................................................................................................4Restaurants.......................................................................................................................4Hotels and Resorts............................................................................................................4Institutional.......................................................................................................................5
ADVANTAGES AND CHALLENGES FOR U.S. PRODUCTS IN RUSSIA.........................................6SECTION II. ROAD MAP FOR MARKET ENTRY........................................................6
A. ENTRY STRATEGY..............................................................................................................6B. MARKET STRUCTURE........................................................................................................8
Restaurants.......................................................................................................................8Fast Food.........................................................................................................................10Hotels and Resorts..........................................................................................................11Large Chain Restaurants.................................................................................................12Products Used/Supply Sources For Selected Restaurant Chains.......................................13Coffee Shop Chains In Russia..........................................................................................14High Category Hotels......................................................................................................15Major Suppliers of Food Products For Restaurants...........................................................16
SECTION III. COMPETITION...............................................................................17Russian Imports of Selected Food, 2000-2002.................................................................17Import Competition for Selected Products.......................................................................18
SECTION IV. BEST PRODUCT PROSPECTS...........................................................19A. Products Present in the Market Which Have Good Sales Potential...................................19B. Products Not Present in Significant Quantities but With Good Sales Potential.................19
V. POST CONTACT AND FURTHER INFORMATION.................................................20CONTACT INFORMATION FOR FAS OFFICES IN RUSSIA AND THE U.S...................................20USDA/FAS AND ATO PROGRAMS AND SERVICES..................................................................21OTHER MARKET REPORTS...................................................................................................21OTHER USEFUL CONTACTS.................................................................................................22TRADE SHOWS IN RUSSIA...................................................................................................23
VI. APPENDIX..................................................................................................24GENERAL ECONOMIC AND DEMOGRAPHIC DATA.................................................................24
Demographic Trends.......................................................................................................24GDP Trends......................................................................................................................24
HOTELS IN MOSCOW..........................................................................................................24TOURISM............................................................................................................................25“CATERING” TO TOURISTS..................................................................................................25CULTURE AND FOOD: TRENDS AND TRADITIONS................................................................26CUISINES: TRENDS AND TRADITIONS..................................................................................26“HEALTHY” EATING.............................................................................................................27
UNCLASSIFIED USDA Foreign Agricultural Service
GAIN Report – RS4304 Page 3 of 27
SECTION I. MARKET SUMMARY The Russian economy has expanded sharply over the past five years, growing by more
than seven percent in 2003. Consumer spending has grown at an even faster rate – up nearly 14 percent in 2003. This,
in turn, has encouraged rapid expansion in all areas of the Russian economy, particularly in services and entertainment.
At the same time, socio-demographic factors such as the growth of the urban population, increasing number of working females, and expanding tourism are all influencing demand for fast-food outlets and restaurants.
The level of food expenditures in Russia is quite high in comparison with Western countries. In fact, food accounted for about 46 percent of total purchases of goods (or more than $69 billion) in 2002.
However, the average Russian consumer spends only seven percent of total food expenditures on food away from home. According to analysts, the current share of food expenditures in Russia corresponds to the U.S. level at the beginning of the 1960s.
Nevertheless, expenditures on food “away-from-home” are increasing rapidly. In fact, a 10 percent rise in consumer income now leads to an increase in “at-home” food expenses of just 2-3 percent while “away-from-home” food expenditures increase by 8-9 percent.
Total food sales in the Russian HRI sector were $4.82 billion in 2002 and increased by 16 percent to an estimated $5.6 billion in 2003.
HRI Food Sales, 2000-2003*2000 2001 2002 2003* 5 year growth
Annual Sales ($billion) 2.69 3.76 4.82 5.60 More than 200%* Estimate
The Restaurant sub-sector accounts for the largest share of “away-from-home” food expenditures.
HRI Food Sales By Sub-Sector (2002) & Estimated Growth (2003)*Food sales (%)
2002Growth (%)
2003*Hotels and Resorts 5 26Restaurants 85 16Institutional Contractors 10 N/A* Estimate
The 1998 economic crisis and ruble devaluation led to a sharp reduction of market share for imported food and beverage products as consumers were forced to substitute with cheaper local goods. However, rising consumer incomes in the past several years have helped push the overall market share for imported food products to 34 percent.
UNCLASSIFIED USDA Foreign Agricultural Service

GAIN Report – RS4304 Page 4 of 27
HRI SUB-SECTORS
Restaurants Moscow and St. Petersburg account for the major share of the restaurant market in Russia.
As for the other regions, the level of development in the restaurant sub-sector varies widely. For those regions with economies based on oil, gas or other natural resources, higher consumer incomes attract a higher level of food service.
At present, the number of cafes, restaurants and other food outlets in Russia lags well behind Western standards. For example, while there are more than 14,000 restaurants in Paris and more than 17,000 restaurants in New York, the number of restaurants in Moscow totals only about 3,500 according to the Moscow Guild of Restaurant Owners.
The Russian restaurant market consists of several market niches, each of which is different in terms of total food sales and the number of “players”:
Fast food, which is divided into two separate segments: street/mobile fast-food (kiosks, stalls, carts, etc.) and walk-in/sit-down fast-food outlets
“Democratic” restaurants – moderately priced outlets “Boutique” restaurants – higher priced/exclusive outlets Coffee shops
While official statistics do not draw a distinction between fast food and “democratic” (moderately priced) restaurants, the following table provides an approximate distribution by segment based on a combination of official statistics and the expert opinions of market participants.
Distribution Of Restaurants By Sub-CategoryMoscow Russia
Shareof total outlets (2002)
-%-
Sales(2002)
-$Million-
Growth (2003)*
-%-
Shareof total outlets (2002)
-%-
Sales(2002)
-$Million-
Growth (2003)*
-%-
Fast food 50 480 15 40 1,000 10-12Democratic Restaurants 15 360 40 15 1,500 30Luxury Restaurants 4 ~200 7 2 500 5Coffee Shops 4 20 63 2 40 40Others 37 ~140 - 41 ~1,060 -Total 100 ~1,200 40 100 ~4,100 16-17
*EstimateSource: All-Russian Congress of Restaurateurs and Food Service Leaders; Consumers' Market and Services Department (Moscow City Government); and expert opinions.
Hotels and Resorts According to the Russian State Statistics Committee (Goskomstat), the total turnover for
the Hotel/Resort sub-sector was $1.2 billion in 2002, an increase of 26 percent in comparison with 2001. Moscow hotels accounted for more than 42 percent of the total turnover and 19 percent of the total number of rooms. St. Petersburg hotels accounted for almost 16 percent of the turnover and eight percent of the number of rooms. Hotels that cater to foreign guests appear to be most successful against the general background.
UNCLASSIFIED USDA Foreign Agricultural Service

GAIN Report – RS4304 Page 5 of 27
The Moscow and St. Petersburg markets draw 80 percent of foreign tourists. These markets are also characterized by a high level of business activity (especially in Moscow), the presence of more high-class hotels, and a developed tourist infrastructure (museums, transport, guides, restaurants and so on). However, the hotel business is beginning to develop in the regions, too. In fact, the Moscow/St. Petersburg market share has decreased by more than 10 percent.
The total number of hotels in Russia is estimated at 4,300. The total number of rooms is about 188,000. Despite Moscow’s developed tourist infrastructure, the number of rooms does not match European standards: there are 3-4 hotel rooms per 1000 people in Moscow versus 10-12 rooms in other European capitals.
On average, the breakdown of hotel income is as follows: room rentals – 70 percent; services – 10 percent; and food and beverages – 20 percent. On this basis, food and beverage sales in the hotel sub-sector were an estimated $240 million in 2002.
Institutional
Schools, Universities, Public companies, Hospitals
At present, the level of development for this sub-sector in Russia is significantly lower in comparison with many countries. This segment forms a very small part of the total food service market in Russia and holds relatively little interest for U.S. exporters of food and beverage products.
Transportation Services
Transportation food service generally cannot be considered a strategic market niche for U.S. food products. However, there may be some potential due to the sheer volume of public transport in Russia. The Russian Federation territory is large, and Russians most often travel by train (1.3 billion passengers in 2002).Railroad
Railroad transport is the primary (and, in some cases, only) mode of transportation for most consumers. In fact, the Russian railway system accounts for about 80% of the total transportation volume in Russia.
However, according to the Ministry of Communication, the Russian railway transport system has only 650 dining cars and 200 buffet cars. Further, the cost of a ticket for a “high-convenience” passenger car (there are 450 such cars in Russia) includes an “onboard” meal. The standard set includes coffee, carbonated water, bread, meat, cheese, yogurt, confectionery and in some cases – a hot dish.
The annual volume of the meal market (“onboard” and “restaurant”) in railway transport is about $60 million.
Airlines
Airline passenger turnover was about 28 million persons in 2002, and the volume is increasing rapidly.
While there is increasing demand for services that match international quality standards, most local catering companies cannot meet the requirements of international airlines. The kitchens of the “Sheremet’evo” (Moscow), “Domodedovo” (Moscow) and “Pulkovo” (St. Petersburg) airports are the exception to this rule because they were created in cooperation with western companies.
UNCLASSIFIED USDA Foreign Agricultural Service

GAIN Report – RS4304 Page 6 of 27
With the increasing demand for quality, air transportation food service can become an attractive market niche for U.S. food and beverage exporters.
ADVANTAGES AND CHALLENGES FOR U.S. PRODUCTS IN RUSSIA
Advantages ChallengesRising consumer incomes and changes in consumption culture are creating new opportunities as consumers look for better quality and more consistency
Difficult delivery: long shipping times from the U.S.; complex customs regulations; internal transport problems
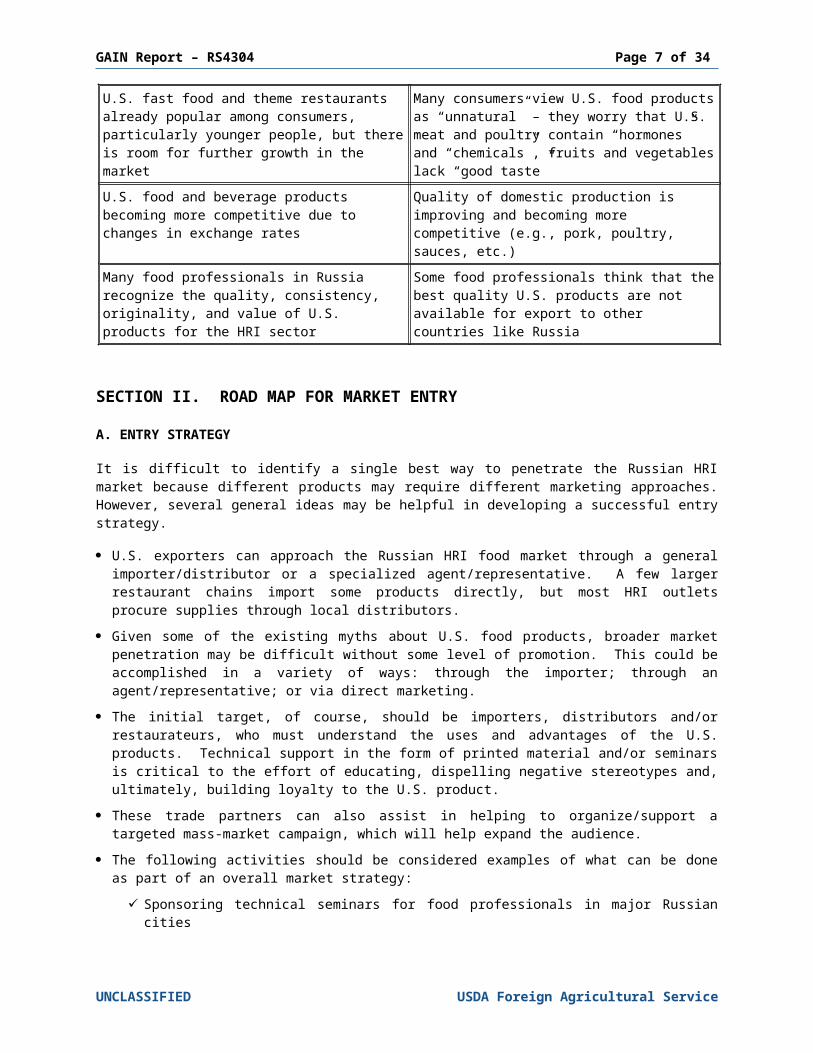
U.S. fast food and theme restaurants already popular among consumers, particularly younger people, but there is room for further growth in the market
Many consumers view U.S. food products as “unnatural” – they worry that U.S. meat and poultry contain “hormones” and “chemicals”, fruits and vegetables lack “good taste”
U.S. food and beverage products becoming more competitive due to changes in exchange rates
Quality of domestic production is improving and becoming more competitive (e.g., pork, poultry, sauces, etc.)
Many food professionals in Russia recognize the quality, consistency, originality, and value of U.S. products for the HRI sector
Some food professionals think that the best quality U.S. products are not available for export to other countries like Russia
SECTION II. ROAD MAP FOR MARKET ENTRYA. ENTRY STRATEGY
It is difficult to identify a single best way to penetrate the Russian HRI market because different products may require different marketing approaches. However, several general ideas may be helpful in developing a successful entry strategy. U.S. exporters can approach the Russian HRI food market through a general
importer/distributor or a specialized agent/representative. A few larger restaurant chains import some products directly, but most HRI outlets procure supplies through local distributors.
Given some of the existing myths about U.S. food products, broader market penetration may be difficult without some level of promotion. This could be accomplished in a variety of ways: through the importer; through an agent/representative; or via direct marketing.
The initial target, of course, should be importers, distributors and/or restaurateurs, who must understand the uses and advantages of the U.S. products. Technical support in the form of printed material and/or seminars is critical to the effort of educating, dispelling negative stereotypes and, ultimately, building loyalty to the U.S. product.
These trade partners can also assist in helping to organize/support a targeted mass-market campaign, which will help expand the audience.
The following activities should be considered examples of what can be done as part of an overall market strategy:
Sponsoring technical seminars for food professionals in major Russian cities Participating in seminars connected with major food exhibitions/trade shows Sponsoring technical/training missions to the U.S. for Russian food professionals
UNCLASSIFIED USDA Foreign Agricultural Service
GAIN Report – RS4304 Page 7 of 27
Participating in or co-sponsoring other activities conducted by U.S. industry or state/regional associations (i.e., U.S. Meat Export Federation, Almond Board of California, etc.) and/or the U.S. Agricultural Trade Office in Moscow
It may be necessary to develop a different strategic approach for each segment of the food service sector. For example: high-category restaurants and “democratic” restaurants will likely require different marketing/promotional tactics.
It is interesting to note that some buyers/chefs of the high-category restaurant segment think that American products of the best quality do not enter the export channel. For example: participants in a master class sponsored by the U.S. Meat Export Federation were pleased with the quality of the U.S. pork used but were surprised to learn that such product is readily available in the Russian market. This example highlights the need for further trade servicing and technical support.
Close contact with importers is also important to avoid logistical problems and shipping delays. Given the longer shipping time for U.S. products compared to products from Europe, it is essential that orders be filled as quickly and efficiently as possible.
Distribution Channels for Food Service Sector
Overall, imported food products account for a large percentage of ingredients used in the restaurant business (as much as 60 percent depending on the segment).
However, many consumers are convinced that local products are fresher, healthier, etc. In response, some restaurant owners now claim to use only domestic ingredients. Ironically, many local products do not maintain the necessary level or consistency of quality, which is typically one of the most important factors cited by consumers in dining decisions.
Most ingredient purchases are made through distributors/intermediaries, who number in the hundreds at present. However, large restaurants and chains prefer to work with the larger suppliers, who typically are also importers.
Restaurants can also purchase directly from local producers, primarily vegetables and fruit during the summer season. In addition, meat cuisine restaurants of the low-to-middle price level prefer to buy meat directly from domestic producers.
UNCLASSIFIED USDA Foreign Agricultural Service
ImportersWholesalers/ distributors
Restaurants
Consumers
Domestic producers
Foreign producers /
Foreign Exporters

GAIN Report – RS4304 Page 8 of 27
For exclusive and/or exotic products (e.g., sushi ingredients) the restaurants most often contact foreign producers directly.
At the same time, some restaurant chains import products directly through their own trading arm, which considerably reduces the cost of production.
B. MARKET STRUCTURE
Restaurants Russian/Ukrainian, Italian and Eastern cuisines are the most popular at present. (Please see
the APPENDIX, CUISINES: TRADITIONS AND TRENDS for more information.) As noted earlier, the restaurant business in Russia now covers several market segments:
fast food outlets; democratic (moderately-priced) restaurants; haute cuisine or exclusive restaurants; and coffee houses.
Fast food outlets, democratic restaurants and coffee houses are currently the most popular and the fastest growing. According to industry forecasts, the share of democratic restaurants will continue to grow, while the market share for restaurants of high category or haute cuisine will diminish.
In addition, catering services are now developing quickly, particularly in Moscow and in St. Petersburg.
“Democratic” Restaurants
This is one of the fastest growing segments of the restaurant market and offers the best prospects for U.S. products. Growth is this sector also provides many opportunities for investors and franchisers.
The dominant players in this segment currently are the “Rosinter” group restaurants (“TGIFriday”, “American Bar & Grill”, “Sushi Planet”, “Patio-Pizza”, etc.) Also included in this category are the inexpensive Japanese restaurants of the “Vesta-Center International” group (“Yakitoria” and “Gin-no-taki”), and the “Romashka Management” theme projects (“Shesh-Besh”, “Molly Gwinn”, and others).
Some of the leading haute cuisine restaurateurs have also entered the “democratic” segment: “Arkadiy Novikov” (“Yolki-Palki” chain); “Dellos” (“Moo-Moo” restaurants); “Bardeev” (“Starlight Diner” chain).
The customer base for this market segment far exceeds that of the haute cuisine restaurants. Before the appearance of the “Sushi Planet” and “Yakitoria” restaurants, sushi was considered a delicacy and was served in only a few expensive restaurants. Likewise, before the opening of “Patio-Pizza” and others like it, Italian food of similar quality was available only at some expensive Italian “boutique” restaurants.
Traditional brazier-style cuisine, which was a specialty of the former (and expensive) “Tamerlan” restaurant, is now abundantly and inexpensively replicated by the “Yolki-Palki” chain.
UNCLASSIFIED USDA Foreign Agricultural Service

GAIN Report – RS4304 Page 9 of 27
Steak Houses and American Cuisine Restaurants
Although meat dishes are a staple of almost every Russian restaurant, U.S.-style steak houses aren’t yet widespread. Market analysts attribute this to the fact that in Russia most of these restaurants were established only at the high end (average bill of about $50).
“Traditional” meat restaurants in Russia work in various formats: meat courses account for more than 50 percent of the turnover in restaurants with Caucasus, Middle-Asian and Russian cuisines. However, classic steak houses occupy a relatively small part of the market. According to the “Rosinter Restaurants” group, American cuisine restaurants account for only about 3-4 percent of the Moscow market. These restaurants also represent a major part of the steak business.
While steak house and American cuisine restaurants do not represent a high growth segment at this point, there appears to be good potential for future growth. The "TGIFriday’s” and “American Bar and Grill” chains operated by the “Rosinter Restaurants” group, with 60,000 visitors per year, currently account for the lion’s share of this segment.
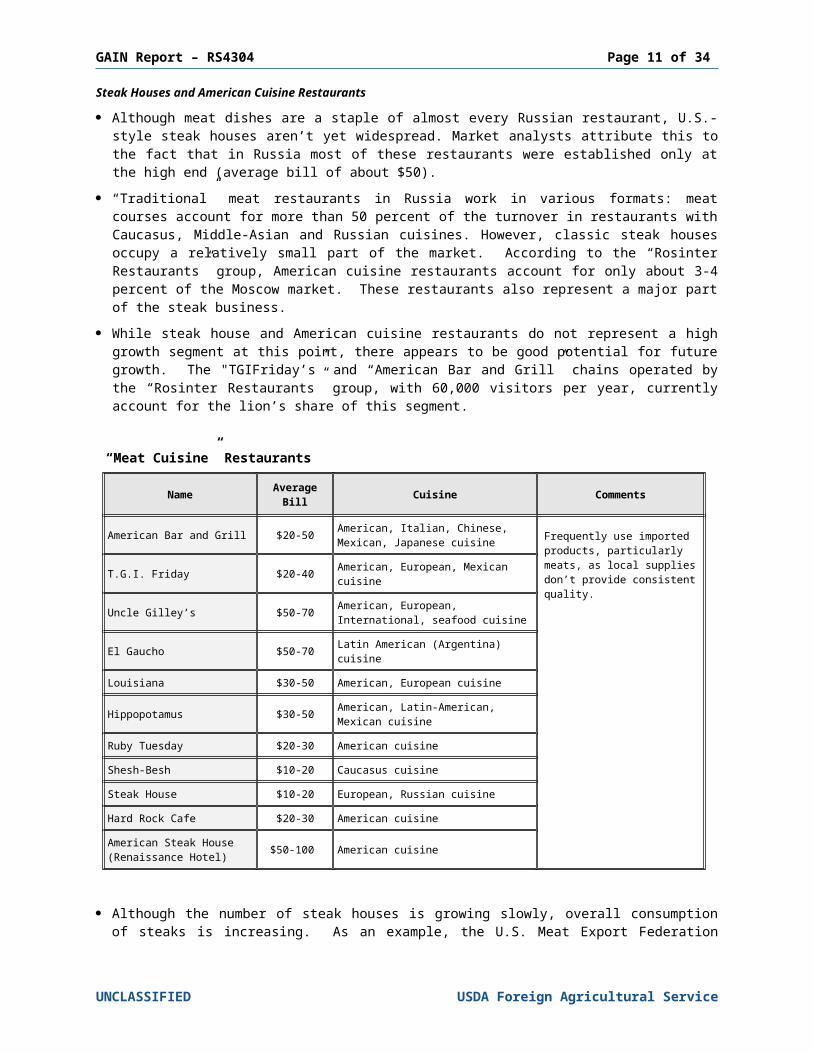
“Meat Cuisine” Restaurants
Name AverageBill Cuisine Comments
American Bar and Grill $20-50 American, Italian, Chinese, Mexican, Japanese cuisine Frequently use imported
products, particularly meats, as local supplies don’t provide consistent quality.T.G.I. Friday $20-40 American, European, Mexican
cuisine
Uncle Gilley’s $50-70 American, European, International, seafood cuisine
El Gaucho $50-70 Latin American (Argentina) cuisineLouisiana $30-50 American, European cuisine
Hippopotamus $30-50 American, Latin-American, Mexican cuisine
Ruby Tuesday $20-30 American cuisineShesh-Besh $10-20 Caucasus cuisineSteak House $10-20 European, Russian cuisineHard Rock Cafe $20-30 American cuisineAmerican Steak House (Renaissance Hotel) $50-100 American cuisine
Although the number of steak houses is growing slowly, overall consumption of steaks is increasing. As an example, the U.S. Meat Export Federation reports that membership in its American Beef Club (ABC) has grown more than one-third to 60 restaurants throughout Russia, including some non-steak house restaurants.
Restaurants of Haute Cuisine
High category (haute cuisine) restaurants started to appear in Russia as early as the late 1980’s to early 1990’s. They are associated with the names of Arkadiy Novikov, Andrei Dellos and other stars. They could (and still can) be considered boutique restaurants, typically using literary themes. The most notable restaurants are: “Pushkin” and “Seer” operated by Novikov; “Le Duc” and “Shinok” of Dellos; “Ulei” of Oleg Bardeev; “Oblomov na Presne” of Anton Tabakov; and “Absent” of Igor Buharov.
UNCLASSIFIED USDA Foreign Agricultural Service

GAIN Report – RS4304 Page 10 of 27
According to industry analysts, the haute cuisine niche is already crowded. However, the owners are convinced that restaurants of this kind will continue to open and evolve.
High category restaurants of this type are loyal consumers for imported high quality product such as marble beef.
Fast Food
Stationary Fast Food
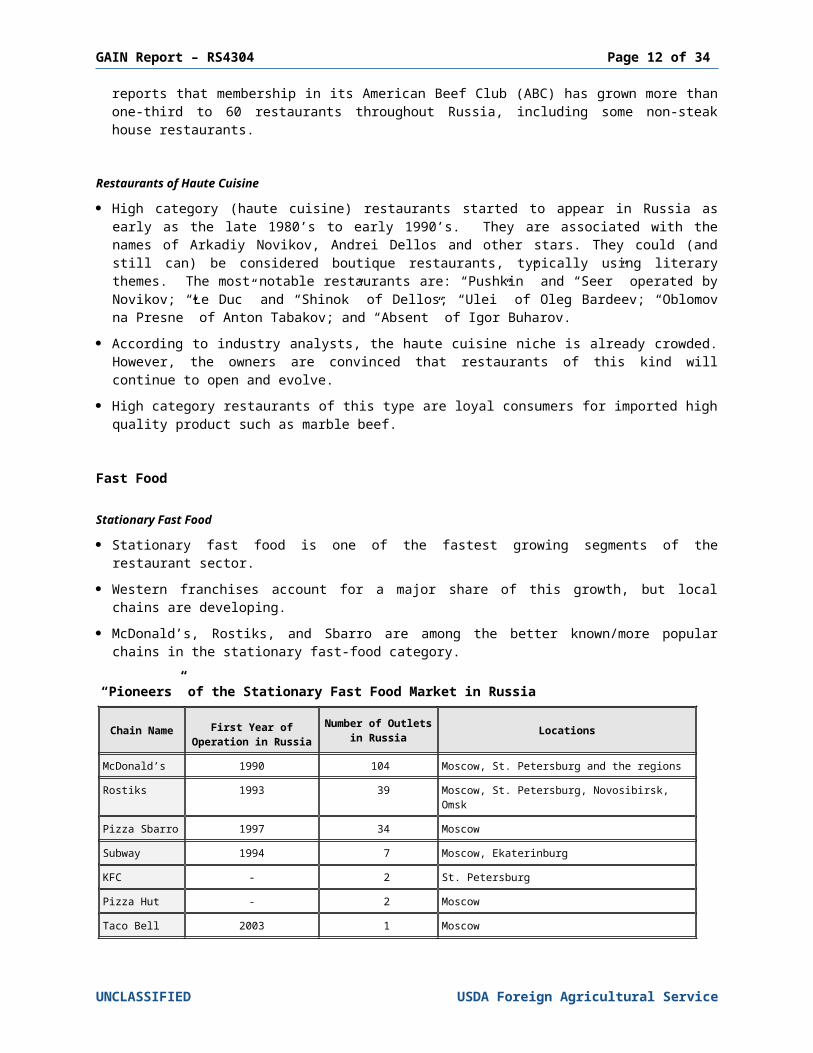
Stationary fast food is one of the fastest growing segments of the restaurant sector. Western franchises account for a major share of this growth, but local chains are
developing. McDonald’s, Rostiks, and Sbarro are among the better known/more popular chains in the
stationary fast-food category.
“Pioneers” of the Stationary Fast Food Market in Russia
Chain Name First Year of Operation in Russia
Number of Outlets in Russia Locations
McDonald’s 1990 104 Moscow, St. Petersburg and the regionsRostiks 1993 39 Moscow, St. Petersburg, Novosibirsk, OmskPizza Sbarro 1997 34 MoscowSubway 1994 7 Moscow, EkaterinburgKFC - 2 St. PetersburgPizza Hut - 2 MoscowTаco Bell 2003 1 Moscow
Street/Mobile Fast Food
Currently, there are about 20 mobile fast-food chains operating in Russia. Typically, each features a particular product: grilled meats; baked potatoes; pancakes or pizza.
Domestic chains dominate in this segment. At present, many of the chains are already well developed in the Moscow market and are moving to the regions.
Main trends for the street fast-food market: displacement of independent vendors by chain outlets; appearance of new themes within the framework of existing chains; opening of stationary outlets by existing chains (e.g., “Stop-Top”, “Steff”, and “Kroshka-Kartoshka”.)
The street/mobile fast-food sub-sector is growing rapidly (30-40 percent per year). However, this category is of limited interest to U.S. exporters because these outlets typically use domestic ingredients.
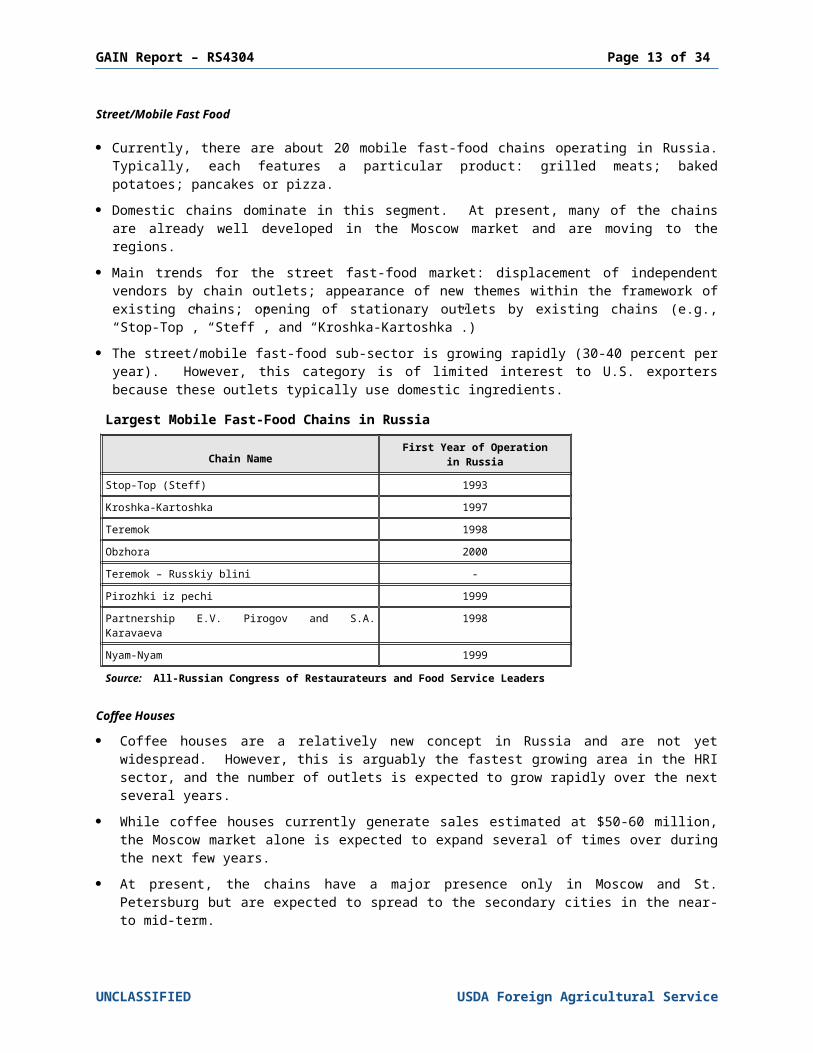
Largest Mobile Fast-Food Chains in Russia
Chain NameFirst Year of Operation
in RussiaStop-Top (Steff) 1993Kroshka-Kartoshka 1997Teremok 1998
UNCLASSIFIED USDA Foreign Agricultural Service
GAIN Report – RS4304 Page 11 of 27
Obzhora 2000Teremok – Russkiy blini -Pirozhki iz pechi 1999Partnership E.V. Pirogov and S.A. Karavaeva 1998Nyam-Nyam 1999Source: All-Russian Congress of Restaurateurs and Food Service Leaders
Coffee Houses
Coffee houses are a relatively new concept in Russia and are not yet widespread. However, this is arguably the fastest growing area in the HRI sector, and the number of outlets is expected to grow rapidly over the next several years.
While coffee houses currently generate sales estimated at $50-60 million, the Moscow market alone is expected to expand several of times over during the next few years.
At present, the chains have a major presence only in Moscow and St. Petersburg but are expected to spread to the secondary cities in the near- to mid-term.
For additional information, please see the special report on coffee shop chains in our GAIN report #3310, The Russian Marketplace.
Hotels and Resorts A new law calls for hotels in Russia to be classified according to generally accepted
international standards. However, local experts still divide the Russian hotel market into four segments:
Luxury classy hotels – international chain hotels (4-5 stars) High category hotels – former “Intourist” chain (Cosmos, Rossia, etc.) Average category hotels – former hotels of Central and Regional Committees Economy category – other hotel and resort outlets
Moscow Hotels by Rating Category
Hotel Rating Share of Total Rooms (%) Occupancy (%)
Luxury 8 65High 52 68
Average 26 n/aEconomy 14 n/a
In terms of occupancy rates, there are significant differences between official data and industry estimates. This may be due to underreporting or different estimation methods.
According to official data, overall occupancy in 2002 declined slightly (37 percent versus 38 percent in 2001). The highest occupancy rates were recorded in Moscow (55 percent) and St. Petersburg (57 percent); for other cities/regions, the rate was only 12 percent.
Several well-known international chains are already present in Russia. While the chains’ overall market share is still relatively small, this is the fastest growing hotel segment.
UNCLASSIFIED USDA Foreign Agricultural Service
GAIN Report – RS4304 Page 12 of 27
Hotels at the high end primarily target foreign tourists and offer the best prospect for imports of U.S. food and beverage products.
C. COMPANY PROFILES
Large Chain Restaurants
Restaurant / Chain
Sales (2002) /Growth Rate (2003/2002)
Brand Name TypeNumber of Outlets in
RussiaLocation
Rostik’s Restaurants Limited /Rosinter Restaurants
$83 milliongrowth: 40%
Rostik's, Fast-Food 39 MoscowSt. PetersburgNovosibirskOmskPatio Pizza Democratic
(Family style) 18
American Bar & Grill Democratic (American style)
4 MoscowT.G.I. Fridays 4 MoscowCafé Des Artist High category 1 MoscowSanta Fe & Tsezarka High category 1 MoscowGooter's Sport Bar High category 1 Moscow
Planet SushiDemocratic
(Asian cuisine)
9MoscowSt. PetersburgNovosibirsk
Benihana of Tokyo 1 MoscowAbazu 1 MoscowCafé Moka-Loka Fast-Food 6 Moscow
Sibirskaya Corona Democratic (beer) 6OmskNovosibirskKrasnoyarsk
McDonald's ~$150 milliongrowth: 10-20% McDonald's, McCafe Fast-Food 104
(109 *)MoscowSt. Petersburg and regions
Arkadiy Novikov ~$80-100 million
growth: 20%
Sirena, Tsarskaya Ohota, Kavkazskaya Plennitsa, Beloe Solntse Puctyni, Uzbekistan, Club-T, Cheese, Biscuit, Pyramid, Three Peskarya, Veranda u Dachi, Vanil’, Yapona-Mama, Vogue Café, etc
High category 24 Moscow
Sushi-Vesla Democratic (Family style) 1 Moscow
Yolki-Palki Democratic (Family style) 21 Moscow
St. PetersburgBrazier & Company $27 million
growth: 50% SbarroFast food / Democratic
(Family style)34 (45*) Moscow
Restaurants Association - Vesta Center Int’l
N/A Yakitorya Democratic(Asian cuisine) 9 Moscow
St. PetersburgGi-no Taki 2 MoscowCrab House 1 MoscowFudzi 2 Moscow
UNCLASSIFIED USDA Foreign Agricultural Service
GAIN Report – RS4304 Page 13 of 27
Hong Kong 1 MoscowSport Bar 1 MoscowNavruz Democratic 1 Moscow
Romashka Management N/A
William Bass Democratic(Beer pub) 1 Moscow
John Bull Pub Democratic(Beer pub) 2 Moscow
Molly Gwynn's Democratic(Beer pub) 2 Moscow
Piccadilly Democratic(Family style) 1 Moscow
Esperanto Democratic 1 Moscow
Mir Pizza Democratic(Family style) 2 Moscow
China City Democratic(Family style) 1 Moscow
Caravan-Saray Democratic(Family style) 1 Moscow
Shesh-Besh Democratic /Fast food 5 Moscow
Restaurant House of Andrei Dellos
~$60 million Pushkin, Bochka, Shinok, Le Duc, CDL Haute cuisine 5 Moscow
Moo-Moo Fast food 2 Moscow
Tinkoff $15 milliongrowth: 50% Tinkoff Democratic
(Beer pub) 5 (10*)
MoscowSt. PetersburgSamaraNovosibirskN. Novgorod
* Number of outlets projected by end 2003Source: Industry estimates
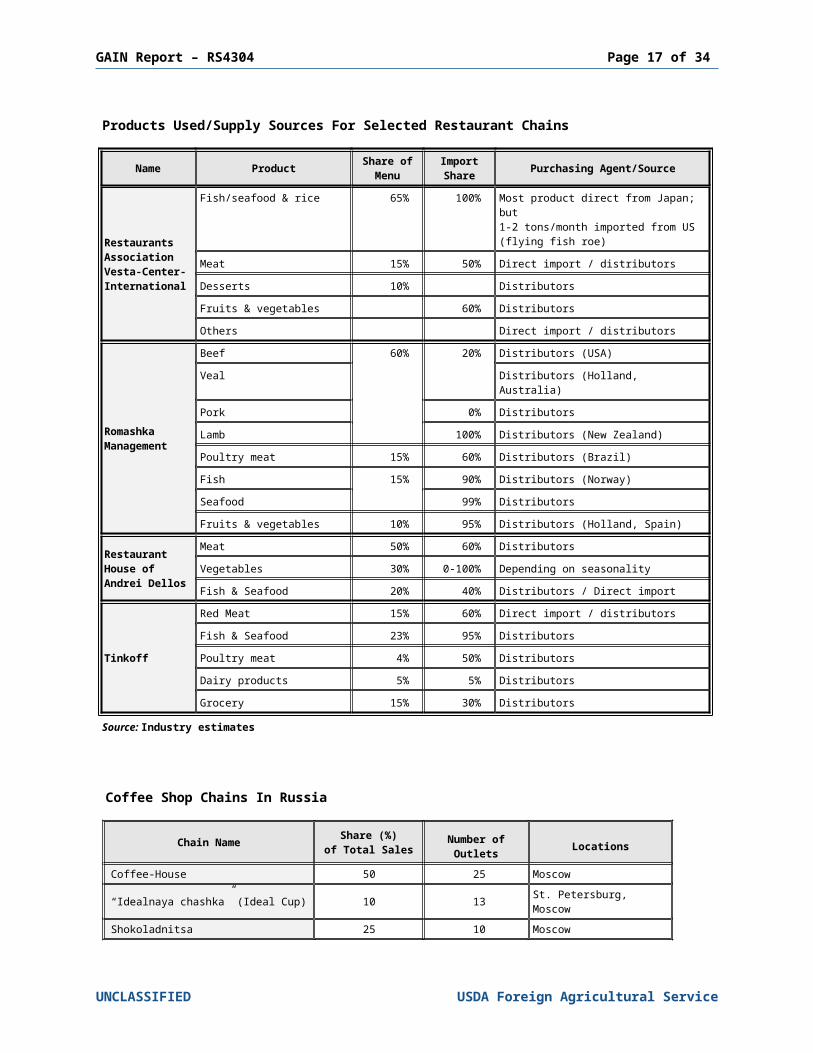
Products Used/Supply Sources For Selected Restaurant Chains
Name Product Share of Menu
Import Share Purchasing Agent/Source
Restaurants Association Vesta-Center-International
Fish/seafood & rice 65% 100% Most product direct from Japan; but1-2 tons/month imported from US (flying fish roe)
Meat 15% 50% Direct import / distributorsDesserts 10% DistributorsFruits & vegetables 60% DistributorsOthers Direct import / distributors
Romashka Management
Beef 60% 20% Distributors (USA)Veal Distributors (Holland, Australia)Pork 0% DistributorsLamb 100% Distributors (New Zealand)Poultry meat 15% 60% Distributors (Brazil)Fish 15% 90% Distributors (Norway)Seafood 99% Distributors
UNCLASSIFIED USDA Foreign Agricultural Service

GAIN Report – RS4304 Page 14 of 27
Fruits & vegetables 10% 95% Distributors (Holland, Spain)
Restaurant House of Andrei Dellos
Meat 50% 60% DistributorsVegetables 30% 0-100% Depending on seasonalityFish & Seafood 20% 40% Distributors / Direct import
Tinkoff
Red Meat 15% 60% Direct import / distributorsFish & Seafood 23% 95% Distributors Poultry meat 4% 50% Distributors Dairy products 5% 5% Distributors Grocery 15% 30% Distributors
Source: Industry estimates
Coffee Shop Chains In Russia
Chain Name Share (%)of Total Sales Number of
Outlets Locations
Coffee-House 50 25 Moscow
“Idealnaya chashka” (Ideal Cup) 10 13 St. Petersburg, Moscow
Shokoladnitsa 25 10 Moscow
Moka-Loka 4 6 MoscowCoffee-Teppa 2 6 NovosibirskNew York Coffee 1 5 NovosibirskTravels Coffee 1 5 NovosibirskCoffee Mania 2 4 Moscow, St. PetersburgBabaru 1 4 St. PetersburgCoffee Bean 1 3 MoscowZen Coffee 1 2 MoscowSegafredo 1 2 MoscowMarko - 3 St. PetersburgRepublic of Coffee - 3 St. Petersburg
*Source: Maya Delo (My Business): Restaurant – magazine
High Category Hotels
Hotel Rating
# ofHotels
# ofRooms Location Occupancy
Rate* Food Outlets Purchasing Agent
Chain Hotels
Marriott 5/4 6 1,509Moscow,St. PetersburgSamara
70-80%Restaurants: 10Bars: 9Coffee shops: 4
Distributors
Radisson SAS 4 4 1,320Moscow,St. PetersburgSochi
60-70%Restaurants: 8Bars: 4Coffee shops: 1
Distributors
Accor, Novotel, Marco Polo
4 3 811 Moscow 60-65%Restaurants: 4Bars: 5Coffee shops: 1
Distributors
Sheraton 5 2 478 Moscow 45-50% Restaurants: 6 Distributors
UNCLASSIFIED USDA Foreign Agricultural Service

GAIN Report – RS4304 Page 15 of 27
St. Petersburg Bars: 3Coffee shops: 2
Forte & Le Meridian 5 2 797 Moscow
St. Petersburg 50-70%Restaurants: 6Bars: 5Coffee shops: 2
Distributors
Word Trade CenterHotel
5/3 2 707 Moscow 50%Restaurants 5Bars: 2Coffee shops: 2
Distributors
Kempinski Hotels & Resorts
5 2 533 MoscowSt. Petersburg 45-50%
Restaurants: 6Bars: 3Coffee shops: 2
Distributors
UMACO / Katerina 4 2 311 Moscow - Restaurants: 4
Bars: 3 Distributors
Best Western 4 2 166 Moscow,St. Petersburg - Restaurants: 3
Bars: 2 Distributors
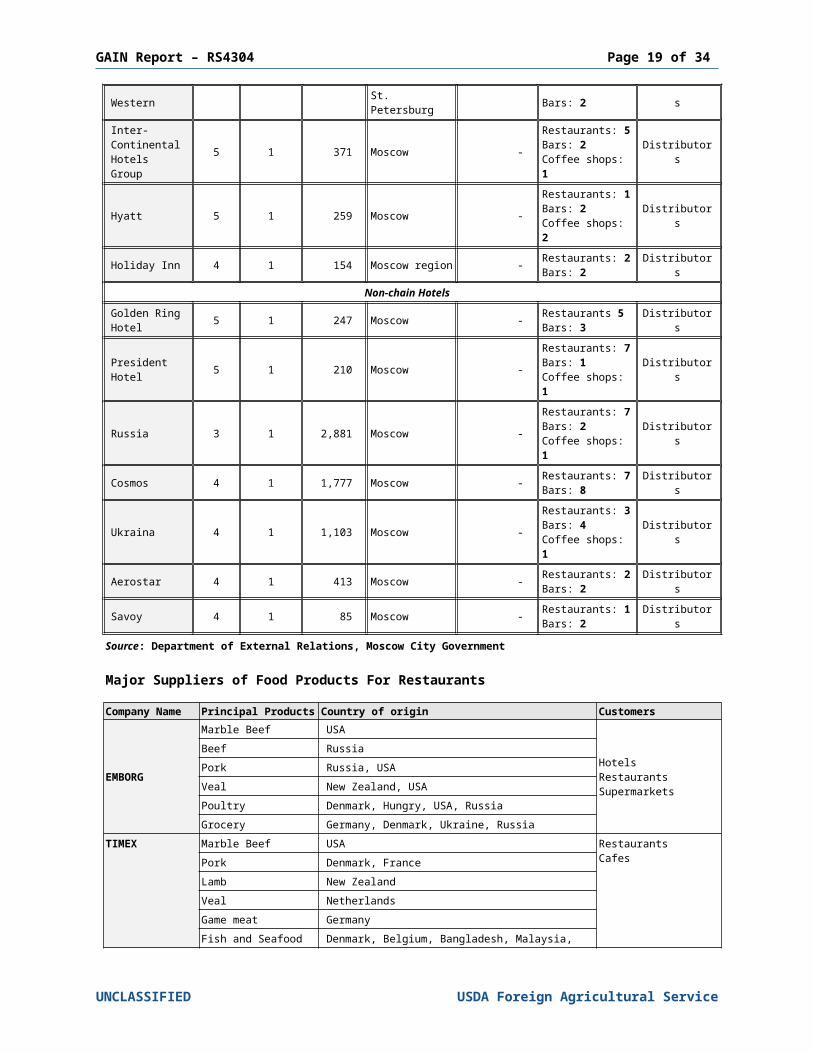
Inter-Continental Hotels Group
5 1 371 Moscow -Restaurants: 5Bars: 2Coffee shops: 1
Distributors
Hyatt 5 1 259 Moscow -Restaurants: 1Bars: 2Coffee shops: 2
Distributors
Holiday Inn 4 1 154 Moscow region - Restaurants: 2Bars: 2 Distributors
Non-chain HotelsGolden Ring Hotel 5 1 247 Moscow - Restaurants 5
Bars: 3 Distributors
President Hotel 5 1 210 Moscow -
Restaurants: 7Bars: 1Coffee shops: 1
Distributors
Russia 3 1 2,881 Moscow -Restaurants: 7Bars: 2Coffee shops: 1
Distributors
Cosmos 4 1 1,777 Moscow - Restaurants: 7Bars: 8 Distributors
Ukraina 4 1 1,103 Moscow -Restaurants: 3Bars: 4Coffee shops: 1
Distributors
Aerostar 4 1 413 Moscow - Restaurants: 2Bars: 2 Distributors
Savoy 4 1 85 Moscow - Restaurants: 1Bars: 2 Distributors
Source: Department of External Relations, Moscow City Government
Major Suppliers of Food Products For Restaurants
Company Name Principal Products Country of origin Customers
EMBORG
Marble Beef USA
HotelsRestaurants Supermarkets
Beef RussiaPork Russia, USAVeal New Zealand, USAPoultry Denmark, Hungry, USA, RussiaGrocery Germany, Denmark, Ukraine, Russia
TIMEX Marble Beef USA RestaurantsCafesPork Denmark, France
Lamb New ZealandVeal Netherlands
UNCLASSIFIED USDA Foreign Agricultural Service

GAIN Report – RS4304 Page 16 of 27
Game meat Germany
Fish and Seafood Denmark, Belgium, Bangladesh, Malaysia, Thailand
Grocery Germany, Netherlands, USA
EAST-WEST
Marble Beef USA
Restaurants
Veal USABeef Russia, Ukraine, Pork USA, Russia, FranceLamb New ZealandFish and Seafood Denmark, NorwayPoultry France, Russia, HungaryGrocery Poland, Germany, Russia, Netherlands
GLOBAL FOODS
Marble Beef USA
HotelsRestaurants
Veal USA, NetherlandsMutton, Lamb New ZealandPork USAPoultry France, GermanyGrocery USA, Belgium, Germany, Netherlands
AUSTRALIA TRADE HOUSE
Marble Beef USA, Australia
HotelsRestaurantsSupermarkets
Beef RussiaPork Denmark, France, RussiaVeal AustraliaLamb, Australian lamb New Zealand, Australia
Fish and Seafood Malaysia, Thailand, Vietnam, RussiaGrocery Australia, Russia, Italy
ICEBIT
Marble Beef USA
RestaurantsSupermarkets
Beef RussiaMutton, Lamb Australia, New ZealandPoultry France, Denmark, HungryVegetables, Berries & Fruit frozen
MARR RUSSIABeef, Marble Beef USA Hotels
RestaurantsCafésSupermarkets
Pork USAMutton, Lamb New ZealandPoultry France, Hungary
SNOW WORLD
Goose and duck liver products France
HotelsRestaurants
Turkey HungaryQuails, Pigeon France, Great BritainOstrich Southern AfricaMutton, Lamb New ZealandMarble Beef USA (PRIME, ANGUS PRIDE, CHOICE)Veal Netherlands, New Zealand, USA, Australia
Beef “Mikoyan” Russia, “Klinskiy” Russia, Cherkizovo” Russia
Pork RussiaGame meat France, Australia, Great Britain, New Zealand
Fish & Seafood Denmark, Bangladesh, Belgium, Russia, Senegal, Indonesia, Spain, France
Grocery RU, France, Italy, Denmark, Netherlands, Estonia
UNCLASSIFIED USDA Foreign Agricultural Service
GAIN Report – RS4304 Page 17 of 27
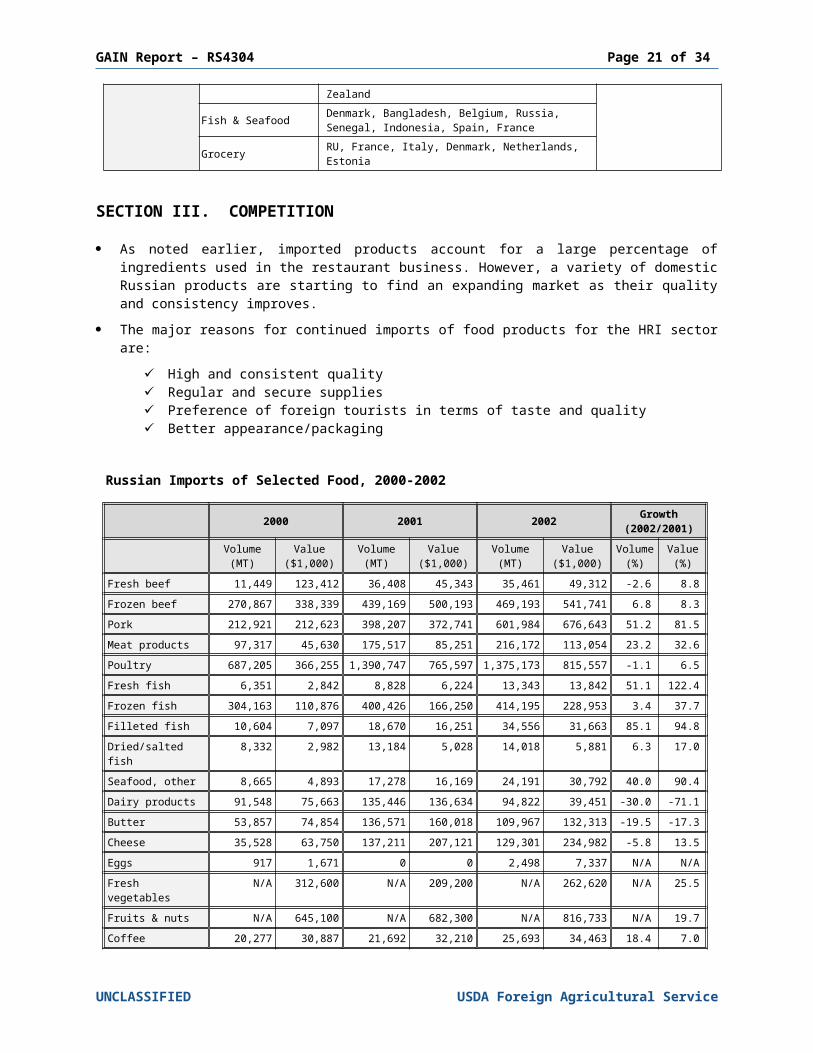
SECTION III. COMPETITION As noted earlier, imported products account for a large percentage of ingredients used in
the restaurant business. However, a variety of domestic Russian products are starting to find an expanding market as their quality and consistency improves.
The major reasons for continued imports of food products for the HRI sector are: High and consistent quality Regular and secure supplies Preference of foreign tourists in terms of taste and quality Better appearance/packaging
Russian Imports of Selected Food, 2000-2002
2000 2001 2002 Growth(2002/2001)
Volume(MT)
Value($1,000)
Volume(MT)
Value($1,000)
Volume(MT)
Value($1,000)
Volume(%)
Value(%)
Fresh beef 11,449 123,412 36,408 45,343 35,461 49,312 -2.6 8.8Frozen beef 270,867 338,339 439,169 500,193 469,193 541,741 6.8 8.3Pork 212,921 212,623 398,207 372,741 601,984 676,643 51.2 81.5Meat products 97,317 45,630 175,517 85,251 216,172 113,054 23.2 32.6Poultry 687,205 366,255 1,390,747 765,597 1,375,173 815,557 -1.1 6.5Fresh fish 6,351 2,842 8,828 6,224 13,343 13,842 51.1 122.4Frozen fish 304,163 110,876 400,426 166,250 414,195 228,953 3.4 37.7Filleted fish 10,604 7,097 18,670 16,251 34,556 31,663 85.1 94.8Dried/salted fish 8,332 2,982 13,184 5,028 14,018 5,881 6.3 17.0Seafood, other 8,665 4,893 17,278 16,169 24,191 30,792 40.0 90.4Dairy products 91,548 75,663 135,446 136,634 94,822 39,451 -30.0 -71.1Butter 53,857 74,854 136,571 160,018 109,967 132,313 -19.5 -17.3Cheese 35,528 63,750 137,211 207,121 129,301 234,982 -5.8 13.5Eggs 917 1,671 0 0 2,498 7,337 N/A N/AFresh vegetables N/A 312,600 N/A 209,200 N/A 262,620 N/A 25.5Fruits & nuts N/A 645,100 N/A 682,300 N/A 816,733 N/A 19.7Coffee 20,277 30,887 21,692 32,210 25,693 34,463 18.4 7.0Tea 158,290 225,618 154,626 205,833 165,313 228,677 6.9 11.1Cereals N/A 551,500 N/A 227,000 N/A 165,644 N/A -27.0Vegetable/animal fats/oils
149,512 88,028 183,329 90,773 175,698 116,996 -4.2 28.9
Canned meat 20,609 28,793 25,114 37,928 19,207 29,584 -23.5 -22.0Canned fish 119,981 29,740 144,447 82,005 96,276 69,840 -33.3 -14.8Sugar & sugar products
N/A 894,600 N/A 1,432,900 N/A 1,108,388 N/A -22.6
Canned veg/fruit N/A 238,300 N/A 335,000 N/A 431,100 N/A 28.7Juice 121,121 56,956 186,671 86,173 186,769 130,591 0.1 51.5Beer (‘000 liters) 53,573 24,935 141,241 47,380 106,538 40,573 -24.6 -14.4Wine (‘000 liters) 250,874 223,106 359,120 305,155 429,794 320,749 19.7 5.1Source: Government Customs Committee
UNCLASSIFIED USDA Foreign Agricultural Service

GAIN Report – RS4304 Page 18 of 27
Import Competition for Selected Products
Product Country of originBeef Brazil, Argentina Veal Australia, NetherlandsLamb New ZealandPork Russia, France, Hungary, Finland, DenmarkGame UK, FrancePoultry France, Russia, HungaryFish & seafood Norway, Denmark, AsiaWine Moldova, France ItalyDairy products Germany, Poland, New Zealand, FinlandFrozen vegetables & fruits Belgium, Netherlands, FranceCanned vegetables & fruits Italy, Spain, FranceIce-cream GermanyConfectionary EuropeBakery EuropeDelicatessen EuropeSeasoning Europe, Russia
UNCLASSIFIED USDA Foreign Agricultural Service
GAIN Report – RS4304 Page 19 of 27
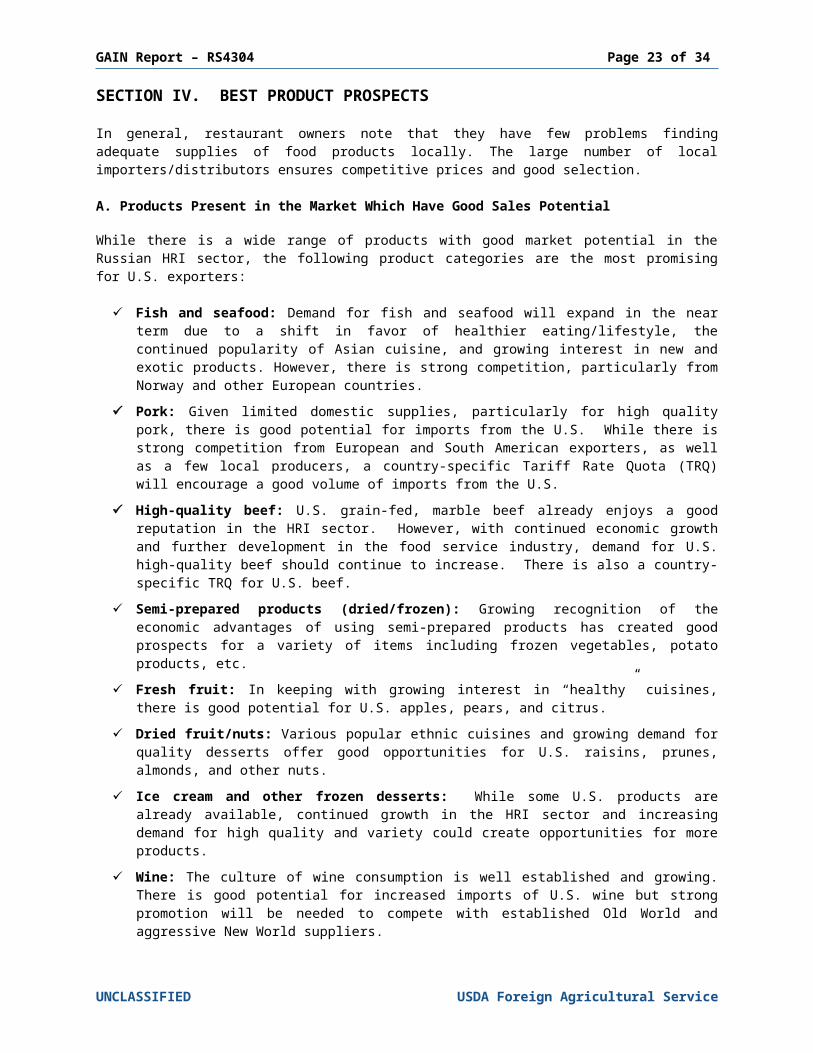
SECTION IV. BEST PRODUCT PROSPECTSIn general, restaurant owners note that they have few problems finding adequate supplies of food products locally. The large number of local importers/distributors ensures competitive prices and good selection.
A. Products Present in the Market Which Have Good Sales Potential
While there is a wide range of products with good market potential in the Russian HRI sector, the following product categories are the most promising for U.S. exporters:
Fish and seafood: Demand for fish and seafood will expand in the near term due to a shift in favor of healthier eating/lifestyle, the continued popularity of Asian cuisine, and growing interest in new and exotic products. However, there is strong competition, particularly from Norway and other European countries.
Pork: Given limited domestic supplies, particularly for high quality pork, there is good potential for imports from the U.S. While there is strong competition from European and South American exporters, as well as a few local producers, a country-specific Tariff Rate Quota (TRQ) will encourage a good volume of imports from the U.S.
High-quality beef: U.S. grain-fed, marble beef already enjoys a good reputation in the HRI sector. However, with continued economic growth and further development in the food service industry, demand for U.S. high-quality beef should continue to increase. There is also a country-specific TRQ for U.S. beef.
Semi-prepared products (dried/frozen): Growing recognition of the economic advantages of using semi-prepared products has created good prospects for a variety of items including frozen vegetables, potato products, etc.
Fresh fruit: In keeping with growing interest in “healthy” cuisines, there is good potential for U.S. apples, pears, and citrus.
Dried fruit/nuts: Various popular ethnic cuisines and growing demand for quality desserts offer good opportunities for U.S. raisins, prunes, almonds, and other nuts.
Ice cream and other frozen desserts: While some U.S. products are already available, continued growth in the HRI sector and increasing demand for high quality and variety could create opportunities for more products.
Wine: The culture of wine consumption is well established and growing. There is good potential for increased imports of U.S. wine but strong promotion will be needed to compete with established Old World and aggressive New World suppliers.
B. Products Not Present in Significant Quantities but With Good Sales Potential
Wild rice: U.S. wild rice is already available in limited supply, but there should be room for further growth as the product shows promise due to the growing demand for “natural” products. Wild rice is also attractive as a “new” and “exotic” food.
Certified organic/natural ingredients: Growing interest in healthier eating/lifestyle could translate into demand for organic and natural products. At present, this market is quite small. However, there are signs that organic/natural foods could develop into a good niche market in the HRI sector.
Functional food ingredients: Similarly, growing interest in healthier eating could create a ready market for functional foods. This is clearly a limited market at present but one that could develop with proper support.
UNCLASSIFIED USDA Foreign Agricultural Service

GAIN Report – RS4304 Page 20 of 27
V. POST CONTACT AND FURTHER INFORMATIONCONTACT INFORMATION FOR FAS OFFICES IN RUSSIA AND THE U.S.
U.S. Agricultural Trade OfficeAmerican EmbassyBolshoy Devyatinskiy Pereulok 8121099 Moscow, RussiaTel: 7 (095) 728-5560; Fax: 7 (095) 728-5069E-mail : [email protected]
Jeffrey Hesse, Director
For mail coming from the U.S.:Agricultural Trade OfficePSC 77 AGRAPO, AE 09721
For international mail:Agricultural Trade OfficeU.S. Embassy - Box MItainen Puistortie 1400140 Helsinki, Finland
Covering Northwest Russia (St. Petersburg):ATO Marketing AssistantAmerican Consulate GeneralNevskiy Prospekt, 25191186 St. Petersburg, RussiaTel: 7 (812) 326-2580; Fax: 7 (812) 326-2561E-mail: [email protected]
Covering the Russian Far East (Vladivostok):ATO Marketing AssistantAmerican Consulate General Ulitsa Pushkinskaya, 32690001 Vladivostok, RussiaTel: 7 (4232) 300-070 or 300-089; Fax: 7 (4232) 300-089E-mail: [email protected]
For General Information on FAS/USDA Market Promotion Programs and Activities:AgExport Services DivisionRoom 493914th and Independence, SWWashington, DC 20250Tel: (202) 720-6343; Fax: (202) 690-0193
UNCLASSIFIED USDA Foreign Agricultural Service
GAIN Report – RS4304 Page 21 of 27
USDA/FAS AND ATO PROGRAMS AND SERVICES
The Foreign Agricultural Service and the Agricultural Trade Office/Moscow offer a variety of programs, services, and information resources to help U.S. exporters of food, beverage, and agricultural products learn more about the Russian market, establish initial contact with Russian buyers, and promote their products in the local market. Following is a partial listing of programs and services:
Trade Leads are direct inquiries from Russian buyers seeking U.S. sources for specific food, beverage, or agricultural products. U.S. companies can receive these Trade Leads by contacting the AgExport Services Division, FAS/USDA or by visiting the USDA/FAS Homepage (see contact information at the beginning of this section).
Buyer Alert is a biweekly publication providing information on specific food, beverage, and agricultural products offered by U.S. exporters. U.S. companies may place ads in Buyer Alert by contacting the AgExport Services Division, FAS/USDA (see contact information at the beginning of this section).
U.S. Supplier Lists are drawn from an extensive database of companies that can supply a wide range of U.S. food, beverage, and agricultural products. The ATO Moscow supplies these lists to Russian importers on request. U.S. companies that wish to be included in this database should contact the AgExport Services Division, FAS/USDA (see contact information at the beginning of this section).
Foreign Buyer Lists are drawn from an extensive database of Russian importers dealing with a wide range of food, beverage, and agricultural products. U.S. companies can order these lists through the AgExport Services Division, FAS/USDA (see contact information at the beginning of this section).
ATO/Moscow also coordinates U.S. participation in local trade shows (see list of Russian Trade Shows below), sponsors supermarket and menu promotions, provides support for trade missions, and can help arrange appointments for first-time visitors to Russia. For more detail on these and other programs or activities, please contact the ATO/Moscow (see contact information above).
The FAS website (www.fas.usda.gov) is an excellent source of information on other USDA/FAS export promotion/assistance programs, such as the Market Access Program (MAP) and Credit Guarantee Programs, as well as a wide range of information and reports on market opportunities for U.S. food, beverage, and agricultural exports world-wide.
OTHER MARKET REPORTS
Reports on the Russian food and agricultural market are available on the FAS website. U.S. exporters may also contact ATO/Moscow for copies of these reports (see contact information at beginning of this section). The following reports may be of particular interest:
Report Title Report # Report SummaryExporter Guide RS4301 Provides an overview of the Russian food market,
identifying opportunities for U.S. food and beverage products in the retail, HRI, and processing sectors
Food Processing Ingredients
RS4302 Examines the Russian food processing sector, focusing on market opportunities for U.S. food ingredients, including raw, semi-processed and specialty products
UNCLASSIFIED USDA Foreign Agricultural Service

GAIN Report – RS4304 Page 22 of 27
Retail Food RS4303 Reviews developments in Russian retail food sector, highlighting market opportunities for U.S. consumer-oriented food products
Fish and Seafood Products Market Brief
RS4305 Examines growing import market for wide range of fish and seafood products
Wine Market Brief RS2307 Brief look at the local market for wine and opportunities for U.S. exporters.
The Russian Marketplace
RS3310 Quarterly newsletter highlighting developments in the Russian food retail, HRI, and processing sectors
Food and Agricultural Import Regulations and Standards
RS3020 Detailed information on Russia’s food import requirements, including certification, labeling and packaging requirements
New Resolution Concerning Use of GMOs in Food Products
RS3031 Overview of new regulations concerning the testing and approval of foods containing of genetically-modified organisms (GMOs)
Livestock and Products Annual
RS3018 Review of the Russian market for beef and pork, including production, consumption and trade.
Poultry and Products Annual
RS3019 Analysis of the Russian market for poultry meat, including production, consumption and trade.
Fishery Products Annual
RS3033 Overview of the Russian market for fish and seafood products meat, including production, consumption and trade.
OTHER USEFUL CONTACTS
American Chamber of Commerce in RussiaKosmodamianskaya Nab. 52, Building 1, 8th floor113054 Moscow, RussiaTel: (095) 961-2141; Fax: (095) 961-2142Email: [email protected]
American Chamber of Commerce in St. Petersburg25 Nevsky Prospect191186 St. Petersburg, RussiaTel: (812) 326-2590; Fax: (812) 326-2591Email: [email protected]
For questions on agricultural machinery, food processing and packaging equipment/materials, refrigeration equipment, etc., please contact the U.S. & Foreign Commercial Service:
Foreign Commercial ServiceBldg. 2, 23/38 Bolshaya Molchanovka121069 Moscow, RussiaTel: 7 (095) 737-5030; Fax: 7 (095) 737-5033E-mail: [email protected]
UNCLASSIFIED USDA Foreign Agricultural Service
GAIN Report – RS4304 Page 23 of 27
TRADE SHOWS IN RUSSIA
The following are large, well-organized, international shows:
WORLD FOOD MOSCOWThe longest-running food and beverage show in Russia. World Food Moscow draws well from throughout Russia and from many countries of the Former Soviet Union.
Date: September 2004Location: Krasnopresnenskaya Expocenter, MoscowWebsite: http://www.ite-exhibitions.com/ Contact: Olga Taybakhtina, Marketing Assistant
ATO MoscowTel: 7 (095) 728-5560; Fax: 7 (095) 728-5069E-mail: [email protected]
PRODEXPO (U.S. Pavilion)Prodexpo is the largest food and beverage show in Russia, with a large number of international exhibitors and many country pavilions.
Date: February 2005Location: Krasnopresnenskaya Expocenter, MoscowContact: Olga Taybakhtina, Marketing Assistant
ATO MoscowTel: 7 (095) 728-5560; Fax: 7 (095) 728-5069E-mail: [email protected]
INTERFOOD 2004This show covers the important Northwest region of Russia (St. Petersburg, Kaliningrad, etc.) However, the show also draws visitors from Moscow and other areas of Russia, as well as neighboring countries.
Date: April 2004Location: Lenexpo Center, St. PetersburgContact: Maria Baranova, Marketing Assistant
American Consulate General, St. PetersburgTel: 7 (812) 326-2580; Fax: 7 (812) 326-2561E-mail: [email protected]
UNCLASSIFIED USDA Foreign Agricultural Service

GAIN Report – RS4304 Page 24 of 27
VI. APPENDIX
GENERAL ECONOMIC AND DEMOGRAPHIC DATA
Demographic Trends
(millions)Total Population 145.2
0-15 years 32.015-60 years (male) & 15-55 years (female) 72.360+ (male) 55+(female) years 40.9Males 67.6Females 77.6Number of births per 1,000 population 9.8Urban Population 106.4Employed Persons 66.3
Total Number of Households 51.6Average Household Size 2.8
GDP Trends
2000 2001 2002 2003*GDP ($Billions) 244 301 362 390GDP per capita ($) 1,700 2,100 2,500 2,700
*Estimate
Source: Russian State Statistics Committee (Goskomstat)
Note: According to official estimates, the “shadow” economy accounts for an estimated 20-25 percent of GDP. However, some industry analysts put this figure at 40-60 percent or more.
HOTELS IN MOSCOW
The development of the hotel trade in Moscow has gone through several stages. Until the 1980-s, all hotels were of the so-called “Soviet” type. In the early 1990-s, international hotel chains began construction of higher-end facilities as the rapidly expanding market economy started to draw foreign businessmen. In fact, most of the existing four- and five-star hotels in Moscow were built during this period.
Prior to the 1998 economic crisis, the hotels were able to charge prices that were high even by European standards and still maintain good occupancy rates (65 percent in 1997). After the crisis, business travel declined significantly and occupancy fell to only 45 percent, with the higher-class international hotels suffering most of all.
In response to the tougher market, hotels were forced to cut prices dramatically (as much as 30 percent). However, with five consecutive years of strong economic growth, prices and occupancy rates have returned to pre-crisis levels.
UNCLASSIFIED USDA Foreign Agricultural Service
GAIN Report – RS4304 Page 25 of 27
According to the Moscow City Government, there are about 150 hotels in Moscow with a total of 61,000 rooms. Of these, eight are classified as five-star hotels, 15 are four-star hotels, 37 are rated as three-star hotels, 26 are two-star hotels, seven are one-star hotels and the rest are not rated.
The turnover for Moscow hotels in 2002 was about $600 million. The overall occupancy rate increased to nearly 70 percent. Overnight stays reached 12.2 billion, with foreign travellers accounting for about one-third of this total.
In August 2003, the Moscow City Government issued a planning document, “Concerning the Scheme of Hotel Allocation in Moscow to the year 2005”. This plan calls for the construction of 122 new hotels with 22,000 rooms over the next three years.
Upper Segment Hotel Statistics for Moscow1999 2000 2001 2002
Occupancy rate (%) 39 44 55 65Revenue ($million) - 39 43 50Average room cost($ per day)
185 171 167 170
Source: “University of the Hotel, Tourist and Restaurant Business Association”
TOURISM
According to World Tourist Organization, Russia has the potential to receive up to 40 million foreign tourists per year (dependent on the corresponding development of the tourist infrastructure). Tourism declined following the 1998 economic crisis, but it is now growing quickly once again.
In 2001, the Russian Federation had 21.6 million foreign visitors: 3.0 million came for business; 2.4 million came as tourists; and 14.1 million came for “personal” visits.
Overall, tourism increased by nearly eight percent in 2002, with Moscow and St. Petersburg drawing the largest numbers of visitors. In fact, the number of “hotel nights” increased by 11.4 percent for Moscow and 16.0 percent for St. Petersburg.
The Department of Tourism (DOT) estimates Russia’s tourism market at $8 billion annually, with “business-trip” tourism accounting for two-thirds of this total versus one-third for “recreation” tourism.
The DOT estimates that the average foreign business visitor spends about $1,000 during a visit of 3.5 days in Moscow.
“CATERING” TO TOURISTS
According to industry sources, tourists often eat breakfast and dinner in their hotel but eat lunch in the city. In an attempt to retain more of the tourist business, hotels are offering special catering services. For example, the Marriott Aurora hotel has developed a special service for tourist groups visiting Red Square: special carts meet the hotel guests with blini (crepes) and several kinds of red and black caviar, accompanied by vodka.
Pelmeni (Russia’s version of ravioli) and blini are typically are included in the menu of almost any eating-place that caters to foreign tourists. Many first-time visitors are eager to sample such treats along with Russian traditional beverages such as vodka, kvas (fermented vegetable drink), Georgian wine and mineral water.
UNCLASSIFIED USDA Foreign Agricultural Service

GAIN Report – RS4304 Page 26 of 27
However, according to restaurant professionals, some foreigner visitors are wary of new dishes and opt for more familiar items such as Caesar salad, steaks, or other grilled dishes.
Budget travelers, including many domestic visitors, are not a primary target for upscale hotels and upscale restaurants. These visitors typically look to the fast-food segment as a way to economize.
Two “democratic”, traditional Russian cuisine restaurant chains in Moscow, “Yolki-Palki” and “Moo-Moo”, have become favorite destinations for tourist. For foreign visitors, these chains offer a national flavor and color; for domestic travelers, the restaurants offer familiar food at a reasonable price and can easily be found throughout the city.
However, food professionals note that foreign tourists do not yet see the local cuisine as a cultural highlight as they might for visits to Italy or France.
CULTURE AND FOOD: TRENDS AND TRADITIONS
Traditionally, Russian hospitality was expressed through meals, and respect for visitors was demonstrated by the amount and variety of food on the table.
There was also the tradition of a “family table” - the entire family gathered at the table for breakfast, dinner and supper. The joint meal was an expression of their close family ties.
These traditions continue but are practiced to a lesser degree due to changes in life style. This is reflected, in part, by the rapid development of the HRI sector since the beginning of the 1990s.
Now Russian consumers have many more choices and are beginning to pay greater attention to quality and value. They are ready to pay more but demand more in return.
The number of expensive, high-end restaurants continues to grow. However, fast-food chains are increasing at an even faster rate.
At the same time, there is also growing interest in “healthy” eating. As a result, restaurants that offer “healthy” meals (for example, vegetarian restaurants) and restaurants specializing in local cuisines that claim to use only “natural” products are becoming more popular.
CUISINES: TRENDS AND TRADITIONS
In the early 1990s, all things foreign or imported, including cuisines, were very popular. Now, Russian cuisine is making a strong comeback. According to one local research company, COMCON, two-thirds of restaurant visitors indicated a preference for Russian cuisine. Dishes from the Caucasus region were selected by 30 percent, with Italian cuisine coming in third with 25 percent. French and Japanese cuisines were at the top of the list two years ago, but now were selected by only nine percent of respondents combined. (Note: respondents were allowed to indicate more than one preference.)
Food professionals note that as recently as two years ago there were only about 15 restaurants in Moscow that served sushi. Now, sushi is available in a large number of restaurants, including many inexpensive food outlets. However, the “expansion boom” seems to be over for many Asian cuisines, and “fusion” cooking has become the new “hot” trend.
“HEALTHY” EATING
Over the last few years, there has been growing interest in “healthy living”. For many Russians, a “healthy” meal is one of the main components of a “healthy” lifestyle.
UNCLASSIFIED USDA Foreign Agricultural Service

GAIN Report – RS4304 Page 27 of 27
Not surprisingly, “natural” products are seen as a key element of a “healthy” meal. Of course, “natural” means different things to different people. However, one of the factors considered is the country of origin, specifically the perceived “cleanliness” of the source.
In general, a “healthy” meal for many Russian consumers means a variety of products in the correct proportion. “It is possible to eat everything, but in reasonable amounts, then there won’t be any harm to my health.”
For some consumers, healthy eating is associated with sacrifice. The guidelines will be followed only in “emergency” situations but not as a “preventive measure” in daily life. As a result, even though consumers know the risks of eating certain products, they may not be willing to eliminate or even cut back on consumption.
It is also generally accepted that Russian women follow “healthy” eating guidelines more closely than men due to their desire to care for their children’s health and for their own appearance.
UNCLASSIFIED USDA Foreign Agricultural Service