Embed Size (px)
Citation preview


R O Y A L O B S E R V A T O R Y H O N G K O N G
TROPICAL CYCLONES IN1992
CROWN COPYRIGHT RESERVED

Published September 1994
Prepared byRoyal Observatory134A Nathan RoadKowloonHong Kong
Permission to reproduce any part of this publicationshould be obtained through the Royal Observatory
This publication is prepared and disseminated in the interest of promoting the exchange of information. TheGovernment of Hong Kong (including its servants and agents) makes no warranty, statement or representation,expressed or implied, with respect to the accuracy, completeness, or usefulness of the information containedherein, and in so far as permitted by law, shall not have any legal liability or responsibility (including liability fornegligence) for any loss, damage or injury (including death) which may result whether directly or indirectly, fromthe supply or use of such information.
This publication is available from:
Government Publications CentreGeneral Post Office BuildingGround FloorConnaught PlaceHong Kong
551.515.2:551.506.1 (512.317)

3
CONTENTS
Page
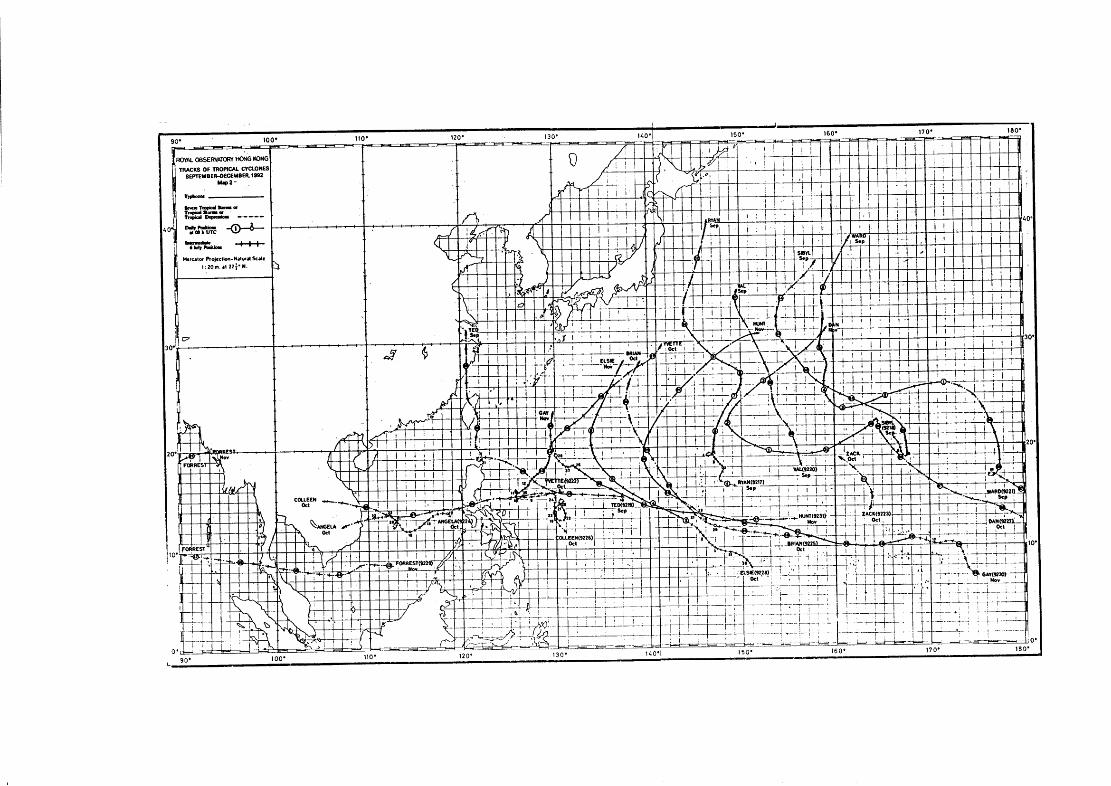
FRONTISPIECE: Tracks of tropical cyclones in the western North Pacific and the South China Seain 1992
FIGURES
TABLES
HONG KONG'S TROPICAL CYCLONE WARNING SIGNALS
1. INTRODUCTION 7
2. TROPICAL CYCLONE OVERVIEW FOR 1992 11
3. REPORTS ON TROPICAL CYCLONES AFFECTING HONG KONG IN 1992 19
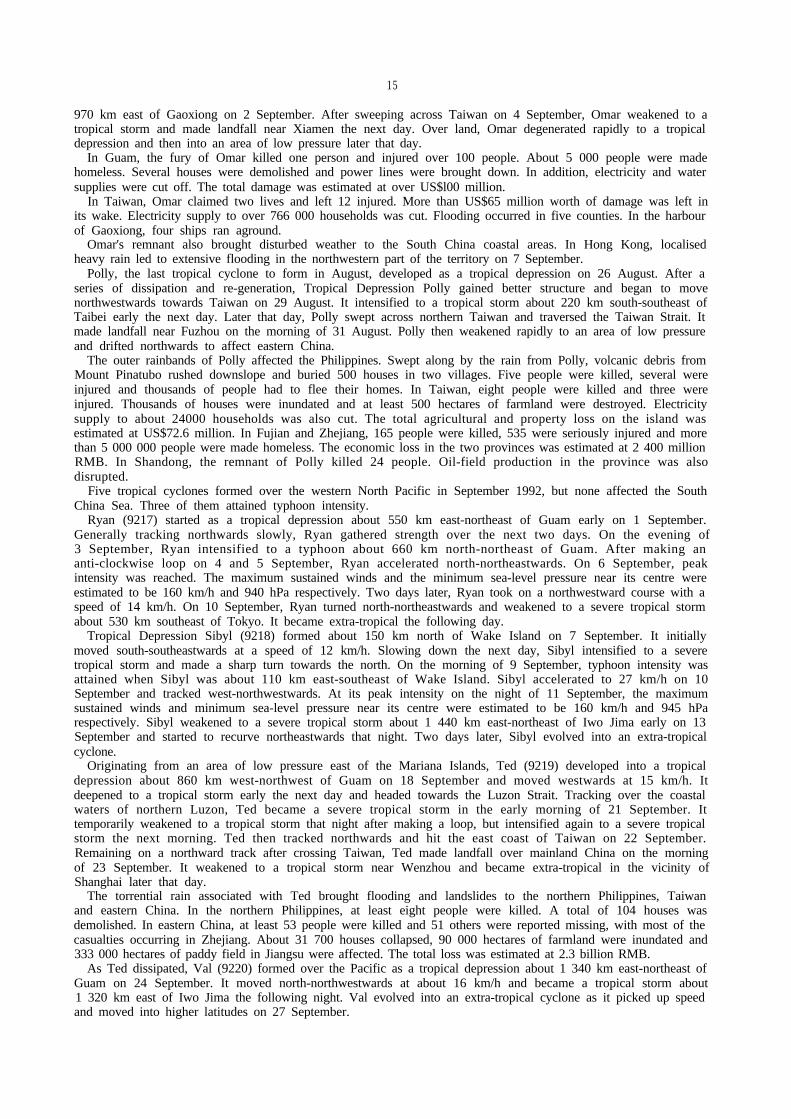
(a) Typhoon Chuck (9204): 24-30 June 20
(b) Typhoon Eli (9205): 9-14 July 25
(c) Tropical Storm Faye (9206): 17-18 July 29
(d) Severe Tropical Storm Gary (9207): 19-23 July 36
(e) Tropical Storm Mark (9212): 16-19 August 42
4. TROPICAL CYCLONE STATISTICS AND TABLES 47
5. TROPICAL CYCLONE POSITION AND INTENSITY DATA, 1992 63
4
5
6

4
FIGURES
1. Locations of anemometers and tide gauge stations in Hong Kong
Page
10
2. Monthly distribution of the frequency of first occurrence of tropical cyclones in the western NorthPacific and the South China Sea in 1992
3. Monthly distribution of the mean frequency of first occurrence of tropical cyclones in the westernNorth Pacific and the South China Sea, 1961-1990
4. Track of Typhoon Chuck (9204): 24-30 June 1992
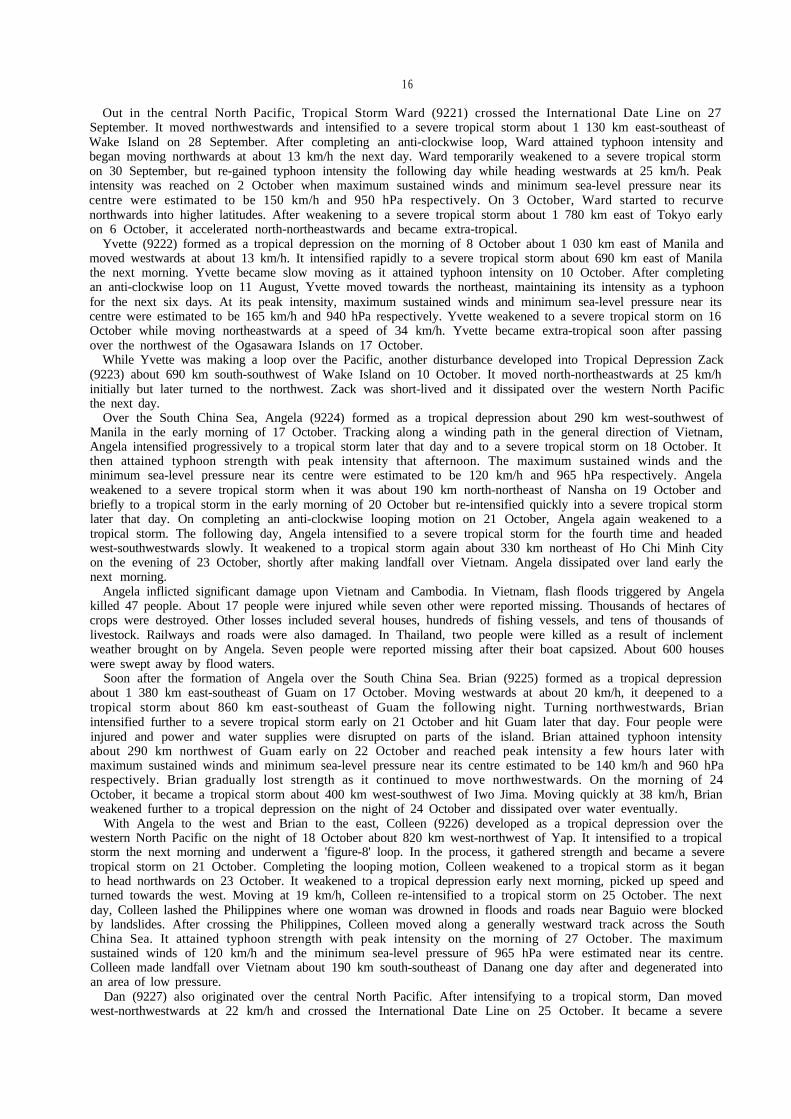
5. Rainfall distribution on 27-30 June 1992
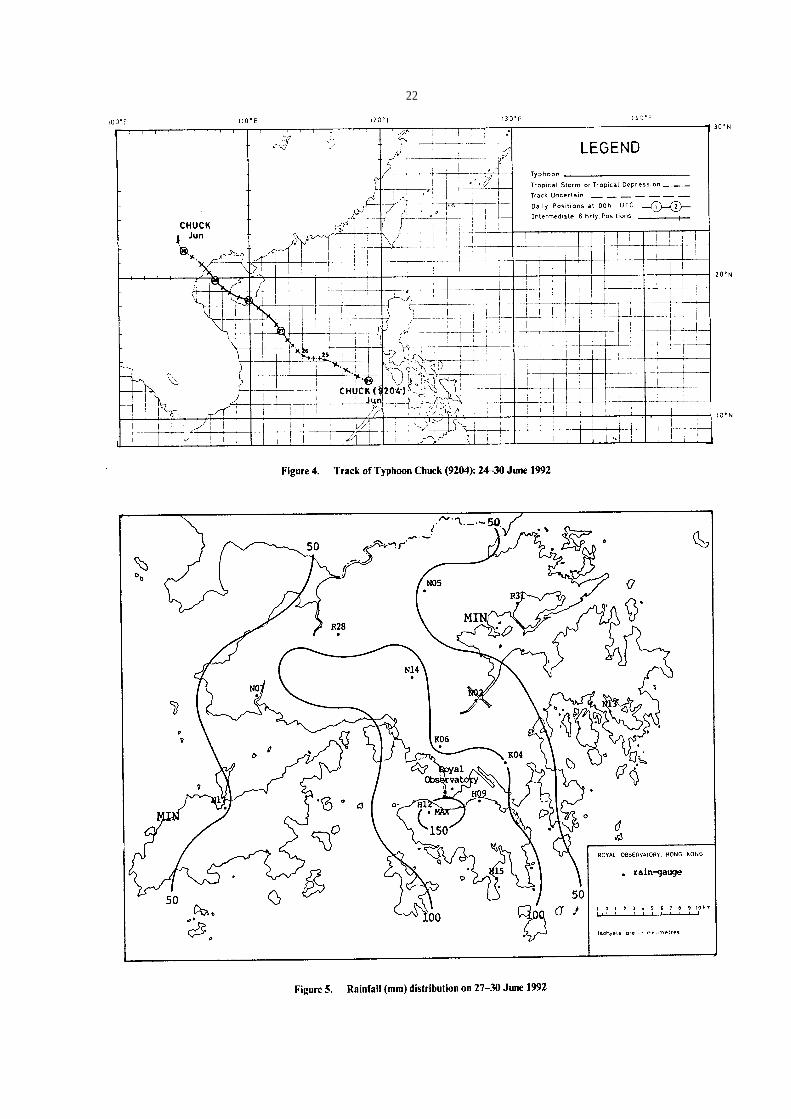
6. GMS-4 infra-red imagery of Chuck at around 5 p.m. on 27 June 1992
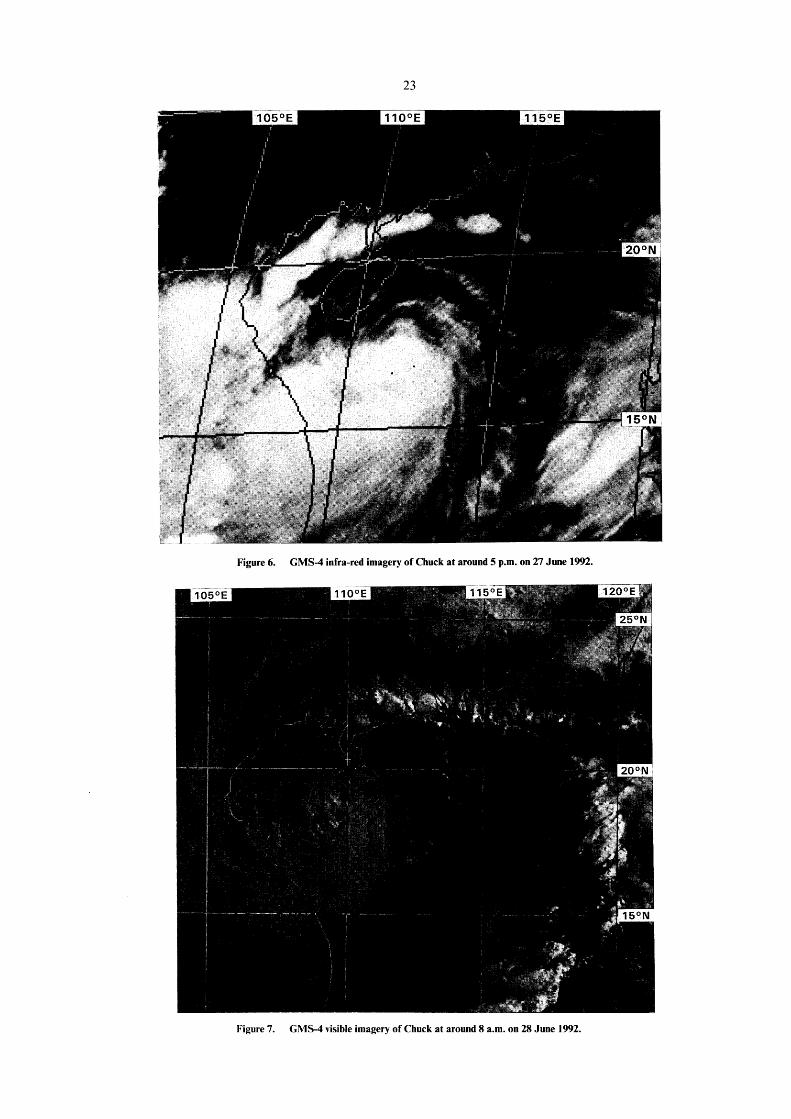
7. GMS-4 visible imagery of Chuck at around 8 a.m. on 28 June 1992
8. A 10-metre tall tree was blown down on Tin Hau Temple Road
9. Track of Typhoon Eli (9205): 9-14 July 1992
10. Rainfall distribution on 11-13 July 1992
11. GMS-4 infra-red imagery of Eli at around 5 p.m. on 12 July 1992
12. GMS-4 visible imagery of Eli at around 2 p.m. on 13 July 1992
13. Track of Tropical Storm Faye (9206): 17-18 July 1992
14. Rainfall distribution on 17-18 July 1992
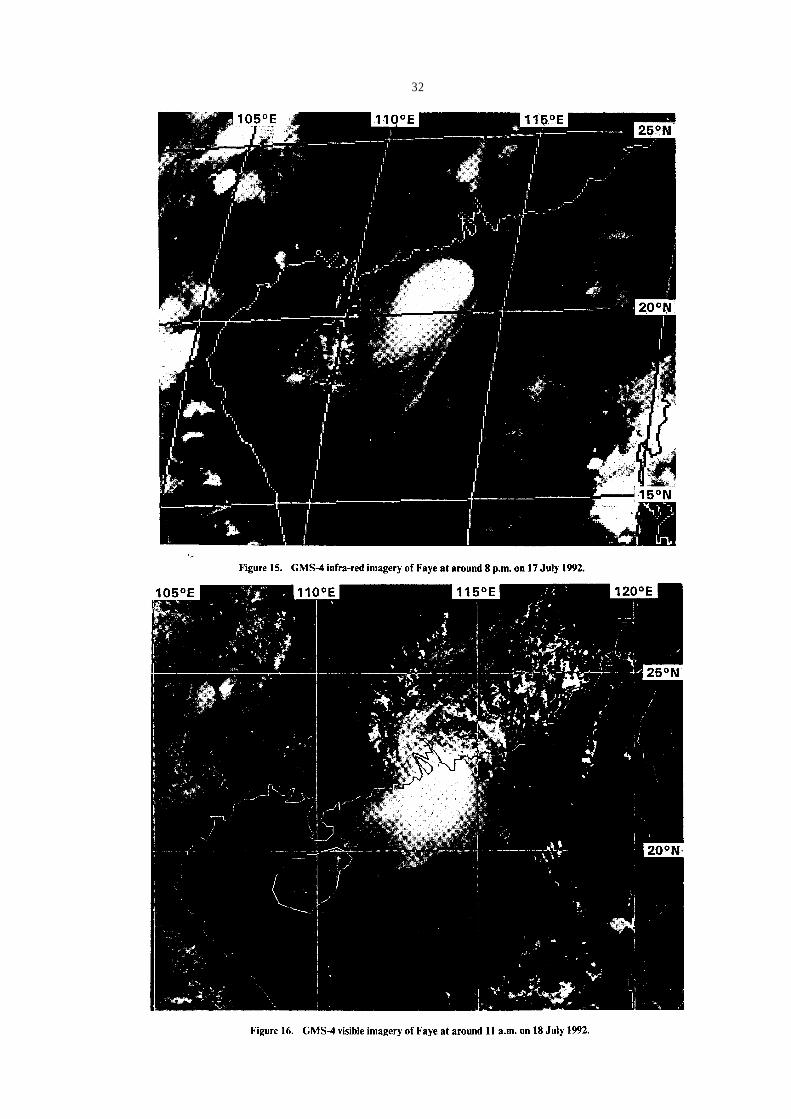
15. GMS-4 infra-red imagery of Faye at around 8 p.m. on 17 July 1992
16. GMS-4 visible imagery of Faye at around 11 a.m. on 18 July 1992
17. Radar display of the rain echoes of Faye at 3.01 a.m. on 18 July 1992
18. Flooding in the New Territories following the heavy downpour due to Faye
19. A badly damaged section of the Tsing Yi South Bridge after it was hit by barges
20. Windows on Wan Chai Tower II broken by blustery winds
21. A barge aground near Tsing Yi Island
22. Track of Severe Tropical Storm Gary (9207): 19-23 July 1992
23. Rainfall distribution on 20-23 July 1992
24. GMS-4 visible imagery of Gary at around 5 p.m. on 21 July 1992
25. GMS-4 visible imagery of Gary at around 2 p.m. on 22 July 1992
26. Two Vietnamese cargo ships aground off Stonecutters Island
27. Loosened scaffoldings on Pratas Street, Cheung Sha Wan
28. Advertisement signboards blown askew on Tonkin Street, Cheung Sha Wan
29. Track of Tropical Storm Mark (9212): 1619 August 1992
30. Rainfall distribution on 16-17 August 1992
31. GMS-4 infra-red imagery of Mark at around 5 a.m. on 17 August 1992
32. GMS-4 visible imagery of Mark at around 8 a.m. on 18 August 1992
13
13
22
22
23
23
24
27
27
28
28
31
31
32
32
33
33
34
34
35
38
38
39
39
40
40
41
44
44
45
45

5
TABLES
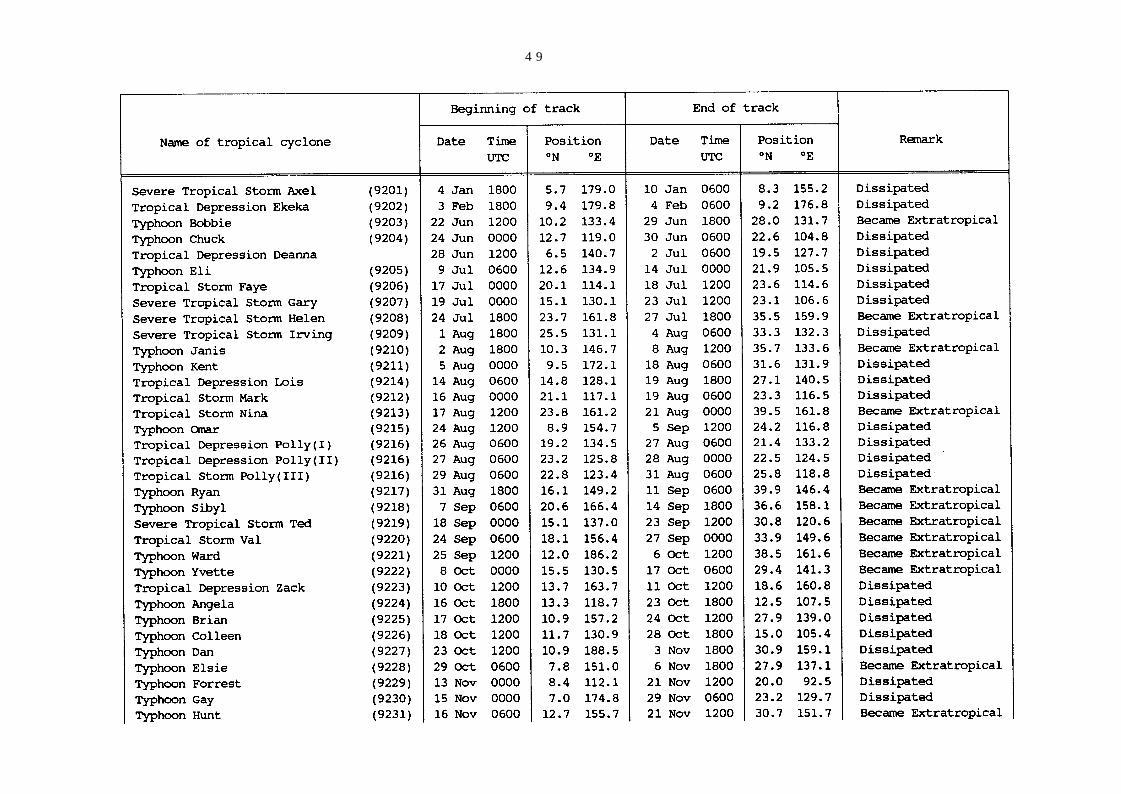
1. List of tropical cyclones in the western North Pacific and the South China Sea in 1992
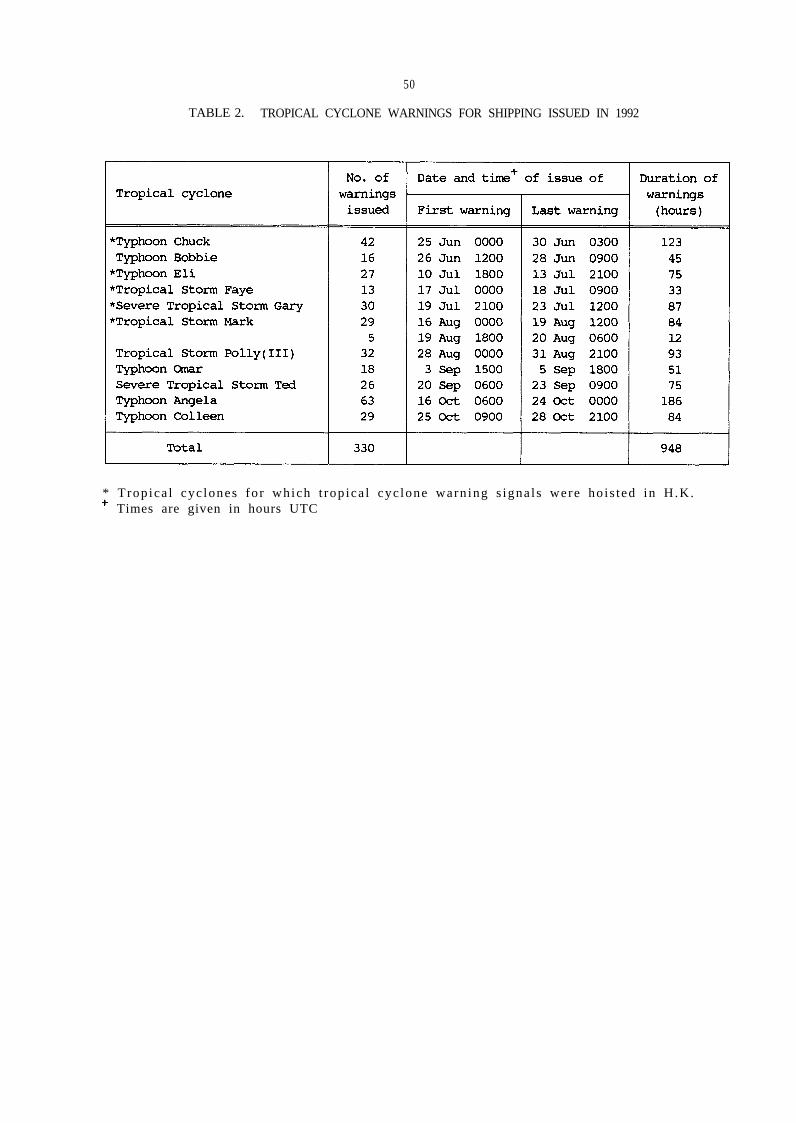
2. Tropical cyclone warnings for shipping issued in 1992
3. Tropical cyclone warning signals hoisted in Hong Kong and number of warning bulletins issuedin 1992
4. Frequency and total duration of display of tropical cyclone warning signals: 1946-1992
5. Number of tropical cyclones in Hong Kong's area of responsibility and the number thatnecessitated the display of tropical cyclone warning signals in Hong Kong: 1956-1992
6. Duration of tropical cyclone warning signals hoisted in Hong Kong: 1956-1992
7. A summary of meteorological observations recorded in Hong Kong during the passages oftropical cyclones in 1992
8. Tropical cyclone rainfall in Hong Kong
9. Typhoons requiring the hoisting of the Hurricane Signal No. 10 during the period 1946-1992
10. Damage caused by tropical cyclones in Hong Kong, 1992
11. Casualties and damage caused by tropical cyclones in Hong Kong: 1963-1992
Page
49
50
51
52
53
54
55
57
59
60
61

6
HONG KONG'S TROPICAL CYCLONE WARNING SIGNALS

Section 1
INTRODUCTION

8
Apart from a short break during 1940-1946, surface observations of meteorological elements since 1884 have beensummarized and published in the Royal Observatory's Meteorological Results. Upper-air observations beganin 1947 and from then onwards the annual publication was divided into two parts, namely Part I-SurfaceObservations and Part II-Upper-air Observations. The publication of Meteorological Results Part II wasterminated in 1981. Upper-air data are now archived on magnetic tapes. Starting from 1987, Part I was re-titled as'Surface Observations in Hong Kong' but the format and contents remained unchanged.
During the period 1884-1939, reports on some destructive typhoons were printed as Appendices to theMeteorological Results. This practice was extended and accounts of all tropical cyclones which caused gales inHong Kong were included in the Director's Annual Departmental Reports from 1947 to 1967 inclusive. The series'Meteorological Results Part III-Tropical Cyclone Summaries' was subsequently introduced. It containedinformation on tropical cyclones over the western North Pacific and the South China Sea. The first issue, whichcontained reports on tropical cyclones occurring in 1968, was published in 1971. Tropical cyclones within the areabounded by the Equator, 45oN, 100oE and 160oE were described. With reconnaissance aircraft reports(terminated from August 1987 onwards) and satellite pictures facilitating the tracking of tropical cyclones over theotherwise data-sparse ocean, the eastern boundary of the area of coverage was extended from 160oE to 180o from1985 onwards. Starting from 1987, the series was re-titled as 'Tropical Cyclones in 19YY' but its contentsremained largely the same.
Tracks of tropical cyclones in the western North Pacific and the South China Sea were published inMeteorological Results up to 1939 and in Meteorological Results Part I from 1947 to 1967. Before 1961, onlydaily positions were plotted on the tracks. The time of the daily positions varied to some extent in the olderpublications but remained fixed at 0000 UTC after 1944. Details of the variation are given in the RoyalObservatory Technical Memoir No. 11, Volume 1. From 1961 onwards, six-hourly positions are shown on thetracks of all tropical cyclones.
Provisional reports on individual tropical cyclones affecting Hong Kong have been prepared since 1960 to meetthe immediate needs of the press, shipping companies and others. These reports are printed and supplied onrequest. Initially, reports were only written on those tropical cyclones for which gale or storm signals had beenhoisted in Hong Kong. By 1968, it had become necessary to produce a report on every tropical cyclone thatnecessitated the hoisting of tropical cyclone warning signals.
In this publication, tropical cyclones are classified into the following four categories according to the maximumsustained surface winds near their centres:
A TROPICAL DEPRESSION (T.D.) has maximum sustained winds of less than 63 km/h.A TROPICAL STORM (T.S.) has maximum sustained winds in the range 63-87 km/h.A SEVERE TROPICAL STORM (S.T.S.) has maximum sustained winds in the range 88-117 km/h.A TYPHOON (T.) has maximum sustained winds of 118 km/h or more.
Throughout this publication, maximum sustained surface winds when used without qualification refer to windspeeds averaged over a period of 10 minutes. Mean hourly winds are winds averaged over a 60-minute intervalending on the hour. Daily rainfall amounts are computed over a 24-hour period ending at midnight Hong KongTime.
Over the western North Pacific and the South China Sea, tropical cyclone names are assigned by the JointTyphoon Warning Center in Guam according to a pre-determined list that undergoes revisions from time to time.Since 1981, a common system for identification of tropical cyclones in the western North Pacific and the SouthChina Sea has been adopted and the Japan Meteorological Agency is delegated with the responsibility ofassigning to each tropical cyclone of tropical storm intensity or above a numerical code of four digits. Forexample, the fourth tropical cyclone of tropical storm intensity or above which occurred within the region in 1992was assigned the code '9204'. In this publication, the appropriate code immediately follows the name of thetropical cyclone in bracket, e.g. Typhoon Chuck (9204)
Surface wind data presented in this report were obtained from a network of anemometers operated by theRoyal Observatory. Details of the stations are listed on the next page:

9
Wind reports were also provided by Hong Kong International Terminal Ltd. at Kwai Chung. Maximum stormsurges caused by tropical cyclones were measured by tide gauges installed at several locations around Hong Kong.The locations of these anemometers and tide gauges are shown in Figure 1.
In Section 2, an overall review of all the tropical cyclones over the western North Pacific and the South ChinaSea in 1992 is presented.
The reports in Section 3 are individual accounts of the life history of tropical cyclones affecting Hong Kong in1992. They include the following information:-
(a) the effects of the tropical cyclone on Hong Kong;(b) the sequence of display of tropical cyclone warning signals;(c) the maximum gust peak speeds and maximum hourly mean winds recorded in Hong Kong;(d) the lowest barometric pressure recorded at the Royal Observatory;(e) the daily amounts of rainfall recorded at the Royal Observatory and selected locations;( f ) the times and heights of the highest tides and maximum storm surges recorded in Hong Kong;(g) satellite pictures and/or radar displays if applicable.Statistics and information relating to tropical cyclones are presented in various tables in Section 4.Six-hourly positions together with the corresponding estimated minimum central pressures and maximum
sustained surface winds for individual tropical cyclones are tabulated in Section 5.In this publication, different times are used in different contexts. The official reference times are given in
Co-ordinated Universal Time and labelled UTC. Times of the day expressed as 'a.m.' or 'p.m.' or as 'morning','evening', etc. in the tropical cyclone narratives are in Hong Kong Time which is eight hours ahead of UTC.

10

Section 2
TROPICAL CYCLONE OVERVIEWFOR 1992

12
In 1992, there were 32* tropical cyclones over the western North Pacific and the adjacent seas bounded by theequator, 45oN, 100oE and 180o. Compared with the 30-year annual average (1961-1990) of 31 tropical cyclones,1992 was a year with near-normal tropical cyclone activity. However, the number of tropical cyclones attainingtyphoon intensity was slightly above normal-a total of 18 typhoons in 1992 against the 30-year annual averageof 15.6. The monthly distribution of the frequency of first occurrence of tropical cyclones and that of typhoons for1992 are shown in Figure 2. The monthly mean frequency of these two parameters during the years 1961-1990 areshown in Figure 3.
Gay (9230) was the most intense typhoon in 1992 while Polly (9216) the most destructive. Ted (9219) wasanother vicious storm which affected the Philippines and China in September. The passages of Gary (9207) acrossthe Philippines in July and Angela (9224) through Vietnam in October both led to heavy casualties while Janis(9210) turned out to be a very costly typhoon for Japan.
Along the coast of China, the preferred landfall locations shifted from Hainan Island and southwestern Chinain July to Taiwan and eastern China in September. Western Japan, in particular Kyushu, was hit by three tropicalcyclones in August. Although the Philippines appeared to have had a relatively quiet year with only three tropicalcyclones passing through, much damage was inflicted by Ted (9219) on northern Philippines. In the late season,Vietnam, Cambodia and Thailand were all visited by tropical cyclones.
During the year, 11 tropical cyclones occurred within the area of responsibility of Hong Kong (i.e. the areabounded by l0oN, 30oN, 105oE and 125oE). This number was lower than the 30-year (1961-90) annual average of16.4. Of the 11 tropical cyclones, four developed within Hong Kong's area of responsibility. Altogether, 330tropical cyclone warnings to ships and vessels were issued by the Royal Observatory in 1992 (Table 2).
Local warning signals were hoisted in Hong Kong for five tropical cyclones. The Strong Wind Signal No. 3 wasthe highest signal required for Typhoon Chuck (9204), Typhoon Eli (9205) and Tropical Storm Faye (9206) whilethe Gale or Storm Signal No. 8 was necessitated for Severe Tropical Storm Gary (9207).
The total tropical cyclone rainfall (defined as the total rainfall recorded at the Royal Observatory from the timewhen a tropical cyclone was centred within 600 km of Hong Kong to 72 hours after the tropical cyclone hasdissipated or moved outside 600 km of Hong Kong) in 1992 amounted to 321.6 mm, 57 per cent below the meanannual value of 741.0 mm (1961-1990). It accounted for 12 per cent of the year's total rainfall of 2678.8 mm.Apart from Chuck, all other tropical cyclones that necessitated the hoisting of tropical cyclone warning signalscame within 600 km of Hong Kong. In addition, a tropical cyclone named Omar (9215) was within 600 km ofHong Kong during its dissipating stage. Rainfall figures associated with these tropical cyclones are given inTable 8(a).
The following is a review of all the tropical cyclones in 1992.The first tropical cyclone in 1992 originated from an area of disturbance over the western North Pacific near the
International Date Line. It developed into Tropical Depression Axel (9201) about 3000 km east of Truk Islandon 5 January. Moving westwards at about 12 km/h, Axel intensified to a tropical storm later that day and becamea severe tropical storm on 6 January. The next day, Axel weakened to a tropical storm, but re-intensified to asevere tropical storm early on 9 January. Tracking west-northwestwards at about 27 km/h, Axel weakened rapidlyto a tropical storm about 790 km east of Truk Island. It degenerated to an area of low pressure over water on10 January.
There was only one tropical cyclone over the western North Pacific in February. Ekeka (9202) formed over thecentral North Pacific. It crossed the International Date Line and entered the western North Pacific as a tropicaldepression on 4 February. Moving westwards towards the Marshall Islands with a speed of about 27 km/h, Ekekaweakened gradually and dissipated over water on the same day.
After a lull lasting over four months, active tropical cyclone development took place over the western NorthPacific and the South China Sea during the last week of June when three disturbances (Bobbie (9203), Chuck(9204) and Deanna) developed in quick succession.
Bobbie formed as a tropical depression about 1 430 km east-southeast of Manila on the evening of 22 June. Itintensified to a tropical storm the next evening and accelerated northwestwards. On 25 June, Bobbie intensifiedfurther and attained typhoon intensity about 730 km east of Manila. It recurved towards the north on the night of26 June. Peak intensity was reached early the next morning when the maximum sustained winds and the minimumsea-level pressure near the centre of Bobbie were estimated to be 155 km/h and 950 hPa respectively. Bobbieturned northeastwards on 28 June and passed about 40 km south-southeast of Okinawa the following day. InOkinawa, transportation was severely disrupted and schools were forced to close. Bobbie weakened to a severetropical storm about 140 km east-northeast of Okinawa while accelerating on a northeastward track. It becameextra-tropical on 30 June.
Two days after the formation of Bobbie, Chuck (9204) developed over the South China Sea. It traversed theSouth China Sea, crossed Hainan Island and Beibu Wan before making landfall over Vietnam. Chucknecessitated the hoisting of tropical cyclone warning signals in Hong Kong. A detailed report on Typhoon Chuckis presented in Section 3.
* including Tropical Storm Ekeka (9202) which formed over the central North Pacific and moved across the International Date Line into thewestern North Pacific.

13

14
The third tropical cyclone in June was Tropical Depression Deanna. It formed about 440 km southeast of Yapon 28 June and moved northwestwards at 22 km/h. Deanna was poorly organized during its lifetime anddegenerated into an area of low pressure while recurving towards the north-northeast on 2 July.
Three tropical cyclones affected the South China Sea in quick succession during July. Eli (9205) hit HainanIsland and landed over northern Vietnam, Faye (9206) brought torrential rain to Hong Kong and Gary (9207)wreaked widespread havoc in southwestern China. All three tropical cyclones necessitated the hoisting of tropicalcyclone warning signals in Hong Kong. Detailed reports on Typhoon Eli, Tropical Storm Faye and SevereTropical Storm Gary are presented in Section 3.
The fourth tropical cyclone to form in July was Helen (9208). It started as a tropical depression about 2 080 kmeast of Iwo Jima on 25 July. Moving northwestwards at 13 km/h, it rapidly intensified to a severe tropical stormabout 1 730 km east of Iwo Jima the next day. Helen then accelerated northwards and weakened to a tropicalstorm. Moving north-northeastwards at a speed of 38 km/h on 27 July, it weakened further to a tropicaldepression about 1 770 km east of Tokyo, and became extra-tropical soon afterwards.
Eight tropical cyclones formed over the western North Pacific and the South China Sea in August. Irving(9209), Janis (9210) and Kent (9211) hit Japan while Mark (9212) and Polly (9216) landed in southeast China.Omar (9215) affected Taiwan and Fujian in early September.
Irving formed as a tropical depression about 350 km east-southeast of Okinawa early on 2 August. Movingnorth-northeastwards at 12 km/h, it intensified to a tropical storm that afternoon. Irving turned northeastwardsand became a severe tropical storm the next day. It weakened to a tropical storm early on 4 August whileadopting a northwestward track. Weakening further to a tropical depression a few hours later, Irving finallydissipated over southern Japan. Heavy rain associated with Irving interrupted air and rail services in Kyushu.
A tropical disturbance developed into Tropical Depression Janis about 410 km south-southeast of Guam earlyon 3 August. It moved northwestwards steadily at 25 km/h and became a tropical storm about 140 kmwest-southwest of Guam that night. Janis strengthened into a severe tropical storm on the night of 4 August andattained typhoon intensity about 940 km northwest of Guam the next morning. On the night of 6 August, Janisreached peak intensity with estimated maximum sustained winds of 165 km/h and minimum sea-level pressureof 940 hPa near its centre. After rampaging across the Ryukyu Islands on 7 August, Janis turned north-northeastwards and weakened to a severe tropical storm about 120 km southwest of Kagoshima early on 8August. It made landfall over Kyushu a few hours later. Janis became extra-tropical that night after skirting thesouthwestern coast of Honshu.
In the Ryukyus, flights to and from Okinawa were cancelled during the close approach of Janis. In Kyushu, twopeople were killed and 41 others were injured. Heavy rain brought on by Janis also caused landslides and floodingthere. About 14 houses were destroyed and several others were flooded. Flights and railway services weresuspended and the electricity supply to several cities was interrupted.
While Janis was making its way towards the Ryukyu Islands, Kent developed as a tropical depression on 5August about 1 230 km south-southeast of Wake Island. Moving west-northwestwards at about 19 km/h, Kentbecame a tropical storm early on 6 August. That night, it intensified and reached severe tropical storm strength. Itweakened briefly to a tropical storm the next day but re-intensified into a severe tropical storm on 9 August as itmoved west-northwestwards. Kent became a typhoon about 1 340 km west of Wake Island the following day andattained peak intensity on 12 August when the maximum sustained winds and the minimum sea-level pressurenear its centre were estimated to be 160 km/h and 945 hPa respectively. After moving north-northwestwards at 10km/h for about three days, Kent turned west-northwestwards at 12 km/h and passed close to the OgasawaraIslands on 15 August. Early the next day, it weakened to a severe tropical storm about 1 040 km east-southeast ofKagoshima. On 18 August, Kent degenerated into an area of low pressure over the coastal waters off easternKyushu.
In southern and western Japan, five people were swept away by waves and two others were reported missingdue to the passage of Kent.
Tropical Depression Lois (9214) formed about 770 km east of Manila on 14 August. It was poorly organizedduring its lifetime and dissipated near the Ogasawara Islands on 20 August.
Mark formed over the northeastern part of the South China Sea on 16 August and subsequently made landfallnear Shantou. It necessitated the hoisting of a tropical cyclone warning signal in Hong Kong. A detailed report ispresented in Section 3.
On the evening of 17 August when Kent was making its way towards southern Japan, Lois traversednortheastwards across the western north Pacific and Mark headed for the south China coast. Meanwhile,Tropical Depression Nina (9213) formed over the western North Pacific about 2 020 km east of Iwo Jima. Movingnorth-northwestwards at 10 km/h and intensifying, Nina became a tropical storm the next day. It weakened to atropical depression about 1 740 km east-northeast of Iwo Jima on 19 August, but temporarily re-gaining tropicalstorm strength on the afternoon of 20 August. Nina evolved into an extra-tropical cyclone on 21 August.
Omar formed over the Caroline Islands about 1 190 km east-southeast of Guam on 24 August and movedwest-northwestwards at about 16 km/h. Gathering strength over water, it attained typhoon intensity about 20 kmeast-southeast of Guam on 28 August. That evening, Omar swept past Guam causing widespread damage. Peakintensity was reached on 29 August when maximum sustained winds and minimum sea-level pressure near itcentre were estimated to be 175 km/h and 935 hPa respectively. Omar weakened to a severe tropical storm about
15
970 km east of Gaoxiong on 2 September. After sweeping across Taiwan on 4 September, Omar weakened to atropical storm and made landfall near Xiamen the next day. Over land, Omar degenerated rapidly to a tropicaldepression and then into an area of low pressure later that day.
In Guam, the fury of Omar killed one person and injured over 100 people. About 5 000 people were madehomeless. Several houses were demolished and power lines were brought down. In addition, electricity and watersupplies were cut off. The total damage was estimated at over US$l00 million.
In Taiwan, Omar claimed two lives and left 12 injured. More than US$65 million worth of damage was left inits wake. Electricity supply to over 766 000 households was cut. Flooding occurred in five counties. In the harbourof Gaoxiong, four ships ran aground.
Omar's remnant also brought disturbed weather to the South China coastal areas. In Hong Kong, localisedheavy rain led to extensive flooding in the northwestern part of the territory on 7 September.
Polly, the last tropical cyclone to form in August, developed as a tropical depression on 26 August. After aseries of dissipation and re-generation, Tropical Depression Polly gained better structure and began to movenorthwestwards towards Taiwan on 29 August. It intensified to a tropical storm about 220 km south-southeast ofTaibei early the next day. Later that day, Polly swept across northern Taiwan and traversed the Taiwan Strait. Itmade landfall near Fuzhou on the morning of 31 August. Polly then weakened rapidly to an area of low pressureand drifted northwards to affect eastern China.
The outer rainbands of Polly affected the Philippines. Swept along by the rain from Polly, volcanic debris fromMount Pinatubo rushed downslope and buried 500 houses in two villages. Five people were killed, several wereinjured and thousands of people had to flee their homes. In Taiwan, eight people were killed and three wereinjured. Thousands of houses were inundated and at least 500 hectares of farmland were destroyed. Electricitysupply to about 24000 households was also cut. The total agricultural and property loss on the island wasestimated at US$72.6 million. In Fujian and Zhejiang, 165 people were killed, 535 were seriously injured and morethan 5 000 000 people were made homeless. The economic loss in the two provinces was estimated at 2 400 millionRMB. In Shandong, the remnant of Polly killed 24 people. Oil-field production in the province was alsodisrupted.
Five tropical cyclones formed over the western North Pacific in September 1992, but none affected the SouthChina Sea. Three of them attained typhoon intensity.
Ryan (9217) started as a tropical depression about 550 km east-northeast of Guam early on 1 September.Generally tracking northwards slowly, Ryan gathered strength over the next two days. On the evening of3 September, Ryan intensified to a typhoon about 660 km north-northeast of Guam. After making ananti-clockwise loop on 4 and 5 September, Ryan accelerated north-northeastwards. On 6 September, peakintensity was reached. The maximum sustained winds and the minimum sea-level pressure near its centre wereestimated to be 160 km/h and 940 hPa respectively. Two days later, Ryan took on a northwestward course with aspeed of 14 km/h. On 10 September, Ryan turned north-northeastwards and weakened to a severe tropical stormabout 530 km southeast of Tokyo. It became extra-tropical the following day.
Tropical Depression Sibyl (9218) formed about 150 km north of Wake Island on 7 September. It initiallymoved south-southeastwards at a speed of 12 km/h. Slowing down the next day, Sibyl intensified to a severetropical storm and made a sharp turn towards the north. On the morning of 9 September, typhoon intensity wasattained when Sibyl was about 110 km east-southeast of Wake Island. Sibyl accelerated to 27 km/h on 10September and tracked west-northwestwards. At its peak intensity on the night of 11 September, the maximumsustained winds and minimum sea-level pressure near its centre were estimated to be 160 km/h and 945 hParespectively. Sibyl weakened to a severe tropical storm about 1 440 km east-northeast of Iwo Jima early on 13September and started to recurve northeastwards that night. Two days later, Sibyl evolved into an extra-tropicalcyclone.
Originating from an area of low pressure east of the Mariana Islands, Ted (9219) developed into a tropicaldepression about 860 km west-northwest of Guam on 18 September and moved westwards at 15 km/h. Itdeepened to a tropical storm early the next day and headed towards the Luzon Strait. Tracking over the coastalwaters of northern Luzon, Ted became a severe tropical storm in the early morning of 21 September. Ittemporarily weakened to a tropical storm that night after making a loop, but intensified again to a severe tropicalstorm the next morning. Ted then tracked northwards and hit the east coast of Taiwan on 22 September.Remaining on a northward track after crossing Taiwan, Ted made landfall over mainland China on the morningof 23 September. It weakened to a tropical storm near Wenzhou and became extra-tropical in the vicinity ofShanghai later that day.
The torrential rain associated with Ted brought flooding and landslides to the northern Philippines, Taiwanand eastern China. In the northern Philippines, at least eight people were killed. A total of 104 houses wasdemolished. In eastern China, at least 53 people were killed and 51 others were reported missing, with most of thecasualties occurring in Zhejiang. About 31 700 houses collapsed, 90 000 hectares of farmland were inundated and333 000 hectares of paddy field in Jiangsu were affected. The total loss was estimated at 2.3 billion RMB.
As Ted dissipated, Val (9220) formed over the Pacific as a tropical depression about 1 340 km east-northeast ofGuam on 24 September. It moved north-northwestwards at about 16 km/h and became a tropical storm about1 320 km east of Iwo Jima the following night. Val evolved into an extra-tropical cyclone as it picked up speedand moved into higher latitudes on 27 September.
16
Out in the central North Pacific, Tropical Storm Ward (9221) crossed the International Date Line on 27September. It moved northwestwards and intensified to a severe tropical storm about 1 130 km east-southeast ofWake Island on 28 September. After completing an anti-clockwise loop, Ward attained typhoon intensity andbegan moving northwards at about 13 km/h the next day. Ward temporarily weakened to a severe tropical stormon 30 September, but re-gained typhoon intensity the following day while heading westwards at 25 km/h. Peakintensity was reached on 2 October when maximum sustained winds and minimum sea-level pressure near itscentre were estimated to be 150 km/h and 950 hPa respectively. On 3 October, Ward started to recurvenorthwards into higher latitudes. After weakening to a severe tropical storm about 1 780 km east of Tokyo earlyon 6 October, it accelerated north-northeastwards and became extra-tropical.
Yvette (9222) formed as a tropical depression on the morning of 8 October about 1 030 km east of Manila andmoved westwards at about 13 km/h. It intensified rapidly to a severe tropical storm about 690 km east of Manilathe next morning. Yvette became slow moving as it attained typhoon intensity on 10 October. After completingan anti-clockwise loop on 11 August, Yvette moved towards the northeast, maintaining its intensity as a typhoonfor the next six days. At its peak intensity, maximum sustained winds and minimum sea-level pressure near itscentre were estimated to be 165 km/h and 940 hPa respectively. Yvette weakened to a severe tropical storm on 16October while moving northeastwards at a speed of 34 km/h. Yvette became extra-tropical soon after passingover the northwest of the Ogasawara Islands on 17 October.
While Yvette was making a loop over the Pacific, another disturbance developed into Tropical Depression Zack(9223) about 690 km south-southwest of Wake Island on 10 October. It moved north-northeastwards at 25 km/hinitially but later turned to the northwest. Zack was short-lived and it dissipated over the western North Pacificthe next day.
Over the South China Sea, Angela (9224) formed as a tropical depression about 290 km west-southwest ofManila in the early morning of 17 October. Tracking along a winding path in the general direction of Vietnam,Angela intensified progressively to a tropical storm later that day and to a severe tropical storm on 18 October. Itthen attained typhoon strength with peak intensity that afternoon. The maximum sustained winds and theminimum sea-level pressure near its centre were estimated to be 120 km/h and 965 hPa respectively. Angelaweakened to a severe tropical storm when it was about 190 km north-northeast of Nansha on 19 October andbriefly to a tropical storm in the early morning of 20 October but re-intensified quickly into a severe tropical stormlater that day. On completing an anti-clockwise looping motion on 21 October, Angela again weakened to atropical storm. The following day, Angela intensified to a severe tropical storm for the fourth time and headedwest-southwestwards slowly. It weakened to a tropical storm again about 330 km northeast of Ho Chi Minh Cityon the evening of 23 October, shortly after making landfall over Vietnam. Angela dissipated over land early thenext morning.
Angela inflicted significant damage upon Vietnam and Cambodia. In Vietnam, flash floods triggered by Angelakilled 47 people. About 17 people were injured while seven other were reported missing. Thousands of hectares ofcrops were destroyed. Other losses included several houses, hundreds of fishing vessels, and tens of thousands oflivestock. Railways and roads were also damaged. In Thailand, two people were killed as a result of inclementweather brought on by Angela. Seven people were reported missing after their boat capsized. About 600 houseswere swept away by flood waters.
Soon after the formation of Angela over the South China Sea. Brian (9225) formed as a tropical depressionabout 1 380 km east-southeast of Guam on 17 October. Moving westwards at about 20 km/h, it deepened to atropical storm about 860 km east-southeast of Guam the following night. Turning northwestwards, Brianintensified further to a severe tropical storm early on 21 October and hit Guam later that day. Four people wereinjured and power and water supplies were disrupted on parts of the island. Brian attained typhoon intensityabout 290 km northwest of Guam early on 22 October and reached peak intensity a few hours later withmaximum sustained winds and minimum sea-level pressure near its centre estimated to be 140 km/h and 960 hParespectively. Brian gradually lost strength as it continued to move northwestwards. On the morning of 24October, it became a tropical storm about 400 km west-southwest of Iwo Jima. Moving quickly at 38 km/h, Brianweakened further to a tropical depression on the night of 24 October and dissipated over water eventually.
With Angela to the west and Brian to the east, Colleen (9226) developed as a tropical depression over thewestern North Pacific on the night of 18 October about 820 km west-northwest of Yap. It intensified to a tropicalstorm the next morning and underwent a 'figure-8' loop. In the process, it gathered strength and became a severetropical storm on 21 October. Completing the looping motion, Colleen weakened to a tropical storm as it beganto head northwards on 23 October. It weakened to a tropical depression early next morning, picked up speed andturned towards the west. Moving at 19 km/h, Colleen re-intensified to a tropical storm on 25 October. The nextday, Colleen lashed the Philippines where one woman was drowned in floods and roads near Baguio were blockedby landslides. After crossing the Philippines, Colleen moved along a generally westward track across the SouthChina Sea. It attained typhoon strength with peak intensity on the morning of 27 October. The maximumsustained winds of 120 km/h and the minimum sea-level pressure of 965 hPa were estimated near its centre.Colleen made landfall over Vietnam about 190 km south-southeast of Danang one day after and degenerated intoan area of low pressure.
Dan (9227) also originated over the central North Pacific. After intensifying to a tropical storm, Dan movedwest-northwestwards at 22 km/h and crossed the International Date Line on 25 October. It became a severe

17
tropical storm about 820 km southeast of Wake Island and accelerated to 31 km/h on 27 October. Dan attainedtyphoon intensity about 160 km northwest of Wake Island on the night of 28 October after passing close to theisland earlier that day. Dan turned southwestwards later on 29 October. It attained peak intensity on 1 Novemberwith maximum sustained winds and minimum sea-level pressure near its centre estimated to be 165 km/h and 940hPa respectively. Dan began to lose strength as it recurved northeastwards on 2 November. It weakened to asevere tropical storm about 1 580 km southeast of Tokyo on the morning of 3 November and to a tropical stormthat afternoon. Dan weakened further to a tropical depression later that evening and dissipated over water shortlyafterwards.
Elsie (9228) developed as a tropical depression about 930 km southeast of Guam on 29 October. Movingnorthwestwards at 6 km/h, it deepened to a tropical storm the next day. Elsie intensified to a severe tropical stormon the night of 31 October when it was about 520 km southeast of Guam. Weakening briefly to a tropical stormearly on 1 November, Elsie intensified again into a severe tropical storm that night. After passing about 140 kmsouth-southwest of Guam early on 3 November, Elsie intensified further to a typhoon the next day. It reachedpeak intensity on 5 November with maximum sustained winds near it centre estimated to be about 165 km/h. Theminimum sea-level pressure was about 940 hPa. Elsie recurved north-northeastwards on 6 November. Movingrapidly at 54 km/h, it weakened to a severe tropical storm about 900 km south-southwest of Tokyo early on 7November and became extra-tropical.
Forrest (9229) originated from a westward travelling disturbance and developed into a tropical depressionabout 650 km east-southeast of Ho Chi Minh City on 13 November. Tracking westwards at 22 km/h, it became atropical storm about 650 km south-southeast of Bangkok on the morning of 15 November. Forrest entered theAndaman Sea after crossing the isthmus of southern Thailand that afternoon. After weakening to a tropicaldepression about 650 km south-southwest of Bangkok, Forrest re-intensified to a typhoon over the Bay of Bengalon 18 November. Forrest attained peak intensity on 19 November when the maximum sustained winds andminimum sea-level pressure near its centre were estimated to be 150 km/h and 950 hPa respectively. Recurvingeastwards towards Burma on 21 November, Forrest weakened rapidly and dissipated over water.
In Vietnam, an aircraft with 31 people on board was reported missing within the circulation of Forrest on 14November. In Thailand, two people were killed and more than 10 000 people were evacuated. The influence ofForrest also extended to Bangladesh where two people were killed and 50 others were injured. Hundreds of houseswere destroyed. Over 400 000 people near the coast had to flee to safety.
During the time when Forrest was moving from the Gulf of Thailand to the Andaman Sea, two tropicalcyclones formed in quick succession over the western North Pacific. Gay (9230) formed as a tropical depressionabout 380 km east of Majuro on 15 November and Hunt (9231) did the same further to the west a day after.
After formation, Gay moved north-northwestwards at a steady speed of 16 km/h. It deepened to a tropicalstorm on the night of 15 November and turned westwards the next day. Gay intensified to a severe tropical stormon 17 November and to a typhoon some 24 hours later when it was about 530 km northwest of Majuro. At peakintensity on 20 November, the maximum sustained winds near its centre were estimated to be 185 km/h. Theminimum sea-level pressure was as low as 925 hPa. Gay skirted past Guam on 23 November and turnednorthwestwards two days later. On 28 November, Gay weakened to a severe tropical storm about 880 kmsouth-southeast of Okinawa and began to take on a northward course. Moving closer to Okinawa the next day,Gay weakened further to a tropical storm. It dissipated as an area of low pressure soon afterwards.
The passage of Gay over the Marshall Islands left one woman dead and 5 000 people homeless. In Guam, allaircraft and vessel movements ceased in Gay's fury. All other activities on the island also came to a standstill.
Tropical Depression Hunt formed about 1 180 km east of Guam on 16 November. It intensified to a tropicalstorm about 900 km east of Guam early the next day and became a severe tropical storm that night. Turning tothe northwest on 18 November, Hunt skirted past Guam and attained typhoon intensity when it was about 150km northwest of the island. Peak intensity was reached when Hunt was about to recurve towards the northeast on20 November. The maximum sustained winds and minimum sea-level pressure near its centre were estimated to be150 km/h and 950 hPa respectively. Moving into the higher latitudes, Hunt weakened rapidly and becameextra-tropical on 21 November.
Note: Casualties and damage figures were consolidated from press reports.

Section 3
REPORTS ON TROPICAL CYCLONESAFFECTING HONG KONG IN 1992

20
(a) Typhoon Chuck (9204)
24-30 June 1992
The track of Chuck is shown in Figure 4
An area of disturbed weather over the western North Pacific weakened while traversing the Philippines on 22June. After entering the South China Sea the next day, the system re-organized and became the first tropicalcyclone to affect the South China Sea in 1992.
The disturbance developed into Tropical Depression Chuck about 300 km southwest of Manila on 24 June andmoved at 16 km/h towards the west-northwest. It intensified to a tropical storm about 460 km southeast of Xishaon 25 June and slowed down to 7 km/h while tracking to the west. During the night, Chuck intensified further to asevere tropical storm about 360 km southeast of Xisha and took on a northwestward track towards HainanIsland. On the morning of 26 June, winds of over 100 km/h were reported by a ship, 'Chilham Castle', about 110km south of the centre of Chuck. Typhoon intensity was attained on the morning of 27 June just before Chuckswept across Xisha Qundao. At Xisha during the closest approach of Chuck, the mean sea-level pressure of 966.2hPa was recorded.
Turning gradually west-northwestwards at 18 km/h, Chuck made landfall over the southern coast of Hainan onthe morning of 28 June. A weather observing station (Yaxian: 59948) recorded a mean sea-level pressure of 964.1hPa as Chuck passed 40 km to its north-northeast that morning. After traversing the southwestern part ofHainan, Chuck entered Beibu Wan that evening. Still maintaining typhoon intensity, Chuck tracked to thenorthwest at 13 km/h over Beibu Wan. It made landfall over the northern part of Vietnam about 100 kmeast-southeast of Hanoi on the evening of 29 June and weakened rapidly over land. It finally dissipated innorthern Vietnam on 30 June.
In Hainan one person was killed and 19 others were injured. Houses damaged or destroyed totalled nearly29 000. About 54 000 hectares of agricultural land were affected and almost 1 400 heads of livestock were killed.About 100 hectares of fresh water fish ponds were affected and 89 fishing boats capsized. Direct economic loss wasestimated at 223 million RMB. Records of storm surge were also reported along the coastal areas of Guangxi. Anestimated 7 000 hectares of rice paddy and fish ponds were ruined. More than 700 dykes were damaged and oneperson was killed.
In northern Vietnam where Chuck landed, five people were killed, nine were reported missing and three wereinjured. Tens of ships capsized and dykes were ruined. In Hanoi, low-lying areas were flooded. About 500 treeswere uprooted and 140 houses were damaged.
In Hong Kong the Stand By Signal No. 1 was hoisted at 8.50 a.m. on 27 June when Typhoon Chuck was about690 km to the south-southwest. At the time, the weather was fine with moderate easterly winds, strong at timesoffshore. As winds continued to strengthen that night, the Strong Wind Signal No. 3 was hoisted at 8.15 p.m.when Typhoon Chuck was about 620 km to the south-southwest. Gale force winds affected offshore areas duringthe night. Rain also started that night and became heavy with squalls the next day. Chuck came closest to HongKong at about 2 a.m. on 28 June when it was about 600 km to the southwest. At the Royal Observatory, thelowest sea-level pressure of 999.0 hPa was recorded at about 4 p.m. the previous day. All signals were lowered at2.00 p.m. on 28 June when Chuck was over Hainan Island about 650 km to the southwest of Hong Kong. Aswinds moderated, rain became infrequent on 29 June and fine weather returned on 30 June.
Torrential rain on 28 June caused flooding in the southern part of Hong Kong Island, the Mid-levels andWestern District. Altogether 57 cases of flooding were reported. In Wong Chuk Hang, flood water was reportedto be about one metre high. A 10-metre tree collapsed in Tin Hau Temple Street and another one toppled inConduit Road. In Tsz Wan Shan, a signboard was blown to a state of near collapse. A pier was also damaged bysea waves in Shek Pik. Fortunately, no casualties were reported during the approach of Chuck. Some ferryservices to China were also affected.
The rainfall distribution associated with Chuck is shown in Figure 5. Information on wind, rainfall and tideduring the passage of Chuck is given as follows:
Maximum gust peak speeds and maximum hourly mean winds together with associated wind directionsrecorded at various stations during the hoisting of tropical cyclone warning signals for Chuck:-

21
Daily rainfall amounts in millimetres recorded at the Royal Observatory and other stations during the passageof Chuck:
Times and heights of the maximum sea level and maximum storm surge recorded at tide stations in Hong Kongduring the passage of Chuck:-
22

25
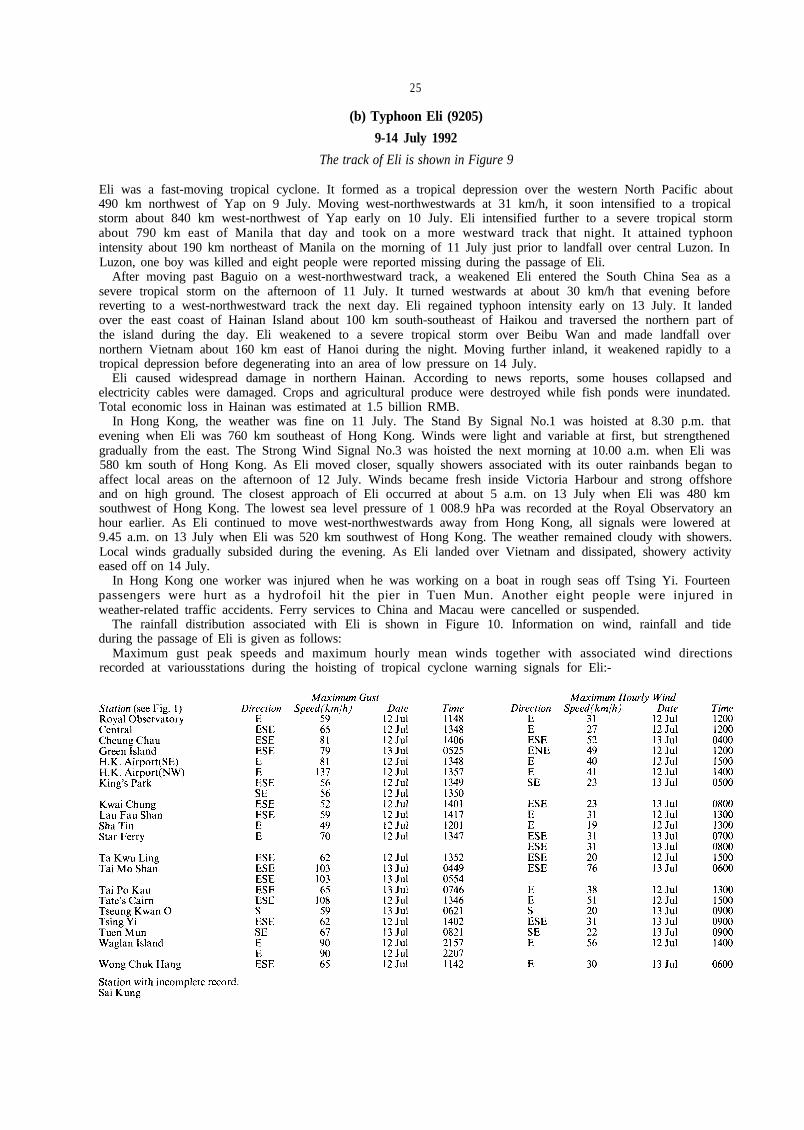
(b) Typhoon Eli (9205)
9-14 July 1992
The track of Eli is shown in Figure 9
Eli was a fast-moving tropical cyclone. It formed as a tropical depression over the western North Pacific about490 km northwest of Yap on 9 July. Moving west-northwestwards at 31 km/h, it soon intensified to a tropicalstorm about 840 km west-northwest of Yap early on 10 July. Eli intensified further to a severe tropical stormabout 790 km east of Manila that day and took on a more westward track that night. It attained typhoonintensity about 190 km northeast of Manila on the morning of 11 July just prior to landfall over central Luzon. InLuzon, one boy was killed and eight people were reported missing during the passage of Eli.
After moving past Baguio on a west-northwestward track, a weakened Eli entered the South China Sea as asevere tropical storm on the afternoon of 11 July. It turned westwards at about 30 km/h that evening beforereverting to a west-northwestward track the next day. Eli regained typhoon intensity early on 13 July. It landedover the east coast of Hainan Island about 100 km south-southeast of Haikou and traversed the northern part ofthe island during the day. Eli weakened to a severe tropical storm over Beibu Wan and made landfall overnorthern Vietnam about 160 km east of Hanoi during the night. Moving further inland, it weakened rapidly to atropical depression before degenerating into an area of low pressure on 14 July.
Eli caused widespread damage in northern Hainan. According to news reports, some houses collapsed andelectricity cables were damaged. Crops and agricultural produce were destroyed while fish ponds were inundated.Total economic loss in Hainan was estimated at 1.5 billion RMB.
In Hong Kong, the weather was fine on 11 July. The Stand By Signal No.1 was hoisted at 8.30 p.m. thatevening when Eli was 760 km southeast of Hong Kong. Winds were light and variable at first, but strengthenedgradually from the east. The Strong Wind Signal No.3 was hoisted the next morning at 10.00 a.m. when Eli was580 km south of Hong Kong. As Eli moved closer, squally showers associated with its outer rainbands began toaffect local areas on the afternoon of 12 July. Winds became fresh inside Victoria Harbour and strong offshoreand on high ground. The closest approach of Eli occurred at about 5 a.m. on 13 July when Eli was 480 kmsouthwest of Hong Kong. The lowest sea level pressure of 1 008.9 hPa was recorded at the Royal Observatory anhour earlier. As Eli continued to move west-northwestwards away from Hong Kong, all signals were lowered at9.45 a.m. on 13 July when Eli was 520 km southwest of Hong Kong. The weather remained cloudy with showers.Local winds gradually subsided during the evening. As Eli landed over Vietnam and dissipated, showery activityeased off on 14 July.
In Hong Kong one worker was injured when he was working on a boat in rough seas off Tsing Yi. Fourteenpassengers were hurt as a hydrofoil hit the pier in Tuen Mun. Another eight people were injured inweather-related traffic accidents. Ferry services to China and Macau were cancelled or suspended.
The rainfall distribution associated with Eli is shown in Figure 10. Information on wind, rainfall and tideduring the passage of Eli is given as follows:
Maximum gust peak speeds and maximum hourly mean winds together with associated wind directionsrecorded at variousstations during the hoisting of tropical cyclone warning signals for Eli:-

26
Daily rainfall amounts in millimetres recorded at the Royal Observatory and other stations on days whentropical cyclone warning signals for Eli:-
Times and heights of the maximum sea level and maximum storm surge recorded at tide stations in Hong Kongduring the passage of Eli:-

27
Figure 9. Track of Typhoon Eli (9205): 9-14 July 1992.
Figure 10. Rainfall (mm) distribution on 11-13 July 1992.

28

29
(c) Tropical Storm Faye (9206)
17-18 July 1992
The track of Faye is shown in Figure 13
Although Faye was a tropical storm with a short life span, it was at its fiercest when it made landfall near HongKong on 18 July and produced one of the most severe rainstorms seen in the passages of tropical cyclones,
Faye originated from an area of low pressure over the western North Pacific to the east of the Philippines on 14July. It moved across the northern tip of Luzon the next day and entered the South China Sea in the evening. Thedisturbance drifted westwards across the northern part of the South China Sea on 16 July with no significantintensification. But during the night, it turned northwards and intensified. It became Tropical Depression Fayeabout 240 km south of Hong Kong on the morning of 17 July and moved at a speed of 12 km/h towards the PearlRiver estuary. Faye turned momentarily to the north-northwest later that day and intensified to a tropical stormabout 110 km south-southwest of Hong Kong that evening. During the night, Faye turned back towards the PearlRiver estuary on a north-northeastward track, skirting past just to the east of Macau on the morning of 18 July. Itmade landfall later that morning about 50 km northwest of the Royal Observatory Headquarters and moved intoeastern Guangdong. Faye eventually dissipated over land about 150 km north-northeast of Hong Kong thatevening.
In Hong Kong, the Stand By Signal No. 1 was hoisted at 9.00 a.m. on 17 July when Faye developed into atropical depression. At that time, Faye was about 230 km to the south. The weather was cloudy with some rain.Winds were moderate easterly at first but freshened during the day. The Strong Wind Signal No. 3 replaced theStand By Signal No. 1 at 11.50 p.m. as Faye, located about 100 km southwest of Hong Kong at the time,continued to intensify and drifted closer to the coast. Winds turned southerly and strengthened during the night.Conditions deteriorated in the early hours of 18 July and became stormy as Faye moved into the Pearl Riverestuary. By the morning, torrential rain accompanied by severe squalls associated with a landing Faye batteredHong Kong, with the western part of the territory bearing the brunt of the rainstorms. Severe squalls and frequentthunderstorms persisted for most part of the day before easing off in the evening as Faye weakened. The heaviestrain fell in the northwestern part of the New Territories where daily rainfall amount exceeding 300 millimetres wasrecorded. Faye came closest at about 9 a.m. on 18 July when it was about 50 km west-northwest of the RoyalObservatory Headquarters. The lowest sea-level pressure of 1 003.6 hPa was recorded at 6 a.m. and 7 a.m. at theRoyal Observatory. After Faye landed, winds over Hong Kong quickly subsided. All signals were lowered at4.05 p.m. on 18 July when a dissipating Faye was about 100 km to the north. The weather soon turned sunnyon 19 July.
In Hong Kong, two people were killed and 24 were injured during the passage of Faye. Altogether, 152 cases offlooding and 40 cases of landslip were reported. Flooding was most severe in the northwestern part of the NewTerritories, particularly in Yuen Long, Kam Tin and San Tin. Landslips occurred in Tsuen Wan, Kwai Chung,Tuen Mun, Cheung Chau, Sha Tin and Hong Kong Island. A landslip in Tai Wo Village in Tsuen Wan led to theevacuation of 200 people from 40 squatter houses. Collapse of scaffoldings occurred in Wan Chai, Central andTsim Sha Tsui while a brick wall crumbled in Central. Trees were blown down in Mount Davis Road, HappyValley and Ho Man Tin. In the New Territories, about one-fifth of the total agricultural land was inundated. Theworst affected areas were Pat Heung, Kam Tin, Sha Tau Kok, Ta Kwu Ling and Sheung Shui. Farmers reporteda loss of 1 000 tonnes of vegetables at an estimated cost of HK$3 million. More than 20 000 heads of poultries,800 pigs and over 100 tonnes of fresh-water fish were lost. The damage incurred was estimated to be over HK$5million. In Hong Kong waters, a Greek container, 'Inchon Glory', ran aground off Lamma Island and a bargesuffered the same fate near Tsing Yi Island. Two other barges crashed into the Tsing Yi South Bridge, forcing theclosure of one lane of the bridge for at least a month and restricting the vehicular traffic to and from the island.Ferry services to China and Macau were also suspended. At the airport, international flights were cancelled ordelayed on the morning of 18 July.
In southern China, air traffic in Guangzhou and Shenzhen airports was affected. Heavy rain also disrupted thepower supply to the Shenzhen airport.
In Macau, torrential rain caused flooding in many places. Gales brought by Faye also led to the closure of theMacau-Taipa bridge for several hours.
The rainfall distribution associated with Faye is shown in Figure 14. Information on wind, rainfall and tideduring the passage of Faye is given as follows:
Maximum gust peak speeds and maximum hourly mean winds together with associated wind directionsrecorded at various stations during the hoisting of tropical cyclone warning signals for Faye:-

30
Daily rainfall amounts in millimetres recorded at the Royal Observatory and other stations on days whentropical cyclone warning signals were hoisted for Faye:-
Times and heights of the maximum sea level and maximum storm surge recorded at tide stations in Hong Kongduring the passage of Faye:-

31
32


36
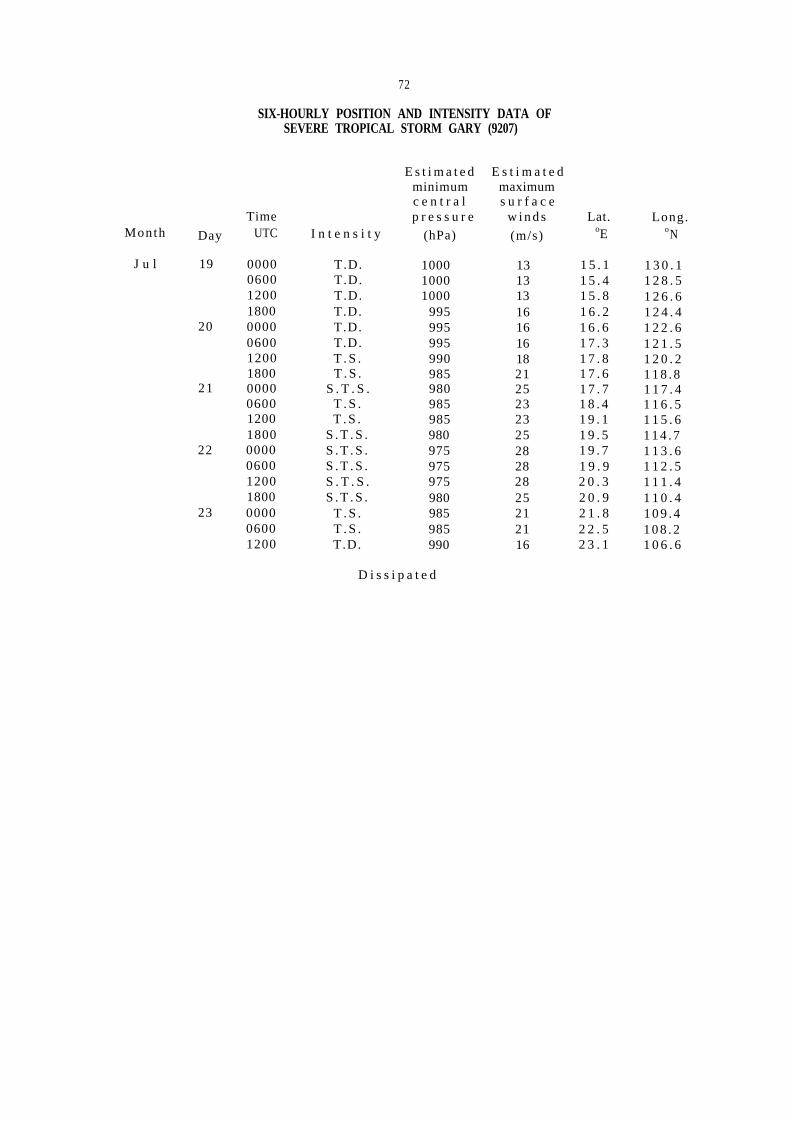
(d) Severe Tropical Storm Gary (9207)
19-23 July 1992
The track of Gary is shown in Figure 22
Gary developed into a tropical depression about 980 km east of Manila on the morning of 19 July and movedwest-northwestwards rapidly at about 30 km/h. It landed over the east coast of Luzon about 280 kmnorth-northeast of Manila the next morning. Slowing down to a speed of 23 km/h, Gary tracked northwestwardsacross northern Luzon during the day and turned westwards into the South China Sea that evening. In northernLuzon, 22 people were killed and more were reported missing.
Gary intensified to a tropical storm over the warm waters of the South China Sea on the evening of 20 July. Itturned northwestwards the next day, moving at 20 km/h towards the coast of Guangdong. After intensifying to asevere tropical storm about 310 km south of Hong Kong early on 22 July, Gary took on a more westward track.As it approached the northeastern tip of Hainan Island, Gary turned northwestwards and hit Leizhou Peninsula,landing about 20 km southwest of Zhanjiang in the early hours of 23 July. It moved into Guangxi during the dayand gradually weakened. By that evening, it had degenerated into a tropical depression about 180 km west ofNanning. As it moved further inland, Gary was downgraded to an area of low pressure during the night.
Gary inflicted extensive damage upon southwestern Guangdong and Guangxi. Gales and torrential rain causeddisruptions in electricity supply, water supply and communication in Zhanjiang and neighbouring regions.According to news reports, one person was killed and nine were injured in Guangdong. About 20 000 housescollapsed and 100 000 others were damaged. An estimated 146 000 hectares of farmland were affected. Othermajor losses included 86 bridges, 700 boats and 362 kilometres of road. The total economic loss was estimated at 5billion RMB. In Guangxi 25 people were killed and 54 were injured. About 23 000 houses collapsed or weredamaged. 4 000 hectares of farmland were affected. Also damaged were 400 bridges, 680 kilometres of road and304 kilometres of drainage pipes. The total loss in Guangxi was estimated at 1 billion RMB.
In Hong Kong the Stand By Signal No.1 was hoisted at 10.30 p.m. on 20 July when Gary was 770 km southeastof Hong Kong. Winds were light and variable, but became moderate northeasterly on the morning of 21 July. Theweather turned cloudy with isolated showers. As winds strengthened gradually from the northeast in theafternoon, the Strong Wind Signal No.3 was hoisted at 3.45 p.m. when Gary was 470 km south-southeast ofHong Kong.
The No. 8 NORTHEAST Gale or Storm Signal was hoisted at 5.45 a.m. on 22 July when Gary was about 290km to the south. Gale force winds were experienced offshore and in exposed areas of the territory. The No. 8SOUTHEAST Gale or Storm Signal replaced the No. 8 NORTHEAST Gale or Storm Signal at 11.00 a.m. asGary moved to the southwest quadrant of Hong Kong. At the time, Gary was 300 km south-southwest of HongKong. The closest approach occurred round about 7 a.m. on 22 July when Gary was 290 km south of HongKong. The lowest sea-level pressure of 1 002.4 hPa was recorded at the Royal Observatory at 2 p.m. that day.Showers became more frequent later during the day. The No. 8 SOUTHEAST Gale or Storm Signal was replacedby the Strong Wind Signal No.3 at 4.15 p.m. when Gary was 330 km to the southwest and continued to moveaway from Hong Kong. Local winds gradually subsided towards the evening. All signals were lowered at 6.50p.m. when Gary no longer posed a threat to the territory. By then, Gary was located about 350 km southwest ofHong Kong. While Gary weakened over Guangxi, cloudy weather and intermittent light rain persisted until 24July.
In Hong Kong 18 people were injured by falling objects. Advertising boards and scaffoldings were blown askewin Shamshuipo, Cheung Sha Wan, Tsim Sha Tsui, Mongkok, Kwun Tong and the Mid-Levels. Toppled treeswere reported in Shek Kip Mei and Yuen Long. Two Vietnamese cargo ships ran aground off Stonecutters Island,but damage was slight. Ferry services to China and Macau were cancelled or suspended.
The rainfall distribution associated with Gary is shown in Figure 23. Information on wind, rainfall and tideduring the passage of Gary is given as follows:
Maximum gust peak speeds and maximum hourly mean winds together with associated wind directionsrecorded at various stations during the hoisting of tropical cyclone warning signals for Gary:-

37
Daily rainfall amounts in millimetres recorded at the Royal Observatory and other stations during the passageof Gary:-
Times and heights of the maximum sea level and maximum storm surge recorded at tide stations in Hong Kongduring the passage of Gary:-

38

39


In eastern Guangdong, one person was killed and another was reported missing. Two people were injured.Heavy rain fell in the Shantou area. About 150 houses collapsed, 16 000 hectares of farmland and 1 000 hectaresof fish ponds were inundated. The total loss was estimated at 67 million RMB.
42
(e) Tropical Storm Mark (9212)
16-19 August 1992
The track of Mark is shown in Figure 29
Cloud clusters associated with an area of low pressure developed over the northeastern part of the South ChinaSea in mid August. From this area of disturbed weather, Tropical Depression Mark formed about 330 kmeast-southeast of Hong Kong on the morning of 16 August. It moved southwestwards initially at 9 km/h andmade an anti-clockwise loop around the island of Dongsha during the day.
Mark headed northeastwards on the evening of 16 August and further intensified to a tropical storm about 390km east of Hong Kong the next morning. Moving slowly at 8 km/h, it gradually turned towards the northwestduring the night. Mark attained peak intensity on the morning of 18 August before weakening to a tropicaldepression that evening. It then re-intensified to a tropical storm just prior to landfall about 20 km northeast ofShantou on the morning of 19 August. Mark then turned south-southwestwards and weakened rapidly to an areaof low pressure as it moved out to sea.
In Hong Kong the Stand By Signal No. 1 was hoisted at 10.15 a.m. on 16 August soon after the formation ofTropical Depression Mark. At the time, Mark was about 320 km to the east-southeast. Winds in Hong Kong weremoderate northerlies and the weather was hot. With Mark moving towards the coast of eastern Guangdong nearShantou, the Stand By Signal No. 1 was lowered at 11.30 a.m. on 17 August. At the time, Mark was about 400 kmeast of Hong Kong. The lowest sea-level pressure of 997.6 hPa was recorded at the Royal Observatory at 5 p.m.on 17 August. Mark made landfall near Shantou on 19 August and weakened to an area of low pressure over thecoastal areas. Mark came closest to Hong Kong at 2 p.m. that afternoon before it weakened to an area of lowpressure about 260 km to the east-northeast. But its remnant moved out to sea and drifted westwards along thecoastal waters of Guangdong, passing about 60 km to the south of Hong Kong on 21 August. Winds turnedeasterly on the evening of 20 August and the weather was windy with some rain on the following day. Winds soonsubsided on the morning of 22 August, but cloudy and showery conditions continued before fine weather returnedon 25 August.
In Hong Kong, a few minor landslides occurred but no casualties were reported. Some ferry services to ports insoutheastern China were cancelled.
The rainfall distribution associated with Mark is shown in Figure 30. Information on wind, rainfall and tideduring the passage of Mark is given as follows:
Maximum gust peak speeds and maximum hourly mean winds together with associated wind directionsrecorded at various stations during the hoisting of tropical cyclone warning signal for Mark:-

43
Daily rainfall amounts in millimetres recorded at the Royal Observatory and other stations on days whentropical cyclone warning signal was hoisted for Mark:-
Times and heights of the maximum sea level and maximum storm surge recorded at tide stations in Hong Kongduring the passage of Mark:-

44

45

Section 4
TROPICAL CYCLONE STATISTICSAND TABLES

48
TABLE 1 is a list of tropical cyclones in 1992 in the western North Pacific and the adjacent seas (i.e. the areabounded by the Equator, 45oN, 100oE and 180o). The dates cited are the residence times of each tropical cyclonewithin the above-mentioned region and as such might not cover the full life-span. This limitation applies to allother elements in the table.
TABLE 2 gives the number of tropical cyclqne warnings for shipping issued by the Royal Observatory in 1992,the durations of these warnings and the times of issue of the first and last warnings for all tropical cyclones inHong Kong's area of responsibility (i.e. the area bounded by l0oN, 30oN, 105oE and 125oE). Times are given inhours and minutes in UTC.
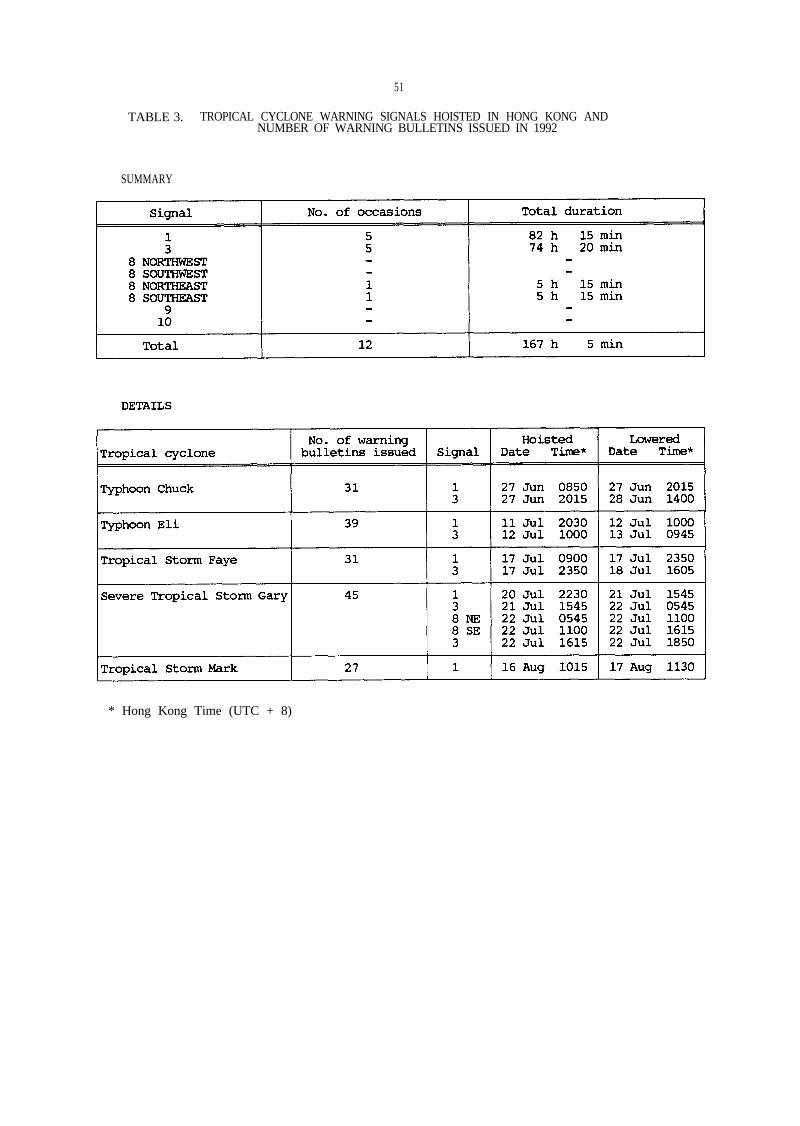
TABLE 3 presents a summary of the occasions/durations of the hoisting of tropical cyclone warning signals in1992. The sequence of the signals displayed and the number of tropical cyclone warning bulletins issued for eachtropical cyclone are also given. Times are given in hours and minutes in Hong Kong Time.
TABLE 4 presents a summary of the occasions/durations of the hoisting of tropical cyclone warning signalsfrom 1956 to 1992 inclusive.
TABLE 5 gives the annual number of tropical cyclones in Hong Kong's area of responsibility between 1956 and1992. The annual number of tropical cyclones causing tropical cyclone warning signals to be raised in Hong Kongis also included.
TABLE 6 shows the maximum, mean and minimum durations of the tropical cyclone warning signals hoistedduring the period 1956-1992.
TABLE 7 is a summary of meteorological information for each tropical cyclone affecting Hong Kong in 1992.Information on the nearest approach together with an estimate of the minimum central pressure of each tropicalcyclone during its closest approach, the maximum winds at the Royal Observatory and Waglan Island, theminimum mean sea-level pressure recorded at the Royal Observatory and the maximum storm surge (the excess,in metres, of the actual water level over that predicted in the Tide Tables) are included.
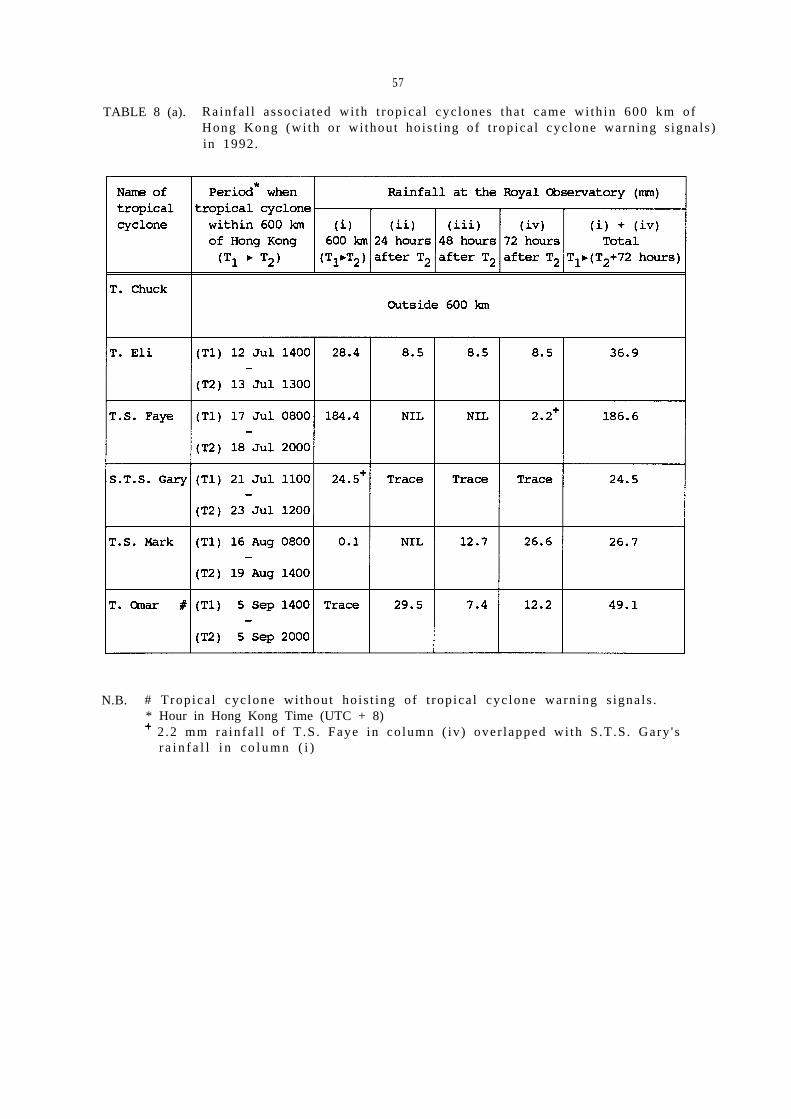
TABLE 8 tabulates the amount of rainfall associated with each tropical cyclone that came within 600 km ofHong Kong in 1992 and highlights the 10 wettest tropical cyclones in Hong Kong for the period 1884-1939 and1947-1992.
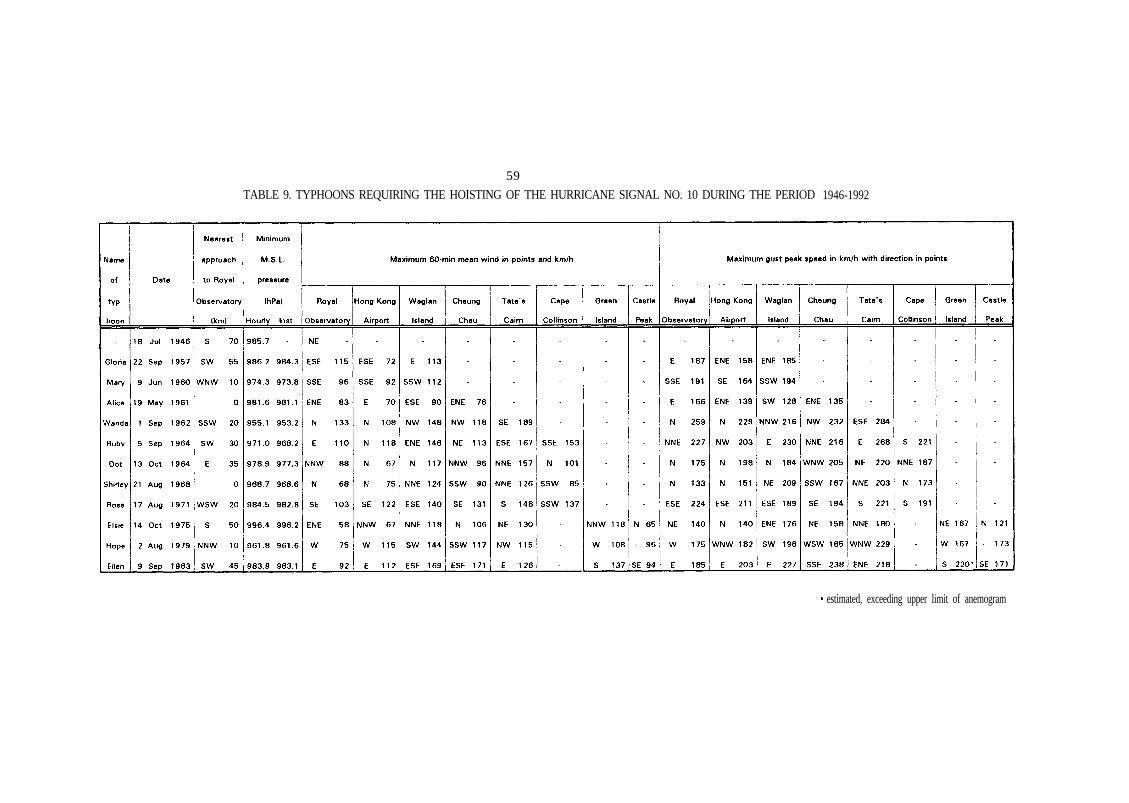
TABLE 9 provides some meteorological information for those typhoons requiring the hoisting of the HurricaneSignal No. 10 in Hong Kong since 1946. The information presented includes the distances and bearings of neareatapproach, the minimum mean sea-level pressures recorded at the Royal Observatory and the maximum 60-minutemean winds and maximum gust peak speeds recorded at some stations in Hong Kong.
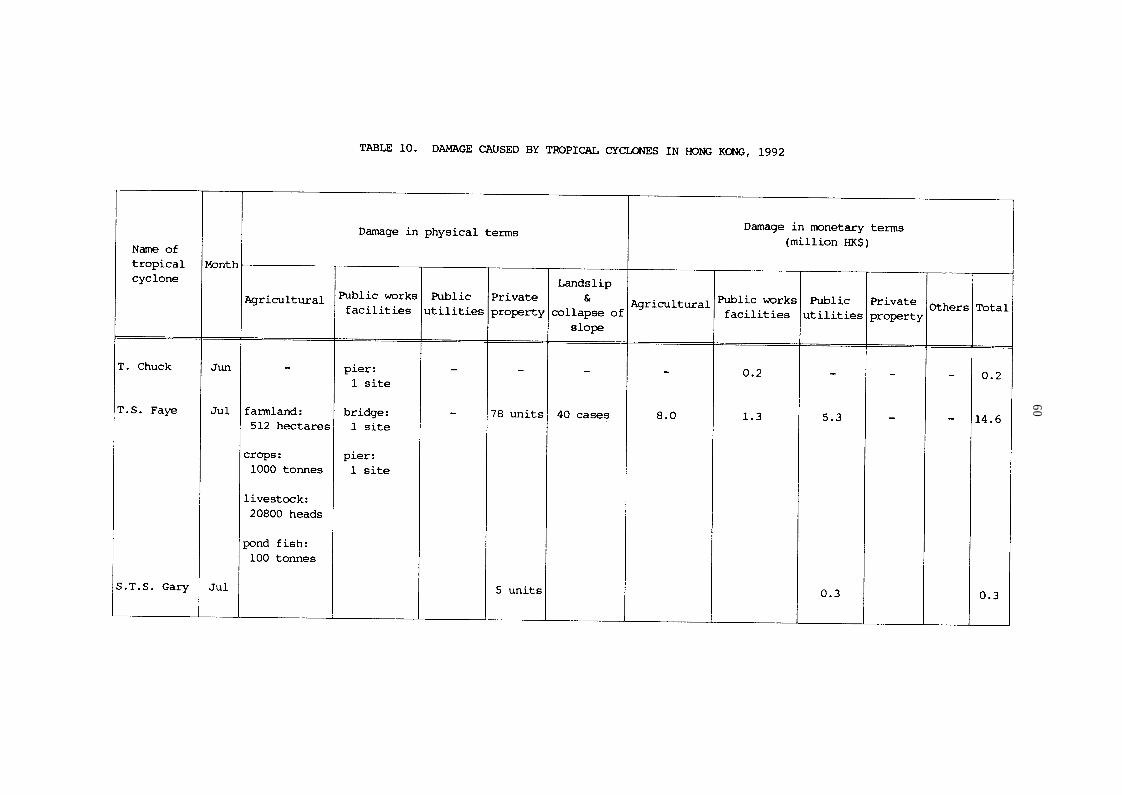
TABLE 10 contains damage caused by tropical cyclones in 1992. The information is compiled from reports byvarious government departments, public utility companies and local newspapers.
TABLE 11 presents the casualties and damage figures associated with tropical cyclones in Hong Kong for thepast 30 years. The information is compiled from local newspaper reports and from the Marine Departmentsrecords.
4 9
50
TABLE 2. TROPICAL CYCLONE WARNINGS FOR SHIPPING ISSUED IN 1992
* Tropica l cyc lones fo r which t rop ica l cyc lone warn ing s igna l s were ho is ted in H.K.Times are given in hours UTC
51
TABLE 3. TROPICAL CYCLONE WARNING SIGNALS HOISTED IN HONG KONG ANDNUMBER OF WARNING BULLETINS ISSUED IN 1992
SUMMARY
* Hong Kong Time (UTC + 8)

52
TABLE 4. FREQUENCY AND TOTAL DURATION OF DISPLAY OF TROPICAL CYCLONEWARNING SIGNALS : 1956-1992

53
TABLE 5. NUMBER OF TROPICAL CYCLONES IN HONG KONG'S AREA OF RESPONSIBILITY ANDTHE NUMBER THAT NECESSITATED THE DISPLAY OF TROPICAL CYCLONE WARNINGSIGNALS IN HONG KONG : 1956 - 1992

54
TABLE 6. DURATION OF TROPICAL CYCLONE WARNING SIGNALS HOISTEDIN HONG KONG : 1956-1992

55
TABLE 7. A SUMMARY OF METEOROLOGICAL OBSERVATIONS RECORDED IN HONG KONG DURING THE PASSAGES OF TROPICAL CYCLONES IN 1992
* Hong Kong Time (UTC + 8)

5 6
(b)
*Hong Kong Time (UTC + 8)
57
TABLE 8 (a). Ra infa l l a ssoc ia ted wi th t rop ica l cyc lones tha t came wi th in 600 km ofHong Kong (wi th or wi thout ho is t ing of t rop ica l cyc lone warn ing s igna ls )in 1992.
N.B. # Tropica l cyc lone wi thout ho is t ing of t rop ica l cyc lone warn ing s igna ls .* Hour in Hong Kong Time (UTC + 8)
2 .2 mm ra infa l l o f T .S . Faye in co lumn ( iv ) over lapped wi th S .T .S . Gary ' sr a i n f a l l i n c o l u m n ( i )

58
(b). THE 10 WETTEST TROPICAL CYCLONES IN HONG KONG (1884-1939, 1947-1992)
N.B. :
(i) during the period in hours when the tropical cyclone was centred within 600 km of Hong Kong.
(ii) during the 24-hour period after the tropical cyclone moved outside (or dissipated within) the 600 km radius.
(iii) during the 48-hour period after the tropical cyclone moved outside (or dissipated within) the 600 km radius.
(iv) during the 72-hour period after the tropical cyclone moved outside (or dissipated within) the 600 km radius.
* For years prior to 1961, (i) is the sum of daily rainfall on those days when tropical cyclone was centred within
600 km of Hong Kong, (ii) to (iv) are correspondingly the sum of daily rainfall figures of the following days.
59
TABLE 9. TYPHOONS REQUIRING THE HOISTING OF THE HURRICANE SIGNAL NO. 10 DURING THE PERIOD 1946-1992
estimated, exceeding upper limit of anemogram
60

61
TABLE 11. CASUALTIES AND DAMAGE CAUSED BY TROPICAL CYCLONES IN HONG KONG : 1963-1992

62
TABLE 11. (cont'd)
N.B.
*+
Information supplies by relevant government departments and public utility companies. Damages reports inthe local press were also examined and collated.Data unavailableStruck by lightning

Section 5
TROPICAL CYCLONE POSITION ANDINTENSITY DATA, 1992

64
Six-hourly position and intensity data are tabulated for the following tropical cyclones in 1992 in the westernNorth Pacific and the South China Sea (i.e. the area between the equator and 45oN, and between 100oE and 180o).
Name of tropical cyclone Page
Severe Tropical Storm Axel (9201) 65Tropical Depression Ekeka (9202) 66Typhoon Bobbie (9203) 67Typhoon Chuck (9204) 68Tropical Depression Deanna 69Typhoon Eli (9205) 70Tropical Storm Faye (9206) 71Severe Tropical Storm Gary (9207) 72Severe Tropical Storm Helen (9208) 73Severe Tropical Storm Irving (9209) 74Typhoon Janis (9210) 75Typhoon Kent (9211) 76Tropical Depression Lois (9214) 77Tropical Storm Mark (9212) 78Tropical Storm Nina (9213) 79Typhoon Omar (9215) 80Tropical Depression Polly (9216) 81Typhoon Ryan (9217) 82Typhoon Sibyl (9218) 83Severe Tropical Storm Ted (9219) 84Tropical Storm Val (9220) 85Typhoon Ward (9221) 86Typhoon Yvette (9222) 87Tropical Depression Zack (9223) 88Typhoon Angela (9224) 89Typhoon Brian (9225) 90Typhoon Colleen (9226) 91Typhoon Dan (9227) 92Typhoon Elsie (9228) 93Typhoon Forrest (9229) 94Typhoon Gay (9230) 95Typhoon Hunt (9231) 96
Surface winds in this section refer to wind(Note: 1 m/s is about 2 knots or 4 km/h)
speeds averaged over a period of 10 minutes given in the unit of m/s.

Month Day
J a n 45
6
7
8
9
10
65
SIX-HOURLY POSITION AND INTENSITY DATA OFSEVERE TROPICAL STORM AXEL (9201)
TimeUTC I n t e n s i t y
E s t i m a t e dminimumc e n t r a lp r e s s u r e
(hpa)
E s t i m a t e dmaximums u r f a c e
w i n d s
(m/s)
Lat.oE
Long.oN
1800 T.D. 1000 13 5 . 7 1 7 9 . 00000 T.D. 1000 13 5 . 7 1 7 8 . 40600 T.D. 1000 16 5 . 8 1 7 7 . 81200 T . S . 995 18 5 . 9 1 7 7 . 11800 T . S . 995 21 6 . 0 1 7 6 . 40000 T . S . 990 23 6 . 1 1 7 5 . 70600 T . S . 990 23 6 . 2 1 7 4 . 91200 S . T . S . 985 25 6 . 2 1 7 4 . 01800 S . T . S . 980 28 6 . 0 1 7 3 . 00000 S . T . S . 975 31 5 . 8 1 7 1 . 90600 S . T . S . 980 28 5 . 8 1 7 0 . 81200 T . S . 990 23 6 . 2 1 6 9 . 81800 T . S . 995 18 6 . 5 1 6 8 . 70000 T . S . 995 18 6 . 6 1 6 7 . 60600 T . S . 990 21 6 . 4 1 6 6 . 41200 T . S . 990 21 6 . 2 1 6 5 . 21800 T . S . 985 23 6 . 1 1 6 3 . 70000 S . T . S . 980 25 6 . 3 1 6 2 . 20600 S . T . S . 980 25 6 . 7 1 6 0 . 51200 T . S . 985 23 7 . 1 1 5 9 . 01800 T . S . 990 18 7 . 4 1 5 7 . 60000 T.D. 995 16 7 . 9 1 5 6 . 20600 T.D. 1000 13 8 . 3 1 5 5 . 2
D i s s i p a t e d

66
SIX-HOURLY POSITION AND INTENSITY DATA OFTROPICAL DEPRESSION EKEKA (9202)
E s t i m a t e d E s t i m a t e dminimum maximumc e n t r a l s u r f a c e
Time p r e s s u r e w i n d s L a t . Long.Month Day UTC I n t e n s i t y (hPa) (m/s)
oE oN
F e b 3 1800 T.D. 995 16 9 . 4 1 7 9 . 84 0000 T.D. 995 16 9 . 3 1 7 8 . 2
0600 T.D. 1000 13 9 . 2 1 7 6 . 8
D i s s i p a t e d

67
SIX-HOURLY POSITION AND INTENSITY DATA OFTYPHOON BOBBIE (9203)
Month Day
J u n 22
23
24
25
26
27
28
29
TimeUTC I n t e n s i t y
minimumc e n t r a lp r e s s u r e
(hPa)
maximums u r f a c e
w i n d s
(m/s)
Lat.oN
Long.oE
1200 T.D. 1000 13 1 0 . 2 1 3 3 . 41800 T.D. 1000 13 1 0 . 3 1 3 3 . 00000 T.D. 1000 13 1 0 . 5 1 3 2 . 60600 T.D. 995 16 1 0 . 7 1 3 2 . 21200 T . S . 990 18 1 0 . 9 1 3 1 . 81800 T . S . 990 18 1 1 . 1 1 3 1 . 50000 T . S . 990 21 1 1 . 3 1 3 1 . 10600 T . S . 990 21 1 1 . 6 1 3 0 . 81200 T . S . 990 21 1 2 . 0 1 3 0 . 31800 T . S . 990 21 1 2 . 6 1 2 9 . 80000 T . S . 985 23 1 3 . 3 1 2 9 . 10600 S . T . S . 980 28 1 4 . 1 1 2 8 . 51200 T. 970 33 1 4 . 9 1 2 7 . 81800 T. 970 33 1 5 . 8 1 2 6 . 90000 T. 965 36 1 6 . 6 1 2 6 . 20600 T. 960 39 1 7 . 4 1 2 5 . 51200 T. 955 41 1 8 . 2 1 2 4 . 91800 T. 950 43 1 9 . 1 1 2 4 . 40000 T. 955 41 2 0 . 1 1 2 4 . 30600 T. 955 39 2 1 . 0 1 2 4 . 01200 T. 955 39 2 1 . 9 1 2 3 . 91800 T. 960 36 2 2 . 7 1 2 4 . 10000 T. 960 36 2 3 . 6 1 2 4 . 20600 T. 960 39 2 4 . 2 1 2 4 . 71200 T. 960 39 2 4 . 8 1 2 5 . 61800 T. 965 36 2 5 . 4 1 2 6 . 60000 T. 965 36 2 5 . 9 1 2 7 . 80600 S . T . S . 970 31 2 6 . 5 1 2 9 . 01200 S . T . S . 975 28 2 7 . 2 1 3 0 . 41800 S . T . S . 975 28 2 8 . 0 1 3 1 . 7
E s t i m a t e d E s t i m a t e d
B e c a m e E x t r a t r o p i c a l

Month Day
J u n 24
25
26
27
28
29
30
68
SIX-HOURLY POSITION AND INTENSITY DATA OFTYPHOON CHUCK (9204)
TimeUTC
E s t i m a t e d E s t i m a t e dminimum maximumc e n t r a l s u r f a c ep r e s s u r e w i n d s
(hPa) (m/s)I n t e n s i t yLat.
oELong.
oN
0000 T.D. 995 13 1 2 . 7 1 1 9 . 00600 T.D. 995 13 1 3 . 0 1 1 8 . 21200 T.D. 995 13 1 3 . 5 1 1 7 . 31800 T.D. 995 16 1 3 . 9 1 1 6 . 50000 T . S . 990 18 1 4 . 2 1 1 5 . 70600 T . S . 985 21 1 4 . 3 1 1 5 . 31200 T . S . 980 23 1 4 . 3 1 1 4 . 91800 S . T . S . 980 25 1 4 . 4 1 1 4 . 50000 S . T . S . 975 28 1 4 . 6 1 1 4 . 10600 S . T . S . 975 28 1 4 . 9 1 1 3 . 71200 S . T . S . 975 28 1 5 . 3 1 1 3 . 31800 S . T . S . 970 31 1 5 . 7 1 1 2 . 90000 T. 965 33 1 6 . 2 1 1 2 . 50600 T. 965 33 1 6 . 7 1 1 2 . 11200 T. 960 36 1 7 . 3 1 1 1 . 51800 T. 960 36 1 7 . 9 1 1 0 . 80000 T. 960 36 1 8 . 4 1 1 0 . 00600 T. 960 36 1 8 . 7 1 0 9 . 31200 T. 965 33 1 9 . 0 1 0 8 . 71800 T. 970 33 1 9 . 4 1 0 8 . 10000 T. 960 36 1 9 . 9 1 0 7 . 60600 T. 960 36 2 0 . 4 1 0 7 . 11200 T. 970 33 2 0 . 9 1 0 6 . 61800 S . T . S . 980 28 2 1 . 4 1 0 5 . 90000 T . S . 990 21 2 1 . 9 1 0 5 . 10600 T.D. 995 13 2 2 . 6 1 0 4 . 8
D i s s i p a t e d

Month Day
J u n 28
29
30
J u l 1
2
69
SIX-HOURLY POSITION AND INTENSITY DATA OFTROPICAL DEPRESSION DEANNA
TimeUTC I n t e n s i t y
E s t i m a t e dminimumc e n t r a lp r e s s u r e
(hPa)
E s t i m a t e dmaximums u r f a c e
w i n d s
(m/s)
Lat.oE
Long.oN
1200 T.D. 1000 13 6 . 5 1 4 0 . 71800 T.D. 997 16 7 . 1 1 3 9 . 90000 T.D. 997 16 7 . 9 1 3 8 . 90600 T.D. 997 16 8 . 7 1 3 8 . 01200 T.D. 997 16 9 . 5 1 3 7 . 11800 T.D. 997 16 1 0 . 2 1 3 6 . 30000 T.D. 997 16 1 1 . 0 1 3 5 . 30600 T.D. 997 16 1 1 . 8 1 3 4 . 41200 T.D. 1000 13 1 2 . 6 1 3 3 . 51800 T.D. 1000 13 1 3 . 4 1 3 2 . 50000 T.D. 1000 13 1 4 . 2 1 3 1 . 60600 T.D. 1000 13 1 5 . 1 1 3 0 . 51200 T.D. 1000 13 1 6 . 0 1 2 9 . 51800 T.D. 1000 13 1 7 . 0 1 2 8 . 60000 T.D. 1000 13 1 8 . 1 1 2 7 . 80600 T.D. 1000 13 1 9 . 5 1 2 7 . 7
D i s s i p a t e d

70
SIX-HOURLY POSITION AND INTENSITY DATA OFTYPHOON ELI (9205)
D i s s i p a t e d

71
SIX-HOURLY POSITION AND INTENSITY DATA OFTROPICAL STORM FAYE (9206)
D i s s i p a t e d
72
Month Day
J u l 19
20
21
22
23
SIX-HOURLY POSITION AND INTENSITY DATA OFSEVERE TROPICAL STORM GARY (9207)
TimeUTC I n t e n s i t y
E s t i m a t e dminimumc e n t r a lp r e s s u r e
(hPa)
E s t i m a t e dmaximums u r f a c e
w i n d s Lat.oE(m/s)
Long.oN
0000 T.D. 1000 13 1 5 . 1 1 3 0 . 10600 T.D. 1000 13 1 5 . 4 1 2 8 . 51200 T.D. 1000 13 1 5 . 8 1 2 6 . 61800 T.D. 995 16 1 6 . 2 1 2 4 . 40000 T.D. 995 16 1 6 . 6 1 2 2 . 60600 T.D. 995 16 1 7 . 3 1 2 1 . 51200 T . S . 990 18 1 7 . 8 1 2 0 . 21800 T . S . 985 21 1 7 . 6 1 1 8 . 80000 S . T . S . 980 25 1 7 . 7 1 1 7 . 40600 T . S . 985 23 1 8 . 4 1 1 6 . 51200 T . S . 985 23 1 9 . 1 1 1 5 . 61800 S . T . S . 980 25 1 9 . 5 1 1 4 . 70000 S . T . S . 975 28 1 9 . 7 1 1 3 . 60600 S . T . S . 975 28 1 9 . 9 1 1 2 . 51200 S . T . S . 975 28 2 0 . 3 1 1 1 . 41800 S . T . S . 980 25 2 0 . 9 1 1 0 . 40000 T . S . 985 21 2 1 . 8 1 0 9 . 40600 T . S . 985 21 2 2 . 5 1 0 8 . 21200 T.D. 990 16 2 3 . 1 1 0 6 . 6
D i s s i p a t e d

Month Day
J u l 2425
26
27
73
SIX-HOURLY POSITION AND INTENSITY DATA OFSEVERE TROPICAL STORM HELEN (9208)
TimeUTC I n t e n s i t y
E s t i m a t e dminimumc e n t r a lp r e s s u r e
(hPa)
E s t i m a t e dmaximums u r f a c e
w i n d s
(m/s)
Lat.oE
Long.oN
1800 T.D. 1000 13 2 3 . 7 1 6 1 . 80000 T.D. 1000 13 2 3 . 9 1 6 1 . 00600 T.D. 1000 13 2 4 . 2 1 6 0 . 31200 T.D. 995 16 2 4 . 6 1 5 9 . 61800 T . S . 990 21 2 5 . 0 1 5 9 . 00000 S . T . S . 980 25 2 5 . 5 1 5 8 . 50600 S . T . S . 980 25 2 6 . 5 1 5 8 . 21200 T . S . 985 23 2 7 . 8 1 5 8 . 11800 T . S . 990 21 2 9 . 1 1 5 8 . 10000 T . S . 990 21 3 0 . 4 1 5 8 . 10600 T . S . 995 18 3 2 . 0 1 5 8 . 31200 T.D. 1000 16 3 3 . 8 1 5 9 . 01800 T.D. 1000 16 3 5 . 5 1 5 9 . 9
B e c a m e E x t r a t r o p i c a l

74
Month Day
Aug 12
3
4
SIX-HOURLY POSITION AND INTENSITY DATA OFSEVERE TROPICAL STORM IRVING (9209)
TimeUTC
18000000060012001800000006001200180000000600
E s t i m a t e d E s t i m a t e dminimum maximumc e n t r a l s u r f a c ep r e s s u r e w i n d s
I n t e n s i t y (hPa) (m/s)
T.D. 1000T.D. 1000T . S . 995T . S . 990T . S . 990
S . T . S . 980S . T . S . 975S . T . S . 980
T . S . 980T.D. 985T.D. 990
D i s s i p a t e d
13 2 5 . 5 1 3 1 . 116 2 6 . 1 1 3 1 . 318 2 6 . 7 1 3 1 . 521 2 7 . 2 1 3 1 . 721 2 7 . 8 1 3 2 . 025 2 8 . 5 1 3 2 . 528 2 9 . 4 1 3 3 . 125 3 0 . 2 1 3 3 . 823 3 1 . 1 1 3 4 . 416 3 2 . 3 1 3 3 . 913 3 3 . 3 1 3 2 . 3
L a t .oE
Long.oN

75
SIX-HOURLY POSITION AND INTENSITY DATA OFTYPHOON JANIS (9210)
Became Extra trop ica l

76
SIX-HOURLY POSITION AND INTENSITY DATA OFTYPHOON KENT (9211)
D i s s i p a t e d
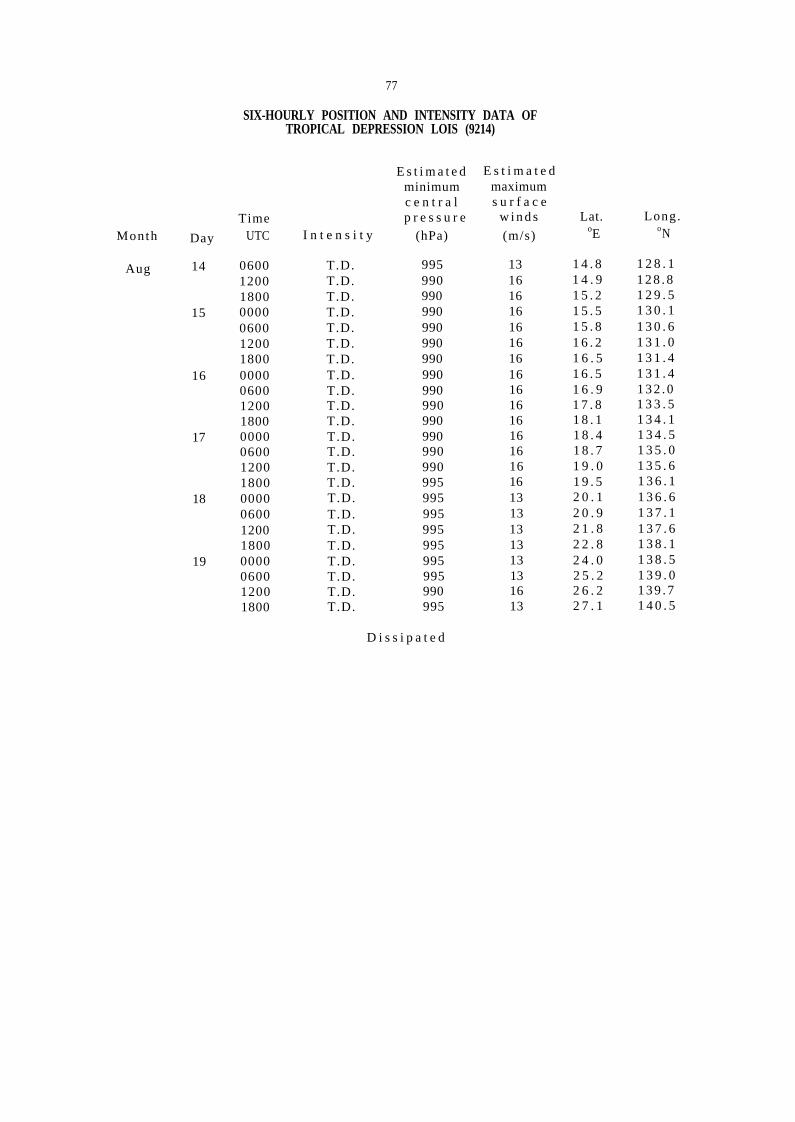
Month
Aug
Day
14
15
16
17
18
19
77
SIX-HOURLY POSITION AND INTENSITY DATA OFTROPICAL DEPRESSION LOIS (9214)
TimeUTC I n t e n s i t y
E s t i m a t e d E s t i m a t e dminimum maximumc e n t r a l s u r f a c ep r e s s u r e w i n d s
(hPa) (m/s)
Lat.oE
Long.oN
0600 T.D. 995 13 1 4 . 8 1 2 8 . 11200 T.D. 990 16 1 4 . 9 1 2 8 . 81800 T.D. 990 16 1 5 . 2 1 2 9 . 50000 T.D. 990 16 1 5 . 5 1 3 0 . 10600 T.D. 990 16 1 5 . 8 1 3 0 . 61200 T.D. 990 16 1 6 . 2 1 3 1 . 01800 T.D. 990 16 1 6 . 5 1 3 1 . 40000 T.D. 990 16 1 6 . 5 1 3 1 . 40600 T.D. 990 16 1 6 . 9 1 3 2 . 01200 T.D. 990 16 1 7 . 8 1 3 3 . 51800 T.D. 990 16 1 8 . 1 1 3 4 . 10000 T.D. 990 16 1 8 . 4 1 3 4 . 50600 T.D. 990 16 1 8 . 7 1 3 5 . 01200 T.D. 990 16 1 9 . 0 1 3 5 . 61800 T.D. 995 16 1 9 . 5 1 3 6 . 10000 T.D. 995 13 2 0 . 1 1 3 6 . 60600 T.D. 995 13 2 0 . 9 1 3 7 . 11200 T.D. 995 13 2 1 . 8 1 3 7 . 61800 T.D. 995 13 2 2 . 8 1 3 8 . 10000 T.D. 995 13 2 4 . 0 1 3 8 . 50600 T.D. 995 13 2 5 . 2 1 3 9 . 01200 T.D. 990 16 2 6 . 2 1 3 9 . 71800 T.D. 995 13 2 7 . 1 1 4 0 . 5
D i s s i p a t e d
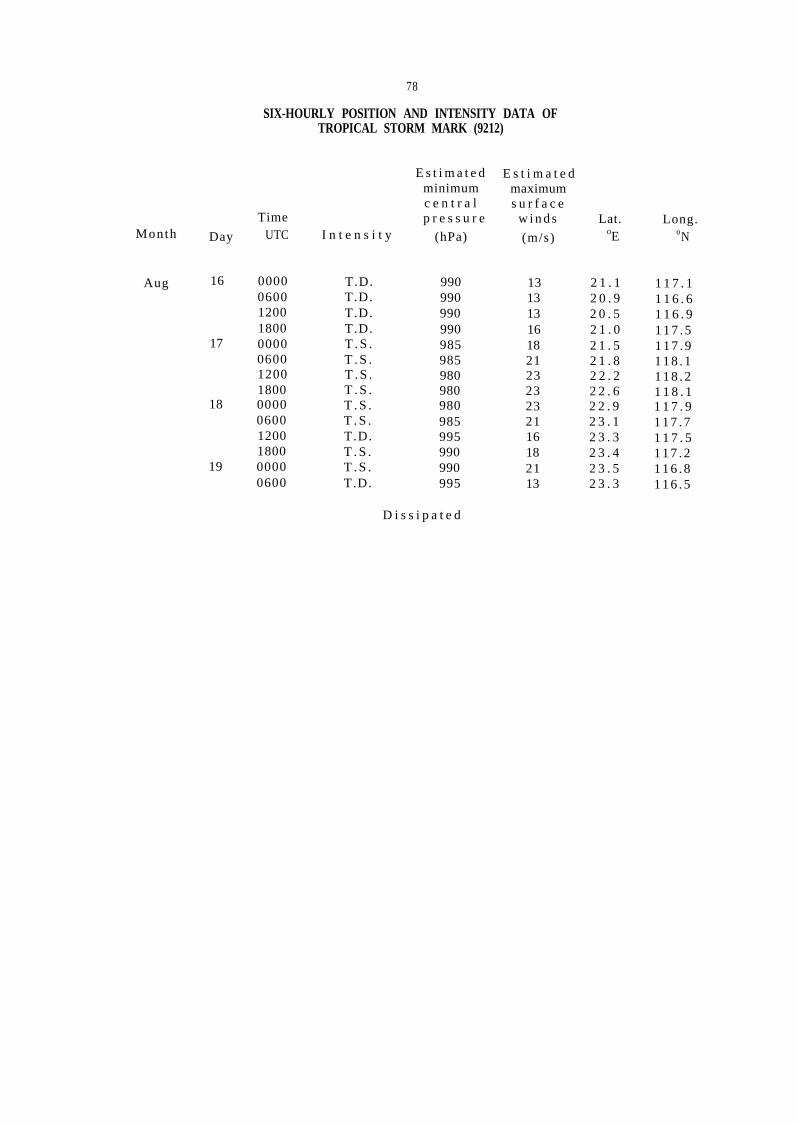
Month Day
Aug 16
17
18
19
78
SIX-HOURLY POSITION AND INTENSITY DATA OFTROPICAL STORM MARK (9212)
TimeUTC I n t e n s i t y
E s t i m a t e dminimumc e n t r a lp r e s s u r e
(hPa)
E s t i m a t e dmaximums u r f a c e
w i n d s
(m/s)
Lat.oE
Long.oN
0000 T.D. 990 13 2 1 . 1 1 1 7 . 10600 T.D. 990 13 2 0 . 9 1 1 6 . 61200 T.D. 990 13 2 0 . 5 1 1 6 . 91800 T.D. 990 16 2 1 . 0 1 1 7 . 50000 T . S . 985 18 2 1 . 5 1 1 7 . 90600 T . S . 985 21 2 1 . 8 1 1 8 . 11200 T . S . 980 23 2 2 . 2 1 1 8 . 21800 T . S . 980 23 2 2 . 6 1 1 8 . 10000 T . S . 980 23 2 2 . 9 1 1 7 . 90600 T . S . 985 21 2 3 . 1 1 1 7 . 71200 T.D. 995 16 2 3 . 3 1 1 7 . 51800 T . S . 990 18 2 3 . 4 1 1 7 . 20000 T . S . 990 21 2 3 . 5 1 1 6 . 80600 T.D. 995 13 2 3 . 3 1 1 6 . 5
D i s s i p a t e d

Month
Aug
Day
17
18
19
20
21
79
SIX-HOURLY POSITION AND INTENSITY DATA OFTROPICAL STORM NINA (9213)
E s t i m a t e d E s t i m a t e dminimum maximumc e n t r a l s u r f a c e
TimeUTC I n t e n s i t y
p r e s s u r e w i n d s L a t . Long.
(hPa) (m/s)oE oN
1200 T.D. 1005 13 2 3 . 8 1 6 1 . 2
1800 T.D. 1000 16 2 4 . 5 1 6 1 . 0
0000 T . S . 995 18 2 5 . 2 1 6 0 . 6
0600 T . S . 990 21 2 5 . 9 1 6 0 . 2
1200 T . S . 995 18 2 6 . 5 1 5 9 . 7
1800 T . S . 995 18 2 7 . 2 1 5 9 . 1
0000 T.D. 1000 16 2 8 . 0 1 5 8 . 4
0600 T.D. 1000 16 2 8 . 9 1 5 7 . 6
1200 T.D. 1000 16 3 0 . 1 1 5 6 . 5
1800 T.D. 1005 13 3 1 . 5 1 5 5 . 5
0000 T.D. 1005 13 3 3 . 1 1 5 5 . 3
0600 T . S . 995 18 3 5 . 0 1 5 5 . 6
1200 T.D. 1000 16 3 7 . 0 1 5 6 . 9
1800 T.D. 1000 16 3 8 . 7 1 5 9 . 0
0000 T.D. 1000 16 3 9 . 5 1 6 1 . 8
B e c a m e E x t r a t r o p i c a l
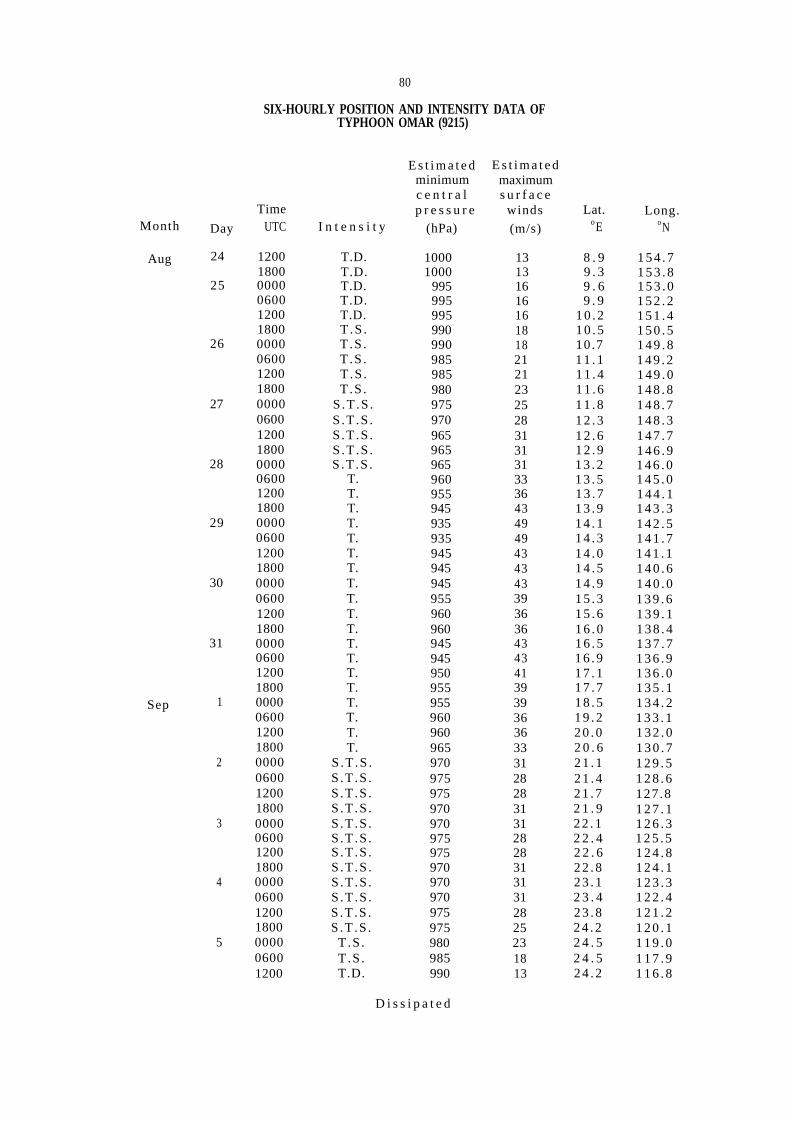
Month Day
Aug 24
25
26
27
28
29
30
31
Sep 1
2
3
4
5
80
SIX-HOURLY POSITION AND INTENSITY DATA OFTYPHOON OMAR (9215)
TimeUTC I n t e n s i t y
E s t i m a t e dminimumc e n t r a lp r e s s u r e
(hPa)
E s t i m a t e dmaximums u r f a c e
winds
(m/s)
Lat.oE
Long.oN
1200 T.D. 1000 13 8 . 9 1 5 4 . 71800 T.D. 1000 13 9 . 3 1 5 3 . 80000 T.D. 995 16 9 . 6 1 5 3 . 00600 T.D. 995 16 9 . 9 1 5 2 . 21200 T.D. 995 16 1 0 . 2 1 5 1 . 41800 T.S . 990 18 1 0 . 5 1 5 0 . 50000 T.S . 990 18 10.7 1 4 9 . 80600 T.S . 985 21 1 1 . 1 1 4 9 . 21200 T.S . 985 21 1 1 . 4 1 4 9 . 01800 T.S . 980 23 1 1 . 6 1 4 8 . 80000 S .T .S . 975 25 1 1 . 8 1 4 8 . 70600 S .T .S . 970 28 1 2 . 3 1 4 8 . 31200 S .T .S . 965 31 1 2 . 6 1 4 7 . 71800 S .T .S . 965 31 1 2 . 9 1 4 6 . 90000 S .T .S . 965 31 1 3 . 2 1 4 6 . 00600 T. 960 33 1 3 . 5 1 4 5 . 01200 T. 955 36 1 3 . 7 1 4 4 . 11800 T. 945 43 1 3 . 9 1 4 3 . 30000 T. 935 49 1 4 . 1 1 4 2 . 50600 T. 935 49 1 4 . 3 1 4 1 . 71200 T. 945 43 1 4 . 0 1 4 1 . 11800 T. 945 43 1 4 . 5 1 4 0 . 60000 T. 945 43 1 4 . 9 1 4 0 . 00600 T. 955 39 1 5 . 3 1 3 9 . 61200 T. 960 36 1 5 . 6 1 3 9 . 11800 T. 960 36 1 6 . 0 1 3 8 . 40000 T. 945 43 1 6 . 5 1 3 7 . 70600 T. 945 43 1 6 . 9 1 3 6 . 91200 T. 950 41 1 7 . 1 1 3 6 . 01800 T. 955 39 1 7 . 7 1 3 5 . 10000 T. 955 39 1 8 . 5 1 3 4 . 20600 T. 960 36 1 9 . 2 1 3 3 . 11200 T. 960 36 2 0 . 0 1 3 2 . 01800 T. 965 33 2 0 . 6 1 3 0 . 70000 S .T .S . 970 31 2 1 . 1 1 2 9 . 50600 S .T .S . 975 28 2 1 . 4 1 2 8 . 61200 S .T .S . 975 28 2 1 . 7 127.81800 S .T .S . 970 31 2 1 . 9 1 2 7 . 10000 S .T .S . 970 31 2 2 . 1 1 2 6 . 30600 S .T .S . 975 28 2 2 . 4 1 2 5 . 51200 S .T .S . 975 28 2 2 . 6 1 2 4 . 81800 S .T .S . 970 31 2 2 . 8 1 2 4 . 10000 S .T .S . 970 31 2 3 . 1 1 2 3 . 30600 S .T .S . 970 31 2 3 . 4 1 2 2 . 41200 S .T .S . 975 28 2 3 . 8 1 2 1 . 21800 S .T .S . 975 25 2 4 . 2 1 2 0 . 10000 T.S . 980 23 2 4 . 5 1 1 9 . 00600 T.S . 985 18 2 4 . 5 1 1 7 . 91200 T.D. 990 13 2 4 . 2 1 1 6 . 8
D i s s i p a t e d

Month Day
Aug 26
27
Aug 27
28
81
SIX-HOURLY POSITION AND INTENSITY DATA OFTROPICAL DEPRESSION POLLY(I) (9216)
TimeUTC I n t e n s i t y
0600 T.D.1200 T.D.1800 T.D.0000 T.D.0600 T.D.
E s t i m a t e d E s t i m a t e dminimum maximumc e n t r a l s u r f a c ep r e s s u r e w i n d s
(hPa) (m/s)
995 13 1 9 . 2 1 3 4 . 5995 13 1 9 . 8 1 3 4 . 1995 13 2 0 . 3 1 3 3 . 8990 16 2 0 . 8 1 3 3 . 5995 13 2 1 . 4 1 3 3 . 2
D i s s i p a t e d
TROPICAL DEPRESSION POLLY(II) (9216)
0600 T.D. 985 13 2 3 . 2 1 2 5 . 81200 T.D. 985 13 2 3 . 0 1 2 5 . 21800 T.D. 985 13 2 2 . 7 1 2 4 . 80000 T.D. 985 13 2 2 . 5 1 2 4 . 5
Aug 29 0600 T.D. 970 13 2 2 . 8 1 2 3 . 41200 T.D. 970 16 2 3 . 0 1 2 3 . 01800 T . S . 970 21 2 3 . 3 1 2 2 . 5
30 0000 T . S . 970 23 2 3 . 6 1 2 2 . 10600 T . S . 970 21 2 4 . 0 1 2 1 . 81200 T . S . 970 18 2 4 . 9 1 2 1 . 01800 T . S . 975 18 2 5 . 3 1 2 0 . 1
31 0000 T . S . 980 18 2 5 . 6 1 1 9 . 30600 T.D. 980 13 2 5 . 8 1 1 8 . 8
D i s s i p a t e d
TROPICAL STORM POLLY (III) (9216)
L a t .oE
Long.oN
D i s s i p a t e d

Month Day
Aug 31S e p 1
2
3
4
5
6
7
8
9
10
11
82
SIX-HOURLY POSITION AND INTENSITY DATA OFTYPHOON RYAN (9217)
E s t i m a t e d E s t i m a t e dminimum maximumc e n t r a l s u r f a c e
TimeUTC I n t e n s i t y
p r e s s u r e(hPa)
w i n d s(m/s)
Lat.oE
Long.oN
1800 T.D. 1000 13 1 6 . 1 1 4 9 . 20000 T.D. 1000 16 1 6 . 3 1 4 8 . 50600 T.D. 1000 16 1 6 . 6 1 4 7 . 71200 T . S . 995 18 1 7 . 0 1 4 7 . 61800 T . S . 990 21 1 7 . 4 1 4 7 . 90000 T . S . 985 23 1 7 . 8 1 4 8 . 00600 S . T . S . 980 25 1 8 . 1 1 4 7 . 81200 S . T . S . 975 28 1 8 . 3 1 4 7 . 61800 S . T . S . 975 28 1 8 . 5 1 4 7 . 40000 S . T . S . 975 28 1 8 . 7 1 4 7 . 20600 S . T . S . 970 31 1 8 . 9 1 4 7 . 01200 T. 960 36 1 9 . 2 1 4 6 . 81800 T. 955 36 1 9 . 4 1 4 6 . 40000 T. 955 36 1 9 . 2 1 4 6 . 20600 T. 955 36 1 9 . 1 1 4 6 . 41200 T. 950 39 1 9 . 1 1 4 6 . 61800 T. 950 39 1 9 . 2 1 4 6 . 70000 T. 950 39 1 9 . 4 1 4 6 . 80600 T. 950 39 1 9 . 7 1 4 6 . 81200 T. 950 39 2 0 . 1 1 4 6 . 91800 T. 950 39 2 0 . 6 1 4 7 . 00000 T. 945 41 2 1 . 4 1 4 7 . 20600 T. 945 41 2 2 . 4 1 4 7 . 61200 T. 940 43 2 3 . 3 1 4 8 . 01800 T. 940 43 2 4 . 1 1 4 8 . 60000 T. 945 41 2 4 . 8 1 4 9 . 40600 T. 945 41 2 5 . 4 1 4 9 . 81200 T. 945 41 2 5 . 9 1 5 0 . 01800 T. 945 41 2 6 . 4 1 5 0 . 10000 T. 945 41 2 6 . 9 1 5 0 . 00600 T. 950 39 2 7 . 4 1 4 9 . 51200 T. 955 36 2 7 . 7 1 4 8 . 81800 T. 955 36 2 8 . 1 1 4 8 . 00000 T. 950 39 2 8 . 5 1 4 7 . 20600 T. 950 39 2 9 . 1 1 4 6 . 41200 T. 950 39 2 9 . 8 1 4 5 . 61800 T. 955 36 3 0 . 6 1 4 4 . 90000 T. 955 33 3 1 . 5 1 4 4 . 20600 S . T . S . 960 31 3 2 . 6 1 4 4 . 01200 S . T . S . 965 28 3 3 . 8 1 4 4 . 11800 S . T . S . 965 28 3 5 . 1 1 4 4 . 70000 S . T . S . 965 28 3 7 . 1 1 4 5 . 60600 S . T . S . 965 25 3 9 . 9 1 4 6 . 4
B e c a m e E x t r a t r o p i c a l

83
SIX-HOURLY POSITION AND INTENSITY DATA OFTYPHOON SIBYL (9218)
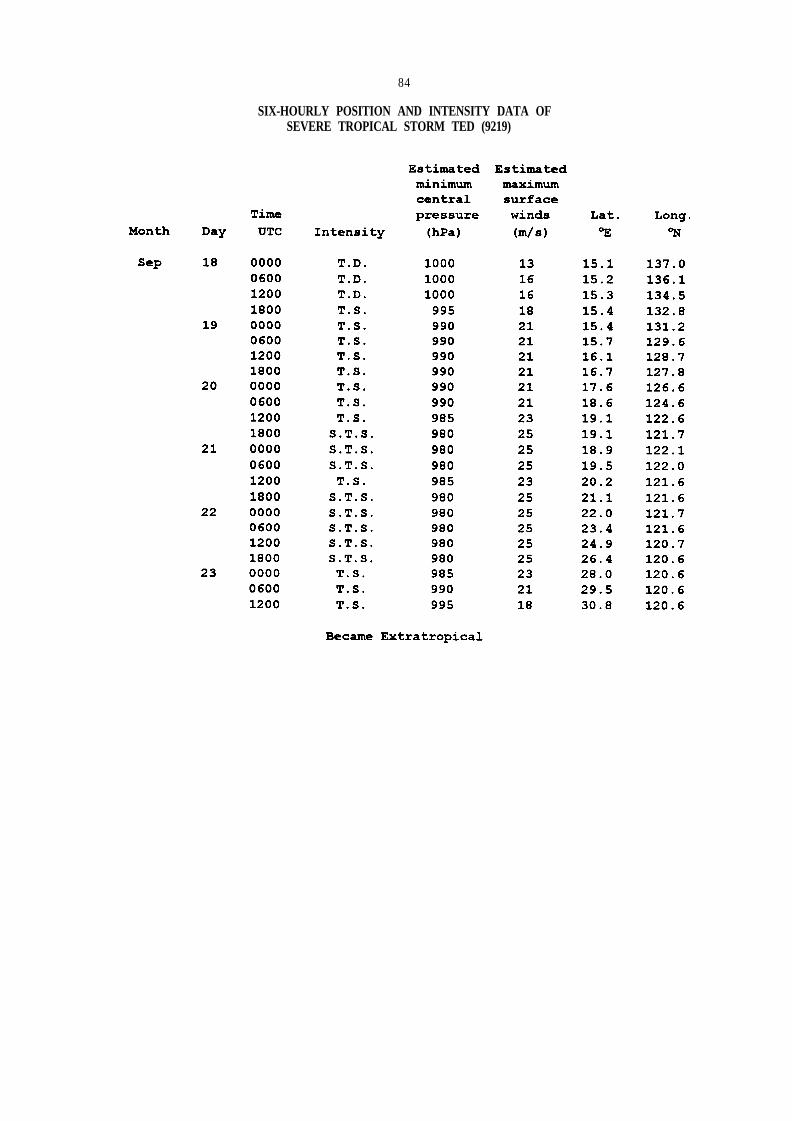
84
SIX-HOURLY POSITION AND INTENSITY DATA OFSEVERE TROPICAL STORM TED (9219)
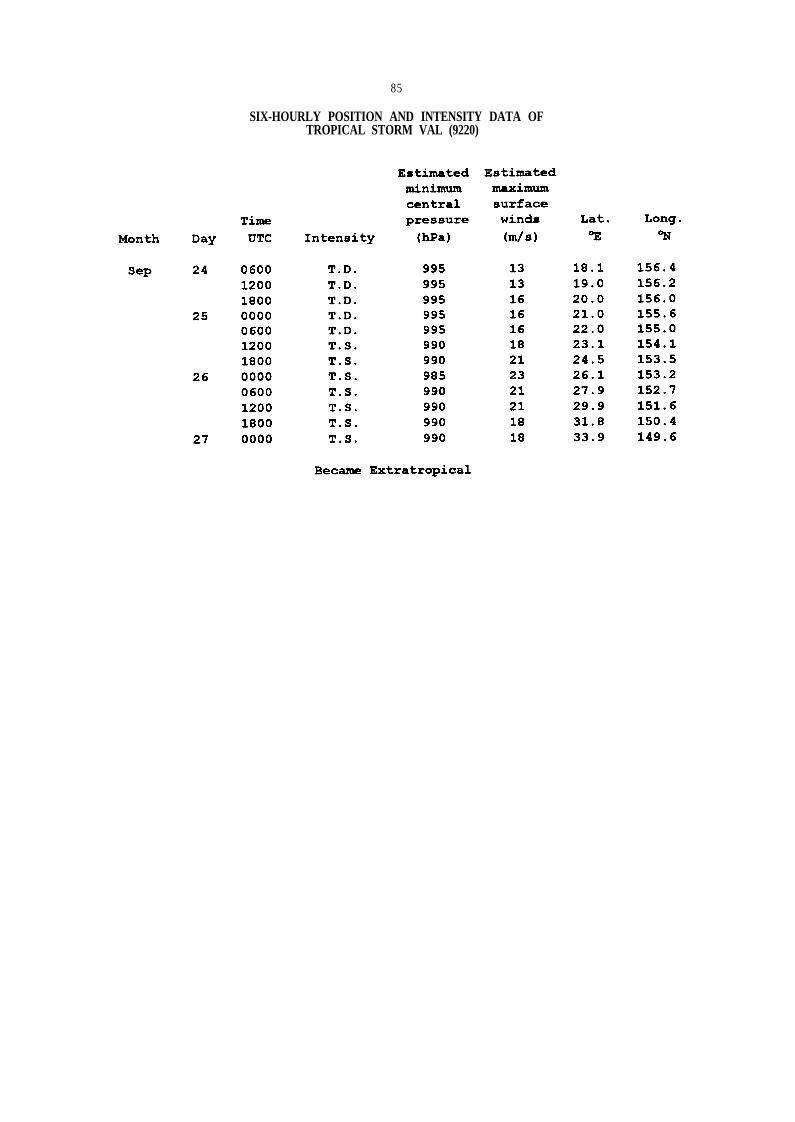
85
SIX-HOURLY POSITION AND INTENSITY DATA OFTROPICAL STORM VAL (9220)

86
SIX-HOURLY POSITION AND INTENSITY DATA OFTYPHOON WARD (9221)
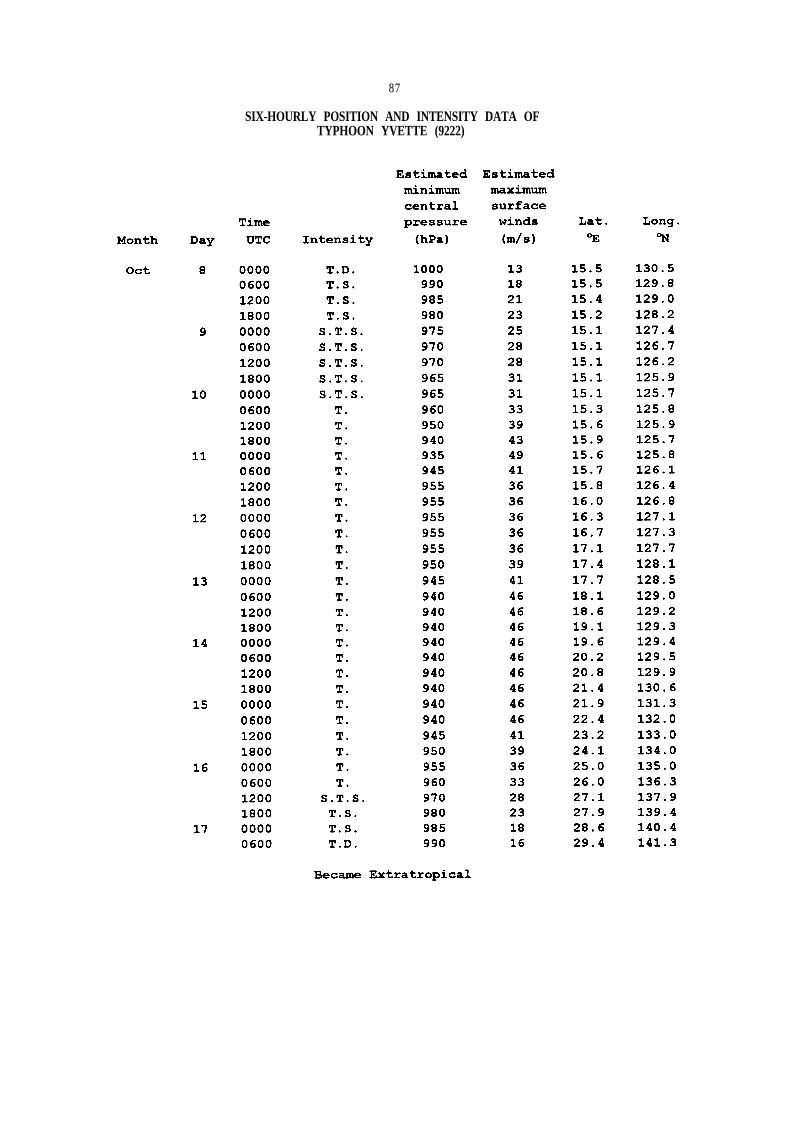
87
SIX-HOURLY POSITION AND INTENSITY DATA OFTYPHOON YVETTE (9222)

88
SIX-HOURLY POSITION AND INTENSITY DATA OFTROPICAL DEPRESSION ZACK (9223)
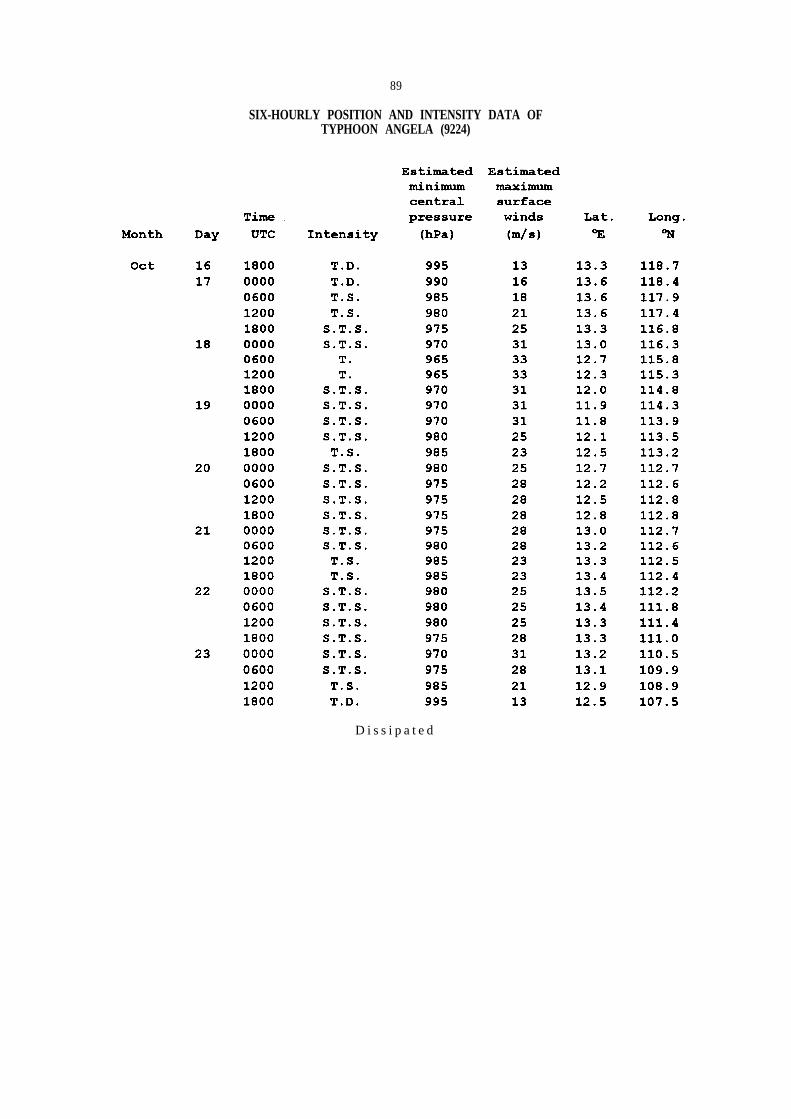
89
SIX-HOURLY POSITION AND INTENSITY DATA OFTYPHOON ANGELA (9224)
D i s s i p a t e d

90
SIX-HOURLY POSITION AND INTENSITY DATA OFTYPHOON BRIAN (9225)
D i s s i p a t e d

91
SIX-HOURLY POSITION AND INTENSITY DATA OFTYPHOON COLLEEN (9226)
D i s s i p a t e d

92
SIX-HOURLY POSITION AND INTENSITY DATA OFTYPHOON DAN (9227)
D i s s i p a t e d

93
SIX-HOURLY POSITION AND INTENSITY DATA OFTYPHOON ELSIE (9228)

94
SIX-HOURLY POSITION AND INTENSITY DATA OFTYPHOON FORREST (9229)
D i s s i p a t e d

95
SIX-HOURLY POSITION AND INTENSITY DATA OFTYPHOON GAY (9230)
D i s s i p a t e d

96
SIX-HOURLY POSITION AND INTENSITY DATA OFTYPHOON HUNT (9231)
B e c a m e E x t r a t r o p i c a l