Embed Size (px)
Citation preview

PhRMA White Paper on ADME Pharmacogenomics: Survey ResultsLisa A. Shipley, Ph.D.Advisory Committee for Pharmaceutical Science and Clinical PharmacologyMarch 18, 2008

Goals of the White Paper Present a pharmaceutical industry perspective of the recent
and future utility of pharmacogenomics (PGx) related to the ADME properties of drugs for drug development and utilization
Offer perspectives on the current state of practices, strategies, knowledge and key information gaps that need to be addressed in order to fulfill the promise of PGx in targeted medicine
Does not intend to provide best practice for ADME PGx in drug development or utilization, nor to address ethical ramifications of ADME PGx
Second half of paper discusses current understanding of clinically significant polymorphisms of drug metabolism enzymes and transporters

Approach
To establish a cross-industry perspective on the current utility of ADME PGx, PhRMA conducted a survey of recent (2003-2005) major pharmaceutical company practices

The Survey Assembled a series of questions to elicit broad information about
current pharmaceutical company ADME PGx practices Survey respondents were instructed to base all answers on clinical
trials that initiated during the period 2003-2005 Companies were also asked to provide citations for peer-reviewed
original PGx ADME research published by industry scientists (up to 3/company), and examples of how PGx ADME information has been used for internal decision-making and regulatory interactions
PhRMA staff solicited responses from PhRMA member companies and aggregated data, to preserve companies’ anonymity (except for citations of published papers)
Not every company answered every question Some questions have been reordered for ease of presentation

Participating Companies
Abbott Laboratories Amgen Astra-Zeneca Bristol Myers Squibb GlaxoSmithKline Johnson & Johnson Lilly
Merck Millennium Novartis Pfizer Sanofi-Aventis Schering-Plough Wyeth

1. How often has your company collected DNA w/ consent for ADME-related genotyping in:Study Type # of Responses
Always Usually Sometimes NeverFirst in human 2 11 1Multiple rising
dose2 12
Drug-drug interaction
1 11 2
Special population 8 5 1Other clin pharm 11 3Proof of concept 7 7Dose ranging 7 7Pivotal 6 8Other 4 8 1

2. How often has your company performed ADME-related genotyping in:Study Type # of Responses
Always Usually Sometimes NeverFirst in human 1 1 12Multiple rising dose
1 1 12
Drug-drug interaction
1 12 1
Special population 1 11 2Other clin pharm 1 11 2Proof of concept 12 2Dose ranging 1 8 5Pivotal 10 4Other 9 5

3. Has your company used ADME-related genotype(s) in study design?
Inclusion Criterion – 10 yes, 4 no Exclusion Criterion – 10 yes, 4 no
Gene # of Responses
CYP2D6 11
CYP3A5 1
UGT1A1 4
CYP2C19 7
CYP2C9 4
MGMT 0
GSTM1 0

Always Usually Sometimes Never
4. How often has your company specified PG-PK analysis in study protocols?
2 12
7. How often does your company have a written PG-PK plan or strategy for a compound in development?
2 1 9 2
12. How often has your company used phenotyping to ensure that genotype-assigned phenotypes are correct?
6 8
15. How often has the statistical power of PG-PK analysis entered into study design criteria at your company?
9 5
17. How often has your company used any FDA-approved in vitro diagnostic (UGT1A1 kit or CYP2D6/2C19 chip) for PG-PK for clinical trial applications?
6 8

5. Breadth of genotyping. Please check whether your company currently genotypes each gene.
GENE# of ResponsesYes No
CYP1A2 7 4CYP2A6 6 5CYP2B6 6 5CYP2C8 7 5CYP2C9 12 1CYP2C19 13 0CYP2D6 14 0CYP3A4 8 4CYP3A5 11 3Other phase 1 enzyme
6 3
GENE# of ResponsesYes No
UGT1A1 13 1TPMT 3 8Other phase 2 enzyme
8 3
OATP1B1 7 4BCRP 7 4MDR1 9 3Other transporter
7 5
Other PK-related
7 5

6. Has you company only genotyped when preclinical data indicate a role for the gene in a compound’s PK, or do you genotype a broader range of genes?
With preclinical support only: 8
Broader range: 6
8. Has genotyping been done within your company or outsourced?
In-house 5
Outsourced 4
Both 89. How has your company coded samples collected for PG-PK research (ok to check more than one)?
Single Coded: 8Double Coded: 10Anonymized/Anonymous 3

YES NO
10. Has your company kept/banked DNA beyond the initial period of the clinical trial?
13 0
13. Has your company combined samples across studies of a single compound to enhance the statistical power of PG-PK analysis?
11 1
16. Has your company used large-scale (e.g., multigene chip-based) exploratory PG-PK analysis?
6 8
18. Does your company apply the following standards for human DNA sample collection and generation of human genotype data that might be used in regulatory submissions?
GCPGLP
GMP
14102
310

11. When PG-PK research has been included in a trial, has it been a required study activity or optional for each subject in: (ok to check both boxes in a row)
STUDY TYPE# of Responses
YES(Required)
NO(Optional)
Phase 1 studies 12 12
Drug interaction studies
10 8
Phase 2 studies 4 12
Phase 3 studies 3 13

14. How important has replication of a PG-PK finding been in your company? (please check only one box)
# of Responses
An independent replication has always been necessary
1
An unreplicated result has been used for internal decision-making but not in a regulatory submission
7
An unreplicated result based on a known valid biomarker has been used in a regulatory submission
2
An unreplicated result based on another biomarker has been used in a regulatory submission
0
PG-PK results have not been used 2

YES NO
19. Have scientists from your company published original PG-PK research in peer-reviewed journals?
8 6
20. Has PG-PK information been used in decision-making at your company?
11 3
21. Has your company interacted with FDA or other regulators regarding PG-PK?
10 3

Summary of Survey PGx has already significantly impacted drug development and beginning to
influence drug utilization PGx allows the identification, confirmation or exclusion of clearance pathways PGx analyses have utility in
Explaining PK variability Ensure trial population appropriately balanced Ensure the safety of volunteers and patients Provide mechanistic information
PGx studies may support labeling claim concerning PK dosing; ethnic variability and safety
A significant effort remains in the education of the public, prescribers, ethics committees and investigators

Questions or Comments?

Incorporation of Pharmacogenetic in Healthcare
Eric Lai, Ph.D.,VP, Pharmacogenetics
March 18, 2008

19
This presentation represents my personal views and does not necessarily reflect the policies or endorsement of GlaxoSmithKline.

20
What is Pharmacogenetics (PGx)? The field of Pharmacogenetics deals with the
effect of individual gene variants on the action of a given drug.
“Right Drug for the right patient at the right time” or personalized medicine.

21
Misconceptions about PGx There is no such things as a personalized medicine (The
right medicine to the right patient at the right dosage at the right time). This is a perfect example of marketing talk (Drugs are not like cars or computers).
Clinical trials are done on populations, effects are observed in a group of patients.
PGx increase the probability whether the drug is going to be beneficial for you or may have major adverse effort(s) against you.
The drug is not specifically designed for you but for a group of targeted individuals (Targeted or Informed Medicine). So it is more like clothing sizes (whether you are size 0 or 14).
Not all clinical trials or drugs have PGx components
22
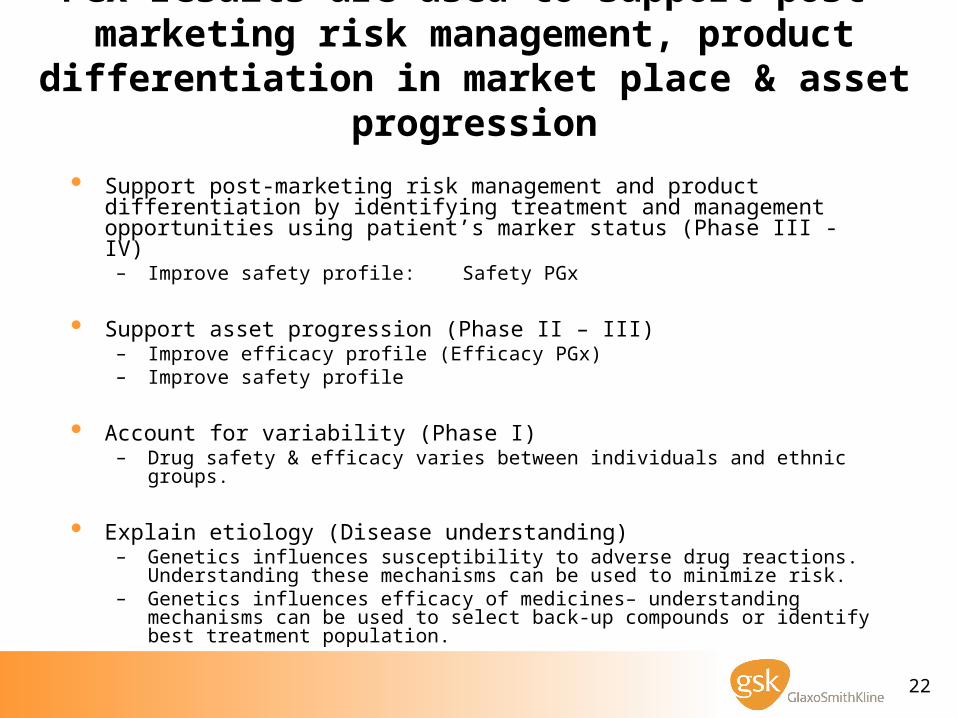
PGx results are used to support post-marketing risk management, product differentiation in
market place & asset progression Support post-marketing risk management and product differentiation by
identifying treatment and management opportunities using patient’s marker status (Phase III - IV)
– Improve safety profile: Safety PGx
Support asset progression (Phase II – III)– Improve efficacy profile (Efficacy PGx)– Improve safety profile
Account for variability (Phase I)– Drug safety & efficacy varies between individuals and ethnic groups.
Explain etiology (Disease understanding)– Genetics influences susceptibility to adverse drug reactions. Understanding
these mechanisms can be used to minimize risk.– Genetics influences efficacy of medicines– understanding mechanisms can
be used to select back-up compounds or identify best treatment population.

23
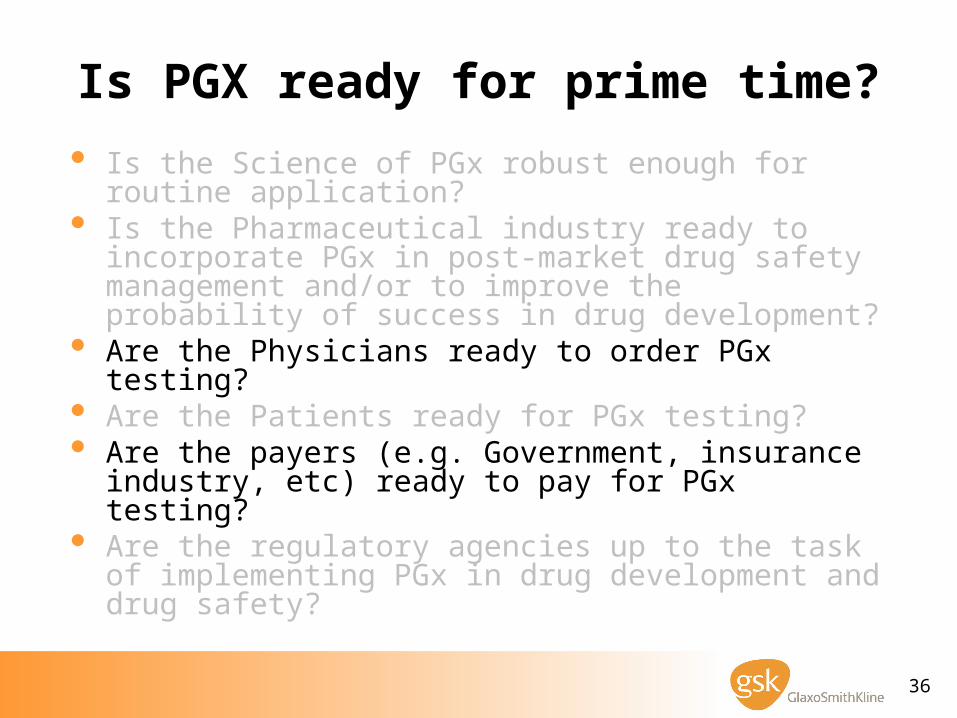
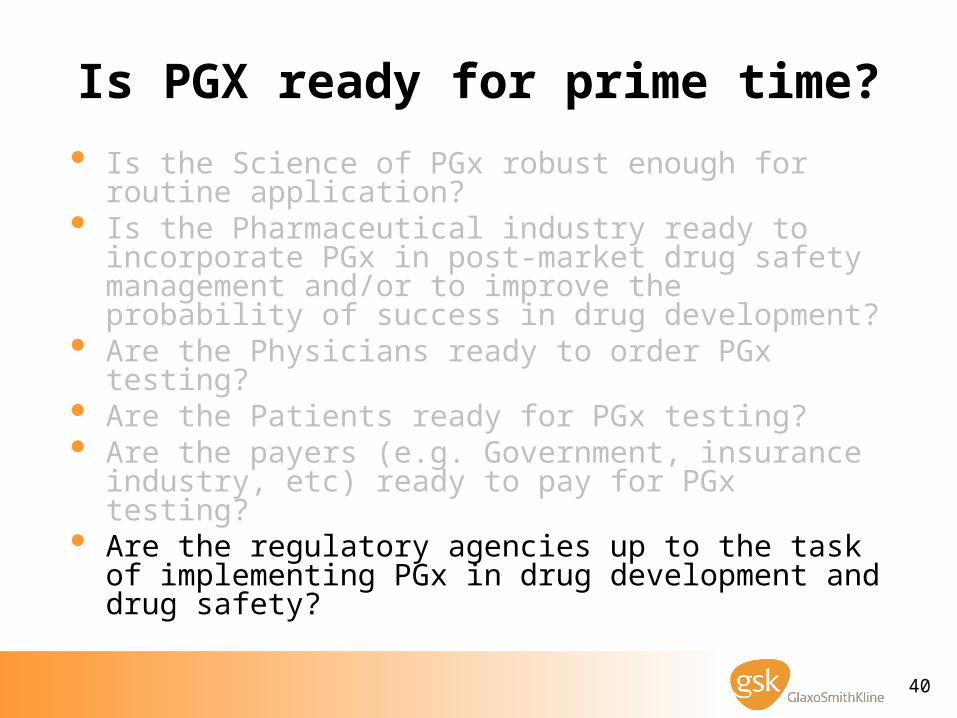
Is PGX ready for prime time? Is the Science of PGx robust enough for routine
application? Is the Pharmaceutical industry ready to incorporate
PGx in post-market drug safety management and/or to improve the probability of success in drug development?
Are the Physicians ready to order PGx testing? Are the Patients ready for PGx testing? Are the payers (e.g. Government, insurance industry,
etc) ready to pay for PGx testing? Are the regulatory agencies up to the task of
implementing PGx in drug development and drug safety?

24
Safety PGx - abacavir hypersensitivity

25
What is abacavir hypersensitivity?
Abacavir (ABC) commonly used in treatment of HIV-1 infection Approved products include Ziagen, Trizivir and Epzicom / Kivexa Generally well tolerated Key limitation: abacavir hypersensitivity reaction (ABC HSR)
– affects ~5% of clinical trial patients
Features of ABC HSR:– Multi-organ clinical syndrome – typically fever and/or rash ±
constitutional, GI and/or respiratory symptoms– Symptoms usually (>90%) occur within first 6 weeks of therapy– The symptoms worsen with continued therapy and can be life-
threatening but usually resolve upon permanent discontinuation of abacavir
– Re-challenge is contraindicated and can be fatal

26
GSK research on ABC HSR Post-approval commitments in 1999 to
regulatory authorities to conduct research to understand ABC HSR and develop tests to confirm diagnosis
Pooled analysis of studies identified some risk factors for HSR: race, sex, CDC class, prior HIV drug treatment, NNRTI co-introduction
Comprehensive & effective risk management program created (educational materials, labelling, pharmacovigilance, etc.)

27
Cumulative patient-years of exposure to ABC products & cumulative spontaneous reports of ABC HSR-associated mortality
0
200
400
600
800
1000
1200
1999 2000 2001 2002 2003 2004 2005 2006
M ortality Patient/years (x10^3)
…but can we determine an individual’s risk for ABC HSR?

28
GSK Abacavir-HSR project timeline 1994 Initiate clinical development program 1998/9 Marketing Approval for first ABC product – Ziagen 1999 Initiation of the GSK Abacavir-HSR project team 2001 Association of HLA-B*5701 with ABC HSR
Caucasian males (50-94% sensitivity, 98% selectivity)
2003 HLA-B*5701 extended to Caucasian females 2004/5 LabCorp offers HLA-B*5701 screening assay
– Response to requests by US HIV clinicians 2006 First reports of prospective HLA-B*5701 screening
on incidence of HSR 2007 Prospective trial (Predict -1) results presented at IAS

29
Is PGX ready for prime time? Is the Science of PGx robust enough for routine
application? Is the Pharmaceutical industry ready to incorporate
PGx in post-market drug safety management and/or to improve the probability of success in drug development?
Are the Physicians ready to order PGx testing? Are the Patients ready for PGx testing? Are the payers (e.g. Government, insurance industry,
etc) ready to pay for PGx testing? Are the regulatory agencies up to the task of
implementing PGx in drug development and drug safety?

30
PGx can be used to detect ADRs: Number of Cases Required to Achieve 80% Statistical Power
Adverse Drug Reaction Genetic Risk Factor Cases Required
Drug Reaction Prevalence Risk Allele Freq.1 Effect2
Gefitinib Diarrhea 0.28 ABCG2 Q141K 0.07 5 47 (>150)
Isoniazid Hepatotoxicity 0.15 CYP2E1*1 & NAT2 Slow Ac
0.133 7 122 (>150)
Irinotecan Neutropenia 0.20 UGT1A1*28 0.32 28 26 (58)
Abacavir Hypersensitivity reaction
0.05 HLA-B*5701 0.04 36 15 (19)
Tranilast Hyperbilirubinemia 0.12 UGT1A1*28 0.30 48 42 (54)
Allopurinol Severe cutaneous adverse reactions
<0.001 HLA-B*5801 0.15 678 19 (19)
Carbamazepine Stevens-Johnson Syndrome
<0.001 HLA-B*1502 0.04 1023 9 (9)
1Allele frequency of the ADR susceptibility variant2Genetic effect is the estimate of the genotype relative risk for those homozygous for the susceptible
genotype compared to the low risk homozygotes3Frequency of the CYP2E1*1 and NAT2 slow acetylator homozygous genotype in Europeans4Number of cases required to achieve 80% power to reject the null hypothesis with 200 clinical matched
(population) controls. Bonferroni adjusted α = 0.05. Assumes LD between genetic risk factor and best SNP marker is r2 = 0.7.

31
Is PGX ready for prime time? Is the Science of PGx robust enough for routine
application? Is the Pharmaceutical industry ready to incorporate
PGx in post-market drug safety management and/or to improve the probability of success in drug development? Yes -> if they are forced to.
Are the Physicians ready to order PGx testing? Are the Patients ready for PGx testing? Are the payers (e.g. Government, insurance industry,
etc) ready to pay for PGx testing? Are the regulatory agencies up to the task of
implementing PGx in drug development and drug safety?

32
0.0
0.05
0.10
0.15
0.20
1998/1999 2000/2001 2002/2003 2004 to July 2005
Pro
porti
on o
f AB
C-n
aïve
pat
ient
s di
scon
tinui
ng A
BC
with
in 6
wee
ks
n=68 n=131 n=102 n=49
1
Before PGxscreening
After PGxscreening
2
P<0.05
Non-GSK study: Prospective HLA-B*5701 screening reduces early discontinuation of ABC
Non-GSK study – Western AustraliaRauch et al. Clin Infect Dis 2006; 43: 99
Discontinuation due to any reasonDiscontinuation due to ABC HSR
1122
7
2
115

33
Determining Clinical Utility: GSK’s Prospective Trial (PREDICT-1) study objectives
To determine whether prospective screening for HLA-B*5701, prior to abacavir treatment, resulted in:– a significantly lower incidence of clinically
suspected ABC HSR– a significantly lower incidence of immunologically
confirmed ABC HSR as determined by ABC skin patch testing
Mallal S et al. NEJM, 2008

34
PREDICT-1 results published Feb 7, 2008
7.8%
2.7%3.4%
0.0%0.0%
1.0%
2.0%
3.0%
4.0%
5.0%
6.0%
7.0%
8.0%
9.0%
Prop
ortio
n of
pat
ient
s w
ith A
BC
HSR
(%)
Control ControlScreen Screen
Clinically suspected ABC HSR
P<0.0001Odds Ratio 0.4 (CI: 0.25, 0.62)
P<0.0001Odds Ratio 0.03(CI: 0.00, 0.18)
Clinically suspected ABC HSR plus skin patch test positive
n=847 n=803 n=842 n=802

35
PREDICT-1 conclusions Prospective HLA-B*5701 screening and avoidance of
ABC in patients who were HLA-B*5701 positive– significantly reduced the incidence of clinically suspected ABC HSR– eliminated immunologically confirmed (i.e., patch test-positive) ABC
HSR
HLA-B*5701 positive patients are at increased risk for ABC HSR
HLA-B*5701 negative patients are at reduced risk for ABC HSR
Mallal S et al. NEJM, 2008
36
Is PGX ready for prime time? Is the Science of PGx robust enough for routine
application? Is the Pharmaceutical industry ready to incorporate
PGx in post-market drug safety management and/or to improve the probability of success in drug development?
Are the Physicians ready to order PGx testing? Are the Patients ready for PGx testing? Are the payers (e.g. Government, insurance industry,
etc) ready to pay for PGx testing? Are the regulatory agencies up to the task of
implementing PGx in drug development and drug safety?

37
Volume of HLA-B*5701 testing:Experience of one clinical laboratory
LabCorp communication
Presentation of PREDICT-1 and SHAPE data at AIDS conference
PREDICT-1 publication in NEJM
Gro
wth

38
Is PGX ready for prime time? Is the Science of PGx robust enough for routine
application? Is the Pharmaceutical industry ready to incorporate
PGx in post-market drug safety management and/or to improve the probability of success in drug development?
Are the Physicians ready to order PGx testing? Are the Patients ready for PGx testing? Are the payers (e.g. Government, insurance industry,
etc) ready to pay for PGx testing? Are the regulatory agencies up to the task of
implementing PGx in drug development and drug safety?

39
Common Sense and Predictably Irrational behavior
Odds of winning in a casino.– Will you pay for a test if the result can tell you
whether you can improve your odd of winning from 5% to 50%? >80% of the people will say yes
Odds of getting an adverse drug reaction.– Will you let your physician order for a test if the
result can tell you whether you have a higher chance of getting an adverse drug reaction (from 5% to 50%)? Only about 50% of the people will say yes
40
Is PGX ready for prime time? Is the Science of PGx robust enough for routine
application? Is the Pharmaceutical industry ready to incorporate
PGx in post-market drug safety management and/or to improve the probability of success in drug development?
Are the Physicians ready to order PGx testing? Are the Patients ready for PGx testing? Are the payers (e.g. Government, insurance industry,
etc) ready to pay for PGx testing? Are the regulatory agencies up to the task of
implementing PGx in drug development and drug safety?

41
Efficacy PGx

42
Current Drug Development Process Current drug development and approval processes
center on data collected from research participants
Most drugs are effective in a majority of patients (Spear, B. Trends Mol Med May 2001 7 (5) 201-204) :
Alzheimer 30%Asthma 60%Cardiac Arr. 60%Depression 62%
All drugs have side effects and some drugs produce major adverse reactions in small subset of patients

43
Examples of Efficacy PGxDrug Indication Efficacy measure Gene-allele FDA
guidelinesCetuximab Colorectal cancer Disease-free survival EGFR+ Required
Trastuzumab Breast Cancer Disease-free survival Her2 overexpression
Required
Lapatinib Breast cancer Disease-free survival Her2+ Required
Tamoxifen Breast cancer (high risk of recurrence)
Reduced relapse-free time CYP2D6*4/*4 For information
only
Busulfan Myelogenous leukemia Disease-free Philadelphia chromosome +
For information
only
Carvedilol Heart failure Ejection fraction; survival 1-AR (arg389) none
Pravastatin Dyslipidemia HDL and total cholesterol levels, atherosoclerosis progression
CETP-B1HMGCR (HAP7)
none
Donepezil Alzheimer’s Disease Improvement in ADAS-Cog ApoE4+ none
Rosiglitazone Alzheimer’s Disease Improvement in ADAS-Cog ApoE4- none

44
Is PGX ready for prime time? Is the Science of PGx robust enough for routine
application? Is the Pharmaceutical industry ready to incorporate
PGx in post-market drug safety management and/or to improve the probability of success in drug development?
Are the Physicians ready to order PGx testing? Are the Patients ready for PGx testing? Are the payers (e.g. Government, insurance industry,
etc) ready to pay for PGx testing? Are the regulatory agencies up to the task of
implementing PGx in drug development and drug safety?

45
Are current drug development process and regulatory thinking ready for Efficacy PGx?

46
Last thought: what is most important?

47
History of mobile phone development
Importance of the regulatory agency:– The basic concept of cellular phones began in 1947, when researchers
looked at crude mobile (car) phones and realized that by using small cells (range of service area) with frequency reuse they could increase the traffic capacity of mobile phones substantially. However at that time, the technology to do so was nonexistent.
– Anything to do with broadcasting and sending a radio or television message out over the airwaves comes under Federal Communications Commission (FCC) regulation. A cell phone is a type of two-way radio. In 1947, AT&T proposed that the FCC allocate a large number of radio-spectrum frequencies so that widespread mobile telephone service would become feasible and AT&T would have a incentive to research the new technology. We can partially blame the FCC for the gap between the initial concept of cellular service and its availability to the public. The FCC decided to limit the amount of frequencies available in 1947, the limits made only twenty-three phone conversations possible simultaneously in the same service area - not a market incentive for research.

48
1968: Change in regulatory landscape The FCC reconsidered its position in 1968. AT&T and Bell Labs proposed a cellular system to the
FCC of many small, low-powered, broadcast towers, each covering a 'cell' a few miles in radius and collectively covering a larger area.
Dr Martin Cooper, a former general manager for the systems division at Motorola, is considered the inventor of the first modern portable handset. Cooper made the first call on a portable cell phone in April 1973.

49
1983: First commercial cellular phoneDr.Cooper
Motorola is first to ship a commercial portable cellular phone, the DynaTAC, with a suggested retail price of $3,995
The DynaTac phone weighs 28 ounces, is 13 x 1.75 x 3.5 inches in dimension, boasts one hour of talk time and eight hours of standby time and has the nickname of “brick phone”.

50
0
50,000,000
100,000,000
150,000,000
200,000,000
250,000,000
1980 1985 1990 1995 2000 2005 2010
Year
# of
US
user
s$299 with better and more reliable coverage
Cell Phone Subscribers in the U.S., 1985–2005

51
So what did the cell phone industry teach us?
Regulatory decisions are critical A common standard (cellular transmission) Reasonable cost for the general public Reliable and good coverage of services (US
cell phone companies still have a lot of work to improve on this issue).

52
PGx results are used to support post-marketing risk management, product differentiation in
market place & asset progression Support post-marketing risk management and product differentiation by
identifying treatment and management opportunities using patient’s marker status (Phase III - IV)
– Improve safety profile: Safety PGx
Support asset progression (Phase II – III)– Improve efficacy profile (Efficacy PGx)– Improve safety profile
Account for variability (Phase I)– Drug safety & efficacy varies between individuals and ethnic groups.
Explain etiology (Disease understanding)– Genetics influences susceptibility to adverse drug reactions. Understanding
these mechanisms can be used to minimize risk.– Genetics influences efficacy of medicines– understanding mechanisms can
be used to select back-up compounds or identify best treatment population.

53
The Long Road to P450 testing Cytochrome P450 proteins with well established common
polymorphisms that affect drug metabolism have been described since 1950s and molecular basis for the polymorphisms have been known since 1980s.
Potential predictors of optimum dose, drug choice and side effect response
– Eg. CYP2D6 & codeine activation, CYP2C9 & warfarin inactivation Why have they not been taken up into clinical practice?
– Complicated gene families and difficult assays– Lack of a standard and “agreed” panel– Lack of regulatory input and guidance– Limited awareness– Feasibility
Access to test Genetic information required at point of prescribing decision?

54
Agreements among 9 Pharma Companies on ADME genes Core List
- “Must Have Genes”- FDA validated- Significant burden of proof- DMET scientist guided- 33 genes (213 markers)
Extended List- “Need to Have Genes”- Probable involvement- Lacking burden of proof of Core- Mostly addition of Transporters- 143 genes (~2,500 markers)
Investigative List- “Like to Have Genes”- Unknown but possible involvement- Very little literature- Modifiers of metabolism- 333 genes (~9,500 markers)

55

56
Core List

57
PGx: Key Stakeholders
Patients
Regulators
Diagnostics and biotech industry
Healthcare Providers
Bioethics & Policy
Organizations
Payers
Government
Drug safety and efficacy are shared responsibilities
Pharma
Central Testing Laboratories

© Pharsight Corporation All Rights ReservedFeb. 1, 2008
On the Use and Value of Drug-Independent Survival Models to Support Clinical Drug Development in Oncology
Rene Bruno, Laurent ClaretPharsight corporationFDA Clinical Pharmacology Advisory Committee Meeting: Quantitative Clinical Pharmacology: Critical Path Opportunities Washington DC, March 18, 2008

© Pharsight Corporation All Rights ReservedMarch, 2008
OutlineOutline
Drug development in oncology
A drug-disease modeling framework to support drug development in Oncology
● Tumor growth model● Survival model
Support to end-of-Phase II development decisions: A retrospective project with capecitabine (Roche)
On the use the FDA NSCLC survival model● A case study based on erlotinib data
Value of the survival simulations
Conclusions

slide 60 © Pharsight Corporation All Rights ReservedMarch, 2008
Drug development in oncologyDrug development in oncologyLots of new drug candidates with new mechanisms of action
● Major advances in understanding the molecular biology and genetics of the disease have led to the so-called “targeted therapies”
● Highly competitive marketEmpirical selection of dose and dosing schedules
● MTD vs. biologically active dose paradigm in Phase I● Phase II studies not designed to assess dose-response
• Typical randomized Phase IIb dose-ranging studies are not conducted in oncology
● Analysis of clinical trial data poorly informative (e.g. response rate, neutropenia grade…)
Limit the ability to learn from early clinical trialsHigh failure rate in Phase III

© Pharsight Corporation All Rights ReservedMarch, 2008
A drug-disease modeling framework to predict A drug-disease modeling framework to predict clinical endpoints and support oncology drug clinical endpoints and support oncology drug developmentdevelopment
Models / Endpoints
Dose Exposure
Survival
Tumor size dynamics
Dose-reductions
PFS
ORRDLT Biomarkers
PK / MOA / Resistance covariates, prognostic
factors, gene expression, protein profile

© Pharsight Corporation All Rights ReservedMarch, 2008
The exposure - tumor size – survival model: A bridge The exposure - tumor size – survival model: A bridge from Phase II to Phase III endpointsfrom Phase II to Phase III endpoints
Dose Exposure SurvivalTumor size dynamics
Drug specificDisease/Patient
specific
Disease specific
Claret L et al. Model-based predictions of expected anti-tumor response and survival in Phase III studies based on phase II data of an investigational agent. Proc ASCO, 24 (18S), 307s (Abs 6025), 2006.
Phase 2 Phase 3
To predict phase 3 endpoint based on phase 2 endpoint and prognostic factors

© Pharsight Corporation All Rights ReservedMarch, 2008
The tumor-size model incorporates tumor growth and The tumor-size model incorporates tumor growth and drug effectdrug effect
0y 0L D
t
dy tK y t K Exposure t R t y t y
dtR t e
Claret et al. PAGE 15, (Abstract 1004), 2006 [www.page-meeting.org/?abstract=1004]
KD, : drug specific Y0, KL: disease/patient specific
y(t): Larger diameter at time t (mm), y(0): baseline tumor sizeExposure(t): Exposure at time t (dose, AUC…))R(t): Resistance function decreasing with time, ranging from 1 (no
resistance) to 0 (no more drug action): Rate constant of resistance appearance KL: Tumor growth rateKD: Drug constant-cell-kill rate

slide 64 © Pharsight Corporation All Rights ReservedMarch, 2008
Goal: To support early drug development decisions● Go/No go● Design of Phase III studies
Simulate expected survival difference in Phase III● Comparing a new drug (X) to a reference drug (R)● Based on Phase II data of X and historical data of R
Retrospective project: ● To simulate:
• Phase III of capecitabine (X) + docetaxel (R) vs. docetaxel in MBC• Phase III of capecitabine (X) vs. 5-Fu (R) in CRC
Claret L et al. Model-based predictions of expected anti-tumor response and survival in Phase III studies based on phase II data of an investigational agent. Proc ASCO, 24 (18S), 307s (Abs 6025), 2006.
Support to end-of-Phase II development Support to end-of-Phase II development decisions: decisions: A retrospective project with capecitabine (Roche)A retrospective project with capecitabine (Roche)

slide 65 © Pharsight Corporation All Rights ReservedMarch, 2008
Model parameter estimation● Capecitabine data
• Phase II (2 studies, 170 patients)● Docetaxel data
• Phase III (docetaxel arm, 223 patients)
Simulation● Phase III study of capecitabine + docetaxel vs. docetaxel (443 patients,
1000 replicates)• Assumes additive effect for the combination• Capecitabine scaled from Phase II to Phase III using disease specific
parameters
Focus on efficacy, no model for dose-limiting side-effects● Simulations conditioned on observed dose intensity (dosing history)● Drug effect driven by dose
Simulation of a Phase III study comparing docetaxel Simulation of a Phase III study comparing docetaxel to docetaxel + capecitabine in MBCto docetaxel + capecitabine in MBC

© Pharsight Corporation All Rights ReservedMarch, 2008
Tumor size reduction relative to baseline
-0.2 0.0 0.2 0.4 0.6
010
020
030
0
-0.2 0.0 0.2 0.4 0.6
010
020
030
0
-0.2 0.0 0.2 0.4 0.6
050
100
200
300
Docetaxel + Capecitabine Arm
Num
ber o
f rep
licat
es
Median25th Quantile 75th Quantile
Observed Predicted 90% PIMedian 0.210 0.270 ( 0.180 - 0.360 )
Simulation of tumor size reduction at week 6 vs. Simulation of tumor size reduction at week 6 vs. observed in the Phase III studyobserved in the Phase III study (1000 replicates)(1000 replicates)

© Pharsight Corporation All Rights ReservedMarch, 2008
Combination Arm
Days
Sur
viva
l
0 200 400 600 800 1000
0.0
0.2
0.4
0.6
0.8
1.0
Docetaxel Arm
Days
Sur
viva
l
0 200 400 600 800 1000
0.0
0.2
0.4
0.6
0.8
1.0
Combination Arm
Days
Sur
viva
l
0 200 400 600 800 1000
0.0
0.2
0.4
0.6
0.8
1.0
Combination Arm
Days
Sur
viva
l
0 200 400 600 800 1000
0.0
0.2
0.4
0.6
0.8
1.0
Docetaxel Arm
Days
Sur
viva
l
0 200 400 600 800 1000
0.0
0.2
0.4
0.6
0.8
1.0
Docetaxel Arm
Days
Sur
viva
l
0 200 400 600 800 1000
0.0
0.2
0.4
0.6
0.8
1.0
Simulation of survival vs. observed in the Phase III Simulation of survival vs. observed in the Phase III study study of docetaxel + capecitabine vs. docetaxelof docetaxel + capecitabine vs. docetaxel

© Pharsight Corporation All Rights ReservedMarch, 2008
Days
Sur
viva
l
0 200 400 600 800 1000
0.0
0.2
0.4
0.6
0.8
1.0
DocetaxelCombination
Observed PredictedCombination 431 412 (330-526)Docetaxel 353 356 (286-443)
Med. Diff 78 57 (-17~148)
Expected survival comparison in a Phase III study of Expected survival comparison in a Phase III study of docetaxel + capecitabine vs. docetaxeldocetaxel + capecitabine vs. docetaxel

slide 69 © Pharsight Corporation All Rights ReservedMarch, 2008
The structure of the tumor size model was robust to predict tumor growth and anti-tumor effect of:
● Three cytotoxic drugs in two tumor types Change in tumor size was a good predictor of survival
● Modeling of longitudinal tumor size data is much more informative than response rate determination
● Poor predictor of survival (primary endpoint in Phase III)• Study-level correlations (Buyse Lancet 2000, Shanafelt JCO 2004)• Even more problematic with new targeted therapies (cytostatic rather
than cytotoxic)
The combined tumor size and survival models:● Successfully predicted expected treatment differences● Is a useful approach to support early development decisions:
• Does the expected survival benefit of the new drug warrant further development?
• If yes, which Phase III study need be designed to show non-inferiority, superiority?
Capecitabine project conclusionsCapecitabine project conclusions
slide 70 © Pharsight Corporation All Rights ReservedMarch, 2008
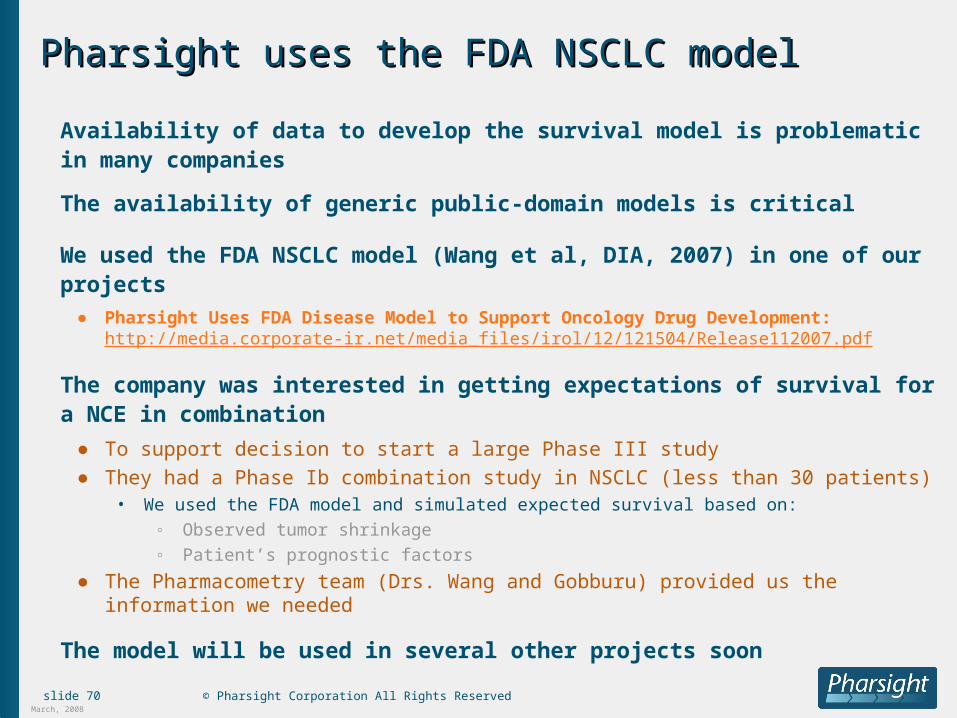
Pharsight uses the FDA NSCLC modelPharsight uses the FDA NSCLC modelAvailability of data to develop the survival model is problematic in many companies The availability of generic public-domain models is critical
We used the FDA NSCLC model (Wang et al, DIA, 2007) in one of our projects
● Pharsight Uses FDA Disease Model to Support Oncology Drug Development:http://media.corporate-ir.net/media_files/irol/12/121504/Release112007.pdf
The company was interested in getting expectations of survival for a NCE in combination
● To support decision to start a large Phase III study● They had a Phase Ib combination study in NSCLC (less than 30 patients)
• We used the FDA model and simulated expected survival based on:◦ Observed tumor shrinkage ◦ Patient’s prognostic factors
● The Pharmacometry team (Drs. Wang and Gobburu) provided us the information we needed
The model will be used in several other projects soon

slide 71 © Pharsight Corporation All Rights ReservedMarch, 2008
A case study to illustrate the use of the FDA A case study to illustrate the use of the FDA NSCLC model with erlotinib dataNSCLC model with erlotinib data
Tumor shrinkage data are generally not reported in papers
Karrison, Maitland, Stadler and Ratain recently proposed to use change in tumor size as the primary endpoint in randomized Phase II trials (J Natl Cancer Inst, 99, 1455-1461, 2007)
● In table 1 they report data for change in tumor size from 4 trials● We used data from the pivotal erlotinib trial in 2nd line patients
(Shepherd et al. New Engl J Med, 353, 123-132)• 488 patients in the erlotinib arm• ORR: 8.9%• Survival: 6.7 months

slide 72 © Pharsight Corporation All Rights ReservedMarch, 2008
A case study to illustrate the use of the FDA A case study to illustrate the use of the FDA NSCLC model with erlotinib data (cont.)NSCLC model with erlotinib data (cont.)
Data used for the simulation ● Week 8 fractional change data based on Karrison reported log ratio
• The ratio of tumor size at week 8 to baseline size is normally distributed• Log ratio was sampled from normal distribution (Table 1): Mean 0.048, SD: 0.340• Shrinkage = exp(logratio)-1 (distribution given in backup)
● Baseline tumor size distribution• Sampled from lognormal distribution• Mean: 100 mm, SD: 57 mm (distribution in backup)
● EGOG 0, 1 proportion (80/20%) based on observed in Shepherd• Shepherd trial included 66 % ECOG 0, 1 and 34 % ECOG 2, 3 patients (Table 1)• Among ECOG 0, 1 patients, 20% had ECOG 1 and 80% ECOG 2
We simulated 1000 replicates of a virtual treatment arm of 300 patients (second–line, ECOG 0 or 1)
● C and D models (assumed to be second line treatments) were used to simulate 1000 replicates
• 25% of the replicates with C1, C2, D1 and D2• Parameters for each of the replicates were sampled in uncertainty of estimates
● Adjusted with early dropouts

© Pharsight Corporation All Rights ReservedMarch, 2008
The FDA SSCLC model can be used to simulate expected survival based on tumor shrinkage data Expected median survival: 7.2 months (95% PI: 5.2 to 10.1 months)
● Slightly longer than in Shepherd (was 6.7 months)● But only concerns ECOG 0, 1 patients
Time (month)
Pro
porti
on
0 10 20 30 40
0.0
0.2
0.4
0.6
0.8
1.0
1000 replicates of 300 patientsMedian 95% prediction interval

slide 74 © Pharsight Corporation All Rights ReservedMarch, 2008
The survival probability distribution of an investigational treatment can be quantified based on early tumor shrinkage clinical data (typically available in Phase Ib or II)
● Can be a new NCE● Can be a new combination treatment
An arm of the investigational treatment can be simulated conditional on a sample size
● To mimic a clinical trial arm
These simulations can be compared to a survival distribution from a reference treatment
● Expected treatment arm difference can support • Go/no go decision• Phase III clinical trial design
Phase III clinical trials can be simulated to assess probability of success
Value of the survival simulationsValue of the survival simulations

slide 75 © Pharsight Corporation All Rights ReservedMarch, 2008
Change in tumor size is a good predictor of survival● Response rate (the primary endpoint in Phase II) is a poor predictor of survival
• Study-level correlations (Buyse Lancet 2000, Shanafelt JCO 2004)● Modeling of longitudinal tumor size data is much more informative than
response rate determination to predict clinical benefit● Supports use of change in tumor size as a primary endpoint in Phase II studies
Drug-independent survival models allow to predict survival expectations or simulate Phase III trials based on early Phase Ib or Phase II data
● Availability of these models is limited● FDA is in a unique position to develop such models without disclosing
proprietary information● Models for other endpoints (e.g. PFS) might be needed
A modeling framework combining longitudinal tumor size models and drug independent survival models can be used
● To predict expected treatment efficacy (ORR, Survival, PFS) ● To simulate clinical trials● To support
• Drug development decisions • Clinical trial design• Drug registration
ConclusionsConclusions

slide 76 © Pharsight Corporation All Rights ReservedMarch, 2008
Contributors to the Roche project● P. Girard, Pharsight corporation, now with INSERM, University of Lyon,
France● K. Zuideveld, K. Jorga, J. Fagerberg, F. Sirzen, M. Abt, F. Hoffmann-La
Roche J. O’Shaughnessy, Baylor-Sammons Cancer Center● P. Hoff, MD Anderson Cancer Center● E. Van Cutsem, University Hospital Gasthuisberg● J. Blum, US Oncology Dallas
FDA pharmacometrics team● Y. Wang and J. Gobburu
AcknowledgementsAcknowledgements

![Caio Rodrigo – [PAN] Diogo Ferreira – [PAN] [PGT] [PPR] Emanoel Rodolfo – [PAN] [PGT] [PPR] Filipe Loreto – [PAN] [PGT] [PPR] Pedro Vasconcelos](https://img.dokumen.tips/doc/110x75/570638501a28abb8238f885f/-caio-rodrigo-pan-diogo-ferreira-pan-pgt-ppr-emanoel.jpg)