Embed Size (px)
Citation preview
Institutional Class Shares
SEMI-ANNUAL REPORT
Roumell Opportunistic Value Fund
FOR THE PERIOD SEPTEMBER 1, 2019 – FEBRUARY 29, 2020 (UNAUDITED)
Roumell Asset Management, LLC
This report and the financial statements contained herein are submitted for the general information of the shareholders of the Roumell Opportunistic Value Fund (the “Fund”). The Fund’s shares are not deposits or obligations of, or guaranteed by, any depository institution. The Fund’s shares are not insured by the FDIC, Federal Reserve Board or any other agency, and are subject to investment risks, including possible loss of principal amount invested. Neither the Fund nor the Fund’s distributor is a bank.
The Roumell Opportunistic Value Fund is distributed by Capital Investment Group, Inc., Member FINRA/SIPC, 100 E. Six Forks Road, Suite 200, Raleigh, NC 27609. There is no affiliation between the Roumell Opportunistic Value Fund, including its principals, and Capital Investment Group, Inc.
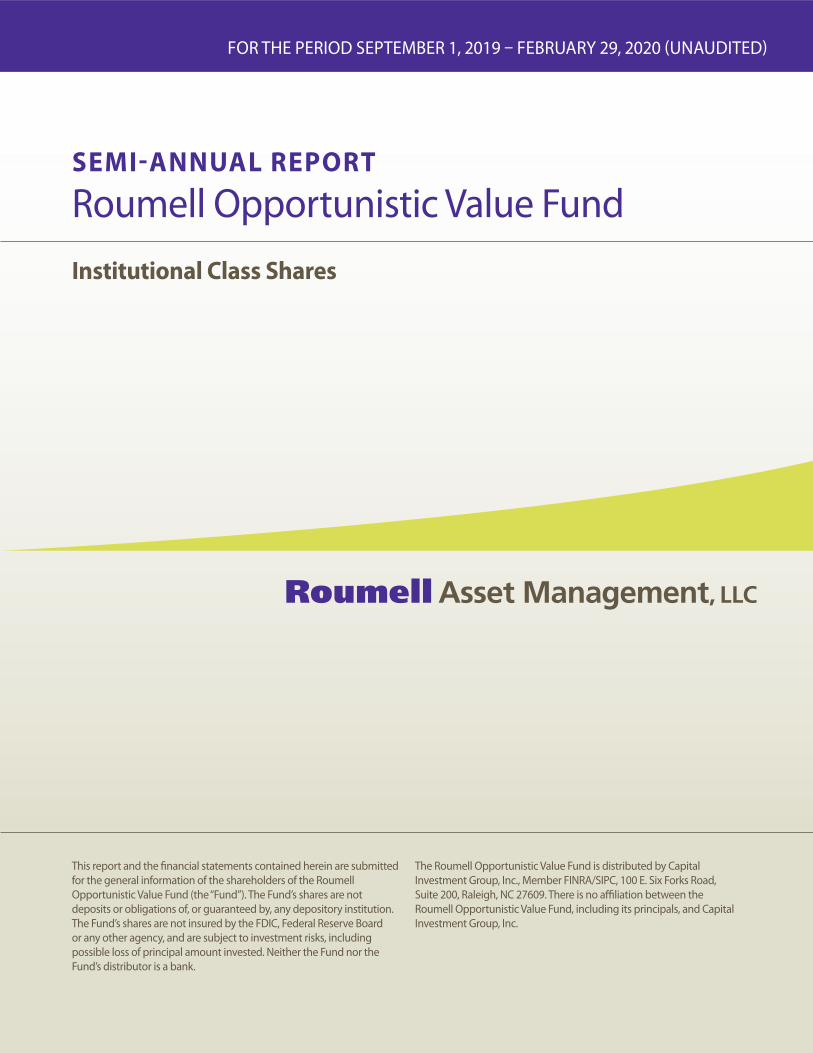
February 29, 2020 During the recent market turmoil, we chose not to liquidate our BDC debt, despite significant negative marks, given our confidence in the covenant protections embedded in BDC bonds provided by the Investment Company Act of 1940, i.e., the requirement that debt must be covered by a minimum of 150% asset value at all times. This did result in an opportunity cost, not a permanent impairment of capital. To be clear, because of the dry powder we already had in place, we were able to add to several existing positions while also going back into ones exited recently that fell back to highly attractive price points. BDC debt, with $25 par value, has in fact moved back up to the $20 level from recent lows of $12 to $15 and we have taken the opportunity to lighten up on this exposure to pursue a superior opportunity set emerging in stocks, particularly in our sweet spot of the market – well capitalized dislocated small and micro‐cap securities. As a ’40 Act Fund, RAMSX, must remain liquid. We never want to risk being forced sellers, and it appears unlikely we will be. To wit, for the month of March, we have received net inflows into our Fund. We believe we are well‐positioned to take advantage of a volatile market environment. In fact, it’s what we’ve been writing about and expecting for some time:
‐ Market Cap to GDP (Wilshire 5000 stock index/Nominal Quarterly GDP) is at
140%. This is the highest ratio on record, slightly outpacing the peak of the tech
bubble. The average ratio over the past 50 years is roughly 80%.
‐ Number of hours of labor needed to buy the S&P 500 is 125 (based on the U.S.
median hourly wage), near the all‐time high of 127 hours reached in September
2018. The average number of work hours required over the past 50 years is
roughly 60.
We also recently noted that over 90% of the S&P 500’s 2019 return was the result of simply multiple expansion. Subtracting out multiple expansion, the S&P 500 in 2019

would have ended up about 2.5%, or roughly at 2,550. Currently, after big rallies, the index stands at the same place at a time when systemic risks have rarely been higher, thus the unprecedented size of government intervention. How are we thinking about capital allocation in the current environment?
1. We are happy to be “balance‐sheet” investors. We believe we own a collection of
well‐financed assets and businesses (with a few of exceptions, offset by compelling
attributes) at bargain prices – that provides us great comfort.
2. Given Covid‐19’s broad economic impact, we are digging deeper into both existing
and new names to stress test their businesses and balance sheets and to assess
each’s ability to weather a prolonged period of “shelter in place.” This work is time
consuming and cannot be rushed. However, as we complete it, we will act.
3. Our company access has been terrific. The past several days has underscored the
depth and strength of our network. Company CEOs and CFOs have been willing to
make time for us and we’ve spent more time on the phone in the past several days
than we can count. Moreover, this universe of business operators is providing us
insights into where to look for new ideas and helping us navigate industries to
avoid.
4. While we believe that Covid‐19, and its impact on current business operations, is
the primary driving force of recent market volatility, it is not the only factor. In
addition to pre‐Covid‐19 valuation levels noted above, the amount of leverage built
up among non‐financial corporations and consumers in recent years is
significant. To wit, corporate debt (bonds and loans), is now roughly 75% of GDP,
matching its 2008 all‐time high. Further, roughly 50% of the $5 trillion Investment
Grade corporate debt market is now BBB rated. As this debt is downgraded, there
are many institutions that will become forced sellers. About $2.5 trillion in
corporate debt matures in 2020 and 2021 and will need to be refinanced. In other
words, Covid‐19 has laid bare the amount of leverage in the system and could set‐
off a significant credit unwinding cycle. Additionally, in 2018 and 2019 corporations
posted back‐to‐back record years in stock buy backs, hence they’re less prepared
to weather the current downturn.
5. If corporations haven’t been investing, what’s been the source of economic growth
in recent years, albeit at mid‐2% levels? The United States is unique among our

Western peers in the role consumers play in driving our economy, it’s roughly
70%. Canada is about 58% and Germany is 52%. Consumers are now in the cross
hairs of Covid‐19. Can consumers be expected to continue to carry the economy
on their backs with the gut‐punch stemming from this violent virus after all the
heavy lifting they’ve done, often financed with debt, over the past ten years? How
this crisis plays out economically is speculative, with economic views ranging from
a V, to a U (of various lengths), or a long L (i.e., a lengthy period) shaped
recovery. Can the government really just step in with a variety of interventions
(never seen before in size or scope), and heal our wounds and make us all feel
better? We do not have answers to these questions, but we suspect systemic risks
are very real.
Bottom line: We are cautious. We will be patient. We will pick our spots. We will do what we do – identify well‐capitalized situations wherein the price to value spread is very wide. We will remain vigilant about requiring a substantial discount to our calculation of net asset value. While we are disappointed in year‐to‐date performance, we are not discouraged. Unlike many of our peers, we have dry powder. We are energized by the prospect of competing in the next chapter of this story. In fact, it’s an environment that favors our style of highly opportunistic investing. Thank you again for your trust and confidence…and stay safe. Kind Regards,
Jim Roumell Portfolio Manager Roumell Opportunistic Value Fund (RCRAM0420001)
ROUMELL OPPORTUNISTIC VALUE FUND
Schedule of Investments(Unaudited)
As of February 29, 2020
Shares Cost
Value (Note 1)
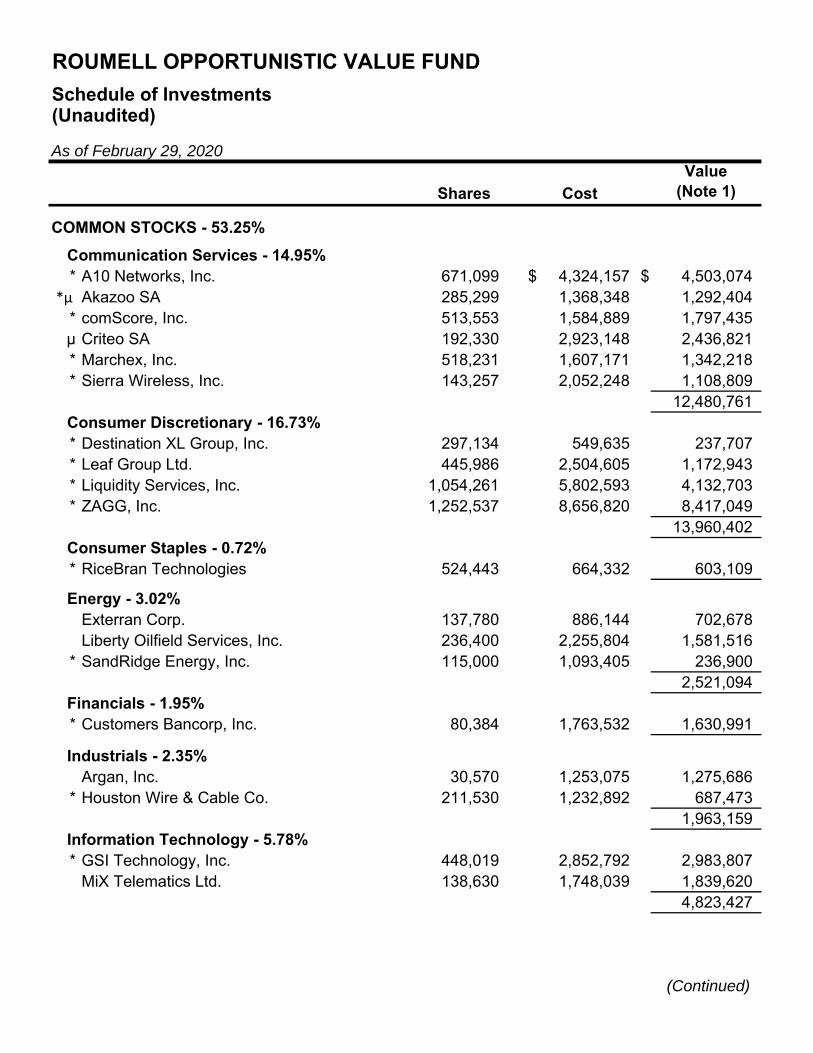
COMMON STOCKS - 53.25%
Communication Services - 14.95%* A10 Networks, Inc. 671,099 4,324,157$ $ 4,503,074
Akazoo SA 285,299 1,368,348 1,292,404 * comScore, Inc. 513,553 1,584,889 1,797,435 µ Criteo SA 192,330 2,923,148 2,436,821 * Marchex, Inc. 518,231 1,607,171 1,342,218 * Sierra Wireless, Inc. 143,257 2,052,248 1,108,809
12,480,761 Consumer Discretionary - 16.73%* Destination XL Group, Inc. 297,134 549,635 237,707 * Leaf Group Ltd. 445,986 2,504,605 1,172,943 * Liquidity Services, Inc. 1,054,261 5,802,593 4,132,703 * ZAGG, Inc. 1,252,537 8,656,820 8,417,049
13,960,402 Consumer Staples - 0.72%* RiceBran Technologies 524,443 664,332 603,109
Energy - 3.02% Exterran Corp. 137,780 886,144 702,678 Liberty Oilfield Services, Inc. 236,400 2,255,804 1,581,516 * SandRidge Energy, Inc. 115,000 1,093,405 236,900
2,521,094 Financials - 1.95%* Customers Bancorp, Inc. 80,384 1,763,532 1,630,991
Industrials - 2.35% Argan, Inc. 30,570 1,253,075 1,275,686 * Houston Wire & Cable Co. 211,530 1,232,892 687,473
1,963,159 Information Technology - 5.78%* GSI Technology, Inc. 448,019 2,852,792 2,983,807 MiX Telematics Ltd. 138,630 1,748,039 1,839,620
4,823,427
(Continued)
*µ
ROUMELL OPPORTUNISTIC VALUE FUNDSchedule of Investments - Continued(Unaudited)
As of February 29, 2020
Shares Cost
Value (Note 1)
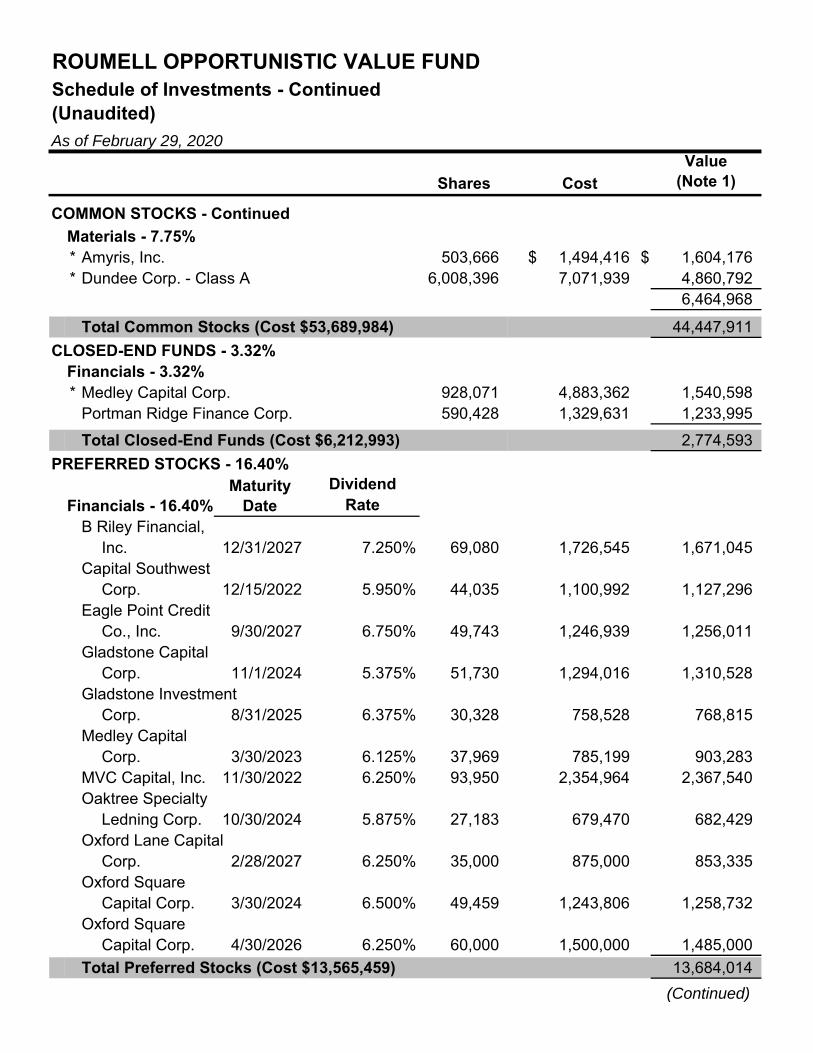
COMMON STOCKS - Continued
Materials - 7.75%* Amyris, Inc. 503,666 1,494,416$ $ 1,604,176 * Dundee Corp. - Class A 6,008,396 7,071,939 4,860,792
6,464,968
Total Common Stocks (Cost $53,689,984) 44,447,911
CLOSED-END FUNDS - 3.32%Financials - 3.32%* Medley Capital Corp. 928,071 4,883,362 1,540,598 Portman Ridge Finance Corp. 590,428 1,329,631 1,233,995
Total Closed-End Funds (Cost $6,212,993) 2,774,593
PREFERRED STOCKS - 16.40%Dividend
Financials - 16.40% RateB Riley Financial,
Inc. 12/31/2027 7.250% 69,080 1,726,545 1,671,045 Capital Southwest
Corp. 12/15/2022 5.950% 44,035 1,100,992 1,127,296 Eagle Point Credit
Co., Inc. 9/30/2027 6.750% 49,743 1,246,939 1,256,011 Gladstone Capital
Corp. 11/1/2024 5.375% 51,730 1,294,016 1,310,528 Gladstone Investment
Corp. 8/31/2025 6.375% 30,328 758,528 768,815 Medley Capital
Corp. 3/30/2023 6.125% 37,969 785,199 903,283 MVC Capital, Inc. 11/30/2022 6.250% 93,950 2,354,964 2,367,540 Oaktree Specialty
Ledning Corp. 10/30/2024 5.875% 27,183 679,470 682,429 Oxford Lane Capital
Corp. 2/28/2027 6.250% 35,000 875,000 853,335 Oxford Square
Capital Corp. 3/30/2024 6.500% 49,459 1,243,806 1,258,732 Oxford Square
Capital Corp. 4/30/2026 6.250% 60,000 1,500,000 1,485,000
Total Preferred Stocks (Cost $13,565,459) 13,684,014
(Continued)
Maturity Date
ROUMELL OPPORTUNISTIC VALUE FUND
Schedule of Investments - Continued(Unaudited)
As of February 29, 2020Value
(Note 1)
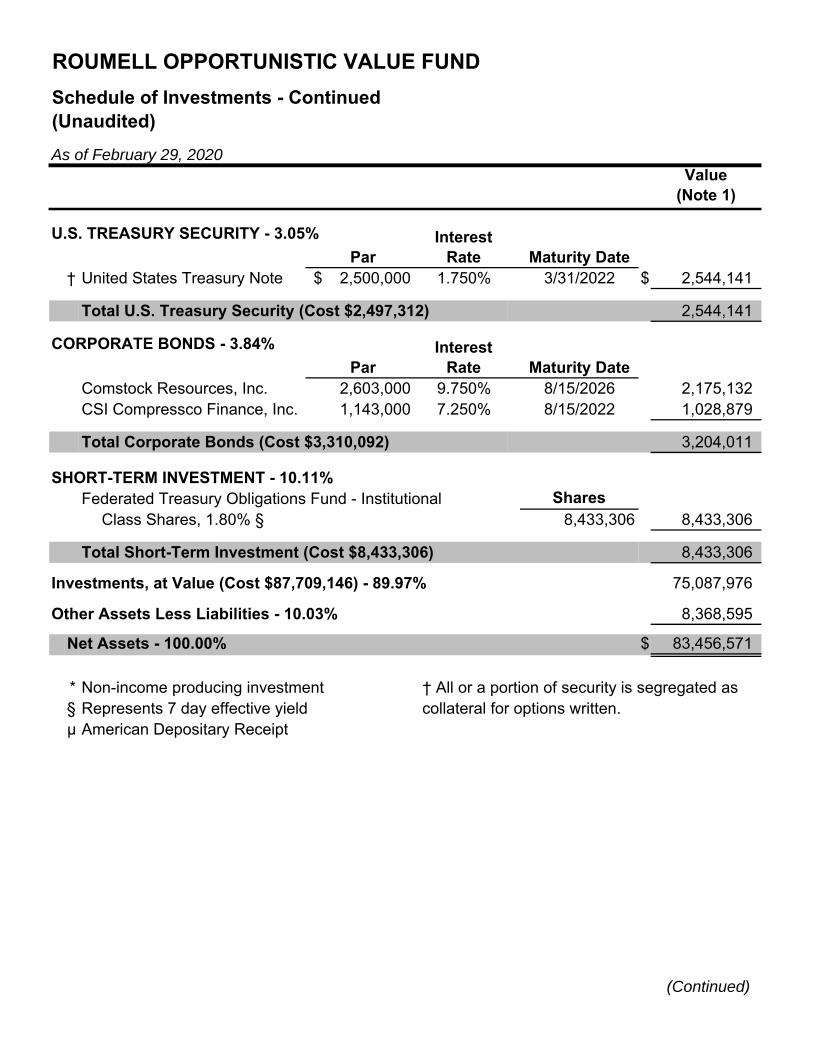
U.S. TREASURY SECURITY - 3.05%
Par† United States Treasury Note 2,500,000$ 1.750% 3/31/2022 $ 2,544,141
Total U.S. Treasury Security (Cost $2,497,312) 2,544,141
CORPORATE BONDS - 3.84%
ParComstock Resources, Inc. 2,603,000 9.750% 8/15/2026 2,175,132 CSI Compressco Finance, Inc. 1,143,000 7.250% 8/15/2022 1,028,879
Total Corporate Bonds (Cost $3,310,092) 3,204,011
SHORT-TERM INVESTMENT - 10.11%Federated Treasury Obligations Fund - Institutional Shares
Class Shares, 1.80% § 8,433,306 8,433,306
Total Short-Term Investment (Cost $8,433,306) 8,433,306
Investments, at Value (Cost $87,709,146) - 89.97% 75,087,976
Other Assets Less Liabilities - 10.03% 8,368,595
Net Assets - 100.00% $ 83,456,571
* Non-income producing investment † All or a portion of security is segregated as§ Represents 7 day effective yield collateral for options written.µ American Depositary Receipt
(Continued)
Maturity DateInterest
Rate
Interest Rate Maturity Date

ROUMELL OPPORTUNISTIC VALUE FUND
Schedule of Investments - Continued(Unaudited)
As of February 29, 2020
Summary of Investments by Sector % of Net
Assets ValueCommon Stocks: Communication Services 14.95% $ 12,480,761 Consumer Discretionary 16.73% 13,960,402 Consumer Staples 0.72% 603,109 Energy 3.02% 2,521,094 Financials 1.95% 1,630,991 Industrials 2.35% 1,963,159 Information Technology 5.78% 4,823,427 Materials 7.75% 6,464,968 Closed-End Funds: Financials 3.32% 2,774,593 Preferred Stocks: Financials 16.40% 13,684,014 U.S. Treasury Security 3.05% 2,544,141 Corporate Bonds 3.84% 3,204,011 Short-Term Investment 10.11% 8,433,306 Other Assets Less Liabilities 10.03% 8,368,595 Total Net Assets 100.00% $ 83,456,571
See Notes to Financial Statements

ROUMELL OPPORTUNISTIC VALUE FUNDStatement of Assets and Liabilities(Unaudited)As of February 29, 2020
Assets:Investments, at value (Cost $87,709,146) $ 75,087,976 Deposits at Broker 4,473 Receivables:
Investments sold 8,040,000 Fund shares sold 1,979,969 Dividends and interest 159,391
Prepaid expenses:Registration and filing expenses 9,251 Fund accounting fees 2,509 Administration fees 1,594 Shareholder fulfillment fees 1,502 Security pricing fees 234 Transfer agent fees 61 Compliance fees 52
Total assets 85,287,012
Liabilities:Payables:
Investments purchased 1,674,666 Fund shares purchased 78,847
Accrued expenses:Advisory fees 59,200 Professional fees 12,748 Custody fees 1,226 Trustee fees and meeting expenses 1,530 Insurance fees 1,516 Miscellaneous expenses 708
Total liabilities 1,830,441
Net Assets $ 83,456,571
Net Assets Consist of:Paid in Beneficial Interest $ 92,350,169 Accumulated Deficit (8,893,598) Total Net Assets $ 83,456,571
Institutional Class Shares of beneficial interest outstanding, no par value (a) 9,954,409 Net Assets $ 83,456,571 Net Asset Value, Offering Price and Redemption Price Per Share (b) $ 8.38
(a) Unlimited Authorized Shares(b) The Fund charges a 1% redemption fee on redemptions made within 60 days of initial purchase.See Notes to Financial Statements
ROUMELL OPPORTUNISTIC VALUE FUND
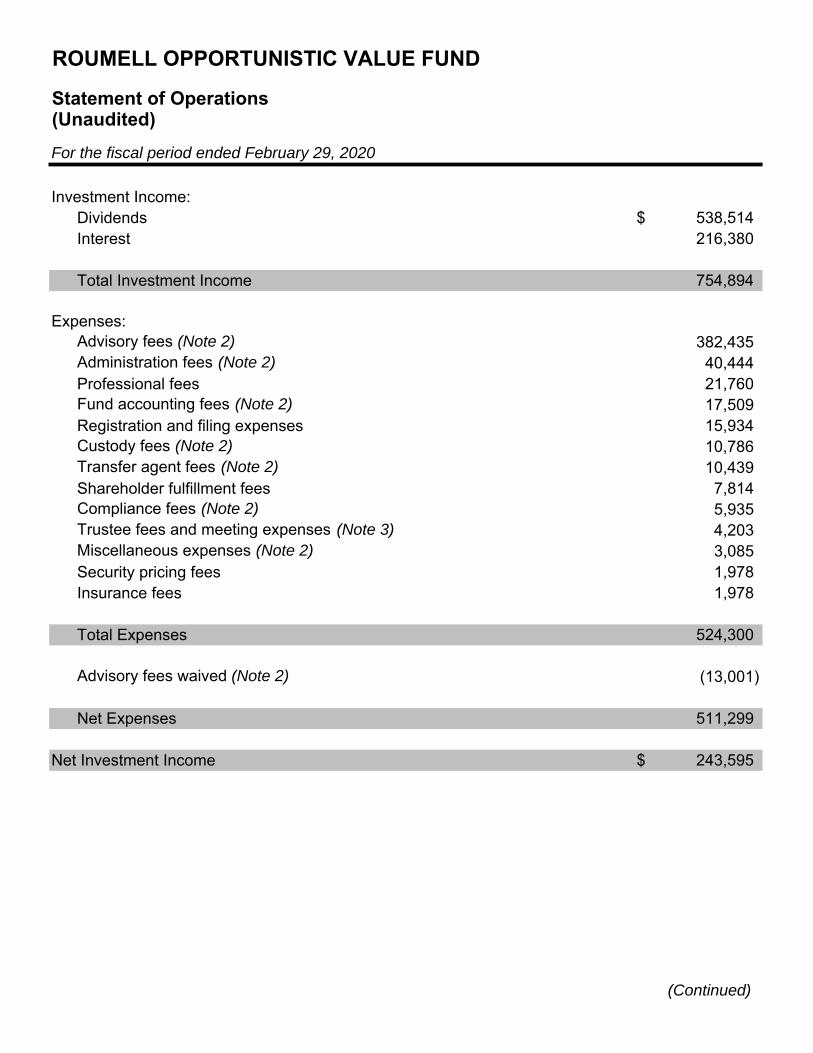
Statement of Operations(Unaudited)
For the fiscal period ended February 29, 2020
Investment Income:Dividends $ 538,514 Interest 216,380
Total Investment Income 754,894
Expenses:Advisory fees (Note 2) 382,435 Administration fees (Note 2) 40,444 Professional fees 21,760 Fund accounting fees (Note 2) 17,509 Registration and filing expenses 15,934 Custody fees (Note 2) 10,786 Transfer agent fees (Note 2) 10,439 Shareholder fulfillment fees 7,814 Compliance fees (Note 2) 5,935 Trustee fees and meeting expenses (Note 3) 4,203 Miscellaneous expenses (Note 2) 3,085 Security pricing fees 1,978 Insurance fees 1,978
Total Expenses 524,300
Advisory fees waived (Note 2) (13,001)
Net Expenses 511,299
Net Investment Income $ 243,595
(Continued)
ROUMELL OPPORTUNISTIC VALUE FUND
Statement of Operations - Continued(Unaudited)
For the fiscal period ended February 29, 2020
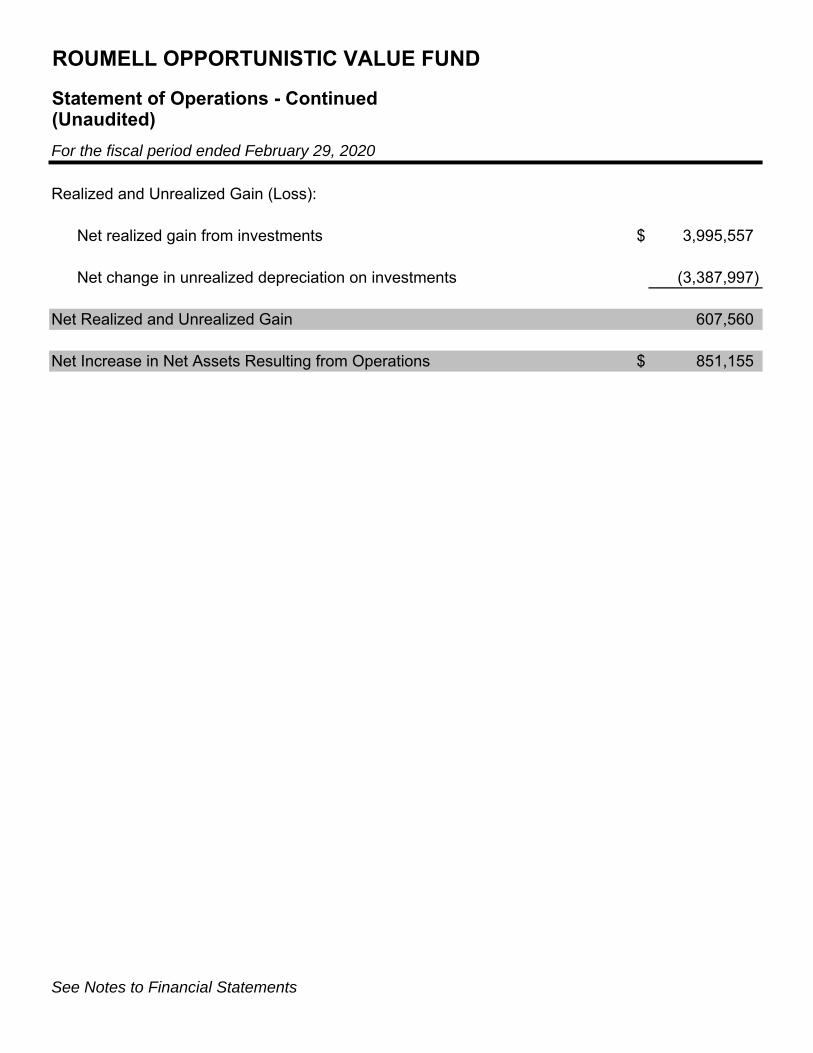
Realized and Unrealized Gain (Loss):
Net realized gain from investments $ 3,995,557
Net change in unrealized depreciation on investments (3,387,997)
Net Realized and Unrealized Gain 607,560
Net Increase in Net Assets Resulting from Operations $ 851,155
See Notes to Financial Statements
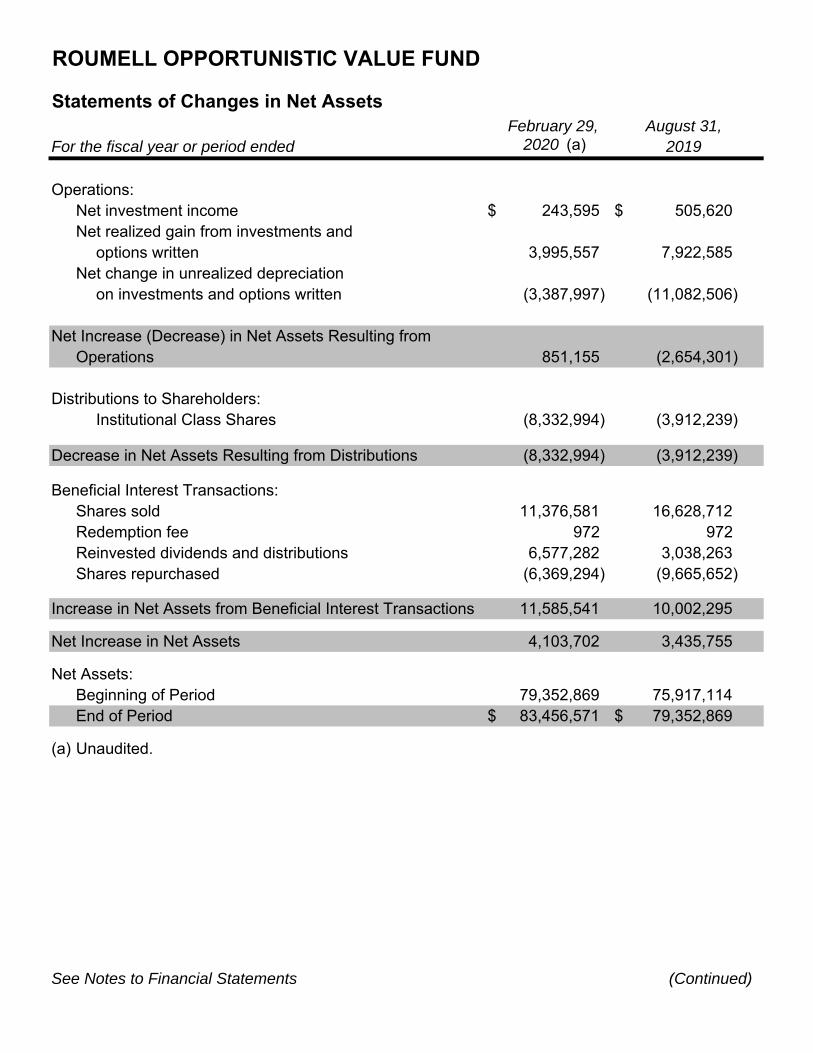
February 29, August 31,For the fiscal year or period ended 2020 (a) 2019
Operations:Net investment income $ 243,595 $ 505,620 Net realized gain from investments and
options written 3,995,557 7,922,585 Net change in unrealized depreciation
on investments and options written (3,387,997) (11,082,506)
Net Increase (Decrease) in Net Assets Resulting from Operations 851,155 (2,654,301)
Distributions to Shareholders: Institutional Class Shares (8,332,994) (3,912,239)
Decrease in Net Assets Resulting from Distributions (8,332,994) (3,912,239)
Beneficial Interest Transactions:Shares sold 11,376,581 16,628,712 Redemption fee 972 972 Reinvested dividends and distributions 6,577,282 3,038,263 Shares repurchased (6,369,294) (9,665,652)
Increase in Net Assets from Beneficial Interest Transactions 11,585,541 10,002,295
Net Increase in Net Assets 4,103,702 3,435,755
Net Assets:Beginning of Period 79,352,869 75,917,114 End of Period $ 83,456,571 $ 79,352,869
(a) Unaudited.
See Notes to Financial Statements
ROUMELL OPPORTUNISTIC VALUE FUND
Statements of Changes in Net Assets
(Continued)

For the fiscal year or period ended
Share Information:Institutional Class Shares Shares Amount Shares Amount
Shares sold 1,250,218 $ 11,376,581 1,795,293 $ 16,628,712 Redemption fee - 972 - 972 Reinvested dividends
and distributions 721,081 6,577,282 360,780 3,038,263 Shares repurchased (687,938) (6,369,294) (1,056,490) (9,665,652)
Net Increase in Sharesof Beneficial Interest 1,283,361 $ 11,585,541 1,099,583 $ 10,002,295
(a) Unaudited.
See Notes to Financial Statements
Statements of Changes in Net Assets - Continued
February 29,2020 (a) 2019
ROUMELL OPPORTUNISTIC VALUE FUND
August 31,
For a share outstanding during
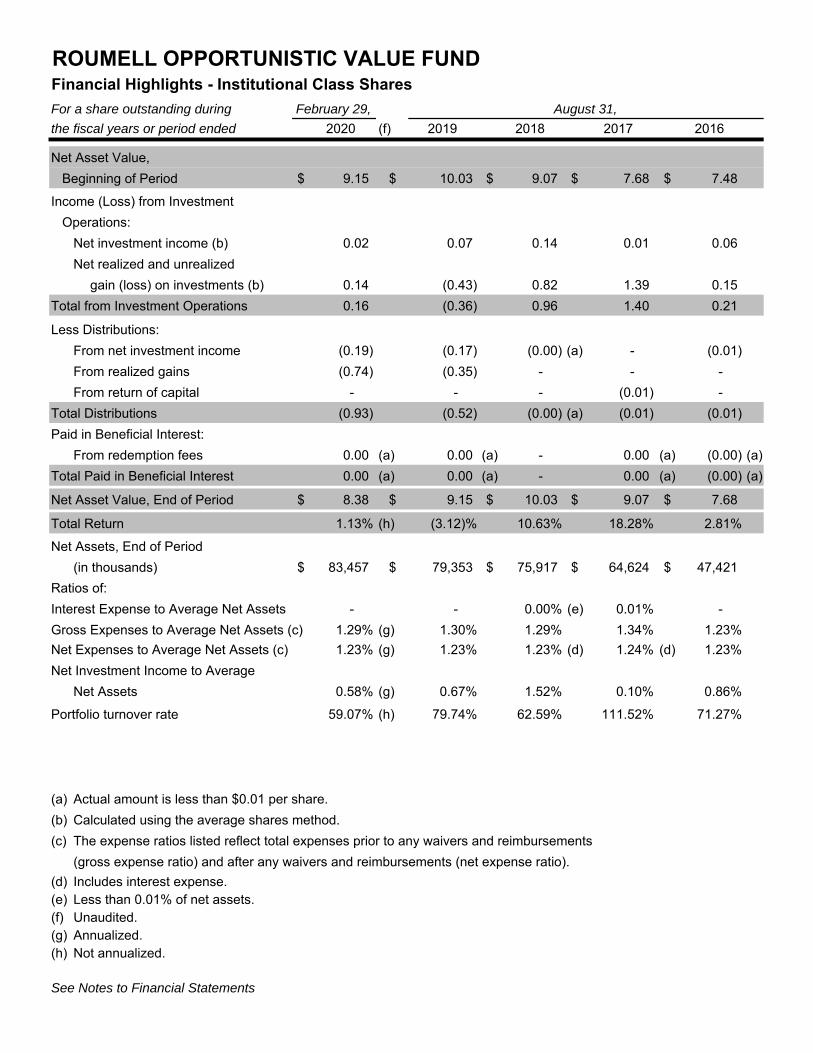
the fiscal years or period ended 2020 (f) 2019 2018 2017 2016
Net Asset Value,
Beginning of Period $ 9.15 $ 10.03 $ 9.07 $ 7.68 $ 7.48
Income (Loss) from Investment
Operations:
Net investment income (b) 0.02 0.07 0.14 0.01 0.06
Net realized and unrealized
gain (loss) on investments (b) 0.14 (0.43) 0.82 1.39 0.15
Total from Investment Operations 0.16 (0.36) 0.96 1.40 0.21
Less Distributions:
From net investment income (0.19) (0.17) (0.00) (a) - (0.01)
From realized gains (0.74) (0.35) - - -
From return of capital - - - (0.01) -
Total Distributions (0.93) (0.52) (0.00) (a) (0.01) (0.01)
Paid in Beneficial Interest:
From redemption fees 0.00 (a) 0.00 (a) - 0.00 (a) (0.00) (a)
Total Paid in Beneficial Interest 0.00 (a) 0.00 (a) - 0.00 (a) (0.00) (a)
Net Asset Value, End of Period $ 8.38 $ 9.15 $ 10.03 $ 9.07 $ 7.68
Total Return 1.13% (h) (3.12)% 10.63% 18.28% 2.81%
Net Assets, End of Period
(in thousands) $ 83,457 $ 79,353 $ 75,917 $ 64,624 $ 47,421
Ratios of:
Interest Expense to Average Net Assets - - 0.00% (e) 0.01% -
Gross Expenses to Average Net Assets (c) 1.29% (g) 1.30% 1.29% 1.34% 1.23%
Net Expenses to Average Net Assets (c) 1.23% (g) 1.23% 1.23% (d) 1.24% (d) 1.23%
Net Investment Income to Average
Net Assets 0.58% (g) 0.67% 1.52% 0.10% 0.86%
Portfolio turnover rate 59.07% (h) 79.74% 62.59% 111.52% 71.27%
(a) Actual amount is less than $0.01 per share.
(b) Calculated using the average shares method.
(c) The expense ratios listed reflect total expenses prior to any waivers and reimbursements
(gross expense ratio) and after any waivers and reimbursements (net expense ratio).
(d) Includes interest expense. (e) Less than 0.01% of net assets.(f) Unaudited.(g) Annualized.(h) Not annualized.
See Notes to Financial Statements
ROUMELL OPPORTUNISTIC VALUE FUNDFinancial Highlights - Institutional Class Shares
February 29, August 31,
ROUMELL OPPORTUNISTIC VALUE FUND
Notes to Financial Statements (Unaudited) As of February 29, 2020
(Continued)
1. Organization and Significant Accounting Policies The Roumell Opportunistic Value Fund (“Fund”) is a series of the Starboard Investment Trust (“Trust”). The Trust is organized as a Delaware statutory trust and is registered under the Investment Company Act of 1940, as amended (the “1940 Act”), as an open-end management investment company. The Fund is a separate non-diversified series of the Trust. The investment objective of the Fund is to seek capital appreciation and income. Roumell Asset Management, LLC (“Roumell Asset Management” or the “Advisor”) seeks to achieve the Fund’s investment objective by using an opportunistic investment strategy. The Fund's portfolio will primarily consist of (i) domestic and foreign equity securities (common stock, preferred stock, warrants, and securities convertible into common stocks); (ii) domestic and foreign fixed income securities consisting of government and corporate debt securities, "junk" bonds, municipal securities, and real estate investment trusts ("REITs"); and (iii) interest-bearing instruments consisting of treasury bills, other U.S. government obligations and bonds, collateralized repurchase contracts, money market instruments, and money market funds (collectively referred to as cash and cash equivalents). The Fund currently has an unlimited number of authorized shares, the Institutional Class Shares. Fund shares are subject to redemption fees of 1.00% if redeemed within 60 days of the issuance. The Date of Initial Public Investment of the Fund shares was December 31, 2010. The following is a summary of significant accounting policies consistently followed by the Fund. The policies are in conformity with accounting principles generally accepted in the United States of America (“GAAP”). The Fund follows the accounting and reporting guidance in the Financial Accounting Standards Board (“FASB”) Accounting Standards Codification 946 “Financial Services – Investment Companies,” and Financial Accounting Standards Update (“ASU”) 2013-08. Investment Valuation The Fund’s investments in securities are carried at value. Securities listed on an exchange or quoted on a national market system are valued at the last sales price as of 4:00 p.m. Eastern Time. Securities traded in the NASDAQ over-the-counter market are generally valued at the NASDAQ Official Closing Price. Other securities traded in the over-the-counter market and listed securities for which no sale was reported on

ROUMELL OPPORTUNISTIC VALUE FUND
Notes to Financial Statements (Unaudited) As of February 29, 2020
(Continued)
that date are valued at the most recent bid price. Securities and assets for which representative market quotations are not readily available (e.g., if the exchange on which the security is principally traded closes early or if trading of the particular security is halted during the day and does not resume prior to the Fund’s net asset value calculation) or which cannot be accurately valued using the Fund’s normal pricing procedures are valued at fair value as determined in good faith under policies approved by the Board of Trustees (the “Board”). A security’s “fair value” price may differ from the price next available for that security using the Fund’s normal pricing procedures. Instruments with maturities of 60 days or less are valued at amortized cost, which approximates market value. Fair Value Measurement Various inputs are used in determining the value of the Fund's investments. These inputs are summarized in the three broad levels listed below:
Level 1: Quoted prices in active markets for identical securities Level 2: Other significant observable inputs (including quoted prices for similar securities, interest rates, credit risk, etc.) Level 3: Significant unobservable inputs (including the Fund’s own assumptions in determining fair value of investments)
The availability of observable inputs can vary from security to security and is affected by a wide variety of factors, including, for example, the type of security, whether the security is new and not yet established in the marketplace, the liquidity of markets, and other characteristics particular to the security. To the extent that valuation is based on models or inputs that are less observable or unobservable in the market, the determination of fair value requires more judgment. Accordingly, the degree of judgment exercised in determining fair value is greatest for instruments categorized in Level 3. The inputs used to measure fair value may fall into different levels of the fair value hierarchy. In such cases, for disclosure purposes, the level in the fair value hierarchy within which the fair value measurement falls in its entirety, is determined based on the lowest level input that is significant to the fair value measurement in its entirety. The inputs or methodology used for valuing securities are not necessarily an indication of the risk associated with investing in those securities.
ROUMELL OPPORTUNISTIC VALUE FUND
Notes to Financial Statements (Unaudited) As of February 29, 2020
(Continued)
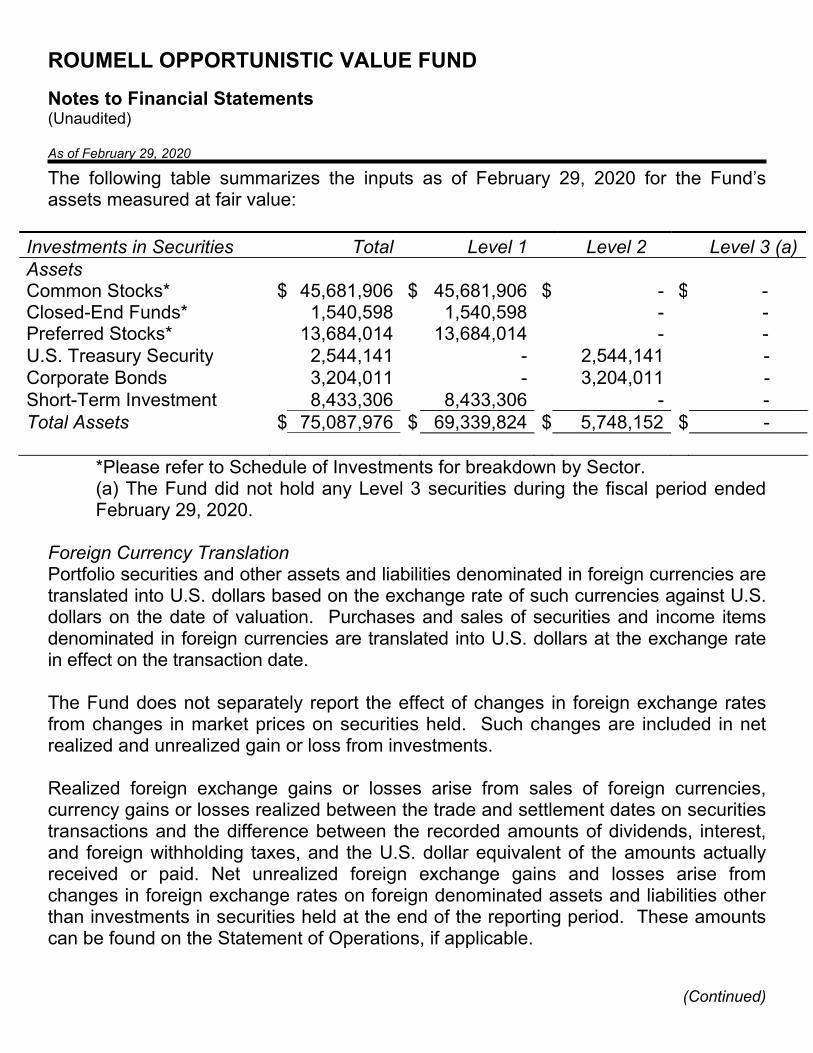
The following table summarizes the inputs as of February 29, 2020 for the Fund’s assets measured at fair value:
Investments in Securities Total Level 1 Level 2 Level 3 (a)Assets Common Stocks* $ 45,681,906 $ 45,681,906 $ - $ - - Closed-End Funds* 1,540,598 1,540,598 - -Preferred Stocks* 13,684,014 13,684,014 - -U.S. Treasury Security 2,544,141 - 2,544,141 -Corporate Bonds 3,204,011 - 3,204,011 - Short-Term Investment 8,433,306 8,433,306 - - -Total Assets $ 75,087,976 $ 69,339,824 $ 5,748,152 $ -
*Please refer to Schedule of Investments for breakdown by Sector. (a) The Fund did not hold any Level 3 securities during the fiscal period ended February 29, 2020.
Foreign Currency Translation Portfolio securities and other assets and liabilities denominated in foreign currencies are translated into U.S. dollars based on the exchange rate of such currencies against U.S. dollars on the date of valuation. Purchases and sales of securities and income items denominated in foreign currencies are translated into U.S. dollars at the exchange rate in effect on the transaction date. The Fund does not separately report the effect of changes in foreign exchange rates from changes in market prices on securities held. Such changes are included in net realized and unrealized gain or loss from investments.
Realized foreign exchange gains or losses arise from sales of foreign currencies, currency gains or losses realized between the trade and settlement dates on securities transactions and the difference between the recorded amounts of dividends, interest, and foreign withholding taxes, and the U.S. dollar equivalent of the amounts actually received or paid. Net unrealized foreign exchange gains and losses arise from changes in foreign exchange rates on foreign denominated assets and liabilities other than investments in securities held at the end of the reporting period. These amounts can be found on the Statement of Operations, if applicable.

ROUMELL OPPORTUNISTIC VALUE FUND
Notes to Financial Statements (Unaudited) As of February 29, 2020
(Continued)
Investment Transactions and Investment Income Investment transactions are accounted for as of the date purchased or sold (trade date). Dividend income is recorded on the ex-dividend date. Certain dividends from foreign securities will be recorded as soon as the Fund is informed of the dividend if such information is obtained subsequent to the ex-dividend date. Interest income is recorded on the accrual basis and includes accretion of discounts and amortization of premiums. Gains and losses are determined on the identified cost basis, which is the same basis used for federal income tax purposes. Expenses The Fund bears expenses incurred specifically on its behalf as well as a portion of general expenses, which are allocated according to methods reviewed annually by the Board. Distributions The Fund may declare and distribute dividends from net investment income (if any) annually. Distributions from capital gains (if any) are generally declared and distributed annually. Dividends and distributions to shareholders are recorded on ex-date. Estimates The preparation of financial statements in conformity with GAAP requires management to make estimates and assumptions that affect the reported amounts of assets and liabilities and disclosure of contingent assets and liabilities at the date of the financial statements and the reported amounts of increases and decreases in the net assets from operations during the reported period. Actual results could differ from those estimates. Fees on Redemptions The Fund charges a redemption fee of 1.00% on redemptions of Fund shares occurring within 60 days following the issuance of such shares. The redemption fee is not a fee to finance sales or sales promotion expenses but is paid to the Fund to defray the costs of liquidating an investor and discourage short-term trading of the Fund’s shares. No redemption fee will be imposed on the redemption of shares representing dividends or capital gains distributions, or on amounts representing capital appreciation of shares. Federal Income Taxes No provision for income taxes is included in the accompanying financial statements, as the Fund intends to distribute to shareholders all taxable investment income and
ROUMELL OPPORTUNISTIC VALUE FUND
Notes to Financial Statements (Unaudited) As of February 29, 2020
(Continued)
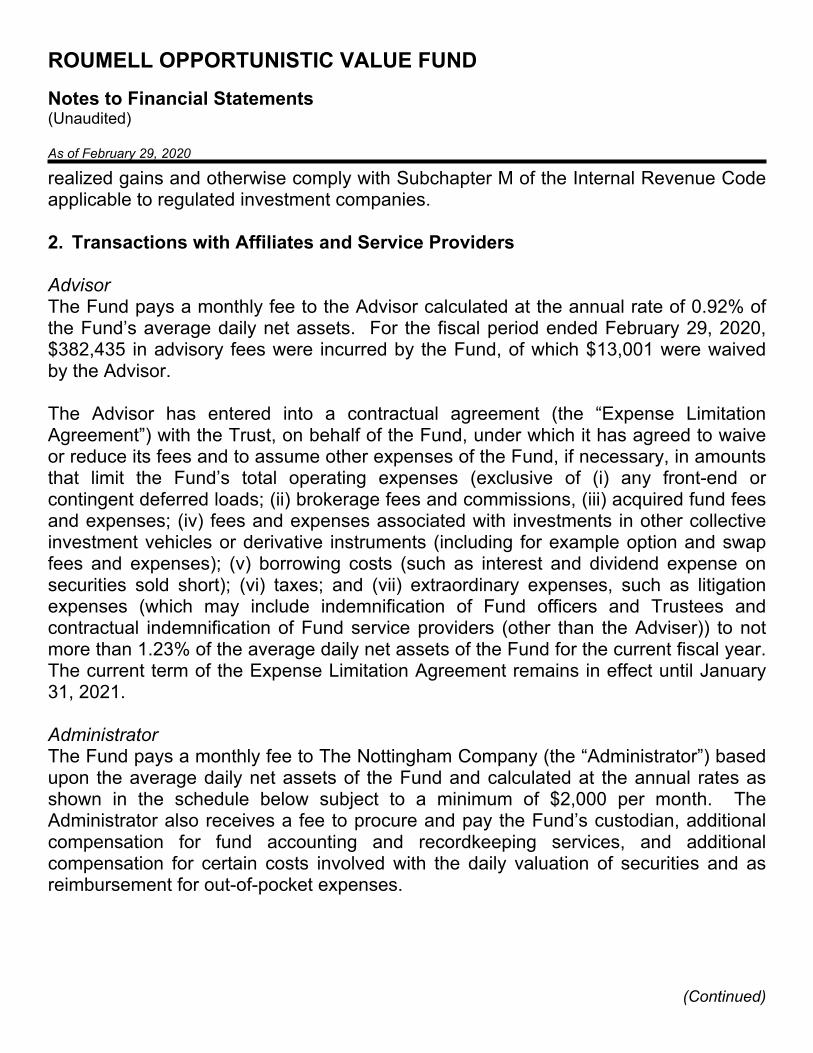
realized gains and otherwise comply with Subchapter M of the Internal Revenue Code applicable to regulated investment companies. 2. Transactions with Affiliates and Service Providers Advisor The Fund pays a monthly fee to the Advisor calculated at the annual rate of 0.92% of the Fund’s average daily net assets. For the fiscal period ended February 29, 2020, $382,435 in advisory fees were incurred by the Fund, of which $13,001 were waived by the Advisor. The Advisor has entered into a contractual agreement (the “Expense Limitation Agreement”) with the Trust, on behalf of the Fund, under which it has agreed to waive or reduce its fees and to assume other expenses of the Fund, if necessary, in amounts that limit the Fund’s total operating expenses (exclusive of (i) any front-end or contingent deferred loads; (ii) brokerage fees and commissions, (iii) acquired fund fees and expenses; (iv) fees and expenses associated with investments in other collective investment vehicles or derivative instruments (including for example option and swap fees and expenses); (v) borrowing costs (such as interest and dividend expense on securities sold short); (vi) taxes; and (vii) extraordinary expenses, such as litigation expenses (which may include indemnification of Fund officers and Trustees and contractual indemnification of Fund service providers (other than the Adviser)) to not more than 1.23% of the average daily net assets of the Fund for the current fiscal year. The current term of the Expense Limitation Agreement remains in effect until January 31, 2021. Administrator The Fund pays a monthly fee to The Nottingham Company (the “Administrator”) based upon the average daily net assets of the Fund and calculated at the annual rates as shown in the schedule below subject to a minimum of $2,000 per month. The Administrator also receives a fee to procure and pay the Fund’s custodian, additional compensation for fund accounting and recordkeeping services, and additional compensation for certain costs involved with the daily valuation of securities and as reimbursement for out-of-pocket expenses.
ROUMELL OPPORTUNISTIC VALUE FUND
Notes to Financial Statements (Unaudited) As of February 29, 2020
(Continued)
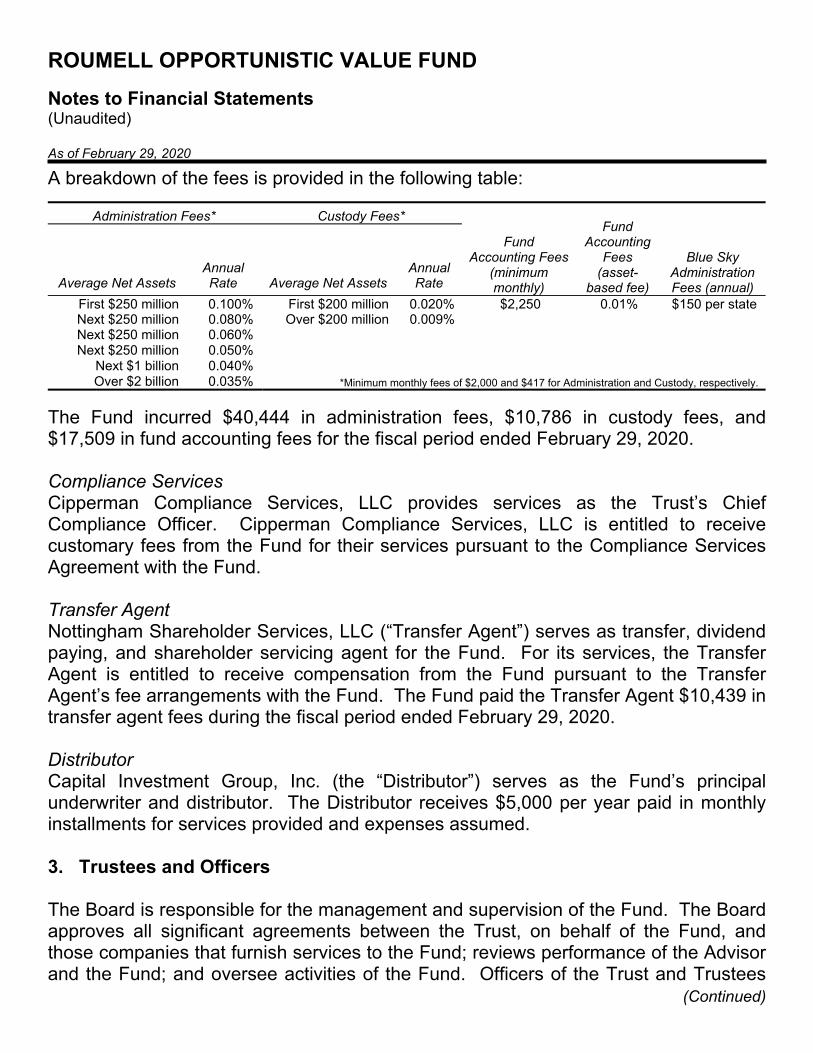
A breakdown of the fees is provided in the following table:
The Fund incurred $40,444 in administration fees, $10,786 in custody fees, and $17,509 in fund accounting fees for the fiscal period ended February 29, 2020. Compliance Services Cipperman Compliance Services, LLC provides services as the Trust’s Chief Compliance Officer. Cipperman Compliance Services, LLC is entitled to receive customary fees from the Fund for their services pursuant to the Compliance Services Agreement with the Fund. Transfer Agent Nottingham Shareholder Services, LLC (“Transfer Agent”) serves as transfer, dividend paying, and shareholder servicing agent for the Fund. For its services, the Transfer Agent is entitled to receive compensation from the Fund pursuant to the Transfer Agent’s fee arrangements with the Fund. The Fund paid the Transfer Agent $10,439 in transfer agent fees during the fiscal period ended February 29, 2020. Distributor Capital Investment Group, Inc. (the “Distributor”) serves as the Fund’s principal underwriter and distributor. The Distributor receives $5,000 per year paid in monthly installments for services provided and expenses assumed. 3. Trustees and Officers The Board is responsible for the management and supervision of the Fund. The Board approves all significant agreements between the Trust, on behalf of the Fund, and those companies that furnish services to the Fund; reviews performance of the Advisor and the Fund; and oversee activities of the Fund. Officers of the Trust and Trustees
Administration Fees* Custody Fees*
Fund Accounting Fees
(minimum monthly)
Fund
Accounting Fees
(asset-based fee)
Blue Sky Administration Fees (annual)
Average Net Assets
Annual Rate
Average Net Assets
Annual Rate
First $250 million 0.100% First $200 million 0.020% $2,250 0.01% $150 per stateNext $250 million 0.080% Over $200 million 0.009% Next $250 million 0.060%
Next $250 million 0.050%
*Minimum monthly fees of $2,000 and $417 for Administration and Custody, respectively.
Next $1 billion 0.040% Over $2 billion 0.035%
ROUMELL OPPORTUNISTIC VALUE FUND
Notes to Financial Statements (Unaudited) As of February 29, 2020
(Continued)
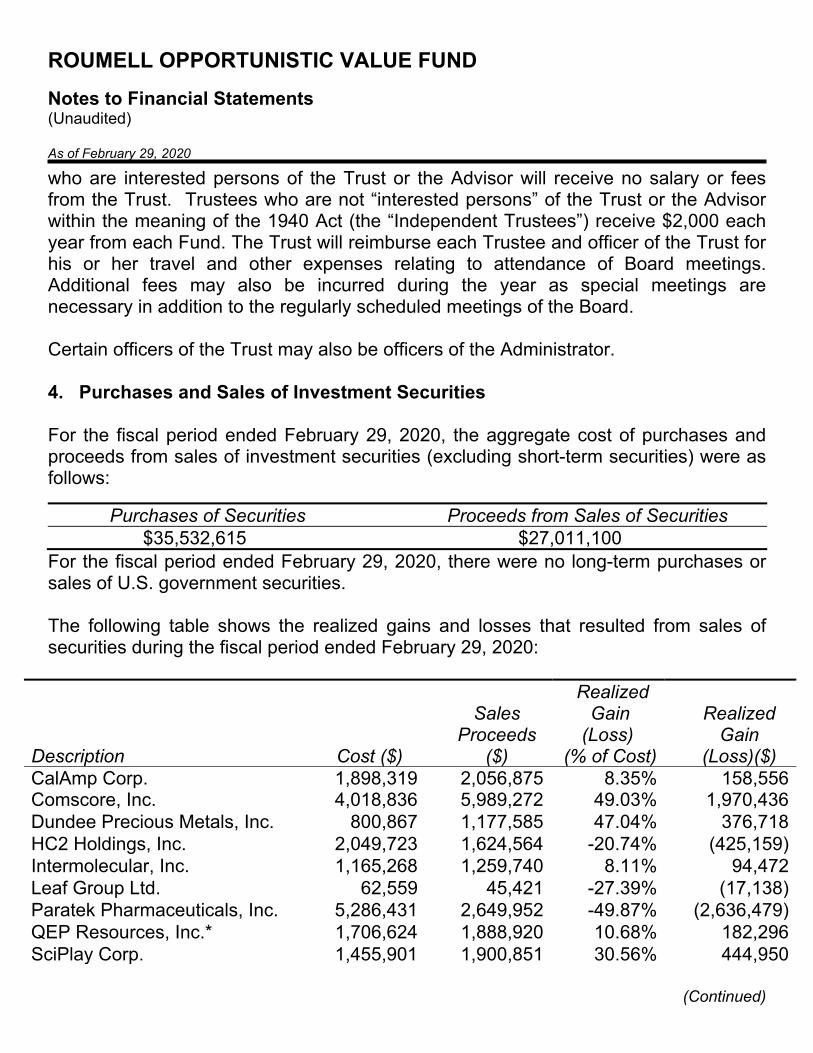
who are interested persons of the Trust or the Advisor will receive no salary or fees from the Trust. Trustees who are not “interested persons” of the Trust or the Advisor within the meaning of the 1940 Act (the “Independent Trustees”) receive $2,000 each year from each Fund. The Trust will reimburse each Trustee and officer of the Trust for his or her travel and other expenses relating to attendance of Board meetings. Additional fees may also be incurred during the year as special meetings are necessary in addition to the regularly scheduled meetings of the Board. Certain officers of the Trust may also be officers of the Administrator. 4. Purchases and Sales of Investment Securities For the fiscal period ended February 29, 2020, the aggregate cost of purchases and proceeds from sales of investment securities (excluding short-term securities) were as follows:
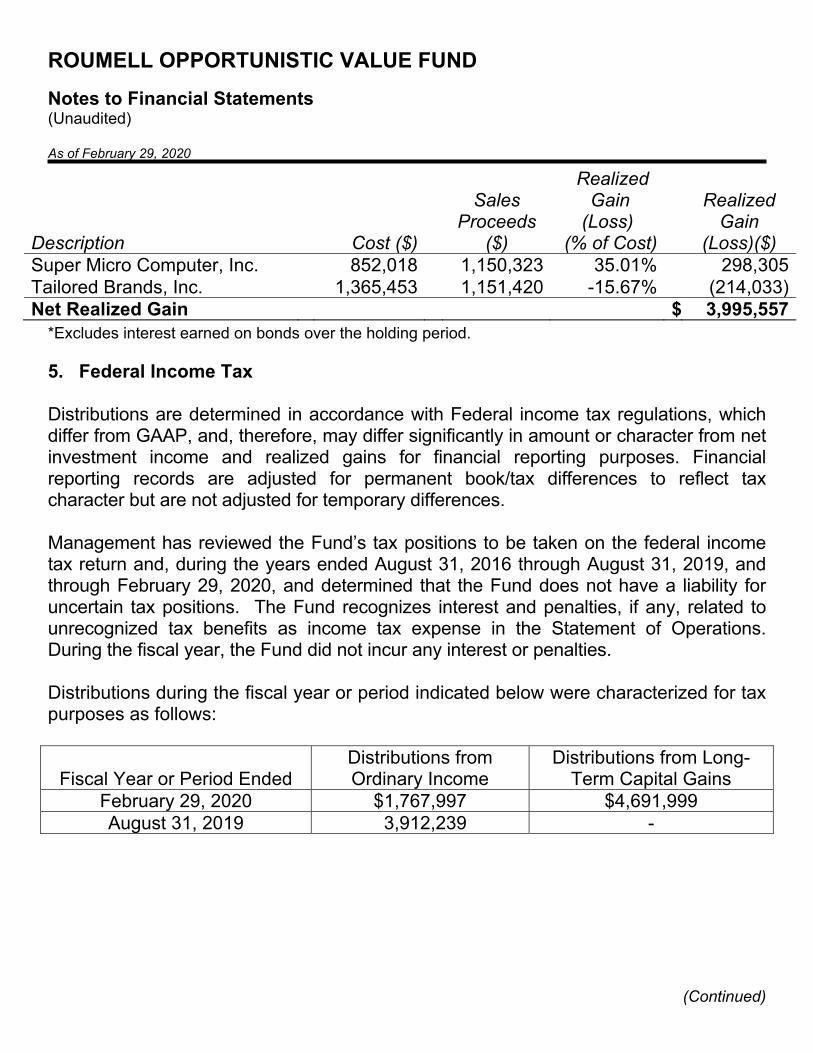
For the fiscal period ended February 29, 2020, there were no long-term purchases or sales of U.S. government securities. The following table shows the realized gains and losses that resulted from sales of securities during the fiscal period ended February 29, 2020:
Description Cost ($)
Sales Proceeds
($)
Realized Gain (Loss)
(% of Cost)
Realized Gain
(Loss)($) CalAmp Corp. 1,898,319 2,056,875 8.35% 158,556Comscore, Inc. 4,018,836 5,989,272 49.03% 1,970,436Dundee Precious Metals, Inc. 800,867 1,177,585 47.04% 376,718HC2 Holdings, Inc. 2,049,723 1,624,564 -20.74% (425,159)Intermolecular, Inc. 1,165,268 1,259,740 8.11% 94,472Leaf Group Ltd. 62,559 45,421 -27.39% (17,138)Paratek Pharmaceuticals, Inc. 5,286,431 2,649,952 -49.87% (2,636,479)QEP Resources, Inc.* 1,706,624 1,888,920 10.68% 182,296SciPlay Corp. 1,455,901 1,900,851 30.56% 444,950
Purchases of Securities Proceeds from Sales of Securities $35,532,615 $27,011,100
ROUMELL OPPORTUNISTIC VALUE FUND
Notes to Financial Statements (Unaudited) As of February 29, 2020
(Continued)
Description Cost ($)
Sales Proceeds
($)
Realized Gain (Loss)
(% of Cost)
Realized Gain
(Loss)($)Super Micro Computer, Inc. 852,018 1,150,323 35.01% 298,305Tailored Brands, Inc. 1,365,453 1,151,420 -15.67% (214,033)Net Realized Gain - $ 3,995,557
*Excludes interest earned on bonds over the holding period. 5. Federal Income Tax Distributions are determined in accordance with Federal income tax regulations, which differ from GAAP, and, therefore, may differ significantly in amount or character from net investment income and realized gains for financial reporting purposes. Financial reporting records are adjusted for permanent book/tax differences to reflect tax character but are not adjusted for temporary differences. Management has reviewed the Fund’s tax positions to be taken on the federal income tax return and, during the years ended August 31, 2016 through August 31, 2019, and through February 29, 2020, and determined that the Fund does not have a liability for uncertain tax positions. The Fund recognizes interest and penalties, if any, related to unrecognized tax benefits as income tax expense in the Statement of Operations. During the fiscal year, the Fund did not incur any interest or penalties. Distributions during the fiscal year or period indicated below were characterized for tax purposes as follows:
Fiscal Year or Period Ended
Distributions from Ordinary Income
Distributions from Long-Term Capital Gains
February 29, 2020 $1,767,997 $4,691,999August 31, 2019 3,912,239 -
ROUMELL OPPORTUNISTIC VALUE FUND
Notes to Financial Statements (Unaudited) As of February 29, 2020
(Continued)
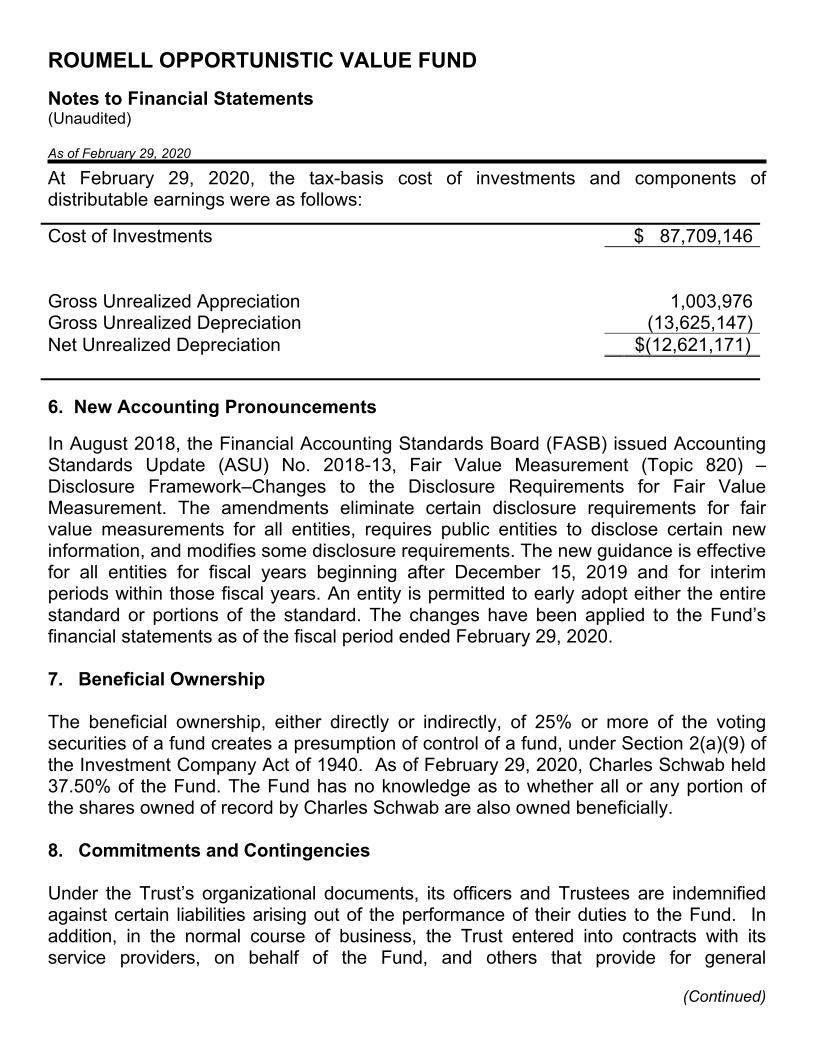
At February 29, 2020, the tax-basis cost of investments and components of distributable earnings were as follows:
6. New Accounting Pronouncements
In August 2018, the Financial Accounting Standards Board (FASB) issued Accounting Standards Update (ASU) No. 2018-13, Fair Value Measurement (Topic 820) – Disclosure Framework–Changes to the Disclosure Requirements for Fair Value Measurement. The amendments eliminate certain disclosure requirements for fair value measurements for all entities, requires public entities to disclose certain new information, and modifies some disclosure requirements. The new guidance is effective for all entities for fiscal years beginning after December 15, 2019 and for interim periods within those fiscal years. An entity is permitted to early adopt either the entire standard or portions of the standard. The changes have been applied to the Fund’s financial statements as of the fiscal period ended February 29, 2020. 7. Beneficial Ownership The beneficial ownership, either directly or indirectly, of 25% or more of the voting securities of a fund creates a presumption of control of a fund, under Section 2(a)(9) of the Investment Company Act of 1940. As of February 29, 2020, Charles Schwab held 37.50% of the Fund. The Fund has no knowledge as to whether all or any portion of the shares owned of record by Charles Schwab are also owned beneficially. 8. Commitments and Contingencies Under the Trust’s organizational documents, its officers and Trustees are indemnified against certain liabilities arising out of the performance of their duties to the Fund. In addition, in the normal course of business, the Trust entered into contracts with its service providers, on behalf of the Fund, and others that provide for general
Cost of Investments $ 87,709,146
Gross Unrealized Appreciation
1,003,976
Gross Unrealized Depreciation (13,625,147)Net Unrealized Depreciation $(12,621,171)

ROUMELL OPPORTUNISTIC VALUE FUND
Notes to Financial Statements (Unaudited) As of February 29, 2020
indemnifications. The Fund’s maximum exposure under these arrangements is unknown, as this would involve future claims that may be made against the Fund. The Fund expects risk of loss to be remote. 9. Subsequent Events
Effective March 31, 2020, Nottingham Compliance Services replaced Cipperman Compliance Services, LLC as the Trust’s Chief Compliance Officer. Management is currently evaluating the recent introduction of the COVID-19 virus and its impact on the financial services industry and has concluded that while it is reasonably possible that the virus could have a negative effect on the fair value of the Company’s investments and results of operations, the specific impact is not readily determinable as of the date of these financial statements. The financial statements do not include any adjustments that might result from the outcome of this uncertainty. In accordance with GAAP, management has evaluated the need for disclosures and/or adjustments resulting from subsequent events through the date of issuance of these financial statements. Management has concluded there are no additional matters, other than those noted above, requiring recognition or disclosure.
ROUMELL OPPORTUNISTIC VALUE FUND Additional Information (Unaudited) As of February 29, 2020
(Continued)
1. Proxy Voting Policies and Voting Record A copy of the Advisor’s Proxy Voting and Disclosure Policy is included as Appendix B to the Fund’s Statement of Additional Information and is available, without charge, upon request, by calling 800-773-3863, and on the website of the Securities and Exchange Commission (“SEC”) at sec.gov. Information regarding how the Fund voted proxies relating to portfolio securities during the most recent 12-month period ended June 30, is available (1) without charge, upon request, by calling the Fund at the number above and (2) on the SEC’s website at sec.gov. 2. Quarterly Portfolio Holdings The Fund files its complete schedule of portfolio holdings with the SEC for the first and third quarters of each fiscal year on Form N-Q. The Fund’s Form N-Qs are available on the SEC’s website at sec.gov. You may also obtain copies without charge, upon request, by calling the Fund at 800-773-3863. 3. Tax Information The following information is provided for the Fund’s fiscal period ended February 29, 2020. During the fiscal period, the Fund paid $1,767,997 in income distributions, $1,872,998 in short-term capital gain distributions, and $4,691,999 in long-term capital gain distributions. Dividend and distributions received by retirement plans such as IRAs, Keogh-type plans, and 403(b) plans need not be reported as taxable income. However, many retirement plans may need this information for their annual information meeting. 4. Schedule of Shareholder Expenses As a shareholder of the Fund, you incur ongoing costs, including management fees and other Fund expenses. This Example is intended to help you understand your ongoing
ROUMELL OPPORTUNISTIC VALUE FUND Additional Information (Unaudited) As of February 29, 2020
(Continued)
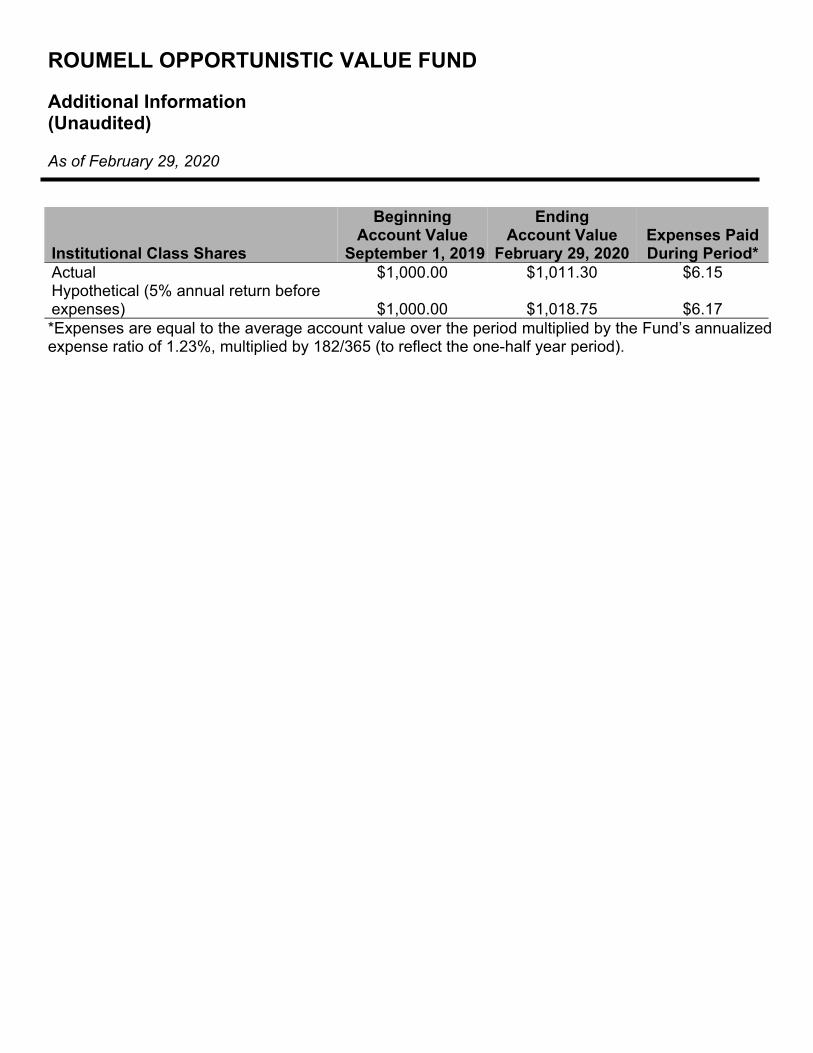
costs (in dollars) of investing in the Fund and to compare these costs with the ongoing costs of investing in other mutual funds. The Example is based on an investment of $1,000 invested at the beginning of the period and held for the entire period from September 1, 2019 through February 29, 2020.
Actual Expenses – The first line of the table below provides information about actual account values and actual expenses. You may use the information in this line, together with the amount you invested, to estimate the expenses that you paid over the period. Simply divide your account value by $1,000 (e.g., an $8,600 account value divided by $1,000 = 8.6), then multiply the result by the number in the first line under the heading entitled “Expenses Paid During Period” to estimate the expenses you paid on your account during this period. Hypothetical Example for Comparison Purposes – The second line of the table below provides information about hypothetical account values and hypothetical expenses based on the Fund’s actual expense ratio and an assumed rate of return of 5% per year before expenses, which is not the Fund’s actual return. The hypothetical account values and expenses may not be used to estimate the actual ending account balance or expenses you paid for the period. You may use this information to compare the ongoing costs of investing in the Fund and other funds. To do so, compare this 5% hypothetical example with the 5% hypothetical examples that appear in the shareholder reports of the other funds. Please note that the expenses shown in the table are meant to highlight your ongoing costs only and do not reflect any transactional costs, such as sales charges (loads), redemption fees, or exchange fees. Therefore, the second line of the table is useful in comparing ongoing costs only and will not help you determine the relative total costs of owning different funds. In addition, if these transactional costs were included, your costs would have been higher.
ROUMELL OPPORTUNISTIC VALUE FUND Additional Information (Unaudited) As of February 29, 2020
*Expenses are equal to the average account value over the period multiplied by the Fund’s annualized expense ratio of 1.23%, multiplied by 182/365 (to reflect the one-half year period).
Institutional Class Shares
Beginning Account Value
September 1, 2019
Ending Account Value
February 29, 2020 Expenses Paid During Period*
Actual Hypothetical (5% annual return before expenses)
$1,000.00 $1,011.30 $6.15
$1,000.00 $1,018.75 $6.17
For Shareholder Service Inquiries:
Documented: Nottingham Shareholder Services 116 South Franklin Street Post Office Drawer 4365 Rocky Mount, North Carolina 27803
Toll-Free Telephone: 1-800-773-3863
World Wide Web @: ncfunds.com
Roumell Asset Management, LLC
Roumell Opportunistic Value Fundis a series of The Starboard Investment Trust
For Investment Advisor Inquiries:
Documented:Roumell Opportunistic Value Fund2 Wisconsin Circle, Suite 640Chevy Chase, Maryland 20815
Toll-Free Telephone:1-800-773-3863
World Wide Web @:roumellfund.com