Embed Size (px)
Citation preview
Roots of Gender Equality:
the Persistent Effect of Beguinages on Attitudes Toward Women
Annalisa Frigo1 and Eric Roca Fernandez∗2
1IRES/LIDAM, UCLouvain
2Aix-Marseille Univ., CNRS, EHESS, Centrale Marseille, AMSE, Marseille, France
Abstract
This paper is concerned with the historical roots of gender equality. It proposes and
empirically assesses a new determinant of gender equality: gender-specific outside options
in the marriage market. In particular, enlarging women’s options besides marriage —even
if only temporarily— increases their bargaining power with respect to men, leading to a
persistent improvement in gender equality. We illustrate this mechanism focusing on Belgium,
and relate gender-equality levels in the 19th century to the presence of medieval, female-only
communities called beguinages that allowed women to remain single amidst a society that
traditionally advocated marriage. Combining geo-referenced data on beguinal communities
with 19th-century census data, we document that the presence of beguinages contributed to
decrease the gender gap in literacy. The reduction is sizeable, amounting to a 12.3% drop in
gender educational inequality. Further evidence of the beguinal legacy is provided leveraging
alternative indicators of female agency.
Keywords: Economic Persistence, Culture, Institutions, Religion, Gender Gap.
JEL: I25, J16, N33, O15, O43, Z12.
∗We thank David de la Croix, Matteo Cervellati, Oded Galor, Marc Goni, Fabio Mariani, Felipe ValenciaCaicedo, and all the participants to seminars at Brown University, Universite catholique de Louvain, Universitedu Luxembourg, the Indian Statistical Institute Delhi, Syddansk Universitet and Universita Commerciale LuigiBocconi for precious comments and suggestions. Annalisa Frigo acknowledges the financial support from theBelgian French-speaking Community (convention ARC no15/19-063 on “Family Transformations: Incentives andNorms”). This work was also supported by French National Research Agency Grant ANR-17-EURE-0020.
1
1 Introduction
The role of women in the society is heavily influenced by cultural norms, which prescribe whether
they should work, earn income and, in general, enjoy the same rights as men’s. Moreover,
attitudes toward women seem to be very persistent (Fernandez and Fogli (2009)) and their
origins have been traced back to cultural shocks and gender-specific physiologic endowments
—see, among others, Becker and Woessmann (2008), Grosjean and Khattar (2017), and Alesina
et al. (2013).
This paper proposes and tests a novel determinant of gender equality based on economic
motives: women’s bargaining power in the marriage market. Bargaining power increases with
the value of outside options, thus access to better opportunities should relate to an increase in
gender equality as women’s negotiating capacity improves. However, this simple argument has
not been empirically addressed, probably due to lack of exogenous variation in outside options.
This study fills this void and illustrates the relevance of such mechanism by focusing on
the Belgian context, where the historical presence of medieval, female-only, semi-religious
communities called beguinages allowed women to remain single and independent of men in stark
contrast to the customs of the time. Beguines enjoyed financial freedom: contrary to traditional
monastic orders, retaining and accumulating wealth was permitted and they provided for their
communal life with paid occupations, personal funds or both. Combining information on the
geographic location of beguinages with Belgian census data, we show that municipalities where
beguine communities thrived reached higher levels of gender equality as measured in the mid-19th
century. In particular, we find a 12.3% reduction in the gender literacy gap, our preferred
measure of gender equality. Alternative demographic indicators also point to increased gender
equality. We consider the possibility that beguinal location decisions reflected pre-existing local
attitudes relying on a series of robustness tests. Furthermore, we provide evidence about the
relevance of the mechanism, especially compared to competing explanations.
The two-step mechanism we postulate combines female empowerment through girls’ bargain-
ing power —facilitated by the presence of beguinages— with the intergenerational transmission
of a gender-egalitarian culture. Initially, the sheer existence of beguinages provides an additional
option to girls: besides marriage or monastic life, they were given the possibility of remaining
single. The availability of a viable outside option to marriage improves the bargaining power of
women, which in turn brings about a progressive reduction of the gender gap. The improved
2
status of women favours the emergence of more gender-egalitarian norms, which are then per-
petuated across generations through a cultural transmission mechanism a la Bisin and Verdier
(2001). In that sense, children in towns where beguines located were firstly exposed to beguines
themselves, and secondly to peers who were becoming more favourable towards gender-equal
norms.
This study supports the idea that gender roles and gender equality are strikingly persistent
and determine present-day attitudes towards women.1 However, our explanation departs
from those advanced in the existing literature, which typically ascribe the origins of gender
roles to gender-based specialisation predating industrialisation. For instance, Alesina et al.
(2013) maintain that gender-specific endowments facilitated economic specialisation, prompting
gender roles. The comparative advantage of men in manoeuvring the plough explains why the
descendants of plough-agriculturalists are today less gender-egalitarian. Similarly, Hansen et al.
(2015) show that nowadays women work less in societies that transitioned earlier to agriculture.
Their proposed channel operates through differential fertility across modes of living, diverting
agriculturalist women’s time from market work to childcare. Galor and Weil (1996) propose
a theoretical framework encompassing the previous findings. It emphasises the importance of
differential physical endowments —in terms of strength— and their complementarity to physical
capital. The endowment imbalance between genders generates economic specialisation as long
as physical capital is absent, leading to a sharp division of roles: men work and women raise
children.
Besides physiological determinants, scholars have shown that certain cultural and economic
aspects are associated with a gender bias. Alesina and Giuliano (2010) relate strong family
ties to gender inequality, although probably both variables co-evolved.2 Grosjean and Khattar
(2017) stress that historical scarcity of women improved their position in Australia during the
17th and 18th century. Today, these traditional roles persist.3 Similarly, Abramitzky et al.
(2011) find that when men are underrepresented in the marriage market, they are able to find
better spouses and marriages are less likely to dissolve. Fernandez and Fogli (2009) analyse
1In general, cultural beliefs are deeply rooted and tend to evolve slowly. Several studies document persistencefor a wide range of characteristics, including antisemitism and trust. See, for instance, Voigtlander and Voth(2012), Becker et al. (2016) or Lowes et al. (2017). Giuliano and Nunn (2020) analyse under which conditionsculture persists or changes.
2Bertocchi and Bozzano (2015) and Bertocchi and Bozzano (2019) validate this result using historical Italiandata. Tur-Prats (2018) associates the stem family type to domestic, intimate-partner violence in Spain.
3Their argument builds on the relative shortage of women, while this is irrelevant in our setting. However, weboth emphasise the importance of the marriage market.
3
the behaviour of second-generation migrants in the US: female labour force participation in the
parents’ country of origin explains the behaviour of their daughters. Finally, Giuliano (2018)
provides an extensive literature review on the historical origins of gender roles.
By focusing on semi-monastic communities, this paper is also linked to the strand of the
literature analysing the legacy of religious institutions on economic performance. For instance,
Valencia Caicedo (2018) assesses the positive effects of historical Jesuit Missions in Latin America
on modern-day human capital and technological progress. Waldinger (2017) relates the presence
of Catholic missions in Mexico to increased literacy and educational attainment. Similar results
extend to Protestant missionaries in Africa, as in Cage and Rueda (2016). Andersen et al. (2017)
associate the presence of the industrious Cistercian Order in England with faster productivity
growth long after monasteries were disbanded. Finally, Akcomak et al. (2016) study how a
Catholic sect that valued literacy to understand the Gospel —the Brethren of the Common
Life— affected Dutch male literacy rates.
Our study is also related to the literature focusing on intra-couple bargaining. Female
education reinforces their status and aligns family preferences to women’s, as described by
Iyigun and Walsh (2007) and Doepke and Tertilt (2009). Giuliano (2018) argues that matrilineal
societies favour gender equality by providing a safety net for women, raising women’s bargaining
power. Jayachandran (2015) and Gottlieb and Robinson (2016) shed further light on this
hypothesis. We bridge the gap between these two strands of the literature, suggesting that even
a temporary improvement in women’s choice set can have long-lasting effects on gender equality.
To the best of our knowledge, this paper is the first to systematically explore the relationship
between pre-industrial, female-only urban associations and gender equality in the long run. Our
contribution singles out the importance of female associations in improving gender equality,
well beyond the life-cycle of the original institutions. Moreover, we propose a novel mechanism
based on women’s bargaining power, never explored in this literature, to illustrate the enduring
association between female communities and gender equality.
The rest of the paper is organised as follows: Section 2 introduces the historical background
of the beguinal movement. Sections 3 and 4 describe the different data sources and the empirical
strategy. The latter is supplemented with robustness tests, including an IV approach. Section 5
discusses the validity of our mechanism and Section 6 concludes.
4
2 Historical Background
The beguinal movement started in the late 12th century in the Northern Sea region,4 fully
flourishing in the next two centuries, and has left several beguinages across the Low Countries,
France and Germany.5 It consisted of self-supporting, female-only, semi-religious communities
that offered single women of all social strata the opportunity to conduct an independent life as
singles in a society that traditionally disapproved that option.6
Records of pre-beguine communities first appeared around the city of Huy circa 1181. Several
analogous groups arose nearby in subsequent years, dotting the region comprising Aachen,
Nivelles and Vilvoorde. Simultaneously, two beguinages flourished in Cambrai and Valenciennes
—in present-day France—, see Simons (2010, Appendix I). Bowie’s (1990, p. 14) chronology is
similar and also points to the same Belgian region as the cradle of the beguine movement.7 From
its early configuration as groups of itinerant, devote women, the movement settled in definitive
spaces within towns.
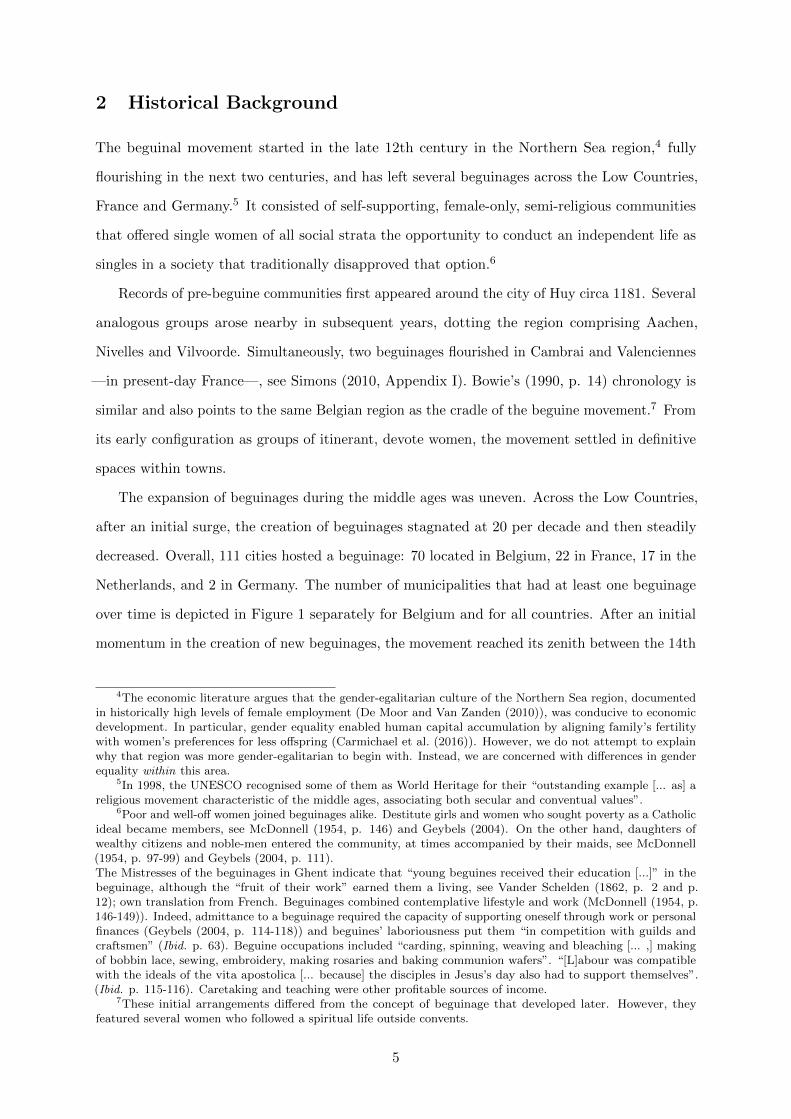
The expansion of beguinages during the middle ages was uneven. Across the Low Countries,
after an initial surge, the creation of beguinages stagnated at 20 per decade and then steadily
decreased. Overall, 111 cities hosted a beguinage: 70 located in Belgium, 22 in France, 17 in the
Netherlands, and 2 in Germany. The number of municipalities that had at least one beguinage
over time is depicted in Figure 1 separately for Belgium and for all countries. After an initial
momentum in the creation of new beguinages, the movement reached its zenith between the 14th
4The economic literature argues that the gender-egalitarian culture of the Northern Sea region, documentedin historically high levels of female employment (De Moor and Van Zanden (2010)), was conducive to economicdevelopment. In particular, gender equality enabled human capital accumulation by aligning family’s fertilitywith women’s preferences for less offspring (Carmichael et al. (2016)). However, we do not attempt to explainwhy that region was more gender-egalitarian to begin with. Instead, we are concerned with differences in genderequality within this area.
5In 1998, the UNESCO recognised some of them as World Heritage for their “outstanding example [... as] areligious movement characteristic of the middle ages, associating both secular and conventual values”.
6Poor and well-off women joined beguinages alike. Destitute girls and women who sought poverty as a Catholicideal became members, see McDonnell (1954, p. 146) and Geybels (2004). On the other hand, daughters ofwealthy citizens and noble-men entered the community, at times accompanied by their maids, see McDonnell(1954, p. 97-99) and Geybels (2004, p. 111).The Mistresses of the beguinages in Ghent indicate that “young beguines received their education [...]” in thebeguinage, although the “fruit of their work” earned them a living, see Vander Schelden (1862, p. 2 and p.12); own translation from French. Beguinages combined contemplative lifestyle and work (McDonnell (1954, p.146-149)). Indeed, admittance to a beguinage required the capacity of supporting oneself through work or personalfinances (Geybels (2004, p. 114-118)) and beguines’ laboriousness put them “in competition with guilds andcraftsmen” (Ibid. p. 63). Beguine occupations included “carding, spinning, weaving and bleaching [... ,] makingof bobbin lace, sewing, embroidery, making rosaries and baking communion wafers”. “[L]abour was compatiblewith the ideals of the vita apostolica [... because] the disciples in Jesus’s day also had to support themselves”.(Ibid. p. 115-116). Caretaking and teaching were other profitable sources of income.
7These initial arrangements differed from the concept of beguinage that developed later. However, theyfeatured several women who followed a spiritual life outside convents.
5

and the 16th centuries, when the number of beguinages stabilised. Afterwards, their popularity
declined.
Figure 1: Number of cities with at least one beguinage.
1300 1400 1500 1600 1700 1800Year
20
40
60
80
Cities with beguinage
All countries
Only Belgium
Note: Data on beguinage foundations per decade from Simons (2010), Table 1. Own elaboration.
Beguinages differed greatly in terms of the population they hosted. Estimates are scarce
but attest to the popularity of the movement.8 For instance, Mechelen’s beguinage hosted up
to 1900 beguines in 1500 while that of Nivelles counted 51 beguines in 1284, shortly after its
creation. However, historians document a decreasing trend between 1300 and 1900. By the
mid-19th century those beguinages still operating counted less than 10 inhabitants.9
Although beguinages were preferentially established in relatively larger towns, communities
also settled in hamlets or small boroughs counting less than 200 houses in 1437. This was the
case of Bousval, Maleves-Sainte-Marie-Wastinnes, Thorembais-les-Beguines and Grez-Doiceau.
At that time, the average town had 187 dwellings,10 and the larger —Brussels, Leuven, and
Antwerp— counted 6376, 3579, and 3440 houses.
The beguine movement stands out from other religious communities especially because
beguines never constituted an orthodox monastic order.11 Albeit religiosity and pious life
guided the beguinages’ foundation and daily routine,12 these communities radically differed from
monastic convents. First, beguines did not take poverty vows, allowing them to retain property
8See Simons (2010, Table 3, p. 56-59; Appendix II), McDonnell (1954, p. 64) and Geybels (2004, pp. 69, 136,143, 145 and 147).
9Some pious men, known as beghards, emulated the lifestyle of beguines but never reached their reputationand size. Beghards were sorts of small guilds, as they were essentially craftsmen in the textile industry.
10The data on municipal size during 1437 is from Cuvelier (1912) and is restricted to the historical Brabantprovince. It comprises 439 towns, of which 22 had a beguinage.
11To Denisart, “beguines are pious women whose status is [...] between religious and secular”; own translationfrom French, see Vander Schelden (1862, Document V, p. XXV-XXVI).
12McDonnell (1954, p. 5) and Bethune (1883, p. 90).
6
and accumulate wealth. Second, they could leave the beguinage at will to marry or to reintegrate
the secular society. Family ties were generally maintained.13
Third, these communities were actively involved and well integrated into the everyday social
life of medieval cities. As thoroughly depicted by Simons (2010), beguinages attracted women
from rural areas who could find work there in a safe and supportive environment. Alongside
prosperous beguines lived others of more modest background who supported themselves as
teachers, maids, nurses, textile workers, or small business owners. In fact, while beguines
promised to lead a humble life, this did not prevent them from having occupations outside
the beguinal walls.14 Beguines served in hospitals and leper houses, and nursing individuals in
private homes, both for charitable reasons and in order to earn a small income. Some beguines
were farmers in nearby fields, herded animals or grew vegetables for the local market. The
bulk of the evidence, however, suggests that most beguine workers were labourers in the textile
industry and earned their living from commerce: for instance, a few traded cloth locally and
interregionally in Bruges, Ghent, and Arras, while in Tournai will records provide documentary
evidence of a draper employing forty fellow beguines. In fact, acceptance to a beguinage was
conditional on possession of personal wealth or willingness to work.
The movement further distinguished from Catholic orders because beguines lacked common
rules and a central coordinating authority.15 Despite their non-adherence to traditional monastic
standards and although communities were independent of any male authority, beguines were
tolerated and even granted spaces by the secular society.16 In general, the Holy See and
local bishops supported the beguine movement.17 However, the Council of Vienna (1311-12)
demonised beguines and the persecution of heretic movements harassed them particularly in
13Warnkonig (1836, p. 350) defines them as “women [...] who wear a particular monastic clothing, livetogether in a space not forbidden to outsiders [...], to lead a chaste and pious life under a superior and followingtheir own statutes. They are not obliged by vows to renounce the world forever”; own translation from French.Vander Schelden (1862, Document V, p. XXV-XXVI) confirms this characterisation adding that “beguines neednot give up family relationships or friendships [...]”. Bishop Malderus of Antwerp similarly characterises beguines,especially noting the lack of vows, see McDonnell (1954, p. 121-122). Mommaers and Dutton (2004, p. 20) portraya similar arrangement.
14McDonnell (1954, p. 131) provides an analogous characterisation based on Bethune (1883, p. 74): “[t]hebeguinage was a retreat, especially well adapted to an urban society, where women living in common could pursuechastity without a vow and earn a livelihood by suitable work”. See also Bowie (1990, p. 25).
15According to Geybels (2004, p. 59), the beguine movement was “poorly organised [...] with each communitypossessing its own statutes”. It always lacked common rules (McDonnell (1954, p. 134)) and ecclesiasticalopposition was partly founded on this, see Fredericq (1889, p. 168-169, par. 172).
16French and Belgian beguines enjoyed powerful patronage and were granted privileges, including land donations,see Vander Schelden (1862) and McDonnell (1954, p. 6, Ch. X and Ch. XI). Clerical tolerance is also emphasized,and beguines’ lifestyle was praised and recommended by prelates and the Roman Curia.
17Simons (2010, p. 124-125) indicates that clergymen accepted beguines as “a sign of diversity” within theChurch, and others simply saw beguines as women who “contributed to purify the faith”. However, some initialopposition is recorded because they preached and “interpreted the mysteries of Scripture”. See also footnote 16.
7

the Rhineland region, despite the fact that the beguine movement was never considered as
such.18 Accusations did not last long though, and Pope Clement VI completely exonerated the
movement from previous charges in 1328. Beguines were also threatened by the Calvinist and
iconoclast movement. For instance, during 1567, the beguinage of Hasselt was destroyed by
Calvinist partisans. Also, the magistrates of Mechelen burnt down the beguinage of the city
—together with other buildings outside the walls— to prevent the Calvinists from using it. In
any case, the effects were temporary as beguines rebuilt their beguinages soon after: despite a
strong initial support, the Reformed cult was banished from Belgium in 1585.19
Beguines’ peculiar freedom of choice and self-determination rapidly propagated and, as
soon as 1260, a literary work portrayed the beguines among other religious orders.20 Indeed,
beguinages were the forerunners of women’s associations, guaranteeing the necessary social and
financial protection for single women who joined the community, in a society where staying
single was stigmatised.21 Because of their independence from male authority, Bowie (1990, p.
13) considered the beguines “the first European women’s movement”.
Finally, De Moor (2014) reviews and dismisses the traditional explanations for the rise and
success of the beguine movement. More in detail, the view that beguines sheltered urban girls
unable to marry because of skewed urban sex rations is dubious since most beguines did come
from the countryside. Similarly, beguinages were not a substitute for monasteries, as each
community located geographically separated and attracted different women. The author evinces
that —besides devotional reasons— beguines were often motivated by personal or professional
motives. In that sense, joining a beguinage was a deliberate choice to stay single and do
remunerated work, independently of a male breadwinner.
18See Fredericq (1889, p. 168-169, par. 172) and Geybels (2004, p. 56-65).19In fact, the Reformation was swiftly and decisively suppressed in present-day Belgium by the Spanish kings,
who fiercely opposed it. Besides summary executions at main squares, including the beheading of importantnoblemen, Reformers were forced to chose between conversion or exile: Luu (2005) reports that between 100.000and 150.000 Belgian Calvinists fled for the Netherlands, Germany and the United Kingdom.
20The poem “Ci encoumence li diz des Beguines” written by the Parisian trouvere Rutebeuf around 1260caricatures beguines “If a beguine marries, that is her vocation, because her vows or profession are not for life.Last year she wept, now she prays, next year she’ll take a husband. Now she is Martha, then she is Mary; nowshe is chaste, then she gets a husband.”. The author of this piece and other foreign visitors in the southern LowCountries expressed surprise over the public behaviour of women: they were usually shocked by women’s relativefreedom of movement and action.
21The cartulary of the beguinage in Ghent supports this perspective, see Geybels (2004, p. 47).
8
3 Data
We combine several data sets to establish an empirical relationship between medieval beguine
communities and female agency while accounting for a rich set of potential confounders.
Historical Presence of Beguines. Beguinage location, foundation and dissolution dates
are reported by Simons (2010). The author combines a wide variety of sources to overcome
the lack of historical records and the fact that beguinages were rarely established through a
formal act of foundation. He documents 143 sites that can be positively defined as beguinages,
with few records grouping multiple small beguinages in the same town. Using this information,
we compile a new data set that features the exact location of each beguinage and relate it to
Belgian municipalities existing in 1866. We restrict our attention to beguinages located within
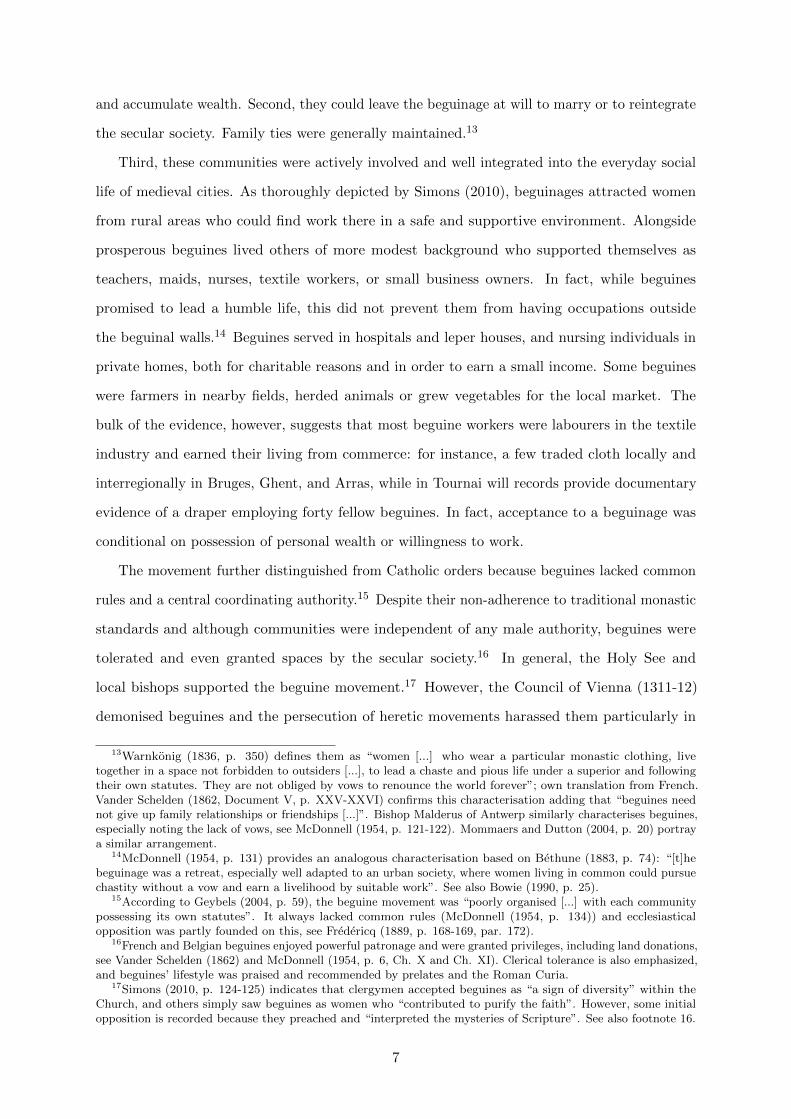
the borders of modern Belgium, where 70 municipalities hosted at least a community. Figure 2
depicts their location.22
Ideally, one would like to have information on the number of beguines living in each
municipality, but such data is scarce and only available for selected beguinages. We circumvent
this limitation by creating two proxy variables that convey the intensive and extensive margin
of such presence. The first one is a binary indicator that takes value one when a municipality
had, at any point in time and for any duration, at least one beguinage:
Beguinagei(j) =
0 if municipalityi(j) never had a beguinage,
1 if municipalityi(j) had at least one beguinage.
(1)
The second measure consists of a continuous variable that accounts for different durations (t)
of beguinages (k) in municipalities (i). Since it is possible that a municipality hosted more
than one beguinage, we aggregate the impact of different beguine communities coexisting or
succeeding in the same town in the variable exposure:
Exposurei(j) =∑k∈i
ti(j),k. (2)
Census Data. Following Bertocchi and Bozzano (2015), we use census data to assess gender
equality comparing female-to-male literacy rates.23 This source offers widespread coverage and
consistent measurement across regions, with a final sample comprising 2447 municipalities with
complete information. Data to proxy gender equality with literacy ratios are only available
22Lacking precise maps for municipal boundaries during 1866, this map represents beguinages overlayed onpresent-day municipal boundaries. Gender-equality indicators have been computed by aggregating data from 1866to the present, using weighted averages.
23In our context, a literate individual is someone able to read and write.
9
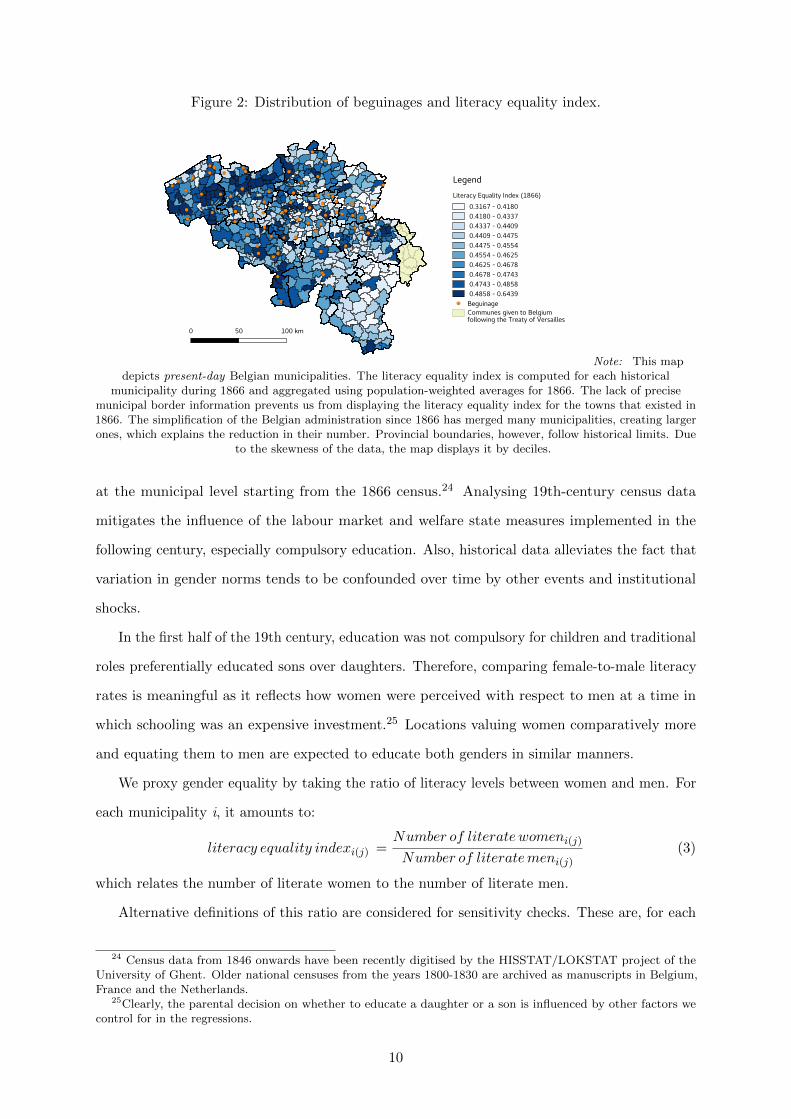
Figure 2: Distribution of beguinages and literacy equality index.
Literacy Equality Index (1866) 0.3167 - 0.4180 0.4180 - 0.4337 0.4337 - 0.4409 0.4409 - 0.4475 0.4475 - 0.4554 0.4554 - 0.4625 0.4625 - 0.4678 0.4678 - 0.4743 0.4743 - 0.4858 0.4858 - 0.6439 BeguinageCommunes given to Belgium following the Treaty of Versailles
Legend
0 50 100 km
Note: This mapdepicts present-day Belgian municipalities. The literacy equality index is computed for each historical
municipality during 1866 and aggregated using population-weighted averages for 1866. The lack of precisemunicipal border information prevents us from displaying the literacy equality index for the towns that existed in1866. The simplification of the Belgian administration since 1866 has merged many municipalities, creating largerones, which explains the reduction in their number. Provincial boundaries, however, follow historical limits. Due
to the skewness of the data, the map displays it by deciles.
at the municipal level starting from the 1866 census.24 Analysing 19th-century census data
mitigates the influence of the labour market and welfare state measures implemented in the
following century, especially compulsory education. Also, historical data alleviates the fact that
variation in gender norms tends to be confounded over time by other events and institutional
shocks.
In the first half of the 19th century, education was not compulsory for children and traditional
roles preferentially educated sons over daughters. Therefore, comparing female-to-male literacy
rates is meaningful as it reflects how women were perceived with respect to men at a time in
which schooling was an expensive investment.25 Locations valuing women comparatively more
and equating them to men are expected to educate both genders in similar manners.
We proxy gender equality by taking the ratio of literacy levels between women and men. For
each municipality i, it amounts to:
literacy equality indexi(j) =Number of literatewomeni(j)
Number of literatemeni(j)(3)
which relates the number of literate women to the number of literate men.
Alternative definitions of this ratio are considered for sensitivity checks. These are, for each
24 Census data from 1846 onwards have been recently digitised by the HISSTAT/LOKSTAT project of theUniversity of Ghent. Older national censuses from the years 1800-1830 are archived as manuscripts in Belgium,France and the Netherlands.
25Clearly, the parental decision on whether to educate a daughter or a son is influenced by other factors wecontrol for in the regressions.
10
municipality i :
female literacy sharei(j) =Number of literatewomeni(j)
Number of literatewomeni(j) +Number of literatemeni(j), (4)
recording the share of literate women within the literate population, and
female literacy indexi(j) =Share of literatewomeni(j)
Share of literatemeni(j)(5)
comparing female and male literacy rates. Higher values of any index correspond to more
favourable attitudes towards women. Notice that the inclusion of men in the denominator is
meaningful since plain literacy rates may vary across regions for diverse reasons. Its inclusion
smooths out part of these underlying, idiosyncratic characteristics.
The census includes other demographic variables. However, we only use total population
because gender-specific characteristics may be an outcome of the presence of beguinages.
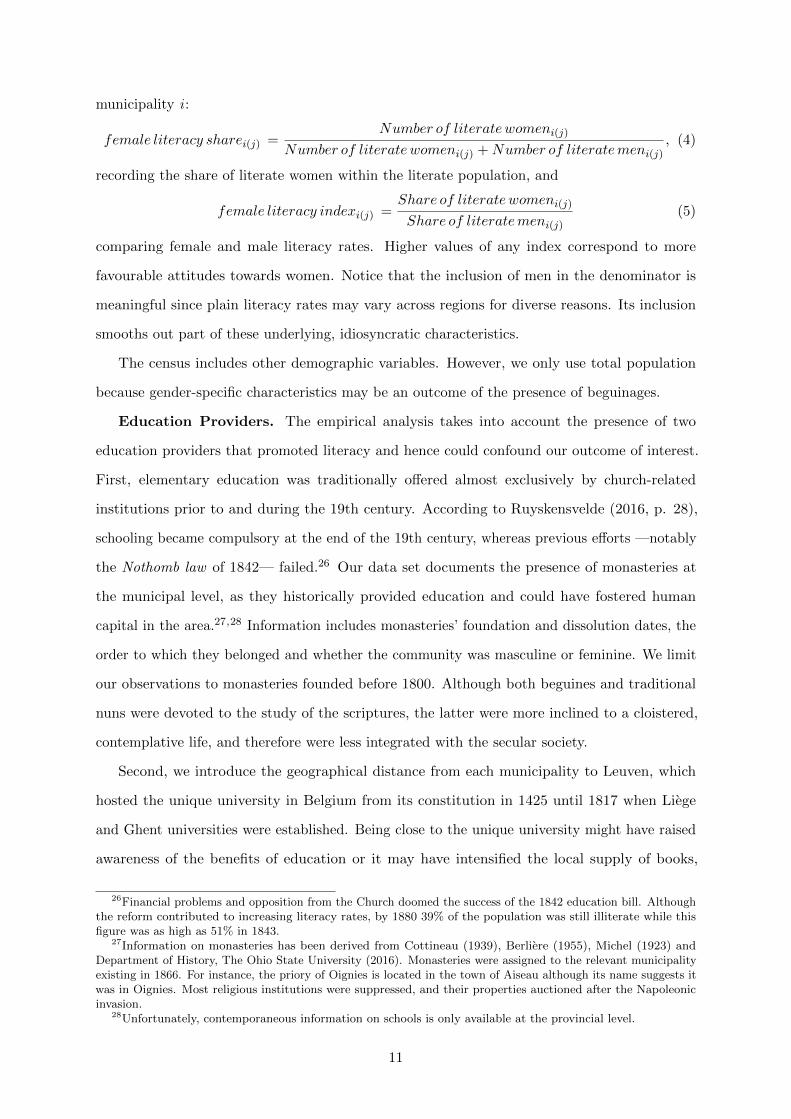
Education Providers. The empirical analysis takes into account the presence of two
education providers that promoted literacy and hence could confound our outcome of interest.
First, elementary education was traditionally offered almost exclusively by church-related
institutions prior to and during the 19th century. According to Ruyskensvelde (2016, p. 28),
schooling became compulsory at the end of the 19th century, whereas previous efforts —notably
the Nothomb law of 1842— failed.26 Our data set documents the presence of monasteries at
the municipal level, as they historically provided education and could have fostered human
capital in the area.27,28 Information includes monasteries’ foundation and dissolution dates, the
order to which they belonged and whether the community was masculine or feminine. We limit
our observations to monasteries founded before 1800. Although both beguines and traditional
nuns were devoted to the study of the scriptures, the latter were more inclined to a cloistered,
contemplative life, and therefore were less integrated with the secular society.
Second, we introduce the geographical distance from each municipality to Leuven, which
hosted the unique university in Belgium from its constitution in 1425 until 1817 when Liege
and Ghent universities were established. Being close to the unique university might have raised
awareness of the benefits of education or it may have intensified the local supply of books,
26Financial problems and opposition from the Church doomed the success of the 1842 education bill. Althoughthe reform contributed to increasing literacy rates, by 1880 39% of the population was still illiterate while thisfigure was as high as 51% in 1843.
27Information on monasteries has been derived from Cottineau (1939), Berliere (1955), Michel (1923) andDepartment of History, The Ohio State University (2016). Monasteries were assigned to the relevant municipalityexisting in 1866. For instance, the priory of Oignies is located in the town of Aiseau although its name suggests itwas in Oignies. Most religious institutions were suppressed, and their properties auctioned after the Napoleonicinvasion.
28Unfortunately, contemporaneous information on schools is only available at the provincial level.
11

teachers and professors.29 Moreover, a higher density of well-educated men is to be expected in
Leuven and its vicinity.
Other Controls. We incorporate additional variables obtained using GIS solutions: latitude,
longitude, distance to the sea, to the closest river30 and to the closest city defined with respect
to the year 1300.31 Proximity to waterways and urban areas are industrialisation predictors, and
we argue that the presence of close-by factories may affect the incentives on whether to educate
children.
During the 19th century, agriculture was an important activity, and we introduce measures
to capture its extents. In particular, we include agricultural caloric yields, soil types and crop-
specific yield for staple crops: barley, buckwheat, rye, wheat, and white potatoes. The economic
literature indicates that historical agricultural productivity, measured by its caloric yield, has
shaped gender roles through economic specialisation. On the other hand, contemporaneous yield
levels affect the marginal productivity of labour, and hence the returns to education. For these
reasons, the variable takes on different values before and after 1550 (Galor and Ozak (2016)).
Carranza (2014) documents that soil types determine female employment in agriculture, and
a long tradition of female participation in agriculture can generate persistence. Following her
intuition, we compute the share of clayey, silty or sandy soil in a 10 km-radius area around each
municipality. Similarly, crop-specific yield measures from FAO’s Global Agro-Ecological Zones
(GAEZ) account for the possibility that women had a comparative advantage in given crops.32
Finally, we control for ruler fixed-effects. Although the elite was in general sympathetic
with beguinages, the degree can vary between rulers. Also, rulers were instrumental at granting
municipal charters, a variable we employ as instrument in Section 4.1. In particular, we include
fixed effects for the Duchies of Brabant —with separate enclaves for Anvers and Malines—,
Luxembourg, Limbourg and Bar; the Counties of Flanders, Hainaut, Namur and Rethel; the
Prince-Bishopric of Liege; and the region of Bouillon, using its extents around 1400 and 1700.
Table 1 provides the summary statistics for the main variables.33
29The presence of this university should not directly encourage women to pursue higher education becausethey were not admitted until 1880, first at Universite Libre de Bruxelles. Therefore, we expect distance to Leuvento have a negative impact on our measures of compared literacy, if any.
30We use shape-files from European Environment Agency (2017) tracing all major European rivers.31The list of Belgian cities during 1300 follows Bairoch (1988).32Crop yield data is provided by FAO/IIASA (2011). These measure production capacity for several crops
based on geographic and climatic characteristics. In our setting, we consider low-input and rain-fed cultivation,mimicking medieval characteristics; and intermediate level of inputs and the use of irrigation to better account for19th-century agricultural techniques.
33 This Table presents distances in kilometres to ease the interpretation. However, all regressions includedistances expressed in log-km.
12

Table 1: Summary statistics.
Mean Std.Dev. Min. Max.
Beguinage presenceBeguinage (0/1) 0.027 0.163 0 1Exposure (centuries) 0.142 1.097 0.000 22.440Between 1200-1300 0.020 0.140 0.000 1.000Between 1300-1400 0.005 0.074 0.000 1.000Between 1400-1500 0.002 0.044 0.000 1.000
OutcomesLit. equality index, 1866 0.822 0.137 0.236 1.808Female lit. share, 1866 0.448 0.042 0.191 0.644Female lit. index, 1866 0.856 0.122 0.256 1.601
ControlsTotal population, 1866 1892.526 5528.608 18.000 157905.000Fem. monas. 0.031 0.189 0.000 2.000Masc. monas. 0.026 0.175 0.000 3.000Other monas. 0.015 0.121 0.000 1.000Distance river (km) 9.088 8.757 0.002 52.396Distance Leuven (km) 68.590 32.919 0.377 165.809Min. distance beguinage (km) 16.270 18.170 0.000 122.010Distance big city (km) 100.187 53.487 0.000 234.532Potential caloric yield before 1550 2142.045 72.738 1908.810 2305.816Potential caloric yield after 1550 8894.448 310.618 8292.416 9780.832Potatoes, yield; pre-1550 3595.131 228.146 2726.000 3933.000Potatoes yield; post-1550 7206.015 450.842 5698.000 7724.000Wheat yield; pre-1550 2507.303 73.552 2328.000 2687.000Wheat yield; post-1550 5992.820 239.720 5163.000 6353.000Barley yield; pre-1550 2507.303 73.552 2328.000 2687.000Barley yield; post-1550 5992.820 239.720 5163.000 6353.000Rye yield; pre-1550 1545.318 57.388 1337.000 1735.000Rye yield; post-1550 3368.462 96.524 2972.000 3637.000Buckwheat yield; pre-1550 1031.991 38.947 911.000 1122.000Buckwheat yield; post-1550 1597.458 55.703 1486.000 1734.000
Observations 2551
13
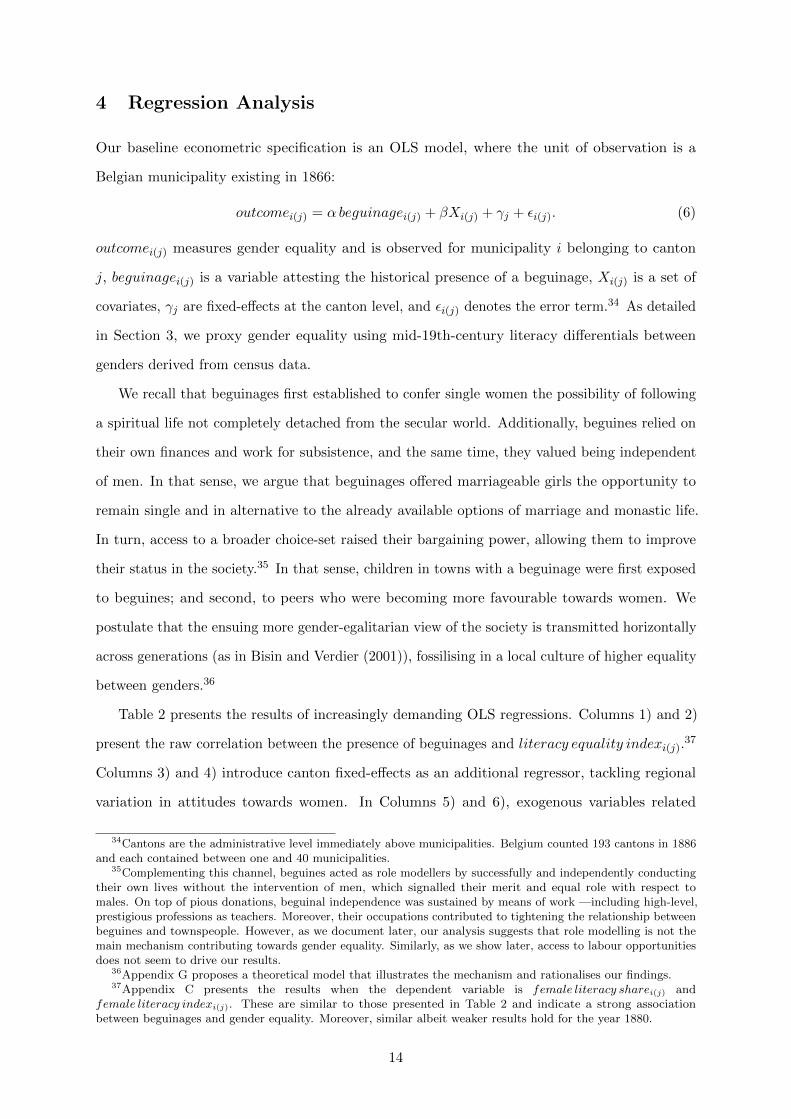
4 Regression Analysis
Our baseline econometric specification is an OLS model, where the unit of observation is a
Belgian municipality existing in 1866:
outcomei(j) = α beguinagei(j) + βXi(j) + γj + εi(j). (6)
outcomei(j) measures gender equality and is observed for municipality i belonging to canton
j, beguinagei(j) is a variable attesting the historical presence of a beguinage, Xi(j) is a set of
covariates, γj are fixed-effects at the canton level, and εi(j) denotes the error term.34 As detailed
in Section 3, we proxy gender equality using mid-19th-century literacy differentials between
genders derived from census data.
We recall that beguinages first established to confer single women the possibility of following
a spiritual life not completely detached from the secular world. Additionally, beguines relied on
their own finances and work for subsistence, and the same time, they valued being independent
of men. In that sense, we argue that beguinages offered marriageable girls the opportunity to
remain single and in alternative to the already available options of marriage and monastic life.
In turn, access to a broader choice-set raised their bargaining power, allowing them to improve
their status in the society.35 In that sense, children in towns with a beguinage were first exposed
to beguines; and second, to peers who were becoming more favourable towards women. We
postulate that the ensuing more gender-egalitarian view of the society is transmitted horizontally
across generations (as in Bisin and Verdier (2001)), fossilising in a local culture of higher equality
between genders.36
Table 2 presents the results of increasingly demanding OLS regressions. Columns 1) and 2)
present the raw correlation between the presence of beguinages and literacy equality indexi(j).37
Columns 3) and 4) introduce canton fixed-effects as an additional regressor, tackling regional
variation in attitudes towards women. In Columns 5) and 6), exogenous variables related
34Cantons are the administrative level immediately above municipalities. Belgium counted 193 cantons in 1886and each contained between one and 40 municipalities.
35Complementing this channel, beguines acted as role modellers by successfully and independently conductingtheir own lives without the intervention of men, which signalled their merit and equal role with respect tomales. On top of pious donations, beguinal independence was sustained by means of work —including high-level,prestigious professions as teachers. Moreover, their occupations contributed to tightening the relationship betweenbeguines and townspeople. However, as we document later, our analysis suggests that role modelling is not themain mechanism contributing towards gender equality. Similarly, as we show later, access to labour opportunitiesdoes not seem to drive our results.
36Appendix G proposes a theoretical model that illustrates the mechanism and rationalises our findings.37Appendix C presents the results when the dependent variable is female literacy sharei(j) and
female literacy indexi(j). These are similar to those presented in Table 2 and indicate a strong associationbetween beguinages and gender equality. Moreover, similar albeit weaker results hold for the year 1880.
14
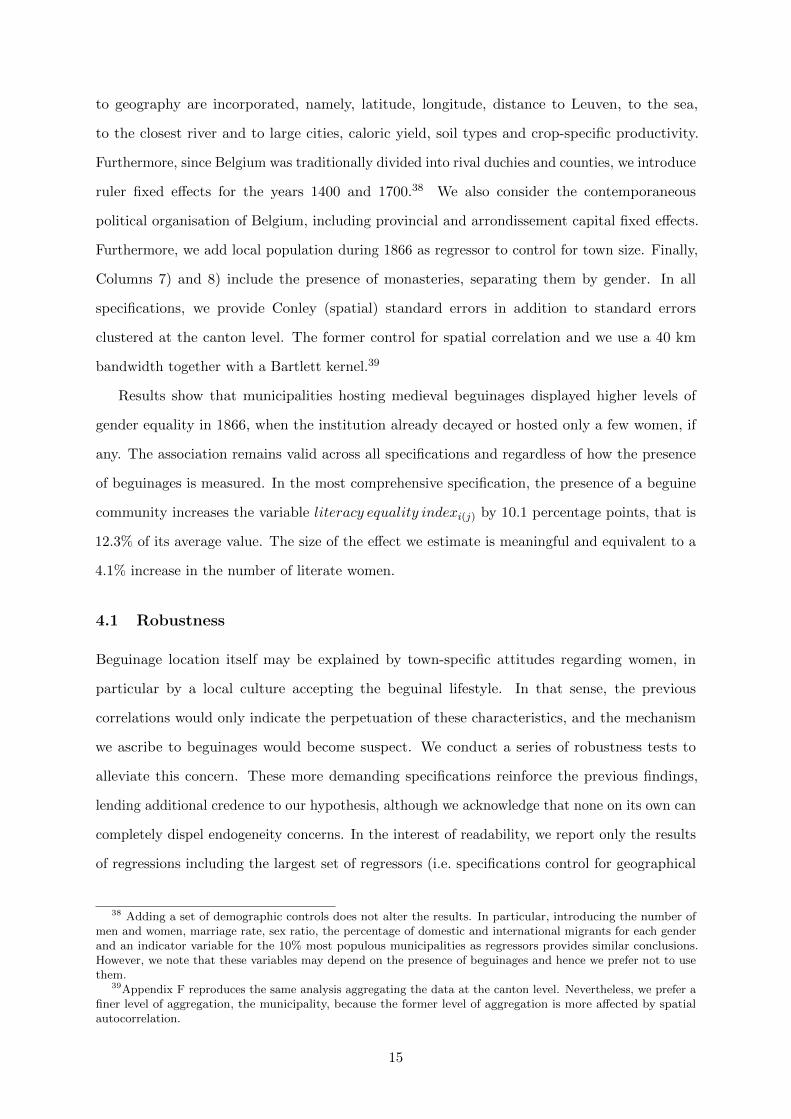
to geography are incorporated, namely, latitude, longitude, distance to Leuven, to the sea,
to the closest river and to large cities, caloric yield, soil types and crop-specific productivity.
Furthermore, since Belgium was traditionally divided into rival duchies and counties, we introduce
ruler fixed effects for the years 1400 and 1700.38 We also consider the contemporaneous
political organisation of Belgium, including provincial and arrondissement capital fixed effects.
Furthermore, we add local population during 1866 as regressor to control for town size. Finally,
Columns 7) and 8) include the presence of monasteries, separating them by gender. In all
specifications, we provide Conley (spatial) standard errors in addition to standard errors
clustered at the canton level. The former control for spatial correlation and we use a 40 km
bandwidth together with a Bartlett kernel.39
Results show that municipalities hosting medieval beguinages displayed higher levels of
gender equality in 1866, when the institution already decayed or hosted only a few women, if
any. The association remains valid across all specifications and regardless of how the presence
of beguinages is measured. In the most comprehensive specification, the presence of a beguine
community increases the variable literacy equality indexi(j) by 10.1 percentage points, that is
12.3% of its average value. The size of the effect we estimate is meaningful and equivalent to a
4.1% increase in the number of literate women.
4.1 Robustness
Beguinage location itself may be explained by town-specific attitudes regarding women, in
particular by a local culture accepting the beguinal lifestyle. In that sense, the previous
correlations would only indicate the perpetuation of these characteristics, and the mechanism
we ascribe to beguinages would become suspect. We conduct a series of robustness tests to
alleviate this concern. These more demanding specifications reinforce the previous findings,
lending additional credence to our hypothesis, although we acknowledge that none on its own can
completely dispel endogeneity concerns. In the interest of readability, we report only the results
of regressions including the largest set of regressors (i.e. specifications control for geographical
38 Adding a set of demographic controls does not alter the results. In particular, introducing the number ofmen and women, marriage rate, sex ratio, the percentage of domestic and international migrants for each genderand an indicator variable for the 10% most populous municipalities as regressors provides similar conclusions.However, we note that these variables may depend on the presence of beguinages and hence we prefer not to usethem.
39Appendix F reproduces the same analysis aggregating the data at the canton level. Nevertheless, we prefer afiner level of aggregation, the municipality, because the former level of aggregation is more affected by spatialautocorrelation.
15
Tab
le2:
Beg
uin
ages
and
lite
racy
equ
alit
y.
Dep
.va
riab
le:
Lit
.eq
ual
ity
ind
ex,
1866
Bas
elin
eF
ixed
-eff
ects
Geo
grap
hy
Mon
aste
ries
(1)
(2)
(3)
(4)
(5)
(6)
(7)
(8)
Beg
uin
age
(0/1
)0.1
44
0.15
30.
110
0.10
1(0.0
19)∗∗∗
(0.0
19)∗∗∗
(0.0
26)∗∗∗
(0.0
24)∗∗∗
[0.0
19]∗∗∗
[0.0
20]∗∗∗
[0.0
27]∗∗∗
[0.0
25]∗∗∗
Exp
osu
re(c
entu
ries
)0.0
210.
022
0.01
40.
012
(0.0
03)∗∗∗
(0.0
03)∗∗∗
(0.0
05)∗∗∗
(0.0
05)∗∗∗
[0.0
03]∗∗∗
[0.0
03]∗∗∗
[0.0
06]∗∗
[0.0
06]∗∗
Fix
ed-e
ffec
tsN
oN
oC
anto
nC
anto
nC
anto
nC
anto
nC
anto
nC
anto
nG
eogr
aphy
No
No
No
No
Yes
Yes
Yes
Yes
Mon
aste
ries
No
No
No
No
No
No
Yes
Yes
Ob
serv
ati
on
s254
925
4925
4925
4924
4724
4724
4724
47R
20.0
30
0.02
90.
203
0.20
00.
231
0.22
50.
235
0.22
9
No
te:
Th
ista
ble
pre
sents
the
resu
lts
of
OL
Sre
gre
ssio
ns
rela
tin
gth
ep
rese
nce
of
beg
uin
ages
toin
crea
sed
gen
der
equ
ali
typ
roxie
dby
the
vari
ab
leliteracyequalityindex
i(j,
see
main
text
for
ad
escr
ipti
on
.C
olu
mn
s1)
an
d2)
incl
ude
on
lyth
ep
rese
nce
of
beg
uin
ages
as
are
gre
ssor.
Colu
mn
s3)
an
d4)
ad
dfi
xed
-eff
ects
at
the
canto
nle
vel
.In
Colu
mn
s5)
an
d6)
exogen
ou
sva
riab
les
are
inco
rpora
ted
,n
am
ely,
lati
tud
e,lo
ngit
ud
e,d
ista
nce
toL
euven
,to
larg
eci
ties
(defi
ned
in1300),
toth
ese
aan
dri
ver
s,ca
lori
cyie
ld,
soil
typ
ean
dcr
op
pro
duct
ivit
y,pro
vin
cean
darr
on
dis
sem
ent
cap
ital
statu
s.A
lld
ista
nce
sin
log-k
m.
Colu
mn
s7)
an
d8)
furt
her
contr
ol
for
the
pre
sen
ceof
mon
ast
erie
s:m
asc
uli
ne,
fem
inin
ean
du
nkn
own
.F
rom
Colu
mn
5)
onw
ard
,w
ealw
ays
contr
ol
for
tota
lp
op
ula
tion
du
rin
g1866.
Sta
nd
ard
erro
rscl
ust
ered
at
the
canto
nle
vel
inp
are
nth
esis
and
Conle
yst
andard
erro
rs,
wit
ha
Bart
lett
ker
nel
and
acu
t-off
dis
tance
of
40
km
,in
bra
cket
s.∗p<
0.1
,∗∗p<
0.0
5,∗∗
∗p<
0.0
1.
16
and agricultural characteristics, population, monasteries, ruler indicators, as well as canton
fixed-effects).
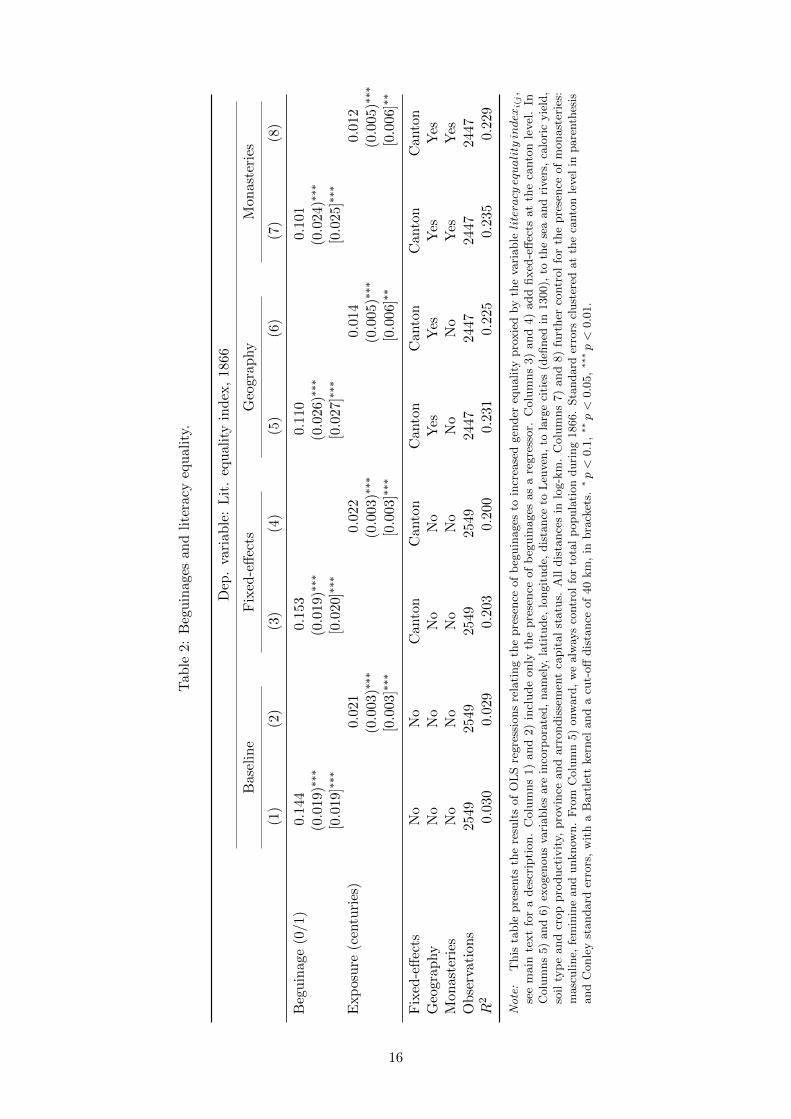
First, Table 3 restricts the sample to municipalities supposedly sharing similar culture and
attitudes towards women by selecting only towns located at close distance from a beguinage: 5
km, 10 km and 20 km, in Columns 1)–2), 3)–4), and 5)–6), respectively. The underlying idea
is that municipalities near the ones chosen by beguines did not hold different views on gender
roles ex-ante. In other words, municipalities sufficiently close can be considered substitutes in
terms of attitudes towards women. In doing so, regressions are likely to violate the stable unit
treatment value assumption. However, the control municipalities are expected to be more similar
regarding townsfolk’s attitudes toward women, partially alleviating endogeneity concerns: the
control group would have been “as likely” to obtain a beguinage as the treated group.
Overall, results indicate a positive and significant effect of beguine communities on gender
equality. Therefore, the presence of a beguinage raised gender-equality levels even among towns
that held similar attitudes towards women. Further adding beguinage fixed-effects and clustering
the standard errors at that level provides similar results.40
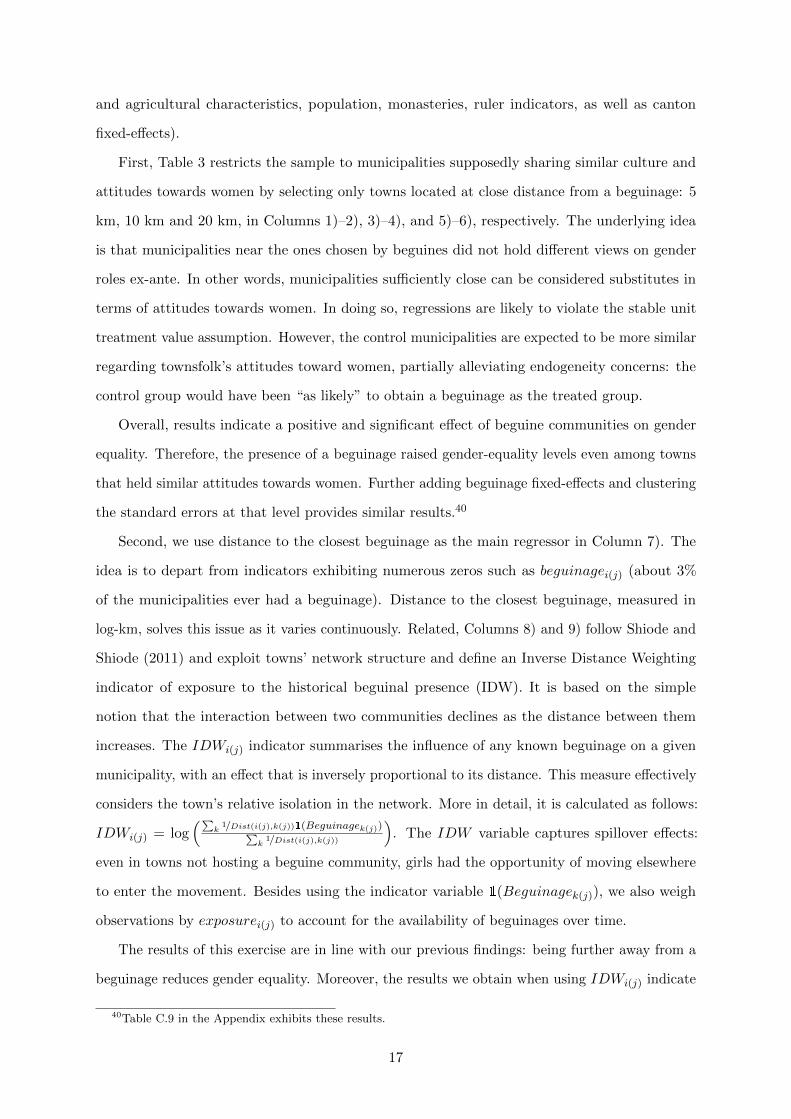
Second, we use distance to the closest beguinage as the main regressor in Column 7). The
idea is to depart from indicators exhibiting numerous zeros such as beguinagei(j) (about 3%
of the municipalities ever had a beguinage). Distance to the closest beguinage, measured in
log-km, solves this issue as it varies continuously. Related, Columns 8) and 9) follow Shiode and
Shiode (2011) and exploit towns’ network structure and define an Inverse Distance Weighting
indicator of exposure to the historical beguinal presence (IDW). It is based on the simple
notion that the interaction between two communities declines as the distance between them
increases. The IDWi(j) indicator summarises the influence of any known beguinage on a given
municipality, with an effect that is inversely proportional to its distance. This measure effectively
considers the town’s relative isolation in the network. More in detail, it is calculated as follows:
IDWi(j) = log(∑
k1/Dist(i(j),k(j))1(Beguinagek(j))∑
k1/Dist(i(j),k(j))
). The IDW variable captures spillover effects:
even in towns not hosting a beguine community, girls had the opportunity of moving elsewhere
to enter the movement. Besides using the indicator variable 1(Beguinagek(j)), we also weigh
observations by exposurei(j) to account for the availability of beguinages over time.
The results of this exercise are in line with our previous findings: being further away from a
beguinage reduces gender equality. Moreover, the results we obtain when using IDWi(j) indicate
40Table C.9 in the Appendix exhibits these results.
17
higher gender equality in towns better connected to beguine municipalities. In that sense, a
location closer to clusters of beguinages offered girls multiple alternatives to avoid marriage,
presenting them an even broader choice set compared to a single beguinage. Meanwhile, peers
and folk in such towns are not necessarily exposed to beguines’ lifestyle, foreclosing the role
modelling channel: it is only operative in towns with a beguinage. In that sense, IDW mainly
captures women’s availability of outside options and not role modelling, reducing, by construction,
the latter channel to a minimum level.41
Finally, we consider two additional potential drivers of educational choices: the income effect
and the early industrialisation of Belgium. Regarding the first, people in relatively wealthier
towns may have intensified daughters’ education. Table 4 mitigates this concern introducing
a municipal-level proxy for income: the per-capita value of town’s real estate, in logarithm,
measured in 1890, the first available year. Second, parents’ decision to educate children depends
on human capital returns, and the presence of nearby industrial occupations affects it. To
take into account the extent of industrialisation at the local level, we include variables derived
from the Belgian industrial census carried out in 1896: the total number of industries and total
horse-power installed for several industries.42 Although the survey is not exactly synchronous
with the baseline outcomes we measure, we believe it represents a good approximation to the
industrial state of Belgium.43 However, we acknowledge that proto-industry and specialisation
in crafts might have guided industrialists’ location choices. For this reason, we only present the
results including the full set of industrial controls as a robustness test.44 In any case, additional
tests, not reported here but available from the authors upon request, indicate that beguinages
were not harbingers of female employment.45 It should be noted that the available proxies for the
development of the local labour market are not expected to confound the highlighted relationship
between beguinages and gender equality. As stated in De Moor and Van Zanden (2010), by the
19th century the society and economy had been characterised by a strong commercialisation to
41As mentioned below, results presented in Table 7 also suggest that role modelling is of secondary importancein the spread of gender egalitarianism.
42The census provides relatively finely-grained categories. We use the broadest set, comprising: construction,wood, ceramic, clothing, leather, metal, textile, food, books, chemical, tobacco, transport, quarries, precisionindustries, paper, glass and mining.
43Using a less precise measure, the number of steam engines per capita before 1850 from van Neck (1979),provides similar results.
44Controlling for income or industry does not affect the qualitative nature of the results throughout the paper.45 These regressions consider female labour force participation in agriculture, the industry and in both sectors
combined. Regressions include the same set of regressors as in Column 2) of Table 4. Similarly, beguinages do notaffect the share of women in the industry relative to men’s, alleviating the concern of a gender specialisation inmanufacturing brought about by the importance of crafts within beguinages.
18

Tab
le3:
Beg
uin
ages
and
lite
racy
equ
alit
y;
acco
unti
ng
for
pro
xim
ity.
Dep
.va
riab
le:
Lit
.eq
ual
ity
ind
ex,
1866
5km
10km
20km
Dis
tan
ceas
regr
esso
r
(1)
(2)
(3)
(4)
(5)
(6)
(7)
(8)
(9)
Beg
uin
age
(0/1
)0.
115
0.11
60.
109
(0.0
39)∗∗∗
(0.0
28)∗∗∗
(0.0
25)∗∗∗
[0.0
25]∗∗∗
[0.0
27]∗∗∗
[0.0
26]∗∗∗
Exp
osu
re(c
entu
ries
)0.
016
0.01
90.
015
(0.0
07)∗∗
(0.0
05)∗∗∗
(0.0
05)∗∗∗
[0.0
04]∗∗∗
[0.0
05]∗∗∗
[0.0
05]∗∗∗
Min
.D
ista
nce
Beg
.(l
og-
km
)−
0.0
19(0.0
07)∗∗
[0.0
07]∗∗∗
IDW
0.1
52(0.0
41)∗∗∗
[0.0
36]∗∗∗
IDW
,ex
posu
re0.1
34(0.0
41)∗∗∗
[0.0
38]∗∗∗
Fix
ed-e
ffec
tsC
anto
nC
anto
nC
anto
nC
anto
nC
anto
nC
anto
nC
anto
nC
anto
nC
anto
nG
eogr
aphy
Yes
Yes
Yes
Yes
Yes
Yes
Yes
Yes
Yes
Mon
aste
ries
Yes
Yes
Yes
Yes
Yes
Yes
Yes
Yes
Yes
Ob
serv
ati
on
s24
524
590
790
719
7519
7524
4723
7523
75R
20.6
220.5
990.3
700.3
610.2
540.2
460.2
290.2
390.2
36
No
te:
Th
ista
ble
pre
sents
the
resu
lts
of
OL
Sre
gre
ssio
ns
rela
tin
gth
ep
rese
nce
of
beg
uin
ages
toin
crea
sed
gen
der
equ
ali
ty.
Colu
mn
s1)
an
d2)
con
sid
eron
lym
un
icip
ali
ties
loca
ted
less
than
5km
from
ab
egu
inage,
3)
an
d4)
incr
ease
the
dis
tan
ceu
pto
10
km
an
d5)
an
d6)
furt
her
expan
dit
to20
km
.C
olu
mn
7)
use
slo
g-d
ista
nce
toth
ecl
ose
stb
egu
inage
as
regre
ssor,
wh
ile
Colu
mn
s8)
an
d9)
intr
od
uce
the
IDW
mea
sure
,w
eighte
dby
the
pre
sen
ceofbeguinage i
(j)
an
dexposure
i(j),
resp
ecti
vel
y.G
eogra
phy:
lati
tud
e,lo
ngit
ude,
calo
ric
yie
ld,
soil
typ
eand
crop
pro
duct
ivit
y,pro
vin
ceand
arr
ondis
sem
ent
capit
al
statu
s,dis
tance
toL
euven
,to
larg
eci
ties
(defi
ned
in1300),
toth
ese
a,
and
tori
ver
s.A
lld
ista
nce
sin
log-k
m.
Mon
ast
erie
s:p
rese
nce
of
masc
uli
ne,
fem
inin
ean
du
nkn
own
mon
ast
erie
s.R
egre
ssio
ns
incl
ud
eca
nto
nfi
xed
effec
tsan
dco
ntr
ol
for
tota
lp
opula
tion.
Sta
ndard
erro
rscl
ust
ered
at
the
canto
nle
vel
inpare
nth
esis
and
Conle
yst
andard
erro
rs,
wit
ha
Bart
lett
ker
nel
and
acu
t-off
dis
tance
of
40
km
,in
bra
cket
s.∗p<
0.1
,∗∗p<
0.0
5,∗∗
∗p<
0.0
1.
19
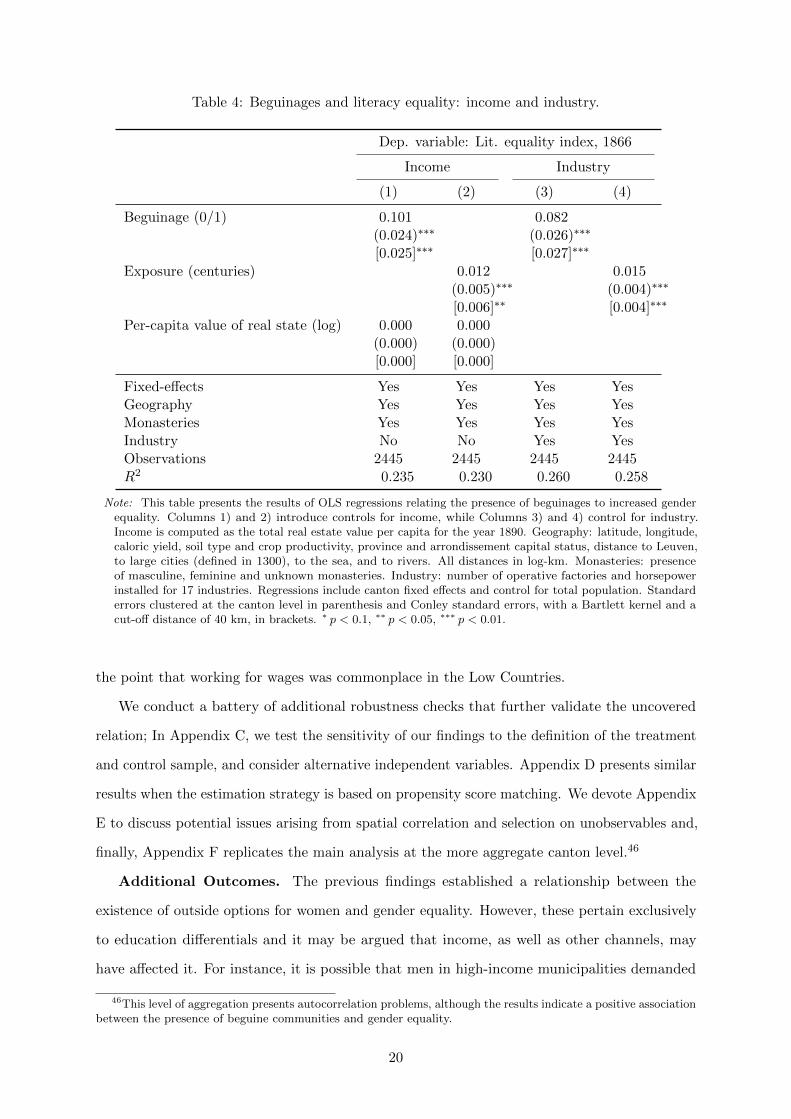
Table 4: Beguinages and literacy equality: income and industry.
Dep. variable: Lit. equality index, 1866
Income Industry
(1) (2) (3) (4)
Beguinage (0/1) 0.101 0.082(0.024)∗∗∗ (0.026)∗∗∗
[0.025]∗∗∗ [0.027]∗∗∗
Exposure (centuries) 0.012 0.015(0.005)∗∗∗ (0.004)∗∗∗
[0.006]∗∗ [0.004]∗∗∗
Per-capita value of real state (log) 0.000 0.000(0.000) (0.000)[0.000] [0.000]
Fixed-effects Yes Yes Yes YesGeography Yes Yes Yes YesMonasteries Yes Yes Yes YesIndustry No No Yes YesObservations 2445 2445 2445 2445R2 0.235 0.230 0.260 0.258
Note: This table presents the results of OLS regressions relating the presence of beguinages to increased genderequality. Columns 1) and 2) introduce controls for income, while Columns 3) and 4) control for industry.Income is computed as the total real estate value per capita for the year 1890. Geography: latitude, longitude,caloric yield, soil type and crop productivity, province and arrondissement capital status, distance to Leuven,to large cities (defined in 1300), to the sea, and to rivers. All distances in log-km. Monasteries: presenceof masculine, feminine and unknown monasteries. Industry: number of operative factories and horsepowerinstalled for 17 industries. Regressions include canton fixed effects and control for total population. Standarderrors clustered at the canton level in parenthesis and Conley standard errors, with a Bartlett kernel and acut-off distance of 40 km, in brackets. ∗ p < 0.1, ∗∗ p < 0.05, ∗∗∗ p < 0.01.
the point that working for wages was commonplace in the Low Countries.
We conduct a battery of additional robustness checks that further validate the uncovered
relation; In Appendix C, we test the sensitivity of our findings to the definition of the treatment
and control sample, and consider alternative independent variables. Appendix D presents similar
results when the estimation strategy is based on propensity score matching. We devote Appendix
E to discuss potential issues arising from spatial correlation and selection on unobservables and,
finally, Appendix F replicates the main analysis at the more aggregate canton level.46
Additional Outcomes. The previous findings established a relationship between the
existence of outside options for women and gender equality. However, these pertain exclusively
to education differentials and it may be argued that income, as well as other channels, may
have affected it. For instance, it is possible that men in high-income municipalities demanded
46This level of aggregation presents autocorrelation problems, although the results indicate a positive associationbetween the presence of beguine communities and gender equality.
20
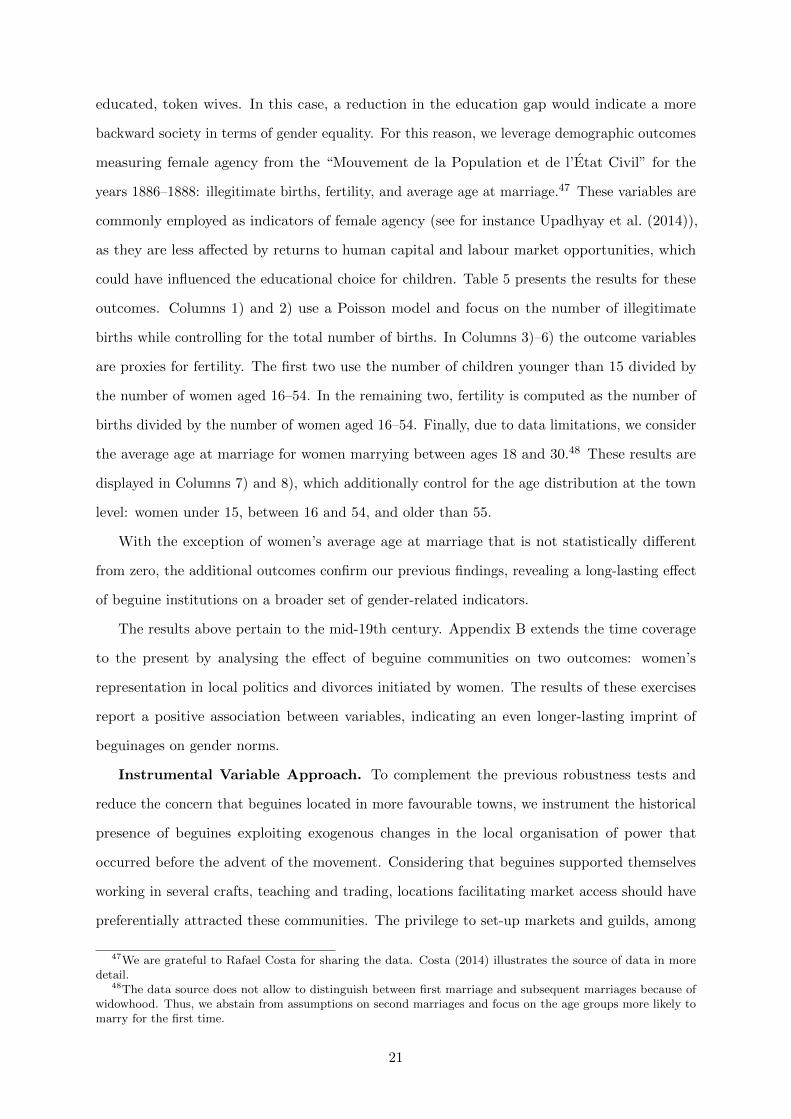
educated, token wives. In this case, a reduction in the education gap would indicate a more
backward society in terms of gender equality. For this reason, we leverage demographic outcomes
measuring female agency from the “Mouvement de la Population et de l’Etat Civil” for the
years 1886–1888: illegitimate births, fertility, and average age at marriage.47 These variables are
commonly employed as indicators of female agency (see for instance Upadhyay et al. (2014)),
as they are less affected by returns to human capital and labour market opportunities, which
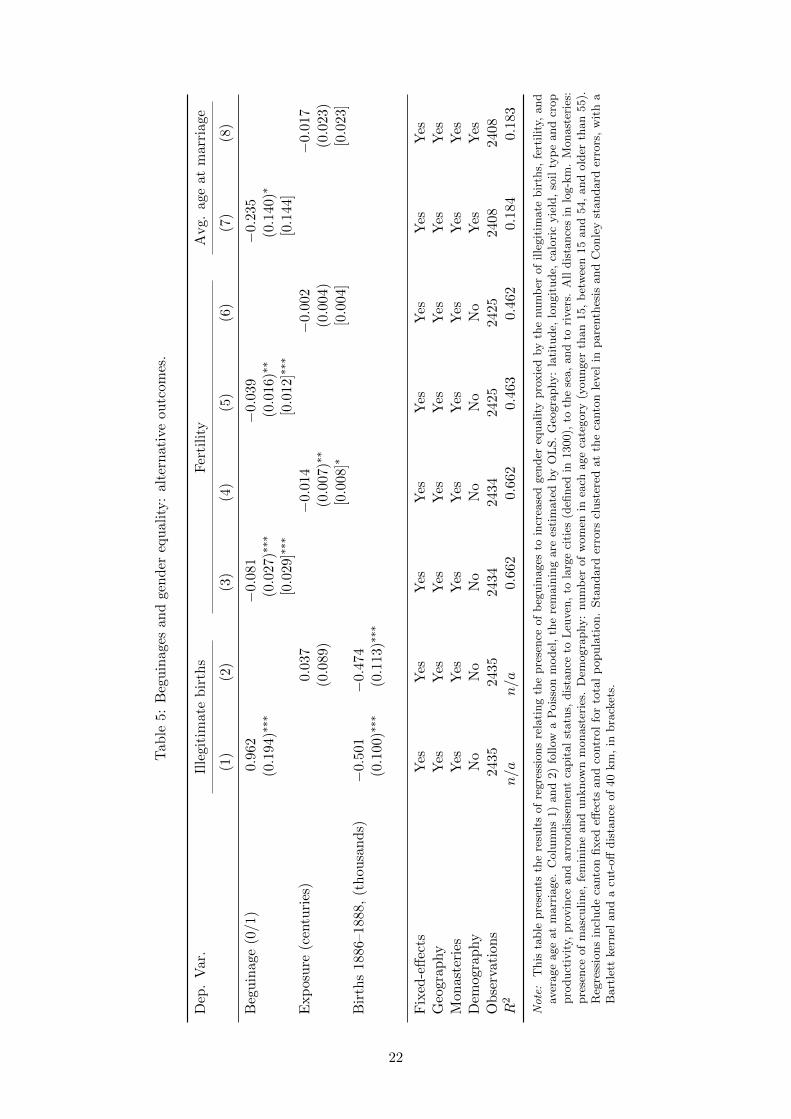
could have influenced the educational choice for children. Table 5 presents the results for these
outcomes. Columns 1) and 2) use a Poisson model and focus on the number of illegitimate
births while controlling for the total number of births. In Columns 3)–6) the outcome variables
are proxies for fertility. The first two use the number of children younger than 15 divided by
the number of women aged 16–54. In the remaining two, fertility is computed as the number of
births divided by the number of women aged 16–54. Finally, due to data limitations, we consider
the average age at marriage for women marrying between ages 18 and 30.48 These results are
displayed in Columns 7) and 8), which additionally control for the age distribution at the town
level: women under 15, between 16 and 54, and older than 55.
With the exception of women’s average age at marriage that is not statistically different
from zero, the additional outcomes confirm our previous findings, revealing a long-lasting effect
of beguine institutions on a broader set of gender-related indicators.
The results above pertain to the mid-19th century. Appendix B extends the time coverage
to the present by analysing the effect of beguine communities on two outcomes: women’s
representation in local politics and divorces initiated by women. The results of these exercises
report a positive association between variables, indicating an even longer-lasting imprint of
beguinages on gender norms.
Instrumental Variable Approach. To complement the previous robustness tests and
reduce the concern that beguines located in more favourable towns, we instrument the historical
presence of beguines exploiting exogenous changes in the local organisation of power that
occurred before the advent of the movement. Considering that beguines supported themselves
working in several crafts, teaching and trading, locations facilitating market access should have
preferentially attracted these communities. The privilege to set-up markets and guilds, among
47We are grateful to Rafael Costa for sharing the data. Costa (2014) illustrates the source of data in moredetail.
48The data source does not allow to distinguish between first marriage and subsequent marriages because ofwidowhood. Thus, we abstain from assumptions on second marriages and focus on the age groups more likely tomarry for the first time.
21
Tab
le5:
Beg
uin
ages
and
gen
der
equ
alit
y:
alte
rnat
ive
outc
omes
.
Dep
.V
ar.
Ille
git
imat
eb
irth
sF
erti
lity
Avg.
age
atm
arri
age
(1)
(2)
(3)
(4)
(5)
(6)
(7)
(8)
Beg
uin
age
(0/1
)0.
962
−0.
081
−0.
039
−0.
235
(0.1
94)∗∗∗
(0.0
27)∗∗∗
(0.0
16)∗∗
(0.1
40)∗
[0.0
29]∗∗∗
[0.0
12]∗∗∗
[0.1
44]
Exp
osu
re(c
entu
ries
)0.
037
−0.0
14−
0.0
02−
0.01
7(0.0
89)
(0.0
07)∗∗
(0.0
04)
(0.0
23)
[0.0
08]∗
[0.0
04]
[0.0
23]
Bir
ths
1886–1
888,
(th
ou
san
ds)
−0.5
01−
0.47
4(0.1
00)∗∗∗
(0.1
13)∗∗∗
Fix
ed-e
ffec
tsY
esY
esY
esY
esY
esY
esY
esY
esG
eogr
aphy
Yes
Yes
Yes
Yes
Yes
Yes
Yes
Yes
Mon
aste
ries
Yes
Yes
Yes
Yes
Yes
Yes
Yes
Yes
Dem
ogra
phy
No
No
No
No
No
No
Yes
Yes
Ob
serv
ati
on
s243
524
3524
3424
3424
2524
2524
0824
08R
2n/a
n/a
0.6
620.
662
0.46
30.
462
0.18
40.1
83
No
te:
This
table
pre
sents
the
resu
lts
of
regre
ssio
ns
rela
ting
the
pre
sence
of
beg
uin
ages
toin
crea
sed
gen
der
equality
pro
xie
dby
the
num
ber
of
ille
git
imate
bir
ths,
fert
ilit
y,and
aver
age
age
at
marr
iage.
Colu
mns
1)
and
2)
follow
aP
ois
son
model
,th
ere
main
ing
are
esti
mate
dby
OL
S.
Geo
gra
phy:
lati
tude,
longit
ude,
calo
ric
yie
ld,
soil
typ
eand
crop
pro
du
ctiv
ity,
pro
vin
cean
darr
on
dis
sem
ent
cap
ital
statu
s,d
ista
nce
toL
euven
,to
larg
eci
ties
(defi
ned
in1300),
toth
ese
a,
an
dto
river
s.A
lld
ista
nce
sin
log-k
m.
Mon
ast
erie
s:pre
sence
of
masc
uline,
fem
inin
eand
unknow
nm
onast
erie
s.D
emogra
phy:
num
ber
of
wom
enin
each
age
cate
gory
(younger
than
15,
bet
wee
n15
and
54,
and
old
erth
an
55).
Reg
ress
ions
incl
ude
canto
nfixed
effec
tsand
contr
ol
for
tota
lp
opula
tion.
Sta
ndard
erro
rscl
ust
ered
at
the
canto
nle
vel
inpare
nth
esis
and
Conle
yst
andard
erro
rs,
wit
ha
Bart
lett
ker
nel
and
acu
t-off
dis
tance
of
40
km
,in
bra
cket
s.
22
others, was typically granted in municipal charters, documents conveying additional rights to
selected municipalities. Indeed, in the medieval European context, some towns were awarded
a semi-independent status through the acquisition of new privileges encoded in charters. A
municipality receiving a charter was granted partial exemption from wars for its citizens, often
allowing the opportunity to wall the town, trade, mint currency, set up a municipal judicial
system, and establish guilds. Municipal charters, in fact, decentralised decision-making.49
This change in the local power and administrative structure could be achieved for various
motives. Some lords founded villages and immediately endowed them with a municipal charter.50
Other towns benefited from their strategic position and obtained a municipal charter in exchange
for defence.51 A few Lords sought bull trade and urban development and granted charters to
this end.52 Finally, some towns gained this privileged status by siding with a Lord at times of
conflict or because of specific local circumstances.53 In any case, granting a municipal charter
was a prerogative of the ruler: not all cities that ever requested this special status obtained it.
In light of the benefits conveyed by municipal charters in terms of trade and economic activity
in general, and considering beguines’ occupations, beguinages were more likely to establish in
towns already enjoying a municipal charter. Moreover, the more decentralised administrative
framework of chartered towns made it easier for beguines to obtain the terrain to erect their
communal buildings, sometimes also as a donation. In view of these characteristics, municipal
charters are employed as a dummy instrument to predict locations that beguines chose to
establish communities. We consider only municipal charters that were bestowed before the 13th
century, as beguinages were only founded after this time. Imposing this restriction assures
that beguinages did not exert any influence in obtaining a municipal charter. In addition, the
49The majority of these documents simply transposed privileges already bestowed to other municipalities,effectively copying them. In most cases, Belgian municipalities celebrated their independence erecting a belfry :a monumental, fortified building that served as a court, prison, archive and treasure chamber and doubled aswatching and bell tower. Eastern cities under the control of the Prince-Bishop of Liege constructed, instead,small, decorated columns named perron. Interestingly, when the city of Liege capitulated in 1467 its perron wasdismantled and moved to Bruges for ten years. The peace treaty remarked that “the Duke wanted nothing leftstanding from the ancient Liege constitution, nor from public liberties, the legacy of a distant past”.
50This is the case of Herentals, Hoogstraten and Landen.51Ath, Geraardsbergen, Maaseik, Vilvoorde, Stokkem and Zoutleeuw received charters for being border posts
against powerful regional rivals.52Joan and Margaret II, Countesses of Flanders, Henry I, Duke of Brabant, and Philip I, Count of Flanders,
were among the group of nobles who promoted these reforms. Their reformation spirit benefited the cities ofAntwerp, Damme, Eeklo, Landen, Oostende and Roeselare.
53Bruges and Kortrijk were involved in a local conflict confronting Thierry of Alsace and William Clito. TheLord of Ghent delegated the resolution of internal turmoil to the citizens by issuing a charter. Phillip II of Francebought off Tournai’s inhabitants offering them a municipal charter. As an example of a more peculiar motivation,the Prince-Bishop of Liege granted Huy the first Belgian charter to reward the city for its involvement in thereconstruction of the cathedral. Abbot Leonius interceded with Thierry, count of Flanders and a friend of his, togrant a municipal charter to his vassals of Poperinge.
23
choice of pre-13th-century municipal charters rules out towns seeking a charter with the goal of
attracting beguines. In total, 42 Belgian municipalities were granted a municipal charter before
the 13th century.54 Among the 70 towns with a beguinage, 32 held a charter before beguines
settled.
Since trade and overall economic activity historically led to population growth and increased
returns to human capital, municipal charters may have promoted female literacy beyond operating
exclusively through the presence of beguine communities. However, we emphasise that the
outcome of interest is not literacy in absolute terms but gender equality in this dimension. In
this regard, we see female-to-male literacy measures as indicators of female agency. Moreover, if
municipal charters boosted the demand for schooling, higher education would bias our estimates
downward, as men were traditionally favoured over women in education investments. We can
also dismiss that municipalities that hosted a beguinage grew faster.55 Other indirect changes
brought about by municipal charters could have affected the general perception of women, for
instance, if decentralisation raised social capital —as in Guiso et al. (2016)— and this impacted
female agency. However, it should be noted that our measure of gender equality incorporates
the deliberate choice of investing in daughters’ human capital (directly and indirectly through
opportunity costs), as the public schooling system had not been enforced yet. While other
proxies of gender equality in the public domain might be fostered by social capital, we claim that
this instrument is more resistant to possible violations of the exclusion restriction as the other
channels would not affect the parents’ private financial considerations. Table C.12 in Appendix C
tackles these issues presenting estimates of the effect of municipal charters on attitudes towards
women, separately for towns with and without a beguinage.56 If, indeed, municipal charters
directly promoted female literacy, municipalities that received a charter should score higher in
female-to-male literacy on these sub-samples.57 The results, however, suggest that municipal
charters did not have much bearing on gender equality when general perceptions of women are
54These are: Aalst, Aarschot, Antwerp, Ath, Beringen, Borgloon, Brugge, Bruxelles, Damme, Deinze, Den-dermonde, Diest, Diksmuide, Eeklo, Ghent, Geraardsbergen, Gistel, Halen, Halle, Harelbeke, Hasselt, Herentals,Hoogstraten, Huy, Kortrijk, Landen, Leuven, Lier, Maaseik, Ninove, Oostende, Oudenaarde, Poperinge, Roeselare,Sint-Truiden, Soignies, Stokkem, Thurnhout, Tournai, Vilvoorde, Ypres and Zoutleeuw.
55We use data from Cuvelier (1912) on municipal size in 1438 and compute population growth rate betweenthis date and 1886. Unfortunately, the geographical coverage is limited to the historical province of the Brabant.
56The underlying idea is that, among each group, attitudes towards women would be similar. In the second case,the low number of observations impedes the exercise. We circumvent this limitation by showing that the effectof municipal charters is only significant at the 10% level for towns up to five kilometres away from a beguinage.Similarly, among municipalities located more than five kilometres from a beguinage, municipal charters do notexert any effect on literacy equality measures.
57Moreover, we argue that, if anything, municipal charters would strengthen men’s position as they areappointed officials in the new positions.
24
held constant.
Table 6 presents the findings of the IV approach when beguinage location is instrumented
using municipal charters. In general, F-statistics are well above 10, indicating that regressions
are not biased due to the inclusion of weak instruments.58 Although the reduce-form effect of
municipal charters on gender equality appears to be highly significant, Table C.12 in Appendix
C indicates that the effect vanishes once we control for the presence of beguinages.
Overall, results from the instrumented specification indicate that beguinages had a positive,
significant and enduring effect on gender equality. Moreover, even if our approach cannot assuage
all the possible endogeneity concerns, this exercise is useful insofar as it highlights that beguine
communities were instrumental in maintaining a higher regard for women for over 600 years.
However, a clearer identification strategy limiting the IV approach only to cases where obtaining
a municipal charter was arguably more exogenous delivers similar results.59 Robustness checks
akin to those performed on the OLS regressions but for the instrumented regressions are omitted
for the sake of brevity and are available from the authors upon request.
5 Mechanism
We argue that the existence of a beguinage in a town increased girls’ bargaining power by
improving their outside options. However, beguines also participated in the labour market, which
could prompt an increase in gender equality. We test this possibility exploiting the presence of
feminine monasteries, given that they enlarged women’s choice-set but lacked the wage labour
component. Moreover, we stress that entering a traditional convent conveyed less freedom and
benefits than joining a beguinage, and that the latter imposed tougher restrictions on women.
Despite being, a priory, a less attractive option for women who wanted to conduct an independent
life, monasteries presented girls with a clear and sanctioned option to oppose marriage and
remain single. Thus, we expect the presence of a feminine monastery to also be related to gender
equality. Table 7 assesses this hypothesis. Columns 1) and 2) consider feminine monasteries
altogether, while Columns 3) and 4) distinguishes between open and cloistered ones according
58 Alternatively, it is possible to use Wooldridge’s procedure 21.1 that correctly accounts for the non-linearity ofthe first-stage when the independent variable of interest is beguinagei. However, the first-stage, probit regression,does not converge and hence we are unable to report the results from such estimation.
59 Reasons considered include charters bestowed upon newly founded cities, conflict, and other miscellaneousinstances. The result of this more demanding specification validates our previous findings. However, the estimatedcoefficient becomes less precise because the instrument is able to predict fewer beguine communities. These resultsare not reported but are available upon request.
25
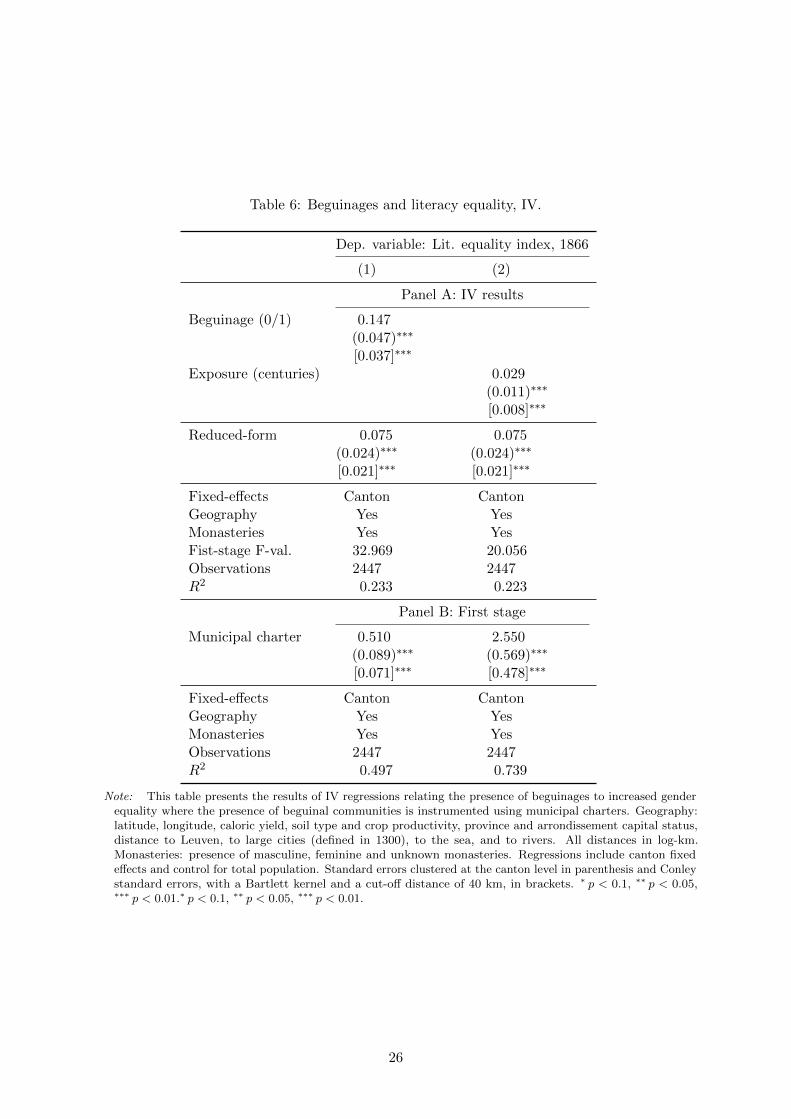
Table 6: Beguinages and literacy equality, IV.
Dep. variable: Lit. equality index, 1866
(1) (2)
Panel A: IV results
Beguinage (0/1) 0.147(0.047)∗∗∗
[0.037]∗∗∗
Exposure (centuries) 0.029(0.011)∗∗∗
[0.008]∗∗∗
Reduced-form 0.075 0.075(0.024)∗∗∗ (0.024)∗∗∗
[0.021]∗∗∗ [0.021]∗∗∗
Fixed-effects Canton CantonGeography Yes YesMonasteries Yes YesFist-stage F-val. 32.969 20.056Observations 2447 2447R2 0.233 0.223
Panel B: First stage
Municipal charter 0.510 2.550(0.089)∗∗∗ (0.569)∗∗∗
[0.071]∗∗∗ [0.478]∗∗∗
Fixed-effects Canton CantonGeography Yes YesMonasteries Yes YesObservations 2447 2447R2 0.497 0.739
Note: This table presents the results of IV regressions relating the presence of beguinages to increased genderequality where the presence of beguinal communities is instrumented using municipal charters. Geography:latitude, longitude, caloric yield, soil type and crop productivity, province and arrondissement capital status,distance to Leuven, to large cities (defined in 1300), to the sea, and to rivers. All distances in log-km.Monasteries: presence of masculine, feminine and unknown monasteries. Regressions include canton fixedeffects and control for total population. Standard errors clustered at the canton level in parenthesis and Conleystandard errors, with a Bartlett kernel and a cut-off distance of 40 km, in brackets. ∗ p < 0.1, ∗∗ p < 0.05,∗∗∗ p < 0.01.∗ p < 0.1, ∗∗ p < 0.05, ∗∗∗ p < 0.01.
26

to the Catholic order they belonged to.60
We find that the residence of religious non-beguine women in the municipalities is associated
with an increase in female agency, more so for orders that interacted with the population.61
This result is consistent with the mechanism we postulate, especially in light of the larger effect
displayed by non-enclosed monasteries. Arguably, open monasteries offered girls an alternative
option besides marriage while cloistered life indicates sheer vocation. Thus, these results are
indicative of a more general pattern that extends beyond beguinages. In other terms, the
availability of a non-stigmatised alternative to nuptials for young, marriageable girls is conducive
to the improvement of women’s status in the local society.62
The results above isolate the channel through which beguinages operated on gender norms.
In particular, by showing that also feminine monasteries are positively related to female agency,
the previous results hint at beguines’ work not being the main determinant of the observed
gender equality. Considering that nuns did not work because monasteries enjoyed rents and
patronage to a larger extent (compared beguines who were required to sustain themselves), the
premise that feminine employment drives our results is dubious. Related, as Section 2 indicates,
several beguines came from the upper classes and secured their entry to a beguinage with their
own wealth instead of manual work. Therefore, in light of the evidence, sheer access to labour
opportunities does not appear to be the leading root of gender equality.
The previous exercise contributes to lessen the concern that other alternative mechanisms are
at play. A simple competing explanation is that beguines acted as role-modellers, showing the
society that women could conduct their lives as men did. While this was possible for beguines,
nuns lacked this component insofar as they were subordinated to a male authority and their
livelihood did not depend on their industriousness. Yet, the effect of female monasteries is
positive and indistinguishable from that corresponding to beguines.
Moreover, Table 7 precludes an alternative interpretation based on monasteries only promoting
literacy, insofar masculine monasteries did so as well. In any case, only a minority of towns that
had a female monastery also had a masculine counterpart, further reducing this concern.63 Table
60Cloistered orders include the Annoncides, Carthusian, Colettine, Dominicans and Trappists.61Comparing the coefficient on beguinages and monasteries, the effect appears not to be statistically different.
The p-values associated to an equality test exceed the 10% threshold. In Column 3), we compare beguinages tohaving one open monastery.
62Nowadays, similar networks of women leaving their families to find mutual protection and support in otherwomen are present in a few developing societies. These groups are described in Appendix A. Analysing the effectof monasteries on gender equality is beyond the scope of this paper.
63 In particular, 73 towns had a feminine monastery. Among these, 17 had also a masculine community, out ofa total of 60 towns with masculine monasteries.
27
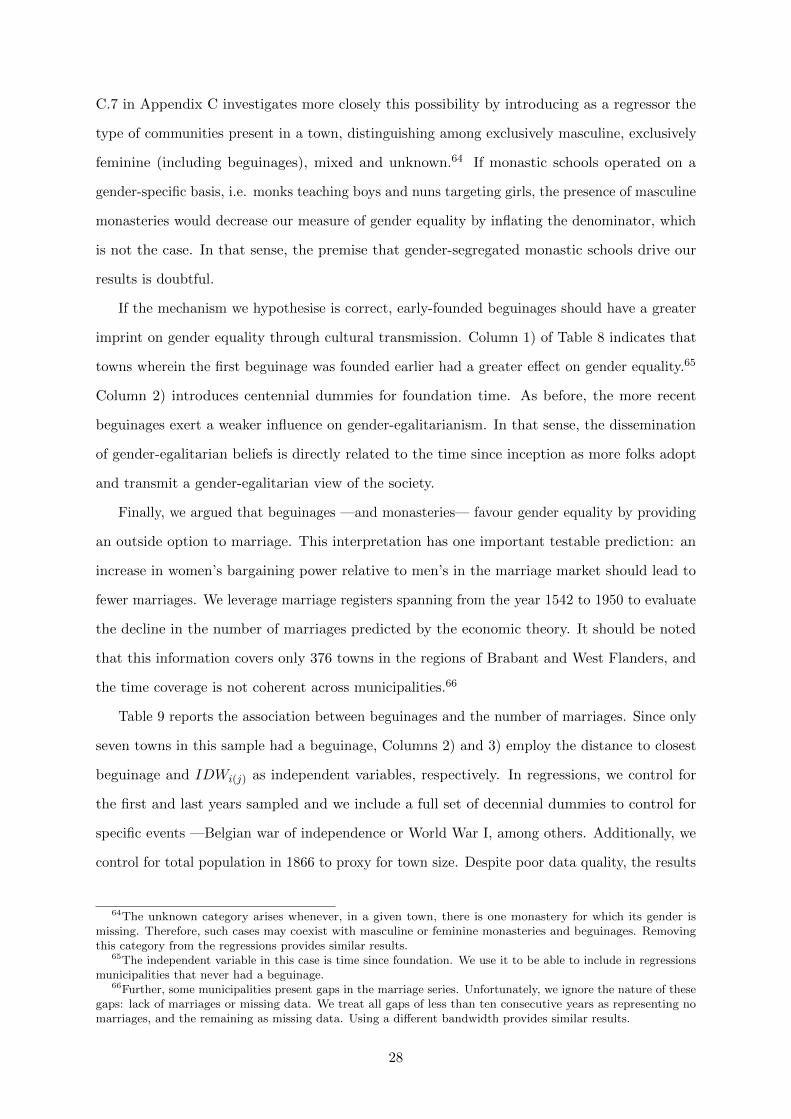
C.7 in Appendix C investigates more closely this possibility by introducing as a regressor the
type of communities present in a town, distinguishing among exclusively masculine, exclusively
feminine (including beguinages), mixed and unknown.64 If monastic schools operated on a
gender-specific basis, i.e. monks teaching boys and nuns targeting girls, the presence of masculine
monasteries would decrease our measure of gender equality by inflating the denominator, which
is not the case. In that sense, the premise that gender-segregated monastic schools drive our
results is doubtful.
If the mechanism we hypothesise is correct, early-founded beguinages should have a greater
imprint on gender equality through cultural transmission. Column 1) of Table 8 indicates that
towns wherein the first beguinage was founded earlier had a greater effect on gender equality.65
Column 2) introduces centennial dummies for foundation time. As before, the more recent
beguinages exert a weaker influence on gender-egalitarianism. In that sense, the dissemination
of gender-egalitarian beliefs is directly related to the time since inception as more folks adopt
and transmit a gender-egalitarian view of the society.
Finally, we argued that beguinages —and monasteries— favour gender equality by providing
an outside option to marriage. This interpretation has one important testable prediction: an
increase in women’s bargaining power relative to men’s in the marriage market should lead to
fewer marriages. We leverage marriage registers spanning from the year 1542 to 1950 to evaluate
the decline in the number of marriages predicted by the economic theory. It should be noted
that this information covers only 376 towns in the regions of Brabant and West Flanders, and
the time coverage is not coherent across municipalities.66
Table 9 reports the association between beguinages and the number of marriages. Since only
seven towns in this sample had a beguinage, Columns 2) and 3) employ the distance to closest
beguinage and IDWi(j) as independent variables, respectively. In regressions, we control for
the first and last years sampled and we include a full set of decennial dummies to control for
specific events —Belgian war of independence or World War I, among others. Additionally, we
control for total population in 1866 to proxy for town size. Despite poor data quality, the results
64The unknown category arises whenever, in a given town, there is one monastery for which its gender ismissing. Therefore, such cases may coexist with masculine or feminine monasteries and beguinages. Removingthis category from the regressions provides similar results.
65The independent variable in this case is time since foundation. We use it to be able to include in regressionsmunicipalities that never had a beguinage.
66Further, some municipalities present gaps in the marriage series. Unfortunately, we ignore the nature of thesegaps: lack of marriages or missing data. We treat all gaps of less than ten consecutive years as representing nomarriages, and the remaining as missing data. Using a different bandwidth provides similar results.
28
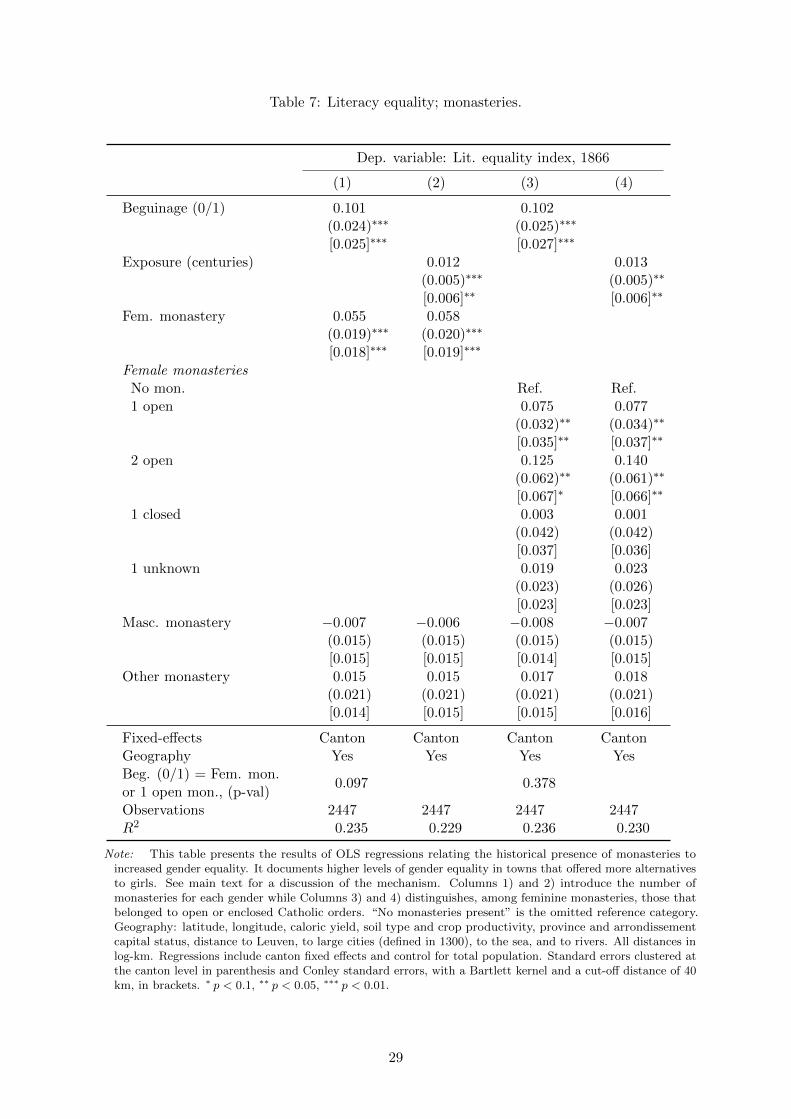
Table 7: Literacy equality; monasteries.
Dep. variable: Lit. equality index, 1866
(1) (2) (3) (4)
Beguinage (0/1) 0.101 0.102(0.024)∗∗∗ (0.025)∗∗∗
[0.025]∗∗∗ [0.027]∗∗∗
Exposure (centuries) 0.012 0.013(0.005)∗∗∗ (0.005)∗∗
[0.006]∗∗ [0.006]∗∗
Fem. monastery 0.055 0.058(0.019)∗∗∗ (0.020)∗∗∗
[0.018]∗∗∗ [0.019]∗∗∗
Female monasteriesNo mon. Ref. Ref.1 open 0.075 0.077
(0.032)∗∗ (0.034)∗∗
[0.035]∗∗ [0.037]∗∗
2 open 0.125 0.140(0.062)∗∗ (0.061)∗∗
[0.067]∗ [0.066]∗∗
1 closed 0.003 0.001(0.042) (0.042)[0.037] [0.036]
1 unknown 0.019 0.023(0.023) (0.026)[0.023] [0.023]
Masc. monastery −0.007 −0.006 −0.008 −0.007(0.015) (0.015) (0.015) (0.015)[0.015] [0.015] [0.014] [0.015]
Other monastery 0.015 0.015 0.017 0.018(0.021) (0.021) (0.021) (0.021)[0.014] [0.015] [0.015] [0.016]
Fixed-effects Canton Canton Canton CantonGeography Yes Yes Yes YesBeg. (0/1) = Fem. mon.or 1 open mon., (p-val)
0.097 0.378
Observations 2447 2447 2447 2447R2 0.235 0.229 0.236 0.230
Note: This table presents the results of OLS regressions relating the historical presence of monasteries toincreased gender equality. It documents higher levels of gender equality in towns that offered more alternativesto girls. See main text for a discussion of the mechanism. Columns 1) and 2) introduce the number ofmonasteries for each gender while Columns 3) and 4) distinguishes, among feminine monasteries, those thatbelonged to open or enclosed Catholic orders. “No monasteries present” is the omitted reference category.Geography: latitude, longitude, caloric yield, soil type and crop productivity, province and arrondissementcapital status, distance to Leuven, to large cities (defined in 1300), to the sea, and to rivers. All distances inlog-km. Regressions include canton fixed effects and control for total population. Standard errors clustered atthe canton level in parenthesis and Conley standard errors, with a Bartlett kernel and a cut-off distance of 40km, in brackets. ∗ p < 0.1, ∗∗ p < 0.05, ∗∗∗ p < 0.01.
29
Table 8: Beguinages and literacy equality; time of foundation.
Dep. variable: Lit. equality index, 1866
(1) (2)
Centuries with a beguinage 0.018(0.004)∗∗∗
[0.005]∗∗∗
First beguinage establishedNever Ref.Between 1200-1300 0.098
(0.021)∗∗∗
[0.027]∗∗∗
Between 1300-1400 0.127(0.065)∗
[0.056]∗∗
Between 1400-1500 0.055(0.028)∗∗
[0.027]∗∗
Fixed-effects Canton CantonGeography Yes YesMonasteries Yes YesObservations 2447 2447R2 0.235 0.235
Note: This table presents the results of OLS regressions relating beguinages foundation date to increasedgender equality. It documents higher levels of gender equality in towns where beguinages established earlier.See main text for a discussion of the mechanism. Column 1) introduces the number of years between thefoundation of the first beguinage in given town and the year 1866. Column 2) uses as independent variablecentennial dummies for the foundation year. Geography: latitude, longitude, caloric yield, soil type andcrop productivity, province and arrondissement capital status, distance to Leuven, to large cities (defined in1300), to the sea, and to rivers. All distances in log-km. Monasteries: presence of masculine, feminine andunknown monasteries. Regressions include canton fixed effects and control for total population. Standarderrors clustered at the canton level in parenthesis and Conley standard errors, with a Bartlett kernel and acut-off distance of 40 km, in brackets. ∗ p < 0.1, ∗∗ p < 0.05, ∗∗∗ p < 0.01.
30

Table 9: Beguinages and nuptiality.
Dep. variable: Number of marriages
(1) (2) (3)
Beguinage (0/1) −0.873(0.469)∗
Min. Distance Beg. (log-km) 0.197(0.074)∗∗∗
IDW −1.174(0.593)∗∗
Fixed-effects Arrond. Arrond. Arrond.Geography Yes Yes YesMonasteries Yes Yes YesDecades FE Yes Yes YesObservations 376 376 364
Note: This table presents the results of Poisson regressions relating beguinages to the number of marriages.Towns with or near a beguinage are associated to fewer marriages. See main text for a discussion of themechanism. Geography: latitude, longitude, caloric yield, soil type and crop productivity, province andarrondissement capital status, distance to Leuven, to large cities (defined in 1300), to the sea, and to rivers.All distances in log-km. Monasteries: presence of masculine, feminine and unknown monasteries. In addition,regressions control for total population, first and last years sampled. The specifications include arrondissementfixed-effects and decennial fixed-effects. Standard errors clustered at the arrondissement level in parenthesis.∗ p < 0.1, ∗∗ p < 0.05, ∗∗∗ p < 0.01.
are indicative of fewer marriages in towns closer to a beguinage, which is compatible with the
mechanism we propose.67
6 Conclusion
This paper proposes a novel mechanism to explain the differences in gender equality, grounded in
the strengthening of women’s bargaining power and enabled by the broadening of their alternatives
to marriage. We argue that such improved position in the marital decisions positively affected
women’s status, closing the gap with men’s outcomes. The intergenerational transmission of an
egalitarian view of gender roles generated persistence over time. Our theory on the deep roots
of female empowerment complements the existing economic literature that mainly emphasises
physiological differences.
The medieval beguinal movement provides the ideal setting to illustrate our mechanism of
broadened options for nubile girls. Beguines were single women, living a semi-religious life in
67Due to the limited sample, regressions employ arrondissement fixed-effects. Nonetheless, using the morerestrictive canton fixed-effects provides qualitatively similar results.
31
self-supporting communities, independently of men, and outside the recognised monastic orders.
These unique characteristics offered an alternative to monastic seclusion and the opportunity to
delay or forgo marriage amid a society that traditionally disapproved such lifestyle. Exploiting a
rich set of historical data, we provide robust evidence of a long-lasting cultural legacy: we show
that Belgian beguinages —founded between 1207 and 1500— were instrumental in generating
higher local levels of gender equality in 1866. In particular, we estimate a 12.3% reduction in
the gender literacy gap, our baseline measure of gender equality.
Our study elucidates the importance of a high opportunity cost of getting married for women
to lessen inequalities and promote the diffusion of gender egalitarian roles. Female associations
—as beguinages— are crucial in our setup: they provide an actionable threat if nuptial negotiation
turns unsuccessful, thus raising female’s bargaining power. Other social arrangements that can
equally promote gender equality are the traditions of uxorolocality and neolocality. The pivotal,
common element is the provision of a safety-net for women that de facto allows them a higher
claim on the marital surplus by reducing their fear for recrimination.
32
References
Abramitzky, R., Delavande, A., and Vasconcelos, L. (2011). Marrying Up: The Role of Sex Ratio
in Assortative Matching. American Economic Journal: Applied Economics, 3(3):124–157.
Akcomak, I. S., Webbink, D., and Weel, B. (2016). Why Did the Netherlands Develop So Early?
The Legacy of the Brethren of the Common Life. The Economic Journal, 593(126):821–860.
Alesina, A. and Giuliano, P. (2010). The power of the family. Journal of Economic Growth,
15(2):93–125.
Alesina, A., Giuliano, P., and Nunn, N. (2013). On the Origins of Gender Roles: Women and
the Plough. The Quarterly Journal of Economics, 128(2):469–530.
Andersen, T. B., Bentzen, J., Dalgaard, C.-J., and Sharp, P. (2017). Pre-reformation Roots of
the Protestant Ethic. The Economic Journal, 127(604):1756–1793.
Bairoch, P. (1988). Cities and economic development : from the dawn of history to the present.
University of Chicago Press, Chicago.
Becker, S. O., Boeckh, K., Hainz, C., and Woessmann, L. (2016). The Empire Is Dead, Long
Live the Empire! Long-Run Persistence of Trust and Corruption in the Bureaucracy. The
Economic Journal, 126(590):40–74.
Becker, S. O. and Woessmann, L. (2008). Luther and the Girls: Religious Denomination and the
Female Education Gap in Nineteenth-century Prussia. Scandinavian Journal of Economics,
110(4):777–805.
Berliere, U., editor (1955). Monasticon belge. Centre national de recherches d’histoire religieuse,
Liege.
Bertocchi, G. and Bozzano, M. (2015). Family structure and the education gender gap: Evidence
from italian provinces. CESifo Economic Studies, 61(1):263–300.
Bertocchi, G. and Bozzano, M. (2019). Origins and Implications of Family Structure across
Italian Provinces in Historical Perspective. In Cliometrics of the Family, pages 121–147.
Springer.
Bethune, J. (1883). Cartulaire du beguinage de Sainte-Elisabeth a Gand. De Zuttere.
Bisin, A. and Verdier, T. (2001). The Economics of Cultural Transmission and the Dynamics of
Preferences. Journal of Economic Theory, 97(2):298–319.
Bowie, F. (1990). Beguine Spirituality: Mystical Writings of Mechthild of Magdeburg, Beatrice
of Nazareth, and Hadewijch of Brabant. Crossroad.
Cage, J. and Rueda, V. (2016). The Long-Term Effects of the Printing Press in Sub-Saharan
33
Africa. American Economic Journal: Applied Economics, 8(3):69–99.
Carmichael, S. G., de Pleijt, A., van Zanden, J. L., and De Moor, T. (2016). The European
marriage pattern and its measurement. The Journal of Economic History, 76(01):196–204.
Carranza, E. (2014). Soil Endowments, Female Labor Force Participation, and the Demographic
Deficit of Women in India. American Economic Journal: Applied Economics, 6(4):197–225.
Colella, F., Lalive, R., Sakalli, S. O., and Thoenig, M. (2019). Inference with Arbitrary Clustering.
IZA Discussion Papers 12584, Institute of Labor Economics (IZA).
Costa, R. (2014). Richesses et limites du mouvement de la population et de l’etat civil pour
l’etude demographique des zones rurales en belgique. l’exemple de la nuptialite de 1886 a 1913.
Espace populations societes. Space populations societies, (2014/1).
Cottineau, L. H. (1939). Repertoire topo-bibliographique des abbayes et prieures. Protat freres,
Macon.
Cuvelier, J. (1912). Les denombrements de foyers en Brabant (XIVe-XVIe siecle). Table
onomastique. Kiessling, Bruxelles.
De Moor, T. (2014). Single, Safe, and Sorry? Explaining the Early Modern Beguine Movement
in the Low Countries. Journal of Family History, 39(1):3–21.
De Moor, T. and Van Zanden, J. L. (2010). Girl Power: the European Marriage Pattern and
Labour Markets in the North Sea Region in the Late Medieval and Early Modern Period. The
Economic History Review, 63(1):1–33.
Department of History, The Ohio State University (2016). Monastic Matrix. Accessed: 2017-02-
28.
Doepke, M. and Tertilt, M. (2009). Women’s Liberation: What’s in It for Men? Quarterly
Journal of Economics, 124(4):1541–1591.
European Environment Agency (2017). WISE Main Rivers, ECRINS - EEA hydrographic data
set. http://projects.eionet.europa.eu/ecrins/library/relation_ecrins/national_
reference/wise-main-rivers-v1-draft-april-2012. Accessed: 2017-02-27.
FAO/IIASA (2011). Global Agro-ecological Zones (GAEZ V3.0). gaez.fao.org. Accessed:
2017-10-24.
Fernandez, R. and Fogli, A. (2009). Culture: An Empirical Investigation of Beliefs, Work, and
Fertility. American Economic Journal: Macroeconomics, 1(1):146–177.
Fong, Y.-F., Guo, R., Ng, T., and Wong, K.-Y. (2018). Sworn Spinsters: An Economic Analysis
of Celibacy. Technical report, mimeo.
34
Fredericq, P. (1889). Corpus documentorum Inquisitionis haereticae pravitatis Neerlandicae;
verzameling van stukken betreffende de pauselijke en bisschoppelijke inquisitie in de Nederlanden.
Uitg. door Paul Fredericq [et al.]. Gent J. Vuylsteke.
Galor, O. and Ozak, Omer. (2016). The Agricultural Origins of Time Preference. American
Economic Review, 106(10):3064–3103.
Galor, O. and Weil, D. N. (1996). The Gender Gap, Fertility, and Growth. The American
Economic Review, 86(3):374–387.
Geybels, H. (2004). Vulgariter beghinae : eight centuries of Beguine history in the Low Countries.
Brepols, Turnhout.
Giuliano, P. (2018). Gender: An historical perspective. In Averett, S. L., Argys, L. M., and
Hoffman, S. D., editors, Oxford Handbook on the Economics of Women. Oxford University
Press.
Giuliano, P. and Nunn, N. (2020). Understanding Cultural Persistence and Change.
Gottlieb, J. and Robinson, A. L. (2016). The effects of matrilineality on gender differences in
political behavior across Africa. University of California, Berkeley, mimeo.
Grosjean, P. and Khattar, R. (2017). It’s raining men! Hallelujah? The long-run consequences
of male-biased sex ratios. The Review of Economic Studies.
Guiso, L., Sapienza, P., and Zingales, L. (2016). Long-Term Persistence. Journal of the European
Economic Association, 14(6):1401–1436.
Hansen, C. W., Jensen, P. S., and Skovsgaard, C. V. (2015). Modern gender roles and agricultural
history: the Neolithic inheritance. Journal of Economic Growth, 20(4):365–404.
Iyigun, M. and Walsh, R. P. (2007). Endogenous Gender Power, Household Labor Supply and
the Demographic Transition. Journal of Development Economics, 82(1):138–155.
Jayachandran, S. (2015). The Roots of Gender Inequality in Developing Countries. Annual
Review of Economics, 7(1):63–88.
Kelly, M. (2019). The Standard Errors of Persistence. CEPR Discussion Papers 13783, C.E.P.R.
Discussion Papers.
Lowes, S., Nunn, N., Robinson, J. A., and Weigel, J. L. (2017). The Evolution of Culture and
Institutions: Evidence From the Kuba Kingdom. Econometrica, 85(4):1065–1091.
Luu, L. B. (2005). Immigrants and the Industries of London, 1500-1700. Routledge.
Lynch, K. A. (2003). Individuals, Families, and Communities in Europe, 1200-1800: the urban
foundations of Western society, volume 37. Cambridge University Press.
35
McDonnell, E. W. (1954). The Beguines and Beghards in Medieval Culture: With Special
Emphasis on the Belgian Scene. Rutgers University Press.
Michel, E. (1923). Abbayes et monasteres de Belgique. G. Van Oest. Cie.
Mommaers, P. and Dutton, E. M. (2004). Hadewijch: Writer, Beguine, Love Mystic. Peeters
Publishers.
Oster, E. (2019). Unobservable selection and coefficient stability: Theory and evidence. Journal
of Business & Economic Statistics, 37(2):187–204.
Ruyskensvelde, S. V. (2016). Wartime Schooling and Education Policy in the Second World
War: Catholic Education, Memory and the Government in Occupied Belgium. Springer.
Shiode, N. and Shiode, S. (2011). Street-level Spatial Interpolation Using Network-based IDW
and Ordinary Kriging. Transactions in GIS, 15(4):457–477.
Simons, W. (2010). Cities of Ladies: Beguine Communities in the Medieval Low Countries,
1200-1565. University of Pennsylvania Press.
Tur-Prats, A. (2018). Family Types and Intimate-Partner Violence: A Historical Perspective.
The Review of Economics and Statistics.
Upadhyay, U. D., Gipson, J. D., Withers, M., Lewis, S., Ciaraldi, E. J., Fraser, A., Huchko,
M. J., and Prata, N. (2014). Women’s empowerment and fertility: A review of the literature.
Social Science & Medicine, 115:111–120.
Valencia Caicedo, F. (2018). The Mission: Human Capital Transmission, Economic Persistence,
and Culture in South America. The Quarterly Journal of Economics.
van Neck, A. (1979). Les debuts de la machine a vapeur dans l’industrie belge, 1800-1850. Palais
des Academies.
Vander Schelden, J. e. H., editor (1862). Requete presentee par les Grandes-dames et Superieures
des deux Beguinages a messieurs les President et membres du Conseil communal de Gand. J.
et H. Vander Schelden,, Gand.
Voigtlander, N. and Voth, H.-J. (2012). Persecution Perpetuated: The Medieval Origins of Anti-
Semitic Violence in Nazi Germany. The Quarterly Journal of Economics, 127(3):1339–1392.
Waldinger, M. (2017). The Long-run Effects of Missionary Orders in Mexico. Journal of
Development Economics, 127:355–378.
Warnkonig, L. A. (1836). Histoire de la Flandre et de ses institutions civiles et politiques jusqu’a
l’annee 1305. Hayer.
36
Appendices
A Analogous Institutions
Despite the fact that beguinages are indeed a phenomenon unique to the cities of the Low
Countries, in the recent past we can observe other large, female-only prime examples of lay
efforts to construct artificial families and communities within an urban setting (Lynch (2003)).
Nowadays, there exist other institutions resembling beguinal social customs: they are collective
arrangements formed by groups of women in order to overcome certain common problems by
setting rules regarding membership and the use of the resources and services the group owns
collectively. Another key feature is the adoption of de facto celibacy beyond apparent religious
concerns. In the following paragraphs we describe two suggestive illustrations of how encouraging
women to be independent and in a safe community might be conducive to a widespread culture
of gender equality.
One of these institutions is called Zishunu: an ancient custom that originated from indigenous
groups in southwestern China and consists of a group of women called Sworn Spinsters. Zishunu
literally means self-combed women and depicts the local customs of girls forming sisterhoods
who ritually pinned up their hair and openly took elaborate vows not to marry and to remain
childless. Evidence of such practices can be found in local publications and prospered well into
the end of the 19th century, when almost all of them worked in silk reeling factories and, from the
1930s, as domestic servants in Hong Kong and Singapore. Their vow of celibacy seems unrelated
to religious motives and rather represents a commitment device of high-intensity labour supply.
This signalling device made their employers invest more in their human capital and match them
to more important working positions (Fong et al. (2018)).
The second instance is the one of women seeking the solidarity and protection of other
women to escape misogynistic marriages. This is the case of a community in Tanzania that has
embraced an age-old tradition of heterosexual women marrying women. In fact, in the Kurya
community in Tarime District of the Mara region in northern Tanzania, the so-called Nyumba
Nthobu tribal law is used by women who are not able to inherit property due to patriarchal
cultural constraints.68 In some cases, Nyumba Ntobhu can be a polygamous marriage, as the
older woman marries two younger women. This custom enables them to claim the children born
68For instance, barren and old women who do not have sons to inherit their property. This holds also for thewomen whose daughters have moved away to their husbands’ villages: the latter cannot take over property in theline of succession.
37
by the other woman as their own69 and is a way of providing security for their old age. Finally,
this custom is also used as an escape for child marriage, female genital mutilation, and domestic
violence. Even in this circumstance, the marriage between the two women is justified by the
bride price paid before marriage, since there is no intimate relationship between the two women.
B Modern Day Outcomes
This section extends the temporal dimension of the main analysis up to the present day using
two alternative sets of outcomes: women’s representation in local politics (for 2019) and divorces
(for 1974).70 The first outcome reflects local attitudes towards female agency —local residents
elect the composition of the town hall— while the second indicates women’s individual exercise
of their autonomy as they decide on marital continuation.
Political Representation.71 Gender quotas targeting elected political office were first
adopted in 1994 and applied at the occasion of the 1994 European and local elections. The
law stipulated that electoral lists must not comprise more than 67% of candidates of the same
sex.72 In 2002, new gender-quotas acts were adopted, compelling parties to put forward an equal
number of female and male candidates, including among the top two positions of each list. Since
then, the organisation of local and provincial elections fell under the remit of the regions. They
all adopted similar measures (with the Flemish government imposing but one of the first three
positions of the list to go to the under-represented sex until 2012).73
The introduction of the aforementioned quotas prevents analysing female representativeness
in municipal councils. However, it is still possible to relate the presence of beguine communities
to the election of a female mayor: the mayor typically occupies the top position of the most-voted
electoral party. Therefore, the gender of the mayor retains information on local preferences
towards women. In particular, political competition pushes parties to elect the most viable
69A man is typically selected from the clan of the old woman for reproduction purposes with the young one.70Other outcomes were taken into consideration but offer more nuanced interpretations: the share of female
graduates in the population invalidates the relationship between the presence of beguine communities on theterritory and female agency, as students tend to move out of their town of origin to pursue tertiary education.Similarly, the local presence of female associations has be discarded, as most entities are headquartered in Brusselsand few other large cities.
71Before turning to the analysis, it is important to highlight that between 1866 and today, Belgium hasunderwent a process of administrative simplification at the local level. This has reduced the total number ofmunicipalities through mergers and fusions. Consequently, the number of observations drops to about 581 for theyear 2019.
72Actually 75%, a temporary quotas set for the first elections after the adoption of the law; from 1999 onwardthe 67% quotas was applicable. In the event of non-compliance, the authorities would not accept the list.
73By 2018, municipal electoral ballots in Wallonia and Brussels-Capital regions had to alternate men andwomen. The data we analyse predates this reform, though.
38

candidate to run for mayor and are, thus, unlikely to present a women in municipalities where
gender equality is lower. Finally, the choice over a mayor indicates the preferences of the local
population and their view of the value of women as political leaders.
We use information on the mayors serving in 2019 to infer the long-run effect of beguinages
on gender equality in politics. Mayors active in 2019 came to power after the 2018 municipal
elections. The sorting of political lists and the outcome of the elections also hinges on several
local-level characteristics we control for. These are the number of running electoral lists and
the number of seats to be distributed to account for political competition; log-area and capital
status74 to control for the importance and salience of a town; and the share of votes to each
political party representing electoral preferences at the town level. Further, all regressions
feature demographic controls: population and unemployment and activity rates. Finally, as in
the baseline regressions, we control for latitude, longitude and for the presence of masculine and
feminine monasteries. All regressions include arrondissement fixed-effect.
Table B.1 presents, in Column 1), the long-run effect of beguine communities on gender
equality, when we measure it by the election of women as mayors. This specification suggests
a rather long-lasting effect of beguine communities: municipalities that had a beguinage are
10 percentage points more likely to elect a women as mayor, although the association is only
relevant at the 10% level. Compared to a baseline of 15.6%, the increase is substantial.75
Divorces. A second dimension that reflects women’s agency is their willingness and ability
to exit a marriage. Starting in 1974, Belgium reformed its divorce law and included the possibility
to file for unilateral divorce. We have gathered data from the Belgian archived inventories
of “Mouvement de la Population” for the year 1974. Crucially, this year predates Michel’s
town merging plan which reduced the number of Belgian towns from 2359 to 596, allowing us
to retain the sample we used throughout the paper. The record lists the number of divorce
filings during the year, and distinguishes between those initiated by the husband, the wife, and
the cases were both partners sought to terminate their marriage. Following from our previous
results and considering that beguinages contributed to female agency, the number of wives
divorcing unilaterally as soon as this is lawful can be considered a signal of the female autonomy.
Furthermore, we use the information on male-initiated divorces as a placebo test.
Columns 2) and 3) of Table B.1 presents the results for this exercise, focusing on wife- and
74Capital status refers to a town being the capital of a province, district or region.75Further adding controls for the aggregate educational achievement at the town levels provides similar results.
39
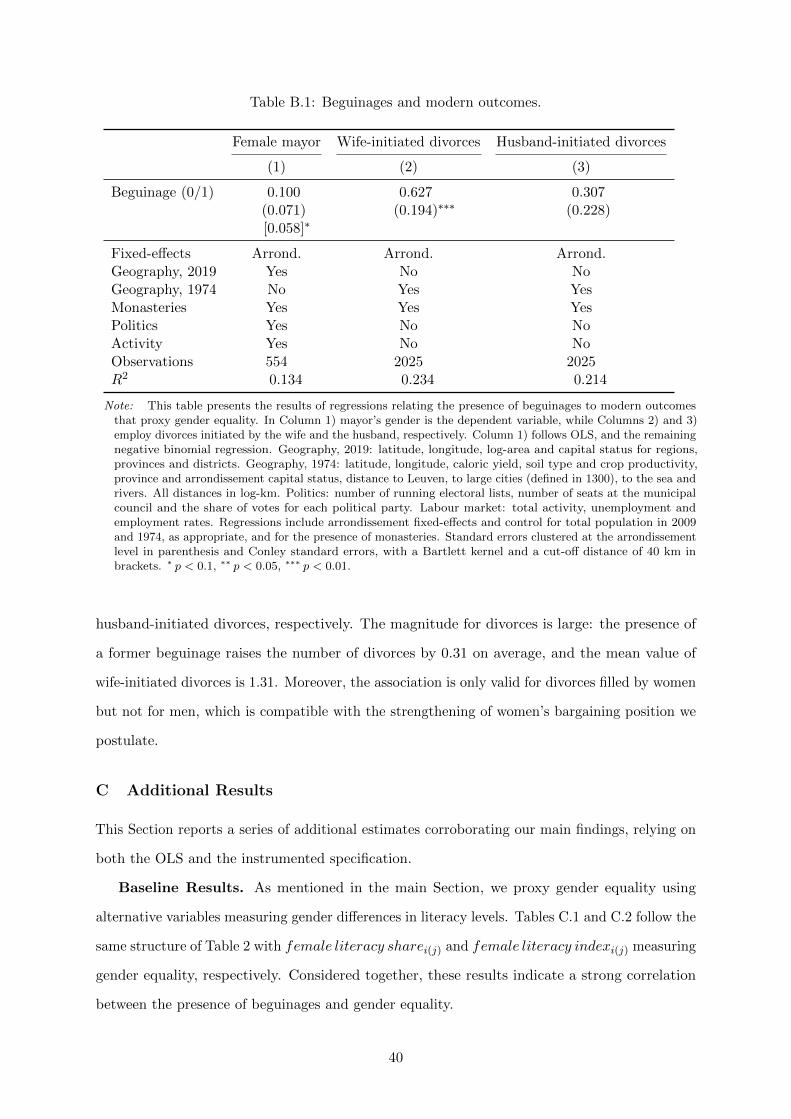
Table B.1: Beguinages and modern outcomes.
Female mayor Wife-initiated divorces Husband-initiated divorces
(1) (2) (3)
Beguinage (0/1) 0.100 0.627 0.307(0.071) (0.194)∗∗∗ (0.228)[0.058]∗
Fixed-effects Arrond. Arrond. Arrond.Geography, 2019 Yes No NoGeography, 1974 No Yes YesMonasteries Yes Yes YesPolitics Yes No NoActivity Yes No NoObservations 554 2025 2025R2 0.134 0.234 0.214
Note: This table presents the results of regressions relating the presence of beguinages to modern outcomesthat proxy gender equality. In Column 1) mayor’s gender is the dependent variable, while Columns 2) and 3)employ divorces initiated by the wife and the husband, respectively. Column 1) follows OLS, and the remainingnegative binomial regression. Geography, 2019: latitude, longitude, log-area and capital status for regions,provinces and districts. Geography, 1974: latitude, longitude, caloric yield, soil type and crop productivity,province and arrondissement capital status, distance to Leuven, to large cities (defined in 1300), to the sea andrivers. All distances in log-km. Politics: number of running electoral lists, number of seats at the municipalcouncil and the share of votes for each political party. Labour market: total activity, unemployment andemployment rates. Regressions include arrondissement fixed-effects and control for total population in 2009and 1974, as appropriate, and for the presence of monasteries. Standard errors clustered at the arrondissementlevel in parenthesis and Conley standard errors, with a Bartlett kernel and a cut-off distance of 40 km inbrackets. ∗ p < 0.1, ∗∗ p < 0.05, ∗∗∗ p < 0.01.
husband-initiated divorces, respectively. The magnitude for divorces is large: the presence of
a former beguinage raises the number of divorces by 0.31 on average, and the mean value of
wife-initiated divorces is 1.31. Moreover, the association is only valid for divorces filled by women
but not for men, which is compatible with the strengthening of women’s bargaining position we
postulate.
C Additional Results
This Section reports a series of additional estimates corroborating our main findings, relying on
both the OLS and the instrumented specification.
Baseline Results. As mentioned in the main Section, we proxy gender equality using
alternative variables measuring gender differences in literacy levels. Tables C.1 and C.2 follow the
same structure of Table 2 with female literacy sharei(j) and female literacy indexi(j) measuring
gender equality, respectively. Considered together, these results indicate a strong correlation
between the presence of beguinages and gender equality.
40

Tab
leC
.1:
Beg
uin
ages
and
lite
racy
equ
alit
y;
fem
.li
tera
cysh
are.
Dep
.va
riab
le:
Fem
ale
lit.
shar
e,18
66
Bas
elin
eF
ixed
-eff
ects
Geo
grap
hy
Mon
aste
ries
(1)
(2)
(3)
(4)
(5)
(6)
(7)
(8)
Beg
uin
age
(0/1
)0.0
41
0.04
30.
031
0.02
8(0.0
04)∗∗∗
(0.0
05)∗∗∗
(0.0
06)∗∗∗
(0.0
06)∗∗∗
[0.0
05]∗∗∗
[0.0
05]∗∗∗
[0.0
07]∗∗∗
[0.0
07]∗∗∗
Exp
osu
re(c
entu
ries
)0.0
060.
006
0.00
40.
003
(0.0
01)∗∗∗
(0.0
01)∗∗∗
(0.0
01)∗∗∗
(0.0
01)∗∗
[0.0
01]∗∗∗
[0.0
01]∗∗∗
[0.0
02]∗∗
[0.0
02]∗
Fix
ed-e
ffec
tsN
oN
oC
anto
nC
anto
nC
anto
nC
anto
nC
anto
nC
anto
nG
eogr
aphy
No
No
No
No
Yes
Yes
Yes
Yes
Mon
aste
ries
No
No
No
No
No
No
Yes
Yes
Ob
serv
ati
on
s254
925
4925
4925
4924
4724
4724
4724
47R
20.0
25
0.02
40.
204
0.20
10.
231
0.22
60.
234
0.22
9
No
te:
Th
ista
ble
pre
sents
the
resu
lts
of
OL
Sre
gre
ssio
ns
rela
tin
gth
ep
rese
nce
of
beg
uin
ages
toin
crea
sed
gen
der
equ
ali
typ
roxie
dby
the
vari
ab
lefem
aleliteracyshare
i(j),
see
main
text
for
ad
escr
ipti
on
.C
olu
mn
s1)
an
d2)
incl
ude
on
lyth
ep
rese
nce
of
beg
uin
ages
as
are
gre
ssor.
Colu
mn
s3)
an
d4)
ad
dfi
xed
-eff
ects
at
the
canto
nle
vel
.In
Colu
mn
s5)
an
d6)
exogen
ou
sva
riab
les
are
inco
rpora
ted
,n
am
ely,
lati
tud
e,lo
ngit
ud
e,d
ista
nce
toL
euven
,to
larg
eci
ties
(defi
ned
in1300),
toth
ese
aan
dri
ver
s,ca
lori
cyie
ld,
soil
typ
ean
dcr
op
pro
duct
ivit
y,pro
vin
cean
darr
on
dis
sem
ent
cap
ital
statu
s.A
lld
ista
nce
sin
log-k
m.
Colu
mn
s7)
an
d8)
furt
her
contr
ol
for
the
pre
sen
ceof
mon
ast
erie
s:m
asc
uli
ne,
fem
inin
ean
du
nkn
own
.F
rom
Colu
mn
5)
onw
ard
,w
ealw
ays
contr
ol
for
tota
lp
op
ula
tion
in1866.
Sta
ndard
erro
rscl
ust
ered
at
the
canto
nle
vel
inp
are
nth
esis
an
dC
onle
yst
andard
erro
rs,
wit
ha
Bart
lett
ker
nel
and
acu
t-off
dis
tance
of
40
km
inbra
cket
s.∗p<
0.1
,∗∗p<
0.0
5,∗∗
∗p<
0.0
1.
41

Tab
leC
.2:
Beg
uin
ages
and
lite
racy
equ
alit
y;
fem
.li
tera
cyin
dex
.
Dep
.va
riab
le:
Fem
ale
lit.
ind
ex,
1866
Bas
elin
eF
ixed
-eff
ects
Geo
grap
hy
Mon
aste
ries
(1)
(2)
(3)
(4)
(5)
(6)
(7)
(8)
Beg
uin
age
(0/1
)0.0
55
0.06
10.
053
0.04
7(0.0
11)∗∗∗
(0.0
12)∗∗∗
(0.0
15)∗∗∗
(0.0
14)∗∗∗
[0.0
12]∗∗∗
[0.0
14]∗∗∗
[0.0
18]∗∗∗
[0.0
17]∗∗∗
Exp
osu
re(c
entu
ries
)0.0
080.
007
0.00
70.
006
(0.0
02)∗∗∗
(0.0
02)∗∗∗
(0.0
03)∗∗
(0.0
03)∗
[0.0
02]∗∗∗
[0.0
02]∗∗∗
[0.0
04]∗
[0.0
04]
Fix
ed-e
ffec
tsN
oN
oC
anto
nC
anto
nC
anto
nC
anto
nC
anto
nC
anto
nG
eogr
aphy
No
No
No
No
Yes
Yes
Yes
Yes
Mon
aste
ries
No
No
No
No
No
No
Yes
Yes
Ob
serv
ati
on
s254
925
4925
4925
4924
4724
4724
4724
47R
20.0
05
0.00
50.
205
0.20
30.
223
0.22
10.
226
0.22
5
No
te:
Th
ista
ble
pre
sents
the
resu
lts
of
OL
Sre
gre
ssio
ns
rela
tin
gth
ep
rese
nce
of
beg
uin
ages
toin
crea
sed
gen
der
equ
ali
typ
roxie
dby
the
vari
ab
lean
dfem
aleliteracyindex
i(j),
see
main
text
for
ad
escr
ipti
on
.C
olu
mn
s1)
an
d2)
incl
ude
on
lyth
ep
rese
nce
of
beg
uin
ages
as
are
gre
ssor.
Colu
mn
s3)
an
d4)
ad
dfi
xed
-eff
ects
at
the
canto
nle
vel
.In
Colu
mn
s5)
an
d6)
exogen
ou
sva
riab
les
are
inco
rpora
ted
,n
am
ely,
lati
tud
e,lo
ngit
ud
e,d
ista
nce
toL
euven
,to
larg
eci
ties
(defi
ned
in1300),
toth
ese
aan
dri
ver
s,ca
lori
cyie
ld,
soil
typ
ean
dcr
op
pro
duct
ivit
y,pro
vin
cean
darr
on
dis
sem
ent
cap
ital
statu
s.A
lld
ista
nce
sin
log-k
m.
Colu
mn
s7)
an
d8)
furt
her
contr
ol
for
the
pre
sen
ceof
mon
ast
erie
s:m
asc
uli
ne,
fem
inin
ean
du
nkn
own
.F
rom
Colu
mn
5)
onw
ard
,w
ealw
ays
contr
ol
for
tota
lp
op
ula
tion
in1866.
Sta
ndard
erro
rscl
ust
ered
at
the
canto
nle
vel
inp
are
nth
esis
an
dC
onle
yst
andard
erro
rs,
wit
ha
Bart
lett
ker
nel
and
acu
t-off
dis
tance
of
40
km
inbra
cket
s.∗p<
0.1
,∗∗p<
0.0
5,∗∗
∗p<
0.0
1.
42

The baseline results also extend to the next census, carried out in 1880, although the results
are weaker, as Table C.3 indicates. Part of the decrease in the explanatory power of beguinages
may be due to education becoming free in 1842: as more children benefited from it and older
generations died, we expect a greater average impact on the overall population subjected to the
census of 1880.
Table C.4 introduces in Column 1) a new independent variable, intensityi(j) that combines
features of beguinagei(j) and exposurei(j). This variable consists of a five-level index formally
defined as follows:
Intensityi(j) =
0 if no beguinage has even been recorded,
1 if 1 beguinage has been present and exposurei(j) < 200,
2 if 1 beguinage has been present and exposurei(j) ≥ 200,
3 if more than 1 beguinage has been present and exposurei(j) ≥ 200,
4 if more than 3 beguinages have been present and exposurei(j) ≥ 200.
(7)
The results suggest a positive association between the presence of beguinages and gender equality,
in line with our previous estimates. Moreover, the effect of beguine communities is larger for
intermediate levels of beguinage presence. Column 2) of Table C.4 proposes a modified version
of the variable exposurei(j). This alternative specification considers the total number of years
during which any beguine community was present it a municipality, but does not aggregate the
values for those overlapping in time. Taken together, using alternative outcomes and independent
variables gives more credence to the association between female-only communities and gender
equality.
In addition, since few municipalities had an operating beguinage in 1886, Panel A) of Table
C.5 disentangles its effects from the cultural legacy lingering from dismantled communities. We
do so by excluding from the sample municipalities that had an operating beguinage in 1866.
This removes 10 municipalities from the baseline sample.76 Results indicate that the cultural
imprint left by beguine communities shaped the perception of women. In general, these results
are indistinguishable from the main specification.
In Panel B), municipal charters, the instrument used in IV regressions, are included as
76The municipalities that had an ongoing beguinage in 1866 are, with the closing year between brackets: Aalst(1953), Diksmuide (1914), Hasselt (1886), Herenthals (2001),Hoogstraten (1972), Lier (1970), Momalle (1899),Nieuwpoort (1914) and Turnhout (1994).
43
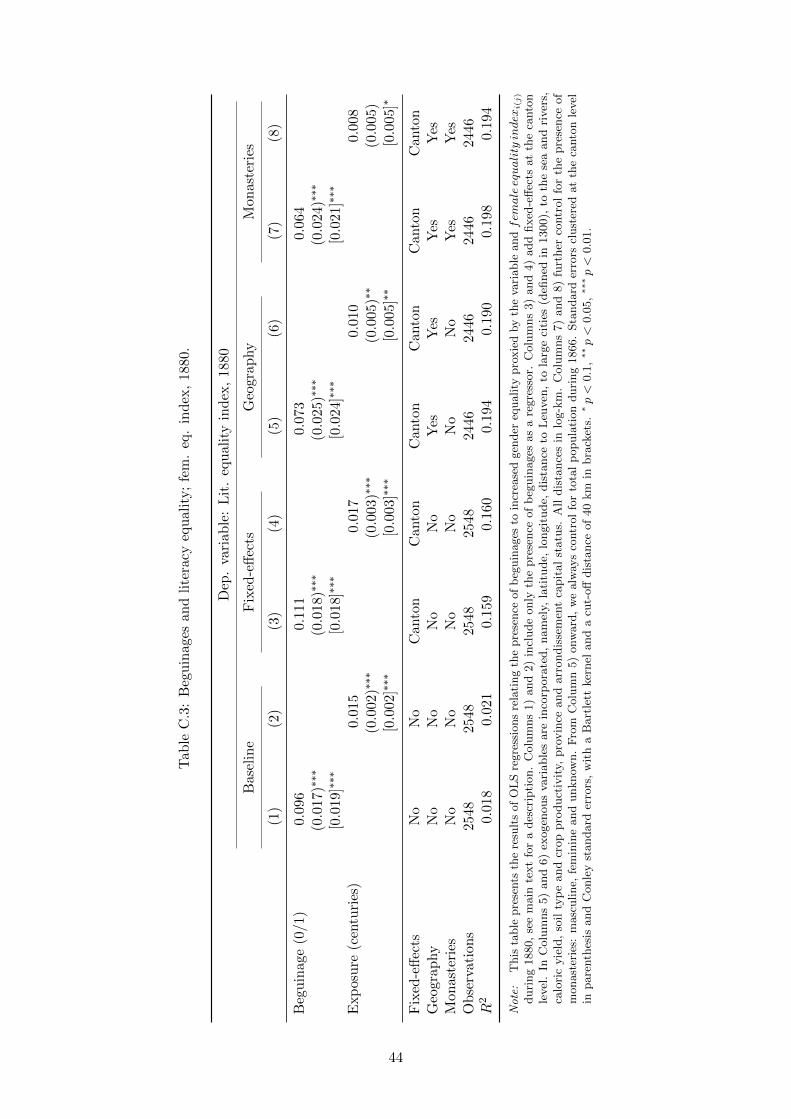
Tab
leC
.3:
Beg
uin
ages
and
lite
racy
equ
alit
y;
fem
.eq
.in
dex
,18
80.
Dep
.va
riab
le:
Lit
.eq
ual
ity
ind
ex,
1880
Bas
elin
eF
ixed
-eff
ects
Geo
grap
hy
Mon
aste
ries
(1)
(2)
(3)
(4)
(5)
(6)
(7)
(8)
Beg
uin
age
(0/1
)0.0
96
0.11
10.
073
0.06
4(0.0
17)∗∗∗
(0.0
18)∗∗∗
(0.0
25)∗∗∗
(0.0
24)∗∗∗
[0.0
19]∗∗∗
[0.0
18]∗∗∗
[0.0
24]∗∗∗
[0.0
21]∗∗∗
Exp
osu
re(c
entu
ries
)0.0
150.
017
0.01
00.
008
(0.0
02)∗∗∗
(0.0
03)∗∗∗
(0.0
05)∗∗
(0.0
05)
[0.0
02]∗∗∗
[0.0
03]∗∗∗
[0.0
05]∗∗
[0.0
05]∗
Fix
ed-e
ffec
tsN
oN
oC
anto
nC
anto
nC
anto
nC
anto
nC
anto
nC
anto
nG
eogr
aphy
No
No
No
No
Yes
Yes
Yes
Yes
Mon
aste
ries
No
No
No
No
No
No
Yes
Yes
Ob
serv
ati
on
s254
825
4825
4825
4824
4624
4624
4624
46R
20.0
18
0.02
10.
159
0.16
00.
194
0.19
00.
198
0.19
4
No
te:
Th
ista
ble
pre
sents
the
resu
lts
of
OL
Sre
gre
ssio
ns
rela
tin
gth
ep
rese
nce
of
beg
uin
ages
toin
crea
sed
gen
der
equ
ali
typ
roxie
dby
the
vari
ab
lean
dfem
aleequalityindex
i(j)
du
rin
g1880,
see
main
text
for
ad
escr
ipti
on
.C
olu
mn
s1)
an
d2)
incl
ud
eon
lyth
ep
rese
nce
of
beg
uin
ages
as
are
gre
ssor.
Colu
mn
s3)
an
d4)
ad
dfi
xed
-eff
ects
at
the
canto
nle
vel
.In
Colu
mns
5)
and
6)
exogen
ous
vari
able
sare
inco
rpora
ted,
nam
ely,
lati
tude,
longit
ude,
dis
tance
toL
euven
,to
larg
eci
ties
(defi
ned
in1300),
toth
ese
aand
river
s,ca
lori
cyie
ld,
soil
typ
eand
crop
pro
duct
ivit
y,pro
vin
ceand
arr
ondis
sem
ent
capit
al
statu
s.A
lldis
tance
sin
log-k
m.
Colu
mns
7)
and
8)
furt
her
contr
ol
for
the
pre
sence
of
mon
ast
erie
s:m
asc
uli
ne,
fem
inin
ean
du
nkn
own
.F
rom
Colu
mn
5)
onw
ard
,w
ealw
ays
contr
ol
for
tota
lp
op
ula
tion
du
rin
g1866.
Sta
nd
ard
erro
rscl
ust
ered
at
the
canto
nle
vel
inpare
nth
esis
and
Conle
yst
andard
erro
rs,
wit
ha
Bart
lett
ker
nel
and
acu
t-off
dis
tance
of
40
km
inbra
cket
s.∗p<
0.1
,∗∗p<
0.0
5,∗∗
∗p<
0.0
1.
44
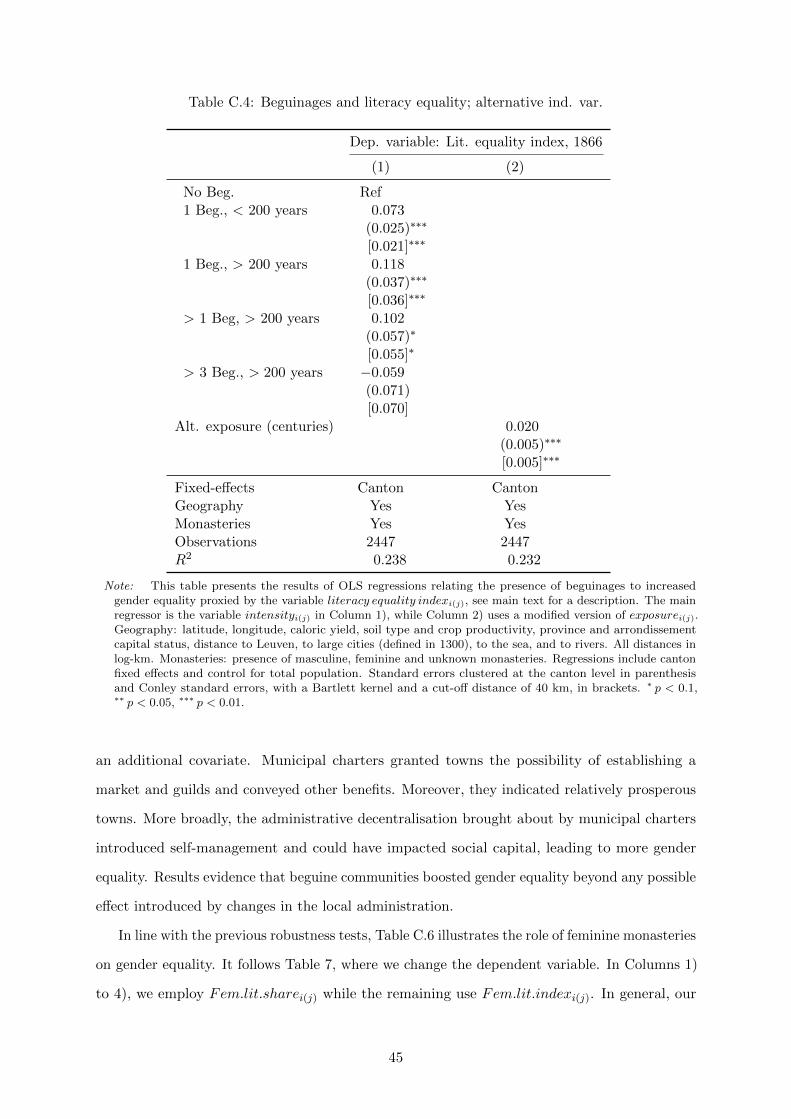
Table C.4: Beguinages and literacy equality; alternative ind. var.
Dep. variable: Lit. equality index, 1866
(1) (2)
No Beg. Ref1 Beg., < 200 years 0.073
(0.025)∗∗∗
[0.021]∗∗∗
1 Beg., > 200 years 0.118(0.037)∗∗∗
[0.036]∗∗∗
> 1 Beg, > 200 years 0.102(0.057)∗
[0.055]∗
> 3 Beg., > 200 years −0.059(0.071)[0.070]
Alt. exposure (centuries) 0.020(0.005)∗∗∗
[0.005]∗∗∗
Fixed-effects Canton CantonGeography Yes YesMonasteries Yes YesObservations 2447 2447R2 0.238 0.232
Note: This table presents the results of OLS regressions relating the presence of beguinages to increasedgender equality proxied by the variable literacy equality indexi(j), see main text for a description. The mainregressor is the variable intensityi(j) in Column 1), while Column 2) uses a modified version of exposurei(j).Geography: latitude, longitude, caloric yield, soil type and crop productivity, province and arrondissementcapital status, distance to Leuven, to large cities (defined in 1300), to the sea, and to rivers. All distances inlog-km. Monasteries: presence of masculine, feminine and unknown monasteries. Regressions include cantonfixed effects and control for total population. Standard errors clustered at the canton level in parenthesisand Conley standard errors, with a Bartlett kernel and a cut-off distance of 40 km, in brackets. ∗ p < 0.1,∗∗ p < 0.05, ∗∗∗ p < 0.01.
an additional covariate. Municipal charters granted towns the possibility of establishing a
market and guilds and conveyed other benefits. Moreover, they indicated relatively prosperous
towns. More broadly, the administrative decentralisation brought about by municipal charters
introduced self-management and could have impacted social capital, leading to more gender
equality. Results evidence that beguine communities boosted gender equality beyond any possible
effect introduced by changes in the local administration.
In line with the previous robustness tests, Table C.6 illustrates the role of feminine monasteries
on gender equality. It follows Table 7, where we change the dependent variable. In Columns 1)
to 4), we employ Fem.lit.sharei(j) while the remaining use Fem.lit.indexi(j). In general, our
45
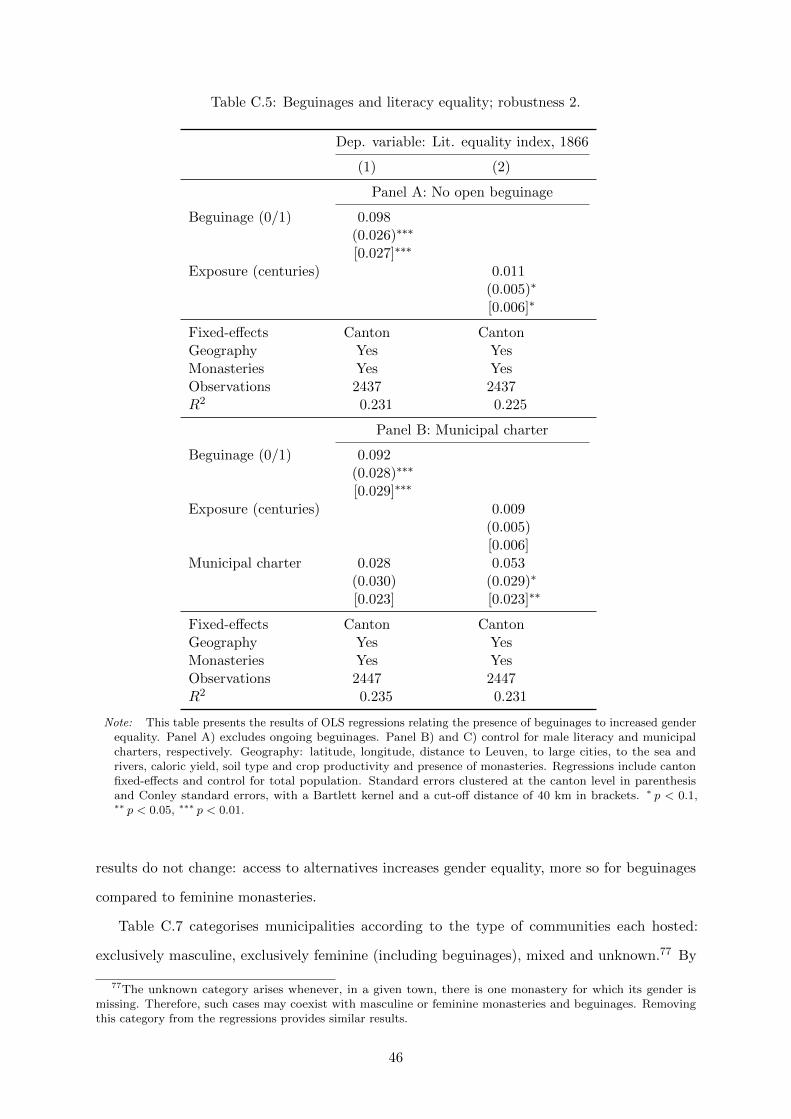
Table C.5: Beguinages and literacy equality; robustness 2.
Dep. variable: Lit. equality index, 1866
(1) (2)
Panel A: No open beguinage
Beguinage (0/1) 0.098(0.026)∗∗∗
[0.027]∗∗∗
Exposure (centuries) 0.011(0.005)∗
[0.006]∗
Fixed-effects Canton CantonGeography Yes YesMonasteries Yes YesObservations 2437 2437R2 0.231 0.225
Panel B: Municipal charter
Beguinage (0/1) 0.092(0.028)∗∗∗
[0.029]∗∗∗
Exposure (centuries) 0.009(0.005)[0.006]
Municipal charter 0.028 0.053(0.030) (0.029)∗
[0.023] [0.023]∗∗
Fixed-effects Canton CantonGeography Yes YesMonasteries Yes YesObservations 2447 2447R2 0.235 0.231
Note: This table presents the results of OLS regressions relating the presence of beguinages to increased genderequality. Panel A) excludes ongoing beguinages. Panel B) and C) control for male literacy and municipalcharters, respectively. Geography: latitude, longitude, distance to Leuven, to large cities, to the sea andrivers, caloric yield, soil type and crop productivity and presence of monasteries. Regressions include cantonfixed-effects and control for total population. Standard errors clustered at the canton level in parenthesisand Conley standard errors, with a Bartlett kernel and a cut-off distance of 40 km in brackets. ∗ p < 0.1,∗∗ p < 0.05, ∗∗∗ p < 0.01.
results do not change: access to alternatives increases gender equality, more so for beguinages
compared to feminine monasteries.
Table C.7 categorises municipalities according to the type of communities each hosted:
exclusively masculine, exclusively feminine (including beguinages), mixed and unknown.77 By
77The unknown category arises whenever, in a given town, there is one monastery for which its gender ismissing. Therefore, such cases may coexist with masculine or feminine monasteries and beguinages. Removingthis category from the regressions provides similar results.
46
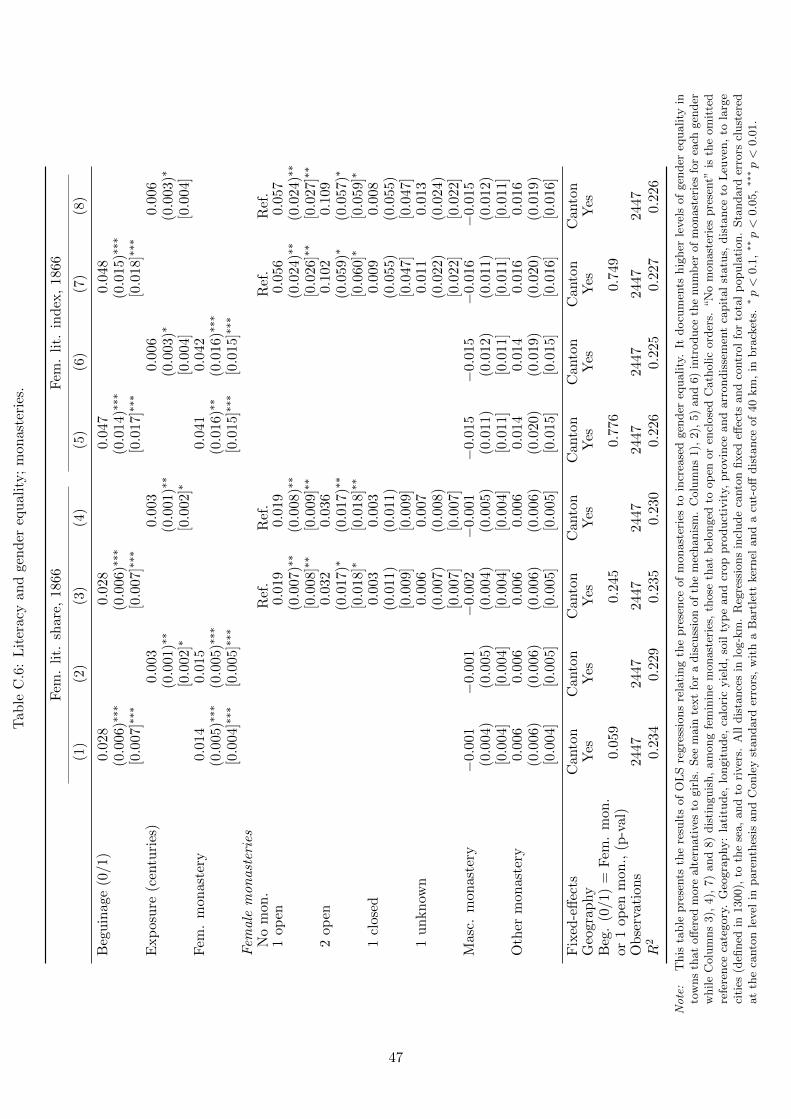
Tab
leC
.6:
Lit
erac
yan
dge
nd
ereq
ual
ity;
mon
aste
ries
.
Fem
.li
t.sh
are,
1866
Fem
.li
t.in
dex
,18
66
(1)
(2)
(3)
(4)
(5)
(6)
(7)
(8)
Beg
uin
age
(0/1)
0.0
280.
028
0.04
70.
048
(0.0
06)∗∗∗
(0.0
06)∗∗∗
(0.0
14)∗∗∗
(0.0
15)∗∗∗
[0.0
07]∗∗∗
[0.0
07]∗∗∗
[0.0
17]∗∗∗
[0.0
18]∗∗∗
Exp
osu
re(c
entu
ries
)0.
003
0.00
30.
006
0.00
6(0.0
01)∗∗
(0.0
01)∗∗
(0.0
03)∗
(0.0
03)∗
[0.0
02]∗
[0.0
02]∗
[0.0
04]
[0.0
04]
Fem
.m
onas
tery
0.01
40.
015
0.0
410.
042
(0.0
05)∗∗∗
(0.0
05)∗∗∗
(0.0
16)∗∗
(0.0
16)∗∗∗
[0.0
04]∗∗∗
[0.0
05]∗∗∗
[0.0
15]∗∗∗
[0.0
15]∗∗∗
Fem
ale
mon
ast
erie
sN
om
on
.R
ef.
Ref
.R
ef.
Ref
.1
op
en0.
019
0.01
90.0
560.
057
(0.0
07)∗∗
(0.0
08)∗∗
(0.0
24)∗∗
(0.0
24)∗∗
[0.0
08]∗∗
[0.0
09]∗∗
[0.0
26]∗∗
[0.0
27]∗∗
2op
en0.
032
0.03
60.1
020.
109
(0.0
17)∗
(0.0
17)∗∗
(0.0
59)∗
(0.0
57)∗
[0.0
18]∗
[0.0
18]∗∗
[0.0
60]∗
[0.0
59]∗
1cl
ose
d0.
003
0.00
30.0
090.
008
(0.0
11)
(0.0
11)
(0.0
55)
(0.0
55)
[0.0
09]
[0.0
09]
[0.0
47]
[0.0
47]
1u
nkn
own
0.00
60.
007
0.0
110.
013
(0.0
07)
(0.0
08)
(0.0
22)
(0.0
24)
[0.0
07]
[0.0
07]
[0.0
22]
[0.0
22]
Mas
c.m
onas
tery
−0.
001
−0.
001
−0.
002
−0.
001
−0.0
15−
0.0
15−
0.0
16−
0.0
15(0.0
04)
(0.0
05)
(0.0
04)
(0.0
05)
(0.0
11)
(0.0
12)
(0.0
11)
(0.0
12)
[0.0
04]
[0.0
04]
[0.0
04]
[0.0
04]
[0.0
11]
[0.0
11]
[0.0
11]
[0.0
11]
Oth
erm
onas
tery
0.00
60.
006
0.00
60.
006
0.01
40.
014
0.01
60.
016
(0.0
06)
(0.0
06)
(0.0
06)
(0.0
06)
(0.0
20)
(0.0
19)
(0.0
20)
(0.0
19)
[0.0
04]
[0.0
05]
[0.0
05]
[0.0
05]
[0.0
15]
[0.0
15]
[0.0
16]
[0.0
16]
Fix
ed-e
ffec
tsC
anto
nC
anto
nC
anto
nC
anto
nC
anto
nC
anto
nC
anto
nC
anto
nG
eogra
phy
Yes
Yes
Yes
Yes
Yes
Yes
Yes
Yes
Beg
.(0
/1)
=F
em.
mon
.or
1op
enm
on.,
(p-v
al)
0.059
0.24
50.
776
0.74
9
Ob
serv
ati
on
s244
724
4724
4724
4724
4724
4724
4724
47R
20.
234
0.22
90.
235
0.23
00.
226
0.22
50.
227
0.22
6
No
te:
Th
ista
ble
pre
sents
the
resu
lts
of
OL
Sre
gre
ssio
ns
rela
tin
gth
ep
rese
nce
of
mon
ast
erie
sto
incr
ease
dgen
der
equ
ali
ty.
Itd
ocu
men
tsh
igh
erle
vel
sof
gen
der
equ
ali
tyin
tow
ns
that
off
ered
more
alt
ern
ati
ves
togir
ls.
See
main
text
for
ad
iscu
ssio
nof
the
mec
han
ism
.C
olu
mn
s1),
2),
5)
an
d6)
intr
od
uce
the
nu
mb
erof
mon
ast
erie
sfo
rea
chgen
der
while
Colu
mns
3),
4),
7)
and
8)
dis
tinguis
h,
am
ong
fem
inin
em
onast
erie
s,th
ose
that
bel
onged
toop
enor
encl
ose
dC
ath
olic
ord
ers.
“N
om
onast
erie
spre
sent”
isth
eom
itte
dre
fere
nce
cate
gory
.G
eogra
phy:
lati
tude,
longit
ude,
calo
ric
yie
ld,
soil
typ
eand
crop
pro
duct
ivit
y,pro
vin
ceand
arr
ondis
sem
ent
capit
al
statu
s,dis
tance
toL
euven
,to
larg
eci
ties
(defi
ned
in1300),
toth
ese
a,
an
dto
river
s.A
lld
ista
nce
sin
log-k
m.
Reg
ress
ion
sin
clu
de
canto
nfi
xed
effec
tsan
dco
ntr
ol
for
tota
lp
op
ula
tion
.S
tan
dard
erro
rscl
ust
ered
at
the
canto
nle
vel
inpare
nth
esis
and
Conle
yst
andard
erro
rs,
wit
ha
Bart
lett
ker
nel
and
acu
t-off
dis
tance
of
40
km
,in
bra
cket
s.∗p<
0.1
,∗∗p<
0.0
5,∗∗
∗p<
0.0
1.
47
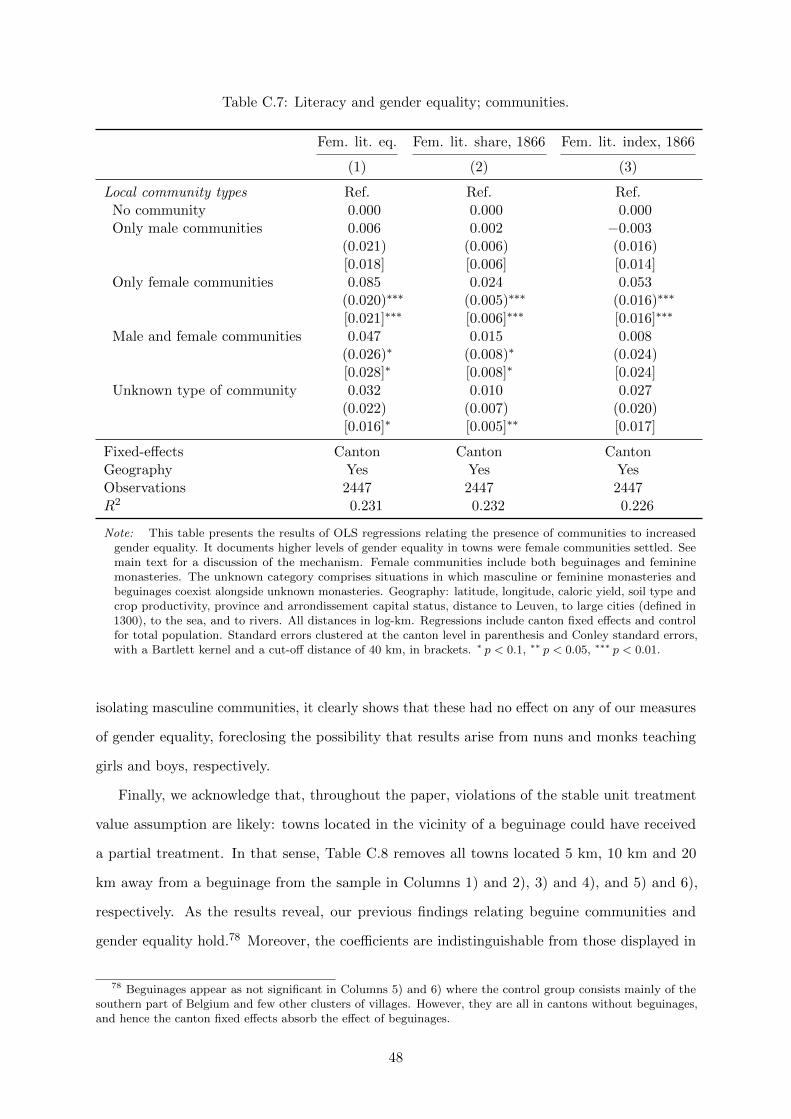
Table C.7: Literacy and gender equality; communities.
Fem. lit. eq. Fem. lit. share, 1866 Fem. lit. index, 1866
(1) (2) (3)
Local community types Ref. Ref. Ref.No community 0.000 0.000 0.000Only male communities 0.006 0.002 −0.003
(0.021) (0.006) (0.016)[0.018] [0.006] [0.014]
Only female communities 0.085 0.024 0.053(0.020)∗∗∗ (0.005)∗∗∗ (0.016)∗∗∗
[0.021]∗∗∗ [0.006]∗∗∗ [0.016]∗∗∗
Male and female communities 0.047 0.015 0.008(0.026)∗ (0.008)∗ (0.024)[0.028]∗ [0.008]∗ [0.024]
Unknown type of community 0.032 0.010 0.027(0.022) (0.007) (0.020)[0.016]∗ [0.005]∗∗ [0.017]
Fixed-effects Canton Canton CantonGeography Yes Yes YesObservations 2447 2447 2447R2 0.231 0.232 0.226
Note: This table presents the results of OLS regressions relating the presence of communities to increasedgender equality. It documents higher levels of gender equality in towns were female communities settled. Seemain text for a discussion of the mechanism. Female communities include both beguinages and femininemonasteries. The unknown category comprises situations in which masculine or feminine monasteries andbeguinages coexist alongside unknown monasteries. Geography: latitude, longitude, caloric yield, soil type andcrop productivity, province and arrondissement capital status, distance to Leuven, to large cities (defined in1300), to the sea, and to rivers. All distances in log-km. Regressions include canton fixed effects and controlfor total population. Standard errors clustered at the canton level in parenthesis and Conley standard errors,with a Bartlett kernel and a cut-off distance of 40 km, in brackets. ∗ p < 0.1, ∗∗ p < 0.05, ∗∗∗ p < 0.01.
isolating masculine communities, it clearly shows that these had no effect on any of our measures
of gender equality, foreclosing the possibility that results arise from nuns and monks teaching
girls and boys, respectively.
Finally, we acknowledge that, throughout the paper, violations of the stable unit treatment
value assumption are likely: towns located in the vicinity of a beguinage could have received
a partial treatment. In that sense, Table C.8 removes all towns located 5 km, 10 km and 20
km away from a beguinage from the sample in Columns 1) and 2), 3) and 4), and 5) and 6),
respectively. As the results reveal, our previous findings relating beguine communities and
gender equality hold.78 Moreover, the coefficients are indistinguishable from those displayed in
78 Beguinages appear as not significant in Columns 5) and 6) where the control group consists mainly of thesouthern part of Belgium and few other clusters of villages. However, they are all in cantons without beguinages,and hence the canton fixed effects absorb the effect of beguinages.
48

Table C.8: Beguinages and literacy equality; SUTVA.
Dep. variable: Lit. equality index, 1866
5 km 10 km 20 km
(1) (2) (3) (4) (5) (6)
Beguinage (0/1) 0.106 0.103 −0.038(0.024)∗∗∗ (0.028)∗∗∗ (0.107)[0.025]∗∗∗ [0.027]∗∗∗ [0.095]
Exposure (centuries) 0.015 0.013 0.013(0.004)∗∗∗ (0.004)∗∗∗ (0.010)[0.006]∗∗∗ [0.004]∗∗∗ [0.008]∗
Fixed-effects Canton Canton Canton Canton Canton CantonGeography Yes Yes Yes Yes Yes YesMonasteries Yes Yes Yes Yes Yes YesObservations 2270 2270 1608 1608 540 540R2 0.240 0.234 0.264 0.257 0.444 0.445
Note: This table presents the results of OLS regressions relating the presence of beguinages to increased genderequality. Columns 1) and 2) consider only municipalities located more than 5 km from a beguinage, 3) and 4)increase the distance up to 10 km and 5) and 6) further expand it to 20 km. Geography: latitude, longitude,distance to Leuven, to large cities, to the sea and rivers, caloric yield, soil type and crop productivity andpresence of monasteries. Regressions include canton fixed-effects and control for total population. Standarderrors clustered at the canton level in parenthesis and Conley standard errors, with a Bartlett kernel and acut-off distance of 40 km in brackets. ∗ p < 0.1, ∗∗ p < 0.05, ∗∗∗ p < 0.01.
Columns 7) and 8) of Table 2, reducing this particular concern.
Location Endogeneity. Table C.9 reproduces Table 3 adding beguinage fixed-effects and
clustering the standard errors at this level. This table, as its analogous before, only considers
municipalities located at most at three cut-off distances from the closest beguinage: 5 km, 10
km and 20 km, in Columns 1)–2), 3)–4) and 5)–6), respectively. Further, we also introduce
distance to the closest beguinage and IDWi(j) as regressors in Columns 7)–9). It corroborates
the previous findings.
Next, we address the possibility that linguistic barriers impeded women from moving to
closeby beguinage due to language differences. In particular, we modify the IDW measure
assuming disconnected municipal networks along linguistic borders. Table C.10 presents the
outcome of this exercise. In general, the results we obtain under these alternative specifications
are qualitatively equivalent to our baseline results, indicating a more gender equal society among
municipalities more connected or exposed to beguinages.
We also follow Valencia Caicedo (2018) and compare the effect of beguinages that were
abandoned soon after they were established to those that remained. Table C.11 presents the
results of regressions including separate indicators for short- and long-lived beguinages. Column
49
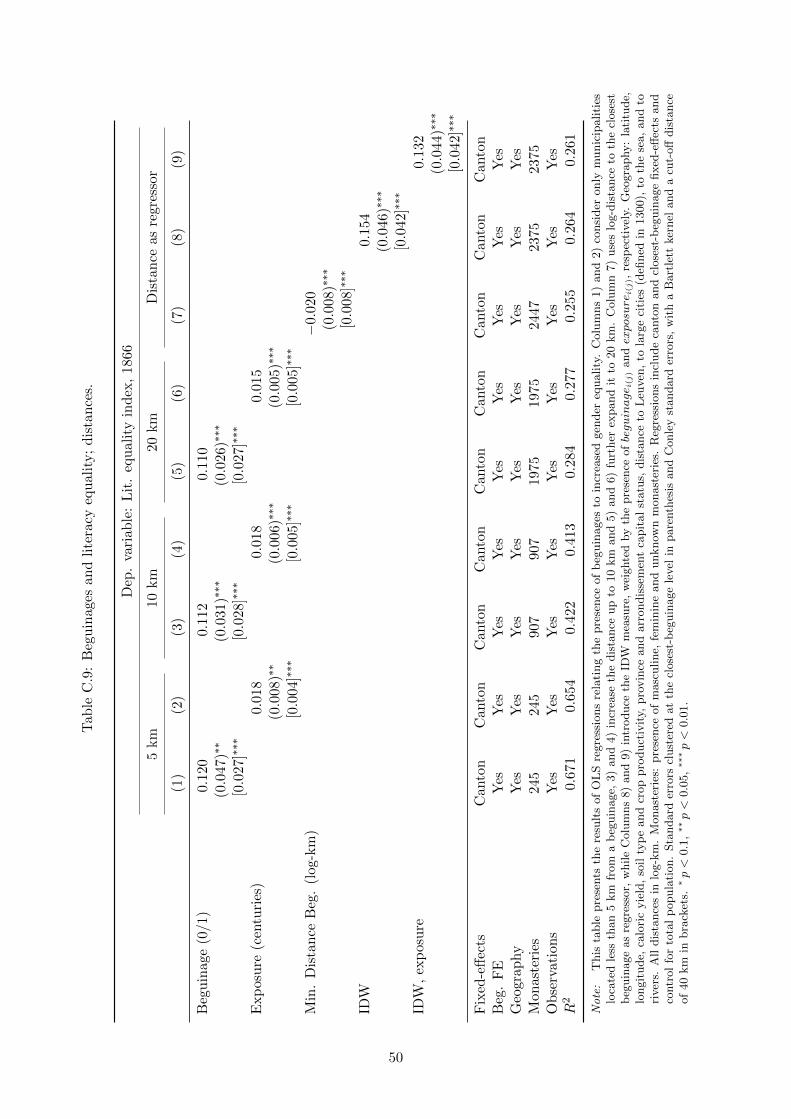
Tab
leC
.9:
Beg
uin
ages
and
lite
racy
equ
alit
y;
dis
tan
ces.
Dep
.va
riab
le:
Lit
.eq
ual
ity
ind
ex,
1866
5km
10km
20km
Dis
tan
ceas
regr
esso
r
(1)
(2)
(3)
(4)
(5)
(6)
(7)
(8)
(9)
Beg
uin
age
(0/1
)0.
120
0.11
20.
110
(0.0
47)∗∗
(0.0
31)∗∗∗
(0.0
26)∗∗∗
[0.0
27]∗∗∗
[0.0
28]∗∗∗
[0.0
27]∗∗∗
Exp
osu
re(c
entu
ries
)0.
018
0.01
80.
015
(0.0
08)∗∗
(0.0
06)∗∗∗
(0.0
05)∗∗∗
[0.0
04]∗∗∗
[0.0
05]∗∗∗
[0.0
05]∗∗∗
Min
.D
ista
nce
Beg
.(l
og-k
m)
−0.0
20(0.0
08)∗∗∗
[0.0
08]∗∗∗
IDW
0.1
54(0.0
46)∗∗∗
[0.0
42]∗∗∗
IDW
,ex
posu
re0.1
32(0.0
44)∗∗∗
[0.0
42]∗∗∗
Fix
ed-e
ffec
tsC
anto
nC
anto
nC
anto
nC
anto
nC
anto
nC
anto
nC
anto
nC
anto
nC
anto
nB
eg.
FE
Yes
Yes
Yes
Yes
Yes
Yes
Yes
Yes
Yes
Geo
grap
hy
Yes
Yes
Yes
Yes
Yes
Yes
Yes
Yes
Yes
Mon
aste
ries
245
245
907
907
1975
1975
2447
2375
2375
Ob
serv
ati
on
sY
esY
esY
esY
esY
esY
esY
esY
esY
esR
20.6
71
0.65
40.
422
0.41
30.
284
0.27
70.
255
0.26
40.
261
No
te:
Th
ista
ble
pre
sents
the
resu
lts
of
OL
Sre
gre
ssio
ns
rela
tin
gth
ep
rese
nce
of
beg
uin
ages
toin
crea
sed
gen
der
equ
ali
ty.
Colu
mn
s1)
an
d2)
con
sid
eron
lym
un
icip
ali
ties
loca
ted
less
than
5km
from
ab
egu
inage,
3)
an
d4)
incr
ease
the
dis
tan
ceu
pto
10
km
an
d5)
an
d6)
furt
her
expan
dit
to20
km
.C
olu
mn
7)
use
slo
g-d
ista
nce
toth
ecl
ose
stb
egu
inage
as
regre
ssor,
wh
ile
Colu
mn
s8)
an
d9)
intr
od
uce
the
IDW
mea
sure
,w
eighte
dby
the
pre
sen
ceofbeguinage i
(j)
an
dexposure
i(j),
resp
ecti
vel
y.G
eogra
phy:
lati
tud
e,lo
ngit
ude,
calo
ric
yie
ld,
soil
typ
eand
crop
pro
duct
ivit
y,pro
vin
ceand
arr
ondis
sem
ent
capit
al
statu
s,dis
tance
toL
euven
,to
larg
eci
ties
(defi
ned
in1300),
toth
ese
a,
and
tori
ver
s.A
lldis
tance
sin
log-k
m.
Monast
erie
s:pre
sence
of
masc
uline,
fem
inin
eand
unknow
nm
onast
erie
s.R
egre
ssio
ns
incl
ude
canto
nand
close
st-b
eguin
age
fixed
-eff
ects
and
contr
ol
for
tota
lp
op
ula
tion
.S
tan
dard
erro
rscl
ust
ered
at
the
close
st-b
egu
inage
level
inp
are
nth
esis
an
dC
on
ley
stan
dard
erro
rs,
wit
ha
Bart
lett
ker
nel
an
da
cut-
off
dis
tan
ceof
40
km
inbra
cket
s.∗p<
0.1
,∗∗p<
0.0
5,∗∗
∗p<
0.0
1.
50
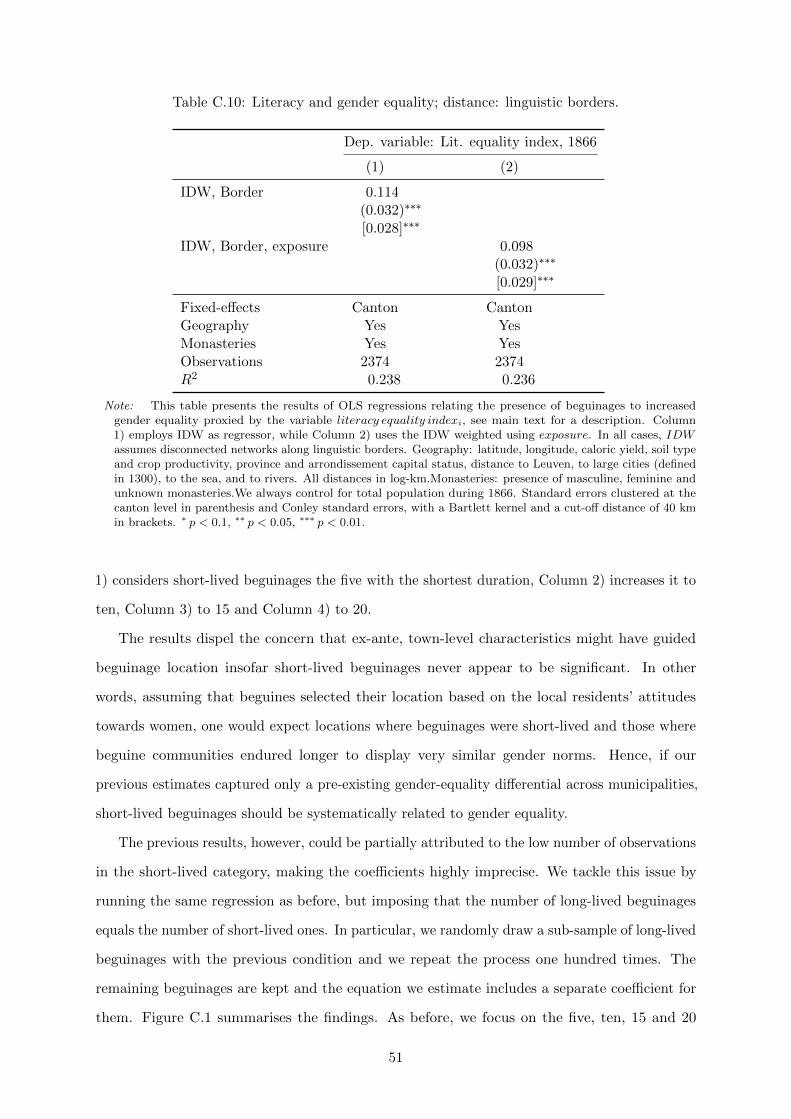
Table C.10: Literacy and gender equality; distance: linguistic borders.
Dep. variable: Lit. equality index, 1866
(1) (2)
IDW, Border 0.114(0.032)∗∗∗
[0.028]∗∗∗
IDW, Border, exposure 0.098(0.032)∗∗∗
[0.029]∗∗∗
Fixed-effects Canton CantonGeography Yes YesMonasteries Yes YesObservations 2374 2374R2 0.238 0.236
Note: This table presents the results of OLS regressions relating the presence of beguinages to increasedgender equality proxied by the variable literacy equality indexi, see main text for a description. Column1) employs IDW as regressor, while Column 2) uses the IDW weighted using exposure. In all cases, IDWassumes disconnected networks along linguistic borders. Geography: latitude, longitude, caloric yield, soil typeand crop productivity, province and arrondissement capital status, distance to Leuven, to large cities (definedin 1300), to the sea, and to rivers. All distances in log-km.Monasteries: presence of masculine, feminine andunknown monasteries.We always control for total population during 1866. Standard errors clustered at thecanton level in parenthesis and Conley standard errors, with a Bartlett kernel and a cut-off distance of 40 kmin brackets. ∗ p < 0.1, ∗∗ p < 0.05, ∗∗∗ p < 0.01.
1) considers short-lived beguinages the five with the shortest duration, Column 2) increases it to
ten, Column 3) to 15 and Column 4) to 20.
The results dispel the concern that ex-ante, town-level characteristics might have guided
beguinage location insofar short-lived beguinages never appear to be significant. In other
words, assuming that beguines selected their location based on the local residents’ attitudes
towards women, one would expect locations where beguinages were short-lived and those where
beguine communities endured longer to display very similar gender norms. Hence, if our
previous estimates captured only a pre-existing gender-equality differential across municipalities,
short-lived beguinages should be systematically related to gender equality.
The previous results, however, could be partially attributed to the low number of observations
in the short-lived category, making the coefficients highly imprecise. We tackle this issue by
running the same regression as before, but imposing that the number of long-lived beguinages
equals the number of short-lived ones. In particular, we randomly draw a sub-sample of long-lived
beguinages with the previous condition and we repeat the process one hundred times. The
remaining beguinages are kept and the equation we estimate includes a separate coefficient for
them. Figure C.1 summarises the findings. As before, we focus on the five, ten, 15 and 20
51

Table C.11: Beguinages and gender equality: Short-lived beguinages.
Dep. variable: Lit. equality index, 1866
5 short. 10 short. 15 sort. 20 short.
(1) (2) (3) (4)
Short beg. 0.007 0.023 0.006 −0.012(0.066) (0.041) (0.034) (0.032)[0.064] [0.042] [0.035] [0.032]
Long. beg. 0.101 0.099 0.098 0.098(0.024)∗∗∗ (0.024)∗∗∗ (0.024)∗∗∗ (0.024)∗∗∗
[0.025]∗∗∗ [0.025]∗∗∗ [0.025]∗∗∗ [0.025]∗∗∗
Coeff. Eq. test, p-val. 0.158 0.099 0.024 0.006
Fixed-effects Canton Canton Canton CantonGeography Yes Yes Yes YesMonasteries Yes Yes Yes YesNo. of Short beg. 5 10 15 20Observations 2447 2447 2447 2447R2 0.235 0.235 0.235 0.235
Note: This table presents the results of OLS regressions relating the presence of beguinages to increased genderequality. Gender equality is proxied by literacy equality index. Column 1) includes separate indicators forbeguinages with the 5 lowest values of exposure. Columns 2), 3) and 4) increase it to the 10, 15 and 20,respectively. Geography: latitude, longitude, distance to Leuven, to large cities, to the sea and rivers, caloricyield, soil type and crop productivity and presence of monasteries. Regressions include canton fixed-effects andcontrol for total population. Standard errors clustered at the canton level in parenthesis and Conley standarderrors, with a Bartlett kernel and a cut-off distance of 40 km in brackets. ∗ p < 0.1, ∗∗ p < 0.05, ∗∗∗ p < 0.01.
shortest-lived beguinages. The figure reports, for each case, the p-value of each regression on the
horizontal axis. The overlaid dots represent the average corresponding coefficient —values are
displayed on the right-hand side, vertical axis. All in all, Table C.11 and Figure C.1 suggest
that beguines did not select places that held very different attitudes regarding gender equality.
Finally, we rule out the possibility that our results are due to chance. In particular, we
generate 70 random beguinages and attribute them among the ten percent most populous
municipalities.79 We then regress the female literacy indexi(j on them, replicating the results
of Column 7) in Table 2. We repeat the procedure one hundred times. Figure C.2 presents
the distribution of the coefficients associated to the random beguinages. In general, these are
indistinguishable from zero, and in all cases the coefficient corresponding to the real beguinages
—depicted by the vertical line— is larger than the (absolute) value of the random ones.
IV Results. Table C.12 presents some evidence regarding the nil effect of municipal charters
on gender equality among towns that had arguably similar attitudes toward women. First,
79This ensures that lack of predictive power for these random beguinages is not due to them being placed insmall towns. Such concern is relevant, as we are only generating 70 beguinages.
52
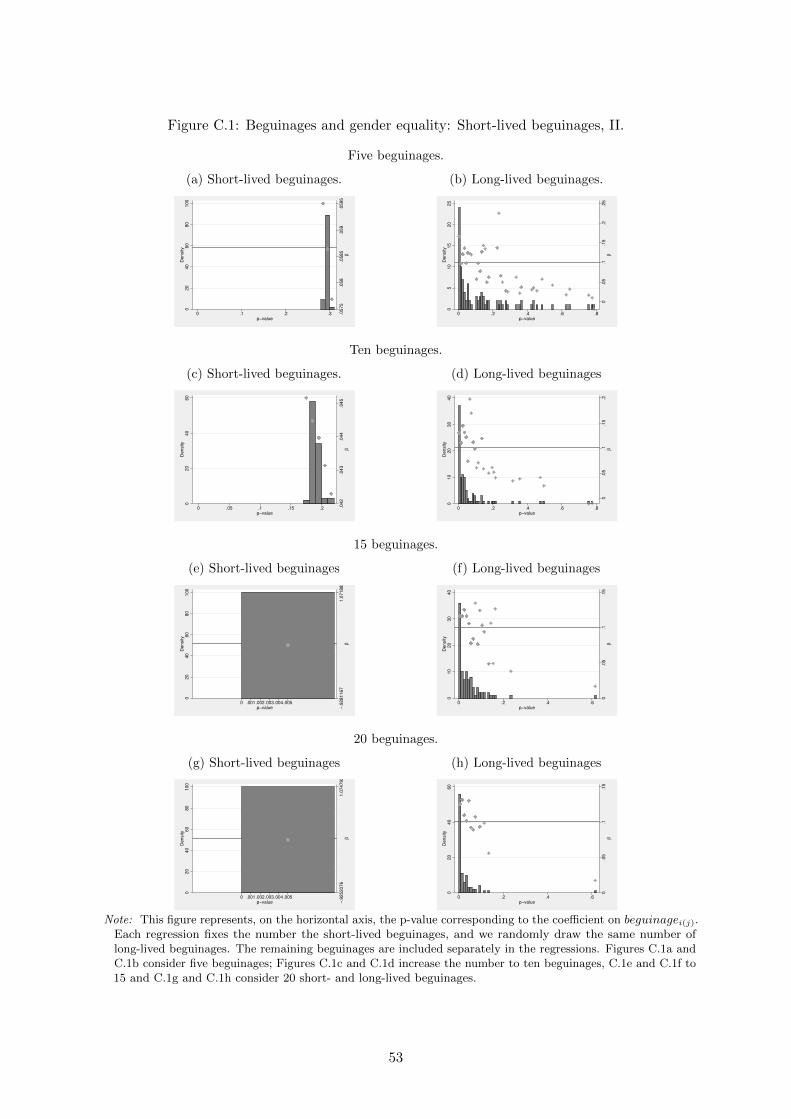
Figure C.1: Beguinages and gender equality: Short-lived beguinages, II.
Five beguinages.
(a) Short-lived beguinages.
.0575
.058
.0585
.059
.0595
β
020
40
60
80
100
Density
0 .1 .2 .3p−value
(b) Long-lived beguinages.
0.0
5.1
.15
.2.2
5β
05
10
15
20
25
Density
0 .2 .4 .6 .8p−value
Ten beguinages.
(c) Short-lived beguinages.
.042
.043
.044
.045
β
020
40
60
Density
0 .05 .1 .15 .2p−value
(d) Long-lived beguinages
0.0
5.1
.15
.2β
010
20
30
40
Density
0 .2 .4 .6 .8p−value
15 beguinages.
(e) Short-lived beguinages
−.9
281167
1.0
71883
β
020
40
60
80
100
Density
0 .001.002.003.004.005p−value
(f) Long-lived beguinages
0.0
5.1
.15
β
010
20
30
40
Density
0 .2 .4 .6p−value
20 beguinages.
(g) Short-lived beguinages
−.9
252076
1.0
74792
β
020
40
60
80
100
Density
0 .001.002.003.004.005p−value
(h) Long-lived beguinages
0.0
5.1
.15
β
020
40
60
Density
0 .2 .4 .6p−value
Note: This figure represents, on the horizontal axis, the p-value corresponding to the coefficient on beguinagei(j).Each regression fixes the number the short-lived beguinages, and we randomly draw the same number oflong-lived beguinages. The remaining beguinages are included separately in the regressions. Figures C.1a andC.1b consider five beguinages; Figures C.1c and C.1d increase the number to ten beguinages, C.1e and C.1f to15 and C.1g and C.1h consider 20 short- and long-lived beguinages.
53

Figure C.2: Random beguinages.
01
02
03
04
0D
en
sity
.01 .02 .03 .04 .05 .06Coeff. random beguinage
Note: This figure displays the coefficient associated to randomly generated beguinages when regressions followour baseline procedure. The red vertical line represents the coefficient associated to real beguinages fromColumn 7) of Table 2.
Column 1) indicates that, among towns that never had a beguinage, that is, those a priory
more hostile towards beguines’ lifestyle having a municipal charter did not impact subsequent
levels of gender equality. Ideally, we would run an equivalent regression for towns with a
beguinage, but the low number of observations in that category prevents the exercise. Instead,
as a proxy, Column 2) considers all towns less than five kilometers away from a beguinage as
being more gender-egalitarian and computes the effect of municipal charters among them. For
completeness, Column 3) considers only towns located more than five kilometers away from a
beguinage. These municipalities should have had similarly low values of female agency. Arguably,
if beguines self-selected towns because they were more tolerant towards their lifestyle, attitudes
toward women should be similar within each sub-sample. Finally, Column 4) simultaneously
introduces municipal charters and beguinages while considering the whole sample. As it is clear,
the presence of beguinages reinforces gender equality. However, the coefficient associated to
municipal charters is not significant, which gives additional credence to our instrumentation.80
80Running the same regression without considering the presence of beguinage as a regressor yields a positiveand significant effect on municipal charters. Since the addition of beguinages renders the former insignificant, theeffect is likely to operate through beguinages.
54
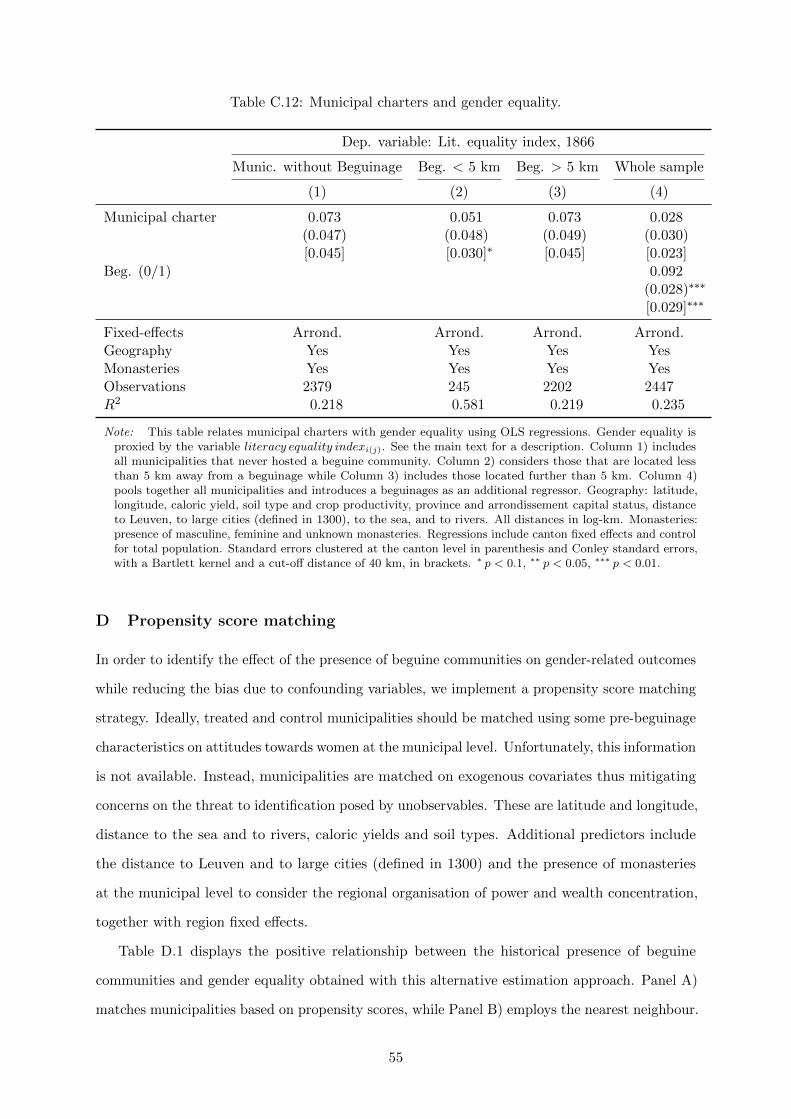
Table C.12: Municipal charters and gender equality.
Dep. variable: Lit. equality index, 1866
Munic. without Beguinage Beg. < 5 km Beg. > 5 km Whole sample
(1) (2) (3) (4)
Municipal charter 0.073 0.051 0.073 0.028(0.047) (0.048) (0.049) (0.030)[0.045] [0.030]∗ [0.045] [0.023]
Beg. (0/1) 0.092(0.028)∗∗∗
[0.029]∗∗∗
Fixed-effects Arrond. Arrond. Arrond. Arrond.Geography Yes Yes Yes YesMonasteries Yes Yes Yes YesObservations 2379 245 2202 2447R2 0.218 0.581 0.219 0.235
Note: This table relates municipal charters with gender equality using OLS regressions. Gender equality isproxied by the variable literacy equality indexi(j). See the main text for a description. Column 1) includesall municipalities that never hosted a beguine community. Column 2) considers those that are located lessthan 5 km away from a beguinage while Column 3) includes those located further than 5 km. Column 4)pools together all municipalities and introduces a beguinages as an additional regressor. Geography: latitude,longitude, caloric yield, soil type and crop productivity, province and arrondissement capital status, distanceto Leuven, to large cities (defined in 1300), to the sea, and to rivers. All distances in log-km. Monasteries:presence of masculine, feminine and unknown monasteries. Regressions include canton fixed effects and controlfor total population. Standard errors clustered at the canton level in parenthesis and Conley standard errors,with a Bartlett kernel and a cut-off distance of 40 km, in brackets. ∗ p < 0.1, ∗∗ p < 0.05, ∗∗∗ p < 0.01.
D Propensity score matching
In order to identify the effect of the presence of beguine communities on gender-related outcomes
while reducing the bias due to confounding variables, we implement a propensity score matching
strategy. Ideally, treated and control municipalities should be matched using some pre-beguinage
characteristics on attitudes towards women at the municipal level. Unfortunately, this information
is not available. Instead, municipalities are matched on exogenous covariates thus mitigating
concerns on the threat to identification posed by unobservables. These are latitude and longitude,
distance to the sea and to rivers, caloric yields and soil types. Additional predictors include
the distance to Leuven and to large cities (defined in 1300) and the presence of monasteries
at the municipal level to consider the regional organisation of power and wealth concentration,
together with region fixed effects.
Table D.1 displays the positive relationship between the historical presence of beguine
communities and gender equality obtained with this alternative estimation approach. Panel A)
matches municipalities based on propensity scores, while Panel B) employs the nearest neighbour.
55
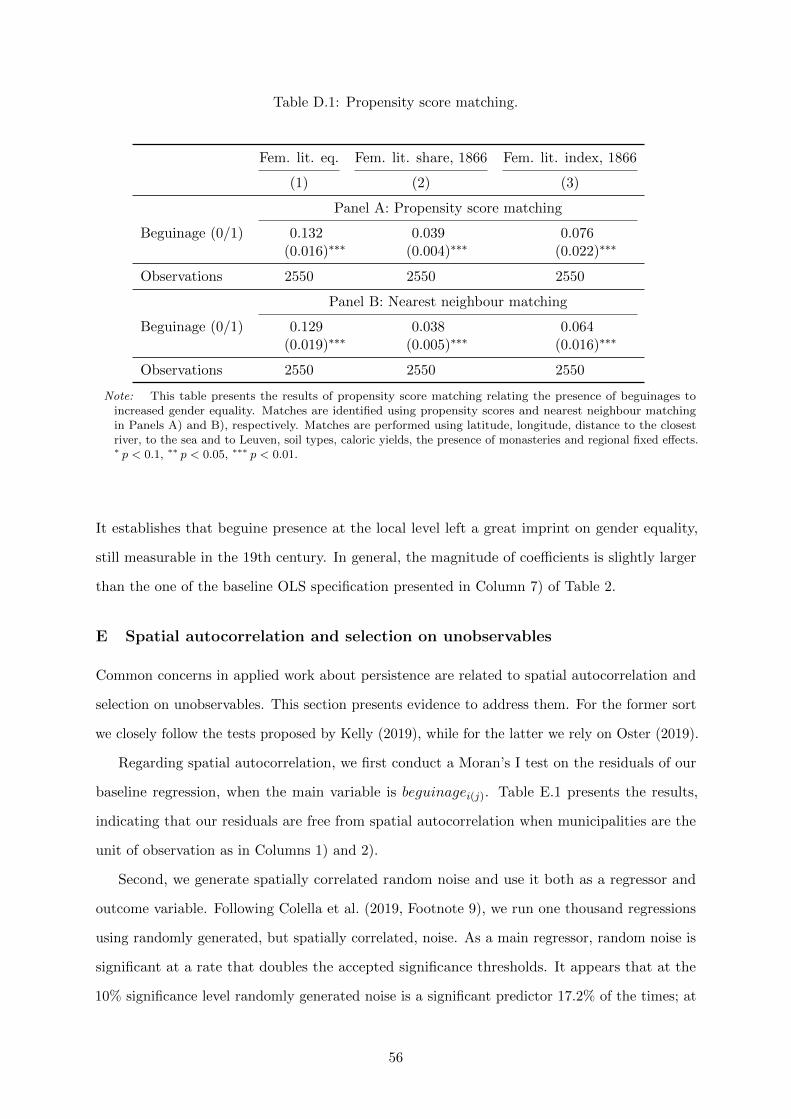
Table D.1: Propensity score matching.
Fem. lit. eq. Fem. lit. share, 1866 Fem. lit. index, 1866
(1) (2) (3)
Panel A: Propensity score matching
Beguinage (0/1) 0.132 0.039 0.076(0.016)∗∗∗ (0.004)∗∗∗ (0.022)∗∗∗
Observations 2550 2550 2550
Panel B: Nearest neighbour matching
Beguinage (0/1) 0.129 0.038 0.064(0.019)∗∗∗ (0.005)∗∗∗ (0.016)∗∗∗
Observations 2550 2550 2550
Note: This table presents the results of propensity score matching relating the presence of beguinages toincreased gender equality. Matches are identified using propensity scores and nearest neighbour matchingin Panels A) and B), respectively. Matches are performed using latitude, longitude, distance to the closestriver, to the sea and to Leuven, soil types, caloric yields, the presence of monasteries and regional fixed effects.∗ p < 0.1, ∗∗ p < 0.05, ∗∗∗ p < 0.01.
It establishes that beguine presence at the local level left a great imprint on gender equality,
still measurable in the 19th century. In general, the magnitude of coefficients is slightly larger
than the one of the baseline OLS specification presented in Column 7) of Table 2.
E Spatial autocorrelation and selection on unobservables
Common concerns in applied work about persistence are related to spatial autocorrelation and
selection on unobservables. This section presents evidence to address them. For the former sort
we closely follow the tests proposed by Kelly (2019), while for the latter we rely on Oster (2019).
Regarding spatial autocorrelation, we first conduct a Moran’s I test on the residuals of our
baseline regression, when the main variable is beguinagei(j). Table E.1 presents the results,
indicating that our residuals are free from spatial autocorrelation when municipalities are the
unit of observation as in Columns 1) and 2).
Second, we generate spatially correlated random noise and use it both as a regressor and
outcome variable. Following Colella et al. (2019, Footnote 9), we run one thousand regressions
using randomly generated, but spatially correlated, noise. As a main regressor, random noise is
significant at a rate that doubles the accepted significance thresholds. It appears that at the
10% significance level randomly generated noise is a significant predictor 17.2% of the times; at
56

Table E.1: Moran’s I autocorrelation test.
Municipal level Canton level
Normal Approx. Randomisation Normal Approx. RandomisationStatistic (1) (2) (3) (4)
Moran’s I 0.0000 0.0000 −0.0255 −0.0255Mean −0.0004 −0.0004 −0.0053 −0.0053Std. Dev. 0.0015 0.0015 0.0083 0.0083Z-score 0.2790 0.2791 −2.4269 −2.4269p-value 0.7803 0.7802 0.0152 0.0153
Note: This table reports the result of a Moran’s I test on the residuals of the baseline regression. It shows thatresiduals are not afflicted by spatial autocorrelation.
the 5% significance level we find it to be significant 10.5% of the times; and finally, at the 1%
level the random noise is significant about 4.8% of the cases. Although ideally we should have
obtained figures below each threshold, our results seem to outperform those analysed by Kelly
(2019). In any case, the average value of the coefficient associated the random noise is virtually
zero, which is clearly lower than what reported in our baseline regressions.
Next, we use random noise as an outcome variable and we assess whether beguinagei(j) and
exposurei(j) are capable of explaining it. In this case, our main regressors are significant only in
a handful of cases: beguinagei(j) is significant only in 4.7%, 1.8% and 0.2% of the cases at the
10%, 5% and 1%, respectively. Figures for exposurei(j) are similar, topping at 6.6%, 3.0% and
0.02%.
Finally, we assess the possibility of selection on unobservables following Oster (2019). In
particular, we analyse the value of our two main coefficients of interest assuming an equal selection
on unobservables as on observables. In Figure E.1 results are presented for multiple levels of
R2.81 For R2 increases up to 30% of those of the OLS regressions, selection on unobservables
should be larger than selection on observables to reduce our coefficients to zero. Therefore, we
are confident that our results do not suffer from this issue, especially when we use beguinagei(j)
as main regressor.
F Analysis at the Canton level
Throughout the paper, municipality is the unit of observation for the empirical analysis. However,
even if the magnitude of the estimated effect is relatively large, the statistical power is affected
81For comparability between the coefficients, the value of the coefficient has been scaled according to the OLSresults.
57
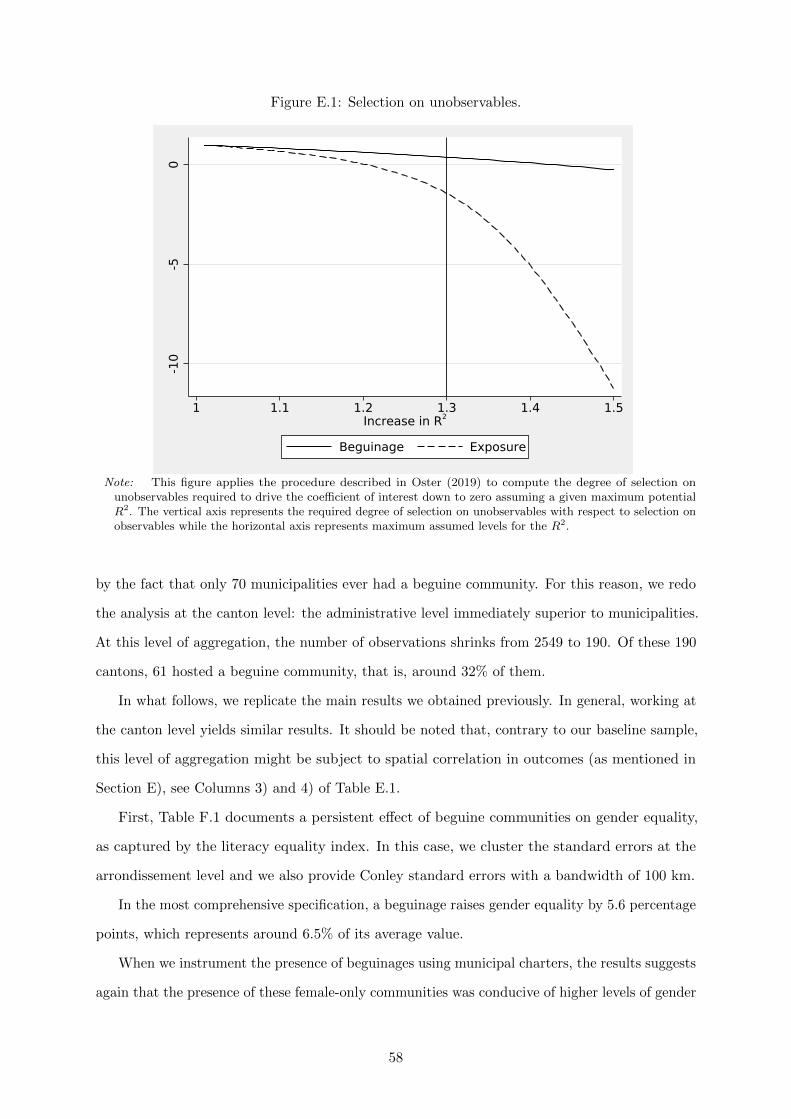
Figure E.1: Selection on unobservables.
-10
-50
1 1.1 1.2 1.3 1.4 1.5Increase in R2
Beguinage Exposure
Note: This figure applies the procedure described in Oster (2019) to compute the degree of selection onunobservables required to drive the coefficient of interest down to zero assuming a given maximum potentialR2. The vertical axis represents the required degree of selection on unobservables with respect to selection onobservables while the horizontal axis represents maximum assumed levels for the R2.
by the fact that only 70 municipalities ever had a beguine community. For this reason, we redo
the analysis at the canton level: the administrative level immediately superior to municipalities.
At this level of aggregation, the number of observations shrinks from 2549 to 190. Of these 190
cantons, 61 hosted a beguine community, that is, around 32% of them.
In what follows, we replicate the main results we obtained previously. In general, working at
the canton level yields similar results. It should be noted that, contrary to our baseline sample,
this level of aggregation might be subject to spatial correlation in outcomes (as mentioned in
Section E), see Columns 3) and 4) of Table E.1.
First, Table F.1 documents a persistent effect of beguine communities on gender equality,
as captured by the literacy equality index. In this case, we cluster the standard errors at the
arrondissement level and we also provide Conley standard errors with a bandwidth of 100 km.
In the most comprehensive specification, a beguinage raises gender equality by 5.6 percentage
points, which represents around 6.5% of its average value.
When we instrument the presence of beguinages using municipal charters, the results suggests
again that the presence of these female-only communities was conducive of higher levels of gender
58
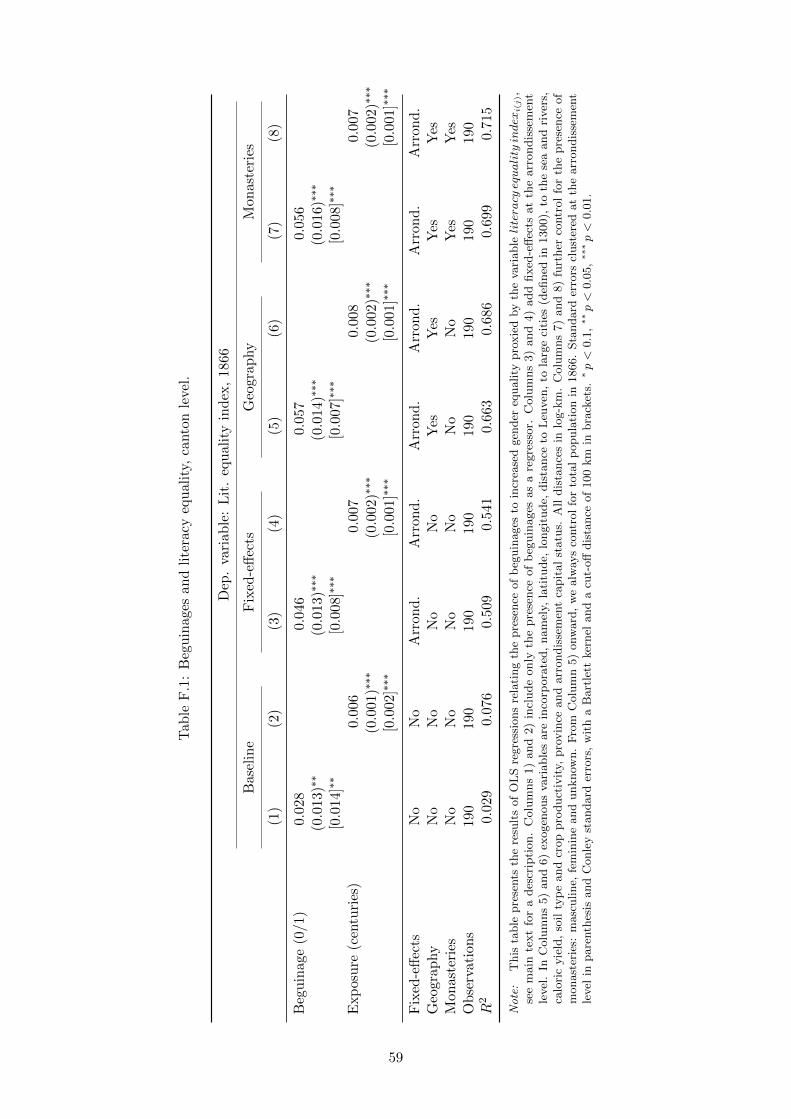
Tab
leF
.1:
Beg
uin
ages
and
lite
racy
equ
alit
y,ca
nto
nle
vel.
Dep
.va
riab
le:
Lit
.eq
ual
ity
ind
ex,
1866
Bas
elin
eF
ixed
-eff
ects
Geo
grap
hy
Mon
aste
ries
(1)
(2)
(3)
(4)
(5)
(6)
(7)
(8)
Beg
uin
age
(0/1
)0.0
28
0.04
60.
057
0.05
6(0.0
13)∗∗
(0.0
13)∗∗∗
(0.0
14)∗∗∗
(0.0
16)∗∗∗
[0.0
14]∗∗
[0.0
08]∗∗∗
[0.0
07]∗∗∗
[0.0
08]∗∗∗
Exp
osu
re(c
entu
ries
)0.0
060.
007
0.00
80.
007
(0.0
01)∗∗∗
(0.0
02)∗∗∗
(0.0
02)∗∗∗
(0.0
02)∗∗∗
[0.0
02]∗∗∗
[0.0
01]∗∗∗
[0.0
01]∗∗∗
[0.0
01]∗∗∗
Fix
ed-e
ffec
tsN
oN
oA
rron
d.
Arr
ond
.A
rron
d.
Arr
ond
.A
rron
d.
Arr
ond
.G
eogr
aphy
No
No
No
No
Yes
Yes
Yes
Yes
Mon
aste
ries
No
No
No
No
No
No
Yes
Yes
Ob
serv
ati
on
s19
019
019
019
019
019
019
019
0R
20.0
29
0.07
60.
509
0.54
10.
663
0.68
60.
699
0.71
5
No
te:
This
table
pre
sents
the
resu
lts
of
OL
Sre
gre
ssio
ns
rela
ting
the
pre
sence
of
beg
uin
ages
toin
crea
sed
gen
der
equality
pro
xie
dby
the
vari
ableliteracyequalityindex
i(j),
see
main
text
for
ad
escr
ipti
on
.C
olu
mn
s1)
an
d2)
incl
ud
eon
lyth
ep
rese
nce
of
beg
uin
ages
as
are
gre
ssor.
Colu
mn
s3)
an
d4)
ad
dfi
xed
-eff
ects
at
the
arr
on
dis
sem
ent
level
.In
Colu
mns
5)
and
6)
exogen
ous
vari
able
sare
inco
rpora
ted,
nam
ely,
lati
tude,
longit
ude,
dis
tance
toL
euven
,to
larg
eci
ties
(defi
ned
in1300),
toth
ese
aand
river
s,ca
lori
cyie
ld,
soil
typ
eand
crop
pro
duct
ivit
y,pro
vin
ceand
arr
ondis
sem
ent
capit
al
statu
s.A
lldis
tance
sin
log-k
m.
Colu
mns
7)
and
8)
furt
her
contr
ol
for
the
pre
sence
of
mon
ast
erie
s:m
asc
uli
ne,
fem
inin
ean
du
nkn
own
.F
rom
Colu
mn
5)
onw
ard
,w
ealw
ays
contr
ol
for
tota
lp
op
ula
tion
in1866.
Sta
nd
ard
erro
rscl
ust
ered
at
the
arr
on
dis
sem
ent
level
inpare
nth
esis
and
Conle
yst
andard
erro
rs,
wit
ha
Bart
lett
ker
nel
and
acu
t-off
dis
tance
of
100
km
inbra
cket
s.∗p<
0.1
,∗∗p<
0.0
5,∗∗
∗p<
0.0
1.
59
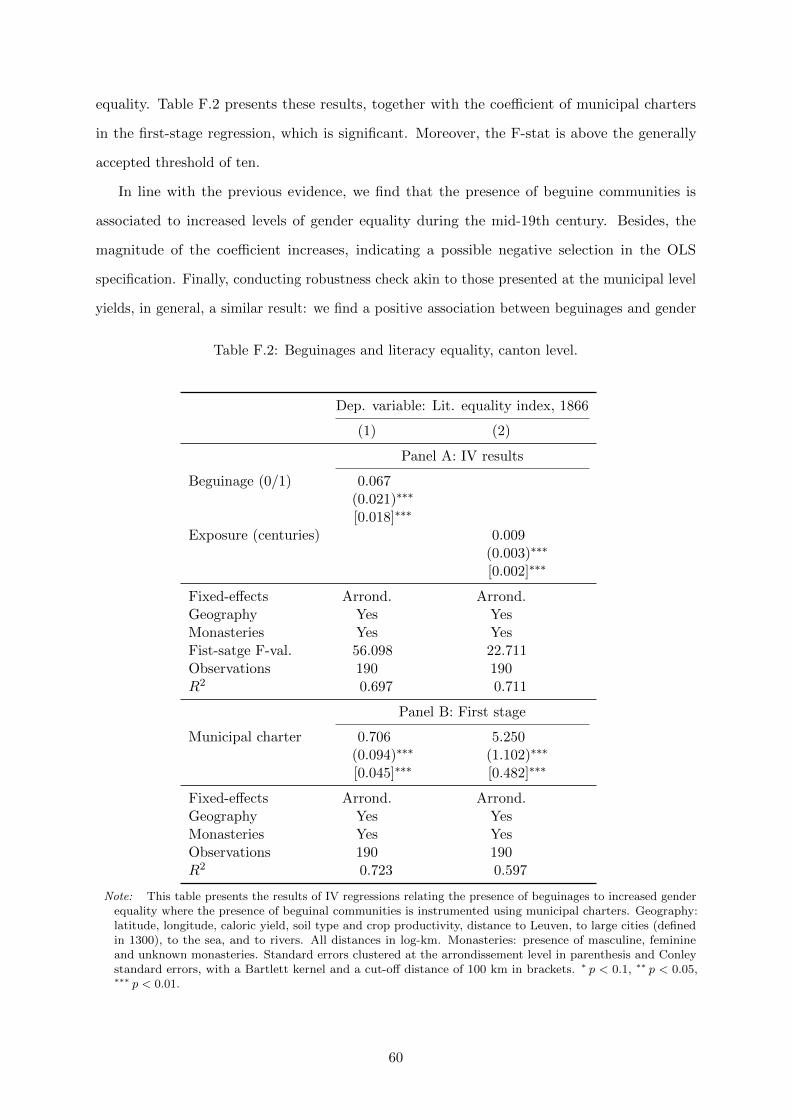
equality. Table F.2 presents these results, together with the coefficient of municipal charters
in the first-stage regression, which is significant. Moreover, the F-stat is above the generally
accepted threshold of ten.
In line with the previous evidence, we find that the presence of beguine communities is
associated to increased levels of gender equality during the mid-19th century. Besides, the
magnitude of the coefficient increases, indicating a possible negative selection in the OLS
specification. Finally, conducting robustness check akin to those presented at the municipal level
yields, in general, a similar result: we find a positive association between beguinages and gender
Table F.2: Beguinages and literacy equality, canton level.
Dep. variable: Lit. equality index, 1866
(1) (2)
Panel A: IV results
Beguinage (0/1) 0.067(0.021)∗∗∗
[0.018]∗∗∗
Exposure (centuries) 0.009(0.003)∗∗∗
[0.002]∗∗∗
Fixed-effects Arrond. Arrond.Geography Yes YesMonasteries Yes YesFist-satge F-val. 56.098 22.711Observations 190 190R2 0.697 0.711
Panel B: First stage
Municipal charter 0.706 5.250(0.094)∗∗∗ (1.102)∗∗∗
[0.045]∗∗∗ [0.482]∗∗∗
Fixed-effects Arrond. Arrond.Geography Yes YesMonasteries Yes YesObservations 190 190R2 0.723 0.597
Note: This table presents the results of IV regressions relating the presence of beguinages to increased genderequality where the presence of beguinal communities is instrumented using municipal charters. Geography:latitude, longitude, caloric yield, soil type and crop productivity, distance to Leuven, to large cities (definedin 1300), to the sea, and to rivers. All distances in log-km. Monasteries: presence of masculine, feminineand unknown monasteries. Standard errors clustered at the arrondissement level in parenthesis and Conleystandard errors, with a Bartlett kernel and a cut-off distance of 100 km in brackets. ∗ p < 0.1, ∗∗ p < 0.05,∗∗∗ p < 0.01.
60
equality. These additional results are available upon request.
G A Model of Cultural Transmission
So far, our research unveiled an enduring relationship between beguine communities and gender
equality. Possible explanations include role-modelling effects, increased female bargaining power,
and beguines lifting girls’ literacy rates as teachers. However, the previous sections evince that
neither role-modelling nor beguinal teaching efforts caused the increase in gender equality we
measure.
Consequently, we propose a theoretical model to explain our results emphasising girls’
bargaining power as the relevant mechanism at play. It illustrates how beguinages triggered
a shift in values that could spread beyond the beguinal population itself, influencing gender
outcomes for centuries. We believe this captures the essence of what beguinages offered to young
girls, while other potential mechanisms are left unexplored.
In this framework, cultural change in gender roles operates through the marriage market. We
consider a population of men —denoted by m— and women —f— in equal number who randomly
meet in the local marriage market. Before getting married, they bargain non-cooperatively over
the share of the constant marital surplus generated by a union, denoted by y.82 Let sm,ft ∈ (0, 1)
be the couple-specific share men appropriate and t = 1, 2, .. denote the time period. Agents will
agree to the wedding if they enjoy their share of marital surplus more than their life as single.
Individuals are characterised by their outside option in case they do not marry. Women f are
assumed to be homogeneous in their outside option uf ∈ (0, y) and we posit that heterogeneous
men m follow a Type I Pareto distribution with scale parameter xt and shape parameter α = 2
such that um,t ∼ ParetoI(xt, 2).83 The initial average type of men is: µ0 = αx0α−1 .
The potential couples’ negotiation problem follows Nash bargaining:
maxsm,ft
(sm,ft y − um, t
)β((1− sm,ft
)y − uf
)1−β, (8)
where β ∈ (0, 1) denotes men’s bargaining power and is assumed to be constant.
At the optimum, men who marry enjoy the share sm,ft
?=
um,t(1−β)+β(y−uf )y , which is
decreasing in uf Matched individuals for which um,t + uf > y cannot agree on a sharing rule.
Consequently, men at the right tail of the distribution will stay single. Both very demanding
men and the women matched with them are better off if they do not marry.
82Many aspects are typically encompassed in the notion of marital surplus: children and other household publicgoods, but also other psychological and sociological amenities, as self-realisation and social recognition.
83A Type I Pareto distribution with value 2 for the shape parameter allows obtaining closed-form solutions.
61

Each married couple has one daughter and one son. To obtain a tractable model, daughters
inherit the constant type uf of their mothers while sons are horizontally socialised. In particular,
sons’ type follows a Type I Pareto distribution with α = 2 and the average son type equals the
average share of surplus that married men obtain in the bargaining process. In other words,
following Bisin and Verdier (2001), a son observes married couples to infer the minimum amount
he should demand in the bargaining process. This average equals:
µt+1 = E(sm,ft
?y)
= y
∫ y−uf
0sm,ft
?f(um,t)dum,t∫ y−uf
0f(um,t)dum,t
= β(y − uf ) + (1− β)2xt(y − uf )
xt − uf + y
Since the average of a Type I Pareto distribution is given by αx1−α we can rewrite the previous
expression in terms of µt84:
µt+1 = (y − uf )
(β +
2(β − 1)µt−µt + 2uf − 2y
). (9)
Equation 9 describes the dynamic evolution of µ over generations. For sufficiently large
values of the initial µ0, µt+1 < µt∀t.85
In order to study the long-term evolution of gender norms, we focus on the change of men’s
values over generations, as captured by µ. We analyse the unique, asymptotically steady-state
level of µt given by:86
limt→∞
µt = µ? =1
2(y − uf )
√β(√
8 + β −√β). (10)
Starting from this model, we show that a temporal shift in women’s outside options —brought
about by the opening of a beguinage— has long-lasting effects that exceed the lifespan of the
shock. We maintain that becoming a beguine was a competing alternative to marriage that
broadened girls’ choice-set.87
Suppose that women in municipalities with a beguinage enjoyed an increased outside option
(ubeguinagef > uf ) and could bargain a better status within the couple if married. In this scenario,
a larger share of selfish men will remain single, leading to a selection of values in the married
84We assume α = 2 and µ0 < 2 ∗ (y − uf ). The latter is a technical condition to have a non-zero denominatorfor the expected average of the truncated distribution.
85More in detail, the condition on µ0 reads µ0 >12(uf − y)(β−
√β(8 + β)). This is not particularly restrictive
considering medieval gender norms according to which husbands were in charge of household administration andwere considered the legal guardians of their wives.
86The speed of convergence to the steady-state accelerates with β. In that sense, higher bargaining power formen increases the speed with which the share of egotistic men is eroded over time.
87The limit case of an everlasting raise in women’s outside options implies convergence towards a differentsteady state.
62
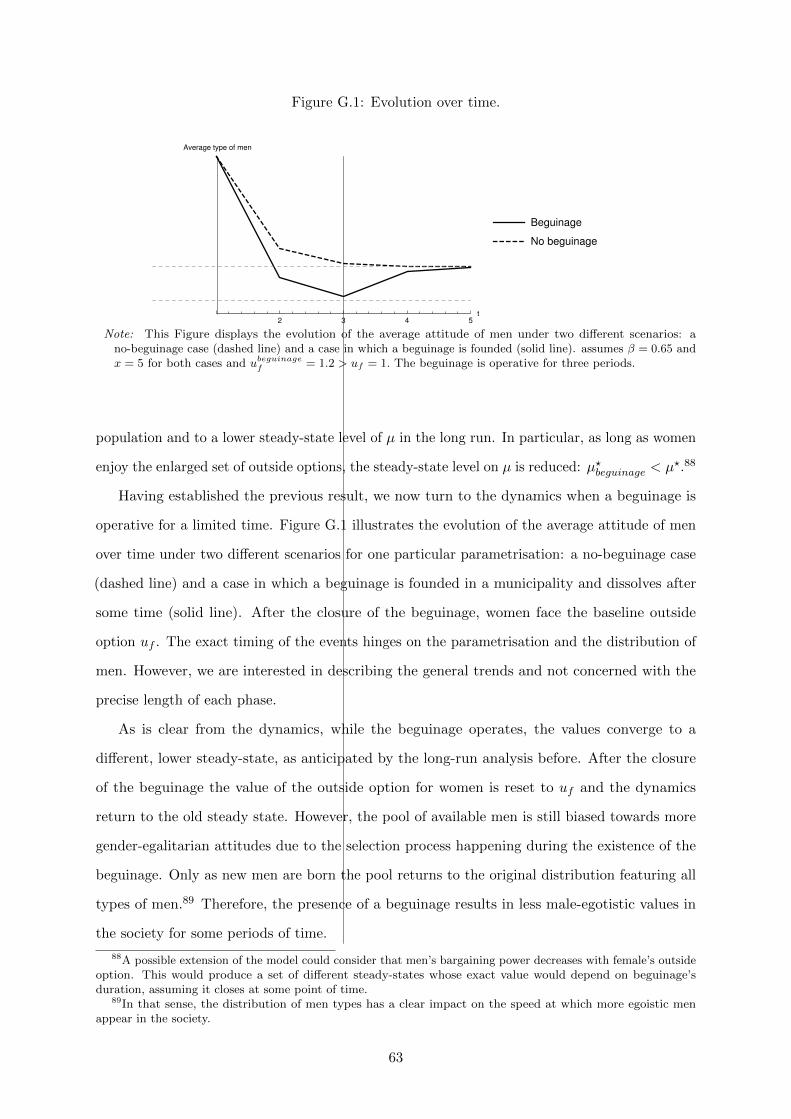
Figure G.1: Evolution over time.
2 3 4 5t
Average type of men
Beguinage
No beguinage
Note: This Figure displays the evolution of the average attitude of men under two different scenarios: ano-beguinage case (dashed line) and a case in which a beguinage is founded (solid line). assumes β = 0.65 andx = 5 for both cases and ubeguinage
f = 1.2 > uf = 1. The beguinage is operative for three periods.
population and to a lower steady-state level of µ in the long run. In particular, as long as women
enjoy the enlarged set of outside options, the steady-state level on µ is reduced: µ?beguinage < µ?.88
Having established the previous result, we now turn to the dynamics when a beguinage is
operative for a limited time. Figure G.1 illustrates the evolution of the average attitude of men
over time under two different scenarios for one particular parametrisation: a no-beguinage case
(dashed line) and a case in which a beguinage is founded in a municipality and dissolves after
some time (solid line). After the closure of the beguinage, women face the baseline outside
option uf . The exact timing of the events hinges on the parametrisation and the distribution of
men. However, we are interested in describing the general trends and not concerned with the
precise length of each phase.
As is clear from the dynamics, while the beguinage operates, the values converge to a
different, lower steady-state, as anticipated by the long-run analysis before. After the closure
of the beguinage the value of the outside option for women is reset to uf and the dynamics
return to the old steady state. However, the pool of available men is still biased towards more
gender-egalitarian attitudes due to the selection process happening during the existence of the
beguinage. Only as new men are born the pool returns to the original distribution featuring all
types of men.89 Therefore, the presence of a beguinage results in less male-egotistic values in
the society for some periods of time.
88A possible extension of the model could consider that men’s bargaining power decreases with female’s outsideoption. This would produce a set of different steady-states whose exact value would depend on beguinage’sduration, assuming it closes at some point of time.
89In that sense, the distribution of men types has a clear impact on the speed at which more egoistic menappear in the society.
63