Embed Size (px)
Citation preview
Biomonitoring Persistent and Non-persistent Chemicals in Human Breast Milk and Endocrine Disruption of Lactation
By
Rosana Alysia Hernandez Weldon
A dissertation submitted in partial satisfaction of the
requirements for the degree of
Doctor of Philosophy
in
Environmental Health Sciences
in the
Graduate Division
of the
University of California, Berkeley
Committee in charge:
Professor Brenda Eskenazi, Co-Chair Professor Nina Holland, Co-Chair Professor S. Katharine Hammond
Professor Alan Hubbard
Fall 2010
Biomonitoring Persistent and Non-persistent Chemicals in Human Breast Milk and Endocrine Disruption of Lactation
© 2010
by Rosana Alysia Hernandez Weldon
Abstract
Biomonitoring Persistent and Non-persistent Chemicals in Human Breast Milk and Endocrine Disruption of Lactation
by
Rosana Alysia Hernandez Weldon
Doctor of Philosophy in Environmental Health Sciences
University of California, Berkeley
Professor Brenda Eskenazi, Co-Chair
Professor Nina Holland, Co-Chair
Breastfeeding has numerous benefits to mother and child including improved maternal post-partum health, maternal/child bonding, and infant neurodevelopment and immune function. However, concern has been expressed about potential health risks posed to infants from environmental chemicals in human milk. The Food Quality Protection Act of 1996 requires the United States Environmental Protection Agency to set pesticide tolerance levels in food that ensure the safety of sensitive sub-populations, particularly pregnant women and children. Maternal dietary and environmental exposures to organophosphate (OP), organochlorine (OC), carbamate, and pyrethroid pesticides and polychlorinated biphenyls (PCBs) may lead to measurable levels of these chemicals in breast milk and because some of these chemicals interfere with hormone regulation, a mother’s ability to lactate may be compromised by exposure. Lactational exposures to infants are of particular concern because infants’ metabolic, neurologic and other systems are developing leading children to be more susceptible to the hazards of pesticides than adults. Although persistent pesticides, such as dichlorodiphenyltrichloroethane (DDT), have been biomonitored in human milk for decades, there are few studies measuring non-persistent pesticides in milk and no studies examining potential sources of non-persistent pesticides in milk. Using data and samples from the Center for the Health Assessment of Mothers and Children of Salinas (CHAMACOS), another study on peripartum pesticide excretion, and a study of breast milk samples collected from San Francisco Bay Area women, this research aimed to: 1) to determine whether persistent organic pollutants measured in the blood of CHAMACOS participants are associated with shortened lactation duration; 2) to measure and compare the chemical concentrations of OPs, OCs, carbamates, pyrethroids, and PCBs in the milk of women residing in an rural area with those of women residing in an urban region; and 3) to investigate whether concentrations of two non-persistent pesticides highly detected in milk are correlated with concentrations measured in other biological samples and determine the potential predictors or sources of maternal exposure. Maternal concentrations of potentially endocrine disrupting chemicals measured in maternal serum were not associated with shortened lactation duration. Breast milk samples from
1
urban and agricultural populations contained all of the persistent chemicals measured and the non-persistent pesticides, chlorpyrifos and permethrin. Concentrations of these two non-persistent pesticides were positively, but not statistically significantly correlated with concentrations measured in the plasma and urine of the same women. Lastly, some dietary and household factors may be potential sources of exposure to the mothers studied. The proposed research will provide information on maternal exposure and lactational exposure of non-persistent and persistent pesticides and PCBs to our most sensitive population, infants. Understanding whether lactation is potentially disrupted and the extent of dietary exposures to infants will allow for informed policy decisions regarding the use of pesticides and for the design of effective interventions in order to ensure the safety of this food for infants.
2

Dedication
This work is dedicated to: my incredibly supportive and understanding
mother, father, husband and children.
i
Table of Contents Abstract.......................................................................................................................................... 1 Dedication....................................................................................................................................... i Table of Contents........................................................................................................................... ii List of Figures................................................................................................................................ v List of Tables ................................................................................................................................. v List of Abbreviations ................................................................................................................... vii Acknowledgments ........................................................................................................................ ix Chapter 1 Introduction ................................................................................................................................... 1 A. Overview................................................................................................................................... 1 B. Background and Significance ................................................................................................... 2
1. Public Health Significance ................................................................................................ 2 2. Physiology of Lactation and Toxicokinetics of Selected Pesticides ................................. 3 3. Endocrine disruption.......................................................................................................... 4 4. Human Exposure to and Health Effects of Persistent Chemicals...................................... 5
a. Intake and Metabolism of DDT & DDE............................................................................ 6 b. Health Effects of DDT & DDE ......................................................................................... 6
5. Human Exposure to and Health Effects of Non-persistent pesticides............................... 7 a. Intake and Metabolism of Chlorpyrifos............................................................................. 7 b. Health Effects of Chlorpyrifos........................................................................................... 8
6. Exposure, Metabolism And Health Effects of Permethrin ................................................ 9 7. Biomonitoring: Measuring Chemicals in Biological Samples .......................................... 9 8. Summary.......................................................................................................................... 11 9. A Comment on Co-Author Contribution......................................................................... 11
C. References............................................................................................................................... 12 Chapter 2 Serum persistent organic pollutants and duration of lactation among Mexican-American women ......................................................................................................................................... 20 A. Chapter Summary ................................................................................................................... 20 B. Introduction............................................................................................................................. 21 C. Materials and Methods............................................................................................................ 22
1. Study Population.............................................................................................................. 22 2. Procedure ......................................................................................................................... 22 3. Sample Collection and Laboratory Analyses .................................................................. 22 4. Endocrine Disruption Categories..................................................................................... 23 5. Statistical Methods .......................................................................................................... 23
D. Results..................................................................................................................................... 25 E. Discussion ............................................................................................................................... 27 F. Conclusions ............................................................................................................................. 29 G. References............................................................................................................................... 30 H. Tables...................................................................................................................................... 35
ii

Chapter 3 Pesticides and PCBs in the breast milk of women residing in urban and agricultural communities of California ........................................................................................................... 40 A. Chapter Summary ................................................................................................................... 40 B. Introduction............................................................................................................................. 41 C. Methods................................................................................................................................... 41
1. Study populations ............................................................................................................ 41 2. Sample collection and laboratory analyses...................................................................... 42 3. Statistical methods ........................................................................................................... 43 4. Examination of variation in concentrations over time..................................................... 44
D. Results..................................................................................................................................... 44 1. Demographics .................................................................................................................. 44 2. Detection and chemical concentrations ........................................................................... 45 3. Variability of chemical concentrations for urban women ............................................... 46
E. Discussion ............................................................................................................................... 47 F. References ............................................................................................................................... 51 G. Tables...................................................................................................................................... 55 H. Figures .................................................................................................................................... 58 Chapter 4 Predictors of chlorpyrifos and permethrin in human milk and relationships with maternal biomarkers measured in blood and urine..................................................................................... 61 A. Chapter Summary ................................................................................................................... 61 B. Introduction............................................................................................................................. 62 C. Methods................................................................................................................................... 64
1. Study population.............................................................................................................. 64 2. Interviews and home inspections..................................................................................... 64 3. Sample collection and laboratory analyses...................................................................... 64 4. Statistical methods ........................................................................................................... 66
D. Results..................................................................................................................................... 68 1. Demographics .................................................................................................................. 68 2. Chlorpyrifos and permethrin biomarker concentrations and relationships between measurements in milk, plasma and urine................................................................................. 68 3. Predictors of chlorpyrifos concentrations in milk (not lipid-adjusted)............................ 69 4. Predictors of chlorpyrifos concentrations in milk (lipid-adjusted).................................. 69 5. Predictors of chlorpyrifos concentrations in milk (lipid as a fixed covariate) ................ 70 6. Predictors of permethrin concentrations in milk (not lipid-adjusted).............................. 70 7. Predictors of permethrin concentrations in milk (lipid-adjusted).................................... 71 8. Predictors of permethrin concentrations in milk (lipid as a fixed covariate) .................. 71 9. Model selection based on backward elimination............................................................. 71
E. Discussion ............................................................................................................................... 72 F. References ............................................................................................................................... 77 G. Tables...................................................................................................................................... 82 Chapter 5 Conclusion ................................................................................................................................... 91
iii
A. Overview................................................................................................................................. 91 B. Summary of Findings.............................................................................................................. 91
1. Endocrine disruption of lactation .................................................................................... 91 2. Measuring concentrations and variability of pesticides and PCBs in breast milk........... 92 3. Determinants of chlorpyrifos and permethrin in milk and correlations of concentrations in plasma and urine.................................................................................................................. 92
C. Public Health Implications...................................................................................................... 93 1. Policy implications and recommendations ...................................................................... 93 2. Breast milk biomonitoring and implications for breastfeeding ....................................... 94
D. Future Directions .................................................................................................................... 94 E. References ............................................................................................................................... 95
iv
List of Figures Chapter 1
Figure 1. DDT and DDE isomers ........................................................................................... 5 Figure 2. Structures of chlorpyrifos and chlorpyrifos-methyl ................................................ 7
Chapter 3
Figure 1. Changes over time of concentrations (pg/g milk) of (A) p,p’-DDE, (B) Chlorpyrifos, and (C) trans-Permethrin in milk from six urban women who provided sample collection dates .................................................................................................... 58
List of Tables Chapter 2
Table 1. Endocrine disruption categories based on published literature. ............................. 35 Table 2. Characteristics of CHAMACOS participants (N=366), Salinas Valley,California,
1999-2000........................................................................................................................ 36 Table 3. Median duration of lactation from Kaplan-Meier plots by quartiles of persistent
organic pollutant concentrations for all participants and stratified by breastfeeding history, Salinas, California, 1999-2000. .......................................................................... 37
Table 4. Relationships between log-transformed persistent organic pollutant (POP) concentrations in maternal blood drawn at 26 weeks gestation and hazard of weaning . 38
Table 5. Adjusted associations of endocrine-disrupting POPs summarized by principal component analysis and duration of lactation, stratified by breastfeeding history.......... 39
Chapter 3
Table 1. Detection frequencies and sample-specific limit of detection summary statistics (in pg/g milk) by chemical class for all chemicals measured in the milk of women residing in urban and agricultural communities of California....................................................... 55
Table 2. Summary statistics and comparisons of chemical concentrations (in pg/g milk) measured with greater than 50% detection frequency in the milk of women residing in urban and agricultural regions of California.................................................................... 56
Table 3. Within- and between-woman variability and intraclass correlation (ICC) of log10-transformed concentrations (in pg/g milk) of chemicals with greater than 50% detection frequency measured in milk of urban women ................................................................. 57
Chapter 4
Table 1a. Categorical demographic and residential characteristics of CHAMACOS women with measurements of chlorpyrifos and permethrin in milk collected near delivery (N=59) ............................................................................................................................. 82
Table 1b. Continuous maternal, dietary and residential characteristics of CHAMACOS women with measurements of chlorpyrifos and permethrin in milk collected near delivery (N=59) ............................................................................................................... 83
v
Table 2. Concentrations of chlorpyrifos and permethrin or their metabolites in milk, plasma and urine and Spearman correlations (Rs) between milk and other matrices ..... 84
Table 3a. Bivariate analyses of potential predictors of chlorpyrifos concentrations in milk collected within two months postpartum......................................................................... 85
Table 3b. Bivariate analyses of potential predictors of lipid-adjusted chlorpyrifos concentrations in milk collected within two months postpartum .................................... 86
Table 3c. Analyses of potential predictors of chlorpyrifos concentrations in milk collected within two months postpartum, controlling for lipid fraction of milk............................. 87
Table 4a. Bivariate analyses of potential predictors of permethrin concentrations in milk collected within two months postpartum......................................................................... 88
Table 4b. Bivariate analyses of potential predictors of lipid-adjusted permethrin concentrations in milk collected within two months postpartum .................................... 89
Table 4c. Analyses of potential predictors of permethrin concentrations in milk collected within two months postpartum, controlling for lipid fraction of milk............................. 90
vi
List of Abbreviations 3-PBA: 3-phenoxybenzoic acid 95%CI: 95% Confidence Interval AAP: American Academy of Pediatrics ACN: Acetonitrile : Beta regression coefficient BDNF: Brain-derived neurotrophic factor BMI: Body Mass Index CDC: Centers for Disease Control and Prevention CHAMACOS: Center for the Health Assessment of Mothers and Children of Salinas DAP: Dialkylphosphate DCCA: trans-3-(2,2-dichlorovinyl)-2,2-dimethylcyclopropanecarboxylic acid DDA: Dichlorodiphenyl acetic acid DDD: Dichlorodiphenyldichloroethane DDE: Dichlorodiphenyl dichloroethylene DDT: Dichlorodiphenyl trichloroethane DEP: Diethylphosphate DETP: Diethylthiophosphate DF: Detection frequency DSA: Deletion/Substitution/Addition EPA: Environmental Protection Agency FFQ: Food Frequency Questionnaire FPBA: Fluorophenoxybenzoic acid FQPA: Food Quality Protection Act g: Grams GC/HRMS: Gas Chromatography/High-Resolution Mass Spectrometry HCB: Hexachlorobenzene HCCH: Hexachlorocyclohexane HR: Hazard Ratio ICC: Intraclass Correlation Coefficient kg/m2: Kilograms per squared meter Kow: Octanol:water coefficient LOD: Limit of Detection N: Sample size n: Sample size of subset NCS: National Children’s study ND: Not detected ng/g: Nanogram per gram NHANES: National Health and Nutritional Examination Survey NIEHS: National Institute for Environmental Health Sciences NIOSH: National Institute for Occupational Safety and Health NLM: National Library of Medicine NMC: Natividad Medical Center nmol/g creatinine: Nanomoles per gram creatinine nmol/L: Nanomoles per liter urine
vii
OC: Organochlorine OP: Organophosphorous OPICN: OP ester-induced chronic neurotoxicity PCB: Polychlorinated biphenyl PCB: polychlorinated biphenyl pg/g: Picogram per gram POP: Persistent Organic Pollutant ppb: Part per billion PSA: Primary and secondary amine silica QSARs: Quantitative structure–activity relationships : CorrelationRED: Reregistration Eligibility Decision SD: Standard Deviation SES: Socioeconomic status TCPy: 3,5,6-trichloro-2-pyridinol U.S.: United States UNEP: United Nations Environment Programme UNICEF: United Nations Children's Fund WHO: World Health Organization WIC: The Special Supplemental Nutrition Program for Women, Infants, and Children
viii

Acknowledgments Above all, I would like to thank my wonderful advisors, Brenda Eskenazi and Nina Holland, whose dedication and support allowed me to successfully navigate through obstacles that regularly seemed to impede progression of my research. I would never have succeeded without your guidance and a few gentle nudges along the way. I also feel that I received the best possible advising well-rounded with your complimentary expertise in epidemiology, maternal and child health, exposure science, and laboratory analyses. You have both prepared me well to conduct my own research projects in the future and I will treasure all of the emotional and life advice that I received from you over the years. I am deeply grateful to my family for their constant love and support through my graduate career. To my husband, thank you for all of the personal sacrifices that you made in order for me to finish; I love you. To my son, Connor, I appreciate your spirited personality and sweetness that helped me to keep life in perspective when times were stressful. To my daughter, Maria, thank you for all of your wonderful singing and dancing that always makes me smile. To my unborn and unnamed daughter, thank you for the extra motivation to finish and file! To my parents, your unwavering belief in me and faith that God would lead me through my dissertation successfully helped me to have faith in myself. To Ned and Kathy, I could not have dreamed of in-laws as wonderful as you. Thank you for making so many things possible for me and our family. To my sisters, Cio and Nina, thank you for helping me in so many ways and for providing just the right amount of distraction. I gratefully acknowledge all of my dissertation committee members, co-authors and contributors to my research. To my dissertation committee members, Kathie Hammond and Alan Hubbard, I appreciate our thoughtful discussions and meetings and your abilities to help me both understand the minute details and step back from the trees to see the forest. I would like to thank my co-authors affiliated with CHAMACOS: Asa Bradman, for guidance and your understanding of the policy implications of this work; Kim Harley, for your patience and your comprehensive understanding of the CHAMACOS study details; Celina Trujillo, I appreciate all of your help in the midst of all of the juggling that you do; and Laura Fenster, for your positive attitude and constant words of encouragement. To my collaborators at the Centers for Disease Control and Prevention, Mark D. Davis, Dana B. Barr, this dissertation would not have been possible without you. I will forever be grateful for your belief in the project and your persistence to see it through. I would also like to acknowledge my friends and colleagues. To Lesliam Quiros Alcala, I will always remember fondly everything that we accomplished together. I am so grateful for your friendship, help and encouragement. We knew we would finish some day! To Raul Aguilar Schall, thank you for always allowing me to bounce ideas off of you and for your “unofficial” statistics advising. To Lisa Goldman Rosas, I can’t imagine graduate school without your friendship and support. We have grown and changed so much since we began our Master’s programs a decade ago and I appreciate your epidemiology expertise. Jonathan Chevrier, thank you for our in depth discussions about endocrine disruption, statistical analysis and so many other things; I have learned so much from you over the years. To all of my colleagues at the Center for Children’s Environmental Health Research, including Amy Marks, Michelle Vedar,
ix
Marcy Warner, Susan Neal, Katie Kogut, and Sonya Wyrobek, you all supported me in many different ways from friendship to help with data preparation and analysis and I thank you. Finally, this dissertation was supported by several grants including the National Institute of Occupational Safety & Health (RO1 OH007400), the US Environmental Protection Agency (EPA) (RD 83171001), and the National Institute of Environmental Health Sciences (PO1 ES009605. My graduate education would not have been possible without the assistance of the following fellowships including the U.S. Environmental Protection Agency Science to Achieve Results (STAR) Graduate Fellowship Program (U-91589301), the University of California, Berkeley Graduate Opportunity Program, the University of California, Toxic Substances Research and Teaching Program, the Oak Ridge Institute for Science and Education, the Preston Scholarship, and the research position provided by the China Benzene and Sperm Study (NIH R03ES015340). Ideas expressed in this dissertation are those of the author and collaborators and do not necessarily reflect the official views of the funders, CDC or the California Department of Public Health.
x
Chapter 1 Introduction A. OVERVIEW
The Food Quality Protection Act (FQPA) of 1996 requires the United States (U.S.) Environmental Protection Agency (EPA) to set pesticide tolerance levels in food and to ensure the safety of sensitive sub-populations, particularly pregnant women and children. The primary source of nutrition for many infants in the first six months of life is human milk. Although breast milk cannot be regulated, it is important to characterize chemical concentrations in milk in order to understand infant exposures and their potential health effects.
As a maternal excretory product, milk has the potential to contain mixtures of chemicals including organophosphate (OP), organochlorine (OC), carbamate, and pyrethroid pesticides and polychlorinated biphenyls (PCBs) that reflect maternal dietary and environmental exposures. Persistent OC pesticides such as dichlorodiphenyltrichloroethane (DDT) and its environmental degradate, dichlorodiphenyldichloroethylene (DDE), are known to bioaccumulate in fat and be excreted in human milk. Though OCs and PCBs have been banned in many countries, their continued biomonitoring in human milk provides a metric that can be compared across populations and allows us to observe changes in an individual’s body burden over time. In contrast, there are limited data on contemporary-use non-persistent pesticides, such as chlorpyrifos, in human milk and the extent of lactational exposures to U.S. infants is unclear. Many of these chemicals have been found to have health effects on neurological, endocrine and other systems; thus may not only interrupt a mother’s ability to lactate, but may also impair infant development.
The extensive questionnaire data and biological samples available from the Center for the Health Assessment of Mothers and Children of Salinas (CHAMACOS) birth cohort and its other auxiliary exposure studies have provided the opportunity to monitor potential endocrine disruption of lactation and to assess pesticide and other chemical concentrations in an agriculturally exposed population in the Salinas Valley of CA and an urban population drawn from the San Francisco Bay Area of CA. The main goals of this research were to understand whether endocrine-disrupting pesticides affect a mother’s ability to lactate and to then characterize infant exposure to non-persistent and persistent pesticides from human milk. The specific aims were: 1. To determine whether levels of potentially endocrine-disrupting persistent pesticides and environmental chemicals measured in maternal serum during pregnancy are associated with shortened lactation duration. Maternal serum samples collected during pregnancy from CHAMACOS women were analyzed for persistent chemicals that have been found to be endocrine disruptors, including DDT, DDE, and PCBs. Associations between these chemicals and mother’s lactation duration were then assessed. The more estrogenic chemicals, including DDT, were expected to be associated with the shortest lactation duration.
1
2. To measure the chemical concentrations of OPs, OCs, carbamates, pyrethroids, and PCBs in the milk of women residing in an agricultural community and in an urban community. Using a new method jointly developed by researchers at UC Berkeley and the Centers for Disease Control and Prevention, concentrations of OPs, OCs, carbamates, pyrethroids and PCBs were measured in breast milk collected from two demographically different populations in California: a low-income, primarily Mexican-American population recruited from the Salinas Valley and a higher income, educated population recruited from the San Francisco Bay Area. Detection frequencies and concentrations were reported. Due to the proximity to agricultural fields and former residence in Mexico, concentrations of both persistent and non-persistent pesticides were expected to be higher in milk samples collected from the women of the Salinas Valley. 3. To investigate whether concentrations of two non-persistent pesticides highly detected in milk are correlated with concentrations measured in other biological samples and determine the potential predictors or sources of maternal exposure. Using the same laboratory methods as described in Aim 2, concentrations of chlorpyrifos and permethrin were measured in breast milk collected from participants of the CHAMACOS study shortly after delivery. These concentrations were compared with concentrations of chlorpyrifos or permethrin or their metabolites measured in the plasma and urine of the same women also near delivery. Dietary, residential and occupational factors were also assessed for their associations with concentrations of chlorpyrifos and permethrin in breast milk. Concentrations were expected to be positively correlated across matrices and dietary and residential factors, through a take-home pathway, were expected to be associated with concentrations of these two chemicals in breast milk. B. BACKGROUND AND SIGNIFICANCE 1. Public Health Significance
For approximately one third of the world’s infants, breast milk is the only source of nutrition for the first four months of life.2 Maternal milk is a complete food that changes in composition over time to accommodate an infant’s dietary needs. Both the World Health Organization3, 4 and the American Academy of Pediatrics5 recommend exclusive breastfeeding for the first six months of an infant’s life due to its numerous benefits including improved infant immune function,6, 7 child neurodevelopment,8 and maternal/child bonding compared to formula-fed infants.9 Although maternal milk is the optimal food for infants, containing nutritional components such as vitamins A, C, E, K, fat, sugars, water, essential minerals, growth hormones, proteins, enzymes and antibodies, breast milk has also been shown to contain potentially harmful elements including viruses such as Human Immunodeficiency Virus10 and environmental chemicals such as the persistent OC pesticide, DDT.11-14 In recent years, some non-persistent pesticides such as the OP pesticides, chlorpyrifos, permethrin and malathion, have also been detected in human milk15-17 at part per billion levels. In animals, lactational transfer of one OP pesticide, malathion, has been associated with neurological effects.18 As public health practitioners, we need to ensure the safety of breast milk especially for infants of farmworkers who are at risk for higher pesticide exposures.
Exposures during the lactation period are of particular concern because they are occurring at critical developmental periods for the infant and because children may be more susceptible than adults to the hazards of chemicals. Their nervous, immune, digestive, and other systems are
2
still developing and their ability to metabolize or inactivate toxicants may be different. Compared to adults, young children eat more food, drink more fluids, and breathe more air in proportion to their weight, and their behavior, such as crawling and placing objects in their mouths, may result in greater exposure to pesticides.19 However, the potential negative effects of pesticides must be weighed against the benefits of their use, such as the use of DDT for control of malaria-carrying mosquitos in poor, tropical countries. Additionally, public health professionals are faced with the challenge of investigating potential health effects of chemicals in human milk while promoting breastfeeding practices.
2. Physiology of Lactation and Toxicokinetics of Selected Pesticides
The human breast is comprised of fat tissue, milk-producing alveoli, and milk ducts and blood vessels.20 Milk synthesis begins in the alveoli and the final product travels through the milk ducts and is ejected from the nipple. The process of lactogenesis is hormonally mediated and begins approximately 40 hours after birth of the human infant. Although the human breast is structurally able to produce milk after mid-pregnancy, the hormone, progesterone, inhibits lactation. The combination of high prolactin levels secreted by the pituitary and a fall in progesterone and estrogen levels after parturition allows for successful lactogenesis.21 Once lactogenesis has begun, two hormones, prolactin (responsible for milk production) and oxytocin (responsible for milk let-down and ejection), are needed to continue production.22 The continued excretion of these hormones depends on infant demand and milk removal from the breast, but high estrogen levels may also interfere with milk production.23
Within an individual, milk composition changes depending on stage of lactation (colostrum, transitional milk or mature milk) and duration of a single feeding (foremilk vs. hindmilk).24 In general, however, colostrum (the first milk stage) is comprised of 86% water, 2.3% fat, 8.6% protein, and 3.2% lactose while mature milk is comprised of 87% water, 4.5% fat, 1.1% protein, and 6.8% lactose. Foremilk, high lactose and low fat in composition, gradually transitions throughout a feeding to the high fat hindmilk.
The occurrence of chemical residues in human milk is determined by the extent of the exposure to the chemical and the properties of the chemicals. Persistent pesticides are known to partition into lipids in the body as evidenced, in part, by their high log octanol-water coefficients (Kows) which are typically above 6. Due to the small size of the molecule and lipophilic properties, persistent chemicals such as DDT and DDE readily penetrate the cellular barriers between blood plasma and mammary gland cells, and concentrate in the milk fat globules (globules of triglyceride surrounded by a lipid bilayer membrane).20, 25 The formation of milk by the mammary epithelial cells requires the production of milk triglycerides, which are formed both from blood lipids and from de novo synthesis. About 20% of the triglycerides are synthesized from medium-chain fatty acids in the mammary gland itself, the remaining 80% are derived from blood plasma, where lipophilic chemicals in the plasma can be easily incorporated. Many factors have been found to affect the variance in levels of persistent pesticides, such as DDT and its metabolites, in human milk including maternal age, occupation, weight change, parity, lactation history, diet, and cigarette smoking.26-29 In fact, lactation has been found to be a major route of excretion for persistent pesticides due to the mobilization of stored fats during a period of post-pregnancy weight loss.30 Lakind et al. formulated a model to estimate doses of DDE to nursing infants and found that, regardless of the exposure scenario simulated, infant body burdens of DDE increase rapidly at the start of lactation, but decrease after approximately 5–6 months, even if nursing continues. The maximum mean body burden of DDE was about 70
3
µg/kg lipid and occurred at approximately 6 months postpartum. By 24 months postpartum, the mean body burden of DDE was <10 µg/kg lipid, regardless of the duration of breast-feeding.31
Some non-persistent pesticides including chlorpyrifos and permethrin are also relatively lipophilic with log Kows of 4.96 for chlorpyrifos and 6.10 for permethrin. Few studies have measured non-persistent pesticides in human milk because they have been thought to readily decompose in the environment and be rapidly metabolized in the body,32-34 but at least one study in India has reported high concentrations of chlorpyrifos in breast milk and a South African study has shown high concentrations of pyrethroids, including permethrin, in breast milk.15, 17 Other international studies have found detectable concentrations of non-persistent pesticides in breast milk,16, 35 but no studies have biomonitored non-persistent pesticides in the breast milk of U.S. women. Although animal studies with acute exposures have shown that measurable levels of chlorpyrifos in milk are not present for more than a few days,36, 37 these studies do not address the potential for accumulation of non-persistent pesticides in milk from chronic, low-level exposures. 3. Endocrine disruption
The endocrine system is comprised of glands that produce hormones, hormones (chemical messengers) and receptors that bind and interpret the chemical messages that hormones deliver. These elements function together and communicate with each other through feedback loops to control biological processes including metabolism, blood sugar levels, growth and function of the reproductive system, and the development of the brain and nervous system.38 Some chemicals have been found to interfere with endocrine processes and are termed endocrine disruptors. These chemicals may bind to receptors and mimic the natural hormone leading to an increased response or a response at an inappropriate time. Once bound, endocrine-disrupting chemicals may also block a receptor from binding its natural hormone leading to decreased response. Endocrine disruptors can also act on the tissues that secrete the primary hormones in the feedback loops leading to over- or under-production of hormone without binding to receptors.39
There are several methods currently used to determine whether chemicals disrupt normal endocrine function of the reproductive system. Quantitative structure–activity relationships (QSARs) involve examining chemical structures and predicting which may have endocrine disrupting effects under the hypothesis that structurally similar molecules will behave similarly.40 The U.S. EPA is currently using a two-tiered approach to evaluate in vitro and in vivo tests for endocrine disruption.41 In vitro tests are the most widely used assays to screen chemicals for estrogenic or androgenic activity. These include measuring binding affinity to receptors, measuring proliferation of cells that are sensitive to estrogens or androgens and measuring products or enzymes that result from reporter gene assays.42 The E-SCREEN assay, which measures proliferation of MCF-7 breast cancer cells with exposure to potential xenoestrogens compared to natural estradiol, and the ligand binding assay using a recombinant human estrogen receptor have been found to be the most sensitive and easiest to perform in vitro assays that provide information on both binding and effect of potentially estrogenic chemicals.43 For testing androgenic activity of chemicals, the A-SCREEN assay (the equivalent of the E-SCREEN assay, but using MCF-7 cells that have been transfected with human androgen receptors) has been proposed as the most suitable bioassay available.42 In vivo tests such as the uterotrophic assay was historically considered the gold standard for estrogenic effects, but researchers found this assay to be insensitive compared to another type of in vivo assay that involves exposing animals
4
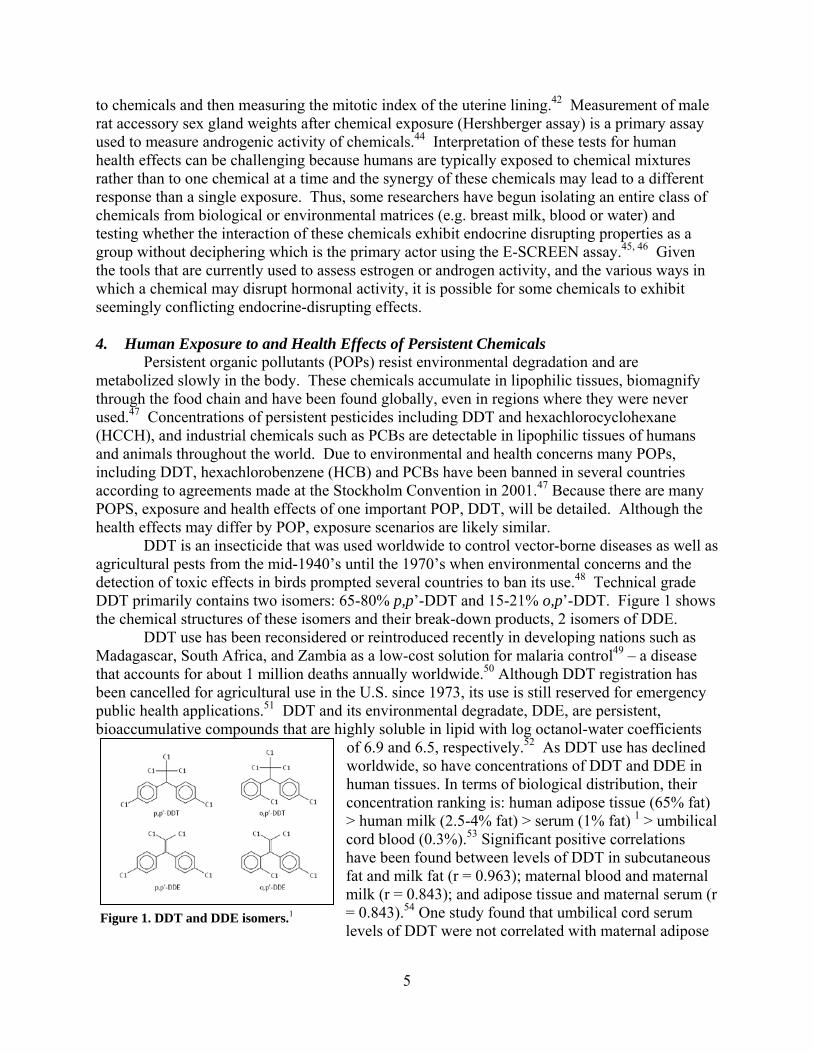
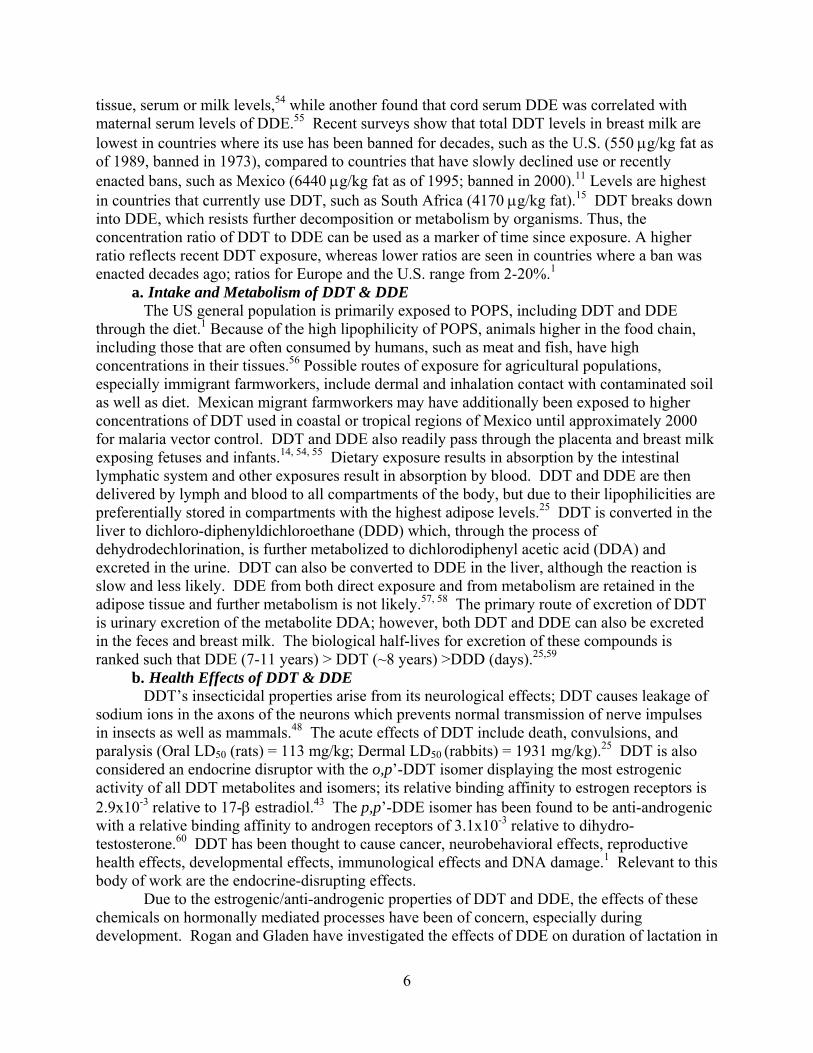
to chemicals and then measuring the mitotic index of the uterine lining.42 Measurement of male rat accessory sex gland weights after chemical exposure (Hershberger assay) is a primary assay used to measure androgenic activity of chemicals.44 Interpretation of these tests for human health effects can be challenging because humans are typically exposed to chemical mixtures rather than to one chemical at a time and the synergy of these chemicals may lead to a different response than a single exposure. Thus, some researchers have begun isolating an entire class of chemicals from biological or environmental matrices (e.g. breast milk, blood or water) and testing whether the interaction of these chemicals exhibit endocrine disrupting properties as a group without deciphering which is the primary actor using the E-SCREEN assay.45, 46 Given the tools that are currently used to assess estrogen or androgen activity, and the various ways in which a chemical may disrupt hormonal activity, it is possible for some chemicals to exhibit seemingly conflicting endocrine-disrupting effects. 4. Human Exposure to and Health Effects of Persistent Chemicals Persistent organic pollutants (POPs) resist environmental degradation and are metabolized slowly in the body. These chemicals accumulate in lipophilic tissues, biomagnify through the food chain and have been found globally, even in regions where they were never used.47 Concentrations of persistent pesticides including DDT and hexachlorocyclohexane (HCCH), and industrial chemicals such as PCBs are detectable in lipophilic tissues of humans and animals throughout the world. Due to environmental and health concerns many POPs, including DDT, hexachlorobenzene (HCB) and PCBs have been banned in several countries according to agreements made at the Stockholm Convention in 2001.47 Because there are many POPS, exposure and health effects of one important POP, DDT, will be detailed. Although the health effects may differ by POP, exposure scenarios are likely similar. DDT is an insecticide that was used worldwide to control vector-borne diseases as well as agricultural pests from the mid-1940’s until the 1970’s when environmental concerns and the detection of toxic effects in birds prompted several countries to ban its use.48 Technical grade DDT primarily contains two isomers: 65-80% p,p’-DDT and 15-21% o,p’-DDT. Figure 1 shows the chemical structures of these isomers and their break-down products, 2 isomers of DDE.
Figure 1. DDT and DDE isomers.1
DDT use has been reconsidered or reintroduced recently in developing nations such as Madagascar, South Africa, and Zambia as a low-cost solution for malaria control49 – a disease that accounts for about 1 million deaths annually worldwide.50 Although DDT registration has been cancelled for agricultural use in the U.S. since 1973, its use is still reserved for emergency public health applications.51 DDT and its environmental degradate, DDE, are persistent, bioaccumulative compounds that are highly soluble in lipid with log octanol-water coefficients
of 6.9 and 6.5, respectively.52 As DDT use has declined worldwide, so have concentrations of DDT and DDE in human tissues. In terms of biological distribution, their concentration ranking is: human adipose tissue (65% fat) > human milk (2.5-4% fat) > serum (1% fat) 1 > umbilical cord blood (0.3%).53 Significant positive correlations have been found between levels of DDT in subcutaneous fat and milk fat (r = 0.963); maternal blood and maternal milk (r = 0.843); and adipose tissue and maternal serum (r = 0.843).54 One study found that umbilical cord serum levels of DDT were not correlated with maternal adipose
5
tissue, serum or milk levels,54 while another found that cord serum DDE was correlated with maternal serum levels of DDE.55 Recent surveys show that total DDT levels in breast milk are lowest in countries where its use has been banned for decades, such as the U.S. (550 g/kg fat as of 1989, banned in 1973), compared to countries that have slowly declined use or recently enacted bans, such as Mexico (6440 g/kg fat as of 1995; banned in 2000).11 Levels are highest in countries that currently use DDT, such as South Africa (4170 g/kg fat).15 DDT breaks down into DDE, which resists further decomposition or metabolism by organisms. Thus, the concentration ratio of DDT to DDE can be used as a marker of time since exposure. A higher ratio reflects recent DDT exposure, whereas lower ratios are seen in countries where a ban was enacted decades ago; ratios for Europe and the U.S. range from 2-20%.1
a. Intake and Metabolism of DDT & DDE The US general population is primarily exposed to POPS, including DDT and DDE
through the diet.1 Because of the high lipophilicity of POPS, animals higher in the food chain, including those that are often consumed by humans, such as meat and fish, have high concentrations in their tissues.56 Possible routes of exposure for agricultural populations, especially immigrant farmworkers, include dermal and inhalation contact with contaminated soil as well as diet. Mexican migrant farmworkers may have additionally been exposed to higher concentrations of DDT used in coastal or tropical regions of Mexico until approximately 2000 for malaria vector control. DDT and DDE also readily pass through the placenta and breast milk exposing fetuses and infants.14, 54, 55 Dietary exposure results in absorption by the intestinal lymphatic system and other exposures result in absorption by blood. DDT and DDE are then delivered by lymph and blood to all compartments of the body, but due to their lipophilicities are preferentially stored in compartments with the highest adipose levels.25 DDT is converted in the liver to dichloro-diphenyldichloroethane (DDD) which, through the process of dehydrodechlorination, is further metabolized to dichlorodiphenyl acetic acid (DDA) and excreted in the urine. DDT can also be converted to DDE in the liver, although the reaction is slow and less likely. DDE from both direct exposure and from metabolism are retained in the adipose tissue and further metabolism is not likely.57, 58 The primary route of excretion of DDT is urinary excretion of the metabolite DDA; however, both DDT and DDE can also be excreted in the feces and breast milk. The biological half-lives for excretion of these compounds is ranked such that DDE (7-11 years) > DDT (~8 years) >DDD (days).25,59
b. Health Effects of DDT & DDE DDT’s insecticidal properties arise from its neurological effects; DDT causes leakage of sodium ions in the axons of the neurons which prevents normal transmission of nerve impulses in insects as well as mammals.48 The acute effects of DDT include death, convulsions, and paralysis (Oral LD50 (rats) = 113 mg/kg; Dermal LD50 (rabbits) = 1931 mg/kg).25 DDT is also considered an endocrine disruptor with the o,p’-DDT isomer displaying the most estrogenic activity of all DDT metabolites and isomers; its relative binding affinity to estrogen receptors is 2.9x10⁻³ relative to 17- estradiol.43 The p,p’-DDE isomer has been found to be anti-androgenic with a relative binding affinity to androgen receptors of 3.1x10⁻³ relative to dihydro-testosterone.60 DDT has been thought to cause cancer, neurobehavioral effects, reproductive health effects, developmental effects, immunological effects and DNA damage.1 Relevant to this body of work are the endocrine-disrupting effects.
Due to the estrogenic/anti-androgenic properties of DDT and DDE, the effects of these chemicals on hormonally mediated processes have been of concern, especially during development. Rogan and Gladen have investigated the effects of DDE on duration of lactation in
6
two different populations and have found decreased lactation duration with increasing levels of p,p’-DDE measured in breast milk.61, 62 Median DDE levels were 3.4 g/g breast milk fat in the Mexican cohort and 1.4 g/g breast milk fat in the North Carolina cohort. This association was confirmed recently in a retrospective cohort of Michigan women where higher serum DDE levels were associated with decreased duration of lactation. 63 Elevated DDE levels have also been associated with preterm delivery,64-66 decreased birthweight,65, 67, 68 shorter stature in girls,69 increased growth in boys,70 and decreased mental and psychomotor development of young children.71-73 Lastly, high DDT concentrations in human milk have been associated with decreased mental capacities among 15 year-old adolescents.74
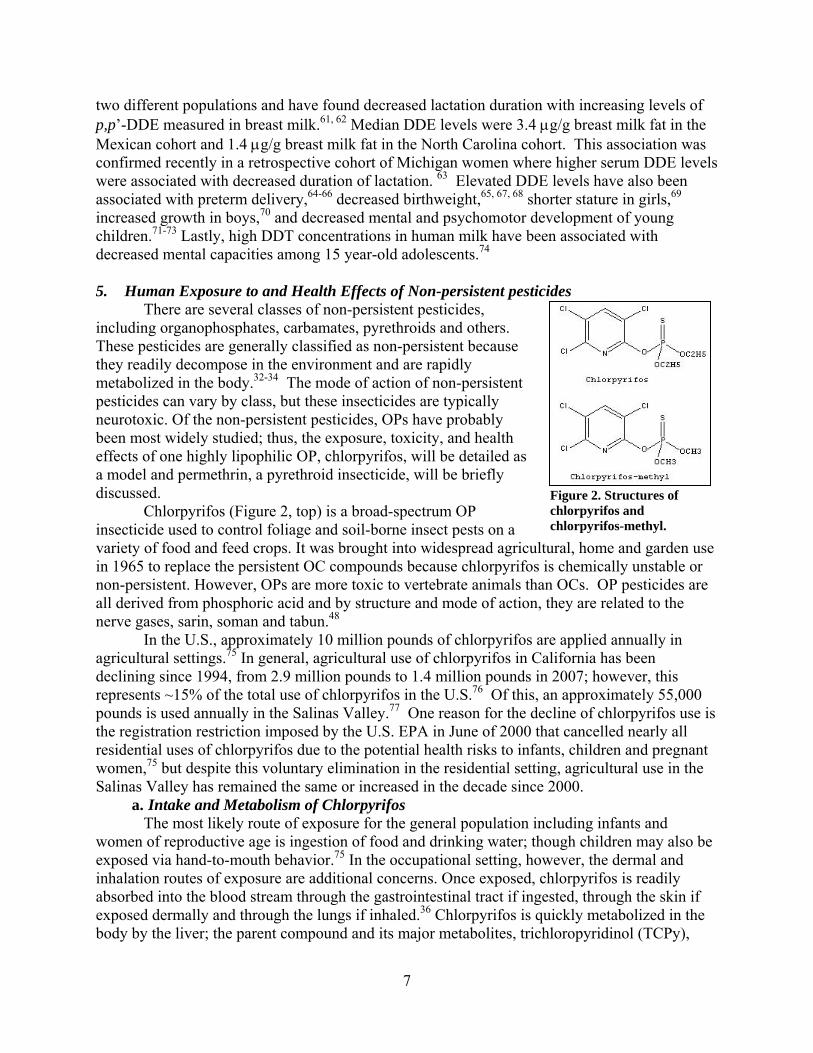
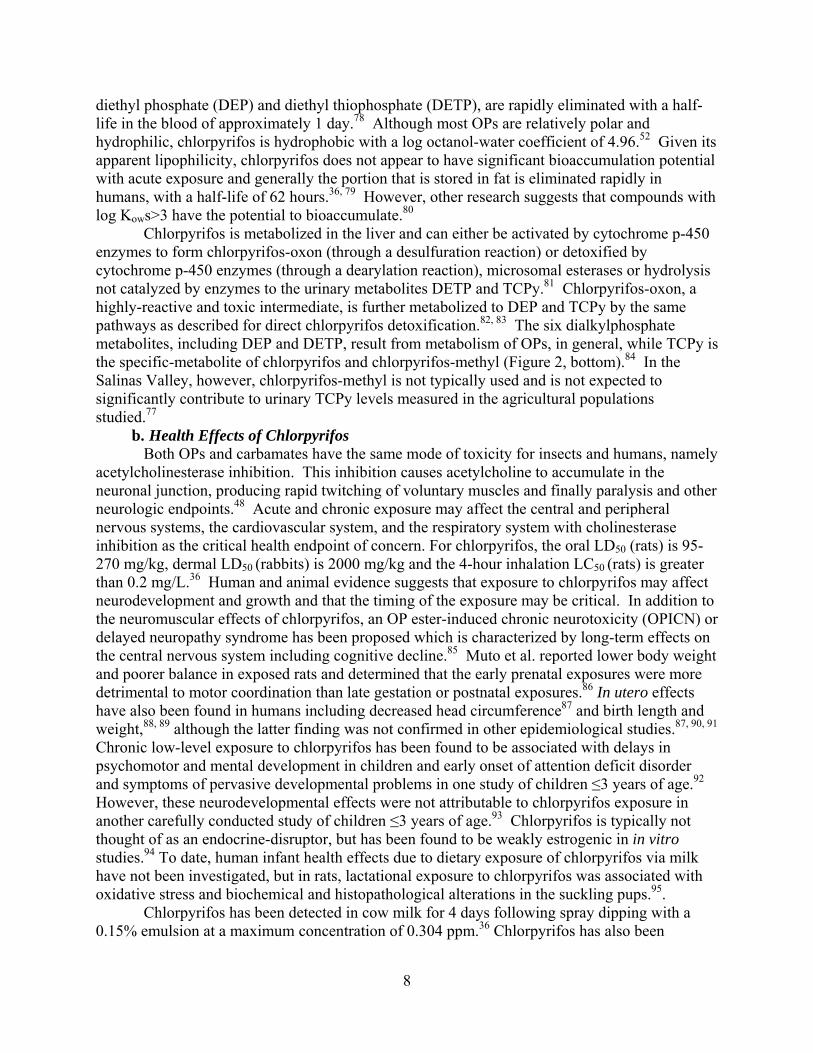
Figure 2. Structures of chlorpyrifos and chlorpyrifos-methyl.
5. Human Exposure to and Health Effects of Non-persistent pesticides There are several classes of non-persistent pesticides,
including organophosphates, carbamates, pyrethroids and others. These pesticides are generally classified as non-persistent because they readily decompose in the environment and are rapidly metabolized in the body.32-34 The mode of action of non-persistent pesticides can vary by class, but these insecticides are typically neurotoxic. Of the non-persistent pesticides, OPs have probably been most widely studied; thus, the exposure, toxicity, and health effects of one highly lipophilic OP, chlorpyrifos, will be detailed as a model and permethrin, a pyrethroid insecticide, will be briefly discussed.
Chlorpyrifos (Figure 2, top) is a broad-spectrum OP insecticide used to control foliage and soil-borne insect pests on a variety of food and feed crops. It was brought into widespread agricultural, home and garden use in 1965 to replace the persistent OC compounds because chlorpyrifos is chemically unstable or non-persistent. However, OPs are more toxic to vertebrate animals than OCs. OP pesticides are all derived from phosphoric acid and by structure and mode of action, they are related to the nerve gases, sarin, soman and tabun.48
In the U.S., approximately 10 million pounds of chlorpyrifos are applied annually in agricultural settings.75 In general, agricultural use of chlorpyrifos in California has been declining since 1994, from 2.9 million pounds to 1.4 million pounds in 2007; however, this represents ~15% of the total use of chlorpyrifos in the U.S.76 Of this, an approximately 55,000 pounds is used annually in the Salinas Valley.77 One reason for the decline of chlorpyrifos use is the registration restriction imposed by the U.S. EPA in June of 2000 that cancelled nearly all residential uses of chlorpyrifos due to the potential health risks to infants, children and pregnant women,75 but despite this voluntary elimination in the residential setting, agricultural use in the Salinas Valley has remained the same or increased in the decade since 2000.
a. Intake and Metabolism of Chlorpyrifos The most likely route of exposure for the general population including infants and women of reproductive age is ingestion of food and drinking water; though children may also be exposed via hand-to-mouth behavior.75 In the occupational setting, however, the dermal and inhalation routes of exposure are additional concerns. Once exposed, chlorpyrifos is readily absorbed into the blood stream through the gastrointestinal tract if ingested, through the skin if exposed dermally and through the lungs if inhaled.36 Chlorpyrifos is quickly metabolized in the body by the liver; the parent compound and its major metabolites, trichloropyridinol (TCPy),
7
diethyl phosphate (DEP) and diethyl thiophosphate (DETP), are rapidly eliminated with a half-life in the blood of approximately 1 day.78 Although most OPs are relatively polar and hydrophilic, chlorpyrifos is hydrophobic with a log octanol-water coefficient of 4.96.52 Given its apparent lipophilicity, chlorpyrifos does not appear to have significant bioaccumulation potential with acute exposure and generally the portion that is stored in fat is eliminated rapidly in humans, with a half-life of 62 hours.36, 79 However, other research suggests that compounds with log Kows>3 have the potential to bioaccumulate.80 Chlorpyrifos is metabolized in the liver and can either be activated by cytochrome p-450 enzymes to form chlorpyrifos-oxon (through a desulfuration reaction) or detoxified by cytochrome p-450 enzymes (through a dearylation reaction), microsomal esterases or hydrolysis not catalyzed by enzymes to the urinary metabolites DETP and TCPy.81 Chlorpyrifos-oxon, a highly-reactive and toxic intermediate, is further metabolized to DEP and TCPy by the same pathways as described for direct chlorpyrifos detoxification.82, 83 The six dialkylphosphate metabolites, including DEP and DETP, result from metabolism of OPs, in general, while TCPy is the specific-metabolite of chlorpyrifos and chlorpyrifos-methyl (Figure 2, bottom).84 In the Salinas Valley, however, chlorpyrifos-methyl is not typically used and is not expected to significantly contribute to urinary TCPy levels measured in the agricultural populations studied.77
b. Health Effects of Chlorpyrifos Both OPs and carbamates have the same mode of toxicity for insects and humans, namely acetylcholinesterase inhibition. This inhibition causes acetylcholine to accumulate in the neuronal junction, producing rapid twitching of voluntary muscles and finally paralysis and other neurologic endpoints.48 Acute and chronic exposure may affect the central and peripheral nervous systems, the cardiovascular system, and the respiratory system with cholinesterase inhibition as the critical health endpoint of concern. For chlorpyrifos, the oral LD50 (rats) is 95-270 mg/kg, dermal LD50 (rabbits) is 2000 mg/kg and the 4-hour inhalation LC50 (rats) is greater than 0.2 mg/L.36 Human and animal evidence suggests that exposure to chlorpyrifos may affect neurodevelopment and growth and that the timing of the exposure may be critical. In addition to the neuromuscular effects of chlorpyrifos, an OP ester-induced chronic neurotoxicity (OPICN) or delayed neuropathy syndrome has been proposed which is characterized by long-term effects on the central nervous system including cognitive decline.85 Muto et al. reported lower body weight and poorer balance in exposed rats and determined that the early prenatal exposures were more detrimental to motor coordination than late gestation or postnatal exposures.86 In utero effects have also been found in humans including decreased head circumference87 and birth length and weight,88, 89 although the latter finding was not confirmed in other epidemiological studies.87, 90, 91 Chronic low-level exposure to chlorpyrifos has been found to be associated with delays in psychomotor and mental development in children and early onset of attention deficit disorder and symptoms of pervasive developmental problems in one study of children ≤3 years of age.92 However, these neurodevelopmental effects were not attributable to chlorpyrifos exposure in another carefully conducted study of children ≤3 years of age.93 Chlorpyrifos is typically not thought of as an endocrine-disruptor, but has been found to be weakly estrogenic in in vitro studies.94 To date, human infant health effects due to dietary exposure of chlorpyrifos via milk have not been investigated, but in rats, lactational exposure to chlorpyrifos was associated with oxidative stress and biochemical and histopathological alterations in the suckling pups.95. Chlorpyrifos has been detected in cow milk for 4 days following spray dipping with a 0.15% emulsion at a maximum concentration of 0.304 ppm.36 Chlorpyrifos has also been
8
detected in commercially available cow milk at levels ranging from 0.01 ppm37 to 0.06 ppm.96 Sanghi, et al. reported levels of chlorpyrifos in milk of 12 women living in India at a mean level of 0.230 + 0.024 ppm; although, the exposure scenario was not detailed.17 6. Exposure, Metabolism And Health Effects of Permethrin Permethrin, a pyrethroid insedticide, is used agriculturally, but is primarily used indoors and is a primary ingredient of many over-the-counter insecticides. According to the U.S. EPA, nationally, approximately 900,000 kg/year of permethrin are applied for agricultural, residential and public health uses.97 In California, 300,000 kg/year are applied by professionals.98
In insects and vertebrates, the main mode of action of permethrin is inhibition of nervous system functioning by binding to sodium channels causing repetitive firing of electric signals in the brain and body.97 Thus, permethrin has been found to have a variety of health effects including neurobehavioral, immunological, carcinogenic and endocrine-disrupting effects in animal models.97, 99 In adult animals, permethrin has been found to impair motor activity, schedule-controlled operant responding, grip strength, and induce increased acoustic-evoked startle response amplitude.100 In rodents, neonatal exposure to permethrin was associated with impaired brain development, open-field behaviors, striatal monoamine level, and increased oxidative stress.101 In a trans-generational study, permethrin impaired development of reflexes, swimming ability, open field activity and social behavior in the offspring of mice who were given permethrin prior to mating.102 Permethrin also appears to have estrogenic and potentially anti-androgenic endocrine-disrupting effects in rats.103, 104 Permethrin is a racemic mixture of cis and trans isomers. Metabolism in the liver results in many metabolites that are excreted in urine and feces.105 The urinary metabolites frequently monitored in humans include cis- and trans-3-(2,2-dichlorovinyl)-2,2-dimethylcyclopropanecarboxylic acid (DCCA), 3-phenoxybenzoic acid (3-PBA) and fluorophenoxybenzoic acid (FPBA).106, 107 Like chlorpyrifos, permethrin is considered non-persistent because it is rapidly metabolized in the body and quickly degrades in the environment.32-34 However, its log Kow (6.10) is higher than that of chlorpyrifos and nearly equal to that of the known persistent pesticide, DDT, which suggests the potential for bioaccumulation in adipose tissue and the lipid fractions of biological matrices.80, 108 Studies in South Africa and Switzerland have reported median concentrations of approximately 250 and 63 μg/kg lipid, respectively, for permethrin.15, 35 7. Biomonitoring: Measuring Chemicals in Biological Samples Biomonitoring has been a useful tool for assessing exposures to a wide variety of environmental chemicals including pesticides.53 In particular, biomonitoring studies have allowed the research community to: document the pervasiveness of pesticide exposures, determine the primary sources or pathways of exposure, investigate potential health risks associated with exposures, identify poisoning cases and ascertain etiologic agents in crisis situations.32 However, it is important to understand the limitations of biomonitoring including variability between and within individuals, stability or persistence of chemicals in biological samples and differences in limits of detection (LODs). Additionally, applying biomonitored data to studies of health effects is challenging because of the presence of chemical mixtures. Most biomonitoring studies in the literature have reported levels of a particular group of chemicals, such as OPs or OCs, from a single “snapshot” spot sample.30 The use of spot samples is reasonable as a marker of exposure to persistent compounds, but is less reliable for non-
9
persistent compounds where biological half-lives are on the order of days or hours leading to increased variability. Non-persistent chemicals are not only rapidly metabolized in the body, but are prone to break down in storage in a few years or less.53 The method LODs become particularly important for non-persistent chemicals where biological levels are expected to be low because of low exposure, rapid metabolism and degradation in the environment. Over the past 30 years, some chemicals, particularly POPs, have been measured in breast milk using a variety of laboratory methods. Prior breast milk biomonitoring methods reported LODs in the part per trillion range for OCs and PCBs and part per billion range for OPs17and pyrethroids.15, 109, 110 Many of those previous analytical methods of milk are limited in that: 1) generally only a few chemicals were monitored per analysis, 2) many methods used a large initial volume of milk (>10 mL), and 3) detection instrumentation with relatively low specificity has been used. The method used to measure pesticides and PCBs in the milk of women who participated in the studies presented in chapters 3 and 4 was jointly developed by researchers at the Centers for Disease Control and Prevention and the University of California, Berkeley. This method, which was able to accurately measure 24 analytes of various chemical classes, involved an initial separation of the analytes from 1 ml of breast milk (10 times less than older methods) using accelerated solvent extraction, extract clean-up using solid phase extraction cartridges filled with primary and secondary amine bonded silica (PSA) and Alumina, analysis using gas chromatography/high-resolution mass spectrometry (GC/HRMS)and quantitation by isotope dilution.111 Extraction recoveries for the analytes were as follows: 55 - 96% for OP insecticides, 34-56% for OC insecticides, and 28 - 31% for PCBs with accurate quantification within 10% of the expected concentrations. The analyte-specific limits of detection typically ranged approximately 1-5 pg/g milk (parts per trillion). This high sensitivity was made possible by using isotope dilution and GC/HRMS. The relative standard deviations of the measurements were less than 35%. This new method allowed for the measurement of many chemicals with different chemical properties and a potentially wide dynamic range in a matrix with high lipid content. Human milk is a unique matrix in that it can be used as a marker of exposure in mothers and a source of exposure to children.53 It is an important matrix to evaluate because exclusively breastfed infants are potentially exposed to chemicals during critical developmental windows. Exclusive breastfeeding is recommended for the first six months of an infant’s life, a period when brain and organ systems are rapidly developing.3, 112 In addition to the POPs that have historically been biomonitored in milk, non-persistent chemicals also need to be considered potential health threats to infants because they are more toxic to humans and because since they are currently used, chronic, low-level exposure to mothers and infants is likely. Biomonitoring of milk presents several challenges including the ethical issues of potentially dissuading mothers from breastfeeding due to concerns about toxic chemicals and of depriving the infant of a potential feeding. Therefore, researchers must consider the minimum volume needed for a sensitive method. Milk also presents challenges to method development because its composition changes throughout the course of a single feeding, throughout a single day and over the course of lactation duration30 with the lipid fraction being of particular importance because of potential analytic interference and because many chemicals tend to partition into the lipid fraction of breast milk.113 Lastly, applying biomonitoring data of non-persistent chemicals to epidemiological studies requires caution because levels of chemicals may be highly variable from day to day.
10
8. Summary Breastfeeding is extremely beneficial to both mother and infant and should be encouraged. However, concern has been expressed about potential health risks posed to infants from environmental chemicals in human milk. Environmental exposures to persistent and non-persistent chemicals combined with their toxicokinetic properties allow for the potential for mothers to unknowingly pass potentially harmful chemicals to their infants. Without adequate understanding of the exposures to infants and the health effects of pesticides in human milk, informed policy decisions regarding the use of pesticides cannot be made. 9. A Comment on Co-Author Contribution
Chapters 2, 3, and 4 are the result of collaborations with several co-authors who contributed invaluable insight to approaching the research and editorial comments; however, each of the chapters represents primarily the work of Ms. Weldon including deciding upon the research questions, performing all data analyses and drafting manuscripts/chapters.
11
C. REFERENCES
1. Rogan, W.J. and A. Chen, Health risks and benefits of bis(4-chlorophenyl)-1,1,1-trichloroethane (DDT). Lancet, Aug 27-Sep 2 2005. 366(9487): p. 763-73.
2. WHO, The WHO Global Data Bank on Breastfeeding and Complementary Feeding. 2006.
3. WHO, Global strategy for infant and young child feeding. . 2003, World Health Organization: Geneva.
4. Kramer, M.S. and R. Kakuma, The optimal duration of exclusive breastfeeding: A systematic review. 2002, World Health Organization: Geneva.
5. Gartner, L.M., J. Morton, R.A. Lawrence, A.J. Naylor, D. O'Hare, R.J. Schanler, and A.I. Eidelman, Breastfeeding and the use of human milk. Pediatrics, Feb 2005. 115(2): p. 496-506.
6. Hanson, L.A., M. Korotkova, and E. Telemo, Breast-feeding, infant formulas, and the immune system. Ann Allergy Asthma Immunol, Jun 2003. 90(6 Suppl 3): p. 59-63.
7. Hanson, L.A., M. Korotkova, S. Lundin, L. Haversen, S.A. Silfverdal, I. Mattsby-Baltzer, B. Strandvik, and E. Telemo, The transfer of immunity from mother to child. Ann N Y Acad Sci, Apr 2003. 987: p. 199-206.
8. Anderson, J.W., B.M. Johnstone, and D.T. Remley, Breast-feeding and cognitive development: a meta-analysis. Am J Clin Nutr, Oct 1999. 70(4): p. 525-35.
9. Leung, A.K. and R.S. Sauve, Breast is best for babies. J Natl Med Assoc, Jul 2005. 97(7): p. 1010-9.
10. McIntyre, J., Preventing mother-to-child transmission of HIV: successes and challenges. Bjog, Sep 2005. 112(9): p. 1196-203.
11. Smith, D., Worldwide trends in DDT levels in human breast milk. Int J Epidemiol, Apr 1999. 28(2): p. 179-88.
12. Rogan, W.J. and B.C. Gladen, Study of human lactation for effects of environmental contaminants: the North Carolina Breast Milk and Formula Project and some other ideas. Environ Health Perspect, May 1985. 60: p. 215-21.
13. Bates, M.N., B. Thomson, and N. Garrett, Reduction in organochlorine levels in the milk of New Zealand women. Arch Environ Health, Nov-Dec 2002. 57(6): p. 591-7.
14. Waliszewski, S.M., A.A. Aguirre, R.M. Infanzon, and J. Siliceo, Persistent organochlorine pesticide levels in maternal blood serum, colostrum, and mature milk. Bull Environ Contam Toxicol, Mar 2002. 68(3): p. 324-31.
15. Bouwman, H., B. Sereda, and H.M. Meinhardt, Simultaneous presence of DDT and pyrethroid residues in human breast milk from a malaria endemic area in South Africa. Environ Pollut, Dec 2006. 144(3): p. 902-17.
16. Lederman, S.A., Environmental contaminants in breast milk from the central Asian republics. Reprod Toxicol, Mar-Apr 1996. 10(2): p. 93-104.
17. Sanghi, R., M.K. Pillai, T.R. Jayalekshmi, and A. Nair, Organochlorine and organophosphorus pesticide residues in breast milk from Bhopal, Madhya Pradesh, India. Hum Exp Toxicol, Feb 2003. 22(2): p. 73-6.
18. Silva, A.P., F.C. Meotti, A.R. Santos, and M. Farina, Lactational exposure to malathion inhibits brain acetylcholinesterase in mice. Neurotoxicology, Apr 28 2006.
12
19. National Research Council, Pesticides in the Diets of Infants and Children. 1993, Washington, D.C.: National Academy Press.
20. Jensen, A.A. and S.A. Slorach, Chemical contaminants in human milk. 1990, Boca Raton CRC Press.
21. Neville, M.C. and M.R. Neifert, Lactation : physiology, nutrition, and breast-feeding. 1983, New York: Plenum Press.
22. Whitney, E.N., Understanding nutrition 9th edition. 2002, Belmont: Wadsworth. 23. Pena, K.S. and J.A. Rosenfeld, Evaluation and treatment of galactorrhea. Am Fam
Physician, May 1 2001. 63(9): p. 1763-70. 24. Jensen, R.G., The Handbook of Milk Composition. 1995, San Diego: Academic Press. 25. U.S. DHHS, Toxicological profile for DDT, DDE, and DDD. 2002, Atlanta, GA: U.S.
Dept. of Health and Human Services Public Health Service, Agency for Toxic Substances and Disease Registry. xix, 403.
26. Harris, C.A., M.W. Woolridge, and A.W. Hay, Factors affecting the transfer of organochlorine pesticide residues to breastmilk. Chemosphere, Apr 2001. 43(2): p. 243-56.
27. Bradt, P.T. and R.C. Herrenkohl, DDT in human milk. What determines the levels? Sci Total Environ, Sep 1976. 6(2): p. 161-3.
28. Mes, J., D.J. Davies, J. Doucet, D. Weber, and E. McMullen, Levels of chlorinated hydrocarbon residues in Canadian human breast milk and their relationship to some characteristics of the donors. Food Addit Contam, Jul-Aug 1993. 10(4): p. 429-41.
29. Rogan, W.J., B.C. Gladen, J.D. McKinney, N. Carreras, P. Hardy, J. Thullen, J. Tingelstad, and M. Tully, Polychlorinated biphenyls (PCBs) and dichlorodiphenyl dichloroethene (DDE) in human milk: effects of maternal factors and previous lactation. American Journal of Public Health., Feb 1986. 76(2): p. 172-7.
30. Fenton, S.E., M. Condon, A.S. Ettinger, J.S. LaKind, A. Mason, M. McDiarmid, Z. Qian, and S.G. Selevan, Collection and use of exposure data from human milk biomonitoring in the United States. J Toxicol Environ Health A, Oct 22 2005. 68(20): p. 1691-712.
31. LaKind, J.S., C.M. Berlin, C.N. Park, D.Q. Naiman, and N.J. Gudka, Methodology for characterizing distributions of incremental body burdens of 2,3,7,8-TCDD and DDE from breast milk in North American nursing infants. J Toxicol Environ Health A, Apr 28 2000. 59(8): p. 605-39.
32. Barr, D.B., Biomonitoring of exposure to pesticides Journal of Chemical Health and Safety, November-December 2008 2008. 15(6): p. 20-29.
33. Racke, J.D., Degradation of organophosphorous insecticides in environmental matrices. Organophosphates Chemistry, Fate and Effects. 1992, San Diego, CA: Academic Press, Inc.
34. Starr, J., S. Graham, D. Stout, 2nd, K. Andrews, and M. Nishioka, Pyrethroid pesticides and their metabolites in vacuum cleaner dust collected from homes and day-care centers. Environ Res, Nov 2008. 108(3): p. 271-9.
35. Zehringer, M. and A. Herrmann, Analysis of polychlorinated biphenyls, pyrethroid insecticides and fragrances in human milk using a laminar cup liner in the GC injector. European Food Research and Technology, 2001. 212(2): p. 247-251.
36. EXTOXNET, Extension Toxicology Network Pesticide Information Profiles for Chlorpyrifos. 1996.
13
37. Salas, J.H., M.M. Gonzalez, M. Noa, N.A. Perez, G. Diaz, R. Gutierrez, H. Zazueta, and I. Osuna, Organophosphorus pesticide residues in Mexican commercial pasteurized milk. J Agric Food Chem, Jul 16 2003. 51(15): p. 4468-71.
38. Hadley, M.E. and J.E. Levine, Endocrinology Sixth Edition. 2007, Upper Saddle River, NJ: Pearson Prentice Hall.
39. U.S. EPA. Endocrine Primer. 2010 [cited 2010 June 8]; Available from: http://www.epa.gov/endo/pubs/edspoverview/primer.htm#3.
40. Krishnan, V. and S. Safe, Polychlorinated biphenyls (PCBs), dibenzo-p-dioxins (PCDDs), and dibenzofurans (PCDFs) as antiestrogens in MCF-7 human breast cancer cells: quantitative structure-activity relationships. Toxicol Appl Pharmacol, May 1993. 120(1): p. 55-61.
41. U.S. EPA. Endocrine Disruptor Screening Program: Assays under consideration. 2010 April 22, 2010 [cited 2010 June 8]; Available from: http://www.epa.gov/endo/pubs/assayvalidation/consider.htm.
42. Soto, A.M., M.V. Maffini, C.M. Schaeberle, and C. Sonnenschein, Strengths and weaknesses of in vitro assays for estrogenic and androgenic activity. Best Pract Res Clin Endocrinol Metab, Mar 2006. 20(1): p. 15-33.
43. Andersen, H.R., A.M. Andersson, S.F. Arnold, H. Autrup, M. Barfoed, N.A. Beresford, P. Bjerregaard, L.B. Christiansen, B. Gissel, R. Hummel, E.B. Jorgensen, B. Korsgaard, R. Le Guevel, H. Leffers, J. McLachlan, A. Moller, J.B. Nielsen, N. Olea, A. Oles-Karasko, F. Pakdel, K.L. Pedersen, P. Perez, N.E. Skakkeboek, C. Sonnenschein, A.M. Soto, and et al., Comparison of short-term estrogenicity tests for identification of hormone-disrupting chemicals. Environ Health Perspect, Feb 1999. 107 Suppl 1: p. 89-108.
44. Yamada, T., T. Kunimatsu, H. Sako, S. Yabushita, T. Sukata, Y. Okuno, and M. Matsuo, Comparative evaluation of a 5-day Hershberger assay utilizing mature male rats and a pubertal male assay for detection of flutamide's antiandrogenic activity. Toxicol Sci, Feb 2000. 53(2): p. 289-96.
45. Fernandez, M.F., A. Rivas, F. Olea-Serrano, I. Cerrillo, J.M. Molina-Molina, P. Araque, J.L. Martinez-Vidal, and N. Olea, Assessment of total effective xenoestrogen burden in adipose tissue and identification of chemicals responsible for the combined estrogenic effect. Anal Bioanal Chem, May 2004. 379(1): p. 163-70.
46. Soto, A.M., C. Sonnenschein, K.L. Chung, M.F. Fernandez, N. Olea, and F.O. Serrano, The E-SCREEN assay as a tool to identify estrogens: an update on estrogenic environmental pollutants. Environ Health Perspect, Oct 1995. 103 Suppl 7: p. 113-22.
47. UNEP, Stockholm Convention on Persistent Organic Pollutants. Depositary notification C.N.531.2001.TREATIES-96 of 19 June 2001, United Nations Environment Program, Editor. 2001, United Nations.
48. Ware, G.W. and D.M. Whitacre, The pesticide book 6th edition. 6 ed. 2004, Willoughby MeisterPro Information Resources.
49. Longnecker, M.P., Invited Commentary: Why DDT Matters Now. Am J Epidemiol, Oct 15 2005. 162(8): p. 726-8.
50. Greenwood, B.M., K. Bojang, C.J. Whitty, and G.A. Targett, Malaria. Lancet, Apr 23-29 2005. 365(9469): p. 1487-98.
51. Farm Chemicals Handbook. 2002. 88. 52. Corporation, S.R., Interactive PhysProp Database Demo. 2006.
14

53. Barr, D.B., R.Y. Wang, and L.L. Needham, Biologic monitoring of exposure to environmental chemicals throughout the life stages: requirements and issues for consideration for the National Children's Study. Environ Health Perspect, Aug 2005. 113(8): p. 1083-91.
54. Kanja, L.W., J.U. Skaare, S.B. Ojwang, and C.K. Maitai, A comparison of organochlorine pesticide residues in maternal adipose tissue, maternal blood, cord blood, and human milk from mother/infant pairs. Arch Environ Contam Toxicol, Jan 1992. 22(1): p. 21-4.
55. Skaare, J.U., J.M. Tuveng, and H.A. Sande, Organochlorine pesticides and polychlorinated biphenyls in maternal adipose tissue, blood, milk, and cord blood from mothers and their infants living in Norway. Arch Environ Contam Toxicol, Jan 1988. 17(1): p. 55-63.
56. Jaga, K. and H. Duvvi, Risk reduction for DDT toxicity and carcinogenesis through dietary modification. J R Soc Health, Jun 2001. 121(2): p. 107-13.
57. Hayes, W.J., Jr., W.E. Dale, and C.I. Pirkle, Evidence of safety of long-term, high, oral doses of DDT for man. Arch Environ Health, Jan 1971. 22(1): p. 119-35.
58. Morgan, D.P. and C.C. Roan, Absorption, storage, and metabolic conversion of ingested DDT and DDT metabolites in man. Arch Environ Health, Mar 1971. 22(3): p. 301-8.
59. Wolff, M.S., A. Zeleniuch-Jacquotte, N. Dubin, and P. Toniolo, Risk of breast cancer and organochlorine exposure. Cancer Epidemiol Biomarkers Prev, Mar 2000. 9(3): p. 271-7.
60. Freyberger, A. and H.J. Ahr, Development and standardization of a simple binding assay for the detection of compounds with affinity for the androgen receptor. Toxicology, Feb 15 2004. 195(2-3): p. 113-26.
61. Gladen, B.C. and W.J. Rogan, DDE and shortened duration of lactation in a northern Mexican town. American Journal of Public Health., Apr 1995. 85(4): p. 504-8.
62. Rogan, W.J., B.C. Gladen, J.D. McKinney, N. Carreras, P. Hardy, J. Thullen, J. Tingelstad, and M. Tully, Polychlorinated biphenyls (PCBs) and dichlorodiphenyl dichloroethene (DDE) in human milk: effects on growth, morbidity, and duration of lactation. American Journal of Public Health., Oct 1987. 77(10): p. 1294-7.
63. Karmaus, W., S. Davis, C. Fussman, and K. Brooks, Maternal concentration of dichlorodiphenyl dichloroethylene (DDE) and initiation and duration of breast feeding. Paediatric and Perinatal Epidemiology, Sep 2005. 19(5): p. 388-98.
64. Saxena, M.C., M.K. Siddiqui, T.D. Seth, C.R. Krishna Murti, A.K. Bhargava, and D. Kutty, Organochlorine pesticides in specimens from women undergoing spontaneous abortion, premature of full-term delivery. J Anal Toxicol, Jan-Feb 1981. 5(1): p. 6-9.
65. Longnecker, M.P., M.A. Klebanoff, H. Zhou, and J.W. Brock, Association between maternal serum concentration of the DDT metabolite DDE and preterm and small-for-gestational-age babies at birth. Lancet, Jul 14 2001. 358(9276): p. 110-4.
66. Torres-Arreola, L., G. Berkowitz, L. Torres-Sanchez, M. Lopez-Cervantes, M.E. Cebrian, M. Uribe, and L. Lopez-Carrillo, Preterm birth in relation to maternal organochlorine serum levels. Ann Epidemiol, Mar 2003. 13(3): p. 158-62.
67. Weisskopf, M.G., H.A. Anderson, L.P. Hanrahan, M.S. Kanarek, C.M. Falk, D.M. Steenport, and L.A. Draheim, Maternal exposure to Great Lakes sport-caught fish and dichlorodiphenyl dichloroethylene, but not polychlorinated biphenyls, is associated with reduced birth weight. Environ Res, Feb 2005. 97(2): p. 149-62.
15
68. Siddiqui, M.K., S. Srivastava, S.P. Srivastava, P.K. Mehrotra, N. Mathur, and I. Tandon, Persistent chlorinated pesticides and intra-uterine foetal growth retardation: a possible association. Int Arch Occup Environ Health, Feb 2003. 76(1): p. 75-80.
69. Karmaus, W., S. Asakevich, A. Indurkhya, J. Witten, and H. Kruse, Childhood growth and exposure to dichlorodiphenyl dichloroethene and polychlorinated biphenyls. J Pediatr, Jan 2002. 140(1): p. 33-9.
70. Gladen, B.C., N.B. Ragan, and W.J. Rogan, Pubertal growth and development and prenatal and lactational exposure to polychlorinated biphenyls and dichlorodiphenyl dichloroethene. J Pediatr, Apr 2000. 136(4): p. 490-6.
71. Eskenazi, B., A.R. Marks, A. Bradman, L. Fenster, C. Johnson, D.B. Barr, and N.P. Jewell, In utero exposure to dichlorodiphenyltrichloroethane (DDT) and dichlorodiphenyldichloroethylene (DDE) and neurodevelopment among young Mexican American children. Pediatrics, Jul 2006. 118(1): p. 233-41.
72. Ribas-Fito, N., E. Cardo, M. Sala, M. Eulalia de Muga, C. Mazon, A. Verdu, M. Kogevinas, J.O. Grimalt, and J. Sunyer, Breastfeeding, exposure to organochlorine compounds, and neurodevelopment in infants. Pediatrics, May 2003. 111(5 Pt 1): p. e580-5.
73. Ribas-Fito, N., M. Torrent, D. Carrizo, L. Munoz-Ortiz, J. Julvez, J.O. Grimalt, and J. Sunyer, In Utero Exposure to Background Concentrations of DDT and Cognitive Functioning among Preschoolers. Am J Epidemiol, Sep 12 2006.
74. Dorner, G. and A. Plagemann, DDT in human milk and mental capacities in children at school age: an additional view on PISA 2000. Neuro Endocrinol Lett, Oct-Dec 2002. 23(5-6): p. 427-31.
75. U.S. EPA, Interim reregistration eligibility decision for chlorpyrifos, in EPA 738-R-01-007. 2002.
76. DPR, Pesticide Use Report, Annual 2007, Indexed by Chemical and by Crop. 2007, Department of Pesticide Regulation, California Environmental Protection Agency: Sacramento, CA.
77. DPR, Pesticide Use Report, Annual 2003, Indexed by Chemical and by Crop. 2003, Department of Pesticide Regulation, California Environmental Protection Agency: Sacramento, CA.
78. NIOSH, The Registry of Toxic Effects of Chemical Substances: RTECS #: TF6300000 (Chlorpyrifos). May 2006.
79. Hayes, W.J. and E.R. Laws, eds. Handbook of Pesticide Toxicology. Organic phosphorus pesticides, ed. M.A.a.L. Gallo, N. J. . 1991, Academic Press: New York.
80. Thomann, R.V., Modeling organic chemical fate in aquatic systems: significance of bioaccumulation and relevant time-space scales. Environ Health Perspect, Jun 1995. 103 Suppl 5: p. 53-7.
81. Sultatos, L.G., M. Shao, and S.D. Murphy, The role of hepatic biotransformation in mediating the acute toxicity of the phosphorothionate insecticide chlorpyrifos. Toxicol Appl Pharmacol, Mar 30 1984. 73(1): p. 60-8.
82. Barr, D.B. and J. Angerer, Potential uses of biomonitoring data: a case study using the organophosphorus pesticides chlorpyrifos and malathion. Environ Health Perspect, Nov 2006. 114(11): p. 1763-9.
16
83. Needham, L.L., Assessing exposure to organophosphorus pesticides by biomonitoring in epidemiologic studies of birth outcomes. Environ Health Perspect, Apr 2005. 113(4): p. 494-8.
84. Koch, H.M., J. Hardt, and J. Angerer, Biological monitoring of exposure of the general population to the organophosphorus pesticides chlorpyrifos and chlorpyrifos-methyl by determination of their specific metabolite 3,5,6-trichloro-2-pyridinol. Int J Hyg Environ Health, Nov 2001. 204(2-3): p. 175-80.
85. Canadas, F., D. Cardona, E. Davila, and F. Sanchez-Santed, Long-term neurotoxicity of chlorpyrifos: spatial learning impairment on repeated acquisition in a water maze. Toxicol Sci, Jun 2005. 85(2): p. 944-51.
86. Muto, M.A., F. Lobelle, Jr., J.H. Bidanset, and J.N. Wurpel, Embryotoxicity and neurotoxicity in rats associated with prenatal exposure to DURSBAN. Vet Hum Toxicol, Dec 1992. 34(6): p. 498-501.
87. Berkowitz, G.S., J.G. Wetmur, E. Birman-Deych, J. Obel, R.H. Lapinski, J.H. Godbold, I.R. Holzman, and M.S. Wolff, In utero pesticide exposure, maternal paraoxonase activity, and head circumference. Environ Health Perspect, Mar 2004. 112(3): p. 388-91.
88. Whyatt, R.M., V. Rauh, D.B. Barr, D.E. Camann, H.F. Andrews, R. Garfinkel, L.A. Hoepner, D. Diaz, J. Dietrich, A. Reyes, D. Tang, P.L. Kinney, and F.P. Perera, Prenatal insecticide exposures and birth weight and length among an urban minority cohort. Environ Health Perspect, Jul 2004. 112(10): p. 1125-32.
89. Perera, F.P., V. Rauh, W.Y. Tsai, P. Kinney, D. Camann, D. Barr, T. Bernert, R. Garfinkel, Y.H. Tu, D. Diaz, J. Dietrich, and R.M. Whyatt, Effects of transplacental exposure to environmental pollutants on birth outcomes in a multiethnic population. Environ Health Perspect, Feb 2003. 111(2): p. 201-5.
90. Eskenazi, B., K. Harley, A. Bradman, E. Weltzien, N.P. Jewell, D.B. Barr, C.E. Furlong, and N.T. Holland, Association of in utero organophosphate pesticide exposure and fetal growth and length of gestation in an agricultural population. Environ Health Perspect, Jul 2004. 112(10): p. 1116-24.
91. Barr, D.B., C.V. Ananth, X. Yan, S. Lashley, J.C. Smulian, T.A. Ledoux, P. Hore, and M.G. Robson, Pesticide concentrations in maternal and umbilical cord sera and their relation to birth outcomes in a population of pregnant women and newborns in New Jersey. Sci Total Environ, Jan 15 2010. 408(4): p. 790-5.
92. Rauh, V.A., R. Garfinkel, F.P. Perera, H.F. Andrews, L. Hoepner, D.B. Barr, R. Whitehead, D. Tang, and R.W. Whyatt, Impact of prenatal chlorpyrifos exposure on neurodevelopment in the first 3 years of life among inner-city children. Pediatrics, Dec 2006. 118(6): p. e1845-59.
93. Eskenazi, B., A.R. Marks, A. Bradman, K. Harley, D.B. Barr, C. Johnson, N. Morga, and N.P. Jewell, Organophosphate pesticide exposure and neurodevelopment in young Mexican-American children. Environ Health Perspect, May 2007. 115(5): p. 792-8.
94. Andersen, H.R., A.M. Vinggaard, T.H. Rasmussen, I.M. Gjermandsen, and E.C. Bonefeld-Jorgensen, Effects of currently used pesticides in assays for estrogenicity, androgenicity, and aromatase activity in vitro. Toxicol Appl Pharmacol, Feb 15 2002. 179(1): p. 1-12.
95. Mansour, S.A. and A.H. Mossa, Adverse effects of lactational exposure to chlorpyrifos in suckling rats. Hum Exp Toxicol, Feb 2010. 29(2): p. 77-92.
17
96. El-Hoshy, S.M., Insecticide residues in milk and influence of heat treatments and bacterial fermentation as safeguard against these pollutants. Assiut Vet. Med. J., 1997. 37(73): p. 141-155.
97. U.S. EPA, Reregistration Eligibility Decision (RED) for Permethrin. 2006, United States Environmental Protection Agency; Office of Prevention, Pesticides and Toxic Substances: Washington, D.C.
98. DPR, Pesticide Use Report, Annual 2006, Indexed by Chemical and by Crop. 2006, Department of Pesticide Regulation, California Environmental Protection Agency: Sacramento, CA.
99. Shafer, T.J., D.A. Meyer, and K.M. Crofton, Developmental neurotoxicity of pyrethroid insecticides: critical review and future research needs. Environ Health Perspect, Feb 2005. 113(2): p. 123-36.
100. Wolansky, M.J. and J.A. Harrill, Neurobehavioral toxicology of pyrethroid insecticides in adult animals: a critical review. Neurotoxicol Teratol, Mar-Apr 2008. 30(2): p. 55-78.
101. Nasuti, C., R. Gabbianelli, M.L. Falcioni, A. Di Stefano, P. Sozio, and F. Cantalamessa, Dopaminergic system modulation, behavioral changes, and oxidative stress after neonatal administration of pyrethroids. Toxicology, Jan 18 2007. 229(3): p. 194-205.
102. Farag, A.T., N.F. Goda, A.H. Mansee, and N.A. Shaaban, Effects of permethrin given before mating on the behavior of F1-generation in mice. Neurotoxicology, May 2006. 27(3): p. 421-8.
103. Kim, S.S., R.D. Lee, K.J. Lim, S.J. Kwack, G.S. Rhee, J.H. Seok, G.S. Lee, B.S. An, E.B. Jeung, and K.L. Park, Potential estrogenic and antiandrogenic effects of permethrin in rats. J Reprod Dev, Apr 2005. 51(2): p. 201-10.
104. Zhang, S.Y., J. Ueyama, Y. Ito, Y. Yanagiba, A. Okamura, M. Kamijima, and T. Nakajima, Permethrin may induce adult male mouse reproductive toxicity due to cis isomer not trans isomer. Toxicology, Jun 27 2008. 248(2-3): p. 136-41.
105. Casida, J.E. and L.O. Ruzo, Metabolic Chemistry of Pyrethroid Insecticides. Pesticide Science, 1980. 11(2): p. 257-269.
106. Casida, J.E., D.W. Gammon, A.H. Glickman, and L.J. Lawrence, Mechanisms of Selective Action of Pyrethroid Insecticides. Annual Review of Pharmacology and Toxicology, 1983. 23: p. 413-438.
107. Leng, G., K.H. Kuhn, and H. Idel, Biological monitoring of pyrethroids in blood and pyrethroid metabolites in urine: Applications and limitations. Science of the Total Environment, Jun 20 1997. 199(1-2): p. 173-181.
108. Lowe, E.R., T.S. Poet, D.L. Rick, M.S. Marty, J.L. Mattsson, C. Timchalk, and M.J. Bartels, The effect of plasma lipids on the pharmacokinetics of chlorpyrifos and the impact on interpretation of blood biomonitoring data. Toxicol Sci, Apr 2009. 108(2): p. 258-72.
109. Sassine, A., S. Moura, V.M. Leo, and O.V. Bustillos, Cypermethrin residues determination in the milk of a lactating dairy cow by gas chromatography-ion trap mass spectrometry. J Anal Toxicol, May-Jun 2004. 28(4): p. 238-41.
110. Bissacot, D.Z. and I. Vassilieff, HPLC determination of flumethrin, deltamethrin, cypermethrin, and cyhalothrin residues in the milk and blood of lactating dairy cows. J Anal Toxicol, Sep 1997. 21(5): p. 397-402.
111. Davis, M., R.H. Weldon, G. Morales-Agudelo, W. Roman, A. Bradman, N. Holland, B. Eskenazi, and D. Barr, A High-Resolution Gas Chromatography Mass Spectrophometric
18
Method for Measuring Pesticides and PCBs in Human Milk. Epidemiology, October 12-16 2008. 19(6): p. S335-S335.
112. AAP, Breastfeeding and the use of human milk. American Academy of Pediatrics. Work Group on Breastfeeding. Pediatrics, Dec 1997. 100(6): p. 1035-9.
113. Needham, L.L., J.J. Ryan, and P. Furst, Guidelines for analysis of human milk for environmental chemicals. J Toxicol Environ Health A, Nov 22 2002. 65(22): p. 1893-908.
19
Chapter 2 Serum persistent organic pollutants and duration of lactation among Mexican-American women Rosana H. Weldon1, Monique Webster1, Kim G. Harley1, Asa Bradman1, Laura Fenster2, Mark D. Davis3, Alan Hubbard4, Dana B. Barr3, Nina Holland1, and Brenda Eskenazi1 1 Center for Children’s Environmental Health Research, School of Public Health, University of California, Berkeley, CA; 2 Division of Environmental and Occupational Disease Control, California Department of Public Health, Richmond, CA; 3 National Center for Environmental Health, Centers for Disease Control and Prevention, Atlanta, GA; 4 School of Public Health, Division of Biostatistics, University of California, Berkeley, CA Accepted 19 April 2010 for publication in the Journal of Environmental and Public Health
A. CHAPTER SUMMARY Background: Research suggests that estrogenic endocrine-disrupting chemicals interfere with lactation. Objectives: 1) to determine if estrogenic persistent organic pollutants (POPs) are associated with shortened lactation duration; and 2) to determine whether previous breastfeeding history biases associations. Methods and Results: We measured selected organochlorines and polychlorinated biphenyls (p,p’-DDE, p,p’-DDT, o,p’-DDT, -hexachlorocyclohexane, hexachlorobenzene, and PCBs 44, 49, 52, 118, 138, 153, and 180) in serum from 366 low-income, Mexican-American pregnant women living in an agricultural region of California and assessed breastfeeding duration by questionnaires. We found no association between DDE, DDT, or estrogenic POPs with shortened lactation duration, but rather associations for two potentially estrogenic POPs with lengthened lactation duration arose (HR [95% CI]: 0.6 [0.4, 0.8] for p,p’-DDE & 0.8 [0.6, 1.0] for PCB 52). Associations between anti-estrogenic POPs (PCBs 138 and 180) and shortened lactation duration were attributed to a lactation history bias. Conclusion: Estrogenic POPs were not associated with shortened lactation duration, but may be associated with longer lactation duration.
20
B. INTRODUCTION
Persistent organic pollutants (POPs) “persist in the environment, bioaccumulate, and pose a risk of causing adverse effects to human health and the environment” 1. Pesticides such as dichlorodiphenyl trichloroethane (DDT), hexachlorocyclohexane (HCCH), and hexachlorobenzene (HCB) and industrial chemicals such as polychlorinated biphenyls (PCB) are POPs. Concerns regarding the effects of these chemicals on endocrine function in humans and wildlife led to the Stockholm Convention, a global treaty in which over 160 governmental parties agree to voluntarily eliminate or reduce the use of POPs. However, this agreement exempted uses of DDT for malaria control. Although chemical-free efforts are being endorsed, indoor spraying of DDT remains a primary means of controlling malaria-transmitting mosquitoes in developing countries 2.
For all infants, but particularly for those from impoverished regions (where use of DDT is more common), breastfeeding is the optimal source of nutrition because it helps fight infections, including malaria, reduces dehydration, and is less expensive than formula-feeding 3. Breastfeeding has additional benefits for the mother and child, including postpartum uterine contractions, lactational amenorrhea, and increased bonding 4. WHO recommends exclusive breastfeeding for infants during the first six months of life and continued breastfeeding with complementary foods up to two years and beyond 5. Exclusive breastfeeding rates around the world are generally low with fewer than 35% of children receiving only breast milk for the first four months of life 5.
In the United States (U.S.), the most commonly reported barriers to breastfeeding initiation and duration among low-income mothers include concerns over whether the baby is getting enough to eat, concerns about breastfeeding in public, and fear of difficulty or pain during breastfeeding 6, 7. One study reported that Hispanic U.S. mothers were more likely to report milk insufficiency and infant breast refusal as the primary reason for cessation of breastfeeding compared to African-American or white mothers 7.
Synthetic estrogens such as hormonal contraceptives, smoking and p,p’-dichlorodiphenyl dichloroethylene (p,p’-DDE), an organochlorine (OC) metabolite of DDT, have been associated with shortened lactation duration, presumably due to effects on milk supply 8-12. However, the association between p,p’-DDE and duration of lactation has been questioned by investigators who could only reproduce the finding among women who had previously lactated 10, 12.
Breastfeeding is a major excretory route for POPs and the longer a woman breastfeeds the more she reduces her body burden of POPs 13. Women tend to breastfeed subsequent children for approximately the same time as previous children 14, 15; therefore, women who breastfed previous children for a short time may have higher levels of POPs, but will breastfeed subsequent children for a short time, possibly biasing studies examining the effects of POPs on lactation duration 9, 10, 12. Thus, true relationships between POPs and length of lactation, should be found in women who had not lactated previously.
In addition, women are likely exposed to a mixture of several endocrine-disrupting POPs that may also affect breastfeeding duration. DDT and DDE, and other chemicals including -HCCH, HCB, and individual congeners of PCBs, have been evaluated by animal or in vitro studies for their ability to bind to estrogen or androgen receptors and their ability to elicit or inhibit an endocrine response 16-20.
In this study we examine the relationships between concentrations of persistent organic pollutants measured in the serum of Mexican-American women living in an agricultural region
21
and duration of lactation using data collected from the Center for the Health Assessment of Mothers and Children of Salinas (CHAMACOS)—a longitudinal birth cohort that began in 1998. We first summarize the available literature on the endocrine-disrupting activity of commonly-detected POPs and categorized them by activity. We then determine the associations between POPs and duration of lactation individually and by these categories. Based on Rogan and Gladen’s 9 hypothesis that the estrogenic activity of o,p’-DDT, p,p’-DDT and p,p’-DDE may shorten lactation duration, we expected POPs with estrogenic activity to be associated with shortened lactation duration while POPs with anti-estrogenic endocrine-disrupting activity to be associated with lengthened lactation duration. Since the CHAMACOS dataset contains information on duration of breastfeeding for all previously breast-fed children, we also investigated the potential bias introduced by breastfeeding history. C. MATERIALS AND METHODS 1. Study Population
The study population was drawn from CHAMACOS, a longitudinal birth cohort comprised of 601 pregnant women 21. The purpose of this cohort is to study the effects of pesticides and other environmental exposures in pregnant women and their children who were born in the Salinas Valley of California, an agricultural community. Women were eligible to participate if they were over 18 years of age, English- or Spanish-speaking, less than 20 weeks gestation at enrollment, Medi-Cal eligible and planning to deliver at Natividad Medical Center. Of the 601 women who were enrolled in this study, 526 delivered liveborn singletons. We restricted the analyses to those who initiated breastfeeding (n=498) and who provided some information on the duration of lactation (n=487). Of these, 366 women had adequate volume of serum drawn near 26 weeks of gestation for measurement of concentrations of persistent organic pollutants (POPs). Demographic characteristics in this subset of women did not differ from the larger cohort.
2. Procedure
CHAMACOS mothers were interviewed by bilingual, bicultural staff about their demographic characteristics and pregnancy and breastfeeding histories. Information was collected on maternal age, parity, body mass index, maternal education and work status, years residing in the United States, marital status and family income. Women were also asked how long they had breastfed all previous children. At delivery, and at 6-, 12-, 24-and 42-months postpartum, women were asked if they were currently breastfeeding their child, and if not, the child’s age in months or weeks when they completely stopped breastfeeding. Information on prenatal care and delivery was abstracted from medical records by a nurse.
Women provided written consent and all study protocols were approved by the Committee for the Protection of Human Subjects at the University of California, Berkeley with collaboration from the Institutional Review Board at the Centers for Disease Control and Prevention (CDC). 3. Sample Collection and Laboratory Analyses
Serum samples were collected and processed near the end of the second trimester of pregnancy (27.3 ± 3.1 weeks gestation), as previously described 22. The OC pesticides and PCBs (p,p’-DDT, o,p’-DDT, p,p’-DDE, HCB, -HCCH, and PCBs 44, 49, 52, 118, 138, 153, and 180)
22
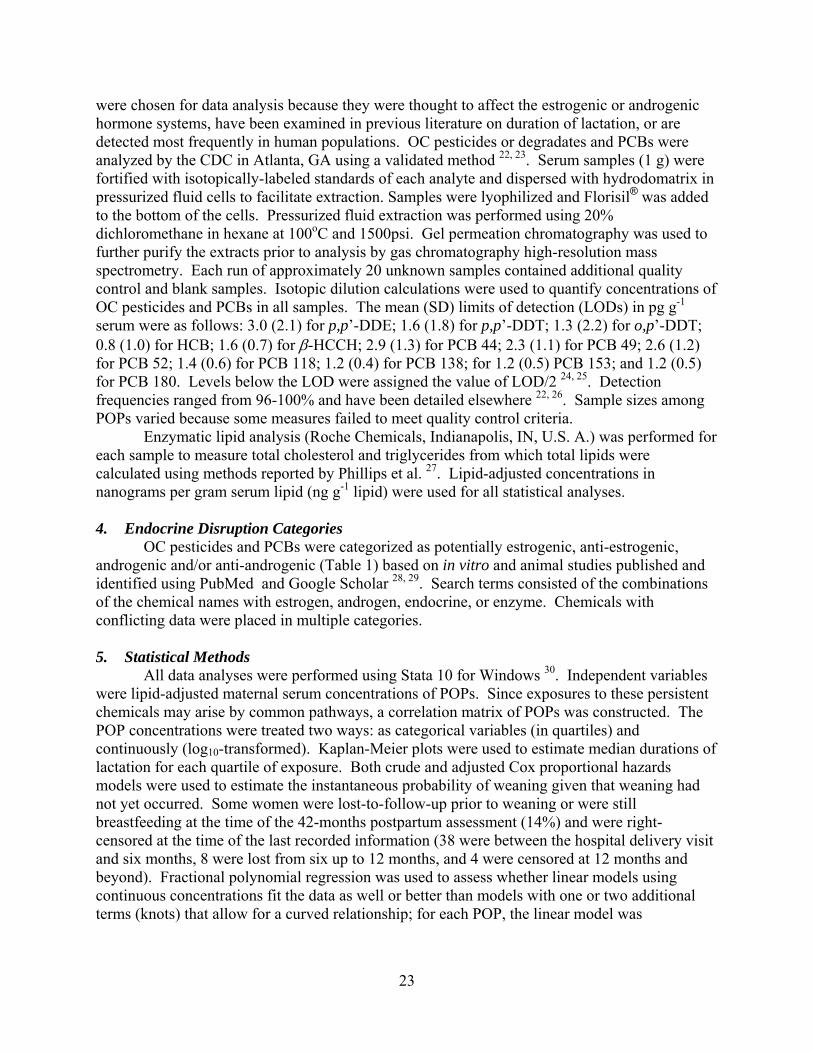
were chosen for data analysis because they were thought to affect the estrogenic or androgenic hormone systems, have been examined in previous literature on duration of lactation, or are detected most frequently in human populations. OC pesticides or degradates and PCBs were analyzed by the CDC in Atlanta, GA using a validated method 22, 23. Serum samples (1 g) were fortified with isotopically-labeled standards of each analyte and dispersed with hydrodomatrix in pressurized fluid cells to facilitate extraction. Samples were lyophilized and Florisil® was added to the bottom of the cells. Pressurized fluid extraction was performed using 20% dichloromethane in hexane at 100oC and 1500psi. Gel permeation chromatography was used to further purify the extracts prior to analysis by gas chromatography high-resolution mass spectrometry. Each run of approximately 20 unknown samples contained additional quality control and blank samples. Isotopic dilution calculations were used to quantify concentrations of OC pesticides and PCBs in all samples. The mean (SD) limits of detection (LODs) in pg g-1 serum were as follows: 3.0 (2.1) for p,p’-DDE; 1.6 (1.8) for p,p’-DDT; 1.3 (2.2) for o,p’-DDT; 0.8 (1.0) for HCB; 1.6 (0.7) for -HCCH; 2.9 (1.3) for PCB 44; 2.3 (1.1) for PCB 49; 2.6 (1.2) for PCB 52; 1.4 (0.6) for PCB 118; 1.2 (0.4) for PCB 138; for 1.2 (0.5) PCB 153; and 1.2 (0.5) for PCB 180. Levels below the LOD were assigned the value of LOD/2 24, 25. Detection frequencies ranged from 96-100% and have been detailed elsewhere 22, 26. Sample sizes among POPs varied because some measures failed to meet quality control criteria.
Enzymatic lipid analysis (Roche Chemicals, Indianapolis, IN, U.S. A.) was performed for each sample to measure total cholesterol and triglycerides from which total lipids were calculated using methods reported by Phillips et al. 27. Lipid-adjusted concentrations in nanograms per gram serum lipid (ng g-1 lipid) were used for all statistical analyses. 4. Endocrine Disruption Categories
OC pesticides and PCBs were categorized as potentially estrogenic, anti-estrogenic, androgenic and/or anti-androgenic (Table 1) based on in vitro and animal studies published and identified using PubMed and Google Scholar 28, 29. Search terms consisted of the combinations of the chemical names with estrogen, androgen, endocrine, or enzyme. Chemicals with conflicting data were placed in multiple categories. 5. Statistical Methods
All data analyses were performed using Stata 10 for Windows 30. Independent variables were lipid-adjusted maternal serum concentrations of POPs. Since exposures to these persistent chemicals may arise by common pathways, a correlation matrix of POPs was constructed. The POP concentrations were treated two ways: as categorical variables (in quartiles) and continuously (log10-transformed). Kaplan-Meier plots were used to estimate median durations of lactation for each quartile of exposure. Both crude and adjusted Cox proportional hazards models were used to estimate the instantaneous probability of weaning given that weaning had not yet occurred. Some women were lost-to-follow-up prior to weaning or were still breastfeeding at the time of the 42-months postpartum assessment (14%) and were right-censored at the time of the last recorded information (38 were between the hospital delivery visit and six months, 8 were lost from six up to 12 months, and 4 were censored at 12 months and beyond). Fractional polynomial regression was used to assess whether linear models using continuous concentrations fit the data as well or better than models with one or two additional terms (knots) that allow for a curved relationship; for each POP, the linear model was
23
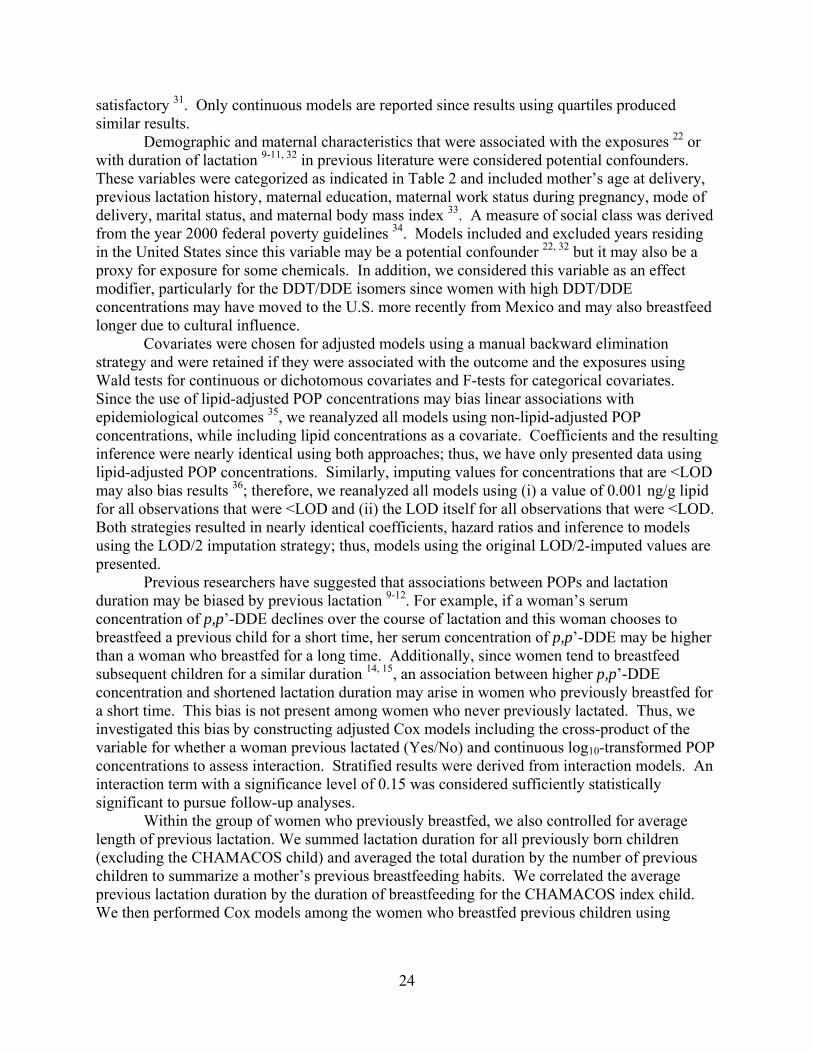
satisfactory 31. Only continuous models are reported since results using quartiles produced similar results.
Demographic and maternal characteristics that were associated with the exposures 22 or with duration of lactation 9-11, 32 in previous literature were considered potential confounders. These variables were categorized as indicated in Table 2 and included mother’s age at delivery, previous lactation history, maternal education, maternal work status during pregnancy, mode of delivery, marital status, and maternal body mass index 33. A measure of social class was derived from the year 2000 federal poverty guidelines 34. Models included and excluded years residing in the United States since this variable may be a potential confounder 22, 32 but it may also be a proxy for exposure for some chemicals. In addition, we considered this variable as an effect modifier, particularly for the DDT/DDE isomers since women with high DDT/DDE concentrations may have moved to the U.S. more recently from Mexico and may also breastfeed longer due to cultural influence.
Covariates were chosen for adjusted models using a manual backward elimination strategy and were retained if they were associated with the outcome and the exposures using Wald tests for continuous or dichotomous covariates and F-tests for categorical covariates. Since the use of lipid-adjusted POP concentrations may bias linear associations with epidemiological outcomes 35, we reanalyzed all models using non-lipid-adjusted POP concentrations, while including lipid concentrations as a covariate. Coefficients and the resulting inference were nearly identical using both approaches; thus, we have only presented data using lipid-adjusted POP concentrations. Similarly, imputing values for concentrations that are <LOD may also bias results 36; therefore, we reanalyzed all models using (i) a value of 0.001 ng/g lipid for all observations that were <LOD and (ii) the LOD itself for all observations that were <LOD. Both strategies resulted in nearly identical coefficients, hazard ratios and inference to models using the LOD/2 imputation strategy; thus, models using the original LOD/2-imputed values are presented.
Previous researchers have suggested that associations between POPs and lactation duration may be biased by previous lactation 9-12. For example, if a woman’s serum concentration of p,p’-DDE declines over the course of lactation and this woman chooses to breastfeed a previous child for a short time, her serum concentration of p,p’-DDE may be higher than a woman who breastfed for a long time. Additionally, since women tend to breastfeed subsequent children for a similar duration 14, 15, an association between higher p,p’-DDE concentration and shortened lactation duration may arise in women who previously breastfed for a short time. This bias is not present among women who never previously lactated. Thus, we investigated this bias by constructing adjusted Cox models including the cross-product of the variable for whether a woman previous lactated (Yes/No) and continuous log10-transformed POP concentrations to assess interaction. Stratified results were derived from interaction models. An interaction term with a significance level of 0.15 was considered sufficiently statistically significant to pursue follow-up analyses.
Within the group of women who previously breastfed, we also controlled for average length of previous lactation. We summed lactation duration for all previously born children (excluding the CHAMACOS child) and averaged the total duration by the number of previous children to summarize a mother’s previous breastfeeding habits. We correlated the average previous lactation duration by the duration of breastfeeding for the CHAMACOS index child. We then performed Cox models among the women who breastfed previous children using
24
continuous log10-transformed concentrations of the POPs while adjusting for average previous breastfeeding duration and other covariates.
Lastly, we used principal components analysis to summarize all of the chemicals within an endocrine-disrupting activity category as identified in Table 1. Separate principal components analyses were performed for each of the four categories and the first principal component in each analysis was used as the summary variable of the entire endocrine-disrupting activity category. Chemicals which fell under multiple categories were included in each of their respective principal component analyses. Values that were missing for reasons other than below the detection limit (e.g. if the measured concentration did not meet quality control criteria) were imputed with the median value for the respective chemical in order to retain the sample size. The first principal component summary variable, which explained 36% of the total variance for chemicals in the estrogenic category, 66% for the anti-estrogenic category, 60% for the androgenic category and 40% for the anti-androgenic category, was then used in separate Cox models for each category including an interaction term (the cross-product of the summary variable and previous lactation); models were adjusted for maternal age at delivery, mother’s years of residence in the United States and marital status. In addition, we used the concentrations imputed with the median value for missing observations to build a comprehensive model including all POPs as explanatory variables in the same model as well as maternal age as a covariate and stratified these models on previous breastfeeding. D. RESULTS
The demographic and pregnancy characteristics of our population are summarized in Table 2. In general, our population was comprised of non-smoking women (99%) who were born in Mexico (90%), Spanish-speaking (90%) and living within 200% of the poverty level (99%). The majority of women had lived in the United States for five or fewer years (57%) and most women (62%) were overweight or obese prior to pregnancy. Additionally, over 40% of women worked in agriculture during pregnancy. Women in this study were young (mean 26 ± 5 years) with 78% aged 18-29 years. About 65% of women had a previous birth and 57% had previously breastfed. About 7% of the index children were born preterm (<37 weeks) and 3% were born of low birth weight (<2500g). One-third of women breastfed the index child for <3 months, 39% for 3 to 11.9 months, and 28% for ≥12 months. Median duration of lactation was 6 months (Table 3). Median length of lactation among women with no history of breastfeeding was nearly half that of women who breastfed previous children, (4 vs. 7 months, respectively). Among women who had previously breastfed, average duration of lactation in the past was moderately correlated with duration of lactation for the CHAMACOS child (=0.46, p<0.0001).
Median serum levels in ng g-1 lipid were 1064 for p,p’-DDE, 12.7 for p,p’-DDT, 1.3 for o,p’-DDT, 39.3 for -HCCH, 63.7 for HCB, 2.8 for PCB 44, 1.9 for PCB 49 3.7 for PCB 52, 3.5 for PCB 118, 2.4 for PCB 138, 5.2 for PCB 153, and 1.4 for PCB 180. Maternal serum concentrations of DDT and DDE isomers were correlated with each other (8 – 0.9, p<0.0005). Chemicals with primarily anti-estrogenic activity, HCB, and PCBs 118, 138, 153 and 180, were also correlated with each other ( 0.3 – 1.0, p<0.0005). As expected, since they are less persistent, PCBs 44, 49 and 52 were not correlated with PCBs 138, 153 and 180 (<0.05, p>0.4 for all correlations), but were highly-correlated among each other (~1.0, p<0.0005). p,p’-DDE was correlated with PCB 180 ( 0.2, p=0.002). Median concentrations of POPs (with the
25
exception of PCB 52) were lower in women who had previously breastfed than women who had not (data not shown).
Table 3 shows the median duration of lactation for each quartile of exposure to each POP derived from the unadjusted Kaplan-Meier plots. Contrary to previous literature, median duration of lactation was longer among women in the highest quartile compared to the lowest for p,p’-DDE, p,p’-DDT, o,p’-DDT and for most of the potentially estrogenic chemicals. However, median duration of lactation was lower in the highest quartile than in the lowest for some of the potentially anti-estrogenic chemicals (HCB, and PCBs 138, 153 and 180, but not PCB 118). Among women who had not previously breastfed, for all POPs except PCB 118 and 180, those in the highest quartile of exposure breastfed longer than those in the lowest quartile.
Adjusted Cox models supported the findings of the unadjusted Kaplan-Meier medians and showed that most of the potentially estrogenic POPs (p,p’-DDE, p,p’-DDT, o,p’-DDT, PCB 49 and PCB52) were associated, albeit non-significantly, with decreased hazard of weaning (i.e., longer duration of lactation), while anti-estrogenic POPs (HCB, PCB 138, PCB 153 and PCB 180) were borderline or significantly associated with an increased hazard of weaning (i.e., shortened duration of lactation) (Table 4). However, these results differed by previous history of lactation. We hypothesized that estrogenic chemicals such as p,p’-DDE would cause shortened lactation duration in women who had not breastfed prior children if the relationship was driven solely by chemical exposures rather than previous lactation history. However, we found increasing concentrations of p,p’-DDE were associated with a decreased hazard of weaning (i.e., breastfed longer) (HR [95%CI]=0.6 [0.4, 0.8]) among women who did not previously breastfeed, while no statistically significant association was observed among women who previously breastfed (HR [95%CI]=1.1 [0.8, 1.4]; pinteraction=0.01). When we adjusted for average duration of lactation for previously born children among women who had breastfed, other potentially estrogenic POPs, PCBs 44, 49, and 52, also became significantly or borderline protective against weaning (i.e., associated with longer lactation) (HR [95% CI]=0.7 [0.4, 1.0], 0.5 [0.3, 0.8], and 0.7 [0.4, 1.0], respectively).
Conversely, we considered that higher concentrations of anti-estrogenic chemicals might result in longer lactation duration among women who did not previously breastfeed. However, we found that increasing concentrations of both PCBs 138 and 180 were not associated with lactation duration among women who did not breastfeed previously, but among women who breastfed previous children, increasing concentrations of both congeners were associated with an increased hazard of weaning (i.e., breastfed shorter) (HR [95%CI]=2.2 [1.2, 4.0] and 2.1 [1.2, 3.9], respectively; pinteraction=0.11). After adjusting for average breastfeeding duration among women who breastfed previous children, PCB 180 (HR [95%CI]=2.0 [1.1, 3.8]), but not 138 (HR [95%CI]=1.7 [0.9, 3.2]), remained associated with an increased hazard of weaning.
We considered the relation of DDT/E and length of lactation stratified by years in the U.S. Overall, results were similar across stratum of duration of residence (≤1, 2-5, 6-10, ≥11 years) in the U.S. However, we observed that among women who previously lactated, but not among those who did not, there was a significant decreased hazard of weaning (i.e., longer lactation) associated with DDT and DDE serum levels among the women who had been in the U.S. the shortest and the longest, but not for the two middle groups (data not shown).
When we used summary variables generated by principal components analysis as our main independent variables (Table 5), we found that the anti-estrogenic group of chemicals was associated with shortened lactation duration, but only among women who breastfed previous children (HR [95%CI]=1.1 [1.0, 1.3]). Variables that summarized estrogenic, androgenic, and
26
anti-androgenic chemicals were not associated with lactation duration. Our comprehensive models including all POPs and maternal age as a covariate showed that only PCB 52 was associated with longer lactation duration (HR [95% CI]= 0.86 [0.77, 0.98]). Upon stratifying by previous breastfeeding, we found that this association was only among women who never previously breastfed (HR [95% CI]= 0.76 [0.61, 0.96]). E. DISCUSSION
We examined whether individual endocrine-disrupting OC pesticides and PCB congeners were associated with duration of lactation in Mexican-American women residing in an agricultural area. Contrary to previous reports, we found that increasing p,p’-DDE maternal serum concentrations were associated with increased duration of lactation among women who had not previously breastfed; we found no association in women who had breastfed previous children. In addition, we found increasing concentrations of potentially anti-estrogenic POPs were associated with reduced duration of lactation, but only among women who had breastfed previous children. The concentrations of OCs in this population are higher than the U.S. population of women of child-bearing age for p,p’-DDE, p,p’-DDT, HCB and -HCCH (U.S. Medians=174, 8, 40, and 5 ng g-1 lipid (LOD imputed), respectively), but lower for PCBs (U.S. Medians=4, 4.6, 14, 20 and 10 ng g-1 lipid (LOD imputed) for PCBs 52, 118, 138, 153 and 180, respectively) 22, 37, 38.
All of the associations between POPs and shortened lactation duration in our study were found only among women who breastfed previous children. These associations can be attributed to lactation history bias because: 1) previous breastfeeding duration (averaged per child) was correlated with duration of breastfeeding the index child in our dataset; and 2) with the exception of o,p’-DDT, all POPs examined in this study were negatively associated with months of previous lactation, although only PCBs 138, 153, and 180 were statistically significant. A true association between an endocrine-disrupting chemical and shortened lactation duration should be observed within the group of mothers who had not previously lactated.
Our results are not consistent with the four previous studies of DDE. Our sample size of ~366 women is somewhat larger than the Durango 10 and Michigan 11 studies (N=229 and 310, respectively), but smaller than the Chiapas 12 and North Carolina 9 studies (N=750 and 858, respectively). Assuming that lipid-adjusted milk concentrations are equal to 1.74 times lipid-adjusted serum concentrations 39, our median p,p’-DDE concentration of 1060 ng g-1 lipid is similar to the two U.S. populations (~1000 ng g-1 lipid in Michigan & 1400 ng g-1 lipid in North Carolina), but lower than the two Mexican populations (2700 ng g-1 lipid in Chiapas and 3400 ng g-1 lipid in Durango). Of these four previous studies, Rogan et al. and Karmaus et al., with concentrations similar to those in the present study, found shortened lactation duration with increasing concentrations of DDE among women who did not breastfeed previously 9, 11. In contrast, we found that increasing concentrations of DDE was associated with longer duration of lactation among women who did not breastfeed previously.
Our study population is comprised of a migrant Mexican-American population who has spent varying amounts of time in the U.S.. Residual confounding by acculturation (despite controlling for years of residence in the U.S.) could explain the disparity between our results and those of previous studies, in that fewer years of residence in the U.S. is associated with higher DDT/E concentrations (due to Mexico’s relatively recent use of DDT compared to the U.S.), but longer duration of lactation (due to cultural influence). However, we observed a similar
27
relationship of longer duration of lactation associated with DDT and DDE serum concentrations even within the group that had been in the U.S. ≤1 year. Although we did not adjust for multiple hypothesis testing, the p-value for the association between p,p’-DDE and lengthened lactation duration among women who never previously lactated was 0.002. This p-value is lower than a Bonferroni significance level adjusted by 12 chemicals (pBonferroni=0.004), which suggests that this association may not be a chance finding. However, there may be other confounding factors that we could not control for due to lack of information including spouse, family and friends’ attitudes and support of breastfeeding, or other social factors that may influence breastfeeding duration.
Our findings are also not consistent with previous studies which found no association between PCBs and lactation duration regardless of lactation history 9, 11. We report associations between PCB138 and PCB 180 with shortened lactation duration, but confined to women who had prior breastfeeding history. Thus, we attributed these findings to the bias introduced by previous breastfeeding. In an attempt to control for this bias among women who previously breastfed, we added a covariate for average duration of lactation of previous children to our models and found that PCB 180 remained associated with shortened lactation duration and that PCBs 49 and 52 became significantly associated with longer breastfeeding duration. PCB 52 was also associated with longer lactation duration among women who had never previously breastfed in our comprehensive model including all POPs, thus, adding to the evidence that PCB 52, an estrogenic chemical, may be associated with longer lactation duration. If the associations for PCBs 49 and 180 had been observed both among women who had never previously lactated and women who previously lactated (controlling for previous lactation duration), we would be more inclined to conclude that there may be an association between PCB 180 (an anti-estrogenic chemical) and shortened lactation duration as well as an association between PCB 49 (an estrogenic chemicals) with longer lactation duration. However, given the inconsistencies of these results in those with and without a history of lactation, relationships for PCBs 49 and 180 may be spurious.
Previous studies examining relationships between POPs and duration of lactation have reported only on associations with p,p’-DDE or total PCB concentrations 9-12. No previous studies have examined effects of several POPs or determined whether chemicals with similar endocrine-disrupting activity affect duration of lactation similarly. In this study, we attempted to classify analytes based on toxicologic mechanism. We hypothesized that if chemicals with similar toxicologic profiles affected lactation in the same manner this would strengthen the biological plausibility of the results. This approach of categorizing chemicals based on biological mechanism has been previously applied in studies of cancer 40 and thyroid function 26. However, there are limited data from in vitro and animal studies that allow for the categorization of the endocrine-disrupting potential of specific chemicals, the results of these studies are often conflicting 41, 42, and some chemicals have multiple mechanisms. Using principal components models we could not account for the relative potency of a chemical or whether chemicals act synergistically or antagonistically, but our findings largely supported the results generated from separate models for each chemical. Only the anti-estrogenic category was associated with shortened lactation duration, but this finding was also attributable to the lactation history bias.
Our study has some limitations. Although previous studies have postulated that breastfeeding initiation may be more sensitive to effects of endocrine disruptors 12, we could not examine this association because the majority of women in the CHAMACOS cohort (97%) initiated breastfeeding. However, among 11 women who did not initiate breastfeeding and who
28
had blood POP measurements, the median concentration of p,p’-DDE was 880 ng g-1 lipid. This value fell into the second quartile of exposure and suggests that in our population, initiation may not be affected by p,p’-DDE exposure. In addition, there may be biases introduced by self-reported data. In our study, women were asked to report the age of their infant (in months or weeks) at the time that they completely stopped breastfeeding. Such self-reported data can lead to misclassification errors. However, since we asked the mother for this information at 6-, 12-, 24-and 42-months postpartum (within 6- 18 months of her weaning), our data are likely accurate. Women did not know their exposure status at the time that they were interviewed, which would minimize recall bias. Although we have no evidence of reporting bias, it is possible that women may have reported longer lactation duration than actually occurred because they perceived breastfeeding as more beneficial to their children. Lastly, although POP concentrations measured at approximately the 26th week of gestation are well-correlated with a subset of concentrations measured near delivery (n=20, >0.7 for most chemicals), we do not know the critical exposure window for duration of lactation and cannot be certain that concentrations measured at approximately the 26th week of gestation represent this critical exposure window 43. Thus, results may be different if all concentrations were measured closer to delivery or during the postpartum period. F. CONCLUSIONS
Our findings do not support previous associations between p,p’-DDE and shortened lactation duration nor do we find any associations between shortened lactation and any estrogenic POP. Instead, we found associations for two potentially estrogenic POPS, p,p’-DDE and PCB 52 and lengthened lactation duration in women who had not lactated previously. The associations for p,p’-DDE and lengthened lactation duration were observed even among those who had resided in the U.S. for one or fewer years. We also found shortened lactation duration with anti-estrogenic POPs among women who breastfed previously born children, but these associations may be spurious since they were not seen among women who did not breastfeed previous children.
29
G. REFERENCES 1. UNEP, Stockholm Convention on Persistent Organic Pollutants. Depositary notification
C.N.531.2001.TREATIES-96 of 19 June 2001, United Nations Environment Program, Editor. 2001, United Nations.
2. UNEP, Report of the expert group on assessment of the production and use of DDT and its alternatives for disease vector control, in Stockholm Convention on Persistent Organic Pollutants. 2009, UNEP: Geneva.
3. UNICEF, WHO, UNESCO, UNFPA, UNDP, UNAIDS, WFP, and W. Bank, Facts for Life: A Communication Challenge. Third ed. 2002, UNICEF: New York.
4. AAP, Breastfeeding and the use of human milk. American Academy of Pediatrics. Work Group on Breastfeeding. Pediatrics, Dec 1997. 100(6): p. 1035-9.
5. WHO, Global strategy for infant and young child feeding. . 2003, World Health Organization: Geneva.
6. McCann, M.F., N. Baydar, and R.L. Williams, Breastfeeding attitudes and reported problems in a national sample of WIC participants. Journal of Human Lactation, Nov 2007. 23(4): p. 314-24.
7. Hurley, K.M., M.M. Black, M.A. Papas, and A.M. Quigg, Variation in breastfeeding behaviours, perceptions, and experiences by race/ethnicity among a low-income statewide sample of Special Supplemental Nutrition Program for Women, Infants, and Children (WIC) participants in the United States. Maternal & Child Nutrition, Apr 2008. 4(2): p. 95-105.
8. WHO, Effects of hormonal contraceptives on breast milk composition and infant growth. World Health Organization (WHO) Task Force on Oral Contraceptives. Studies in Family Planning, Nov-Dec 1988. 19(6 Pt 1): p. 361-9.
9. Rogan, W.J., B.C. Gladen, J.D. McKinney, N. Carreras, P. Hardy, J. Thullen, J. Tingelstad, and M. Tully, Polychlorinated biphenyls (PCBs) and dichlorodiphenyl dichloroethene (DDE) in human milk: effects on growth, morbidity, and duration of lactation. American Journal of Public Health., Oct 1987. 77(10): p. 1294-7.
10. Gladen, B.C. and W.J. Rogan, DDE and shortened duration of lactation in a northern Mexican town. American Journal of Public Health., Apr 1995. 85(4): p. 504-8.
11. Karmaus, W., S. Davis, C. Fussman, and K. Brooks, Maternal concentration of dichlorodiphenyl dichloroethylene (DDE) and initiation and duration of breast feeding. Paediatric and Perinatal Epidemiology, Sep 2005. 19(5): p. 388-98.
12. Cupul-Uicab, L.A., B.C. Gladen, M. Hernández-Ávila, J.P. Weber, and M.P. Longnecker, DDE, a degradation product of DDT, and duration of lactation in a highly exposed area of Mexico. Environmental Health Perspectives, Feb 2008. 116(2): p. 179-83.
13. Rogan, W.J., B.C. Gladen, J.D. McKinney, N. Carreras, P. Hardy, J. Thullen, J. Tingelstad, and M. Tully, Polychlorinated biphenyls (PCBs) and dichlorodiphenyl dichloroethene (DDE) in human milk: effects of maternal factors and previous lactation. American Journal of Public Health., Feb 1986. 76(2): p. 172-7.
14. Arthur, C.R., R.B. Saenz, and W.H. Replogle, Personal breast-feeding behaviors of female physicians in Mississippi. Southern Medical Journal, 2003. 96(2): p. 130-135.
15. Nagy, E., H. Orvos, A. Pal, L. Kovacs, and K. Loveland, Breastfeeding duration and previous breastfeeding experience. Acta Paediatrica, Jan 2001. 90(1): p. 51-6.
30
16. Steinmetz, R., P.C. Young, A. Caperell-Grant, E.A. Gize, B.V. Madhukar, N. Ben-Jonathan, and R.M. Bigsby, Novel estrogenic action of the pesticide residue beta-hexachlorocyclohexane in human breast cancer cells. Cancer Research, Dec 1 1996. 56(23): p. 5403-9.
17. Kojima, H., E. Katsura, S. Takeuchi, K. Niiyama, and K. Kobayashi, Screening for estrogen and androgen receptor activities in 200 pesticides by in vitro reporter gene assays using Chinese hamster ovary cells. Environmental Health Perspectives, Apr 2004. 112(5): p. 524-31.
18. Ralph, J.L., M.C. Orgebin-Crist, J.J. Lareyre, and C.C. Nelson, Disruption of androgen regulation in the prostate by the environmental contaminant hexachlorobenzene. Environmental Health Perspectives, Apr 2003. 111(4): p. 461-6.
19. DeCastro, B.R., S.A. Korrick, J.D. Spengler, and A.M. Soto, Estrogenic activity of polychlorinated biphenyls present in human tissue and the environment. Environmental Science & Technology, Apr 15 2006. 40(8): p. 2819-25.
20. Hansen, L.G., Stepping backward to improve assessment of PCB congener toxicities. Environmental Health Perspectives, Feb 1998. 106 Suppl 1: p. 171-89.
21. Eskenazi, B., A. Bradman, E.A. Gladstone, S. Jaramillo, K. Birch, and N. Holland, CHAMACOS, a longitudinal birth cohort study: lessons from the fields. Journal of Child Health, 2003. 1(1): p. 3-27.
22. Bradman, A.S., J.M. Schwartz, L. Fenster, D.B. Barr, N.T. Holland, and B. Eskenazi, Factors predicting organochlorine pesticide levels in pregnant Latina women living in a United States agricultural area. Journal of Exposure Science and Environmental Epidemiology, Jul 2007. 17(4): p. 388-99.
23. Barr, D.B., P. Weihe, M.D. Davis, L.L. Needham, and P. Grandjean, Serum polychlorinated biphenyl and organochlorine insecticide concentrations in a Faroese birth cohort. Chemosphere, Feb 2006. 62(7): p. 1167-82.
24. Hornung, R.W. and L.D. Reed, Estimation of Average Concentration in the Presence of Nondetectable Values. Applied Occupational and Environmental Hygiene, Jan 1990 1990. 5(1): p. 46-51.
25. Barr, J.R., W.J. Driskell, R.H. Hill, Jr., D.L. Ashley, L.L. Needham, S.L. Head, E.J. Sampson, and D.B. Barr, Strategies for biological monitoring of exposure for contemporary-use pesticides. Toxicology and Industrial Health, Jan-Mar 1999. 15(1-2): p. 168-79.
26. Chevrier, J., B. Eskenazi, A. Bradman, L. Fenster, and D.B. Barr, Associations between prenatal exposure to polychlorinated biphenyls and neonatal thyroid-stimulating hormone levels in a Mexican-American population, Salinas Valley, California. Environmental Health Perspectives, Oct 2007. 115(10): p. 1490-6.
27. Phillips, D.L., J.L. Pirkle, V.W. Burse, J.T. Bernert, Jr., L.O. Henderson, and L.L. Needham, Chlorinated hydrocarbon levels in human serum: effects of fasting and feeding. Archives of Environmental Contamination and Toxicology, Jul-Aug 1989. 18(4): p. 495-500.
28. U.S. National Library of Medicine. PubMed. [Search engine] 2008 [cited 2008 February]; Available from: www.pubmed.gov.
29. Google, I. Google Scholar. [Search engine] 2006 [cited 2008 February]; Available from: http://scholar.google.com/.
31
30. StataCorp, Stata Statistical Software: Release 10. 2007, StataCorp LP: College Station, TX.
31. Royston, P. and D.G. Altman, Approximating statistical functions by using fractional polynomial regression. Statistician, 1997. 46(3): p. 411-422.
32. Harley, K., N.L. Stamm, and B. Eskenazi, The effect of time in the U.S. on the duration of breastfeeding in women of Mexican descent. Maternal and Child Health Journal, Mar 2007. 11(2): p. 119-25.
33. CDC. Body Mass Index: About BMI for adults. [website] 2007 May 22, 2007 [cited 2008 January 31]; Available from: http://www.cdc.gov/nccdphp/dnpa/bmi/adult_BMI/about_adult_BMI.htm.
34. U.S. Bureau of the Census, Poverty Thresholds 2000, Current Population Survey. 2000, U.S. Census Bureau: Washington, DC.
35. Schisterman, E.F., B.W. Whitcomb, G.M. Louis, and T.A. Louis, Lipid adjustment in the analysis of environmental contaminants and human health risks. Environ Health Perspect, Jul 2005. 113(7): p. 853-7.
36. Schisterman, E.F., A. Vexler, B.W. Whitcomb, and A. Liu, The limitations due to exposure detection limits for regression models. Am J Epidemiol, Feb 15 2006. 163(4): p. 374-83.
37. CDC. 1999-2000 National Health and Nutrition Examination Survey (NHANES), Demographics and Lab 28 Dioxins data files. 2005 July 2005 [cited 2008 June 2]; Available from: http://www.cdc.gov/nchs/about/major/nhanes/nhanes99_00.htm.
38. CDC, Third National Report on Human Exposure to Environmental Chemicals. . 2005, Centers for Disease Control and Prevention: Atlanta.
39. LaKind, J.S., C.M. Berlin, Jr., A. Sjodin, W. Turner, R.Y. Wang, L.L. Needham, I.M. Paul, J.L. Stokes, D.Q. Naiman, and D.G. Patterson, Jr., Do human milk concentrations of persistent organic chemicals really decline during lactation? Chemical concentrations during lactation and milk/serum partitioning. Environ Health Perspect, Oct 2009. 117(10): p. 1625-31.
40. Wolff, M.S., A. Zeleniuch-Jacquotte, N. Dubin, and P. Toniolo, Risk of breast cancer and organochlorine exposure. Cancer Epidemiol Biomarkers Prev, Mar 2000. 9(3): p. 271-7.
41. Hull, V.J., The effects of hormonal contraceptives on lactation: current findings, methodological considerations, and future priorities. Studies in Family Planning, Apr 1981. 12(4): p. 134-55.
42. Truitt, S.T., A.B. Fraser, D.A. Grimes, M.F. Gallo, and K.F. Schulz, Hormonal contraception during lactation. systematic review of randomized controlled trials. Contraception, Oct 2003. 68(4): p. 233-8.
43. Bloom, M.S., G.M. Buck-Louis, E.F. Schisterman, P.J. Kostyniak, and J.E. Vena, Changes in maternal serum chlorinated pesticide concentrations across critical windows of human reproduction and development. Environ Res, Jan 2009. 109(1): p. 93-100.
44. Alvarez, L., A. Randi, P. Alvarez, G. Piroli, A. Chamson-Reig, V. Lux-Lantos, and D. Kleiman de Pisarev, Reproductive effects of hexachlorobenzene in female rats. Journal of Applied Toxicology, Jan-Feb 2000. 20(1): p. 81-7.
45. Foster, W.G., A. McMahon, E.V. Younglai, J.F. Jarrell, and P. Lecavalier, Alterations in circulating ovarian steroids in hexachlorobenzene-exposed monkeys. Reproductive Toxicology, Nov-Dec 1995. 9(6): p. 541-8.
32
46. Muller, W.F., W. Hobson, G.B. Fuller, W. Knauf, F. Coulston, and F. Korte, Endocrine effects of chlorinated hydrocarbons in rhesus monkeys. Ecotoxicology and Environmental Safety, Sep 1978. 2(2): p. 161-72.
47. Miller, C.A., 3rd, Expression of the human aryl hydrocarbon receptor complex in yeast. Activation of transcription by indole compounds. Journal of Biological Chemistry, Dec 26 1997. 272(52): p. 32824-9.
48. Kelce, W.R., C.R. Stone, S.C. Laws, L.E. Gray, J.A. Kemppainen, and E.M. Wilson, Persistent DDT metabolite p,p'-DDE is a potent androgen receptor antagonist. Nature, Jun 15 1995. 375(6532): p. 581-5.
49. Welch, R.M., W. Levin, and A.H. Conney, Estrogenic action of DDT and its analogs. Toxicology and Applied Pharmacology, Mar 1969. 14(2): p. 358-67.
50. Oh, S.M., B.T. Ryu, S.K. Lee, and K.H. Chung, Antiestrogenic potentials of ortho-PCB congeners by single or complex exposure. Archives of Pharmacal Research, Feb 2007. 30(2): p. 199-209.
51. Wolff, M.S., D. Camann, M. Gammon, and S.D. Stellman, Proposed PCB congener groupings for epidemiological studies. Environmental Health Perspectives, Jan 1997. 105(1): p. 13-4.
52. Endo, F., T.K. Monsees, H. Akaza, W.B. Schill, and S. Pflieger-Bruss, Effects of single non-ortho, mono-ortho, and di-ortho chlorinated biphenyls on cell functions and proliferation of the human prostatic carcinoma cell line, LNCaP. Reproductive Toxicology, Mar-Apr 2003. 17(2): p. 229-36.
53. Bigsby, R.M., A. Caperell-Grant, and B.V. Madhukar, Xenobiotics released from fat during fasting produce estrogenic effects in ovariectomized mice. Cancer Res, Mar 1 1997. 57(5): p. 865-9.
54. Bitman, J., H.C. Cecil, S.J. Harris, and G.F. Fries, Estrogenic activity of o,p'-DDT in the mammalian uterus and avian oviduct. Science, Oct 18 1968. 162(851): p. 371-2.
55. Pliskova, M., J. Vondracek, R.F. Canton, J. Nera, A. Kocan, J. Petrik, T. Trnovec, T. Sanderson, M. van den Berg, and M. Machala, Impact of polychlorinated biphenyls contamination on estrogenic activity in human male serum. Environmental Health Perspectives, Oct 2005. 113(10): p. 1277-84.
56. Bonefeld-Jorgensen, E.C., H.R. Andersen, T.H. Rasmussen, and A.M. Vinggaard, Effect of highly bioaccumulated polychlorinated biphenyl congeners on estrogen and androgen receptor activity. Toxicology, Feb 14 2001. 158(3): p. 141-53.
57. Coosen, R. and F.L. van Velsen, Effects of the beta-isomer of hexachlorocyclohexane on estrogen-sensitive human mammary tumor cells. Toxicology and Applied Pharmacology, Nov 1989. 101(2): p. 310-8.
58. Lyche, J.L., J.U. Skaare, H.J. Larsen, and E. Ropstad, Levels of PCB 126 and PCB 153 in plasma and tissues in goats exposed during gestation and lactation. Chemosphere, Apr 2004. 55(4): p. 621-9.
59. Jansen, H.T., P.S. Cooke, J. Porcelli, T.C. Liu, and L.G. Hansen, Estrogenic and antiestrogenic actions of PCBs in the female rat: in vitro and in vivo studies. Reproductive Toxicology, May-Jun 1993. 7(3): p. 237-48.
60. Cooke, P.S., T. Sato, D.L. Buchanan, L.W. Robertson, and L.G. Hansen, Disruption of steroid hormone signaling by PCBs, in PCBs Recent advances in environmental toxicology and health effects, L.S.a.H. Robertson, L. G., Editor. 2001, University Press of Kentucky: Lexington, KY.
33
61. Li, M.H., Y.D. Zhao, and L.G. Hansen, Multiple dose toxicokinetic influence on the estrogenicity of 2,2',4,4',5,5'-hexachlorobiphenyl. Bull Environ Contam Toxicol, Oct 1994. 53(4): p. 583-90.
34
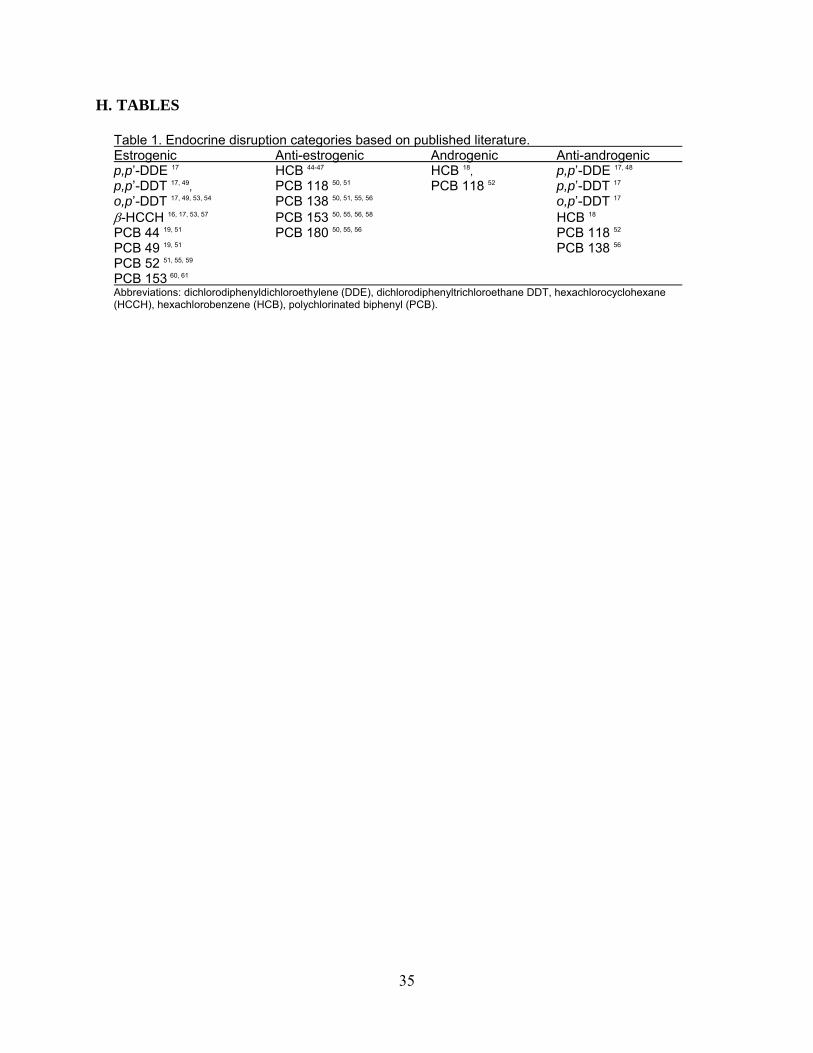
H. TABLES
Table 1. Endocrine disruption categories based on published literature. Estrogenic Anti-estrogenic Androgenic Anti-androgenic p,p’-DDE 17 HCB 44-47 HCB 18, p,p’-DDE 17, 48 p,p’-DDT 17, 49, PCB 118 50, 51 PCB 118 52 p,p’-DDT 17 o,p’-DDT 17, 49, 53, 54 PCB 138 50, 51, 55, 56 o,p’-DDT 17 -HCCH 16, 17, 53, 57 PCB 153 50, 55, 56, 58 HCB 18 PCB 44 19, 51 PCB 180 50, 55, 56 PCB 118 52 PCB 49 19, 51 PCB 138 56
PCB 52 51, 55, 59 PCB 153 60, 61 Abbreviations: dichlorodiphenyldichloroethylene (DDE), dichlorodiphenyltrichloroethane DDT, hexachlorocyclohexane (HCCH), hexachlorobenzene (HCB), polychlorinated biphenyl (PCB).
35
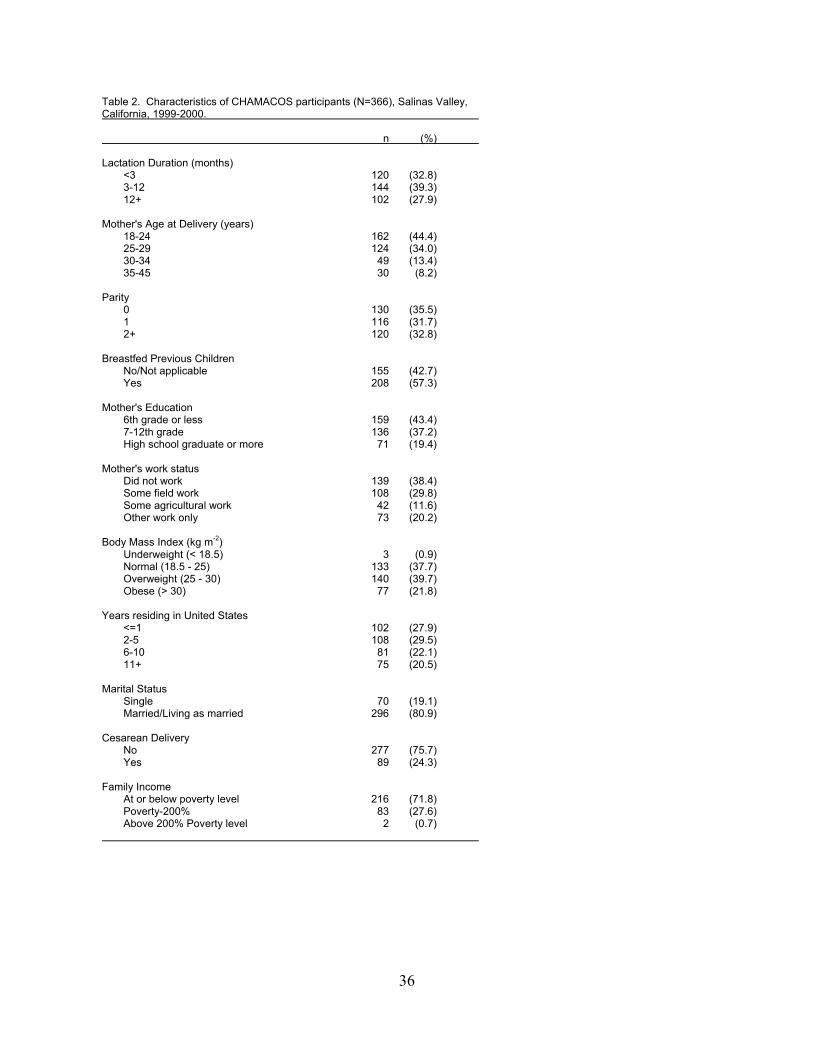
Table 2. Characteristics of CHAMACOS participants (N=366), Salinas Valley, California, 1999-2000. n (%) Lactation Duration (months) <3 120 (32.8) 3-12 144 (39.3) 12+ 102 (27.9) Mother's Age at Delivery (years) 18-24 162 (44.4) 25-29 124 (34.0) 30-34 49 (13.4) 35-45 30 (8.2) Parity 0 130 (35.5) 1 116 (31.7) 2+ 120 (32.8) Breastfed Previous Children No/Not applicable 155 (42.7) Yes 208 (57.3) Mother's Education 6th grade or less 159 (43.4) 7-12th grade 136 (37.2) High school graduate or more 71 (19.4) Mother's work status Did not work 139 (38.4) Some field work 108 (29.8) Some agricultural work 42 (11.6) Other work only 73 (20.2) Body Mass Index (kg m-2) Underweight (< 18.5) 3 (0.9) Normal (18.5 - 25) 133 (37.7) Overweight (25 - 30) 140 (39.7) Obese (> 30) 77 (21.8) Years residing in United States <=1 102 (27.9) 2-5 108 (29.5) 6-10 81 (22.1) 11+ 75 (20.5) Marital Status Single 70 (19.1) Married/Living as married 296 (80.9) Cesarean Delivery No 277 (75.7) Yes 89 (24.3) Family Income At or below poverty level 216 (71.8) Poverty-200% 83 (27.6) Above 200% Poverty level 2 (0.7)
36
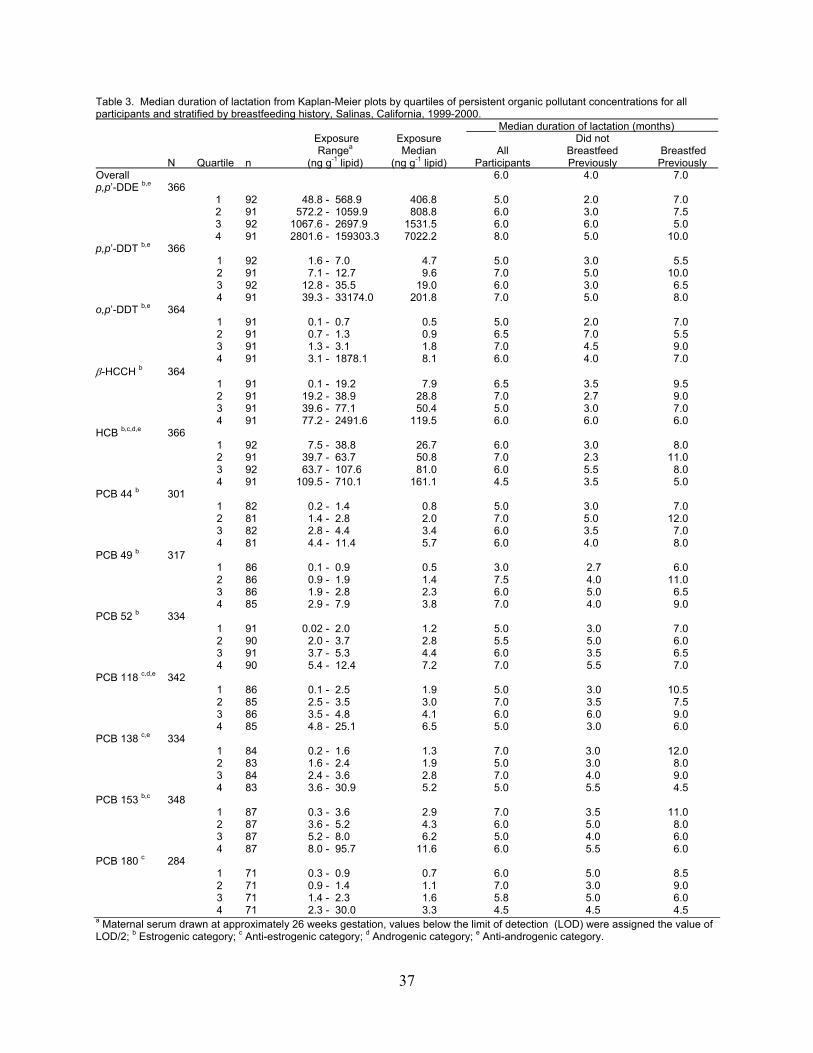
Table 3. Median duration of lactation from Kaplan-Meier plots by quartiles of persistent organic pollutant concentrations for all participants and stratified by breastfeeding history, Salinas, California, 1999-2000. _____ Median duration of lactation (months) Exposure Exposure Did not Rangea Median All Breastfeed Breastfed N Quartile n (ng g-1 lipid) (ng g-1 lipid) Participants Previously Previously Overall 6.0 4.0 7.0 p,p’-DDE b,e 366 1 92 48.8 - 568.9 406.8 5.0 2.0 7.0 2 91 572.2 - 1059.9 808.8 6.0 3.0 7.5 3 92 1067.6 - 2697.9 1531.5 6.0 6.0 5.0 4 91 2801.6 - 159303.3 7022.2 8.0 5.0 10.0 p,p’-DDT b,e 366 1 92 1.6 - 7.0 4.7 5.0 3.0 5.5 2 91 7.1 - 12.7 9.6 7.0 5.0 10.0 3 92 12.8 - 35.5 19.0 6.0 3.0 6.5 4 91 39.3 - 33174.0 201.8 7.0 5.0 8.0 o,p’-DDT b,e 364 1 91 0.1 - 0.7 0.5 5.0 2.0 7.0 2 91 0.7 - 1.3 0.9 6.5 7.0 5.5 3 91 1.3 - 3.1 1.8 7.0 4.5 9.0 4 91 3.1 - 1878.1 8.1 6.0 4.0 7.0 -HCCH b 364 1 91 0.1 - 19.2 7.9 6.5 3.5 9.5 2 91 19.2 - 38.9 28.8 7.0 2.7 9.0 3 91 39.6 - 77.1 50.4 5.0 3.0 7.0 4 91 77.2 - 2491.6 119.5 6.0 6.0 6.0 HCB b,c,d,e 366 1 92 7.5 - 38.8 26.7 6.0 3.0 8.0 2 91 39.7 - 63.7 50.8 7.0 2.3 11.0 3 92 63.7 - 107.6 81.0 6.0 5.5 8.0 4 91 109.5 - 710.1 161.1 4.5 3.5 5.0 PCB 44 b 301 1 82 0.2 - 1.4 0.8 5.0 3.0 7.0 2 81 1.4 - 2.8 2.0 7.0 5.0 12.0 3 82 2.8 - 4.4 3.4 6.0 3.5 7.0 4 81 4.4 - 11.4 5.7 6.0 4.0 8.0 PCB 49 b 317 1 86 0.1 - 0.9 0.5 3.0 2.7 6.0 2 86 0.9 - 1.9 1.4 7.5 4.0 11.0 3 86 1.9 - 2.8 2.3 6.0 5.0 6.5 4 85 2.9 - 7.9 3.8 7.0 4.0 9.0 PCB 52 b 334 1 91 0.02 - 2.0 1.2 5.0 3.0 7.0 2 90 2.0 - 3.7 2.8 5.5 5.0 6.0 3 91 3.7 - 5.3 4.4 6.0 3.5 6.5 4 90 5.4 - 12.4 7.2 7.0 5.5 7.0 PCB 118 c,d,e 342 1 86 0.1 - 2.5 1.9 5.0 3.0 10.5 2 85 2.5 - 3.5 3.0 7.0 3.5 7.5 3 86 3.5 - 4.8 4.1 6.0 6.0 9.0 4 85 4.8 - 25.1 6.5 5.0 3.0 6.0 PCB 138 c,e 334 1 84 0.2 - 1.6 1.3 7.0 3.0 12.0 2 83 1.6 - 2.4 1.9 5.0 3.0 8.0 3 84 2.4 - 3.6 2.8 7.0 4.0 9.0 4 83 3.6 - 30.9 5.2 5.0 5.5 4.5 PCB 153 b,c 348 1 87 0.3 - 3.6 2.9 7.0 3.5 11.0 2 87 3.6 - 5.2 4.3 6.0 5.0 8.0 3 87 5.2 - 8.0 6.2 5.0 4.0 6.0 4 87 8.0 - 95.7 11.6 6.0 5.5 6.0 PCB 180 c 284 1 71 0.3 - 0.9 0.7 6.0 5.0 8.5 2 71 0.9 - 1.4 1.1 7.0 3.0 9.0 3 71 1.4 - 2.3 1.6 5.8 5.0 6.0 4 71 2.3 - 30.0 3.3 4.5 4.5 4.5 a Maternal serum drawn at approximately 26 weeks gestation, values below the limit of detection (LOD) were assigned the value of LOD/2; b Estrogenic category; c Anti-estrogenic category; d Androgenic category; e Anti-androgenic category.
37
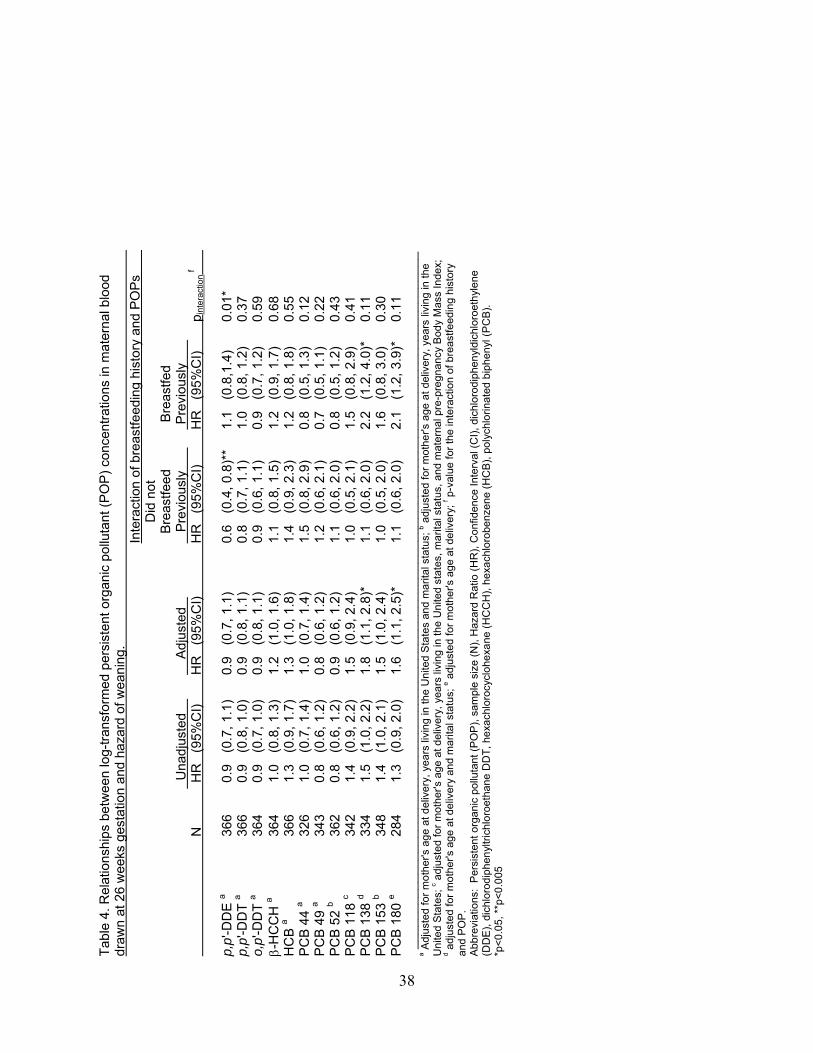
Tab
le 4
. Rel
atio
nshi
ps b
etw
een
log-
tran
sfor
med
per
sist
ent
orga
nic
pollu
tant
(P
OP
) co
ncen
trat
ions
in m
ater
nal b
lood
dr
awn
at 2
6 w
eeks
ges
tatio
n an
d ha
zard
of w
eani
ng.
Inte
ract
ion
of b
reas
tfeed
ing
hist
ory
and
PO
Ps
Did
not
B
reas
tfeed
B
reas
tfed
Una
djus
ted
Adj
uste
d
P
revi
ousl
y
Pre
viou
sly
N
HR
(9
5%C
I)
HR
(9
5%C
I)
HR
(9
5%C
I)
HR
(9
5%C
I)
p int
erac
tion
f
p,
p'-D
DE
a 36
6 0.
9 (0
.7, 1
.1)
0.9
(0.7
, 1.1
) 0.
6 (0
.4, 0
.8)*
* 1.
1 (0
.8,1
.4)
0.
01*
p,
p'-D
DT
a 36
6 0.
9 (0
.8, 1
.0)
0.9
(0.8
, 1.1
) 0.
8 (0
.7, 1
.1)
1.0
(0.8
, 1.2
)
0.37
o,p'
-DD
T a
364
0.9
(0.7
, 1.0
) 0.
9 (0
.8, 1
.1)
0.9
(0.6
, 1.1
) 0.
9 (0
.7, 1
.2)
0.
59
-
HC
CH
a 36
4 1.
0 (0
.8, 1
.3)
1.2
(1.0
, 1.6
) 1.
1 (0
.8, 1
.5)
1.2
(0.9
, 1.7
)
0.68
HC
B a
366
1.3
(0.9
, 1.7
) 1.
3 (1
.0, 1
.8)
1.4
(0.9
, 2.3
) 1.
2 (0
.8, 1
.8)
0.
55
P
CB
44
a 32
6 1.
0 (0
.7, 1
.4)
1.0
(0.7
, 1.4
) 1.
5 (0
.8, 2
.9)
0.8
(0.5
, 1.3
)
0.12
PC
B 4
9 a
343
0.8
(0.6
, 1.2
) 0.
8 (0
.6, 1
.2)
1.2
(0.6
, 2.1
) 0.
7 (0
.5, 1
.1)
0.
22
P
CB
52
b 36
2 0.
8 (0
.6, 1
.2)
0.9
(0.6
, 1.2
) 1.
1 (0
.6, 2
.0)
0.8
(0.5
, 1.2
)
0.43
PC
B 1
18 c
342
1.4
(0.9
, 2.2
) 1.
5 (0
.9, 2
.4)
1.0
(0.5
, 2.1
) 1.
5 (0
.8, 2
.9)
0.
41
P
CB
138
d 33
4 1.
5 (1
.0, 2
.2)
1.8
(1.1
, 2.8
)*
1.1
(0.6
, 2.0
) 2.
2 (1
.2, 4
.0)*
0.
11
P
CB
153
b 34
8 1.
4 (1
.0, 2
.1)
1.5
(1.0
, 2.4
) 1.
0 (0
.5, 2
.0)
1.6
(0.8
, 3.0
)
0.30
PC
B 1
80 e
284
1.3
(0.9
, 2.0
) 1.
6 (1
.1, 2
.5)*
1.
1 (0
.6, 2
.0)
2.1
(1.2
, 3.9
)*
0.11
____
____
____
____
____
____
____
____
____
____
____
____
____
____
____
____
____
____
____
____
____
____
____
__
a Adj
uste
d fo
r m
oth
er's
age
at d
eliv
ery,
yea
rs li
ving
in th
e U
nite
d S
tate
s an
d m
arita
l sta
tus;
b adj
uste
d fo
r m
othe
r's a
ge a
t del
iver
y, y
ears
livi
ng in
the
Uni
ted
Sta
tes;
c adj
uste
d fo
r m
othe
r's a
ge a
t del
iver
y, y
ears
livi
ng in
the
Un
ited
stat
es, m
arita
l sta
tus,
and
mat
erna
l pre
-pre
gna
ncy
Bod
y M
ass
Inde
x;
d adj
uste
d fo
r m
oth
er's
age
at d
eliv
ery
and
mar
ital s
tatu
s; e a
djus
ted
for
mot
her's
age
at d
eliv
ery;
f p-v
alue
for
the
inte
ract
ion
of b
reas
tfeed
ing
hist
ory
and
PO
P.
Abb
revi
atio
ns:
Per
sist
ent o
rgan
ic p
ollu
tant
(P
OP
), s
ampl
e si
ze (
N),
Haz
ard
Rat
io (
HR
), C
onfid
ence
Int
erva
l (C
I),
dich
loro
diph
en
yldi
chlo
roet
hyl
ene
(D
DE
), d
ichl
orod
iphe
nyl
tric
hlor
oeth
ane
DD
T, h
exa
chlo
rocy
cloh
exa
ne (
HC
CH
), h
exa
chlo
robe
nzen
e (H
CB
), p
olyc
hlo
rinat
ed b
iphe
nyl
(P
CB
).
*p<
0.05
, **p
<0.
005
38
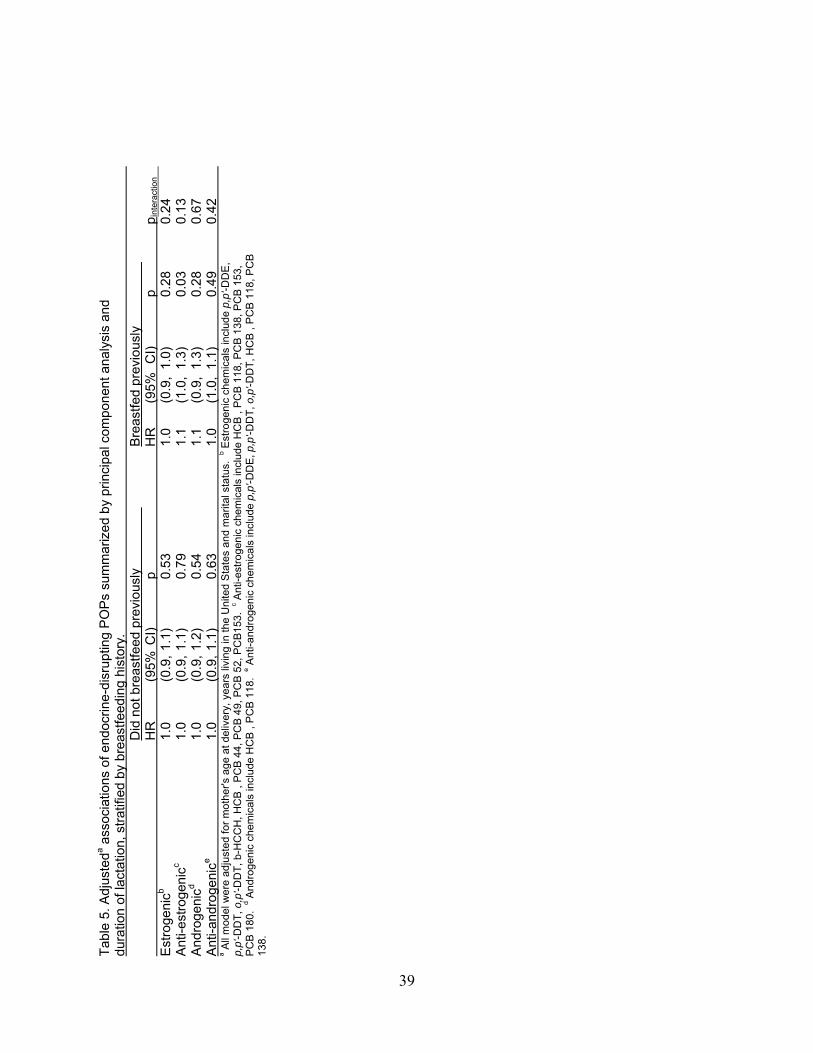
Tab
le 5
. Adj
uste
da a
ssoc
iatio
ns o
f end
ocrin
e-di
srup
ting
PO
Ps
sum
mar
ized
by
prin
cipa
l com
pone
nt a
naly
sis
and
dura
tion
of la
ctat
ion,
str
atifi
ed b
y br
east
feed
ing
hist
ory.
D
id n
ot b
reas
tfeed
pre
viou
sly
B
reas
tfed
prev
ious
ly
HR
(9
5% C
I)
p
HR
(9
5%
CI)
p
p
inte
ract
ion
Est
roge
nicb
1.0
(0.9
, 1.
1)
0.53
1.0
(0.9
, 1.
0)
0.28
0.24
A
nti-e
stro
geni
cc 1.
0 (0
.9,
1.1)
0.
79
1.
1 (1
.0,
1.3)
0.
03
0.
13
And
roge
nicd
1.0
(0.9
, 1.
2)
0.54
1.1
(0.9
, 1.
3)
0.28
0.67
A
nti-a
ndro
geni
ce 1.
0 (0
.9,
1.1)
0.
63
1.
0 (1
.0,
1.1)
0.
49
0.
42
a A
ll m
odel
we
re a
djus
ted
for
mot
her's
age
at d
eliv
ery,
yea
rs li
ving
in th
e U
nite
d S
tate
s an
d m
arita
l sta
tus.
b E
stro
geni
c ch
emic
als
incl
ude
p,p'
-DD
E,
p,p'
-DD
T, o
,p'-D
DT
, b-H
CC
H, H
CB
, P
CB
44,
PC
B 4
9, P
CB
52,
PC
B15
3. c A
nti-e
stro
geni
c ch
emic
als
incl
ude
HC
B ,
PC
B 1
18, P
CB
13
8, P
CB
153
, P
CB
180
. d A
ndro
geni
c ch
emic
als
incl
ude
HC
B ,
PC
B 1
18.
e Ant
i-a
ndro
geni
c ch
emic
als
incl
ude
p,p'
-DD
E, p
,p'-D
DT
, o,
p'-D
DT
, H
CB
, P
CB
118
, PC
B
138.
39

Chapter 3 Pesticides and PCBs in the breast milk of women residing in urban and agricultural communities of California A. CHAPTER SUMMARY Background: Few publications have reported concentrations of persistent organic pollutants (POPs) in breast milk from women residing in the United States (U.S.) since the 1980’s and no studies have characterized non-persistent pesticides such as chlorpyrifos in the milk of U.S. women despite concerns about their effects on child neurodevelopment. Methods: We measured concentrations of 7 organochlorine insecticides, 13 contemporary-use non-persistent pesticides, and 4 polychlorinated biphenyl (PCB) congeners in human milk samples from 13 women residing in the agricultural region of Salinas, CA and 21 women from the urban San Francisco Bay Area, CA. Samples were collected from 2002-2007. Results: Detection frequencies were >90% in both populations for chlorpyrifos, hexachlorobenzene, -hexachlorocyclohexane, o,p’- and p,p’-DDT/DDE, dacthal, and PCBs 118, 138, and 153. In general, detection frequencies were between 10 and 50% for cyfluthrin, atrazine, propoxur, and chlorpyrifos-methyl, and <10% for cypermethrin, fonofos, disulfoton, deltramethrin, bendiocarb and diazinon. Chlorpyrifos median concentrations were 25 and 28 pg/g milk and p,p’-DDE median concentrations were 3171 and 3351 pg/g milk for urban and agricultural women, respectively. Conclusion: POPs such as organochlorine pesticides and PCBs remain detectable in the milk of women residing in the U.S., but at lower concentrations. Additionally, several non-persistent pesticides used in agriculture and/or the home were found in human milk, indicating the potential for direct exposures to neonates and young children. Chlorpyrifos, which was voluntarily eliminated for residential use in 2001, was detected in urban women at concentrations comparable to women residing the Salinas Valley, a region with agricultural use of this pesticide.
40
B. INTRODUCTION
The World Health Organization1, 2 and the American Academy of Pediatrics3 recommend exclusive breastfeeding for the first six months of an infant’s life due to its numerous physiological and psychological benefits to infants and mothers.4-7 Although maternal milk is the optimal food for infants, it can contain mixtures chemicals that reflect maternal contemporary and accumulated dietary and environmental exposures.8-11 Most persistent organic pollutants including polychlorinated biphenyls (PCBs) and dichlorodiphenyltrichloroethane (DDT) and its environmental degradate, dichlorodiphenyldichloroethylene (DDE), are known to persist in the environment, bioaccumulate in fat and to be excreted in human milk.12 Although these persistent organochlorines (OCs) have been banned in many countries,13 their continued biomonitoring in human milk provides a metric that can be compared across populations and allows for monitoring of changes in body burdens over time.
In recent years, some non-persistent pesticides such as the organophosphate (OP) pesticides, chlorpyrifos and malathion, have also been detected in human milk14, 15 at ng/g concentrations (equivalent to parts per billion). Although some of these chemicals, such as chlorpyrifos, are relatively lipophilic, limited data exist on these contemporary-use non-persistent pesticides in human milk and the extent of infant exposure via breastfeeding. They have rarely been studied because they typically readily degrade in the environment and metabolized and excreted within hours to days in the body, hence, their non-persistent classification.16-18 These chemicals are of concern because they have been associated with neurodevelopmental effects in children and animals19-23 and because some non-persistent chemicals have properties that suggest that they are likely to be detected in human milk.24 Exposures during the lactation period are of particular concern because they occur at critical developmental periods for the infant.25
The Food Quality Protection Act (FQPA) of 1996 requires the United States (U.S.) Environmental Protection Agency (EPA) to set pesticide tolerance levels in food that reflect the vulnerability of sensitive sub-populations, particularly pregnant women and children.26 Yet, since there are no standardized human milk biomonitoring programs in the United States, we do not know the concentrations of chemicals to which breastfed infants are exposed or whether there are health effects associated with these early life exposures. Additionally, public health professionals are faced with the challenge of investigating potential health effects of chemicals in human milk while promoting breastfeeding practices.27
In this study we report concentrations of several non-persistent and persistent pesticides and PCBs measured in the milk of women residing in urban and agricultural regions. The analytes, including OP, OC, pyrethroid and carbamate pesticides and PCBs were extracted simultaneously using a new, highly sensitive extraction and a single analysis procedure.28 We also examine the variability of these chemicals over time to determine whether they are reliable biomarkers of exposure to mothers and infants. C. METHODS 1. Study populations
Participants were recruited from two California communities; one was urban (San Francisco Bay Area) and the other was agricultural (Salinas Valley). These communities were chosen to reflect the possible range of chemicals in maternal milk. All protocols were reviewed
41
and approved by the Committee for the Protection of Human Subjects at the University of California, Berkeley and the Institutional Review Board at the Centers for Disease Control and Prevention. Written, informed consent was obtained from participants at enrollment.
The urban population was a convenience sample which consisted of women who participated in a method development and validation study, performed jointly by researchers at the Centers for Disease Control and Prevention and the University of California, Berkeley, for measuring non-persistent and persistent pesticides and environmental chemicals in human milk.28 Women (N=22) were recruited from research facilities, doctors’ offices and offices for a food and nutrition program for women, infants and children (WIC). An advertisement was also placed in an electronic newsletter for parents. At the time of screening and enrollment, participants resided within 20 miles of the urban community of Berkeley, CA; were 18 or more years of age; spoke English or Spanish; and did not live near any agricultural fields. No demographic or exposure questionnaire data were collected from this population, but addresses were recorded and participants were visited for sample collection allowing for estimation of ethnicity and socio-economic status (SES). Milk samples were collected between January 2002 and May 2004.
Women from the Salinas Valley, CA were participants of a pesticide exposure study conducted in the summer of 2007 through the spring of 2008. Women were eligible to participate in this study if they were pregnant (between 24 and 34 weeks gestation), age 18 years or older, planning to deliver by Cesarean at Natividad Medical Center, low-income (eligible for Medi-Cal and the Comprehensive Perinatal Services Program), English- or Spanish-speaking with no previous chronic or pregnancy-specific conditions and were referred to our study by their medical provider. A detailed demographic and pesticide exposure questionnaire was administered to all 16 women who were enrolled in this study at approximately two weeks to four days prior to their scheduled Cesarean deliveries. This questionnaire also included a brief food frequency questionnaire pertaining to foods consumed in the three days prior to the interview.
2. Sample collection and laboratory analyses
Urban women provided freshly pumped or previously frozen milk that they felt their infants could spare. Participants used an electric or manual pump and expressed milk samples into plastic bottles or bags at home. Ten of the 22 urban women provided multiple samples resulting in a total of 121 individual samples; six of these ten women provided collection dates. Of these 121 samples, 43 samples from 21 women (1 women provided insufficient volume) were selected for analysis (12 women had one sample analyzed; 3 women had 2 samples analyzed; 1 women had 3 samples analyzed; 4 women had 4 samples analyzed and one woman had 6 samples analyzed). We analyzed at least two samples from nearly all women who provided multiple samples We selected additional multiple samples per woman based on whether collection dates were provided and, in general, selected the first and last sample provided. When collection dates were not provided, we selected additional samples randomly. For the six women who provided more than two samples and collection dates, we selected additional samples to represent the distribution of time since collection of sample 1.
Thirteen agricultural women provided one milk sample each. These samples were collected in their homes one to two weeks after delivery (mean (SD) = 9 (2.4) days postpartum). Agricultural women were asked to wash their hands with soap and water and to remove creams from breasts using warm water prior to sample collection. Either or both breasts were used as
42
source of milk samples and all participants used a breast pump (Basic Nurture III, Bailey Medical Engineering, Los Osos, CA).
All freshly pumped samples from either population were collected directly into the collection bottle (from individually sealed sterile kits made for the pump). Samples were then sealed, transported in a cooler on ice packs to the laboratory and immediately transferred to glass vials with Teflon-lined tops. Previously frozen samples from the urban population were transported from participants’ homes to the laboratory in a cooler containing dry ice. Samples were thawed slowly on ice, mixed vigorously and aliquoted into at least two separate vials (~10-20 ml each). All samples were stored frozen in the laboratory at -80°C.
Samples from urban and agricultural women were shipped on dry ice to the Centers for Disease Control and Prevention, National Center for Environmental Health, Pesticide Laboratory in Atlanta, GA for analysis using a newly developed and validated method which employed isotope dilution.28 Briefly, one gram of each sample was weighed and dispersed over hydromatrix. Accelerated solvent extraction with dichloromethane and hexane (80:20, v:v) was used to extract the analytes. The resulting eluate was concentrated to ~20 L, then 500 L of acetonitrile was added. Matrix interferents were removed using solid phase extraction cartridges packed with neutral alumina and PSA. Analytes were eluted with acetonitrile. The eluate was again concentrated to 20 L, then 20 L of toluene were added and the remaining acetonitrile was allowed to evaporate. Samples were analyzed using gas chromatography/high resolution mass spectrometry. Concentrations of p,p’-DDE in some samples exceeded upper instrument detection limits; thus, these samples were diluted by a factor of 10 with toluene and re-analyzed. The resulting measured concentration was then multiplied by the dilution factor to obtain the actual concentration. All concentrations were reported in picograms/gram milk (pg/g). Individual sample limits of detection (LODs) were reported for each chemical. Amount of lipid per gram of milk was determined gravimetrically from a separate aliquot. Quality control procedures included the use of blanks and duplicate samples. The complete list of 24 analytes measured by this method is shown in Table 1 by chemical class. 3. Statistical methods
All statistical analyses were performed using Stata 10 for Windows 29. Although we could not collect detailed demographic information for the urban women, we estimated demographics and income by visual observation and using participants’ addresses collected during screening along with the 2000 United States census data searched at the block group level for median household income and education and the block level for race and ethnicity information 30. For agricultural women, we summarized maternal age, ethnicity, marital status, education, household income, years residing in the United States, and agricultural work during pregnancy based on data collected during a detailed maternal interview.
Detection frequencies of each analyte were calculated separately for each population. Since some urban women contributed multiple samples, a chemical was considered detected in a woman if the concentration of that chemical exceeded its LOD in any of that woman’s samples. Sample-specific LODs were summarized for each chemical by population.
For analytes with at least 50% detection frequency, concentrations that were below the LOD were imputed as the individual sample’s LOD/2 and summary statistics (minimum, 25th, 50th and 75th percentiles, and maximum concentrations) were calculated for each population and reported in pg/g milk. We did not adjust concentrations by the lipid fraction in the milk because it is not clear whether lipid-adjustment is appropriate for all chemicals given their varying
43
lipophilicities and the lack of information of the mechanism by which these chemicals are transported to the milk.31 Lipid-adjusted concentrations can be calculated by dividing reported concentrations by the average lipid concentrations measured in the same samples (0.028 g fat/g milk for urban women and by 0.013 g fat/g milk for agricultural women). Typically the lipid fraction in mature milk is higher than that in colostrum or transitional milk32, and the measured lipid concentrations may reflect the timing of sample collection in relation to parturition for the two populations, but we cannot confirm this timing for the urban population. For urban women, concentrations (in pg/g milk) for individuals with multiple measurements were averaged before calculating summary statistics or performing statistical tests. Wilcoxon ranksum tests were then performed to determine whether chemical concentrations differed by urban or agricultural location. Because of the small sample sizes, a Monte Carlo permutation test (10,000 repetitions) was performed to determine the exact significance level (ppermutation) and the 95% confidence interval around the p-value for the ranksum test. If the exact significance level was below 0.05 and the confidence interval around it did not contain 0.05, we rejected the null hypothesis that the distributions of the chemical concentrations were the same by location. 4. Examination of variation in concentrations over time
Many women in the urban population provided multiple samples, which allowed us to determine whether measurements of these chemicals in human milk were stable biomarkers of exposure over time by estimating within-woman and between-women variance. Chemical concentrations (in both pg/g milk and ng/g lipid) were log-transformed and a simple random effects model (Yij = + i + eij) was used to determine standard deviations (SDs) of the between-women (i) and within-woman (eij) terms. The intraclass correlation coefficient (ICC) was then calculated as follows: ICC = (SD[i])
2 / ((SD[i]) 2 + (SD[eij])
2). We considered a large ICC (close to 1) to be a stable biomarker because of the small variation within a woman relative to between women. An ICC<0.7 provided evidence that a single sample may not adequately capture an individual woman’s exposure over time because the within-woman variation was a considerable fraction of the total variation.
We selected p,p’-DDE, chlorpyrifos and trans-permethrin as representative persistent and non-persistent chemicals to illustrate patterns of excretion over time and whether patterns differed by persistence. We plotted concentrations (in pg/g milk) separately for each of these two chemicals and for each woman by day of sample collection marking the sample that was collected and analyzed earliest as sample 1 and determining the days between subsequent samples and sample 1 (N=6). For these figures, the time element does not capture days postpartum, but rather describes the time between collection of each sample. Note that we were unable to record collection dates for one of three samples from woman 6 and all samples from women 7, 8 and 9; therefore, these women appear in the inset figures, but not in the larger figures plotted over time.
D. RESULTS 1. Demographics
Urban women were predominantly Caucasian (white), approximately 30-40 years of age, and of middle- to-high income with professional careers. The observed data on race and income were supported by the census 2000 data which showed that, in the census blocks from which our women resided, 69% were white, 8% were black or African American, and 17% were Asian; 7%
44
reported being of Hispanic ethnicity. Census block group data for the communities in which these women resided showed that on average, median household income was approximately $97,000 per year with only 7% below poverty and greater than 57% completed college or professional school. Conversely, agricultural women were 22-39 years of age, born in Mexico (100%), had no education beyond primary school, and had a median household income less than $24,000 per year. Nearly half of the agricultural women had lived in the U.S. for five or fewer years and 54% worked in agriculture during pregnancy. Although we do not know the age of the urban infants at the time of sample collection, we believe them to be older than those from the agricultural community since urban mothers were allowed to donate milk stored in freezers potentially over several months and mothers from the agricultural community were all recently postpartum. 2. Detection and chemical concentrations
As shown in Table 1, detection frequencies were ≥90% in both locations for thirteen of the 24 chemicals analyzed including the non-persistent chemicals: chlorpyrifos, cis- and trans-permethrin, as well as the persistent compounds: hexachlorobenzene, all four DDT/DDE isomers, -hexachlorocyclohexane, dacthal, and PCBs 118, 138, and 153. Detection frequencies were between 50 and 90% in at least one location for chlorpyrifos-methyl (urban), propoxur (urban), and PCB 180 (urban and agricultural). Ten of the chemicals had detection frequencies that were <50% in both locations including: fonofos, disulfoton, diazinon, cyfluthrin, cypermethrin, deltamethrin, bendiocarb, and atrazine. Mean LODs ranged from 0.02 - 5 pg/g milk for most chemicals; however, diazinon, cyfluthrin, cypermethrin, deltamethrin, and PCB 180 had higher mean LODs. With the exception of PCB 180, typically the chemicals with the highest LODs had the lowest detection frequencies. Thus, of the 14 non-persistent pesticides or isomers measured, only chlorpyrifos, chlorpyrifos-methyl, cis-permethrin, trans-permethrin, and propoxur were detected in more than 50% of samples tested and chlorpyrifos-methyl and propoxur were detected at this frequency only among urban women.
Summary statistics of concentrations of chemicals with >50% detection frequency and comparisons by urban/agricultural location are shown in Table 2. Median concentrations of chlorpyrifos were 25 and 28 pg/g milk in urban and agricultural women, respectively. Although non-parametric statistical tests showed that the distributions of chlorpyrifos concentrations did not differ by location, concentrations at the higher end of the distributions (> 75th percentile) were much higher in samples from agricultural women than the urban women leading to a higher mean concentration among agricultural women. Chlorpyrifos-methyl was the only other OP detected in >50% of samples drawn from urban women. Among these women, the median concentration of chlorpyrifos-methyl was 4 pg/g milk—six times lower than the median concentration of chlorpyrifos. Median concentrations (in pg/g milk) of cis-permethrin were 82 and 103 and of trans-permetrin were 93 and 176 for urban and agricultural women, respectively. Generally, the concentration of trans-permethrin was higher in a given sample than cis-permethrin. Additionally, the distributions of cis- and trans-permethrin were significantly higher in agricultural women than urban women. Concentrations of propoxur among urban women ranged from <LOD to 127 pg/g milk; the median value was 4.3 pg/g milk.
In contrast to the non-persistent pesticides, the majority of the persistent OCs measured were detected in milk samples from women in both urban and agricultural communities. Concentrations of hexachlorobenzene were well over the LOD with median values of 191 and 223 pg/g milk for urban and agricultural women, respectively. The range of -
45
hexachlorocyclohexane was 45–1406 pg/g milk with a median value of 220 pg/g milk among urban women. The median value of -hexachlorocyclohexane among agricultural women (443 pg/g milk) was twice that of urban women and the range was broader (<LOD – 2438 pg/g milk). Median concentrations of the four DDT/DDE isomers measured (in pg/g milk) were 5.7 for o,p’-DDE, 37 for o,p’-DDT, 107 for p,p’-DDT and 3171 for p,p’-DDE in urban women. DDT/DDE median concentrations (in pg/g milk) among agricultural women were 5.2 for o,p’-DDE, 62 for o,p’-DDT, 102 for p,p’-DDT and 3488 for p,p’-DDE. The maximum concentration of p,p’-DDE among agricultural women was an order of magnitude higher than that of urban women. Lastly, although dacthal was detected in all of the urban and agricultural samples, concentrations were low, ranging from 0.9 to 5.6 with a median value of 2.8 pg/g milk in urban women and ranging from 2.6 to 7.4 with a median value of 3.4 pg/g milk in agricultural women. Although no persistent OCs were statistically significantly different by location, concentrations were generally higher in agricultural women than urban women.
In contrast to trends observed for OCs, concentrations of three PCB congeners were significantly higher in urban women than agricultural women. Among urban women, median concentrations of PCBs 118, 138, and 153 were 93, 183, and 242 pg/g milk, respectively; whereas for agricultural women, median concentrations were 17, 38, and 44 pg/g milk, respectively. PCB 180 was statistically significantly lower in urban women than agricultural women with median concentrations of 239 and 683 pg/g milk, respectively. 3. Variability of chemical concentrations for urban women
With the exception of dacthal and PCB 180 (ICCs of 0.53 and 0.46, respectively) we found that ICCs were highest (ranging from 0.80 to 0.91) for persistent OCs and PCBs, confirming the stability of these chemicals within women. ICCs were lower, indicating high within-woman variance, for chlorpyrifos, chlorpyrifos-methyl and propoxur (ICC = 0.54, 0.36 and 0.64, respectively). Although cis- and trans-permethrin are considered non-persistent pesticides, concentrations appeared to be almost as stable within a woman as the persistent OCs and PCBs with ICCs of 0.80 and 0.74, respectively.
Illustrations of within-woman and between-women variability and estimated trends of concentrations over time are shown for p,p’-DDE (Figure 1A), chlorpyrifos (Figure 1B) and trans-permethrin (Figure 1C) for each woman (inset) as well as for each woman over time. Overall, most women’s concentrations of p,p’-DDE generally decreased over time (Figure 1A), although some women’s concentrations increased at some points as was observed by Lakind et al. 33. The random effects model clustered by woman showed a statistically significant decrease in concentrations of p,p’-DDE (log10-transformed) by -0.0013 pg/g milk per day (95% CI = -0.003, -0.00009). Using lipid-adjusted p,p’-DDE concentrations in these models also yielded a statistically significant negative association ( = -0.0010 ng/g lipid per day, 95% CI = -0.002, -0.00002). The Figure 1A inset shows that for many women, concentrations are tightly clustered, while some women have high variability. Within women, concentrations of p,p’-DDE ranged 641-8196 pg/g milk and the ratios of the highest to lowest concentrations within a woman ranged 1.2-4.3 with a mean (SD) ratio of 2.1 (1.0).
In contrast to the negative trend observed for p,p’-DDE, Figure 1B displays no clear trend in concentrations of chlorpyrifos among women over time. Concentrations in some women increased over time while in others concentrations decreased. The coefficient on our time variable from the random effects model of log10-transformed chlorpyrifos concentrations was not statistically significant whether we used lipid-adjusted or unadjusted values ( [95% CI] =
46
0.0008 ng/g lipid per day [-0.0008, 0.002]; 0.001 pg/g milk per day [-0.0004, 0.003]), supporting our observations of no clear trend over time from Figure 1B. From the Figure 1B inset, we see that many women’s repeat samples cluster, but the difference between the maximum and minimum concentration per woman can vary greatly (range of difference=1.2-96.8 pg/g milk). In addition, the ratios between the highest and lowest concentrations measured within a woman ranged 1.1-4.7 with a mean (SD) ratio of 2.5 (1.2), which is higher than the mean ratios observed for p,p’-DDE.
In Figure 1C, we observed generally smaller between-women and within-woman variation than for p,p’-DDE or chlorpyrifos; notice that the scale figure 1C is smaller than for the other two figures. We observed no clear trend over time, as was confirmed by random effects models using either non-lipid-adjusted or lipid-adjusted concentrations (� [95% CI] = -0.00004 pg/g milk per day [-0.001, 0.001]; -0.0001 ng/g lipid per day [-0.001, 0.001]). The range of differences between the maximum and minimum concentrations per woman was 12-126 pg/g milk and the range of ratios of maximum and minimum concentrations per woman was 1.1-2.9 with a mean (SD) ratio of 1.6 (0.5). Although both the between-women and within-woman variability were low for trans-permethrin, the low ICC is primarily due to the low within-woman variance. E. DISCUSSION
Measurements of chemicals in breast milk provide a biomarker of maternal exposure and dietary exposure for breastfeeding infants during critical developmental periods.25 In this study, we detected non-persistent pesticides that are not typically measured in human milk as well as persistent organic pollutants. We also found that concentrations of persistent pesticides and PCBS were typically more stable over time than most non-persistent pesticides except for permethrin.
As expected, we observed high detection (>97%) for most of the POPs, including DDT/DDE. In comparison to demographically similar historic populations, we found that median concentrations of p,p’-DDE in our urban women (3171 pg/g milk) were much lower than concentrations in milk collected from Northern California women in ~1993 (~6000 pg/g milk, estimated)34 and the agricultural women in this study (3488 pg/g milk) had much lower median concentrations than milk from a migrant Mexican cohort recruited from North Carolina in 1998 (~30,000 pg/g milk, estimated).34 Worldwide policy actions since the 1970’s likely led to decreases in concentrations over time for DDT/DDE and other POPs.
PCB concentrations appeared to differ by location and to have decreased over time. For three PCB congeners, 118, 138 and 153, the concentration distribution for the urban population was statistically significantly higher than the agricultural population possibly due to demographic differences, particularly in diet.35 Non-Hispanic white women have been found to eat more fish, a food in which PCBs tend to bioaccumulate and biomagnify, than Mexican Americans.36-38 Few studies have reported concentrations of individual PCB congeners in milk, but compared to urban women in our study, concentrations of PCB 153 were approximately 13 times higher among women residing in New York in 1979.39 Detection for PCB 180 was poor due to method limitations and interference with other analytes. Thus, data for this congener may not be as reliable as that reported for the other three congeners (PCBs 118, 138 and 153).
We observed high detection frequencies of the non-persistent pesticides, chlorpyrifos and permethrin, in both populations, but were only able to investigate potential pathways of exposure
47
among the 13 women residing in the agricultural region. Among women residing in the Salinas Valley with chlorpyrifos concentrations above the median, 71% (5 of 7) worked in agriculture during pregnancy (compared to 2 of 6 women who were below the median concentration), but only 2 women lived fewer than ¼ mile from agricultural fields (vs. 1 woman below the median concentration). The impact of proximity of residence to agricultural fields is unclear in this population since most women lived > ¼ mile from the nearest field. We hypothesized that women residing in an agricultural area would have higher concentrations of chlorpyrifos in their milk compared to urban women because chlorpyrifos is widely used for agricultural purposes in the Salinas Valley (~ 28,000 kg/yr used); however, median levels were not significantly different although the 75th percentile was higher among Salinas women. Future studies should examine whether chlorpyrifos concentrations in breast milk are associated with agricultural work. Concentration differences between the two populations may have been more evident if recruitment of all study women had occurred at the same time in relation to the U.S. EPA voluntary elimination of residential uses of chlorpyrifos in 2001.40 For example, if chlorpyrifos had been used in residences in both locations in 2000 and samples were collected at the same time, concentrations measured in women of both locations would be more meaningful. Chlorpyrifos has been found to adhere to particles, such as housedust,41 may be somewhat bioaccumulative since it has a log octanol-water coefficient (Kow) greater than 3,24, and appears to persist indoors for greater than a year, 42 but the total duration of persistence in the environment or in the body is not known. Thus, residential applications may contribute to maternal exposures in the urban population (recruited within 1-3 years of the ban on residential use), but may not contribute to maternal exposures in the agricultural cohort who were recruited 6-7 years after the ban.
For permethrin, the agricultural population had statistically significantly higher concentrations compared to the urban population for both isomers. In addition to agricultural use of permethrin (~20,000 kg/yr),43 low SES families may reside in poorer quality housing possibly leading to increased use of home pesticides containing permethrin.44 Reported home pesticide use of permethrin in agricultural homes was minimal during our study, but historically used permethrin may persist indoors as evidenced by the high detection of permethrin in household dust for demographically similar homes.45
Few studies have reported concentrations of non-persistent pesticides in human milk; one report from India showed extremely high concentrations of chlorpyrifos (estimated 230,000 pg/g milk compared to 28 pg/g milk in agricultural women in this study).15 The authors attributed these concentrations to non-compliance of recommended re-entry waiting periods after application of chlorpyrifos. Reported concentrations of permethrin in the milk of South African women (estimated 8000 pg/g milk) were much higher than any women in our populations (maximum values of 93 and 176 pg/g milk in urban and agricultural women, respectively).46 In South Africa, permethrin is used indoors for malaria vector control. Thus, regulations and use patterns in different countries may explain why concentrations were lower in our study.
Chlorpyrifos-methyl and propoxur were frequently detected in the urban population, but not in the agricultural population. Timing of sample collections may explain the discrepancies of detection of these two pesticides between our urban and agricultural populations. Chlorpyrifos-methyl production in some forms was halted in 2000 and use of all formulations was discontinued at the end of 2004.47 Since the urban samples were collected from 2002 to 2004 and since chlorpyrifos-methyl was used on stored grain products during that period, it is possible that the urban population was exposed to higher concentrations of chlorpyrifos-methyl through
48
the diet than the agricultural population whose sample collection occurred a few years after the ban. Propoxur is an indoor and outdoor home-use pesticide and is used in food handling facilities to control cockroaches, ants and other flying insects; however, it is not used in agriculture.48 We do not know about home use of pesticides in the urban sample and only two agricultural homes were found to contain any home-use pesticides during the period of study, but the ingredients remain unknown.
Pesticide degradation, storage stability issues and relatively higher LODs may explain why some non-persistent pesticides widely used in California, including diazinon, were not detected. Other chemical properties may determine whether some persist in the environment or in the body. For example, we observed that chemicals with higher log Kows had higher ICCs. The log Kow values for permethrin and p,p’-DDE are 6.10 and 6.51, respectively; whereas log Kows for chlorpyrifos and diazinon are lower at 4.96 and 3.81, respectively, indicating less lipophilicity and less potential to bioaccumulate. These characteristics may in part explain why concentrations for persistent chemicals and permethrin did not vary greatly within women, indicating stability of concentrations over time, but varied more for chlorpyrifos. Understanding the variability or stability of these chemicals in breast milk will inform epidemiological researchers about the utility of these biomarkers of exposure in relation to health effects and whether a single measurement is informative. Concentrations in milk that vary little over time are the most useful biomarkers of exposure, but with repeated sampling, a less stable biomarker may still be useful for epidemiological investigations.
Although we directly compared chemical concentrations between our urban and agricultural populations, we realize that such comparisons should be interpreted with caution for several reasons. These populations were selected to reflect the possible range of pesticide concentrations in maternal milk. A priori, we expected higher concentrations of non-persistent pesticides among the agricultural population because of their potential for chronic low-level exposure to contemporary-use non-persistent pesticides farmworker occupation, proximity to agricultural fields,49 lower SES and likely poorer housing quality44. We also expected higher concentrations of DDT among agricultural women, who were born in Mexico, where DDT was used until 2000, whereas DDT was banned in the U.S. in 1972.50, 51 Timing of sample collection in relation to parturition could also alter expected differences between the populations. Milk samples collected from urban women were mature milk samples, collected more than 14 days postpartum, whereas the majority of samples from agricultural women were colostrum or transitional milk. Thus, not only is the composition of milk different by lactation stage with colostrum having lower lipid content, but agricultural women may have had behavioral or dietary differences because their samples were collected closer to delivery. For persistent lipophilic chemicals that may decrease over the course of lactation,52 concentrations measured in the milk of women who have lactated longer may underestimate infant exposures closer to the postpartum period. There may also be other metabolic or pharmacokinetic alterations in the postpartum period that diminish the comparability of measured concentrations in these populations (e.g. weight changes).
This research was intended to be a pilot study, thus there are several limitations. Technology has allowed for the ability to measure environmental chemicals in human milk using sophisticated analytical methods, but at this point, we are not certain whether the concentrations observed carry potential risks to children. In addition, the sample sizes of both populations are small and chemical concentrations may not reflect those found in other urban or agricultural populations. Stability of the analytes during storage, particularly for the non-persistent pesticides
49
from the urban population, is another potential limitation of this study. We have not yet performed storage stability studies; thus, our measured concentrations may underestimate actual concentrations and exposures experienced by our mothers and infants.
Many advocates support biomonitoring of human milk in the U.S.27 Researchers who study early childhood exposures should consider not only chemicals that are highly persistent, lipophilic, and expected to be found in human milk, but also non-persistent chemicals to which women are exposed in their daily environments or diets. Although non-persistent chemicals may not highly bioaccumulate, they are detectable in human milk and pose potential risks to infants. Under FQPA,26 the U.S. EPA is required to conduct dietary exposure assessments for current-use non persistent pesticides, but the primary food for the youngest and most vulnerable population, breast milk, has not been adequately studied and the potential health effects in infants and young children from lactation exposure are not known. The lack of a comprehensive breast milk biomonitoring program is a shortcoming of FQPA.
To our knowledge, this is the first report of concentrations of non-persistent pesticides such as chlorpyrifos and permethrin in human milk over time. Because these pesticides have only recently been reported in human milk, little is known about the mechanisms of exposure or transport and there is currently no literature on which factors contribute to measurable levels of these chemicals in breast milk. Without an adequate understanding of these factors, interventions cannot be designed to minimize exposures to infants via human milk.
In conclusion, we found that several contemporary-use, non-persistent pesticides including chlorpyrifos, chlorpyrifos-methyl, permethrin and propoxur were detectable in human milk, particularly in women who resided in an urban community. For persistent chemicals, most OC and PCB concentrations were lower than in studies from at least a decade ago. In general, OC concentrations were higher in the agricultural populations than the urban population; the reverse was true of the PCBs. Lastly, some non-persistent chemicals such as chlorpyrifos may not be stable biomarkers of exposure in human milk given the wide variability of concentrations observed within women. While there are measurable concentrations of chemicals in all mothers’ milk, breastfeeding is still the optimal source of nutrition for infants. More research is needed to identify sources of exposure to mothers and reduce exposures to women of childbearing age and breastfeeding infants.
50
F. REFERENCES 1. WHO, Global strategy for infant and young child feeding. . 2003, World Health
Organization: Geneva. 2. Kramer, M.S. and R. Kakuma, The optimal duration of exclusive breastfeeding: A
systematic review. 2002, World Health Organization: Geneva. 3. Gartner, L.M., J. Morton, R.A. Lawrence, A.J. Naylor, D. O'Hare, R.J. Schanler, and A.I.
Eidelman, Breastfeeding and the use of human milk. Pediatrics, Feb 2005. 115(2): p. 496-506.
4. Hanson, L.A., M. Korotkova, and E. Telemo, Breast-feeding, infant formulas, and the immune system. Ann Allergy Asthma Immunol, Jun 2003. 90(6 Suppl 3): p. 59-63.
5. Hanson, L.A., M. Korotkova, S. Lundin, L. Haversen, S.A. Silfverdal, I. Mattsby-Baltzer, B. Strandvik, and E. Telemo, The transfer of immunity from mother to child. Ann N Y Acad Sci, Apr 2003. 987: p. 199-206.
6. Anderson, J.W., B.M. Johnstone, and D.T. Remley, Breast-feeding and cognitive development: a meta-analysis. Am J Clin Nutr, Oct 1999. 70(4): p. 525-35.
7. Leung, A.K. and R.S. Sauve, Breast is best for babies. J Natl Med Assoc, Jul 2005. 97(7): p. 1010-9.
8. Smith, D., Worldwide trends in DDT levels in human breast milk. Int J Epidemiol, Apr 1999. 28(2): p. 179-88.
9. Rogan, W.J. and B.C. Gladen, Study of human lactation for effects of environmental contaminants: the North Carolina Breast Milk and Formula Project and some other ideas. Environ Health Perspect, May 1985. 60: p. 215-21.
10. Bates, M.N., B. Thomson, and N. Garrett, Reduction in organochlorine levels in the milk of New Zealand women. Arch Environ Health, Nov-Dec 2002. 57(6): p. 591-7.
11. Waliszewski, S.M., A.A. Aguirre, R.M. Infanzon, and J. Siliceo, Persistent organochlorine pesticide levels in maternal blood serum, colostrum, and mature milk. Bull Environ Contam Toxicol, Mar 2002. 68(3): p. 324-31.
12. Waliszewski, S.M., G. Melo-Santiesteban, R. Villalobos-Pietrini, S. Gomez-Arroyo, O. Amador-Munoz, M. Herrero-Mercado, and O. Carvajal, Breast Milk Excretion Kinetic of beta-HCH, pp'DDE and pp'DDT. Bull Environ Contam Toxicol, Jun 24 2009.
13. UNEP, Stockholm Convention on Persistent Organic Pollutants. Depositary notification C.N.531.2001.TREATIES-96 of 19 June 2001, United Nations Environment Program, Editor. 2001, United Nations.
14. Lederman, S.A., Environmental contaminants in breast milk from the central Asian republics. Reprod Toxicol, Mar-Apr 1996. 10(2): p. 93-104.
15. Sanghi, R., M.K. Pillai, T.R. Jayalekshmi, and A. Nair, Organochlorine and organophosphorus pesticide residues in breast milk from Bhopal, Madhya Pradesh, India. Hum Exp Toxicol, Feb 2003. 22(2): p. 73-6.
16. Barr, D.B., Biomonitoring of exposure to pesticides Journal of Chemical Health and Safety, November-December 2008 2008. 15(6): p. 20-29.
17. Racke, J.D., Degradation of organophosphorous insecticides in environmental matrices. Organophosphates Chemistry, Fate and Effects. 1992, San Diego, CA: Academic Press, Inc.
51
18. Starr, J., S. Graham, D. Stout, 2nd, K. Andrews, and M. Nishioka, Pyrethroid pesticides and their metabolites in vacuum cleaner dust collected from homes and day-care centers. Environ Res, Nov 2008. 108(3): p. 271-9.
19. Silva, A.P., F.C. Meotti, A.R. Santos, and M. Farina, Lactational exposure to malathion inhibits brain acetylcholinesterase in mice. Neurotoxicology, Apr 28 2006.
20. Eskenazi, B., A.R. Marks, A. Bradman, K. Harley, D.B. Barr, C. Johnson, N. Morga, and N.P. Jewell, Organophosphate pesticide exposure and neurodevelopment in young Mexican-American children. Environ Health Perspect, May 2007. 115(5): p. 792-8.
21. Eskenazi, B., J. Chevrier, L.G. Rosas, H.A. Anderson, M.S. Bornman, H. Bouwman, A. Chen, B.A. Cohn, C. de Jager, D.S. Henshel, F. Leipzig, J.S. Leipzig, E.C. Lorenz, S.M. Snedeker, and D. Stapleton, The Pine River statement: human health consequences of DDT use. Environ Health Perspect, Sep 2009. 117(9): p. 1359-67.
22. Rauh, V.A., R. Garfinkel, F.P. Perera, H.F. Andrews, L. Hoepner, D.B. Barr, R. Whitehead, D. Tang, and R.W. Whyatt, Impact of prenatal chlorpyrifos exposure on neurodevelopment in the first 3 years of life among inner-city children. Pediatrics, Dec 2006. 118(6): p. e1845-59.
23. Engel, S.M., G.S. Berkowitz, D.B. Barr, S.L. Teitelbaum, J. Siskind, S.J. Meisel, J.G. Wetmur, and M.S. Wolff, Prenatal organophosphate metabolite and organochlorine levels and performance on the Brazelton Neonatal Behavioral Assessment Scale in a multiethnic pregnancy cohort. Am J Epidemiol, Jun 15 2007. 165(12): p. 1397-404.
24. Thomann, R.V., Modeling organic chemical fate in aquatic systems: significance of bioaccumulation and relevant time-space scales. Environ Health Perspect, Jun 1995. 103 Suppl 5: p. 53-7.
25. National Research Council, Pesticides in the Diets of Infants and Children. 1993, Washington, D.C.: National Academy Press.
26. Food Quality Protection Act. 1996. 27. LaKind, J.S., C.M. Berlin, and M.N. Bates, Overview: technical workshop on human milk
surveillance and biomonitoring for environmental chemicals in the United States. J Toxicol Environ Health A, Oct 22 2005. 68(20): p. 1683-9.
28. Davis, M., R.H. Weldon, G. Morales-Agudelo, W. Roman, A. Bradman, N. Holland, B. Eskenazi, and D. Barr, A High-Resolution Gas Chromatography Mass Spectrophometric Method for Measuring Pesticides and PCBs in Human Milk. Epidemiology, October 12-16 2008. 19(6): p. S335-S335.
29. StataCorp, Stata Statistical Software: Release 10. 2007, StataCorp LP: College Station, TX.
30. U.S. Bureau of the Census, American Factfinder. 2000, U.S. Census Bureau: Washington, DC.
31. Schisterman, E.F., B.W. Whitcomb, G.M. Louis, and T.A. Louis, Lipid adjustment in the analysis of environmental contaminants and human health risks. Environ Health Perspect, Jul 2005. 113(7): p. 853-7.
32. Allen, J.C., R.P. Keller, P. Archer, and M.C. Neville, Studies in human lactation: milk composition and daily secretion rates of macronutrients in the first year of lactation. Am J Clin Nutr, Jul 1991. 54(1): p. 69-80.
33. LaKind, J.S., C.M. Berlin, Jr., A. Sjodin, W. Turner, R.Y. Wang, L.L. Needham, I.M. Paul, J.L. Stokes, D.Q. Naiman, and D.G. Patterson, Jr., Do human milk concentrations of persistent organic chemicals really decline during lactation? Chemical concentrations
52
during lactation and milk/serum partitioning. Environ Health Perspect, Oct 2009. 117(10): p. 1625-31.
34. Lovelady, C.A., R.A. Whitehead, M.A. McCrory, L.A. Nommsen-Rivers, S. Mabury, and K.G. Dewey, Weight change during lactation does not alter the concentrations of chlorinated organic contaminants in breast milk of women with low exposure. J Hum Lact, Dec 1999. 15(4): p. 307-15.
35. Beyer, A. and M. Biziuk, Environmental fate and global distribution of polychlorinated biphenyls. Rev Environ Contam Toxicol, 2009. 201: p. 137-58.
36. Hightower, J.M., A. O'Hare, and G.T. Hernandez, Blood mercury reporting in NHANES: identifying Asian, Pacific Islander, Native American, and multiracial groups. Environ Health Perspect, Feb 2006. 114(2): p. 173-5.
37. Schwartz, P.M., S.W. Jacobson, G. Fein, J.L. Jacobson, and H.A. Price, Lake Michigan fish consumption as a source of polychlorinated biphenyls in human cord serum, maternal serum, and milk. Am J Public Health, Mar 1983. 73(3): p. 293-6.
38. Corsolini, S., N. Ademollo, T. Romeo, S. Greco, and S. Focardi, Persistent organic pollutants in edible fish: a human and environmental health problem Microchemical Journal, January 2005 2005. 79 (1-2): p. 115-123.
39. Bush, B., J. Snow, S. Connor, and R. Koblintz, Polychlorinated biphenyl congeners (PCBs), p,p'-DDE and hexachlorobenzene in human milk in three areas of upstate New York. Arch Environ Contam Toxicol, Jul 1985. 14(4): p. 443-50.
40. U.S. EPA (2000) Pesticide Reregistration Status for Organophosphates Volume, 41. Harnly, M.E., A. Bradman, M. Nishioka, T.E. McKone, D. Smith, R. McLaughlin, G.
Kavanagh-Baird, R. Castorina, and B. Eskenazi, Pesticides in dust from homes in an agricultural area. Environ Sci Technol, Dec 1 2009. 43(23): p. 8767-74.
42. Buck, R.J., H. Ozkaynak, J. Xue, V.G. Zartarian, and K. Hammerstrom, Modeled estimates of chlorpyrifos exposure and dose for the Minnesota and Arizona NHEXAS populations. J Expo Anal Environ Epidemiol, 2001. 11(3): p. 253-68.
43. DPR, Pesticide Use Report, Annual 2007, Indexed by Chemical and by Crop. 2007, Department of Pesticide Regulation, California Environmental Protection Agency: Sacramento, CA.
44. Bradman, A., J. Chevrier, I. Tager, M. Lipsett, J. Sedgwick, J. Macher, A.B. Vargas, E.B. Cabrera, J.M. Camacho, R. Weldon, K. Kogut, N.P. Jewell, and B. Eskenazi, Association of housing disrepair indicators with cockroach and rodent infestations in a cohort of pregnant Latina women and their children. Environmental Health Perspectives, Dec 2005. 113(12): p. 1795-1801.
45. Quirós-Alcalá, L., K.D. Smith, G. Weeresekera, M. Odetokuns, D.B. Barr, M. Nishioka, B. Eskenazi, and A. Bradman. Is there an association between organophosphorous pesticide and dialkylphosphate levels in house dust and urinary dialkylphosphate metabolites in children? in The International Society of Exposure Science. 2009. Minneapolis, MN.
46. Bouwman, H., B. Sereda, and H.M. Meinhardt, Simultaneous presence of DDT and pyrethroid residues in human breast milk from a malaria endemic area in South Africa. Environ Pollut, Dec 2006. 144(3): p. 902-17.
47. U.S. EPA, Report on FQPA Tolerance Reassessment and Risk Management Decision for Chlorpyrifos methyl. 2000, Office of Prevention, Pesticides and Toxic Substances: Washington, D.C.
53
48. U.S. EPA, Reregistration Eligibility Decision (RED): Propoxur. 1997, United States Environmental Protection Agency; Office of Prevention, Pesticides and Toxic Substances: Washington, D.C.
49. Lu, C., R.A. Fenske, N.J. Simcox, and D. Kalman, Pesticide exposure of children in an agricultural community: evidence of household proximity to farmland and take home exposure pathways. Environ Res, 2000. 84(3): p. 290-302.
50. US EPA (1972) DDT Ban Takes Effect (Environmental Protection Agency press release). 51. US EPA (2002) Persistent Organic Pollutants: A Global Issue, A Global Response 52. LaKind, J.S., C.M. Berlin, and D.Q. Naiman, Infant exposure to chemicals in breast milk
in the United States: what we need to learn from a breast milk monitoring program. Environ Health Perspect, 2001. 109(1): p. 75-88.
54
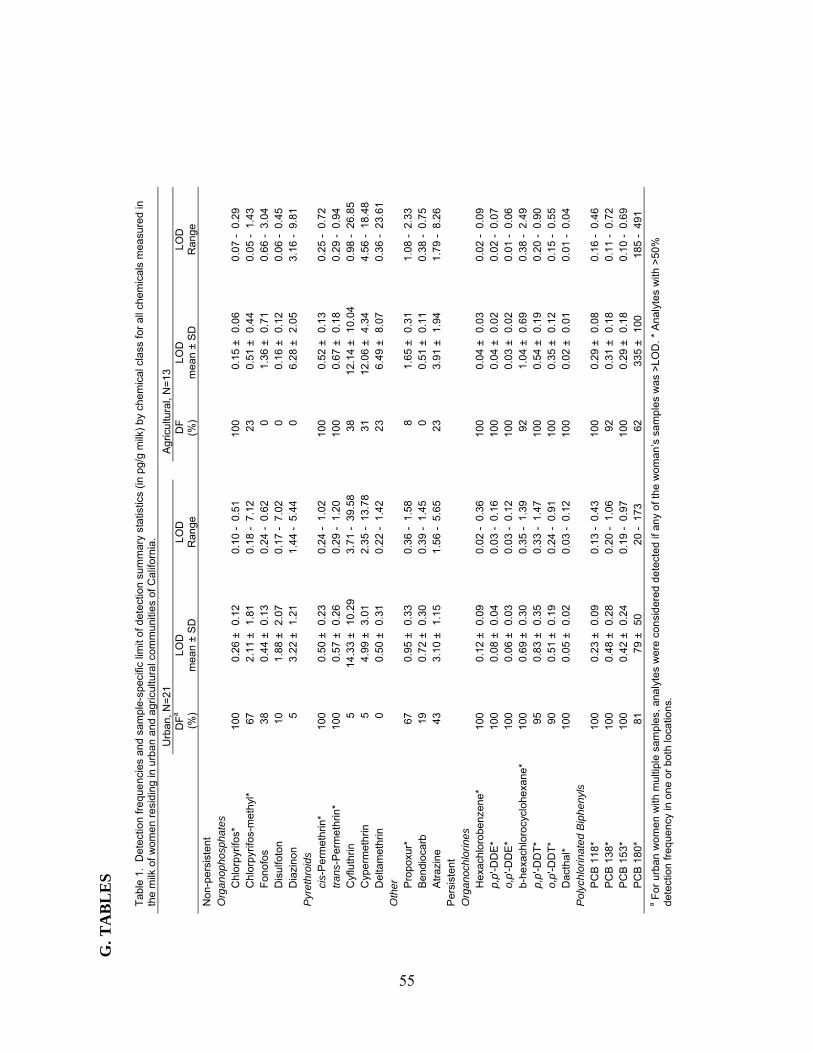
G. T
AB
LE
S
T
able
1.
Det
ectio
n fr
eque
ncie
s an
d sa
mpl
e-sp
ecifi
c lim
it of
det
ectio
n su
mm
ary
stat
istic
s (in
pg/
g m
ilk)
by
chem
ical
cla
ss fo
r al
l che
mic
als
mea
sure
d in
th
e m
ilk o
f wom
en
resi
ding
in u
rba
n an
d ag
ricul
tura
l com
mun
ities
of C
alifo
rnia
.
Urb
an,
N=
21
A
gric
ultu
ral,
N=
13
DF
a (%
) LO
D
mea
n ±
SD
LO
D
Ran
ge
D
F
(%)
LOD
m
ean
± S
D
LOD
R
ange
Non
-pe
rsis
tent
Org
ano
phos
phat
es
Chl
orp
yrifo
s*
100
0.26
±0.
12
0.10
-0.
51
10
0 0.
15 ±
0.06
0.
07 -
0.29
Chl
orp
yrifo
s-m
eth
yl*
67
2.11
±1.
81
0.18
-7.
12
23
0.
51 ±
0.44
0.
05 -
1.43
Fon
ofos
38
0.
44 ±
0.13
0.
24 -
0.62
0 1.
36 ±
0.71
0.
66 -
3.04
Dis
ulfo
ton
10
1.88
±2.
07
0.17
-7.
02
0
0.16
±0.
12
0.06
-0.
45
D
iazi
non
5 3.
22 ±
1.21
1.
44 -
5.44
0 6.
28 ±
2.05
3.
16 -
9.81
P
yret
hroi
ds
cis-
Per
met
hrin
* 10
0 0.
50 ±
0.23
0.
24 -
1.02
100
0.52
±0.
13
0.25
-0.
72
tr
ans-
Per
me
thri
n*
100
0.57
±0.
26
0.29
-1.
20
10
0 0.
67 ±
0.18
0.
29 -
0.94
Cyf
luth
rin
5 14
.33
±10
.29
3.71
-39
.58
38
12
.14
±10
.04
0.98
-26
.85
C
ype
rmet
hrin
5
4.99
±3.
01
2.35
-13
.78
31
12
.06
±4.
34
4.56
-18
.48
D
elta
met
hrin
0
0.50
±0.
31
0.22
-1.
42
23
6.
49 ±
8.07
0.
36 -
23.6
1 O
ther
P
ropo
xur*
67
0.
95 ±
0.33
0.
36 -
1.58
8 1.
65 ±
0.31
1.
08 -
2.33
Ben
dioc
arb
19
0.72
±0.
30
0.39
-1.
45
0
0.51
±0.
11
0.38
-0.
75
A
traz
ine
43
3.10
±1.
15
1.56
-5.
65
23
3.
91 ±
1.94
1.
79 -
8.26
P
ersi
sten
t
Org
ano
chlo
rines
H
exac
hlor
obe
nzen
e*
100
0.12
±0.
09
0.02
-0.
36
10
0 0.
04 ±
0.03
0.
02 -
0.09
p,p'
-DD
E*
100
0.08
±0.
04
0.03
-0.
16
10
0 0.
04 ±
0.02
0.
02 -
0.07
o,p'
-DD
E*
100
0.06
±0.
03
0.03
-0.
12
10
0 0.
03 ±
0.02
0.
01 -
0.06
b-he
xach
loro
cycl
ohex
ane*
10
0 0.
69 ±
0.30
0.
35 -
1.39
92
1.04
±0.
69
0.38
-2.
49
p,
p'-D
DT
* 95
0.
83 ±
0.35
0.
33 -
1.47
100
0.54
±0.
19
0.20
-0.
90
o,
p'-D
DT
* 90
0.
51 ±
0.19
0.
24 -
0.91
100
0.35
±0.
12
0.15
-0.
55
D
acth
al*
100
0.05
±0.
02
0.03
-0.
12
10
0 0.
02 ±
0.01
0.
01 -
0.04
P
olyc
hlor
inat
ed B
iphe
nyls
P
CB
118
* 10
0 0.
23 ±
0.09
0.
13 -
0.43
100
0.29
±0.
08
0.16
-0.
46
P
CB
138
* 10
0 0.
48 ±
0.28
0.
20 -
1.06
92
0.31
±0.
18
0.11
-0.
72
P
CB
153
* 10
0 0.
42 ±
0.24
0.
19 -
0.97
100
0.29
±0.
18
0.10
-0.
69
P
CB
180
* 81
79
±50
20
-17
3
62
335
±10
0 18
5 -
491
a For
urb
an w
omen
with
mul
tiple
sam
ples
, ana
lyte
s w
ere
con
side
red
det
ecte
d if
any
of t
he w
oman
’s s
ampl
es w
as >
LO
D. *
Ana
lyte
s w
ith >
50%
de
tect
ion
freq
uenc
y in
one
or
both
loca
tions
.
55
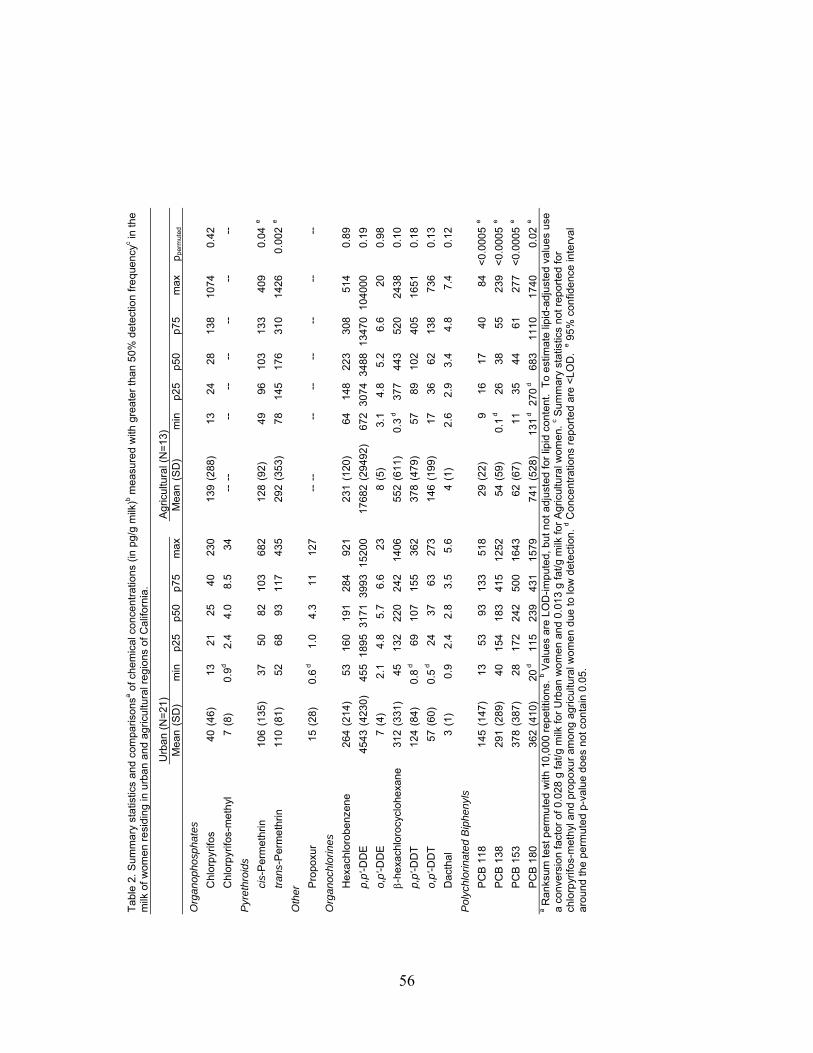
Tab
le 2
. Sum
ma
ry s
tatis
tics
and
com
paris
onsa o
f che
mic
al c
once
ntra
tions
(in
pg/
g m
ilk)b m
easu
red
with
gre
ate
r th
an 5
0%
det
ectio
n fr
eq
uenc
yc in th
e m
ilk o
f wom
en r
esi
ding
in u
rban
and
agr
icul
tura
l re
gion
s of
Cal
iforn
ia.
U
rban
(N
=21
)
A
gric
ultu
ral (
N=
13)
Mea
n (S
D)
min
p25
p50
p75
max
M
ean
(SD
) m
in
p25
p50
p75
max
ppe
rmut
ed
Org
ano
phos
phat
es
C
hlor
pyr
ifos
40 (
46)
1321
2540
230
13
9(2
88)
13
2428
138
1074
0.42
C
hlor
pyr
ifos-
met
hyl
7
(8)
0.9
d2.
44.
08.
534
--
--
--
----
----
--
Pyr
ethr
oids
ci
s-P
erm
ethr
in
106
(135
) 37
5082
103
682
12
8(9
2)
49
9610
313
340
90.
04e
tr
ans-
Per
me
thrin
11
0 (8
1)
5268
9311
743
5
292
(353
) 78
14
517
631
014
260.
002
e
Oth
er
P
ropo
xur
15 (
28)
0.6 d
1.0
4.3
1112
7
----
--
--
----
----
Org
ano
chlo
rines
H
exac
hlor
obe
nzen
e 26
4 (2
14)
5316
019
128
492
1
231
(120
) 64
14
822
330
851
40.
89
p,
p'-D
DE
45
43 (
4230
)45
518
9531
7139
9315
200
17
682
(294
92)
672
3074
3488
1347
010
4000
0.19
o,
p'-D
DE
7
(4)
2.1
4.8
5.7
6.6
23
8(5
) 3.
1 4.
85.
26.
620
0.98
-
hexa
chlo
rocy
cloh
exan
e 31
2 (3
31)
4513
222
024
214
06
552
(611
) 0.
3 d
377
443
520
2438
0.10
p,
p'-D
DT
12
4 (8
4)
0.8 d
6910
715
536
2
378
(479
) 57
89
102
405
1651
0.18
o,
p'-D
DT
57
(60
) 0.
5 d24
3763
273
14
6(1
99)
17
3662
138
736
0.13
D
acth
al
3 (1
) 0.
92.
42.
83.
55.
6
4(1
) 2.
6 2.
93.
44.
87.
40.
12
Pol
ychl
orin
ated
Bip
heny
ls
P
CB
118
14
5 (1
47)
1353
9313
351
8
29(2
2)
9 16
1740
84<
0.00
05e
P
CB
138
29
1 (2
89)
4015
418
341
512
52
54(5
9)
0.1
d
2638
5523
9<
0.00
05e
P
CB
153
37
8 (3
87)
2817
224
250
016
43
62(6
7)
11
3544
6127
7<
0.00
05e
P
CB
180
36
2 (4
10)
20 d
115
239
431
1579
74
1(5
28)
131
d
270 d
683
1110
1740
0.02
e
a Ran
ksum
test
per
mut
ed w
ith 1
0,00
0 re
petit
ions
. b V
alue
s ar
e LO
D-im
pute
d, b
ut n
ot a
djus
ted
for
lipid
con
tent
. T
o es
timat
e lip
id-a
djus
ted
valu
es u
se
a co
nver
sion
fact
or o
f 0.0
28 g
fat/
g m
ilk fo
r U
rban
wo
men
and
0.0
13
g fa
t/g m
ilk fo
r A
gric
ultu
ral w
omen
. c S
umm
ary
stat
istic
s no
t rep
orte
d fo
r ch
lorp
yrifo
s-m
eth
yl a
nd p
ropo
xur
amon
g ag
ricul
tura
l wom
en
due
to lo
w d
etec
tion.
d Con
cent
ratio
ns r
epor
ted
are
<L
OD
. e 9
5%
con
fiden
ce in
terv
al
arou
nd th
e pe
rmut
ed p
-val
ue d
oes
not c
onta
in 0
.05.
56

Table 3. Within- and between-woman variability and intraclass correlation (ICC) of log10-transformed concentrations (in pg/g milk) of chemicalsa with greater than 50% detection frequency measured in milk of urban womenb.
SDbetween SDwithin ICCChlorpyrifos 0.22 0.20 0.54Chlorpyrifos-methylc 0.40 0.53 0.36cis-permethrin 0.25 0.12 0.80trans-permethrin 0.19 0.11 0.74Propoxur 0.61 0.45 0.64o,p'-DDE 0.20 0.10 0.81p,p'-DDE 0.36 0.16 0.84Hexachlorobenzene 0.29 0.09 0.91Dacthal 0.14 0.13 0.53p,p'-DDT 0.52 0.13 0.94-hexachlorocyclohexane 0.36 0.11 0.91o,p'-DDT 0.61 0.30 0.80PCB 118 0.37 0.15 0.85PCB 138 0.33 0.16 0.80PCB 153 0.36 0.16 0.83PCB 180 0.40 0.44 0.46a Concentrations are log-transformed and LOD-imputed, but not lipid-adjusted. b N=43 samples from 21 women; there was an average of 2 samples per woman with a range of 1-6 samples per woman. c Random effects model did not provide SDbetween; therefore, SDbetween was estimated using concentrations averaged per woman and ICC was calculated manually as: SDbetween/(SDbetween + SDwithin).
57
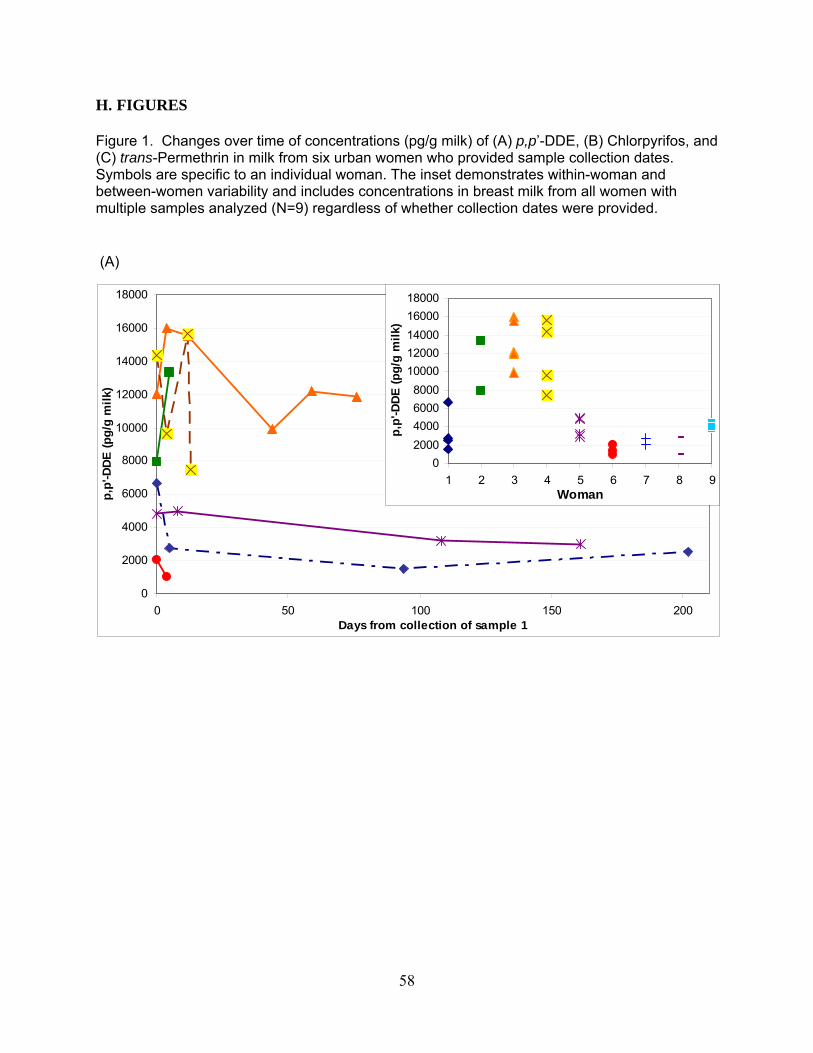
H. FIGURES Figure 1. Changes over time of concentrations (pg/g milk) of (A) p,p’-DDE, (B) Chlorpyrifos, and (C) trans-Permethrin in milk from six urban women who provided sample collection dates. Symbols are specific to an individual woman. The inset demonstrates within-woman and between-women variability and includes concentrations in breast milk from all women with multiple samples analyzed (N=9) regardless of whether collection dates were provided. (A)
0
2000
4000
6000
8000
10000
12000
14000
16000
18000
0 50 100 150 200Days from collection of sample 1
p,p
'-DD
E (
pg
/g m
ilk)
0
2000
4000
6000
8000
10000
12000
14000
16000
18000
1 2 3 4 5 6 7 8 9Woman
p,p
'-DD
E (
pg
/g m
ilk)
58
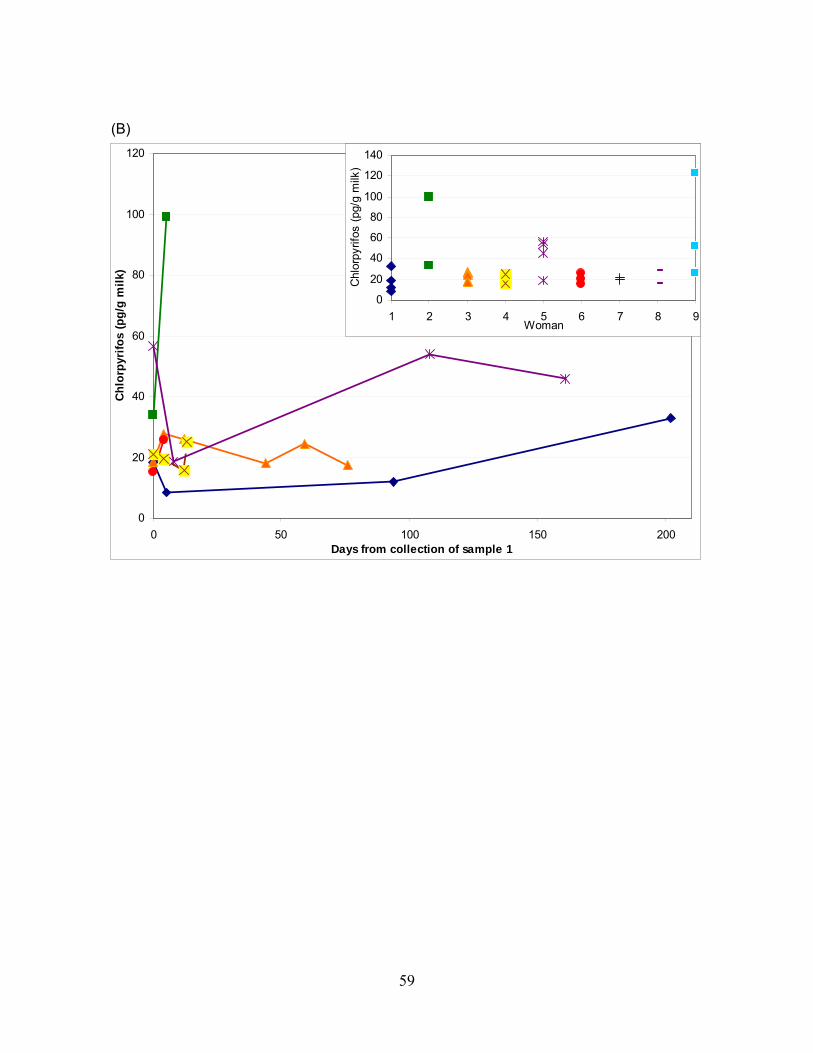
(B)
0
20
40
60
80
100
120
0 50 100 150 200Days from collection of sample 1
Ch
lorp
yrif
os
(pg
/g m
ilk)
0
20
40
60
80
100
120
140
1 2 3 4 5 6 7 8 9Woman
Chl
orpy
rifos
(pg
/g m
ilk)
59
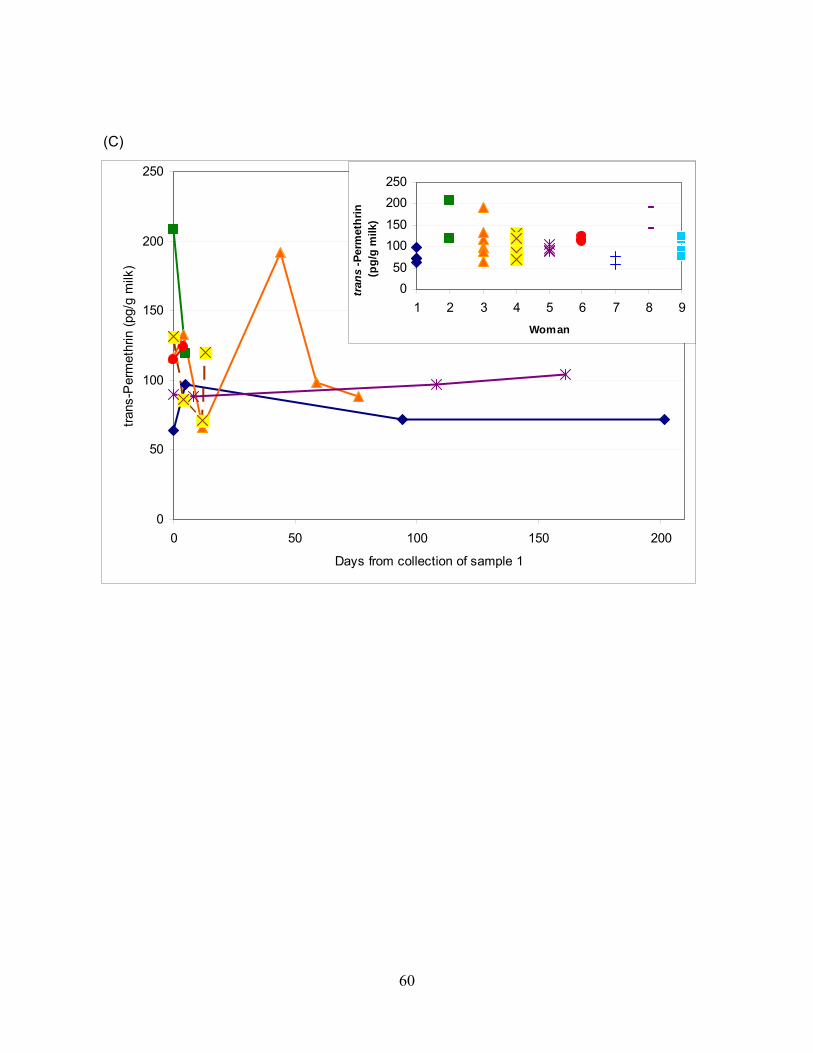
0
50
100
150
200
250
0 50 100 150 200
Days from collection of sample 1
tran
s-P
erm
ethr
in (
pg/g
milk
)
0
50
100
150
200
250
1 2 3 4 5 6 7 8 9
Woman
tran
s-P
erm
eth
rin
(p
g/g
milk
)
(C)
60
Chapter 4 Predictors of chlorpyrifos and permethrin in human milk and relationships with maternal biomarkers measured in blood and urine A. CHAPTER SUMMARY Background: Although chlorpyrifos and permethrin, non-persistent insecticides, have been previously reported in human milk, no studies have determined their relationships with biomarkers of exposure measured in other biological matrices such as blood and urine. The sources of chlorpyrifos and permethrin exposures to mothers are also unclear despite concerns about lactational exposure and potential health effects in infants, whose primary diet consists of human milk. Methods: We measured chlorpyrifos, cis- and trans-permethrin concentrations in human milk samples from 59 women residing in the agricultural region of Salinas, CA. Women were participants of the Center for the Health Assessment of Mothers and Children of Salinas (CHAMACOS). Samples were collected from 2000-2001. Results: Chlorpyrifos and permethrin were detected in 95% and 100%, respectively, of milk samples collected within two months postpartum. The mean±standard deviation (SD) limit of detection (LOD) was 0.19±0.13 pg/g milk for chlorpyrifos, 0.66±0.27 pg/g milk for cis-permethrin, and 0.82±0.34 pg/g milk for trans-permethrin. Median concentrations for chlorpyrifos, cis- and trans- permethrin were 24, 103, and 154 pg/g milk and concentrations ranged <LOD-570, 32-568, 35-1124 pg/g milk, respectively. We found positive, but not statistically significant correlations ranging 0.02-0.2 for chlorpyrifos and 0.07-0.15 for permethrin when comparing measurements in milk and those measured in blood and urine. Dietary variables such as fish consumption and environmental factors including presence of carpet and housing density appeared to be associated with chlorpyrifos concentrations in milk. Dietary factors including consumption of dairy and fats, oils, sweets and sodas were negatively associated with permethrin concentrations in milk. Conclusion: Chlorpyrifos and permethrin were detected in human milk, indicating the potential for direct exposures to neonates and young children. Lactational exposures to children can only be reduced by decreasing exposures to mothers; some environmental factors may contribute to maternal exposures of chlorpyrifos, while some dietary factors may protect mothers and infants from chlorpyrifos and permethrin.
61
B. INTRODUCTION
Chlorpyrifos and permethrin are non-persistent insecticides that are widely used in the United States (U.S.). Since 2001, chlorpyrifos use has been restricted to non-residential applications, 1 but permethrin remains both a residential and agricultural pesticide. In the U.S. approximately 4.5 million kg/year of chlorpyrifos are used,1 including 650,000 kg/year in California 2. Total permethrin usage is more challenging to calculate because it is difficult to quantify use of over-the-counter insecticide products that contain permethrin, a synthetic pyrethroid chemical that is primarily used indoors. However, nationally, approximately 900,000 kg/year of permethrin are applied for agricultural, residential and public health uses3 and approximately 300,000 kg/year are applied by professionals in California.4 Indoor use of permethrin has increased in the U.S. since the voluntary elimination of residential uses of chlorpyrifos5. Internationally, permethrin is used as an alternative to the persistent pesticide dichlorodiphenyltrichloroethane (DDT) in malaria-endemic regions.6
Chlorpyrifos and permethrin exert their effects by different mechanisms. Chlorpyrifos, an organophosphorous (OP) chemical, is a neurodevelopmental toxicant that at higher doses inhibits function of the enzyme acetylcholinesterase. In the absence of acetylcholinesterase, the neurotransmitter acetylcholine accumulates in neuronal junctions leading to continued stimulation and then suppression of neurotransmission to organs.7 Chronic low-level exposure to chlorpyrifos has been found to be associated with delays in psychomotor and mental development in children, and mothers reported more attention problems and symptoms of pervasive developmental problems in one study of children ≤3 years of age, 8 but these neurodevelopmental effects were not attributable to chlorpyrifos exposure in another study of children ≤3 years of age.9 In rats, lactational exposure to chlorpyrifos was associated with oxidative stress and biochemical and histopathological alterations in the suckling pups.10
Permethrin has been found to have neurobehavioral, immunological, carcinogenic and endocrine-disrupting effects in animal models.3, 11 Its main mode of action is inhibition of nervous system functioning by binding to sodium channels causing repetitive firing of electric signals in the brain; thus, toxic effects include muscle spasms, paralysis and death. 3 Little is known about neurodevelopmental effects of permethrin in children, but at doses that are well below those that produce signs of poisoning, permethrin impairs motor activity, schedule-controlled operant responding, grip strength, and induces increased acoustic-evoked startle response amplitude in adult animals.12 In rodents, neonatal exposure to permethrin was associated with impaired brain development by altering the expression of the c-fos and brain-derived neurotrophic factor (BDNF) genes in neurons, which are involved in the survival, differentiation, and synaptic plasticity of neurons and the postnatal development of the mammalian central nervous system.13 Neonatal exposure was also associated with changes in open-field behaviors, striatal monoamine level, and increased oxidative stress.14 One study found impaired development of reflexes, swimming ability, open field activity and social behavior in the offspring of mice who were given permethrin prior to mating.15 Little is also known about endocrine-disrupting effects of permethrin, but exposure induced uterine growth in female rats and reductions in androgen-dependent sex accessory tissue in male rats, indicating estrogenic activity.16 Another study found reduced sperm count, sperm motility, and testosterone in adult male mice after exposure to the cis isomer, but not trans.17 Metabolism of chlorpyrifos and permethrin occurs in the liver, but by different mechanisms. Chlorpyrifos can either be converted to chlorpyrifos-oxon, a highly reactive and
62
toxic intermediate, or it can be directly metabolized by cytochrome P450 enzymes into the organophosphate-specific dialkylphosphate (DAP) metabolite, diethylthiophosphate (DETP), and the chemical-specific 3,5,6-trichloro-2-pyridinol (TCPy) metabolite; both metabolites are excreted in urine. Chlorpyrifos-oxon is further metabolized into another DAP metabolite, diethylphosphate (DEP), and TCPy.18 Permethrin is a racemic mixture of cis and trans isomers that are metabolized by liver microsomal esterases and oxidases.19 Metabolism involves hydrolysis, particularly for the less toxic trans isomer, oxidation and hydroxylation, and results in metabolites that are excreted in urine for the trans isomer and feces for the cis isomer because of its hydrolysis resistance. The urinary metabolites frequently monitored in humans include cis- and trans-3-(2,2-dichlorovinyl)-2,2-dimethylcyclopropanecarboxylic acid (DCCA), 3-phenoxybenzoic acid (3-PBA) and fluorophenoxybenzoic acid (FPBA).20, 21 Urinary metabolites of OPs and pyrethroids are frequently used as biomarkers of exposure; more recently, unmetabolized chlorpyrifos and permethrin have also been biomonitored in blood serum or plasma.22-24 Although chlorpyrifos and permethrin are considered non-persistent pesticides due to their rapid metabolism in the body and degradation in the environment,22, 25, 26 their relatively high log octanol water coefficients (Kow) suggest the potential for bioaccumulation in adipose tissue and the lipid fractions of biological matrices (log Kow= 4.96 for chlorpyrifos and 6.10 for permethrin).27, 28
A few studies have measured non-persistent pesticide concentrations in human milk. These studies have reported detectable concentrations of chlorpyrifos and permethrin.6, 29, 30 However, no human studies have investigated associations between concentrations measured in different biological matrices for permethrin and only one has assessed correlations of chlorpyrifos or its metabolites in blood, urine and meconium, but not breast milk.31 Urine and milk are non-invasive biomarkers compared to serum and it is unclear whether the parent compounds measured in milk or blood are more stable than urinary metabolites that are rapidly excreted and may represent exposure to preformed metabolite species (degradates) found in the environment.32 Additionally, no previous studies have attempted to identify factors that may contribute to measureable concentrations of these non-persistent pesticides in breast milk. Studies of other biomarkers have indicated that dietary, residential and occupational sources may be important factors.33-35
The Food Quality Protection Act (FQPA) of 1996 mandates that the U.S. Environmental Protection Agency (EPA) set pesticide tolerances in foods, but also requires EPA to assess pesticide exposures to infants and children to ensure their safety.36 Since breast milk is the primary source of nutrition for many infants, concentrations of pesticides in human milk should be assessed and the potential sources of exposure to mothers should be identified to determine points of intervention to decrease exposures. In the present study, we aimed to measure chlorpyrifos and cis-and trans-permethrin in the milk of mothers residing in an agricultural community. Selection of these pesticides was based on our previous findings of high detection of chlorpyrifos and permethrin in the milk of mothers residing in urban and agricultural communities of California.37 We then explored the relationships between concentrations of these non-persistent pesticides in milk and biomarkers of exposure to these pesticides measured in other biological matrices, namely plasma and urine. Lastly, we attempted to identify the sources of these pesticides in the milk by exploring whether demographic, household or dietary factors were associated with concentrations of chlorpyrifos or permethrin in milk.
63
C. METHODS 1. Study population
Women were participants of the Center for the Health Assessment of Mothers and Children of Salinas (CHAMACOS), a federally funded longitudinal birth cohort study conducted in the Salinas Valley of California, an agricultural community.38 The CHAMACOS study aims to understand the potential health effects of pesticides and other environmental chemicals in pregnant women and their children. Pregnant women were eligible to participate in the study if they were ≥ 18 years of age, < 20 weeks of gestation at enrollment, English- or Spanish-speaking, Medi-Cal eligible, and planning to deliver at Natividad Medical Center. All protocols and study materials were approved by the Committee for the Protection of Human Subjects at the University of California, Berkeley and the Institutional Review Board at the Centers for Disease Control and Prevention in Atlanta, GA. Written informed consent was obtained from all participants prior to enrollment to the study. Of the 601 women enrolled, 526 delivered live-born singleton children, 498 women initiated breastfeeding and 323 women provided a breast milk sample near the time of delivery. For these analyses, women were selected if their breast milk samples were collected >1 week postpartum but < 8 weeks postpartum and the milk sample volume was >2.5 ml. Women were also given selection preference if they had measurements of chlorpyrifos and permethrin or their metabolites in plasma and urine. The resulting sample size was 59 women. 2. Interviews and home inspections
Women were interviewed at the end of the first and second trimesters of pregnancy (mean ± SD = 14 ± 5 and 27 ± 2 weeks gestation, respectively) and at the time of delivery. Study staff also visited participant homes and conducted home inspections at the end of the first trimester. During these interviews and home visits information was collected on demographic characteristics including the participant’s age at delivery; education (from first trimester interview); work status and type of work throughout the pregnancy; residence proximity to agricultural fields at the time of delivery; years of residence in the United States (U.S.; from the first trimester interview); household income (first trimester interview), husband’s (or partner’s) work status, type of job and whether they resided with the participant at the time of delivery and information on several other household factors that may be sources of pesticide exposure to pregnant women. In addition, a 72-item food frequency questionnaire (FFQ), modified from the Spanish-language Block 98 Questionnaire, was administered during the second trimester interview.39, 40 Details of this FFQ have been previously reported.41 Participants were asked about their usual portion sizes of particular food items and how often they ate those items in the three months prior to the interview. From these data, daily or weekly servings of dairy, meat, fish, fruit, vegetables fat, and saturated fat were calculated in addition to nutrient densities of these foods (daily food intake/ daily kilocalories consumed).
3. Sample collection and laboratory analyses
All sample analyses were performed by the Centers for Disease Control and Prevention (CDC), National Center for Environmental Health Pesticide Laboratory in Atlanta, GA. Breast milk. Breast milk samples were collected from women approximately 19 ± 9 (mean ± SD) days postpartum. Women used manual expression or an electric pump provided by the study (Basic Nurture III, Bailey Medical Engineering, Los Osos, CA or a hospital-grade
64
Classic Breast Pump, Medela, Inc. Breastfeeding U.S., McHenry, IL) to collect milk samples. Women were instructed to wash their hands with soap and water and remove creams from their nipples using soap and water prior to sample collection. Women were allowed to collect milk from either or both breasts. All samples were collected directly into sterile collection bottles provided by the pump manufacturers. Each breast milk sample collected was divided into 5 to14 ml aliquots, depending on the volume available. Aliquots were stored frozen (-80°C) at the CHAMACOS laboratory. Milk samples were then shipped on dry ice to CDC for analysis.
Breast milk was analyzed with a newly developed and validated method which employed isotope dilution. This method allows for the extraction and analysis of 24 analytes including 7 organochlorine insecticides, 13 contemporary-use non-persistent pesticides, and 4 polychlorinated biphenyl (PCB) congeners in human milk samples; all validation data have been presented elsewhere.42 Briefly, one gram of each sample was weighed and dispersed over hydromatrix. Accelerated solvent extraction with dichloromethane and hexane (80:20, v:v) was used to extract the analytes. The resulting eluate was concentrated to ~20 L then 500 L of ACN was added. Matrix interferents were removed using solid phase extraction cartridges packed with neutral alumina and primary and secondary amine silica (PSA). Analytes were eluted with acetonitrile (ACN). The eluate was again concentrated to 20 L, then 20 L of toluene were added and the remaining ACN was allowed to evaporate. Samples were analyzed using gas chromatography/high resolution mass spectrometry. Concentrations of chlorpyrifos, cis- and trans-permethrin in milk are reported as picograms per gram of milk (pg/g milk). Individual sample limits of detection (LODs) were reported for each chemical and were 0.19 ± 0.13 (mean ± SD) pg/g milk for chlorpyrifos, 0.66 ± 0.27 pg/g milk for cis-permethrin and 0.82 ± 0.34 pg/g milk for trans-permethrin. Quality control procedures included the use of blanks and duplicate samples. Amount of lipid per gram of milk was determined gravimetrically from a separate aliquot. Thus, nanograms of analyte per gram of lipid (ng/g lipid) were also calculated.
Maternal blood. Maternal blood was collected by venipuncture into tubes containing heparin. Collection typically occurred in the hospital around the time of delivery (mean ± SD = 2 ± 10 days postpartum). Whole blood was separated using the Ficoll technique. The resulting plasma layer was transferred to separate vials and stored in -80°C freezers. Plasma samples were then shipped on dry ice to CDC for analysis of organophosphorous, pyrethroid, and carbamate insecticides. 43 Plasma samples (2mL aliquots) were enriched with isotopically labeled internal standards and were dispersed over individual preconditioned Varian ABS ELUT-Nexus 60mg 3mL SPE cartridges (Palo Alto, CA, USA) for extraction. Deionized water (2× 2mL) followed by 40% methanol in water (2× 2mL) were passed through cartridges then cartridges were dried under full vacuum for 5 min. Analytes were eluted with toluene (2×1mL) and the eluant was collected in 15-mL conical centrifuge tubes. Extracts were concentrated for 30 min at 40 °C and 15 psi of nitrogen using a Zymark TurboVap LV Evaporator (Milford, MA, USA). Residual water was azeotroped from extracts with ACN (1 mL) then extracts were mixed by vortexing and concentrated to dryness again for 30 min at 40 °C and15 psi of nitrogen. Toluene (100 L) was added to reconstitute samples and extracts were transferred to GC autosampler vials. Extracts were then further concentrated using a Glas-Col 96-well evaporator system (Terre Haute, IN, USA) under nitrogen gas (40° C) to a final volume of 10 L. Vials were capped and analyzed by gas chromatography–high resolution mass spectrometer. Isotope dilution was employed for quantification of analyte concentrations. Method LODs were reported as 0.021, 0.031, and 0.020 ng/mL plasma for chlorpyrifos, cis-permethrin and trans-permethrin, respectively. Quality
65
assurance was achieved using quality control samples made from pooled plasma spiked with a known amount of native standards in addition to blank and duplicate samples.
Maternal urine. Spot urine samples were collected from women an average of 9 days postpartum (SD=11) following procedures used by CDC in the National Health and Nutrition Examination Survey (NHANES) 1999–2000.44 As previously reported, women used bathroom facilities at the CHAMACOS field office or in the mobile CHAMACOS clinic and collected voided urine in sterile cups.45 Urine samples were then divided into aliquots, transferred to precleaned glass jars with Teflon-lined caps, and stored frozen (-80°C) prior to shipment to CDC for analysis of six dialkylphosphate metabolites including DEP and DETP. Laboratory methods have been previously described in detail.46 Urine (4 mL) was transferred to a 15-mL centrifuge vial, enriched with isotopically labeled internal standards and mixed thoroughly. Extraction by codistillation involved addition of ACN (4 mL) and concentration to approximately 4 mL using a Turbovap LV (Zymark, Hopkinton, MA) for 30 min at 50°C with 15 psi head pressure of nitrogen. Again, ACN (4 mL) was added, extracts were mixed and concentrated under the same conditions to an approximate volume of 2 mL; this process was repeated once more, allowing extracts to concentrate to dryness. The residue was reconstituted in ACN (1 mL) and analytes were derivatized using 1-chloro-3-iodopropane (50 L) and remained at room temperature for 1 hr. Samples were transferred to a clean test tube, potassium carbonate was added and the sample was heated for 2 hr at 80°C in a heater block (Isotemp 1455 D, Fisher Scientific, Atlanta, GA). Samples were then concentrated under the same conditions as above to a final volume of 100 L, transferred to autosampler vials, capped and analyzed by gas chromatography-tandem mass spectrometry using a triple quadrupole MS (FinniganTSQ-7000, ThermoFinnigan, San Jose, CA). Isotope dilution was used to quantify concentrations. LODs ranged 0.2 to 0.6 g/L (1.3- 3.9 nmol/L) for DEP and 0.1 to 0.6 g/L (0.6-3.5 nmol/L) for DETP. Quality control procedures involved analysis of well-characterized urine pools enriched with a known amount of native standards, blanks and blind field-enriched samples incorporated into analysis batches with the unknown samples. Creatinine concentrations in urine were determined from a separate aliquot using a commercially available diagnostic enzyme method (Vitros CREA slides, Ortho Clinical Diagnostics, Raritan, NJ). Urinary DEP and DETP are reported both creatinine-adjusted in nanomoles per gram creatinine (nmol/g creatinine) and unadjusted in nanomoles per liter urine (nmol/L).
4. Statistical methods
All statistical analyses were performed using Stata 10.0 47 and R version 2.10.148 for Windows. Demographic, maternal, residential and dietary characteristics were summarized for the population in Tables 1a and 1b including maternal age at delivery, maternal work status during pregnancy, spouse’s/partner’s work and residence status during pregnancy, maternal education, income relative to federal poverty guidelines and years of residence in the U.S..
We used any quantifiable concentration for statistical analysis regardless if it was below the LOD; however the percent of concentrations that were >LOD was also calculated. For summary statistics, concentrations that were not detected (ND) were assigned a value of zero. Concentrations were summarized by the mean, standard deviation (SD), median, range, 25th, and 75th percentiles. Additionally, urinary DEP and DETP concentrations (nmol/L) were summed to capture the total potential exposure to chlorpyrifos and cis-and trans- isomers of permethrin were summed separately for milk and plasma to approximate total permethrin exposure. Urinary concentrations of permethrin metabolites were not available for this population.
66
We used Spearman correlations to compare the rank order of blood or urine measurements against concentrations measured in milk, both lipid-adjusted and unadjusted. Since milk samples were typically collected after serum or urine samples, we considered days between sample collection as a potential effect modifier and stratified correlations by the median number of days between collection of each sample type (18 days for milk and serum comparisons and 9.5 days for milk and urine comparisons). Because method and/or sample LODs differed by analysis method, some methods produced a lower percentage of samples that were quantifiable than other methods. Thus, we calculated the Kappa statistic of agreement for detection (defined as a quantifiable analyte concentration regardless of the LOD) and explored correlations restricted to samples that were detected in both biological matrices.
We examined the associations of several potential predictors with chlorpyrifos and permethrin concentrations in milk in order to elucidate potential pathways of maternal exposure. Several household, dietary, and occupational variables were considered and selected if they were suspected predictors of non-persistent or persistent pesticides in other analyses of the CHAMACOS cohort.33, 34 Since diet can change throughout pregnancy and postpartum, we included information on frequency of fruit and vegetable consumption during the preconception period, first trimester, and the second trimester from the FFQ. Housing density was calculated as the number of people in a household divided by the number of rooms. Pre-pregnancy body mass index (BMI) was calculated as the self-reported pre-pregnancy weight in kilograms divided by the height in meters squared. Pregnancy weight gain was calculated as the self-reported pre-pregnancy weight subtracted from the weight just prior to delivery as reported in the medical record. For these analyses, concentrations of chlorpyrifos and permethrin (summed cis- and trans- isomers) that were <LOD (3 observations for chlorpyrifos and 0 for permethrin) were imputed as LOD divided by the square root of 2; concentrations were then log10 transformed to satisfy linear regression assumptions. To retain a sample size of 59 observations, missing observations for predictor variables were imputed with the median value of the variable (none had > 4 missing (6.8%)). Bivariate linear regression analyses were performed for each potential predictor of chlorpyrifos and permethrin in milk in three ways: first, using non-lipid-adjusted values; second, using lipid-adjusted values; and third, fixing the fraction of lipid in the milk samples as a covariate. The complete list of potential predictors and their bivariate associations with chlorpyrifos and permethrin concentrations in milk is shown in Tables 3a-c for chlorpyrifos and Tables 4a-c for permethrin including the coefficient, 95% confidence interval (CI), R2, and the p-value given by the model (poverall). Variables are presented in ascending order of poverall. Additionally, we calculated the Bonferroni-adjusted p-value (padjusted) as the poverall multiplied by the number of variables considered potential predictors in order to address the problem of multiple testing. The adjusted p-value was assigned a 1 if the calculated adjustment exceeded 1.
We then used a backward elimination procedure to determine how the variables related with each other on the dependent variable. We fit linear regression models for each set of variables that had a poverall<0.2 in Tables 3a-c and 4a-c, using the appropriate log10-transformed dependent variable for the set (non-lipid-adjusted, lipid-adjusted, and lipid as a covariate). We then removed the variable with the highest p-value and ran the model again. This process was repeated until all variables in the model were associated with the dependent variable at p<0.05 or until a likelihood ratio test indicated that a block of variables, e.g. indicator variables for season, should not be removed from models even if none of the variables in the block had p-values <0.05. Lipid fraction was retained in all models that required lipid fraction as a fixed covariate, regardless of its statistical significance.
67
Lastly, we used a Deletion/Substitution/Addition (DSA) algorithm49 written for R as a model selector program to determine the amount of variation of chlorpyrifos and permethrin concentrations in milk (log10-transformed) that can be explained by the variables listed in Tables 3a and 3b. DSA is a procedure based on cross-validation and the squared error loss function which returns a polynomial generalized linear model of variables associated with the outcome. For these analyses, we loosely defined the parameters and allowed polynomial models to contain a maximum of 20 variables with a maximum order of power of 5 and 3-way interaction. For the cross validation we specified a “vfold” of 5 meaning that the data are split into 5 mutually exclusive sets. A learning set was defined as a subset of 4 of these 5 sets that were used to specify a model and later evaluated in the validation set (the remaining 1/5 of the data). The risk (expected loss) is calculated and stored. The procedure is repeated choosing a different learning set for each possible subset of 4 groups out of the five. The optimal model is defined as that with minimal risk. Depending upon how the data are split, different models can be selected by DSA; thus, we repeated the DSA procedure 1000 times and determined the R2 of each of the models. We then calculated the mean R2 over the 1000 models selected. D. RESULTS 1. Demographics Population characteristics are shown in Tables 1a and 1b. CHAMACOS participants were primarily Mexican-born (95%) and most preferred to speak Spanish in the home (95%). All were low-income with 65% at or below federal poverty levels and few were educated beyond high school (8%). Participants’ ages ranged from 18 to 43 years with a mean ± SD of 26 ± 6 years. Most women were multiparous (71%) and of these women, 95% breastfed previously. Just over one-third of women worked in agriculture for some time during their pregnancies (37%) and approximately half of the women lived with their spouses (or partners) who worked in agriculture or fields near the time of delivery (53%). Very few women smoked during pregnancy (5%). Only 12% lived within a ¼ mile of an agricultural field. 2. Chlorpyrifos and permethrin biomarker concentrations and relationships between measurements in milk, plasma and urine Table 2 shows the summarized concentrations of chlorpyrifos measured in milk and plasma and its urinary metabolites, creatinine-adjusted and unadjusted measurements of DEP, DETP and the sum of DEP and DETP. Chlorpyrifos concentrations in milk ranged from not detected (ND) to 570.32 pg/g milk (63.37 ng/g lipid) with a median concentration of 23.84 pg/g milk (1.51 ng/g lipid). Chlorpyrifos concentrations in plasma were lower than those of milk (assuming that the densities of milk and plasma are similar), (median= 5.65 pg/mL plasma) and % >LOD was lower in plasma (11% vs. 95% >LOD). Both percent >LOD and concentrations of urinary DEP were higher than for DETP. Median DEP concentration was 25.19 nmol/L urine (31.15 nmol/g creatinine), whereas median DETP concentration was 4.32 nmol/L urine (5.95 nmol/g creatinine). Also shown in Table 2 are the concentrations of cis- and trans-permethrin measured in milk and plasma and the sums of the isomers in both matrices unadjusted for lipid and lipid-adjusted. Both isomers were detected in 100% of the breast milk samples, but very few, if any, plasma samples had concentrations that were >LOD (0% for cis-permethrin and 9% for trans-permethrin). The median concentration of cis-permethrin in breast milk was 103.25 pg/g milk
68
(5.88 ng/g lipid) and concentrations of trans-permethrin were higher than the cis- isomer with a median concentration of 154.36 pg/g milk (8.64 ng/g lipid). Assuming the densities of milk and blood are similar, concentrations of cis- and trans-permethrin in plasma were much lower than concentrations of either isomer measured in breast milk. We observed no statistically significant correlations between concentrations of chlorpyrifos or permethrin measured in milk and concentrations of these biomarkers measured in plasma or urine (regardless of lipid-adjustment, Table 2); however, all correlations were positive. When we stratified by median time between sample collections or considered only samples that were detected in both matrices, we found no improvement in correlations (data not shown). The Kappa statistic of agreement of detection between the milk and plasma methods was 0.14 (p=0.06) for chlorpyrifos with 74% agreement between the two methods. All but one of the samples that were detected by the plasma method were also detected by the milk method. The Kappa statistics comparing agreement of detection between milk and the urinary metabolites DEP, DETP and the sum of DEP and DETP were negative or very small (-0.07, 0.02, and -0.06, respectively with p>0.4 for each comparison) and not statistically significant, indicating that the actual agreement was less than or nearly equal to the expected agreement. However, agreement was 88%, 70% and 89% for each comparison of detection of urinary DEP, DETP and their sum, respectively, with detection of chlorpyrifos in milk. Given the high detection of permethrin in milk (100% for both isomers, shown in Table 2) and the poor detection in plasma (≤ 30% for each isomer and the sum), we were not surprised to find that the Kappa statistics comparing detection were all equal to zero and not statistically significant. 3. Predictors of chlorpyrifos concentrations in milk (not lipid-adjusted)
As shown in Table 3a, the variables that were associated with chlorpyrifos concentrations in milk (pg/g milk, at poverall<0.2) from bivariate analyses were: consumption of fish or shellfish ( [95%CI]= -0.40 [-0.62, -0.17]); nutrient density of meat servings (0.46 [0.04, 0.87]); the presence of extremely dirty carpet (0.32 [-0.01, 0.66]); housing density (0.21 [-0.03, 0.45]); daily servings of fats, oils, sweets and sodas (-0.11 [-0.23, 0.02]); daily vegetable servings in the first trimester of pregnancy (0.13 [-0.03, 0.28]); daily dairy servings (-0.10 [-0.23, 0.03]); female child sex (0.22 [-0.09, 0.53]); and living with a partner who works in agriculture (-0.21 [-0.09, 0.52]). However, when we applied a Bonferroni correction to the p-values given by the models, we found that only consumption of fish remained significantly associated with chlorpyrifos concentrations in milk (padjusted = 0.03). The direction of this association was negative indicating that the higher the fish consumption, the lower the concentration of chlorpyrifos in the milk. The DSA algorithm selected models predicting log10 chlorpyrifos with R2 values that ranged 0 (intercept only) to 0.73 and a mean R2 value of 0.11 over the 1000 procedures performed, meaning that the vast majority of models returned by DSA contained no potential predictors. 4. Predictors of chlorpyrifos concentrations in milk (lipid-adjusted) Table 3b shows that the set of variables that were associated with lipid-adjusted chlorpyrifos concentrations was very similar to the set associated with non-lipid-adjusted chlorpyrifos concentrations, but that keeping regular household clothes separate from agricultural work clothes was now considered a potentially important predictor ( [95%CI]= -0.28[-0.06, 0.60]). Coefficients () and 95% confidence intervals for the other potentially important predictors using lipid-adjusted chlorpyrifos as the dependent variable were: (-0.46 [-0.69, -0.23]) for fish or shellfish servings per week; (0.31 [0.07, 0.55]) for housing density; (0.46
69
[0.03, 0.90]) for nutrient density of daily meat servings; (-0.13 [-0.26, 0.01]) for second trimester daily dairy servings; (0.33 [-0.03, 0.68]) for the presence of extremely dirty carpet in the house; (-0.12 [-0.24, 0.01]) for daily servings of fats, oils, sweets and soda; (0.14 [-0.03, 0.30]) for daily vegetable servings in the first trimester; (0.27 [-0.06, 0.59]) for female child sex; and (0.24 [-0.07, 0.56]) for living with a partner who works in agriculture. Again, only fish or shellfish consumption remained statistically significant after Bonferroni adjusting the p-value (padjusted = 0.01). The DSA algorithm returned 14 models in 1000 runs. The range of R2 values for these models was 0 (intercept only) to 0.78 with an average R2 of 0.22. 5. Predictors of chlorpyrifos concentrations in milk (lipid as a fixed covariate) Regression models with lipid fraction included as a fixed covariate yielded the smallest set of variables potentially predictive of chlorpyrifos in milk (in pg/g milk). Table 3c shows that fish or shellfish consumption ( [95%CI]= -0.42 [-0.64, -0.19]); nutrient density of meat servings (0.47 [0.05, 0.88]); housing density (0.26 [0.01, 0.50]); the presence of extremely dirty carpet (0.32 [-0.01, 0.66]); daily servings of fats, oils, sweets and sodas (-0.11 [-0.24, 0.01]); and daily dairy servings (-0.11 [-0.24, 0.02]) were all associated with chlorpyrifos in milk at poverall<0.2. None of the variables remained significantly associated after Bonferroni adjustment of the overall model p-value, but the p-values on the independent variables for fish consumption, nutrient density of meat servings, and housing density were <0.0001, 0.03, and 0.04, respectively. These p-values correspond to adjusted p-values of 0.004 for fish consumption, 0.97 for nutrient density of meat servings, and 1 for housing density (data not shown). Lipid fraction was not statistically significant at p<0.05 in any models. DSA models with lipid fraction as a fixed independent variable returned models with R2 values that ranged 0.008 to 0.53. The average R2 among the 1000 models was 0.19. 6. Predictors of permethrin concentrations in milk (not lipid-adjusted)
More variables were associated with non-lipid-adjusted permethrin concentrations in milk (at poverall<0.2) than chlorpyrifos concentrations in milk (Table 4a). Bivariate analyses indicated that saturated fat intake ( [95%CI]= -0.01 [-0.02, -0.004]); daily dairy servings (-0.08 [-0.15, -0.02]); consumption of fats, oils, sweets and sodas (-0.07 [-0.14, -0.008]); storing unlaundered work clothes inside the home (-0.14 [-0.30, 0.02]); residential proximity <1/4 mile from fields (-0.20 [-0.45, 0.05]); pesticide use in and around the home during pregnancy (-0.13 [-0.31, 0.05]); and any smoking during pregnancy (-0.24 [-0.61, 0.13]) were negatively associated with permethrin concentrations in milk. Frequency of vegetable consumption in the first trimester (0.07 [-0.01, 0.16]); nutrient density of meat servings (0.19 [-0.04, 0.41]) and the presence of extremely dirty carpet in the house (0.12 [-0.06, 0.30]) were positively associated with permethrin concentrations in milk. The direction of associations differed by season with spring and summer showing positive associations compared to winter (0.21 [-0.01, 0.43] and 0.03 [-0.26, 0.31], respectively) and fall showing a negative association (-0.03 [-0.29, 0.23]). Bonferroni correction for multiple comparisons indicated chance associations with permethrin for all of the variables that were listed above. Saturated fat intake had the lowest adjusted p-value (0.1). For permethrin, R2 values from models selected by DSA ranged from 0 (intercept only) to 0.63 and the mean R2 was 0.19.
70
7. Predictors of permethrin concentrations in milk (lipid-adjusted) Only some of the variables that were associated with non-lipid-adjusted permethrin concentrations remained associated with lipid-adjusted permethrin (Table 4b). These included: saturated fat consumption (-0.01 [-0.02, -0.004]); second trimester daily dairy servings (-0.11 [-0.19, -0.03]); second trimester consumption of fats, oils, sweets and sodas (-0.08 [-0.15, -0.02]); first trimester daily vegetable servings (0.08 [-0.02, 0.19]); season of breast milk collection (0.15 [-0.12, 0.43] for spring, 0.10 [-0.46, 0.26] for summer, -0.10 [-0.42, 0.23] for fall vs. winter); and nutrient density of daily meat servings (0.19 [-0.08, 0.47]). Additional variables associated with lipid-adjusted permethrin were housing density (0.17 [0.01, 0.32]); history of breastfeeding previous children (0.15 [-0.06, 0.37]); second trimester daily servings of meat, eggs and beans (-0.08 [-0.19, 0.03]); nutrient density of daily dairy servings (-0.15 [-0.36, 0.07]); and keeping pets inside the home during pregnancy (0.26 [-0.13, 0.66]). None of the variables that were associated with lipid-adjusted permethrin concentrations in bivariate models remained associated after Bonferroni correction. The majority of the models returned by DSA contained only the intercept (74%), indicating that none of the potential predictors in our list were associated with lipid-adjusted permethrin concentrations even if when polynomials of the variables or interactions were allowed. The R2 values from the DSA models ranged 0 to 0.41 with an average R2 of 0.07, meaning that the intercept best explained the variability in lipid-adjusted permethrin concentrations most of the time. 8. Predictors of permethrin concentrations in milk (lipid as a fixed covariate) The sets potential predictors of permethrin concentration indicated from non-lipid-adjusted permethrin concentrations and lipid-adjusted permethrin concentrations converged when lipid fraction was included in models as a fixed covariate (Table 4c). These variables included saturated fat (-0.01 [-0.02, -0.004]); second trimester dairy consumption (-0.09 [-0.16, -0.02]); second trimester consumption of fats, oils, sweets, and sodas (-0.07 [-0.14, -0.009]); and season of breast milk collection (0.21 [-0.02, 0.43] for spring, 0.01 [-0.28, 0.31] for summer, -0.03 [-0.29, 0.23] for fall vs. winter). Lipid fraction was not significant as a covariate in any of the bivariate models, but its inclusion in the models affected the poverall of the model, lowering the statistical significance. The p-values for saturated fat, second trimester dairy consumption and second trimester consumption of fats, oils, sweets and sodas were 0.003, 0.01, and 0.03, respectively, and the corresponding Bonferroni-adjusted p-values were 0.11, 0.36, and 0.97. Thus, none of the potential predictors remained associated with permethrin concentrations (including lipid fraction as a covariate) after adjusting for multiple testing. The DSA algorithm returned models with R2 values ranging from 0.003 to 0.75; however, the average R2 was 0.20. 9. Model selection based on backward elimination The backward elimination strategy showed that regardless of lipid-adjustment procedure three variables usually remained in models predicting chlorpyrifos concentrations: fish and shellfish consumption, presence of extremely dirty carpet and housing density. Inclusion of these variables and lipid fraction yielded a positive and statistically significant association between lipid fraction and chlorpyrifos concentration in pg/g milk (15.32 [0.77, 29.87]). The coefficients and 95% confidence intervals for the covariates in the final model including lipid fraction were (-0.46 [-0.66, -0.25]) for fish; (0.24 [0.03, 0.45]) for housing density and (0.40 [0.12, 0.69]) for the presence of extremely dirty carpet. This model yielded an R2 of 0.37 and poverall for the model was <0.00001.
71
Since the sets of potentially predictive covariates resulting from bivariate analyses were different for non-lipid-adjusted and lipid-adjusted permethrin models, the final models produced by backward elimination were different. Second trimester dairy consumption (-0.08 [-0.14, -0.02]); second trimester consumption of fats, oils, sweets, and sodas (-0.08 [-0.14, -0.02]); season of breast milk collection (0.17 [-0.03, 0.37] for spring, 0.07 [-0.18, 0.33] for summer, -0.05 [-0.27, 0.18] for fall vs. winter), storing unlaundered work clothes inside the home (-0.17 [-0.31, -0.04]); frequency of vegetable consumption in the first trimester (0.08 [0.01, 0.16]); and pesticide use in and around the home during pregnancy (-0.15 [-0.31, 0.001]) were associated with non-lipid-adjusted permethrin concentrations in milk. The R2 for this model was 0.45 and the overall model p-value was 0.0001. The final restricted model predicting lipid-adjusted permethrin included: housing density (0.16 [0.03, 0.29]); history of breastfeeding previous children (0.20 [0.02, 0.37]); second trimester daily servings of meat, eggs and beans (-0.33 [-0.48, -0.19]); nutrient density of daily meat servings (0.91 [0.56, 1.26]); and keeping pets inside the home during pregnancy (0.38 [0.06, 0.69]) and had a model R2 of 0.45 and overall p-value <0.00001. Although lipid fraction was not associated with permethrin concentrations in milk in any of the bivariate or backwards elimination models, the final model including lipid fraction as a covariate contained the smallest set of variables potentially associated with permethrin concentrations in milk including only second trimester dairy consumption (-0.09 [-0.15, -0.021]); second trimester consumption of fats, oils, sweets, and sodas (-0.07 [-0.132, -0.01]); and lipid fraction (4.52 [-3.91, 12.95]). Since there were fewer variables in this model, the R2 and the overall model p-value were lower (0.19 and 0.009, respectively). E. DISCUSSION
We found detectable concentrations of chlorpyrifos, cis- and trans-permethrin in breast milk collected near delivery from women residing in an agricultural region of California. The detection frequency of chlorpyrifos measured in plasma from the same women near the same time was lower than that of milk samples and concentrations were positively, but not statistically significantly, correlated with chlorpyrifos concentrations measured in milk. Similarly, although non-specific metabolites of chlorpyrifos were highly detected in maternal urine, their concentrations were positively, but not statistically significantly, correlated with chlorpyrifos in milk. Concentrations of cis- or trans-permethrin isomers measured in milk were also somewhat positively correlated with those measured in plasma, but not statistically significant. Few studies have investigated concentrations of chlorpyrifos or permethrin measured in different biological compartments of humans. Whyatt et al. found that chlorpyrifos measured in maternal and umbilical cord blood and TCPy, the specific metabolite of chlorpyrifos, measured in maternal urine were all positively correlated with TCPy measured in infant meconium with sample sizes that ranged 17 to 79 women depending upon the comparison (Spearman: 0.22-0.40, p: 0.003-0.10). However, they also found that maternal and cord blood chlorpyrifos concentrations were not correlated with TCPy measured in maternal urine collected pre- or postnatally. We observed a moderate correlation of 0.20 between the creatinine-adjusted non-specific urinary metabolite, DEP, and chlorpyrifos measured in milk. Since DEP reflects exposure to many diethyl OPs, this correlation may have been higher if we had measured urinary TCPy near delivery.
Non-persistent pesticides with high log Kows likely partition into the lipid fraction of biological tissues; thus, these analytes will be in equilibrium in the different lipid-containing
72
matrices.27, 28, 50 As such, lipid fraction is an important consideration when assessing correlations of concentrations in different lipid-containing matrices. The fat content of breast milk and plasma is known to be highly variable, but breast milk typically contains 4% fat (range: 1-14%)51 and women’s plasma is approximately 0.4±0.26% fat.52, 53 In our sample, the amount of lipid in the breast milk (g fat/ g milk, measured gravimetrically in a separate aliquot) was not correlated with any of the three analytes of interest measured in milk (Spearman, p = -0.04, 0.73 for chlorpyrifos; 0.05, 0.73 for cis- and 0.03, 0.83 for trans-permethrin), but was well-correlated with a known persistent and bioaccumulative analyte, p,p’-DDE (the primary degredate of DDT), measured in the milk at the same time as our analytes of interest (Spearman, p =0.34, 0.003). However, correlations between lipid-adjusted milk concentrations and non-lipid-adjusted plasma concentrations for chlorpyrifos and permethrin were higher than correlations using non-lipid-adjusted concentrations in both matrices. Thus, it is possible that lipid-adjustment of both matrices may further improve correlations between concentrations measured in milk and plasma. Researchers have also suggested that chlorpyrifos and/or permethrin form protein or DNA adducts; thus, the bound versus free fractions should be explored.54, 55
Lipid fraction was also critical to determining potential predictors of chlorpyrifos and permethrin concentrations in milk. Since we did not know the optimal method for controlling for the influence of lipid fraction, we assessed potential predictors using: non-lipid-adjusted concentrations as the dependent variable, lipid-adjusted concentrations as the dependent variable and fixing lipid as a covariate in models with the non-lipid-adjusted concentrations as the dependent variable. For chlorpyrifos, the three methods of adjustment generally indicated the same variables as potential predictors in bivariate and backward elimination analyses. These included weekly consumption of fish or shellfish, housing density and the presence of extremely dirty carpet. As expected, increasing housing density and extremely dirty carpet were associated with increased chlorpyrifos concentrations in breast milk, likely due to a take-home pathway of exposure; however, consuming more fish or shellfish was associated with lower concentrations of chlorpyrifos in milk. We suspect that this variable may have less measurement error in recalling servings than other dietary variables because fish and shellfish consumption was less frequent, thus more memorable, than other foods. Chlorpyrifos has been detected in open-ocean, freshwater and farmed fishes, with higher detection and higher maximum concentrations among farmed fish compared to open ocean fish.56, 57 Although we cannot be sure of the species of fish or shellfish consumed by CHAMACOS women, given the proximity of Salinas to the ocean and Monterey Bay, we suspect that our population may consume more saltwater fishes or shellfish than freshwater fishes. Chlorpyrifos has also been frequently detected in several fruits and vegetables including broccoli, celery, spinach that are abundant crops in Monterey County and in 2001 more than half of the total chlorpyrifos used in Monterey County was applied to broccoli;58,
59 thus, more fish consumption may mean less ingestion of other foods that may conain higher concentrations of chlorpyrifos. Also, since fish and shellfish are considered healthy alternatives to other protein sources, it is possible that women who consume more fish or shellfish are also more likely to have other health-conscious behaviors that would reduce their body burdens of chlorpyrifos, but we are unable to explore these behaviors with our current data. For permethrin, the three methods of lipid adjustment produced different sets of variables potentially predictive of permethrin concentrations. The four variables that were associated with permethrin regardless of how the data were adjusted in bivariate models were: consumption of saturated fat, second trimester dairy consumption, second trimester consumption of fats, oils, sweets and sodas and season. However, the backwards elimination procedure indicated the most
73
agreement between the final models using non-lipid-adjusted concentrations with and without adding lipid fraction as a fixed covariate. In both of these models, second trimester daily dairy servings and daily servings of fats, oils, sweets and sodas were negatively associated with permethrin concentrations in breast milk. The 2005 U.S. Department of Agriculture Pesticide Data Program Summary Report indicated that permethrin is infrequently detected in dairy products such as milk (2.8%) and heavy cream (1%), whereas detection is much higher in vegetable crops (as high as ~20% or more depending on the crop and year).59 We do not have enough detail on consumption of fats, oils, sweets and sodas to investigate why this variable may be negatively associated with permethrin concentrations, but consumption of unhealthy foods represented by this variable may have replaced the potential calories from more vitamin rich and nutrient dense foods such as vegetables. This is the second study reporting concentrations of chlorpyrifos and permethrin in the breast milk of women residing in California. Some differences between that study and the present one are 1) the former study analyzed samples that may have been colostrum while the present study ensured that samples were not colostrum by restricting sample selection to those collected >1 week postpartum and 2) participants of the former study were recruited approximately 6 years after the voluntary elimination of residential uses of chlorpyrifos while samples collected for the present study were collected just before or within the first year of the voluntary elimination. Our previous investigation reported median concentrations of 28 pg/g milk (4 ng/g lipid) for chlorpyrifos, 103 pg/g milk (13 ng/g lipid) for cis-permethrin and 176 pg/g milk (22 ng/g lipid) for trans-permethrin in the milk of women who were also recruited from the Salinas Valley and were demographically similar to those in the present study.37 Thus, non-lipid-adjusted median concentrations measured in the present study were similar to those previously measured. Colostrum has lower lipid content, but also represents a shorter period of breastfeeding and less time to deplete chemical stores. Thus, it is difficult to predict whether these chemicals would be higher or lower in colostrum compared to more mature milk. However, we would expect chlorpyrifos concentrations to be higher in the present study than the former if CHAMACOS participants were using chlorpyrifos in their homes (prior to the residential elimination), but we did not observe this. Also, if permethrin were the major alternative to residential chlorpyrifos use, then we would expect permethrin concentrations to be lower in the present study. While non-lipid adjusted concentrations of cis- and trans-permethrin were similar in both studies, lipid-adjusted concentrations of both isomers were, in fact, lower in the present study.
Given the small sample size and relatively high variance of the concentrations measured in milk, we chose to report variables that were associated with the outcomes using a very generous significance level of 0.2. We performed multiple tests of associations in our bivariate analyses and used a Bonferroni correction to determine which associations may be due to chance alone given the number of tests performed. However, this approach may have been too conservative because the variables that we considered may not be independent. We selected variables that have been associated with non-persistent or persistent pesticide exposure in other studies33, 34 including dietary, residential and occupational factors, but it is possible that other unmeasured variables may be better predictors of chlorpyrifos and permethrin measured in milk and that information on food residues specific to the population being studied may be better predictors than the food frequency data that were available for this population. Additionally, final models achieved using the backwards elimination strategy for covariate selection should be interpreted with caution. Covariates selected by this method will likely vary depending on the
74
sample and sampling from this population (with replacement) will yield a different set of covariates in a final model. Similarly, we did not provide the specific models selected by DSA because they are not meaningful by themselves. DSA is most useful for providing inference on traditional investigations of associations between the dependent variable and a main independent variable without relying on the model itself. The large range of R2 values shows that the models selected are highly dependent upon the data splits, demonstrating the volatility of DSA and backwards elimination as model selection procedures. However, it is worth noting that polynomial models selected by DSA frequently included polynomials and interactions between variables that also had the highest bivariate associations shown in Tables 3a-c and 4a-c; thus, variables such as fish/shellfish consumption and housing density are likely to be associated with chlorpyrifos concentrations in breast milk and dietary variables such as the nutrient density of meat, eggs and beans and saturated fat consumption are likely to be associated with permethrin concentrations in breast milk.
The CHAMACOS study was not specifically designed for this investigation; thus, many improvements can be made in future studies. Prior to our present and former studies, there was no published literature on concentrations of chlorpyrifos or permethrin in breast milk in U.S. populations and we did not know if concentrations would be detectable in our breast milk samples. Thus, although over 300 breast milk samples were collected near the time of delivery, we analyzed only a subset of 59 which had sufficient volume and were mature milk samples rather than colostrum. We avoided colostrum samples, because we were unsure of whether the matrix differences between colostrum and mature milk would interfere with laboratory analysis. Selection of mature milk samples also created a problem of increased time between collection of milk and collection of blood or urine. We expected that correlations stratified by median number of days between collections would show improved correlations among the group with less than the median days between sample collections; however, we did not confirm this, potentially because the sample size and power were further reduced. Since concentrations in spot samples of non-persistent pesticides have been shown to be highly variable,60, 61 collection of the different matrices on the same day may improve correlations. Our study was also limited by the detection of the analytes in the different biologic matrices and the differing sensitivities of methods used to analyze concentrations in milk, plasma and urine. The method used to analyze the milk samples had the lowest LODs; LODs were approximately 1-2 orders of magnitude higher for the plasma analysis method and 3 orders of magnitude higher for the urinary DAP method. This is not surprising since the LODs for the milk method were sample-specific, while the LODs for plasma and urine were method-specific, meaning that the same LOD was applied to each sample regardless of matrix differences between samples. For analytes measured in plasma, nearly all of the quantifiable concentrations were <LOD (89% for chlorpyrifos, 100% for cis-permethrin and 91% for trans-permethrin) and are prone to more error than measurements that are >LOD. We felt that using quantifiable concentrations, even if they were <LOD, likely had less error than imputing randomly or with a fixed calculation such as the LOD divided by the square root of 2, but correlations between milk and plasma concentrations should be interpreted with caution. A larger sample size with more detailed data collected closer to the time of sample collection, would also improve future studies of potential predictors of non-persistent pesticides in breast milk.
In conclusion, we found positive, but non-statistically significant correlations between chlorpyrifos and permethrin measured in milk and in urine and plasma and higher sensitivity in breast milk with the laboratory method used, suggesting that breast milk is a worthwhile matrix
75
to biomonitor, particularly when concerned with infant dietary exposures. We also found that dietary factors and/or residential factors were associated with chlorpyrifos and permethrin in breast milk. The results of our study suggest that interventions such as increasing consumption of fish and shellfish and more frequent carpet cleaning or alternative floorings such as wood or linoleum may help to reduce maternal exposures to chlorpyrifos, but points of intervention for permethrin are less clear. This study serves as a pilot for future, in-depth studies validating the use of breast milk as a biomarker of exposure to mothers and infants as well as studies investigating the sources of exposures to mothers.
76
F. REFERENCES 1. U.S. EPA, Interim reregistration eligibility decision for chlorpyrifos, in EPA 738-R-01-
007. 2002. 2. DPR, Pesticide Use Report, Annual 2002, Indexed by Chemical and by Crop. 2002,
Department of Pesticide Regulation, California Environmental Protection Agency: Sacramento, CA.
3. U.S. EPA, Reregistration Eligibility Decision (RED) for Permethrin. 2006, United States Environmental Protection Agency; Office of Prevention, Pesticides and Toxic Substances: Washington, D.C.
4. DPR, Pesticide Use Report, Annual 2006, Indexed by Chemical and by Crop. 2006, Department of Pesticide Regulation, California Environmental Protection Agency: Sacramento, CA.
5. Williams, M.K., A. Rundle, D. Holmes, M. Reyes, L.A. Hoepner, D.B. Barr, D.E. Camann, F.P. Perera, and R.M. Whyatt, Changes in pest infestation levels, self-reported pesticide use, and permethrin exposure during pregnancy after the 2000-2001 U.S. Environmental Protection Agency restriction of organophosphates. Environ Health Perspect, Dec 2008. 116(12): p. 1681-8.
6. Bouwman, H., B. Sereda, and H.M. Meinhardt, Simultaneous presence of DDT and pyrethroid residues in human breast milk from a malaria endemic area in South Africa. Environ Pollut, Dec 2006. 144(3): p. 902-17.
7. Eskenazi, B., A. Bradman, and R. Castorina, Exposures of children to organophosphate pesticides and their potential adverse health effects. Environ Health Perspect, 1999. 107 Suppl 3: p. 409-19.
8. Rauh, V.A., R. Garfinkel, F.P. Perera, H.F. Andrews, L. Hoepner, D.B. Barr, R. Whitehead, D. Tang, and R.W. Whyatt, Impact of prenatal chlorpyrifos exposure on neurodevelopment in the first 3 years of life among inner-city children. Pediatrics, Dec 2006. 118(6): p. e1845-59.
9. Eskenazi, B., A.R. Marks, A. Bradman, K. Harley, D.B. Barr, C. Johnson, N. Morga, and N.P. Jewell, Organophosphate pesticide exposure and neurodevelopment in young Mexican-American children. Environ Health Perspect, May 2007. 115(5): p. 792-8.
10. Mansour, S.A. and A.H. Mossa, Adverse effects of lactational exposure to chlorpyrifos in suckling rats. Hum Exp Toxicol, Feb. 29(2): p. 77-92.
11. Shafer, T.J., D.A. Meyer, and K.M. Crofton, Developmental neurotoxicity of pyrethroid insecticides: critical review and future research needs. Environ Health Perspect, Feb 2005. 113(2): p. 123-36.
12. Wolansky, M.J. and J.A. Harrill, Neurobehavioral toxicology of pyrethroid insecticides in adult animals: a critical review. Neurotoxicol Teratol, Mar-Apr 2008. 30(2): p. 55-78.
13. Imamura, L., H. Hasegawa, K. Kurashina, T. Matsuno, and M. Tsuda, Neonatal exposure of newborn mice to pyrethroid (permethrin) represses activity-dependent c-fos mRNA expression in cerebellum. Arch Toxicol, Jul 2002. 76(7): p. 392-7.
14. Nasuti, C., R. Gabbianelli, M.L. Falcioni, A. Di Stefano, P. Sozio, and F. Cantalamessa, Dopaminergic system modulation, behavioral changes, and oxidative stress after neonatal administration of pyrethroids. Toxicology, Jan 18 2007. 229(3): p. 194-205.
77
15. Farag, A.T., N.F. Goda, A.H. Mansee, and N.A. Shaaban, Effects of permethrin given before mating on the behavior of F1-generation in mice. Neurotoxicology, May 2006. 27(3): p. 421-8.
16. Kim, S.S., R.D. Lee, K.J. Lim, S.J. Kwack, G.S. Rhee, J.H. Seok, G.S. Lee, B.S. An, E.B. Jeung, and K.L. Park, Potential estrogenic and antiandrogenic effects of permethrin in rats. J Reprod Dev, Apr 2005. 51(2): p. 201-10.
17. Zhang, S.Y., J. Ueyama, Y. Ito, Y. Yanagiba, A. Okamura, M. Kamijima, and T. Nakajima, Permethrin may induce adult male mouse reproductive toxicity due to cis isomer not trans isomer. Toxicology, Jun 27 2008. 248(2-3): p. 136-41.
18. Busby-Hjerpe, A.L., J.A. Campbell, J.N. Smith, S. Lee, T.S. Poet, D.B. Barr, and C. Timchalk, Comparative pharmacokinetics of chlorpyrifos versus its major metabolites following oral administration in the rat. Toxicology, Jan 31 2010. 268(1-2): p. 55-63.
19. Casida, J.E. and L.O. Ruzo, Metabolic Chemistry of Pyrethroid Insecticides. Pesticide Science, 1980. 11(2): p. 257-269.
20. Casida, J.E., D.W. Gammon, A.H. Glickman, and L.J. Lawrence, Mechanisms of Selective Action of Pyrethroid Insecticides. Annual Review of Pharmacology and Toxicology, 1983. 23: p. 413-438.
21. Leng, G., K.H. Kuhn, and H. Idel, Biological monitoring of pyrethroids in blood and pyrethroid metabolites in urine: Applications and limitations. Science of the Total Environment, Jun 20 1997. 199(1-2): p. 173-181.
22. Barr, D.B., Biomonitoring of exposure to pesticides Journal of Chemical Health and Safety, November-December 2008 2008. 15(6): p. 20-29.
23. Whyatt, R.M., D.B. Barr, D.E. Camann, P.L. Kinney, J.R. Barr, H.F. Andrews, L.A. Hoepner, R. Garfinkel, Y. Hazi, A. Reyes, J. Ramirez, Y. Cosme, and F.P. Perera, Contemporary-Use Pesticides in Personal Air Samples during Pregnancy and Blood Samples at Delivery among Urban Minority Mothers and Newborns. Environ Health Perspect, May 2003. 111(5): p. 749-56.
24. Bradman, A. and R.M. Whyatt, Characterizing exposures to nonpersistent pesticides during pregnancy and early childhood in the National Children's Study: A review of monitoring and measurement methodologies. Environmental Health Perspectives, Aug 2005. 113(8): p. 1092-1099.
25. Starr, J., S. Graham, D. Stout, 2nd, K. Andrews, and M. Nishioka, Pyrethroid pesticides and their metabolites in vacuum cleaner dust collected from homes and day-care centers. Environ Res, Nov 2008. 108(3): p. 271-9.
26. Racke, J.D., Degradation of organophosphorous insecticides in environmental matrices. Organophosphates Chemistry, Fate and Effects. 1992, San Diego, CA: Academic Press, Inc.
27. Thomann, R.V., Modeling organic chemical fate in aquatic systems: significance of bioaccumulation and relevant time-space scales. Environ Health Perspect, Jun 1995. 103 Suppl 5: p. 53-7.
28. Lowe, E.R., T.S. Poet, D.L. Rick, M.S. Marty, J.L. Mattsson, C. Timchalk, and M.J. Bartels, The effect of plasma lipids on the pharmacokinetics of chlorpyrifos and the impact on interpretation of blood biomonitoring data. Toxicol Sci, Apr 2009. 108(2): p. 258-72.
78
29. Sanghi, R., M.K. Pillai, T.R. Jayalekshmi, and A. Nair, Organochlorine and organophosphorus pesticide residues in breast milk from Bhopal, Madhya Pradesh, India. Hum Exp Toxicol, Feb 2003. 22(2): p. 73-6.
30. Zehringer, M. and A. Herrmann, Analysis of polychlorinated biphenyls, pyrethroid insecticides and fragrances in human milk using a laminar cup liner in the GC injector. European Food Research and Technology, 2001. 212(2): p. 247-251.
31. Whyatt, R.M., R. Garfinkel, L.A. Hoepner, H. Andrews, D. Holmes, M.K. Williams, A. Reyes, D. Diaz, F.P. Perera, D.E. Camann, and D.B. Barr, A biomarker validation study of prenatal chlorpyrifos exposure within an inner-city cohort during pregnancy. Environ Health Perspect, Apr 2009. 117(4): p. 559-67.
32. Quirós-Alcalá, L., K.D. Smith, G. Weeresekera, M. Odetokuns, D.B. Barr, M. Nishioka, B. Eskenazi, and A. Bradman. Is there an association between organophosphorous pesticide and dialkylphosphate levels in house dust and urinary dialkylphosphate metabolites in children? in The International Society of Exposure Science. 2009. Minneapolis, MN.
33. Bradman, A., M. Harnly, J. Schwartz, D. Barr, T. Mckone, and B. Eskenazi, Longitudinal Analysis of Factors Predicting Organophosphate Pesticide Exposure to Children Living in an Agricultural Area at Ages 6, 12, and 24 Months. Epidemiology:, November 2006 2006. Suppl. 17(6): p. S101.
34. Bradman, A.S., J.M. Schwartz, L. Fenster, D.B. Barr, N.T. Holland, and B. Eskenazi, Factors predicting organochlorine pesticide levels in pregnant Latina women living in a United States agricultural area. Journal of Exposure Science and Environmental Epidemiology, Jul 2007. 17(4): p. 388-99.
35. McKone, T.E., R. Castorina, M.E. Harnly, Y. Kuwabara, B. Eskenazi, and A. Bradman, Merging models and biomonitoring data to characterize sources and pathways of human exposure to organophosphorus pesticides in the Salinas Valley of California. Environ Sci Technol, May 1 2007. 41(9): p. 3233-40.
36. Food Quality Protection Act. 1996. 37. Weldon, R.H., M.D. Davis, D.B. Barr, A. Bradman, N. Holland, and B. Eskenazi.
Pesticides and PCBs detected in the milk of women residing in urban and rural communities of California. in The International Society of Exposure Science. 2009. Minneapolis, MN.
38. Eskenazi, B., A. Bradman, E.A. Gladstone, S. Jaramillo, K. Birch, and N. Holland, CHAMACOS, a longitudinal birth cohort study: lessons from the fields. Journal of Child Health, 2003. 1(1): p. 3-27.
39. Block, G., F.E. Thompson, A.M. Hartman, F.A. Larkin, and K.E. Guire, Comparison of two dietary questionnaires validated against multiple dietary records collected during a 1-year period. J Am Diet Assoc, Jun 1992. 92(6): p. 686-93.
40. Block, G., M. Woods, A. Potosky, and C. Clifford, Validation of a self-administered diet history questionnaire using multiple diet records. J Clin Epidemiol, 1990. 43(12): p. 1327-35.
41. Harley, K., B. Eskenazi, and G. Block, The association of time in the US and diet during pregnancy in low-income women of Mexican descent. Paediatr Perinat Epidemiol, Mar 2005. 19(2): p. 125-34.
42. Davis, M., R.H. Weldon, G. Morales-Agudelo, W. Roman, A. Bradman, N. Holland, B. Eskenazi, and D. Barr, A High-Resolution Gas Chromatography Mass Spectrophometric
79
Method for Measuring Pesticides and PCBs in Human Milk. Epidemiology, October 12-16 2008. 19(6): p. S335-S335.
43. Perez, J.J., M.K. Williams, G. Weerasekera, K. Smith, R.M. Whyatt, L.L. Needham, and D.B. Barr, Measurement of pyrethroid, organophosphorus, and carbamate insecticides in human plasma using isotope dilution gas chromatography-high resolution mass spectrometry. J Chromatogr B Analyt Technol Biomed Life Sci Apr 3 2010. doi:10.1016/j.jchromb.2010.03.015.
44. CDC, Second National Report on Human Exposure to Environmental Chemicals. NCEH Pub. No. 02-0716. 2003, Centers for Disease Control and Prevention, National Center Environmental Health: Atlanta, GA.
45. Bradman, A., B. Eskenazi, D.B. Barr, R. Bravo, R. Castorina, J. Chevrier, K. Kogut, M.E. Harnly, and T.E. McKone, Organophosphate urinary metabolite levels during pregnancy and after delivery in women living in an agricultural community. Environ Health Perspect, Dec 2005. 113(12): p. 1802-7.
46. Bravo, R., W.J. Driskell, R.D. Whitehead, Jr., L.L. Needham, and D.B. Barr, Quantitation of dialkyl phosphate metabolites of organophosphate pesticides in human urine using GC-MS-MS with isotopic internal standards. J Anal Toxicol, Jul-Aug 2002. 26(5): p. 245-52.
47. StataCorp, Stata Statistical Software: Release 10. 2007, StataCorp LP: College Station, TX.
48. The R Foundation for Statistical Computing, R version 2.10.1 (2009-12-14). 2009. 49. Sinisi, S.E. and M.J. van der Laan, Deletion/substitution/addition algorithm in learning
with applications in genomics. Stat Appl Genet Mol Biol, 2004. 3: p. Article18. 50. Needham, L.L., Assessing exposure to organophosphorus pesticides by biomonitoring in
epidemiologic studies of birth outcomes. Environ Health Perspect, Apr 2005. 113(4): p. 494-8.
51. Weber, A., A. Loui, F. Jochum, C. Buhrer, and M. Obladen, Breast milk from mothers of very low birthweight infants: variability in fat and protein content. Acta Paediatr, Jul 2001. 90(7): p. 772-5.
52. Brown, S.A., E. Boerwinkle, F.K. Kashanian, N. Swanson, and W. Patsch, Variation in Concentrations of Lipids, Lipoprotein Lipids, and Apolipoprotein-a-I and Apolipoprotein-B in Plasma from Healthy Women. Clinical Chemistry, Feb 1990. 36(2): p. 207-210.
53. Covaci, A., S. Voorspoels, C. Thomsen, B. van Bavel, and H. Neels, Evaluation of total lipids using enzymatic methods for the normalization of persistent organic pollutant levels in serum. Sci Total Environ, Jul 31 2006. 366(1): p. 361-6.
54. Carter, W.G., M. Tarhoni, A.J. Rathbone, and D.E. Ray, Differential protein adduction by seven organophosphorus pesticides in both brain and thymus. Hum Exp Toxicol, Apr 2007. 26(4): p. 347-53.
55. Cui, Y., J. Guo, B. Xu, and Z. Chen, Potential of chlorpyrifos and cypermethrin forming DNA adducts. Mutat Res, Apr 30 2006. 604(1-2): p. 36-41.
56. Sapozhnikova, Y., O. Bawardi, and D. Schlenk, Pesticides and PCBs in sediments and fish from the Salton Sea, California, USA. Chemosphere, May 2004. 55(6): p. 797-809.
57. Sun, F. and H.S. Chen, Monitoring of pesticide chlorpyrifos residue in farmed fish: investigation of possible sources. Chemosphere, May 2008. 71(10): p. 1866-9.
80
58. DPR, Pesticide Use Report, Annual 2001, Indexed by Chemical and by Crop. 2001, Department of Pesticide Regulation, California Environmental Protection Agency: Sacramento, CA.
59. U.S. Department of Agriculture. Pesticide Data Program: Latest Activities/Reports. 2010 05/20/2010 [cited 2010 06/01/10]; Available from: http://www.ams.usda.gov/AMSv1.0/pdp.
60. Fortin, M., G. Carrier, and M. Bouchard, Concentrations versus amounts of biomarkers in urine: a comparison of approaches to assess pyrethroid exposure. Environmental Health, 2008. 7(55).
61. Lambert, W.E., M. Lasarev, J. Muniz, J. Scherer, J. Rothlein, J. Santana, and L. McCauley, Variation in organophosphate pesticide metabolites in urine of children living in agricultural communities. Environ Health Perspect, Apr 2005. 113(4): p. 504-8.
81
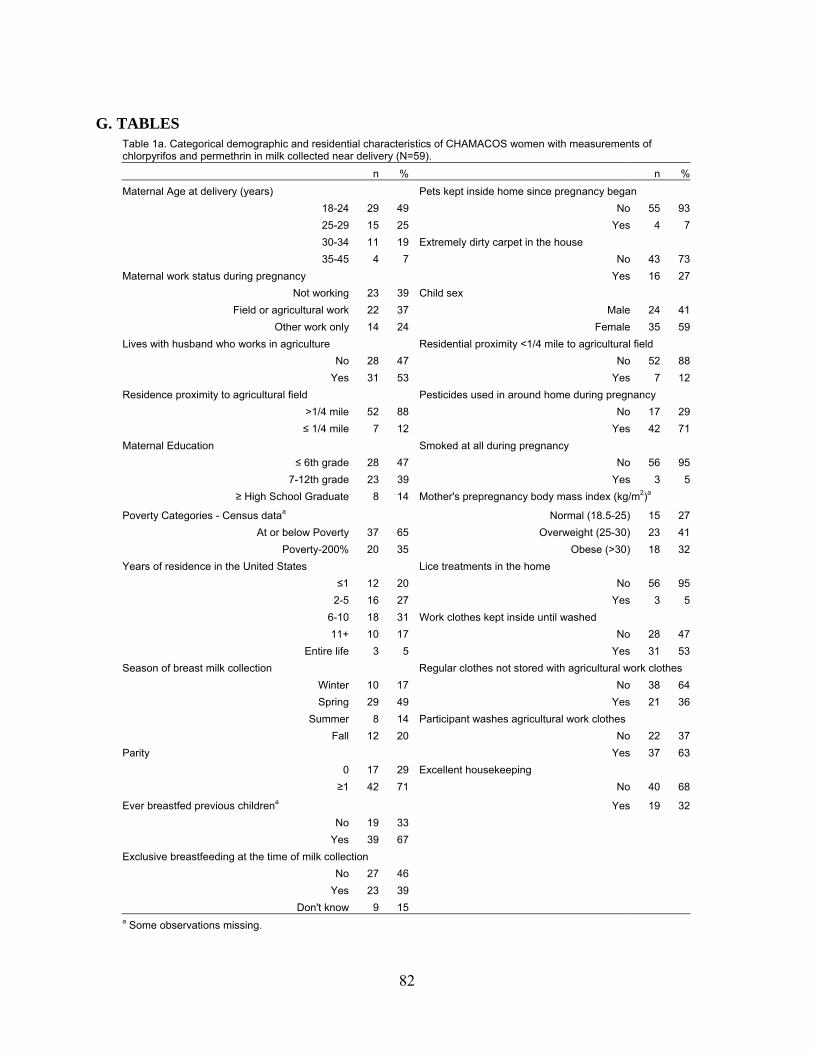
G. TABLES
Table 1a. Categorical demographic and residential characteristics of CHAMACOS women with measurements of chlorpyrifos and permethrin in milk collected near delivery (N=59).
n % n %
Maternal Age at delivery (years) Pets kept inside home since pregnancy began
18-24 29 49 No 55 93
25-29 15 25 Yes 4 7
30-34 11 19 Extremely dirty carpet in the house
35-45 4 7 No 43 73
Maternal work status during pregnancy Yes 16 27
Not working 23 39 Child sex
Field or agricultural work 22 37 Male 24 41
Other work only 14 24 Female 35 59
Lives with husband who works in agriculture Residential proximity <1/4 mile to agricultural field
No 28 47 No 52 88
Yes 31 53 Yes 7 12
Residence proximity to agricultural field Pesticides used in around home during pregnancy
>1/4 mile 52 88 No 17 29
≤ 1/4 mile 7 12 Yes 42 71
Maternal Education Smoked at all during pregnancy
≤ 6th grade 28 47 No 56 95
7-12th grade 23 39 Yes 3 5
≥ High School Graduate 8 14 Mother's prepregnancy body mass index (kg/m2)a
Poverty Categories - Census dataa
Normal (18.5-25) 15 27
At or below Poverty 37 65 Overweight (25-30) 23 41
Poverty-200% 20 35 Obese (>30) 18 32
Years of residence in the United States Lice treatments in the home
≤1 12 20 No 56 95
2-5 16 27 Yes 3 5
6-10 18 31 Work clothes kept inside until washed
11+ 10 17 No 28 47
Entire life 3 5 Yes 31 53
Season of breast milk collection Regular clothes not stored with agricultural work clothes
Winter 10 17 No 38 64
Spring 29 49 Yes 21 36
Summer 8 14 Participant washes agricultural work clothes
Fall 12 20 No 22 37
Parity Yes 37 63
0 17 29 Excellent housekeeping
≥1 42 71 No 40 68
Ever breastfed previous childrena
Yes 19 32
No 19 33
Yes 39 67
Exclusive breastfeeding at the time of milk collection
No 27 46
Yes 23 39
Don't know 9 15
a Some observations missing.
82
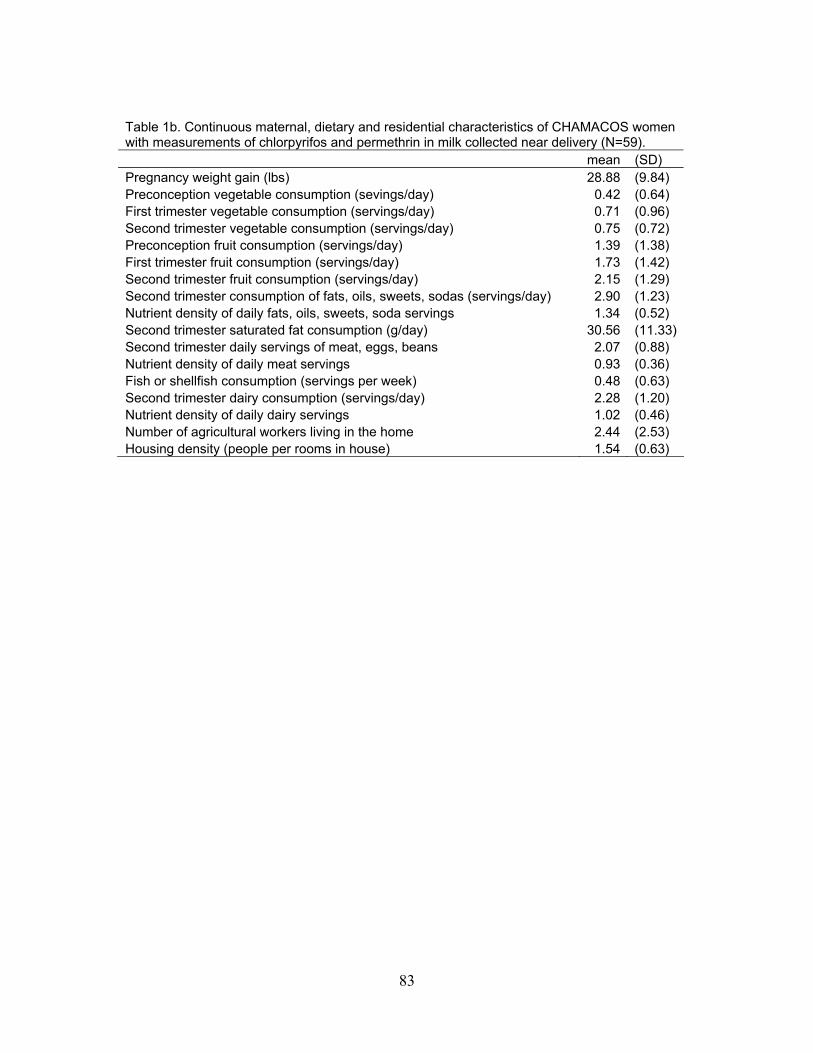
Table 1b. Continuous maternal, dietary and residential characteristics of CHAMACOS women with measurements of chlorpyrifos and permethrin in milk collected near delivery (N=59). mean (SD) Pregnancy weight gain (lbs) 28.88 (9.84) Preconception vegetable consumption (sevings/day) 0.42 (0.64) First trimester vegetable consumption (servings/day) 0.71 (0.96) Second trimester vegetable consumption (servings/day) 0.75 (0.72) Preconception fruit consumption (servings/day) 1.39 (1.38) First trimester fruit consumption (servings/day) 1.73 (1.42) Second trimester fruit consumption (servings/day) 2.15 (1.29) Second trimester consumption of fats, oils, sweets, sodas (servings/day) 2.90 (1.23) Nutrient density of daily fats, oils, sweets, soda servings 1.34 (0.52) Second trimester saturated fat consumption (g/day) 30.56 (11.33)Second trimester daily servings of meat, eggs, beans 2.07 (0.88) Nutrient density of daily meat servings 0.93 (0.36) Fish or shellfish consumption (servings per week) 0.48 (0.63) Second trimester dairy consumption (servings/day) 2.28 (1.20) Nutrient density of daily dairy servings 1.02 (0.46) Number of agricultural workers living in the home 2.44 (2.53) Housing density (people per rooms in house) 1.54 (0.63)
83
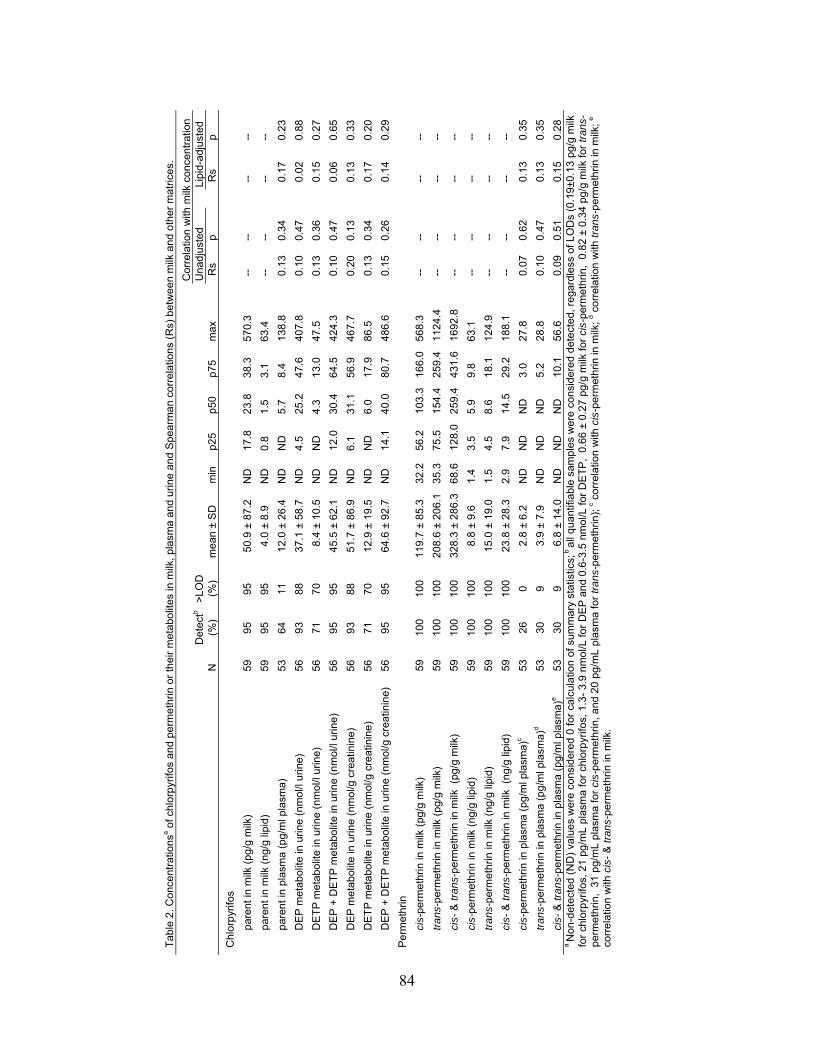
Tab
le 2
. Con
cent
ratio
nsa o
f chl
orp
yrifo
s an
d pe
rme
thrin
or
thei
r m
etab
olite
s in
milk
, pla
sma
and
urin
e an
d S
pear
ma
n co
rrel
atio
ns (
Rs)
bet
wee
n m
ilk a
nd o
ther
mat
rices
.
C
orre
latio
n w
ith m
ilk c
once
ntra
tion
D
etec
tb>
LOD
Una
djus
ted
Li
pid-
adju
sted
N
(%
)
(%)
mea
n ±
SD
m
in
p25
p50
p75
max
Rs
p
Rs
p
Chl
orp
yrifo
s
pa
rent
in m
ilk (
pg/g
milk
) 59
95
95
50
.9 ±
87.2
N
D
17.8
23
.8
38.3
57
0.3
--
--
--
--
pa
rent
in m
ilk (
ng/g
lipi
d)
59
95
95
4.0
±8.
9 N
D
0.8
1.5
3.1
63.4
--
--
--
--
pa
rent
in p
lasm
a (p
g/m
l pla
sma)
53
64
11
12
.0 ±
26.4
N
D
ND
5.
7 8.
4 13
8.8
0.
13
0.34
0.17
0.
23
D
EP
met
abol
ite in
urin
e (n
mol
/l ur
ine)
56
93
88
37
.1 ±
58.7
N
D
4.5
25.2
47
.6
407.
8
0.10
0.
47
0.
02
0.88
D
ET
P m
etab
olite
in u
rine
(nm
ol/l
urin
e)
56
71
70
8.4
±10
.5
ND
N
D
4.3
13.0
47
.5
0.
13
0.36
0.15
0.
27
D
EP
+ D
ET
P m
eta
bolit
e in
urin
e (n
mol
/l ur
ine)
56
95
95
45
.5 ±
62.1
N
D
12.0
30
.4
64.5
42
4.3
0.
10
0.47
0.06
0.
65
D
EP
met
abol
ite in
urin
e (n
mol
/g c
reat
inin
e)
56
93
88
51.7
±86
.9
ND
6.
1 31
.1
56.9
46
7.7
0.
20
0.13
0.13
0.
33
D
ET
P m
etab
olite
in u
rine
(nm
ol/g
cre
atin
ine)
56
71
70
12
.9 ±
19.5
N
D
ND
6.
0 17
.9
86.5
0.13
0.
34
0.
17
0.20
D
EP
+ D
ET
P m
eta
bolit
e in
urin
e (n
mol
/g c
reat
inin
e)
56
95
95
64.6
±92
.7
ND
14
.1
40.0
80
.7
486.
6
0.15
0.
26
0.
14
0.29
Per
met
hrin
ci
s-pe
rmet
hrin
in m
ilk (
pg/g
milk
) 59
10
0 10
0 11
9.7
±85
.3
32.2
56
.2
103.
3 16
6.0
568.
3
--
--
--
--
tr
ans-
perm
ethr
in in
milk
(pg
/g m
ilk)
59
100
100
208.
6 ±
206.
1 35
.3
75.5
15
4.4
259.
4 11
24.4
--
--
--
--
ci
s- &
tran
s-pe
rmet
hrin
in m
ilk (
pg/g
milk
) 59
10
0 10
0 32
8.3
±28
6.3
68.6
12
8.0
259.
4 43
1.6
1692
.8
--
--
--
--
ci
s-pe
rmet
hrin
in m
ilk (
ng/g
lipi
d)
59
100
100
8.8
±9.
6 1.
4 3.
5 5.
9 9.
8 63
.1
--
--
--
--
tr
ans-
perm
ethr
in in
milk
(ng
/g li
pid)
59
10
0 10
0 15
.0 ±
19.0
1.
5 4.
5 8.
6 18
.1
124.
9
--
--
--
--
ci
s- &
tran
s-pe
rmet
hrin
in m
ilk (
ng/g
lipi
d)
59
100
100
23.8
±28
.3
2.9
7.9
14.5
29
.2
188.
1
--
--
--
--
ci
s-pe
rmet
hrin
in p
lasm
a (p
g/m
l pla
sma)
c 53
26
0
2.8
±6.
2 N
D
ND
N
D
3.0
27.8
0.07
0.
62
0.
13
0.35
tr
ans-
perm
ethr
in in
pla
sma
(pg/
ml p
lasm
a)d
53
30
9 3.
9 ±
7.9
ND
N
D
ND
5.
2 28
.8
0.
10
0.47
0.13
0.
35
ci
s- &
tran
s-pe
rmet
hrin
in p
lasm
a (p
g/m
l pla
sma)
e 53
30
9
6.8
±14
.0
ND
N
D
ND
10
.1
56.6
0.09
0.
51
0.
15
0.28
a N
on-d
etec
ted
(ND
) va
lues
wer
e co
nsid
ered
0 fo
r ca
lcul
atio
n of
sum
mar
y st
atis
tics;
b al
l qua
ntifi
able
sam
ples
wer
e c
onsi
dere
d de
tect
ed,
reg
ardl
ess
of L
OD
s (0
.19±
0.13
pg/
g m
ilk
for
chlo
rpyr
ifos,
21
pg/m
L pl
asm
a fo
r ch
lorp
yrifo
s, 1
.3-
3.9
nmol
/L fo
r D
EP
and
0.6
-3.5
nm
ol/L
for
DE
TP
, 0.
66 ±
0.2
7 pg
/g m
ilk fo
r ci
s-pe
rmet
hrin
, 0.
82 ±
0.3
4 pg
/g m
ilk fo
r tr
ans-
perm
eth
rin,
31 p
g/m
L pl
asm
a fo
r ci
s-pe
rmet
hrin
, and
20
pg/m
L pl
asm
a fo
r tr
ans
-per
met
hrin
); c c
orre
latio
n w
ith c
is-p
erm
ethr
in in
milk
; d c
orre
latio
n w
ith t
ran
s-pe
rmet
hrin
in m
ilk;
e co
rrel
atio
n w
ith c
is-
& tr
ans-
perm
eth
rin in
milk
.
84
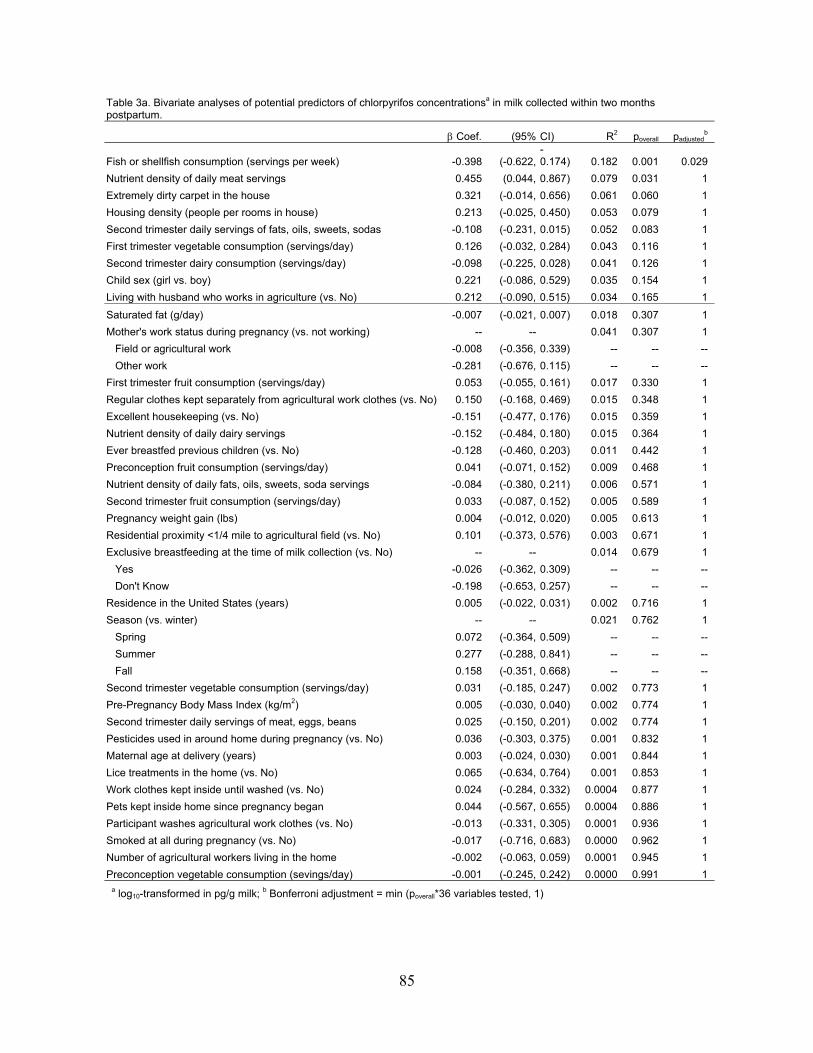
Table 3a. Bivariate analyses of potential predictors of chlorpyrifos concentrationsa in milk collected within two months postpartum.
Coef. (95% CI) R2 poverall padjustedb
Fish or shellfish consumption (servings per week) -0.398 (-0.622,-0.174) 0.182 0.001 0.029
Nutrient density of daily meat servings 0.455 (0.044, 0.867) 0.079 0.031 1
Extremely dirty carpet in the house 0.321 (-0.014, 0.656) 0.061 0.060 1
Housing density (people per rooms in house) 0.213 (-0.025, 0.450) 0.053 0.079 1
Second trimester daily servings of fats, oils, sweets, sodas -0.108 (-0.231, 0.015) 0.052 0.083 1
First trimester vegetable consumption (servings/day) 0.126 (-0.032, 0.284) 0.043 0.116 1
Second trimester dairy consumption (servings/day) -0.098 (-0.225, 0.028) 0.041 0.126 1
Child sex (girl vs. boy) 0.221 (-0.086, 0.529) 0.035 0.154 1
Living with husband who works in agriculture (vs. No) 0.212 (-0.090, 0.515) 0.034 0.165 1
Saturated fat (g/day) -0.007 (-0.021, 0.007) 0.018 0.307 1
Mother's work status during pregnancy (vs. not working) -- -- 0.041 0.307 1
Field or agricultural work -0.008 (-0.356, 0.339) -- -- --
Other work -0.281 (-0.676, 0.115) -- -- --
First trimester fruit consumption (servings/day) 0.053 (-0.055, 0.161) 0.017 0.330 1
Regular clothes kept separately from agricultural work clothes (vs. No) 0.150 (-0.168, 0.469) 0.015 0.348 1
Excellent housekeeping (vs. No) -0.151 (-0.477, 0.176) 0.015 0.359 1
Nutrient density of daily dairy servings -0.152 (-0.484, 0.180) 0.015 0.364 1
Ever breastfed previous children (vs. No) -0.128 (-0.460, 0.203) 0.011 0.442 1
Preconception fruit consumption (servings/day) 0.041 (-0.071, 0.152) 0.009 0.468 1
Nutrient density of daily fats, oils, sweets, soda servings -0.084 (-0.380, 0.211) 0.006 0.571 1
Second trimester fruit consumption (servings/day) 0.033 (-0.087, 0.152) 0.005 0.589 1
Pregnancy weight gain (lbs) 0.004 (-0.012, 0.020) 0.005 0.613 1
Residential proximity <1/4 mile to agricultural field (vs. No) 0.101 (-0.373, 0.576) 0.003 0.671 1
Exclusive breastfeeding at the time of milk collection (vs. No) -- -- 0.014 0.679 1
Yes -0.026 (-0.362, 0.309) -- -- --
Don't Know -0.198 (-0.653, 0.257) -- -- --
Residence in the United States (years) 0.005 (-0.022, 0.031) 0.002 0.716 1
Season (vs. winter) -- -- 0.021 0.762 1
Spring 0.072 (-0.364, 0.509) -- -- --
Summer 0.277 (-0.288, 0.841) -- -- --
Fall 0.158 (-0.351, 0.668) -- -- --
Second trimester vegetable consumption (servings/day) 0.031 (-0.185, 0.247) 0.002 0.773 1
Pre-Pregnancy Body Mass Index (kg/m2) 0.005 (-0.030, 0.040) 0.002 0.774 1
Second trimester daily servings of meat, eggs, beans 0.025 (-0.150, 0.201) 0.002 0.774 1
Pesticides used in around home during pregnancy (vs. No) 0.036 (-0.303, 0.375) 0.001 0.832 1
Maternal age at delivery (years) 0.003 (-0.024, 0.030) 0.001 0.844 1
Lice treatments in the home (vs. No) 0.065 (-0.634, 0.764) 0.001 0.853 1
Work clothes kept inside until washed (vs. No) 0.024 (-0.284, 0.332) 0.0004 0.877 1
Pets kept inside home since pregnancy began 0.044 (-0.567, 0.655) 0.0004 0.886 1
Participant washes agricultural work clothes (vs. No) -0.013 (-0.331, 0.305) 0.0001 0.936 1
Smoked at all during pregnancy (vs. No) -0.017 (-0.716, 0.683) 0.0000 0.962 1
Number of agricultural workers living in the home -0.002 (-0.063, 0.059) 0.0001 0.945 1
Preconception vegetable consumption (sevings/day) -0.001 (-0.245, 0.242) 0.0000 0.991 1 a log10-transformed in pg/g milk; b Bonferroni adjustment = min (poverall*36 variables tested, 1)
85
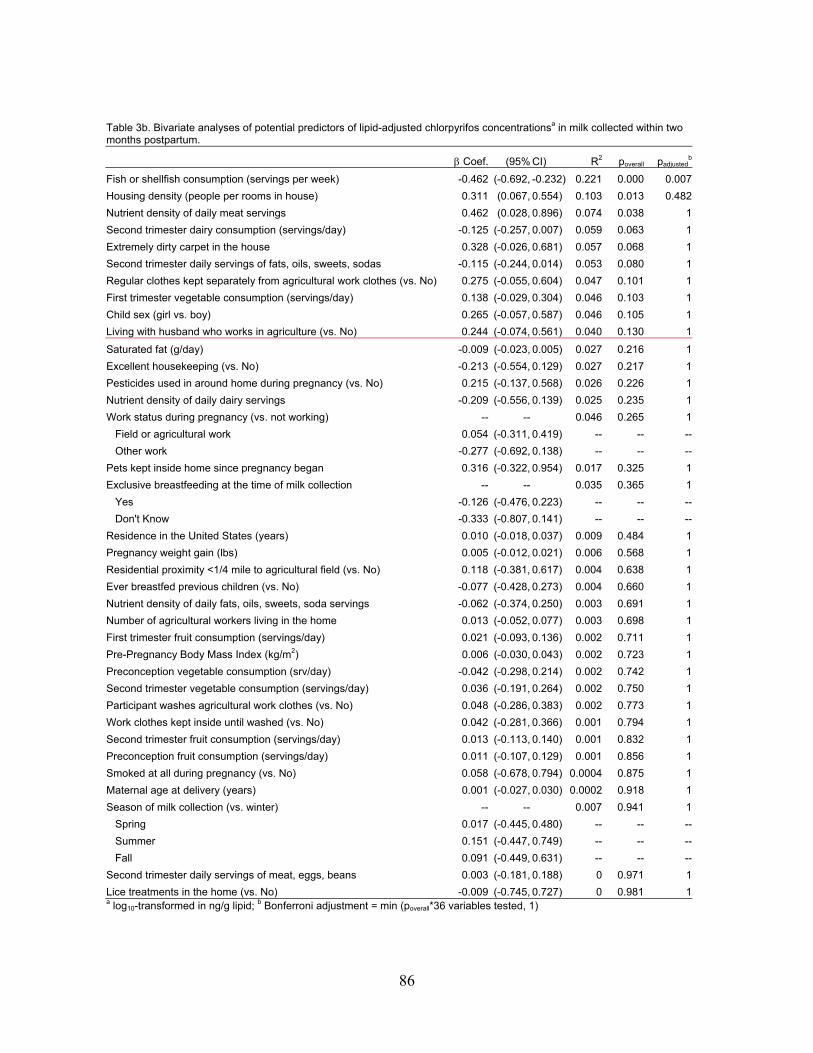
Table 3b. Bivariate analyses of potential predictors of lipid-adjusted chlorpyrifos concentrationsa in milk collected within two months postpartum.
padjustedb Coef. (95% CI) R2 poverall
Fish or shellfish consumption (servings per week) -0.462 (-0.692, -0.232) 0.221 0.000 0.007
Housing density (people per rooms in house) 0.311 (0.067, 0.554) 0.103 0.013 0.482
Nutrient density of daily meat servings 0.462 (0.028, 0.896) 0.074 0.038 1
Second trimester dairy consumption (servings/day) -0.125 (-0.257, 0.007) 0.059 0.063 1
Extremely dirty carpet in the house 0.328 (-0.026, 0.681) 0.057 0.068 1
Second trimester daily servings of fats, oils, sweets, sodas -0.115 (-0.244, 0.014) 0.053 0.080 1
Regular clothes kept separately from agricultural work clothes (vs. No) 0.275 (-0.055, 0.604) 0.047 0.101 1
First trimester vegetable consumption (servings/day) 0.138 (-0.029, 0.304) 0.046 0.103 1
Child sex (girl vs. boy) 0.265 (-0.057, 0.587) 0.046 0.105 1
Living with husband who works in agriculture (vs. No) 0.244 (-0.074, 0.561) 0.040 0.130 1
Saturated fat (g/day) -0.009 (-0.023, 0.005) 0.027 0.216 1
Excellent housekeeping (vs. No) -0.213 (-0.554, 0.129) 0.027 0.217 1
Pesticides used in around home during pregnancy (vs. No) 0.215 (-0.137, 0.568) 0.026 0.226 1
Nutrient density of daily dairy servings -0.209 (-0.556, 0.139) 0.025 0.235 1
Work status during pregnancy (vs. not working) -- -- 0.046 0.265 1
Field or agricultural work 0.054 (-0.311, 0.419) -- -- --
Other work -0.277 (-0.692, 0.138) -- -- --
Pets kept inside home since pregnancy began 0.316 (-0.322, 0.954) 0.017 0.325 1
Exclusive breastfeeding at the time of milk collection -- -- 0.035 0.365 1
Yes -0.126 (-0.476, 0.223) -- -- --
Don't Know -0.333 (-0.807, 0.141) -- -- --
Residence in the United States (years) 0.010 (-0.018, 0.037) 0.009 0.484 1
Pregnancy weight gain (lbs) 0.005 (-0.012, 0.021) 0.006 0.568 1
Residential proximity <1/4 mile to agricultural field (vs. No) 0.118 (-0.381, 0.617) 0.004 0.638 1
Ever breastfed previous children (vs. No) -0.077 (-0.428, 0.273) 0.004 0.660 1
Nutrient density of daily fats, oils, sweets, soda servings -0.062 (-0.374, 0.250) 0.003 0.691 1
Number of agricultural workers living in the home 0.013 (-0.052, 0.077) 0.003 0.698 1
First trimester fruit consumption (servings/day) 0.021 (-0.093, 0.136) 0.002 0.711 1
Pre-Pregnancy Body Mass Index (kg/m2) 0.006 (-0.030, 0.043) 0.002 0.723 1
Preconception vegetable consumption (srv/day) -0.042 (-0.298, 0.214) 0.002 0.742 1
Second trimester vegetable consumption (servings/day) 0.036 (-0.191, 0.264) 0.002 0.750 1
Participant washes agricultural work clothes (vs. No) 0.048 (-0.286, 0.383) 0.002 0.773 1
Work clothes kept inside until washed (vs. No) 0.042 (-0.281, 0.366) 0.001 0.794 1
Second trimester fruit consumption (servings/day) 0.013 (-0.113, 0.140) 0.001 0.832 1
Preconception fruit consumption (servings/day) 0.011 (-0.107, 0.129) 0.001 0.856 1
Smoked at all during pregnancy (vs. No) 0.058 (-0.678, 0.794) 0.0004 0.875 1
Maternal age at delivery (years) 0.001 (-0.027, 0.030) 0.0002 0.918 1
Season of milk collection (vs. winter) -- -- 0.007 0.941 1
Spring 0.017 (-0.445, 0.480) -- -- --
Summer 0.151 (-0.447, 0.749) -- -- --
Fall 0.091 (-0.449, 0.631) -- -- --
Second trimester daily servings of meat, eggs, beans 0.003 (-0.181, 0.188) 0 0.971 1
Lice treatments in the home (vs. No) -0.009 (-0.745, 0.727) 0 0.981 1a log10-transformed in ng/g lipid; b Bonferroni adjustment = min (poverall*36 variables tested, 1)
86
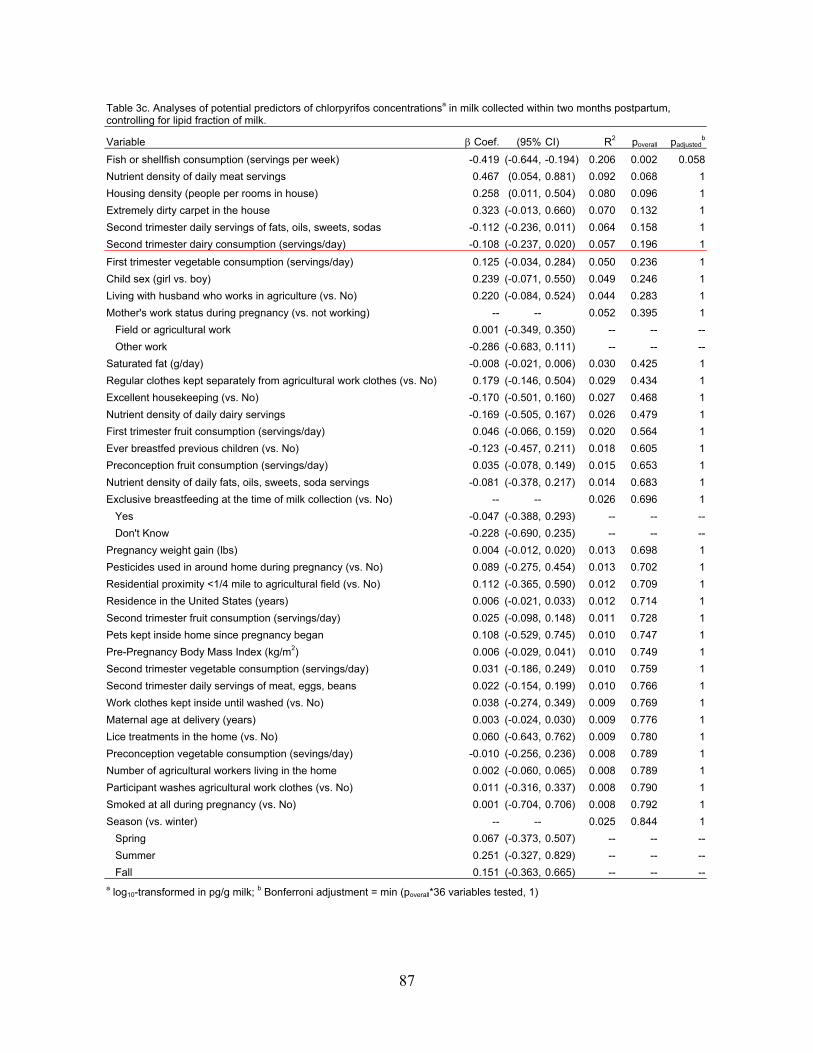
Table 3c. Analyses of potential predictors of chlorpyrifos concentrationsa in milk collected within two months postpartum, controlling for lipid fraction of milk.
Variable Coef. (95% CI) R2 poverall padjustedb
Fish or shellfish consumption (servings per week) -0.419 (-0.644, -0.194) 0.206 0.002 0.058
Nutrient density of daily meat servings 0.467 (0.054, 0.881) 0.092 0.068 1
Housing density (people per rooms in house) 0.258 (0.011, 0.504) 0.080 0.096 1
Extremely dirty carpet in the house 0.323 (-0.013, 0.660) 0.070 0.132 1
Second trimester daily servings of fats, oils, sweets, sodas -0.112 (-0.236, 0.011) 0.064 0.158 1
Second trimester dairy consumption (servings/day) -0.108 (-0.237, 0.020) 0.057 0.196 1
First trimester vegetable consumption (servings/day) 0.125 (-0.034, 0.284) 0.050 0.236 1
Child sex (girl vs. boy) 0.239 (-0.071, 0.550) 0.049 0.246 1
Living with husband who works in agriculture (vs. No) 0.220 (-0.084, 0.524) 0.044 0.283 1
Mother's work status during pregnancy (vs. not working) -- -- 0.052 0.395 1
Field or agricultural work 0.001 (-0.349, 0.350) -- -- --
Other work -0.286 (-0.683, 0.111) -- -- --
Saturated fat (g/day) -0.008 (-0.021, 0.006) 0.030 0.425 1
Regular clothes kept separately from agricultural work clothes (vs. No) 0.179 (-0.146, 0.504) 0.029 0.434 1
Excellent housekeeping (vs. No) -0.170 (-0.501, 0.160) 0.027 0.468 1
Nutrient density of daily dairy servings -0.169 (-0.505, 0.167) 0.026 0.479 1
First trimester fruit consumption (servings/day) 0.046 (-0.066, 0.159) 0.020 0.564 1
Ever breastfed previous children (vs. No) -0.123 (-0.457, 0.211) 0.018 0.605 1
Preconception fruit consumption (servings/day) 0.035 (-0.078, 0.149) 0.015 0.653 1
Nutrient density of daily fats, oils, sweets, soda servings -0.081 (-0.378, 0.217) 0.014 0.683 1
Exclusive breastfeeding at the time of milk collection (vs. No) -- -- 0.026 0.696 1
Yes -0.047 (-0.388, 0.293) -- -- --
Don't Know -0.228 (-0.690, 0.235) -- -- --
Pregnancy weight gain (lbs) 0.004 (-0.012, 0.020) 0.013 0.698 1
Pesticides used in around home during pregnancy (vs. No) 0.089 (-0.275, 0.454) 0.013 0.702 1
Residential proximity <1/4 mile to agricultural field (vs. No) 0.112 (-0.365, 0.590) 0.012 0.709 1
Residence in the United States (years) 0.006 (-0.021, 0.033) 0.012 0.714 1
Second trimester fruit consumption (servings/day) 0.025 (-0.098, 0.148) 0.011 0.728 1
Pets kept inside home since pregnancy began 0.108 (-0.529, 0.745) 0.010 0.747 1
Pre-Pregnancy Body Mass Index (kg/m2) 0.006 (-0.029, 0.041) 0.010 0.749 1
Second trimester vegetable consumption (servings/day) 0.031 (-0.186, 0.249) 0.010 0.759 1
Second trimester daily servings of meat, eggs, beans 0.022 (-0.154, 0.199) 0.010 0.766 1
Work clothes kept inside until washed (vs. No) 0.038 (-0.274, 0.349) 0.009 0.769 1
Maternal age at delivery (years) 0.003 (-0.024, 0.030) 0.009 0.776 1
Lice treatments in the home (vs. No) 0.060 (-0.643, 0.762) 0.009 0.780 1
Preconception vegetable consumption (sevings/day) -0.010 (-0.256, 0.236) 0.008 0.789 1
Number of agricultural workers living in the home 0.002 (-0.060, 0.065) 0.008 0.789 1
Participant washes agricultural work clothes (vs. No) 0.011 (-0.316, 0.337) 0.008 0.790 1
Smoked at all during pregnancy (vs. No) 0.001 (-0.704, 0.706) 0.008 0.792 1
Season (vs. winter) -- -- 0.025 0.844 1
Spring 0.067 (-0.373, 0.507) -- -- --
Summer 0.251 (-0.327, 0.829) -- -- --
Fall 0.151 (-0.363, 0.665) -- -- --a log10-transformed in pg/g milk; b Bonferroni adjustment = min (poverall*36 variables tested, 1)
87
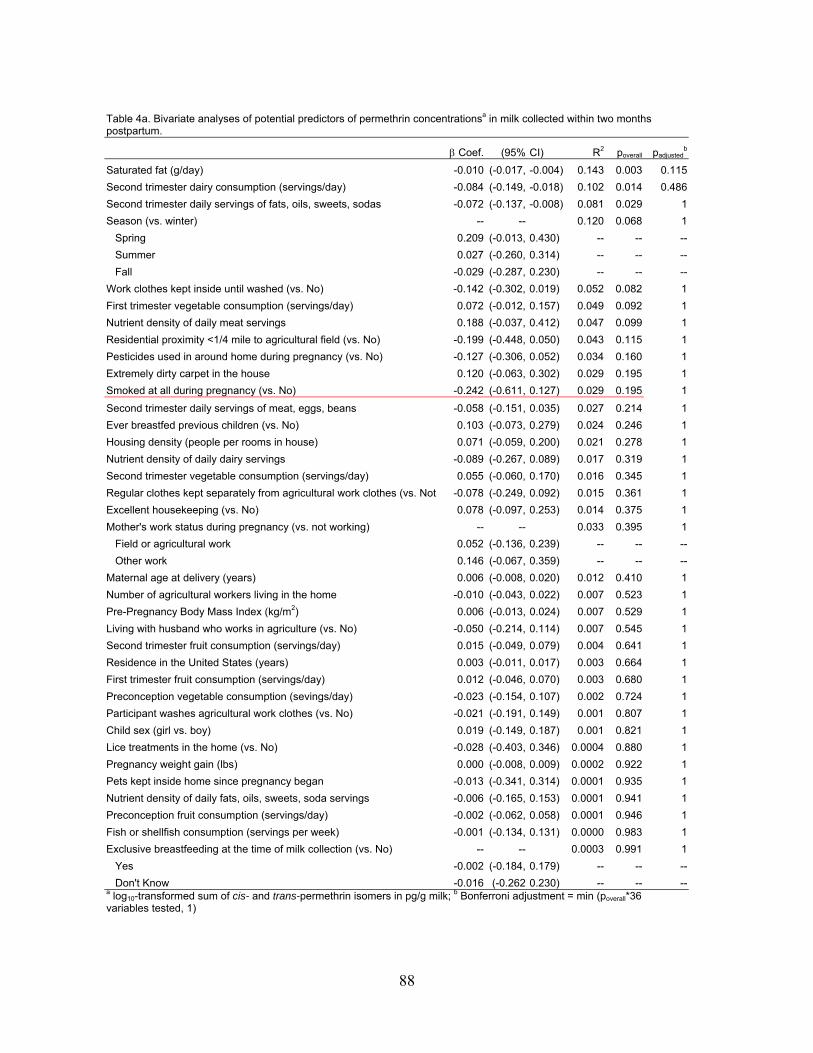
Table 4a. Bivariate analyses of potential predictors of permethrin concentrationsa in milk collected within two months postpartum.
Coef. (95% CI) R2 poverall padjustedb
Saturated fat (g/day) -0.010 (-0.017, -0.004) 0.143 0.003 0.115
Second trimester dairy consumption (servings/day) -0.084 (-0.149, -0.018) 0.102 0.014 0.486
Second trimester daily servings of fats, oils, sweets, sodas -0.072 (-0.137, -0.008) 0.081 0.029 1
Season (vs. winter) -- -- 0.120 0.068 1
Spring 0.209 (-0.013, 0.430) -- -- --
Summer 0.027 (-0.260, 0.314) -- -- --
Fall -0.029 (-0.287, 0.230) -- -- --
Work clothes kept inside until washed (vs. No) -0.142 (-0.302, 0.019) 0.052 0.082 1
First trimester vegetable consumption (servings/day) 0.072 (-0.012, 0.157) 0.049 0.092 1
Nutrient density of daily meat servings 0.188 (-0.037, 0.412) 0.047 0.099 1
Residential proximity <1/4 mile to agricultural field (vs. No) -0.199 (-0.448, 0.050) 0.043 0.115 1
Pesticides used in around home during pregnancy (vs. No) -0.127 (-0.306, 0.052) 0.034 0.160 1
Extremely dirty carpet in the house 0.120 (-0.063, 0.302) 0.029 0.195 1
Smoked at all during pregnancy (vs. No) -0.242 (-0.611, 0.127) 0.029 0.195 1
Second trimester daily servings of meat, eggs, beans -0.058 (-0.151, 0.035) 0.027 0.214 1
Ever breastfed previous children (vs. No) 0.103 (-0.073, 0.279) 0.024 0.246 1
Housing density (people per rooms in house) 0.071 (-0.059, 0.200) 0.021 0.278 1
Nutrient density of daily dairy servings -0.089 (-0.267, 0.089) 0.017 0.319 1
Second trimester vegetable consumption (servings/day) 0.055 (-0.060, 0.170) 0.016 0.345 1
Regular clothes kept separately from agricultural work clothes (vs. Not -0.078 (-0.249, 0.092) 0.015 0.361 1
Excellent housekeeping (vs. No) 0.078 (-0.097, 0.253) 0.014 0.375 1
Mother's work status during pregnancy (vs. not working) -- -- 0.033 0.395 1
Field or agricultural work 0.052 (-0.136, 0.239) -- -- --
Other work 0.146 (-0.067, 0.359) -- -- --
Maternal age at delivery (years) 0.006 (-0.008, 0.020) 0.012 0.410 1
Number of agricultural workers living in the home -0.010 (-0.043, 0.022) 0.007 0.523 1
Pre-Pregnancy Body Mass Index (kg/m2) 0.006 (-0.013, 0.024) 0.007 0.529 1
Living with husband who works in agriculture (vs. No) -0.050 (-0.214, 0.114) 0.007 0.545 1
Second trimester fruit consumption (servings/day) 0.015 (-0.049, 0.079) 0.004 0.641 1
Residence in the United States (years) 0.003 (-0.011, 0.017) 0.003 0.664 1
First trimester fruit consumption (servings/day) 0.012 (-0.046, 0.070) 0.003 0.680 1
Preconception vegetable consumption (sevings/day) -0.023 (-0.154, 0.107) 0.002 0.724 1
Participant washes agricultural work clothes (vs. No) -0.021 (-0.191, 0.149) 0.001 0.807 1
Child sex (girl vs. boy) 0.019 (-0.149, 0.187) 0.001 0.821 1
Lice treatments in the home (vs. No) -0.028 (-0.403, 0.346) 0.0004 0.880 1
Pregnancy weight gain (lbs) 0.000 (-0.008, 0.009) 0.0002 0.922 1
Pets kept inside home since pregnancy began -0.013 (-0.341, 0.314) 0.0001 0.935 1
Nutrient density of daily fats, oils, sweets, soda servings -0.006 (-0.165, 0.153) 0.0001 0.941 1
Preconception fruit consumption (servings/day) -0.002 (-0.062, 0.058) 0.0001 0.946 1
Fish or shellfish consumption (servings per week) -0.001 (-0.134, 0.131) 0.0000 0.983 1
Exclusive breastfeeding at the time of milk collection (vs. No) -- -- 0.0003 0.991 1
Yes -0.002 (-0.184, 0.179) -- -- --
Don't Know -0.016 (-0.262 0.230) -- -- --a log10-transformed sum of cis- and trans-permethrin isomers in pg/g milk; b Bonferroni adjustment = min (poverall*36 variables tested, 1)
88
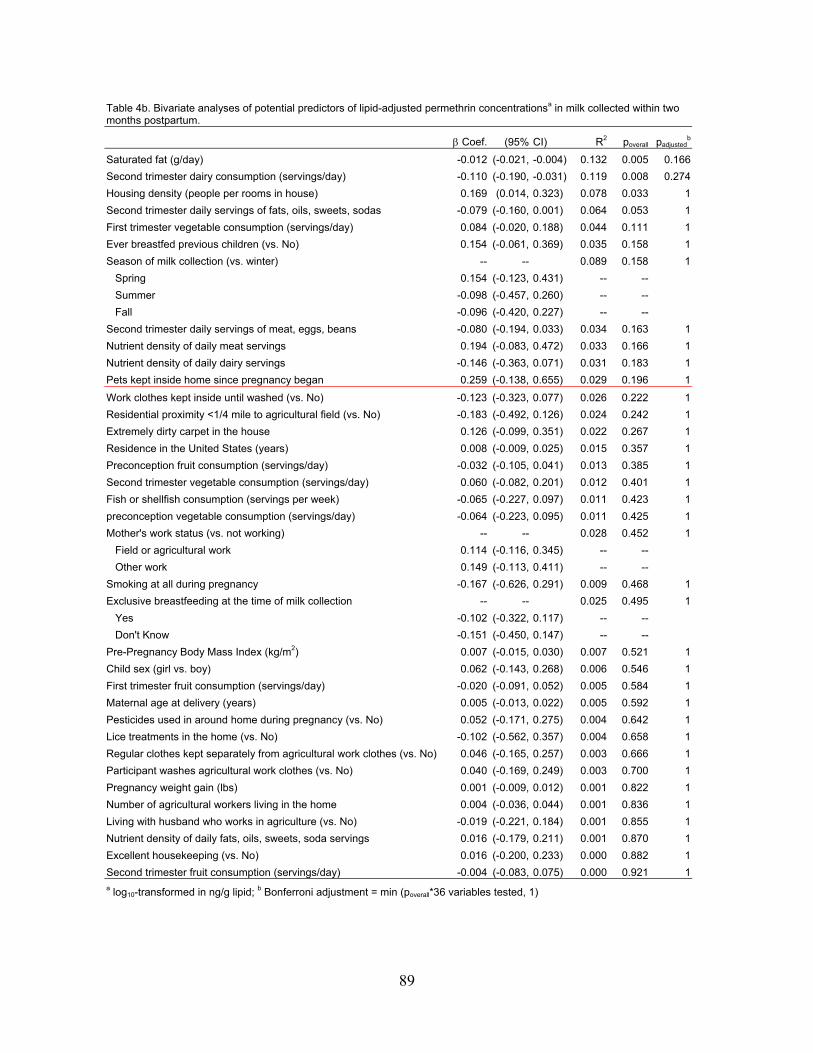
Table 4b. Bivariate analyses of potential predictors of lipid-adjusted permethrin concentrationsa in milk collected within two months postpartum.
Coef. (95% CI) R2 poverall padjustedb
Saturated fat (g/day) -0.012 (-0.021, -0.004) 0.132 0.005 0.166
Second trimester dairy consumption (servings/day) -0.110 (-0.190, -0.031) 0.119 0.008 0.274
Housing density (people per rooms in house) 0.169 (0.014, 0.323) 0.078 0.033 1
Second trimester daily servings of fats, oils, sweets, sodas -0.079 (-0.160, 0.001) 0.064 0.053 1
First trimester vegetable consumption (servings/day) 0.084 (-0.020, 0.188) 0.044 0.111 1
Ever breastfed previous children (vs. No) 0.154 (-0.061, 0.369) 0.035 0.158 1
Season of milk collection (vs. winter) -- -- 0.089 0.158 1
Spring 0.154 (-0.123, 0.431) -- --
Summer -0.098 (-0.457, 0.260) -- --
Fall -0.096 (-0.420, 0.227) -- --
Second trimester daily servings of meat, eggs, beans -0.080 (-0.194, 0.033) 0.034 0.163 1
Nutrient density of daily meat servings 0.194 (-0.083, 0.472) 0.033 0.166 1
Nutrient density of daily dairy servings -0.146 (-0.363, 0.071) 0.031 0.183 1
Pets kept inside home since pregnancy began 0.259 (-0.138, 0.655) 0.029 0.196 1
Work clothes kept inside until washed (vs. No) -0.123 (-0.323, 0.077) 0.026 0.222 1
Residential proximity <1/4 mile to agricultural field (vs. No) -0.183 (-0.492, 0.126) 0.024 0.242 1
Extremely dirty carpet in the house 0.126 (-0.099, 0.351) 0.022 0.267 1
Residence in the United States (years) 0.008 (-0.009, 0.025) 0.015 0.357 1
Preconception fruit consumption (servings/day) -0.032 (-0.105, 0.041) 0.013 0.385 1
Second trimester vegetable consumption (servings/day) 0.060 (-0.082, 0.201) 0.012 0.401 1
Fish or shellfish consumption (servings per week) -0.065 (-0.227, 0.097) 0.011 0.423 1
preconception vegetable consumption (servings/day) -0.064 (-0.223, 0.095) 0.011 0.425 1
Mother's work status (vs. not working) -- -- 0.028 0.452 1
Field or agricultural work 0.114 (-0.116, 0.345) -- --
Other work 0.149 (-0.113, 0.411) -- --
Smoking at all during pregnancy -0.167 (-0.626, 0.291) 0.009 0.468 1
Exclusive breastfeeding at the time of milk collection -- -- 0.025 0.495 1
Yes -0.102 (-0.322, 0.117) -- --
Don't Know -0.151 (-0.450, 0.147) -- --
Pre-Pregnancy Body Mass Index (kg/m2) 0.007 (-0.015, 0.030) 0.007 0.521 1
Child sex (girl vs. boy) 0.062 (-0.143, 0.268) 0.006 0.546 1
First trimester fruit consumption (servings/day) -0.020 (-0.091, 0.052) 0.005 0.584 1
Maternal age at delivery (years) 0.005 (-0.013, 0.022) 0.005 0.592 1
Pesticides used in around home during pregnancy (vs. No) 0.052 (-0.171, 0.275) 0.004 0.642 1
Lice treatments in the home (vs. No) -0.102 (-0.562, 0.357) 0.004 0.658 1
Regular clothes kept separately from agricultural work clothes (vs. No) 0.046 (-0.165, 0.257) 0.003 0.666 1
Participant washes agricultural work clothes (vs. No) 0.040 (-0.169, 0.249) 0.003 0.700 1
Pregnancy weight gain (lbs) 0.001 (-0.009, 0.012) 0.001 0.822 1
Number of agricultural workers living in the home 0.004 (-0.036, 0.044) 0.001 0.836 1
Living with husband who works in agriculture (vs. No) -0.019 (-0.221, 0.184) 0.001 0.855 1
Nutrient density of daily fats, oils, sweets, soda servings 0.016 (-0.179, 0.211) 0.001 0.870 1
Excellent housekeeping (vs. No) 0.016 (-0.200, 0.233) 0.000 0.882 1
Second trimester fruit consumption (servings/day) -0.004 (-0.083, 0.075) 0.000 0.921 1a log10-transformed in ng/g lipid; b Bonferroni adjustment = min (poverall*36 variables tested, 1)
89
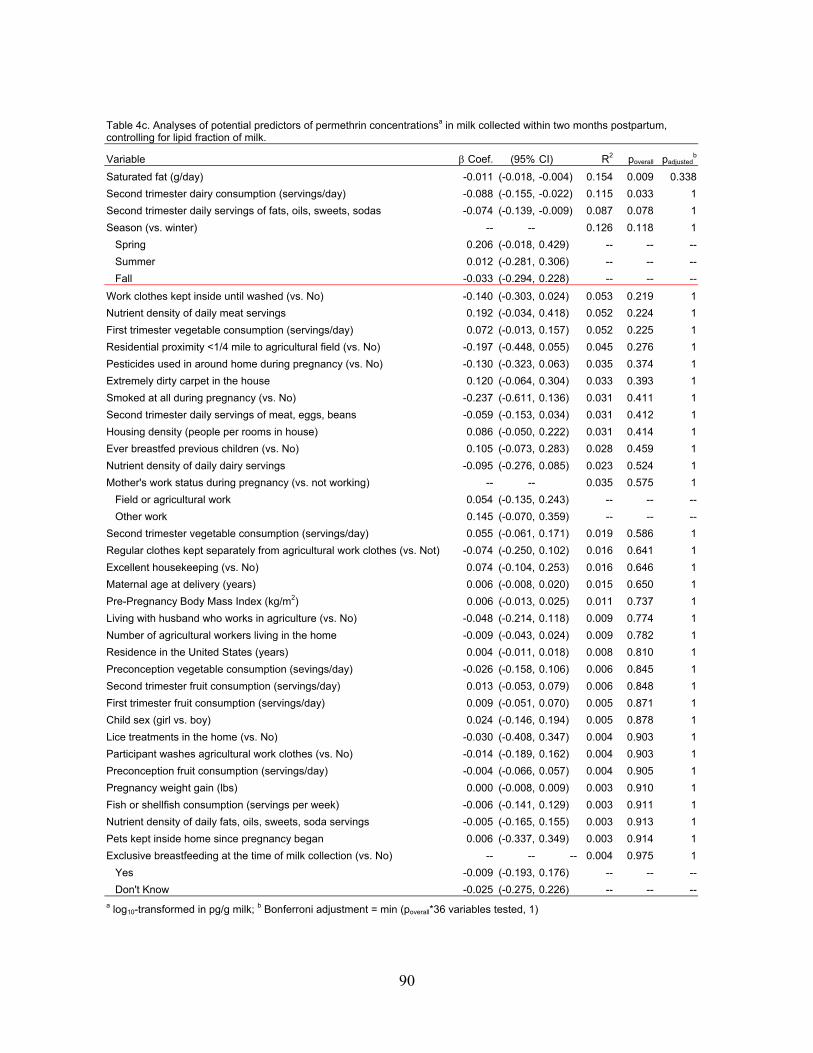
Table 4c. Analyses of potential predictors of permethrin concentrationsa in milk collected within two months postpartum, controlling for lipid fraction of milk.
padjustedbVariable Coef. (95% CI) R2 poverall
Saturated fat (g/day) -0.011 (-0.018, -0.004) 0.154 0.009 0.338
Second trimester dairy consumption (servings/day) -0.088 (-0.155, -0.022) 0.115 0.033 1
Second trimester daily servings of fats, oils, sweets, sodas -0.074 (-0.139, -0.009) 0.087 0.078 1
Season (vs. winter) -- -- 0.126 0.118 1
Spring 0.206 (-0.018, 0.429) -- -- --
Summer 0.012 (-0.281, 0.306) -- -- --
Fall -0.033 (-0.294, 0.228) -- -- --
Work clothes kept inside until washed (vs. No) -0.140 (-0.303, 0.024) 0.053 0.219 1
Nutrient density of daily meat servings 0.192 (-0.034, 0.418) 0.052 0.224 1
First trimester vegetable consumption (servings/day) 0.072 (-0.013, 0.157) 0.052 0.225 1
Residential proximity <1/4 mile to agricultural field (vs. No) -0.197 (-0.448, 0.055) 0.045 0.276 1
Pesticides used in around home during pregnancy (vs. No) -0.130 (-0.323, 0.063) 0.035 0.374 1
Extremely dirty carpet in the house 0.120 (-0.064, 0.304) 0.033 0.393 1
Smoked at all during pregnancy (vs. No) -0.237 (-0.611, 0.136) 0.031 0.411 1
Second trimester daily servings of meat, eggs, beans -0.059 (-0.153, 0.034) 0.031 0.412 1
Housing density (people per rooms in house) 0.086 (-0.050, 0.222) 0.031 0.414 1
Ever breastfed previous children (vs. No) 0.105 (-0.073, 0.283) 0.028 0.459 1
Nutrient density of daily dairy servings -0.095 (-0.276, 0.085) 0.023 0.524 1
Mother's work status during pregnancy (vs. not working) -- -- 0.035 0.575 1
Field or agricultural work 0.054 (-0.135, 0.243) -- -- --
Other work 0.145 (-0.070, 0.359) -- -- --
Second trimester vegetable consumption (servings/day) 0.055 (-0.061, 0.171) 0.019 0.586 1
Regular clothes kept separately from agricultural work clothes (vs. Not) -0.074 (-0.250, 0.102) 0.016 0.641 1
Excellent housekeeping (vs. No) 0.074 (-0.104, 0.253) 0.016 0.646 1
Maternal age at delivery (years) 0.006 (-0.008, 0.020) 0.015 0.650 1
Pre-Pregnancy Body Mass Index (kg/m2) 0.006 (-0.013, 0.025) 0.011 0.737 1
Living with husband who works in agriculture (vs. No) -0.048 (-0.214, 0.118) 0.009 0.774 1
Number of agricultural workers living in the home -0.009 (-0.043, 0.024) 0.009 0.782 1
Residence in the United States (years) 0.004 (-0.011, 0.018) 0.008 0.810 1
Preconception vegetable consumption (sevings/day) -0.026 (-0.158, 0.106) 0.006 0.845 1
Second trimester fruit consumption (servings/day) 0.013 (-0.053, 0.079) 0.006 0.848 1
First trimester fruit consumption (servings/day) 0.009 (-0.051, 0.070) 0.005 0.871 1
Child sex (girl vs. boy) 0.024 (-0.146, 0.194) 0.005 0.878 1
Lice treatments in the home (vs. No) -0.030 (-0.408, 0.347) 0.004 0.903 1
Participant washes agricultural work clothes (vs. No) -0.014 (-0.189, 0.162) 0.004 0.903 1
Preconception fruit consumption (servings/day) -0.004 (-0.066, 0.057) 0.004 0.905 1
Pregnancy weight gain (lbs) 0.000 (-0.008, 0.009) 0.003 0.910 1
Fish or shellfish consumption (servings per week) -0.006 (-0.141, 0.129) 0.003 0.911 1
Nutrient density of daily fats, oils, sweets, soda servings -0.005 (-0.165, 0.155) 0.003 0.913 1
Pets kept inside home since pregnancy began 0.006 (-0.337, 0.349) 0.003 0.914 1
Exclusive breastfeeding at the time of milk collection (vs. No) -- -- -- 0.004 0.975 1
Yes -0.009 (-0.193, 0.176) -- -- --
Don't Know -0.025 (-0.275, 0.226) -- -- --a log10-transformed in pg/g milk; b Bonferroni adjustment = min (poverall*36 variables tested, 1)
90
Chapter 5
Conclusion A. OVERVIEW
An infant’s development depends upon many factors including proper nutrition, maternal bonding, and appropriate stimulation. Breastfeeding allows an infant to receive these three key elements and much more. Breast milk provides complete nutrition to an infant from birth to the first six months of life and continued breastfeeding with complementary feeding is recommended up to two years postpartum and beyond.1 Breastfeeding also promotes the maternal-child bonding that is essential for infant neurodevelopment.2, 3 Hormones play a critical role in lactation, where a low estrogen environment is needed to successfully lactate while increased oxytocin facilitates milk ejection.4 Some chemicals, including insecticides, such as DDT/DDE, may interrupt these endocrine processes as demonstrated by previous studies which found associations between increased concentrations of DDE and shortened lactation duration.5-7 These insecticides also function by interrupting neurochemical processes in insects and vertebrates and have been associated with neurobehavioral deficits in human and animal models.8-16
Since breast milk is the optimal source of nutrition for many infants, it is important to understand the role of environmental chemicals on proper lactation. We, in collaboration with the Centers for Disease Control and Prevention, developed a laboratory method to measure nonpersistent and persistent pesticides and PCBs in breast milk because it may be the largest source of environmental contaminants to exclusively breastfed infants. Thus, biomonitoring breast milk remains a necessary step in understanding infant exposures, their potential health effects and in identifying potential points of intervention to decrease these exposures. B. SUMMARY OF FINDINGS 1. Endocrine disruption of lactation
Previous researchers have found associations between DDT, or rather its environmental degradate, DDE, and shortened lactation duration.5-7 They have hypothesized that lactation duration is compromised by chemicals with estrogenic endocrine-disrupting activity. We expanded upon this research by investigating the endocrine disrupting activity of several persistent organic pollutants (POPs) and assessing whether these POPs were associated with lactation duration individually and grouped by potential endocrine disrupting activity. Contrary to previous literature, we found no association between any of the isomers of DDT or DDE or any other potentially estrogenic chemicals and shortened lactation duration; instead, we found longer lactation duration with increasing concentrations of DDE and PCB 52. It is possible that cultural and familial influences may have encouraged mothers to persevere through breastfeeding challenges presented by endocrine-disrupting chemicals, but our study did not have the data needed to investigate this.
91
The end point that may be most sensitive to endocrine disruption is initiation of breastfeeding rather than duration.23 Our study was not able to investigate initiation because most women in our population initiated breastfeeding, but this may have been due to cultural differences within our population; thus, these questions should be investigated among populations that have more variation in breastfeeding initiation and cessation in the early weeks of breastfeeding. 2.
3.
Measuring concentrations and variability of pesticides and PCBs in breast milk Unlike Sweden and other European countries, the United States (U.S.) has no established
breast milk biomonitoring program. In addition, the chemicals that are typically biomonitored in breast milk, lipophilic, bioaccumulative POPs, have been banned in the U.S. for years.17 Therefore, we embarked on this project to investigate whether currently used non-persistent pesticides were detectable in breast milk in addition to the POPs of historic interest. As expected, we found that all of the POPs that we measured (hexachlorobenzene, DDT, DDE, -hexachlorocyclohexane, and PCBs 118, 132, 153, and 180) were detectable in the milk of women residing in two different California communities, one agricultural and one urban. We also found high detection frequencies of several non-persistent pesticides including chlorpyrifos, chlorpyrifos-methyl, permethrin, and propoxur. We investigated the variability of these chemicals and found permethrin to be almost as stable over time as the lipophilic POPs, but chlorpyrifos, chlorpyrifos-methyl and propoxur varied more over time. These findings indicate that neonates are exposed to currently used pesticides and POPs through their mothers’ milk. More research is needed to identify the sources of exposure to mothers and to investigate the potential health effects of lactational exposure to pesticides, other environmental chemicals and mixtures of environmental chemicals.
Although the sample sizes in this study were small and the two populations studied were demographically different, this pilot study shows detectable concentrations of currently used pesticides in women residing in both agricultural and urban communities. This suggests that exposures to currently used pesticides may be occurring through a common pathway in both communities. This research also indicates that future breast milk biomonitoring programs need to measure currently used chemicals in breast milk even if they are not readily considered bioaccumulative. Finally, our analyses of the variability of chemicals measured in the breast milk of the same women over time indicate that for some non-persistent pesticides such as permethrin, a single “snapshot” sample may adequately describe exposure to the mother and infant, but for another non-persistent pesticide, chlorpyrifos, several samples will likely be needed to characterize maternal or infant exposure in epidemiological studies or risk assessments.
Determinants of chlorpyrifos and permethrin in milk and correlations of concentrations in plasma and urine
In Chapter 3, we found that two currently used non-persistent pesticides, chlorpyrifos and permethrin, were detectable in nearly all of the breast milk samples that we analyzed from women residing in an agricultural and an urban community. This led us to investigate whether measurements of these chemicals in breast milk reflected concentrations of biomarkers of exposure in other biological matrices such as plasma and urine. We also explored potential factors that may have led some women to have higher concentrations in their breast milk than others. We found that concentrations of chlorpyrifos and permethrin measured in breast milk
92
were positively rank correlated with concentrations measured in plasma and/or urine, but none of these correlations were statistically significant. We also found that dietary factors such as fish consumption were associated with decreased chlorpyrifos concentrations in breast milk, while environmental factors including the presence of dirty carpet and housing density were associated with increased chlorpyrifos concentrations in milk. Other dietary factors such as consumption of dairy and fats, oils, sweets and sodas were associated with having lower concentrations of permethrin in breast milk. The small sample size of this study limits its utility for direct policy action, but the findings indicate that a larger study should be performed to determine whether the dietary and environmental factors that were found to be associated with chlorpyrifos and permethrin exposure in this study are indeed potential points of intervention for reducing exposures of these pesticides to lactating women and their nursing infants.
Although this was a small study, important implications result from our findings. Our comparisons of concentrations measured in breast milk with those measured in urine and plasma indicate that breast milk is a valuable matrix to measure because it appears to be a more sensitive and specific biomarker of exposure and because it is the best measure of dietary exposure to exclusively breastfed infants. This study was the first to attempt to identify potential dietary and environmental factors that may be associated with currently used pesticides; understanding these factors will allow women to be proactive in protecting themselves and their infants from the potentially harmful effects of pesticides. This work will also aid in the design and implementation of future studies that may be able to address some of the data collection and sample size limitations of this study. Larger studies will, in turn, be helpful in informing policy decisions regarding the safety of pesticides for women of reproductive age and their infants. C. PUBLIC HEALTH IMPLICATIONS 1. Policy implications and recommendations
The Food Quality Protection Act, enacted in 1996, charged the U.S. Environmental Protection Agency (EPA) to evaluate pesticides in food and ensure food safety, particularly for vulnerable populations including pregnant women and children.18 Although the National Health and Nutrition Examination Survey (NHANES) has been monitoring pesticides and other chemicals in biological tissues from U.S. citizens since 1988,19 breast milk has never been included in NHANES and the U.S. has never established an ongoing nationwide breast milk biomonitoring program. Without an understanding of the concentrations of chemicals in breast milk, often the sole food consumed by infants in the first six months of life, the safety of breastfeeding infants cannot be ensured.
As of 2009, the National Children’s study (NCS), conducted jointly by the National Institute of Child Health and Development, the Centers for Disease Control and Prevention, the National Institute of Environmental Health Sciences, and the U.S. EPA, began recruiting 525 pregnant women as part of a pilot program to examine the effects of various environmental contaminants on health and development.20 As part of this pilot, samples of blood, breast milk, and urine in pregnant mothers and children will be examined for over 100 environmental chemicals and nutritional indicators. Our studies of pesticides and environmental contaminants in breast milk are currently being used by researchers at EPA to aid in selecting the environmental chemicals that will be analyzed in breast milk samples collected from the NCS pilot program. Our research clearly shows that U.S. infants are being exposed to non-persistent pesticides in breast milk; thus, breast milk biomonitoring programs including the NCS pilot
93
program need to consider exposure rates and routes of currently used pesticides when selecting target analytes to study in addition to the lipophilic POPs that remain of interest due to their persistence and bioaccumulative properties. In addition, the NCS or another large-scale study should attempt to understand the variability of these chemicals in breast milk to assess their utility in epidemiological studies. Large-scale studies are also needed to fully understand the potential factors that contribute to high concentrations of pesticides in breast milk. Without this knowledge, effective policies cannot be designed to reduce these exposure sources and protect breastfeeding women and their nursing infants from continued exposures. 2. Breast milk biomonitoring and implications for breastfeeding
In this work, we report concentrations of many pesticides and PCBs in the milk of women from three populations who resided in agricultural and urban communities. Of particular importance was the detection of non-persistent pesticides that are currently used, including chlorpyrifos and permethrin. The U.S. EPA recognizes concerns about the health effects of pesticides and other environmental chemicals and lists several recommendations on its website for consumers who want to reduce their exposure to pesticides including: 1) removing sources of food, water, and shelter for pests rather than using insecticides; 2) reading pesticide use and handling instructions carefully if insecticides are used; 3) washing and peeling fruits and vegetables prior to consuming them; and 4) eating a varied diet.21
Well-designed breast milk biomonitoring programs would be able to assess concentrations of potentially toxic chemicals, to study their potential health effects and to inform policy decisions that would aid in decreasing exposures to women of child-bearing age and their future offspring. Despite the high detection of pesticides and PCBs in breast milk reported in our studies, breast milk remains the most nutritional and beneficial food for infants, especially since alternative foods may also be contaminated with pesticides and PCBs. Mothers who are concerned about environmental contaminants in their breast milk should be educated about the benefits of breastfeeding to the infant and ways in which they can reduce exposure to pesticides. Mothers who are properly educated by lactation consultants or other health care providers may be more likely to initiate or continue breastfeeding their children.22
D. FUTURE DIRECTIONS
There is still much to learn about the concentrations, variability and health effects of non-persistent and persistent pesticides and PCBs in breast milk. Our work has opened some avenues for future research and our studies of non-persistent pesticides in breast milk should be replicated in other populations and with larger sample sizes. In addition, we should continue to conduct studies to investigate the potential health effects of lactational transfer of non-persistent pesticides on child health and development.
94
E. REFERENCES 1. WHO, The WHO Global Data Bank on Breastfeeding and Complementary Feeding.
2006. 2. Champagne, F., J. Diorio, S. Sharma, and M.J. Meaney, Naturally occurring variations
in maternal behavior in the rat are associated with differences in estrogen-inducible central oxytocin receptors. Proc Natl Acad Sci U S A, Oct 23 2001. 98(22): p. 12736-41.
3. Kuchinskas, S., The Chemistry of Connection: How the Oxytocin Response Can Help You Find Trust, Intimacy, and Love. 2009 Oakland, CA: New Harbinger Publications.
4. Pena, K.S. and J.A. Rosenfeld, Evaluation and treatment of galactorrhea. Am Fam Physician, May 1 2001. 63(9): p. 1763-70.
5. Gladen, B.C. and W.J. Rogan, DDE and shortened duration of lactation in a northern Mexican town. American Journal of Public Health., Apr 1995. 85(4): p. 504-8.
6. Karmaus, W., S. Davis, C. Fussman, and K. Brooks, Maternal concentration of dichlorodiphenyl dichloroethylene (DDE) and initiation and duration of breast feeding. Paediatric and Perinatal Epidemiology, Sep 2005. 19(5): p. 388-98.
7. Rogan, W.J., B.C. Gladen, J.D. McKinney, N. Carreras, P. Hardy, J. Thullen, J. Tingelstad, and M. Tully, Polychlorinated biphenyls (PCBs) and dichlorodiphenyl dichloroethene (DDE) in human milk: effects on growth, morbidity, and duration of lactation. American Journal of Public Health., Oct 1987. 77(10): p. 1294-7.
8. Canadas, F., D. Cardona, E. Davila, and F. Sanchez-Santed, Long-term neurotoxicity of chlorpyrifos: spatial learning impairment on repeated acquisition in a water maze. Toxicol Sci, Jun 2005. 85(2): p. 944-51.
9. Dorner, G. and A. Plagemann, DDT in human milk and mental capacities in children at school age: an additional view on PISA 2000. Neuro Endocrinol Lett, Oct-Dec 2002. 23(5-6): p. 427-31.
10. Eskenazi, B., A.R. Marks, A. Bradman, L. Fenster, C. Johnson, D.B. Barr, and N.P. Jewell, In utero exposure to dichlorodiphenyltrichloroethane (DDT) and dichlorodiphenyldichloroethylene (DDE) and neurodevelopment among young Mexican American children. Pediatrics, Jul 2006. 118(1): p. 233-41.
11. Farag, A.T., N.F. Goda, A.H. Mansee, and N.A. Shaaban, Effects of permethrin given before mating on the behavior of F1-generation in mice. Neurotoxicology, May 2006. 27(3): p. 421-8.
12. Nasuti, C., R. Gabbianelli, M.L. Falcioni, A. Di Stefano, P. Sozio, and F. Cantalamessa, Dopaminergic system modulation, behavioral changes, and oxidative stress after neonatal administration of pyrethroids. Toxicology, Jan 18 2007. 229(3): p. 194-205.
13. Rauh, V.A., R. Garfinkel, F.P. Perera, H.F. Andrews, L. Hoepner, D.B. Barr, R. Whitehead, D. Tang, and R.W. Whyatt, Impact of prenatal chlorpyrifos exposure on neurodevelopment in the first 3 years of life among inner-city children. Pediatrics, Dec 2006. 118(6): p. e1845-59.
14. Ribas-Fito, N., E. Cardo, M. Sala, M. Eulalia de Muga, C. Mazon, A. Verdu, M. Kogevinas, J.O. Grimalt, and J. Sunyer, Breastfeeding, exposure to organochlorine compounds, and neurodevelopment in infants. Pediatrics, May 2003. 111(5 Pt 1): p. e580-5.
95
15. Ribas-Fito, N., M. Torrent, D. Carrizo, L. Munoz-Ortiz, J. Julvez, J.O. Grimalt, and J. Sunyer, In Utero Exposure to Background Concentrations of DDT and Cognitive Functioning among Preschoolers. Am J Epidemiol, Sep 12 2006.
16. Wolansky, M.J. and J.A. Harrill, Neurobehavioral toxicology of pyrethroid insecticides in adult animals: a critical review. Neurotoxicol Teratol, Mar-Apr 2008. 30(2): p. 55-78.
17. UNEP, Stockholm Convention on Persistent Organic Pollutants. Depositary notification C.N.531.2001.TREATIES-96 of 19 June 2001, United Nations Environment Program, Editor. 2001, United Nations.
18. Food Quality Protection Act. 1996. 19. Centers for Disease Control and Prevention. National Health and Nutrition Examination
Survey - History. 2010 May 21, 2010 [cited 2010 June 11]; Available from: http://www.cdc.gov/nchs/nhanes/history.htm.
20. Centers for Disease Control and Prevention. National Biomonitoring Program: National Children's Study. 2010 March 12 2010 [cited 2010 June 11, 2010]; Available from: http://www.cdc.gov/biomonitoring/childrens_study.html.
21. U.S. EPA. Pesticide News Story: EPA Statement Regarding Pediatrics Article, “Attention-Deficit/Hyperactivity Disorder and Urinary Metabolites of Organophosphate Pesticides”. 2010 Released May 21, 2010 [cited 2010 June 22]; Available from: http://epa.gov/oppfead1/cb/csb_page/updates/2010/op-adhd.html.
22. Commonweal, Monitoring Mother Earth by Monitoring Mothers’ Milk. 2009: Bolinas, CA.
23. Cupul-Uicab, L.A., B.C. Gladen, M. Hernández-Ávila, J.P. Weber, and M.P. Longnecker, DDE, a degradation product of DDT, and duration of lactation in a highly exposed area of Mexico. Environmental Health Perspectives, Feb 2008. 116(2): p. 179-83.
96