Embed Size (px)
Citation preview

Imperial Journal of Interdisciplinary Research (IJIR)
Vol-3, Issue-2, 2017
ISSN: 2454-1362, http://www.onlinejournal.in
Imperial Journal of Interdisciplinary Research (IJIR) Page 349
Rooftop Solar Plant Installation of 25KW
Mr. Jyotish Kumar Patel* & Dr. Dharma Buddhi* *Dual Degree (B.Tech. Mechanical Engineering + M.Tech. Energy Engineering), Suresh
Gyan Vihar University, Jaipur, Dist. Rajasthan, India
*Centre of Excellence, (M.Tech) Energy Research & Utilization, Suresh Gyan Vihar
University, Jaipur, India
Abstract : The solar cells are available in two forms depending on the nature of the material used for its production. The two main forms are crystalline solar cells and solar cells in thin layers. Lens solar cells until now have higher conversion efficiencies with regard to the photovoltaic cells and the main types are mono-crystalline and polycrystalline cells. The thin film solar cells, much less efficient than crystalline silicon offer greater promise for large-scale energy. Solar energy in India is linked to the rapid development of industry, with a total installed capacity of solar power network of 8,062 MW (8 GW) of 31 July 2016. In January 2015, the Government of India significantly expanded its floor plans, US $ 100 billion investment and 100 GW solar (40 GW sunroof ) started in 2022 the large scale use of solar orientation only in 2010, but the ambitious targets India would be to install more than double the global leaders of China and Germany in the late 2015 period. Lant generates the electricity rate <(less than) Rs.3 / unit compared to normal tables provide electricity at Rs. 10-15 / unit. ROI (return on investment) is 3 to 5 years, while the life of the solar power plant is more than 25 years. Therefore, the client will get the advantage of solar energy over 20 to 22 years. The government grant of 30% offered in India, which will lower floor of a relatively low cost. Tax income of the accelerated depreciation of 80% the first year and 20% next year CAPEX effectively reduce the cost of the plant in India.
1. Introduction 1.1 Sun as the main source of solar energy Energy in the form of chemicals from fossil fuel,
biomass energy is obtained from the degradation of
plants and animals, and water power is called
hydropower and solar energy can be obtained by
the falling sun sunlight on the solar panel, the sun
as a star and still five billion years. If we talk about
human point of view, it is an inexhaustible source
of energy. The virile energy divided into two
outside
(1) Renewable energy
(2) Non-renewable energy source.
The electricity industry in India had an installed
capacity of 305.55 GW to 31 August 2016
capacity.
Renewable energy plants constitute 28% of the
total installed capacity.
1.2 Photovoltaic an overview
1.2.1 Nature of semiconductor
Electrical energy is obtained by converting
electromagnetic radiation into electrical energy of
this phenomenon is essentially photovoltaic cell
and photovoltaic phenomenon has basically the
nature of the energy transformation. There are two
types of semiconductor
(1) Intrinsic semiconductor
(2) Extrinsic semiconductor.
In semiconductors pure intrinsic semiconductors
are extrinsic semiconductors present and the
impure semiconductor are present impure
semiconductor has .The N conductivity type and
contains negative charge carriers that is, free
electrons or p-type conductivity: for loading
support positive will say (holes) .If speaks of
silicon has a diamond structure and is 14 electrons
and electron energy covalent bond can form .The
required specific energy value of periodic motion
.These are the categories
(1) Energy permissible band
(2) The energy of the band gap
The group contains valance electron valence
electron level of energy in very low temperature .In
- sorted electron energy band cannot circulate the
energy level .The energy level between the band
valence band and the conduction is called level
Fermi.
Fig No. 1.1:-Energy level between bands

Imperial Journal of Interdisciplinary Research (IJIR)
Vol-3, Issue-2, 2017
ISSN: 2454-1362, http://www.onlinejournal.in
Imperial Journal of Interdisciplinary Research (IJIR) Page 350
When a photon strikes the electronic band interval
and then break the valence band and converting the
conduction band and the conduction band valance
.The partially moved to the Fermi level .The
electron in the conduction band for this reason
capable to carry electric current and the electron
current area left free valence band and electronic
switches to another level. The valence electron to
the different direction in different electric field
such that the field strength of the positively
charged particle called holes, the not equal. Holes
and electrons in semiconductor photon energy
intrinsic must be exceeding the band gap when the
electron-hole pair is generated.
Fig No. 1.2:-Fermi level and band banding in p
type and n type semiconductor
Photo means light and voltaic term means tension,
the principle of the photovoltaic cell based on the
photovoltaic effect, electricity generated by
sunlight.
1.2.2 Photovoltaic effects
In photovoltaic effect when sunlight or the incident
sunlight on the surface of the solar cell then the
energy observed by the valence band so excited
and try to jump the conduction band and the
electromotive force generated the energy transfer
what light into electrical energy. The scientist Sir
A.E Becquerel gave the idea about the photovoltaic
effect.
In the photovoltaic effect of the generation
of charge carriers due to photon
absorption semiconductor.
Division of charge between junctions.
The strike of solar radiation on the module PV
form of photons and the electric power
generated direct current dc current form that
can be used by UPS and stored by the battery
for use in appliances.
Fig No.1.3:-Solar electrical circuit
1.2.3 Function of photovoltaic cell
Photovoltaic cell has large area p-n junction .it
produce electricity from sunlight. Photovoltaic cell
is typically made of silicon, germanium type of
material, when these materials by sunlight heats
then produce a voltage at the junction.
1.2.4 Working of P-V cell
PV cellular material has an atom having a positive
charge and the electron has a negative charge
around the pair of electrons and holes to recombine
.When nuclease treated together .If the
phenomenon doping impurity is added or doping
.The finished more electrons in the outside of the
cell because this particle negatively charged
electron is free to move , the sun has both n-type
and p- type semi transfer connected conduction
electrons and the other n-type p-type because of
this difference in voltage developed by the union of
cells observed .When light , while the energy of the
electrons will flow down due to the natural
tendency and flow holes room for this reason will
develop matching circuit.
1.2.5 Separation of charge carrier
Two modes are available for separation of charge
carrier
(1) Drift
(2) Diffusion
1.2.6 Type of solar photovoltaic panel
There are three types of solar panel.
1. Mono Crystalline (Single Crystalline)
2. Polly Crystalline (Multi Crystalline)
3. Amorphous
Table No. 1:-Efficiency of solar module
Cell materials Module Efficiency
Mono crystalline silicon
materials
20%- 25%
Poly crystalline silicon
materials
13% -16%
Amorphous silicon
materials
5%-10%

Imperial Journal of Interdisciplinary Research (IJIR)
Vol-3, Issue-2, 2017
ISSN: 2454-1362, http://www.onlinejournal.in
Imperial Journal of Interdisciplinary Research (IJIR) Page 351
2. Experimental materials and
method This project was carried out on top floor of
International Hindu School, Varanasi, Uttar
Pradesh. We took reading at different days and
different climate condition. In this project many
component is used to install the 25 KW roof top
solar power plants.
2.1 Component description
There is following component which was used
during project work
1. Solar PV modules
2. Mounting structure
3. Array junction box
4. Direct current distribution box
5. Inverter
6. Alternating current distribution box
7. Lightning Arrestors
8. Earthling kit
2.2 Experimental procedure A photovoltaic system on the roof or a photovoltaic
system on the roof is a photovoltaic system that
solar panels produce electricity mounted on the
roof of a building or a residential or commercial
structure. The different components of a system of
this type include photovoltaic modules, mounting
systems, cables and other electrical accessories
solar inverters.
Mounted roof systems are small compared to
photovoltaic plants mounted to the floor with
capacity of megawatt. Photovoltaic systems on the
roof of the overall residential buildings have a
capacity of about 5 to 20 kilowatts (kW), while
those in commercial buildings often reach 100
kilowatts or more.
Other considerations for the installation of
a solar system Although a solar photovoltaic system can produce
electricity through direct sunlight or scattered sun,
but it is very important to assess the amount of
light available where you are installing a solar
photovoltaic system. To collect sunlight to the
maximum the ideal orientation of a solar panel is
facing south. However, a 45 degrees east or west of
the south may also work.
The system should be placed in such a place that
there is no obstruction from trees or adjacent
buildings. In case you have not completed these
requirements, an expert should be hired to do a
detailed analysis of the available light
The roof capacity, where the solar panels will be
installed load must also be performed. Solar panel
structure normally 15 kg per square meter and the
roof must be able to support the load.
2.2.1. Open circuit voltage (voc):- Open circuit
voltage is the electrical potential difference
between two terminals of a device when it is
disconnected from any circuit. No external load
connected. No external electrical current flows
between the terminals. Sometimes the symbol is
given Voc. In this voltage network analysis is also
known that the venin voltage of.
Where
k = Boltzmann constant, T = temperature, and ISC
=short circuit current.
2.2.2. Short circuit current (Isc):- The short-
circuit current is the current through the solar cell
when the voltage across the solar cell is equal to
zero (when the solar cell is short-circuited).
Usually, it is written that the SAI, the short-circuit
current shown in curve IV below.
Fig No.2.1:- Current and Voltage Curve
2.2.3. Efficiency (η)
It is the ratio between the input power output power
to take off the battery and take power output and
maximum power point and the surface of the solar
Imperial Journal of Interdisciplinary Research (IJIR)
Vol-3, Issue-2, 2017
ISSN: 2454-1362, http://www.onlinejournal.in
Imperial Journal of Interdisciplinary Research (IJIR) Page 352
cell as the input source. It depends on various cell
types. For the assessment of the effectiveness of the
module output power divided by the radiation and
the region.
Where
Pin = Radiation * panel area, Vm=maximum
voltage, Im= Maximum current
2.3 Factors affecting the roof area required The extension of the roof area required by a
photovoltaic solar plant depends on two factors
(1)Shade-free roof area
(2)Panel efficiency
(1)Shade-free roof area: - Used roof will not be
evaluated by the impact of the shadows throughout
the year to determine the extent of the area free of
shadows for the installation of a photovoltaic solar
plant on the roof. We insist on the roof area without
shade, like shadows affect the performance of
photovoltaic systems in two ways
Output: - When a shadow falls on a PV panel it
reduces the output from the plant.
Panel damage: - When a shadow falls on a part of
a panel, this part of the panel extends from a
controller in strength and begins heating. This part
of the panel and burn the whole panel must be
replaced. This will not be covered under warranty.
Therefore, it is essential to ensure that no shadow
falls on the photovoltaic system throughout the
year. Shadows falling on the ground can be.
Neighbouring Structures: -Buildings, signs, cell
phone towers, and even trees can cast a shadow on
the roof of a photovoltaic system. In many cities in
the world where residential and commercial
buildings have a number of buildings and other
neighbouring structures, shading analysis will be an
important consideration before estimating the
actual area available for sunroof appearance.
The PV plant itself: -A row of panels can cast a
shadow over the row behind them; further we move
from Ecuador, plus the shadow that is cast and the
amount of space needed between the rows of
panels
(2)Panel efficiency: -Panel footprint efficiency
influences on the roof because the efficiency is
calculated from the area occupied by the panel. A
simple way to understand the relationship between
the efficiency of the panel and roof space is
necessary to remember that a plant on the roof that
uses panels with a rating lower performance will
require more space on the roof of a factory that
uses panels with higher efficiency ratio.
The purpose for which the solar system is
desired
Feeding into the grid: -If the state allows solar
policy, its roof electricity can be supplied to the
network and received based payment to a Feed-in
Tariff- (FIT) or net metering.
Diesel substitution: - The plant will be integrated
with the diesel generator and the power grid to act
as a backup diesel generator and the power grid. In
addition, the investor must be able to switch
between sources. This solution can be quite
complex if multiple diesel generators are used.
Off-grid solution: - It is used in areas where the
electricity grid is absent; this solution requires an
investor outside the network.
Night-Time usage: -As solar energy is generated
during the day, energy storage solutions are
considered part of the roof of the factory.
2.4 Solar PV system sizing
Determine the energy consumption
requirements
The first step in designing a solar photovoltaic
system is to discover the power and total energy
consumption of all charges must be provided by
photovoltaic solar energy system as follows
(1) Total energy requirement / day (Wh) =
Wattage of
appliance x No. of appliance x Hours of
Working
(2) System size = Energy requirement x 1.3 /
Generation
(3) No. of panels = System size / Panel Rating

Imperial Journal of Interdisciplinary Research (IJIR)
Vol-3, Issue-2, 2017
ISSN: 2454-1362, http://www.onlinejournal.in
Imperial Journal of Interdisciplinary Research (IJIR) Page 353
Table 4.10:- PV system sizing and area required
Panel efficiency Rooftop space require (SF) plant capacity
1 KW 2 KW 5 KW 10 KW
12.0% 125 250 625 1250
12.5% 120 240 600 1200
13.0% 115 231 577 1154
13.5% 111 222 566 1111
14.0% 107 214 536 1071
14.5% 103 207 517 1034
15.0% 100 200 500 1000
15.5% 97 194 484 968
16.0% 94 188 469 938
3. Observation table
Table No 3.1 Overall Power Generation in KWh on July
Date Generate Electricity (KWh)
1-Jul-16 52.21
2-Jul-16 45.72
3-Jul-16 34.72
4-Jul-16 57.48
5-Jul-16 68.33
6-Jul-16 69.76
7-Jul-16 52.35
8-Jul-16 64.16
9-Jul-16 58.73
10-Jul-16 62.55
11-Jul-16 47.22
12-Jul-16 24.04
13-Jul-16 40.9
14-Jul-16 29.35
15-Jul-16 14.28
16-Jul-16 19.89
17-Jul-16 24.66
18-Jul-16 61.39
19-Jul-16 56.16
20-Jul-16 61.91
21-Jul-16 57.15
22-Jul-16 48.71
23-Jul-16 27.7
24-Jul-16 20.14
25-Jul-16 30.63
26-Jul-16 33.77
27-Jul-16 29.84
28-Jul-16 47.27
29-Jul-16 57.69

Imperial Journal of Interdisciplinary Research (IJIR)
Vol-3, Issue-2, 2017
ISSN: 2454-1362, http://www.onlinejournal.in
Imperial Journal of Interdisciplinary Research (IJIR) Page 354
30-Jul-16 46.47
31-Jul-16 38.15
TOTAL 1383.33
Graph No. 3.1 Variation in between Date and Generate Electricity (KWh)
Date Generate Electricity (KWh) Solar radiation on inclined solar panel (KW/m2)
1-Jul-16 52.21 4.32
2-Jul-16 45.72 4.14
3-Jul-16 34.72 4.28
4-Jul-16 57.48 4.73
5-Jul-16 68.33 4.45
6-Jul-16 69.76 4.17
7-Jul-16 52.35 4.31
8-Jul-16 64.16 4.79
9-Jul-16 58.73 4.76
10-Jul-16 62.55 5.51
11-Jul-16 47.22 5.18
12-Jul-16 24.04 3.15
13-Jul-16 40.9 4.93
14-Jul-16 29.35 3.18
15-Jul-16 14.28 3.52
16-Jul-16 19.89 3.39
17-Jul-16 24.66 3.47
18-Jul-16 61.39 4.31
19-Jul-16 56.16 4.81
20-Jul-16 61.91 5.28
52,21
45,72
34,72
57,48
68,33 69,76
52,35
64,16
58,73 62,55
47,22
24,04
40,9
29,35
14,28
19,89
24,66
61,39
56,16
61,91
57,15
48,71
27,7
20,14
30,63 33,77
29,84
47,27
57,69
46,47
38,15
0
10
20
30
40
50
60
70
80
Ge
ne
rate
Ele
ctri
city
(K
Wh
)
Date
Generate Electricity (KWh)

Imperial Journal of Interdisciplinary Research (IJIR)
Vol-3, Issue-2, 2017
ISSN: 2454-1362, http://www.onlinejournal.in
Imperial Journal of Interdisciplinary Research (IJIR) Page 355
21-Jul-16 57.15 5.09
22-Jul-16 48.71 4.44
23-Jul-16 27.7 3.67
24-Jul-16 20.14 3.08
25-Jul-16 30.63 4.38
26-Jul-16 33.77 3.65
27-Jul-16 29.84 3.13
28-Jul-16 47.27 4.73
29-Jul-16 57.69 4.86
30-Jul-16 46.47 4.79
31-Jul-16 38.15 4.39
Average 44.62 4.28
Table No. – 3.2 Overall power generation in (KWh) and solar radiation on inclined solar panel (KW /m2)
on July
Graph No. 3.2:- Variation between Generate Electricity (KWh) and solar radiation on inclined solar
panel (KW/m2) on July
4. Result and discussion
4.1 Experimental data
Panel angle is 30o from azimuth
The DCMCB in the array junction box will be of
15 Amp, 1000 V DC
The wire from array junction box to inverter will be
of 16 square mm solar cable.
The AC wire shall be 3.5 core of 16 square mm.
A bi-directional meter before connecting the grid to
ACDB (Alternating current distribution box)
DCDB (Direct current distribution box) – 16 square
mm X 2
ACDB (Alternating current distribution box) – 16
square mm X 4
Neutral – 2.5 square mm X 1
Three wire positive (+ ve), negative (- ve), and
neutral wire from AJB (Array junction box) to
DCDB (Direct current distribution box).
52,21 45,72
34,72
57,48
68,33 69,76
52,35
64,16 58,73
62,55
47,22
24,04
40,9
29,35
14,28 19,89
24,66
61,39 56,16
61,91 57,15
48,71
27,7 20,14
30,63 33,77 29,84
47,27
57,69
46,47 38,15
4,32 4,14 4,28 4,73 4,45 4,17 4,31 4,79 4,76 5,51 5,18 3,15 4,93 3,18 3,52 3,39 3,47 4,31 4,81 5,28 5,09 4,44 3,67 3,08 4,38 3,65 3,13 4,73 4,86 4,79 4,39 0
10
20
30
40
50
60
70
80
Ge
ne
rate
Ele
ctri
city
(K
Wh
)
Date
Variation between Generate Electricity (KWh) and Radiation
(KW/m2)
Generate Electricity (KWh) Radiation (KW/m2)

Imperial Journal of Interdisciplinary Research (IJIR)
Vol-3, Issue-2, 2017
ISSN: 2454-1362, http://www.onlinejournal.in
Imperial Journal of Interdisciplinary Research (IJIR) Page 356
AC input from grid to inverter shall be RYBN.
Total area required 25 KW rooftop power plant is
2500 square feet.
Total number of panel used is 250 Wp X 100 no’s
4.2 Load of project site
Observed the data of electricity consumption from
august 2015 to July 2016.
Electricity consumption
Annual electricity consumption is 131144 KWh.
The total off peak electricity consumption is
114020 KWh and the total electricity consumption
is 29124 KWh. Average electricity monthly
consumption including off peak and peak is
10928.66 KWh.
Monthly electricity consumption
Using data from the monthly electricity bill is
determined by the monthly and annual energy
consumption average. Increasingly possible show
the peak energy consumption and peak hours.
Where, Peak-hour: peak hour is from 6pm to 11pm
and Off-peak hour: off-peak hour is from 12am to
5pm.
The data of monthly average peak and off peak
electricity consumption is given below in table
Table No. 4.1:- Monthly electricity consumption in off peak and peak hour
Month Off peak consumption (kWh) Peak consumption (kWh)
August,2015 10944 1976
September,2015 11096 1976
October,2015 10000 4500
November,2015 9576 4104
December,2015 5928 3040
January,2016 7448 2128
February,2016 7600 1520
March,2016 9576 1976
April,2016 9120 1976
May,2016 10388 2128
June,2016 11704 1976
July,2016 10640 1824
Average 9501.66 2427
0
2000
4000
6000
8000
10000
12000
14000
Au
gust
,2015
Sep
tem
ber
,20
15
Oct
ob
er,2
01
5
Nov
emb
er,2
01
5
Dec
ember
,20
15
Jan
uar
y,2
016
Feb
ruar
y,2
016
Mar
ch,2
016
Ap
ril,
20
16
May
,20
16
June,
20
16
July
,201
6
Off peak consumption
(kWh)
Peak consumption
(kWh)

Imperial Journal of Interdisciplinary Research (IJIR)
Vol-3, Issue-2, 2017
ISSN: 2454-1362, http://www.onlinejournal.in
Imperial Journal of Interdisciplinary Research (IJIR) Page 357
Graph No.4.1:- Monthly electricity consumption in off peak and peak hour.
From the graph we can see that the month of June has the highest energy consumption and -peak October is the
peak power consumption.
Table No 4.2:- Total monthly electricity consumption
Month Energy consumption(KWh)
August,2015 12920
September,2015 13072
October,2015 14500
November,2015 13680
December,2015 8968
January,2016 9576
February,2016 9120
March,2016 11552
April,2016 11096
May,2016 12516
June,2016 13680
July,2016 12464
Total 143144
Graph No. 4.2:- Monthly electricity consumption
From the graph we can see that the month of October has the highest electricity consumption and the month of
June has the lowest electricity consumption.
0
2000
4000
6000
8000
10000
12000
14000
16000
Energy consumption(Kwh)
Energy consumption(Kwh)

Imperial Journal of Interdisciplinary Research (IJIR)
Vol-3, Issue-2, 2017
ISSN: 2454-1362, http://www.onlinejournal.in
Imperial Journal of Interdisciplinary Research (IJIR) Page 358
Table No. 4.3:- Possible impact of the SPV (Simulated)
Month
Radiatio
n/KWh
Monthly
average
Simulated
(KWh)
Electricity
Consumption
(KWh)
Electricity
Amount (Rs.)
Simulated
Impact (KWh)
Amount
Simulated
(Rs.)
Saving
(Rs.)
Jan-15 4.38
4.38*25*3
1 3394.5 9576 75929.2 6181.5 48942.92 26986.28
Feb-15 4.76
4.76*25*2
8 3332 9120 72304 5788 45814.6 26490
Mar-15 4.87
4.87*25*3
1 3774.25 11552 91638.4 7777.75 61633.12 30005.28
Apr-15 4.54
4.54*25*3
0 3405 11096 84984.4 7691 60943.45 24040.95
May-
15 4.27
4.27*25*3
1 3309.25 12516 99302.2 9206.75 72993.67 26308.53
Jun-15 3.78
3.78*25*3
0 2835 13680 108556 10845 86017.75 22538.25
Jul-15 3.32
3.32*25*3
1 2573 12464 98888.8 9891 78433.45 20455.35
Aug-15 3.35
3.35*25*3
1 2596.25 12920 102514 10323.75 81873.81 20640.19
Sep-15 3.98
3.98*25*3
0 2985 13072 103722.4 10087 79991.65 23730.75
Oct-15 4.43
4.43*25*3
1 3433.25 14500 115075 11066.75 87780.67 27294.33
Nov-15 4.36
4.36*25*3
0 3270 13680 108556 10410 82559.5 25996.5
Dec-15 4.21
4.21*25*3
1 3262.75 8968 71095 5705.25 45156.74 25938.26
Average
= 4.18
Total =
38170
Total =
143144
Total =
1132565.4
Total =
104973.25
Total =
832141.33
Total =
300424.67
4.3 Design and load calculation of the project
Fig No. 4.1: - The diagram shows the solar panels are connected to inverters, the current of the inverter
will be supplied to the bus bar, then to the load.
Load
Bus bar
Inverter
Solar panel
Imperial Journal of Interdisciplinary Research (IJIR)
Vol-3, Issue-2, 2017
ISSN: 2454-1362, http://www.onlinejournal.in
Imperial Journal of Interdisciplinary Research (IJIR) Page 359
4.3.1 Load calculation
Rated Voltage (Vmp) = 30.95 V
Rated Current (Imp) = 8.17 A
Total Voltage = 20 * 30.95
= 619 V
Total Current = 5 * 8.17
= 40.85 A
4.4 Capacity utilization factor (C.U.F.)
CUF = Actual energy from the plant (KWh) / Plant capacity (KWp) * 24 * 365
= 38170 KWh / 25w * 24 * 365
= 0.1742
CUF % = 17.42 %
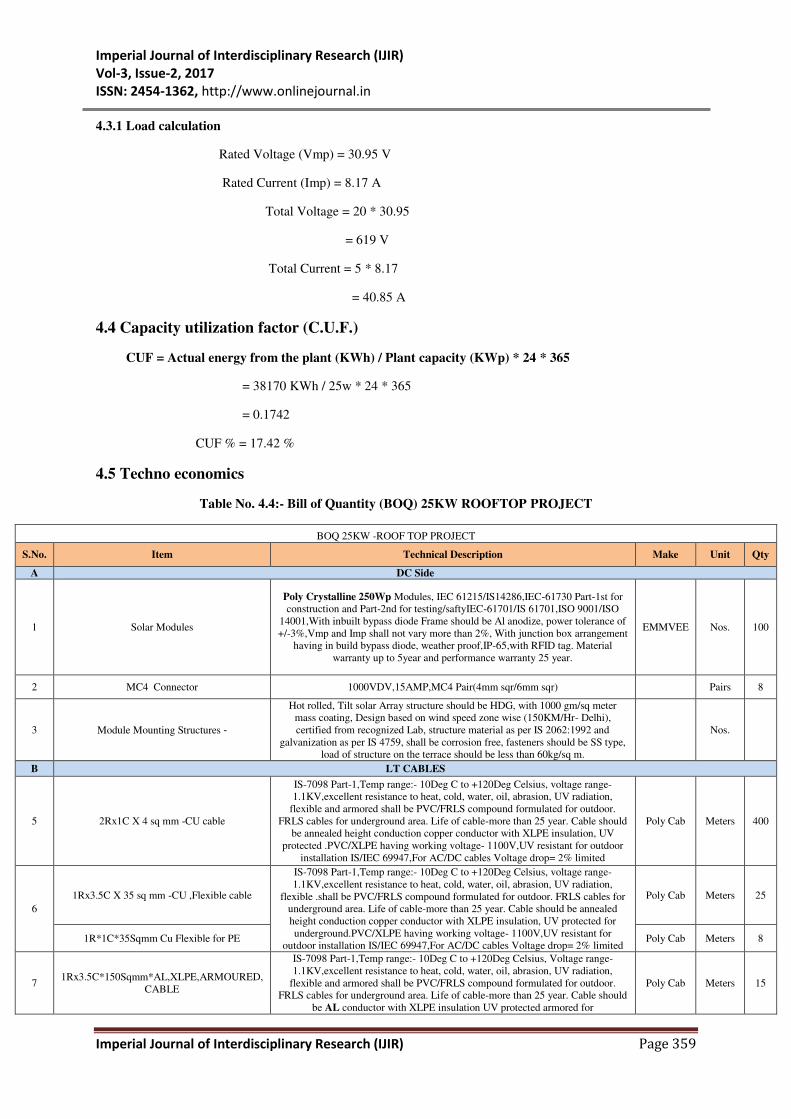
4.5 Techno economics
Table No. 4.4:- Bill of Quantity (BOQ) 25KW ROOFTOP PROJECT
BOQ 25KW -ROOF TOP PROJECT
S.No. Item Technical Description Make Unit Qty
A DC Side
1 Solar Modules
Poly Crystalline 250Wp Modules, IEC 61215/IS14286,IEC-61730 Part-1st for
construction and Part-2nd for testing/saftyIEC-61701/IS 61701,ISO 9001/ISO
14001,With inbuilt bypass diode Frame should be Al anodize, power tolerance of
+/-3%,Vmp and Imp shall not vary more than 2%, With junction box arrangement
having in build bypass diode, weather proof,IP-65,with RFID tag. Material
warranty up to 5year and performance warranty 25 year.
EMMVEE Nos. 100
2 MC4 Connector 1000VDV,15AMP,MC4 Pair(4mm sqr/6mm sqr)
Pairs 8
3 Module Mounting Structures ‐ Hot rolled, Tilt solar Array structure should be HDG, with 1000 gm/sq meter
mass coating, Design based on wind speed zone wise (150KM/Hr- Delhi),
certified from recognized Lab, structure material as per IS 2062:1992 and
galvanization as per IS 4759, shall be corrosion free, fasteners should be SS type,
load of structure on the terrace should be less than 60kg/sq m.
Nos.
B LT CABLES
5 2Rx1C X 4 sq mm -CU cable
IS-7098 Part-1,Temp range:- 10Deg C to +120Deg Celsius, voltage range-
1.1KV,excellent resistance to heat, cold, water, oil, abrasion, UV radiation,
flexible and armored shall be PVC/FRLS compound formulated for outdoor.
FRLS cables for underground area. Life of cable-more than 25 year. Cable should
be annealed height conduction copper conductor with XLPE insulation, UV
protected .PVC/XLPE having working voltage- 1100V,UV resistant for outdoor
installation IS/IEC 69947,For AC/DC cables Voltage drop= 2% limited
Poly Cab Meters 400
6
1Rx3.5C X 35 sq mm -CU ,Flexible cable
IS-7098 Part-1,Temp range:- 10Deg C to +120Deg Celsius, voltage range-
1.1KV,excellent resistance to heat, cold, water, oil, abrasion, UV radiation,
flexible .shall be PVC/FRLS compound formulated for outdoor. FRLS cables for
underground area. Life of cable-more than 25 year. Cable should be annealed
height conduction copper conductor with XLPE insulation, UV protected for
underground.PVC/XLPE having working voltage- 1100V,UV resistant for
outdoor installation IS/IEC 69947,For AC/DC cables Voltage drop= 2% limited
Poly Cab Meters 25
1R*1C*35Sqmm Cu Flexible for PE Poly Cab Meters 8
7 1Rx3.5C*150Sqmm*AL,XLPE,ARMOURED,
CABLE
IS-7098 Part-1,Temp range:- 10Deg C to +120Deg Celsius, Voltage range-
1.1KV,excellent resistance to heat, cold, water, oil, abrasion, UV radiation,
flexible and armored shall be PVC/FRLS compound formulated for outdoor.
FRLS cables for underground area. Life of cable-more than 25 year. Cable should
be AL conductor with XLPE insulation UV protected armored for
Poly Cab Meters 15

Imperial Journal of Interdisciplinary Research (IJIR)
Vol-3, Issue-2, 2017
ISSN: 2454-1362, http://www.onlinejournal.in
Imperial Journal of Interdisciplinary Research (IJIR) Page 360
1Rx3.5C*185Sqmm*AL,XLPE,ARMOURED,
CABLE
underground.PVC/XLPE having working voltage- 1100V,UV resistant for
outdoor installation IS/IEC 69947,For AC/DC cables Voltage drop= 2% limited Poly Cab Meters 15
D OTHER
9 Cable Lugs - 4 Sq mm Copper coated, Ring Type Dowels Nos. 15
10 Cable Lugs - 35 Sq mm Copper coated, Ring Type Dowels Nos. 4
11 Cable Lugs - 150Sq mm AL coated, Ring Type Dowels Nos. 8
12 Cable Lugs - 185Sq mm AL coated, Ring Type Dowels Nos. 8
13 HDPE 25Sqmm
HDPE Pipes
Beria (UV
Protected)
Meters 250
L-JOINT Nos. 50
T-JOINT Nos. 25
LONG BAND Nos. 25
STRAIGHT JOINT Nos. 20
4-SIDDER JOINT Nos. 20
Saddle Nos. 375
14 Flexible Pipe 25Sqmm
Meters 50
15 Cable Ties Nylon 66 UL94V-2, 4.2 X 300mm Thickness(100 Nos. in one packet)
Packets 5
16 Ferrules 0 to 9 (Each letter is hundred in one packet)
Packets 5
a to z (Each letter is hundred in one packet)
Packets 5
17 Danger Board Size :- 8"x6"(Inch)
Nos. 1
18 Fire Extinguisher 4KG
Nos. 3
19 Buckets with stand Soiled buckets
Nos. 3
20 Radium sticker for marking at Inverter / LT
panel/Cable
Inverter-Red
Nos. 2
ACDB-Green
Nos. 1
Cable-Yellow
Nos. 15
21 Inverter canopy Will decide as per location and size or area available
Nos. 2
22 Inverter Stand Will decide as per location and size or area available
Nos. 2
E INVERTER
1 Grid Inverter -25KW
House MPPT,DG set interactive, output should compatible with grid frequency
IGBT/MOSFET,Microprodessor,DSP,415V,3-Phase,50Hz +/-3%,Ambient tem -
20 deck to +50Deg,Humidity 95%, Protection IP-20 for indoor and IP-65
outdoor, grid voltage tolerance -20% to +15%, No load losses lees then 1% of
rated power, efficiency 93% or above, THD less then 3%,P.F more than 0.9,fully
automatic having internal protections against any fault in feeder Built-in meter
and data logger to monitor plant, inverter design as per IEC/BIS standard for
efficiency and environmental tests as per IEC 61683/IS 61683 and IEC 60068-2
(1,2,14,30).MPPT as per IEC 60068-2(1,2,14,30)/Disjunction box should be IP-
65 for outdoor and IP 55 for indoor as per IEC 529.Inverter should be grid as well
as DG integrated.
delta Nos. 1
2 Scads
Portal from SMA Separate for each plat, provision for plant control/monitoring,
time and data stamped, high quality analysis, metering and instrumentation for
display of system parameter, to measure solar radiation by integrating
pyranometer (Class II or better)with sensor mounted, temperature indicating. It
should be display AC voltage/AC output current/power/P.F/DC input
voltage/Current/Time activity/disabled/time idle/power production. Protection
function limit (AC over voltage AC under voltage, over frequency, under
frequency, ground fault PV starting voltage PV stopping voltage, over current,
short circuit etc digital display to see parameters logging facility DC string/Array
monitoring AC output monitoring time interval not more than 15 Minute, real
time clock, battery backup up to 2 hours, compute data in excel format,
instantaneous data shown on computer screen, provision for intern ate monitoring
also centralize internet monitoring.
delta Nos. 1
3 Communication Cable Mob’s RTU over RS 485 Physical layer
Meters 25
F AC Side
1 ACDB Panel With MCCB protections/SPD
along with stand.
(ACDB control AC power from PCU having surge arrestor. All
switched/CB/connectors as per IEC 60947, part I, II, III/ IS 60947 part I, II and
III. Panel shall be metal clad, enclosed rigid, floor mounted, air insulated, cubical
type and to support to 415 Volts,50Hz.Desing for ambient temperature of 45
degree Celsius,80% humidity and dusty weather,IP-65,Volage +/-10% and
frequency +/-3% vary.
Nos. 1
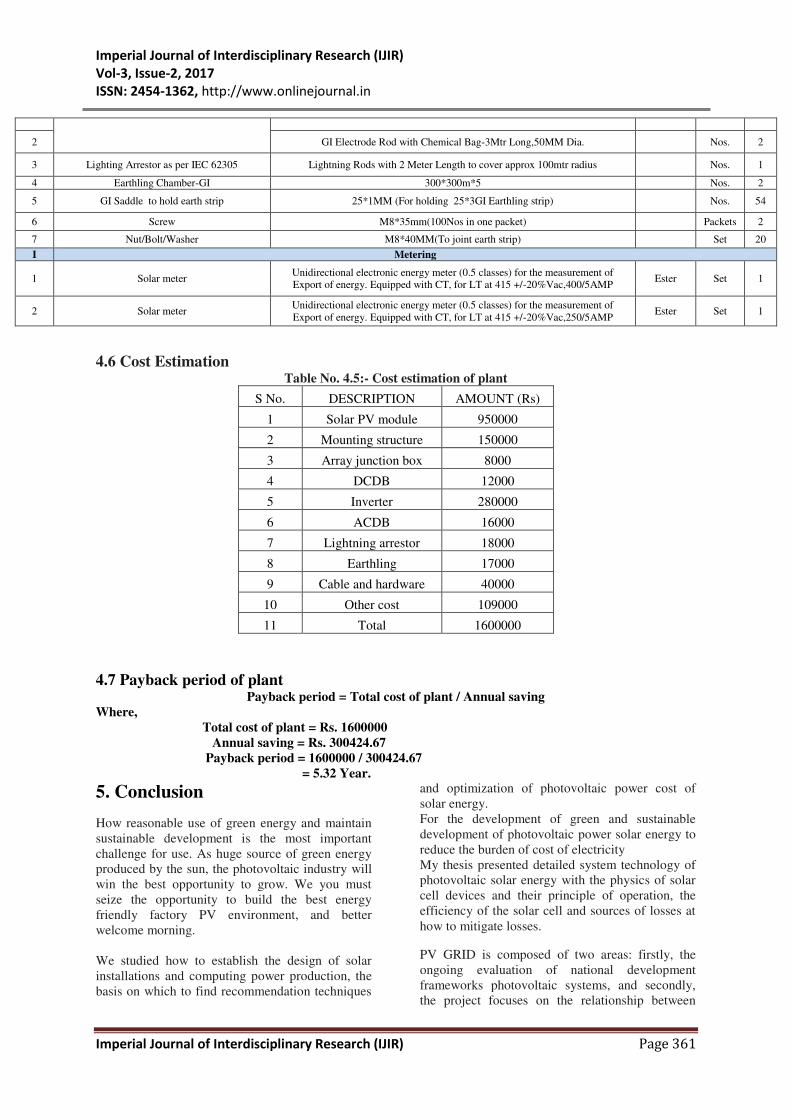
H Protections
1 Earthling as per IS: 3043-1987. GI Strip 25X3 mm
Meters 150
Imperial Journal of Interdisciplinary Research (IJIR)
Vol-3, Issue-2, 2017
ISSN: 2454-1362, http://www.onlinejournal.in
Imperial Journal of Interdisciplinary Research (IJIR) Page 361
2 GI Electrode Rod with Chemical Bag-3Mtr Long,50MM Dia.
Nos. 2
3 Lighting Arrestor as per IEC 62305 Lightning Rods with 2 Meter Length to cover approx 100mtr radius
Nos. 1
4 Earthling Chamber-GI 300*300m*5
Nos. 2
5 GI Saddle to hold earth strip 25*1MM (For holding 25*3GI Earthling strip)
Nos. 54
6 Screw M8*35mm(100Nos in one packet)
Packets 2
7 Nut/Bolt/Washer M8*40MM(To joint earth strip)
Set 20
I Metering
1 Solar meter Unidirectional electronic energy meter (0.5 classes) for the measurement of
Export of energy. Equipped with CT, for LT at 415 +/-20%Vac,400/5AMP Ester Set 1
2 Solar meter Unidirectional electronic energy meter (0.5 classes) for the measurement of
Export of energy. Equipped with CT, for LT at 415 +/-20%Vac,250/5AMP Ester Set 1
4.6 Cost Estimation Table No. 4.5:- Cost estimation of plant
S No. DESCRIPTION AMOUNT (Rs)
1 Solar PV module 950000
2 Mounting structure 150000
3 Array junction box 8000
4 DCDB 12000
5 Inverter 280000
6 ACDB 16000
7 Lightning arrestor 18000
8 Earthling 17000
9 Cable and hardware 40000
10 Other cost 109000
11 Total 1600000
4.7 Payback period of plant Payback period = Total cost of plant / Annual saving
Where,
Total cost of plant = Rs. 1600000
Annual saving = Rs. 300424.67
Payback period = 1600000 / 300424.67
= 5.32 Year. 5. Conclusion
How reasonable use of green energy and maintain
sustainable development is the most important
challenge for use. As huge source of green energy
produced by the sun, the photovoltaic industry will
win the best opportunity to grow. We you must
seize the opportunity to build the best energy
friendly factory PV environment, and better
welcome morning.
We studied how to establish the design of solar
installations and computing power production, the
basis on which to find recommendation techniques
and optimization of photovoltaic power cost of
solar energy.
For the development of green and sustainable
development of photovoltaic power solar energy to
reduce the burden of cost of electricity
My thesis presented detailed system technology of
photovoltaic solar energy with the physics of solar
cell devices and their principle of operation, the
efficiency of the solar cell and sources of losses at
how to mitigate losses.
PV GRID is composed of two areas: firstly, the
ongoing evaluation of national development
frameworks photovoltaic systems, and secondly,
the project focuses on the relationship between

Imperial Journal of Interdisciplinary Research (IJIR)
Vol-3, Issue-2, 2017
ISSN: 2454-1362, http://www.onlinejournal.in
Imperial Journal of Interdisciplinary Research (IJIR) Page 362
certain legal, regulatory and policy frameworks and
available technical solutions identified to increase
the distribution of accommodation capacity. The
second area of activity largely due to the fact that
the predecessor GRID PV project PV Legal, who
had already assessed the national PV development
frameworks and procedures and focus on the
obstacles arising from legal and administrative
actions identified related grid obstacles that one of
the main groups of barriers to the development of
PV. For this reason, the PV GRID focused on the
improving the accommodation capacity of PV in
distribution networks while overcoming regulatory
barriers and regulations that hinder application of
technical solutions available.
6. References
MNRE. “Jawaharlal Nehru National Solar Mission (JNNSM): Towards building a
Solar India.”
http://www.mnre.gov.in/fileanager/UserFi
les/mission_document_JNNSM.pdf.
Accessed 20 Apr 2014 Engelmeier,T, Anand,M, Khurana,J,
Goel,P and Loond,T, “Rooftop Revolution: Unleashing Delhi's Solar
Potential”, Greenpeace India, New Delhi, 2013.
First Green Consulting Pvt Ltd, “Rooftop Solar Markets: Policy trends and issues”, New Delhi, 2014.
http://www.firstgreen.co/wp-
content/uploads/2014/02/Rooftop-Solar-
Markets.pdf . Accessed 21 Jun 2014 Indian Power Sector, “New Project
Sanctions under the MNRE Subsidy
Scheme Unlikely This Year”, 2013. http://indianpowersector.com/home/2013/
08/new- project-sanctions-under-the-
mnre-subsidy-scheme-unlikely-this-year/
Accessed 10 Jun 2014. DERC, “Proposal on net metering &
connectivity in respect of rooftop solar PV
projects”, 2013. http://www.indiaenvironmentportal.org.in/
files/file/DERC%20Net%20Metering%20
Proposal.pdf . Accessed 10 Feb 2014. Rohit Pandey, Dr. M.K Gaur, Dr. C.S.
Malvi. 2012. “Estimation of cost analysis for 4 kW grids connected solar
photovoltaic plant”. IJMER, vol.2, Maxis Power Solutions, “ Capital cost of
solar system”, 2014. http://www.maxisindia.com/2_5kWp-solar
system/117/22 . Accessed 29 July 2014. Solar Energy Centre, “Solar Radiation
Handbook”, MNRE and Indian Metrological Department, New Delhi,
2008.
http://www.indiaenvironmentportal.org.in/
files/srd-sec.pdf . Accessed 10 June 2014. Bridge to India, “ India Solar Handbook”,
New Delhi, 2014. G.D.Rai, Solar Energy Utilization, 5
th
Edition, Khanna Publishers. Renewable
Energy Akshay Urja Vol. 3 Issue 1, Jan-
Feb, 2007. S. Hasan Saeed & D.K. Sharma, Non-
Conventional Energy Resources, 1st
Edition. A Guide to Grid-Connected Photovoltaic
Systems prepared by Cape & Islands Self-
Reliance.
![R410A Tropical (25kW-250kW) 50Hz 2013 - MiracoMCAC-2012-08]R410a … · MCAC-2012-08 AIR-COOLED SCROLL MODULAR CHILLER R410A Tropical (25kW-250kW) 50Hz 2013 Commercial Air Conditioner](https://img.dokumen.tips/doc/110x75/5ad5cf287f8b9a177c8d7961/r410a-tropical-25kw-250kw-50hz-2013-mcac-2012-08r410a-mcac-2012-08-air-cooled.jpg)