Embed Size (px)
Citation preview

Romania: Financial sector
Liviu Voinea Deputy Governor
Bucharest, 15 March 2017
2
The role of National Bank of Romania
• The role of Central Banks: secure price stability; additionally, secure
financial stability and exchange rate stability
• NBR has reached all three stabilities
Price stability
• Interest rates
historically low
• Low inflation, not
deflation
Financial stability
• Reduced risk of
legislative uncertainty
• Banking sector has
been consolidated
• NPL ratio
• No use of public
money to save banks
Exchange rate
stability
• Higher net
international
reserves
• Low volatility of the
exchange rate
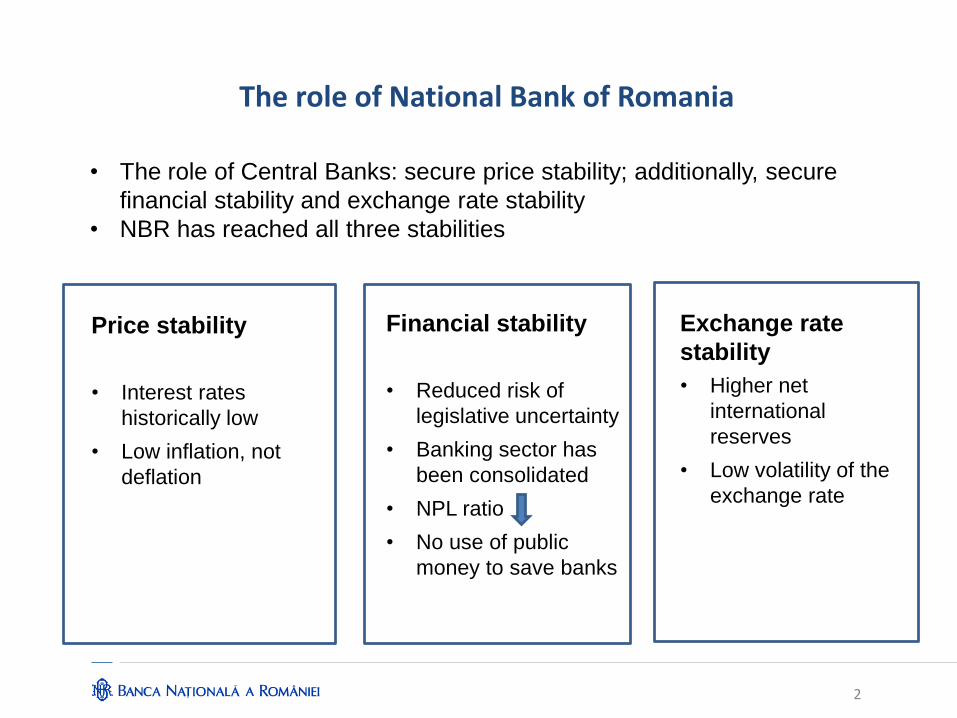
I.1. Low inflation, not deflation
Inflation rate
Source: NBR
3
-4
-2
0
2
4
6
8
10
12
Mar
-05
Sep
-05
Mar
-06
Sep
-06
Mar
-07
Sep
-07
Mar
-08
Sep
-08
Mar
-09
Sep
-09
Mar
-10
Sep
-10
Mar
-11
Sep
-11
Mar
-12
Sep
-12
Mar
-13
Sep
-13
Mar
-14
Sep
-14
Mar
-15
Sep
-15
Mar
-16
Sep
-16
Inflation rateInflation rate excluding the first-round effects of VAT rate changesInflation targetLower bound of inflation target bandUpper bound of inflation target band
percent
I. Price stability
Negative inflation was driven by fiscal
measures, while inflation excluding VAT cuts remained close to
our target band
-1.5
-1.0
-0.5
0.0
0.5
1.0
1.5
2.0
ian
.-1
4
mai
.-1
4
sep
.-1
4
ian
.-1
5
mai
.-1
5
sep
.-1
5
ian
.-1
6
mai
.-1
6
sep
.-1
6
CZ HU PL
percent

4
Inflation has re-entered into the positive territory
-4
-2
0
2
4
6
8
10
12
-4
-2
0
2
4
6
8
10
12
2014Q4
2015Q4
2016Q4
2017Q4
2018Q4
uncertainty interval
annual CPI inflation rate (previous round)
annual CPI inflation rate (net of the VATfirst-round effect)
annual CPI inflation rate
annual percentage change
Inflation target: 2.5 1pp
annual percentage change
Note: According to the February 2017 Inflation Report. The uncertainty interval was calculated based on the forecast errors in the NBR
projections during 2005-2016. The magnitude of forecast errors is positively correlated with the time horizon they refer to.
Source: National Institute of Statistics, National Bank of Romania projections and calculations
Inflation Forecast
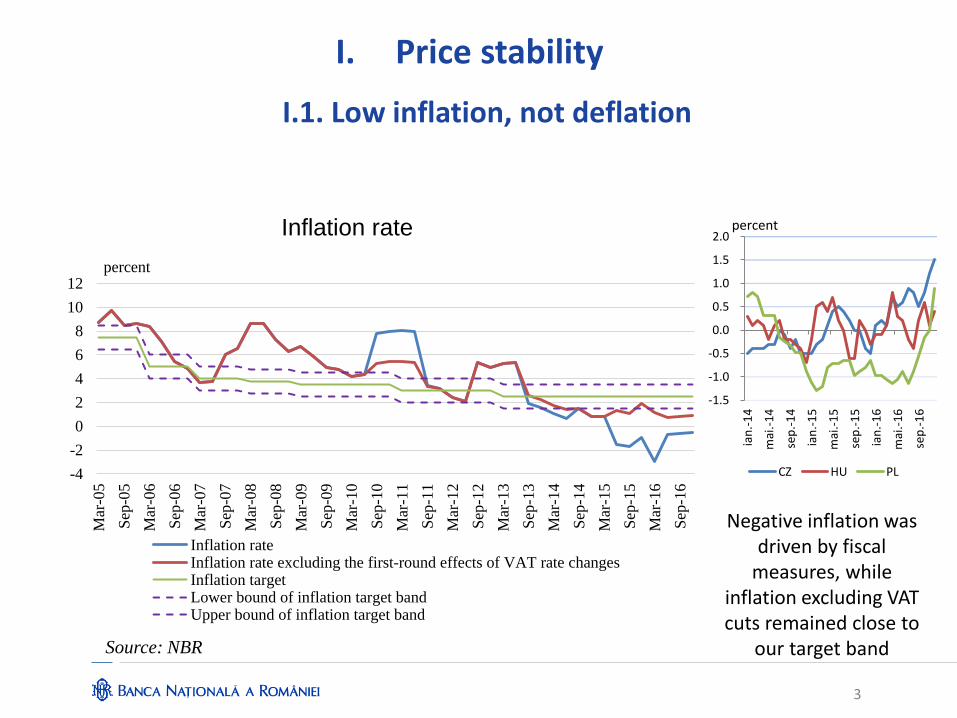
I.2. Favourable monetary conditions:
Monetary policy rate at historical lows
Central bank’s interest rates
Source: NBR
5
Minimum reserve requirements
0
2
4
6
8
10
12
14
16
Jan-0
9
Jul-
09
Jan-1
0
Jul-
10
Jan-1
1
Jul-
11
Jan-1
2
Jul-
12
Jan-1
3
Jul-
13
Jan-1
4
Jul-
14
Jan-1
5
Jul-
15
Jan-1
6
Jul-
16
Jan-1
7
Lombard rate Deposit facility rate Key policy rate
percent
0
5
10
15
20
25
30
35
40
45
Jan-0
9
Jul-
09
Jan-1
0
Jul-
10
Jan
-11
Jul-
11
Jan-1
2
Jul-
12
Jan-1
3
Jul-
13
Jan-1
4
Jul-
14
Jan-1
5
Jul-
15
Jan-1
6
Jul-
16
Jan-1
7
Local currency Foreign currency
percent
6
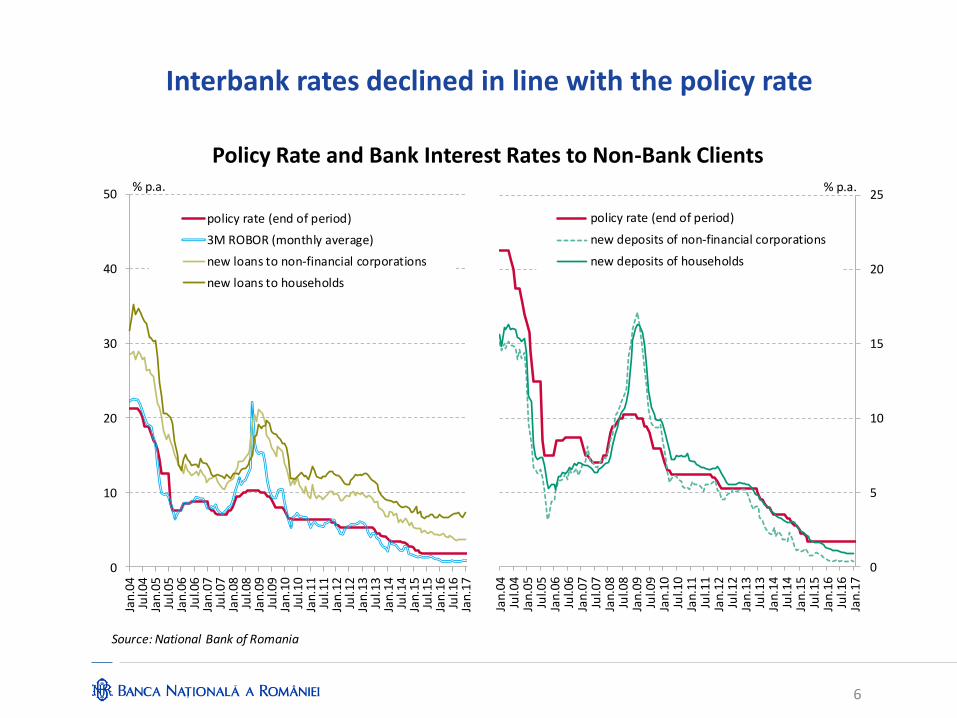
Interbank rates declined in line with the policy rate
Policy Rate and Bank Interest Rates to Non-Bank Clients
0
10
20
30
40
50
Jan
.04
Jul.0
4Ja
n.0
5Ju
l.05
Jan
.06
Jul.0
6Ja
n.0
7Ju
l.07
Jan
.08
Jul.0
8Ja
n.0
9Ju
l.09
Jan
.10
Jul.1
0Ja
n.1
1Ju
l.11
Jan
.12
Jul.1
2Ja
n.1
3Ju
l.13
Jan
.14
Jul.1
4Ja
n.1
5Ju
l.15
Jan
.16
Jul.1
6Ja
n.1
7
policy rate (end of period)
3M ROBOR (monthly average)
new loans to non-financial corporations
new loans to households
% p.a.
0
5
10
15
20
25
Jan.
04Ju
l.04
Jan.
05Ju
l.05
Jan.
06Ju
l.06
Jan.
07Ju
l.07
Jan.
08Ju
l.08
Jan.
09Ju
l.09
Jan.
10Ju
l.10
Jan.
11Ju
l.11
Jan.
12Ju
l.12
Jan.
13Ju
l.13
Jan.
14Ju
l.14
Jan.
15Ju
l.15
Jan.
16Ju
l.16
Jan.
17
policy rate (end of period)
new deposits of non-financial corporations
new deposits of households
% p.a.
Source: National Bank of Romania
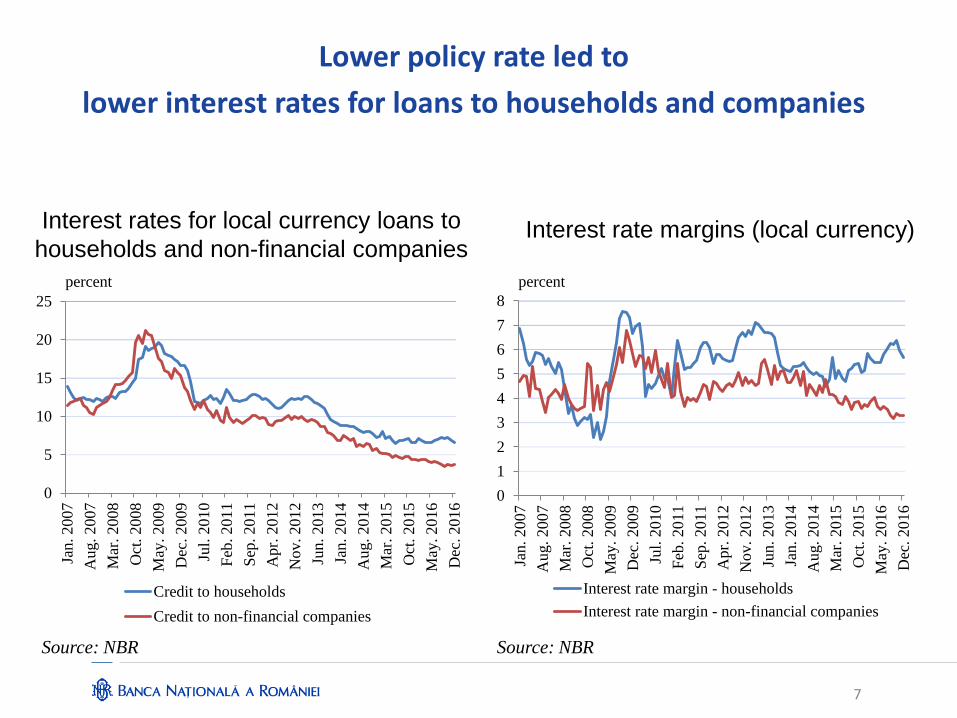
Lower policy rate led to
lower interest rates for loans to households and companies
Interest rates for local currency loans to
households and non-financial companies
Source: NBR
7
0
5
10
15
20
25
Jan. 2007
Aug. 2007
Mar
. 2008
Oct
. 2008
May
. 2009
Dec
. 2009
Jul.
2010
Feb
. 2011
Sep
. 2011
Apr.
2012
Nov. 2012
Jun. 2013
Jan. 2014
Aug. 2014
Mar
. 2015
Oct
. 2015
May
. 2016
Dec
. 2016
Credit to households
Credit to non-financial companies
percent
0
1
2
3
4
5
6
7
8
Jan. 2007
Aug. 2007
Mar
. 2008
Oct
. 2008
May
. 2009
Dec
. 2009
Jul.
2010
Feb
. 2011
Sep
. 2011
Apr.
2012
Nov. 2012
Jun. 2013
Jan. 2014
Aug. 2014
Mar
. 2015
Oct
. 2015
May
. 2016
Dec
. 2016
Interest rate margin - households
Interest rate margin - non-financial companies
percent
Source: NBR
Interest rate margins (local currency)
8
II. Financial stability II.1. Reducing the risk of legislative uncertainty
• Datio in solutum (giving in payment) law
NBR warned repeatedly, through all Executive Board members, against the negative impact
of this law on financial stability.
BNR intervened in this debate because it answered to the requests from the President and
Parliament.
Financial Stability Report 1/2016 considered legislative uncertainty as a severe systemic
risk.
Three amendments proposed by NBR were adopted, limiting the amount and destination of
loans, and excluding First House loans.
Other amendments proposed by NBR referring to loan to value and debt service to income
limits were rejected.
NBR’s position was aimed at preserving financial stability, while making sure that the law
helped only those debtors who could not afford to pay anymore, not those who didn’t want to
pay anymore.
II.1. Reducing the risk of legislative uncertainty
• Datio in solutum law (cont.)
The Constitutional Court decided that the law must respect the Civil Code, so the debtor
must prove that: he/she entered into default because of unpredictable circumstances (the
debtor can’t pay); and that he/she tried to settle with the bank; and a court of law must
decide that.
Therefore, the law is no longer a loss event for banks at the moment of adoption, but only
on a case by case situation, when a court decides so. Losses are phased-out over many
years.
However, problems remain: debt does not go away, and the need for a solution remains.
There is no standard for what unpredictable means (what is the trigger?)
Common understanding and common practice is still needed.
9
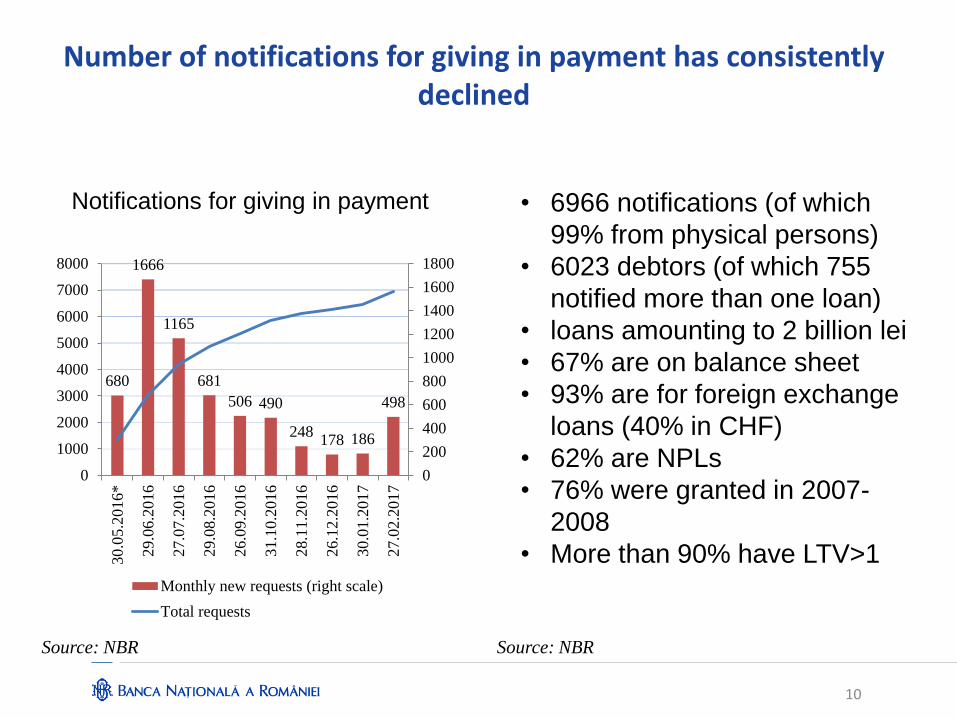
Number of notifications for giving in payment has consistently declined
Notifications for giving in payment
Source: NBR
10
Source: NBR
680
1666
1165
681
506 490
248 178 186
498
0
200
400
600
800
1000
1200
1400
1600
1800
0
1000
2000
3000
4000
5000
6000
7000
8000
30.0
5.2
016*
29.0
6.2
016
27.0
7.2
016
29.0
8.2
016
26.0
9.2
016
31.1
0.2
016
28.1
1.2
016
26.1
2.2
016
30.0
1.2
017
27.0
2.2
017
Monthly new requests (right scale)
Total requests
• 6966 notifications (of which
99% from physical persons)
• 6023 debtors (of which 755
notified more than one loan)
• loans amounting to 2 billion lei
• 67% are on balance sheet
• 93% are for foreign exchange
loans (40% in CHF)
• 62% are NPLs
• 76% were granted in 2007-
2008
• More than 90% have LTV>1
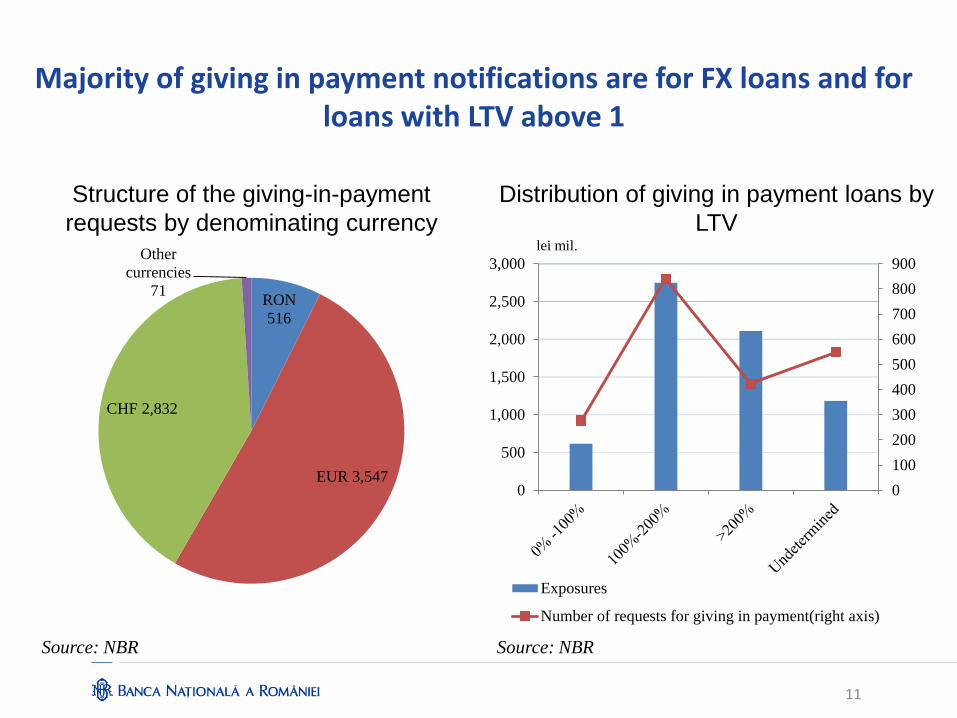
Majority of giving in payment notifications are for FX loans and for loans with LTV above 1
Structure of the giving-in-payment
requests by denominating currency
Source: NBR
11
Source: NBR
Distribution of giving in payment loans by
LTV
RON
516
EUR 3,547
CHF 2,832
Other
currencies
71
0
100
200
300
400
500
600
700
800
900
0
500
1,000
1,500
2,000
2,500
3,000
Exposures
Number of requests for giving in payment(right axis)
lei mil.
II.1. Reducing the risk of legislative uncertainty (cont.)
• CHF conversion law
The CHF conversion law was adopted by the Parliament, but the Constitutional
Court decided that the law is not constitutional.
The NBR advocated for a bilateral negotiation between banks and debtors with CHF
loans. One size fits all is not the best option, each particular case requires individual
solution.
As of December 2016:
• 38519 CHF debtors (vs. 75412 at end-2014)
• Volume: 5.4 billion lei (vs. 10 bn. At end-2014)
• 40% not backed by mortgages
Since January 2015, banks received 59411 requests from debtors regarding CHF
loans, of which they admitted 37366 (62.9%): 24853 conversions and 12513
restructurings.
12
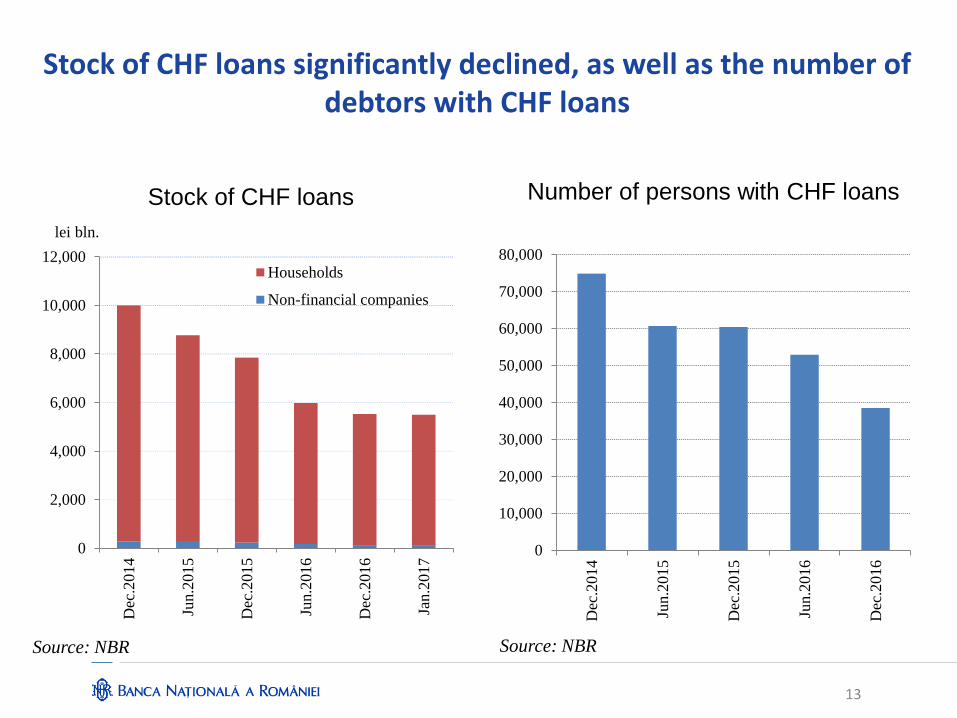
Stock of CHF loans significantly declined, as well as the number of debtors with CHF loans
Stock of CHF loans Number of persons with CHF loans
Source: NBR Source: NBR
13
0
2,000
4,000
6,000
8,000
10,000
12,000
Dec
.20
14
Jun.2
015
Dec
.2015
Jun.2
016
Dec
.2016
Jan.2
017
Households
Non-financial companies
lei bln.
0
10,000
20,000
30,000
40,000
50,000
60,000
70,000
80,000
Dec
.2014
Jun.2
015
Dec
.2015
Jun.2
016
Dec
.2016
14
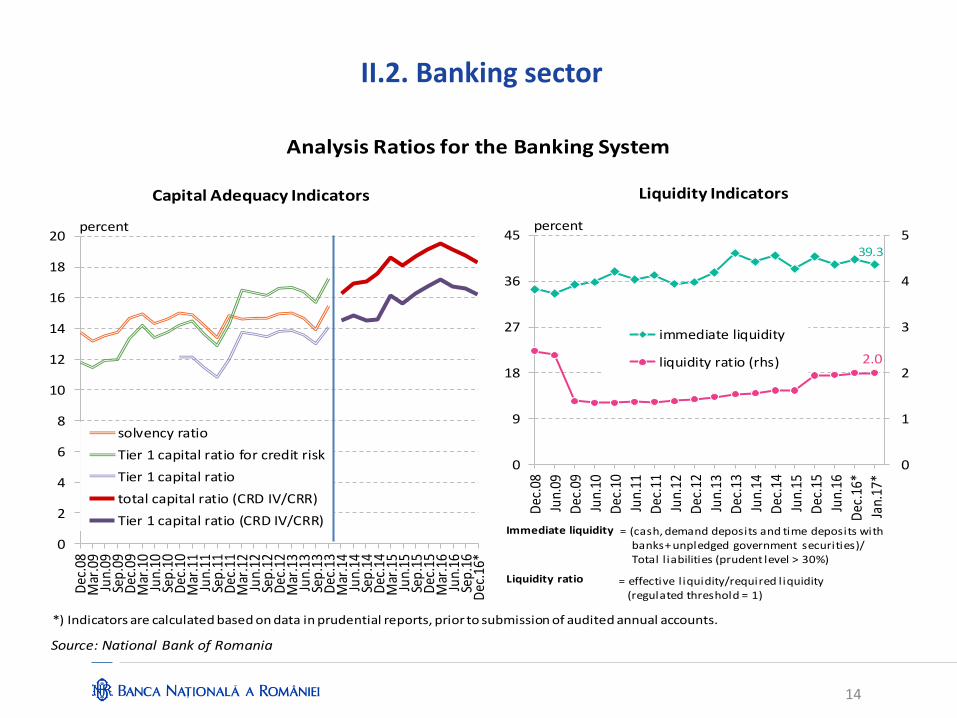
II.2. Banking sector
0
2
4
6
8
10
12
14
16
18
20
Dec
.08
Mar
.09
Jun.
09Se
p.09
Dec
.09
Mar
.10
Jun.
10Se
p.10
Dec
.10
Mar
.11
Jun.
11Se
p.11
Dec
.11
Mar
.12
Jun.
12Se
p.12
Dec
.12
Mar
.13
Jun.
13Se
p.13
Dec
.13
Mar
.14
Jun.
14Se
p.14
Dec
.14
Mar
.15
Jun.
15Se
p.15
Dec
.15
Mar
.16
Jun.
16Se
p.16
Dec
.16*
solvency ratio
Tier 1 capital ratio for credit risk
Tier 1 capital ratio
total capital ratio (CRD IV/CRR)
Tier 1 capital ratio (CRD IV/CRR)
percent
Source: National Bank of Romania
39.3
2.0
0
1
2
3
4
5
0
9
18
27
36
45
Dec
.08
Jun.
09
Dec
.09
Jun.
10
Dec
.10
Jun.
11
Dec
.11
Jun.
12
Dec
.12
Jun.
13
Dec
.13
Jun.
14
Dec
.14
Jun.
15
Dec
.15
Jun.
16
Dec
.16*
Jan.
17*
immediate liquidity
liquidity ratio (rhs)
percent
Liquidity Indicators
Immediate liquidity = (cash, demand deposits and time deposits withbanks+ unpledged government securities)/Total l iabilities (prudent level > 30%)
Liquidity ratio = effective l iquidity/required liquidity(regulated threshold = 1)
Capital Adequacy Indicators
Analysis Ratios for the Banking System
*) Indicators are calculated based on data in prudential reports, prior to submission of audited annual accounts.
15
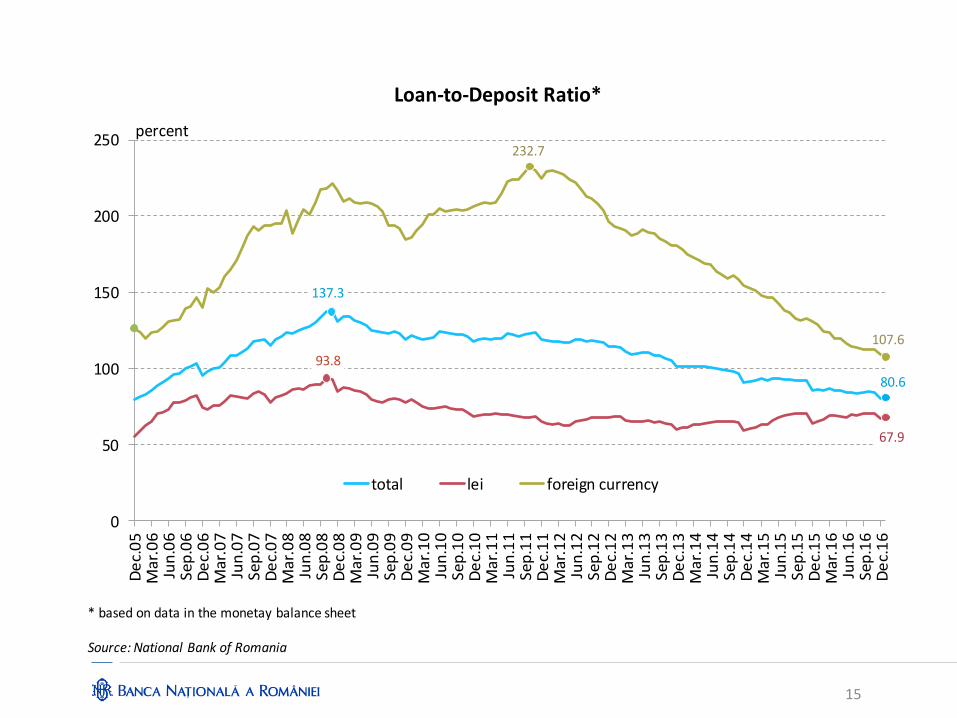
137.3
80.6
93.8
67.9
232.7
107.6
0
50
100
150
200
250D
ec.
05
Mar
.06
Jun
.06
Sep
.06
De
c.0
6M
ar.0
7Ju
n.0
7Se
p.0
7D
ec.
07
Mar
.08
Jun
.08
Sep
.08
De
c.0
8M
ar.0
9Ju
n.0
9Se
p.0
9D
ec.
09
Mar
.10
Jun
.10
Sep
.10
De
c.1
0M
ar.1
1Ju
n.1
1Se
p.1
1D
ec.
11
Mar
.12
Jun
.12
Sep
.12
De
c.1
2M
ar.1
3Ju
n.1
3Se
p.1
3D
ec.
13
Mar
.14
Jun
.14
Sep
.14
De
c.1
4M
ar.1
5Ju
n.1
5Se
p.1
5D
ec.
15
Mar
.16
Jun
.16
Sep
.16
De
c.1
6
total lei foreign currency
Loan-to-Deposit Ratio*
percent
* based on data in the monetay balance sheet
Source: National Bank of Romania
16
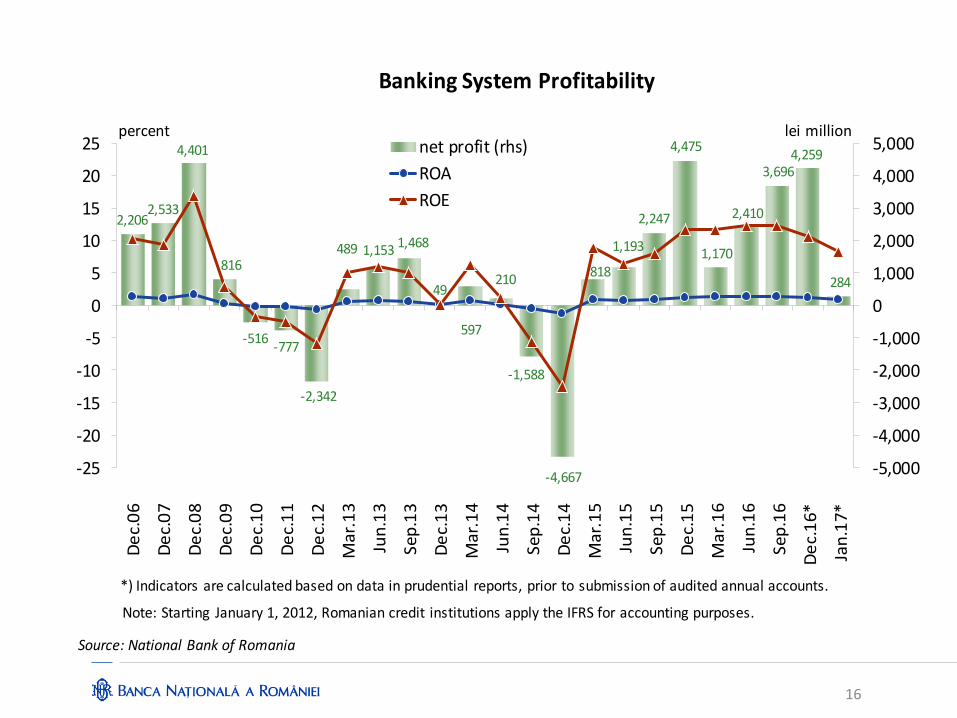
2,2062,533
4,401
816
-516-777
-2,342
489 1,1531,468
49
597
210
-1,588
-4,667
818
1,193
2,247
4,475
1,170
2,410
3,6964,259
284
-5,000
-4,000
-3,000
-2,000
-1,000
0
1,000
2,000
3,000
4,000
5,000
-25
-20
-15
-10
-5
0
5
10
15
20
25D
ec.
06
De
c.0
7
De
c.0
8
De
c.0
9
De
c.1
0
De
c.1
1
De
c.1
2
Mar
.13
Jun
.13
Sep
.13
De
c.1
3
Mar
.14
Jun
.14
Sep
.14
De
c.1
4
Mar
.15
Jun
.15
Sep
.15
De
c.1
5
Mar
.16
Jun
.16
Sep
.16
De
c.1
6*
Jan
.17*
net profit (rhs)
ROA
ROE
Banking System Profitability
percent lei million
Note: Starting January 1, 2012, Romanian credit institutions apply the IFRS for accounting purposes.
Source: National Bank of Romania
*) Indicators are calculated based on data in prudential reports, prior to submission of audited annual accounts.
-20
-10
0
10
20
30
40
50
60
70
80
90
100
Jan.
06M
ay.0
6Se
p.0
6Ja
n.07
May
.07
Sep
.07
Jan.
08M
ay.0
8Se
p.0
8Ja
n.09
May
.09
Sep
.09
Jan.
10M
ay.1
0Se
p.1
0Ja
n.11
May
.11
Sep
.11
Jan.
12M
ay.1
2Se
p.1
2Ja
n.13
May
.13
Sep
.13
Jan.
14M
ay.1
4Se
p.1
4Ja
n.15
May
.15
Sep
.15
Jan.
16M
ay.1
6Se
p.1
6Ja
n.17
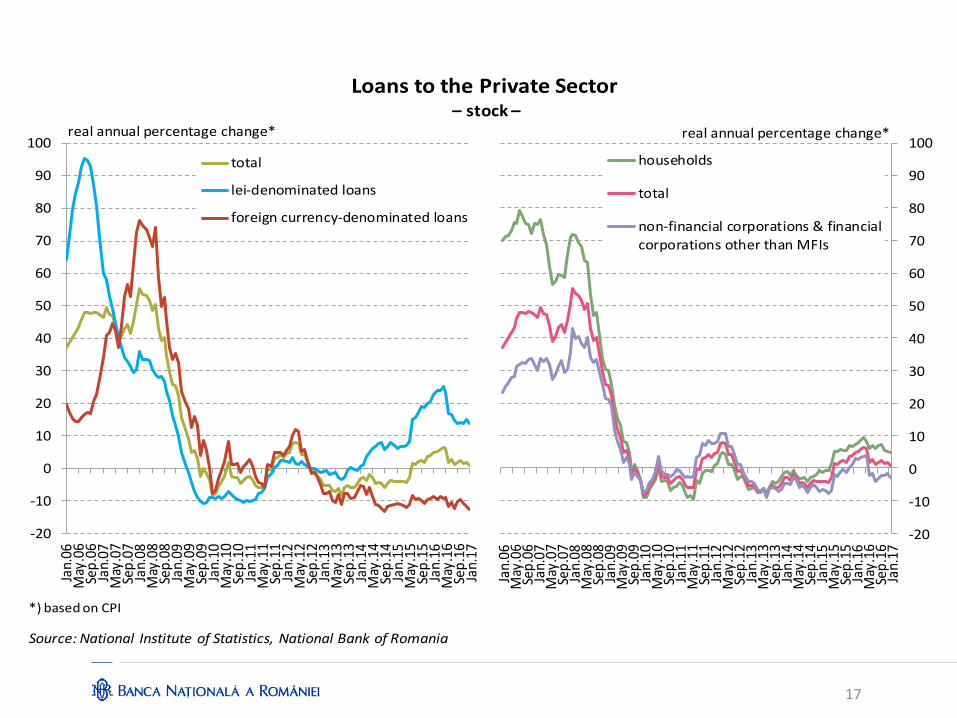
total
lei-denominated loans
foreign currency-denominated loans
-20
-10
0
10
20
30
40
50
60
70
80
90
100
Jan.
06M
ay.0
6Se
p.0
6Ja
n.07
May
.07
Sep
.07
Jan.
08M
ay.0
8Se
p.0
8Ja
n.09
May
.09
Sep
.09
Jan.
10M
ay.1
0Se
p.1
0Ja
n.11
May
.11
Sep
.11
Jan.
12M
ay.1
2Se
p.1
2Ja
n.13
May
.13
Sep
.13
Jan.
14M
ay.1
4Se
p.1
4Ja
n.15
May
.15
Sep
.15
Jan.
16M
ay.1
6Se
p.1
6Ja
n.17
households
total
non-financial corporations & financialcorporations other than MFIs
Loans to the Private Sector– stock –
real annual percentage change* real annual percentage change*
*) based on CPI
Source: National Institute of Statistics, National Bank of Romania
17
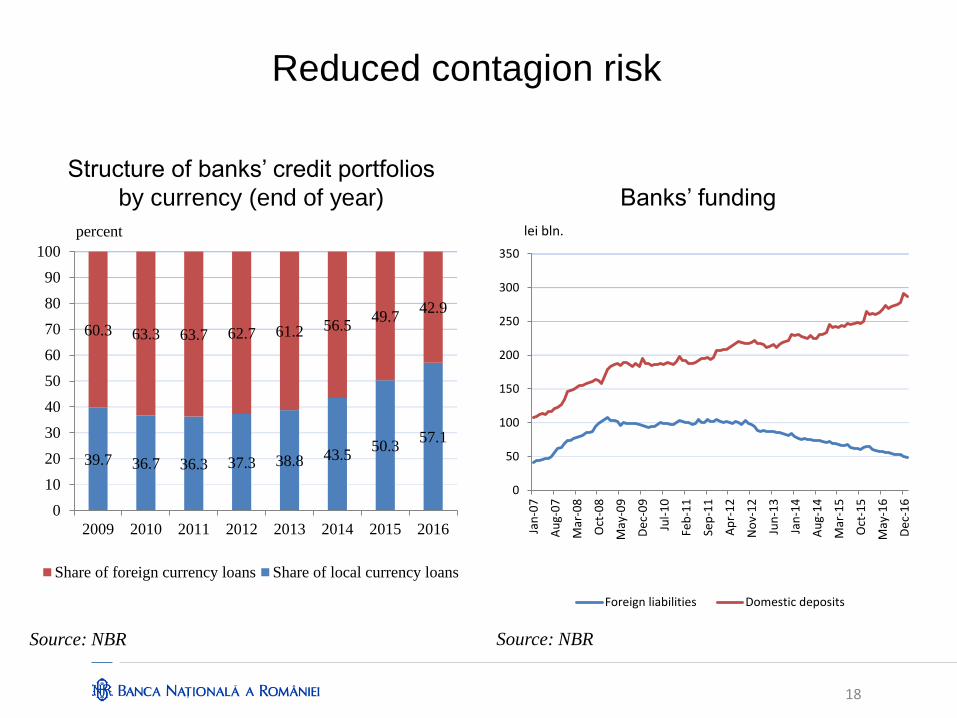
Structure of banks’ credit portfolios
by currency (end of year) Banks’ funding
Source: NBR
18
Source: NBR
0
50
100
150
200
250
300
350
Jan
-07
Au
g-0
7
Mar
-08
Oct
-08
May
-09
De
c-0
9
Jul-
10
Feb
-11
Sep
-11
Ap
r-1
2
No
v-1
2
Jun
-13
Jan
-14
Au
g-1
4
Mar
-15
Oct
-15
May
-16
De
c-1
6
Foreign liabilities Domestic deposits
lei bln.
39.7 36.7 36.3 37.3 38.8 43.5 50.3
57.1
60.3 63.3 63.7 62.7 61.2 56.5 49.7
42.9
0
10
20
30
40
50
60
70
80
90
100
2009 2010 2011 2012 2013 2014 2015 2016
Share of foreign currency loans Share of local currency loans
percent
Reduced contagion risk
19
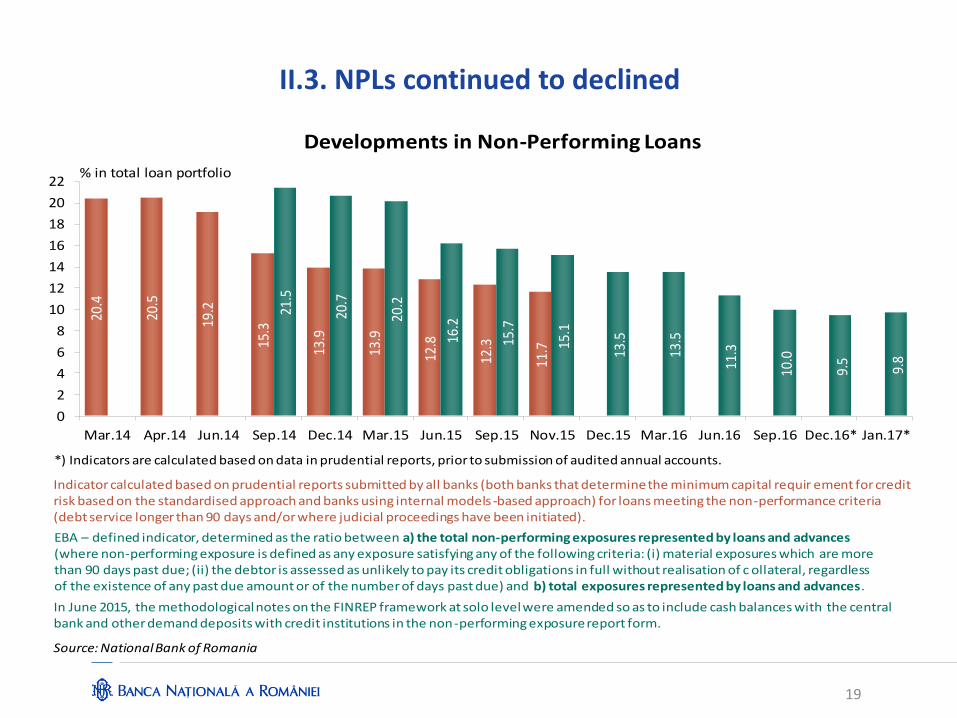
II.3. NPLs continued to declined 20
.4
20.5
19.2
15.3
13.9
13.9
12.8
12.3
11.7
21.5
20.7
20.2
16.2
15.7
15.1
13.5
13.5
11.3
10.0
9.5
9.8
0
2
4
6
8
10
12
14
16
18
20
22
Mar.14 Apr.14 Jun.14 Sep.14 Dec.14 Mar.15 Jun.15 Sep.15 Nov.15 Dec.15 Mar.16 Jun.16 Sep.16 Dec.16* Jan.17*
Developments in Non-Performing Loans
% in total loan portfolio
Indicator calculated based on prudential reports submitted by all banks (both banks that determine the minimum capital requir ement for credit risk based on the standardised approach and banks using internal models -based approach) for loans meeting the non-performance criteria(debt service longer than 90 days and/or where judicial proceedings have been initiated).
EBA – defined indicator, determined as the ratio between a) the total non-performing exposures represented by loans and advances(where non-performing exposure is defined as any exposure satisfying any of the following criteria: (i) material exposures which are morethan 90 days past due; (ii) the debtor is assessed as unlikely to pay its credit obligations in full without realisation of c ollateral, regardless of the existence of any past due amount or of the number of days past due) and b) total exposures represented by loans and advances.
Source: National Bank of Romania
In June 2015, the methodological notes on the FINREP framework at solo level were amended so as to include cash balances with the central bank and other demand deposits with credit institutions in the non-performing exposure report form.
*) Indicators are calculated based on data in prudential reports, prior to submission of audited annual accounts.
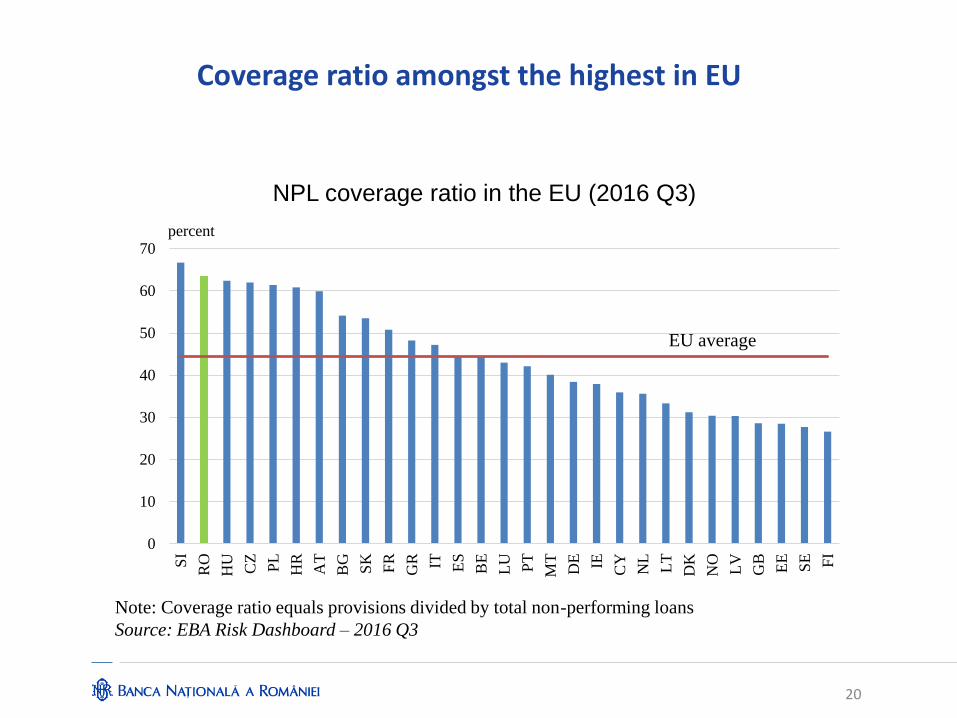
Coverage ratio amongst the highest in EU
NPL coverage ratio in the EU (2016 Q3)
20
0
10
20
30
40
50
60
70
SI
RO
HU
CZ
PL
HR
AT
BG
SK
FR
GR IT ES
BE
LU PT
MT
DE IE CY
NL
LT
DK
NO
LV
GB
EE
SE FI
percent
EU average
Note: Coverage ratio equals provisions divided by total non-performing loans
Source: EBA Risk Dashboard – 2016 Q3
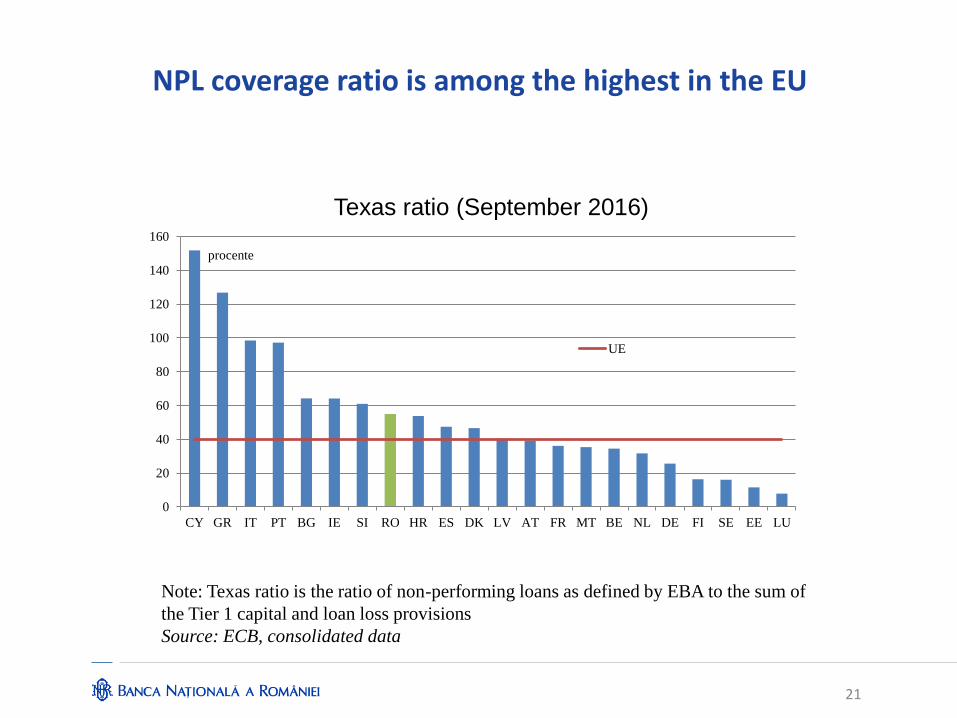
NPL coverage ratio is among the highest in the EU
Texas ratio (September 2016)
Note: Texas ratio is the ratio of non-performing loans as defined by EBA to the sum of
the Tier 1 capital and loan loss provisions
Source: ECB, consolidated data
0
20
40
60
80
100
120
140
160
CY GR IT PT BG IE SI RO HR ES DK LV AT FR MT BE NL DE FI SE EE LU
UE
procente
21
22
2007 2008 2009 2010 2011 2012 2013 2014 2015
BE - -30.0 -0.7 280.9 -193.3 -2,116.3 600.8 -93.6 -97.9
BG - - - - - - - -739.2 -95.3
CZ - - - - - - - - -
DK - 0.6 162.1 562.1 -180.4 511.3 326.1 163.3 11.3
DE - -3,071.5 -2,980.3 -33,004.4 173.6 -1,168.2 1,435.6 577.6 -491.5
EE - - - - - - - - -
IE - - -3,767.0 -35,543.7 -6,370.5 354.9 438.7 14.6 -1,765.6
EL - - 373.0 960.0 633.0 -5,347.0 -19,446.0 136.0 -7,171.0
ES - -12.0 696.0 771.6 -3,515.0 -38,289.0 -3,277.0 -1,350.0 -535.0
FR - 48.0 1,356.0 995.0 601.0 -2,198.0 238.0 27.5 -18.2
HR - - - -61.7 -3.0 -29.5 -3.9 -4.0 -69.8
IT - - -16.5 88.0 177.4 -86.3 -150.0 361.9 -3,534.8
CY - - 10.0 27.0 25.0 -40.5 -31.0 -1,486.0 -161.0
LV - 2.1 -183.9 -401.7 -70.3 -101.5 33.1 -79.5 -8.4
LT - - - -32.3 -888.7 -41.3 -174.9 475.5 212.0
LU - -20.4 -68.7 50.7 54.7 27.7 -3.0 46.3 71.6
HU - - 4.3 7.4 9.8 0.8 - - -
MT - - - - - - - - -
NL - -161.0 -2,304.0 -1,082.0 -112.0 -221.0 -1,188.0 -50.0 412.0
AT - 2.2 -2,656.6 -327.0 -292.4 -1,318.9 -1,489.8 -5,338.9 -2,201.5
PL - - - - - - - - -
PT - 2.4 12.2 -2,219.3 -866.3 -932.0 -585.2 -5,126.5 -2,822.6
RO - - - - - - - - -
SI - - 3.7 13.5 -236.9 -62.1 -3,671.1 -693.4 -529.9
SK - - - - - - - - -
FI - - - - - - - - -
SE - -1.5 128.7 262.1 228.4 134.1 111.8 6.9 1.7
UK 61.4 -5,587.2 -8,076.9 1,522.4 1,077.3 2,009.0 -1,225.8 -769.1 -564.9
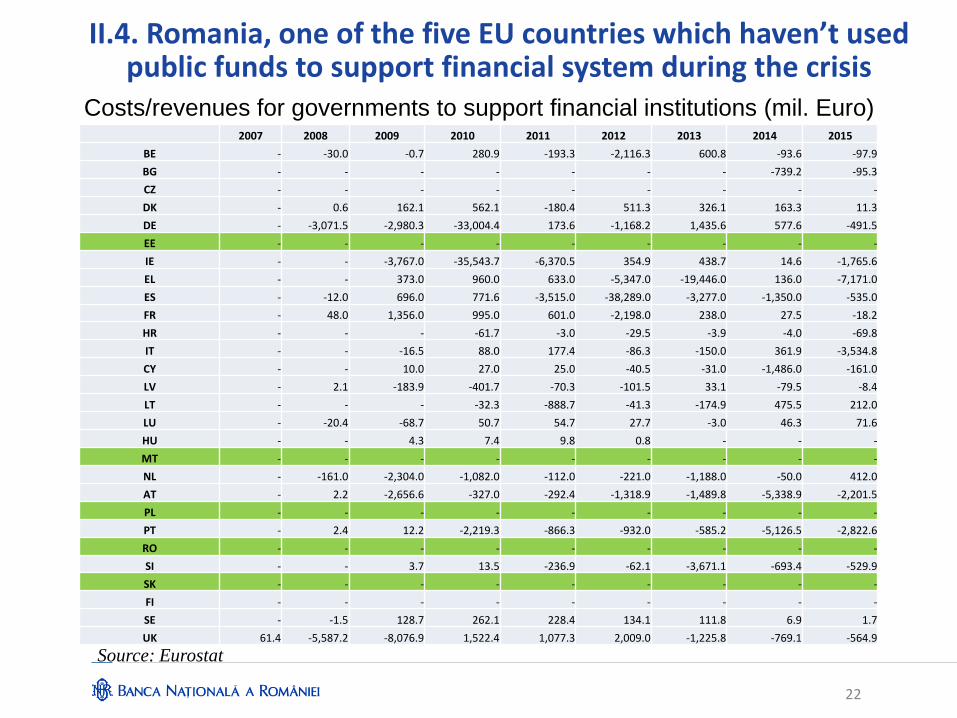
II.4. Romania, one of the five EU countries which haven’t used public funds to support financial system during the crisis
Source: Eurostat
Costs/revenues for governments to support financial institutions (mil. Euro)
23
2007 2008 2009 2010 2011 2012 2013 2014 2015
BE - 21,546.0 19,503.2 17,921.7 17,549.9 18,502.5 15,044.0 14,535.7 13,224.2
BG - - - - - - - 1,201.6 1,086.5
CZ - - - - - - - - -
DK - 586.6 10,072.1 9,452.5 7,734.3 6,381.2 5,867.6 1,099.6 2,953.5
DE - 47,434.4 85,303.5 267,412.9 234,697.0 250,216.8 210,925.3 197,927.4 185,538.0
EE - - - - - - - - -
IE - - 7,000.0 6,634.1 36,419.0 31,621.0 22,288.9 11,744.0 8,245.4
EL - - 3,983.0 3,911.0 4,959.0 30,875.0 29,535.0 16,778.0 10,457.0
ES - 9,337.0 19,335.0 25,918.0 19,200.0 9,824.0 6,981.0 6,095.0 6,095.0
FR - 10,823.0 6,751.0 2,463.0 30.0 30.0 30.0 30.0 30.0
HR - - - 69.2 63.7 40.6 40.2 22.4 74.7
IT - - 4,050.0 4,050.0 2,600.0 2,600.0 4,071.0 1,071.0 -
CY - - - - - 1,796.1 - - -
LV - 951.4 929.6 1,473.8 731.1 690.0 524.9 367.9 179.1
LT - - - - 1.7 1.4 6.5 8.7 8.7
LU - 2,506.2 2,534.7 2,534.7 2,534.7 2,607.7 2,607.7 2,607.7 2,607.7
HU - - 1,758.0 995.3 498.9 - - - -
MT - - - - - - - - -
NL - 81,431.0 56,013.0 49,926.0 43,263.0 40,212.0 44,485.0 38,001.0 27,522.0
AT - 900.0 40,438.1 21,217.4 17,966.2 15,302.0 11,322.2 26,000.5 31,922.1
PL - - - - - - - - -
PT 150.0 930.0 1,930.0 6,374.6 6,374.6 12,709.1 12,679.1 9,200.8 9,811.6
RO - - - - - - - - -
SI - - 1,430.0 1,430.0 1,472.0 1,524.0 3,493.0 5,098.9 3,576.7
SK - - - - - - - - -
FI - - - - - - - - -
SE - 221.9 2,016.5 2,313.8 1,694.5 2,052.0 - - -
UK - 62,489.2 105,793.3 207,359.9 158,233.0 173,117.3 157,677.8 158,549.2 111,043.0
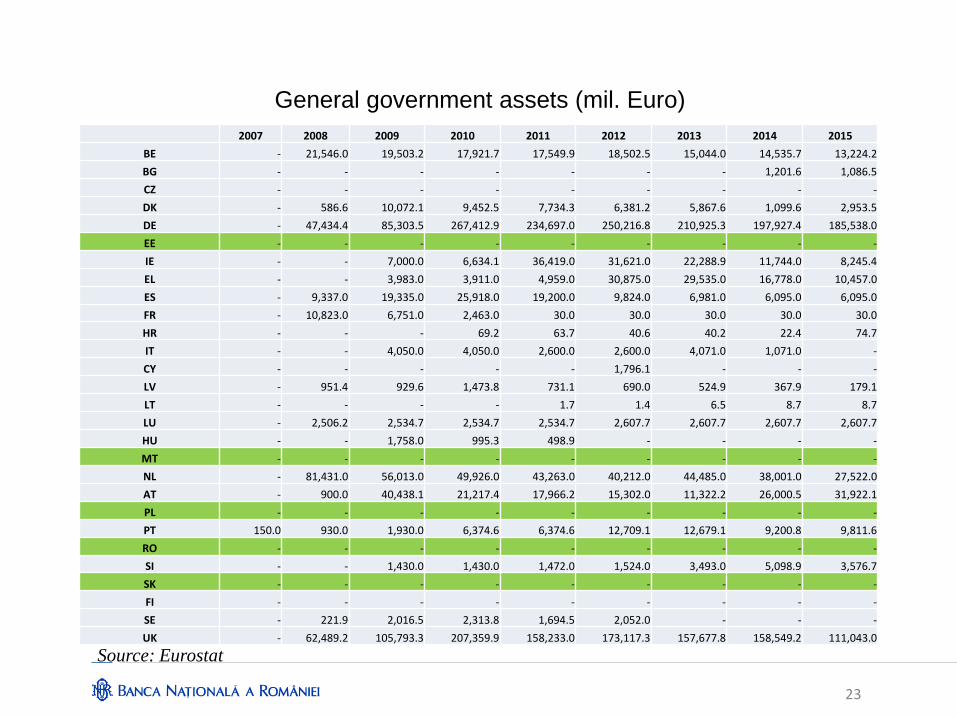
Source: Eurostat
General government assets (mil. Euro)
24
2007 2008 2009 2010 2011 2012 2013 2014 2015
BE - 21,576.0 21,405.3 21,046.3 24,786.7 22,863.8 16,337.7 16,486.5 13,831.6
BG - - - - - - - 1,201.6 1,086.5
CZ - - - - - - - - -
DK - 586.6 10,072.1 9,452.5 7,734.3 6,381.2 5,867.6 1,099.6 340.2
DE - 52,367.7 94,697.0 306,567.7 292,534.6 295,195.7 248,709.3 238,784.3 224,679.8
EE - - - - - - - - -
IE - - 10,767.0 46,374.9 82,580.6 80,408.7 70,645.9 59,220.4 58,321.4
EL - -6.0 3,947.0 3,407.0 5,081.0 35,710.0 42,080.0 39,809.0 45,220.0
ES - 9,349.0 18,651.0 24,462.0 21,260.0 50,173.0 50,607.0 51,071.0 51,606.0
FR - 11,452.0 5,896.0 801.0 - 2,585.0 2,654.0 2,720.0 2,780.0
HR - - - 61.0 62.6 91.9 95.0 98.6 168.4
IT - - 4,050.0 4,050.0 2,600.0 2,600.0 4,071.0 1,071.0 1,550.0
CY - - - - - 1,888.6 1,987.2 3,487.2 3,662.2
LV - 949.3 1,110.5 1,719.3 1,449.5 1,354.5 1,290.2 1,330.6 1,207.3
LT - - - 32.3 867.2 695.0 834.7 337.3 92.6
LU - 2,500.0 2,500.0 2,500.0 2,500.0 2,500.0 2,500.0 2,500.0 2,500.0
HU - - 1,758.0 995.3 498.9 - - - -
MT - - - - - - - - -
NL - 81,592.0 58,064.0 52,883.0 44,506.0 41,340.0 43,804.0 36,792.0 29,787.0
AT - 897.5 22,844.9 22,179.4 20,380.1 18,841.1 16,483.2 28,061.1 37,255.6
PL - - - - - - - - -
PT 150.0 547.6 1,535.4 6,399.5 7,266.2 14,722.1 15,277.2 16,925.4 20,609.8
RO - - - - - - - - -
SI - - 1,426.3 1,412.8 1,691.7 1,804.5 5,152.3 6,680.5 6,556.2
SK - - - - - - - - -
FI - - - - - - - - -
SE - 221.9 547.2 625.7 629.5 653.7 - - -
UK -1.4 66,683.5 127,473.3 205,474.3 192,936.7 185,302.0 163,584.0 162,520.2 131,424.5
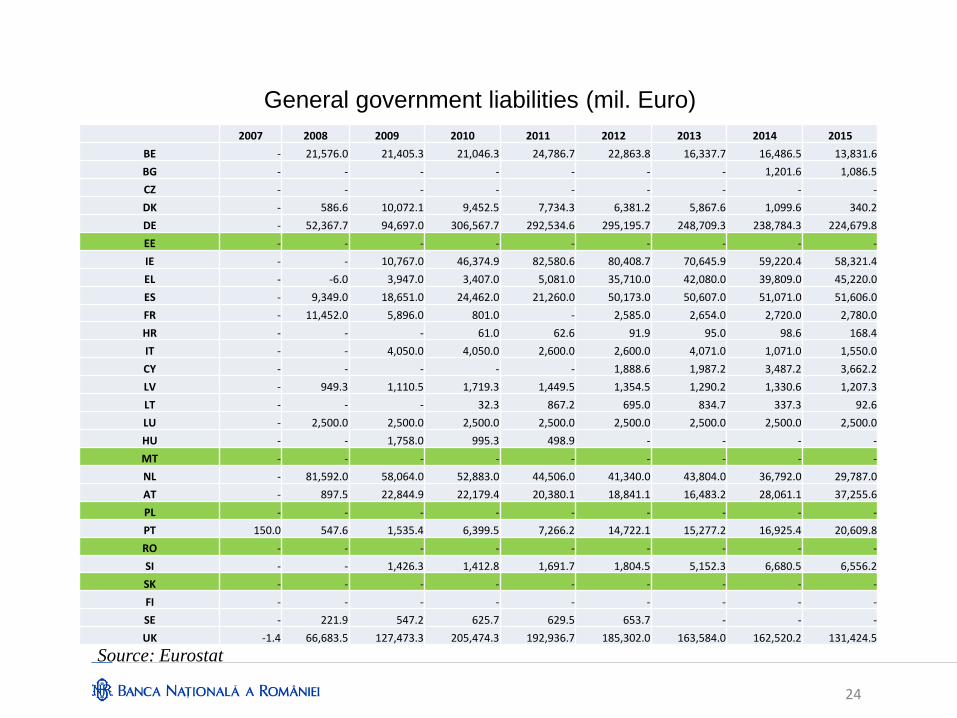
Source: Eurostat
General government liabilities (mil. Euro)
25
2007 2008 2009 2010 2011 2012 2013 2014 2015
BE - 36,234.6 62,046.8 55,829.3 46,959.7 59,057.1 45,355.8 37,564.8 31,506.1
BG - - - - - - - - -
CZ - - - - - - 137.1 78.6 14.7
DK - - 7,148.8 27,169.5 22,369.6 9,471.8 1,270.5 692.7 -
DE - 66,300.0 159,030.0 82,801.0 61,931.0 50,255.0 36,860.0 22,174.0 22,178.0
EE - - - - - - - - -
IE - 352,329.0 281,176.0 156,979.2 137,404.0 114,240.0 54,709.0 23,838.0 11,299.0
EL - 1,890.0 5,617.0 55,834.0 67,801.0 54,111.0 51,145.0 51,110.0 44,726.0
ES - - 49,008.0 59,506.0 64,659.0 105,093.0 95,604.0 55,090.0 46,385.0
FR - 39,211.0 100,112.0 90,417.0 70,233.0 50,605.0 68,848.0 47,297.0 40,212.0
HR - - - - - - - - -
IT - - - - 43,715.0 85,679.0 81,679.0 23,375.0 6,421.0
CY - - 2,229.0 2,962.0 2,769.0 1,000.0 1,000.0 1,000.0 1,000.0
LV - - 663.0 355.8 127.2 127.6 126.6 - -
LT - - - - - - - - -
LU - 1,776.9 1,513.2 1,333.3 1,377.8 2,210.1 2,262.1 2,190.4 1,838.5
HU - - - - - - - - -
MT - - - - - - - - -
NL - 2,740.0 79,462.0 39,948.0 34,125.0 18,192.0 10,843.0 - -
AT - 7,000.0 16,550.6 15,630.0 10,048.4 6,383.6 3,155.6 100.0 1,700.0
PL - - - - - - - - -
PT - 1,750.0 8,350.0 5,275.0 15,850.0 16,525.0 16,275.0 6,300.0 6,300.0
RO - - - - - - - - -
SI - - 2,000.0 2,200.0 1,554.9 199.9 398.1 119.0 -
SK - - - - - - - - -
FI - 115.0 - - - - - - -
SE - 13,622.5 26,406.2 19,669.5 10,181.2 3,537.1 1,007.8 99.5 -
UK 36,721.9 325,007.9 620,685.7 424,720.3 201,364.8 9,802.7 - - -
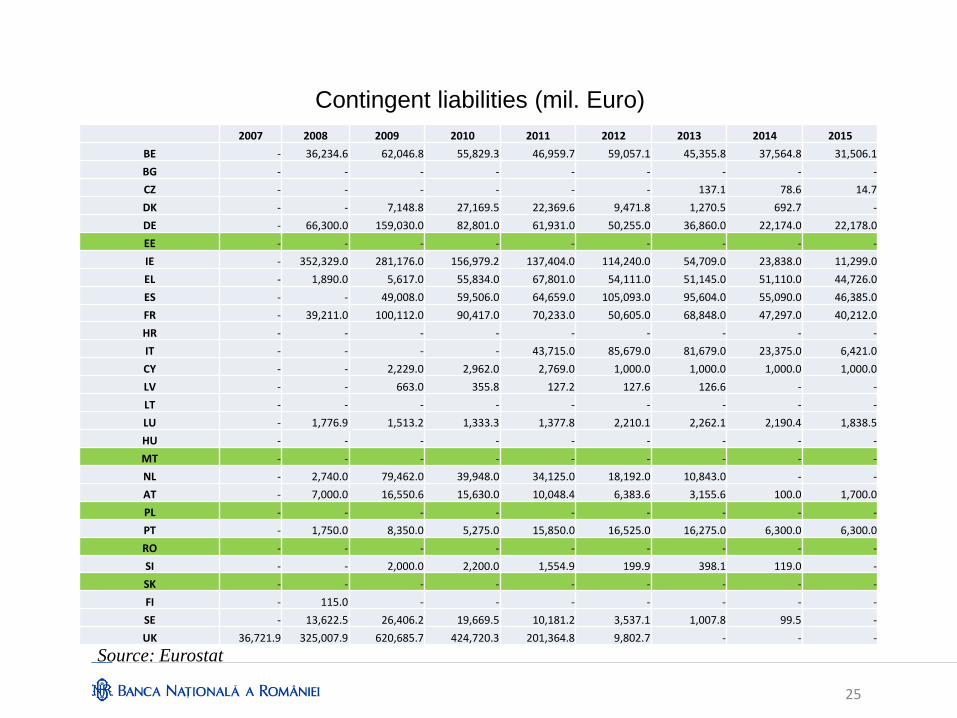
Source: Eurostat
Contingent liabilities (mil. Euro)
26
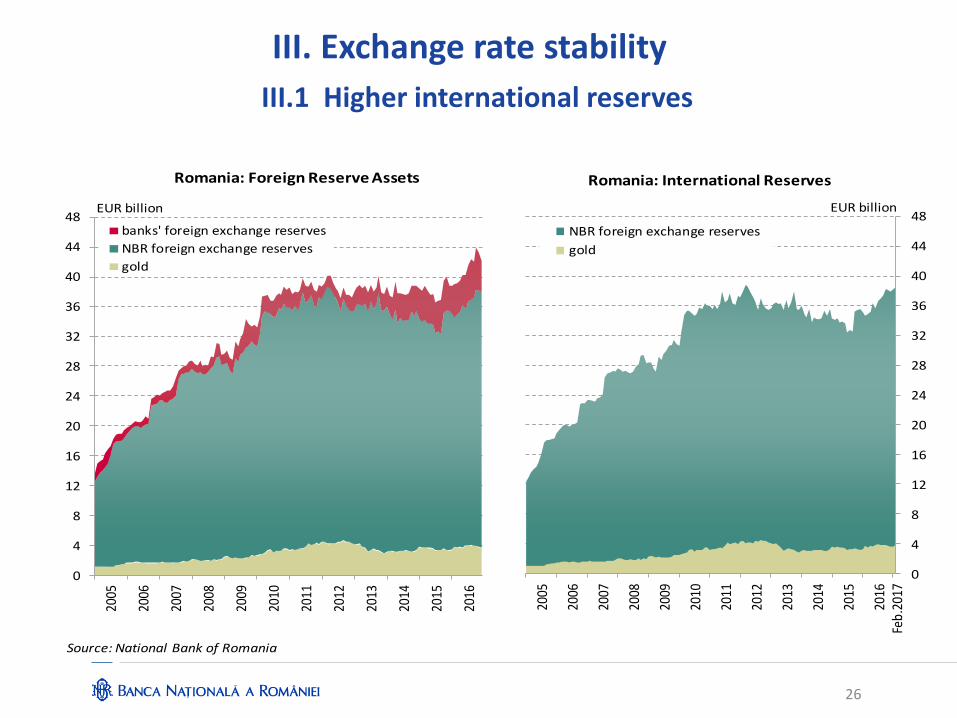
III.1 Higher international reserves
0
4
8
12
16
20
24
28
32
36
40
44
48
2005
2006
2007
2008
2009
2010
2011
2012
2013
2014
2015
2016
banks' foreign exchange reserves
NBR foreign exchange reserves
gold
0
4
8
12
16
20
24
28
32
36
40
44
48
2005
2006
2007
2008
2009
2010
2011
2012
2013
2014
2015
2016
Feb.
2017
NBR foreign exchange reserves
gold
Romania: International Reserves
EUR billion
Source: National Bank of Romania
Romania: Foreign Reserve Assets
EUR billion
III. Exchange rate stability
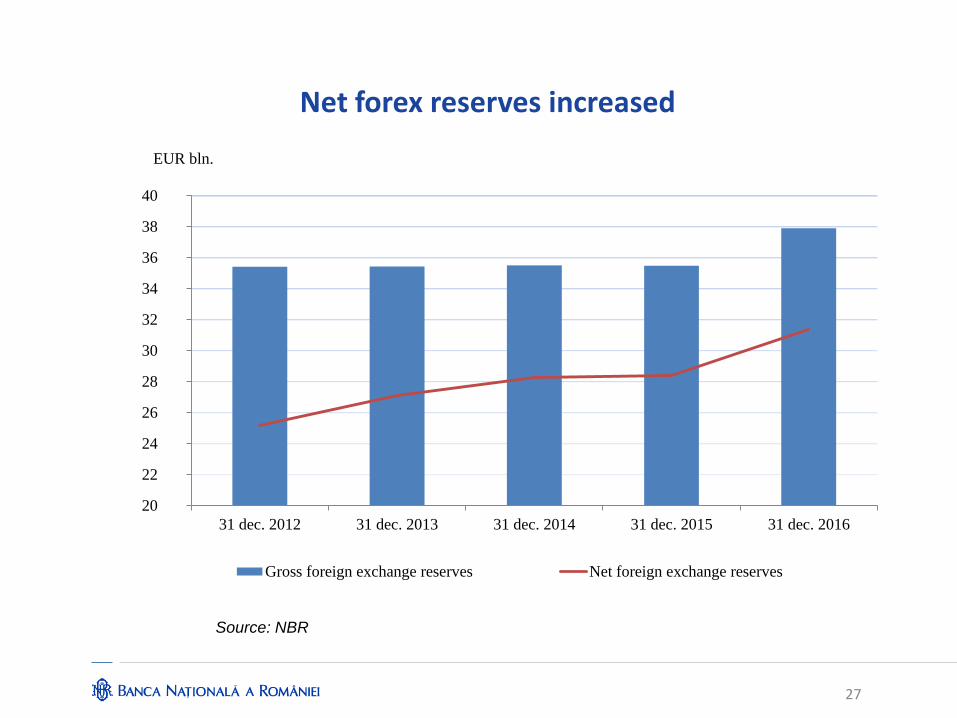
Net forex reserves increased
27
20
22
24
26
28
30
32
34
36
38
40
31 dec. 2012 31 dec. 2013 31 dec. 2014 31 dec. 2015 31 dec. 2016
Gross foreign exchange reserves Net foreign exchange reserves
EUR bln.
Source: NBR
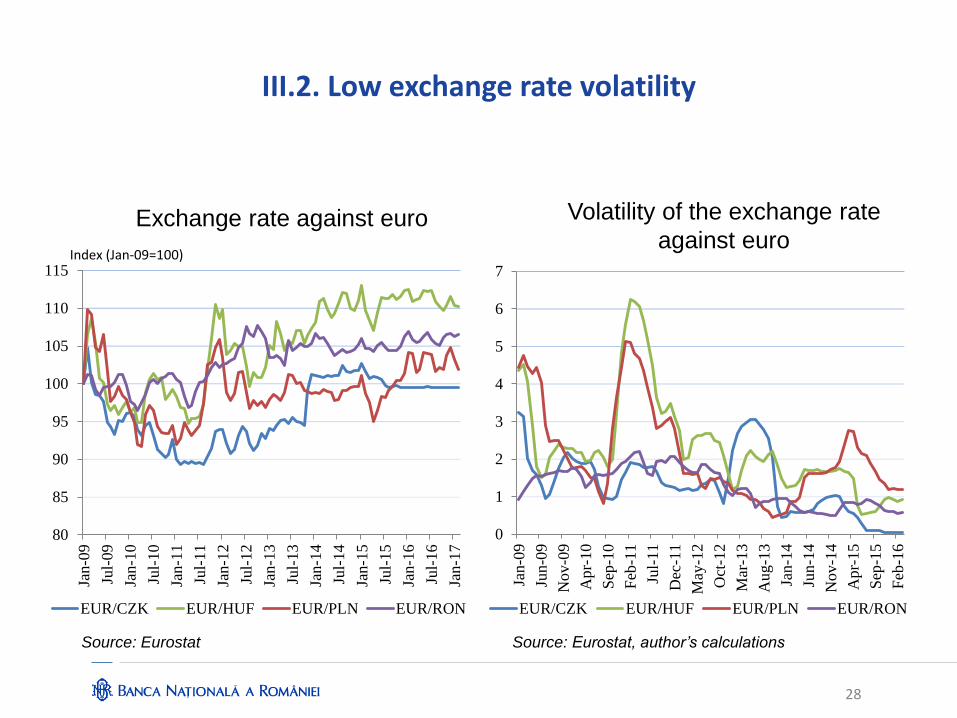
III.2. Low exchange rate volatility
28
Exchange rate against euro
Source: Eurostat
0
1
2
3
4
5
6
7
Jan-0
9
Jun
-09
Nov-0
9
Apr-
10
Sep
-10
Feb
-11
Jul-
11
Dec
-11
May
-12
Oct
-12
Mar
-13
Aug-1
3
Jan-1
4
Jun-1
4
Nov-1
4
Apr-
15
Sep
-15
Feb
-16
EUR/CZK EUR/HUF EUR/PLN EUR/RON
Volatility of the exchange rate
against euro
80
85
90
95
100
105
110
115
Jan-0
9
Jul-
09
Jan-1
0
Jul-
10
Jan-1
1
Jul-
11
Jan-1
2
Jul-
12
Jan-1
3
Jul-
13
Jan-1
4
Jul-
14
Jan-1
5
Jul-
15
Jan-1
6
Jul-
16
Jan-1
7
EUR/CZK EUR/HUF EUR/PLN EUR/RON
Index (Jan-09=100)
Source: Eurostat, author’s calculations
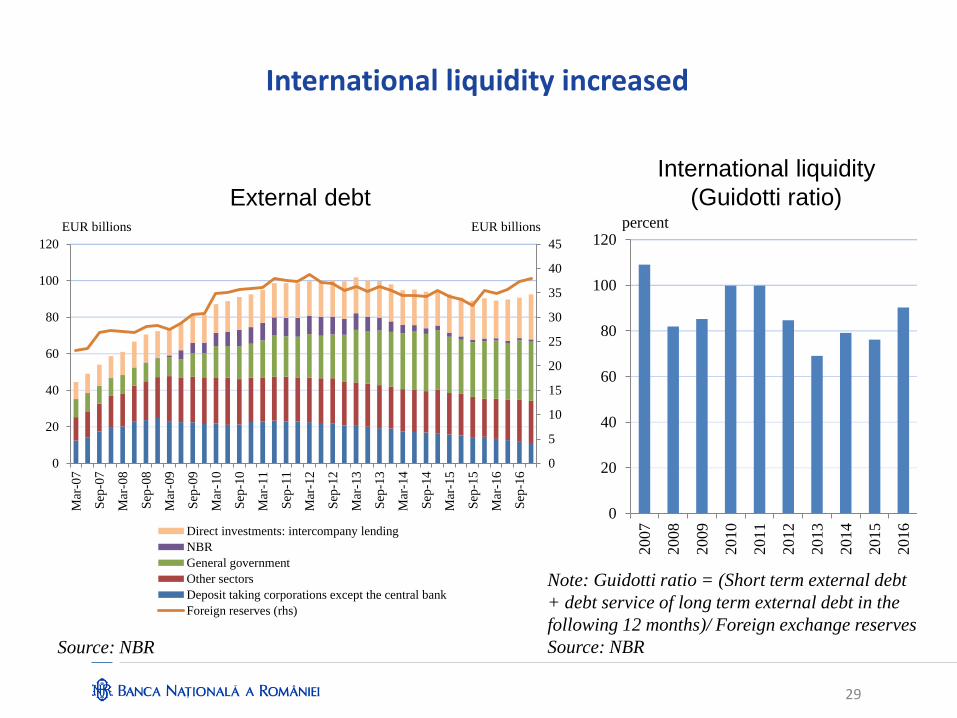
International liquidity increased
Source: NBR
External debt
0
5
10
15
20
25
30
35
40
45
0
20
40
60
80
100
120
Mar
-07
Sep
-07
Mar
-08
Sep
-08
Mar
-09
Sep
-09
Mar
-10
Sep
-10
Mar
-11
Sep
-11
Mar
-12
Sep
-12
Mar
-13
Sep
-13
Mar
-14
Sep
-14
Mar
-15
Sep
-15
Mar
-16
Sep
-16
EUR billions EUR billions
Direct investments: intercompany lending
NBR
General government
Other sectors
Deposit taking corporations except the central bank
Foreign reserves (rhs)
0
20
40
60
80
100
120
2007
2008
2009
2010
2011
2012
2013
2014
2015
2016
percent
Note: Guidotti ratio = (Short term external debt
+ debt service of long term external debt in the
following 12 months)/ Foreign exchange reserves
Source: NBR
International liquidity
(Guidotti ratio)
29
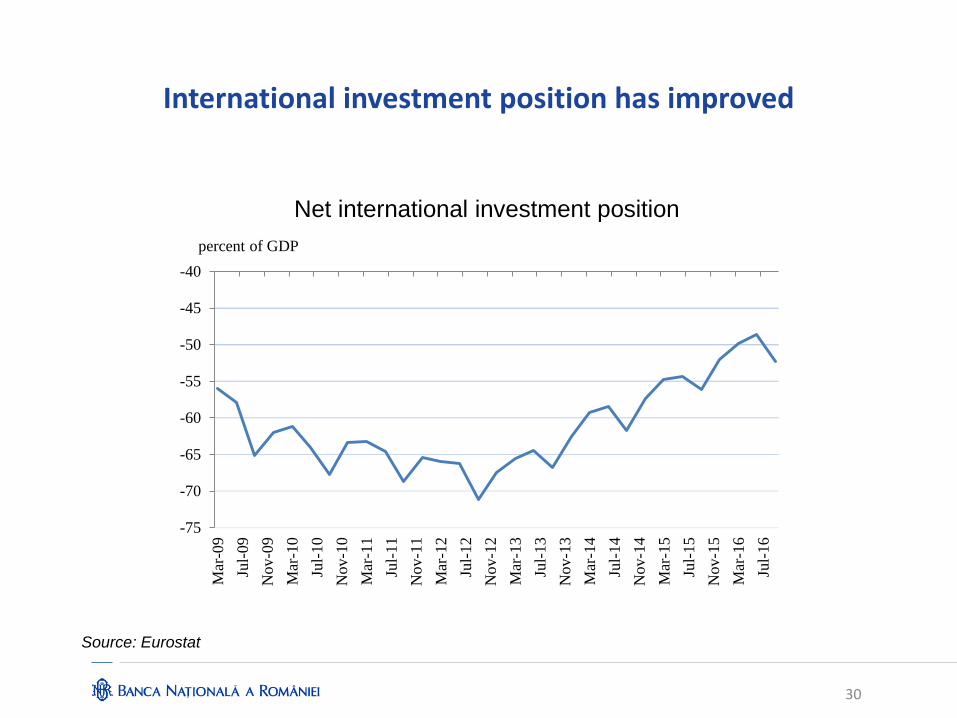
International investment position has improved
30
Net international investment position
Source: Eurostat
-75
-70
-65
-60
-55
-50
-45
-40
Mar
-09
Jul-
09
Nov-0
9
Mar
-10
Jul-
10
Nov-1
0
Mar
-11
Jul-
11
Nov-1
1
Mar
-12
Jul-
12
Nov-1
2
Mar
-13
Jul-
13
Nov-1
3
Mar
-14
Jul-
14
Nov-1
4
Mar
-15
Jul-
15
Nov-1
5
Mar
-16
Jul-
16
percent of GDP
31
IV. Key messages
NBR has reached all three stabilities: price stability, financial stability and
exchange rate stability.
Low inflation, but no deflation.
Interest rates at historical lows stimulate local currency lending.
NBR contributed to reducing the risk of legislative uncertainty.
Romania is one of the 5 EU members which haven’t used public funds to
support the financial sector since the crisis hit.
Banks continued to clean-up their balance sheets from non-performing
loans.
Banks are well capitalized and liquid. Contagion risk declined.
Larger net foreign exchange reserves and improved international liquidity.