Embed Size (px)
Citation preview

This file is part of the following reference:
Miranda-Hernandez, Socorro (2013) Role of toll-like
receptors and NKT cells in gene/environment interactions
in a mouse model of multiple sclerosis. PhD thesis, James
Cook University.
Access to this file is available from:
http://researchonline.jcu.edu.au/35564/
The author has certified to JCU that they have made a reasonable effort to gain
permission and acknowledge the owner of any third party copyright material
included in this document. If you believe that this is not the case, please contact
[email protected] and quote
http://researchonline.jcu.edu.au/35564/
ResearchOnline@JCU
Roles of Toll-like receptors and NKT cells in gene/environment interactions in a mouse
model of Multiple Sclerosis
Thesis submitted by
Socorro Miranda-Hernandez
Bachelor in Veterinary
Autonomous University of State of Mexico, Mexico
In August 2013
for the degree of Doctor of Philosophy
in the School of Pharmacy and Molecular Sciences,
Comparative Genomics Centre,
James Cook University

ii
STATEMENT OF ACCESS
I, the undersigned, author of this work, understand that James Cook
University will make this thesis available for use within the University
Library and, via the Australian Digital Theses network, for use elsewhere.
I understand that, as an unpublished work, a thesis has significant
protection under the Copyright Act and; I do not wish to place any
furtherrestrictiononaccesstothiswork.
__________________________
Signature
__________________________
Date
__________________________
Name

iii
STATEMENT ON SOURCES
I declare that this thesis is my own work and has not been submitted in any
form for another degree or diploma at any university or other institution of
tertiary education. Collaborations and information derived from the
published or unpublished work of others has been acknowledged in the text
and a list of references is given.
__________________________
Signature
__________________________
Date
__________________________
Name

iv
ELECTRONIC COPY
I, the undersigned, author of this work, declare that the electronic copy of
this thesis provided to James Cook University library is an accurate copy of
the print thesis submitted, within the limits of technology available.
__________________________
Signature
__________________________
Date
__________________________
Name
v
CONTRIBUTIONS OF OTHERS
Contribution Names or Affiliations
Financial support Universidad Autonoma del Estado de Mexico (Autonomous University of the State of Mexico)
Mexican Consejo Nacional de Ciencia y Tecnologia (CONACYT)
James Cook University
Editorial Assistance Kellie Johns
Elizabeth Tynan
Rosemary Dunn
Kasturi-Reddy Lopata
Paul Wayne Marsh
Michell Tirell
vi
APPROVAL OF ETHICS
This research presented and reported in this thesis was conducted in
compliance with the National Health and Medical Research Council
(NHMRC) Australian Code of Practice for the Care and Use of Animals for
Scientific Purposes, 7th Edition, 2004 and the Qld Animal Care and
Protection Act, 2001.
The proposed research study received animal ethics approval from the JCU
Animal Ethics Committee Approval Numbers #A1163 and #A1518.

vii
ACKNOWLEDGEMENTS
I am thankful to the Universidad Autonoma del Estado de Mexico
(Autonomous University of the State of Mexico), to the Mexican Consejo
Nacional de Ciencia y Tecnologia (CONACYT) and to James Cook
University for their financial support during my doctoral studies.
I am very grateful to my supervisor, Dr. Alan G Baxter for his interest,
support and guidance in my PhD studies at James Cook University.
I sincerely appreciate the participation of the staff of the Immunogenetics
Research Facility at James Cook University: Nicole Fraser, Kylie
Robertson, Jo-Anne Diaz, Rohan Henderson, Shevourne O’Reilly, Kirilly
O’Reilly, Samuel Page, Liam Finn, Lisa Brown and Nicole Smith. Their
expertise in the animal management and their support were invaluable for
the development of this project.
Special thanks to Klaus Griewank and Albert Bendelac for their dedicated
work in generating the construct for TCR V alpha14 transgenic mice.

viii
I appreciate the help of Erik Biros and Shahead Chowdhury in the
genotyping of the different TLR knockout mice.
I acknowledge Sue Reilly for her teachings in histology techniques and
tolerance.
I appreciate the help of Latifa Atagazli and Jaime Neal in the process of
histopathological samples.
I am very grateful to Kellie Johns, Elizabeth Tynan, Kasturi-Reddy Lopata
Rosemary Dunn, Paul Marsh and Michell Tirell for their editorial support.
Thanks to Julie M. Fletcher and Nicole Gerlach for her support.
ToMiguelinMemoriam.
Every reasonable effort has been made to gain permission and
acknowledge the owners of copyright material. I would be please to
hear from any copyright ownerwho has been omitted or incorrectly
acknowledged.

ix
ABSTRACT
Multiple Sclerosis (MS) is a degenerative disease affecting the central
nervous system. The molecular mechanisms and the development of
therapies for MS are mainly studied in the animal model Experimental
Autoimmune Encephalomyelitis (EAE), which is an induced demyelinating
paralysis model, resembling some aspects of MS. Although significant
advances have been achieved in MS and EAE, the genetic and
environmental factors underlying the initiation and progression of MS are
unclear and no curative or preventive therapies are known.
Toll-like receptors (TLRs) mediate the effects of some environmental
factors in the immune system and initiate inflammatory responses against
pathogen associated molecular patterns (PAMP) and danger associated
molecular patterns (DAMP). Although studies show that TLR expression
increases during MS and EAE in the CNS, the role of TLRs remains unclear
in both diseases. In this study, it was examined the development of MOG35-
55/CFA + PTX–induced EAE in the absence of MyD88 and TLR1, TLR2,
TLR4, TLR6, TLR9, TLR2/9 and TLR4/9. On the other hand regulatory
cells such as NKT cells have been associated with inflammation in MS;
nevertheless, the role of NKT cells in the disease is indistinct. In this study,

x
it was examined the genetic control of NKT cell numbers in the severity of
MOG35-55/CFA + PTX–induced EAE.
C57BL/6 mice developed a chronic form of MOG35-55/CFA + PTX–induced
EAE. The absence of TLR1, TLR4, TLR6 and TLR4/9 did not affect the
severity of chronic active MOG35-55/CFA + PTX–induced EAE in C57BL/6
mice; however, C57BL/6.Myd88-/- mice were completely protected from the
disease. Female C57BL/6.Tlr2-/- and C57BL/6.Tlr9-/- mice showed less
severe clinical signs of MOG35-55/CFA + PTX–induced EAE compared with
wild type (WT) B6 mice. C57BL/6.Tlr2-/-9-/- male and females mice also
decreased the severity of MOG35-55/CFA + PTX–induced EAE compared
with WT B6 mice but the disease was not less severe that that seen in single
deficient female mice in TLR2 or TLR9.
The passive form of chronic MOG35-55/CFA + PTX–induced EAE
confirmed protection from disease in the absence of TLR2 and TLR9.
Passive MOG35-55/CFA + PTX–induced EAE was ameliorated in
C57BL/6.Tlr9-/- female mice but the clinical signs of disease were similar to
those seen in active MOG35-55/CFA + PTX–induced EAE. However, both
male and female C57BL/6.Tlr2-/- mice were completely protected.
Protection of disease in the absence of TLR2 was associated with fewer
CNS-infiltrating CD4+ T cells, fewer CNS-infiltrating CD4+ T cells
secreting IL17, increasing proportions of central (CD62L+)
xi
CD4+CD25+Foxp3+ regulatory T cells and reduced prevalence of detectable
circulating levels of IL6.
As type 1 diabetes (T1D)-prone NOD mice are susceptible to MOG35-
55/CFA + PTX–induced EAE, we used the same approach to study MOG35-
55/CFA + PTX–induced EAE in this strain in order to dissect the
interrelationships between organ-specific autoimmune diseases. NOD mice
showed a mild form of relapsing-remitting MOG35-55/CFA + PTX–induced
EAE. The absence of TLR1, TLR2, TLR4, TLR6 and TLR9 did not affect
the clinical course of relapsing remitting MOG35-55/CFA + PTX–induced
EAE in both males and female mice compared to the WT NOD/Lt controls.
As the absence of TLR2 did not decrease the severity of MOG35-55/CFA +
PTX–induced EAE in NOD mice, it was hypothesized that insulitis
associated with T1D development in some way compensated for the lack of
TLR2 signalling in NOD mice. To test this hypothesis, NOD/Lt mice
carrying the MHC haplotype H2b from C57BL/6 mice (NOD.H2b) were
crossed onto the NOD.Tlr2-/- strain. NOD.H2b mice were completely
protected from T1D and insulitis but showed more severe relapsing-
remitting MOG35-55/CFA + PTX–induced EAE than NOD/Lt mice. In
contrast, the severity of relapsing remitting MOG35-55/CFA + PTX–induced
EAE decreased in NOD.H2b.Tlr2-/- mice. Moreover, NOD.H2b.Tlr2-/- mice
were protected from relapses of MOG35-55/CFA + PTX–induced EAE. This
data suggest that both TLR2 signalling and immunological events

xii
associated with autoimmunity at distant site can mediate relapses in CNS
autoimmunity.
Because mice with increased numbers of NKT cells are protected from T1D
and NKT cells have been associated with both increase severity and
decrease severity of MS. In this study, it was hypothesized that genetic
control of NKT cells numbers affects the severity of MOG35-55/CFA +
PTX–induced EAE. The clinical course of active MOG35-55/CFA + PTX–
induced EAE was not affected in NOD/Lt congenic mice for Nkrp1b, NKT1,
NKT2a, NKT2b and NKT2e. The absence of Cd1d did not affect the severity
of MOG35-55/CFA + PTX–induced EAE neither in C57BL/6 mice nor in
NOD/Lt mice. NOD.Idd13 mice showed an increased severity of MOG35-
55/CFA + PTX–induced EAE. Transgenic C57BL/6.Tg(mCD4-V14)6
female mice but not male mice ameliorated the severity of MOG35-55/CFA +
PTX–induced EAE. Both male and female C57BL/6.Tg(mCD4-V14)5
decreased the severity of MOG35-55/CFA + PTX–induced EAE.
C57BL/6.Tg(mCD4-V14)2 female were completely protected but not
males. These data indicate that increased numbers of NKT cells play a role
in CNS autoimmune inflammation.
In conclusion, these results indicate that signalling provided by TLR9 play a
partial role in the severity of CNS autoimmunity. The effector phase of
autoimmune inflammation in the CNS is dependent of TLR2 signalling.

xiii
Genetic control of NKT numbers is associated with the severity of
autoimmune CNS inflammation.

xiv
TABLE OF CONTENT
STATEMENT OF ACCESS ....................................................................... ii
STATEMENT ON SOURCES .................................................................. iii
ELECTRONIC COPY ............................................................................... iv
CONTRIBUTIONS OF OTHERS ............................................................. v
APPROVAL OF ETHICS ......................................................................... vi
ACKNOWLEDGEMENTS ...................................................................... vii
ABSTRACT ................................................................................................ ix
TABLE OF CONTENT ........................................................................... xiv
LIST OF TABLES .................................................................................. xxiii
LIST OF FIGURES ................................................................................ xxiv
PREFACE ............................................................................................... xxxi
ACHIEVEMENTS ............................................................................... xxxiii
ABBREVIATIONS .............................................................................. xxxvii
CHAPTER 1 ................................................................................................. 1
INTRODUCTION ....................................................................................... 1
1.1 Autoimmunity .................................................................................... 1
1.2 Multiple Sclerosis ............................................................................... 3
1.2.1 Genetic and environmental factors in MS .................................... 5
1.3 Toll-like receptors .............................................................................. 7

xv
1.4 Toll-like receptors in Multiple Sclerosis .......................................... 8
1.4.1 Toll-like Receptor One in Multiple Sclerosis ............................... 9
1.4.2 Toll-like Receptor Two in Multiple Sclerosis ............................ 10
1.4.3 Toll-like Receptor Three in Multiple Sclerosis .......................... 12
1.4.4 Toll-like Receptor Four in Multiple Sclerosis ............................ 13
1.4.5 Toll-like Receptor Five in Multiple Sclerosis ............................ 13
1.4.6 Toll-like Receptor Six in Multiple Sclerosis .............................. 14
1.4.7 Toll-like Receptor Seven in Multiple Sclerosis .......................... 14
1.4.8 Toll-like Receptor Eight in Multiple Sclerosis ........................... 16
1.4.9 Toll-like Receptor Nine in Multiple Sclerosis ............................ 16
1.4.10 Toll-like Receptor Ten in Multiple Sclerosis ........................... 17
1.4.11 Toll-like Receptor Eleven in Multiple Sclerosis ...................... 17
1.5 Animal Models of Multiple Sclerosis ............................................. 18
1.5.1 Experimental Autoimmune Encephalomyelitis .......................... 19
1.6 MyD88 in Animal Models of Multiple Sclerosis ........................... 22
1.6.1 Toll-like Receptor One in Animal Models of Multiple Sclerosis
............................................................................................................. 23
1.6.2 Toll-like Receptor Two in Animal Models of Multiple Sclerosis
............................................................................................................. 24
1.6.3 Toll-like Receptor Three in Animal Models of Multiple Sclerosis
............................................................................................................. 26
1.6.4 Toll-like Receptor Four in Animal Models of Multiple Sclerosis
............................................................................................................. 27

xvi
1.6.5 Toll-like Receptor Five in Animal Models of Multiple Sclerosis
............................................................................................................. 29
1.6.6 Toll-like Receptor Six in Animal Models of Multiple Sclerosis 29
1.6.7 Toll-like Receptor Seven in Animal Models of Multiple Sclerosis
............................................................................................................. 30
1.6.8 Toll-like Receptor Eight in Animal Models of Multiple Sclerosis
............................................................................................................. 31
1.6.9 Toll-like Receptor Nine in Animal Models of Multiple Sclerosis
............................................................................................................. 31
1.6.10 Toll-like Receptors Eleven, Twelve and Thirteen in Animal
Models of Multiple Sclerosis ............................................................... 33
1.7 Natural Killer T cells in Multiple Sclerosis and Experimental
Autoimmune Encephalomyelitis .......................................................... 34
1.7.1 NKT cells classification .............................................................. 35
1.7.2 NKT cells in Multiple Sclerosis ................................................. 36
1.7.3 NKT cells in Experimental Autoimmune Encephalomyelitis .... 38
1.8 Summary and project aims ............................................................. 39
CHAPTER 2 ............................................................................................... 46
MATERIALS AND METHODS .............................................................. 46
2.1 Mice ................................................................................................... 46
2.1.1 Sources of C57BL/6 and NOD/Lt mice ..................................... 46
2.1.2 Sources and generation of knockout, congenic and transgenic
mice ..................................................................................................... 46
2.1.2.1 Knockout mice ..................................................................... 46

xvii
2.1.2.2 Congenic and transgenic mice ............................................. 48
2.2 Mouse identification and housing .................................................. 49
2.3 Genotyping ....................................................................................... 49
2.3.1 DNA extraction ........................................................................... 49
2.3.2 Polymerase chain reaction (PCR) and polyacrylamide gel
electrophoresis (PAGE) ....................................................................... 50
2.3.3 Processing and staining of cells from blood for Flow Cytometry
............................................................................................................. 51
2.4 Induction of EAE ............................................................................. 51
2.4.1 Mouse immunisation for active MOG35-55-induced EAE ........... 51
2.4.2 Mouse immunisation for passive MOG35-55-induced EAE ......... 52
2.4.2.1 Donor immunisation and organ collection .......................... 52
2.4.2.2 Single cell suspension and cell culture ................................ 53
2.4.2.3 Adoptive transfer of EAE to recipients ............................... 54
2.5 Clinical scoring of active and passive EAE ................................... 54
2.6 Diabetes incidence ............................................................................ 55
2.7 Histopathology ................................................................................. 56
2.7.1 Organ removal and fixation ........................................................ 56
2.7.1.1 Central Nervous System (CNS) ........................................... 56
2.7.2 Parafination, section, de-waxing and hydratation....................... 56
2.7.3 Staining ....................................................................................... 57
2.7.3.1 Hematoxilin and Eosin Staining .......................................... 57
2.7.3.2 Luxol fast blue ..................................................................... 58
2.7.3.3 Bielschowsky's Silver .......................................................... 58

xviii
2.8 Histological evaluation .................................................................... 59
2.8.1 Spinal cord .................................................................................. 59
2.9 Flow Cytometry ............................................................................... 60
2.9.1 Organ removal ............................................................................ 60
2.9.2 Preparation of single cell suspensions ........................................ 60
2.9.2.1 Spleen .................................................................................. 60
2.9.2.2 Lymph nodes ....................................................................... 61
2.9.2.3 Central Nervous System ...................................................... 61
2.9.3 FACs staining and analysis .......................................................... 62
2.9.3.1 Blocking FcR binding .............................................................. 62
2.9.3.2 Cell surface staining ................................................................ 62
2.9.3.3 Intracellular staining ................................................................ 64
2.9.3.3.1 Tregs staining ................................................................... 64
2.9.3.3.2 IL17 in spleen ................................................................... 64
2.9.3.3.3 IL17 Secretion Assay ........................................................ 64
2.10 Cytokines assays ............................................................................ 66
2.10.1 Plasma collection and storage ................................................... 66
2.10.2 Th1/Th2/Th17 cytokine assays ................................................. 67
2.10.2.1 IFN ELISA ...................................................................... 68
2.11 Intraperitoneal injections of IL6 .................................................. 68
2.12 Mice treated with antibiotics ........................................................ 68
2.13 Statistical analysis .......................................................................... 69
CHAPTER 3 ............................................................................................... 70

xix
ROLES FOR TLR2, TLR9 AND MyD88 BUT NOT TLR1, TLR4 AND
TLR6 IN ACTIVE MOG35-55/CFA + PTX–INDUCED EAE ................ 70
3.1 Introduction ..................................................................................... 70
3.2 Results ............................................................................................... 71
3.2.1 Toll-like receptors and MyD88 in active MOG35-55/CFA + PTX–
induced EAE ........................................................................................ 71
3.2.2 Histopathology of damage to the spinal cord in the absence of
TLRs and MyD88 ................................................................................ 82
3.2.3 Leukocyte infiltration in the CNS at the peak of active MOG35-
55/CFA + PTX-induced EAE ............................................................... 88
3.2.4 Plasma cytokines in active MOG35-55/CFA + PTX-induced EAE
............................................................................................................. 94
3.3 Discussion ......................................................................................... 97
CHAPTER 4 ............................................................................................. 100
ROLE FOR TLR2 AND TLR9 IN PASSIVE EAE .............................. 100
4.1 Introduction ................................................................................... 100
4.2 Results ............................................................................................. 102
4.2.1 Absence of PTX and irradiation in passive EAE ..................... 102
4.2.2 The absence of TLR4 in the severity of passive EAE .............. 105
4.2.3 TLR9 and TLR2 in passive EAE .............................................. 108
4.2.4 CD4+ T cells in the CNS in passive EAE ................................. 117
4.2.5 CD4+ T cells secreting IL17 in the absence of TLR2 in the CNS
........................................................................................................... 120

xx
4.2.6 Absolute numbers of CD62L-expressing Tregs in the absence of
TLR2 .................................................................................................. 122
4.2.7 Microflora in passive EAE ....................................................... 128
4.3 Discussion ....................................................................................... 131
CHAPTER 5 ............................................................................................. 135
THE ROLE OF TLR2 IN ACTIVE MOG35-55/CFA + PTX-INDUCED
RELAPSING-REMITTING EAE .......................................................... 135
5.1 Introduction ................................................................................... 135
5.2 Results ............................................................................................. 136
5.2.1 Active MOG35-55/CFA + PTX–induced relapsing-remitting EAE
in NOD/Lt deficient mice in TLR1, TLR2, TLR4, TLR6 and TLR9 136
5.2.2 Active MOG35-55/CFA + PTX–induced relapsing-remitting EAE
in NOD.H2b and NOD.H2d mice ....................................................... 143
5.2.3 Active MOG35-55/CFA + PTX–induced relapsing-remitting EAE
in NOD.H2b.Tlr2-/- ............................................................................. 148
5.2.4 IL6 in active MOG35-55/CFA + PTX–induced relapsing-remitting
EAE in the absence of TLR2 ............................................................. 155
5.2.5 Circulating levels of cytokines in active MOG35-55/CFA + PTX–
induced relapsing-remitting EAE in NOD.H2b.Tlr2-/- and NOD.Tlr2-/-
mice ................................................................................................... 159
5.3 Discussion ....................................................................................... 162
CHAPTER 6 ............................................................................................. 164

xxi
NKT CELLS IN THE INTERACTION BETWEEN
ENVIRONMENTAL AND GENETIC RISK FACTORS FOR EAE 164
6.1 Introduction ................................................................................... 164
6.2 Results ............................................................................................. 166
6.2.1 Active MOG35-55/CFA + PTX-induced EAE in NOD/Lt mice and
NOD.Nkrp1b mice ............................................................................. 166
6.2.2. Cd1d in active MOG35-55/CFA + PTX-induced EAE .............. 169
6.2.3. The Idd13 locus in active MOG35-55/CFA + PTX-induced EAE
........................................................................................................... 173
6.2.4 Active MOG35-55/CFA + PTX-induced EAE in NOD.Nkrp1b
mice congenic for Nkt1, Nkt2a, Nkt2b, Nkt2e ................................... 177
6.2.5 Active MOG35-55/CFA + PTX-induced EAE in TCR CD4-V14
transgenic mice .................................................................................. 180
6.2.5.1 C57BL/6.Tg(mCD4-V14)6 mice .................................... 180
6.2.5.2 C57BL/6.Tg(mCD4-V14)5 mice .................................... 181
6.2.5.3 C57BL/6.Tg(mCD4-V14)2 mice .................................... 183
6.3 Discussion ....................................................................................... 187
CHAPTER 7 ............................................................................................. 191
GENERAL DISCUSSION AND CONCLUSIONS .............................. 191
REFERENCES ........................................................................................ 200
Appendix 1 ................................................................................................ 261
LOCALIZATION OF TOLL-LIKE RECEPTORS ............................ 261
APPENDIX 2 ............................................................................................ 262

xxii
PRODUCTION OF C57BL/6.Cd1d-/- MICE ......................................... 262
APPENDIX 3 ............................................................................................ 263
PRODUCTION OF NOD.H2b.Tlr2-/- MICE.......................................... 263
APPENDIX 4 ............................................................................................ 264
MOUSE IDENTIFICATION ................................................................. 264
APPENDIX 5 SEQUENCES OF PRIMERS ....................................... 265
APPENDIX 6 ............................................................................................ 266
POLYMERASE CHAIN REACTION (PCR) ...................................... 266
APPENDIX 7 TERMOCYCLING PROTOCOLS FOR PCR ........... 267
APPENDIX 8 ANTIBODIES FOR FLOW CYTOMETRY ANALYSIS
................................................................................................................... 268
APPENDIX 9 PREPARATION OF SOLUTIONS AND BUFFERS . 271

xxiii
LIST OF TABLES
Table 1.1 Toll-like receptors in EAE ........................................................... 42
Table 3.1 Characteristics of active MOG35-55/CFA + PTX–induced EAE in
male and female C57BL/6 and C57BL/6 mice deficient in TLR1, TLR2,
TLR4, TLR6, TLR9, TLR2/9, TLR4/9 and MyD88 ................................... 77
Table 3.2 Active MOG35-55/CFA + PTX –induced EAE in C57BL/6 female
mice deficient in TLR2 and TLR9 .............................................................. 81
Table 4.1 Passive EAE in C57BL/6 mice treated with or without PTX and
irradiation. .................................................................................................. 104
Table 4.2 Passive EAE in TLR-deficient C57BL/6 mice and C57BL/6 WT
control mice ............................................................................................... 110
Table 6.1. Active MOG35-55/CFA + PTX –induced EAE in NOD/Lt and
NOD.Idd13 female mice. ........................................................................... 174

xxiv
LIST OF FIGURES
Figure 3.1 Representative clinical course of active MOG35-55/CFA + PTX–
induced EAE in individual mice .................................................................. 75
Figure 3.2 Clinical course of active MOG35-55/CFA + PTX–induced EAE in
male and female mice .................................................................................. 76
Figure 3.3 Scoring system of spinal cord histopathology after 40 days of
active MOG35-55/CFA + PTX –induced EAE .............................................. 85
Figure 3.4 Representative transverse histopathological sections of spinal
cords taken 40 days after active MOG35-55/CFA + PTX-induced EAE ....... 86
Figure 3.5 Histopathological analysis of damage in spinal cords of mice
with 40 days of active MOG35-55/CFA + PTX -induced EAE ..................... 87
Figure 3.6 Representative gating of FACS analysis showing the proportions
of leukocytes from CNS of male and female C57BL/6 (positive and
negative control groups), C57BL/6.Tlr2-/-, C57BL/6.Tlr9-/- and
C57BL/6.Tlr2-/-9-/- mice 21 days after MOG35-55/CFA/PTX immunisation. 92
Figure 3.7 CNS-infiltrating leucocytes of C57BL/6 positive control group
(closed circles), C57BL/6 negative control group (closed diamonds),
C57BL/6.Tlr2-/- (closed squares), C57BL/6.Tlr9-/- (closed downward
triangles), C57BL/6.Tlr2-/-9-/- (closed upward triangles) and
C57BL/6.Myd88-/- (open diamonds) male and female mice ........................ 93

xxv
Figure 3.8 Cytokine levels in the plasma of C57BL/6 and C57BL/6.Tlr-/-
male mice, 21 days after MOG35-55/CFA + PTX immunisation .................. 96
Figure 4.1 Analysis of the clinical course of passive EAE in female
C57BL/6 (closed circles) and C57BL/6.Tlr4-/- (open circles) mice .......... 107
Figure 4.2 Analysis of the clinical course of passive EAE in female
C57BL/6 (closed circles) and C57BL/6.Tlr9-/- (open circles) mice .......... 111
Figure 4.3 Analysis of the clinical course of passive EAE in male C57BL/6
(closed circles) and C57BL/6.Tlr2-/- (open circles) mice .......................... 112
Figure 4.4 Analysis of the clinical course of passive EAE in female
C57BL/6 (closed circles) and C57BL/6.Tlr2-/- (open circles) mice .......... 113
Figure 4.5 Analysis of the clinical course of passive EAE in female mice.
................................................................................................................... 116
Figure 4.6 Representative FACS analysis showing the proportions of brain
and spinal cord leukocytes from female C57BL/6, C57BL/6 (PBS),
C57BL/6.Tlr2-/- and C57BL/6.Tlr9-/-, 34 days after adoptive transfer of EAE
................................................................................................................... 118
Figure 4.7 Total numbers of CD4+ T cells, CD8+ T cells, inflammatory
macrophages and, myeloid dendritic cells (MFI- mean fluorescence
intensity) in the CNS of C57BL/6 (closed cicles), C57BL/6.Tlr2-/- (closed
squares), C57BL/6.Tlr9-/- (downward closed triangles), C57BL/6 (PBS)
(closed diamonds) female mice ................................................................. 119

xxvi
Figure 4.8 Representative experiments of IL17 secretion of Central Nervous
System leukocytes and splenocytes from naive mice, and mice with passive
EAE. Cells were stimulated with PMA and controls were not stimulated 121
Figure 4.9 Representative flow cytometry gating of CD4+ T cells and Tregs:
CD3+CD4+CD25+FoxP3+ and CD3+CD4+CD25+FoxP3+CD62L+. ........... 124
Figure 4.10 Total numbers of CD4+ T cells and Tregs from spleen of male
and female C57BL/6.Tlr2-/-, C57BL/6.Tlr9-/- and C57BL/6 WT control
mice. .......................................................................................................... 125
Figure 4.11 IL6 levels in plasma after 10 days of passive EAE induction 126
Figure 4.12 IL6 levels in plasma after 34 days of passive EAE induction 127
Figure 4.13 Analysis of the clinical course of passive MOG35-55/CFA + PTX
-induced EAE in female C57BL/6 (closed circles), C57BL/6.Tlr2-/-, (closed
downward triangles) and C57BL/6.Tlr9-/- (closed diamonds) mice fed with
normal diet and; female C57BL/6 (open circles), C57BL/6.Tlr2-/-, (open
downward triangles) and C57BL/6.Tlr9-/- (open diamonds) mice fed with
medicated diet. ........................................................................................... 130
Figure 5.1. Representative clinical course of active MOG35-55/CFA + PTX–
induced relapsing-remitting EAE in individual NOD/Lt control WT (closed
circles) and NOD.Tlr1-/-, NOD.Tlr2-/-, NOD.Tlr4-/-, NOD.Tlr6-/- and
NOD.Tlr9-/- (open circles) male and female mice ..................................... 140
xxvii
Figure 5.2 Clinical course of active MOG35-55/CFA + PTX–induced
relapsing-remitting EAE in NOD/Lt WT control (closed circles) and
NOD.Tlr1-/-, NOD.Tlr2-/-, NOD.Tlr4-/-, NOD.Tlr6-/- and NOD.Tlr9-/- (open
circles) female and male mice ................................................................... 141
Figure 5.3. Analysis of the clinical course of active MOG35-55/CFA + PTX-
induced relapsing-remitting EAE in NOD/Lt (closed cicles), NOD.Tlr1-/-
(open squares), NOD.Tlr2-/- (open cicles), NOD.Tlr4-/- (open downward
triangles), NOD.Tlr6-/- (open upward triangles) and NOD.Tlr9-/- (open
diamonds) male and female mice .............................................................. 142
Figure 5.4. Cumulative diabetes incidence in NOD/Lt (closed cicles),
NOD.H2b (open cicles) and NOD.H2d (open circles) female mice .......... 145
Figure 5.5. Representative clinical course of active MOG35-55/CFA + PTX-
induced relapsing-remitting EAE in individual female NOD/Lt (closed
circles), NOD.H2b (open circles) and NOD.H2d (open forwards triangles)
mice. .......................................................................................................... 146
Figure 5.6. Analysis of the clinical course of active MOG35-55/CFA + PTX-
induced relapsing-remitting EAE in NOD/Lt (closed circles), NOD.H2b
(open circles) and NOD.H2d (open forwards triangles) female mice ....... 147
Figure 5.7 Clinical course of active MOG35-55/CFA + PTX–induced EAE in
NOD.H2b control mice (WT) (closed circles), NOD.H2b.Tlr2-/- (open
circles) and; NOD/Lt control mice (WT) (closed downward triangles) and
NOD.Tlr2-/- (open upwards triangles) ....................................................... 153

xxviii
Figure 5.8. Analysis of the clinical course of active MOG35-55/CFA + PTX-
induced relapsing-remitting EAE in NOD.H2b (close circles) and
NOD.H2b.Tlr2-/- (open circles); and NOD/Lt (closed downwards triangles)
and NOD.H2b.Tlr2-/- (open upwards triangles) in males and female mice..
................................................................................................................... 154
Figure 5.9 Analysis of the clinical course of active MOG35-55/CFA + PTX–
induced EAE in NOD.H2b control mice (WT) (closed circles),
NOD.H2b.Tlr2-/- mice treated with PBS (open circles) and NOD.H2b.Tlr2-/-
mice treated with IL6 (open downward triangles) .................................... 158
Figure 5.10 Circulating levels of IL6 and IL22 in NOD.H2b (close cicles),
NOD.H2b.Tlr2-/- treated with PBS (open cicles), NOD.H2b.Tlr2-/- treated
with IL6 (open downward triangles), naive NOD.H2b (closed squares),
naive NOD.H2b.Tlr2-/- (open squares), naive NOD/Lt (open diamonds),
naive NOD.Tlr2-/- (closed diamonds) ........................................................ 161
Figure 6.1 Analysis of the clinical course of active MOG35-55/CFA + PTX -
induced EAE in female NOD/Lt (closed circles) and NOD.Nkrp1b (open
circles) mice .............................................................................................. 168
Figure 6.2. Analysis of the clinical course of active MOG35-55/CFA + PTX -
induced EAE in female C57BL/6 (closed circles) and C57BL/6.Cd1d-/-
(open circles) mice .................................................................................... 171

xxix
Figure 6.3 Analysis of the clinical course of active MOG35-55/CFA + PTX -
induced EAE in female NOD/Lt (closed circles) and NOD.Cd1d-/- (open
circles) mice. ............................................................................................. 172
Figure 6.4 Analysis of the clinical course of active MOG35-55/CFA + PTX -
induced EAE in male NOD/Lt (closed circles) and NOD.Idd13 (open
circles) mice.. ............................................................................................ 175
Figure 6.5 Representative analysis of clinical course of active MOG35-
55/CFA + PTX -induced EAE in female NOD/Lt (closed circles) and
NOD.Idd13 (open circles) mice from two independent experiments ....... 176
Figure 6.6 Analysis of the clinical course of active MOG35-55/CFA + PTX -
induced EAE in female NOD.Nkrp1b (closed circles), NOD.Nkt1 (open
circles), NOD.Nkt2a (open upward triangles), NOD.Nkt2b (open downward
triangles) and NOD.Nkt2e (open diamonds) mice .................................... 179
Figure 6.7 Analysis of the clinical course of active MOG35-55/CFA + PTX -
induced EAE in male C57BL/6 (closed circles), C57BL/6.Tg(mCD4-
Va14)6 (upward triangles), C57BL/6.Tg(mCD4-Va14)5 (open squares)
mice ........................................................................................................... 184
Figure 6.8 Analysis of the clinical course of active MOG35-55/CFA + PTX -
induced EAE in male C57BL/6 (closed circles), C57BL/6.Tg(mCD4-
Va14)2 (open cicles) mice ......................................................................... 185

xxx
Figure 6.9 Analysis of the clinical course of active MOG35-55/CFA + PTX -
induced EAE in female C57BL/6 (closed circles), C57BL/6.Tg(mCD4-
Va14)2 (upward triangles), C57BL/6.Tg(mCD4-Va14)5 (open square) and
C57BL/6.Tg(mCD4-Va14)2 (open circles) mice ...................................... 186

xxxi
PREFACE
The studies shown in this thesis describe the importance of Toll-like
receptors (TLRs) and Natural Killer T cells (NKT cells) in the best
characterised animal model of Multiple Sclerosis (MS), Experimental
Autoimmune Encephalomyelitis (EAE).
Chapter 1 presents an analysis of literature about TLRs and NKT cells in
MS and EAE. This is followed by the materials and methods used in the
experimental work. A study of the role of TLRs in active MOG35-55/CFA +
PTX-induced EAE in C57BL/6 mice and C57BL/6 mice deficient in TLR1,
TLR2, TLR4, TLR6, TLR9, TLR2/9, TLR4/9 and MyD88 is described in
the Chapter 3. The Chapter 4 describes studies in the passive model of EAE
in C57BL/6 mice and mice deficient in TLR2 and TLR9.
In Chapter 5 is presented a study of TLR2 in MOG35‐55/CFA + PTX‐
inducedrelapsing‐remittingEAEandtheroleofNKTcellsinactiveEAE
isdescribedintheChapter6.Chapter7presentsageneraldiscussionof
theinvolvementofTLRsandNKTcellsinEAEandtheirimplicationsin
MSasapossiblewayintheimprovementoftherapiesforpatientswith
thedisease.

xxxii
To GOD with love, thanks for giving me the opportunity to live and for
teaching me to love and to forgive.
To my family gratefully, thank you for believing in me, for your
unconditional support and for their worthy examples of improvement and
delivery.
To Paul Wayne Marsh with love, thanks for your continued support and
unconditional love and for being a friend and constant companion, a source
of wisdom, calm and advice at all times.
To my friends fondly, thanks for your friendship and support.
ToConnorandNicolawhoareinmyheartforever.

xxxiii
ACHIEVEMENTS
This work has been published and presented in national and international
conferences. It has also been awarded several times.
Published papers
Miranda-Hernandez S, Gerlach N, Fletcher JM, Biros E, Mack M,
Körner H, Baxter AG. Role for MyD88, TLR2 and TLR9 but not
TLR1, TLR4 or TLR6 in experimental autoimmune
encephalomyelitis. The Journal of Immunology. 2011; 187(2): 791-
804.
Miranda-Hernandez S and Baxter AG. Role of toll-like receptors in
multiple sclerosis. American Journal of Clinical and Experimental
Immunology. 2013; 2(1): 75-93.
Published abstracts
Miranda-Hernandez S, Fletcher JM, Gerlach N, Erik B, Chowdhury
S, Heinrich K, Baxter AG. Toll-like receptors signalling in
Experimental Autoimmune Encephalomyelitis. Progress in MS

xxxiv
Research Conference, Melbourne, Australia, 2011: Conference
Abstracts. Multiple Sclerosis, May 2012, 18: 697-703.
Oral presentations
Australasian Association for Immunology 2009. ASI Infection and
Immunity workshop.
My research in 3 minutes 2010 at James Cook University.
“so you think you can research” North Queensland Festival of Life
Sciences 2012.
Three minutes poster oral session. Australasian Association for
Immunology 2012.
Poster presentations
Brisbane Immunology group Annual Retreat 2007 and 2011.
North Queensland Festival of Sciences 2007, 2010, 2011 and 2012.
Australasian Association for Immunology 2009, 2010, 2012.
Neuroimmunology Australia 2010.
14th International Congress of Immunology, Kansai, Japan 2010.
Multiple Sclerosis Australia 2011.

xxxv
TLROZ 2012. 3rd National Conference of the Australian Toll-like
Receptors Research Network.
Other participations
Microscopy image competition 2011, James Cook University.
Queensland, Australia.
Awards
Best PhD student oral presentation. ASI Infection and Immunity
Workshop. Australasian Society for Immunology Meeting 6th – 10th
December 2009 (ASI Gold Cost 2009). Conrad Jupiters,
Broadbeach, Queensland, Australia.
Poster Presentation award at North Queensland Festival of Sciences
2010, James Cook University, Townsville, Queensland, Australia.
Poster presentation award at the TLROZ 2012 Meeting 3rd National
Conference of Australian Toll-Like Receptors Research Network.
Melbourne, Australia.
Winner of oral presentation of “so you think you can research”
North Queensland Festival of Life Sciences 2012.

xxxvi
Future presentations
ProgressonMSResearchConferenceNovember2013.

xxxvii
ABBREVIATIONS
C Degrees Celsius
15-HC - 15-a-hydroxicholestene
2-ME - 2-Mercaptoethanol
APC - Antigen presenting cell(s)
BAFF - B-cell activating factor
bp Base pair
BSA Bovine serum albumin
C57BL/6 - C57 black 6 mouse
C57BL/6.Cd1d-/- - C57 black 6 mouse deficient in CD1d
C57BL/6.Myd88-/- - C57 black 6 mouse deficient in Myeloid differentiation primary response gene (88)
C57BL/6.Tg(mCD4-V14)
- C57 black 6 mouse transgenic for CD4-V14
C57BL/6.Tlr - C57 black 6 mouse –Toll like receptor
C57BL/6.Tlr-/- - C57 black 6 mouse –Toll like receptor knockout
C57BL/6.Tlr1-/- - C57 black 6 mouse deficient in Toll like receptor one

xxxviii
C57BL/6.Tlr2-/- - C57 black 6 mouse deficient in Toll like receptor two
C57BL/6.Tlr2-/-9-/- - C57 black 6 mouse deficient in Toll like receptor two and nine
C57BL/6.Tlr4-/- - C57 black 6 mouse deficient in Toll like receptor four
C57BL/6.Tlr4-/-9-/- - C57 black 6 mouse deficient in Toll like receptor two and nine
C57BL/6.Tlr6-/- - C57 black 6 mouse deficient in Toll like receptor six
C57BL/6.Tlr9-/- - C57 black 6 mouse deficient in Toll like receptor nine
CaCl2 - Calcium chloride
CCL2 - Chemokine (C-C motif) ligand 2
CCR2 - Chemokine (C-C motif) receptor 2
CD - Cluster of differentiation
CD62L - L-selectin
CDI - Clinical disease index
cDNA - Complementary deoxyribonucleic acid
CFA - Complete Freund’s Adjuvant
CNS - Central Nervous System

xxxix
CO2 - Carbon dioxide
CpG - -cytosine-phosphate-guanine-
CpG-ODN - CpG Oligodeoxynucleotide
CSF - Cerebrospinal fluid
CXCL - Chemokine (C-X-C motif)
DAMP - Damage associated molecular pattern (s)
DC - Dendritic cell(s)
ddH2O - Double distilled water
dH2O - Distilled water
DNA - Deoxyribonucleic acid
DNase - Deoxyribonuclease
DPBS - Dulbecco’s Phosphate Buffered Saline
DPX - Mixture of distyrene, plasticizer and xylene
Dr - Doctor
dsRNA - Double stranded ribonucleic acid

xl
DW - Distillated water
e.g. - For exmple
EAE - Experimental Autoimmune Encephalomyelitis
EDTA - Ethylenediaminetetraacetic acid
ELISA - Enzyme-linked immunosorbent assay
F1 - Filial 1
F3 - Filial 3
FCS - Fetal calf serum
Foxp3 - Forkhead box P3
g Gravitational
GalC - Galactocerebrocide
GM-CSF - Granulocyte macrophage colony-stimulating factor
GWAS - Genome-wide association studies
Gy - Gray
H pylori - Helicobacter pylori

xli
HBSS - Hank’s Balanced Salt Solution
HI - High
HLA - Human Leukocyte Antigen
HMGB1 - High-mobility group protein B1
HSP70 - Heat shock protein seventy
HSP90 - Heat shock protein ninety
i.p. - Intraperitoneal
IF1H1 - Interferon Induced with Helicase C domain 1
IFA - Incomplete Freund’s Adjuvant
iGb3 - Isoglobotrihexosylceramide
IL10 - Interleukin ten
IL12 - Interleukin twelve
IL13 - Interleukin thirteen
IL17 - Interleukin seventeen
IL18 - Interleukin eighteen

xlii
IL1R - Interleukin-1 receptor
IL1 - Interleukin one alpha
IL1 - Interleukin one beta
IL2 - Interleukin two
IL21 - Interleukin twenty one
IL22 - Interleukin twenty-two
IL23 - Interleukin twenty-three
IL27 - Interleukin twenty-seven
IL3 - Interleukin three
IL4 - Interleukin four
IL5 - Interleukin five
IL6 - Interleukin six
IL7 - Interleukin seven
IFN - Interferon(s)
IFN - Interferon beta

xliii
IFN - Interferon gamma
iNKT cells - Invariant Natural Killer T cells
iNOS - Inducible nitric oxide synthase
IRAK - Interleukin-1 receptor-associated kinase 1
ISGF3
- IFN-stimulated gene factor 3
KCl - Potassium chloride
KO - Knockout
LFB - Luxol fast blue
LPS - Lipopolysaccharides
LT - Lymphotoxin
M. tuberculosis Mycobacterium tuberculosis
MBP - Myelin basic protein
MFI - Mean fluorescence intensity
Mg Miligrams
MgCl2 - Magnesium chloride

xliv
MHC - Major histocompatibility complex
MIP-1β - Macrophage inflammatory protein beta
Ml - Milliliters
mM Millimolar
MOG - Myelin Oligodendrocyte Glycoprotein
MOG35-55 - Myelin Oligodendrocyte Glycoprotein 35-55
mRNA - Messenger RNA
MS - Multiple Sclerosis
MyD88 - Myeloid differentiation primary response gene (88)
NaCl - Sodium chloride
NF- - Nuclear factor kappa-light-chain
Ng Nanograms
NK cells - Natural Killer cells
NKT cells - Natural Killer T cells
NOD - Non-obese diabetic mouse

xlv
NOD. Tlr-/- - Non-obese diabetic mouse – Toll-like receptor knockout
NOD.Tlr - Non-obese diabetic mouse – Toll-like receptor
NOD1 - Nucleotide-binding oligomerization domain-containing protein 1
NOD2 - Nucleotide-binding oligomerization domain-containing protein 2
OPC - Oligodendrocyte precursor cell(s)
PAGE - Polyacrylamide gel electrophoresis
PAMP - Pathogen Associated Molecular Pattern(s)
PBMC - Peripheral blood mononuclear cell (s)
PBS - Dulbecco’s Phosphate Buffered Saline
PCR - Polymerase chain reaction
PE - Phycoerythrin
PerCp-Cy5.5 Peridinin-chlorophyII Protein Complex with cyanine dye (Cy5.5)
PGN - Peptidoglycans
PI - Propidium Iodide
PIM - Phospatidylinositol mannosedes

xlvi
PLP - Proteolipid protein
PMA - Phorbol 12-myristate 13-acetate
Poly I:C - Polyinosinic:polycytidylic
PPMS - Primary Progressive Multiple Sclerosis
PRR - Pattern-recognition receptors
PTX - Pertussis toxin
QIMR - Queensland Institute of Medical Research
Rag - Recombination activating genes
RBC - Red blood cell
Rcf Compute relative centrifugal force
RIG-I - Retinoic acid-inducible gene 1
RIPK2 - Receptor-interacting serine/threonine-protein kinase 2
RNA - Ribonucleic acid
RORC - Retinoic acid-related orphan nuclear hormone receptor C
RPMS - Relapsing Progressive Multiple Sclerosis

xlvii
RRMS - Relapsing-Remitting Multiple Sclerosis
RT-PCR - Reverse transcription polymerase chain reaction
SD Standard deviation
SEM Standard error of mean
SFB - Segmented filamentous bacteria
siRNA - Small interfering RNA
SNP - Single-nucleotide polymorphism
SPMS - Secondary Progressive Multiple Sclerosis
ssRNA - Single stranded ribonucleic acid
STAT1
- Signal Transducer and Activator of Transcription one
STAT2
- Signal Transducer and Activator of Transcription two
T1D - Type one diabetes
T1R - Toll/interleukin-1 receptor
TAE - Tris base, acetic acid and Ethylenediaminetetraacetic acid
TCR - T cell receptor

xlviii
TCR V - T cell receptor V
TCR - T cell receptor beta
TGF-1 - Transforming grown factor beta 1
TGF - Transforming grown factor beta
Th1/Th2 - T helper 1/T helper 2
Th17 - T helper 17
Th2 - T helper 2
TIR - Toll/interleukin-1 receptor
TLR - Toll-like receptor (s)
Tlr-/- - Toll-like receptor knockout
TLR1 - Toll-like receptor one
TLR10 - Toll-like receptor ten
TLR11 - Toll-like receptor eleven
TLR13 - Toll-like receptor thirteen
TLR2 - Toll-like receptor two

xlix
Tlr2-/-Tlr9-/- - Absence of Toll-like receptor two and nine
TLR2/9 - Toll-like receptor two and nine
TLR3 - Toll-like receptor three
TLR4 - Toll-like receptor four
Tlr4-/- Tlr9-/- - Absence of Toll-like receptor four and nine
TLR4/9 - Toll-like receptor four and nine
TLR5 - Toll-like receptor five
TLR6 - Toll-like receptor six
TLR7 - Toll-like receptor seven
TLR8 - Toll-like receptor eight
TLR9 - Toll-like receptor nine
TMEV - Theiler’s Murine Encephalomyelitis Virus
TNF - Tumor necrosis factor
TRAF - TNF receptor associated factor
Tregs - Regulatory T cells

l
TRIF - TIR-domain-containing adapter-inducing interferon-β
U Units
VLA-4 - Very-late activation antigen-4
WT - Wild type
-GalCer - Alpha-galatosylceramide
TCR - Alpha T cell receptor
- Beta
g Micrograms
L Microliters
m Micrometers

CHAPTER 1

CHAPTER 1
1
CHAPTER 1
INTRODUCTION
1.1 Autoimmunity
The body responds to invading pathogens and damaged tissues by
producing pro-inflammatory molecules such as cytokines and chemokines,
generating an inflammatory response. Immune cells such as antigen
presenting cells (APC) and lymphocytes are recruited during inflammation
into the affected area(s). The cessation of the stimulus stops the production
of inflammatory mediators leading to resolution of the response (Janssen et
al., 2012).
The 1908 Nobel Laureate in Medicine, Paul Ehrlich, called autoimmunity
“horror autotoxicus” and was the first scientist to mentioned its effects
(http://www.nature.com/nature/journal/v435/n7042/pdf/435583a.pdf).
Autoimmunity is characterised by the presence of autoreactive lymphocytes
and autoantibodies and the main cause of autoimmunity is the breakdown of
self-tolerance (Silverstein, 2001; Rioux et al., 2005).

CHAPTER 1
2
The approximate prevalence of autoimmune diseases in the world is about
6-9.4% and at least 65% of affected people are women (Cooper et al., 2003;
Cooper et al., 2009; Agmon-Levin et al., 2011). Western societies have the
highest number of people with autoimmune diseases: about 5 to 6% of their
populations (Moroni et al., 2012). The number of autoimmune diseases
increases as well as its prevalence and incidence (review in Cooper GS et
al., 2003). In response to the global increase in autoimmune diseases, a
number of synthetic drugs (e.g. anti-inflammatory, immunosuppressive and
disease modified drugs) have been developed (Schütz et al., 2010).
However, many of these therapies treat the clinical signs and symptoms but
do not prevent the disease or act on the underlying cause. Many of these
drugs produce side effects and adverse symptoms affecting organs and
tissues such as liver, stomach, heart, blood vessels and kidneys (Lindberg
2013). Limits in our understanding of the etiology and biology of
autoimmunity have restricted preventive therapies, and suitable diagnostic
and therapeutic options.
To date environmental and genetic factors have been associated with the
failure of self-tolerance that triggers an autoimmune disease (McGonagle et
al., 2006; Sirota et al., 2009). Genetic factors in autoimmune diseases are
strong; however, their participation needs to be demonstrated, since
monozygotic twins do not develop autoimmunity to 100% (Gregersen,
1993; Barcellos et al., 2003; Anaya et al., 2006), suggesting that
environmental factors must be required for the initiation of autoimmunity.

CHAPTER 1
3
Moreover, it is important to note that the presentation of autoimmunity
differs among affected individuals who apparently suffer the same
autoimmune disease, supporting the hypothesis that genetics together with
environmental factors are critical for the initiation and development of
autoimmune diseases (Agmon-Levin, et al., 2011).
Despite the great efforts made and progress achieved in the study of
autoimmune diseases, many knowledge gaps remain. In particular, research
is under way to clarify how environmental factors interact with genetic
factors to initiate and maintain an autoimmune response. One potential link
between environmental factors and genetic susceptibility to autoimmune
diseases such as Multiple Sclerosis (MS) is the class of cellular
environmental sensors, Toll-like receptors (TLRs). Another potential link in
the development of MS is the deficiency and dysfunction of regulatory cells
such as Natural Killer T cells (NKTs). This literature review will focus on
the role of TLRs and NKT cells in the interaction between genetics and
environmental factors in MS and its animal model Experimental
Autoimmune Encephalomyelitis (EAE).
1.2 Multiple Sclerosis
MS is an autoimmune disease that damages the myelin sheaths in the central
nervous system (CNS) leading to demyelination, severely affecting the

CHAPTER 1
4
patient’s quality of life. Signs and symptoms related to the disease including
bladder dysfunction, bowel dysfunction, cognitive problems, depression,
difficulty walking, fatigue, headache, heat temperature sensitivity,
numbness, spasticity, difficulty swallowing, tremors and problems with
memory and vision (http://www.msaustralia.org.au). In general, MS has
four patterns: 1) relapsing-remitting (RRMS), characterised by
unpredictable relapses with partial or complete periods of recovery; 2)
secondary progressive (SPMS) that develops in patients who initially have
RRMS but progress to greater disability later; 3) primary progressive
(PPMS), characterised by slow onset and progressively worsening
symptoms; and 4) relapsing progressive (RPMS), characterised by gradual
worsening of disability together with relapses from the onset of disease
(http://www.msaustralia.org.au).
MS mainly affect young adults and is more common in women than in men,
but more severe in men than in women (Wynn et al., 1990; Duquette et al.,
1992; Moldovan et al., 2008). Sexual dimorphism is also seen in some MS
therapies, such as interferon-, which is more beneficial in women (Sena et
al., 2008).
Approximately 2.5 x 10⁶ people live with MS and there is a higher
prevalence of patients in temperate areas such as the United States, Canada,
North Europe, New Zealand and Australia (Melcon et al., 2013; Aguirre-
CHAPTER 1
5
Cruz et al., 2011; Grzesiuk 2011; Marrie et al., 2010; Milo et al., 2010;
Poppe et al., 2008; Bhigjee et al., 2007; Flachenecker et al., 2006).
Currently, approximately 21,200 Australian suffer MS and the prevalence of
the disease increases 4% every year (http://www.msaustralia.org.au).
Although advances in treatment are developing rapidly, no preventive or
curative therapies are known and the aetiology and pathogenic mechanisms
underlying the onset and development of the disease remain unclear.
1.2.1 Genetic and environmental factors in MS
Epidemiological, genetic and immunological studies of MS suggest that the
disease results from an interaction between genetic and environmental
factors. The evidence of a genetic basis for MS includes racial prevalence
and ethnic differences, familial aggregation, increased concordance in
monozygotic twins than dizygotic twins, HLA associations, linkage
association studies, genome-wide association studies (GWAS) and epistasis
studies (Bertrams et al., 1976; Ebers et al., 1993; Ebers et al., 1995; Haines
et al., 1998; Giordano et al., 2002; Harbo 2004; Hansen et al., 2005;
Hemminki et al., 2009; Ramagopalan et al., 2009; Lincoln et al., 2009;
Kemppinen et al., 2011). Environmental contributions to MS include viral
and bacterial infection, reduced ultraviolet light exposure, migration and
cigarette consumption (McLeod et al., 2012; Djelilovic-Vranic et al., 2012;
McLeod et al., 2011; Pekmezovic et al., 2006; Geier et al., 2005; Contini et
al., 2004; Munger et al., 2004; Rosati 2001; Elian et al., 1990; Visscher et
CHAPTER 1
6
al., 1981). In summary, MS is a complex genetic disease with multiple
genetic and environmental factors contributing to risk.
The molecular and cellular mechanisms of MS are also not yet fully
clarified, other than the involvement of the immune system in the
development of disease. Examples of immune system involvement include:
1) increased numbers of myelin reactive T cells in MS patients (Venken et
al., 2010; Raddassi et al., 2011); 2) accumulation of B cells in cerebrospinal
fluid (CSF) of MS patients (Colombo et al., 2000); 3) dysfunction of Tregs
in MS patients (Viglietta et al., 2004; Fransson et al., 2010; Venken et al.,
2008); 4) increased activity of monocytes in peripheral blood of MS patients
(Kouwenhoven 2001); 5) decrease activity of NK cells in MS patients
(Lünemann et al., 2011); 6) activation of microglia in cortical lesions of MS
(Kastrukoff et al., 1998); 7) high numbers of monocytes in acute MS lesions
(Hammann et al., 1986); 8) high proportion of Ig-containing cells in MS
plaques (Esiri 1980); 9) association of single nucleotide polimorphisms in
IL2 and IL7 cytokine receptors with MS and; 10) increased expression of
BAFF and CXCL13 chemokines during MS relapses in CSF (Ragheb et al.,
2011; Dalla Libera et al., 2011; Wootla et al., 2011). All together, resident
and infiltrating APC and lymphocytes generate a chronic inflammatory
response against unclear antigens in MS.

CHAPTER 1
7
1.3 Toll-like receptors
Toll-like receptors (TLRs) are part of the family of Pattern-recognition
receptors (PRR) (Table 1.1) that identify Pathogen Associated Molecular
Patterns (PAMP) or damage associated molecular patterns (DAMP) and
trigger an immune response against invaders and/or self components (Akira
et al., 2006; Sutmuller et al., 2006; Kaisho et al., 2006). Thirteen members
of the TLR family have been identified. Humans express 11 members (from
TLR1 to TLR11) and mice express 12 members of the TLR family (from
TLR1 to TLR9 and from TLR11 to TLR13) (Takeuchi et al., 1999; Tabeta
et al., 2004; Kaisho et al., 2006; Kawai et al., 2007). TLRs have been
classified according their localization in two groups (Appendix 1): 1)
Extracellular, which include TLR1, TLR2, TLR4, TLR5, TLR6, TLR10
and; 2) Intracellular, which contain TLR3, TLR7, TLR8, TLR9, TLR11,
TLR13 (Akira et al., 2006; Kaisho et al., 2006; Govindaraj et al., 2010;
Pifer et al., 2011; Oldenburg et al., 2012). The genes Tlr7 and Tlr8 are
localized in chromosome X (Du X, et al., 2000).
TLRs respond to different components of microorganisms. For example,
TLR1, TLR2 and TLR6 respond to lipopeptides; TLR4 identifies
lipoglycans; TLR5, TLR11 sense proteins; and TLR3, TLR7, TLR8, TLR9
and TLR13 react against nucleic acids (Roach et al., 2005). TLRs also form
heterodimers. For example, TLR2 can heterodimerize with TLR1 and TLR6
and TLR10; TLR10 can also heterodimerize with TLR1 (Takeda et al.,

CHAPTER 1
8
2002; Quesniaux et al., 2004; Hasan et al., 2005; Matsumoto et al., 2012).
Activation of TLRs leads to the production of Type I interferon and pro-
inflammatory cytokines (Akira et al., 2006). Interestingly, TLRs are
expressed in almost every tissue of the body, including the immune cells
and CNS cells (Takeda et al. 2002; Bsibsi et al., 2002).
To summarize, TLRs respond to extracellular and intracellular stimuli from
the main components of microorganisms and signal of damage, indicating
that they are a key component in the generation of immune responses
against invaders. Moreover, TLRs are expressed in most cells of the body,
suggesting that this family of receptors can promptly initiate an immune
response in every bodily tissue. The failure of tolerance that leads to
autoimmunity in MS may be related to immune responses triggered by
TLRs, as TLRs are expressed in resident and infiltrating cells in the CNS
and trigger the activity of other genes involved in the pathogenesis of MS.
1.4 Toll-like receptors in Multiple Sclerosis
The immune system responds to environmental factor stimuli by the
maturation of antigen presenting cells (APCs) and lymphocytes via cellular
receptors such as TLRs (TLR; Weber et al., 2004; Visser, et al., 2005).
TLR mediate responses to self components called DAMPs; e.g. high
mobility group Figure 1.1 (HMGB1), heat shock protein 70 (HSP70), heat

CHAPTER 1
9
shock protein 90 (HSP90), and cellular RNA), and components of
microorganisms termed PAMPs; e.g., lipoproteins or lipopeptides,
peptidoglycans, lipopolysaccharides (LPS), single stranded ribonucleic acid
(ssRNA), double stranded ribonucleic acid (dsRNA) and CpG-DNA). TLR
ligation can trigger an inflammatory immune response and cell migration
(Taukeuchi et al., 1999; Hemmi et al., 2000; Alexopoulou et al., 2001;
Wang et al. 2004; Takeuchi et al., 2010).
In MS, leucocytes such as monocytes, dendritic cells (DCs), NK cells, CD4+
and CD8+ T cells and B cells, migrate and accumulate in the central nervous
system (CNS) mediating myelin destruction and neuronal cell death
(Toneatto et al., 1999; Deng et al., 2003; Walder et al., 2004). Both
infiltrating and resident cells of the CNS express TLRs and their expression
increases in MS (Zekki et al., 2002; Lafon et al., 2006; Zhou et al., 2009).
Augmentation of TLR expression in the CNS has been also associated with
degenerative, neuro-protective and restorative functions (Bsibsi et al., 2006;
O'Brien et al., 2008, Enevold et al., 2010).
1.4.1 Toll-like Receptor One in Multiple Sclerosis
TLR1 is expressed as a heterodimer with TLR2, and binds bacterial triacyl
lipopeptides. It is widely expressed on APC monocytes, macrophages, DC
and B cells. It is also expressed on Human NT2-N and CHP-212 neuronal

CHAPTER 1
10
cell lines (Prehaud et al., 2005, Lafon et al., 2006, Zhou et al., 2009) and has
been identified by RT PCR on microglia (Bsibsi et al., 2002). TLR1 is down
regulated in peripheral blood mononuclear cells (PBMC) of MS patients and
up regulated in patients treated with IFN (Fernald et al., 2007, Singh et al.,
2007).
1.4.2 Toll-like Receptor Two in Multiple Sclerosis
TLR2 is expressed as both a homodimer and as a heterodimer, partnered
with either TLR1 or TLR6. It is expressed on monocytes, macrophages and
myeloid DC, and can bind a wide range of ligands, including lipoteichoic
acid from Gram-positive bacteria, bacterial lipopeptides and glycolipids,
fungal beta glucan (zymosan) and endogenous DAMPs Hyaluronan, HSP70
and HMGB1. TLR2 has been identified on CNS endothelial cells,
microglia, astrocytes and oligodendrocytes (Bsibsi et al., 2002, Nagyoszi et
al., 2010) and on infiltrating cells in MS. It is up regulated on PBMCs,
cerebrospinal fluid (CSF) mononuclear cells and in demyelinating lesions of
MS patients (Bsibsi et al., 2002, Prehaud et al., 2005, Lafon et al., 2006,
Zhou et al., 2009, Sloane et al., 2010).
MS relapses have been reported during bacterial infections (Correale et al.,
2006). Monocyte-derived dendritic cells from MS patients with bacterial
infections express higher levels of HLA-DR and costimulators than those

CHAPTER 1
11
from uninfected patients and drive higher production of IL12, IL17 and
IFN (Correale and Farez, 2007). Several TLR2 ligands have been identified
in the brains and CSF of MS patients. For example, the TLR2 ligand
peptidoglycan, a major component of the Gram-positive bacterial cell walls,
has been reported as present in the brains of MS patients within
macrophage/DC-like APC that express costimulatory molecules (CD80,
CD86 and CD40) and proinflammatory cytokines (IL1, IL6, IL12, TNF
and IFN; (Schrijver et al., 2001). High numbers of macrophages and
microglia expressing the endogenous TLR2 ligand HMGB1 are also found
in acute and RRMS (Andersson et al., 2008). The migration and
differentiation of oligodendrocyte precursor cells (OPC) play important
roles in myelin repair after inflammatory damage. MS lesions contain
hyaluronan deposits that, once fragmented by the hyaluronidases expressed
by OPCs, inhibit the maturation of OPC and remyelination via TLR2
ligation (Sloane et al., 2010, Back et al., 2005, Visser et al., 2005).
The TLR2 ligand zymosan can modulate the severity of MS by inducing
peripheral blood DC from MS patients treated with IFN to secrete IL10,
which suppresses IL23 and IL1 production (Sweeney et al., 2011).
Similarly, surface expression of TLR2 on B cells and DC was significantly
higher in helminth-infected MS patients, who had better clinical and
radiological outcomes than uninfected patients. Protection was associated
with regulatory T cell induction and increased TGFβ and IL10 levels. In

CHAPTER 1
12
contrast, immunisation with S. pneumoniae exacerbates MS (de la Monte et
al., 1986).
1.4.3 Toll-like Receptor Three in Multiple Sclerosis
TLR3 is expressed in DC and B cells and binds double-stranded (viral)
RNA and the endogenous microtubule regulator stathmin. TLR3 ligation
induces the activation of NF-κB via the adaptor TRIF to increase production
of type I interferons. Cerebral endothelial cells (Nagyoszi et al., 2010),
neurons, microglia, astrocytes and oligodendrocytes express TLR3 (Bsibsi
et al., 2002, Farina et al., 2005, Jack et al., 2005, Lafon et al., 2006). Adult
normal human astrocytes increase the production of anti-inflammatory
cytokines such as IL10 and downregulate proinflammatory cytokines such
as IL12 (p40) and IL23 in response to TLR3 ligation (Bsibsi et al., 2002).
The endogenous TLR3 ligand stathmin was identified in astrocytes,
microglia, and neurons of MS-affected human brain, and was shown by
cDNA arrays to initiate the same set of neuroprotective factors as the
synthetic TLR3 agonist polyinosinic:polycytidylic (poly I:C) acid (Bsibsi et
al., 2010).
Association studies of TLR3 sequence variants have failed to identify any
significant association with MS (Szvetko et al., 2009, Szvetko et al., 2010).

CHAPTER 1
13
1.4.4 Toll-like Receptor Four in Multiple Sclerosis
TLR4 is expressed on monocytes and macrophages, myeloid DC and T and
B lymphocytes, as well as intestinal epithelium. It can bind LPS from Gram-
negative bacteria, bacterial and endogenous HSP, as well as the endogenous
ligands HMGB1, fibrinogen, heparan sulphate and hyaluronic acid.
TLR4 expression has been identified in cerebral endothelial cells (Nagyoszi
et al., 2010) and microglia by RT-PCR (Bsibsi et al., 2002). Both TLR4 and
its endogenous ligand HMGB1 are increased in expression in the CSF
mononuclear cells of MS patients compared to healthy controls (Andersson
et al., 2008). Association studies of functional (missense) mutations in TLR4
(Asp299Gly and Thr399Ile) failed to identify any association with MS
(Kroner et al., 2005, Reindl et al., 2003). A subsequent study of nine TLR4
single nucleotide polymorphisms (SNP) tested for association with MS in
362 MS patients and 467 healthy controls also failed to identify any
significantly associated loci (Urcelay et al., 2007).
1.4.5 Toll-like Receptor Five in Multiple Sclerosis
TLR5 binds bacterial flagellin and is expressed on monocytes and
macrophages, some DC and intestinal epithelium; its expression has been

CHAPTER 1
14
identified in microglia by RT-PCR (Bsibsi et al., 2002). Little has been
published on any role it may play in MS.
1.4.6 Toll-like Receptor Six in Multiple Sclerosis
TLR6 is expressed on monocytes and macrophages, B cells and mast cells
and it binds to diacyl lipopeptides from Mycoplasma. It has been identified
in cerebral endothelial cells and microglia by RT-PCR (Bsibsi et al., 2002).
The TLR6 SNP rs5743810 was associated with the development of IFNβ-
specific neutralizing antibodies in men but not in women after 24 months of
treatment with IFN (Enevold et al., 2010).
1.4.7 Toll-like Receptor Seven in Multiple Sclerosis
TLR7 is expressed in monocytes and macrophages, plasmacytoid DC and B
cells, and binds to single-stranded (viral) RNA. TLR7 expression has been
identified in microglia by RT-PCR (Bsibsi et al., 2002).
The pro-inflammatory cytokine IL17 plays a critical role in the
immunopathogenesis of MS and EAE (Matusevicius et al., 1999, Lock et
al., 2002, Hofstetter et al., 2005, Chen et al., 2006, Hecker et al., 2011) and
its production is downregulated by type I IFNs (Guo et al., 2008; Kürtüncü

CHAPTER 1
15
et al., 2012). In vitro treatment of human monocyte-derived DCs with
IFNβ1a induced the expression of TLR7 and, in a TLR7-dependent fashion,
the members of its downstream signalling pathway (MyD88, IRAK4, and
TRAF6), but inhibited the expression of IL1R. TLR7 expression was also
necessary for IFNβ1a-induced secretion of IL27 by DCs and the inhibition
of IL1β and IL23. Supernatants from IFNβ1a-treated DCs inhibited Th17
differentiation of CD4 T cells, with down regulation of retinoic acid-related
orphan nuclear hormone receptor C (RORC) and IL17A gene expression and
IL17A secretion. Again, inhibition of IL17A was TLR7 dependent and
could be blocked by TLR7 siRNA silencing (Zhang et al., 2009).
At the onset of MS, a subset of patients (11 of 61) expressed elevated
mRNA levels of TLR7, together with RIG-1 and IFIH1 – an IFN expression
signature potentially attributable to an overactivity of IFN-stimulated gene
factor 3 (ISGF3, a complex formed by STAT1, STAT2 and IFN regulatory
factor 9). This phenotype was shared by a subset of healthy control subjects
(Hundeshagen et al., 2012). Patients with a relatively high IFN expression
signature at baseline showed no significant modulation in the expression of
the genes involved in IFN -related pathways during IFNβ therapy. In
contrast, patients with a low endogenous IFN gene signature showed strong
gene induction after 1 month of treatment (Hundeshagen et al., 2012).

CHAPTER 1
16
1.4.8 Toll-like Receptor Eight in Multiple Sclerosis
TLR8 is expressed on monocytes and macrophages, a subset of DC and
mast cells; it binds to single stranded (viral) RNA. TLR8 expression has
also been identified in microglia by RT-PCR (Bsibsi et al., 2002). As is the
case for TLR7, at the onset of MS, a subset of patients and healthy controls
express elevated mRNA levels of TLR8, as part of an endogenous IFN gene
signature (Hundeshagen et al., 2012).
1.4.9 Toll-like Receptor Nine in Multiple Sclerosis
TLR9 is expressed in monocytes and macrophages, plasmacytoid DC and B
cells; it binds to unmethylated CpG DNA, which is present in bacteria and
DNA viruses. TLR9-expressing plasmacytoid DC are present in the
leptomeninges and demyelinating lesions of patients with MS. Plasmacytoid
DC are a major source of type I IFN, and secrete IFN in response to TLR9
ligation within the early endosomes (Liu, 2005) and this response is
enhanced in untreated patients with MS (Balashov et al., 2010). IFNβ
treatment down regulates the expression of TLR9 in MS patients with a low
endogenous IFN gene signature (Hundeshagen et al., 2012) and inhibits
TLR9 processing (activation) and TLR9 ligation-induced secretion of IFN
by plasmacytoid DC in all treated patients (Aung et al., 2010, Balashov et
al., 2010).
CHAPTER 1
17
Following stimulation of TLR9 by CpG-DNA (with or without stimulation
via the B cell receptor and CD40), the B cells of MS patients secrete more
lymphotoxin (LT), TNF and IL12, and less IL10, than those of healthy
controls (Bar-Or et al., 2010, Hirotani et al., 2010). The TLR9-stimulated
production of IL10 correlates with TLR9 expression levels in CD27+
(memory) B cells, which is significantly reduced in MS patients (Hirotani et
al., 2010).
1.4.10 Toll-like Receptor Ten in Multiple Sclerosis
Little is known about TLR10, its tissue distribution, its specificity or any
possible role in MS.
1.4.11 Toll-like Receptor Eleven in Multiple Sclerosis
TLR11 is expressed on monocytes and macrophages, as well as in the liver
and in kidney and urinary bladder epithelial cells. It binds profilin from the
parasite Toxoplasma gondii and an unidentified ligand from uropathogenic
Escherichia coli (Zhang et al., 2004; Yarovinsky et al., 2005). Little has
been published on any role TLR11 may play in MS.

CHAPTER 1
18
1.5 Animal Models of Multiple Sclerosis
Clinical research on MS is supported by animal models of the pathogenesis
and immunoregulation of CNS autoimmunity. Commonly used models in
the research of MS include:
1) Cuprizone
Cuprizone is a copper chealator that induces oligodendrocyte cell death,
reversible demyelination, axonal injury and microglial activation (Kipp et
al., 2009, Werner et al., 2010). It is used to model aspects of demyelination,
OPG migration and activation, and remyelination.
2) Theiler’s murine encephalomyelitis virus
Theiler’s murine encephalomyelitis virus (TMEV) is a single stranded RNA
murine cardiovirus used to infect genetically susceptible mice (e.g. SJL
strain) intra-cerebrally, resulting in persistent infection and chronic
demyelinating disease (Turrin, 2008). The TMEV DA strain infects
astrocytes, microglia and macrophages, resulting in chronic
encephalomeyelits that resembles the chronic and progressive forms of MS
(Theiler, 1937, Dal Canto and Lipton 1977). The disease can also be
induced in resistant mouse strains (e.g. C57BL/6 strain) by activating innate
immunity with two LPS injections after TMEV infection (Turrin, 2008).
CHAPTER 1
19
3) Experimental autoimmune encephalomyelitis
Experimental autoimmune encephalomyelitis (EAE) is a family of models
of autoimmune CNS damage induced by the immunisation of experimental
animals with CNS components (either an extract, purified protein or a
peptide), usually in the presence of an adjuvant (Baxter, 2007).
1.5.1 Experimental Autoimmune Encephalomyelitis
The pathogenesis of CNS damage caused by EAE, and the specific CNS
components targeted, are affected by strain and species of animal, choice of
antigen (e.g. myelin oligodendrocyte glycoprotein (MOG), proteolipid
protein (PLP) or myelin basic protein (MBP)) and adjuvant (e.g. Complete
Freund’s Adjuvant (CFA), CpG, LPS or Pertussis toxin (PTX)), and
whether the disease studied is active (i.e. that occurring in the immunised
individual) or passive (i.e. that occurring in the recipient of adoptively
transferred T cells from the immunised individual). Various combinations
can result in monophasic, relapsing–remitting or chronic EAE (Bettelli et
al., 2003, Stromnes and Goverman, 2006).
As a generalization, EAE in mice is associated with an autoimmune CD4 T
cell response dominated by the production of IFN and IL6, IL23 and IL17;

CHAPTER 1
20
features it shares with MS (Gijbels et al., 1990; Jewtoukoff et al., 1992;
Kuchroo et al., 1993; Stromnes and Goverman; 2006, Holmoy, 2007;
Aranami and Yamamura, 2008; Miljković et al., 2011; Komiyama et al.,
2006). Damage to the blood-brain barrier permits the influx of monocytes
and macrophages, DCs, NK cells, CD4+ and CD8+ T cells, NKT cells and
B-lymphocytes. CNS resident cells respond with astrocytic hypertrophy,
microglial activation and OPG migration and activation (Sriram et al., 1982;
Zamvil and Steinman, 1990; Jaskiewicz, 2004; Jack et al., 2005; von
Budingen et al., 2006). The model is characterised by autoantibody
production and inflammation, demyelination, axon damage and atrophy of
the CNS (Karlsson et al., 2003; Bö et al., 2006; Hafler et al., 2005; Sospedra
and Martin, 2005). CNS inflammation in the mouse model is predominately
restricted to the spinal cord, causing an ascending flaccid paralysis that
starts in the tail and progresses to the hind limbs and then the forelimbs
(Stromnes and Goverman, 2006).
Responses to the antigens administered are associated with the generation of
autoreactive T cells and the induction of autoantibodies (Stefferl et al.,
1999). While disease can occur in the absence of adjuvant, the rate of onset,
incidence and severity of disease are all enhanced by the administration of
adjuvant at the time of immunisation (Baxter, 2007). CFA is the most
commonly used (Billiau and Matthys, 2001). PTX is believed to facilitate
leucocyte infiltration into the CNS (Linthicum et al., 1982), increase
secretion of IL12 and IL6 (Hofstetter et al., 2002; Racke et al., 2005),

CHAPTER 1
21
decrease production of IL10 and decrease differentiation of regulatory
CD4+CD25+ T cells (Tregs) (Pasare and Medzhitov, 2003).
This system has significant limitations in modeling some aspects of MS, but
these limitations are generally well characterised: i) The initiation is
unlikely to reflect a natural correlate in MS; ii) Where a single protein or
peptide has been introduced, the diversity of antigenic targets seen in MS is
not reflected; iii) As disease is induced by introduction of an extrinsic
antigen, the roles of MHC class I presentation and CD8 T cells in induction
are completely absent, and in pathogenesis are imperfectly modelled; and
iv) Not all molecular and cellular components of the immune system have
identical functions in non human species.
These limitations have resulted in failure of some therapies identified in
preclinical studies to exhibit significant activity in clinical trials. In
particular, therapies targeted at specific HLA/peptide/TCR interactions
resulting from EAE studies using defined induction antigens have
performed poorly (Baxter, 2007). Nevertheless, EAE has been, and remains,
a critically important model system for studying many aspects of CNS
autoimmunity, such as: immune cell trafficking, CNS entry and apoptosis;
roles of endogenous and infiltrating cells in CNS damage and repair;
interactive cellular and cytokine networks; and the immunoregulation of

CHAPTER 1
22
remission and relapse. To date, every effective therapy for MS has been
successfully trialed in EAE.
The mouse model of EAE has a particular advantage in studying the roles of
TLR in CNS autoimmunity, because it provides a well-validated platform
for specific gene deletion.
1.6 MyD88 in Animal Models of Multiple
Sclerosis
There is a consensus that EAE is dependent on MyD88 (Prinz et al., 2006;
Marta et al., 2008), an adaptor protein for both TLR and cytokine signalling
(Adachi et al., 1998; Zhang et al., 1999). The cytoplasmic portions of TLR
receptors include a conserved motif, termed the toll/interleukin-1 receptor
(TIR) domain. The TIR domains of TLRs are homologous with the
respective domain of the interleukin 1 receptor (IL1R) and the cytoplasmic
adaptor protein family. The TIR domains of the adaptor proteins interact
with those of TLRs or IL1R and trigger the activation of downstream
protein kinases and multiple transcription factors, including the NFB
family. All TLR except TLR3 signal through the adaptor protein MyD88;
TLR3 signals through a MyD88-independent, TRIF-dependent pathway and

CHAPTER 1
23
TLR4 uses both MyD88-dependent and -independent pathways (Kumar et
al., 2009).
Increased expression of MyD88 mRNA was found in the MOG35-
55/CFA+PTX induced model of EAE in C57BL/6 mice (Prinz et al., 2006)
and targeted gene deletion of Myd88 reduced expression of several key
inflammatory cytokines, including IL6, IL23 and IL17, and prevented EAE
(Prinz et al., 2006; Marta et al., 2008). Paradoxically, MyD88-signalling in
B cells induced IL10, which inhibited secretion of IL-6, IL-12, IL-23, and
TNF by CpG-activated DC, suppressing inflammatory T cell responses in
EAE and aiding recovery from disease (Lampropoulou et al., 2008).
1.6.1 Toll-like Receptor One in Animal Models of
Multiple Sclerosis
Although Tlr1 mRNA expression is increased in the MOG35-55/CFA+PTX
induced (active) model of EAE, the clinical course of the disease in the
absence of TLR1 has not been studied (Prinz et al., 2006); Table 1.1).
CHAPTER 1
24
1.6.2 Toll-like Receptor Two in Animal Models of
Multiple Sclerosis
Increased expression of TLR2 mRNA was found in the MOG35-
55/CFA+PTX induced model of EAE in C57BL/6 mice (Prinz et al., 2006),
as well as in the EAE model induced in rats immunized with recombinant
rat MOG in IFA (Andersson et al., 2008) and in mice after TMEV infection
(Turrin, 2008).
The effects of Tlr2 targeted deletion on active EAE appear to be operator
dependent. While Prinz et al (2006) and Hermann et al (2006) reported mice
deficient of TLR2 developing a normal clinical course of active EAE, Shaw
et al (2011) reported a mild decrease in the clinical scores in female mice,
and Reynolds et al (2010) described a similar result in adoptive transfer
recipients of Tlr2-/- bone marrow.
Cells differentiated in the presence of the TLR2 ligand Pam3Cys showed a
∼50% increase in the proportion expressing IL17, while Tlr2−/− T cells did
not exhibit obvious differences in Th17 polarization in the absence of
exogenous TLR2 ligands compared to WT controls; the number of IL-17-
producing Tlr2−/− cells was also unaffected when stimulated with Pam3Cys
(Reynolds et al., 2010).

CHAPTER 1
25
Exacerbation of MS after active immunisation with a pneumococcal vaccine
has been reported by de la Monte et al., (1986) and Herrmann et al., (2006)
confirmed a similar effect of Streptococcus pneumonie infection on EAE;
this effect was TLR2 dependent. Similarly, phosphorylated
dihydroceramides from the common human oral bacterium Porphyromonas
gingivalis induced dendritic cell IL6 production, decreased spinal cord
Foxp3+ T cells and enhanced EAE in a TLR2-dependent manner (Nichols et
al., 2009; Nichols et al., 2011).
Visser et al (Visser et al., 2005; Visser et al., 2006) hypothesized that
peptidoglycan can contribute to disease development and progression in MS
and EAE in the absence of infection or bacterial replication. They found that
bacterial peptidoglycan was able to be substituted for heat killed
Mycobacteria tuberculosis in CFA in the induction of active EAE (Visser et
al., 2005). They subsequently reported persistence of TLR ligands in the
CNS in MS patients as well as in two nonhuman primate models of EAE,
associated with reduced local expression of two major PGN-degrading
enzymes, lysozyme and N-acetylmuramyl-l-alanine amidase (Visser et al.,
2006). As peptidoglycan can be sensed by cytoplasmic PAMP receptors
(NOD1 and NOD2) in addition to TLR2, Shaw et al (2011) compared
induction of MOG35-55/CFA+PTX EAE in female Tlr2-/-, Nod1−/−, Nod2−/−,
and Ripk2−/− mice. Tlr2-/- mice decrease the severity of EAE while Nod1−/−,

CHAPTER 1
26
Nod2−/−, and Ripk2−/− mice showed arguably greater protection (Shaw et al.,
2011). The authors make a good case for RIP2 at least contributing to
activation of CNS-infiltrating dendritic cells, and thereby EAE, in
WT/Ripk2−/− bone marrow chimeric mice (Shaw et al., 2011).
As for MS, DAMPs that are TLR2 ligands have also been associated with
EAE. For example, HMGB1 has been identified in active EAE lesions and
its levels correlate with active inflammation (Andersson et al., 2008).
Increased serum concentrations of 15-a-hydroxicholestene (15-HC) have
also been identified in mice with secondary progressive EAE and 15-HC
activated microglia, macrophages and astrocytes, and enhanced expression
of TNF, iNOS and CCL2 mRNA in CNS-infiltrating
monocytes/macrophages, through a pathway involving TLR2 (Farez et al.,
2009).
1.6.3 Toll-like Receptor Three in Animal Models of
Multiple Sclerosis
Although increased expression of TLR3 was not found in the MOG35-
55/CFA+PTX induced model of EAE in C57BL/6 mice (Prinz et al., 2006),
it was upregulated in mice susceptible to demyelinating disease (SJL strain)
after TMEV infection, but not in resistant mice (Turrin, 2008).

CHAPTER 1
27
Repeated i.p. injections of the TLR3 ligand poly I:C (a double-stranded
RNA analog) induced expression of endogenous IFNβ and the peripheral
induction of the CC chemokine CCL2, and strongly inhibited EAE induced
in SJL/J mice by immunisation of PLP peptide 139-151 in CFA (Touil et
al., 2006).
1.6.4 Toll-like Receptor Four in Animal Models of
Multiple Sclerosis
Increased expression of Tlr4 mRNA was found in the MOG35-55/CFA+PTX
induced model of EAE in C57BL/6 mice (Prinz et al., 2006), as well as in
the Dark Agouti rat EAE model with MOG emulsified in incomplete
Freund’s adjuvant (Andersson et al., 2008).
Conflicting outcomes have been published in studies of EAE susceptibility
in mice deficient in TLR4. C57BL/6.Tlr4 deficient mice showed increased
Il6 and Il23 mRNA expression by myeloid DC, an increased proportion of T
cells producing IL17 and increased EAE clinical scores following
immunisation with recombinant rat MOG (Marta et al., 2008). In contrast,
in the MOG35-55 peptide-induced model, the severity of disease was
unaffected by targeted deletion of Tlr4 (Kerfoot et al., 2004), unless a
CHAPTER 1
28
marginal dose of M. tuberculosis was used in the inoculum, in which case
the severity of disease was sometimes reduced compared to C57BL/6 in a
mechanism that appeared to involve pertussis toxin (PTX) signalling
through TLR4 (Kerfoot et al., 2004). In a model of active EAE induced in
C57BL/6. Rag1-/- hosts reconstituted by CD4 T cell adoptive transfer from
either WT or Tlr4-/- mice, the prevalence of EAE induced by MOG35-
55/CFA+PTX was halved in the recipients of Tlr4-/- T cells (Reynolds et al.,
2012). The protected mice had reduced numbers of infiltrating cells and
consequently reductions in Il17, Ifng, Ccr6 and Ccl2 transcripts in total
CNS mRNA analyses.
The TLR4 ligand poly-g-glutamic acid from Bacillus subtilis signals naive
CD4+ T cells via TLR4 and MyD88 to induce TGFβ and upregulate FoxP3
expression, suppressing EAE in the C57BL/6 MOG35-55/CFA+PTX model
(Lee et al., 2012).
Complement C5a synergizes with TLR4 ligation by LPS to induce APC to
produce serum factors, including IL6, that drive Th17-cell differentiation
(Fang et al., 2009). In the passive (adoptive transfer) model of MOG38-
50/CFA, if the T cells to be adoptively transferred were first re-stimulated in
vitro in the presence of serum from mice treated with C5a in addition to
LPS, a greater severity of EAE resulted (Fang et al., 2009).

CHAPTER 1
29
Different models of EAE reproduce various aspects of EAE but no single
model replicates MS. The review of literature about the role of TLR4 in
EAE is difficult to interpret because EAE is influenced by auto-antigens,
adjuvants, doses and genetic background. However, it is possible to deduce
that T cells require of TLR4 signalling to promote or regulate EAE.
1.6.5 Toll-like Receptor Five in Animal Models of
Multiple Sclerosis
Little is known about the role of TLR5 in animal models of MS. TLR5 was
not increased in expression in the MOG35-55/CFA+PTX induced model of
EAE in C57BL/6 mice (Prinz et al., 2006).
1.6.6 Toll-like Receptor Six in Animal Models of
Multiple Sclerosis
Increased expression of Tlr6 mRNA was found in the MOG35-55/CFA+PTX
induced model of EAE in C57BL/6 mice (Prinz et al., 2006), as well as in
mice susceptible to demyelinating disease (SJL strain) after TMEV
infection, but not in resistant mice (Turrin, 2008). Targeted deletion of Tlr6
did not affect the severity of EAE in C57BL/6 mice (Prinz et al., 2006;
Marta et al., 2008).

CHAPTER 1
30
1.6.7 Toll-like Receptor Seven in Animal Models of
Multiple Sclerosis
Increased expression of Tlr7 mRNA was found in the MOG35-55/CFA+PTX
induced model of EAE in C57BL/6 mice (Prinz et al., 2006) as well as in
mice after TMEV infection (Turrin, 2008).
Repeated low dose administration of the synthetic TLR7 agonist 9-benzyl-
8-hydroxy-2-(2-methoxyethoxy) adenine upregulated expression of the TLR
signal inhibitors IRAK-M, and SHIP-1, and induced hyporesponsiveness to
TLR2, -7 and -9, resulting in reduced EAE clinical scores in the MOG35-
55/CFA+PTX induced model (Hayashi et al., 2009). The TLR7 agonist
Imiquimod, administered on days one, three and five post administration of
MOG35-55/CFA+PTX also delayed disease onset and reduced EAE clinical
scores; the treatment was associated with the endogenous production of
IFN (O’Brien et al., 2010).

CHAPTER 1
31
1.6.8 Toll-like Receptor Eight in Animal Models of
Multiple Sclerosis
Increased expression of Tlr8 mRNA was found in the MOG35-55/CFA+PTX
induced model of EAE in C57BL/6 mice (Prinz et al., 2006) as well as in
mice susceptible to demyelinating disease (SJL strain) after TMEV
infection, but not in resistant mice (Turrin, 2008). Intra-axonal
accumulations of TLR8 protein were confirmed for the MOG35-
55/CFA+PTX model (Soulika et al., 2009). Little else is known about the
potential role of TLR8 in animal models of MS.
1.6.9 Toll-like Receptor Nine in Animal Models of
Multiple Sclerosis
Increased expression of Tlr9 mRNA was found in the MOG35-55/CFA+PTX
induced model of EAE in C57BL/6 mice (Prinz et al., 2006), as well as in
mice after TMEV infection (Turrin, 2008).
Whereas C57BL/6.Tlr9-/- mice showed a decreased severity of disease
following EAE induction with MOG35-55 (Prinz et al., 2006), disease was
exacerbated in TLR9-deficient mice treated with recombinant rat MOG
(Marta et al., 2008). Lampropoulou et al., (2008) examined EAE
susceptibility of mice bearing TLR9-deficiency on only B cells by using a

CHAPTER 1
32
mixed bone marrow chimeric system with MT mice (carrying a gene
deletion of the µ heavy chain) and Tlr9−/−Cd40−/− mice as donors and WT
mice as recipients. The onset and recovery from EAE was indistinguishable
from that of control mice (Lampropoulou et al., 2008).
Consistent with TLR9 playing a role in EAE pathogenesis, TLR9 ligation
with CpG DNA was able to induce EAE. Mice that expressed the transgenic
TCR 5B6, which is specific for the PLP peptide 139-151, on the EAE-
resistant (EAE-resistant) B10.S background rarely developed spontaneous
EAE, in contrast to 5B6 transgenic mice on the EAE-susceptible SJL
background. The relative resistance to spontaneous EAE in transgenic
B10.S mice appeared to be due to a lower activation state of the APCs.
When APCs in 5B6 transgenic B10.S mice were activated by TLR9 ligation
with CpG DNA, T cell tolerance was broken, resulting in encephalomyelitis
(Walder et al., 2004). Similar results were obtained in an analogous, but
non-transgenic system: Adult SJL mice injected i.p. with a PLP peptide
emulsified in IFA fail to mount proliferative or cytokine responses and are
protected from EAE upon subsequent challenge with the PLP/CFA. Again,
the tolerized PLP-specific lymph node cells regained the ability to transfer
EAE once reactivated in vitro in the presence of CpG oligonucleotides
(Ichikawa et al., 2002). Finally, a combination of TLR4 and TLR9 agonists
(CpG-ODN and LPS) was able to replace mycobacteria in Freund’s

CHAPTER 1
33
adjuvant to induce EAE in Lewis rats immunized with MBP peptide 68-86
(Wolf et al., 2007).
1.6.10 Toll-like Receptors Eleven, Twelve and
Thirteen in Animal Models of Multiple Sclerosis
Nothing has been published on the potential roles of these TLR in animal
models of MS.
To summarize, TLRs play an important role in CNS autoimmune
inflammation; however, research about the role of TLRs has been done
using different protocols for EAE induction and different environments,
which seem to lead to conflicting results and unclear interpretation. It is
necessary to clarify confronting data by using a single protocol in the same
environment. Moreover, it is also important to know the phenotype of EAE
in the absence of TLRs in both male and females in order to establish
clearer data for the development of more specific therapies.

CHAPTER 1
34
1.7 Natural Killer T cells in Multiple Sclerosis
and Experimental Autoimmune
Encephalomyelitis
Natural Killer T cells (NKT cells) are a heterogeneous group of T cells
identified in 1987 that originate in the thymus (Fowlkes et al., 1987; Pellicci
et al., 2002). NKT cells express common markers from both T cells and NK
cells such as CD161 (NK1.1), CD122 (IL-2R) and TCR (Godfrey et al.,
2000; MacDonald HR. 2002).
Recognition of antigens by NKT cells is restricted by the CD1d molecule
(Godfrey et al., 2000; MacDonald 2002). NKT cells are activated by
exogenous and endogenous ligands such as -galatosylceramide (-
GalCer), -glycuronsyl ceramides, -galactosyl diacylglycerol,
phospatidylinositol mannosedes (PIM), lipophosphoglycans and
isoglobotrihexosylceramide (iGb3) (Kinjo et al., 2005; Speak et al., 2008;
and Muindi et al., 2010).

CHAPTER 1
35
1.7.1 NKT cells classification
In general two different classification systems group NKT cells:
1) According to the NKT cells’ surface expression and function, humans
have 3 subsets of NKT cells: a) CD4+CD8-, b) CD4-CD8- and c) CD4-CD8+)
and mice have 2 subsets of NKT cells: a) CD4+CD8- and b) CD4-CD8-)
(review in Berzins et al., 2011).
2) According to the NKT cells’ reactivity to the Glycolipid -GalCer, the
CD1d-dependent and the TCR chains, NKT cells have 2 subsets: a) Type I
NKT cells or iNKT cells (invariant V24+J18 in humans and V14+J18
in mice) which react to -GalCer in a CD1d dependent manner and are
limited to TCR. This group includes a CD4+ and a CD4-CD8- populations;
b) Type II NKT cells which do not react to -GalCer, are CD1d dependent
and have diverse TCR (Seino et al., 2005).
NKT cells produce large amounts of IL4 after activation (Bendelac et al.,
1997). Different subsets of NKT cells secrete IL2, IL3, IL5, IL13, IL17,
IL21, GM-CSF and/or osteopontin after activation and have cytotoxic
activity (Godfrey et al., 2004; Coquet et al., 2008; Coquet et al., 2007; Jiang
et al 2005; review in Berzins et al., 2011). Cytokines production by NKT
cells plays a key role in autoimmunity. IL4 drives the differentiation and

CHAPTER 1
36
growth of Th2 cells and regulates autoimmunity and; IL17 drives the
differenciation and growth of Th17 cells, which are associated with
autoimmunity damage.
Because NKT cells are active cells in autoimmunity, recognize exogenous
and endogenous ligands and secrete the pro-inflammatory cytokines found
in MS and EAE, it is possible that NKT cells play a role in CNS
autoimmunity in both diseases.
1.7.2 NKT cells in Multiple Sclerosis
Altered numbers of NKT cells are seen in MS patients. For example, the
number and diversity of NKT cells expressing the V24 marker is reduced
in blood of MS patients including patients in remission (Illés et al. 2000;
Démoulins et al. 2003; Araki et al. 2003). Opposing these findings, studies
have reported that NKT cells expressing the invariant V24-J18+ T-cell
receptor are increased in peripheral blood of MS patients (O'Keeffe et al.,
2008). These studies indicate that NKT cell numbers may correlate with the
immunopathology of MS; however, the precise role of NKT cells in the
disease remains unclear.

CHAPTER 1
37
Cytokine production by NKT cells is also altered in MS patients, for
example CD4-CD8-V24JQ T cells from peripheral blood of patients with
RR-MS produce less IL4 but not IFN compared with CD4-CD8-V24JQ
T cells from patients with progressive MS or healthy controls (Gigli et al.,
2007). Moreover, analysis of blood of MS patients indicates that MS
treatment affects NKT cell numbers and function. For example, type 1
interferon beta therapy increased the percentage of Valpha24+ NKT cells
through myeloid dendritic cell maturation (Gigli et al., 2007). After type
IFN therapy, NKT cells increased the secretion of IL4 (Gigli et al., 2007).
Natalizumab, a monoclonal antibody therapy for RRMS that blocks the
entry of leucocytes into the CNS by binding to the 4 subunit of a very-late
activation antigen-4 (VLA-4), has a higher binding to NKT cells and NK
cells than to CD3+ T cells. In addition, natalizumab, decreases levels of beta
1 integrin surface expression on NKT cells and T cells, B cells and NK cells
(Harrer et al., 2011; Harrer 2012). These studies indicate that NKT cells
migrate into the CNS and play an important role in cell signalling,
regulation of cell cycle and regulation of inflammation in MS.
Ligands for NKT cells are extensively found in myelin. The dry weight of
myelin comprises approximately 73-81% lipids and 20-25% protein (Deber
et al., 1991; Aggarwal et al., 2011). The most abundant lipids in myelin are
glycolipids such as galactocerebrocide (GalC) and its sulfated version
sulfatide and phospholipids (Aggarwal et al., 2011). This suggests that

CHAPTER 1
38
APCs can present glycolipids from the myelin to NKT cells during local
inflammation in the CNS.
1.7.3 NKT cells in Experimental Autoimmune
Encephalomyelitis
Stimulation of NKT cells decreases the severity of EAE by the production
of pathogenic or protective cytokines. For example, the severity of EAE is
increased in IL4 knockout mice and decreased in IFN- knockout mice
when stimulated by alpha-GC (Pál et al., 2001). However, controversial
results have been found during immunisation with NKT cells ligands such
as sulfatide and alpha-GC. Immunisation with sulfatide at the same time as
EAE induction protects mice from developing EAE (Jahng et al., 2004).
Pre-immunisation of mice with -Galcer protects C57BL/6 and B10PL
mice against EAE (Furlan et al., 2003; Jahng et al., 2001); however,
immunisation with -Galcer at the same time as EAE induction protects
C57BL/6 mice, while in B10PL mice the disease is exacerbated (Jahng et
al., 2001). Other studies have found no effect or a minimal effect in the
development of EAE when mice are immunized with -Galcer (Pál et al.,
2001).

CHAPTER 1
39
A potential association has been found recently between NKT cells and
vitamin D, which could be related to the initiation and progression of both
MS and EAE. NKT cells require vitamin D for development and function,
and vitamin D is associated with the onset and development of EAE and MS
(Cantorna et al 2012).
Overall, the role of NKT cells in the development of both EAE and MS
needs to be clarified. The reduced number of NKT cells in MS patients
could explain the lack of antinflammatory properties by regulatory
cytokines such as IL4 and IL10 produced by NKT cells. However, NKT
cells also produced IFN and IL17, which increase the severity of EAE.
Whether NKT cells are associated with MS and EAE is being debated.
1.8 Summary and project aims
Although research into MS has been accelerating, particularly in recent
years due to the constant increase in the incidence and prevalence of the
disease, the interaction between genetics and environmental factors remain
undiscovered. The deeper understanding of the interactions of these factors
is required for better diagnostics, and improvement of therapies for the
prevention and cure of MS.

CHAPTER 1
40
In this study, Toll-like receptors and NKT cells were proposed as potential
mechanisms for the development of CNS-autoimmune inflammation seen in
MS. The roles of TLRs and NKT cells in gene/environment interactions can
be studied in the EAE model because it provides a well-validated platform
for specific gene and environmental manipulation. The mouse model of MS
used in these studies was MOG35-55/CFA+PTX induced EAE.
As mentioned before and summarized in Table 1.1, the absence of TLR2,
TLR4 and TLR9 in EAE has generated controversial results. The lack of
TLR1, TLR3, TLR5, TLR7, TLR8 and TLR10-TLR13 has not been studied
in EAE. TLR6 has been ruled out to contribute to EAE. The previous
studies that contributed to find the role of TLRs in EAE used different
protocols for EAE induction, different environments and the sex of the
animals is not declare in some findings (Table 1.1). It is unclear whether the
conflicts in results stem from variation in the sex, methods of induction or
environment. The first hypothesis of this study is that discrepancies in the
studies of the role of TLRs in EAE can be partially solved by comparing the
disease in male and female mice using a single model of EAE and the same
environment. To test this hypothesis, the roles of TLR1, TLR2, TLR4,
TLR6, TLR9, TLR2/9, TLR4/9 and MyD88 were examined in the mouse
model MOG35-55/CFA+PTX induced EAE at the Comparative Genomics
Centre.

CHAPTER 1
41
As NOD/Lt mice, the most common animal model of T1D, are also
susceptible to EAE, MOG35-55/CFA+PTX induced EAE was used to study
the roles of TLR1, TLR2, TLR4, TLR6 and TLR9 in this strain in order to
dissect the inter-relationships between organ-specific autoimmune diseases.
Unlike C57BL/6.Tlr2-/- mice, NOD.Tlr2-/- mice did not decrease the severity
of EAE. To test the hypothesis that insulitis associated with T1D
development in some way compensated for the lack of TLR2 signalling in
NOD mice, the role of TLR2 was examined in NOD.H2b and
NOD.H2b.Tlr2-/- mice.
Finally, most of the previous studies on the role of NKT cells in EAE have
been performed using NKT cell ligands and little is know about the
contribution of NKT cell numbers to EAE. It was hypothesized that
different numbers of NKT cells alter the phenotype of EAE. To test this
hypothesis the clinical course of MOG35-55/CFA+PTX induced EAE was
examined in mice with different numbers of NKT cells.

CHAPTER 1
42
Table 1.1 Toll-like receptors in EAE.
Mutation Strain mouse Sex
Auto antigen Adjuvant Enhacement
Age of induction *Result Reference
TLR1 Non known Non known
Non known
Non known Non known Non known Non known Non known
TLR2
C57BL/6
C57BL/6
C57BL/6
C57BL/6
Female
Female
No specified
Female
MOG35–55
MOG35–55
MOG35–55
MOG35–55
CFA
CFA
CFA
CFA
PTX
PTX
PTX
PTX
6-12 weeks
6-8 weeks
6-8 weeks
7-7 weeks
Susceptible
Susceptible
No mentioned
Resistant
Prinz et al., 2006
Hermann et al., 2006
Chen et al., 2009
Shaw et al., 2011
TLR3 Non known Non known Non known
Non known Non known Non known Non known Non known
TLR4
C57BL/6
C57BL/10ScCr
C57BL/10ScCr
C57BL/10ScCr
Female
No specified
No specified
No specified
Recombinant rat MOG190-250
protein
MOG35–55
MOG35–55
MOG35–55
CFA
CFA
CFA
CFA
PTX
PTX
PTX
No enhacement
8-12 weeks
9 weeks
9 weeks
9 weeks
Exacerbates
Susceptible
Resistant
Resistant
Marta et al., 2008
Kerfoot et al., 2004
Kerfoot et al., 2004
Kerfoot et al., 2004
Continue Table 1.1 Toll-like receptors in EAE

CHAPTER 1
43
Mutation Strain mouse Sex Autoantigen Adjuvant Enhacement
Age of induction *Result Reference
TLR5 Non known
Non known Non known
Non known Non known Non known Non known Non known
TLR6
C57BL/6
Female
Recombinant rat MOG190-250
protein
CFA
PTX
8-12 weeks
Susceptible
Marta et al., 2008
TLR7 Non known
Non known Non known
Non known Non known Non known Non known Non known
TLR8 Non known
Non known Non known
Non known Non known Non known Non known Non known
TLR9
C57BL/6
C57BL/6
Female
Female
Recombinant rat MOG190-250
protein
MOG35–55
CFA
CFA
PTX
PTX
8-12 weeks
6-12 weeks
Exacerbates
Resistant
Marta , et al., 2008
Prinz et al., 2006
TLR10-TLR13 Non known
Non known Non known
Non known Non known Non known Non known Non known
Continue Table 1.1 Toll-like receptors in EAE

CHAPTER 1
44
Mutation Strain mouse Sex Autoantigen Adjuvant Enhacement
Age of induction *Result Reference
MyD88 C57BL/6 Female MOG35–55 CFA PTX 6-12 weeks Complete resistant Prinz et al., 2006
MyD88
C57BL/6
C57BL/6
Female
No specified
Recombinant rat MOG190-250
protein
MOG35–55
CFA
CFA
PTX
PTX
8-12 weeks
No specified
Complete resistant
Complete resistant
Marta et al., 2008
Lampropoulou et al., 2008
TLR2/4 C57BL/6 No specified MOG35–55 CFA PTX No specified Susceptible
Lampropoulou et al., 2008
IRAK1 C57BL/6 No specified MOG35–55 CFA PTX No specified Susceptible Deng et al., 2003
IRAK1
C57BL/6
No specified
MBP Ac1-11
CFA
No enhacement
7-10 weeks
Complete resistant (A-EAE)
Susceptible (P-EAE)
Hansen et al., 2006
Continue Table 1.1 Toll-like receptors in EAE

CHAPTER 1
45
Mutation Strain mouse Sex Autoantigen Adjuvant Enhacement
Age of induction *Result Reference
TRIFLps2/Lps2 C57BL/6 No specified MOG35–55 CFA PTX No specified Exacerbates Guo et al., 2008
NF-kappa B1 C57BL/6 No specified MOG38–50 CFA PTX 4-6 weeks Resistant Hilliard et al., 1999
*Susceptible means that there is not difference between knockout mice and the control group.
*Exacerbates means that knockout mice are more susceptible than the control group.
*Resistant means that knockout mice decrease significantly the disease when compared with the control group.
*Complete resistant means that knockout mice do not develop clinical signs of EAE.

CHAPTER 2

CHAPTER 2
46
CHAPTER 2
MATERIALS AND METHODS
2.1 Mice
2.1.1 Sources of C57BL/6 and NOD/Lt mice
C57BL/6 and NOD/Lt mice were bought from The Jackson Laboratory
(Bau Harbor, Maine, USA) and were bred and housed at The
Immunogenetics Research Facility, James Cook University.
2.1.2 Sources and generation of knockout, congenic
and transgenic mice
2.1.2.1 Knockout mice
Dr Shizuo Akira from Osaka University (Osaka, Japan) kindly provided the
C57BL/6-Tlr knockout mice (Takeuchi et al., 1999; Hemmi et al., 2000;
Adachi et al., 1998; Hoshino et al., 1999; Takeuchi et al., 2001; Takeuchi et
al., 2002). C57BL/6.Tlr-/- mice were originally generated on the 129/SvJ
background and backcrossed to B6. Erick Biros and Shahead Chowdly
helped to found the C57BL/6.Tlr-/- and NOD.Tlr-/- mice by backcrossing and
genotyping the mice in the Comparative Genomics Centre. C57BL/6.Tlr1-/-

CHAPTER 2
47
and C57BL/6.Tlr6-/- mice had been backcrossed to C57BL/6 for six
generations on arrival. They were subsequently further backcrossed to
C57BL/6 mice for a total of 10 generations before intercrossing to generate
homozygous knockout mice. C57BL/6.Tlr2-/-, C57BL/6.Tlr4-/-,
C57BL/6.Tlr9-/- and C57BL/6.MyD88-/ mice had been backcrossed to
C57BL/6 mice for 10 generations before intercrossing to generate
homozygous mutants. Double-knockout mice (C57BL/6.Tlr2-/-Tlr9-/- and
C57BL/6.Tlr4-/-Tlr9-/-) were generated by crossing single knockout mice,
intercrossing the F1 progenies and genotyping a selection of homozygous
mutants as founders for the new line (Adachi et al., 1998; Hoshino et al.,
1999; Takeuchi et al., 1999; Hemmi et al., 2000; Takeuchi et al., 2001;
Takeuchi et al., 2002).
NOD/Lt mice were crossed to C57BL/6.Tlr1-/-, C57BL/6.Tlr2-/-,
C57BL/6.Tlr4-/-, C57BL/6.Tlr6-/-, C57BL/6.Tlr9-/- and C57BL/6.MyD88-/-
mice and the progeny backcrossed to NOD/Lt mice for 10 more generations.
At each generation, pups were genotyped by PCR tail DNA to select
heterozygous mutants. The inbred lines were founded by intercrossing the
F1 progenies and genotyping for selection of homozygous mutants.
The Queensland Institute of Medical Research (QIMR) (Brisbane QLD,
Australia) provided C57BL/6.Cd1d-/- mice. C57BL/6.Cd1d-/- mice were
backcrossed to C57BL/6 (Appendix 2). Blood samples from the F1

CHAPTER 2
48
progenies were analyzed by Flow Cytometry to find the homozygous
knockout (KO) mice using anti-mouse CD1d PE antibody (clone 1B1)
(Appendix 8) and anti-mouse TCR PerCP-Cy5.5 (clone H57-597)
(Appendix 8).
NOD.Cd1d-/- mice were bought from The Jackson Laboratory.
2.1.2.2 Congenic and transgenic mice
Alan G Baxter established the NOD.Nkrp1b mice (Poulton, et al., 2001).
Julie M Fletcher crossed NOD.Nkrp1b mice with NOD.Cd1d-/- mice in
order to establish NOD.Nkrp1b.Cd1d-/- mice in the Comparative Genomics
Centre. Margaret Jordan and Christine Hawke established the NOD.H2d
mice in the Comparative Genomics Centre. NOD.Idd13 were bought from
The Jackson Laboratory. Tim Butler and Tatiana Tsoutsman established the
NOD.Nkt1, NOD.Nkt2a, NOD.Nkt2b and NOD.Nkt2e mice in the
Comparative Genomics Centre. Klaus Griewank generated the construct for
TCR V alpha14 transgenic mice in the Albert Bendelac’ Laboratory at
Howard Hughes Medical Institute, Committee on Immunology, Deparment
of Pathology, University of Chicago, USA.

CHAPTER 2
49
NOD.H2b mice were crossed to NOD.Tlr2-/- mice. The F1 progeny were
intercrossed and genotyped by PCR tail DNA to generate NOD.H2b.Tlr2-/-
homozygous mice (Appendix 3).
2.2 Mouse identification and housing
Mice aged 7-14 weeks were used in the research studies. Every mouse was
ear-clipped for identification (Appendix 4). Mice were kept under specific
pathogen-free conditions in the Immunogenetics Research Facility at James
Cook University. The studies were reviewed and approved by the James
Cook University Animal Care and Ethics Committee.
2.3 Genotyping
2.3.1 DNA extraction
Mouse-tail tips at around 8 millimeters were cut to extract DNA. Every tail
tip was digested in 420L of Tissue digest (QIAGEN Sciences, Maryland,
USA) and 10L of Digest enzyme (QIAGEN Sciences, Maryland, USA)
overnight at 56C. Samples were vortexed and then centrifuged for 5
minutes at 2500 rcf. The amount of 220L of the digested tails was
transferred to 96 well storage plates.

CHAPTER 2
50
DNA extraction was done on a CAS-1810 X-TractorGene (Corbett
Robotics) using the DX Reagent Pack (QIAGEN Sciences) and following a
method developed in the Baxter laboratory at the Comparative Genomics
Centre. After extraction, 2L of extracted DNA were used to measure the
DNA concentration in a nonodrop.
2.3.2 Polymerase chain reaction (PCR) and
polyacrylamide gel electrophoresis (PAGE)
PCR and PAGE were used to identify the targeting constructs. PCR was
done in 20L to 25L volume containing H2O, GoTaq Green Master mix
(Promega, Wisconsin, USA) (2x buffer), the specific primers (Appendix 5
and 6) and DNA. Samples were run in the Thermal cycler following the
thermocycling protocols shown in Appendix 7. Samples were stored at 4C
until PAGE was performed.
The amount of 5L to 10L per sample was analyzed by PAGE run for 30
minutes to distinguish amplified DNA fragments. Fragment sizes were
determined by separation of a 100 bp ladder (Invitrogen; Victoria,
Australia) run in parallel.

CHAPTER 2
51
2.3.3 Processing and staining of cells from blood for
Flow Cytometry
The amount of 100L of mouse blood was collected by retro-orbital
venipuncture with plastic clad micro hematocrit tubes (Becton Dickinson;
Pennsylvania, USA). Peripheral blood was stained with anti-CD1d (clone
IB1, eBiosciences, California, USA) and anti-TCR (clone H57-597, BD
Biosciences, California, USA) (Appendix 8) antibodies for 30 minutes at
room temperature in the dark. After incubation, red cells were lysed with
2mL 1x RBC Lysis Buffer (Sigma, Ayrshire, UK) and washed with 2 ml of
MACS buffer (Appendix 9) and resuspended in MACS buffer (Appendix 9)
to be analyzed by Flow Cytometry.
2.4 Induction of EAE
2.4.1 Mouse immunisation for active MOG35-55-
induced EAE
Mice were injected subcutaneously (s.c.) at day 0 and day 7 in the inguinal
and flank regions with 200 g of MOG35-55 peptide (Auspep; Victoria,
Australia) in PBS (Invitrogen; Victoria, Australia) emulsified in an equal
volume (1:1) of Complete Freud’s Adjuvant (CFA, containing 5mg/ml of
heat-killed Mycobacteria tuberculosis (Difco laboratories; Michigan and

CHAPTER 2
52
Missouri, USA). Each mouse also received an intra-peritoneal (i.p.)
injection containing 250ng of PTX (List biological laboratories; California,
USA) at days 0 and 2 (Prinz et al., 2006).
2.4.2 Mouse immunisation for passive MOG35-55-
induced EAE
2.4.2.1 Donor immunisation and organ collection
Donor mice were injected subcutaneously at day 0 in the inguinal regions
and flanks with 200 g of MOG35-55 peptide (Auspep; Victoria, Australia) in
PBS (Invitrogen; Victoria, Australia) emulsified in an equal volume (1:1) of
Complete Freund’s Adjuvant (CFA; containing 5mg/ml of heat-killed
Mycobacteria tuberculosis (Difco laboratories; Michigan and Missouri,
USA). An intra-peritoneal injection of 250ng of PTX (List biological
laboratories; California, USA) was also administrated at days 0 and 2.
Mice were euthanized by CO2 asphyxiation at day 10 to 11 after
immunisation. The spleens and inguinal and axillary lymph nodes from
donor mice were collected in HBSS (Invitrogen; Victoria, Australia)
containing 100U/ml of penicillin/streptomycin (Invitrogen; Victoria,
Australia) to prevent bacteria growth.

CHAPTER 2
53
2.4.2.2 Single cell suspension and cell culture
Spleen and lymph nodes were placed in a petri dish and mashed between
two microscope slides with HBSS (Invitrogen; Victoria, Australia)
containing 100U/ml of penicillin/streptomycin (Invitrogen; Victoria,
Australia). Red cells from the spleens were lysed with Red Blood Cell
lysing buffer (Sigma-Aldrich; Ayrshire, UK). Cells were washed and
resuspended in a culture medium (Invitrogen; Victoria, Australia)
supplemented with 10% (v/v) FCS, 2 mM L-glutamine, 100 U/ml penicillin,
100 g/ml streptomycin sulfate, 1 mM sodium pyruvate, and 2 M 2-ME
(Invitrogen; Victoria, Australia) at a concentration of 5 X 10⁶ cells/ml.
Cells were stimulated with 50g/ml MOG35-55 peptide (Auspep; Victoria,
Australia), 10ng/ml IL23 (eBioscience; California, USA), 10ng/ml IL6
(Sigma; Missouri, USA) and 5ng/ml TGF- (eBioscience; California, USA)
and cultured at 37C and 5% CO2 in culture medium (Appendix 9). Cells
were harvested at day 3 after cell culture. Cells adhering at the bottom of the
flask were removed with a cell scraper. Dead cells were removed using
Histopaque 1083 (Sigma; Missouri, USA) and centrifuged for 5 minutes
with the centrifuge brake turned off.

CHAPTER 2
54
2.4.2.3 Adoptive transfer of EAE to recipients
Recipient mice were irradiated with 3 Gray and 5 X 10⁷ cells were injected
i.p. per mouse at day 0. Every mouse received an i.p. injection of 350ng of
PTX (List biological laboratories; California, USA) at day 0 and 2.
2.5 Clinical scoring of active and passive EAE
Mice were scored daily over 30 days for clinical signs of active and passive
EAE using the A scale in chronic EAE (Chapter 3 and Chapter 4). The B
scale was used in subsequent chapters as NOD mice showed a marked
weakness in the tail and hind-limp weakness with or without tail paralysis
(Chapter 5 and Chapter 6).
- A scale:
0-no detectable signs of EAE; 0.5-hunching; 1-slight tail weakness; 1.5-
distal limp tail or hind-limb weakness; 2-total tail paralysis; 2.5-hind leg
totally paralyzed; 3-both hind legs totally paralyzed; 3.5-bilateral hind-limb
paralysis in combination with unilateral fore-limb paralysis or weakness of
forelimbs; 4-bilateral hind-limb and forelimb paralysis; 5-moribund state or
death (modified from Becher et al., 2001 and Prinz et al, 2006). Mice were
euthanized when the clinical score was 3.5 or higher.

CHAPTER 2
55
- B scale:
0-no detectable signs of EAE; 0.5-hunching; 1-slight tail weakness; 1.5-
distal limp tail or marked weakness in the tail; 2-total tail paralysis; 2.5-
hind-limb weakness with or without tail paralysis; 3.0-hind leg totally
paralyzed; 3.5-both hind legs totally paralyzed; 4.0-bilateral hind-limb
paralysis in combination with unilateral fore-limb paralysis or weakness of
forelimbs; 4.5-bilateral hind-limb and forelimb paralysis; 5-moribund state
or death (modified from Becher et al., 2001 and Prinz et al, 2006). Mice
were euthanized when the clinical score was 4.0 or higher.
2.6 Diabetes incidence
A drop of blood obtained by a tail venepucture was used to measure glucose
with a CareSens Blood Glucose Meter (Life Biosciences) and a blood
glucose test strip (Medical Technology Promedt Consulting GmbH; Ingbert,
Germany). Every mouse was bled fortnightly during 250 days. Mice were
considered diabetic after two consecutive glucose readings of at least 14.0
mM or a single glucose reading of “HI” (modified from Fletcher JM, et al.,
2008). Diabetic mice were euthanized by CO2 asphyxiation and their
pancreata were collected in 10% formalin (Sigma; Missouri, USA) for
histological analysis.

CHAPTER 2
56
2.7 Histopathology
2.7.1 Organ removal and fixation
2.7.1.1 Central Nervous System (CNS)
Mice were euthanized by CO2 asphyxiation. The right atrium was snipped
and the left ventricle was perfused with 24 ml of PBS (Invitrogen;Victoria,
Australia). The skin on the top of the mouse head was incised and the skull
was opened to collect the brain. A middle skin incision along the dorsum
was made and the spinal vertebrae were cut to collect the spinal cord. Both
the brain and the spinal cord were fixed in 10% formalin (Sigma; Missouri,
USA).
2.7.2 Parafination, section, de-waxing and
hydratation
Fixed CNS in 10% formalin were put in ethanol overnight and embedded in
paraffin (Leica Microsystems; New South Wales, Australia) to be sectioned
in a Cryotomo (R. Jung Heidelberg). CNS was sectioned at 4m for
Hematoxilin and Eosin (provided by the Department of Marine and Tropical
Biology, James Cook University), 5m for Luxol Fast Blue (Sigma; New
South Wales, Australia), 10m for Bielschowsky's Silver (UNILAB;

CHAPTER 2
57
Sydney, Australia). Sectioned tissues were de-waxed in Xylene (Merk;
Victoria, Australia), and later put in absolute alcohol (Merk; Victoria,
Australia) and 70% alcohol. Later, slides were washed in dH2O.
2.7.3 Staining
2.7.3.1 Hematoxilin and Eosin Staining
Brains and spinal cords were stained with Mayer’s Haemalum (1%
concentration in destilled water) (provided by the Department of Marine and
Tropical Biology, James Cook University) for 8 minutes and washed in
dH2O two times at 20 dips each. They were then kept in blueing solution
containing sodium bicarbonate, magnesium sulphate and distillated water
(provided by the Department of Marine and Tropical Biology, James Cook
University) for 30 seconds and washed as before, and stained with eosin
(provided by the Department of Marine and Tropical Biology, James Cook
University) for 3 minutes. Later, slides were dehydrated and cleared in 70%
alcohol, absolute alcohol (Merk; Australia) and xylene (Merk; Victoria,
Australia) and mounted with DPX (BDH; Poole, UK), which is a mixture of
distyrene, plasticizer, and xylene (Protocols were adapted from Humason
GH, 1972).

CHAPTER 2
58
2.7.3.2 Luxol fast blue
Spinal cords were placed in 1% Luxol fast blue solution (Appendix 9) and
left overnight at 56 C. Slides were rinsed of excess staining with 95% ethyl
alcohol (provided by the Department of Marine and Tropical Biology,
James Cook University) and then rinsed with distilled water. Spinal cord
sections were put in the lithium carbonate solution (Acros Biochemicals)
(Appendix 9) for 30 seconds and 70% ethyl alcohol for 30 seconds. Sections
were then rinsed in distilled water and checked microscopically to see if
grey matter was clear and white matter was defined. After clear
differentiation between grey and white matter, sections were put in distilled
water, counterstained in 0.1% cresyl fast violet (The British Drug Houses;
Poole, England) or 0.1% cresyl violet acetate (Sigma; New South Wales,
Australia) (Appendix 9) solution for 30-40 seconds and rinsed in distilled
water. Sections were then passed through 95% ethyl alcohol (provided by
the Department of Marine and Tropical Biology, James Cook University)
for 5 minutes, 100% alcohol (10 dips) (Merk; Australia) and xylene (10
dips) (Merk; Victoria, Australia) and mounted on DPX (BDH; Poole, UK)
(method adapted from IHCWORLD, Life Science Information Network).
2.7.3.3 Bielschowsky's Silver
Spinal cords sections were placed in 10% silver nitrate solution (UNILAB;
Sydney, Australia) (Appendix 9) at 40ºC for 20 minutes and washed by

CHAPTER 2
59
distilled water. While the slides were in distilled water, concentrated
ammonium hydroxide 28% (UNIVAR, New South Wales, Australia) was
added to the 10% silver nitrate solution (Appendix 9) and the slides were
then placed back into the ammonium silver solution (Appendix 9) for 60
minutes at 40 ºC. The slides were placed in 1% ammonium hydroxide
(Appendix 9) solution for 3 minutes and then into developer working
solution (Appendix 9) for 4 minutes. Later, the slides were placed in 1%
ammonium hydroxide solution (Appendix 9) for 3 minutes to stop the silver
reaction. The slides were placed in 5% sodium thiosulfate solution
(Appendix 9) for 5 minutes and washed in distilled water, dehydrated and
cleared through 95% ethyl alcohol and absolute ethyl alcohol and xylene
(Merk; Victoria, Australia). The slides were then mounted with DPX (BDH;
Poole, England) (method modified from IHCWORLD, Life Science
Information Network).
2.8 Histological evaluation
2.8.1 Spinal cord
Cell infiltration and demyelination (loss of myelin) of spinal cords was
assessed using the following semi-quantitative scoring system: 0 = no
lesions, no cell infiltration and no reduction in LFB and Bielschowsky's
silver staining; 1 = solitary lesions with cell infiltration of low cellular
density with or without mildly reduced LFB and Bielschowsky's silver

CHAPTER 2
60
staining; 2 = two to three lesions level with moderate cell infiltration
associated with reduced LFB staining and Bielschowsky's silver; 3 = many
lesions in almost all fields with extensive cell infiltration associated with
severe reduction in LFB and Bielschowsky's silver staining (modified from
Hempel et al., 1985).
2.9 Flow Cytometry
2.9.1 Organ removal
Mice were euthanized by CO2 asphyxiation. Spleens and superficial and
deep cervical lymph nodes were removed and placed in PBS (Invitrogen
Victoria, Australia). CNS was removed after snipping the right atrium and
perfusion via the left ventricle with 24 ml of PBS (Invitrogen Victoria,
Australia). All samples were kept at 4C.
2.9.2 Preparation of single cell suspensions
2.9.2.1 Spleen
Each spleen was placed in a petri dish with MACS buffer (Appendix 9) and
mashed between two microscope slides and centrifuged. The pellet obtained
after centrifugation was resuspended in red blood cell lysing buffer (Sigma;
Ayrshire, UK) and incubated for 8 minutes in ice to destroy the red cells.

CHAPTER 2
61
After incubation, the cells were washed with MACS buffer (Appendix 9)
and resuspended in 1ml of MACS buffer (Appendix 9) and counted using a
cell counter (Beckman Coulter, Instance Number 898673; California,
USA).
2.9.2.2 Lymph nodes
Lymph nodes from every mouse were mashed between two microscope
slides in MACS buffer (Appendix 9), centrifuged and resuspended in 1ml of
MACS buffer (Appendix 9). Cells were counted with a Beckman Coulter
(Instance Number 898673; California, USA).
2.9.2.3 Central Nervous System
Every CNS was minced through a wire mesh sieve and centrifuged for 15
minutes at 4°C. Pellets were resuspended in enzyme/ collagenase buffer
containing 0.5ml/mg of Collagenase Type II (Sigma; NSW, Australia) and
500U/ml of DNase I (Sigma; NSW, Australia) and incubated at 37°C for 60
minutes. Samples were topped up to 50 ml with PBS (Invitrogen Victoria,
Australia) after incubation and centrifuged for 15 minutes at 400 X g.
Pellets were resuspended in 20 ml of 30% v/v isotonic percoll (GE
HealthcareBio‐Sciences;NewSouthWales,Australia), underlayed with
7.5ml of 70% v/v isotonic percoll (GE Healthcare Bio‐Sciences; New

CHAPTER 2
62
SouthWales, Australia), topped with 7.5ml of PBS (Invitrogen Victoria,
Australia) and centrifuged for 25 minutes at 25°C, 600 X g. Cells between
30% and 70% density were collected and washed in 50ml of PBS
(Invitrogen Victoria, Australia). The pellet was resuspended in MACS
buffer (Apendix 9) and counted with a cell counter (Beckman Coulter,
InstanceNumber898673;California,USA).
2.9.3 FACs staining and analysis
2.9.3.1 Blocking FcR binding
Leucocytes from CNS, spleens and lymph nodes were plated out in 96-well
U-bottom plates at 1-2 million cells per well. Cells were incubated with
Biotin-CD16/32 antibody (BD biosciences; California, USA) containing
10% mouse serum for 15 minutes to prevent non-specific antibodies
bindings. Cell pellets were re-suspended for cell surface staining.
2.9.3.2 Cell surface staining
Each leukocyte sample from the CNS, spleens and lymph nodes were
incubated with a cocktail of antibodies (Appendix 8) for 25 minutes after
blocking FcR binding (BD biosciences; California, USA). Cells were
washed with MACS buffer and centrifuged for 2 minutes at 4°C. A

CHAPTER 2
63
secondary staining was done with streptavidin when biotinylated antibodies
were used (Appendix 8). After cell surface staining, the pellet was re-
suspended in 300L of MACS buffer (Appendix 9) and filtered through
70m nylon mesh (Clear Edge Filtration; Victoria, Australia) into Falcons
tubes (BD biosciences; California, Australia). Propidium iodide (PI)
(2ng/ml) (Invitrogen; Victoria, Australia) was added before cell analysis to
detect dead cells. Data analysis was performed on a CyAnTM ADP Flow
Cytomer (Beckman Coulter) and LSR Fortessa (BD Biosciences).
For CCR2 staining, cells were incubated with 50% mouse serum for 15
minutes at room temperature and centrifuged at 4°C for 3 minutes. Cells
were incubated with CCR2 mAb biotinylated (Appendix 8) for 25 minutes
and washed. Cells were then incubated with streptavidin-Dylight 649
(Appendix 8) for 25 minutes. Cells were washed in 200L of Macs buffer
(Appendix 9) and centrifuged at 4°C for 3 minutes. Later, cells were
incubated with 10% rat serum for 30 minutes at 4°C, centrifuged and
resuspended in MACS buffer (Appendix 9).

CHAPTER 2
64
2.9.3.3 Intracellular staining
2.9.3.3.1 Tregs staining
Cell surface staining was done with anti TCR, CD4, CD25 and CD62L
antibodies (Appendix 8) as described previously. Cells were fixed with
100l of 1X FoxP3 Fix/Perm solution (BioLegend; California, USA) for 20
minutes. Cells were washed with Perm buffer twice (BioLegend; California,
USA). Cells were stained with anti-FoxP3 antibody (BioLegend; California,
USA) for 30 minutes, washed twice with FoxP3 Perm buffer (BioLegend;
California, USA) and re-suspended in MACS buffer (Appendix 9).
2.9.3.3.2 IL17 in spleen
Cells were stimulated with Ionomycin (1g/ml) (Invitrogen; Victoria,
Australia) and PMA (10ng/ml) (Sigma-Aldrich; Missouri, United Kingdom)
and incubated for 4 hours at 37C. Samples were analyzed following the BD
Cytofix/CytopermTM Plus Fixation/Permeabilization Kit with BD
GolgiPlusTM protocol (BD biosciences; California, USA).
2.9.3.3.3 IL17 Secretion Assay
Leukocytes from CNS and spleen were washed with HBSS (Invitrogen;
Victoria, Australia), centrifuged at 4C for 10 minutes and then the

CHAPTER 2
65
supernatant was aspirated. Each CNS pellet was re-suspended in RPMI
medium (Invitrogen; Victoria, Australia) containing 5% of mouse serum
and the spleens were re-suspended at 1X10⁷ cells/ml. CNS cells and spleen
cells were placed in a 96 or 24 well cell culture plate respectively,
stimulated with Ionomycin (1g/ml) (Invitrogen; Victoria, Australia) and
PMA (10ng/ml) (Sigma; Missouri, UK) and incubated for 3 hours at 37C.
Negative controls were not stimulated.
Cells were washed twice with cold buffer (PBS (Invitrogen; Victoria,
Australia) containing 0.4% EDTA (AMRESCO; Ohio, USA) and 5 ml of
5% bovine serum albumin (BSA) (Invitrogen; Victoria, Australia) after 3
hours of stimulation and centrifuged. The pellet of leucocytes from the CNS
was re-suspended in 90L of cold buffer and the pellet of leucocytes from
the spleen was re-suspended in 900L of cold buffer. 10L and 100L of
mouse IL17 Catch Reagent were added to the CNS and the spleen cells,
respectively, and incubated for 5 minutes on ice. Buffers and Catch reagent
were bought from Miltenyi Biotec (New South Wales, Australia).
Cells were topped up to 10ml of cell culture medium (Appendix 9) and
incubated for 45 minutes at 37C (the tubes were rotated every 5 minutes to
re-suspend settled cells). Cells were then put on ice and washed with cold
buffer. The pellet from the CNS cells was re-suspended in 100L of cold

CHAPTER 2
66
buffer and the pellet from the spleen cells was re-suspended in 900 l of
cold buffer. 10L and 100L of Mouse IL17 Detection Antibody were
added to the CNS and the spleen cells, respectively, and incubated for 10
minutes on ice. Buffers were bought from Miltenyi Biotec; New South
Wales, Australia).
Cells were then washed in 10 ml of cold buffer. The pellet from the CNS
cells was re-suspended in 100L cold buffer and the pellet from the spleen
cells was re-suspended in 900 L of cold buffer. 10L and 100L of
streptavidin PE were added to the CNS and the spleen cells, respectively,
and incubated for 10 minutes on ice. Cells were washed and stained with
CD45.2, TCR, CD4 and CD8 (Appendix 8) as described in cell surface
staining cells before. Buffers were bought from Miltenyi Biotec (New South
Wales, Australia).
2.10 Cytokines assays
2.10.1 Plasma collection and storage
Blood was collected by retro-orbital venipuncture with plastic clad micro
hematocrit tubes (Becton Dickinson and Company; Pennsylvania, USA) at
21 days after active EAE induction, at 10 and 34 days after passive EAE
and at 40 days in relapsing-remitting EAE. Blood was centrifuged at 4C

CHAPTER 2
67
and 6000 X g for 8 minutes. Plasma was collected and stored at -80C until
assayed.
2.10.2 Th1/Th2/Th17 cytokine assays
Plasma from C57BL/6, C57BL/6.Tlr2-/-, C57BL/6.Tlr9-/-, C57BL/6.Tlr2-/-/9-
/-, C57BL/6.MyD88-/- male and female mice with active EAE and plasma
from C57BL/6, C57BL/6.Tlr2-/- with passive EAE was analyzed to detect
GM-CSF, IFN, IL-1, IL-2, IL-4, IL-5, IL-6, IL-10, IL-17, TNF, IL-23
and/or IL-18, CXCL1/KC, and MIP-1. Plasma from NOD.H2b and
NOD.H2b.Tlr2-/- was analyzed to detect IL13, IL1, IL22, IL5, IL21, IL6,
IL10, IL27, IL23, IFN, TNF, IL4 and IL17 (eBiosciences). Samples were
process following the Bender MedSystems protocols.
Samples were acquired on either a CyAn ADP (Beckman Counter) or an
LSR Fortessa (BD Biosciences) Flow Cytometers. Data were analyzed with
a multiparameter logistic nonlinear regression model using Flow Cytomix
Pro 2.2.1 (Bender Medsystems) and Graph Pad Prism version 5.00 (Graph
Pad for Mac, Software, San Diego, California, USA).

CHAPTER 2
68
2.10.2.1 IFN ELISA
Plasma from C57BL/6, C57BL/6.Tlr2-/-, C57BL/6.Tlr9-/-, C57BL/6.Tlr2-/-/9-
/-, C57BL/6.MyD88-/- male and female mice with active EAE was analyzed
to detect IFN protein using enzyme-linked immunosorbent assay (ELISA)
(plb interferon source; New Jersey, USA). ELISA was performed following
the protocol of plb Biomedical Laboratories. Data analysis was performed
on a micro-plate reader at an absorbance of 450nm (Versamax Microplate
reader). The detection range was 15.6-1000 pg/ml.
2.11 Intraperitoneal injections of IL6
C57BL/6, C57BL/6.Tlr2-/-, NOD.H2b and NOD.H2b.Tlr2-/- mice received
daily intraperitoneal injection of IL6 (Shenandoah Biotechnology,
Pennsylvania, USA) (2g in 200l of PBS (Invitrogen; Victoria,
Australia)) for 20 days during the induction of the disease.
2.12 Mice treated with antibiotics
Mice were fed with pellets of medicated food with 600mg of amoxicillin,
100mg clarithromycin, 200mg metronidazole and 4mg ameprazole per
kilogram. Control mice were fed with normal food (no medicated food). All

CHAPTER 2
69
medicated and non-medicated food was bought from Specialty Feeds, Glen
Forrest, Western, Australia.
2.13 Statistical analysis
Mice from the control group were compared with knockout, congenic or
transgenic mice of the same sex. Statistical calculations were performed
using Microsoft Excel 2008, Graph Pad Prism version 5.00 (Graph Pad for
Mac, Software, San Diego, California, USA www.graphpad.com), Graph
Pad Prism version 4.0c (1994-2005) or InStat 3.0b (1992-2003). Data were
statistically significant at p < 0.05 (Mann-Whitney U test or Kruskal-Wallis
test with Dunn’s multiple-comparison post-test unless otherwise stated).

CHAPTER 3

CHAPTER 3
70
CHAPTER 3
ROLES FOR TLR2, TLR9 AND MYD88 BUT
NOT TLR1, TLR4 AND TLR6 IN ACTIVE
MOG35-55/CFA + PTX–INDUCED EAE
3.1 Introduction
MS is a chronic immune-mediated inflammatory/demyelinating disease of
the CNS that occurs in young adulthood and is more common in women but
more severe in men (Hsueh et al., 2013). The molecular mechanisms of MS
and the development of therapies to treat it have been successfully studied
in animal models such as EAE (Furlan et al., 2009). EAE causes a
demyelinating paralysis resembling the common forms of MS and almost
every therapy for MS has been developed in this animal model (Lindsey et
al., 1996). Despite advances in the treatment of signs and symptoms of MS,
the factors underlying its initiation and progression are unclear and no cure
or preventive therapies are known.
Multiple genetic and environmental factors contribute to MS and EAE as
discussed in Chapter 1. One potential mechanism by which environmental
factors could regulate autoimmune responses is via the TLR system and

CHAPTER 3
71
associated pathways. TLRs mediate inflammatory responses to
environmental factors known as PAMP, and to endogenous molecules
known as DAMP (Akira et al., 2006; Kaisho et al., 2006). Although TLR
expression increases in CNS autoimmune inflammation, the role of TLRs
remains controversial in MS and EAE (Bsibsi et al., 2002; Kerfoot, et al.,
2004; Prinz et al., 2006; Marta et al., 2008; Reynolds et al., 2010). In this
chapter, it is hypothesized that TLR ligation regulates CNS autoimmune
inflammation in EAE. To test this hypothesis, the roles of TLR1, TLR2,
TLR4, TLR6, TLR9, TLR2/9, TLR4/9 or MyD88 in active MOG35-55/CFA
+ PTX–induced EAE are examined.
3.2 Results
3.2.1 Toll-like receptors and MyD88 in active MOG35-
55/CFA + PTX–induced EAE
Previous studies found that MyD88 is required for the development of EAE
(Prinz et al., 2006). MyD88 is the adaptor molecule for almost all TLRs,
except TLR3; TLR3 signals via the TRIF pathway, and TLR4 uses both the
MyD88 pathway and the TRIF pathway (Uematsu et al., 2006). To
determine whether signalling through TLRs play a role in the induction
and/or effector phase of active MOG35-55/CFA + PTX–induced EAE, the
disease was induced in male and female C57BL/6 (WT, positive control

CHAPTER 3
72
group) and C57BL/6 mice deficient in TLR1, TLR2, TLR4, TLR6, TLR9,
TLR2/9, TLR4/9 or MyD88 (5-12 mice per group); with s.c. administration
of MOG35-55 peptide and CFA and i.p. administration of PTX. Negative
control male and female C57BL/6 mice were treated with Phosphate
Buffered Saline (PBS) (1 mouse), or PTX and an emulsion of CFA and PBS
(CFA/PTX) (1 mouse).
Clinical signs of active MOG35-55/CFA + PTX–induced EAE were
examined over 40 days. Neither male nor female mice from the negative
control groups showed clinical signs of EAE, while male and female
C57BL/6 mice from the positive control group and C57BL/6 mice deficient
in TLR1, TLR2, TLR4, TLR6, TLR9, TLR2/9, TLR4/9 immunized with
MOG35-55/CFA + PTX showed clinical signs of EAE (Figure 3.1 and Figure
3.2). PTX and CFA were unable to induce clinical signs of active EAE
without MOG35-55 peptide.
Clinical signs of active MOG35-55/CFA + PTX–induced EAE appeared
within 13-17 days in C57BL/6 (WT) male mice, and within 13-19 days in
C57BL/6 (WT) female mice after the induction of EAE. Both male and
female C57BL/6 mice developed a chronic form of EAE. The peak of active
MOG35-55/CFA + PTX–induced EAE was observed at 21 days after EAE
induction, followed by a slight drop to a plateau disability in both sexes
(Figure 3).

CHAPTER 3
73
The clinical course of active MOG35-55/CFA + PTX–induced EAE was
compared between C57BL/6 mice (positive control group) and
C57BL/6.Tlr-knockout mice. Both male and female mice deficient in TLR1
showed similar course of active MOG35-55/CFA + PTX–induced EAE
compared with C57BL/6 male or female mice respectively (Figure 3.2 and
Table 3.1).
Male mice deficient in TLR4 showed a mild exacerbation of active MOG35-
55/CFA + PTX–induced EAE for four days (days 16, 17, 20, 21) and,
TLR4/9 doubly deficient male mice had a mildly decreased severity of
disease for eight days (days 20-24 and 30-32) compared with C57BL/6 male
mice. However, in the absence of TLR4 or TLR4/9, mice showed similar
clinical course of active MOG35-55/CFA + PTX–induced EAE in female
mice compared with C57BL/6 female mice. Also, no differences were seen
in the daily clinical scores of active MOG35-55/CFA + PTX–induced EAE in
the absence of TLR6 compared with the positive control groups in both
male and female mice (Figure 3.2 and Table 3.1).
The day of onset of active MOG35-55/CFA + PTX–induced EAE, the
maximum score of disease and the CDI were also similar between C57BL/6
and C57BL/6 mice deficient in TLR1, TLR4 TLR6 and TLR4/9 in both

CHAPTER 3
74
male and female mice (Figure 3.2 and Table 3.1). These results indicate that
signalling from TLR1, TLR4, TLR6 and TLR4/9 do not play a major role in
active MOG35-55/CFA + PTX–induced EAE.

CHAPTER 3
75
Figure 3.1 Representative clinical course of active MOG35-55/CFA + PTX–induced EAE in individual mice. The two columns in the left side are the negative control C57BL/6 male and female mice immunized with PBS (closed squares) or CFA/PTX (open squares). The two columns in the right side are the positive control C57BL/6 and C57BL/6.Tlr-knockout male and female mice immunized with MOG35-55/CFA/PTX. Closed circles correspond to C57BL/6 WT positive control mice and open circles correspond to C57BL/6.Tlr1-/-, C57BL/6.Tlr2-/-, C57BL/6.Tlr4-/-, C57BL/6.Tlr6-/-, C57BL/6.Tlr9-/-, C57BL/6.Tlr2-/-9-/-, C57BL/6.Tlr4-/-9-/- and C57BL/6.Myd88-/- male and female mice.
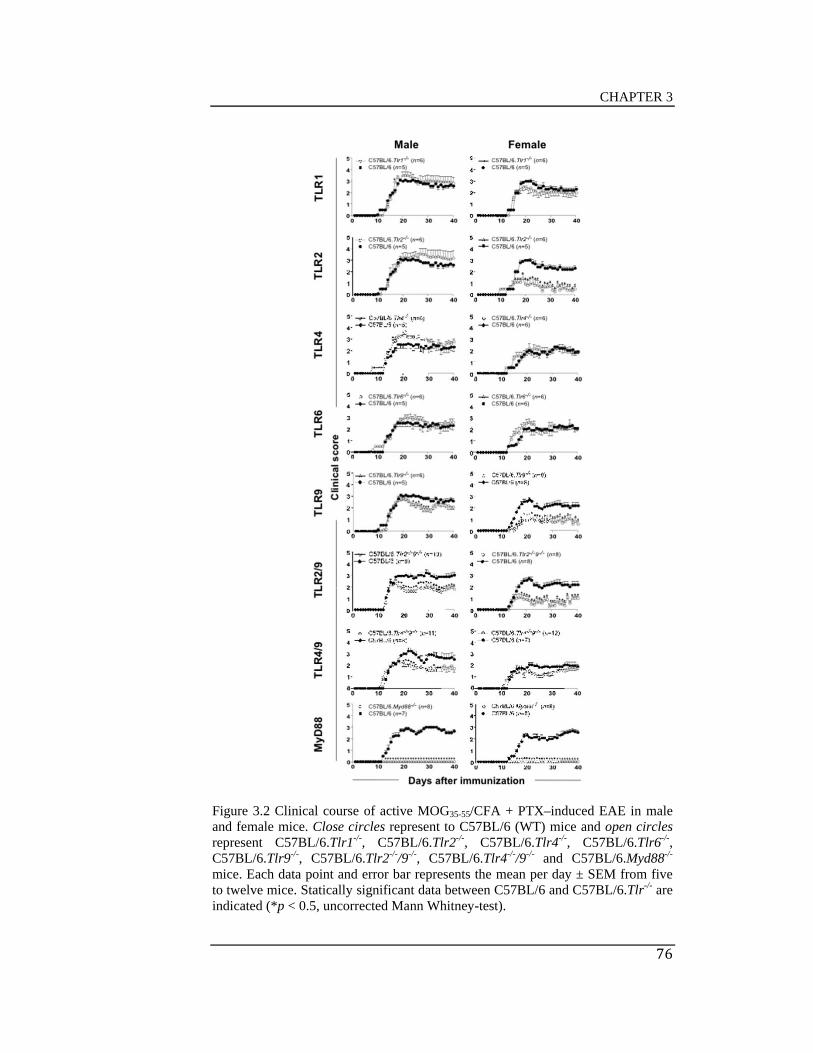
CHAPTER 3
76
Figure 3.2 Clinical course of active MOG35-55/CFA + PTX–induced EAE in male and female mice. Close circles represent to C57BL/6 (WT) mice and open circles represent C57BL/6.Tlr1-/-, C57BL/6.Tlr2-/-, C57BL/6.Tlr4-/-, C57BL/6.Tlr6-/-, C57BL/6.Tlr9-/-, C57BL/6.Tlr2-/-/9-/-, C57BL/6.Tlr4-/-/9-/- and C57BL/6.Myd88-/-
mice. Each data point and error bar represents the mean per day ± SEM from five to twelve mice. Statically significant data between C57BL/6 and C57BL/6.Tlr-/- are indicated (*p < 0.5, uncorrected Mann Whitney-test).

CHAPTER 3
77
Table 3.1 Characteristics of active MOG35-55/CFA + PTX–induced EAE in male and female C57BL/6 and C57BL/6 mice deficient in TLR1, TLR2, TLR4, TLR6, TLR9, TLR2/9, TLR4/9 and MyD88.
Experiment
Strain
n
Incidence
(%)
Onset
(days)
Maximum Disease Score
Cumulative Disease Index (CDI)
Male
Exp 1 C57BL/6 5 100 14.2±0.2 3.1±0.1 71.8±2.9
C57BL/6.Tlr1-/- 6 100 14.7±0.2 3.7±0.3 77.3±8.7
C57BL/6.Tlr2-/- 6 100 14.5±0.2 3.8±0.4 80.2±12.1
C57BL/6.Tlr9-/- 6 100 14.5±0.4 3.2±0.2 60.2±4.3
Exp 2 C57BL/6 5 100 13.2±0.2 2.9±0.2 62.1±8.3
C57BL/6.Tlr4-/- 6 100 13.2±0.2 3.5±0.0* 76.7±2.0
C57BL/6.Tlr6-/- 6 100 13.0±0.0 3.3±0.2 67.3±4.3
Exp 3 C57BL/6 6 100 15.2±0.5 3.0±0.0 64.9±5.2
C57BL/6.Tlr9-/- 6 100 15.3±0.2 2.8±0.2 60.5±3.7
Exp 4 C57BL/6 7 100 13.4±0.2 3.4±0.1 80.9±7.0
C57BL/6.Tlr2-/- 8 100 13.8±0.3 3.8±0.2 74.5±8.3
C57BL/6.Tlr2/9-/- 10 100 13.8±0.2 2.8±0.1** 49.4±5.4***
Exp 5 C57BL/6 7 100 14.3±0.4 3.0±0.0 70.3±2.9
C57BL/6.Myd88-/- 8 0 Na 0.0±0.0*** 0.0±0.0***
Exp 6 C57BL/6 8 100 13.7±0.2 3.25±0.2 71.9±6.7
C57BL/6.Tlr4/9-/- 11 100 12.4±0.3* 2.4±0.2 54.6±8.0
Female
Exp 1 C57BL/6 5 100 16.0±0.0 3.1±0.1 61.1±3.8
C57BL/6.Tlr1-/- 6 100 15.2±0.2** 2.7±0.3 53.6±9.7
C57BL/6.Tlr2-/- 6 100 15.7±0.8 1.6±0.3** 14.2±8.8*
C57BL/6.Tlr4-/- 6 100 15.7±1.6 3.2±0.4 64.0±19.2
C57BL/6.Tlr6-/- 6 100 15.5±1.6 3.1±0.5 65.1±19.8
C57BL/6.Tlr9-/- 6 33.3 17.0±1.2* 0.8±0.5** 8.5±7.8**
Exp 2 C57BL/6 6 100 13.7±0.3 2.9±0.3 57.7±10.3
C57BL/6.Tlr9-/- 6 100 17±0.0** 2.2±0.2* 32.0±5.5*
C57BL/6.Myd88-/- 5 40 22.0±2.6** 1.1±0.4** 8.8±7.3**
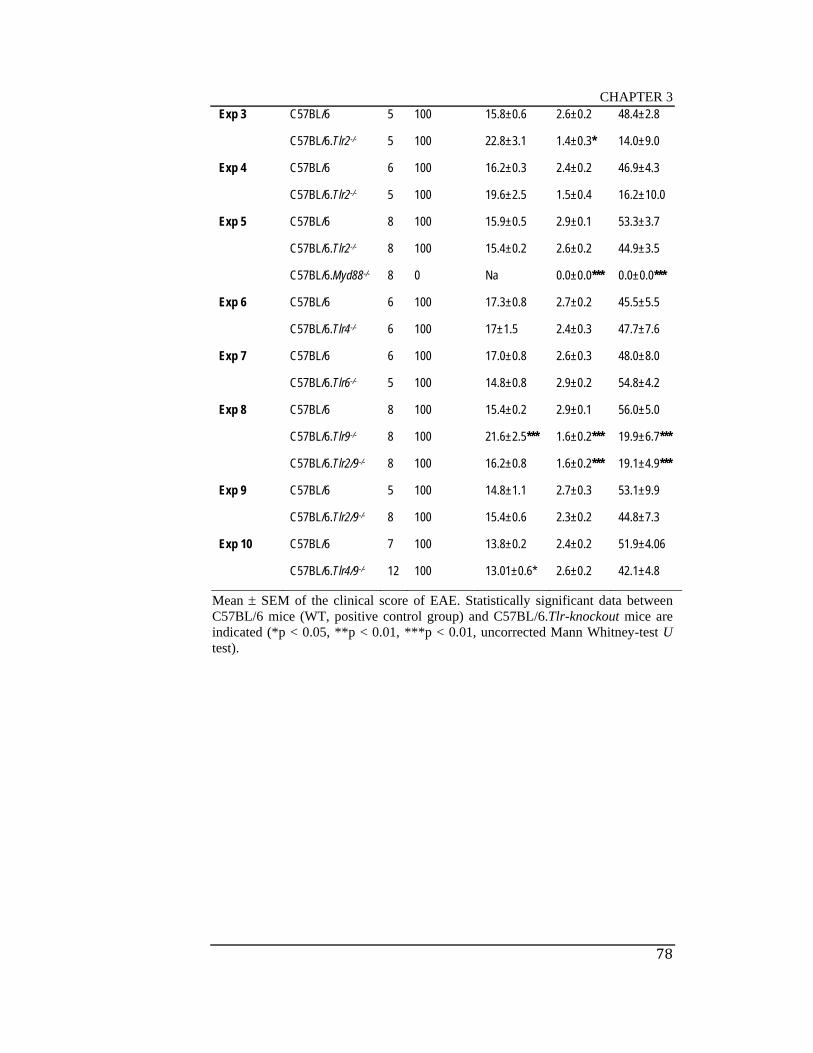
CHAPTER 3
78
Exp 3 C57BL/6 5 100 15.8±0.6 2.6±0.2 48.4±2.8
C57BL/6.Tlr2-/- 5 100 22.8±3.1 1.4±0.3* 14.0±9.0
Exp 4 C57BL/6 6 100 16.2±0.3 2.4±0.2 46.9±4.3
C57BL/6.Tlr2-/- 5 100 19.6±2.5 1.5±0.4 16.2±10.0
Exp 5 C57BL/6 8 100 15.9±0.5 2.9±0.1 53.3±3.7
C57BL/6.Tlr2-/- 8 100 15.4±0.2 2.6±0.2 44.9±3.5
C57BL/6.Myd88-/- 8 0 Na 0.0±0.0*** 0.0±0.0***
Exp 6 C57BL/6 6 100 17.3±0.8 2.7±0.2 45.5±5.5
C57BL/6.Tlr4-/- 6 100 17±1.5 2.4±0.3 47.7±7.6
Exp 7 C57BL/6 6 100 17.0±0.8 2.6±0.3 48.0±8.0
C57BL/6.Tlr6-/- 5 100 14.8±0.8 2.9±0.2 54.8±4.2
Exp 8 C57BL/6 8 100 15.4±0.2 2.9±0.1 56.0±5.0
C57BL/6.Tlr9-/- 8 100 21.6±2.5*** 1.6±0.2*** 19.9±6.7***
C57BL/6.Tlr2/9-/- 8 100 16.2±0.8 1.6±0.2*** 19.1±4.9***
Exp 9 C57BL/6 5 100 14.8±1.1 2.7±0.3 53.1±9.9
C57BL/6.Tlr2/9-/- 8 100 15.4±0.6 2.3±0.2 44.8±7.3
Exp 10 C57BL/6 7 100 13.8±0.2 2.4±0.2 51.9±4.06
C57BL/6.Tlr4/9-/- 12 100 13.01±0.6* 2.6±0.2 42.1±4.8
Mean SEM of the clinical score of EAE. Statistically significant data between C57BL/6 mice (WT, positive control group) and C57BL/6.Tlr-knockout mice are indicated (*p < 0.05, **p < 0.01, ***p < 0.01, uncorrected Mann Whitney-test U test).
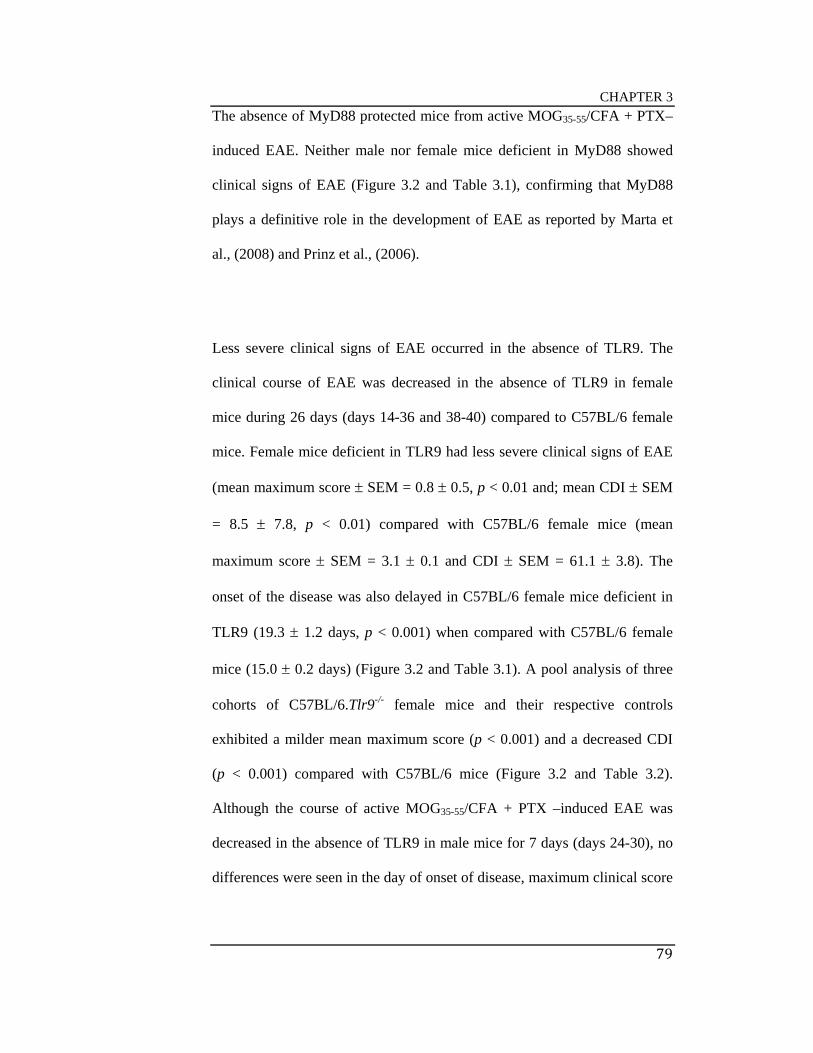
CHAPTER 3
79
The absence of MyD88 protected mice from active MOG35-55/CFA + PTX–
induced EAE. Neither male nor female mice deficient in MyD88 showed
clinical signs of EAE (Figure 3.2 and Table 3.1), confirming that MyD88
plays a definitive role in the development of EAE as reported by Marta et
al., (2008) and Prinz et al., (2006).
Less severe clinical signs of EAE occurred in the absence of TLR9. The
clinical course of EAE was decreased in the absence of TLR9 in female
mice during 26 days (days 14-36 and 38-40) compared to C57BL/6 female
mice. Female mice deficient in TLR9 had less severe clinical signs of EAE
(mean maximum score SEM = 0.8 0.5, p < 0.01 and; mean CDI SEM
= 8.5 7.8, p < 0.01) compared with C57BL/6 female mice (mean
maximum score SEM = 3.1 0.1 and CDI SEM = 61.1 3.8). The
onset of the disease was also delayed in C57BL/6 female mice deficient in
TLR9 (19.3 1.2 days, p < 0.001) when compared with C57BL/6 female
mice (15.0 0.2 days) (Figure 3.2 and Table 3.1). A pool analysis of three
cohorts of C57BL/6.Tlr9-/- female mice and their respective controls
exhibited a milder mean maximum score (p < 0.001) and a decreased CDI
(p < 0.001) compared with C57BL/6 mice (Figure 3.2 and Table 3.2).
Although the course of active MOG35-55/CFA + PTX –induced EAE was
decreased in the absence of TLR9 in male mice for 7 days (days 24-30), no
differences were seen in the day of onset of disease, maximum clinical score

CHAPTER 3
80
and CDI when compared with C57BL/6 male mice (Figure 3.2 and Table
3.2).
Less severe clinical signs of EAE occurred in the absence of TLR2. Female
mice deficient in TLR2 showed a decreased severity of EAE during 25 days
(days 16-40) compared to C57BL/6 female mice. The severity of EAE was
also decreased in the absence of TLR2 (mean of maximum score SEM =
1.6 0.3, p 0.01) and mean of CDI SEM = 14.2 8.8, p 0.05)
compared with C57BL/6 female mice (mean maximum score SEM of 3.1
0.1 and CDI SEM of 61.1 3.8) (Figure 3.2 and Table 3.1). A pooled
analysis of four cohorts of C57BL/6.Tlr2-/- female mice and their respective
control showed highly significant differences in mean maximum score (p <
0.001) and CDI (p < 0.001) (Figure 3.2 and Table 3.2). In contrast, no
differences were seen in the clinical course of EAE, onset day of disease,
maximum score of disease and CDI in the absence of TLR2 in male mice
compared with C57BL/6 male mice (Figure 3.2 and Table 3.1). These
results showed that sexual dimorphism is present in the severity of active
MOG35-55/CFA + PTX –induced EAE in the absence of TLR2 and TLR9.

CHAPTER 3
81
Table 3.2 Active MOG35-55/CFA + PTX –induced EAE in C57BL/6 female mice deficient in TLR2 and TLR9.
Experiment
Strain
n
Incidence
(%)
Onset
(days)
Mean Maximum Disease Score
Cumulative Disease Index (CDI)
Female
TLR2 C57BL/6 24 100 15.9±0.2 2.7±0.0 52.2±2.0
C57BL/6.Tlr2-/- 24 100 17.8±0.9 1.8±0.1*** 24.8±4.5***
TLR9 C57BL/6 19 100 15±0.2 2.9±0.1 57.8±3.8
C57BL/6.Tlr9-/- 20 80 19.3±1.2*** 1.5±0.2*** 20.1±4.2***
Mean SEM of the clinical score of EAE. Statistically significant data between C57BL/6 mice (WT, positive control group) and C57BL/6.Tlr2-/- and C57BL/6.Tlr9-/- female mice are indicated (*p < 0.05, **p < 0.01, ***p < 0.01, uncorrected Mann Whitney-test U test).
As active MOG35-55/CFA + PTX–induced EAE appeared to be partially
dependent on TLR2 and TLR9 signalling in female mice but not in male
mice, the disease was analyzed in female and male C57BL/6 (WT) and
C57BL/6.Tlr2-/-Tlr9-/- mice. C57BL/6.Tlr2-/-Tlr9-/- female mice showed
significantly less severe disease, with a mean maximum disease score
SEM of 1.6 0.2 (p0.001) and a mean CDI SEM of 19.1 4.9 (p0.001)
compared with the WT control group (2.9 0.01 and 56.0 5.0,
respectively). Less severe disease was also observed in C57BL/6.Tlr2-/-Tlr9-
/- male mice, with a mean maximum score SEM of 2.8 0.1 (p0.01) and
a mean CDI SEM of 49.4 5.4 (p0.001) compared with the WT control
group (3.4 0.1 and 80.9 7.0, respectively) (Figure 3.2, Table 3.1). Even
though the severity of EAE was decreased in C57BL/6.Tlr2-/-Tlr9-/- male
mice, the severity of disease in C57BL/6.Tlr2-/-Tlr9-/- female mice was not

CHAPTER 3
82
lower than that seen in single deficient mice in TLR2 or TLR9 (Figure 3.2
and Table 3.1).
All together, these results show that C57BL/6.Tlr2-/- and C57BL/6.Tlr9-/-
mice as well as male and female C57BL/6.Tlr2-/-Tlr9-/- showed less severe
EAE, whereas female and male C57BL/6.Myd88-/- are resistant to EAE.
Given the strong suppression of EAE in the absence of MyD88, these
results also indicates that MyD88 plays a role in the pathogenesis of EAE in
addition to its role as the adaptor molecule for TLR2 and TLR9.
3.2.2 Histopathology of damage to the spinal cord in
the absence of TLRs and MyD88
Spinal cords from male and female C57BL/6 (WT) mice (positive and
negative controls) and C57BL/6.Tlr1-/-, C57BL/6.Tlr2-/-, C57BL/6.Tlr4-/-,
C57BL/6.Tlr6-/-, C57BL/6.Tlr9-/-, C57BL/6.Tlr2-/-9-/- and C57BL/6.Myd88-/-
mice (5-20 mice per group) were assessed 40 days post EAE induction for
cell infiltration, loss of myelin and axonal injury. Transversal sections from
the spinal cords were scored using a semi-quantitative scoring system, as
shown in the Figure 3.3 and described in Material and Methods.

CHAPTER 3
83
The spinal cords from C57BL/6 male and female mice showed cell
infiltration, loss of myelin and axonal damage. In contrast, the spinal cords
from male and female negative controls mice did not show evidence of
EAE. Neither cell infiltration nor defects in LFB and Bielschowsky's silver
stain were observed in C57BL/6.Myd88-/- male or female mice (score mean
SEM = 0.0 0.0, p<0.001 in both male and female) compared with WT
mice (score mean in male SEM = 2.82 0.03 and score mean in female
SEM = 2.59 0.09) (Figure 3.4 and Figure 3.5). These results confirm that,
in the absence of MyD88, the CNS is completely resistant to active EAE.
Spinal cords from C57BL/6.Tlr9-/- and C57BL/6.Tlr2-/- female mice had
significantly decreased infiltration and demyelinating lesions (score mean
SEM = 1.28 0.13 (p<0.001) and 0.80 0.41 (p<0.01), respectively)
compared with WT mice (score mean SEM = 2.59 0.09). In contrast,
spinal cords from C57BL/6.Tlr9-/- and C57BL/6.Tlr2-/- male mice did not
differ to those of the positive control group. Both C57BL/6.Tlr2-/-Tlr9-/-
male and female mice had significantly fewer lesions and less infiltration
(score mean SEM = 1.74 0.15, p<0.001, and 1.42 0.28, p<0.01,
respectively) compared with WT mice (score mean SEM = 2.82 0.03
and 2.59 0.1, respectively) (Figure 3.4 and 3.5).

CHAPTER 3
84
Histopathological analysis confirmed that the severity of disease was
reduced in the absence of TLR2 and TLR9 in female mice, but not in male
mice, and in the absence of TLR2/9 in both male and female mice, whereas
the lack of MyD88 completely protected mice from EAE.

CHAPTER 3
85
Figure 3.3 Scoring system of spinal cord histopathology after 40 days of active MOG35-55/CFA + PTX –induced EAE. Spinal cord was stained with Hematoxylin and Eosin (H&E) (column on left side), Luxol fast Blue (middle column) and Bielschowsky's (column on right side). Representative pictures show four different grades of lesions in the spinal cord numbered from 0 to 3: score 0 = no lesions, no cell infiltration and no reduction in LFB and Bielschowsky's silver staining (first row); 1 = solitary lesions with cell infiltration of low cellular density with or without mildly reduced LFB and Bielschowsky's silver staining (second row); 2 = two to three lesions level with moderate cell infiltration associated with reduced LFB staining and Bielschowsky's silver (third row); 3 = many lesions in almost all fields with extensive cell infiltration associated with severe reduction in LFB and Bielschowsky's silver staining (fourth row). The objective magnification used is 4x. Lesions, cell infiltration and reduction of LFB and Bielschowsky’s silver are indicated with arrows (scoring system was modified from Hempel et al., 1985).

CHAPTER 3
86
Figure 3.4 Representative transverse histopathological sections of spinal cords taken 40 days after active MOG35-55/CFA + PTX-induced EAE. Males are shown on the left side and female are shown on the right side. At the top of every column is indicated the staining (H&E, LFB and Bielschowsky's silver) and magnification (100x): Fist row and second row show C57BL/6 negative control (mice treated with PBS or PTX/CFA respectively), followed by positive controls (mice treated with MOG35-55/CFA + PTX) and C57BL/6.Tlr-/- mice.
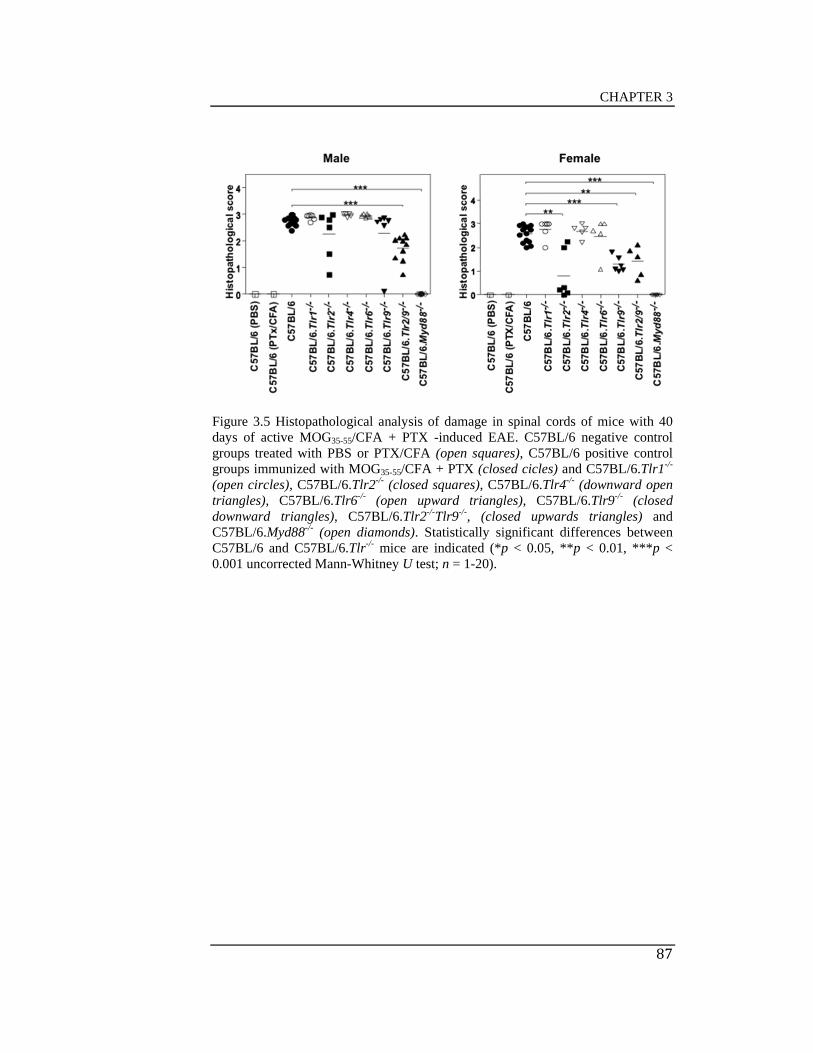
CHAPTER 3
87
Figure 3.5 Histopathological analysis of damage in spinal cords of mice with 40 days of active MOG35-55/CFA + PTX -induced EAE. C57BL/6 negative control groups treated with PBS or PTX/CFA (open squares), C57BL/6 positive control groups immunized with MOG35-55/CFA + PTX (closed cicles) and C57BL/6.Tlr1-/-
(open circles), C57BL/6.Tlr2-/- (closed squares), C57BL/6.Tlr4-/- (downward open triangles), C57BL/6.Tlr6-/- (open upward triangles), C57BL/6.Tlr9-/- (closed downward triangles), C57BL/6.Tlr2-/-Tlr9-/-, (closed upwards triangles) and C57BL/6.Myd88-/- (open diamonds). Statistically significant differences between C57BL/6 and C57BL/6.Tlr-/- mice are indicated (*p < 0.05, **p < 0.01, ***p < 0.001 uncorrected Mann-Whitney U test; n = 1-20).

CHAPTER 3
88
3.2.3 Leukocyte infiltration in the CNS at the peak of
active MOG35-55/CFA + PTX-induced EAE
TLR ligation triggers an inflammatory immune response and cell migration
(Taukeuchi et al., 1999; Hemmi et al., 2000; Alexopoulou et al., 2001;
Wang et al., 2004). CNS damage in EAE is characterised by the presence of
inflammatory cells that migrate from the periphery into the CNS
(Smorodchenko et al., 2007; Furtado et al., 2008). Potential explanations for
the relative resistance of C57BL/6.Tlr2-/-, C57BL/6.Tlr9-/-, C57BL/6.Tlr2-/-
Tlr9-/- and C57BL/6.Myd88-/- mice to active EAE induced with MOG35-
55/CFA + PTX include effects on recruitment of inflammatory cells to the
CNS and differences in subsets recruited. To determine the nature of cells
infiltrating the CNS of TLR-deficient C57BL/6 mice, CNS infiltrating
leukocytes of female and male C57BL/6, C57BL/6.Tlr2-/-, C57BL/6.Tlr9-/-,
C57BL/6.Tlr2-/-Tlr9-/- and C57BL/6.Myd88-/- mice were compared by flow
cytometric analysis 21 days after immunisation with MOG35-55/CFA +PTX
(Figure 3.6).
A significant decrease was observed in the total number of CD4+ and CD8+
T cells infiltrating the CNS of female C57BL/6.Myd88-/- mice compared to
C57BL/6 mice (p < 0.001 and p < 0.01 respectively, Kruskal-Wallis Test
with Dunn’s multiple comparison post-test; Figure 3.7) and a significant
reduction in CD8+ T cells in female C57BL/6.Tlr9-/- mice (p < 0.05). As

CHAPTER 3
89
TLR2- and TLR9- deficient mice showed a trend to lower T cell numbers,
an additional cohort of C57BL/6, C57BL/6.Tlr2-/- and C57BL/6.Tlr9-/- mice
was assessed and the data combined. Numbers of CD4+ T cells infiltrating
the CNS of female C57BL/6.Tlr2-/- and C57BL/6.Tlr9-/- mice of the
combined experiment were significantly decreased (p < 0.05 and p < 0.01
respectively, Kruskal-Wallis Test with Dunn’s multiple comparison post-
test; n = 11-13), as were the numbers of CD8+ T cells infiltrating the CNS of
C57BL/6.Tlr9-/- mice (p < 0.01).
Whereas male C57BL/6.Myd88-/- mice showed a statistically significant
decrease in only the total number of infiltrating CD4+ T cells (p < 0.01;
Kruskal-Wallis Test with Dunn’s multiple comparison post-test; n = 7-
8/group; Figure 3.7), neither the C57BL/6.Tlr2-/- nor C57BL/6.Tlr9-/- male
mice showed any significant difference in CNS infiltration, consistent with
the clinical data. As the C57BL/6.Tlr2-/-Tlr9-/- double mutant and
C57BL/6.Myd88-/- male mice showed some trends from the control mice in
terms of some infiltrating cell subsets, an additional cohort of C57BL/6,
C57BL/6.Tlr2-/-Tlr9-/- and C57BL/6.Myd88-/- male mice was assessed and
the data combined. Numbers of CD4+ and CD8+ T cells infiltrating the CNS
of male C57BL/6.Myd88-/- mice of the combined experiment were
significantly decreased (p < 0.001 and p < 0.05 respectively, Kruskal-Wallis
Test with Dunn’s multiple comparison post-test; n = 13/group).

CHAPTER 3
90
CD45 staining in combination with CD11b and/or CD11c was used to
distinguish between dendritic cells (DCs) (CD45intSShiCD11c+),
macrophages/monocytes (CD45hiSShiCD11b+) and inflammatory monocytes
(CD45hiSShiCD11c+CD11b+) (Figure 3.6). In contrast to female C57BL/6
mice, which develop severe EAE with high numbers of infiltrating cells,
female C57BL/6.Myd88-/- mice had statistically significantly fewer
infiltrating DCs, macrophages and inflammatory monocytes (p < 0.05, p <
0.01 and p < 0.001 respectively, Kruskal-Wallis Test with Dunn’s multiple
comparison post-test; n = 4-6/group). Analysis of the combined experiment
also found a significant reduction in CNS infiltrating macrophages in both
C57BL/6.Tlr2-/- and C57BL/6.Tlr9-/- female mice (p < 0.05 in both cases)
and a significant reduction in inflammatory monocytes in female
C57BL/6.Tlr2-/- mice (p < 0.01).
As for the T cells, male mutant mice tended to a phenotype more similar to
that of WT mice in terms of macrophage/monocyte infiltration. Only male
C57BL/6.Myd88-/- mice showed statistically significant decreases in
numbers of CNS infiltrating DCs and macrophages (p < 0.05 and p < 0.01
respectively; Kruskal-Wallis Test with Dunn’s multiple comparison post-
test; n = 7-8/group; Figure 3.7). Analysis of the combined experiment
confirmed reduction of DCs, macrophages and inflammatory monocytes in
only the male C57BL/6.Myd88-/- mice (p < 0.05, p < 0.01 and p < 0.05
respectively; Kruskal-Wallis Test with Dunn’s multiple comparison post-
test; n = 13/group).

CHAPTER 3
91
Thus, the milder clinical disease and resistance to EAE seen in female
C57BL/6.Tlr2-/-, C57BL/6.Tlr9-/-, C57BL/6.Tlr2-/-Tlr9-/- and
C57BL/6.Myd88-/- mice and male C57BL/6.Myd88-/- mice is associated with
decreased numbers of CNS infiltrating cells compared to C57BL/6 WT
mice.

CHAPTER 3
92
Figure 3.6 Representative gating of FACS analysis showing the proportions of leukocytes from CNS of male and female C57BL/6 (positive and negative control groups), C57BL/6.Tlr2-/-, C57BL/6.Tlr9-/- and C57BL/6.Tlr2-/-Tlr9-/- mice 21 days after MOG35-55/CFA/PTX immunisation. Lymphocytes and APCs were detected using side scatter area (SSA) vs CD45. Other cell populations were identified are the following: CD45hiTCR+CD4+ were CD4+ T cells; CD45hiTCR+CD8+ were CD8+ T cells; CD45intSShiCD11b+CD11c- were macrophages/monocytes; CD45intSShiCD11b+CD11c+ were inflammatory monocytes; CD45intSShiCD11b-
CD11c+ were dendritic cells (DCs). The mean SD of four to six mice per group, except the negative control group that is represented by a single mouse, is indicated in every plot.

CHAPTER 3
93
Figure 3.7 CNS-infiltrating leucocytes of C57BL/6 positive control group (closed circles), C57BL/6 negative control group (closed diamonds), C57BL/6.Tlr2-/- (closed squares), C57BL/6.Tlr9-/- (closed downward triangles), C57BL/6.Tlr2-/-Tlr 9-/- (closed upward triangles) and C57BL/6.Myd88-/- (open diamonds) male and female mice. The left column shows two separated experiments in male mice devided by a vertical line, and the right column shows a single experiment in female mice. Significant differences are indicated (*p < 0.05, **p < 0.01, ***p < 0.01, Kruskal-Wallis test with Dunn’s multiple-comparison post-test).

CHAPTER 3
94
3.2.4 Plasma cytokines in active MOG35-55/CFA +
PTX-induced EAE
TLR ligation triggers the production of inflammatory cytokines in
autoimmunity including EAE (Mills et al., 2011). To determine whether
target deletion of TLRs affect the development of active MOG35-55/CFA +
PTX-induced EAE, plasma from C57BL/6 mice and C57BL/6 mice
deficient in TLR2, TLR9, TLR2/9 and MyD88 was analyzed at 21 days
post-immunisation for IFN, GM-CSF, IL-1, IL-2, IL-4, IL-5, IL-6, IL-10,
IL-17, IL-18, IL-23, IFN, TNF, CXCL1/KC, and MIP-1
Plasma levels of IFN- (4 to 10 mice per group) were examined using an
enzyme-linked immunosorbent assay (ELISA) (PBL Biomedical
Laboratories; Piscataway, NJ, USA). IFNß was undetectable in all lines of
mice. Plasma levels of GM-CSF, IL-1, IFN, IL-2, IL-4, IL-5, IL-6, IL-10,
IL-17, IL-18, IL-23, TNF, CXCL1/KC, and MIP-1were examined by
cytometric bead arrays using Bender Medsystems (Viena, Austria) (4-8
mice per group). Plasma levels of IL5, IL6 and IL18 were significantly
increased in male mice deficient in MyD88 (p 0.01, p 0.05, p 0.01
respectively), but not in female mice deficient in MyD88, when compared
with C57BL/6 mice (Figure 9). Increased levels of IL18 might be due to an
infection, although mice did not show evidence of infection. Plasma levels
of IL17 were significantly decreased in female mice deficient in TLR2/9 (p

CHAPTER 3
95
0.05) but not in TLR2/9 deficient male mice (Figure 8). No significant
differences were observed in the levels of GM-CSF, IL-1, IFN, IL-2, IL-
4, IL-10, IL-23, TNF, CXCL1/KC, and MIP-1. These results discard an
association between TLR2, TLR9, TLR2/9 and MyD88 and circulating
cytokines in the development of clinical signs of EAE at the peak of the
disease, suggesting that circulating cytokines play a role during the
induction of EAE not at the peak of disease.

CHAPTER 3
96
Figure 3.8 Cytokine levels in the plasma of C57BL/6 and C57BL/6.Tlr-/- male mice, 21 days after MOG35-55/CFA + PTX immunisation. WT mice were compared to C57BL/6 mice deficient in TLR2, TLR9, TLR2/9 and MyD88. Data were considered statically significant when *p < 0.05, **p < 0.01 (uncorrected Mann Whitney-test U test).

CHAPTER 3
97
3.3 Discussion
As previously reviewed in Baxter 2007, the use of CFA and Pertussis toxin
were indispensable in this study to induce active EAE suggesting that
components of microorganisms are involved in the induction of disease.
TLRs recognize PAMP and DAMP and trigger immune responses
(Taukeuchi et al., 1999; Hemmi et al., 2000; Alexopoulou et al., 2001;
Wang et al., 2004). TLR ligands such as CpG ODN (Segal et al., 2000),
LPS (Reynolds et al., 2010; Hansen et al., 2006; Wolf et al., 2007) and
zymosan (Hansen et al., 2006) have been successfully used as adjuvants in
the induction of EAE, or have been used to modulate the severity of disease,
indicating the capacity of TLR signalling to promote the disease.
Consistent with previous studies (Prinz M, et al., 2006; Marta et al., 2008;
Lampropoulou et al., 2008), MyD88 signalling was essential for the
development of clinical signs and lesions in the CNS in this study. MyD88
is the adaptor molecule for signalling induced by IL1, IL18 and all TLRs,
except TLR3 (Adachi et al., 1998; Kumar et al., 2009). Activation of
MyD88 by IL1/1L18 promotes the production of IL17 (Kumar et al., 2009;
Lalor SJ, et al., 2011). Absences of both IL1 and IL18 have been studied in
EAE. IL1-/- mice were reported to show a decrease in the clinical signs of
EAE (Sutton C, et al., 2006) while the course of EAE in IL18-/- mice was
controversial (Shi FD, et al 2000; Gutcher I, et al., 2006) suggesting that in
addition to the role of IL1/1L18 in the phenotype of MyD88 in EAE, TLRs
CHAPTER 3
98
also participate in the activation of MyD88 to promote or to regulate the
production of IL17 in EAE.
TLR1, TLR4 and TLR6 did not contribute to the severity of active MOG35-
55/CFA + PTX-induced EAE in this study. To my knowledge, this study is
the first in discarding a role of TLR1 in EAE. The role of TLR6 was
previously reported by Prinz et al., (2006) and confirmed in this study as not
necessary to the development of EAE. Whereas TLR1 and TLR6 did not
affect the severity of EAE, the contribution of TLR2, TLR4 and TLR9 to
EAE is controversial. Mice deficient in TLR4 have been reported to
increased severity (Marta et al., 2008), decreased severity and unaffected
EAE (Kerfoot et al., 2004). In this study, the absence of TLR4 did not affect
the phenotype of active EAE. Differences in the results must be associated
to the differences protocols used to induce EAE. TLR9 and TLR2 played a
partial role in active EAE in this study. However, previous studies have
reported that active EAE is exacerbated (Marta et al., 2008) or decreased in
the absence of TLR9 (Prinz et al., 2006); and TLR2 do not affect (Prinz et
al., 2006) the severity of EAE (Shaw PJ et al., 2011).
TLR2 can signal as homodimer or else as heterodimer with TLR1 or TLR6;
however, neither TLR6 nor TLR1 appear to play a role in active EAE. So in
this study TLR2 must be act as a homodimer. The combination of
deficiency of TLR2 and TLR9 did not affect the severity of EAE more than

CHAPTER 3
99
the deficiency of either TLR2 or TLR9 indicating that the role of each
receptor is independent of each other. Discrepancies of previous studies in
the role of TLR2 and TLR9 could be because of sex susceptibility to EAE
as showed in this study.
All together, while male and female mice deficient in MyD88 were
completely protected from active EAE, no TLR knockout mice was totally
protected from the disease. As the absence of IL1 showed less severe EAE
and the absence of IL18 is indistinct in the disease (Shi FD, et al 2000;
Gutcher I, et al., 2006; Sutton C, et al., 2006), MyD88 play a definitive role
in the pathogenesis of EAE in addition to its role as the adaptor molecule of
IL1/1L18/TLRs. EAE is dependent of the activation of MyD88 by IL1,
TLR2 and TLR9.

CHAPTER 4

CHAPTER 4
100
CHAPTER 4
ROLE FOR TLR2 AND TLR9 IN PASSIVE
EAE
4.1 Introduction
The most common animal model to study Multiple Sclerosis is EAE. The
two main types of EAE are: 1) active EAE, induced with autoantigen, such
as MOG, adjuvants, for example CFA, and PTX, and 2) passive EAE which
is induced by adoptive cell transfer from donors to recipients (Stromnes et
al., 2006; Miller et al., 2007).
The active form of EAE involves the use of killed M. tuberculosis as a
component of the adjuvant. M. tuberculosis possess agonists for TLR2
(Brightbill et al., 1999; Jones et al., 2001; Means et al., 1999; Thoma-
Uszynski et al., 2000), TLR4 (Means et al., 1999; Thoma-Uszynski et al.,
2000; Abel et al., 2002; Brian et al., 2002) and TLR9 (Bafica et al., 2005).
In the previous chapter we found that the severity of active MOG35-55/CFA
+ PTX–induced EAE decreased in the absence of TLR2 and TLR9. An
explanation for the relative resistance of C57BL/6.Tlr2-/- and C57BL/6.Tlr9-
/- to MOG35-55/CFA + PTX–induced EAE is that the suppression of TLR2
and TLR9 signalling inhibited the adjuvant activity of CFA. To determine

CHAPTER 4
101
whether the adjuvant activity of CFA is inhibited in the absence of TLR2
and TLR9, the passive form of EAE was examined in C57BL/6,
C57BL/6.Tlr2-/- and C57BL/6.Tlr9-/- mice.
In addition to the action of CFA in EAE, a question remains, what could
trigger TLR2 and TLR9 signalling? Recently evidence implicates
microbiota in autoimmune diseases including MS and EAE (Fung et al.,
2012). For example: Li et al., (2007) reported that H. pylori is associated
with protection against MS in the Japanese population. Berer et al., (2011)
reported that commensal gut flora is essential to trigger myelin specific
CD4+ T cells in relapsing-remitting EAE. Lee et al., (2011) found that germ-
free mice decreased the severity of EAE compared with mice colonized with
normal flora; and colonization with segmented filamentous bacteria (SFB)
induces CD4+ T cells, which produce IL17 in CNS. Decrease of clinical
signs of EAE was associated with lower levels of IFN and IL17, and
increase numbers of Tregs. In addition, Lee et al., (2011) showed that mice
infected with SFB are able to restore the severity of EAE (Lee et al., 2011).
Thus, a possible explanation that trigger TLR2 and TLR9 signalling is
microflora, which could partially regulate autoimmune responses via these
TLRs. To determine whether microflora could be responsible for TLR
dependent EAE, the clinical course of passive EAE was analysed in
C57BL/6.Tlr9-/- and C57BL/6.Tlr2-/- female mice treated with amoxocilin,
clarithromycin, metronidazole and omeprazole.
CHAPTER 4
102
4.2 Results
4.2.1 Absence of PTX and irradiation in passive EAE
The passive EAE mouse model used in this study have a number of
refinements in order to increase the severity of disease. In this model, cells
adoptively transfer the disease from active immunized donors after
reactivation in vitro into preconditioned mice by irradiation and immunized
with PTX, as described in chapter 2. To determine the importance of PTX
and irradiation in passive EAE, we characterised the effect of PTX and
irradiation in our mouse model by inducing the disease in three different
forms: 1) passive EAE with both PTX and gamma irradiation (control
group); 2) passive EAE with PTX in the absence of gamma irradiation; 3)
passive EAE with gamma irradiation in the absence of PTX.
Mice treated with PTX together with irradiation, as well as those only
immunized with PTX, showed clinical signs of disease (Table 4.1). Five
mice from a group of six mice treated with irradiation in the absence of PTX
showed clinical signs of disease (Table 4.1). Mice treated with both
irradiation and PTX showed more severe maximum clinical score SEM
(3.00 0.00) and CDI SEM (41.33 5.51) compared to mice treated only
with irradiation (maximum clinical score SEM = 1.58 0.32, p 0.01 and

CHAPTER 4
103
CDI SEM = 11.75 3.29, p 0.01) or mice treated only with PTX
(maximum clinical score SEM = 2.41 0.20, p 0.05 and CDI SEM =
24.92 4.30, p 0.05) (Table 4.1). Because the use of PTX and irradiation
in the passive EAE mouse model showed 100% incidence of EAE and
developed more severe disease, the mouse model was used in subsequent
experiments.

CHAPTER 4
104
Table 4.1 Passive EAE in C57BL/6 mice treated with or without PTX and irradiation.
Leukocytes from spleen and lymph nodes from donor mice immunized with CFA, PTX and MOG35-55 were reactivated in vitro and transferred into recipient mice with different treatments. a Irradiated C57BL/6 mice plus PTX, b no irradiated C57BL/6 mice plus PTX, c irradiated C57BL/6 mice without PTX. Statistical differences comparing irradiated C57BL/6 mice plus PTX with no irradiated C57BL/6 mice plus PTX and irradiated C57BL/6 mice without PTX are indicated (*p < 0.05, **p < 0.01, ***p < 0.001; uncorrected Mann-Whitney U test).
Strain
n
Irradiation Pertussis Toxin Incidence (%)
Mean Maximum Score
Cumulative Disease Index (CDI)
a C57BL/6 6 Yes Yes 100 3.00±0.00 41.33±5.51 b C57BL/6 6 No Yes 100 2.41±0.2* 24.92±4.30* c C57BL/6 6 Yes No 83.3 1.58±0.32** 11.75±3.29**

CHAPTER 4
105
4.2.2 The absence of TLR4 in the severity of passive
EAE
It has been reported that PTX signal via TLR4 (Kerfoot et al., 2004; Nishida
et al., 2010). Although the phenotype of active MOG35-55/CFA+PTX–
induced EAE was similar between C57BL/6.Tlr4-/- mice and C57BL/6 mice
(WT-control group) (data showed in chapter 3), it remains possible that it
did contribute to the activity of PTX in a passive model in either sex.
Similarly, studies indicate that irradiation produces intrinsic TLR4 agonists
(Apetoh et al., 2007), as well as the translocation of commensal gut
microflora into mesenteric lymph nodes and elevation of circulating LPS
(Paulos et al., 2007). To clarify the role of TLR4 in EAE, the passive form
of EAE was induced in C57BL/6 (control group) and C57BL/6.Tlr4-/-
female mice.
C57BL/6 mice deficient in TLR4 showed clinical signs of EAE (Figure
4.1). The clinical course of passive EAE in the absence of TLR4 decreased
during six days (day 25 to day 30). The onset day of disease was delayed
(20.17 0.70 days, p 0.01) and the CDI SEM was decreased (20.42
5.15, p 0.05) in C57BL/6.Tlr4-/- female mice compared with C57BL/6
female mice (13.33 2.02 days and CDI SEM = 41.33 5.51). However,
no difference was seen in maximum score of disease between
C57BL/6.Tlr4-/- and C57BL/6 mice (Figure 4.1).

CHAPTER 4
106
Although clinical signs of EAE were decreased in the absence of TLR4 in
passive EAE, the inhibition of disease was not as great as in the mice that
lacked PTX, indicating that, if PTX does not act through TLR4, it is also
likely to have activities mediated by other mechanisms in this model.

CHAPTER 4
107
Figure 4.1 Analysis of the clinical course of passive EAE in female C57BL/6 (closed circles) and C57BL/6.Tlr4-/- (open circles) mice. Significant differences in the clinical score per day between C57BL/6 and C57BL/6.Tlr4-/- mice are indicated (*p < 0.05). Differences in the onset of disease, maximum clinical score and cumulative disease are shown (*p < 0.05, **p < 0.01, ***p < 0.001 uncorrected Mann-Whitney U test; n = 6).
This image cannot currently be display ed.

CHAPTER 4
108
4.2.3 TLR9 and TLR2 in passive EAE
CFA contains M. tuberculosis and TLR2, TLR4 and TLR9 are activated in
response to M. tuberculosis (Brightbill et al., 1999; Means et al., 1999;
Thoma-Uszynski et al., 2000; Jones et al., 2001; Abel et al., 2002; Bafica et
al., 2005). Passive EAE is induced in the absence of CFA. Previously we
found that TLR4 did not play a major role neither in active EAE nor passive
EAE. However, it is possible that target deletion of Tlr2 and Tlr9 decreased
the severity of active MOG35-55/CFA+PTX–induced EAE because the lack
of TLR2 and TLR9 signalling suppress the adjuvant action of CFA. To
determine whether the components of killed Mycobacteria tuberculosis used
as adjuvant in active MOG35-55/CFA + PTX–induced EAE were responsible
for TLR2 and TLR9 dependent disease; the passive form of EAE was
examined in the absence of TLR2 and TLR9.
A pool analysis of three independent experiments in female mice showed
that the clinical course of passive EAE decreased during 10 days (day 25 to
day 34) in C57BL/6.Tlr9-/- mice compared to C57BL/6 (p 0.5) (Figure
4.2). The clinical signs of disease were less severe in the absence of TLR9
(mean maximum score SEM = 1.6 0.4, p 0.5) compared to C57BL/6
mice (mean maximum score SEM = 2.8 0.2) (Table 4.2 and Figure 4.2).
The onset of disease was not affected in any of the three experiments or
combined experiments. Although the CDI showed significant differences in
one of three independent experiments between C57BL/6.Tlr9-/- (CDI SEM

CHAPTER 4
109
= 4.4±1.5,p 0.01) and C57BL/6 (CDI SEM = 34.4±4.7), the pool
analysis of the three experiments did not show differences (Table 4.2 and
Figure 4.2). In contrast, fiveindependentexperimentsinbothmaleand
femaleshowedthattheabsenceofTLR2completelyprotectmicefrom
thepassiveformofEAE(Table4.2,Figure4.3andfigure4.4).

CHAPTER 4
110
Table 4.2 Passive EAE in TLR-deficient C57BL/6 mice and C57BL/6 WT control mice
Experiment
Strain
n
Incidence
(%)
Onset
(days)
Mean Maximum Score
Cumulative Disease Index (CDI)
Female
Exp 1 C57BL/6 5 100 17.0±2.3 2.8±0.2 34.4±4.7
C57BL/6.Tlr2-/- 3 0 Na 0.0±0.0* 0.0±0.0*
C57BL/6.Tlr9-/- 5 80 13.8±1.8 1.6±0.4* 25.1±9.3
Exp 2 C57BL/6 6 100 23.8±0.5 2.7±0.2 21.8±2.1
C57BL/6.Tlr2-/- 4 0 Na 0.0±0.0** 0.0±0.0**
C57BL/6.Tlr9-/- 4 100 23.3±1.3 1.5±0.2** 4.4±1.5**
Exp 3 C57BL/6 4 100 19.5±1.8 2.5±0.5 33.4±7.9
C57BL/6.Tlr2-/- 6 0 Na 0.0±0.0** 0.0±0.0**
C57BL/6.Tlr9-/- 5 100 19.4±2.8 2.1±0.5 26.0±11.1
Combined C57BL/6 15 100 20.4±1.2 2.7±0.2 29.1±3.0
C57BL/6.Tlr2-/- 13 0 Na 0.0±0.0*** 0.0±0.0***
C57BL/6.Tlr9-/- 14 92.8 18.8±0.5 1.8±0.2** 19.5±5.5
Male
Exp 1 C57BL/6 4 100 23±1.0 2.6±0.4 16.9±3.2
C57BL/6.Tlr2-/- 3 0 Na 0.0±0.0 0.0±0.0
Exp 2 C57BL/6 6 100 21±0.2 3.0±0.0 22.8±2.4
C57BL/6.Tlr2-/- 6 0 Na 0.0±0.0** 0.0±0.0**
Combined C57BL/6 10 100 21.8±0.5 2.8±0.1 18.9±1.9
C57BL/6.Tlr2-/- 9 0 Na 0.0±0.0*** 0.0±0.0***
Passive EAE was induced by adoptive transfer of in vitro activated lymph nodes and splenocytes from MOG35-55/CFA immunized C57BL/6 mice into C57BL/6.Tlr2-/-, C57BL/6.Tlr9-/- and C57BL/6 (control WT mice). Mean SEM of the clinical scores of EAE. Statistical differences between B6 WT control mice and TLR-deficient mice for TLR2 and TLR9 are indicated (*p < 0.05, **p < 0.01, ***p < 0.001; uncorrected Mann-Whitney U test). na = not appropriate.
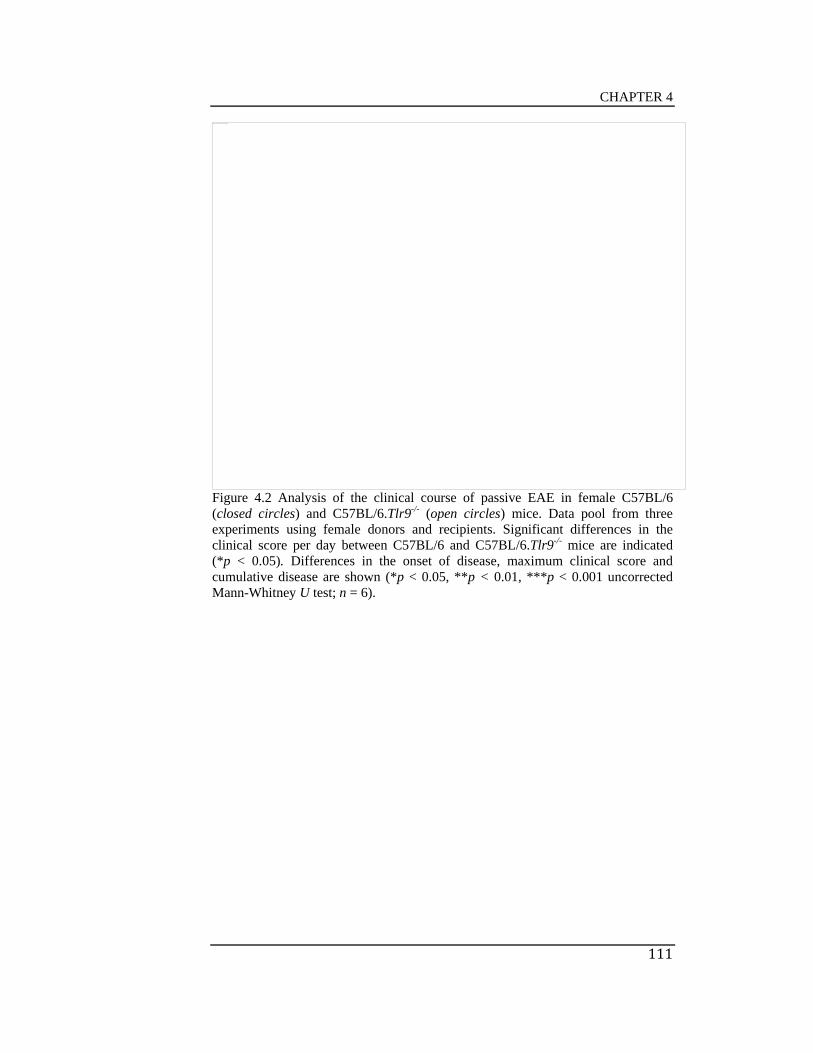
CHAPTER 4
111
Figure 4.2 Analysis of the clinical course of passive EAE in female C57BL/6 (closed circles) and C57BL/6.Tlr9-/- (open circles) mice. Data pool from three experiments using female donors and recipients. Significant differences in the clinical score per day between C57BL/6 and C57BL/6.Tlr9-/- mice are indicated (*p < 0.05). Differences in the onset of disease, maximum clinical score and cumulative disease are shown (*p < 0.05, **p < 0.01, ***p < 0.001 uncorrected Mann-Whitney U test; n = 6).
This image cannot currently be display ed.

CHAPTER 4
112
Figure 4.3 Analysis of the clinical course of passive EAE in male C57BL/6 (closed circles) and C57BL/6.Tlr2-/- (open circles) mice. Data pool from two experiments using male donors and recipients. Significant differences in the clinical score per day between C57BL/6 and C57BL/6.Tlr2-/- mice are indicated (*p < 0.05). Differences in the onset of disease, maximum clinical score and cumulative disease are shown (*p < 0.05, **p < 0.01, ***p < 0.001 uncorrected Mann-Whitney U test; n = 9-10).

CHAPTER 4
113
Figure 4.4 Analysis of the clinical course of passive EAE in female C57BL/6 (closed circles) and C57BL/6.Tlr2-/- (open circles) mice. Data pool from three experiments using female donors and recipients. Significant differences in the clinical score per day between C57BL/6 and C57BL/6.Tlr2-/- mice are indicated (*p < 0.05). Differences in the onset of disease, maximum clinical score and cumulative disease are shown (*p < 0.05, **p < 0.01, ***p < 0.001 uncorrected Mann-Whitney U test; n = 6).

CHAPTER 4
114
Because mice deficient in TLR2 did not show clinical signs of passive EAE,
a further examination of the role of TLR2 in passive EAE was done in
female mice by adoptive transfers from: a) C57BL/6 into C57BL/6 (control
group); b) C57BL6.Tlr2-/- into C57BL6.Tlr2-/-; c) C57BL6.Tlr2-/- into
C57BL/6; d) C57BL/6 into C57BL6.Tlr2-/-.
Leucocytes transferred from C57BL/6 into C57BL/6 mice resulted in severe
clinical course of passive EAE, while C57BL/6 leukocytes into
C57BL/6.Tlr2-/- mice did not show clinical signs of disease (Figure 4.5) (p
0.05). The adoptive transfer of leukocytes from C57BL/6.Tlr2-/- into
C57BL/6, and C57BL/6.Tlr2-/- into C57BL/6.Tlr2-/- resulted in a lower
clinical course of disease compared with leucocytes transferred from
C57BL/6 into C57BL/6 mice (p 0.05) (Figure 4.5).
The onset SEM of passive EAE was delayed when leukocytes were
transferred from: C57BL6.Tlr2-/- into C57BL6.Tlr2-/- (26.6 0.94 days, p
0.001); C57BL6.Tlr2-/- into C57BL/6 (28.0 1.15 days, p 0.001)
compared with leukocytes transferred from C57BL/6 into C57BL/6 (13.3
0.28 days) (Figure 4.5).
The maximum clinical scores SEM were less severe when leukocytes
were transferred from: C57BL6.Tlr2-/- into C57BL/6 (1.88 0.30, p 0.05)

CHAPTER 4
115
compared with leukocytes transferred from C57BL/6 into C57BL/6 (3.0
0.0). No differences in the maximum clinical score were seen when
leukocytes were transferred from C57BL6.Tlr2-/- into C57BL6.Tlr2-/-
compared with leukocytes transferred from C57BL/6 into C57BL/6 (Figure
4.5).
The CDI SEM was decreased when leukocytes were transferred from:
C57BL6.Tlr2-/- into C57BL6.Tlr2-/- (8.95 2.39, p 0.001); C57BL6.Tlr2-/-
into C57BL/6 (5.44 2.34, p 0.01) compared with leukocytes transferred
from C57BL/6 into C57BL/6 (41.33 5.51) (Figure 4.5).
These results confirm that TLR2 plays a role in exacerbating the severity of
EAE. The prevention of clinical signs of EAE in TLR2-deficient recipients
of WT cells suggests that the presence of receptor at induction of EAE
creates a dependence on TLR2 signalling in the effector phase.

CHAPTER 4
116
Figure 4.5 Analysis of the clinical course of passive EAE in female mice. Data pool from three experiments using female donors and recipients. Adoptive transfer from: C57BL/6 into C57BL/6 (closed circles), C57Bl/6.Tlr2-/- into C57Bl/6.Tlr2-/- (upward triangles), C57Bl/6.Tlr2-/- into C57BL/6 (closed diamonds), C57BL/6 into C57Bl/6.Tlr2-/- (closed squares). Significant differences in the clinical score per day are indicated (*p < 0.05). Differences in the onset of disease, maximum clinical score and cumulative disease are shown (*p < 0.05, **p < 0.01, ***p < 0.001 uncorrected Mann-Whitney U test; n = 6-10).
This image cannot currently be display ed.

CHAPTER 4
117
4.2.4 CD4+ T cells in the CNS in passive EAE
Potential explanations for the relative resistance of C57BL6.Tlr2-/- and
C57BL6.Tlr9-/- mice to passive EAE involve effects on recruitment of
inflammatory cells to the CNS. To determine whether inflammatory cells
could accumulate in CNS in the absence of TLR2 and TLR9 in passive
EAE, leucocytes from brain and spinal cord were isolated and analysed by
flow cytometry 34 days after passive transfer of leukocytes from female
C57BL/6 donors into female C5BL6.Tlr9-/- and C5BL6.Tlr2-/- recipients
(Figure 4.6).
Consistent with the clinical signs of passive EAE, C5BL6.Tlr2-/- mice had
fewer total numbers of CNS-infiltrating CD4+ T cells SEM (0.8 0.01, p
0.01; pair wise Mann Whitney U test) than C57BL/6 mice (0.64 0.25)
(Figure 4.7). C5BL6.Tlr2-/- mice also had less MFI SEM of CNS-
infiltrating myeloid DCs (85.50 1.26, p 0.05) compared with C57BL/6
mice (108.3 7.58) (Figure 4.8). No differences in total numbers of
TCR+CD8+ T cells and CD11b+Ly6ChiCCR2hi (inflammatory macrophages)
in the CNS were observed in C5BL6.Tlr9-/- and C5BL6.Tlr2-/- compared to
C57BL/6 mice (Figure 4.7). Thus, the absence of TLR2 diminished the
entry of inflammatory cells in the CNS.

CHAPTER 4
118
Figure 4.6 Representative FACS analysis showing the proportions of brain and spinal cord leukocytes from female C57BL/6, C57BL/6 (PBS), C57BL/6.Tlr2-/- and C57BL/6.Tlr9-/-, 34 days after adoptive transfer of EAE. Lymphocytes were identified as CD45hi and SSAlow. TCR in combination with CD4 or CD8 were used to detect CD4+ and CD8+ T cells respectively. Inflammatory macrophages were Ly6C+CCR2+ and myeloid DCs were CD11b+CD11c+.
This image cannot currently be display ed.

CHAPTER 4
119
Figure 4.7 Absolute numbers of CD4+ T cells, CD8+ T cells, inflammatory macrophages and, myeloid dendritic cells (MFI- mean fluorescence intensity) in the CNS of C57BL/6 (closed cicles), C57BL/6.Tlr2-/- (closed squares), C57BL/6.Tlr9-/- (downward closed triangles), C57BL/6 (PBS) (closed diamonds) female mice. Statistical differences between the C57BL/6.Tlr-deficient mice and C57BL/6 control group are indicated (*p < 0.05, **p < 0.01, ***p < 0.001 uncorrected Mann-Whitney U test; n = 1-6).
This image cannot currently be display ed.

CHAPTER 4
120
4.2.5 CD4+ T cells secreting IL17 in the absence of
TLR2 in the CNS
As CD4+ T cells decreased in the absence of TLR2 in the CNS, and both
CD4+ T cells and IL17 play a crucial role in EAE (Harrington et al., 2005;
Park et al., 2005), the secretion of IL17 by CD4+ T cells were examined in
the CNS and spleen in passive EAE. Leucocytes from mice with passive
EAE were isolated from CNS and spleens 30 days after the induction of
disease. CNS leukocytes and splenocytes were stimulated in vitro with
PMA as described in the Chapter 2 and analyzed by flow cytometry (Figure
4.8).
Four independent experiments for both males (n = 3-6 mice) and females (n
= 5-6 mice) showed that the total numbers of CD4+ T cells secreting IL17
SEM was reduced in the absence of TLR2 in the CNS of both sexes (males:
0.03 0.00, p 0.05; females: 0.00 0.00, p 0.01) compared with the
C57BL/6 mice (males 0.15 0.03, females 0.18 0.04) (Figure 4.8).
However, no differences were seen in the total numbers CD4+ T cells
secreting IL17 in spleens when compared with C57BL/6 mice (Figure 4.8).
These results indicated that TLR2 signalling is required for the secretion of
IL17 by CD4+ T cells infiltrating the CNS.

CHAPTER 4
121
Figure 4.8 Representative experiments of IL17 secretion of Central Nervous System leukocytes and splenocytes from naive mice, and mice with passive EAE. Cells were stimulated with PMA and controls were not stimulated. Unstimulated naive C57BL/6 cells (closed diamonds), stimulate naive C57BL/6 cells (open diamonds), unstimulated C57BL/6 cell from mice with passive EAE (closed squares), stimulated C57BL/6 cells from mice with passive EAE (closed cicles), unstimulated C57BL/6.Tlr2-/- cells from mice with passive EAE (open squeare), stimulated C57BL/6.Tlr2-/- cells from mice with passive EAE (open circles). Significant data are indicated (*p < 0.05, **p < 0.01, ***p < 0.001 uncorrected Mann-Whitney U test; n = 1-6).
This image cannot currently be display ed.

CHAPTER 4
122
4.2.6 Absolute numbers of CD62L-expressing Tregs
in the absence of TLR2
Tregs and Tregs subsets have been associated with the suppression of Th17
cells (Ichiyama et al., 2008). For example, activation of CD62L-expressing
Tregs suppresses autoimmunity by the production of regulatory cytokines
such as IL10 (Lau et al., 2008). It is possible that the reduced number of
CD4+ T cells and CD4+ T cells secreting IL17 observed in the CNS in
C57BL/6.Tlr2-/- mice is associated with the activity of regulatory Tregs or
CD62L-expressing Tregs. To examine whether Tregs or CD62L-expressing
subset of splenic Tregs is associated with the suppression of activation and
expansion of autoreactive T cells in the absence of TLR2, splenic Tregs
were analyzed by flow cytometry after the induction of passive EAE in
C57BL/6 and C57BL/6.Tlr2-/- (Figure 4.9).
The total numbers of Tregs were similar between C57BL/6 and
C57BL/6.Tlr2-/- in male and female mice. However, C57BL/6.Tlr2-/- male
had more total numbers of Tregs expressing CD62L+ in spleens (mean
SEM = 22.69 1.79, p 0.5) than C57BL/6 male mice (mean SEM =
15.61 1.61) (Figure 4.10). C57BL/6.Tlr2-/- female mice also had more
total numbers of Tregs expressing CD62L+ in spleens (mean SEM = 28.7
2.0, p 0.01) than C57BL/6 (20 0.8) female mice. No differences were
found between C57BL/6.Tlr9-/- and C57BL/6 female mice (Figure 4.10).

CHAPTER 4
123
In an attempt to identify a molecular mechanism for the increase numbers of
central (CD62L+) Tregs in C57BL/6.Tlr2-/- passive EAE recipients, plasma
from mice with passive EAE was analyzed for levels of IL1, IL2, IL4, IL5,
IL6, IL10, IL17, INF, TNF, and GM-CSF at 10 and 34 days after adoptive
transfer. Almost all cytokines were undetected in plasma except IL6, which
was detected in 4 of 6 C57BL/6 recipient mice after 10 days of passive EAE
(Figure 4.11); and 3 of 5 C57BL/6 recipient mice after 34 days of induction
of passive EAE (Figure 4.12). In contrast, levels of IL6 were undetectable in
the plasma in the absence of TLR2 (Figure 11 and 12) indicating that TLR2
is associated to central (CD62L-expressing) Tregs and IL6 in autoimmune
inflammation.
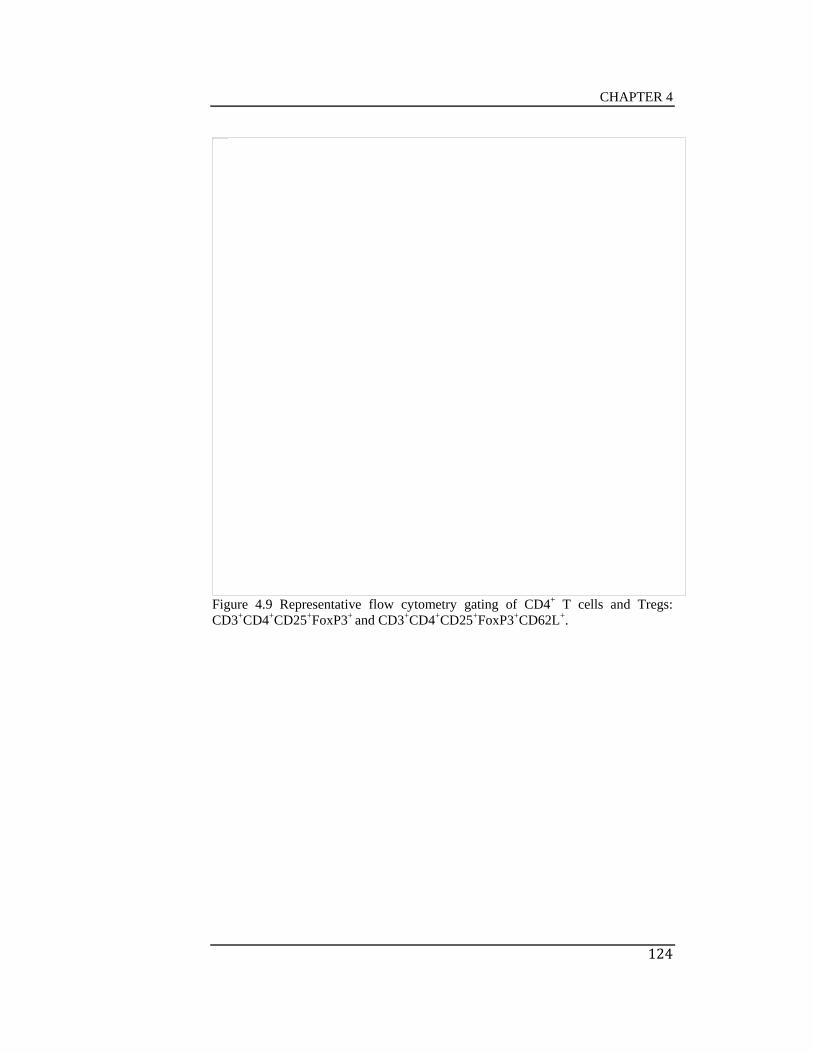
CHAPTER 4
124
Figure 4.9 Representative flow cytometry gating of CD4+ T cells and Tregs: CD3+CD4+CD25+FoxP3+ and CD3+CD4+CD25+FoxP3+CD62L+.
This image cannot currently be display ed.

CHAPTER 4
125
Figure 4.10 Total numbers of CD4+ T cells and Tregs from spleen of male and female C57BL/6.Tlr2-/-, C57BL/6.Tlr9-/- and C57BL/6 WT control mice. At least four mice per group were analyzed and the mean value of each group is indicated as a bar. Statistical differences between the C57BL/6 control group and C57BL/6.Tlr2-/- or C57BL/6.Tlr9-/- mice are indicated (*p < 0.05, **p < 0.01, ***p < 0.001 uncorrected Mann-Whitney U test; n = 1-6).
This image cannot currently be display ed.

CHAPTER 4
126
Figure 4.11 IL6 levels in plasma after 10 days of passive EAE induction. C57BL/6 (closed cicles) and C57BL/6.Tlr2-/- (close squares) (*p < 0.05, **p < 0.01, ***p < 0.001 uncorrected Mann-Whitney U test; n = 6).
This image cannot currently be display ed.

CHAPTER 4
127
Figure 4.12 IL6 levels in plasma after 34 days of passive EAE induction. C57BL/6 (closed cicles) and C57BL/6.Tlr2-/- (close squares) (*p < 0.05, **p < 0.01, ***p < 0.001 uncorrected Mann-Whitney U test; n = 6).
This image cannot currently be display ed.

CHAPTER 4
128
4.2.7 Microflora in passive EAE
The passive form of EAE was dependent on TLR2 and partially dependent
on TLR9. However, a question remained, what triggers TLR2 and TLR9
signalling. The activation of TLR2 and TLR9 signalling could occur via
endogenous and/or exogenous ligands. An explanatory mechanism by
which TLR2 and TLR9 could be activated is microflora. To determine
whether microflora could be responsible for TLR dependent passive EAE,
microflora from female mice were altered by the used of amoxocilin,
clarithromycin, metronidazole and omeprazole and the clinical course of
disease was analyzed in the absence of TLR2 and TLR9.
Mice were separated in two main groups and six subgroups. The first main
group was fed with normal diet and the second main group was fed with diet
treated with amoxocilin, clarithromycin, metronidazole and omeprazole for
five weeks. Subgroups of mice with normal diet included: C57BL/6 (control
group), C57BL/6.Tlr2-/- and C57BL/6.Tlr9-/-. Subgroups of mice fed with
treated diet with antibiotics included: C57BL/6 (control group),
C57BL/6.Tlr2-/- and C57BL/6.Tlr9-/-.
C57BL/6.Tlr9-/- mice fed with normal diet or medicated diet had less severe
clinical course of passive EAE compared with C57BL/6 mice (p 0.05).
C57BL/6.Tlr2-/- mice fed with normal diet and treated diet did not show

CHAPTER 4
129
clinical signs of disease (Figure 4.11). Clinical signs of disease were
delayed in C57BL/6 mice with normal diet (onset of disease SEM = 23.83
0.47) compared to C57BL/6 with treated diet (onset of disease SEM
18.8 1.41, p 0.01) (Figure 4.11). No significant differences were seen in
the maximum clinical score and CDI between mice with normal diet and
medicated diet (Figure 4.11). Data confirmed previous results showing that
passive EAE is dependent of TLR2 and partially depend on TLR9.
Manipulation of microflora with amoxocilin, clarithromycin, metronidazole
and omeprazole delayed the clinical signs of passive EAE in C57BL/6 mice
but not in mice deficient in TLR2 and TLR9, suggesting that while the
antibiotics had an effect microflora might modulate CNS autoimmune
inflammation via TLRs.

CHAPTER 4
130
Figure 4.13 Analysis of the clinical course of passive MOG35-55/CFA + PTX -induced EAE in female C57BL/6 (closed circles), C57BL/6.Tlr2-/-, (closed downward triangles) and C57BL/6.Tlr9-/- (closed diamonds) mice fed with normal diet and; female C57BL/6 (open circles), C57BL/6.Tlr2-/-, (open squares) and C57BL/6.Tlr9-/- (open diamonds) mice fed with medicated diet. Significant differences are indicated (*p < 0.05, **p < 0.01, ***p < 0.001 uncorrected Mann-Whitney U test; n = 4-6).
CHAPTER 4
131
4.3 Discussion
Encephalomyelitis can be experimentally induced in laboratory animals in
the absence of adjuvant and the severity and incidence of EAE increases by
its addition (review in Baxter 2007). The most common adjuvants in EAE
are CFA, which contains Mycobacteria tuberculosis, and PTX. The
adjuvant activity of Mycobacteria tuberculosis is mediated by NOD2
recognition of muramide peptide, and cell lines transfected with human
TLR2 or TLR4 were responsive to M. tuberculosis (Ferwerda et al., 2005).
Kerfoot et al., (2004) proposed that the action of PTX in active EAE is
mediated by TLR4.
To date, there is no evidence of an adjuvant immunisation event in the
initiation of MS. On the other side, the dependence of EAE on induction by
CFA containing M. tuberculosis and PTX raise concern that TLR-
dependencies identified in the active model of EAE represent limitations of
this model, and not characteristics of MS. However, the use of CFA in
active EAE can be avoided by using the passive form of EAE. Adoptive cell
transfer from donors to recipients induces passive EAE. The passive model
of EAE requires of a number of refinements to enhance the disease. The
refinements include: mild (3Gy) gamma irradiation and pretreatment with
PTX of the recipient.

CHAPTER 4
132
In Chapter 3, it was found that TLR4 do not play a role in active EAE. In
this Chapter, we showed that the C57BL/6.Tlr4-/- mice ameliorated the
clinical signs of passive EAE but inhibition of disease was not as great as in
the mice that did not receive PTX, indicating that PTX do not signal via
TLR4. Apetoth (2007) proposed that irradiation trigger the release of
intrinsic TLR ligands. However, wefound that the absence of irradiation in
C57BL6 mice did not affect the course of passive EAE. Thus, neither the
absence of CFA nor the use of PTX and irradiation alter the development of
passive EAE in the absence of TLR4 suggesting that TLR4 have activities
mediated by other mechanisms, including microflora in this model.
Studies from Reynold et al., (2007), Lee et al., (2012) and Fang et al.,
(2009) indicate that T cells require of TLR4 signalling to promote or
regulate EAE. In our studies the absence of TLR4 did not alter the course of
EAE in active EAE (Chapter 3), opposing this results the absence of TLR4
decreased the severity of passive EAE. As active EAE has both priming and
effector phases and passive EAE has only the effector phase, our results
suggest that TLR4 signalling is potentially important in both phases of EAE.
In the presence of TLR4 priming T cells increase but in the absence of
TLR4 primed T cells from WT mice are unable to augment the number of T
cells.
CHAPTER 4
133
In Chapter 3 it was also found that the severity of active EAE is partially
dependent on TLR2 and TLR9. This chapter examined EAE in the absence
of CFA in mice deficient in TLR2 and TLR9. Results revealed that mice
deficient in TLR9 are partially protected of passive EAE, while mice
deficient in TLR2 are completely protected from passive EAE. Protection
was associated with the lack of circulating levels of IL6, an increased
numbers of central (CD62L+) regulatory T cells, a reduced recruitment of
activated CD4 T cells in CNS and a reduced numbers of CD4 T cells
producing IL17 in CNS. Previously, Prinz et al., (2006) reported a partial
dependency on TLR9 expression on the adoptive transfer recipients. Our
findings of complete dependence of TLR2 expression in recipients of WT
cells is novel but consistent with Reynolds et al., (2010), who reported that
bone morrow chimeras reconstituted with TLR2-deficient marrow
expressed ameliorated disease after induction of active EAE.
In our model the presence of TLR2 during priming appears to confer a
dependency on TLR2 during the effector phase of EAE. Cells from WT
mice priming in vitro must lead to increasing expression of TLR2, produce
regulatory and pathogenic cytokines and stimulate the cell that produce
those cytokines. Transference of those cells into mice in the absence of
TLR2 might increase levels of cytokines but without augmenting the
numbers of cells that produce the pathogenic cytokines and increasing the
cells that produce regulatory cytokines.
CHAPTER 4
134
In addition, the dependence of passive induction of EAE on TLR2
expression in the recipient indicates the presence of tonic signalling through
the receptor. This could occur via endogenous or exogenous ligands.
Although many putative endogenous ligands for TLR2 have been proposed,
none of them meet the reasonable criteria of purity and validation required
to demonstrate their ability to directly bind and signal through TLR2
(Erridge et al., 2010). In contrast, microbial products from intestinal
microflora have been detected in blood of healthy humans (Erridge et al.,
2007) and mice (Clarke et al., 2010). Although alteration of microflora with
antibiotics in the absence of TLR2 did not affect the development of passive
EAE, the disease was delayed in WT mice without any treatment,
suggesting that TLR2 is required to protect mice of CNS autoimmune
inflammation; however, further studies are required to clarify the activation
of TLR2 by microflora. Moreover, considering that gender influence the
immune response to infections (McClelland EE, et al., 2011; Roberts BJ, et
al., 2013), it might be possible that specific immune responses from
microflora or pathogen exposure in male and female mice contribute to the
phenotype of EAE.

CHAPTER 5

CHAPTER 5
135
CHAPTER 5
THE ROLE OF TLR2 IN ACTIVE MOG35-
55/CFA + PTX-INDUCED RELAPSING-
REMITTING EAE
5.1 Introduction
Studies in Chapter 3 of this work reported a partial role of TLR2 and TLR9
in active MOG35-55/CFA + PTX–induced EAE, and studies in Chapter 4 of
this work reported a partial role of TLR9 and a definitive role of TLR2 in
passive MOG35-55/CFA + PTX–induced EAE; indicating that TLR2 plays a
key role in EAE. Additional evidence that support the role of TLR2 in EAE
and MS include: 1) the presence of TLR2 ligands in the CNS in MS and
EAE (Schrijver et al., 2001; Andersson et al., 2008; Farez et al., 2009); 2)
the dependence of TLR2 in the exacerbation of MS and EAE during
bacterial infections (de la Monte et al., 1986; Herrmann et al., 2006; Nichols
et al., 2009; Nichols et al., 2011); 3) the association of TLR2 with the
decrease of severity of MS in helminth-infected MS patients (Correale et al.,
2009); 4) the successful use of TLR2 ligands as adjuvant in the induction of
EAE (Visser et al., 2005); 5) the inhibition of remyelination via TLR2

CHAPTER 5
136
(Visser et al., 2005; Sloane et al., 2010; Back et al., 2005); and 6) the
modulation of MS by TLR2 ligands (Sweeney et al., 2011).
Because CNS autoimmune inflammation was associated to TLR2 and TLR9
in C57BL/6 mice, in this chapter we further analysed the development of
EAE in NOD mice, the mouse model of type 1 diabetes (T1D), in order to
dissect the interrelationship between organ-specific autoimmune diseases.
5.2 Results
5.2.1 Active MOG35-55/CFA + PTX–induced
relapsing-remitting EAE in NOD/Lt deficient mice in
TLR1, TLR2, TLR4, TLR6 and TLR9
NOD/Lt mice are commonly used as a model of TID because they develop
spontaneous insulitis associated with the disease (Makino et al., 1980;
Kachapati et al., 2012). In addition, NOD/Lt mice develop a form of
relapsing-remitting EAE (Amor et al., 1993; Slavin et al., 1998). Relapsing-
remitting EAE is characterised by partial or complete recovery from the
onset of clinical signs of disease, and then relapses and remissions (Slavin et
al., 1998). To determine the role of TLRs in active MOG35-55/CFA + PTX–
CHAPTER 5
137
induced relapsing-remitting EAE, the disease was induced in NOD/Lt (WT
control group), NOD.Tlr1-/-, NOD.Tlr2-/-, NOD.Tlr4-/-, NOD.Tlr6-/- and
NOD.Tlr9-/- male and female mice.
Mice were observed and scored each individual day for clinical signs of
active MOG35-55/CFA + PTX–induced relapsing-remitting EAE over 71
days post EAE induction. As previously reported by Slavin et al., (1998),
NOD/Lt mice developed relapsing-remitting EAE (Figure 5.1). The day of
onset of clinical signs of active MOG35-55/CFA + PTX–induced relapsing-
remitting EAE appeared within 13-31 days in male NOD/Lt mice, and 10-
31 days in female NOD/Lt mice after the induction of EAE. The onset of
clinical signs of disease was followed by relapses and remissions (Figure
5.1, Figure 5.2 and Figure 5.3).
The clinical course of active MOG35-55/CFA + PTX–induced relapsing-
remitting EAE, the day of onset of clinical signs of disease, the maximum
score of clinical signs and the CDI were similar between NOD/Lt and
NOD.Tlr1-/- mice in either sex (n = 8-9 mice) (Figure 5.2 and Figure 5.3).
The clinical course of active MOG35-55/CFA + PTX–induced relapsing-
remitting EAE decreased in the absence of TLR2 only one day in male mice
(day 28) and two days in female mice (days 16 and 17) compared with
CHAPTER 5
138
NOD/Lt mice (n = 8 male mice, p 0.05 and n = 8 female mice, p 0.05)
(Figure 5.2 and Figure 5.3). No differences were observed in the onset of
clinical signs of disease between NOD.Tlr2-/- male mice and NOD/Lt male
mice. The day of onset of clinical signs of EAE was delayed in the absence
of TLR2 in female mice (mean day of onset SEM = 25.5 2.58, p 0.01)
compared with NOD/Lt female mice (mean day of onset SEM = 14.87
0.71), but no differences were observed in male mice. Neither male nor
female mice showed significant differences in the maximum score of
disease and CDI in the absence of TLR2 when compared with NOD/Lt mice
(Figure 5.2 and Figure 5.3).
The clinical course of active MOG35-55/CFA + PTX–induced relapsing-
remitting EAE decreased in the absence of TLR4 two days in female mice
(day 27 and 28) compared with NOD/Lt female mice (n = 8 mice, p 0.05);
but no differences were seen in male mice (Figure 5.2 and Figure 5.3). No
significant differences on the day of onset of clinical signs of disease, the
maximum score of EAE and CDI were observed between NOD/Lt and
NOD.Tlr4-/- female and male mice (Figure 5.2 and Figure 5.3).
The clinical course of active MOG35-55/CFA + PTX–induced relapsing-
remitting EAE decreased in the absence of TLR6 three days (day 35-37) in
male mice compared with NOD/Lt male mice (n = 8 mice, p 0.05); but no

CHAPTER 5
139
differences were observed in female mice (Figure 5.2 and Figure 5.3). No
significant differences on the day of onset of clinical signs of disease, the
maximum score of disease and CDI where observed between NOD/Lt and
NOD.Tlr6-/- mice in male and female (Figure 5.2 and Figure 5.3).
The clinical course of active MOG35-55/CFA + PTX–induced relapsing-
remitting EAE decreased in the absence of TLR9 five days in male mice
(days 30, 47, 66, 69 and 70) and five days in female mice (days 16, 17 and
50-52) compared with NOD/Lt mice (n = 8 mice, p 0.05) (Figure 5.2 and
Figure 5.3). The day of onset of clinical signs was delayed in the absence of
TLR9 in female mice (mean day of onset SEM = 26.00 2.43, p 0.05)
compared with NOD/Lt female mice (mean day of onset SEM 14.87
0.71); but no differences were observed in male mice. No significant
differences were seen in the maximum score of disease and CDI between
NOD/Lt and NOD.Tlr9-/- female and male mice (Figure 5.2 and Figure 5.3).
These results showed that TLR2 and TLR9 play a role in the onset of
MOG35-55/CFA+PTX–induced relapsing-remitting EAE in NOD mice.

CHAPTER 5
140
Figure 5.1. Representative clinical course of active MOG35-55/CFA + PTX–induced relapsing-remitting EAE in individual NOD/Lt control WT (closed circles) and NOD.Tlr1-/-, NOD.Tlr2-/-, NOD.Tlr4-/-, NOD.Tlr6-/- and NOD.Tlr9-/- (open circles) male and female mice. Clinical signs of EAE were monitored each day over 71 days (n = 1).
This image cannot currently be display ed.
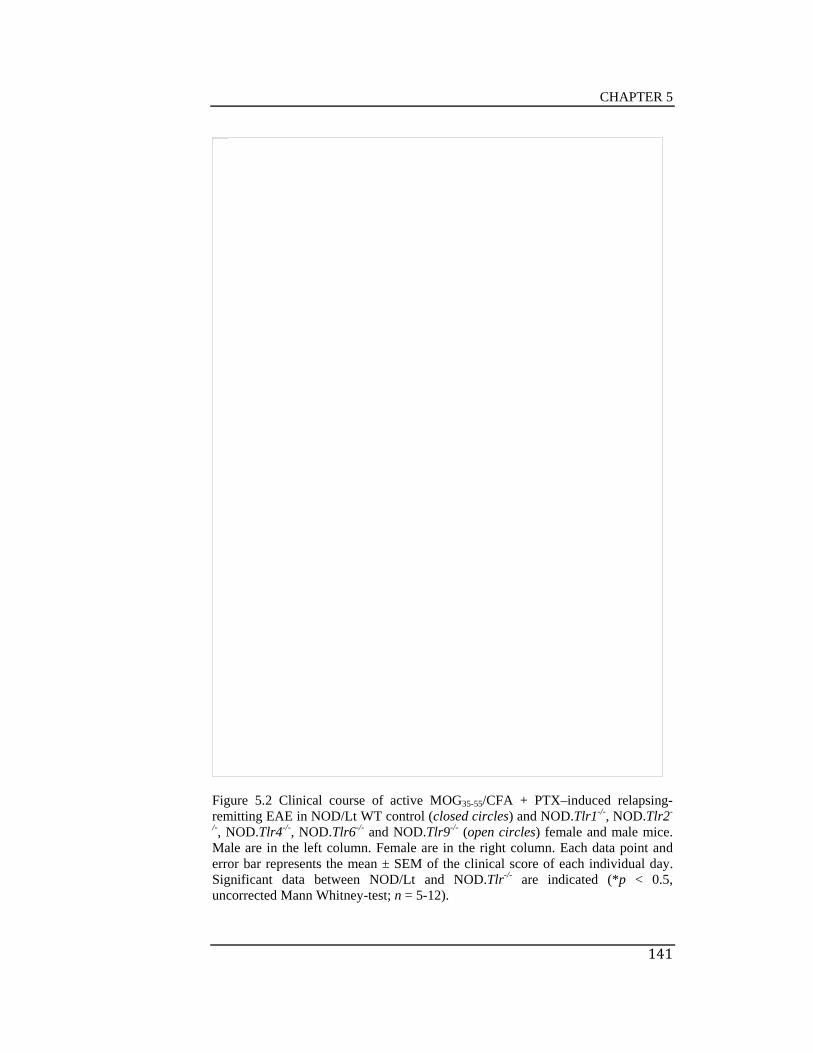
CHAPTER 5
141
Figure 5.2 Clinical course of active MOG35-55/CFA + PTX–induced relapsing-remitting EAE in NOD/Lt WT control (closed circles) and NOD.Tlr1-/-, NOD.Tlr2-
/-, NOD.Tlr4-/-, NOD.Tlr6-/- and NOD.Tlr9-/- (open circles) female and male mice. Male are in the left column. Female are in the right column. Each data point and error bar represents the mean ± SEM of the clinical score of each individual day. Significant data between NOD/Lt and NOD.Tlr-/- are indicated (*p < 0.5, uncorrected Mann Whitney-test; n = 5-12).
This image cannot currently be display ed.

CHAPTER 5
142
Figure 5.3. Analysis of the clinical course of active MOG35-55/CFA + PTX- induced relapsing-remitting EAE in NOD/Lt (closed cicles), NOD.Tlr1-/- (open squares), NOD.Tlr2-/- (open cicles), NOD.Tlr4-/- (open downward triangles), NOD.Tlr6-/-
(open upward triangles) and NOD.Tlr9-/- (open diamonds) male and female mice. Statistically significant differences between NOD/Lt and NOD.Tlr-/- mice are indicated (*p < 0.05, **p < 0.01, uncorrected Mann-Whitney U test; n = 8 or 9).

CHAPTER 5
143
5.2.2 Active MOG35-55/CFA + PTX–induced
relapsing-remitting EAE in NOD.H2b and NOD.H2d
mice
As the NOD mouse strain showed little influence of TLR2 on the onset of
relapsing-remitting EAE but not in the severity of disease, we thought that
might be due to ongoing autoimmune inflammation provided by
inflammatory milieu, for example IL6 that we previously identified in an
earlier chapter; otherwise being provided by the TLR2 signalling. To test
the hypothesis that insulitis associated with T1D development in some way
compensated for the lack of TLR2 signalling in NOD mice, we looked for a
NOD mouse background but without the insulitis associated with T1D. We
knew that NOD.H2b and NOD.H2d congenic mice were relatively free of
T1D as declared by Pearson et al., (2003), Yoshida et al., (2008) and Jordan
(2009) and showed in Figure 5.4. Thus, NOD.H2b and NOD.H2d female
micewereimmunizedwithMOG35-55/CFA + PTX.
NOD.H2d female mice developed a relapsing-remitting form of EAE
(Figure 5.5 and Figure 5.6). Clinical signs of EAE appeared earlier in
NOD.H2d female mice (mean day of onset SEM = 12.14 0.50, p
0.001) than in NOD/Lt female mice (mean day of onset SEM = 15 0.0)
(Figure 5.6). However, no differences were observed in the maximum score

CHAPTER 5
144
of clinical signs of EAE and CDI between NOD.H2d and NOD/Lt female
mice (Figure 5.6).
NOD.H2b female mice also developed a form of relapsing-remitting EAE
(Figure 5.5 and Figure 5.6). Clinical signs of EAE appeared earlier in
NOD.H2b female mice (mean day of onset SEM = 13.12 0.63, p 0.01)
than in NOD/Lt female mice (mean day of onset SEM = 15 0.0) (Figure
5.6). Although no differences were seen in the maximum score of EAE, the
cumulative disease index was clearly higher in NOD.H2b female mice
compared with NOD/Lt female mice (CDI mean SEM = 57.93 1.89 and
CDI mean SEM = 38.42 2.12 respectively; p 0.001) (Figure 5.6).

CHAPTER 5
145
Figure 5.4. Cumulative diabetes incidence in NOD/Lt (closed cicles), NOD.H2b (open cicles) and NOD.H2d (open cicles) female mice. Mice were bled fortnightly for 36 weeks of age and random blood glucose levels determined. Significant data are indicated (*p < 0.05, **p < 0.01, ***p < 0.001 uncorrected Mann-Whitney U test; n = 14-38).

CHAPTER 5
146
Figure 5.5. Representative clinical course of active MOG35-55/CFA + PTX- induced relapsing-remitting EAE in individual female NOD/Lt (closed circles), NOD.H2b (open circles) and NOD.H2d (open forwards triangles) mice. Clinical signs of EAE were score each day over 40 days (n = 1).

CHAPTER 5
147
Figure 5.6. Analysis of the clinical course of active MOG35-55/CFA + PTX- induced relapsing-remitting EAE in NOD/Lt (closed circles), NOD.H2b (open circles) and NOD.H2d (open forwards triangles) female mice. NOD.H2b mice showed a more severe form of relapsing-remitting EAE compared to NOD/Lt mice (WT). The appearance of clinical signs of disease was delayed in both NOD.H2b and NOD.H2d compared to WT. No differences were seen in maximum clinical score (*p < 0.05, **p < 0.01, ***p < 0.001 uncorrected Mann-Whitney U test; n = 7-8).

CHAPTER 5
148
5.2.3 Active MOG35-55/CFA + PTX–induced
relapsing-remitting EAE in NOD.H2b.Tlr2-/-
Because NOD.H2b mice developed significantly more severe form of
relapsing-remitting EAE than NOD.H2d, the phenotype of the disease was
analyzed in NOD.H2b, NOD.H2b.Tlr2-/-, NOD/Lt and NOD.Tlr2-/-. The
clinical course of active MOG35-55/CFA + PTX–induced relapsing-remitting
EAE decreased in NOD.H2b.Tlr2-/- male mice over 19 days (day 11-13, 22-
26, 28-30 and 33-40) compared with NOD.H2b male mice (Figure 5.7). The
day of onset of disease was delayed in NOD.H2b.Tlr2-/- male mice (mean of
day of onset SEM = 14.3 0.26, p 0.001) compared with NOD.H2b
male mice (mean of day of onset SEM = 11.33 0.21). No differences
were observed in the maximum score between NOD.H2b and
NOD.H2b.Tlr2-/- male mice. CDI decreased in NOD.H2b.Tlr2-/- male mice
(mean of the CDI SEM = 31.25 3.39, p 0.001) compared with
NOD.H2b male mice (mean of the CDI SEM = 59.66 4.56) (Figure 5.8).
The clinical course of active MOG35-55/CFA + PTX–induced relapsing-
remitting EAE decreased in NOD.H2b.Tlr2-/- female mice over eight days
(day 11-12, 22, 27-30 and 33) compared with NOD/Lt female mice (Figure
5.7). The day of onset of disease was delayed in NOD.H2b.Tlr2-/- female
mice (mean of day of onset SEM = 14.2 0.24, p 0.05) compared with

CHAPTER 5
149
NOD.H2b male mice (mean of day of onset SEM = 11.11 0.11). No
differences were observed in the maximum score between NOD.H2b and
NOD.H2b.Tlr2-/- female mice. CDI decreased in NOD.H2b.Tlr2-/- female
mice (mean of the CDI SEM = 39.65 3.70, p 0.01) compared with
NOD.H2b female mice (mean of the CDI SEM = 51.66 1.35) (Figure
5.8).
The clinical course of active MOG35-55/CFA + PTX–induced relapsing-
remitting EAE decreased in NOD.Tlr2-/- male mice over 4 days (day 18, 21,
23 and 38) compared to NOD/Lt male mice (Figure 5.7). As seen before, no
differences were observed on the day of onset of disease, the maximum
score of disease and CDI between NOD/Lt male mice and NOD.Tlr2-/- male
mice (Figure 5.8).
The clinical course of active MOG35-55/CFA + PTX–induced relapsing-
remitting EAE decreased only two days in NOD.Tlr2-/- female mice (day 37
and 39) compared with NOD/Lt female mice (Figure 5.7). Results
confirmed a delayed on the day of onset of clinical signs of EAE in
NOD.Tlr2-/- female mice (mean of day of onset SEM = 13.0 0.0, p
0.05) compared with NOD/Lt female mice (mean of day of onset SEM =
12.2 5.45). No differences were observed in the maximum score of
disease and CDI between NOD.Tlr2-/- and NOD/Lt female mice (Figure

CHAPTER 5
150
5.8).
A further analysis of the clinical signs of active MOG35-55/CFA + PTX–
induced relapsing-remitting EAE showed that NOD.H2b male mice
developed more severe relapsing-remitting EAE than NOD/Lt male mice
(Figure 5.7). The mean SEM of maximum clinical score of EAE was 2.91
0.20 (p 0.05) in NOD.H2b male mice and 1.83 0.21 in NOD/Lt male
mice. The mean SEM of CDI was 59.66 4.56 (p 0.001) in NOD.H2b
male mice and 19.66 3.15 in NOD/Lt male mice. No differences were
observed in the day of onset of disease between NOD.H2b male mice and
NOD/Lt male mice (Figure 5.8).
Female NOD.H2b mice also developed more severe CDI than NOD/Lt male
mice. The mean SEM of CDI was 51.66 1.35 (p 0.001) in NOD.H2b
female mice and 28.8 12.87 in NOD/Lt female mice. Moreover, the day of
onset of clinical signs of EAE were delayed in NOD.H2b female mice. The
mean SEM of the day of onset of disease was 11.11 0.11 in NOD.H2b
female mice and 12.2 5.45 in NOD/Lt female mice. No differences were
observed in the maximum score of EAE between NOD.H2b female mice
and NOD/Lt female mice (Figure 5.8).

CHAPTER 5
151
NOD.H2b.Tlr2-/- male mice developed a later onset of active MOG35-55/CFA
+ PTX–induced relapsing-remitting EAE and more severe disease than
NOD.Tlr2-/- male mice (Figure 5.7). The day of onset of clinical signs of
EAE SEM in NOD.H2b.Tlr2-/- male mice was 14.3 0.26(p 0.01) and
13.66 0.71 in NOD.Tlr2-/- male mice. The maximum clinical score was
2.6 0.1 (p 0.05) in NOD.H2b.Tlr2-/- male mice and 1.5 0.0 in
NOD.Tlr2-/- male mice. CDI was 31.25 3.39 in NOD.H2b.Tlr2-/- male
mice and 17 3.66 in NOD.Tlr2-/- male mice (Figure 5.8).
NOD.H2b.Tlr2-/- female mice also developed a later onset of active MOG35-
55/CFA + PTX–induced relapsing-remitting EAE and more severe disease
than NOD.Tlr2-/- female mice (Figure 5.7). The day of onset of clinical
signs of EAE SEM in NOD.H2b.Tlr2-/- female mice was 14.2 0.24(p
0.05) and 13.0 0.0 in NOD.Tlr2-/- female mice. The maximum clinical
score SEM was 2.8 0.16(p 0.01) in NOD.H2b.Tlr2-/- female mice and
1.7 0.2 in NOD.Tlr2-/- female mice. CDI SEM was 39.65 7.70 ((p
0.01) in NOD.H2b.Tlr2-/- female mice and 18.0 4.08 in NOD.Tlr2-/- female
mice (Figure 5.8).
All together, NOD.H2b mice, a resistant mouse strain to T1D, developed
more severe active MOG35-55/CFA + PTX–induced relapsing-remitting EAE
and earlier onset of clinical signs of disease compared with NOD/Lt mice in

CHAPTER 5
152
either sex. The severity of active MOG35-55/CFA + PTX–induced relapsing-
remitting EAE was lower in both male and females NOD.H2b.Tlr2-/- mice
compared with male and female NOD.H2b mice. Although relapses of EAE
were observed in female and male NOD.H2b mice, NOD.H2b.Tlr2-/- mice
did not show relapses of disease after the initial peak of active MOG35-
55/CFA + PTX–induced relapsing-remitting EAE in either sex. These results
suggest that both TLR2 signalling and immunological events associated
with autoimmunity at distant site can mediate relapses in CNS
autoimmunity.

CHAPTER 5
153
Figure 5.7 Clinical course of active MOG35-55/CFA + PTX–induced EAE in NOD.H2b control mice (WT) (closed circles), NOD.H2b.Tlr2-/- (open circles) and; NOD/Lt control mice (WT) (closed downward triangles) and NOD.Tlr2-/- (open upwards triangles). Each data point and error bar represents the mean ± SEM of the clinical score of each individual day from 6-10 mice. Statically significant data are indicated (*p < 0.05, uncorrected Mann Whitney-test; n = 6-10).

CHAPTER 5
154
Figure 5.8. Analysis of the clinical course of active MOG35-55/CFA + PTX- induced relapsing-remitting EAE in NOD.H2b (close circles) and NOD.H2b.Tlr2-/- (open circles); and NOD/Lt (closed downwards triangles) and NOD.H2b.Tlr2-/- (open upwards triangles) in males and female mice. Significant differences are indicated (*p < 0.05, **p < 0.01, ***p < 0.001 uncorrected Mann-Whitney U test; n = 6-10).

CHAPTER 5
155
5.2.4 IL6 in active MOG35-55/CFA + PTX–induced
relapsing-remitting EAE in the absence of TLR2
As previous studies showed that protection of chronic EAE in the absence
of TLR2 was associated with detectable levels of circulating IL6 (Chapter
4), it remains possible that the severity of EAE decreased in NOD.H2b.Tlr2-
/- was due to circulating levels of IL6. To determine whether circulating
levels of IL6 could influence the phenotype of active MOG35-55/CFA +
PTX–induced relapsing-remitting EAE in NOD.H2b.Tlr2-/- mice, the disease
was induced in NOD.H2b and NOD.H2b.Tlr2-/- mice and; IL6 or PBS
(control) was administrated i.p. in NOD.H2b.Tlr2-/- mice during the
induction of active MOG35-55/CFA + PTX–induced EAE.
NOD.H2b.Tlr2-/- male mice treated with PBS had less severe clinical course
of relapsing-remitting EAE during nine days (day 22, 28, 30-33 and 35-37,
p 0.05) and NOD.H2b.Tlr2-/- male mice treated with IL6 had less severe
clinical course of relapsing-remitting EAE during four days (day 31-34, p
0.05) compared with NOD.H2b male mice (Figure 5.9). CDI decreased in
NOD.H2b.Tlr2-/- male mice treated with PBS (CDI mean SEM = 36.25
3.91, p 0.05) compared with NOD.H2b male mice (CDI mean SEM =
61.0 11.61); but no differences were observed between NOD.H2b.Tlr2-/-
male mice treated with IL6 and NOD.H2b male mice (Figure 5.9). ). No

CHAPTER 5
156
differences were seen in the day of onset of disease and maximum clinical
score in NOD.H2b.Tlr2-/- male mice treated with IL6 or PBS compared with
NOD.H2b male mice (Figure 5.9).
NOD.H2b.Tlr2-/- female mice treated with PBS had less severe clinical
course of relapsing-remitting EAE during 12 days (26, 30-40, p 0.05), and
NOD.H2b.Tlr2-/- female mice treated with IL6 had less severe clinical
course of relapsing-remitting EAE during 19 days (21, and 23-40, p 0.05)
(Figure 5.9). CDI decreased in NOD.H2b.Tlr2-/- female mice treated with
PBS (CDI mean SEM = 38.42 4.52, p 0.05), and in NOD.H2b.Tlr2-/-
female mice treated with IL6 (CDI mean SEM = 30.93 6.62, p 0.01)
compared with NOD.H2b female mice (CDI mean SEM = 67.37 10.61).
No differences were seen in the day of onset of disease and maximum
clinical score in NOD.H2b.Tlr2-/- female mice treated with IL6 or PBS
compared with NOD.H2b female mice (Figure 5.9).
A further analysis of the clinical course of active MOG35-55/CFA + PTX–
induced relapsing-remitting EAE between NOD.H2b.Tlr2-/- mice treated
with IL6 and NOD.H2b.Tlr2-/- mice treated with PBS showed no differences
in the clinical course of active relapsing-remitting EAE, the day of onset of
disease, the maximum clinical score and the CDI in either sex (Figure 5.9).
These results suggest that circulating IL6 remained in plasma without

CHAPTER 5
157
altering the severity of active MOG35-55/CFA + PTX–induced relapsing-
remitting EAE.
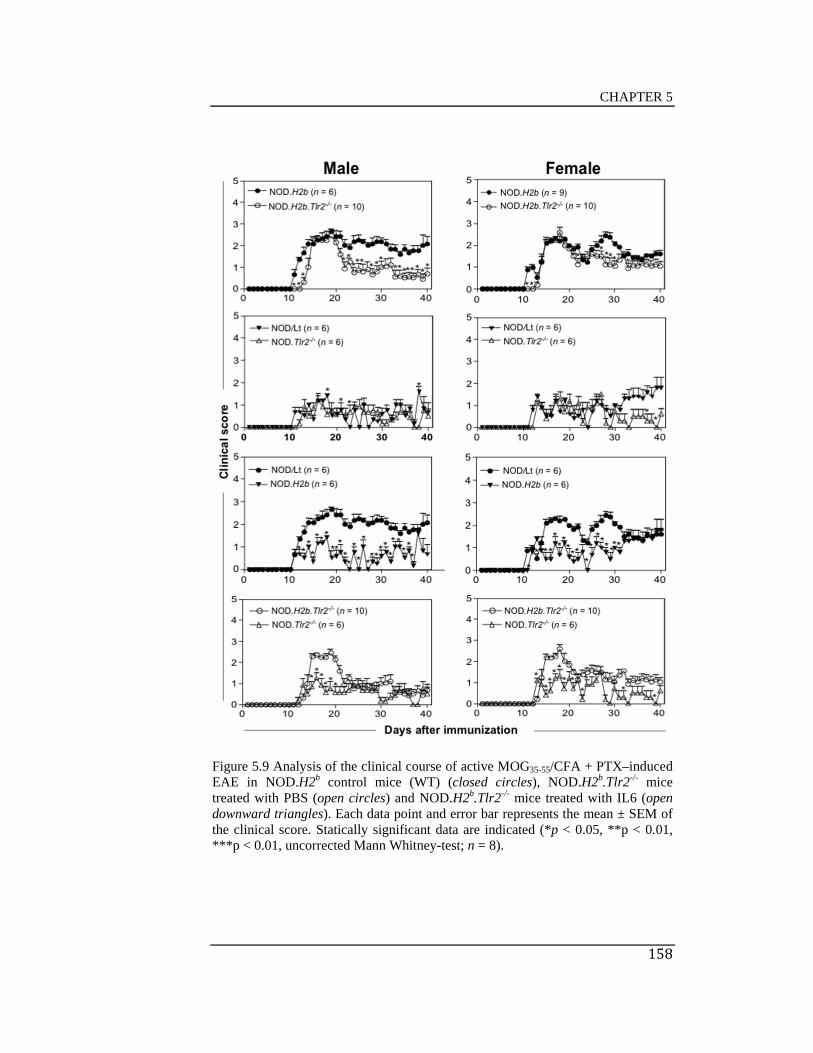
CHAPTER 5
158
Figure 5.9 Analysis of the clinical course of active MOG35-55/CFA + PTX–induced EAE in NOD.H2b control mice (WT) (closed circles), NOD.H2b.Tlr2-/- mice treated with PBS (open circles) and NOD.H2b.Tlr2-/- mice treated with IL6 (open downward triangles). Each data point and error bar represents the mean ± SEM of the clinical score. Statically significant data are indicated (*p < 0.05, **p < 0.01, ***p < 0.01, uncorrected Mann Whitney-test; n = 8).

CHAPTER 5
159
5.2.5 Circulating levels of cytokines in active MOG35-
55/CFA + PTX–induced relapsing-remitting EAE in
NOD.H2b.Tlr2-/- and NOD.Tlr2-/- mice
In an attempt to find whether circulating cytokines influenced the
development of MOG35-55/CFA + PTX–induced relapsing-remitting EAE in
NOD.H2b and NOD.H2b.Tlr2-/- mice, plasma from NOD.H2b and
NOD.H2b.Tlr2-/- mice was analysed after 40 days of EAE induction.
Circulating levels of IL6 were detected in NOD.H2b and NOD.H2b.Tlr2-/-
mice treated with either IL6 or PBS. Circulating levels of IL6 decreased in
NOD.H2b.Tlr2-/- mice treated with IL6 (mean SEM = 254.1 44.59) but
not in NOD.H2b.Tlr2-/- mice treated with PBS (mean SEM = 450.9
117.5) compared with NOD.H2b mice (mean SEM = 481.7 63.45).
Surprisingly, IL22 levels increased in both NOD.H2b.Tlr2-/- mice treated
with IL6 (mean SEM = 145.5 22.31) and in NOD.H2b.Tlr2-/- mice
treated with PBS (mean SEM = 271.2 61.12) compared with NOD.H2b
(mean SEM = 74.55 10.49). No detectable levels of IL13, IL1, IL22,
IL2, IL5, IL21, IL6, IL10, IL27, IL23, IFN, TNF, IL4 and IL17 were found
neither in NOD.H2b nor NOD.H2b.Tlr2-/- mice treated with either IL6 or

CHAPTER 5
160
PBS. Data suggest that IL6 do not accumulate in the periphery when
administrated i.p., and IL22 production is associated to TLR2 signalling.

CHAPTER 5
161
Figure 5.10 Circulating levels of IL6 and IL22 in NOD.H2b (close cicles), NOD.H2b.Tlr2-/- treated with PBS (open cicles), NOD.H2b.Tlr2-/- treated with IL6 (open downward triangles), naive NOD.H2b (closed squares), naive NOD.H2b.Tlr2-/- (open squares), naive NOD/Lt (open diamonds), naive NOD.Tlr2-/- (closed diamonds). Limits of detention levels of cytokines are indicated with a horizontal line. Significant differences are shown (*p < 0.05, **p < 0.01, ***p < 0.001 uncorrected Mann-Whitney U test; n = 6-10).

CHAPTER 5
162
5.3 Discussion
In Chapter 3 we found that C57BL/6.Tlr2-/- mice show less severe clinical
signs of EAE; and in Chapter 4 we found that adoptive transfer of EAE into
C57BL/6.Tlr2-/- mice failed to transfer disease. This protection from EAE
was associated with fewer infiltrating CD4+ T cells in the CNS, reduced
prevalence of detectable circulating IL6, and increased proportions of
central (CD62L+) Foxp3+ Tregs. In this chapter, we studied the dependence
of EAE on TLR2 in an autoimmune-prone genetic background. As NOD/Lt
mice develop a mild form of relapsing/remitting EAE (Amor et al., 1993;
Slavin et al., 1998), this strain of mice was used to study the role of TLRs in
EAE in order to dissect the interrelationships between organ-specific
autoimmune diseases.
In contrast to C56BL/6 mice, which developed a chronic form of EAE
(Chapter 3 and Chapter 4) NOD/Lt mice developed a mild form of
relapsing-remitting EAE. Furthermore, unlike to C57BL/6.Tlr2-/- mice,
NOD.Tlr2-/- mice did not affect the severity of EAE. As NOD/Lt mice are
susceptible to T1D (Kachapati et al., 2012), we tested whether insulitis
associated with T1D development compensated for the lack of TLR2
signalling in these mice. Because our results confirmed that NOD.H2b and
NOD.H2d mice did not develop insulitis or T1D as declared by Yoshida et
al., (2008) and Pearson et al., 2003, active MOG35-55/CFA + PTX was
studied in these mice.

CHAPTER 5
163
NOD.H2b mice showed increased severity of EAE compared to NOD/Lt
mice, again in a relapsing/remitting pattern. To my knowledge this work
show for first time that in the absence of insulitis, EAE is ameliorated in
NOD.H2b.Tlr2-/- mice and no relapses occurred after the initial peak of
disease. These data suggest that both TLR2 signalling and immunological
events associated with autoimmunity at a distant site can mediate relapses in
CNS autoimmunity. As seen before circulating levels of IL6 did not affect
the severity of active MOG35-55/CFA + PTX –induced EAE after the
induction of EAE in the absence of TLR2 confirming that circulating levels
of IL6 increase before clinical signs of EAE appear. Although increased
numbers of IL22 were found in the absence of TLR2, Kreymborg et al.,
(2007) reported that IL22 knockout mice are not protected from EAE.
Further studies are required to find the mechanisms that influence the
severity of EAE in NOD.H2b and NOD.H2b.Tlr2-/- mice.

CHAPTER 6

CHAPTER 6
164
CHAPTER 6
NKT CELLS IN THE INTERACTION
BETWEEN ENVIRONMENTAL AND
GENETIC RISK FACTORS FOR EAE
6.1 Introduction
NKT cells are innate/memory T lymphocytes that recognize lipids and
glycolipids presented by CD1d molecules (Godfrey et al., 2000; MacDonald
2002). NKT cells expressed the semi-invariant V24+J18 in humans and
V14+J18 in mice (Budd et al., 1987; Fowlkes et al., 1987; review in
MacDonald 2007). Activation of NKT cells releases the production of
INF/IL4/IL17 cytokines (Godfrey et al., 2004; Coquet et al., 2008). The
initiation and development of MS and EAE are also associated with the
production of INF/IL4/IL17 cytokines (Lees et al., 2008; Stromnes IM,
2008). Despite knowing that different NKT cell subsets produced key
cytokines involved in the phenotype of MS and EAE, the role of NKT cells
in CNS-autoimmune inflammation remains far from clear.
The evidence that NKT cells contribute to EAE includes at least four
mechanisms: 1) cytokine production by NKT cells ligation of lipids and

CHAPTER 6
165
glycolipids (Hammond et al., 2002); 2) NKT cell cytokine production in
response to specific NKT cell peptides (Liu et al., 2011; Fujita et al., 2009);
3) the activity of CD1d molecule in EAE (Jahng et al., 2001) and; 4) the
NKT cell number in EAE (Miljković et al., 2011; Yokote et al., 2008).
Moststudiesindicatethatincrement of IL4 and IL10 and decrease of INF
and IL17 by NKT cell ligation of -GalCer, OCH and RCAI147/-160
protect mice from EAE (Miyamoto et al., 2001; Furlan et al., 2003; Oh et
al., 2011; Shiozaki, et al., 2013). However, contradictory reports showed
that -GalCer treatment in EAE had no effect or is dependent of the time of
EAE immunisation and route of administration (Furlan et al., 2003; Pál et
al., 2001; Hammond et al., 2002). Other studies indicate that the expression
of CD1d molecule is required for EAE protection (Singh et al., 2001; Mars
et al., 2008). Few studies showed that NKT cell-enriched mice are protected
against EAE (Mars et al., 2002; Mars et al., 2008).
At the time of writing most studies have been done by stimulation of NKT
cells to produce INF/IL4/IL17 cytokines. Little research has been done in
mice with different numbers of NKT cells. In this chapter, it was
hypothesized that genetic control of NKT cells numbers alters the severity
of EAE. To test this hypothesis, EAE was induced in genetically
manipulated mice with different genes controlling NKT cell numbers.

CHAPTER 6
166
6.2 Results
6.2.1 Active MOG35-55/CFA + PTX-induced EAE in
NOD/Lt mice and NOD.Nkrp1b mice
NOD/Lt mice are the most common animal models to study Type 1 diabetes
(T1D) (Makino et al., 1980). NOD/Lt mice are also animal models to study
systemic lupus erythematosus, Sojogren’ syndrome and MS (Krause et al.,
1999; Slavin et al., 1998; Robinson et al., 1997; Baker et al., 1995). NOD/Lt
mice do not express the allelic marker NK1.1 while NOD.Nkrp1b mice
express the allelic marker NK1.1 because NOD.Nkrp1b mice carry the B6-
derived allele Klrb1c, a natural killer complex on chromosome 6 (from
D6mit105 to D6mit135) (Poulton et al., 2001).
Both NOD/Lt and NOD.Nkrp1b mice are characterised for having fewer
NKT cell numbers than C57BL/6 mice (Jordan et al., 2009; Poulton et al.,
2001). The difference of NKT cell numbers is associated with the resistance
of C57BL/6 mice to T1D and the spontaneous development of T1D in
NOD/Lt mice (Makino et al., 1980; Pearson et al., 2003). Although
NOD.Nkrp1b carry the allele Klrb1c from C57BL/6 mice, NOD.Nkrp1b
mice develop a similar pattern of T1D than NOD/Lt mice as the numbers of
NKT cells between NOD/Lt and NOD.Nkrp1b is similar (Poulton et al.,
2001; Fletcher et al., 2008). However, the development of EAE in C57BL/6

CHAPTER 6
167
and NOD/Lt differs (Chapter 3, Chapter 4 and Chapter 5). NOD/Lt mice
develop a mild form of relapsing-remitting EAE and C57BL/6 mice develop
a chronic form of EAE (Slavin et al., 1998).
To determine the phenotype of EAE in mice with few NKT cell numbers
that express the NK1.1 marker at the same time, NOD/Lt and NOD.Nkrp1b
female mice were immunized for active MOG35-55/CFA + PTX-induced
EAE. As expected, all NOD/Lt and NOD.Nkrp1b mice developed clinical
signs of disease and the clinical course of disease was similar in both groups
(Figure 6.1). No differences were also observed in the onset of the disease,
maximum clinical score and CDI (Figure 6.1), indicating that the population
of NKT cells expressing the NK1.1 marker does not affect the severity of
active MOG35-55/CFA + PTX-induced EAE in NOD mice.

CHAPTER 6
168
Figure 6.1 Analysis of the clinical course of active MOG35-55/CFA + PTX -induced EAE in female NOD/Lt (closed circles) and NOD.Nkrp1b (open circles) mice. No significant differences were found between NOD/Lt and NOD.Nkrp1b (*p < 0.05, uncorrected Mann-Whitney U test; n = 5).
This image cannot currently be display ed.

CHAPTER 6
169
6.2.2. Cd1d in active MOG35-55/CFA + PTX-induced
EAE
CD1d molecules are cell surface glycoproteins expressed on APCs that
present lipids and glycolipids to NKT cells (Porcelli et al., 1989). NKT cells
are severely reduced in Cd1d knockout mice (Mendiratta et al., 1997). To
determine whether targeted deletion of Cd1d affects the clinical course of
active MOG35-55/CFA + PTX-induced EAE, the disease was induced in
NOD.Cd1d-/-, C57BL/6.Cd1d-/-, NOD/Lt and C57BL/6 mice.
Targeted deletion of Cd1d in C57BL/6 female mice did not influence the
clinical course of active MOG35-55/CFA + PTX-induced EAE, the onset day
of disease, the maximum clinical score and the cumulative disease index (p
0.05,uncorrectedMannWhitney‐testUtest) (Figure 6.2).
TheclinicalcourseofdiseaseintheabsenceofCd1dinNOD/Ltfemale
mice increased only during three days (day 16, 40 and 39) and
decreasedforoneday(day18).Nosignificantdifferencesintheonset
dayofdisease,themaximumclinicalscoreandthecumulativedisease
indexwereobservedintheabsenceofCd1dinNOD/Ltfemalemice(p<
0.05,uncorrectedMannWhitney‐testUtest)(Figure6.3).

CHAPTER 6
170
These data discarded a role of CD1d in the severity of activeMOG35‐
55/CFA+PTX‐inducedEAEinNODandC57BL/6mice,suggestingthat
the course of disease is independent of CD1molecule but it could be
dependent of NKT cells after the antigen presentation by the CD1d
molecule.

CHAPTER 6
171
Figure 6.2. Analysis of the clinical course of active MOG35-55/CFA + PTX -induced EAE in female C57BL/6 (closed circles) and C57BL/6.Cd1d-/- (open circles) mice. No significant differences were found between C57BL/6 and C57BL/6.Cd1d-/- (*p < 0.05, uncorrected Mann-Whitney U test; n = 7-8).
This image cannot currently be display ed.

CHAPTER 6
172
Figure 6.3 Analysis of the clinical course of active MOG35-55/CFA + PTX -induced EAE in female NOD/Lt (closed circles) and NOD.Cd1d-/- (open circles) mice. NOD.Cd1d-/- mice showed an increase of clinical signs of disease only at days 16, 39 and 40 compared to NOD/Lt. No differences were seen in the onset of disease, maximum clinical score and cumulative disease index between NOD/Lt and NOD.Cd1d-/- (*p < 0.05, uncorrected Mann-Whitney U test; n = 7).

CHAPTER 6
173
6.2.3. The Idd13 locus in active MOG35-55/CFA +
PTX-induced EAE
Idd13 locus regulates NKT cell numbers and NOD.Idd13 mice increase
NKT cell numbers compared to NOD/Lt mice (Esteban et al., 2003; Chen et
al., 2007). To find out whether higher numbers of NKT cells participate in
the development of EAE, males and females NOD/Lt and NOD.Idd13 mice
were immunized for MOG35-55/CFA + PTX-induced EAE.
The clinical course of active MOG35-55/CFA + PTX-induced EAE reached
significant difference between NOD/Lt and NOD.Idd13 only during three
days in male mice (days 51, 54 and 55; p < 0.05, uncorrected Mann
Whitney‐test U test) (Figure 6.4). No significant differences between
NOD/Lt and NOD.Idd13 male mice were found in the onset day of disease,
the maximum score and the clinical disease index (Figure 6.4).
The clinical course of disease increased in NOD.Idd13 female mice for a
period of 14 days (day37,40‐47,50,54‐55,65‐66;p<0.05)compared
toNOD/Lt female mice. No differences were observed on the onset day of
disease between NOD/Lt and NOD.Idd13 female mice. The maximum score
of disease and CDI showed an increase in NOD.Idd13 compared to NOD/Lt
female mice (Table 1 and Figure 6.5).

CHAPTER 6
174
An independent experiment in NOD.Idd13 and NOD/Lt female mice
showed more severe clinical course of the disease for 6 days (day 16, 32,
34-35, 39, 40: p < 0.05). Clinical signs of disease appeared earlier in
NOD.Idd13 (p<0.01)compared to NOD/Lt female mice (Table 6.1). The
clinical signs of disease and the CDI were more severe in NOD.Idd13 (p<
0.01andp<0.05respectively)than NOD/Lt female mice (Table 6.1). All
together, these data suggest that increased numbers of NKT cells in
NOD.Idd13 mice is associated with more severe clinical signs of disease.
Table 6.1. Active MOG35-55/CFA + PTX –induced EAE in NOD/Lt and NOD.Idd13 female mice.
Experiment
Strain
N
Incidence
(%)
Onset
(days)
Maximum Disease Score
Cumulative Disease Index (CDI)
Female
Exp 1 NOD/Lt 8 100 20.1±1.2 1.5±0.2 23.2±6.2
NOD.Idd13 7 100 19.2±0.5 2.6±0.3* 61.5±10.2**
Exp 2 NOD/Lt 7 100 16.7±0.6 1.9±0.1 32.9±1.9
NOD.Idd13 7 100 13.7±0.5** 2.8±0.2** 42.7±2.8*
Mean SEM of the clinical score of EAE. Statistically significant data between NOD/Lt mice and NOD.Idd13 mice are indicated (*p < 0.05, **p < 0.01, ***p < 0.01, uncorrected Mann Whitney-test U test).

CHAPTER 6
175
Figure 6.4 Analysis of the clinical course of active MOG35-55/CFA + PTX -induced EAE in male NOD/Lt (closed circles) and NOD.Idd13 (open circles) mice. NOD.Idd13 mice showed an increase of clinical signs of disease during three days compared to NOD/Lt. However, no differences were seen in the onset of disease, maximum clinical score and cumulative disease index (*p < 0.05, uncorrected Mann-Whitney U test; n = 7-8).
This image cannot currently be display ed.

CHAPTER 6
176
Figure 6.5 Representative analysis of clinical course of active MOG35-55/CFA + PTX -induced EAE in female NOD/Lt (closed circles) and NOD.Idd13 (open circles) mice from two independent experiments. Significant differences are indicated (*p < 0.05, **p < 0.01, ***p < 0.001 uncorrected Mann-Whitney U test; n = 7-8).
This image cannot currently be display ed.

CHAPTER 6
177
6.2.4 Active MOG35-55/CFA + PTX-induced EAE in
NOD.Nkrp1b mice congenic for Nkt1, Nkt2a, Nkt2b,
Nkt2e
Nkt1, Nkt2a, Nkt2b and Nkt2e loci control NKT cell numbers and
NOD.Nkrp1b mice congenic for the Nkt1, Nkt2a, Nkt2b and Nkt2e loci
increase numbers of NKT cells (Esteban et al., 2003; Rocha-Campos et al.,
2006; Fletcher et al., 2008). To determine whether increase numbers of
NKT cells in the congenic segments Nkt1, Nkt2a, Nkt2b and Nkt2e affect
the severity of EAE, NOD.Nkrp1b.Nkt1, NOD.Nkrp1b.Nkt2a,
NOD.Nkrp1b.Nkt2b, NOD.Nkrp1b.Nkt2e and NOD.Nkrp1b (control group)
were immunized for active MOG35-55/CFA + PTX-induced EAE.
The clinical course of MOG35-55/CFA + PTX-induced EAE between
NOD.Nkrp1b (control group) and NOD.Nkrp1b.Nkt1 showed significant
difference only in two consecutive days (day 15-16: p<0.05) (Figure 6.6).
The control group increased the severity of disease on day 15 and the next
the day NOD.Nkrp1b.Nkt1 showed more severe disease (Figure 6.6). The
maximum score decreased in NOD.Nkrp1b.Nkt1 (1.75 0.17) compared
with NOD.Nkrp1b (2.92 0.3). No differences where seen in the onset day
of disease and CDI between NOD.Nkrp1b and NOD.Nkrp1b.Nkt1 (Figure
6.6).
CHAPTER 6
178
The clinical course of disease between NOD.Nkrp1b and
NOD.Nkrp1b.Nkt2a differ significantly on days 14, 19, 23, 24, 26, 29 and
30 (p < 0.05): On days 14, 29 and 30 disease was more severe in
NOD.Nkrp1b.Nkt2a; however, on days 23-24 and 26 the disease was more
severe in NOD.Nkrp1b. No differences were seen in the day of onset of
disease, in the maximum score and in the CDI (Figure 6.6).
The clinical course of disease was more severe only for one day in
NOD.Nkrp1b compared with NOD.Nkrp1b.Nkt2 and, in NOD.Nkrp1b
compared with NOD.Nkrp1b.Nkt2e. No differences were seen in the day of
onset of disease, maximum score and cumulative disease index between
NOD.Nkrp1b and NOD.Nkrp1b.Nkt2b or between NOD.Nkrp1b compared
with NOD.Nkrp1b.Nkt2e (Figure 6.6).
All together, these data showed that despite the Nkt1, Nkt2a, Nkt2b and
Nkt2e loci increase numbers of NKT cells in NOD mice, this increase do not
affect the severity of active MOG35-55/CFA + PTX-induced EAE.

CHAPTER 6
179
Figure 6.6 Analysis of the clinical course of active MOG35-55/CFA + PTX -induced EAE in female NOD.Nkrp1b (closed circles), NOD.Nkt1 (open circles), NOD.Nkt2a (open upward triangles), NOD.Nkt2b (open downward triangles) and NOD.Nkt2e (open diamonds) mice. Although differences in the clinical score were seen during few days between NOD.Nkrp1b compared to NOD.Nkt1, NOD.Nkt2b and NOD.Nkt2e no diferences were seen in the onset of disease, maximum clinical score and cumulative disease index in NOD.Nkt1, NOD.Nkt2a, NOD.Nkt2b and NOD.Nkt2e mice compared to NOD.Nkrp1b mice (*p < 0.05, uncorrected Mann-Whitney U test; n = 6-7).
This image cannot currently be display ed.

CHAPTER 6
180
6.2.5 Active MOG35-55/CFA + PTX-induced EAE in
TCR CD4-V14 transgenic mice
TCR CD4-V14 C57BL/6 transgenic mice are enriched in CD1-restricted
NKT cells. The transgene was inserted in different places and every place
was identified with the numbers 2, 5 and 6. A new line of mice were created
from each insert. The three lines of mice were identified with the common
names: C57BL/6.Tg(mCD4-V14)2, C57BL/6.Tg(mCD4-V14)5 and
C57BL/6.Tg(mCD4-V14)6. To determine whether different inserts of the
transgene TCR CD4-V14 C57BL/6 affect the severity of, active MOG35-
55/CFA + PTX-induced EAE, the disease was induced in female and male
C57BL/6.Tg(mCD4-V14)2, C57BL/6.Tg(mCD4-V14)5 and
C57BL/6.Tg(mCD4-V14)6 mice.
6.2.5.1 C57BL/6.Tg(mCD4-V14)6 mice
C57BL/6.Tg(mCD4-V14)6 male mice decreased the clinical course of
disease during days 13, 14 and 15 (p<0.05) compared to C57BL/6 male
mice (Figure 6.7). The onset day of disease was delayed in
C57BL/6.Tg(mCD4-V14)6 (15.4 0.4) compared to C57BL/6 (13.17

CHAPTER 6
181
0.16) male mice (Figure 6.7). No differences in the maximum clinical score
were seen between C57BL/6.Tg(mCD4-V14)6 and C57BL/6 male mice.
The clinical course of disease decreased in C57BL/6.Tg(mCD4-V14)6
female mice compared with C57BL/6 female mice (day 21-22, 24-27, 31,
33-35, 37-40: p<0.05) (Figure 6.9). C57BL/6.Tg(mCD4-V14)6 female
did not differ on the day of onset of disease compared with C57BL/6 female
mice (Figure 6.9). The clinical signs of disease were less severe in female
C57BL/6.Tg(mCD4-V14)6 mice (maximum clinical score SEM = 2.0
0.44) compared with C57BL/6 female mice (maximum clinical score
SEM = 3.5 00). The CDI also decreased in C57BL/6.Tg(mCD4-V14)6
female mice (CDI SEM = 26.0 14.78) compared with C57BL/6 female
mice (CDI SEM = 73.83 5.25). This data indicate that the TCR CD4-
V14 transgene inserted in the place identify with the number six decrease
the severity of active MOG35-55/CFA + PTX-induced EAE.
6.2.5.2 C57BL/6.Tg(mCD4-V14)5 mice
C57BL/6.Tg(mCD4-V14)5 male mice show less severe clinical course of
disease on days 13-23, 25-27, 31, 34-36 (p<0.05) than C57BL/6 male mice
(Figure 6.7). The day of onset of disease SEM was delayed in
C57BL/6.Tg(mCD4-V14)5 (27.17 4.88 days) compared to C57BL/6
CHAPTER 6
182
(13.16 0.16) male mice (Figure 6.7). The maximum clinical score and the
cumulative disease index show no differences between C57BL/6.Tg(mCD4-
V14)5 and C57BL/6 male mice (Figure 6.7).
C57BL/6.Tg(mCD4-V14)5 female mice showed lower clinical course of
disease from day 17 to 40 compared to C57BL/6 (p<0.05). The onset day
of disease SEM was delayed in C57BL/6.Tg(mCD4-V14)5 female mice
(31.8 5.67 days) compared with C57BL/6 female mice (14.5 0.76 days).
The severity of clinical signs of disease decreased in C57BL/6.Tg(mCD4-
V14)5 female mice (maximum clinical score SEM = 0.8 0.49) than
C57BL/6 female mice (maximum clinical score SEM = 3.5 00). The
cumulative disease index was lower in C57BL/6.Tg(mCD4-V14)5 female
mice (CDI SEM = 11.2 7.31) than C57BL/6 female mice (CDI SEM =
73.83 5.25).
This data indicate that the TCR CD4-V14 transgene inserted in the place
identify with the number five delayed the onset of clinical signs of disease
and decrease the severity of active MOG35-55/CFA + PTX-induced EAE.
CHAPTER 6
183
6.2.5.3 C57BL/6.Tg(mCD4-V14)2 mice
C57BL/6.Tg(mCD4-V14)2 male mice show less severe clinical score on
day 19, 25, 31 and 33-39 (p<0.05) than C57BL/6 (Figure 6.8). The onset
day of disease was delayed in C57BL/6.Tg(mCD4-V14)2 (16.0 1.19)
compared to C57BL/6 (13.5 0.34) male mice (Figure 6.8). No differences
were seen in the maximum clinical score. The cumulative disease index was
lower in C57BL/6.Tg(mCD4-V14)2 (61.28 9.78 than C57BL/6 male
mice (88.5 3.01) (Figure 6.8). C57BL/6.Tg(mCD4-V14)2 female were
completely protected from EAE (Figure 6.9).

CHAPTER 6
184
Figure 6.7 Analysis of the clinical course of active MOG35-55/CFA + PTX -induced EAE in male C57BL/6 (closed circles), C57BL/6.Tg(mCD4-Va14)6 (upward triangles), C57BL/6.Tg(mCD4-Va14)5 (open squares) mice. Significant differences in clinical score per day between C57BL/6 and C57BL/6.Tg(mCD4-Va14) mice are indicated (*p < 0.05). Differences in the onset of disease, maximum clinical score and cumulative disease are indicated (*p < 0.05, **p < 0.01, ***p < 0.001 uncorrected Mann-Whitney U test; n = 5-6).
This image cannot currently be display ed.

CHAPTER 6
185
Figure 6.8 Analysis of the clinical course of active MOG35-55/CFA + PTX -induced EAE in male C57BL/6 (closed circles), C57BL/6.Tg(mCD4-Va14)2 (open cicles) mice. Significant differences in clinical score per day between C57BL/6 and C57BL/6.Tg(mCD4-Va14) mice are indicated (*p < 0.05). Differences in the onset of disease, maximum clinical score and cumulative disease are indicated (*p < 0.05, **p < 0.01, ***p < 0.001 uncorrected Mann-Whitney U test; n = 6-7).

CHAPTER 6
186
Figure 6.9 Analysis of the clinical course of active MOG35-55/CFA + PTX -induced EAE in female C57BL/6 (closed circles), C57BL/6.Tg(mCD4-Va14)2 (upward triangles), C57BL/6.Tg(mCD4-Va14)5 (open square) and C57BL/6.Tg(mCD4-Va14)2 (open circles) mice. Significant differences in the clinical score per day between C57BL/6 and C57BL/6.Tg(mCD4-Va14) mice are indicated (*p < 0.05). Differences in the onset of disease, maximum clinical score and cumulative disease are indicated (*p < 0.05, **p < 0.01, ***p < 0.001 uncorrected Mann-Whitney U test; n = 5-6).

CHAPTER 6
187
6.3 Discussion
NKT cells are a group of T cells that express common markers for T and
NK cells and are activated by lipids and glycolipids (Godfrey et al., 2004;
MacDonald 2002). NKT cells produce IL4/IFN/IL17 cytokines and these
cytokines play a key role in EAE (Godfrey et al., 2004; Coquet et al., 2008;
Lees et al., 2008; Stromnes 2008).
To date, most research about the role of NKT cells in EAE has been focused
on the immune response to NKT cells ligation (Jahng et al., 2001; Singh et
al., 2001; Furlan et al., 2003). Little research has been done about the NKT
cell number in EAE (Novak et al., 2011; Miljković et al., 2011; Yokote et
al., 2008). This chapter illustrated the genetic control of NKT cells numbers
in the phenotype of EAE.
C57BL/6 mice have higher numbers of NKT cells than NOD/Lt and
NOD.NKrp1b mice (Jordan et al., 2009; Poulton et al., 2001). NOD/Lt mice
develop a mild form of relapsing-remitting EAE and C57BL/6 mice develop
a chronic form of EAE (Slavin et al., 1998). NOD.Nkrp1b mice carry the B6
alleles at the NKC on Chomosome 6 to express the marker NK1.1 (Esteban
et al., 2003). Here, it is shown that the phenotype of EAE is similar between
NOD/Lt and NOD.Nkrp1b mice, which demonstrates that the B6 alleles at
the NKC on Chomosome 6 do not affect the severity of EAE in NOD/Lt

CHAPTER 6
188
mice. However, deeper studies are necessary to conclusively demonstrate
whether NKT cells expressed the NK1.1 marker affect the severity of EAE.
NK1.1 marker is express in a small population of NKT cells and in NK cells
(Slifka et al., 2004). Fritz et al., (2001) reported that cells expressing the
NK1.1+ marker, DX5+ and + TCR regulate EAE.
The lack of CD1d decreases dramatically the NKT cell numbers (Mendiratta
et al., 1997). The reduced numbers of NKT cells in the absence of Cd1d do
not affect the clinical course of EAE neither in NOD/Lt mice nor in
C57BL/6 mice. Although, Teige et al., (2004) reported that EAE is
exacerbated in the absence Cd1d, these results support the findings of Mars
et al., (2002) and Singh et al., (2001) who found that the severity of EAE is
not altered in Cd1d-deficient mice. Different results can be associated to
different protocols to induce EAE.
The Idd13 locus is located on chromosome 2 and is a strong component of
the distinction between NOD and NOR mice (Reifsnyder et al., 2005).
NOD.Idd13 mice have higher NKT cells numbers than NOD/Lt mice
(Esteban et al., 2003; Chen et al., 2007). Although, Mayo et al., (2007)
reported that NOR/Lt mice decrease the severity of disease in the presence
of PTX and, in the absence of PTX NOR/Lt mice are completely resistant to
EAE. We are the first group reporting that NOD.Idd13 mice increase the
severity of disease.

CHAPTER 6
189
NKT cells numbers also increase in NOD.Nkrp1b.Nkt1,
NOD.Nkrp1b.Nkt2a, NOD.Nkrp1b.Nkt2b and NOD.Nkrp1b.Nkt2e mice
(Rocha-Campos et al., 2006; Jordan et al., 2007). However, the
development of EAE remains unaltered in these mice. To my knowledge
studies of EAE in these mice has not been reported previously.
TCR CD4-V14 C57BL/6 transgenic mice are enriched in CD1-restricted
NKT cells. Although, previous report in transgenic mice show that TCR
V14 -J281 transgenic NOD mice enriched in CD1d-restricted NKT cells,
are protected from EAE (Mars et al., 2002). This study is the first reporting
that TCR CD4-V14 transgene inserted in three different places decrease
the severity of EAE in C57BL/6 mice.
All together, further studies are required to identified whether NKT cells
expressing the NK1.1 marker alter the development of EAE. CD1d does not
affect the severity of EAE. Idd13 locus affects the severity of EAE but not
the Nkt1, Nkt2a, Nkt2b and Nkt2e loci. TCR CD4-V14 construct affect the
severity of EAE. Although the mechanisms affecting the severity of EAE
remain to be defined, in this chapter we report that specific genes control
NKT cells numbers are able to influence the severity of EAE. It possible
that congenic alleles that boost NKT cell numbers may control the
CHAPTER 6
190
phenotype of EAE and/or influence the immune response because of the
specific subsets of NKT cells generated during the disease.

CHAPTER 7

CHAPTER 7
191
CHAPTER 7
GENERAL DISCUSSION AND
CONCLUSIONS
MSisachronicinflammatoryanddegenerativediseasethataffectsthe
CNS.Thisdiseaseaffectsmainlyyoungadultsand ismorecommon in
womenthaninmen;butitismoresevereinmenthaninwomen.MSis
classified as an autoimmune disease because the immune cells attack
theCNS’owncellswithanunclearcause.Despitethecauseisnotclear,
genetic and environmental factors have been associated with the
initiationandprogressionofMS(Wynn et al., 1990; Duquette et al., 1992;
Moldovan et al., 2008).
BothgeneticsandenvironmentalfactorsassociatedwithMSaremainly
studiedinanimalmodels,whichreproducesomeformsofthedisease.
EAE is the most commonly used animal model for the study of the
pathogenesis and immunoregulation of CNS autoimmunity. Although
EAsE has some limitations to replicate the autoimmune inflammation
observed inMS, it isausefulmodel foradeeperunderstandingofMS
biology. In the present study, EAE was used as an animal model to

CHAPTER 7
192
assesstheroleofTLRsandNKTcellsingene/environmentinteractions
inCNS‐autoimmuneinflammation.
MS and EAE are dominated by CD4+ T helper (Th) cells secreting Th1,
Th17, Th2 and iTreg cells (Corrale et al., 1995; Lassmann et al., 2001).
Th17 and Th1 cells are associated with CNS autoimmune damage while
Th2 is associated with CNS autoimmune protection (Link et al., 1994;
Maddur et al., 2012). In general, there are two subsets of Th17 cells: 1)
Th17 (Th17) cells, which requires of IL6 and TGF for their development,
and expresses higher IL10, CCL20, CXCR6, IL17A and IL17F and; 2)
Th17 (23) cells that require of IL6, IL23 and IL1 and expresses higher IL22,
CCL9 and CXCR3. Th1 cells require of IL12 and IFN and produce IFN.
In contrast, Th2 cells and iTreg cells seem to down regulate autoimmune
inflammation in the CNS. Th2 cells require IL4 and produce IL4, IL5, IL10
and IL13. iTreg cells require TGF and IL2 to produce TGF (review in
Kurebayashi et al., 2013).
Th1, Th17, Th2 and iTreg cytokines regulate each other, for example: a)
Th17 differentiation is inhibited by the production of IL2, IL4 and IFN; b)
Th1 differentiation is inhibited by IL4 production; c) Th2 differentiation is
inhibited by IFN and IL2 and d) Treg is inhibited by IL6 (D’Andrea et al.,
1993; Oukka et al., 2007; review in Kurebayashi et al., 2013).

CHAPTER 7
193
Gene microarray analysis of MS plaques from autopsy of MS patients
showed increased levels of IL6, IL17 and IFN including altered pathways
of these cytokines (Lock et al., 2002). Altered numbers of IL17 and IFN
have been found in RRMS and SPMS (Frisullo et al., 2008). RRMS patients
show altered levels of IL4, IL6, IL12 and IL10 (Link et al., 1994; Chen et
al., 2012; Kallaur et al., 2013). TGF production is defective and TGF
signalling is reduced in MS patients (Mokhtarian et al 1994; Meoli et al.,
2011). Moreover, evidence of the role of Th1, Th17, Th2 and iTreg
cytokines secretion in autoimmune inflammation is also seen in EAE for
example; mice are resistant to EAE in the absence of IL23 or IL6, while IL4
and IL10 has anti-inflammatory effect (Eugster et al., 1998; Cua et al.,
2003; Hirota et al., 2011; Payne et al., 2012 and Fitzgerald et al., 2007).
TLRs and NKT cells respond to environmental factors by the production
and/or expression of Th1, Th17, Th2 and iTreg cytokines; for example:
Ligation of TLRs modulates the differentiation of human Th17 cells (Kattah
et al., 2008). IL6 is generated in response to ligation of TLR2 and
augmented on response to ligation of TLR4 and TLR2/6 heterodimer,
(Takeuchi et al., 2000, Thoma-Uszynski et al., 2000, McCurdy et al., 2001,
Mu et al., 2001; Jin et al., 2011). TGF is produced in response to
microflora, which is identified by TLRs (Rakoff-Nahoum et al., 2004;
Atarashi et al., 2008; Ivanov et al., 2008; Zeuthen et al., 2008). IL23 and

CHAPTER 7
194
IL1 are up regulated in response to pathogenic E. coli K4 after ligation of
TLR2 and TLR4 (Cammarota et al., 2009). IFN is produced in response of
TLRs such as TLR2 and TLR4 and promotes TLR signalling (Hu et al.,
2006; Schroder, et al., 2006; Brüll et al., 2010). IL17, IFN and IL4 are
produced by different NKT cell subsets, examples include: CD4- NKT cells
and CD4-CD8- NKT cells produce IFN; CD4+ NKT cells produce IL4;
CD4-NK1.1- NKT cells produced IL17 (Gumperz et al., 2002; Lee et al.,
2002; Michel et al., 2007; Coquet et al., 2008).
This research illustrates part of the phenotype of MOG35-55/CFA+PTX
induced EAE generated by CD4+ T helper (Th) cytokine production via
TLRs and NKT cells. The absence of MyD88 completely protect mice of
active MOG35-55/CFA+PTX induced EAE as reported before by Prinz et al.,
(2006); Marta et al., (2008) and Lampropoulou et al., (2008). However, the
absence of TLR1 and TLR6 do not alter the clinical course of EAE. The
role of TLR1 is reported for the first time in this study and the role of TLR6
is consistent with results previously reported by Marta et al., (2008).
However, controversial results have been found in active EAE in the
absence of TLR4, TLR2 and TLR9. Our studies rule out a role of TLR4 in
the disease while Marta et al (2008) found that TLR4 protects against EAE.
This work supports a decrease of clinical course of EAE in the absence of
TLR9 (Prinz et al., 2006), although Marta et al (2008) found a mild increase
in of the severity of disease. This study also found a decrease in the severity
CHAPTER 7
195
of active EAE in the absence of TLR2 but Prinz et al (2006) did not find
differences. Results from this study are consistent with the effect of M.
tuberculosis that was used as adjuvant. The difference between these studies
and those from of Marta et al (2008) is the autoantigen. Marta used
recombinant rat MOG protein and we used MOG35-55. Kerfoot et al., (2004)
do not mention the sex of the mice used in the experiment. Prinz et al (2006)
only used female mice in the experiments. The different protocol of EAE
induction, the sex of the animal models and the environment seem to be
associated with distinct results. This study reports a partial resolution of this
discrepancy when we describe a mild reduction in EAE clinical socores of
female, but not male in the absence of TLR2 in C57BL/6 mice. Moreover,
this study suggests that microflora or pathogen exposure in different animal
facilities contributed to different results.
In order to discard any effect of the adjuvant (CFA, which contains M.
tuberculosis and; PTX, which signal through TLR4 (Kerfoot et al., 2004)),
the roles of TLR2, TLR4 and TLR9 were studied in the passive model of
EAE. In this model adoptive transfers were performed by transfer
lymphocytes from: WT to TLR2 deficient mice, WT to WT; WT to TLR2
deficient mice; WT to TLR9 deficient mice; TLR2 deficient mice to WT
and TLR2 deficient mice to TLR2 deficient mice.

CHAPTER 7
196
Adoptive transfer of WT lymphocytes into WT recipients resulted in similar
clinical signs of active MOG35-55/CFA+PTX induced EAE. The severity of
passive EAE decreased in TLR4 deficient mice, thus PTX partially signal
through TLR4. Clinical signs of passive EAE decreased in the absence of
TLR9, nevertheless; the inhibition of disease was similar to that seen in
active EAE. The adoptive transfer of TLR2 deficient cells into either WT or
TLR2 deficient recipients resulted in ameliorated disease, similar to active
EAE in the absence of TLR2 in female mice. In contrast, the transfer of WT
cells into TLR2 deficient mice resulted in complete protection in both male
and female mice; suggesting that the presence of TLR2 at the induction of
disease creates a dependence on TLR2 signalling in the effector phase. Our
results were consistent with the findings of Reynolds et al., (2010).
Protection in the absence of TLR2 was associated to a decrease of CD4+ T
cell infiltration in CNS, a decrease of CD4+ T cell secreting IL17 in the
CNS, undetectable levels of circulating IL6 and increase numbers of central
(CD62L+) CD4+CD25+Foxp3+ regulatory T cells. These results provide a
potential mechanism of TLR2 in the development of autoimmune CNS
inflammation as IL6 is produced after TLR2 ligation, and IL6 is involved in
CD4+ T cell differentiation into Th17 cells, which are inhibited by Treg
cells (Takeuchi et al., 2000, Thoma-Uszynski et al., 2000, McCurdy et al.,
2001, Mu et al., 2001; Jin et al., 2011; Kurebayashi et al., 2013).
The role of TLRs was further studied in NOD mice. Consistent with the
results of Amor et al., (1993) and Slavin et al., (1998), NOD mice

CHAPTER 7
197
developed a form of relapsing/remitting EAE. In contrast to C57BL/6.Tlr2-/-
mice, NOD.Tlr2-/- mice did not affect the severity of disease. As NOD/Lt
mice are susceptible to T1D, we tested whether insulitis associated with
T1D development compensated for the lack of TLR2 signalling in these
mice.
Because NOD/Lt and NOD.Tlr-/- developed a mild form of EAE, a better
model of EAE was used. Active MOG35-55/CFA+PTX induced EAE was
induced in in NOD.H2d and NOD.H2b mice, which are resistant to Type 1
diabetes (T1D) (Pearson et al., 2003; Yoshida et al., 2008). NOD.H2d mice
developed a chronic form of EAE similar to C57BL/6 mice and NOD.H2b
mice showed a severe form of relapsing-remitting EAE.
To test the hypothesis that insulitis associated with T1D development in
some way compensated for the lack of TLR2 signalling in NOD mice, the
B6 MHC, H2b was crossed onto the NOD and NOD.Tlr2-/- strains.
NOD.H2b.Tlr2-/- mice did not show relapses of disease after the initial peak
of disease. To my knowledge, this is the first study showing the phenotype
of EAE in NOD.H2d, NOD.H2b, NOD.H2b.Tlr2-/-. These results indicate
that the role of TLR2 is particularly important in the effector phase of both
chronic and relapsing-remitting MOG35-55/CFA+PTX induced EAE. In
addition, these data suggest that both TLR2 signalling and immunological

CHAPTER 7
198
events associated with autoimmunity at a distant site can mediate relapses in
CNS autoimmunity.
Finally, NKT cells are also involved in CD4+ T helper (Th) cytokine
production. Activation of NKT cells by glycolipids was found to protect the
CNS of autoimmune inflammation by the preferential production of IL4,
GM-CSF, IL4 and IFN (Miyamoto et al., 2001; Parekh et al., 2013).
Opposing these results, Quian et al., (2010) found that -galcer exacerbate
EAE by the production of IL17. NKT cells are restricted by CD1d
molecule; and enrich in CD1d-restricted NKT cells protect from EAE (Mars
et al., 2002; Mars et al., 2008). Protection is associated with CNS NKT cells
infiltration and CNS local expression of CD1d (Mars et al., 2002; Mars et
al., 2008). It seems that only enrichment of CD1d in CNS provide
protection against autoimmune inflammation. Consistent with this
statement, our experiments show that the severity of MOG35-55/CFA+PTX
induced EAE decrease in transgenic mice but not in congenic mice.
C57BL/6.Tg(mCD4-V14)6 female decreases the clinical signs of disease
in female mice but not male mice and in C57BL/6.Tg(mCD4-V14)5
female and male mice while C57BL/6.Tg(mCD4-V14)2 female were
completely protected from the disease. Mars et al., (2002) reported that TCR
V14-J81 transgenic NOD mice are protected from EAE by inhibiting
IFN production in spleen These results suggest that CD4+V14 NKT cells
produce preferentially one of the four groups of cytokines that could dictate
CHAPTER 7
199
the phenotype of MOG35-55/CFA + PTX induced EAE; nevertheless if the
phenotype of EAE depends on cytokine production by NKT cells or by
NKT cell infiltration need to be clarified.
Given the different results in the role of TLR2 and NKT cells, it would be
important to understand more fully the mechanisms involved in their
participation in CNS autoimmune inflammation before translate this results
into therapeutic options for MS. Then it would be important to replicate the
results in different animal models, environments and sexes. On the other
side the key role of MyD88 in CNS autoimmune inflammation requires the
development, validation and testing of MS drugs in several animal models.
If results are favorable and consistent in different animal models, they must
be translated into therapeutic options for specific individuals.

REFERENCES

REFERENCES
200
REFERENCES
Abel B, Thieblemont N, Quesniaux VJ, Brown N, Mpagi J, Miyake K, Bihl
F, Ryffel B. Toll-like receptor 4 expression is required to control
chronic Mycobacterium tuberculosis infection in mice. Journal of
Immunology. 2002; 169(6): 3155-3162.
Adachi O, Kawai T, Takeda K, Matsumoto M, Tsutsui H, Sakagami M,
Nakanishi K, Akira S. Targeted disruption of the MyD88 gene
results in loss of IL-1- and IL-18-mediated function. Immunity.
1998; 9(1): 143-150.
Aggarwal S, Yurlova L, Simons M. Central nervous system myelin:
structure, synthesis and assembly. Trends Cell Biology. 2011;
21(10): 585-593.
Agmon-Levin N, Lian Z, Shoenfeld Y. Explosion of autoimmune diseases
and the mosaic of old and novel factors. Cell & Molecular
Immunology. 2011; 8(3): 189-192.
Aguirre-Cruz L, Flores-Rivera J, De La Cruz-Aguilera DL, Rangel-López
E, Corona T. Multiple sclerosis in Caucasians and Latino
Americans. Autoimmunity. 2011; 44(7): 571-575.
Akira S, Uematsu S, Takeuchi O. Pathogen Recognition and Innate

REFERENCES
201
Immunity. Cell. 2006; 124: 783-801.
Alexopoulou L, Holt AC, Medzhitov R, Flavell RA. Recognition of double-
stranded RNA and activation of NF-kappaB by Toll-like receptor 3.
Nature. 2001; 413(6857): 732-738.
Amor S, Baker D, Groome N, Turk JL. Identification of a major
encephalitogenic epitope of proteolipid protein (residues 56-70) for
the induction of experimental allergic encephalomyelitis in Biozzi
AB/H and nonobese diabetic mice. Journal of Immunology. 1993;
150(12): 5666-5672.
Anaya JM, Gómez L, Castiblanco J. Is there a common genetic basis for
autoimmune diseases? Clinical & Developmental Immunology.
2006; 13(2-4): 185-195.
Andersson A, Covacu R, Sunnemark D, Danilov AI, Bianco AD, Khademi
M, Wallström E, Lobell A, Brundin L, Lassmann H, Harris RA.
Pivotal Advance: HMGB1 expression in active lesions of human and
experimental multiple sclerosis. Journal of Leukocyte Biology. 2008;
84(5): 1248-1255.
Apetoh L, Ghiringhelli F, Tesniere A, Obeid M, Ortiz C, Criollo A, Mignot
G, Maiuri MC, Ullrich E, Saulnier P, Yang H, Amigorena S, Ryffel
B, Barrat FJ, Saftig P, Levi F, Lidereau R, Nogues C, Mira JP,
Chompret A, Joulin V, Clavel-Chapelon F, Bourhis J, André F,

REFERENCES
202
Delaloge S, Tursz T, Kroemer G, Zitvogel L. Toll-like receptor 4-
dependent contribution of the immune system to anticancer
chemotherapy and radiotherapy. Nature Medicine. 2007; 13(9):
1050-1059.
Araki M, Kondo T, Gumperz JE, Brenner MB, Miyake S, Yamamura T.
Th2 bias of CD4+ NKT cells derived from multiple sclerosis in
remission. International Immunology. 2003; 15(2): 279-288.
Aranami T, Yamamura T. Th17 Cells and autoimmune encephalomyelitis
(EAE/MS). Allergology International: official journal of the
Japanese Society of Allergology. 2008; 57(2): 115-120.
Atarashi K, Nishimura J, Shima T, Umesaki Y, Yamamoto M, Onoue M,
Yagita H, Ishii N, Evans R, Honda K, Takeda K. ATP drives lamina
propria T(H)17 cell differentiation. Nature. 2008; 455(7214): 808-
812.
Aung LL, Fitzgerald-Bocarsly P, Dhib-Jalbut S, Balashov K. Plasmacytoid
dendritic cells in multiple sclerosis: chemokine and chemokine
receptor modulation by interferon-beta. Journal of
Neuroimmunology. 2010; 226(1-2): 158-164.
Back SA, Tuohy TM, Chen H, Wallingford N, Craig A, Struve J, Luo NL,
Banine F, Liu Y, Chang A, Trapp BD, Bebo BF Jr, Rao MS,
Sherman LS. Hyaluronan accumulates in demyelinated lesions and

REFERENCES
203
inhibits oligodendrocyte progenitor maturation. Nature Medicine.
2005; 11(9): 966-972.
Bafica A, Scanga CA, Feng CG, Leifer C, Cheever A, Sher A. TLR9
regulates Th1 responses and cooperates with TLR2 in mediating
optimal resistance to Mycobacterium tuberculosis. The Journal of
Experimental Medicine. 2005; 202(12): 1715-1724.
Baker D, Rosenwasser OA, O'Neill JK, Turk JL. Genetic analysis of
experimental allergic encephalomyelitis in mice. Journal of
Immunology. 1995; 155(8): 4046-4051.
Balashov KE, Aung LL, Vaknin-Dembinsky A, Dhib-Jalbut S, Weiner HL.
Interferon-β inhibits toll-like receptor 9 processing in multiple
sclerosis. Annals of Neurology. 2010; 68(6): 899-906.
Bar-Or A, Fawaz L, Fan B, Darlington PJ, Rieger A, Ghorayeb C, Calabresi
PA, Waubant E, Hauser SL, Zhang J, Smith CH. Abnormal B-cell
cytokine responses a trigger of T-cell-mediated disease in MS?
Annals of Neurology. 2010; 67(4): 452-461.
Barcellos LF, Oksenberg JR, Begovich AB, Martin ER, Schmidt S,
Vittinghoff E, Goodin DS, Pelletier D, Lincoln RR, Bucher P,
Swerdlin A, Pericak-Vance MA, Haines JL, Hauser SL. HLA-DR2
Dose Effect on Susceptibility to Multiple Sclerosis and Influence on
Disease Course. American Journal of Human Genetics. 2003; 72(3):

REFERENCES
204
710–716.
Baxter AG. The origin and application of experimental autoimmune
encephalomyelitis. Nature Reviews Immunology. 2007; 7(11): 904-
912.
Becher B, Durell BG, Miga AV, Hickey WF, Noelle RJ. The clinical course
of experimental autoimmune encephalomyelitis and inflammation is
controlled by the expression of CD40 within the central nervous
system. Journal of Experimental Medicine. 2001; 193(8): 967-974.
Bendelac A, Rivera MN, Park SH, Roark JH. Mouse CD1-specific NK1 T
cells: development, specificity, and function. Annual Review of
Immunology. 1997;15:535-62.
Berer K, Mues M, Koutrolos M, Rasbi ZA, Boziki M, Johner C, Wekerle H,
Krishnamoorthy G. Commensal microbiota and myelin autoantigen
cooperate to trigger autoimmune demyelination. Nature. 2011;
479(7374): 538-541.
Bertrams HJ, Kuwert EK. Association of histocompatibility haplotype
HLA-A3-B7 with multiple sclerosis. Journal of Immunology. 1976;
117(5 Pt.2): 1906-1912.
Berzins SP, Smyth MJ, Baxter AG. Presumed guilty: natural killer T cell
defects and human disease. Nature Reviews Immunology. 2011;
11(2): 131-142.

REFERENCES
205
Bettelli E, Pagany M, Weiner HL, Linington C, Sobel RA, Kuchroo VK.
Myelin Oligodendrocyte Glycoprotein–specific T Cell Receptor
Transgenic Mice Develop Spontaneous Autoimmune Optic Neuritis.
The Journal of Experimental Medicine. 2003; 197(9): 1073-1081.
Bhigjee AI, Moodley K, Ramkissoon K. Mult Scler. Multiple sclerosis in
KwaZulu Natal, South Africa: an epidemiological and clinical study.
Multiple Sclerosis. 2007; 13(9): 1095-1099.
Billiau A, Matthys P. Modes of action of Freund's adjuvants in experimental
models of autoimmune diseases. Journal of Leukocyte Biology.
2001; 70(6): 849-860.
Bö L, Geurts JJ, Mörk SJ, van der Valk P. Grey matter pathology in
multiple sclerosis. Acta Neurologica Scandinavica Supplementum.
2006; 183: 48-50.
Brian A, Thieblemont N, Quesniaux VJF, Brown N, Mpagi J, Miyake K,
Bihl F, Ryffel B. Toll-Like Receptor 4 Expression Is Required to
Control Chronic Mycobacterium tuberculosis Infection in Mice.
Journal of Immunology. 2002; 169(6): 3155-3162.
Brightbill HD, Libraty DH, Krutzik SR, Yang RB, Belisle JT, Bleharski JR,
Maitland M, Norgard MV, Plevy SE, Smale ST, Brennan PJ, Bloom
BR, Godowski PJ, Modlin RL. Host defense mechanisms triggered
by microbial lipoproteins through toll-like receptors. Science. 1999;

REFERENCES
206
285(5428): 732-736.
Brüll F, Mensink RP, van den Hurk K, Duijvestijn A, Plat J. TLR2
activation is essential to induce a Th1 shift in human peripheral
blood mononuclear cells by plant stanols and plant sterols. The
Journal of Biological Chemistry. 2010; 285(5): 2951-2958.
Bsibsi M, Bajramovic JJ, Vogt MH, van Duijvenvoorden E, Baghat A,
Persoon-Deen C, Tielen F, Verbeek R, Huitinga I, Ryffel B, Kros A,
Gerritsen WH, Amor S, van Noort JM. The microtubule regulator
stathmin is an endogenous protein agonist for TLR3. Journal of
Immunology. 2010; 184(12): 6929-6937.
Bsibsi M, Persoon-Deen C, Verwer RW, Meeuwsen S, Ravid R, Van Noort
JM. Toll-like receptor 3 on adult human astrocytes triggers
production of neuroprotective mediators. Glia. 2006; 53(7): 688-
695.
Bsibsi M, Ravid R, Gveric D, van Noort JM. Broad expression of Toll-like
receptors in the human central nervous system. Journal of
Neuropathology and Experimental Neurology. 2002; 61(11): 1013-
1021.
Budd RC, Miescher GC, Howe RC, Lees RK, Bron C, MacDonald HR.
Developmentally regulated expression of T cell receptor beta chain
variable domains in immature thymocytes. The Journal of

REFERENCES
207
Experimental Medicine. 1987;166(2): 577-5782.
Cammarota M, De Rosa M, Stellavato A, Lamberti M, Marzaioli I, Giuliano
M. In vitro evaluation of Lactobacillus plantarum DSMZ 12028 as a
probiotic: emphasis on innate immunity. International Journal of
Food Microbiology. 2009; 135(2): 90-98.
Cantorna MT, Zhao J, Yang L. Vitamin D, invariant natural killer T-cells
and experimental autoimmune disease. The Proceeding of Nutrition
Society. 2012; 71(1): 62-66.
Chen Y, Langrish CL, McKenzie B, Joyce-Shaikh B, Stumhofer JS,
McClanahan T, Blumenschein W, Churakovsa T, Low J, Presta L,
Hunter CA, Kastelein RA, Cua DJ. Anti-IL-23 therapy inhibits
multiple inflammatory pathways and ameliorates autoimmune
encephalomyelitis. The Journal of Clinical Investigation. 2006;
116(5): 1317-1326.
Chen YC, Yang X, Miao L, Liu ZG, Li W, Zhao ZX, Sun XJ, Jiang GX,
Chen SD, Cheng Q. Serum level of interleukin-6 in Chinese patients
with multiple sclerosis. Journal of Neuroimmunology. 2012; 249(1-
2): 109-111.
Chen YG, Driver JP, Silveira PA, Serreze DV. Subcongenic analysis of
genetic basis for impaired development of invariant NKT cells in
NOD mice. Immunogenetics. 2007; 59(9): 705-712.

REFERENCES
208
Clarke TB, Davis KM, Lysenko ES, Zhou AY, Yu Y, Weiser JN.
Recognition of peptidoglycan from the microbiota by Nod1
enhances systemic innate immunity. Nature Medicine. 2010;16(2):
228-231.
Colombo M, Dono M, Gazzola P, Roncella S, Valetto A, Chiorazzi N,
Mancardi GL, Ferrarini M. Accumulation of clonally related B
lymphocytes in the cerebrospinal fluid of multiple sclerosis patients.
Journal of Immunology. 2000; 164(5): 2782-2789.
Contini C, Cultrera R, Seraceni S, Castellazzi M, Granieri E, Fainardi E.
Cerebrospinal fluid molecular demonstration of Chlamydia
pneumoniae DNA is associated to clinical and brain magnetic
resonance imaging activity in a subset of patients with relapsing-
remitting multiple sclerosis. Multiple Sclerosis. 2004; 10(4): 360-
369.
Cooper GS, Bynum ML, Somers EC. Recent insights in the epidemiology of
autoimmune diseases: improved prevalence estimates and
understanding of clustering of diseases. Journal of Autoimmunity.
2009; 33(3-4): 197-207.
Cooper GS, Stroehla BC. The epidemiology of autoimmune diseases.
Autoimmunity Reviews. 2003; 2(3): 119-125.
Coquet JM, Chakravarti S, Kyparissoudis K, McNab FW, Pitt LA,

REFERENCES
209
McKenzie BS, Berzins SP, Smyth MJ, Godfrey DI. Diverse cytokine
production by NKT cell subsets and identification of an IL-17-
producing CD4-NK1.1- NKT cell population. Proceeding of
National Academy of Sciences of the United States of America.
2008; 105(32): 11287-11292.
Coquet JM, Kyparissoudis K, Pellicci DG, Besra G, Berzins SP, Smyth MJ,
Godfrey DI. IL-21 is produced by NKT cells and modulates NKT
cell activation and cytokine production. Journal of Immunology.
2007; 178(5): 2827-2834.
Correale J, Farez M. Helminth antigens modulate immune responses in cells
from multiple sclerosis patients through TLR2-dependent
mechanisms. Journal of Immunology. 2009; 183(9): 5999-6012.
Correale J, Farez M. Monocyte-derived dendritic cells in multiple sclerosis:
the effect of bacterial infection. Journal of Neuroimmunology. 2007;
190(1-2): 177-189.
Correale J, Fiol M, Gilmore W. The risk of relapses in multiple sclerosis
during systemic infections. Neurology. 2006; 67(4): 652-659.
Correale J, Gilmore W, McMillan M, Li S, McCarthy K, Le T, Weiner LP.
Patterns of cytokine secretion by autoreactive proteolipid protein-
specific T cell clones during the course of multiple sclerosis. Journal
of Immunology. 1995; 154(6): 2959-2968.
REFERENCES
210
Cua DJ, Sherlock J, Chen Y, Murphy CA, Joyce B, Seymour B, Lucian L,
To W, Kwan S, Churakova T, Zurawski S, Wiekowski M, Lira SA,
Gorman D, Kastelein RA, Sedgwick JD. Interleukin-23 rather than
interleukin-12 is the critical cytokine for autoimmune inflammation
of the brain. Nature. 2003; 421(6924): 744-748.
D'Andrea A, Aste-Amezaga M, Valiante NM, Ma X, Kubin M, Trinchieri
G. Interleukin 10 (IL-10) inhibits human lymphocyte interferon
gamma-production by suppressing natural killer cell stimulatory
factor/IL-12 synthesis in accessory cells. The Journal of
Experimental Medicine. 1993; 178(3): 1041-1048.
Dal Canto MC, Lipton HL. Multiple sclerosis. Animal model: Theiler's
virus infection in mice. The American Journal of Pathology. 1977;
88(2): 497-500.
Dalla Libera D, Di Mitri D, Bergami A, Centonze D, Gasperini C, Grasso
MG, Galgani S, Martinelli V, Comi G, Avolio C, Martino G,
Borsellino G, Sallusto F, Battistini L, Furlan R. T regulatory cells
are markers of disease activity in multiple sclerosis patients. PLoS
One. 2011; 6(6): e21386.
de la Monte SM, Ropper AH, Dickersin GR, Harris NL, Ferry JA,
Richardson EP Jr. Relapsing central and peripheral demyelinating
diseases. Unusual pathologic features. Archives Neurology. 1986;
43(6): 626-629.

REFERENCES
211
Deber CM, Reynolds SJ. Central nervous system myelin: structure,
function, and pathology. Clinical Biochemistry. 1991; 24(2): 113-
134.
Démoulins T, Gachelin G, Bequet D, Dormont D. A biased Valpha24+ T-
cell repertoire leads to circulating NKT-cell defects in a multiple
sclerosis patient at the onset of his disease. Immunology Letters.
2003; 90(2-3): 223-228.
Deng C, Radu C, Diab A, Tsen MF, Hussain R, Cowdery JS, Racke MK,
ThomasJA. IL-1 Receptor-Associated Kinase 1 Regulates
Susceptibility to Organ-Specific Autoimmunity. Journal of
Immunology. 2003; 170(6): 2833-2842.
Djelilovic-Vranic J, Alajbegovic A. Role of early viral infections in
development of multiple sclerosis. Medisinski Arhiv. 2012; 66(3 s1):
37-40.
Du X, Poltorak A, Wei Y, Beutler B. Three novel mammalian toll-like
receptors: gene structure, expression, and evolution. European
Cytokine Network. 2000; 11(3): 362-71.
Duquette P, Pleines J, Girard M, Charest L, Senecal-Quevillon M, Masse C.
The increased susceptibility of women to multiple sclerosis. The
Canadian Journal of Neurological Sciences. 1992; 19: 466-471.
Ebers GC, Sadovnick AD, Risch NJ. A genetic basis for familial

REFERENCES
212
aggregation in multiple sclerosis. Canadian Collaborative Study
Group. Nature. 1995; 377(6545): 150-151.
Ebers GC, Sadovnick AD. The geographic distribution of multiple sclerosis:
a review. Neuroepidemiology. 1993; 12(1): 1-5.
Elian M, Nightingale S, Dean G. Multiple sclerosis among United
Kingdom-born children of immigrants from the Indian subcontinent,
Africa and the West Indies. Journal of Neurology, Neurosurgery
and, Psychiatry. 1990; 53(10): 906-911.
Enevold C, Oturai AB, Sørensen PS, Ryder LP, Koch-Henriksen N,
Bendtzen K. Polymorphisms of innate pattern recognition receptors,
response to interferon-beta and development of neutralizing
antibodies in multiple sclerosis patients. Multiple Sclerosis. 2010;
16(8): 942-949.
Erridge C, Attina T, Spickett CM, Webb DJ. A high-fat meal induces low-
grade endotoxemia: evidence of a novel mechanism of postprandial
inflammation. The American Journal of Clinical Nutrition. 2007;
86(5): 1286-1292.
Erridge C. Endogenous ligands of TLR2 and TLR4: agonists or assistants?
Journal of Leukocyte Biology. 2010; 87(6): 989-999.
Esiri MM. Multiple sclerosis: a quantitative and qualitative study of
immunoglobulin-containing cells in the central nervous system.

REFERENCES
213
Neuropathology and Applied Neurobiology. 1980; 6(1): 9-21.
Esteban LM, Tsoutsman T, Jordan MA, Roach D, Poulton LD, Brooks A,
Naidenko OV, Sidobre S, Godfrey DI, Baxter AG. Genetic control
of NKT cell numbers maps to major diabetes and lupus loci. Journal
of Immunology. 2003; 171(6): 2873-2878.
Eugster HP, Frei K, Kopf M, Lassmann H, Fontana A. IL-6-deficient mice
resist myelin oligodendrocyte glycoprotein-induced autoimmune
encephalomyelitis. Europen Journal of Immunology. 1998; 28(7):
2178-2187.
Fang C, Zhang X, Miwa T, Song WC. Complement promotes the
development of inflammatory T-helper 17 cells through synergistic
interaction with Toll-like receptor signalling and interleukin-6
production. Blood. 2009; 114(5): 1005-10015.
Farez MF, Quintana FJ, Gandhi R, Izquierdo G, Lucas M, Weiner HL. Toll-
like receptor 2 and poly(ADP-ribose) polymerase 1 promote central
nervous system neuroinflammation in progressive EAE. Nature
Immunology. 2009; 10(9): 958-964. Erratum in: Natute Immunology.
2010; 11(1): 97.
Farina C, Krumbholz M, Giese T, Hartmann G, Aloisi F, Meinl E.
Preferential expression and function of Toll-like receptor 3 in human
astrocytes. Journal of Neuroimmunology. 2005; 159(1-2): 12-19.

REFERENCES
214
Fernald GH, Knott S, Pachner A, Caillier SJ, Narayan K, Oksenberg JR,
Mousavi P, Baranzini SE. Genome-wide network analysis reveals
the global properties of IFN-beta immediate transcriptional effects in
humans. Journal of Immunology. 2007; 178(8): 5076-5085.
Ferwerda G, Girardin SE, Kullberg BJ, Le Bourhis L, de Jong DJ,
Langenberg DM, van Crevel R, Adema GJ, Ottenhoff TH, Van der
Meer JW, Netea MG. NOD2 and toll-like receptors are
nonredundant recognition systems of Mycobacterium tuberculosis.
PLoS Pathogens. 2005; 1(3): 279-285.
Fitzgerald DC, Zhang GX, El-Behi M, Fonseca-Kelly Z, Li H, Yu S, Saris
CJ, Gran B, Ciric B, Rostami A. Suppression of autoimmune
inflammation of the central nervous system by interleukin 10
secreted by interleukin 27-stimulated T cells. Nature Immunology.
2007; 8(12): 1372-1379.
Flachenecker P. Epidemiology of neuroimmunological diseases. Journal of
Neurology. 2006; 253 (s5):V2-8. Review. Erratum in: Journal of
Neurology 2008; 255(2): 308.
Fletcher JM, Jordan MA, Snelgrove SL, Slattery RM, Dufour FD,
Kyparissoudis K, Besra GS, Godfrey DI, Baxter AG. Congenic
Analysis of the NKT Cell Control Gene Nkt2 Implicates the
Peroxisomal Protein Pxmp4. Journal of Immunology. 2008; 181(5):
3400-3412.

REFERENCES
215
Fowlkes BJ, Kruisbeek AM, Ton-That H, Weston MA, Coligan JE,
Schwartz RH, Pardoll DM. A novel population of T-cell receptor
alpha beta-bearing thymocytes which predominantly expresses a
single V beta gene family. Nature. 1987; 329(6136): 251-254.
Fransson M, Burman J, Lindqvist C, Atterby C, Fagius J, Loskog A. T
regulatory cells lacking CD25 are increased in MS during relapse.
Autoimmunity. 2010; 43(8): 590-597.
Frisullo G, Nociti V, Iorio R, Patanella AK, Marti A, Caggiula M, Mirabella
M, Tonali PA, Batocchi AP. IL17 and IFNgamma production by
peripheral blood mononuclear cells from clinically isolated
syndrome to secondary progressive multiple sclerosis. Cytokine.
2008; 44(1): 22-25.
Fritz RB, Zhao ML. Regulation of experimental autoimmune
encephalomyelitis in the C57BL/6J mouse by NK1.1+, DX5+, alpha
beta+ T cells. Journal of Immunology. 2001; 166(6): 4209-4215.
Fujita M, Otsuka T, Mizuno M, Tomi C, Yamamura T, Miyake S.
Carcinoembryonic antigen-related cell adhesion molecule 1
modulates experimental autoimmune encephalomyelitis via an iNKT
cell-dependent mechanism. The American Journal of Pathology.
2009; 175(3): 1116-1123.
Fung I, Garrett JP, Shahane A, Kwan M. Do bugs control our fate? The

REFERENCES
216
influence of the microbiome on autoimmunity. Current Allergy and
Asthma Reports. 2012; 12(6): 511-519.
Furlan R, Bergami A, Cantarella D, Brambilla E, Taniguchi M, Dellabona
P, Casorati G, Martino G. Activation of invariant NKT cells by
alphaGalCer administration protects mice from MOG35-55-induced
EAE: critical roles for administration route and IFN-gamma.
European Journal of Immunology. 2003; 33(7):1830-1838.
Furlan R, Cuomo C, Martino G. Animal models of multiple sclerosis.
Methods in Molecular Biology. 2009; 549: 157-173.
Furtado GC, Marcondes MC, Latkowski JA, Tsai J, Wensky A, Lafaille JJ.
Swift entry of myelin-specific T lymphocytes into the central
nervous system in spontaneous autoimmune encephalomyelitis.
Journal of Immunology. 2008; 181(7): 4648-4655.
Geier DA, Geier MR. A case-control study of serious autoimmune adverse
events following hepatitis B immunization. Autoimmunity. 2005;
38(4): 295-301.
Gigli G, Caielli S, Cutuli D, Falcone M. Innate immunity modulates
autoimmunity: type 1 interferon-beta treatment in multiple sclerosis
promotes growth and function of regulatory invariant natural killer T
cells through dendritic cell maturation. Immunology. 2007; 122(3):
409-417.

REFERENCES
217
Gijbels K, Van Damme J, Proost P, Put W, Carton H, Billiau A. Interleukin
6 production in the central nervous system during experimental
autoimmune encephalomyelitis. European Journal of Immunology.
1990; 20(1): 233-235.
Giordano M, D'Alfonso S, Momigliano-Richiardi P. Genetics of multiple
sclerosis: linkage and association studies. American Journal of
Pharmacogenomics. 2002; 2(1): 37-58.
Godfrey DI, Hammond KJ, Poulton LD, Smyth MJ, Baxter AG. NKT cells:
facts, functions and fallacies. Immunology Today. 2000; 21(11):
573-583.
Godfrey DI, Kronenberg M. Going both ways: Immune regulation via
CD1d-dependent NKT cells. Journal of Clinical Investigation. 2004;
114: 1379-1388.
Govindaraj RG, Manavalan B, Lee G, Choi S. Molecular modeling-based
evaluation of hTLR10 and identification of potential ligands in Toll-
like receptor signalling. PLoS One. 2010; 5(9): e12713.
Gregersen PK. Discordance for autoimmunity in monozygotic twins. Are
"identical" twins really identical? Arthritis Rheumatism. 1993; 36(9):
1185-1192.
Grzesiuk AK. Epidemiological profile in multiple sclerosis patients,
Uberaba, MG, Brazil. Arquivos Neuropsiquiatria. 2011; 69(5): 852.

REFERENCES
218
Gumperz, J. E., S. Miyake, T. Yamamura, M. B. Brenner. Functionally
distinct subsets of CD1d-restricted natural killer T cells revealed by
CD1d tetramer staining. The Journal of Experimental Medicine.
2002; 195: 625–636.
Guo B, Chang EY, Cheng G. The type I IFN induction pathway constrains
Th17-mediated autoimmune inflammation in mice. The Journal of
Clinical Investigation. 2008; 118(5): 1680-1690.
Gutcher I, Urich E, Wolter K, Prinz M, Becher B. Interleukin 18-
independent engagement of interleukin 18 receptor-alpha is required
for autoimmune inflammation. Nature Immunology. 2006; 7(9):
946-953.
Hafler DA, Slavik JM, Anderson DE, O'Connor KC, De Jager P, Baecher-
Allan C. Multiple sclerosis. Immunological Reviews. 2005; 204:
208-31.
Haines JL, Terwedow HA , Burgess K , Pericak-Vance MA , Rimmler JB ,
Martin ER, Oksenberg JR, Lincoln R, Zhang DY, Banatao DR ,
Gatto N, Goodkin DE, Hauser SL. Linkage of the MHC to familial
multiple sclerosis suggests genetic heterogeneity. The Multiple
Sclerosis Genetics Group. Human Molecular Genetics. 1998; 7:
1229-1234.
Hammann KP, Hopf HC. Monocytes constitute the only peripheral blood

REFERENCES
219
cell population showing an increased burst activity in multiple
sclerosis patients. International Archives of Allergy Applied
Immunology. 1986; 81(3): 230-234.
Hammond KJ, Godfrey DI. NKT cells: potential targets for autoimmune
disease therapy? Tissue Antigens. 2002; 59(5): 353-363.
Hansen BS, Hussain RZ, Lovett-Racke AE, Thomas JA, Racke MK.
Multiple toll-like receptor agonists act as potent adjuvants in the
induction of autoimmunity. Journal of Neuroimmunology. 2006;
172(1-2): 94-103.
Hansen T, Skytthe A, Stenager E, Petersen HC, Kyvik KO, Brønnum-
Hansen H. Risk for multiple sclerosis in dizygotic and monozygotic
twins. Multiple Sclerosis. 2005; 11(5): 500-503.
Harbo HF, Lie BA, Sawcer S, Celius EG, Dai KZ, Oturai A, Hillert J,
Lorentzen AR, Laaksonen M, Myhr KM, Ryder LP, Fredrikson S,
Nyland H, Sørensen PS, Sandberg-Wollheim M, Andersen O,
Svejgaard A, Edland A, Mellgren SI, Compston A, Vartdal F,
Spurkland A. Genes in the HLA class I region may contribute to the
HLA class II-associated genetic susceptibility to multiple sclerosis.
Tissue Antigens. 2004; 63(3): 237-247.
Harrer A, Pilz G, Einhaeupl M, Oppermann K, Hitzl W, Wipfler P, Sellner
J, Golaszewski S, Afazel S, Haschke-Becher E, Trinka E, Kraus J.
REFERENCES
220
Lymphocyte subsets show different response patterns to in vivo
bound natalizumab-A flow cytometric study on patients with
multiple sclerosis. PLoS One. 2012; 7(2): e31784.
Harrer A, Wipfler P, Einhaeupl M, Pilz G, Oppermann K, Hitzl W, Afazel
S, Haschke-Becher E, Strasser P, Trinka E, Kraus J. Natalizumab
therapy decreases surface expression of both VLA-heterodimer
subunits on peripheral blood mononuclear cells. Journal of
Neuroimmunology. 2011; 234(1-2): 148-154.
Harrington LE, Hatton RD, Mangan PR, Turner H, Murphy TL, Murphy
KM, Weaver CT. Interleukin 17-producing CD4+ effector T cells
develop via a lineage distinct from the T helper type 1 and 2
lineages. Nature Immunology. 2005; 6(11): 1123-1132.
Hasan U, Chaffois C, Gaillard C, Saulnier V, Merck E, Tancredi S, Guiet C,
Brière F, Vlach J, Lebecque S, Trinchieri G, Bates EE. Human
TLR10 is a functional receptor, expressed by B cells and
plasmacytoid dendritic cells, which activates gene transcription
through MyD88. Journal of Immunology. 2005; 174(5): 2942-2950.
Hayashi T, Gray CS, Chan M, Tawatao RI, Ronacher L, McGargill MA,
Datta SK, Carson DA, Corr M. Prevention of autoimmune disease
by induction of tolerance to Toll-like receptor 7. Proceedings of the
National Academy of Sicences of the United States of America.
2009; 106(8): 2764-2769.

REFERENCES
221
Hecker M, Paap BK, Goertsches RH, Kandulski O, Fatum C, Koczan D,
Hartung HP, Thiesen HJ, Zettl UK. Reassessment of blood gene
expression markers for the prognosis of relapsing-remitting multiple
sclerosis. PLoS One. 2011; 6(12): e29648.
Hemmi H, Takeuchi O, Kawai T, Kaisho T, Sato S, Sanjo H, Matsumoto M,
Hoshino K, Wagner H, Takeda K. A Toll-like receptor recognizes
bacterial DNA. Nature. 2000; 408(6813): 740-745.
Hemminki K, Li X, Sundquist J, Hillert J, Sundquist K. Risk for multiple
sclerosis in relatives and spouses of patients diagnosed with
autoimmune and related conditions. Neurogenetics. 2009; 10(1): 5-
11.
Hempel K, Freitag A, Freitag B, Endres B, Mai B, Liebaldt G.
Unresponsiveness to experimental allergic encephalomyelitis in
Lewis rats pretreated with complete Freund's adjuvant. International
Archieves of Allergy and Applied Immunology. 1985; 76(3): 193-
199.
Herrmann I, Kellert M, Schmidt H, Mildner A, Hanisch UK, Brück W,
Prinz M, Nau R. Streptococcus pneumoniae Infection aggravates
experimental autoimmune encephalomyelitis via Toll-like receptor
2. Infection and Immunity. 2006; 74(8): 4841-4848.
Hilliard B, Samoilova EB, Liu TS, Rostami A, Chen Y. Experimental

REFERENCES
222
autoimmune encephalomyelitis in NF-kappa B-deficient mice: roles
of NF-kappa B in the activation and differentiation of autoreactive T
cells. Journal of Immunology. 1999; 163(5): 2937-29343.
Hirota K, Duarte JH, Veldhoen M, Hornsby E, Li Y, Cua DJ, Ahlfors H,
Wilhelm C, Tolaini M, Menzel U, Garefalaki A, Potocnik AJ,
Stockinger B. Fate mapping of IL-17-producing T cells in
inflammatory responses. Nature Immunology. 2011; 12(3): 255-263.
Hirotani M, Niino M, Fukazawa T, Kikuchi S, Yabe I, Hamada S, Tajima
Y, Sasaki H. Decreased IL-10 production mediated by Toll-like
receptor 9 in B cells in multiple sclerosis. Journal of
Neuroimmunology. 2010; 221(1-2): 95-100.
Hofstetter HH, Ibrahim SM, Koczan D, Kruse N, Weishaupt A, Toyka KV,
Gold R. Therapeutic efficacy of IL-17 neutralization in murine
experimental autoimmune encephalomyelitis. Cellular Immunology.
2005; 237(2): 123-130.
Hofstetter HH, Shive CL, Forsthuber TG. Pertussis Toxin Modulates the
Immune Response to Neuroantigens Injected in Incomplete Freund's
Adjuvant: Induction of Th1 Cells and Experimental Autoimmune
Encephalomyelitis in the Presence of High Frequencies of Th2 Cells.
Journal of Immunology. 2002; 169(1): 117-125.
Holmøy T. Immunopathogenesis of multiple sclerosis: concepts and

REFERENCES
223
controversies. Acta Neurologica Scandinavica. 2007; 115 (s187),
39–45.
Hoshino K, Takeuchi O, Kawai T, Sanjo H, Ogawa T, Takeda Y, Takeda K,
Akira S. Cutting edge: Toll-like receptor 4 (TLR4)-deficient mice
are hyporesponsive to lipopolysaccharide: evidence for TLR4 as the
Lps gene product. Journal of Immunology. 1999; 162(7): 3749-3752.
Hsueh CJ, Kao HW, Chen SY, Lo CP, Hsu CC, Liu DW, Hsu WL.
Comparison of the 2010 and 2005 versions of the McDonald MRI
criteria for dissemination-in-time in Taiwanese patients with classic
multiple sclerosis. Journal of Neurological Sciences. 2013; 329(1-
2): 51-54.
Hu X, Paik PK, Chen J, Yarilina A, Kockeritz L, Lu TT, Woodgett JR,
Ivashkiv LB. IFN-gamma suppresses IL-10 production and
synergizes with TLR2 by regulating GSK3 and CREB/AP-1
proteins. Immunity. 2006; 24(5): 563-574.
Humason GH. Animal Tissue Techniques. W.H. Freeman & Company, San
Franscisco. 1972; p. 238-239.
Hundeshagen A, Hecker M, Paap BK, Angerstein C, Kandulski O, Fatum C,
Hartmann C, Koczan D, Thiesen HJ, Zettl UK. Elevated type I
interferon-like activity in a subset of multiple sclerosis patients:
molecular basis and clinical relevance. Journal of

REFERENCES
224
Neuroinflammation. 2012; 9: 140.
Ichikawa HT, Williams LP, Segal BM. Activation of APCs through CD40
or Toll-like receptor 9 overcomes tolerance and precipitates
autoimmune disease. Journal of Immunology. 2002; 169(5): 2781-
2787.
Ichiyama K, Yoshida H, Wakabayashi Y, Chinen T, Saeki K, Nakaya M,
Takaesu G, Hori S, Yoshimura A, Kobayashi T. Foxp3 inhibits
RORgammat-mediated IL-17A mRNA transcription through direct
interaction with RORgammat. The Journal of Biological Chemistry.
2008; 283(25): 17003-17008.
Illés Z, Kondo T, Newcombe J, Oka N, Tabira T, Yamamura T. Differential
expression of NK T cell V alpha 24J alpha Q invariant TCR chain in
the lesions of multiple sclerosis and chronic inflammatory
demyelinating polyneuropathy. Journal of Immunology. 2000;
164(8): 4375-4381.
Ivanov II, Frutos Rde L, Manel N, Yoshinaga K, Rifkin DB, Sartor RB,
Finlay BB, Littman DR. Specific microbiota direct the
differentiation of IL-17-producing T-helper cells in the mucosa of
the small intestine. Cell Host & Microbe. 2008; 4(4): 337-349.
Jack CS, Arbour N, Manusow J, Montgrain V, Blain M, McCrea E, Shapiro
A, Antel JP. TLR signalling tailors innate immune responses in

REFERENCES
225
human microglia and astrocytes. Journal of Immunology. 2005;
175(7): 4320-4330.
Jahng A, Maricic I, Aguilera C, Cardell S, Halder RC, Kumar V. Prevention
of autoimmunity by targeting a distinct, noninvariant CD1d-reactive
T cell population reactive to sulfatide. The Journal of Experimental
Medicine. 2004 199(7): 947-957.
Jahng AW, Maricic I, Pedersen B, Burdin N, Naidenko O, Kronenberg M,
Koezuka Y, Kumar V. Activation of natural killer T cells potentiates
or prevents experimental autoimmune encephalomyelitis. The
Journal of Experimental Medicine. 2001; 194(12): 1789-1799.
Janssen WJ, Henson PM. Cellular Regulation of the Inflammatory
Response. Toxicologic Pathology. 2012; 40(2): 166-173.
Jaskiewicz E. Epitopes on myelin proteins recognized by autoantibodies
present in multiple sclerosis patients. Postepy Higieny Medycyny
Doswiadczalnej. 2004; 58: 472-482.
Jewtoukoff V, Amzazi S, Lebar R, Bach MA, Marche PN. T-cell receptor
identification of an oligodendrocyte-specific autoreactive cytotoxic
T-cell clone without self restriction. Scandinavian Journal of
Immunology. 1992, 36(6): 893-898.
Jiang S, Game DS, Davies D, Lombardi G, Lechler RI. Activated CD1d-
restricted natural killer T cells secrete IL-2: innate help for

REFERENCES
226
CD4+CD25+ regulatory T cells? European Journal of Immunology.
2005; 35(4): 1193-1200.
Jin J, Samuvel DJ, Zhang X, Li Y, Lu Z, Lopes-Virella MF, Huang Y.
Coactivation of TLR4 and TLR2/6 coordinates an additive
augmentation on IL-6 gene transcription via p38MAPK pathway in
U937 mononuclear cells. Molecular Immunology. 2011; 49(3): 423-
432.
Jones BW, Means TK, Heldwein KA, Keen MA, Hill PJ, Belisle JT, Fenton
MJ. Different Toll-like receptor agonists induce distinct macrophage
responses. Journal of Leukocyte Biology. 2001; 69(6): 1036-1044.
Jordan MA, Fletcher JM, Pellicci D, Baxter AG. Slamf1, the NKT cell
control gene Nkt1. Journal of Immunology. 2007; 178(3): 1618-
1627.
Jordan MA, Poulton LD, Fletcher JM, Baxter AG. Allelic variation of Ets1
does not contribute to NK and NKT cell deficiencies in type 1
diabetes susceptible NOD mice. The Review of Diabetic Studies.
2009; 6(2): 104-116.
Jordan MA, Poulton LD, Fletcher JM, Baxter AG. Allelic variation of Ets1
does not contribute to NK and NKT cell deficiencies in type 1
diabetes susceptible NOD mice. The Review of Diabetic Studies.
2009; 6(2): 104-116.

REFERENCES
227
Kachapati K, Adams D, Bednar K, Ridgway WM. The non-obese diabetic
(NOD) mouse as a model of human type 1 diabetes. Methods in
Molecular Biology. 2012; 933: 3-16.
Kaisho T, Akira S. Toll-like receptor function and signalling. Journal of
Allergy and Clinical Immunology. 2006; 117 (5): 979-987.
Kallaur AP, Oliveira SR, Colado Simão AN, Delicato de Almeida ER,
Kaminami Morimoto H, Lopes J, de Carvalho Jennings Pereira WL,
Marques Andrade R, Muliterno Pelegrino L, Donizete Borelli S,
Kaimen-Maciel DR, Vissoci Reiche EM. Cytokine profile in
relapsing�remitting multiple sclerosis patients and the association
between progression and activity of the disease. Molecular Medicine
Reports. 2013; 7(3): 1010-1020.
Karlsson J, Zhao X, Lonskaya I, Neptin M, Holmdahl R, Andersson A.
Novel Quantitative Trait Loci Controlling Development of
Experimental Autoimmune Encephalomyelitis and Proportion of
Lymphocyte Subpopulations. The Journal of Immunology. 2003;
170: 1019-1026.
Kastrukoff LF, Morgan NG, Zecchini D, White R, Petkau AJ, Satoh J, Paty
DW. A role for natural killer cells in the immunopathogenesis of
multiple sclerosis. Journal of Neuroimmunology. 1998; 86(2): 123-
133.

REFERENCES
228
Kattah MG, Wong MT, Yocum MD, Utz PJ. Cytokines secreted in response
to Toll-like receptor ligand stimulation modulate differentiation of
human Th17 cells. Arthritis Rheumatism. 2008; 58(6): 1619-1629.
Kawai T, Akira S. TLR signalling. Seminars in Immunology. 2007; 19(1):
24-32.
Kemppinen A, Sawcer S, Compston A. Genome-wide association studies in
multiple sclerosis: lessons and future prospects. Briefings in
Functional Genomics. 2011; 10(2): 61-70.
Kerfoot SM, Long EM, Hickey MJ, Andonegui G, Lapointe BM, Zanardo
RCO, Bonder C, James WG, Robbins SM, Kubes P. TLR4
Contributes to Disease-Inducing Mechanisms Resulting in Central
Nervous System Autoimmune Disease. Journal of Immunology.
2004; 173(11): 7070-7077.
Kinjo Y, Wu D, Kim G, Xing GW, Poles MA, Ho DD, Tsuji M, Kawahara
K, Wong CH, Kronenberg M. Recognition of bacterial
glycosphingolipids by natural killer T cells. Nature. 2005;
434(7032): 520-525.
Kipp M, Clarner T, Dang J, Copray S, Beyer C. The cuprizone animal
model: new insights into an old story. Acta Neuropathologica. 2009;
118(6): 723-736.
Komiyama Y, Nakae S, Matsuki T, Nambu A, Ishigame H, Kakuta S, Sudo

REFERENCES
229
K, Iwakura Y. IL-17 plays an important role in the development of
experimental autoimmune encephalomyelitis. Journal of
Immunology. 2006; 177(1): 566–573.
Kouwenhoven M, Ozenci V, Gomes A, Yarilin D, Giedraitis V, Press R,
Link H. Multiple sclerosis: elevated expression of matrix
metalloproteinases in blood monocytes. Journal of Autoimmunity.
2001; 16(4): 463-470.
Krause I, Tomer Y, Elias D, Blank M, Gilburd B, Cohen IR, Shoenfeld Y.
Inhibition of diabetes in NOD mice by idiotypic induction of SLE.
Journal of Autoimmunity. 1999; 13(1): 49-55.
Kroner A, Vogel F, Kolb-Mäurer A, Kruse N, Toyka KV, Hemmer B,
Rieckmann P, Mäurer M. Impact of the Asp299Gly polymorphism
in the toll-like receptor 4 (tlr-4) gene on disease course of multiple
sclerosis. Journal of Neuroimmunology. 2005; 165(1-2): 161-165.
Kuchroo VK, Martin CA, Greer JM, Ju ST, Sobel RA, Dorf ME. Cytokines
and adhesion molecules contribute to the ability of myelin
proteolipid protein-specific T cell clones to mediate experimental
allergic encephalomyelitis. Journal of Immunology. 1993; 151(8):
4371-4382.
Kumar H, Kawai T, Akira S. Toll-like receptors and innate immunity.
Biochemical and Biophysical Research Communications. 2009;

REFERENCES
230
388(4): 621-625.
Kurebayashi Y, Nagai S, Ikejiri A, Koyasu S. Recent advances in
understanding the molecular mechanisms of the development and
function of Th17 cells. Genes to Cells. 2013; 4: 247-265.
Kürtüncü M, Tüzün E, Türkoğlu R, Petek-Balcı B, Içöz S, Pehlivan M,
Birişik Ö, Ulusoy C, Shugaiv E, Akman-Demir G, Eraksoy M.
Effect of short-term interferon-β treatment on cytokines in multiple
sclerosis: significant modulation of IL-17 and IL-23. Cytokine. 2012;
59(2): 400-4002.
Lafon M, Megret F, Lafage M, Prehaud C. The innate immune facet of
brain: human neurons express TLR-3 and sense viral dsRNA.
Journal of Molecular Neurosciences. 2006, 29(3): 185-194.
Lalor SJ, Dungan LS, Sutton CE, Basdeo SA, Fletcher JM, Mills KH.
Caspase-1-processed cytokines IL-1beta and IL-18 promote IL-17
production by gammadelta and CD4 T cells that mediate
autoimmunity. Journal of Immunology. 2011; 186(10): 5738-5748.
Lampropoulou V, Hoehlig K, Roch T, Neves P, Calderon Gomez E,
Sweenie CH, Hao Y, Freitas AA, Steinhoff U, Anderton SM,
Fillatreau S. TLR-Activated B Cells Suppress T Cell-Mediated
Autoimmunity. Journal of Immunology. 2008; 180(7): 4763-4773.
Lassmann H, Brück W, Lucchinetti C. Heterogeneity of multiple sclerosis

REFERENCES
231
pathogenesis: implications for diagnosis and therapy. Trends in
Molecular Medicine. 2001; 7(3): 115-121.
Lau AW, Biester S, Cornall RJ, Forrester JV. Lipopolysaccharide-activated
IL-10-secreting dendritic cells suppress experimental autoimmune
uveoretinitis by MHCII-dependent activation of CD62L-expressing
regulatory T cells. Journal of Immunology. 2008; 180(6): 3889-
3899.
Lee K, Hwang S, Paik DJ, Kim WK, Kim JM, Youn J. Bacillus-derived
poly-γ-glutamic acid reciprocally regulates the differentiation of T
helper 17 and regulatory T cells and attenuates experimental
autoimmune encephalomyelitis. Clinical and Experimental
Immunology. 2012; 170(1): 66-76.
Lee YK, Menezes JS, Umesaki Y, Mazmanian SK. Proinflammatory T-cell
responses to gut microbiota promote experimental autoimmune
encephalomyelitis. Procceding of the National Academy of Science
of the United States of America. 2011; 108, s1: 4615-4622.
Lee, P. T., K. Benlagha, L. Teyton, A. Bendelac. Distinct functional
lineages of human V(alpha)24 natural killer T cells. Journal of
Experimental Medicine. 2002; 195(5): 637–641.
Lees JR, Golumbek PT, Sim J, Dorsey D, Russell JH. Regional CNS
responses to IFN-gamma determine lesion localization patterns

REFERENCES
232
during EAE pathogenesis. Journal of Experimental Medicine. 2008;
205(11): 2633-2642.
Li W, Minohara M, Su JJ, Matsuoka T, Osoegawa M, Ishizu T, Kira J.
Helicobacter pylori infection is a potential protective factor against
conventional multiple sclerosis in the Japanese population. Journal
of neuroimmunology. 2007; 184(1-2): 227-231.
Lincoln MR, Ramagopalan SV, Chao MJ, Herrera BM, Deluca GC, Orton
SM, Dyment DA, Sadovnick AD, Ebers GC. Epistasis among HLA-
DRB1, HLA-DQA1, and HLA-DQB1 loci determines multiple
sclerosis susceptibility. Proceeding of National Academy of Sciences
of the United States of America. 2009; 106(18): 7542-7547.
Lindberg M. [Use of NSAIDs in rheumatoid arthritis should be limited].
Ugeskr Laeger. 2013;175(15): 1039-1041.
Lindsey JW. Immunogenetics. Characteristics of initial and reinduced
experimental autoimmune encephalomyelitis. Immunogenetics.
1996; 44(4): 292-297.
Link J, Söderström M, Olsson T, Höjeberg B, Ljungdahl A, Link H.
Increased transforming growth factor-beta, interleukin-4, and
interferon-gamma in multiple sclerosis. Annals of Neurology. 1994;
36(3): 379-386.
Linthicum DS, Munoz JJ, Blaskett A. Acute experimental autoimmune

REFERENCES
233
encephalomyelitis in mice. I. Adjuvant action of Bordetella pertussis
is due to vasoactive amine sensitization and increased vascular
permeability of the central nervous system. Cellular Immunology.
1982; 73(2): 299-310.
Liu Y, Teige A, Mondoc E, Ibrahim S, Holmdahl R, Issazadeh-Navikas S.
Endogenous collagen peptide activation of CD1d-restricted NKT
cells ameliorates tissue-specific inflammation in mice. The Journal
of Clinical Investigation. 2011; 121(1): 249-264.
Liu YJ. IPC: professional type 1 interferon-producing cells and
plasmacytoid dendritic cell precursors. Annual Reviews of
Immunology. 2005; 23: 275-306.
Lock C, Hermans G, Pedotti R, Brendolan A, Schadt E, Garren H, Langer-
Gould A, Strober S, Cannella B, Allard J, Klonowski P, Austin A,
Lad N, Kaminski N, Galli SJ, Oksenberg JR, Raine CS, Heller R,
Steinman L. Gene-microarray analysis of multiple sclerosis lesions
yields new targets validated in autoimmune encephalomyelitis.
Nature Medicine. 2002; 8(5): 500-508.
Lünemann A, Tackenberg B, DeAngelis T, da Silva RB, Messmer B,
Vanoaica LD, Miller A, Apatoff B, Lublin FD, Lünemann JD, Münz
C. Impaired IFN-γ production and proliferation of NK cells in
multiple sclerosis. International Immunology. 2011; 23(2): 139-148.

REFERENCES
234
MacDonald HR. Development and selection of NKT cells. Current Opinion
in Immunology. 2002; 14(2): 250-254.
Macdonald HR. NKT cells: In the beginning... European Journal of
Immunology. 2007; 37, s1: S111-S115.
Maddur MS, Miossec P, Kaveri SV, Bayry J. Th17 cells: biology,
pathogenesis of autoimmune and inflammatory diseases, and
therapeutic strategies. The American Journal of Pathology. 2012;
181(1): 8-18.
Makino S, Kunimoto K, Muraoka Y, Mizushima Y, Katagiri K, Tochino Y.
Breeding of a non-obese, diabetic strain of mice. Jikken Dobutsu.
1980; 29 (1): 1-13.
Marrie RA, Yu N, Blanchard J, Leung S, Elliott L. The rising prevalence
and changing age distribution of multiple sclerosis in Manitoba.
Neurology. 2010; 74(6): 465-471. Erratum in: Neurology. 2011;
77(11): 1105.
Mars LT, Gautron AS, Novak J, Beaudoin L, Diana J, Liblau RS, Lehuen A.
Invariant NKT cells regulate experimental autoimmune
encephalomyelitis and infiltrate the central nervous system in a
CD1d-independent manner. Journal of Immunology. 2008; 181(4):
2321-2329.
Mars LT, Laloux V, Goude K, Desbois S, Saoudi A, Van Kaer L, Lassmann

REFERENCES
235
H, Herbelin A, Lehuen A, Liblau RS. Cutting edge: V alpha 14-J
alpha 281 NKT cells naturally regulate experimental autoimmune
encephalomyelitis in nonobese diabetic mice. Journal of
Immunology. 2002; 168(12): 6007-6011.
Marta M, Anderson A, Isaksson M, Kampe O, Lobell A. Unexpected
regulatory roles of TLR4 and TLR9 in experimental autoimmune
encephalomyelitis. European Journal of Immunology. 2008; 38(2):
565-575.
Matsumoto C, Oda T, Yokoyama S, Tominari T, Hirata M, Miyaura C,
Inada M. Toll-like receptor 2 heterodimers, TLR2/6 and TLR2/1
induce prostaglandin E production by osteoblasts, osteoclast
formation and inflammatory periodontitis. Biochemical and
Biophysical Research Communications. 2012; 428(1): 110-115.
Matusevicius D, Kivisäkk P, He B, Kostulas N, Ozenci V, Fredrikson S,
Link H. Interleukin-17 mRNA expression in blood and CSF
mononuclear cells is augmented in multiple sclerosis. Multiple
Sclerosis. 1999; 5(2): 101-104.
Mayo S, Quinn A. Altered susceptibility to EAE in congenic NOD mice:
Altered processing of the encephalitogenic MOG35-55 peptide by
NOR/LtJ mice. Clinical Immunology. 2007; 122(1): 91-100.
McClelland EE, Smith JM. Gender specific differences in the immune

REFERENCES
236
response to infection. Archivum Immunologiae et Therapiae
Experimentalis (Warsz). 2011; 59(3): 203-213.
McCurdy JD, Lin TJ, Marshall JS. Toll-like receptor 4-mediated activation
of murine mast cells. Journal of Leukocyte Biology. 2001; 70(6):
977-984.
McGonagle D, McDermott MF. A Proposed Classification of the
Immunological Diseases. PLoS Medicine. 2006; 3(8): e297.
McLeod JG, Hammond SR, Kurtzke JF. Migration and multiple sclerosis in
immigrants to Australia from United Kingdom and Ireland: a
reassessment. I. Risk of MS by age at immigration. Journal of
Neurology. 2011; 258(6): 1140-1149.
McLeod JG, Hammond SR, Kurtzke JF. Migration and multiple sclerosis in
United Kingdom and Ireland immigrants to Australia: a
reassessment. II. Characteristics of early (pre-1947) compared to
later migrants. Journal of Neurology. 2012; 259(4): 684-693.
Means TK, Wang S, Lien E, Yoshimura A, Golenbock DT, Fenton MJ.
Journal of Immunology. 1999; 163(7): 3920-3927.
Melcon M, Melcon C, Bartoloni L, Cristiano E, Duran J, Grzesiuk A,
Fragoso Y, Brooks JB, Díaz V, Romero García K, Cabrera Gomez J,
Abad P, Islas MM, Gracia F, Diaz de Bedoya VH, Ruiz MC,
Hackembruch J, Oehninger C, Ketzoian C, Soto A; the "Grupo

REFERENCES
237
Colaborativo Multicéntrico para el Estudio de la Esclerosis Multiple
en America Latina y el Caribe" (GEEMAL). Towards establishing
MS prevalence in Latin America and the Caribbean. Multiple
Sclerosis. 2013; 19(2): 145-152.
Mendiratta SK, Martin WD, Hong S, Boesteanu A, Joyce S, Van Kaer L.
CD1d1 mutant mice are deficient in natural T cells that promptly
produce IL-4. Immunity. 1997; 6(4): 469-477.
Mendiratta SK, Martin WD, Hong S, Boesteanu A, Joyce S, Van Kaer L.
CD1d1 mutant mice are deficient in natural T cells that promptly
produce IL-4. Immunity. 1997; 6(4): 469-477.
Meoli EM, Oh U, Grant CW, Jacobson S. TGF-β signalling is altered in the
peripheral blood of subjects with multiple sclerosis. Journal of
Neuroimmunology. 2011; 230(1-2): 164-168.
Michel, M.-L., A. C. Keller, C. Paget, M. Fujio, F. Trottein, P. B. Savage,
C.-H. Wong, E. Schneider, M. Dy, M. C. Leite-de-Moraes.
Identification of an IL-17-producing NK1.1(neg) iNKT cell
population involved in airway neutrophilia. Journal of Experimental
Medicine. 2007; 204(5): 995–1001.
Miljković D, Momčilović M, Stanojević Z, Rašić D, Mostarica-Stojković
M. It is still not for the old iron: adjuvant effects of carbonyl iron in
experimental autoimmune encephalomyelitis induction. Journal of
REFERENCES
238
Neurochemisty. 2011; 118(2): 205-214.
Miller SD, Karpus WJ. Experimental autoimmune encephalomyelitis in the
mouse. Current Protocols in Immunology. 2007; 15.1.
Mills KH. TLR-dependent T cell activation in autoimmunity. Nature
Reviews Immunology. 2011; 11(12): 807-822.
Milo R, Kahana E. Multiple sclerosis: geoepidemiology, genetics and the
environment. Autoimmunity Reviews. 2010; 9(5): A387-394.
Miyamoto K, Miyake S, Yamamura T. A synthetic glycolipid prevents
autoimmune encephalomyelitis by inducing TH2 bias of natural
killer T cells. Nature. 2001; 413(6855): 531-534.
Mokhtarian F, Shi Y, Shirazian D, Morgante L, Miller A, Grob D. Defective
production of anti-inflammatory cytokine, TGF-beta by T cell lines
of patients with active multiple sclerosis. Journal of Immunology.
1994; 152(12): 6003-6010.
Moldovan IR, Cotleur AC, Zamor N, Butler RS, Pelfrey CM. Multiple
sclerosis patients show sexual dimorphism in cytokine responses to
myelin antigens. Journal of Neuroimmunology. 2008; 193(1-2): 161-
169.
Moroni L, Bianchi I, Lleo A. Geoepidemiology, gender and autoimmune
disease. Autoimmunity Reviews. 2012; 11(6-7): A386-392.

REFERENCES
239
Mu HH, Sawitzke AD, Cole BC. Presence of Lps(d) mutation influences
cytokine regulation in vivo by the Mycoplasma arthritidis mitogen
superantigen and lethal toxicity in mice infected with M. arthritidis.
Infection and Immunity. 2001; 69(6): 3837-3844.
Muindi K, Cernadas M, Watts GF, Royle L, Neville DC, Dwek RA, Besra
GS, Rudd PM, Butters TD, Brenner MB. Activation state and
intracellular trafficking contribute to the repertoire of endogenous
glycosphingolipids presented by CD1d [corrected]. Proceeding of
the National Academy of Sciences of the United States of America.
2010; 107(7): 3052-3057. Erratum in: Proceeding of the National
Academy of Sciences of the United States of America. 2010; 107(13):
6118.
Munger KL, Zhang SM, O'Reilly E, Hernán MA, Olek MJ, Willett WC,
Ascherio A. Vitamin D intake and incidence of multiple sclerosis.
Neurology. 2004; 62(1): 60-65.
Nagyoszi P, Wilhelm I, Farkas AE, Fazakas C, Dung NT, Haskó J, Krizbai
IA. Expression and regulation of toll-like receptors in cerebral
endothelial cells. Neurochemistry International. 2010; 57(5): 556-
564.
Nichols FC, Housley WJ, O'Conor CA, Manning T, Wu S, Clark RB.
Unique lipids from a common human bacterium represent a new
class of Toll-like receptor 2 ligands capable of enhancing

REFERENCES
240
autoimmunity. The American Journal of Pathology. 2009; 175(6):
2430-2438.
Nichols FC, Yao X, Bajrami B, Downes J, Finegold SM, Knee E, Gallagher
JJ, Housley WJ, Clark RB. Phosphorylated dihydroceramides from
common human bcteria are recovered in human tissues. PLoS One.
2011; 6(2): e16771.
Nishida M, Suda R, Nagamatsu Y, Tanabe S, Onohara N, Nakaya M,
Kanaho Y, Shibata T, Uchida K, Sumimoto H, Sato Y, Kurose H.
Pertussis toxin up-regulates angiotensin type 1 receptors through
Toll-like receptor 4-mediated Rac activation. Journal of Biological
Chemistry. 2010; 285(20): 15268-15277.
Novak J, Lehuen A. Mechanism of regulation of autoimmunity by iNKT
cells. Cytokine. 2011; 53(3): 263-270.
O'Brien K, Fitzgerald D, Rostami A, Gran B. The TLR7 agonist,
imiquimod, increases IFN-beta production and reduces the severity
of experimental autoimmune encephalomyelitis. Journal of
Neuroimmunology. 2010; 221(1-2): 107-111.
O'Brien K, Fitzgerald DC, Naiken K, Alugupalli KR, Rostami AM, Gran B.
Role of the innate immune system in autoimmune inflammatory
demyelination. Current medicinal chemistry. 2008; 15(11): 1105-
1115.

REFERENCES
241
O'Keeffe J, Gately CM, Counihan T, Hennessy M, Leahy T, Moran AP,
Hogan EL. T-cells expressing natural killer (NK) receptors are
altered in multiple sclerosis and responses to alpha-
galactosylceramide are impaired. Journal of the Neurological
Sciences. 2008; 275(1-2): 22-28.
Oh SJ, Chung DH. Invariant NKT cells producing IL-4 or IL-10, but not
IFN-gamma, inhibit the Th1 response in experimental autoimmune
encephalomyelitis, whereas none of these cells inhibits the Th17
response. Journal of Immunology. 2011; 186(12): 6815-6821.
Oldenburg M, Krüger A, Ferstl R, Kaufmann A, Nees G, Sigmund A,
Bathke B, Lauterbach H, Suter M, Dreher S, Koedel U, Akira S,
Kawai T, Buer J, Wagner H, Bauer S, Hochrein H, Kirschning CJ.
TLR13 recognizes bacterial 23S rRNA devoid of erythromycin
resistance-forming modification. Science. 2012; 337(6098): 1111-
1115.
Oukka M. Interplay between pathogenic Th17 and regulatory T cells.
Annals of the Rheumatic Disease. 2007; 66 (s3): iii87-90.
Pál E, Tabira T, Kawano T, Taniguchi M, Miyake S, Yamamura T.
Costimulation-dependent modulation of experimental autoimmune
encephalomyelitis by ligand stimulation of V alpha 14 NK T cells.
Journal of Immunology. 2001; 166(1): 662-668.

REFERENCES
242
Parekh VV, Wu L, Olivares-Villagómez D, Wilson KT, Van Kaer L.
Activated Invariant NKT Cells Control Central Nervous System
Autoimmunity in a Mechanism That Involves Myeloid-Derived
Suppressor Cells. Journal of Immunology. 2013; 190(5): 1948-1960.
Park H, Li Z, Yang XO, Chang SH, Nurieva R, Wang YH, Wang Y, Hood
L, Zhu Z, Tian Q, Dong C. A distinct lineage of CD4 T cells
regulates tissue inflammation by producing interleukin 17. Nature
Immunology. 2005; 6(11): 1133-1141.
Pasare C, Medzhitov R. Toll pathway-dependent blockade of CD4+CD25+
T cell-mediated suppression by dendritic cells. Science. 2003;
299(5609): 1033-1036.
Paulos CM, Wrzesinski C, Kaiser A, Hinrichs CS, Chieppa M, Cassard L,
Palmer DC, Boni A, Muranski P, Yu Z, Gattinoni L, Antony PA,
Rosenberg SA, Restifo NP. Microbial translocation augments the
function of adoptively transferred self/tumor-specific CD8+ T cells
via TLR4 signalling. Journal of Clinical Investigation. 2007; 117(8):
2197-2204. Erratum in: The Journal of Clinical Investigation. 2007;
117(10): 3140.
Payne NL, Dantanarayana A, Sun G, Moussa L, Caine S, McDonald C,
Herszfeld D, Bernard CC, Siatskas C. Early intervention with gene-
modified mesenchymal stem cells overexpressing interleukin-4
enhances anti-inflammatory responses and functional recovery in

REFERENCES
243
experimental autoimmune demyelination. Cell Adhesion &
Migration. 2012; 6(3): 179-189.
Pearson T, Markees TG, Serreze DV, Pierce MA, Marron MP, Wicker LS,
Peterson LB, Shultz LD, Mordes JP, Rossini AA, Greiner DL.
Genetic disassociation of autoimmunity and resistance to
costimulation blockade-induced transplantation tolerance in
nonobese diabetic mice. Journal of Immunology. 2003; 171(1): 185-
195.
Pearson T, Markees TG, Wicker LS, Serreze DV, Peterson LB, Mordes JP,
Rossini AA, Greiner DL. NOD congenic mice genetically protected
from autoimmune diabetes remain resistant to transplantation
tolerance induction. Diabetes. 2003; 52(2): 321-326.
Pekmezovic T, Drulovic J, Milenkovic M, Jarebinski M, Stojsavljevic N,
Mesaros S, Kisic D, Kostic J. Lifestyle factors and multiple
sclerosis: A case-control study in Belgrade. Neuroepidemiology.
2006; 27(4): 212-216.
Pellicci DG, Hammond KJ, Uldrich AP, Baxter AG, Smyth MJ, Godfrey
DI. A natural killer T (NKT) cell developmental pathway iInvolving
a thymus-dependent NK1.1(-)CD4(+) CD1d-dependent precursor
stage. The Journal of Experimental Medicine. 2002; 195(7): 835-
844.
REFERENCES
244
Pifer R, Benson A, Sturge CR, Yarovinsky F. UNC93B1 is essential for
TLR11 activation and IL-12-dependent host resistance to
Toxoplasma gondii. The Journal of Biological Chemistry. 2011;
286(5): 3307-3314.
Poppe AY, Wolfson C, Zhu B. Prevalence of multiple sclerosis in Canada: a
systematic review. The Canadian Journal of Neurological Sciences.
2008; 35(5): 593-601.
Porcelli S, Brenner MB, Greenstein JL, Terhorst C, Balk SP, Bleicher PA.
Recognition of Cluster of Differentiation 1 Antigens by Human
CD4-CD8- CytolyticT Lymphocyte. Nature. 1989; 341: 447-450.
1989. Journal of Immunology. 2010; 184(7): 3306-3309.
Poulton LD, Smyth MJ, Hawke CG, Silveira P, Shepherd D, Naidenko OV,
Godfrey DI, Baxter AG. Cytometric and functional analyses of NK
and NKT cell deficiencies in NOD mice. International Immunology.
2001; 13(7): 887-896.
Préhaud C, Mégret F, Lafage M, Lafon M. Virus infection switches TLR-3-
positive human neurons to become strong producers of beta
interferon. Journal of Virology. 2005; 79(20): 12893-12904.
Prinz M, Garbe F, Schmidt H, Mildner A, Gutcher I, Wolter K, Piesche M,
Schroers R, Weiss E, Kirschning CJ, Rochford CD, Brück W,
Becher B. Innate immunity mediated by TLR9 modulates

REFERENCES
245
pathogenicity in an animal model of multiple sclerosis. Journal of
Clinical Investigation. 2006; 116(2): 456-464.
Qian G, Qin X, Zang YQ, Ge B, Guo TB, Wan B, Fang L, Zhang JZ. High
doses of alpha-galactosylceramide potentiate experimental
autoimmune encephalomyelitis by directly enhancing Th17
response. Cell Research. 2010; 20(4): 480-491.
Quesniaux V, Fremond C, Jacobs M, Parida S, Nicolle D, Yeremeev V,
Bihl F, Erard F, Botha T, Drennan M, Soler MN, Le Bert M,
Schnyder B, Ryffel B. Toll-like receptor pathways in the immune
responses to mycobacteria. Microbes and Infection. 2004; 6(10):
946-959.
Racke MK, Hu W, Lovett-Racke AE. PTX cruiser: driving autoimmunity
via TLR4. Trends Immunology. 2005; 26(6): 289-291.
Raddassi K, Kent SC, Yang J, Bourcier K, Bradshaw EM, Seyfert-Margolis
V, Nepom GT, Kwok WW, Hafler DA. Increased frequencies of
myelin oligodendrocyte glycoprotein/MHC class II-binding CD4
cells in patients with multiple sclerosis. Journal of Immunology.
2011; 187(2): 1039-1046.
Ragheb S, Li Y, Simon K, VanHaerents S, Galimberti D, De Riz M,
Fenoglio C, Scarpini E, Lisak R. Multiple sclerosis: BAFF and
CXCL13 in cerebrospinal fluid. Multiple Sclerosis. 2011; 17(7):

REFERENCES
246
819-829.
Rakoff-Nahoum S, Paglino J, Eslami-Varzaneh F, Edberg S, Medzhitov R.
Recognition of commensal microflora by toll-like receptors is
required for intestinal homeostasis. Cell. 2004; 118(2): 229-241.
Ramagopalan SV, Ebers GC. Epistasis: multiple sclerosis and the major
histocompatibility complex. Neurology. 2009; 72(6): 566-567.
Re F, Strominger JL. Toll-like receptor 2 (TLR2) and TLR4 differentially
activate human dendritic cells. The Journal of Biological Chemistry.
2001; 276(40): 37692-37699.
Reifsnyder PC, Li R, Silveira PA, Churchill G, Serreze DV, Leiter EH.
Conditioning the genome identifies additional diabetes resistance
loci in Type I diabetes resistant NOR/Lt mice. Genes and Immunity.
2005; 6(6): 528-538. Erratum in: Genes and Immunity. 2006; 7(2):
184.
Reindl M, Lutterotti A, Ingram J, Schanda K, Gassner C, Deisenhammer F,
Berger T, Lorenz E. Mutations in the gene for toll-like receptor 4
and multiple sclerosis. Tissue Antigens. 2003; 61(1): 85-88.
Reynolds JM, Martinez GJ, Chung Y, Dong C. Toll-like receptor 4
signalling in T cells promotes autoimmune inflammation.
Proceedings of the National Academy Sciences of the United Stated
of America. 2012; 109(32): 13064-13069.

REFERENCES
247
Reynolds JM, Pappu BP, Peng J, Martinez GJ, Zhang Y, Chung Y, Ma L,
Yang XO, Nurieva RI, Tian Q, Dong C. Toll-like receptor 2
signalling in CD4(+) T lymphocytes promotes T helper 17 responses
and regulates the pathogenesis of autoimmune disease. Immunity.
2010; 32(5): 692-702.
Rioux JD, Abbas AK. Paths to understanding the genetic basis of
autoimmune disease. Nature. 2005; 435(7042): 584-589.
Roach JC, Glusman G, Rowen L, Kaur A, Purcell MK, Smith KD, Hood
LE, Aderem A. The evolution of vertebrate Toll-like receptors.
Proceeding of the National Academy of Sciences of the United States
of America. 2005; 102(27): 9577-9582.
Robinson CP, Yamachika S, Alford CE, Cooper C, Pichardo EL, Shah N,
Peck AB, Humphreys-Beher MG. Elevated levels of cysteine
protease activity in saliva and salivary glands of the nonobese
diabetic (NOD) mouse model for Sjögren syndrome. Proceeding of
the National Academy of Sciences of the United States of America.
1997; 94(11): 5767-5771.
Roberts BJ, Moussawi M, Huber SA. Sex differences in TLR2 and TLR4
expression and their effect on coxsackievirus-induced autoimmune
myocarditis. Experimental and Molecular Pathology. 2013; 94(1):
58-64.

REFERENCES
248
Rocha-Campos AC, Melki R, Zhu R, Deruytter N, Damotte D, Dy M,
Herbelin A, Garchon HJ. Genetic and functional analysis of the Nkt1
locus using congenic NOD mice: improved Valpha14-NKT cell
performance but failure to protect against type 1 diabetes. Diabetes.
2006; 55(4): 1163-1170.
Rosati G. The prevalence of multiple sclerosis in the world: an update.
Neurological Sciences. 2001; 22(2): 117-139.
Schrijver IA, van Meurs M, Melief MJ, Wim Ang C, Buljevac D, Ravid R,
Hazenberg MP, Laman JD. Bacterial peptidoglycan and immune
reactivity in the central nervous system in multiple sclerosis. Brain.
2001; 124(Pt 8): 1544-1554.
Schroder K, Sweet MJ, Hume DA. Signal integration between IFNgamma
and TLR signalling pathways in macrophages. Immunobiology.
2006; 211(6-8): 511-524.
Schütz C, Oelke M, Schneck JP, Mackensen A, Fleck M. Killer artificial
antigen-presenting cells: the synthetic embodiment of a 'guided
missile'. Immunotherapy. 2010; 2(4): 539-550.
Segal BM, Chang JT, Shevach EM. CpG oligonucleotides are potent
adjuvants for the activation of autoreactive encephalitogenic T cells
in vivo. Journal of Immunology. 2000; 164(11): 5683-5688.

REFERENCES
249
Seino K, Taniguchi M. Functionally distinct NKT cell subsets and subtypes.
The Journal of Experimental Medicine. 2005; 19; 202(12): 1623-
1626.
Sena A, Pedrosa R, Ferret-Sena V, Cascais MJ, Roque R, Araújo C,
Couderc R. Interferon beta therapy increases serum ferritin levels in
patients with relapsing-remitting multiple sclerosis. Multiple
Sclerosis. 2008; 14(6): 857-859.
Shaw PJ, Barr MJ, Lukens JR, McGargill MA, Chi H, Mak TW, Kanneganti
TD. Signalling via the RIP2 adaptor protein in central nervous
system-infiltrating dendritic cells promotes inflammation and
autoimmunity. Immunity. 2011; 34(1): 75-84.
Shi FD, Takeda K, Akira S, Sarvetnick N, Ljunggren HG. IL-18 directs
autoreactive T cells and promotes autodestruction in the central
nervous system via induction of IFN-gamma by NK cells. Journal of
Immunology. 2000; 165(6): 3099-3104.
Shiozaki M, Tashiro T, Koshino H, Shigeura T, Watarai H, Taniguchi M,
Mori K. Synthesis and biological activity of hydroxylated analogues
of KRN7000 (-galactosylceramide). Carbohydrate Research. 2013;
370: 46-66.
Silverstein AM. Autoimmunity versus horror autotoxicus: the struggle for
recognition. Nature Immunology. 2001; 2(4): 279-281.

REFERENCES
250
Singh AK, Wilson MT, Hong S, Olivares-Villagómez D, Du C, Stanic AK,
Joyce S, Sriram S, Koezuka Y, Van Kaer L. Natural killer T cell
activation protects mice against experimental autoimmune
encephalomyelitis. The Journal of Experimental Medicine. 2001;
194(12): 1801-1811.
Singh MK, Scott TF, LaFramboise WA, Hu FZ, Post JC, Ehrlich GD. Gene
expression changes in peripheral blood mononuclear cells from
multiple sclerosis patients undergoing beta-interferon therapy.
Journal of Neurological Sciences. 2007; 258(1-2): 52-59.
Sirota M, Schaub MA, Batzoglou S, Robinson WH, Butte AJ. Autoimmune
Disease Classification by Inverse Association with SNP Alleles.
PLoS Genetics. 2009; 5(12): e1000792.
Slavin A, Ewing C, Liu J, Ichikawa M, Slavin J, Bernard CC. Induction of a
multiple sclerosis-like disease in mice with an immunodominant
epitope of myelin oligodendrocyte glycoprotein. Autoimmunity.
1998; 28(2): 109-120.
Slifka MK, Pagarigan RR, Whitton JL. NK markers are expressed on a high
percentage of virus-specific CD8+ and CD4+ T cells. Journal of
Immunology. 2000; 164(4): 2009-2015. Erratum in: Journal of
Immunology. 2000; 164(6): following 3444. Journal of Immunology.
2004; 172(11): 7220.
REFERENCES
251
Sloane JA, Batt C, Ma Y, Harris ZM, Trapp B, Vartanian T. Hyaluronan
blocks oligodendrocyte progenitor maturation and remyelination
through TLR2. Proceeding of the National Academia of Sciences of
United States of America. 2010; 107(25): 11555-11560.
Smorodchenko A, Wuerfel J, Pohl EE, Vogt J, Tysiak E, Glumm R,
Hendrix S, Nitsch R, Zipp F, Infante-Duarte C. CNS-irrelevant T-
cells enter the brain, cause blood-brain barrier disruption but no glial
pathology. The European Journal Neuroscience. 2007; 26(6): 1387-
1398.
Sospedra M, Martin R. Immunology of multiple sclerosis. Annual Review of
Immunology. 2005; 23: 683-747.
Soulika AM, Lee E, McCauley E, Miers L, Bannerman P, Pleasure D.
Initiation and progression of axonopathy in experimental
autoimmune encephalomyelitis. The Journal of Neurosciences.
2009; 29(47): 14965-14979.
Speak AO, Cerundolo V, Platt FM. CD1d presentation of glycolipids.
Immunology and Cell Biology. 2008; 86(7): 588-597.
Sriram S, Solomon D, Rouse RV, Steinman L. Identification of T cell
subsets and B lymphocytes in mouse brain experimental allergic
encephalitis lesions. Journal of Immunology. 1982, 129(4): 1649-
1651.
REFERENCES
252
Stefferl A, Brehm U, Storch M, Lambracht-Washingto D, Bourquin C,
Wonigeit K, Lassmann H, Linington C. Myelin Oligodendrocyte
Glycoprotein Induces Experimental Autoimmune Encephalomyelitis
in the "Resistant" Brown Norway Rat: Disease Susceptibility Is
Determined by MHC and MHC-Linked Effects on the B Cell
Response. The Journal of Immunology. 1999; 163(1): 40-49.
Stromnes IM, Cerretti LM, Liggitt D, Harris RA, Goverman JM.
Differential regulation of central nervous system autoimmunity by
T(H)1 and T(H)17 cells. Nature Medicine. 2008; 14(3): 337-342.
Stromnes IM, Goverman JM. Passive induction of experimental allergic
encephalomyelitis. Nature Protocols. 2006; 1(4): 1952-1960.
Sutmuller RPM, den Brok MHMGM, Kramer M, Bennink EJ, Toonen
LWJ, Kullberg B-J, Joosten LA, Akira S, Netea MG, Adema GJ.
Toll-like receptors 2 controls expansion and function of regulatory T
cell. The Journal of Clinical Investigation. 2006; 116(2): 485-494.
Sutton C, Brereton C, Keogh B, Mills KH, Lavelle EC. A crucial role for
interleukin (IL)-1 in the induction of IL-17-producing T cells that
mediate autoimmune encephalomyelitis. The Journal of
Experimental Medicine. 2006; 203(7): 1685-16891.
Sweeney CM, Lonergan R, Basdeo SA, Kinsella K, Dungan LS, Higgins
SC, Kelly PJ, Costelloe L, Tubridy N, Mills KH, Fletcher JM. IL-27

REFERENCES
253
mediates the response to IFN-β therapy in multiple sclerosis patients
by inhibiting Th17 cells. Brain Behavior, and Immunity. 2011;
25(6): 1170-1181.
Szvetko AL, Jones A, Mackenzie J, Tajouri L, Csurhes PA, Greer JM,
Pender MP, Griffiths LR. Investigation of the [-/A]8 and C1236T
genetic variations within the human Toll-like receptor 3 gene for
association with multiple sclerosis. Neurological Research. 2010;
32(4): 438-441.
Szvetko AL, Jones A, Mackenzie J, Tajouri L, Csurhes PA, Greer JM,
Pender MP, Griffiths LR. An investigation of the C77G and C772T
variations within the human protein tyrosine phosphatase receptor
type C gene for association with multiple sclerosis in an Australian
population. Brain Research. 2009; 1255: 148-152.
Tabeta K, Georgel P, Janssen E, Du X, Hoebe K, Crozat K, Mudd S,
Shamel L, Sovath S, Goode J, Alexopoulou L, Flavell LA, Beutler
B. Toll-like receptors 9 and 3 as essential components of innate
immune defense against mouse cytomegalovirus infection.
Proceeding of the National Academy of Sciences of the United States
of America. 2004; 101(10): 3516-3521.
Takeda K, Takeuchi O, Akira S. Recognition of lipopeptides by Toll-like
receptors. Journal of endotoxin research. 2002; 8(6): 459-463.

REFERENCES
254
Takeuchi O, Akira S. Pattern recognition receptors and inflammation. Cell.
2010; 140(6): 805-820.
Takeuchi O, Hoshino K, Akira S. Cutting edge: TLR2-deficient and
MyD88-deficient mice are highly susceptible to Staphylococcus
aureus infection. Journal of Immunology. 2000; 165(10): 5392-5396.
Takeuchi O, Hoshino K, Kawai T, Sanjo H, Takada H, Oagawa T, Takeda
K, Akira S. Differential roles of TLR2 and TLR4 in recognition of
gram-negative and gram-positive bacteria cell wall components.
Immunity. 1999; 11(4): 443-451.
Takeuchi O, Kawai T, Mühlradt PF, Morr M, Radolf JD, Zychlinsky A,
Takeda K, Akira S. Discrimination of bacterial lipoproteins by Toll-
like receptor 6. International Immunology. 2001; 13(7): 933-940.
Takeuchi O, Kawai T, Sanjo H, Copeland NG, Gilbert DJ, Jenkins NA,
Takeda K, Akira S. TLR6: A novel member of an expanding toll-
like receptor family. Gene. 1999; 231(1-2): 59-65.
Takeuchi O, Sato S, Horiuchi T, Hoshino K, Takeda K, Dong Z, Modlin
RL, Akira S. Cutting edge: role of Toll-like receptor 1 in mediating
immune response to microbial lipoproteins. Journal of Immunology.
2002; 169(1): 10-14.
Teige A, Teige I, Lavasani S, Bockermann R, Mondoc E, Holmdahl R,
Issazadeh-Navikas S. CD1-dependent regulation of chronic central

REFERENCES
255
nervous system inflammation in experimental autoimmune
encephalomyelitis. Journal of Immunology. 2004; 172(1): 186-194.
Theiler M. Spontaneus Encephalomyelitis of mice, a new virus disease. The
Journal of Experimental Medicine. 1937; 65(5): 705-719.
Thoma-Uszynski S, Kiertscher SM, Ochoa MT, Bouis DA, Norgard MV,
Miyake K, Godowski PJ, Roth MD, Modlin RL. Activation of toll-
like receptor 2 on human dendritic cells triggers induction of IL-12,
but not IL-10. Journal of Immunology. 2000; 165(7): 3804-3810.
Toneatto S, Finco O, van der PH, Abrignani S, Annunziata P. Evidence of
blood–brain barrier alteration and activation in HIV-1 gp120
transgenic mice. AIDS. 1999; 13(17): 2343–2348.
Touil T, Fitzgerald D, Zhang GX, Rostami A, Gran B. Cutting Edge: TLR3
Stimulation Suppresses Experimental Autoimmune
Encephalomyelitis by Inducing Endogenous IFN-beta. Journal of
Immunology. 2006; 177(11): 7505-7509.
Turrin NP. Central nervous system Toll-like receptor expression in response
to Theiler's murine encephalomyelitis virus-induced demyelination
disease in resistant and susceptible mouse strains. Virology Journal.
2008; 5: 154.
Uematsu S, Akira S. The role of Toll-like receptors in immune disorders.
Expert Opinion on Biological Theraphy. 2006; 6(3): 203-214.

REFERENCES
256
Urcelay E, Blanco-Kelly F, de Las Heras V, de la Concha EG, Arroyo R,
Martínez A. TLR4 haplotypes in multiple sclerosis: a case-control
study in the Spanish population. Journal of Neuroimmunology.
2007; 192(1-2): 215-218.
Venken K, Hellings N, Hensen K, Rummens JL, Stinissen P. Memory
CD4+CD127high T cells from patients with multiple sclerosis
produce IL-17 in response to myelin antigens. Journal of
Neuroimmunology. 2010; 226(1-2): 185-191.
Venken K, Hellings N, Thewissen M, Somers V, Hensen K, Rummens JL,
Medaer R, Hupperts R, Stinissen P. Compromised CD4+
CD25(high) regulatory T-cell function in patients with relapsing-
remitting multiple sclerosis is correlated with a reduced frequency of
FOXP3-positive cells and reduced FOXP3 expression at the single-
cell level. Immunology. 2008; 123(1): 79-89.
Viglietta V, Baecher-Allan C, Weiner HL, Hafler DA. Loss of functional
suppression by CD4+CD25+ regulatory T cells in patients with
multiple sclerosis. Journal of Experimental Medicine. 2004; 199(7):
971-979.
Visscher BR, Bunnell DH, Detels R. Multiple sclerosis and multiple moves:
an etiologic hypothesis. American Journal of Epidemiology. 1981;
113(2): 140-143.

REFERENCES
257
Visser L, Jan de Heer H, Boven LA, van Riel D, van Meurs M, Melief MJ,
Zähringer U, van Strijp J, Lambrecht BN, Nieuwenhuis EE, Laman
JD. Proinflammatory bacterial peptidoglycan as a cofactor for the
development of central nervous system autoimmune disease. Journal
of Immunology. 2005; 174(2): 808-816.
Visser L, Melief MJ, van Riel D, van Meurs M, Sick EA, Inamura S,
Bajramovic JJ, Amor S, Hintzen RQ, Boven LA, 't Hart BA, Laman
JD. Phagocytes containing a disease-promoting Toll-like
receptor/Nod ligand are present in the brain during demyelinating
disease in primates. The American Journal of Pathology. 2006;
169(5): 1671-1685.
von Budingen HC, Menge T, Hauser SL, Genain CP. Restrictive and
diversifying elements of the anti-myelin/oligodendrocyte
glycoprotein antibody response in primate experimental allergic
encephalomyelitis. Immunogenetics. 2006; 58(2-3): 122–128.
Walder H, Collins M, Kuchroo VK. Activation of antigen-presenting cells
by microbial products breaks self tolerance and induce autoimmune
disease. The Journal of Clinical Investigation. 2004; 113(7): 990-
997.
Wang T, Town T, Alexopoulou L, Anderson JF, Fikrig E, Flavell RA. Toll-
like receptor 3 mediates West Nile virus entry into the brain causing
lethal encephalitis. Nature Medicine. 2004; 10(12): 1366-1373.

REFERENCES
258
Weber MS, Starck M, Wagenpfeil S, Meinl E, Hohlfeld R, Farina C.
Multiple sclerosis: glatiramer acetate inhibits monocyte reactivity in
vitro and in vivo. Brain. 2004; 127(Pt 6): 1370-1378.
Werner SR, Saha JK, Broderick CL, Zhen EY, Higgs RE, Duffin KL, Smith
RC. Proteomic analysis of demyelinated and remyelinating brain
tissue following dietary cuprizone administration. Journal of
Molecular Neurosciences. 2010; 42(2): 210-225.
Wolf NA, Amouzegar TK, Swanborg RH. Synergistic interaction between
Toll-like receptor agonists is required for induction of experimental
autoimmune encephalomyelitis in Lewis rats. Journal of
Neuroimmunology. 2007; 185(1-2): 115-122.
Wootla B, Denic A, Keegan BM, Winters JL, Astapenko D, Warrington
AE, Bieber AJ, Rodriguez M. Evidence for the role of B cells and
immunoglobulins in the pathogenesis of multiple sclerosis.
Neurology Research International. 2011; 2011: 780712.
Wynn DR, Rodriguez M, O'Fallon WM, Kurland LT. A reappraisal of the
epidemiology of multiple sclerosis in Olmsted County, Minnesota.
Neurology. 1990; 40(5): 780-786.
Yarovinsky F, Zhang D, Andersen JF, Bannenberg GL, Serhan CN, Hayden
MS, Hieny S, Sutterwala FS, Flavell RA, Ghosh S, Sher A. TLR11
activation of dendritic cells by a protozoan profilin-like protein.

REFERENCES
259
Science. 2005; 308(5728): 1626-1629.
Yokote H, Miyake S, Croxford JL, Oki S, Mizusawa H, Yamamura T. NKT
cell-dependent amelioration of a mouse model of multiple sclerosis
by altering gut flora. The American Journal of Pathology. 2008;
173(6): 1714-1723.
Yoshida T, Jiang F, Honjo T, Okazaki T. PD-1 deficiency reveals various
tissue-specific autoimmunity by H-2b and dose-dependent
requirement of H-2g7 for diabetes in NOD mice. Proceeding of the
National Academy Sciences. 2008; 105(9): 3533-3538.
Zamvil SS, Steinman L. The T Lymphocyte in Experimental Allergic
Encephalomyelitis. Annual Review of Immunology. 1990; 8: 579-
621.
Zekki H, Feinstein DL, Rivest S. The clinical course of experimental
autoimmune encephalomyelitis is associated with a profound and
sustained transcriptional activation of the genes encoding toll-like
receptor 2 and CD14 in the mouse CNS. Brain Pathology. 2002;
12(3): 308-319.
Zeuthen LH, Fink LN, Frokiaer H. Epithelial cells prime the immune
response to an array of gut-derived commensals towards a
tolerogenic phenotype through distinct actions of thymic stromal
lymphopoietin and transforming growth factor-beta. Immunology.

REFERENCES
260
2008; 123(2): 197-208.
Zhang D, Zhang G, Hayden MS, Greenblatt MB, Bussey C, Flavell RA,
Ghosh S. A toll-like receptor that prevents infection by
uropathogenic bacteria. Science. 2004; 303(5663): 1522-1526.
Zhang FX, Kirschning CJ, Mancinelli R, Xu XP, Jin Y, Faure E, Mantovani
A, Rothe M, Muzio M, Arditi M. Bacterial lipopolysaccharide
activates nuclear factor-kappaB through interleukin-1 signalling
mediators in cultured human dermal endothelial cells and
mononuclear phagocytes. The Journal of Biological Chemistry.
1999; 274(12): 7611-7614.
Zhang X, Jin J, Tang Y, Speer D, Sujkowska D, Markovic-Plese S. IFN-
beta1a inhibits the secretion of Th17-polarizing cytokines in human
dendritic cells via TLR7 up-regulation. Journal of Immunology.
2009; 182(6): 3928-3936.
Zhou Y, Ye L, Wan Q, Zhou L, Wang X, Li J, Hu S, Zhou D, Ho W.
Activation of Toll-like receptors inhibits herpes simplex virus-1
infection of human neuronal cells. Journal of Neurosciences
Research. 2009; 87(13): 2916-1925.

APPENDICES

APPENDICES
261
APPENDIX 1
LOCALIZATION OF TOLL-LIKE
RECEPTORS
Dendritic cell showing the extracellular and intracellular localization of Toll-like receptors.

APPENDICES
262
APPENDIX 2
PRODUCTION OF C57BL/6.CD1d-/- MICE
C57BL/6.Cd1d-/- mice were backcrossed to C57BL/6 mice and the pups of the F1 generation were intercrossed. F1 pups were genotyping as declared in Chapter 2 Materials and Methods for selection of homozygous mutants. C57BL/6.Cd1d-/- homozygous mice were intercrossed to extend the new line of mice.
This image cannot currently be display ed.

APPENDICES
263
APPENDIX 3
PRODUCTION OF NOD.H2b.Tlr2-/- MICE
NOD.H2b.Tlr2-/- mice were backcrossed to C57BL/6 mice and the pups of the F1 generation were intercrossed. F1 pups were genotyping as declared in Chapter 2 Materials and Methods for selection of homozygous mutants. NOD.H2b.Tlr2-/- homozygous mice were intercrossed to extend the new line of mice.
This image cannot currently be display ed.

APPENDICES
264
APPENDIX 4
MOUSE IDENTIFICATION
Dorsal view of head mice with ear clipping for identification. Units are marked in the right ear (1, 2, 3, 4, 5, 6, 7, 8, 9). Tens are marked in the left ear (10, 20, 30; 40, 50, 60, 70, 80, 90). This method allowed identifying mice from the number 1 to the number 99 using a combination of units and tens as showed in the example.
This image cannot currently be display ed.

APPENDICES
265
APPENDIX 5
SEQUENCES OF PRIMERS
Target DNA
construct
Name
Sequence (5’ to 3’)
H2b D17mit 176 (Fw1) GCCTAACTAGACTACAAGCCTTGC
H2b D17mit 176 (Rv2) GTAGGTACATACAACCCACATACAGG
TLR2 A (Rv) GTTTAGTGCCTGTATCCAGTCAGTGCG
TLR2 B (Fw) TTGGATAAGTCTGATAGCCTTGCCTCC
TLR2 C (Rv) ATCGCCTTCTATCGCCTTCTTGACGAG
MyD88 A (Rv) AGACAGGCTGAGTGCAAACTTGTGCTG
MyD88 B (Fw) AGCCTCTACACCCTTCTCTTCTCCACA
MyD88 C (Rv) ATCGCCTTCTATCGCCTTCTTGACGAG
V14 V14 (Fw) TGTAGGCTCAGATTCCCAACC
V14 V14 (Rv) TGTAGGCTCAGATTCCCAACC
GAPDH GAPDH (Fw) TGCCGCCTGGAGAAACCTGTATGTATG
GAPDH GAPDH (Rv) TGGAAGAGTGGGAGTTGCTGTTGAACT
Nkrp1b D6mit135 (Fw) CCTAACAGTTCAATTTGTCAGCC
Nkrp1b D6mit135 (Rv) CCAGCCCCCAATTTGATATA
1 Fw - Forward 2 RV - Reverse

APPENDICES
266
APPENDIX 6
POLYMERASE CHAIN REACTION (PCR)
Targeting DNA constructs
H2O (l)
GoTaq Green
(2X)
Primer
(Fw)
Primer
(Rv)
1l of DNA Total Volume (l)
H2b 10.5 (12.5l) 0.5l (10M) 0.5l (10M) 20-180 ng/l 25
V14 6.5 (12.5l) 0.5l (10M) 0.5l (10M) 20 ng/l 25
Nkrp1b 9.70 (12.5l) 0.90l (6.6M) 0.90l (6.6M) 20-180 ng/l 25
TLR2
+
GAPDH
4.1 (12.5l) 0.7l (6M)
0.2l (2M)
0.7l (6M)
0.2l (2M)
20-180 ng/l 20
MyD88
+
GAPDH
4.1 (12.5l) 0.7l (10M)
0.2l (2M)
0.7l (10M)
0.2l (2M)
20-180 ng/l 20

APPENDICES
267
APPENDIX 7
TERMOCYCLING PROTOCOLS FOR PCR
Target DNA
construct
Initial denaturation
Denaturation Annealing Elongation Final elongation
H2b
Nkrp1b
95 C
3 minutes
(32 cycles)
72 C
7 minutes
95 C
30 seconds
55 C
30 seconds
72 C
30 seconds
TLR2
95 C
3 minutes
(35 cycles)
74 C
10 minutes
94 C
30 seconds
67 C
60 seconds
74 C
60 seconds
MyD88
95 C
3 minutes
(35 cycles)
74 C
10 minutes
94 C
30 seconds
67 C
60 seconds
74 C
60 seconds
V14
95 C
3 minutes
(32 cycles)
72 C
7 minutes
95 C
60 seconds
59 C
60 seconds
72 C
60 seconds

APPENDICES
268
APPENDIX 8
ANTIBODIES FOR FLOW CYTOMETRY ANALYSIS
Specificity Conjugated to Host Isotype Clone Catalogue Number
Source
CD45 Biotin Rat (LOU) IgG2b, 30-F11 553077 BD PharmingenTM (San Diego, CA)
CD45.2 PB Mouse (SJL) IgG2a, 104 109820 BioLegend (San Diego, CA)
TCR APC
FITC
PerCp-Cy5.5
Armenian Hamster
Armenian Hamster
Armenian Hamster
IgG2, λ1
IgG
IgG2, λ1
H57-597
H57-597
H57-597
553174
11-5961-85
560657
BD PharmingenTM (San Diego, CA)
eBiosciencesTM (San Diego, CA)
BD PharmingenTM (San Diego, CA)
CD1d PE Rat IgG2b, 1B1 12-0011-82 eBiosciencesTM (San Diego, CA)
CD4 FITC Rat (DA) IgG2a, M4-5 553046 BD PharmingenTM (San Diego, CA)

APPENDICES
269
Continue antibodies for flow cytometry analysis
PB
PerCp-Cy5.5
V450
Rat (DA)
Rat (DA)
Rat (DA)
IgG2a,
IgG2a,
IgG2a,
RM4-5
RM4-5
RM4-5
558107
550954
560468
BD PharmingenTM (San Diego, CA)
BD PharmingenTM (San Diego, CA)
BD HorizonTM (San Diego, CA)
CD8 APC-Cy7 Rat (LOU/Ws1/M) IgG2a, 53-6.7 557654 BD PharmingenTM (San Diego, CA)
CD11b FITC
PE-Cy7
Rat (DA)
Rat (DA)
IgG2b,
IgG2b,
M1/70
M1/70
553310
552850
BD PharmingenTM (San Diego, CA)
BD PharmingenTM (San Diego, CA)
CD11c PE
PE-Cy7
Armenian Hamster
Armenian Hamster
IgG
IgG1, λ2
N418
HL3
117308
558079
BioLegend (San Diego, CA)
BD PharmingenTM (San Diego, CA)
Ccr2 Biotin Rat MC-21 N/A N/A Donated by Matthias Mack
FoxP3 FITC Rat IgG2a, FJK-16s 11-5773-82 eBiosciencesTM (San Diego, CA)
CD25 PE
Biotin
N/A
Rat (LEW)
N/A
IgM,
Streptavidin
7D4
554061
553070
BD PharmingenTM (San Diego, CA)
BD PharmingenTM (San Diego, CA)
CD62L PE-Cy7 Rat IgG2a, MEL-14 104418 BioLegend (San Diego, CA)
CD3e APC Armenian Hamster IgG1, 145-2C11 553066 BD PharmingenTM (San Diego, CA)
IFN FITC Rat IgG1, XMG1.2 11-7311-82 eBiosciencesTM (San Diego, CA)

APPENDICES
270
Continue antibodies for flow cytometry analysis
PO - Pacific orange PB - Pacific blue APC - Allophycocyanin FITC - Fluoroscein isothiocyanate PerCp - Peridinin-chlorophyII Protein Complex PerCp-Cy5.5 - Peridinin-chlorophyII Protein Complex with cyanine dye (Cy5.5) V450 - Violet with an Em Max at 450 nm APC-Cy7 – Allophycocyanin with cyanine dye (Cy7) PE-Cy7 - Phycoerythrin with cyanine dye (Cy7) PE – Phycoerythrin N/A – Non applicable
Ly6C PerCP-Cy5.5 Rat IgM, AL-21 560525 BD PharmingenTM (San Diego, CA)
IL17 PE Rat (LEW) IgG1, TC11-18H10 559502 BD PharmingenTM (San Diego, CA)
Streptavidin
PO
PE
Dylight 649
N/A
N/A
N/A
N/A
N/A
N/A
N/A
N/A
N/A
S32365
554061
N/A
Invitrogen
BD PharmingenTM (San Diego, CA)
Jackson Immunoresearch (West Grove)

APPENDICES
271
APPENDIX 9
PREPARATION OF SOLUTIONS AND
BUFFERS
50x TAE (Tris base, acetic acid and
Ethylenediaminetetraacetic acid (EDTA)) buffer solution
(1L)
A liter of 50x TAE buffer solution was made up of 242g Tris base
(AMRESCO;Ohio,USA), 57.1 ml glacial acetic acid (UNIVAR;AsiaPacific
SpecialtyChemicalsLimited), 18.6g EDTA (AMRESCO;Ohio,USA)and
900 ml distilled H20.
1x TAE buffer solution
The buffer solution 1x TAE was made by diluting 50x TAE buffer solution
in distillated water. Final solute concentrations are 40mM Tris acetate and
1mM EDTA.

APPENDICES
272
Agarose gel (2% and 3%) for polyacrylamide gel
electrophoresis (PAGE)
Each 100ml of agarose gel was made up of 100 ml of 1x TAE buffer
solution, 2.0g agarose (2%) or 3g agarose (3%) (Fisher biotec;Western
Australia, Australia) and 7.5 l Gel red (BIOTIUM, Cat. No. 41003;
California,UnitedStatesofAmerica).
MACS buffer
Macs buffer consist of PBS (Invitrogen; Victoria, Australia) supplemented
with 0.4% of 0.5M EDTA (AMRESCO; Ohio, USA) and 0.2% of 10mM
Sodium Azide.
Cell culture medium
RPMI 1640 medium (Invitrogen; Victoria, Australia) was supplemented
with 10% (v/v) fetal cow serum (FCS) (Invitrogen; Victoria, Australia),
1mM Sodium pyruvate (Invitrogen; Victoria, Australia), 100U/ml penicillin
(Invitrogen; Victoria, Australia), 100g/ml streptomycin sulfate (Invitrogen;

APPENDICES
273
Victoria, Australia), 2mM L-glutamine (Invitrogen; Victoria, Australia), 2
M 2-Mercaptoethanol (Invitrogen; Victoria, Australia).
Luxol fast blue (0.1%)
The solution of 0.1% luxol fast blue was made up of 0.1g luxol fast blue
(Sigma; New South Wales, Australia), 100 ml of 95% ethyl alcohol
(provided by the Department of Marine and Tropical Biology, James Cook
University), 0.5 ml of glacial acetic acid (BDH AnalaR; Victoria,
Australia).
Cresyl echt violet (0.1%) or cresyl violet acetate (0.1%)
Cresyl echt violet 0.1% or cresyl violet acetate 0.1% was made up of 0.1 g
of cresyl echt violet (cresyl fast violet) (Thebritishdrughouses;Poole,
England)or cresyl violet acetate (Sigma; New South Wales, Australia), 100
ml of distilled water and 10 drops of glacial acetic acid (added just before
use) (BDHAnalaR;Victoria,Australia).

APPENDICES
274
Lithium carbonate (0.05%)
The solution of 0.05% of lithium carbonate was made up of 0.05 g of
lithium carbonate (provided by the Department of Marine and Tropical
Biology, James Cook University) and 100 ml of distilled water.
Silver Nitrate (10%)
Silver nitrate stock 10% was made up of 5g of silver nitrate (UNILAB;
Sydney,Australia)and 50 ml of distilled water.
Ammonium Hydroxide (1%)
Ammonium hydroxide 1% was made up of 1 ml of ammonium hydroxide
(concentrated) (UNIVAR; New South Wales, Australia) and 100 ml of
distilled water.
APPENDICES
275
Developer Stock
The developer stock solution was made up of 20 ml of 37-40%
formaldehyde (provided by the Department of Marine and Tropical Biology,
James Cook University), 0.5g of citric acid (trisodium dihydrate) (Sigma;
Missouri, USA), 2 drops of nitric acid (concentrated) (AnalaR; Victoria,
Australia)and 100 ml of distilled water.
Developer Working
The developer working solution was made up of 8 drops of developer stock
solution, 8 drops of ammonium hydroxyide (concentrated) (UNIVAR;New
SouthWales,Australia)and 50 ml of distilled water.
Sodium Thiosolfate (HYPO) (5%)
Sodium Thiosolfate (HYPO) 5% was made up of 5g of sodium thiosolfate
(Univar,;NewSouthWales,Australia)and 100 ml of distilled water.

APPENDICES
276
Enzyme/Collagenase buffer
Enzyme/Collagenase buffer was made up 4 g/L MgCl2 (BDH AnaR;
Victoria, Australia), 2.55 g/L CaCl2 (UNILAB; New South Wales,
Australia), 3.73 g/L KCl (UNIVAR; New South Wales, Australia), 8.95 g/L
NaCl(UNIVAR;NewSouthWales,Australia),500U/mlofDNase(Sigma;
NSW, Australia) andddH2O.EnsurepHisbetween6and7.