Embed Size (px)
Citation preview

Role of Infrastructure in Poverty Reduction
Final Quantitative and Qualitative Report February 2006
Japan Bank for International Cooperation
The Energy and Resources Institute New Delhi
2 Role of Infrastructure in Poverty Reduction
Acknowledgment We would like to thank JBIC for providing us the opportunity to take up this study, and for various technical inputs during the study. We appreciate very much the cooperation of officials of the implementing agencies of the eight projects being evaluated - Metro Railways, Hoogly River Bridge Commissioners (Kolkata Transport Infrastructure Project), Haldia Port, West Bengal Pollution Control Board, Purulia Pumped Storage Project, Teesta Hydroelectric Project, West Bengal Transmission System Project and Bakreshwar Thermal Power Project. Surveys of project beneficiaries were conducted in collaboration with TNS Mode, and local research support was provided by Suman Bedajna, Pritam Datta and Archita Banik.
Project team February 28, 2006 Project team J L Bajaj Souvik Bhattachariya Pavel Chakraborty Vikram Dayal Divya Datt Anirban Ganguly Shilpa Nischal Kiran Shivpuri
TERI Report No. 2004 RD 24

3 Role of Infrastructure in Poverty Reduction
T E R I Report No. 2004 RD 24
Table of Contents �������������� ����������������������������������� ������� ��������������������������������������� �������� ���������������������������11111111111111111111�12���������������������� ������������#��� ������ �������11111111111111!34��� �������������"11111111111111111111111111111111!135�
��� �������1111111111111111111111111111111111!35����������11111111111111111111111111111111111!!36��������������11111111111111111111111111111111!�36����������������������1111111111111111111111111!�37�
��������� 11111111111111111�111111111111111111111!!!38�������� ���������������� ��� � !��� �"����������������#�#�����$� -������*-&,�(*������-�� � �&��������"���,�"�����+���"�����11111!39���:����� 111111111111111111111111111111111111111!!3;���������� 111111111111111111111111111111111111111!53�-���<����5!31!!111111111111111111111111111111111111!55�������� �%��&�� �������#�#��������������������������%�&���������1111111111111111111111111111111111111156����111111111111111111111111111111111111111111!56�
�������11111111111111111111111111111111111156� � ����� �� ��1111111111111111111111111111111157�!����� � ����������� �� �����11111111111111111111111!57�"���� �� ������ �� ��1111111111111111111111111111!!58�
����� ������ ��� 111111111111111111111111111111111115;���� �������111111111111111111111111111111111!!64�
������������������������11111111111111111111111111111111111!63����� ���11111111111111111111111111111111111!!63�� ��� ����#��������������������������������������111111111111!63�
��������� 11111111111111111111111111111111111111166�-���<����6!31111111111111111111111111111111111111!!67�������� �'��&�#�������#�#����������������������%(�&���������1111111111111111111111111111111111111!6=���11111111111111111111111111111111111111111169�
� ����� �� ��1111111111111111111111111111111!!69������ ������ ��� 1111111111111111111111111111111111169�
$���111111111111111111111111111111111111!!69�%���111111111111111111111111111111111111!6;�
������������������ ��� ��111111111111111111111111111111111!74��
������ ������������)���������������#���� �����������) � ��������� �����������������������������'��*������"� ��� 1111111111111111111111111111111111175���11111111111111111111111111111111111111111!!!75�����"���� ���$������������� �<������ ������ �����������3;;;>54441111111176�� ��"�������� �"�����������������"������������������������������ 111177�

4 Role of Infrastructure in Poverty Reduction
T E R I Report No. 2004 RD 24
��������� 11111111111111111111111111111111111111!!78� ������ �(��������#��������������������������'(�������� �������������������������������'$�������� �$��*��!����&�� ��+��� ��#��,-��#����.����#� �������- �/�����������������������0�*��#������������������!1111111111111111111111111111111!84��������������������#���!1111111111111111111111111111111!85��������������� !11!!!!!!!11111111111111111111111111111118;�-���<����9!3111111!!1111111111111111111111111111111!98�������� ����*��!����1 ��#�� ����� �#� ���� ��������������- �/��������������������������������������*��#������������������!1111111111111111111111111111111!!25��������������������#���!111111111111111111111111111111!!!26��������������� !11!!!!!!!111111111111111111111111111111!!;8�-���<����2!3111111!!111111111111111111111111111111!348�������� �2��3������-� ��&��� ��4������- �/�����������������*��#������������������!1111111111111111111111111111111!!333��������������������#���!111111111111111111111111111111!!!333��������������� 1111111111�!111111111111111111111111!!357�-���<����;!3111111!!111111111111111111111111111111135=�������� ��0��5�#��6��)�������#� ����-������������� ���- �/��������2�*��#������������������!!!111111111111111111111111111111!!35;��������������������#���11!1111111111111111111111111111!!363�������� �����6�! �#� � �1�� ����-� � �- �/��������������'��*��#������������������!!!!111111111111111111111111111111!!372��������������������#���!1111111111111111111111111111111372��������������� !11!!!!!!!111111111111111111111111111111!!382�������� �����1��#���������3�� ������ ���- �/����������������((�*��#������������������!!!!111111111111111111111111111111!!3==��������������������#���!11111111111111111111111111111113==��������������� !11!!!!!!!111111111111111111111111111111!!397�������� ��%��-� �����-�������� �)��- �/������������������$��*��#������������������!!!!111111111111111111111111111111!!392��������������������#���!1111111111111111111111111111111392��������������� !11!!!!!!!111111111111111111111111111111!!326�-���<��� �36!3 �36!5 �36!6 �36!7 �36!811111111�11111111111111!32;%3;8�������� ��'��5�#��6��)���1 ��#��##�����#�����- �/�����������2(�*��#������������������!!!!111111111111111111111111111111!!3;=��������������������#���!11111111111111111111111111111113;=��������������� !11!!!!!!!111111111111111111111111111111!545�
���

5 Role of Infrastructure in Poverty Reduction
T E R I Report No. 2004 RD 24
�
Executive summary �
�
*������ ����� � ��� ����� ��� ���� ������� � ���� $���� � "����� ���
����� �� ��������� !� ���� ��$��� � � ������ ���������"���� ����
��������� ��������� ���� �������"�� �$���� �����<����� ���������
������� � � ��������� ������� ���� ������!� ��� ���� $ ����� ���
������ ���� �������� � ������ ���������� ���" � ���� ������ ���!�
,�"�� ���� ������ ���� ������� � ���� $���� � ������� ���
�������������� �"�����"���� ��� ������� ����� � ������ ����� �
���� ���"��� ���� ��� � � $���� � ��"�� ��� ���� �����
�"������ �"���!�-��� �� ��� �$��������� ���� ������� ��� ���
� "��������������������������������������� �������������������
��������������� �������!��
���� ��������� ���#��� � ������ ��� ������ ��� $�� �������
����� ����� �� � � ��� ����� �� ������ ������ � ��� �"���� ��� ����
����� ��� $���� ������� ��� ��������� ���" !� ���� ���� ���� ����
��������������%��������� ��� ���� ������� �� � � � ���������2�
����� ���� ��������� ���#��� � ��� �� �� ������ �"��� ���� �����
*�����������������*��#��� �&��������� ���*� �������� ���������
*��#��� � '���� *���� &������?����� *��#��� � )�����
���� ��������� �������"���� *��#��� � ���� ��� ����"�� *�����
*��#��� � ��� �� ���� '������������ *��#��� � *������ *�"����
,������ *��#���� ��� �� �� ������ ��� "� ���� *��#����
"�������� ��� � !�25!8�$������!� ��� �� ���� ��������� ���� �"��� �
��� ����� ����� � ��"$��� ��� �� � ��� �"�� ���� ��� ����
���� �"���� � � ��� ��� $�� ��������� $� ���� 0�����"���� ��� �� ��
�����!��
���� �������� � ����$������"������ @�:������������ � �
���:����������� � !��
��� � � ���� �"��� � ��� ���� ��������� ���� �"��� �
:���������� � �� � "���� � � $���� ���������� �� ������
����� %"��� �"� �� ���"���� �� ���� ���$��� �����"��������"�
����� � ����� � ��� �������� �����"������ ��� ��� �����
������:�� !�-��������� ����$�����(,�������3+������� � �������
$ ��� ���������������� ����������� ������������������ ���������
���#��� � ������ � � ��������� $� � $����� �� � � ��� ���� ��������
$������� ���� �������� � ������� ��� ������� ���������!� �������
���� ���������� ���������� ������ � �������� ��$��������� ��
���������"���������������� ��������������� �������!�-�$�����
$��������� ��� ���� ���#��� � ��� �� �� ������ � � $���� ���������
��������������������������� �������������"!��
,������� 5� ������� � ���� ������� ��"������ ���� ��� ����
� ��� ���� ���� �� � � $ ��� ��� ���� *-&,� (*������ -�� � �
&��������"���,�"�����+�����������������!�������"���������
*-&,� ������� � ���� �� � � ����� ������ ����� � �"��� "��� �
"� �����"����!�������"������� �� ��� � �����:����� �� ����

6 Role of Infrastructure in Poverty Reduction
T E R I Report No. 2004 RD 24
���������������������� ���������� �������� ������������#��� ���
����� ������ ���� � ����������"$���������������������!��
,�������6������� �����"������ � �����������������������
������ ���� ������� ��� ���������� ���� ��������� ��� ��������
���$�� � ��� ���� ������� ������ � ��� ����� ����������� ����
����������� � ��� ��� �� �����������$�� � ��� �"������ ��� �� �����
���� ���#���� ������ � �!�!� ����������� ���������� ��� ���� �����
�� ����!�'����������� ����������������#��� ����������������
���������������������� ���������� ���������$ �����������!�!�
5444!�,�"���� � �������7�� ��������� ����"� ���� � �������
������������ �������������������� ����� A� ���������������������
����������$�� � ��� � �������$��!� �������� ����� ���� ������� �
������� �� � � ��� ���� �"������ ���� ����������� � ��� ����� �
�����������$�� �������������������������� ������� ������ ��� �
��� ����� ���� ���� ��� ������ ��� � ������� ��� $� ����������
��������� ���������������������$ ��������!��
,�������8� ������� � � ���� $ ��� ���� ��� ������� �"������!�-�
�������������������$������"�� ��������������� @�����������
�� ���$������ ��� ����"�� ��� � ������� ��� ����"�!� ��� ������� �
������ � �!�!� ����"���� ���"� ����� �������� �<"����� ����
������� ��� ���� ��������� ��� ������� ��� ��� ������� ��� ����������
����� !� ��� ��� � ������ � ��� �<"���� ���� �������� �������
������ ������ ������� ��� �<� ����� � ��� ��������� @� ���������� �
������ �������� �� ����������������������������$�!���
,�������=� �""�� � ����� ����������� �$ ������� ��"�� �
����������������#��� ����'����*���!� �����"<�"�"�����������
��� ������� ����� (���� ������ ����+� � � �$ ������ "���� �����
���� �������� ����� �(3=!8B����5444����8!;B���������#���+!�����
����� �� ��� ������� ������� ���� ���������� � ���� ����� ���
������ � ������� �� ��"������2B �64B����34B��� ��������!��
����:����������� � �� ���� ���������#���%�� ����� ������
������ !��������#����� ���������� �����-���������@��������� �
��������� � ����������� � �"���� ��� � ���$����!� ������ ����
:���������� ��"������� ���� ����� � ���#���� �"��� � ��� �������
�� � "���% ��� � ���� :��������� ��"������� ��� ���� � ��������
����� �"��� � ���� � �"���"���� ���������� ���(����+� �����
�������"���!�-��������� ���� ������� �� ��� � ��� � ����� "����
���������������� �������#����$���������� �( ���� ���""���� ����
����"��������������� ����� ���������� ��#����������������#����
��� !� � ���� ��� �$ ������� � ���� ���� ���#���� ��� "���������
$����@��
�
• &����@�'���� ����$���� � ����� �� ��"��� �� ������ � �<�� �
������
• C����� � (��� ����� ���� ��������+@� '���� �� ��"���
�� ������ �������"����������������"���
• ���� ���� ����"�@� ,������ ����� �������"���� �������
����������"�����������"�����
7 Role of Infrastructure in Poverty Reduction
T E R I Report No. 2004 RD 24
• ��� "� ���@� ������$������ ��� ����� �������������� �
������������$�����
• ���� ����� *��������� �������@� ������"���� ��� �����������
�������� ����"������������������
• ��� ��'����������@�'��������������
• *������ *�"���� ,�����@� '���� �������� � ������ �����
�������"���� ������ ��������������������"���"���������
• '����*����&������ ����@�'�������������
����������������������

8 Role of Infrastructure in Poverty Reduction
T E R I Report No. 2004 RD 24
�
CHAPTER 1 Introduction �
�
*������ � � ������ �� ���$��� � � ����������� ���� ���
����������� ��� ��"�� ����� $���� � ��� ���� $ ����� ���
������������ � ��� ������ �"� ������"����� ��� ��"�������
��� �������"���!� ���� ������"���� ��� ����� �������?� � ��� �
���� ���������������������� �$�������������������$#�����������
�������"�����������!��
� ���� ������ �����$������������ �����������%$����� ������
����"� � �����"� � ���� ��� ������� $������ ������������ �
����������!������� ��� ���� ����� ������������#��� ����������
������ ��� $�� ������� ���������� �� � � �������� �� ������
������ � ��� $�� ���� ��� �"���� ��� ���� ����� ��� $����� �����
���" D�������� ����� � ��� �� ���$�����D��� �� ����� ���" �
������������������������������� ����������������"����������
��"������$����"!�
� ���������������� �����������������������(����+� ���
���� ������� �� � � � $���� ���������� ������ ���� ���������
���#��� � ������� ��� ����� � � � ��� �������� � ���
������""�������� � ����� !� ��� ���� � ����� � � �������
����<�"���� �*E� 3 834� $������� (F,G� 37� $������ � � � =77�
$������+�"������������ ������������#��� !������������ � ��� �
������"������ � ������"�������2����� ������������#��� �
���������$������������� ��������� �������!���
� ��� � ����� �$����������������������"���������"��� �
��� ��������� ��������� ���� ��������� ���#��� � �������� $����
:��������� ���:���������� � "���!�C��� ����:���������
� "���� ��� � ���� �-�� ��������� �������� (�������� �
��������� ������������ ��"������� � ���$����+�����������
�� � � ��� ���� ��� �"��� ��� �<�������� ����� ���������� �
�$������ �������� ����:�� �������� � ���� $���� ��� ������!�
�������������"��� �:���������� ��� � "����� �$����
���������� �� ������ ����� %"���� � "� �� ��� "��� � � ����
���$��� �����"����� ���"� ����� � ����� � ��� ��������
�����"��������� ��� �����������:�� !��
� ���� �� ��� � �$���������"� ���� ���� ������:�� � ��� �����
�� ��� ��� �����"���� ���� ������� �"���� ��� ���� �����
������������� ������������#��� ��������������� �������������
��������� �������!��
�
Infrastructure, growth and poverty reduction ���� ��������� ���� �"��� � ��������� ���$�� ������������
����� ������ � ����������� ������������ !�'������ ��������
� �����������$�����������������������!��<%��� �����������
���"� � ����� ������ � � ���� � �� ������ ������� ���� �<� � �

9 Role of Infrastructure in Poverty Reduction
T E R I Report No. 2004 RD 24
$������� ���� ��������� ��� ������ � ��� ��� ������� $�����
������� ����� ������� ������!� ���� ���������� ���"���� � �
���%�<������!���
�� SOURCE Ali and Pernia (2003) �
� ,�"�� ����� ������ ���� ��������� ��� �� � �"���� ��� ����
��������$��������������" D������������� ������ ���$�����D
��� ��������� ���" � �������� ���� ������ ������� ������ � ���
������������"���������� ��"������$����� ���������(-������
*�����5446+�!��
� �������;4A ����� ����� �������������"��$�������������
���� ��������� ��� ������� ���������!�H������ ���"��������
�"�������� ��� ���� ��������� ��� ������� ���������� ������ � ���
����������� �����"�� !� � ��� ���� ������ ����� � � ����� ����
���� ��������� � � ������� ����� ������� "� $� "�� ��� ����
������������ �������"���� ��""����!� ������ ����� ������
�� �� �������� � ������� "�(-������*�����5446+@��
�� ������� �"������� ���� �����"��� ������ � ���� ���������
���� �"�����������������������������������������!��
�� -����� $������ � ���"� ���� ��������� ����� �� � ����
���������!�

10 Role of Infrastructure in Poverty Reduction
T E R I Report No. 2004 RD 24
�� ������������������� �������� ����� �����������������
����� ���������$���� ���� �"���� ������ !���� ������ � ����
������$������ ��� �����"��� ������� ��� ���� ���$����� �
������� ����������"���� �������������� �������#��� ����
������� ������!���
�� '������ ������������$������������ �������������������
��� �� ������������"����� � ��� ����������� � �����������
$������� ���� ��������� ��� ���������� ��� ������� ���� ����
����������������������������������!��
�
Background of the infrastructure projects in West Bengal ,���������� ������������#��� �����$�������������� ����� ��
������������� ������ �� ������������������$������� �����
��� ���� ���� �������� � ������ ������ � ��� ����:����
������������� !�,�"�������� �����#��� � ���������$���������
$�������� �� ���$�����(�$���3!3+!���
Table 1.1 JBIC projects in West Bengal�
Sl. No Project
1 Metro Railways Construction Project (Phase II)
2 Haldia Port Modernization Project
3 Industrial Pollution Control Project
4 Kolkata Infrastructure Development Project
5 Bakreswar Thermal Power Project
6 Teesta Canal Hydroelectric Project
7 Purulia Pumped Storage Project
8 West Bengal Transmission Project (I & II) ��
��� ���� � ���� � ��� ��� �� ���������� ��$���� ��� �����
���� ��������������� � ���������"����������������������� �
���� 0�����"���� ��� ����� � �$�� ���� ���� &�����������
��� �����*��#���� ���&��� ���������� ����3;=;!�-����#����
���� ���� ��� ��������� ��� � "����� ����� ��� ������� � �
�������?��� ������ ���� & ���� *��� (���� F�$�� �����
��� ����� �������"���� *��+� � ���� ���� ��$��� ������� ���
���� �������A ��� ������������$��" !�������� �������� �
� ��� ����$��� ��"�� ����%���� ��� ���� ���#���A � ������ ���� �
������� � ���������������"�����������-��� ��3;29 �$�������
������ ��"������� ���� ��������3;;=!�,�"����� ���� �� �� �
������������������� ������������� ���������:�� ����� ������
����� ���� ��"�� ���� �"�������� ��� ��������� "������ �
������������ ��� ��"�%��� �"���� ��������� ��� ���� ���
��� ��������� ���� ���"��������$���������������� ��������
�������� ��������������� !��
�

11 Role of Infrastructure in Poverty Reduction
T E R I Report No. 2004 RD 24
� ����'����*����&������?��������#�����"������ ���"����
���� ���� ��� �"�������� ���������� ���������� ��� ���� �������
���� !� ���� ����������� � ��� ���� ���#���� � � ����� ��������
����� � ��������������������"�������������������������� �
(����� ����� ����"� � ��� ��������� �������� ����"� �
����� ��� ��"������ ���5445>46+!� ����"#��� �"���� ����
���� ���#���� $������� � � �������� �����"��� ���"������ �����
���� ����� ����� ��� "��������� � ��� ���� '���� ���
����� ���� $� ����<�"���� 29B� $������� 3;;9>;2� %��
5445>46!�
� ������� ������'���������������#�����������������������
�� ��������,�����������"����*������� ����������������
��"�� ����� ���� ���� �������� ���"� ���� ������ !� ���� 8�
����� ������ ����� � ��������� 3 =44� &� � ����� $�����
��� �������� ��� ������ ��� ������� ���� $� ��"�<� ��� ����������
�����!��������#����� ��<����������������$�������������������
��������������� ��� ���� ��������� ���� ��� ���� ���!� ��� �������
������� ����� � �$���?���� ������ ����� ��� ���"������
�������� �������"���� ��� ��#������� ��� �� �� �������
�� ����� � ����� �� ������,���� �������� ���� ��� ��������� ���
������ ������������� ������ ����� � ��� ����&�����&���
����(&&�+����������� ������������*��#���!���
� *������*�"����,������*��#����� � ��������� ����<����
���������� ��� ���� ������������������������������������ !�
�� � ������ � �������� ��� ��������� ��� *�"���� ,����� �
��� ������������������� "� �������� �����<��� �����������
�$% ����� !�
� ���� ����� *����������������� *��#���� � � ��������������
�����������������"��������������������"����$������ ��������
�� ��������*�������������������������"����$����������
�������� �����:���"��� ������*��A ������� �(�������������"�
������� �$������ ��� �������� ������� ��"� ��������
�$�����+��������������� �����������������������������
�������� � ����� ��� ���� ����� ��� ���� ����� ���� � ����
�����������������������$��"���!��
� -��������"����������� ������������#���������"��������
&�5447�� � ������ ����������� "� ����, ��"�*��#���!�
�� ��$#�������� ���������������$����������� "� ���� ��" �
��� ��� "��� ���������� �����% ���� ������ ��� "� ��� � $�
��� ��������� ��"������� ������ ��� "� ���� �������� ���
��� ���������� �$ ����� �����<�����<� ����� �$ ����� ����
�� ��� �� ��� �������� ������ ��"��� ��� ����� �� ���
���������� ������ ��� ��"���� �� � ��� ���� ���� ��� �� ��
�����!� - � �� � ������� ���� ���� ���#���� �" � ��� �������?��
���� �� �����"�����������������������������������""����!�
� ���� ������� ��� ����� ���� ��������� �������"����
���#�����"�������������� ��� ����� ���� ��������� ����� ��
����� �$�$�������������� �����"������������#������� ����

12 Role of Infrastructure in Poverty Reduction
T E R I Report No. 2004 RD 24
���������� �$����� ����������������������������������
� !��
West Bengal economy ���� ������ ����� ������� ���� ��� ��������,������"� ����
*�������(�,�*+������ �������� ��� ����� ��������� �$����
2!88��������� ���������� ���������!������������" ��������������
�������������"���� ��������� ������"����$�������������
������ ��� �������������� �%�����" ���!����� ����� ��������
������ ������� ��� =!53� ���� ����� $������� 3;;6� ��� 5446�
��"�������������������������"�������7!58���������!���
Table 1.2 Net State Domestic Product at factor cost (at constant prices) (1993-94) (Rs crore)
Average growth
Average growth
States 1980-81 1990-91 (Per cent) 1993-94 2002-03 (Per cent)
West Bengal 9594 14458 5.06 48398 89792 8.55
India 401128 692871 7.27 781345 1318321 6.87
Note * 2001-02 figures for the states of Punjab
Source CSO, Economic Survey 2004-05 and RBI ��
Agriculture � Table 1.3 Land availability, usage, production and yield of food grains in 2001-02
States Irrigated area as per
cent of total
agricultural area
Production (million
tonnes)
2001-02
Yield (Kg/per Ha) 2001-02
Average annual growth in yield
per cent 1991-
2001
West Bengal 28.10 16.50 2424 1.90
India - 212.03 1739 2.58
�
�
�� �������� ��� ����3;94 ��������������� ���� ���������
��� �������������������������%������ ��������3;24 ����� �
����� �� ���������� �����������������������=!8�������������
����� ���� � ����������!1� �� �� �����A � �����������
������"���� � � ��"��$��� $��� �� ��� ��� � ���������"� ����
$����"�������" ������������������!2����
���� ������� ���� $������� ���������� ��� �����������
������������ ��� ������� � � �����%������ ���� ��� ���� � ���
��$�����������!��� ������������������ ������������������ ��
������� ����������%����� �������������������� ���������
5757� ��� ���� �� � � �$ ������� ������� ���� ���� �������
�����!� ���� ���� ��� � �� �� ������ ���� � ����� ������ ���
1�����#�������! �5445�2�0��� �"�����! �5448�

13 Role of Infrastructure in Poverty Reduction
T E R I Report No. 2004 RD 24
����������� � �� � ����"�� ��� ����� ����� ����������� ���� � ���
������ ����� F*� ��� *��#$!� ���� ����� ����������� ��� �� ��
�����A �������"���� ����������������"� �����������������
��� ������������������������������������� �������� ���!����
3;;3%;5 ������ ����"������� �������� ������������������72���
������ ��� �����������,"����,���� �24!=;����� ����� ������
��"�� ������ �������������"��������"�� ���������������
6;!;2���������������������������!�3���
Industry ��� 3;24%23� �� �� ������ ��������� ;!2� ���� ����� ��� ����
���� ����������������������������!����3;;9%;2 �������� �����
��� ����������������������������"$�� ����� ����� �8!3�
�������� �������"���������7!9�������������3;;8%;=!�H���� ���
�������"���"������������������������ �����������������
�������3;24%;9I� ��� �������� ��"���"���� ��� ��������� ���
������� �������������������"�34!27���� �������������9!;;�
��� !4� ��� � ���� ����� �������� ��� �� �� ������ � � ��� �
����������"����������� ���������������� ���A ������"!�����
�������"����������� �������������������� �����������"�
3=� ���� ����� ��� 3;;6%;7� ��� 37� ���� ����� ��� 5445%46!� ��� �
�������������������������������� �����������������������
������� � � ������ ���������!5���� ���� ��� ���� ���� ��� � �
�����"������������������$����������������� ������� ������
�� �����"���������������������� "����"�%������!������
Infrastructure -�������� ������� ��� ��������37���"���������� ��� ����
3;;9%;2�������" ������ ����<�������� �������� � ���"�����
�����7����� ���������3;93%95!6����� ����<���"��� � �(+���� �
���� ����� �($+���������� �(�+����������� �(�+���������� �(�+�
���%���� ������� ����$�� ����(�+��<������������������� ����
������"���!� ��� ���� ��� ��� �� �������� � �� �� ������ � �
������$���������������������!��
� *���� ��� � ���� ���"��� � ��� �� �� �������� �� � !�-�
� �� ��������������"���% ���������� ���*������ �����������
������� ��� ���� ����� ����� � ��� � ����� ����� $� ,�����
������������-�����,��������� ���������������������
���� � � 58%64���� �<��� ���� ��� ��������� (��"����� ���
��:������������������������ �� �23!8����+!7�������" ��������
��� ����������� ��� ������������� ����$�����$���������
��%����������!�
����������� � � ������� ��� ������ ��� ����������!� ����
��������%,��� ������� "������ � "�� � � � ��� ���" � ����
$��"�� ���%��$��� �"��� $��� �� ���� ���� �� � ���� ����
3��,,H������� !�4�����#�����!��!��5�����#�����!��! �5445�6��������$�0�� � �5443�7�-�����,�� ���&�)���� �5443�

14 Role of Infrastructure in Poverty Reduction
T E R I Report No. 2004 RD 24
���"� ��� "����� ��� ��������������"���,��!�����*�������
��""� ���� ��� ���� ���� ������ ����� ��������� ��
���������76!98���������������������������5443%45������3;;6%
;7 ��� ��������������$������������������ �����62!=7�����
����!8����� ��� ���" � ������� ����� ��� �"������������������� �
������ � � � $������ ��������� ��� ���� � ���� � � ����� � �� ��
������ ����� �� ����� �� ��� ��� �"������ $� 62!33� ���� �����
��"����� ������ ��� �� ��� ���� ������� ����� �� ���74!53� ����
����!� ������ �� �� ������ ���� ����� ����� ��� ���" � ���
��� �"����� � ��� ����� $������ ��� ���" � ��� ��������������� ���
������ !�-�������������5445�����92!39��������������� ������� �
����� ����������� ������� ���� ������������ ������ �2=!=8�����
����!� ��� 5445 � ������ ��� � (-* � '�� �'* �)���� �
)��� � &�� �� � *��#$� ��� �"��� ���+� ���� �"� ��
��"��������������(*���������""� ����5445+!���
Poverty and backwardness ����� ���� �*&� (��""��� �� *��� ��� ����� &�<� � +� %����
����������"���������������� �����������3;99���������������
��� ������� ��� ���� ���� � �=4!85� ���� ���� � ����� $���� ����
��������*.�($����������������+����83!65���������!����3;;;%
44� ��� �� ����� 59!459� ���� ����� ��� 5=!3410� ���� ���� �
�� ��������!���� �"�� � ���������� ��� ��$����� �����������
���������� ���$�88!68���������������� ������ ������� ����
��� ����� ���� �������� � � 7;!55� ���������� ����� !� �� ��
�����A ��*.�������� ��������� ���������� ���������������������
����� ����- "�(6=!4;���������+ ������(75!=4���������+����
H�� � (79!38� ���� ����+� ��"������ ����� $���� ���� �������
�����!�����������"��������� ��������� ���"��$����������
���&�� ������������������������"�3;99%92����3;;;%44�� �
88!52�������������58!45��������������������������������������
88!55���������������� !�������������������������"�������
�� �� ������ ��� &�� �� � ���� ���"��� ������ �����
�� "���������" �������� ������<�� ��������������������� ��
��������� ������� ������ ���������������$�����������������
"������������"������� ��������� �$������ ���������������
��������������������� ����������!11�������������������"�� ����
���" �����������������������������������������$����)��� �
�"������ �-*�����# ���!����)�����*.����������������
���"�85!55�������������3;99%92����35!958����3;;;%44!�
8�*���������""� ��������������,�� �5443�9��������'�"���������"���������� �5443�10��������'�"���������"���������� �5443�11�0��� �"���!��! �5448�

15 Role of Infrastructure in Poverty Reduction
T E R I Report No. 2004 RD 24
�
References -��������*������!�5446�
������������� ���� ������ ������������� ��� ���
����������
- ����������"�������!��
�
����#��������!�5445�
� ���)���� ����������+��� �����5�#��6��)���
!���� �������� � ���&����� �H���$���35 �5445�
�
����������,����,���-!�5443� �
� �����������������������������������������
)����@��������� ����������&���"����
�
��������������!�5443�
+�������1���-� �� �����#��-�� � �����,��������,��� ���������
!���� �������� � ���&����� �H���$���= �5443�
�
0�� ���!�5443�
�����'����� � �&�34 �5443�
�
0��� �"�����!�5448�
��������� 7 � ��� ���� 8���������� ��� 5�#�� 6��)���� ������
��� � �*����������
!���� �������� � ���&����� �&�53 �5448�
�
.�����-!�5444�
�9:;��������-�9����<����������������
!���� �������� � ���&����� �-�����5; �5444�
�
&�-!�5446�
������������������������������
���� �����@� ����������� ��� �����"�� � ��� ,��� ��� � &��� ��� ���
-�����������
�
&�C!�5448��
�������������� !"� #�
���������@�0�����"����������� �&��� ������C������
�
*���������""� ���!�5445�
$��%���������������&���������������' �������(�������
$���������()���
���������@�H����������������� ����0������������� �&��� ������'�"��
-���� �0�����"������������
�
*���������""� ���!�5445$�
;��������3�����8����������+��� ����00��
���������@�*���������""� ��� �0�����"������������
����&�0!�5445 �
�����)���������������
�����������������������*���������""� ����
�
����������-���$?��*���� ������35 �5443�
�

16 Role of Infrastructure in Poverty Reduction
T E R I Report No. 2004 RD 24
,��-����,�"������&!�3;;7�
�) ������ ��� 7 � ��� ��� 5�#�� 6��)��� ��� ���� �2�0#�� �
�� ����������$��� ����� �������� �
!���� �������� � ���&�����!�&����5= �3;;7�
�
1�������#���������������A �$� �������� �� ��� �
��� �*��� �-��� ��3= �5447�
�
*�������'�������+���,�����
���������-������������"������,��� ��� �0�����"��������� ��������
�
*�����������������������������
�&�� �0�����"������������
�
*����������������-�������������������������
0�����"������������
�
������
�������

17 Role of Infrastructure in Poverty Reduction
T E R I Report No. 2004 RD 24
�
CHAPTER 2 Analytical framework for quantitative analysis �
Adapted PAMS (Poverty Analysis Macroeconomic Simulator) framework �
���� �������������"������������� ��������������A �
*-&,�(*������-�� � �&��������"���,�"�����+!� �*-&,�
� �$� ��������� ����"����� ������������"�����(� "%
� � � ��� ���� ��""��������+!� -� � � �� ������������� �
������ ���������� "���� � ���� "� ���� ���� ���������� ���
�� ���$������ ��� ������� ��� $�� �������� ��� � $����� �� ����
���������� ���"����� �����$������������� � ���� �,�",�*�
���*��,���(� "%� ��5448+!�- ���,��������!�(5446+�
������ ��� � ���� ��� ������� ��� ���� *-&,� ��"������ � � ����
�����������"�������"� �������"���������� �������������"@�
�
+*#�������������������,�� ���#������ � � ������ ������#�����
�� ������� ��� � �������� ����� ���� ���� � �� ������ ��� ���
�������������-��������#����� ������������ ��������#�
�� ������ ����� �� �������� ./"�0� ��� ������1� *#�� �����
��2� ������������� ����#������������ ����� ���#���#���
������� ��������� ���� �����������1����#��� �������������
������������-������� ����������������������������������
��� � ��� ��� ���� ���� �� �� � ��� �#�� ���� �����
�����#�� ���������� ���������� ��������� ��� ��2�� ���
��� ���� ���� ������ � �#� �#�� �������� �� �������1�
*#���� �� ��� ��� �� ����#���������� �������������
�#�� #����#���� ������� �� ��� ��� ���� �#�� ������ ���
�-���� ������ ��� ��#�#����#���� ��� ����� � ����������� �#��
�������������#��������������#����� ��� �������� �����
��� �#�� ���� � �� ������ ������� ��� �#����� �� ��������
�� ����13��
� *-&,�� ����"����������� ���������� @�"��� �"� ��
���"����!������$#��������������"��������� �������#����0�*�
���������"�������$�� !������$#��������������"� ������� �
��� �<"���� ����"� � ��� ���������� ����� � ��� ����� ��������
��� ����� !� ���� "����� ���� �<"��� � ���� ������� ��� ����
����� ��������� ����������� ����� �����"�����������!��
� -���������������*-&,�����������C ��� ��������������
������� ����*����������������,��������������������$� ����
������ ���� ��� ������� C �� (�� ,���� ��� �!� 5446+!� ����
"���%��� � ����� ������� �&,&%J�� � � ��� ��� �<"����
���#������ � ��� "��������"��� ���$�� � ���� � 0�* �
���� �"��� � ��$�� $������ ���!� 0����� ������� ������� ��� �
���#������ ���� �����$����"���������� ���������� ��������

18 Role of Infrastructure in Poverty Reduction
T E R I Report No. 2004 RD 24
������������� ������ ��������� � ���������"�� ��������$��� �
��$�� ��������$��� ������$���� �����!��
� -���������� �"����������������������*-&,���"���������
*����� �������,�",�*� �������(��������!�5446+!�������� �
��������� � ���� ������� ��� ������� ��� ���������� ����� �
(���������� � ������ �������� ��+������������������� �� �
������!��
� ���� ��� ���� ���� ��� $�� ���� � $����� �����"������ ���
������ $������� ���� *-&,���������� � ����������C �� ���
*���!����������� � ����� �������$�������������*����
����(���������� � ������ ����� ��I����� ���$�+������ ����
���������"�������"� ����� � ���������������C �� ���!�
'������ �����"�������"� ����� ����������� ���� ����� ��
�����"�������� � !�
� ���� ���������� ����� � ���� �����"����� ���� ������
���������"�����@�
�� ����� �� ���������$������������������������#����
�� �������$�����������
�� � C������ 5!3� ��� � ���� ���������"������ ���� � ��� ���
��� �� ���!����
��
Qualitative analysis
Macro
Meso
Micro
Infrastructureprojects Infrastructure output
Growth in sectors:agriculture, industry and
services
Growth in employment inagriculture, industry,services, urban, rural
Changes in wages
Changes in labourforce distribution
Changes in representativehousehold income: urban, rural,agriculture, industry , services,
Poverty line:urban, ruralchanges in poverty
in West Bengal
Investment, fiscalindicator, other
variables
19 Role of Infrastructure in Poverty Reduction
T E R I Report No. 2004 RD 24
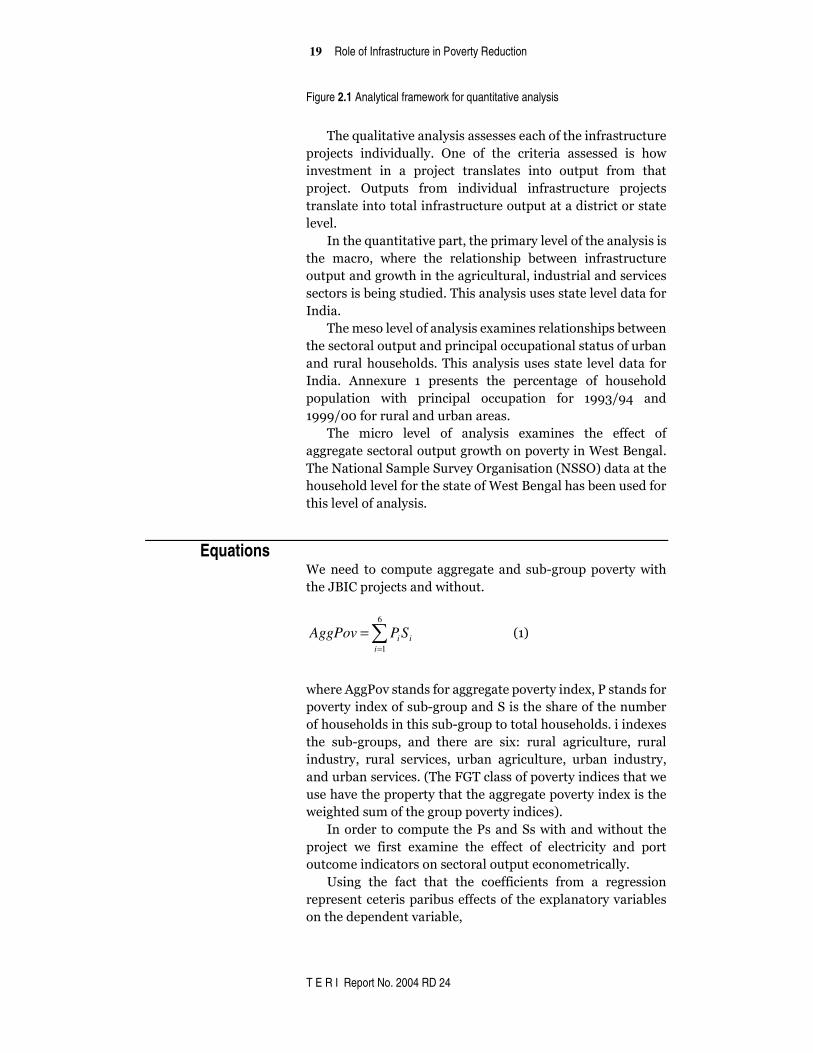
Figure 2.1 Analytical framework for quantitative analysis
�
� ����:����������� � � � � ���������������� ���������
���#��� � ����������!� H��� ��� ���� �������� � ��� � � ����
���� �"���� ��� � ���#���� ��� ��� � ����� ������� ���"� ����
���#���!� H����� � ���"� ���������� ���� ��������� ���#��� �
��� ������������������ ��������������������� ��������� ����
�����!��
� �������:������������� ��������"����������������� � �� �
���� "��� � ������ ���� ������� ���� $������� ���� ���������
���������������������������������� ����� �������� ������ �
����� �� �$����� ������!���� ��� � �� � � �����������������
����!��
� ����"� ������������� � ��<"��� �������� ��� �$�������
���� ������������������������������������� ��� ������$��
��� �������� ����� !���� ��� � �� � � �����������������
����!� -���<���� 3� ��� ��� � ���� ���������� ��� ��� ������
���������� ����� ��������� ���������� ���� 3;;6>;7� ���
3;;;>44���������������$���� !��
� ���� "����� ������ ��� �� � � �<"��� � ���� ������� ���
�������� ������������������������������������ �������!�
�����������,"����,�����H���� �����(�,,H+����������
��� �������������������� ��������� ��������� �$����� �������
��� ������������ � !����
Equations �������� ��� ��"����� �������� ��� �$%������������������
������������#��� �����������!��
�
�=
=6
1iii SPAggPov �� � ��(3+� � �
�
������-��*��� ��� ������������������������< �*� ��� �����
�����������<���� �$%���������,�� ����� �������������"$���
������ ����� ������� � �$%����������������� ����� !�������<� �
���� �$%����� � ��� ������ ��� �<@� ����� ���������� � �����
���� �� � ����� ������ � ��$�� ���������� � ��$�� ���� �� �
�����$�� ������ !�(����C0���� ����������������� ��������
� ���������������������������������������������<�� �����
��������� �"��������������������������� +!�
� ��������� �����"����� ����* ����, ����������������� ����
���#���� ��� ��� �� �<"���� ���� ������� ��� ����������� ��� �����
�����"���������� ���� �������������������"�������!�
� F ���� ���� ���� ���� ���� ����������� � ���"� � ����� ����
����� ���������� ����$� ������� ���������<����������$�� �
��������������������$�� �

20 Role of Infrastructure in Poverty Reduction
T E R I Report No. 2004 RD 24
�
portdiseltotpcoutpc jP
jEj ∆+∆=∆ ββ ���(5+�
�
������������� �������������������� ���������� ����������������
��������� ((������ ���$����� K� ���%�������
���������+>���������+� ��� ������ � � � ���� ����� ���������
( �"� ����� ���������� ���� � ���("#��� ����� ����>�� ����� ���
��������"����������� ���++!������������������ �����<�������
��� ���� "���� ������!� #� � � �� ����<� ��� �����"��� ����� �
(���������� � ������ �������� ��+!����� �$ ��������� ���������
�����������$�� �������� �$ ������*�� ��������������� ����$��!��
�,�"���� ��
�
totoutpcoutshS totoutpck
kki ∆+∆=∆ � γγ ����(6+�
����������� ��������� ������������� ��������������� ��������"� �����!� ��� �� � � ������� ���� ��� ���� ��� ��� ������ �
����<���$��������������� �����!���������� � ����� ������������
��������!�
� ��� �"����������� � ������������ ����� �$���������
���� �$%������(�+��<���������������� �����������"����������
����� �<��������� � ("���+� �� � ���� �:��� ��� ���� ���� ���
����� �� ��� ���� ������� ��� ���� ����� �������� ������ (#+!�
,�""�� ��� ��� � ���� ��� �� =� ���������� ����� � � � $����
������������-���<����3!���
)1(j
jii outpc
outpcmpcempcegr
∆+= ������(7+�
���� ������� ��������� ���� � �$%������ � � � ��������� ��� ����
"����������� �$%���������������������������������(��������
��$�+!���� ���
),(),( // URiURii plinempcegrfplinempcefP −=∆ ����(8+�
�
�:������(8+������ ��� � ����� ��"�������������� ����������
�������������������#��� !��
�
� ���$�����$�� ��"���������� ��� �����������(5+ �������
� � ���� "���� ���� ( ��� C������ 5!3+� ��� ������� 6!� ��� �����
� ��"��� ����� ��� � ���������� �:������ (6+ � ������ � � ����
"� �� ��� � ��� ������� 7!� ��� �� ����� ����� ���� �������
�"������ �$ �������:����� �(3+ �(7+����(8+�����������8!�
����������� ���� �� � � ���� ��� 3;;;>5444� � � $����
����� � ���� $ �� ��!� ��� � � � $���� ����� ����� ��������
������� � ��"����� � � ���������� $� ���� ������� ,"����

21 Role of Infrastructure in Poverty Reduction
T E R I Report No. 2004 RD 24
,�����H����?���� �0�����"����������������:���:�������
$ � � ���� � �� � ��"�� � $����� ���$��� ���� ���� ���
3;;;>5444!����� �� �� �"��������������#����$������ ������
��������?������3;;;>5444 �"������� �$���������"��� ������
�� ��� � ����� ���� ���#��� �(�!�!� $ ��� ��� ���� �"������+� ���
��������($ �������3;;;>5444+!��
�
References ��,����.�-�* �� "%� ��� �,"����!�5446�
=��!��)� �)) �)���� &�� ����#�#������ &����#� ��� 3��#������
� ��#������������ � �"��������"��� �"����� ����*-&,�
���*#�� ������������ ����� � ����������������� ������ ��� ��� �� �
�������$������������������,��� ���!�568D5=4�
� ������� ���@�����������
�
����0 ��"� �) �&�� $�������� ������������������L!�5446�
- �������)����������������)) �)����7 � ������-�� ���
���*#�� ������������ ����� � ����������������� ������ ��� ��� �� �
�������$������������������,��� ���!�538D566�
� ������� ���@�����������
�
� "%� ���!�5448�
.����������'�����,���������� ������/���������������
����.�����4����� ���������� ��������#���
�&�"���
�

22 Role of Infrastructure in Poverty Reduction
T E R I Report No. 2004 RD 24
Annexure 2.1 Table 2.1.1 Percentage of Household Population with principal occupation, 1993/94 and 1999/00, rural and urban State Agriculture Industry Services
Rural Rural Urban Urban Rural Rural Urban Urban Rural Rural Urban Urban
1993-94 1999-00 1993-94 1999-00 1993-
94
1999-00 1993-94 1999-00 1993-
94
1999-00 1993-94 1999-00
Andhra Pradesh 57 56 5 3 7 6 6 8 11 10 14 17
Arunachal
Pradesh
64 69 3 1 6 10 3 1 16 13 8 7
Assam 68 54 3 1 3 5 1 1 17 28 8 10
Bihar 73 70 3 2 4 7 2 3 10 11 7 7
Goa 28 15 7 2 10 12 11 18 19 21 25 32
Gujarat 48 51 6 2 9 7 12 12 9 9 17 18
Haryana 44 43 3 2 8 11 9 12 17 15 18 18
Himachal Pradesh 58 51 3 0 16 23 2 2 14 17 7 7
Jammu & Kashmir 46 50 5 1 13 13 4 5 14 18 18 13
Karnataka 55 58 7 3 5 5 8 10 9 8 16 16
Kerala 44 38 8 5 12 15 6 7 19 21 11 13
Madhya Pradesh 67 67 5 3 4 5 6 6 5 6 13 12
Maharashtra 47 46 5 2 6 6 12 14 8 9 22 23
Manipur 47 58 8 5 5 4 2 2 21 15 17 16
Meghalaya 68 71 2 0 3 2 2 2 14 10 12 16
Mizoram 54 47 10 8 2 2 3 7 10 11 20 26
Nagaland 46 48 3 1 3 2 4 4 24 17 21 27
Orissa 69 67 3 3 7 7 3 4 10 9 8 10
Punjab 46 42 3 2 8 9 10 15 14 12 18 20
Rajasthan 54 52 4 2 13 15 7 8 9 10 14 13
Sikkim 51 56 2 0 8 8 1 2 32 25 6 10
Tamil Nadu 43 44 7 3 10 11 11 12 11 11 18 18
Tripura 44 44 2 1 5 11 1 2 37 31 10 12
Uttar Pradesh 62 58 4 2 7 10 5 7 11 11 11 13
West Bengal 47 51 4 1 11 10 9 8 15 15 14 15
Andaman &
Nicober Islands
32 42 3 3 18 15 9 8 19 13 19 19
Chandigarh 1 3 8 3 5 7 25 21 6 7 55 59
Dadra & Nagar
Haveli
44 39 1 0 17 29 3 7 31 19 4 5
Daman & Diu 22 21 8 8 17 27 10 8 20 13 23 23
Delhi 1 1 8 0 5 5 29 20 5 20 51 52
Lakshadweep 22 25 23 15 9 14 7 4 20 24 20 18
Pondicherry 26 24 14 4 7 10 19 26 6 8 28 29

23 Role of Infrastructure in Poverty Reduction
T E R I Report No. 2004 RD 24
CHAPTER 3 Macro analysis ��
��� ��� � ������ � ��� �<"���� ���� ������� ��� ���� ��������� ���
������� ��� ���������� � ���� ��� ��� ������ !� � ��� � � ��� ���
���������� ������ ����� ������� ������ ����$�������������
,������(5447+!� �������"� �� ����� � � �� ��� %������� ���
�� ����� ������������������������� ��� ��������!����� ��
� ��� ���������������������������������������"� ��� !�
�
Methodology H���$ �������� �����:������� �����������"@�
�
it
itcontrolitj
Pitj
Eitj
ityheterogeneunobserved
controlportdiseltotpcoutpc
εββββ
++
+++= 0,�
�
������ ������ � � ���� ������� ���� ����� ��� ���������� ����� !� #�
������ � ����� � (���������� � ���� ��� ��� ������ +!� �������
��� ������ � ��� �������� � ��� ����������� ��� ����� �����"� �
���� ��� �� �� ��� ��� ������� ������ ��� ���� ������� ��� ��!�
*���� ��� ����� ��� � ����� � � ��� �������� ���� ���$ ������
����������������� � ���� ������� ����� �( ��� +���������
��"�!� ��� � ����� ���� �:������ ������� � ���� � ��"�� � ����
�:������ (5+� "��������� ��� ���� ������� ��� �������
��"����� ��������5!���
Data Sources
�����������-������ �,��� ��� �(�-,+� $������� ���� $� ����
�������,��� �����H����?�����(�,H+�� � ����"��� ���������
��� ���� ����� � �������� �����"��� �������� � ��� ����!� ����
������������"������������������"������$����� ��� �����
�����"��� � �������� � ������ �(���� � � ����,��� +� ��� ����
�,H������ �������� �������!�,��������������������� ����
���� �������������������� ����"��$����������� ������ � ��� � �
����������������������������������� ���� �������� �������
��"��$��!�'������ ������,H�� �$�������������"��$���
�������� ����"�� ���� � ���� ���� ����� �� ��� C������
��""� ���� ��� ����!� ���� ��� ���� � � � ���$��� �� 5�
����������$ ���������� @�(3+���3;24%23������ ��������������
(5+� �� 3;;6%;7� ����� !� ���� ��� ���� ���� ���� � � $����
�$�����������������"��,H!��
�����,H����� �� �$���� �������� ������ � ��� ����������
��!� ������ ��� ���� ��� ���� ������ ���� %� ��������3;24%23�
����� � ��� ���� ����������3;;6%;7������ !�,����� ���� ��� ����
������ ���� ����� ���� ������� ������� ��� ���� �� � � ��3;;6%;7�

24 Role of Infrastructure in Poverty Reduction
T E R I Report No. 2004 RD 24
����� � ������$���$������ ����������� ������������������� �
$���� ���������� �� 3;;6%;7� ����� � ��� � � $���� � ��� ����
��������� � ��� ��������� �� ��� !� ��� ������ ���� � ��� ����
���$�� ������� � �������"� �������3;;6%;7������ !�
� ���� ���$�� � ������ ���� $���� � ��� � �<������� ���
���������� ��"��������"������������ � ����� ������� �����
$���� ������� ���"� ����� � ��$������� � ��� ������� ����
&���������� ��� ���� �����������"!�.����� � � �������$�� �
�����������������������������������������$������������"�
��������� �� �� ����-�����������,��� ��� �����&��!�,�"�����
���� ��������� ������������$�� ������ �������������$�� �
��� � � $���� ������� ���"� ����� � � �� � ��� ����� �
���� ������������*�$����C����������&��!������������" ����
���� �����������$����� ��� �����<����$��������<������
�����"���� �F����/��������<���� ��<��� ��� ������������
���F����/���� ��� �"���� !� ���� ��� ��� ���" � ��� ����� ����
$������������"������ �� �� ���������"���,����!���
Basic statistics �������$�� �� ������������ � ��������������$���6!3������
����� ������ ���� !�����"��� ��� ������������������� ����
���$������� �������������������$���$����!�� Table 3.1 Descriptive statistics
Variables Units Mean Standard deviation
Agri output Rs lakhs 1324357.98 793753.02
Industry output Rs lakhs 1077261.67 868281.66
Ser output Rs lakhs 1976477.87 1593838.61
Actual rainfall Millimetre 1575.91 1076.17
Fertilizer consumption 1000 tonnes 877.73 706.56
Expenditure on social
services Rs crore 3996.95 3115.49
Electricity Million kwh 20741.86 14548.71
Port distance Free of unit 254.91 191.53 ��
Electricity and port indicators ����������������������������������������� �� �:���������������
�������<���� �!�-�������������������������������� ��� �����
344B �������� �������� ����������"����������� �������������
�������������� ����� ���������������!��
� H��� ����������� ��������� ���� ���� � � �� ���� � � �� ������
������ ��� ���� ���!� '������ � ������ "��� ��� � ����
�������$��� �� ������ ����� � ��� ��� � ������ ���� �������� ����
�����% ������� ��� ��������������!�H���������������$�������
���������� ��� � ���� ���������� �� � � � ����������� ���� ���
���������� ����� �$��� ��� � � ��������$�"� ���"��������� �
(�����5448+ � � � � �����������"� ������� �<"������� ��� ����

25 Role of Infrastructure in Poverty Reduction
T E R I Report No. 2004 RD 24
��!� -� � � ���� �� � ���� �������� ���� �� � $� �������� � ���
������ ��� ����� �$ ����������������������!��
� ��� ��������� � ��� �� ���� ��������� ���� ��� ���� �����
���������� �������� @�
�
���������������M���������$�����(�������������
��������� ���"� ������� ���� +� K� ���%�������
����������
�
������ ���� ���%������� ���������� ����� � ��� ���� �������
��������� � ������ � � ���� ���������� � ��� ���� ���%
��� �"�����!��
�
������ ���$����� M� ���� ���������� K� ������
������������"�#������������������� K�������
������������"������� ��� �����"���� �
�
������������
�������M���������������>������������������ ����
�
� *����� � ������ � ���� ������� ��� $���� ����� � � ��� �����
������ ��� ���������� ���� � ��� �� ����� ��� � ���� ���"�
���������� ���� � $���� ��� ������ ������ ������� ���� ������� ���
���� !�C����<"��� ��"�������� ���� ����� ���������� �������
*��#$�� ���!�� �
� �������� ��������� �������� �������������������$�����
"#���������������!�,������������������������������� �����
������������������� ���� ��������������������� ������������
�������������� !������������������ ������������������������� �
������� ����@��
]/[�= disPortPortdis ��
�
������������ ������������������������"#������� ������ �� �
���� �� ��������"�����<�"���� ���� ������� ������� ���� ���
����"#�������!�������������� ��������"����� �����������
"#��� ����� $� ��������� �"�� ����� ��� ���� ���� ���� � �
�������������� ���� ������ ������ ��������"���� � ����� ���
����"#�������!������� ���� � ��� ���$����� ����"� ����
�������$ ���!���
Descriptive statistics ����<"������"������ �����������������$�� ���������� �!��
C������6!3� ��� �������"������ ����������������������������
������� ��� ���� ����(����� ��� ������� ��� ����������� ������
�������� $� ����� ���������� ��� ���� ���+!� ��� � ����� ���
������������ �����������"�� �5464����3;2;>;4����� �52=8�
��� 5445>46!� &� �� ��� � ��� ���� ���� "���� ����� � � ���
�<�����������������������������������������������!���

26 Role of Infrastructure in Poverty Reduction
T E R I Report No. 2004 RD 24
020
0004
0000
6000
00
2000
0400
0060
000
020
0004
0000
6000
00
2000
0400
0060
000
1990 1995 2000 2005 1990 1995 2000 2005 1990 1995 2000 2005
1990 1995 2000 2005 1990 1995 2000 2005
Andhra Pradesh Assam Bihar Delhi Goa
Gujarat Haryana Karnataka Kerala Madhya Pradesh
Maharashtra Orissa Punjab Rajasthan Tamil Nadu
Uttar Pradesh West Bengal
ag_o
utpc
yearGraphs by state code
� Figure 3.1 Line plots of agricultural output per capita �
050
0001
0000
0150
000
050
0001
0000
0150
000
050
0001
0000
01500
000
5000
0100
0001
5000
0
1990 1995 2000 2005 1990 1995 2000 2005 1990 1995 2000 2005
1990 1995 2000 2005 1990 1995 2000 2005
Andhra Pradesh Assam Bihar Delhi Goa
Gujarat Haryana Karnataka Kerala Madhya Pradesh
Maharashtra Orissa Punjab Rajasthan Tamil Nadu
Uttar Pradesh West Bengal
ind_
outp
c
yearGraphs by state code
� Figure 3.2 Line plots of industrial output per capita �

27 Role of Infrastructure in Poverty Reduction
T E R I Report No. 2004 RD 24
� C������6!5� ��� �������������� ����� ���������������������
�������������� ��� ��������!�������" �������� ����������������
���� � �� �� ������ ����� ��� ���� ������� $�������
3;2;>3;;4� ��� 5445>46 � � ���� �"��� ��� � 0�#�� �
)��������'��!���
050
00010
000015
000020
0000
050
00010
000015
000020
0000
050
00010
000015
000020
0000
050
00010
000015
000020
0000
1990 1995 2000 2005 1990 1995 2000 2005 1990 1995 2000 2005
1990 1995 2000 2005 1990 1995 2000 2005
Andhra Pradesh Assam Bihar Delhi Goa
Gujarat Haryana Karnataka Kerala Madhya Pradesh
Maharashtra Orissa Punjab Rajasthan Tamil Nadu
Uttar Pradesh West Bengal
ser_
outp
c
yearGraphs by state code
�� Figure 3.3 Line plots of services output per capita �
� C������6!6� ��� �������������� ���������������������������
������ ��� ������ ������� ��� "� �� ��� � � � $���� � �� �D
������ !� ��� � � � ����� ��� ������ ��� �� �� ������ ��� ��� �
������!���

28 Role of Infrastructure in Poverty Reduction
T E R I Report No. 2004 RD 24
050
010
0015
000
500
1000
1500
050
010
0015
000
500
1000
1500
1990 1995 2000 2005 1990 1995 2000 2005 1990 1995 2000 2005
1990 1995 2000 2005 1990 1995 2000 2005
Andhra Pradesh Assam Bihar Delhi Goa
Gujarat Haryana Karnataka Kerala Madhya Pradesh
Maharashtra Orissa Punjab Rajasthan Tamil Nadu
Uttar Pradesh West Bengal
elto
tpc
yearGraphs by state code
� Figure 3.4 Line plots of total electricity per capita by state ��
� �������������������������� ������� ��� ����������� ��
������(C������6!7+� ������� ���� �"���� � ��� �"������ �
0�#������0�!��
�

29 Role of Infrastructure in Poverty Reduction
T E R I Report No. 2004 RD 24
0 50
100
150
0 50
100
150
0 50
100
150
0 50
100
150
1990 1995 2000 2005 1990 1995 2000 2005 1990 1995 2000 2005
1990 1995 2000 2005 1990 1995 2000 2005
Andhra Pradesh Assam Bihar Delhi Goa
Gujarat Haryana Karnataka Kerala Madhya Pradesh
Maharashtra Orissa Punjab Rajasthan Tamil Nadu
Uttar Pradesh West Bengal
portdi
year Graphs by state code
� Figure 3.5 Line plots of port distance by state �
�
�� ��������� ������� ���� ���������������������$���
������� �����(C������6!8+!��
�
Regression results *��������� � �� �$����� �������������������"�������
�������� ���$�� � ��� ���� ������� ������!� C��� ��� � �����
���� �����$������� ������������������������"������� �
� ���� �� � ������ ��������������������� � ����� ��"��������
�� ������� � ������ ���� ���� ������� �"��� !� C��� ���� "����
�� � ����������3=� ��� �����$������� ��������������"��
����������38��� �(3;;4%5447+!������� ��� ���������� � ����
��������� ��������$�� �$����!������������������������� ����
���"������������� ������ ��� �$��������$������$������������
�������������$���!�
� ������� ���$������� ������� ��� �����������������������������
���������������!������<����������$�� ���� ������������
�����������������$������������� �������� ���� ����������
�<���������� ��� ����� ������� � ���� ����� ������� ���
��� �"��������������������!�������� �� �������$�� ����
$����� �������$����� �����<�����������#��� ����������� �
�������� ����� ������� ����������� ������������ �$������

30 Role of Infrastructure in Poverty Reduction
T E R I Report No. 2004 RD 24
�""����� ��� ���� �<���������� ��� �������� � ��$���� ����� �
�"��������� ������ �������� ������� ���� ��� ��������
��� ��������� � � � ��� ���$� � �$���� ��� �"���"��� �
���������� ���!� "�� � � �� �$��� �<������� ���$��� ���
����������� �����������������!� ���� ������ ���� �!�!��������?���
��� �"������ ��� ������� ��� ����� ����� ������� $��� ��
��� ���������������� ����"��� ����� �������� ��������������
�����������������!���
Agriculture � Table 3.2 Regression results for dependent variable agricultural output per capita
Variable Coefficients Robust Standard Error t statistic
eltotpc 7.50 4.16 1.80
portdis 11.35 5.97 1.90
expsopc -37.97 9.50 -4.00
fertpc 253.82 104.54 2.43
actualrain~m 0.84 0.40 2.08
_cons 17687.60 2279.88 7.76
Fixed effects regression, number of observations = 240, R-sq within = 0.1044, between =0.5779, overall = 0.5472 �
� ������������������������ ����������������������������������
���� �<����������$�� � ������� � �������� � ���"� ���"����
����������������������� ����������������� ���!��
� �$��� 6!5� ��� � ���� ����� ���� �� ��� � ���� �����������
������� ���� ����!������ ����� ����������� ���� ����� ��� �����
�� ����� ��� ��� ������ ���������� �� ���� 8B� �����!� ����
�����������$�� � �<���������� ��� ����� ����� ��������?��� ����
������������������ ��� ������ ���������!�����$���������
��������"�����:����������� � �� �� ��� � ������ �����
�������"���� ������� ���"� ����������������� ���#��� !� C���
�<"��� ��������� ������#��� ���������������������#��� �� �
������� ��������� ������������ � ��� ���� ����������� �����!�
���� ����� ��������� ��� ��������� ��� ����� ��� I� ���� �
���� ��������������������"� ��������������������������� �
����������#������ �������� � �""�� ���$������������������
��"�� !���

31 Role of Infrastructure in Poverty Reduction
T E R I Report No. 2004 RD 24
Industry � Table 3.3 Regression results for dependent variable industrial output per capita
Variable Coefficients Robust Standard Error t statistic
eltotpc 31.2 7.7 4.0
portdis 12.9 14.6 0.9
fiscaldefi~t -0.8 0.3 -2.7
expsopc 54.4 31.2 1.8
_cons 1915.7 3874.1 0.5 ���������������������������������������������������Fixed-effects regression, 241 observations, R sq within = 0.8917, between=0.6055, overall = 0.59 ��
� �$��� 6!6� ��� � ���� ����� ���� �� ��� � ���� ���� �����
������� ���� ����!� ����� ����������� ���� ����� � � ������
��� ������ ���������!�C� ����������� � � ��������� ������� ���
���� ����� ������� ���� ����� ��� ��� ������ ����������
���������� ���� �������� ������ � � $���� ������"����
���� �"��� � ������"$����������������� ���� �"��� ����� � ���
$�� :�� ������� �������!� -� �� $��� �� ��� ���� ����� ������ ��
$����� ����� ���� ��������� ���� �"�������� ���� ������������
��� ��"�����!���
Services � Table 3.4 Regression results for dependent variable services output per capita
Variable Coefficients Robust Standard Error t statistic
eltotpc 29.55 10.84 2.73
portdis -1.46 17.23 -0.08
expsopc 218.22 41.14 5.30
_cons 12954.12 4430.87 2.92 ��
� �$���6!7� ��� ���������� ������ ��� ����� ������ ��������
���� ����!� ����� ����������� ���� ����� � � ��� ������
��������� � �� ������<������������� ����� ������ !����������
$����� �"#��� ��"������� ����<���������� ��� ����� ������ �
#� ����� ��� �������������������������� ������ � ������������!��
� ��� � �� ������� ���� ����� ��� � (3+� ����� �����%���
����� � (5+� � ���� ���� -������%����� � ��"���!� ��� $����
� � � ���� �?�� ��� ���� ������ � ��� ���� ��������� ��� ������� ���
�"���������� ���������������$�� �6!5 �6!6����6!7!�-������%
������ ��"����� ����������������������������������$�� !��
Simulating the effect of projects on sectoral output �:������(5+�����������5�� �����$ � �������� �"��������������
������������������#��� �(�������������+���� �������������!�-�
���#��������� ��� ��������"����������������������� ���������
�������� ����� ������������� ��������������� �������������
�$�� �6!5 �6!6����6!7 ������������������ ���� �������������!��

32 Role of Infrastructure in Poverty Reduction
T E R I Report No. 2004 RD 24
Table 3.5 Projects and infrastructure indicators
Project Outcome Unit
Bakreshwar 9780 Million kWh
Purulia 1500 Million kWh
TandD 225.6 Million kWh
Teesta 319.9 Million kWh
Total in Million kWh 11825.5 Million kWh
Population of West Bengal in 2000 82.6 Million
Eltotpc 143.16586
Port Haldia 20000 thousand tonnes
Distance 202 km
Portdis 99 ��
� �$���6!8� ��� � ���� ������������������#��� � ��"$�����
������ ���� �� �����"�� �:�������� ��� 33258�"������� ��� �
������� ����� �$ �����!����������$�������������������� ��
������ ��� 3;;;>5444 � ��� ���� �����"����� �������� ���� ���
���#�������376!�,�"���� �'��������������"��������$�������
� 54444� ���� ��� ����� � (��� � � � ����� � "����� ���
#����"���� ����������������� �$�����������������������+!�
���� �� ����� ���"� ���� ������� ���� ��� �� �� ������
(����"�+����'����� �545��" ����������������������"��
$� �� ����� ���� � ������ � ��� ;;!� *�������� ���� ���� � ���
�����"�� ���$�� � ����� ���� �:����� � ��� ���� ������ � ���
��������������(�$���6!=+!���
Table 3.6 Effects of projects on sectoral output
Coefficients
Sector Eltotpc Portdis
Effect of
projects (Rs lakh)
Base (2000)
values (Rs .lakh)
% effect
of projects
ag_out 7.5 11.35 177475.2 2187353 8.11
ind_out 31.2 12.9 469864.3 1565636 30.01
ser_out 29.6 0 350034.8 3599792 9.72
Total output per capita 997374.3 7352781 13.56 ��
� �$���6!=� ��� ���������� ��"���������������������#��� �� �
$���� 2B� ����� �� ��� ����������� ������� ���� ����� �����
3;;;>5444� ����� � 5=B� ����� �� ���� ���� ����� ������� ����
���� �9B����� ������ �������������33B���������������������
�����(���� ������ ����� ��������+!� ��� � ��������������������
����'���� ����������� �� ������ ������� ��� ��� � ������ ����
�� �������!��

33 Role of Infrastructure in Poverty Reduction
T E R I Report No. 2004 RD 24
�
References �������������,������.!�5447�
$�� ������ ��� ������������� '��� ���� ��� ������� ����
�����'�����,������
� ������� ���@���������������N*����� �� ����������������� ���!�
�*,�6744O�
�
$����51����6�
.�����������.����-����
���������@�-���"���C���������
����������������������������������������������

34 Role of Infrastructure in Poverty Reduction
T E R I Report No. 2004 RD 24
�
Annexure 3.1 Table 3.1.1 Regression results for dependent variable agricultural output with time dummies
Variable Coef. Std. Err. T P>t 95% Conf. Interval
Portdis 10.34 6.99 1.48 0.14 -3.44 24.12
Fertpc 264.41 118.02 2.24 0.03 31.71 497.11
Expsopc -39.20 12.33 -3.18 0.00 -63.50 -14.89
Eltotpc 7.94 3.87 2.05 0.04 0.31 15.57
actualrain~m 0.91 0.49 1.87 0.06 -0.05 1.87
yeard1 -822.53 2073.52 -0.40 0.69 -4910.81 3265.75
yeard2 -1354.71 2016.04 -0.67 0.50 -5329.66 2620.24
yeard3 -1921.11 1998.96 -0.96 0.34 -5862.38 2020.16
yeard4 -2382.03 1981.09 -1.20 0.23 -6288.07 1524.02
yeard5 -1390.41 1916.92 -0.73 0.47 -5169.93 2389.10
yeard6 -2027.15 1812.22 -1.12 0.27 -5600.23 1545.93
yeard7 -885.36 1733.85 -0.51 0.61 -4303.93 2533.21
yeard8 -1374.33 1678.41 -0.82 0.41 -4683.59 1934.94
yeard9 -1539.48 1560.54 -0.99 0.33 -4616.33 1537.37
yeard10 -916.75 1524.92 -0.60 0.55 -3923.38 2089.89
yeard11 -2019.09 1466.79 -1.38 0.17 -4911.10 872.92
yeard12 -1423.48 1433.08 -0.99 0.32 -4249.04 1402.07
yeard13 -1472.51 1425.53 -1.03 0.30 -4283.16 1338.14
yeard14 -1613.86 1474.55 -1.09 0.28 -4521.16 1293.44
yeard15 (dropped)
_cons 18983.15 3757.86 5.05 0.00 11573.92 26392.37
Number of obs= 240, R-sq: within = 0.13, between = 0.60, overall = 0.57

35 Role of Infrastructure in Poverty Reduction
T E R I Report No. 2004 RD 24
Table 3.1.2 Regression results for dependent variable industrial output with time dummies
Variable Coef. Std. Err. t P>t 95% Conf. Interval
Eltotpc 27.00 7.25 3.72 0.00 12.70 41.30
Portdis 30.75 13.39 2.30 0.02 4.34 57.15
Expsopc 87.31 23.93 3.65 0.00 40.13 134.49
fiscaldefi~t -0.67 0.26 -2.58 0.01 -1.18 -0.16
yeard1 12027.32 3940.27 3.05 0.00 4258.90 19795.75
yeard2 13099.50 3904.97 3.35 0.00 5400.68 20798.33
yeard3 10154.16 3849.74 2.64 0.01 2564.22 17744.10
yeard4 10275.84 3779.75 2.72 0.01 2823.88 17727.79
yeard5 11439.95 3630.79 3.15 0.00 4281.68 18598.21
yeard6 10005.98 3451.34 2.90 0.00 3201.49 16810.46
yeard7 9430.42 3324.02 2.84 0.01 2876.96 15983.87
yeard8 8869.35 3192.72 2.78 0.01 2574.76 15163.94
yeard9 8939.06 3004.81 2.97 0.00 3014.93 14863.18
yeard10 8491.25 2927.78 2.90 0.00 2719.00 14263.51
yeard11 7255.95 2823.43 2.57 0.01 1689.42 12822.48
yeard12 5782.86 2771.46 2.09 0.04 318.79 11246.92
yeard13 6736.98 2770.90 2.43 0.02 1274.02 12199.93
yeard14 5393.49 2823.32 1.91 0.06 -172.82 10959.81
yeard15 (dropped)
_cons -12294.90 5217.66 -2.36 0.02 -22581.80 -2008.01 Number of obs =241, R-sq: within = 0.59, between = 0.78,overall = 0.73 Table 3.1.3 Regression results for dependent variable industrial output with time dummies
ser_outpc Coef. Std. Err. t P>t 95% Conf. Interval
Eltotpc 22.02 7.92 2.78 0.01 6.40 37.64
Portdis 19.78 14.61 1.35 0.18 -9.03 48.58
Expsopc 271.79 25.70 10.58 0.00 221.13 322.45
yeard1 13667.82 4211.49 3.25 0.00 5364.91 21970.73
yeard2 15499.59 4171.91 3.72 0.00 7274.72 23724.47
yeard3 13833.06 4112.63 3.36 0.00 5725.04 21941.08
yeard4 14101.77 4032.34 3.50 0.00 6152.04 22051.49
yeard5 13718.82 3881.34 3.53 0.00 6066.79 21370.85
yeard6 12337.41 3689.11 3.34 0.00 5064.38 19610.44
yeard7 12837.58 3566.34 3.60 0.00 5806.58 19868.59
yeard8 13165.53 3455.33 3.81 0.00 6353.38 19977.68
yeard9 12533.82 3257.41 3.85 0.00 6111.87 18955.77
yeard10 9963.08 3196.61 3.12 0.00 3660.99 16265.16
yeard11 8073.87 3066.44 2.63 0.01 2028.41 14119.33
yeard12 5943.17 3003.84 1.98 0.05 21.14 11865.20
yeard13 8688.11 2987.57 2.91 0.00 2798.14 14578.07
yeard14 7515.76 3031.20 2.48 0.01 1539.77 13491.75
yeard15 (dropped)
_cons -4310.25 5612.72 -0.77 0.44 -15375.70 6755.16 Number of obs.= 241, R-sq: within = 0.84, between = 0.50, overall = 0.54

36 Role of Infrastructure in Poverty Reduction
T E R I Report No. 2004 RD 24
CHAPTER 4 Meso analysis �
�
������ ������������<"����������������������� ���������������
����� ��� ��� � ��� ������� ������� ��� ��� � ��� ����������
����� � ��� ���� ��������� ���������� ��� ��� ����� !� �����
�����"����������������� �� ����������� ����� �$���� ����"�
��������������������� �������� �������� ������� ����� ����
��$���� !��
Methodology H���$ �������� �����:������� �����������"@�
�
iwtotoutppck
kki wtotoutpcoutshS ηγγγγ ++++= �0 �
�
������,�� ����� ������������������������"$��������� ����� !�
������ ��� �<� ����� � ��������������� � ����� ���� �� � �����
������ � ��$�� ���������� � ��$�� ���� ��� ��� ��$��
������ � ��� ��� �� ��� ����<��� $� �!� ���� γ � ����� ��� ������ ��������������� !���� ��� �������� ����������� ������
������ � ����<��� $� ���������� ���� � ��� �� (����� ���� ���
����������� � �� ������ ���� ��� �������� "��������������+!�
��������� � � ���� ���������������� ����!��� � � ���������������
��� ����� �� ��� �����<�����������������#� �"��� ����
��� ����� � ���������������������������� ���������� ����� �
���� ���������� ��� !� -� � � ����������� ��� � �������� ��
�"������� ����������������������"����!������� ��������������
� �������������$����������������������� ������"����!�C�� � �
���� ����������� ��� � ��� ������ ���������� ����� ������
������� ����<� � ���� � ��������� ���� @� ������ ������� � �
������ ���� � ����� ���$������� ������������ !�,����� � ��� � �
� ���� �$������������$���������������� ���������������
�������������� ����������!���������� ���� ���������$����"�����
� ���"���������(���� ��������� ����� ���+ ������������������
"� ��� �����P�� �����������A ��!�!��������� ��������������
�$����� � ��� �������� ��� ����!� ��� � � � ������� ����������
����� ����������������������������������" ���� ����������
������� ����� (���� "���� �� ������ ������� �� � ���� ������ ����
�� �������� ���+ � ������������� ��� ���� ��������� ����������
����� �� ���� ���"� ���� ��� ����� �������� $������� ����
��� � ��� ������ ������� ����<� � ���� � ���� ���������
����!����� ������������������������"$��������� ����� �� ��
���������������� ������� ��� ���������� �����������������������
������������������������ !��

37 Role of Infrastructure in Poverty Reduction
T E R I Report No. 2004 RD 24
�
Data ����������������������������� ������� ����� ��������������
��� �� � �<����������"� �����������,"����,���� �84���
��� 88��� ����� � (���� �� � 3;;6>;7� ��� 3;;;>5444+ �
����������$������������,"����,�����H����?����!��
Basic statistics
�������$�� �� ������������ � ��������������$���7!3������
����� ������ ���� !�����"��� ��� ������������������� ����
���$������� �������������������$��!��
� Table 4.1 Descriptive statistics
Variables Units Mean
Standard
deviation
Agricultural output share Free of unit 0.31 0.13
Industrial output share Free of unit 0.25 0.08
Service output share Free of unit 0.44 0.12
Total output per capita Rupees 103139.59 57005.66
Agricultural wage Rs Thousand 3.12 1.08 �
Regressions results *��������� � �� �� ��$����� ��������� ����������� ���
�����"������������������������"������$�� �������� �������
���������� ��� ����� � ������� ��� $� ���������!� - � ��� ����
�$ ������� � ��� ��������� � ���� "����"$��� ��� ��� � � �
$���� �������� ������ ���� ��"�� ������� ��� � � � ��� ���� �� �
(3;;6%;7� ���3;;;%5444+!� ���� �� ��� ����� ���� ������� ���
��� ����� � ��� ����� ������ ��� ���� �$�� � $����!� ��� � �
"������$������������������ ��������������������������������
������������������������ � !���� �� �$��� �����������������
���� � ��� ��� � ��������� ���$��� ��� ��� ���� ����� ������
��"����� ��� ������ ���$�� � � ��� ��� ���� �� � !� ��� � � �
�����������"��$���7!3�����"��6!���
Rural � Table 4.2 Regression for dependent variable share of rural agricultural households
Variables Coefficients Robust Standard Error t statistic
indoutsh -0.23 0.18 -1.28
seroutsh -0.36 0.16 -2.25
totoutPC -1.95E-06 0.00 -8.24
agwage2 -0.03 0.01 -2.96
_cons 0.99 0.08 11.83
Pooled OLS regression, observations = 34, Rsq=0.884 �

38 Role of Infrastructure in Poverty Reduction
T E R I Report No. 2004 RD 24
�$��� 7!5� ��� � ���� ����� ���� ���� ���� ���� ��� �����
�������������� ����� !����� ������������ ������� ������ �
������� ���� ��� ��������� ������ � ������� ���� ������ �
������� ����� � ��� ������ ���������!����������������������
��� ���� ����������� ���� ���� ��� ��� ������ ����
��������� �������������������!������ ���������������������
��������������������� ������������������"���� �����������
����� ��� ���� ��� ����� � ���"� ���� ����������� ��� ������
������������������ !���
Table 4.3 Regression for dependent variable share of rural industrial households
Variable Coefficients Robust Standard Error t statistic
indoutsh 0.03 0.08 0.33
seroutsh 0.02 0.06 0.36
totoutPC -8.06E-08 0.00 -0.38
agwage2 0.01 0.01 2.38
_cons 0.03 0.03 0.98
Pooled OLS regression, observations = 34, Rsq=0.2 �
�$��� 7!6� ��� � ���� ����� ���� ���� ���� ���� ��� �����
���� ����� ��� ����� !� H��� ���� ���� ����������� ���� � �
��� ������ ��������� � ��� � � �� ������� ������!� ���� �����
������� ������� ������ �������� ��������� ������������� �
��� ��������������������� � ����������������!� ����� �� ���
������������������������������������� ������������������"��
�� ������� ��� � ����� ��� ���� ��� ����� � ���"� ���� ���� �����
������ ��� ���� ������ � $��� �� ��� ���� ������� ������� ��� ����
������ � �����!���� Table 4.4 Regression for dependent variable share of rural services households
Variable Coefficients Robust Standard Error t statistic
indoutsh 0.08 0.15 0.49
seroutsh -0.20 0.12 -1.71
totoutPC 3.41E-07 0.00 1.23
agwage2 0.02 0.01 1.99
_cons 0.10 0.06 1.69
Pooled OLS regression, observations = 34, Rsq=0.34 �
�$��� 7!7� ��� � ���� ����� ���� ���� ���� ���� ��� �����
������ � ��� ����� !� H��� ���� ���� ����������� ���� � �
��� ������ ���������!� ����� ������� ���� ����� � � �� �������
���������������� ������������ ������ ���� ����� � �$��� ��
�������������� ���������"������������������������ ������������
������ � ����� �������� �����������"� ���"���������������
���������$�� ����!��
39 Role of Infrastructure in Poverty Reduction
T E R I Report No. 2004 RD 24
Urban
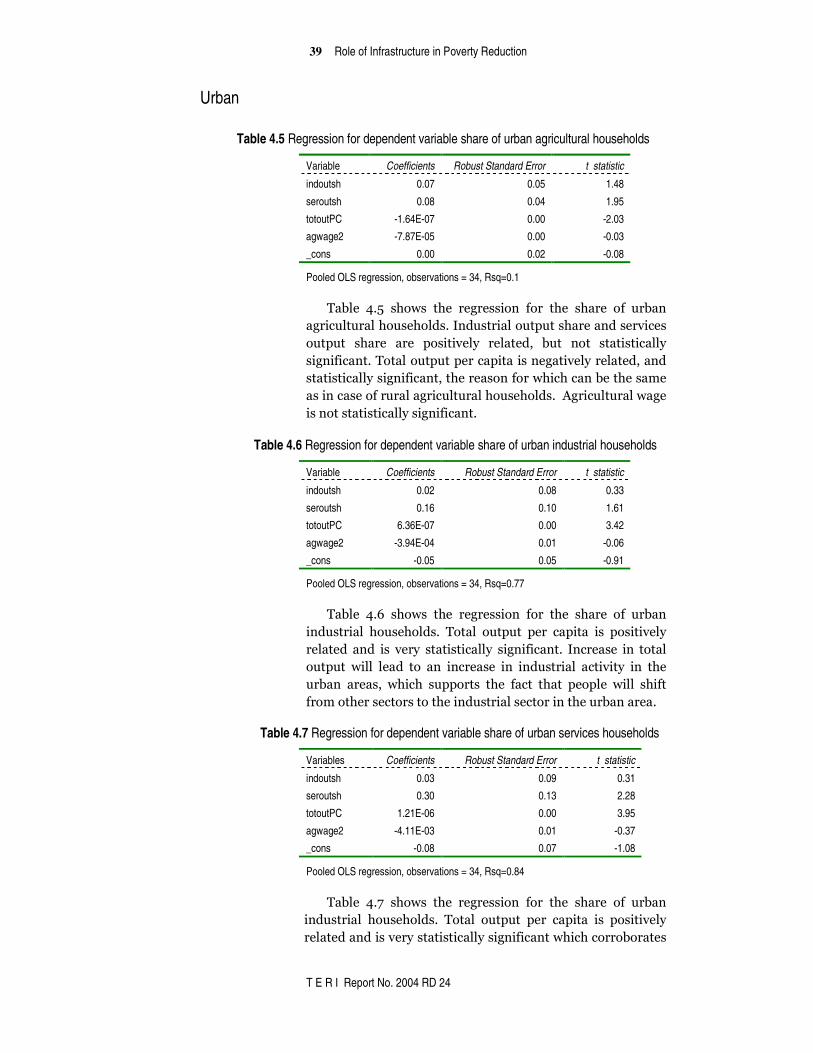
Table 4.5 Regression for dependent variable share of urban agricultural households
Variable Coefficients Robust Standard Error t statistic
indoutsh 0.07 0.05 1.48
seroutsh 0.08 0.04 1.95
totoutPC -1.64E-07 0.00 -2.03
agwage2 -7.87E-05 0.00 -0.03
_cons 0.00 0.02 -0.08
Pooled OLS regression, observations = 34, Rsq=0.1 �
�$��� 7!8� ��� � ���� ����� ���� ���� ���� ���� ��� ��$��
�������������� ����� !����� ������������ ������� ������ �
������� ���� ��� �� ������� ������ � $��� ���� ��� ������
���������!����������������������� ���������������� ����
��� ������ ��������� ������� ����������������$������ "��
����� ������������������������ ����� !��-���������������
� ����� ��� ������ ���������!��
Table 4.6 Regression for dependent variable share of urban industrial households
Variable Coefficients Robust Standard Error t statistic
indoutsh 0.02 0.08 0.33
seroutsh 0.16 0.10 1.61
totoutPC 6.36E-07 0.00 3.42
agwage2 -3.94E-04 0.01 -0.06
_cons -0.05 0.05 -0.91
Pooled OLS regression, observations = 34, Rsq=0.77 �
�$��� 7!=� ��� � ���� ����� ���� ���� ���� ���� ��� ��$��
���� ����� ��� ����� !� ����� ������� ���� ����� � � �� �������
������� ��� � ����� ��� ������ ���������!� ����� �� ��� �����
������� ��������� ��� �� ����� �� ��� ���� ����� ������� ��� ����
��$�� �� � ������ ������ � ���� ���� ���� ������� ����� �����
���"������� ����� ������������ ����� ���������������$����!��� Table 4.7 Regression for dependent variable share of urban services households
Variables Coefficients Robust Standard Error t statistic
indoutsh 0.03 0.09 0.31
seroutsh 0.30 0.13 2.28
totoutPC 1.21E-06 0.00 3.95
agwage2 -4.11E-03 0.01 -0.37
_cons -0.08 0.07 -1.08
Pooled OLS regression, observations = 34, Rsq=0.84 �
�$��� 7!9� ��� � ���� ����� ���� ���� ���� ���� ��� ��$��
���� ����� ��� ����� !� ����� ������� ���� ����� � � �� �������
����������� ����� ��� ������ ���������������������$���� �

40 Role of Infrastructure in Poverty Reduction
T E R I Report No. 2004 RD 24
�������� ��� ���� ������� ��� ������ � ��� ���� ��$�� ������ ��� ����
������� ��"� !�,���� ��� ������� � � � �� �� ������� ������� ���
��� ������ ���������!����
Simulation Table 4.8 Effects of projects on shares of households in different groups
Coefficients
Group indoutsh seroutsh totoutPC
Effect of
projects
Base (2000)
shares New shares
ru_aghhSH -0.23 -0.36 -1.95E-06 -0.0257 0.511 0.485
ru_indhhSH 0.03 0.02 -8.06E-08 -0.0004 0.104 0.103
ru_serhhSH 0.08 -0.2 3.41E-07 0.0101 0.146 0.157
urb_aghhSH 0.07 0.08 -1.64E-07 -0.0012 0.010 0.009
urb_indSH 0.02 0.16 6.36E-07 0.0060 0.080 0.086
urb_serSH 0.03 0.3 1.21E-06 0.0112 0.148 0.160 �
�
F ���� ���� �"������� ��� ���#��� � ��� ������� ������� ����
����� ��� ���� �� ��� � ��� ���� ����� ��� � ��������� ��� ��� �
������ ���� �"����� ���� ������� ��� ���� ���#��� � ��� ��� � ���
��� ����� ������������������� �(�$���7!2+!��
C��� ����� ����������� ��� ����� � ���� ���� ���������
���#��� � ���� ��� � ���������� ��� 5!6B� ��� ���� ���� ��� �����
����������� ��� ����� � �!�!� ������ � � � ����� ��� 5!6B� ���
��� ����� � ���"� ����� ����������� ������ ��� ������ ����� �
������� ���$����������!��������������$�������� ������
����� ���������� ������ ���� ����� �(3B+ ������$������ �����
��� ����� �(4!8B+������$�� ������ ���� ����� �(3B+!��

41 Role of Infrastructure in Poverty Reduction
T E R I Report No. 2004 RD 24
CHAPTER 5 Simulating the effect of sectoral output growth on poverty �
���� $ ��� ���� ���������� ���� ������� �"������� � � ���� �
������ ��� ������� ��� $�� ����"�� ��� ����� ���� ��� @� �
����������� ���$�������������"��������������������"�!�����
�������������������������� �����������������������������
����� $�� ������� $� $ �������� ���"� �� ���$������� ������ �
(C������ 8!3+!� ��� ������� � ������ � �!�!� ����"���� ���"� ��
��� � ��� ���� �<"����� ���� ������� ��� ���� ��������� ���
������� ��� ��� ������� ��� ���������� ����� !� ��� ����
�<"������������������������������������������ ��� �<�
����� � ��� ��������� @� ���������� � ������ � ��� ���� �� �
���������������������������$�!������������������������� Figure 5.1 The distribution with dashed line shows the initial distribution of income (log of income). The solid line shows the final distribution. The dotted line shows the distribution of income with growth effect only. The area with vertical line shading shows the growth effect of reduction on poverty; the gray shaded area shows the distribution effect. ����
Initial distribution
Final distribution
Poverty line
Log income
Density (share of population)
Initial distribution
Final distribution
Poverty line
Log income
Density (share of population)
Growth effect
Distribution effect
Poverty line
Log income
Density (share of population)
Growth effect
Distribution effect
Poverty line
Log income
Density (share of population)
Initial distribution
Final distribution
Poverty line
Log income
Density (share of population)
Initial distribution
Final distribution
Poverty line
Log income
Density (share of population)
Growth effect
Distribution effect
Poverty line
Log income
Density (share of population)
Growth effect
Distribution effect
Poverty line
Log income
Density (share of population)

42 Role of Infrastructure in Poverty Reduction
T E R I Report No. 2004 RD 24
Poverty measures �
���� "� �� ��""���� � ��� "� ���� ��� ������� � � ����
�������������!���� � � ������������������������������$�����
���������������!��
�
� �=
≤=N
ii zx
NP
10 )(1
1�
� *4�� ������������������ ���� �����������������������3�� �
� ������������������ ���� � �3� ��� �� � ���"���� � � ����� ��� 4�
������� �!�H����� ����������������������������� ��������
��� �����������������������������������������!������� ����� �
�� �$������� ������������� ����� ��� �"������$�� ��� �������
����"�����"������������������������� �������(������3;;9+!��
� ���� ������� ��� "� ���� � � �� �"�����"���� ��� ����
�������������!����� �������$��
�
� �=
≤−=N
iii zxzx
NP
11 )(1)]/(1[
1�
� *3� � � ���� ������� ��� "� ���!� ��� ���� ������� ���
"� ��� � ������� ��������� � ���� � ������� ������� (������
3;;9+!��
� ���� ������� "� ��� � � �� ������� ���� � ��� �� ������ ��
�������� ����� ����"����%�������� ����� !�������(5446+�
������ ������������ ��"���� ��������������� ���������!�����
������� ���� � � ��� ��������� ���� ���� ����� � ���$��" �
(������5448+@�
�� ���� ��$�� ��� ����������� ����������� � ���� ���� �"��� ���
������������$�������$��!�
�� �������� ��� ������ ��� ���� ���� ��� ��������� ��� ���� ����
����������������<� �� ��!�
�
� ��������������� ����������$�������(5446+����� ������
��� �������!���������������� ������� ������������3;;;>5444�
��@�
� �64=!27������������ �
� �676!83�������$���� ��
Data ����88��� ����������������,"����,����� � � �� ����������
����� ��� ��� ������ ��� �"��� �<��������� � �"���"���%
���"���"���� ��� �����"�� ���%����������� �������� � !�
���� ��� ���"� ���� ��� ������ �������� 3� ��� ��� �"���
�<���������� ����� �<������� ��� ��?��!� 0����� ���� ����
�������� ������ ��� ���� ����� ��� ����$��� ������� ����� �����
����� ����������������������� ����� ����������!�
�
43 Role of Infrastructure in Poverty Reduction
T E R I Report No. 2004 RD 24
����������$�� �� �������@�
�� ,�����@�����������$��
�� ,����������@���� �������� ����������� �������� ��� ������
�� �������������$��������������5=�
�� *�������� ���������� ��� ��� ������ ��������� ��� ��������
3;;2��� ���������
�� &����������������<����������
�
�������������� ������,��12!��
�
Income distribution of the six groups in West Bengal in 1999/2000 ����<"���������<������������ ���$������������� �<������ ����
�� �����������3;;;>5444!���������������� � �����<"��������
���������� �������� ���������<������������ ���$����� !�)������
��� �������� ����$������������� � "��������� ����" �(����
����� � ���������3;;9+!��<"�������������������� �������� �
��������<������������ ���$���������� �� ���� ��� �� ���������
"� ��� � ��� ������� ��� ���� �"�����"���� ��� �������
����� ����������������������������������������� ����� !�,�����
�����<�������������� ��������� ������� ����������<"����
�����������"����������������<���������!��
12�-�������������<����$ ��� ������ �,�",������*�� ������$��� �� ���������������"������<�$����!�&������� �,���� ��<�������� �������������������� !������ �����,���������������� � �� ��<�������������������������(3;;9+!���
��

44 Role of Infrastructure in Poverty Reduction
T E R I Report No. 2004 RD 24
0.5
11.
5D
ensi
ty5 6 7 8
lmpce30
Rural agriculture
0.5
11.
5D
ensi
ty
5 6 7 8 9 10lmpce30
Rural industry
0.5
11.
5D
ensi
ty
4 5 6 7 8lmpce30
Rural services
0.2
.4.6
.81
Den
sity
5 6 7 8lmpce30
Urban agriculture
0.5
1D
ensi
ty
4 6 8 10 12lmpce30
Urban industry
0.2
.4.6
.8D
ensi
ty
4 6 8 10 12lmpce30
Urban services
�Figure 5.2 Kernel density curves of the log of monthly per capita expenditure (30 day reporting period) of different occupational groups in West Bengal. Vertical lines show the poverty line
�
� C������8!5� ��� � �������������� ��� ����� � ��� �������� ���
"����������������<����������(64�������������������+����
���������� ����������� ����� � ��� �� �� �����!� ���� ��������
���� � �������������������!����������������������������������
��� ���� ������� ����� ���� � � � �� ���������� ��� ���� �<����� ���
������� "���� ���� ����������� �����!� ����� � ������ � �
������� ������� ��� ������� � ���� �����$�� �� !������� � �
� �� ����� �� ������� "���� ���� ����������� ������ �����
����������!������������� ��������� ������������������������
���������"� ��������������������������!�-������ "����"��
����������� ���� ����"����������������� �����$�� ���� ���
��� ������ �������� ��������������������� �������!���
Estimation and simulation of poverty among different occupational groups
�$��� 8!3� ��� � ���� � ��"����� ��� �"������� ��� �������
"���� ���������� ����������� ����� � ��� �� �� �����!� ����
�������"� ����� �����������$�������$���������"������A �
���� ��� � ��"�� � ��� ���� �������� ���������� ��� *�������
��""� �������3;;;%44�� ��������������<� !�������(5446+�
� ����������������������������� �������#� �"��������88���
�������<�������������� ���"���!��

45 Role of Infrastructure in Poverty Reduction
T E R I Report No. 2004 RD 24
�Table 5.1 Estimation and simulation of poverty among households belonging to different occupational groups in West Bengal
Household share Head count ratio Poverty gap Occupational group 2000 With project 2000 With project 2000 with project Rural Agriculture 51.09 48.79 21.01 15.95 3.48 2.30 Rural Industry 10.36 10.31 16.52 5.91 2.83 0.71 Rural Services 14.64 15.67 9.37 6.61 1.57 1.09 Urban Agriculture 1.04 0.88 9.32 8.29 2.05 1.52 Urban Industry 8.01 8.53 5.47 1.32 0.79 0.16 Urban Services 14.85 15.81 4.60 3.21 0.69 0.46 Total 15.04 10.12 2.49 1.47
���� �"������� ��� ������� $���� � ��� ���� �"������� ���
������������������� ���$������������ ����� ���������� �6�
���7!������������ �"������ �� ���:����� �(3+ �(7+����(8+�
������������������������������"����� ��������5!��
� ����������� �"������ ����������������� ����� � �����
���������� � �$��� �������������� ���$������� ��������$ � �
��� ��������� ����������� ��� � ��� ��� ����� � ����
��������� !� ���� ���#��� � ���� � ����� � ��"���� ������� ���
������!������������������� ��:������53B������� ����� ����
5444 ���� ����3=B�������������#��� !���������"� �� ����������
������ � ��� ��� ��� ����� � ��� �� ��������� ���������� � �
���� �� � $��� �� �<�� ���� ��� ������ ��� ���� � ����� �
���� ��� �������"� �!� ����� ���� ��� ��� ������ ���������
�������� ����"�3=!8B����5444����=B�������������#��� �������
��$������ ������ ����������������������� ����"�8!8B����
3!6B!� ���� ���� ��� ������� ����� ���#��� � � � �� � � ��� ���
��������� � ��� ���� ������ � ��� ����� !� F�$�� ������ �
��� ������ ��������� ����� ��� � ���"� 7!=B� ��� 6!5B!� ����
����������������������������������� ����� �� ����"�38B����
34B!�����������������"$�� ������� �"���� ���!������������
����������"� ������� ����"�5!7;B����5444����3!79B������
�������#��� !���
References ������-!��3;;9�$�� ��������� ��� ��������� ������(� �� ������������� ������������ ���� �����.�����@��������� �'����� �F����� ���*�� � ������-!�5446�.��������.��������������0�1234"� ������"������*�����������������58 �5446@�6=5%6=2��������

46 Role of Infrastructure in Poverty Reduction
T E R I Report No. 2004 RD 24
�
CHAPTER 6 Conclusions �
���� ������ � ��� ��������� ������ ���#��� � ��� ����'���� �����
���#��������������� � �"�����!����� �"�������������� ��
���������������������������#��� !����� ����������<�� �������
�"�����"����� �������"������ ������������ �����������"���
�����������������!�
����� ��"�� ����������������������#��� ���� ����'����
��������#��������� ����$����!�
�
,�������������@�
�
�� 2B������ �������������������������������!�
�� 64B������ ��������� ��������������������!�
�� 34B������ ����� ������ ����������������!�
�
,��� ������� ����� ������������������������������ @�
�
�� 5!6B�������������� �������������������������� ����� !�
�� 4!4=B�������������� ���������������� �������� ����� !�
�� 3B������ ����� ������������ ������ ���� ����� !�
�� 4!3=B� ���������� ��� ���� ��� ��$�� �����������
��� ����� !�
�� 4!8B������ ����� ���������$������ �������� ����� !�
�� 3B������ ����� ���������$�� ������ ���� ����� !��
�
*�������<����������$��������������������������� @�
�
�� ���������� ��� ��������� ��������"�53B� ���5444� ���3=B�
��������#����$�������������������� ����� !�
�� ������������������������������"�3=!8B����5444����8!;B�
��������#����$���������� �������� ����� !�
�� ������������������������������"�;!7B����5444����=!=B�
��������#����$������ ������ ���� ����� !�
�� ������������������������������"�;!6B����5444����2!6B�
��������#����$���$���������������� ����� !�
�� ������������������������������"�8!8B����5444����3!6B�
��������#����$���$������ �������� ����� !�
�� ������������������������������"�7!=B����5444����6!5B�
��������#����$���$�� ������ ���� ����� !��
�
������

47 Role of Infrastructure in Poverty Reduction
T E R I Report No. 2004 RD 24
Annexure �
Introduction �������������"����������� �$������������������ � ����
� ����������A ���"������*-&,�((*������-�� � �
&��������"���,�"�����+!������������������*-&,�� �����
�� �$������������������� ��������� ������ �� $�������"������
���������������� ���������� ����"��<������������ ����
�����������$�� � ���� ���� ���"� ������������(0�*+�$�
�����!���� ����� �������#������������������������ �������
�������������������� ���$��������� � �����������
"�� �����"�������� ���� ��� ��"���"��� ������� ����
���:������ ��"�� ���� � ��������������"��������"���
��"�����!�*-&,�� ����"����������� ���������� @�
"��� �"� �����"����!�&������"�������� � �����
������� ����$����������� ���������������������������������
���������� ����� �������� ������ � ����� !�&� ���<"��� �
����������� ��� �$����������� ��������������������������
����������� ��� ������$������������� ����� !�&�����
��������������� ����������������������� ���������������������
���������!�
�
Equation used in the quantitative analysis
Macro
- ������"������������������������ �����$ ����$#����������
����"������ � �� ����������������������� ����$�����������
��������������������� ����� ���������� �����������<�������
���$�� !�-� �"����������� ����� ��"�������"����������
����� ����"������ � ������� �
�
it
itcontrolitj
Pitj
Eitj
ityheterogeneunobserved
controlportdiseltotpcoutpc
εββββ
++
+++= 0,�
�
������������� ���������������������������������� ����� ���?�
���������� ����� ������ ������ �����<���$����� �$ ������P#A!�
��������������� ������������� �����������������������
�����"� !���������������� ������������� �((������
���$�����K����%����������������+>���������+���������� �
� �������������������( �"�������������������� ����("#��������
����>�� ����������������"����������� ���++!�*�������
����� ��� ������� �������������������$ �������������������
���� � ���� ������� ����� �( ��� +�����������"�!��

48 Role of Infrastructure in Poverty Reduction
T E R I Report No. 2004 RD 24
Meso ���"� ���� � ��������� ����� �$��������������$�������
����������������������� ��� �������$������������� ������
������������������ ��������������������������!���� �� �
����� ������ ���
iwtotoutppck
kki wtotoutpcoutshS ηγγγγ ++++= �0 �
�
������,��� ����� �������������������������������"$������
��� ����� !�C����������#���� �<� ��������� �����$����
�������������? ���������������� ���������� �� ������ ������ �
��$������������ ���$������ ��������$�� ������ !�H�� ��� �
����������� ����������� ������ ������ �����<���$������
(����� ������������������� �����������������������"�����
����������+!����������� �������������������������!�C�������
� ������������������� ����� �� ��� �����<������������
�����#� �"��� ������� ����� !���
�
Micro ���"������� � ����� ������������������������� �����������!��
C������ ��"� ������������������ ����$������������!��H������
������ ���� ���"����� �� ������������������!������ ���������
��������������������������������� �����$����������������
����!����� �� �������$��
� �=
≤=N
ii zx
NP
10 )(1
1�
������*4������������������ �������������������������3�� ��
����������������������� �3������ ����"����� ���������4�
������� �!���������������"� ����� ����"�����"�������
�����������������!�'�������������(3;;9+�� ������������
���������� �����������������������������������������!����
��� ����� ��� �$�����������������������������"������$��
��� �����������"�����"������<���"��������������������
����������� ���������!����� �������$��
� �=
≤−=N
iii zxzx
NP
11 )(1)]/(1[
1�
*3�� ���������������"� ���!������������������"� ��� �
���������������� ����������������������"���������� ���� �
(������3;;9+!�������������"� ��� �� ������������� ����
�� ������ ���������� ����� ����"����%�������� ����� !�
������(5446+������� ������������ ��"���� ��������������� �
��������!���� �������������� �$����� �������������#���!��
�
�

49 Role of Infrastructure in Poverty Reduction
T E R I Report No. 2004 RD 24
��<��������"���������������������� �$%�������������� �
��:������$�������������� ��������$ ����������������#���!�
�
�=
=6
1iii SPAggPov � � (3+� ��
�������������� ������������������������< �*��������� �����
�����������<������������� �$%���������,��� ����� �����������
��"$��������� ����� ������� � �$%����������������� ����� �
�
��������������"���������*�,����,�,���������������������
���#��� ���������������������������������������"���������� �
��� ������������������ ����$���<"����������"�������!�
F ������������������������������� ����"������� ����
����� ���������� ����$� ������� ���������<����������$�� �
��������������������$�� ����"�����"�����:��������������
portdiseltotpcoutpc jP
jEj ∆+∆=∆ ββ ���(5+�
������������� �������������������� ���������� ����������������
��������!������������������ �����<��������������"����
������!��
�,�"���� ��
�
totoutpcoutshS totoutpck
kki ∆+∆=∆ � γγ ����(6+�
����������#�� �������� ����������� ������ ������ �����<���
$��������������� �����!����������� �������������������������!�
� - �"������������� � ������������ ����� �$������������
� �$%������(�+��<���������������� �����������"����������
������<��������� �("���+���������:�����������������
����� ���������������������������� �������� ������(#+!����� �� �
����� ����������������� ��
)1(j
jii outpc
outpcmpcempcegr
∆+= ������(7+�
������������������������� �$%������� ������������������
"����������� �$%���������������������������������(��������
��$�+!���� ���
),(),( // URiURii plinempcegrfplinempcefP −=∆ ����(8+�
�
�:������(8+������ ��� ������ ��"������������������������
�������������������#��� !��
�
� �
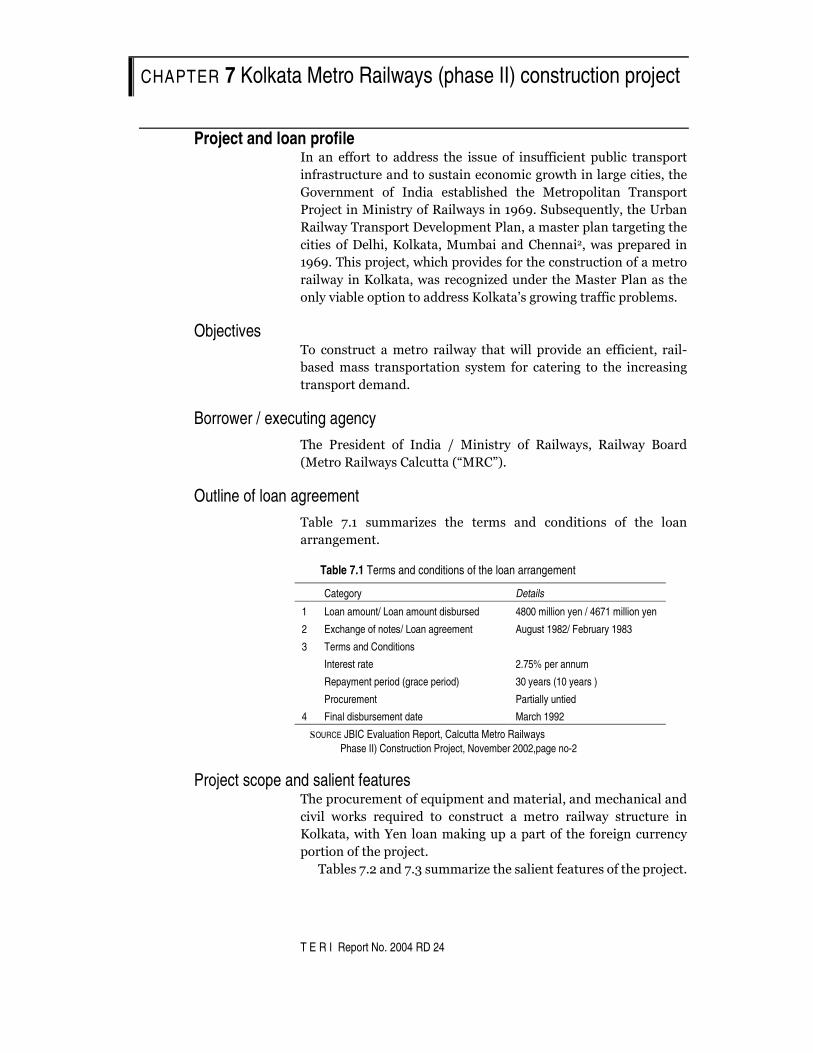
T E R I Report No. 2004 RD 24
CHAPTER 7 Kolkata Metro Railways (phase II) construction project �
Project and loan profile ��� ��� ������ �� ������ ��� ����� ��� ����� � ������� �� ��������
��������������������� �������� �������� ��������� �������
���������� ��� �� �� ����� ���� ��� ������� ��� ���������
������� ��� � ��������� ������ ��� ! "�#����$����������%�����
�� ��������������&��������������������������������� ������
� ��� ���&��� ��'��(��������� � ���)����� *�������������� ��
� ! "��� ������������ ������� ����������������� �������������
�� ����� ��'��(�������������� +���������������������������
������ ������� �����������'��(��,������ ������� ����������"��
� �
Objectives ��� �������� ������� �� ����� ���� ������� �������� � ������ �-
���������� �������� ��� ������ ���� ���� ��� �� ��� ������ ���
������������"�
�
Borrower / executing agency ���� ���� ��� ��� �� �� .� � � ���� ��� �� ������� �� ����� /����
0������� ������)������01��)23"�
�
Outline of loan agreement ������ 4"�� ������ +��� ��� ����� ��� ��� ���� ��� ��� �����
����������"��
Table 7.1 Terms and conditions of the loan arrangement
Category Details
1 Loan amount/ Loan amount disbursed 4800 million yen / 4671 million yen
2 Exchange of notes/ Loan agreement August 1982/ February 1983
3 Terms and Conditions
Interest rate 2.75% per annum
Repayment period (grace period) 30 years (10 years )
Procurement Partially untied
4 Final disbursement date March 1992
sOURCE JBIC Evaluation Report, Calcutta Metro Railways Phase II) Construction Project, November 2002,page no-2
Project scope and salient features �������������������$� ������������ ������������� �������
� � �� ���(�� ��$� ��� �� �������� �� ����� �� ����� �������� ��
'��(����� ��5����������( ���������������������� ������������
��� ���������������"��
� �������4"*����4"6������� +�������� �����������������������"��

51 Role of Infrastructure in Poverty Reduction
T E R I Report No. 2004 RD 24
Table 7.2 Salient features of the project
�
�
�
�
�
�
�
�
�
� �OURCE�Metro Railways�
Table 7.3 Present commuter service (as on 01.12.2004)
Category Details
Daily period of service
Monday to Saturday 7.00 am to 9.45 pm
Sunday 3.00 pm to 9.45 pm
Number of train services
Monday to Friday 188
Saturday 132
Sunday 56
Holidays 120
Frequency of train services
Peak hours 8 minutes
Non-peak hours 10-15 minutes
Travel Time (Dum Dum –
Tollygunge)
By Metro 33 minutes
By bus (road travel) 90 minutes ( approx.)
Passenger fare structure ( including
safety surcharge )
Up to 5 km Rs 4.00
> 5 km – 10 km Rs 6.00
> 10 km Rs 8.00
Concession on passenger fares ( as
on 01.12.2004 )
Limited multi ride tickets (LMR) 25% on 40 rides
Extended multi ride tickets (EMR) 31.25% on 80 rides
����������������������������������SOURCE Metro Railways
Status
��������������������������������7����������� ������������
���� ����"�
S No. Category Details
1 Total route length 16.45 km
2 Stations 17 (15 underground, 1 surface and 1 elevated)
3 Coaches per train 8
4 Maximum permissible limit 55 km/ h
5 Average speed 30 km/ h
6 Voltage 750 volts DC
7 Method of current collection Third Rail
8 Travel time- Dum Dum to Tollygunge 33 minutes
9 Interval between trains 8 minutes in peak hours

52 Role of Infrastructure in Poverty Reduction
T E R I Report No. 2004 RD 24
�
Evaluation of the project Relevance
8 ����� ������ +� ���������������������� ������ ������ �����
������ +���������������� � ������� ����������������"�9�������
����� ��� ���� ���� ����� ������ ��� �������� ������� � ��
�� ��� ��� ���7��� ����7 � �������� �����������������������
���� ��������� ������������������������������ �� ��������
������"������������������� �� ������������������������ ��
����� �������������� ������������������� ������ � �������
�� ������ ��� ! "� �:���������� �������%������� ��������������
&����������������������������������������������� ���������
����������� ������ ��������� +���������������������� ����� ��
)�����"� �������� ����������������� ��������������������
������� � � �� ����� ����� ��� �������� ��� �� ��� � ��� ��
����� � � +� ��� ���� ����� ������ +�� �� ��� ��������� ������
�������������)������������� ���& �� ��0)�&3"��
�
;��������������<������������ ��� ������������"��
�
Efficiency Project scope
5��� ����� ��� ������ ������� ���� ��� ��� �� ��� ����� �� �����
����������������� ���=">*4���������������!"?=�(��� ���� ���!�
����������4��� ���"�:���� ���������������)����� ����������
��� ������� ���� ��������� �� ���������� � �� ��� �� � ����
�������� ��@�������� ����� �������� ��������������������"��
�
Implementation schedule ������������ ���������� ������� �������������� �����������
��@����� !� ��������:������ A4������������� � �����������"�
������������������������ �������������� ���� ���� ���������
������ ��$� � ��� ��� ����� ��� ������� ������� ����B� ���
������ ������� ��������������� ������� ����( ���B�������� ���
�� ��� ��������� � ����� ��� � ��������( �������������������
������������������7 �������������� � ���� ������ � � ��������
� ��� ����� ��������� ������� ��� ������������(� ���������
������(� ��� ��� ������ ������� �� �� ��B� ��� �� (������ ���
������������������������������"��
�
Project cost :���������������� ������������������������������������ ����
�����������������"����� ��������� ��� ��7�������������6� ����
����� ��� � A�� ����� �� � ?"� � ;7��� ���� ������� �� ����
����������� � �����������������7������-���( ������(����
�� �� �� �� ����-����� ���� �� ��� ��� ������� ��� ����� �����
�������������������"��
�

53 Role of Infrastructure in Poverty Reduction
T E R I Report No. 2004 RD 24
;��������������<������������������������������ �� � ���� ���
��� ���� ��������� ��� �� �������� ����� ����� ������ ��� ���
��� ��������"��
�
Effectiveness �������� ���7�� ��� ����7��� ���� ���������������� ���� ��
����� ��� ���1���� ��������� � ��� ������-����� ��� �� �-�����
����� ��� �������2�� ����� ���� ������(��������������������
�� ����� ���������������������� � +�������������� ������� �����
���� ������������������ ��� ��������������������� �� ���"�
Train operation
���������� ������������ ��� ������ ����������� ������������
�������������� ��"��� ��������������� � ������������������
����������������������������"����
�
Table 7.4 Train Operation Indicators
Total number of trains Interval between
trains (minutes)
peak/off-peak
Total hours of train operation
during weekdays (mon-sat)
Operating time
(from X: X to X:
X)
Planned Actual Actual Planned Actual Actual
1995-96 112 92 n.a 75 61 7:20-21:53
1996-97 120 119 15/20 80 79 7:20-21:53
1997-98 132 130 10/15 88 87 7:20-21:53
1998-99 142 136 10/15 95 91 7:20-21:53
1999-00 142 137 10/15 95 91 7:20-21:53
2000-01 153 153 10/15 102 102 7:00-22:18
2001-02 167 167 8/15 148 86.7 7:00-22:18
2002-03 280-300 186 8-10/15 187-240 86.7 7:00-21:45
2003-04 280-300 186 8-10/15 187-240 86.7 7:00-21:45
2004-05 280-300 188 8-10/15 187-240 86.7 7:00-21:45
SOURCE Metro Railways’ Executing Agency Questionnaire, JBIC Evaluation Report, Calcutta Metro Railways (Phase II)
Construction Project, November 2002, Page 4
Quick means of transport
������ ����!"?=�(�����������������&���&��������������������
���������� ��������� �� �� ������66�� ����"�/������� ��(���
����� !>- >�� ����� ����� �������� ���� �� ��� ���"������ ���
��������������$� �(�������������� �������������������"��
Power supply
'��(��� ����� ���� ����� � ���� �� �� �� ��7� ����� �� ������� ��
������ �������� ������� ��� ���������� �������� ��������� �� �����
�� ���������������������� �"���������� (��������������������
�� ������ ����������� �� ��� ������������ �7 �� ������� ������
���� ��� �� ���� �� ��� � � ���� ���� �� ��� ��$� ��� �� ���
����������������� ���"�

54 Role of Infrastructure in Poverty Reduction
T E R I Report No. 2004 RD 24
� ����������� ����������������� ������������� ���������-
�� ���� ��� ���� �� �� �������� ������� ����� ������� ���-
� ���"� � ���� ������ �� ���� �� ��� ��� )������ ;���� �� #������
)������ ���0);#)3"�����%�#����(-�������������������"��
�
Passenger traffic volume ���������� ������������ ��� ������ ��������������������������
���� ������������"��
Table 7.5 Passenger traffic Yearly passenger traffic
(Million/year) Average daily passenger traffic (thousand/ day)
Yearly volume of transportation
(Thousand persons x km)
Planned Actual Planned Actual Actual
1995-96 667 43.7 1880 146.5 362,440
1996-97 678 62.6 1910 221.1 561,350
1997-98 688 69.1 1940 233.4 631,150
1998-99 699 57.1 1970 192.7 523,330
1999-00 710 55.8 2000 188.7 526,560
2000-01 717 70.6 2020 238.9 657,300
2001-02 724 76.65 210.02 712,648
2002-03 77.35 211.92 727,801
2003-04 90.55 247.41 844,358
SOURCE Metro Railways’ Executing Agency Questionnaire, JBIC Evaluation Report, Calcutta Metro Railways
(Phase II) Construction Project, November 2002, page no-5
�� �������������������� �������� ������ ������� ������������
������� � �� �� ���� ����� ������ �������� ������� *>>*->6� ���
*>>6->?"� �C������������������������������������������������
� ���7������������"��� �� �������������� ����������<��
�� ��������������� ������-������������������������"�/�����
��� ��� �� ����� ������ � ����� ���� ����� ���� ��� �����
����������"� ������ ���� ��� � ��� ����� �� ���� ��� ����� ����
������� ��� ����� ���������� ��� ���� ���-����� ��������
����� ��"��� ������������������������"��
�� ������ ���������� ���� ������ ���� ���� ���������� �� ���� ��
��� ������ �� ����� ��B� ��� ����� ����������������������
������������"��
�
Coach mobilization ���� ����� ������ ������ ��� ������ ��� � �� ��� ������� �����
���� �������������������������������������������"��

55 Role of Infrastructure in Poverty Reduction
T E R I Report No. 2004 RD 24
Table 7.6 Coach mobilisation
Number of coaches
owned (average units)
Number of coaches
mobilized (average units)
Average time required for
maintenance (day/train) *
Maximum speed/
rated speed (km/h)
1995-96 144 100 140 55/30
1996-97 144 100 144 55/30
1997-98 144 108 143 55/30
1998-99 144 116 172 55/30
1999-00 144 120 164 55/30
2000-01 144 124 94 55/30
2001-02 144 124 55/30
2002-03 144 128 55/30
2003-04 144 128 55/30
Source Metro Railways’ Executing Agency Questionnaire, JBIC Evaluation Report, Calcutta Metro Railways
(Phase II) Construction Project, November 2002, Page 6
Punctuality
����������� �������� ���� �������� ����������� ����"�:� �� ��
����� �������� �� ���6�� �������� ���������� ���������
���������������� �"�&�� ������������������� ��*>>?->=�����
������� ���������� "* D��� ��� ������ �������� ������ ���
�������� ��������"�0������4"43�
Table 7.7 Punctuality and reliability of service
Item 1999-2000 2000-01 2001-02 2002-03 2003-04 2004-05
Punctuality* 97.47% 99.16% 98.81% 99.27% 99.18% 99.29%
Reliability** 83.19% 97.04% 97.95% 98.14% 98.05% * Punctuality is linked to the arrival of the train at destination. If a train reaches its destination within two minutes from the scheduled arrival time, it is treated as punctual. Arrivals later than two minutes of the scheduled time are treated as “loss of punctuality”. ** Reliability is linked to starting of a train from originating station. The trains which fail to start from originating points within two minutes from the scheduled time are treated as rescheduled. Reliability is estimated as the total number of trains starting as ‘scheduled’ expressed as a percentage of total number of trains scheduled to work. source General Manager’s Annual Report, 2003-04(Page 16, Table 1.10)
;��������������<������������ ��� ��������� � ����� ����������
������� �������� �� � �"�C������������������ ����������� ��
���� ��� ������ ����� �� ��� �� ���(� ���-����� ��������
����� ��"��

56 Role of Infrastructure in Poverty Reduction
T E R I Report No. 2004 RD 24
Impact
Table 7.8 Metro usage against other modes of transport
1998-1999 2000-2001 2003-2004
Passenger (%) Passenger (%) Passenger (%)
Buses 10,650 60.1 11,510 60.7 27,450 70
Tram/LRT 160 0.9 200 1.1 240 0.6
Taxi/other 3,280 18.5 3,500 18.5 670 1.7
Ferry 220 1.2 240 1.3 3,120 7.9
Railway 3,215 18.2 3,270 17.3 4,200 10.8
Metro 193 1.1 239 1.3 3,500 9.0
Total 17,718 100.0 18,959 100.0 39180 100.0
SOURCE Metro Railways’ Executing Agency Questionnaire (Unit: ‘000 passengers)
� �� �� ����� ����� ��� ������ ����� ����� ��� ���������� ���
����������� �� ��� �������� ��� ��� ��� ������������� ��������
���� �������� �������� �� ��� ��� ��� �� � A- � �� *>>6->?"��
&�� �������������� �����������������7 �������������� ��������
������������������� ����"�/�� ����� ����������������������
�������������� ������������������>D"� � ������������ ���������
��� ������ ��� ����������� �� ��� ������� �� ��� ���� ��������� �����
������������ ����� ��-������ ��� ��� ����� ����� ����� ����
����� ��������������������������������� ���� ��"��
�
Social impacts ������ ���� ������� �� ��� ��� ��� ��� ��� � �� �����,� � ����
��� �������������� �����������"��
�
Social development support ���� &��-&��� E� ����������� ����� � ��� �� �� � ���������"�
�������������� ������������������� �������������� �����������"�
�
;�������� ������<� � ������ �� ���� ����� � ��� ���� ��� ��� ���
������������������ ���������"�F���������� ������������ ��
����� ������������� ��������� ������������� ���� �������
�������� �������� �������������������������������������"��
Sustainability
Financial status
������������������� ������ ������ �������������������� ���� ���
������������������������� ����� ��� � �� �����-���������������
����7��� ���������"��� ���� �������� � ���� ��� ������������ ��� �� ��� ��� ��������
���� �������7��� ����������������� ������� ����������� ���
�������������� �� ����������������"�
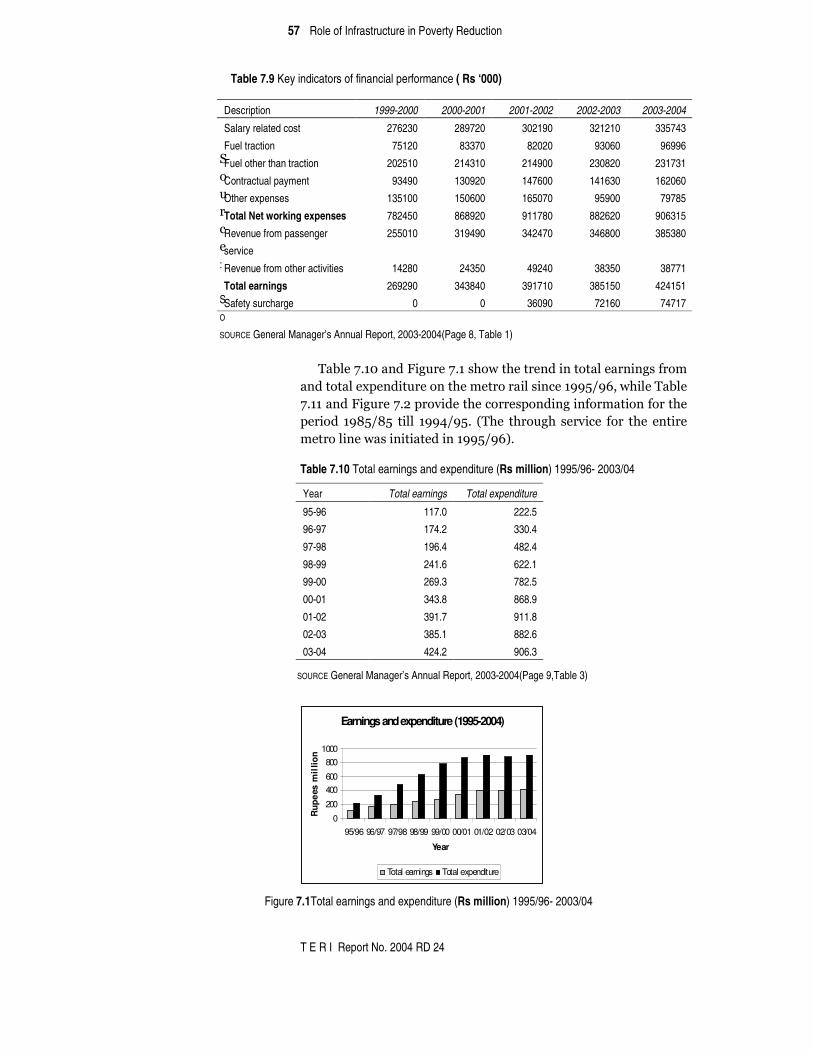
57 Role of Infrastructure in Poverty Reduction
T E R I Report No. 2004 RD 24
Table 7.9 Key indicators of financial performance ( Rs ‘000)
�
#
�
�
�
�
�
:
S
O
SOURCE General Manager’s Annual Report, 2003-2004(Page 8, Table 1)�
�
� ������4"�>����9 �����4"�������������� ���������� ���������
��������7��� ����������������� ��� ����� =. !���� ���������
4"������9 �����4"*����� �������������� ��� ������ ����������
��� �� � A=.A=� ��� � ?. ="�0���� ����������� ��� ���� ��� �� ���
������ ������� � ��� ��� =. !3"���
Table 7.10 Total earnings and expenditure (Rs million) 1995/96- 2003/04
SOURCE General Manager’s Annual Report, 2003-2004(Page 9,Table 3)
Figure 7.1Total earnings and expenditure (Rs million) 1995/96- 2003/04
Description 1999-2000 2000-2001 2001-2002 2002-2003 2003-2004
Salary related cost 276230 289720 302190 321210 335743
Fuel traction 75120 83370 82020 93060 96996
Fuel other than traction 202510 214310 214900 230820 231731
Contractual payment 93490 130920 147600 141630 162060
Other expenses 135100 150600 165070 95900 79785
Total Net working expenses 782450 868920 911780 882620 906315
Revenue from passenger
service
255010 319490 342470 346800 385380
Revenue from other activities 14280 24350 49240 38350 38771
Total earnings 269290 343840 391710 385150 424151
Safety surcharge 0 0 36090 72160 74717
Year Total earnings Total expenditure
95-96 117.0 222.5
96-97 174.2 330.4
97-98 196.4 482.4
98-99 241.6 622.1
99-00 269.3 782.5
00-01 343.8 868.9
01-02 391.7 911.8
02-03 385.1 882.6
03-04 424.2 906.3
Earnings and expenditure (1995-2004)
0
200
400600
8001000
95/96 96/97 97/98 98/99 99/00 00/01 01/02 02/03 03/04
Year
Rup
ees
mil
lion
Total earnings Total expenditure

58 Role of Infrastructure in Poverty Reduction
T E R I Report No. 2004 RD 24
Table 7.11 Total earnings and expenditure 1984/85- 1994/95 (Rs million)
Year Total earnings Total expenditure
84-85 1.5 02.9
85-86 2.8 11.4
86-87 12.3 21.3
87-88 20.6 42.6
88-89 23.0 59.6
89-90 26.8 79.3
90-91 30.0 82.2
91-92 32.7 93.6
92-93 43.7 102.2
93-94 40.3 113.5
94-95 50.2 139.0
SOURCE General Manager’s Annual Report, 2003-2004(Page 9, Table 3)
Figure 7.2 Total earnings and expenditure 1984/85- 1994/95 (Rs million)
� ������4"�*� ��� 9 �����4"6� ����� �������(-��� ��� ������( ���
�7������������������ ��������*>>6.>?"�:���������������������
����������� ����7��������������������.��������������� ��"�
�
Table 7.12 Break up of ordinary working expenses for 2003-2004
Category Amount (Rs million) Percentage
Staff cost 335.7 37
Energy (non-traction) 231.7 26
Energy (traction) 97 11
Contractual 162.1 18
Stores 64.6 7
Miscellaneous 15.2 2
Total 906.3 100
SOURCE General Manager’s Annual Report, 2003-2004(Page 9, Table 3)
Earnings and expenditure (1985-1995)
0
50
100
150
84/85
85/86
86/87
87/88
88/89
89/90
90/9191/92
92/9393/94
94/95
Rup
ees
mil
lion
Total earnings Total expenditure

59 Role of Infrastructure in Poverty Reduction
T E R I Report No. 2004 RD 24
Figure 7.3 Break up of ordinary working expenses in percent for 2003-2004 SOURCE Metro Railway Executing Agency Questionnaire
�
� :�� �������� ���������������� ��� �������������������� ��� �
���� ����� ����"� �� �� �� ��� �� ����� ��� ���� ������ ���
���$�������������� ���������������� ���"��
� �� �� ������� ���������������������� ���� ������������������
��� ����"� � �� �� ��������� ��� ������������� ���� �� ��
���� ��� ������������ �������������������� ����������������
��� ������� �����"� � ����� �� � �� ��� ���������������� ���������
������������ ��� ���� ��������������������B� ����������������
��� ��� ����� ��������� ��� $��� �� ��� � ��� ��� �������� ���
����������������"��
Monitoring system
&��� �� ��� �� �� ����� ���� ���� ��� ���� ��� �������� �����
���� ������������� ��"�
Training programme
���� �� � ��� ����������� ���� ����� �������� ��� ���(� ���� �����
�� ��������� ��� ��������� ������(� ������� ���� ����$� ��
��$���"�
�
Compliance with maintenance manual G���� �� �� ����� ����� � �� �� �������� ������� �� �������
������� ������� ��� �� ��"� :�$���� ���(�� ��� ������
����.������������������� ������������������� ����"��
�
;��������������<�9 ���� ��������������� ������ �������������
�������� � �� ����������� �"��
Beneficiary views :������ ��� � �������� ��������������������� ����� �� �������
���� �����������������-���������������� ������������������
����� ���� ��� ��� �� �����"� ���� $��� ���� ��� ���� ���� ���
������� �� ���� �� ��� :���7���� 4"�"� ���� ���� ������� ���
���������� ���� �������� ?>6� ��� ����� ���!A�������������
�����������������������"�:���������$�����������������������
Break-up of working expenses (%)
Staff cost
Energy (non-traction)
Energy (traction)
Cont rac tual
Stores
Miscellaneous
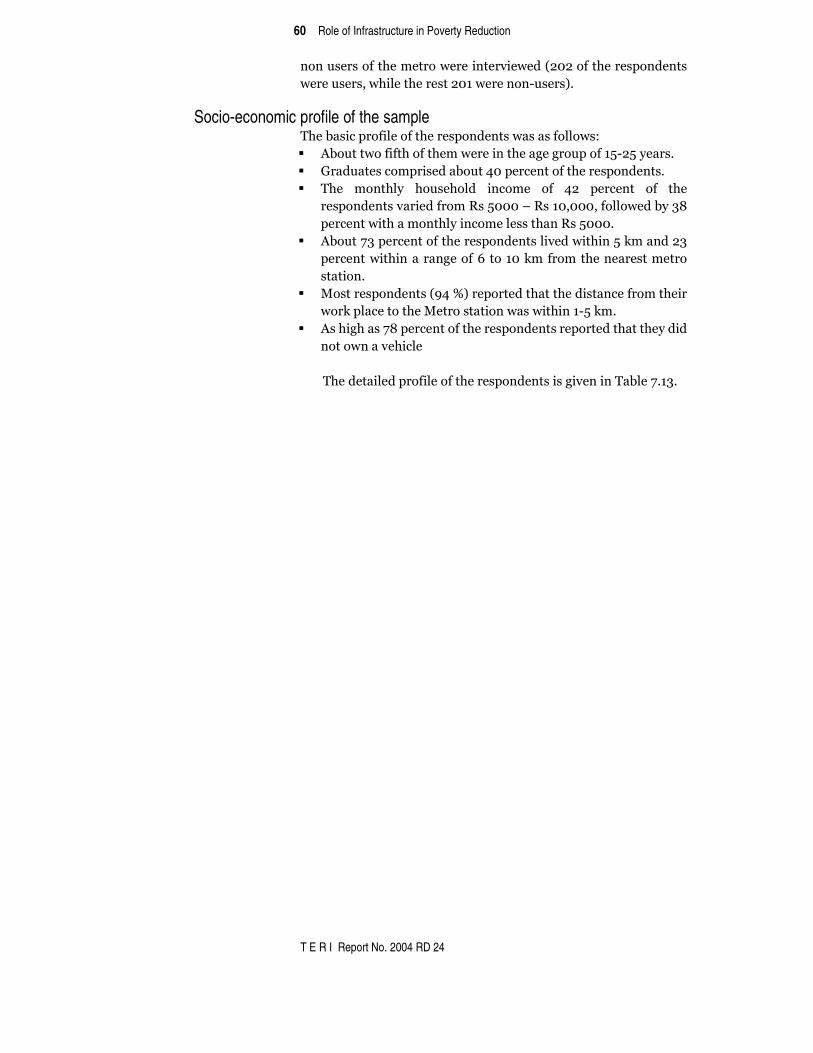
60 Role of Infrastructure in Poverty Reduction
T E R I Report No. 2004 RD 24
�������������������������� ���� ����0*>*�����������������
�������������� ����������*>����������-�����3"�
� �� �
Socio-economic profile of the sample ������� ������ ���������������������������������<�
�� :�������� ��������������� �������������������=-*=������"��
�� ������������� ��������?>�����������������������"��
�� ���� ������� ��������� ������ ��� ?*� ������� ��� ���
������������� ����������=>>>�E�����>�>>>�������������6A�
�������� ����������� ������������������=>>>"�
�� :����46������������������������� ���� � ��=�(�����*6�
�������� � �������������!� ���>�(����������������������
�� ��"��
����������������0 ?�D3�������������� ������������� ��
���(������������������� �������� � ���-=�(�"��
�� :��� ������4A�������������������������������������� �
������������ �����
�
������ ������� ������������������� ��� ���� ��������4"�6"��

61 Role of Infrastructure in Poverty Reduction
T E R I Report No. 2004 RD 24
Table 7. 13 Profile of the respondents Number of respondents Percent Age group
< 15yrs 4 0.99 15-20yrs 87 21.59 21-25yrs 92 22.83 26-30yrs 63 15.63 31-35yrs 47 11.66 36-40yrs 32 7.94 41-45yrs 22 5.46 46-50yrs 14 3.47
>50yrs 42 10.42 Total 403 100.00
Education Primary 51 12.66
Secondary 75 18.61 Higher Secondary 79 19.60
Graduate 161 39.95 Post Graduate 34 8.44
Non Literate 3 0.74 Total 403 100.00
Household monthly income (Rs) 5000 151 37.47
5000-10000 171 42.43 10000-15000 50 12.41 15000-20000 18 4.47 20000-25000 10 2.48
>25000 3 0.74 Total 403 100.00
Distance of home from nearest metro station (km) 1-3km 227 56.33 4-5km 67 16.63 6-7km 53 13.15 8-9km 30 7.44
10-15km 16 3.97 16-20km 3 0.74
>20km 7 1.74Total 403 100.00
Distance from workplace to nearest metro station (km) 1-3km 337 83.62 4-5km 41 10.17 6-7km 8 1.99 8-9km 3 0.74
10-15km 12 2.98 16-20km 2 0.50
Total 403 100.00Ownership of vehicle
Yes 90 22.33 No 313 77.67
Total 403 100.00 Source Executing agency

62 Role of Infrastructure in Poverty Reduction
T E R I Report No. 2004 RD 24
Figure 7.4 Ownership of vehicles of the respondents
Socio-economic profile of users and non-users of the metro ������4"�?�������������� �����������������������������������7��
���������������� ���������������� �������� ����"������������
�������� ���� A=D� ��� ��� ������ ��� �������������������� ���
�����=>D����������-���������������"��
� 8 ���������� ��������������������� ������������������
?=D� ��� ��� ������ �������� �� ��� ������ �������� 1��� =>>>-
�>>>>2"������ �� ��� ������-�������������� �� ���1H��� =>>>2�
������ �����"� 8 �� ��� �������� �� ��� ��������� ������� ���
�������������-������ �������������������"��
Table 7.14 Socio-economic profile of users and non users of metro
Users of metro Non users of metro
Number of respondents Percent
Number of respondents Percent
Sex
Male 176 87.13 99 49.25
Female 26 12.87 102 50.75
Total 202 100.00 201 100.00
Household monthly income (Rs)
<5000 43 21.29 108 53.73
5000-10000 92 45.54 79 39.30
10000-15000 41 20.30 9 4.48
15000-20000 15 7.43 3 1.49
20000-25000 8 3.96 2 1.00
>25000 3 1.49 0 0.00
Total 202 100.00 201 100.00
Ownership of vehicles
Yes 59 29.21 31 15.42
No 143 70.79 170 84.58
202 100.00 201 100.00
Ownership of Vehicles of Respondents
Yes
No

63 Role of Infrastructure in Poverty Reduction
T E R I Report No. 2004 RD 24
P r o f i l e o f M e t r o U s e r s A c c o r d i n g t o H o u s e h o l d M o n t h l y I n c o m e
< 5 0 0 0
5 0 0 0 - 1 0 0 0 0
1 0 0 0 0 - 1 5 0 0 0
1 5 0 0 0 - 2 0 0 0 0
2 0 0 0 0 - 2 5 0 0 0
> 2 5 0 0 0
Figure 7.5 Profile of Metro users by income
Ownership of Vehicles of Metro Users
Yes
No
Figure 7.6 Ownership of vehicles of Metro users
Profile of Metro Non-Users According to Household Monthly
Income
<5000
5000-10000
10000-15000
15000-20000
20000-25000
>25000
Figure 7.7 Profile of Metro Non-Users according to Household monthly income

64 Role of Infrastructure in Poverty Reduction
T E R I Report No. 2004 RD 24
Ownership of Vehicles of Metro Non-Users
Yes
No
Figure 7.8 Ownership of Vehicles of Metro Non users
Use of other modes of transport Users of metro
����*>*����������������������������������(�������������
��������������������������������"�:����4A���������������
��� ���� � ��� �������� ��� ���� ���� ��� ���� ����� ���
���������������� ���������"��������������������� ��������
���� ��� �������� �������� �� ��������� ����������� ������
���� ��� �7 "� ���� ���� ��� �����.� ���������� � �(�������� ����
��� ����������������������������0������4"�=3"�
�
Table 7.15 Use of other modes of transport along with the metro
Number of responses
Percent of total
respondents
Use of any other mode along with the metro
Yes 158 78.2
Mode of transport along with metro*
Bus 101 63.92
Taxi 25 15.82
Auto 6 3.80
Shared auto 75 47.47
Cycle/hand pulled rickshaw 7 4.43
Private vehicle 6 3.80
Others 2 1.27
Train 14 8.86
* Multiple responses Non-users of Metro railways
�������-������ ��� ����� ����� ������� ��������� ��� �������"�
���������A �������������������������������������������
����������"�������������������������������� ���0������4"�!3"���

65 Role of Infrastructure in Poverty Reduction
T E R I Report No. 2004 RD 24
Table 7.16 Modes of transport used by non-metro users
Mode of transport * Number of responses
Percent of total respondents
Bus 179 89.05
Taxi 43 21.39
Auto 3 1.49
Shared auto 123 61.19
Cycle/hand pulled rickshaw 21 10.45
Private vehicle 9 4.48
Others 2 1.00
* Multiple responses
� ���������� ������������ ���������� ������������� �������
���������������"��
Table 7.17 Comparative fares
Routes
Tollygunge-Dumdum Tollygunge-Esplanade Esplanade-Dumdum
Distance by metro route
(approx., in km) 16.5 8.2 8.3
Distance by road (approx., in km) 17.2 8.6 8.6
Transport Fares (Rs)
Metro 8 6 6
Private Bus 10 5 5
Mini Bus 14 7 7
Taxi (total) 190 90 90
Taxi (per person)* 47.5 22.5 22.5
* Assuming that a taxi will carry four passengers
Fares by alternative modes of transport along metro route (Tollygunj-Dum Dum)
01020304050
Metro PrivateBus
Mini Bus CTC Bus Taxi
Modes of transport
Fare
(Rup
ees)
Figure 7.9 Fare comparison of different modes of transport along Metro route
� 8�� ���� ���� �����9 �����4" � �������� ��$� �� ���������� ��
������ ���� �� ����� ����� ��� �������"� C�������� ����� ������
4"�4������������� ������������������������������������ ��������

66 Role of Infrastructure in Poverty Reduction
T E R I Report No. 2004 RD 24
�� � �������� D���� ���4>D����������������� ��������� ��*>>6-
*>>?"��������������� ��� ������������������������(���� ���-
����� ����� ��� ��� ������������ ��� �������"�/�� ��� � ���
���������� �����-�-���� ���� ���� �� ����������������� ��� ��
����������������"��
Frequency and purpose of metro use
���������������������(��������������������������"�:����
������ ��������������������� �� ���0� ��������������� ����
���(3"���������������� � ������� ���������(������ �����������
=������������ ��������������������(�0������4"�A3"�
� ���������������������� ������� ������������-������!=�
������� �� � ��� ���� �������� ��� ��� ����� ���� ����� ���
������������������ ��"�I �������� �������-� ������������
������� ��� ���� ���� �������� ���� ����� ��� � ��"� :���� �?�
������������������������� ���������� �����������������
��������0������4"�A3"���
�
Table 7.18 Frequency and purpose of metro use
Number of responses
Percent of total respondents
Use of metro
Daily (five days or more in a week) 122 60.40
Weekly (Less than five days in a week) 70 34.65
Monthly (Less than once a week) 10 4.95
Purpose of use of metro *
Home-office 130 64.36
School-home 28 13.86
Shopping 64 31.68
Personal 9 4.46
College 11 5.45
Pvt. tuition 4 1.98
Occasion 3 1.49
Entertainment 16 7.92
Business 10 4.95
* Multiple responses
Preference for the metro
���������������������(��������� �������������������������
����� ������� ���� ������� ������� ��� �����"������ ���� �����
��������������������������������������������������� ���*>�
���������������� � �� ������7��"�F���������?����������� ���
������ ��� ����� � ��� ������� �� ���� � ����� �� ���� ��� �����
������������ ����������0������4"� 3"��

67 Role of Infrastructure in Poverty Reduction
T E R I Report No. 2004 RD 24
Table 7.19 Preference for metro over other modes of transport
Prefer the metro or other transport Number of respondents Percent
Yes very much 307 76.18
Yes to some extent 81 20.10
No, not so much 13 3.23
No, not at all 2 0.50
Total 403 100
�
�
Figure 7.10 Preference of Respondents for Metro over other modes of transport
�
� ����6AA���������������������������������������(�����
�������� ���� �� �� ����������"� ����� �� ��� ��� ���������� � ��
�������� ������� �������������"����� ����������� �������
�>�-�6>�� ����"��
� :�����?��������������� ���������������������������� ���
����������-�����������������==����������������������� ���
��������=����6>�����������������>"�
� ���� ����� ������� ���� ��� ����������� ���� ��� ����� �� ������
������������ �����0 AD3�����������0 !D3"�I �������� ����
����� ������������������������������ �����0������4"*>3"��
Preference of Respondents for Metro Over Other Modes of Transport
Yes very much
Yes to some extent
No, not so much
No, not at all
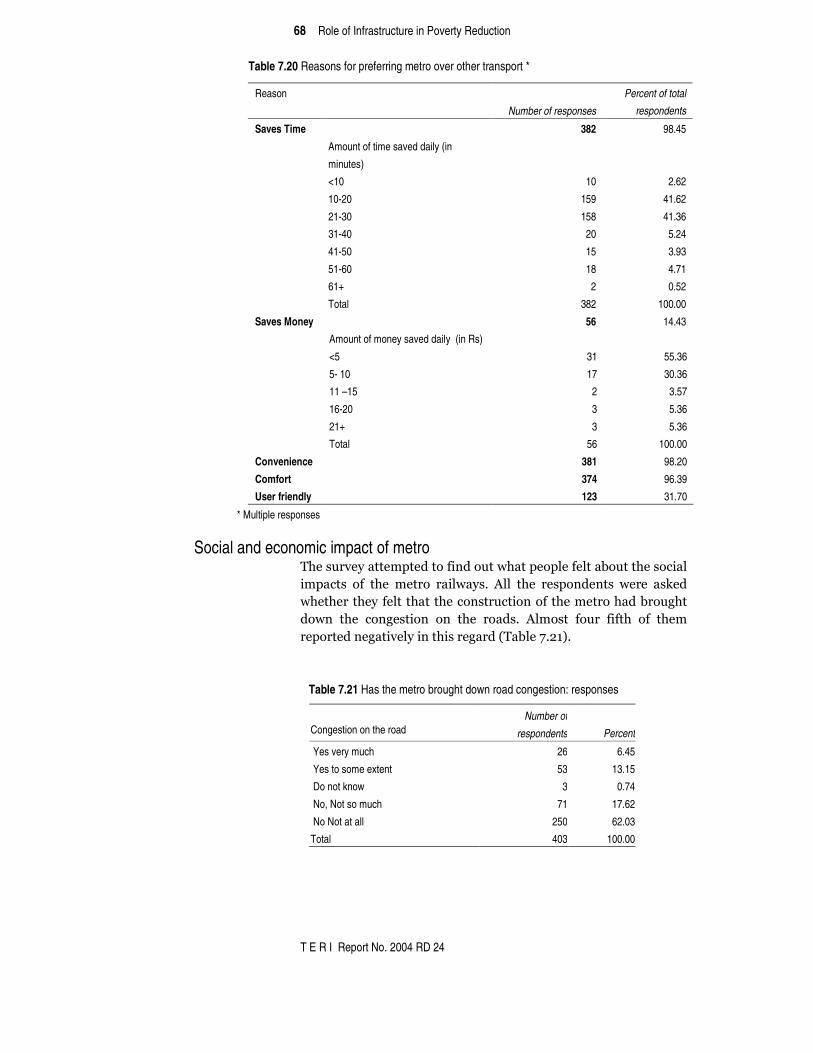
68 Role of Infrastructure in Poverty Reduction
T E R I Report No. 2004 RD 24
�������������������Table 7.20 Reasons for preferring metro over other transport * �
* Multiple responses
�
Social and economic impact of metro �������������������� ������������������������������� ���
������ ��� ��� ����� �� �����"� :��� ��� ���������� ����� ��(��
���������������������������� ������������������������
���� ��� ������ ��� ��� ��� ����"� :����� ����� � ��� ��� ����
����������� ����� ��� ��������0������4"*�3"��
Table 7.21 Has the metro brought down road congestion: responses
Congestion on the road Number of
respondents Percent
Yes very much 26 6.45
Yes to some extent 53 13.15
Do not know 3 0.74
No, Not so much 71 17.62
No Not at all 250 62.03
Total 403 100.00
Reason
Number of responses
Percent of total respondents
Saves Time 382 98.45
Amount of time saved daily (in
minutes)
<10 10 2.62
10-20 159 41.62
21-30 158 41.36
31-40 20 5.24
41-50 15 3.93
51-60 18 4.71
61+ 2 0.52
Total 382 100.00
Saves Money 56 14.43
Amount of money saved daily (in Rs)
<5 31 55.36
5- 10 17 30.36
11 –15 2 3.57
16-20 3 5.36
21+ 3 5.36
Total 56 100.00
Convenience 381 98.20
Comfort 374 96.39
User friendly 123 31.70

69 Role of Infrastructure in Poverty Reduction
T E R I Report No. 2004 RD 24
Responses Whether Metro Brought Down Road Congestion Yes very much
Yes to someextent
Do not know
No, Not somuch
No Not at all
Figure 7.11 Responses whether Metro brought down road congestion
�
� ���� ���������� ����� ����� ��(�� ������� ���� ������ ���
�������������������������� ������������"�8� �������� ��������
���������,� ���� ��� ��� ����� ���� ���������� ���� ��� ������
� ��� ������� ������ � ��� ������ ��� � ��� ������������ ��������
������������� ��� ���������� ���� ���������� �� �������� ������
�������������������������0������4"**3"����
�
Table 7.22 Is the metro affordable for different income groups: responses
Income class Number of
respondents Percent
Poor class
Yes 223 55.33
No 180 44.67
Lower middle class
Yes 387 96.03
No 16 3.97
Upper middle class
Yes 402 99.75
No 1 0.25
Rich class
Yes 403 100.00
No 0 0.00
�
�
� ������������������(����������������������������������
���� ���������� ����������� ��.���� ������ ����������������
����� ����� ��� �� �� �7 �����"� ���� ���������� ��������
��� ��� ������� � �"�:����?6�������� ���������������������
���������� �� ��� =!� ������� ������� ��� ����� ���� �����
����������0������4"*63"�

70 Role of Infrastructure in Poverty Reduction
T E R I Report No. 2004 RD 24
Table 7.23 Improvement in economic environment along the metro route
Improvement in the environment Number of responses
Percent of total respondents
Yes very much 173 42.93
Yes to some extent 227 56.33
Do not know 1 0.25
No, Not so much 2 0.50
Total 403 100.00
Reasons for improvement*
Establishment of shops around the metro 352 88.00
Improvement in access to a school, hospital 319 79.75
Increase in labour productivity 246 61.50
Less congestion on roads 213 53.25
Provision of feeder services (auto etc) 132 33.00
Others 1 0.25
Total 400 100.00
* Multiple responses
Figure 7.12 Responses regarding improvement in economic environment along the Metro route
�
� ���� ���������� ����������� �������� ������ �����������
�� ������ �������������� �����������������������������
0AAD3�� ���������� �� ������� �� �������� ������� ���� 0A>D3��
�������� �������������� � ��0!*D3������� ������ ��� ��� �����
0=6D3�������� � ���������������� ����066D3�0������4"*63"�
� F�� ����������� �������� ����� ������������� ��������
����� �� ��� ��� ���������� ������� ��� ����� ��� ����� ���
���������� ����������� ����� ������������ ���� ������ ��
��� �� �������"����� �������� �������� ���� � �� �����������
���������� ������� ���0 6D3�� �������� ������� ������ �����
������������(��������(���0A=D3�� �������� �������������� � ��
04>D3�� �������� ������� ��� ���� ��� �� +� ��� 0=4D3� 0������
4"*?3"�
Responses Regarding Improvement in Economic Environment along the
Metro Route
Yes very much
Yes to someextent
Do not know
No, Not so much

71 Role of Infrastructure in Poverty Reduction
T E R I Report No. 2004 RD 24
Table 7.24 Improvement in economic condition of residents due to the metro
Responses Regarding Economic Improvement due to Metro
Yes very much
Yes to someextent
No, Not so much
No Not at all
Figure 7.23 Responses regarding economic improvement due to Metro
�
Impact on economic condition of residents Number of
responses
Percent of total
respondents Yes very much 163 40.45
Yes to some extent 235 58.31
No, Not so much 4 0.99
No Not at all 1 0.25
Total 403 100.00
Reasons for improvement
More employment opportunities 368 92.46
Increase in labour productivity 279 70.10
Increased access to hospital schools, banks, markets 338 84.92
Increased opportunities for socialization 227 57.04
Others 3 0.75
Total respondents 398
Reasons for non-improvement
No economic improvement 2 40.00
I haven't observed and kind of usefulness due to the
metro 1
20.00
Has not increased employment opportunities 1 20.00
Not popular in the lower income class 1 20.00
Total 5

72 Role of Infrastructure in Poverty Reduction
T E R I Report No. 2004 RD 24
Responses Regarding Reasons for Improvement
0102030405060708090
100
Moreemploymentopportunities
Increase inlabour
productivity
Increasedaccess tohospitalschools,banks,
markets
Increasedopportunities
forsocialization
OthersP
erce
nt
Figure 7.14Reasons for improvement
Responses Regarding Reasons for Non-Improvement
0
5
10
15
20
25
30
35
40
45
No economicimprovement
I haven't observedand kind of
usefulness due tothe metro
Has not increasedemployment
opportunities
Not popular in thelow er income
class
Per
cent
Figure 7.3 Reasons for non-improvement

73 Role of Infrastructure in Poverty Reduction
T E R I Report No. 2004 RD 24
� :������ �������������������������������������������"�
������������������������������������������ ������������
����� ������� ��������� ��� ��������� ��� ����� ?>D� ���� ��� ���
���������������������"��
� ��������� �����������������������������������������
����������� ������������ �� ����������0������4"*=3"�
�
Table 7.25 Impacts of metro on convenience and safety of travel and image of the city
Has metro made travel easier? Number of
respondents Percent
Yes very much 149 37.0
Yes to some extent 177 43.9
Do not know 1 0.2
No, Not so much 47 11.7
No Not at all 29 7.2
Total 403 100
Is it a safe mode of travel?
Yes very much 213 52.9
Yes to some extent 164 40.7
Do not know 3 0.7
No, Not so much 20 5.0
No Not at all 3 0.7
Total 403 100
Has it enhanced the image of the city?
Yes very much 345 85.6
Yes to some extent 56 13.9
No, Not so much 2 0.5
Total 403 100
Responses Whether Metro Made Travel Easier
Yes very much
Yes to someextent
Do not know
No, Not so much
No Not at all
Figure 7.4 Responses whether Metro made travel easier

74 Role of Infrastructure in Poverty Reduction
T E R I Report No. 2004 RD 24
Responses whether Metro is Safe
Yes very much
Yes to someextent
Do not know
No, Not so much
No Not at all
Figure 7.5 Responses whether Metro is safe
Responses Whether Metro has Enhanced the Image of the city
Yes very much
Yes to someextent
No, Not so much
Figure 7.6 Responses whether Metro enhanced the image of the city
Overall Comments of evaluator �
����������� ��� ������������������������� ������ ���������(�
����������"��
� C�������������� ���� ���������������������� �����������
������ ������������������ �"�9��$��������������� �����������
������������������������������������������ �"�C��������� ��
��������� ����� ���� �������������� �������������������������
������� ����������������� ��������� ����� ��������� ������ ���
����� ������������������� �����������������������������"���
�� ��������� ������� ��� �������� ����� ��� �� ���� �����
����� ���������������������������������������������� � � ��"�
9������� ����� ��������� ������ ��� ���������� ������ �����(���
������� ���"������������������������������������������������
�(�� �� ���� ����� �� �� �� ����� �� �� ����.��� ��� ��� ������ ���
�� �� ����������������������������"���������������������
����������� ��� � �� ������������������-������� ���-�����
����� ��� ��� �������� ������"��

75 Role of Infrastructure in Poverty Reduction
T E R I Report No. 2004 RD 24
��������������� ������ ���� ���������������
�������� ��������������� �������������
Schedule No.
IDENTIFICATION PARTICULARS:
Name of the PSU
Name of site / location
Date of visit (DD/MM)
Result* of the visit
*Result Codes 1 = Eligible and Completed 2 = Eligible but refused 3 = Eligible but incomplete 4=Not Eligible
TO BE ADMINISTERED TO USERS AND NON USERS OF METRO AND ALTERNATIVE TRANSPORT
FOR OFFICIAL USE ONLY
Name Signature INTERVIEWER: __________________________ ____________________ SUPERVISOR: __________________________ ____________________ SPOT CHECKED: __________________________ ____________________
INFORMED CONSENT FORM Introduction: Good morning/ afternoon/ evening. “My name is…………… I’m from a research agency called TNS India. We are carrying out a study to understand peoples’ perception about the different infrastructure in the city. Importantly, the results of this study will help us in designing appropriate strategies for the future. We’re interviewing different categories of people. Although it is useful to interview every individual, time and finances restrict our ability to do so. Hence, we select a sample of individuals. You were randomly selected to be interviewed – that means that you were picked by chance to talk with me as are others who are asked to talk with us. This place has also been selected by chance for the survey in order to find out the present scenario. Confidentiality and consent: I’m going to ask some questions that some people may not feel comfortable answering. I want to assure you that your responses will be completely confidential – that is, no one will ever know what answers you gave because your name will not be linked to your answers. Your answers will be combined with answers from everyone else who is being interviewed so we can understand what is happening to this place as a whole – not just to you as an individual. Your name will never be divulged to anyone. You do not have to answer any questions that you do not want to answer, and you may end this interview at any time. Your participation in the interview will help us to provide better infrastructure in the city. Kindly spare some time and respond to my questions. It will take approximately 15-20 minutes.

76 Role of Infrastructure in Poverty Reduction
T E R I Report No. 2004 RD 24
A. INFORMATION OF INTERVIEWEE
Q No. Questions and filters Coding categories and codes Skip to
1. What is your name? PLEASE WRITE IN BLOCK LETTERS
2. Contact details Phone number: Address:
3. Sex of the respondent Male
Female
4. What is your age? MENTION IN COMPLETE
YEARS
Primary
Secondary
Higher
Secondary
Graduate
Postgraduate
Non Literate
5. How far have you studied?
6. Monthly Income (Rs): 5000
5000-10000
10000-15000
15000-20000
20000-25000
>25000
7. No. of Persons in the Household:
_____________
__

77 Role of Infrastructure in Poverty Reduction
T E R I Report No. 2004 RD 24
8. Distance of home from nearest metro station (km)
9. Distance from workplace to nearest metro station (km)
10. Do you own Car/ motorcycle Yes
No
B. PROFILE OF USERS/NON USERS Q No. Questions and filters Coding categories and codes Skip to
11. Do you use the Metro?
Yes
No
12. If ‘Yes’ (Coded 1 in Q 11) Do you use any other mode along with the Metro?
Yes
No
Bus
Taxi
Auto
13. If ’’Yes’ (Coded 1 in Q 12) Which ones:
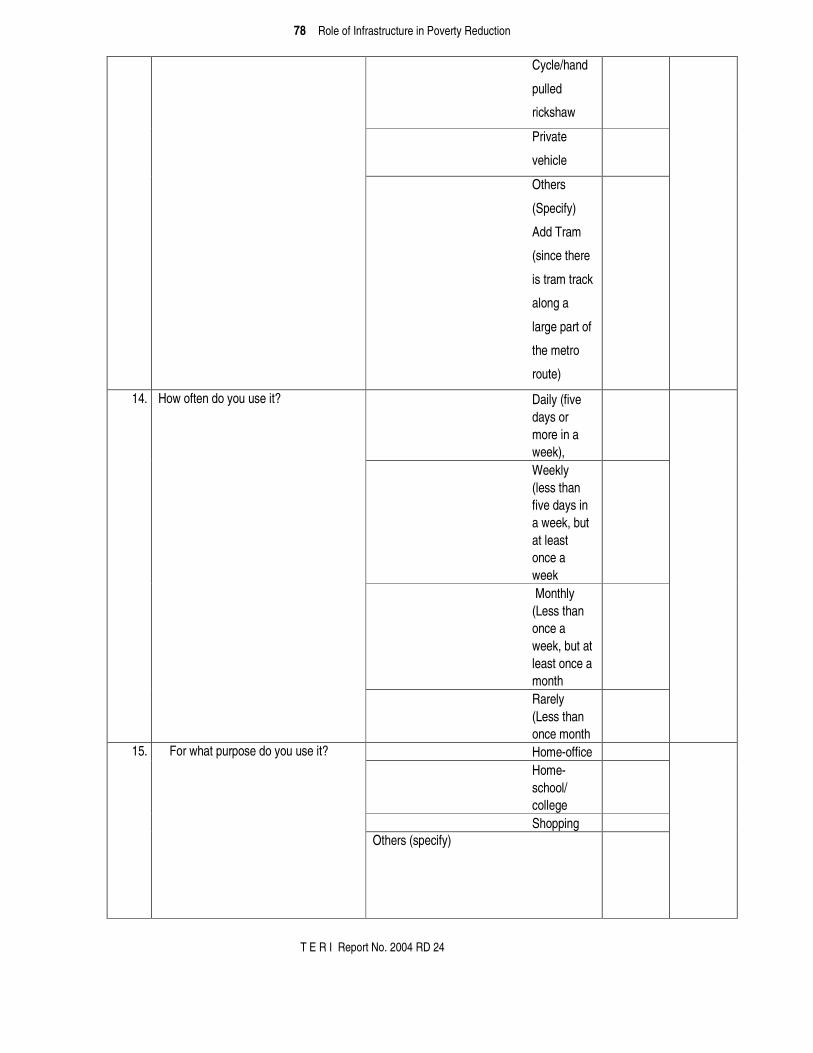
78 Role of Infrastructure in Poverty Reduction
T E R I Report No. 2004 RD 24
Cycle/hand
pulled
rickshaw
Private
vehicle
Others
(Specify)
Add Tram
(since there
is tram track
along a
large part of
the metro
route)
Daily (five days or more in a week), Weekly (less than five days in a week, but at least once a week Monthly (Less than once a week, but at least once a month
14. How often do you use it?
Rarely (Less than once month Home-office Home-school/ college Shopping
15. For what purpose do you use it?
Others (specify)
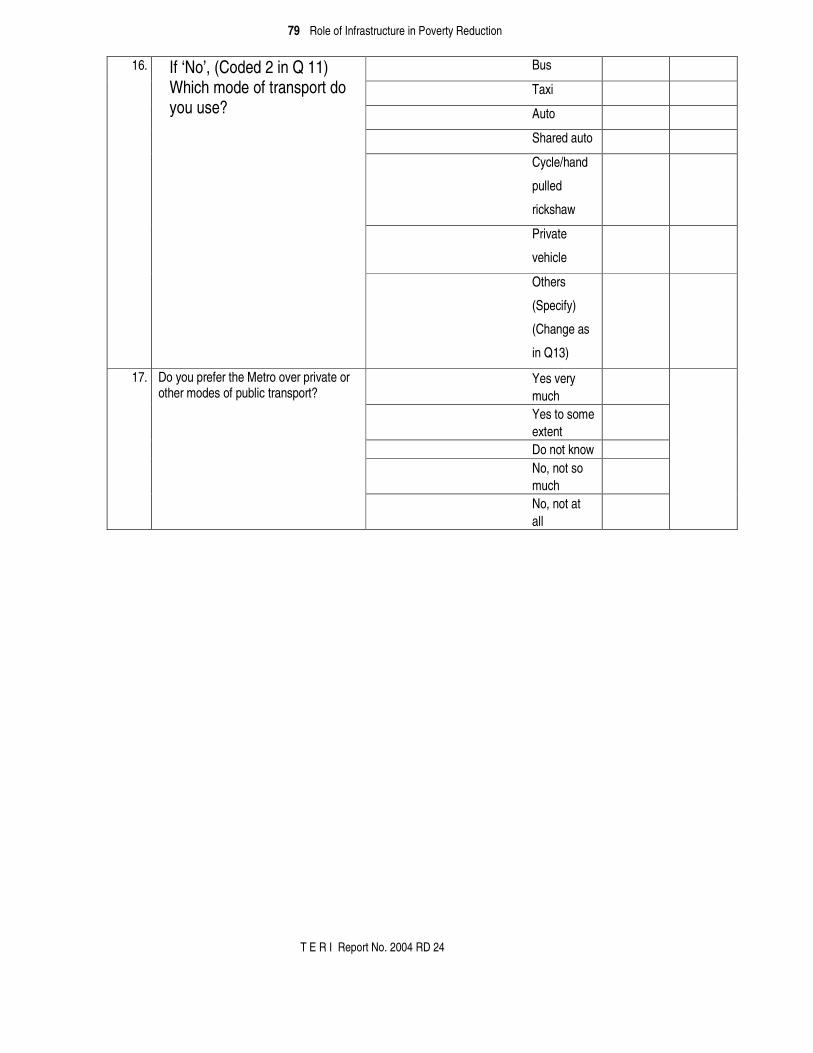
79 Role of Infrastructure in Poverty Reduction
T E R I Report No. 2004 RD 24
Bus
Taxi
Auto
Shared auto
Cycle/hand
pulled
rickshaw
Private
vehicle
16. If ‘No’, (Coded 2 in Q 11) Which mode of transport do you use?
Others
(Specify)
(Change as
in Q13)
Yes very much Yes to some extent Do not know No, not so much
17. Do you prefer the Metro over private or other modes of public transport?
No, not at all

80 Role of Infrastructure in Poverty Reduction
T E R I Report No. 2004 RD 24
Q No. Questions and filters Coding categories and codes
Skip to
Time (give an indication of amount saved daily) 1 Money (give an indication of money saved daily)
2
Convenience 3 Comfort 4 User friendly 5
18 If ‘Yes’, (Coded 1& 2 in Q 17) Then why?
Others (please specify) 6
Time (give an indication of time lost if traveling by)
1
Metro compared to others 2 More expensive (give an indication of money lost if traveling by Metro compared to others)
3
Convenience/ 4
Comfort/ 5 User friendly 6
19 If you answer ‘No’, why? (Coded 4& 5 in Q 17)
Others (please specify 7
C. SOCIAL IMPACT OF THE METRO
Yes very much 1 Yes to some extent 2 Do not know � 3 No, not so much � 4
20 Do you think that construction of the Metro has brought down congestion on the roads? No, not at all 5
Poor 1 Lower middle class 2 Upper middle class 3 Rich 4
21 Do you think the Metro is affordable by the follwoing income groups ( READ OUT ONE BY ONE AND CODE ACCORDINGLY)
Yes very much 1 Yes to some extent 2 Do not know 3 No, not so much 4
22 Do you think there has been an improvement in the economic/social environment around the metro route due to the Metro?
No, not at all 5
Establishment of shops around the Metro 1 Improvement in access to a school, hospital 2 Increase in productivity of work among those who use the metro
3
Less congestion on roads 4 Provision of feeder services (auto etc) 5
23 If you answer Yes (coded 1& 2 in Q 22), what do you attribute this to?
� Others (please specify 6
24 If you answer No, what do you attribute this to?

81 Role of Infrastructure in Poverty Reduction
T E R I Report No. 2004 RD 24
Q No. Questions and filters Coding categories and codes Skip to
Yes very much 1
Yes to some extent 2
Do not know 3
No, not so much 4
25 Do you think the Metro has made any impact on economic conditions of residents in the city generally?
No, not at all
5
More employment opportunities 1 Increase in labour productivity 2 Increased access to hospital, schools, banks, markets
3
Increased opportunities for socialization
4
26 If you answer Yes (Coded 1&2 in Q 25), what do you attribute this to?
Others (please specify) 5
27 If you answer No,(Coded 4& 5 in Q 25 ) what do you attribute this to ?
Yes very much 1 Yes to some extent 2 Do not know 3 No, not so much 4
28 Do you think that metro has made travel easier for elderly/ infirm people?
No, not at all 5
Yes very much 1 Yes to some extent 2 Do not know 3 No, not so much 4
29 Do you think that the metro is a safe mode of travel?
No, not at all 5
Yes very much 1 Yes to some extent 2 Do not know 3 No, not so much 4
30 Do you think that metro has enhanced the image of the city in general?
No, not at all 5
Interviewer’s Remarks:
…………………………………………………………………………………………………………………………………………………………

82 Role of Infrastructure in Poverty Reduction
T E R I Report No. 2004 RD 24
CHAPTER 8 Kolkata transport infrastructure development project ������������������������������������
Project and loan profile '��(���0���� ���)�����3�������� ������8���/������� ������ $���
� ��� �� ��-�7 ������ ��� ������������ ��� �������"� ���� ����
������������� ����������� ��� � ��0�����!������������������
�������� ����3�� ��( ��� � �� ���� �� ����� � �� ��� ��������
���� +�� ��� ������ �� ��� ���� ��� ��� ���� ��� �� ������"� ���
��(���� ����������������������� ���������-�)���������������
�������������&���������� �������0)��&�3� -����� ����� ��� ��
�������� ���-� ������ ���� �� ��� �������� ��������������������
��� ��� ��� ����� ���� ��� ��� � �� ��� �� ���� ��� ����� �����
���� ����"� ���� ������� �� �� ���������� ��� ���(���� � ��� ��
����� ������� ������������� ����� ������$��� ������ ��� ��
���� �"�������������������������
�
Objectives ������ ���������� ���������������� ���� ������������� � � �� ���
������� ��� ����� ����� ��� )�����*�� ��� �� � ��� ��������� ���
�������������������7 � ����������� ���"��
�
Project output ����������������� �������������� ��<�
�
0�3�)������ ������G�� ������9���������������� ����������� ���"�
���� ������ ����������������� �������������� �����6<�
�"� J�"�<��������� �@��� ���0��������������� �����������3�
*"� J��6<������ ����)���� ���
6"� J�"�=�K�!<����������� ����#�������/��(���������:"@")"�
/��������
?"� J�"�A<���������� ���������(�#�������)���� ����������
="� J�"� <���������� ������ ������I��(���������
!"� J�"��><�������(�#�����������:"@")"�/�������������� �(��+���
0��������������� �����������3�
�
0�3�#�������I������������������6����� ���?<�
����������������������� ���������� �������������������
�"� J�"*<���;��������
*"� J�"?<���#������+���0�����3�
6"� J�"�4<������ (��������� ���0�����3�
�
���/�������.�;7��� ���:������
�����������)��&��/��(������� �����C�������� ����/� ���)��� �� ����
*���������)��&���������#����������6���������*>>=0�����*3�6���������)��&���������#����������6���������*>>=0�����*-�3�

83 Role of Infrastructure in Poverty Reduction
T E R I Report No. 2004 RD 24
��������� ���� /�������.� �7��� ��� ������� ���� ��� ������� �� ���
�������������8���/����������������&��������.����"�
���F�� ������I����:��������
� � ������� ����������������������� ��� ���� ��������A"�"��
Table 8.1 Loan agreement
ID-P122 Loan Amount Loan Disbursed Amount Date of Exchange of Notes
JPY 10,679 Mil JPY 6,958,683,599 22 January, 1997
Date of Loan Agreement 25 February, 1997 Terms and Conditions OECF (JBIC) “ General Terms
and Conditions” dated November 1987
Interest Rate Repayment Period (Grace Period)
2.3% p.a
5 years
Procurement OECF (JBIC) “Guidelines for
Procurement under OECF loan”
dated November 1987
Final Disbursement Date 29 December 2005
SOURCE Executing Agency Questionnaire, HRBC
#���<�������������������������������������7����������� ���
������������ ��������"
Evaluation of the project Relevance
�������������(����)������� �� ��� ����������� +��� ������
��� �������$� � ��������������������������������������������
���� ��������������� ���"�8 �� �����������������������
���� ��� ���-���� +�� ��� ����� � (�� � �(������ ������� ���� ��
������ ��� ��� ��� ������ ���� �� ���� ���� ��� ������ ��������
��������������������� ��"�:��������� ����� ��������� � ������
�������� ��� �� ����� !�������� ��� ��� ���� ������ ���������� ���
������� ��� ��� ��������� �� �7����� �� ���� ������� ������ ���
���� �� ������ ������ ������ � ��� ��� ���� �� ����� �� ��� �������
������"�
� ��������� ����� �������������������� �����=<�
������ ���������� �������� �������� ������� ������ �����
�� ������������������� ����������������"�
�� ������� ��� ��� ���� �� ����� �� ��� ����-������ ��� ��� ���
�������E���� ������������� ������� ���������� ������ ����
���������� ������ ������ ��������"���( ��� ������� ��������
�������� � ���������� ���������� ������� �������� ������
����"�
=���������� ���������������)��&��0�������������� ���K������ ��;�� ���� ���& �������.���������&�������.�������������8���/�����3������� !�

84 Role of Infrastructure in Poverty Reduction
T E R I Report No. 2004 RD 24
�� ����������������� � � ����������������������'��(����������
����������� ��#�����C�������/� ���0���G �����������3�
� ���� �������� �������������� ������ ���������� �������������
�������� ��������� ���� ���� ��"�
�� ����� ������������� +� ��������� �� ������������� ���
�� � ��� ��� ���� ��� ������� ������ � � �� �� ��� �������
����� ���)������ � �� ��� �������� ������� � � +� ��� ��� ���
#�����C�������/� ��"�
�
� ���� � �(�� ������� ���� ��� ��� ���� ������������ ���
���������� �� ��� �-������ �� ��� ���� �� ��� � �� ��������
�������� ������� �� ��� ��� ��� �� ��� ������"� �)��� ��� ��� ���-
������ ����� ������ ������ ��� �� ��� ����� ��� ��� � ��� �� ���
����� �������� ���� �� ����� ��� ������ ����� ��� ��� ���
�������"� �� �� � ��� �� ���� �������� ���(� ����� � �� �� ���
��� � � ��� ����� ��� ����� ��� ���� ���� �� ��� ����� ��� ��� � ���
�� �������������������������� ����� �� �"��
� ����������� ������ ����� ������������������� ����� �
���� ��� � �"� !�� �� ����� ������ +���� ������ ����� � �����
����� ��� ��� 0�������3� ���� ���� ��� ����� ���� ��� ��� ������
����������������� ��������������� ������� ����� ���� �����-
���������"���� �������� �(��� �����������������������������������
��� ��� � ���� ;�� ��������� #������� ��� ��� ��� � �����
&��������������"� � ;���� ������ �� ��������������� ��� � ��������
��������� � ������ ������7 � ������-����������� �������
��� � ��� �������� ���� ���"� ���������� �������� ����� ��� ���� ��
���������7������������������ ����������������������$��� ��
���� ��� ���������� ���������������� ���������������� � ������
��������"������������������� ������ ����� ������������������
����������������� �������
�
;�������� ������<� � ���� ������� �� �������� ���� ��� ��� ���� ��
������ ��� ����������������� �"��
�
Efficiency Project scope
����������� ���� ��� ��� ����� ����������(���������� � ������ ���
������ ��� ���������� ��� �7 � ��� ���.���� ���
�������������������(������ �-��������� �����������"�������
������ ������ ��������A"*"�
�
!���<..(��(��"��"� �" ��0�����������*!-*->!3�

85 Role of Infrastructure in Poverty Reduction
T E R I Report No. 2004 RD 24
Table 8.2 Project scope
Intersections Contract package
ID No. Name
Type of work Construction period
8 Park Street Flyover & At-Grade I
9 Lock Gate Road Flyovers & At-Grade 24 months (now 40.5 mnth.)
2 Esplanade At-Grade
3 Gariahat Flyover & At-Grade
4 Shyambazar At-Grade (dropped) II
7 Maniktala At-Grade (dropped)
29 months (now 65 mnth.)
III 5&6 AJC Bose Road Flyover & At-Grade Taken-over on 12.04.2004
IV Additional WATM Program At-Grade 21 months
��������������������������������SOURCE YEC Monthly Progress Report, February, 2005 (Page 2-1) �
��������������� ��������
�
�������� �
�������������� ����������������
���� ���(� ����� ��� ������ ���� ��������� ��� �=�� J��������
*>>����������������������������������?��J��������*>>6"�
����������������������������������������������� ����������
� ��9��������*>>="�
������������������ ���!������
�������(�������������������������� ��4������?���� ���������
��������� ����� �������/"�"����������������������(��������
���* ��:�����*>>?"�����9����������������������� ��� ��������
�����6���:�����*>>?"�
�
�������� �
������������"� ����#��!������
�������(����� �����������������������������������J��������
� .���� �������� ���� �������� ��� ������ �� ���� �� ��� �?��
:�� ��*>>*"�������������� ��������������������� ����������
�������� ��� ���� � ��� ��� ��� ���� ����� �7���� ��� ���� ��� ���
��������� �:������������ ������������������������������"�
�
������������$��%���&��'�����'�����(������&�
:������(����;��������������� ����������������������7����
��������� ������ ������� ����������<��
�� I������ ���������� � �� ������("�
�� ������� ���������� ��� ����� ��������"��
�� I� ��� ��� ��� �� :������ � ������ ��� ������ ��� ������� �� ��
��������� ��� ����� >� ������� ��� ��� ���(� ���� �����
�������"��
�� :������� � ������(��� �����������������6>��@����*>>="�
7 #�����<�)��&���������#����������6���������*>>=

86 Role of Infrastructure in Poverty Reduction
T E R I Report No. 2004 RD 24
�������� �
)*+���,��&!������
�������(�����������������=��������*>>����������������
���������������� ������ ��:�����*>>6"��
�
�������� ��
&&�������-�&�����������.�����'��� �����''� �� �� ���(���� ����� ���� ��� � �� ��� ��� ���� ������� ��� �-
������� ������ ������������(�������� ������ ��� �������������
���� �� �����"� ���� ���(� ��������� ���4�� @����� *>>6� �������
������������������ ���� � ������� ����� ������"������������
���������-�������������� �����(���������������������������
���������������������� �"�
�
� ���� ��������� &��������� ���������� ��� 8��� /������
�������� �� ������ �� ���� � ����� �������� ��� ����
���������� �� ��� ����������(���� �G���7��� ���� ������ ���
����������� ����� ��� ��� ���� �������� ������ ��"�@/�)� �������
�� ����������*>>?.J&I�0�:3-��4?�����4">6"*>>=� ����������
����� ��� �� ��� �������� ��� ��� ������� ��� ���(���� �G� ���
��������������#������"�:������������������������(����
�G���������������� ������ �����������������@/�)������ ������
������ ���� ���������������������� �����<��
��)�����;�������0�����/"�"���������� �(������ �����3�
����� �(����@��� ���0:�)���������� ��G ��(���������3�
�� ���(�#����0����������(�) �����@�"�������� (��+��3�
����������� �:������0������� �����������(���#����/�������3��
�
� :��� ��� ������ ���-������������������ �(������ ���� �7��� ��"�
�����������������������(�����G� �����������������������
���6>��#��������*>>="�
Brief description of the flyovers
����#��!������
��� ���� �������� �� ������ ������������� ��� ������ ���� ��
��������� � :�����"� ���� �������� ���� ������(� �� �� ����� ���
��� ���������&������ ������"�������������������������������
� ����� ���������������"��������������������������������� ���
�������������������������������������������"����-���� ����
������� �������������� �� ��� � ������������������ ��������
� � �����������"���������������������� ���������� �����������
���������� ��"�
� ����������7 �� ������� ������������ ��������������( ������
�7��� ������������������<���� ���� ������� �������� �������� ��
��� ������ �� �� ���� ������� ��� ��� ���� ���� ���������
���������������� (��"��������� �������� ���������������������
������� ������������������� �����������"�

87 Role of Infrastructure in Poverty Reduction
T E R I Report No. 2004 RD 24
� ���� �( ���� ������� ����� ����� ������� ��� ������ ��� ���
��� ������ ����� ���� �� ��� �� ������ ��� �7��� ���� �����
�����������@����"��
�
Features of the Gariahat Flyover
Total Length 571.06 m
Width of Carriage Way 2 x 7 m
Abutments 2
Piers 14
Contractor Senbo Engineering Ltd., Kolkata
Consultant Yachio Engineering Co. Ltd.
Implementing Agency Hooghly River Bridge Commissioners
Date of Commencement 1 November, 1999
Opened to traffic 14 April, 2002
SOURCE Booklet on Gariahat Road Flyover provided by Hooghly River Bridge Commissioners
���������!������
���� ���(�#���� 9������� ��������@����������J���������� ��
I ����� #���� �� �� ����� ���� ����� #���� �� ����"� ����
�������� ����� ����� ��� ����-����� ������ ���� ��� @����������
����� �����(�#�����F����������������������'��#���"��
�
���!"#�$�%&���#���!#��!��'(%)�#�
Total Length 1350 m
Width of Carriage Way 2 x 7 m
Abutments 2
Piers 21
Contractor Senbo-Skanska Joint Venture
Consultant Yachio Engineering Co. Ltd.
Implementing Agency Hooghly River Bridge Commissioners
Date of Commencement 15 November 2001
Opened to traffic 19 February 2005
����������������������������������������������������SOURCE Booklet on Park Street Flyover provided by Hooghly River Bridge Commissioners
�
)*+���,��&!������
���� �������� �7�� ��� �����&"I"�'�������� E� :@)�/��������
����� ��� �� ���(� ) ����� ������ ����� ) ����� :������ �������� ���
������ ��-��������-�������� ��"�
�

88 Role of Infrastructure in Poverty Reduction
T E R I Report No. 2004 RD 24
���!"#�$�%&�����*%$���%�+��'(%)�#�
Total Length 2.448 km
Width of Carriage Way East Bound 7.3 m wide (2 lane) , West Bound 7.3 m wide
Piers 21
Contractor L & T ECC Division
Consultant Yachio Engineering Co. Ltd.
Implementing Agency Hooghly River Bridge Commissioners
Project Duration 29 Months
Date of Commencement 15 March 2001
Opened to Traffic 19 August 2005
SOURCE Booklet on AJC Bose Road Flyover provided by Hooghly River Bridge Commissioners
�
��������,��&!������
I��(���� ���� 9������� �� ����� )��� ����� ��� )� ���� �� �����
����������� ���/"�"��������)��� ��������"������������������
��� �����������#������+���� ��-�� ������� ��"��
�����
�����!"#�$�%&��%����!���%�+��'(%)�#�
Total Length 1070 m
Width of Carriage Way 1 x 7 m
Contractor Senbo-Skanska Joint Venture
Consultant Yachio Engineering Co. Ltd.
Implementing Agency Hooghly River Bridge Commissioners
Date of Commencement 15 March 2001
Opened to Traffic 29 August 2004
SOURCE Booklet on Lockgate Road Flyover provided by Hooghly River Bridge Commissioners �
,�����������/����������
:� ������� ��� ��� ��� ��� � � ��� ��� �� ��� �������� �������
������� ������ ����� �� ��������� �������������"�&���� � ���
� (������� ���������� �������������������������������(�������
����� ��"������� �������������������� � ���� (��� ��������
��� ���������� ������� ��� ��� ���(� ������� ����������������
����� ������������������"�
� ��� ������� ������� ����� �� ��� �������� ����� C�� ��� ���
� ���-������� �������������������������� �������� ��������
� ���"������������������������ � ������������������� ���
���� ������������������ ������������������� � ��"��
� 9����������������� ���������� �(��� �� ������� ���� � ����
������� ����� ���� ������ �� ���� �� �� ��� ������� ��� ��� ���
�������"� ��� ������� ��� � �� '��(��� ����� �� ��� ���� �� ����� ����
���� �� ���� ��� ��� �� ���������������������"�&�� ��� ���
�� ��� ������� ��� ��� ��� *� ������ ����� ���� ��� ������ ���
��� ����������������� ��� ��������� �������������"��
� ���� ���� ��������������������������������� �"���
A�#�����<�/��(��������� ��������9����������� �����C�������� ����
/� ���)��� �� ������

89 Role of Infrastructure in Poverty Reduction
T E R I Report No. 2004 RD 24
�
Implementation Schedule ��'�!��'�
:������ �������� ���������� �������� ��������������� * ������
*>>="� ���� ��� ���� �������� ����� �7���� �� * �� &��������
*>>="������������������������������ ��� ���� ��������A"6"�
Table 8.3 Present status
*Certain items of works are being carried out during the defect liability period
SOURCE CTIDP Project Status Report, 31st March, 2005, Page-4
��0���*���
��������������������� ��� ���� ��������A"?"������������� �� ���
������� � ��������� �������������� ��� ��������A"="�
Table 8.4 Project cost (billion rupees)
(A) Civil work 2.96
(B) Consulting Services 0.41
(C) Interest during Construction 0.20
(D) Contingencies 0.30
(E) General Administration, Taxes 0.13
(F) Total 4
OECF Contribution 3.4
Government of West Bengal contribution 0.60(0.47 for civil work)
SOURCE CTIDP Project Status Report, 31st March 2005, page no-3
Package Date of Tender Date of opening
of Tender
Date of commencement
of work
Schedule time
for construction
Extension granted up to
Package I Done (31.3.2000) (27.06.2000) 15/11/2001 24 months 30/06/05
Package II Done Done 1/11/99 29 months 30/06/05
Package III Done (4.4.2000) Done (12.07.2000) 15/3/2001 29 months 31/03/04* (completed)
Package IV 07.07.2003 27 months 30.09.2005

90 Role of Infrastructure in Poverty Reduction
T E R I Report No. 2004 RD 24
Table 8.5 Present situation: civil construction cost
SOURCE CTIDP Project Status Report,31st March, 2005,page-4
Cost efficiency ���������� ������������ ��� ������ �������� �������������
�7��� �����0��������������� �����������������������3"�8��
��������� �������������� �������-� ��������� ��������� ����
����������7��� ���"��� ����������������������������������
����� ���������������������������"��
� ������� �������������� �� ���������� ����������7��� ���� ���
����� ��� ���� ��� ����"� �� �� ��������� ��� ��������������
��������� �� ��� ����� ��� ��� � ��� �� ��� ���� �� ����� � ���
������ ������ �"����������� ������ �� ����'��(��� �� *?4�A�
�����$�(������������*>>��������B��������������������������������
������ �� ���7����������� ����"�������� ����7��� ��� �������
������������������������ ������������������ ������ ���� � ��������
��������������� �������� ����� � ��"��
�
Table 8.6 Estimated and actual expenditure
Year Estimated expenditure (yen) Actual expenditure (yen)
Foreign Total Cost Local Total Cost Total Cost Foreign Total Cost Local Total Cost Total Cost
1997-98 654375960 165644040 820020000 344159646 133293 344292939
1998-99 109798416 27793584 137592000 81529915 53671483 135201398
1999-00 721711200 182688800 904400000 472523620 110641776 583165396
2000-01 1783051200 451348800 2234400000 1037866482 245134834 1283001316
2001-02 3320322390 840482610 4160805000 886141613 220025502 1106167115
2002-03 2513707980 636302020 3150010000 1401116196 431444689 1832560885
2003-04 2530685430 640599570 3171285000 2072701778 456666641 2529368419
Source Executing agency
Intersection No. Package
Number
Name of intersection Project Cost in Rs Crores after
amendment where made
8 I Park Street 63.62
9 I Lock Gate 28.87
10 I Mullickbazar Dropped
Sub Total 92.49
2 II Esplanade 11.90
3 II Gariahat 47.60
4 II Shyambazar Dropped
7 II Maniktala Dropped
59.50
1 III Moulali Dropped
5 & 6 III Rabindra Sadan / Beck Bagan 142.70
AWATM INCLUDING
PHASE 2
IV
In different roads 52.03
Total 346.72

91 Role of Infrastructure in Poverty Reduction
T E R I Report No. 2004 RD 24
Figure 8.1 Estimated and actual expenditure ;�������� ������<� � ����������� �������� ����� ��� ����������
������������������ ����������� �������� �������������������
�����������������������"��
�
Effectiveness
SOURCE Log frame, CTIDP
�
� ���� ����� ������ �������������� � ������ ����(�������� �������
� �������������������������"�:������ ����������������� ������
���������� ���������������� ����"�C����������� ���������� ���
������� ���� ����� ������� �� ����� ��� ����� � ���� ������(�
��������� ������������������������������������� ������� ����
����� ��� ��"� � 9��� �7��������������� ������� ������������� ���
������ ���� ���� ��� ��������� ����� ������ ������ ���� ��� ���
��������������������������� �������������������"����������������
1998 (estimation)
Intersection no.
1, 24,021
2. 26,895
3. 16,487
4.18,040
5. 19,172
6. 18,847
7. 14,043
8. 28,527
10. 23,512
Total from 2001 to 2021 (1,000 Rs.)
Route� *
1,320,950
5,650,976
Route 2**
910,808
3,951,721
Route 3***
462,746
4,377,736
1) Annual Average Daily Traffic (AADT)
(PCU/12 hours)
2) Saving of driving expenses (Rs/hrs)
3) Saving of transport time (Rs/hrs)
4) Decrease of traffic accidents (Rs.)
5) EIRR
Not available
20.08%
* Route 1: intersection No.1, 5-6, 10
** Route 2: intersection No. 9,4,7
*** Route 3: intersection No. 3,8,2
Expenditure - Actual and estimated
0500000000
10000000001500000000200000000025000000003000000000350000000040000000004500000000
1997-98
1998-99
1999-00
2000-01
2001-02
2002-03
2003-04
Year
Exp
endi
ture Estimated expenditure
(Million yen)Actual expenditure (Millionyen)

92 Role of Infrastructure in Poverty Reduction
T E R I Report No. 2004 RD 24
0$��� � ��3� � ����������������� �������������� �������
������ ����"��
�
;�������� ������<� ������ �� ���������� �� � ��� ������ ��� �����
�� ���� ��B� �������� ���� �� ��� �� $��� � ����� �������
����� ����������������� �����"��
��
Impact Social impacts: land acquisition and relocation
������ ���� ����� ��� ���� ��$� � ��� ��� ������ ��� ���� ���
������� ��������������� �����������'��(��" �
� �� �� ���� �������� ���� ������� ��� ���� ���� ��� �����
�������������"��
�
1�'�����#�2�����%�����'���
&�� ��� ��� ������� �� �������� ������� ��� �� ��������� ���
������������ ������ �� ���K�������� ��� �� � �������������
� ����������������������,�������� �������������������������
������� ��"���������������������������������� ����������
��� ��� ���� �� � �� ��� �� ��� ����� ��� ���� ����� ����� �����
�������������������������������������������������� ��"�>�
�
Environmental impacts11 ���&���
������������������� ����������������� ������� �������7 � ���
��������������������� �������$� � ���������� �����������"�
9��� ��� ����� �������� ��� ������� ��� ��� ����� ��� ��� ���
�������������������������������� �������� ����� � ��������� ��"�
�
���������&�����&3����4������
����������������������������������������� �������������
$��� �� 0�������� ��� ������ ����3"� :�� ��� ������� ���� ���
������������������������� �������������� ������� �� ������
����� ��� ������ ��� ������ ��� �� ������� ��� ��� $��� �� ��
���� � ���"�
�
�'��������5������
���� )�� ��6� & ����� ��� �����*� �������� ��� )�� ���� ��
&�������� ��� ��������� ��� ���� ���� ���� � ���� ��� ��� ���
�0��������;�� ���������������:���������#����)��&��0���������
&�������.��������������8���/������.C�/).�5;)3��������� A3��>�#�����<�;�� ���������������:���������#����)��&��0���������
&�������.��������������8���/������.C�/).�5;)3��������� A����������� ��� ����������;�� ���������������:���������#����)��&��
0���������&�������.��������������8���/������.C�/).�5;)3��������
� A �*�)�� ��6� ����� �������� ���� ����������� ��$��� ������"��� �������������
����� ���& ���� ���;$�� ����������������� 7 ���+�������������
�������� +���������� ����� �����������������"�� �������������������
������������� �������������� ���������� � ������������������� �����

93 Role of Infrastructure in Poverty Reduction
T E R I Report No. 2004 RD 24
��������������������������������� ������ +"�)F����JF7� "�
������ ������������� ������������ ���-�
����������������� 4-� A������� ��
�����������*>>>-*>>�������� ��� �������������������������
�����������*>>>-*>>�������� ��� ��������������������
�
� ���� ����� � ���� ��� �7��� ��� �������� ��� ��� � �� $��� ��
����������������� ������� �������� ������� ������������
��� � ��� �������������������������-������)F����*?-�����JF7��
������� �� ��� !"6>� ��.�6� ������ ����� ��� �� ���������� ��
�� �� ��� ������� ������� � �� ��� �������� �� ���� ��� ������
��� ������������� ����������� ������� �� ���������"�
6����
)��������� ���� ����� ���������� ������� ���� �� �������� ��� ���
��� �������� ����� ������������������ ��������������������"�
�� ������������� �� �7����� ����� ����� ���� �� ��� ������
������������ ������������� � �� ������� ������������� ��������
� ���������������$�������-������� ����� ���"�
�
(������
���� ������� ��� ��� ��� �������� ������ �� �������� �� ������
����� ������ ����� *>>� ����"� C�������� ��� ������� ���������
����� ��� ����� �� �����(�� ������������ ����� ��� �� � ��
�����"� )�-����� ��� ��� ��������� ) � �� :���� ��� ����� ���
�������� �� ����� ��������������� ���������"���
�
;��������������<������������������������� � ������ ������ ���
��� ��� ��������� ������ ��� �� � ��� ������ ��� ��� ��� ��� ���
������������� ���������� �������� ��"��
Sustainability Financial Status
CTIDP 122 Financial Status Upto 31.03.2005
Total Project Cost Estimate Rs 400 Crores (i) Loan from JBIC Rs 340 (ii) Govt. of West Bengal Rs 60
1.
Total Rs 400
SOURCE CTIDP Project Status Report, 31st March, 2005 (Page no 8)
Consultancy Service from 7th May 1997
Rs Yen Portion Rupee Value 2.
Contract Price Yachiyo Engg. Co. Ltd. 302,892,990 894,580,052
SOURCE CTIDP Project Status Report, 31st March, 2005 (Page no 8)
��� ������������������ ������������������������ � ��*>>����������
������

94 Role of Infrastructure in Poverty Reduction
T E R I Report No. 2004 RD 24
Name of Package Contractor Contract Value (RS)
Package I 24 months/extended upto 30.06.05
Senbo-Skanska JV Commenced from 15/11/2001
689,193,286.56
Package II Extended upto 30.06.2005
SENBO ENGG.Co.Ltd. Commenced from 01/11/1999
636,300,172.27
3.
Package III 29 months/completed on 31.03.05
M/SL&T Ltd Ecc Div Commenced from 15/03/2001.
1,777,273,650.00
Package IV 26 months 3 weeks (up to 30.09.05
TANTIA CONSTRUCTION CO LTD Commenced from :-08/07/2003
520,270,888.00*
* The disbursement by JBIC upto 31st March 2005 was Rs 494639875 (or 95% of the contract value). The previous figures were taken from the CTIDP project status report, in which there was an error.
SOURCE CTIDP Project Status Report, 31st March 2005(Page no 8)
Disbursement Upto 31 st March, 2005
JBIC JBIC Govt. of West Bengal
Rs Yen Portion Rs
[a] Consultancy 347,122,619 928,085,640 -
[b] Contingency 294,719,318
[C] Senbo-Skanska JV (Civil) 585,161,053
114,659,250
4.
[d] Senbo Engg.Co . Ltd.(Civil) 378,785,690 72,149,655
[e] L & T LTD. ECC.Divn.(Civil) 1,138,560,218 216,868,611
(f) Tantia Construction Co.Ltd.(Civil) 306,314,481 - 58,345,615
Total Rupees 2,755,944,061 928,085,640 756,742,449
SOURCE CTIDP Project Status Report, 31st March 2005(Page no 8)
C T I D - P R 0 J E C T (I D P - 1 2 2) Expenditure Statement From 1997-98 To
31st March, 2005
Major Break Up of Project Contingent Expenditure
1. CONTINGENCIES Rs 14,638,185
2. PUBLIC AWARNESS PROGRAMME Rs 4,763,964
3. LEGAL EXPENSES Rs 461,635
4. BANK CHARGES Rs 6,929,431
5. COMPUTER & SOFTWARE ACCESSORIES Rs 1,059,458
6. FUND PLACED TO CMC, KMDA,CTC(Civil) Rs 9,026,110
7. PLANTATION PROGRAMME Rs 4,249,900
8. Charges of land use (Rail, Metro Rail) Rs 29,535,358
9. 1% MARGIN MONEY TO D.E.A., GOVT. OF INDIA Rs 395,111
Total (Rs) Rs 71,059,152
10. Utilities relocation of PWD shifting of pillar box (Civil) Rs 1,83,154
11 Utilities relocation of CESC reimbursable from JBIC (Civil) Rs 61,231,383
12 Electricity charges of Package- I, II & III Rs 8,881,772
13 Electricity charges of Package- I, II & III Rs 153,363,856
Total Rs 294,719,318
SOURCE CTIDP Project Status Report, 31st March, 2005 (Page no 9)
�

95 Role of Infrastructure in Poverty Reduction
T E R I Report No. 2004 RD 24
� # �����������������������������-���� ��� ��������������������
� �� �� ���� �� ������ �� ���� ��� � �� ������� � ���� ���
�������"��C��������������������������� ����������������������
��� ������� ��� ����� �7��� ���� �� ��� ����� � (�� � � ��
������ ���� ���� �� ����������� ����� ���� ���� �� ��� ��(��� ���
����������� ������ �������������"�����������������������������
�����*?D�������������� ������7��� ����������������"�����
�
Organisational status
������������������������������������������������������� ������� ����������������������� ������������ ��<�
Category 2001-02 2002-03 2003-04
Technical 61 77 69
Administrative* 37 33 42
* Finance, stores, general administration etc.
� �� ��������������������� ������� �������� ���� �� �������
���������������� ��������"� ���� �� �������������(���� ������
������� ������ ����� ������������(����E��������������� � ������
���)� ���;�� �����������������"����������������� �� � �����
�� � ����������������������������� ���������� ����(�������"���
�
;��������������(<�9 ���� ������� ��� � �� ������������������
�� ��� ����7� ��� � �� ������"� ��� ����� ��������� ���� �����
����� �� ���������������� ��� ���������� ��� � �"��
�
Beneficiary views :� ������� ���� ���� �� ��� �� �������� ��� ������� ��� ��� ���
�������������� ��� �� �� ���������� ��� �� ��������������� ��"�
6�*���������������� ���� ������������ � ������ ��������
��������������������� �"�
�
Basic profile of the sample ������� ������ ���������������������������������"�
�� :������������� ������������������� ���� ��������������
������� ���������066�������3���������� ����������� ��0*6�
������3"�
�� ������������� ��������6 �����������������������"��
�� ���� ������� ��������� ������ ��� ?6� ������� ��� ���
���������� ���� ����� ������� =>>>� ����������� 6 ��������
� ����������� ����������������=>>>�E�����>>>>"�
�� :���� *�� ������� ��� ��� ���������� ����� �� ��� �� �� ����
��� ����"��
�
� :��� ������� ��� ��� ���� ��������A"4"�
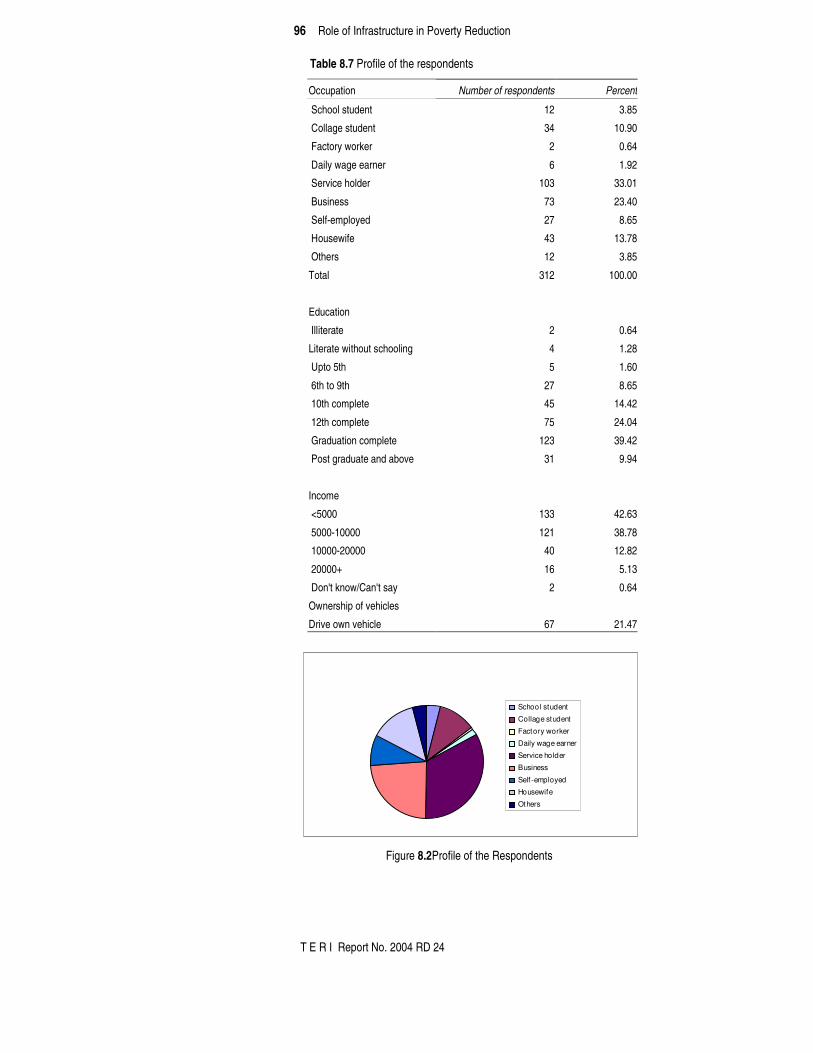
96 Role of Infrastructure in Poverty Reduction
T E R I Report No. 2004 RD 24
Table 8.7 Profile of the respondents
School student
Collage student
Factory worker
Daily wage earner
Service holder
Business
Self -employed
Housewife
Others
`
Figure 8.2Profile of the Respondents
Occupation Number of respondents Percent
School student 12 3.85
Collage student 34 10.90
Factory worker 2 0.64
Daily wage earner 6 1.92
Service holder 103 33.01
Business 73 23.40
Self-employed 27 8.65
Housewife 43 13.78
Others 12 3.85
Total 312 100.00
Education
Illiterate 2 0.64
Literate without schooling 4 1.28
Upto 5th 5 1.60
6th to 9th 27 8.65
10th complete 45 14.42
12th complete 75 24.04
Graduation complete 123 39.42
Post graduate and above 31 9.94
Income
<5000 133 42.63
5000-10000 121 38.78
10000-20000 40 12.82
20000+ 16 5.13
Don't know/Can't say 2 0.64
Ownership of vehicles
Drive own vehicle 67 21.47

97 Role of Infrastructure in Poverty Reduction
T E R I Report No. 2004 RD 24
Profile of the respondents(Education)
Education
Illiterate
Literate w ithout schooling
Upto 5th
6th to 9th
10th complete
12th complete
Graduation complete
Post graduate and above
Figure 8.3 Profile of the Respondents (Education)
Profile of the Respondents-Income
<5000
5000-10000
10000-20000
20000+
Don't know /Can't say
Figure 8.4 Profile of the Respondents (Income)
�
Use of flyover ��������������������������������������0=6�������3��������
��������� ��� ����������������������������?!�����������������
�� ��� ���������������*-6� ���������(�0������A"A3"��
�
Table 8.8 Frequency of flyover usage
Frequency of use of flyover Number of respondents Percent
Use it every day 165 53.05
2-3 Times a week 143 45.98
Once a week 3 0.96
Total 311 100
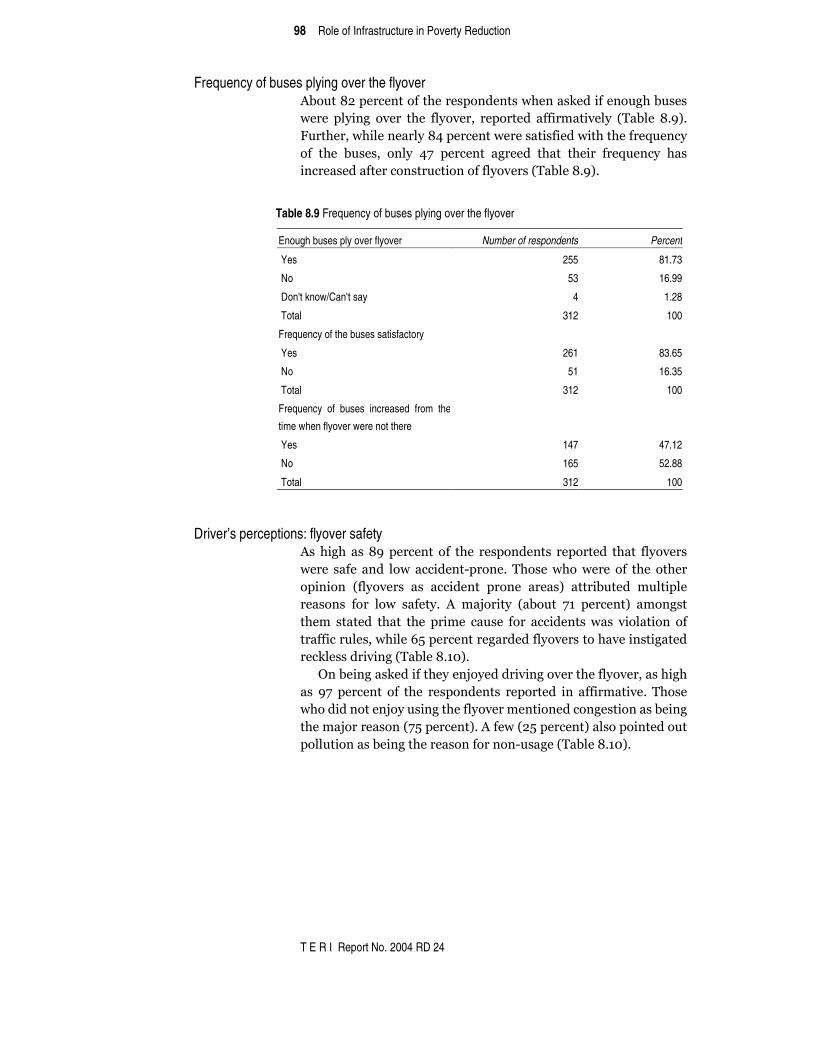
98 Role of Infrastructure in Poverty Reduction
T E R I Report No. 2004 RD 24
Frequency of buses plying over the flyover
:����A*�������������������������������(�� ���������������
�������� ��� ����� ��� ��������� ������� ��� ��� �����0������ A" 3"�
9��������� ����������A?��������������� �� ��� ��������$������
��� ��� ������� ����� ?4� ������� ������ ��� �� �� ���$������ ����
�������������������� ���������������0������A" 3"��
Table 8.9 Frequency of buses plying over the flyover
Enough buses ply over flyover Number of respondents Percent
Yes 255 81.73
No 53 16.99
Don't know/Can't say 4 1.28
Total 312 100
Frequency of the buses satisfactory
Yes 261 83.65
No 51 16.35
Total 312 100
Frequency of buses increased from the
time when flyover were not there
Yes 147 47.12
No 165 52.88
Total 312 100
Driver’s perceptions: flyover safety :��� ������ A �������� ��� ��� ���������� ������� ��� ���������
����� ����� ���������� ��-�����"� ��������������� ��� ��� �����
�� � ��� 0��������� ��� ��� ��� ������ �����3� �� ���� ��� ����
�������� ���� ���� �����"� :� ����� �� 0����� 4�� ������3� �������
���� ���� ��� ����� ��� ������ ���� ��� ��������� ��� ��� ���
���� ����������� ���!=������������������������������� �� ����
���(������ � ���0������A"�>3"�
� F���� �����(�� �������������� � ������������������������ ���
��� 4�������� ��� ��� ���������� ������� �� ��� ��� ��"� ������
���� ������������ ����������������� ���������� �������� ���
����������������04=�������3"�:�����0*=�������3�������� ������
����� �������� ��������������������-������0������A"�>3"�
�

99 Role of Infrastructure in Poverty Reduction
T E R I Report No. 2004 RD 24
Table 8.10 Percent of respondent by safety of flyovers and enjoyment of drive on it
Safety of flyovers in terms of accident Number of respondents Percent
Yes 278 89.10
No 34 10.90
Total 312 100
Reasons for flyovers not being safe *
Flyover have instigated for reckless driving 22 64.71
The condition of the roads are poor 19 55.88
There is violation of traffic rules 24 70.59
Total 65
Enjoy while driving on flyovers
Yes 304 97.44
No 8 2.56
Total 312 100
Reasons for not enjoying while driving over flyover
There is too much of congestion 6 75.00
There is pollution 2 25.00
Total 8 100
* Multiple response
Responses regarding whether flyovers are safe
Yes
No
Figure 8.5 Responses for Flyover safety

100 Role of Infrastructure in Poverty Reduction
T E R I Report No. 2004 RD 24
Reasons for flyovers not being safe
0
1020
3040
50
6070
80
Flyover haveinstigated for
reckless driving
The condition of theroads are poor
There is violation oftraffic rules
perc
ent
Figure 8.6 Reasons for flyovers not being safe
Whether respondents enjoy while driving
Yes
No
Figure 8.7 Whether respondents enjoy while driving
Reasons for not enjoying while driving over flyovers
75%
25% There is too muchof congestion
There is pollution
Figure 8.8 Reasons for not enjoying driving over flyovers

101 Role of Infrastructure in Poverty Reduction
T E R I Report No. 2004 RD 24
Impact of flyovers: social Commuting time
:����� ���� ���������� ������� ��� ����� ��� ��� �� �����
������ ����� ���� ����� �� ��� ��������� ��������� ���������
0������A"��3"��
Table 8.11 Reduction in commuting time by using flyovers
Flyover usage has reduced the commuting time Number of respondents Percent
Yes 311 99.67 No 1 0.33 Total 312 100
Road congestion and city outlook
:��� ��� ���������� �7���� ��� ������ ��� ��� ��������
������� ������������������� �,�� �����0������A"�*3"�9�������
�������(�������������������������������������������� ���
�����������������6�������������������� ���� ������ ����� ��
����� �7���� �� ��� ����� ����� ��� ��� ���������� ==� �������
���������������� ���������� ��������������������� �����
������� ���������������0������A"�*3"�
�
Table 8.12 Social impacts of flyovers
Flyovers have enhanced the image of the city Number of respondents Percent
Yes 310 99.36
No 2 0.64
Flyovers decreased the congestion on the road
Yes very much 43 13.78
Yes to some extent 96 30.77
No, Not so much 69 22.12
No Not at all 104 33.33
Total 312 100
Figure 8.9 Whether Flyovers have enhanced the image of the city
Responses whether Flyovers have enhanced the image of the city
Yes
No

102 Role of Infrastructure in Poverty Reduction
T E R I Report No. 2004 RD 24
�
Figure 8.10 Whether flyovers have enhanced the image of the city
�
Impact of flyovers: environmental ��������� 4�����������������������������������������������
��� ����� ��� ����� ��� ��� ��� ������"�F�� ����� 6?��������
���� ��� ��� ����� ���� ���� ������"� ��������� ������� 044�
������3� ��� ����� ������ ��� ������ ������ ��� �������� 0� �
������3���������� ������������ ���� �������� �� �������
��� �������0������A"�63"�
Table 8.13 Environmental impact of flyovers
Improvement in the environment Number of respondents Percent
Yes very much 105 33.65 Yes to some extent 198 63.46 No, Not so much 4 1.28 No Not at all 5 1.60 Total 312 100
Attributes for improvement Establishment of shops around the flyover 236 77.89 Improvement in access to a school, hospital 59 19.47 Increase in labour productivity 3 0.99 Less congestion on roads 5 1.65 Total 303 100
Responses whether Flyovers have decreased the congestion on the road
14%
31%
22%
33% Yes very much
Yes to someextent
No, Not so much
No Not at all
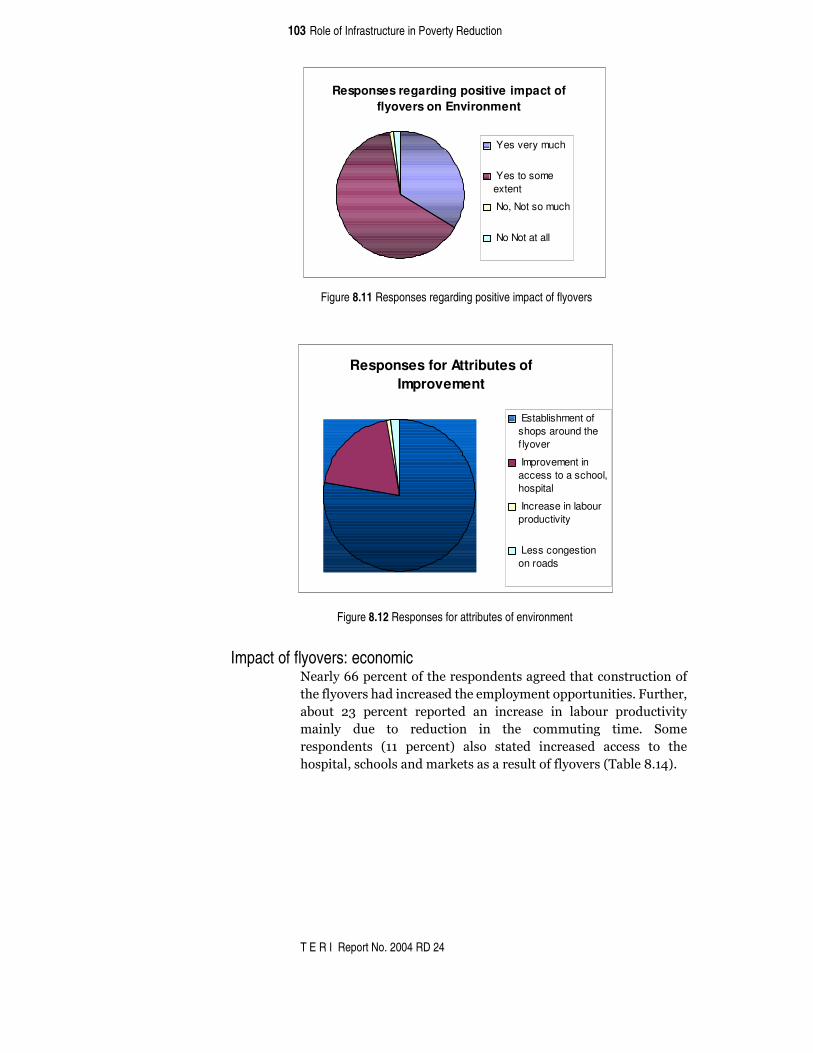
103 Role of Infrastructure in Poverty Reduction
T E R I Report No. 2004 RD 24
Figure 8.11 Responses regarding positive impact of flyovers
Figure 8.12 Responses for attributes of environment
Impact of flyovers: economic
J������!!���������������������������������������� ������
��������������� ���������������������������� ��"�9�������
����� *6� ������� ������� ��� �������� �� ������� ����� � ��
�� ���� ��� �� ���� ��� �� ��� ����� ��� ��"� #����
���������� 0��� ������3� ����� ���� �������� ������� �� ���
���� ������������������(��������������������������0������A"�?3"�
�
�
Responses regarding positive impact of flyovers on Environment
Yes very much
Yes to someextent
No, Not so much
No Not at all
Responses for Attributes of Improvement
Establishment ofshops around thef lyover
Improvement inaccess to a school,hospital
Increase in labourproductivity
Less congestionon roads

104 Role of Infrastructure in Poverty Reduction
T E R I Report No. 2004 RD 24
Table 8.14 Economic impacts of flyovers
Attribute Number of respondents Percent
More employment opportunities 200 66.01
Increase in labour productivity 69 22.77
Increased access to hospital, schools, banks, markets 32 10.56
Increased opportunities for socialization 1 0.33
No of shop increased 1 0.33
Total 303 100
�
Figure 8.13 Responses regarding Economic Impact of flyovers
Responses regarding Economic Impact of Flyovers
More employmentopportunities
Increase in labourproductivity
Increased access tohospital, schools,banks, markets Increasedopportunities forsocialization No of shop increased

105 Role of Infrastructure in Poverty Reduction
T E R I Report No. 2004 RD 24
ANNEXURE 8.1: TERI QUESTIONNAIRE FOR FLY-OVER USERS Schedule No.
IDENTIFICATION PARTICULARS:
Name of the PSU
Name of site / location
Date of visit (DD/MM)
Result* of the visit
*Result Codes 1 = Eligible and Completed 2 = Eligible but refused 3 = Eligible but incomplete 4=Not Eligible
TO BE ADMINISTERED AT A SCHOOL/ COLLEGE/ OFFICE COMPLEX WHERE THERE IS A SIGNIFICANT NUMBER OF USERS
FOR OFFICIAL USE ONLY
Name Signature INTERVIEWER: __________________________ ____________________ SUPERVISOR: __________________________ ____________________ SPOT CHECKED: __________________________ ____________________
INFORMED CONSENT FORM Introduction: Good morning/ afternoon/ evening. “My name is…………… I’m from a research agency called TNS India. We are carrying out a study to understand peoples’ perception about the different infrastructure in the city. Importantly, the results of this study will help us in designing appropriate strategies for the future. We’re interviewing different categories of people. Although it is useful to interview every individual, time and finances restrict our ability to do so. Hence, we select a sample of individuals. You were randomly selected to be interviewed – that means that you were picked by chance to talk with me as are others who are asked to talk with us. This place has also been selected by chance for the survey in order to find out the present scenario. Confidentiality and consent: I’m going to ask some questions that some people may not feel comfortable answering. I want to assure you that your responses will be completely confidential – that is, no one will ever know what answers you gave because your name will not be linked to your answers. Your answers will be combined with answers from everyone else who is being interviewed so we can understand what is happening to this place as a whole – not just to you as an individual. Your name will never be divulged to anyone. You do not have to answer any questions that you do not want to answer, and you may end this interview at any time. Your participation in the interview will help us to provide better infrastructure in the city. Kindly spare some time and respond to my questions. It will take approximately 15-20 minutes.

106 Role of Infrastructure in Poverty Reduction
T E R I Report No. 2004 RD 24
Q No. Questions and filters Coding categories and codes Skip to
18. What is your name?
PLEASE WRITE IN BLOCK LETTERS
19. Contact details Phone number: Address: Email
20. Sex of the respondent Male ------------------------
-------------------------------
Female
21. What is your age in completed years? (WRITE THE AGE IN THE SQUARE BOXES)
22. What is your occupation? School student …………………………………………….. Collage student ……………………………………….. Factory worker……………………………………………… Daily wage earner …………………………………………. Service holder ……………………………………… Business Self-employed Housewife Other (specify)___________________________
1 2
3 4
5

107 Role of Infrastructure in Poverty Reduction
T E R I Report No. 2004 RD 24
23. What is your highest level of education? (SINGLE CODE)
Illiterate Literate without schooling---------------------------------------Upto 5th 6th to 9th -------------------------------------------------------------- 10th complete-------------------------------------------------------- 12th complete ------------------------------------------------------ Graduation complete---------------------------------------------- Post Graduate and above---------------------------------------
1 2 3 4 5 6 7 8
24. Combining all your sources of income, how much do you earn on average in a month? (WRITE THE INCOME IN NUMBERS IN THE SQUARE BOXES WITH LEADING ZEROES)
Rs
Don’t know/Can’t say
88888
25. What is the address of your work place / school / collage?
26. How far is it from your place of residence? Mention distance in KM
27. What is the name of the flyover you use?
28. Do you drive or use a public transport for commuting?
Drive own vehicle Use public transport
1
2
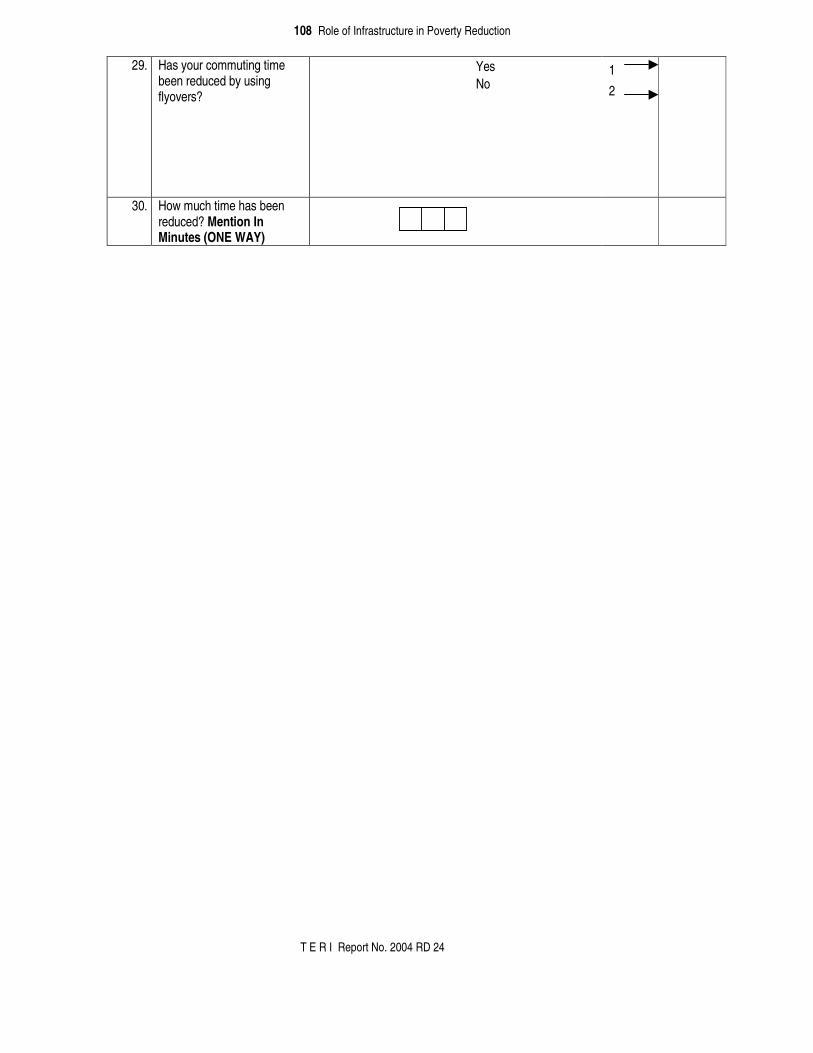
108 Role of Infrastructure in Poverty Reduction
T E R I Report No. 2004 RD 24
29. Has your commuting time been reduced by using flyovers?
Yes No
1 2
30. How much time has been reduced? Mention In Minutes (ONE WAY)
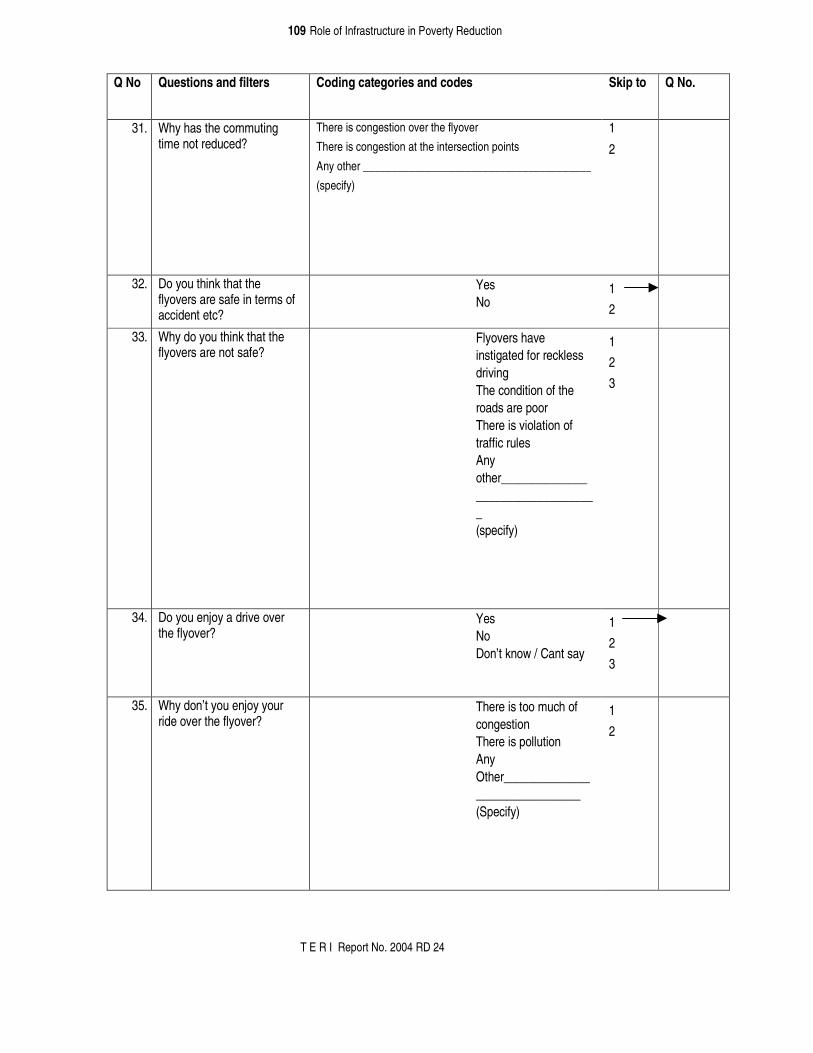
109 Role of Infrastructure in Poverty Reduction
T E R I Report No. 2004 RD 24
Q No Questions and filters Coding categories and codes Skip to Q No.
31. Why has the commuting time not reduced?
There is congestion over the flyover
There is congestion at the intersection points
Any other ________________________________________
(specify)
1
2
32. Do you think that the flyovers are safe in terms of accident etc?
Yes No
1 2
33. Why do you think that the flyovers are not safe?
Flyovers have instigated for reckless driving The condition of the roads are poor There is violation of traffic rules Any other__________________________________ (specify)
1 2 3
34. Do you enjoy a drive over the flyover?
Yes No Don’t know / Cant say
1 2 3
35. Why don’t you enjoy your ride over the flyover?
There is too much of congestion There is pollution Any Other_______________________________ (Specify)
1 2

110 Role of Infrastructure in Poverty Reduction
T E R I Report No. 2004 RD 24
36. Are there enough bus routes over the flyover to suit your needs?
Yes No Don’t know / Cant say
1 2 3
37. Is the frequency of the buses satisfactory?
Yes No
1 2
38. Has the frequency increased from the time when flyover were not there?
Yes No
1 2
39. Do you think that the flyovers has enhanced the image of the city?
Yes No
1 2
�

111 Role of Infrastructure in Poverty Reduction
T E R I Report No. 2004 RD 24
CHAPTER 9 Haldia port modernization project �
�
Project and loan profile Objectives
������������������ ��������������������� �������� ����� ������������ �����
��� � ����� �� ���C�� �� ���� ��� ��� �� ������� ������� ��������
������ �������������������"�
�
Project scope and salient features ���� ������� ��� ��� ��� ������� ��� ��� ��� F �� @��� *"� ����
�� �������� � ��������������������������������������<��
�� 9 ���� �� ����$� ����"�
�� Waste oil disposal facilities. �� 2 tug boats (traction: 35 tons; also used as fire boats). �� Navigational and berthing aids. �� 1 trawler (200 HP) �� I�������������
�
� F�� ����������� ���� ��� A�=*=�� �� �������� ���F&:������ �������
����� ��� ���� ��������������� ���06�?!6�� �� ������3�������������
��� ������ ��������� ��� ��� 06*A� � �� ��� ��������� �������3� ���� ��
������� 6�4 ��� �� ������"� ���� ���� � ��������� ������������ �������
���������� ������� ����� ��� ����������������� ��� ����� ����� ���
�7��� ���������"�
�
Status ����������� ��������������7����������� ���������������� ����"��
Evaluation of the project Relevance
�����������*������������ ���� �� ���� ���)��������� �������
����C�� �� ��� ����� �?>�� ��������� ������ �� �,�� ����� ��"�
C�� ������ �������� ��� ��� � ������(� ��� ���C������� � ���-��
� ��������� ���� ����������"�&����������������C�� ���������
��� ����� ���� ���� )������ ����� �� ��� ��� � !>�"� C��������
������ �� ������� � +�� �� ������ ������ ��� ��� �������� ����
������ ���������)����������)�����7�������������� ������ ��
�������������� ��������������������� ������ �������������"��
� �������������� ��� C�� ������ ���� ��������������� ���
�7 � ��� � �� ���� ������� �������� ��� �� � ������ ���� ��"� :�
� � � ����������� �������������������������������� �"�#����
��� ��� ��� � ������������������� ����������������������
��������������������������������� ���������������� ����"�
F �� ������� �������� ��� ��� � ��� ��� ����� �� �������� �����
����� � ��� ��"���������� �����������������������������������
����� �����)����������������� ��������������������� ��
����������� ������� �����������������7 � ���0J�������3�� ��

112 Role of Infrastructure in Poverty Reduction
T E R I Report No. 2004 RD 24
�����������������. ������ ���������������� ����$� ����"�
C�������� � ���� ����� ���� ���� � �� ��� ������� � ��-�����
���������������0� A=-� A 3������ ��1 ������� ��� ����� �����
��� � ���������� ���������2"��
� ��������������������� �������� �������������������������
6??"?� � �� ��� ���� �� ��� ��� ��� ��� ��������������� ��� ������
�����������*A "��� �� ��������� ������ ��� ��-����������0� A-
*>>*3"�C�������� ����������� ����� �����������������������
�������������������������������������� �������� ���������
�� ������ � ��� ������ ������������ � ������������ �� ������� ���
$��� ��������� ����������������������������� ����������� ��
� ���������������������� �������� �� ������� ����������
?�=�� �� �������0����������������!D3��� ��������� ����� ��-
����������0*>>43"��
� ���� ���������� ��� ���������� ���� ����� ��� �������� ���� ���
��������� ��� �� ����� ��� ����� ��� ��� ���� �������� �����
�7 � ������� ��������������������� �������� ��� ��"�������
���� ������ ��� ��� ����� ������ ���� ������� C�� �� ����
����� +� ��������������� �,������� ��-�������������������
����� �� �� 1 ������� ���� ���� ����� ���� ��� ���� ���� ��
��������� ��2"��
�
;��������������<������������� ��� ������������"��
�Efficiency Output
��������������� � ��������������� ��������������� ��������
���������-�
�"� �� �������������J�"���� �������
*"� )������ ������J�"�*�� ��������� �� �������� � ���
6"� ������������������������ ������ � ���
�
� /�� ������ ��� ����� ����� 0�3� ��� 063� ����� �7����"�
)��������0�3������ �������������7��� ��������������7�����
��������F&:��������� ���������������"�C������������� ������
������������� �� ������������ �� � ����� �� ���������� ���
���� �� ����������7��� �������������������� ��������� ������
���������� ������"�
� �)�������� 063� ���� �7����� ����� ��� ����� �������� ���
������ ���� � ��� ��������� ����� ��� ���������� �� ������ ���
� �� ��� �� ��� �� ��"� #����$������� ����� ���� ���� ����
����������� ����������C�� �������������7��� ����������
�������� ��� �� �� ������ L���� )������ 0��L)3� ��� �����
�������� ����������)������0���3�� �� ����������"��
� )�������� 0*3� ���� �7����� ������ �� ����� � �� ���
�� � ���� �����"� C�������� ����� � ���� ��������� ����� ����
���������������� ����������� ������ ������� ���������� �"�
������������������������ ������ ��� ������������ �������

113 Role of Infrastructure in Poverty Reduction
T E R I Report No. 2004 RD 24
��� �� ��������� �� ��������� ����6� ���� ��� ��� F ��
)��� �� ���)��� ���0F))3��������������������� +� ��"��
� :���� ���������7��� ������������������������������ ������
��������������� ����������������������������7����������
��������������@��������F&:�����"�
�Implementation schedule
:���� ���������7��� �������������������� �����������������
����� �������� ����������"�
��������������������������������������������������������������������Planned and actual Schedule
Item Planned Schedule Result
L/A conclusion October 1986 December 1986
Prequalification survey April 1986-June 1986 September-December 1986
January 1987-August 1988 (A) * Bidding July 1986-April 1987
January 1987-February 1989 (B) *
September 1988-April 1990 (A) Construction May 1987-October 1988
March 1989-January 1991 (B)
A: International Bidding portion (platform, dolphin, loading arm, etc)
B: Local Bidding portion (approach, walkway, etc) �
� ��������������� �� ���� �� �������� �� ���� ��������"�
�� ��� � ��� ���� �����(��� ���� ���� ����� ����� 0���� ���
��������3�������� ��0��������������3���� ���"�/���������� ���
���� ��� ������ ��������� ��� ��� ���� � ����� ���� �7������ ���
���� ��� ��� ������ ��������� ��� ���� ����� �������� ��� ���
� ��� ���� �����(��� ��� �"� :������� ������� ��� ���(�
�������� �� �� ���������� ������ ��� ���� �� 0������ ��������3�
��� ������������������� �� ��� ������� ��� ��� �������"� :�� ��
�����$������������ �����������������������*A������"�
� C���������������� ��� ������� ��������� ��������� ���F ��
)������ ���� ��� ������ ����� ��� ��� ����� ����� ������ ��� ���
� �� � ��������������������� � ����������������������� �"��
�Project Cost
:������� ����������������������������������� ��� ���������"�
���
�6�#��� � ����������F))������������� ����������������(�������� ���������������� ���� �� ����$� �����0���������3����"�

114 Role of Infrastructure in Poverty Reduction
T E R I Report No. 2004 RD 24
Comparison of Planned and Actual project Costs
Foreign Currency total (million yen) Local currency total (100 thousand rupees) Output
Planned Actual Planned Actual
(1) Reinforcement of No. 1 oil jetty 543 289
(2) Construction of No. 2 oil jetty
and incidental facilities
1580 1933 2189 4246
(3) Improvement of cargo handling
facilities
1025 342
(Reserve fund, price escalation) 315 555
Total 3463 1933 3375 4246 �
� 9��������� �������������� ������� ������������ ���������
J�"�*�� ����������� ���������"�
�Comparison of Original and Actual Costs for No. 2 Oil Jetty
Foreign currency total
(million yen)
Local currency total
(100 thousand rupees)
Total*
(million yen)
Item
Planned Actual Planned Actual Planned Actual
Berthing/mooring facilities 920 540.19 198 516.85 1217.00 961.42
Service Platform - 286.92 155 285.20 232.50 519.36
Approach/walkway/pump room - - 316 500.00 474.00 407.50
Fender/bollards etc 24 41.13 17 99.07 49.50 121.87
Capital dredging - - 33 - 49.50 0.00
Floating landing equipment 188 286.44 65 188.76 285.50 440.28
Fire fighting equipment 27 109.11 90 368.87 162.00 409.74
Electrical equipment
Electrolyte protection equipment
53 54.49 50 146.78 128.00 174.12
Waste of oil disposal facilities - - 100 607.74 150.00 495.31
Navigation aids 368 614.50 1165 1532.50 2115.50 1863.49
Total 1580 1932.78 2189 4245.77 4863.50 5393.08 (Note: The exchange rate fluctuated from Rp 1=15 yen at appraisal to Rp 1=8.15 yen) �
� /������� ��������������������������������� �����7��������
� ���������������������������� ����������<�
�
�3���/������� A!����� ������� ���� ��������������������� ����
��������������������������������������� �������"��
�
*3���;7��� ����������1���� �2� �?�������1��������������� ���
�$� ����2��=���������� ������������� ����������������
����� ����� �������"��
�
63��������� ��������� ����������7�������������������������
������������������"�
�?��� �� ��������-��� ����������������������� ���� �� ������������� ��������������������� �������������� ����=��� ������������������� ����������������� ���������������� � � ��������� ����������� ���������� ������������������� ��� ��������������� ���

115 Role of Infrastructure in Poverty Reduction
T E R I Report No. 2004 RD 24
�
� # ���� ��������� ��������������7����� � �������������� ��
��������������������� �� � ���� ��������������� �� � ��������
������"��
�
Consultant and Construction Contractor Performance �����7��� �������������������������������������������� ���
��� � ��� ��� �7��� ���� �� ��� ��� ���� �� ��� �( ����� ���
� ��� ����� ���� �� � �"� ���� ������� ��� ��������� ��� ���
�� ����� ��������� ��� ���� ���� ��� ��� ������ ��������� ��� ����
0�7�����������������������������7������������3"���
;�������� ������<� � ������ ����� ����� ������ �� �������
�������� ����������� � �������� ��"��
�
Effectiveness Cargo handled
�������� �������� �������C&)����������*>>=���� �������=>D�
�������� �� �FI�������� ��� �>>D� �������� �� ���������� ���
���� �����0��6>�>>>��;%�3������"���� �� ��� ��� ��� �������
���� �����*>>=���������������*=�� �� ��� ��������������"�� ���
���� � �� ����� ������ ���� ������ ���� ����� ���� ����� ��� ���
��� �� ��� ��������� ������ ��� ������� ����7��� ����������
�� ������������������ ���� ����<�
��)��� �������� ����$� ������
��)������������
���� ��� $� ������������
���#��������� � ���
�
�� �'��(������� �����(��� ������������������������� �� � ����� ��� ������ ���� �� �������� ��� *>>6->?"� ����������� ���
������������������������ �����������*>>6-*>>?�����?�"*!�
� �� ��� ����� �������� ��6="A>?�� �� ��� ������������� ���
��� ���� ���� ������ ���� ��� ��� �������� ��� �="*?D"� ���� �����
���� ����� ������� �����������6"44!�� �� ��������0�?"*4D3����
����7�������� �� ������������"!A�� �� ��������0�4" AD3��� ���
*>>6-*>>?�� �� ������ ���� �� ��������� ��� ������ ���� ���
� ���������������� ��������"��
� �#� � ���������������������'��(���&��(�#��������C�� ��
&��(�)�����7������ ���� �������� "�������"�&�� ���*>>6-*>>?��
��� ���� �������� ��'��(���&��(� #�����0'� �����������
�?" *���(������0*>"4*D3����������� ����C�� ��&��(�)�����7�
0C&)3� �����������6 "!?���(������0�6"A!D3�����������������
���� ���������� ���*>>*-*>>6"������� "*����� ��������������
����7������� �������������������������"��

116 Role of Infrastructure in Poverty Reduction
T E R I Report No. 2004 RD 24
Table 9.1 Cargo handled In Last Twenty Years (Million Tones)
Year Kolkata Dock System Haldia Dock Complex Total For Kolkata Port
1984 - 1985 3.988 6.536 10.524
1985 - 1986 4.163 7.964 12.127
1986 - 1987 4.047 8.025 12.072
1987 - 1988 4.393 8.678 13.071
1988 - 1989 4.338 9.885 14.223
1989 - 1990 4.339 10.350 14.689
1990 - 1991 4.126 11.114 15.240
1991 - 1992 4.157 11.843 16.000
1992 - 1993 5.157 13.180 18.337
1993 - 1994 5.169 13.327 18.496
1994 - 1995 5.804 14.731 20.535
1995 - 1996 6.124 15.391 21.515
1996 - 1997 6.023 17.101 23.124
1997 - 1998 7.952 20.205 28.157
1998 - 1999 9.163 20.224 29.387
1999 - 2000 10.313 20.713 31.026
2000 - 2001 7.158 22.842 30.000
2001 - 2002 5.374 25.029 30.403
2002 - 2003 7.201 28.603 35.804
2003 - 2004 8.693 32.567 41.260

117 Role of Infrastructure in Poverty Reduction
T E R I Report No. 2004 RD 24
� ���� � ����������� �� ����� �������� ����� ������� ��������"�
����� ����� ����� ��� ������ ��� ��������� ��� ��� C�� �� &��(�
)�����7"��������� ������������������������'��(�����������
���� ����������� ���������������������C�� ��&��(�����
�������� ��� ���� ��� ��� ���� ��� �� ��� ������ ����� ��������
�����"��
Table 9.2 Volume of imports and exports handled at the Kolkata Dock System and the Haldia Dock system (In lakh tonnes)
Year Import Export Total
A. KOLKATA DOCK SYSTEM (KDS):
1999 – 2000 90.60 12.53 103.13
2000 – 2001 59.29 12.29 71.58
2001 – 2002 44.90 8.84 53.74
2002 – 2003 63.37 8.64 72.01
2003 – 2004 75.59 11.34 86.93
B. HALDIA DOCK COMPLEX (HDC):
1999 – 2000 158.76 48.37 207.13
2000 – 2001 172.50 55.92 228.42
2001 – 2002 184.60 65.69 250.29
2002 – 2003 201.23 84.80 286.03
2003 – 2004 226.77 98.90 325.67
�
0
5
10
15
20
25
30
35
40
45
1993
- 19
94
1994
- 19
95
1995
- 19
96
1996
- 19
97
1997
- 19
98
1998
- 19
99
1999
- 20
00
2000
- 20
01
2001
- 20
02
2002
- 20
03
2003
- 20
04
Year
Car
go h
andl
ed (m
illio
n to
ns)
Kolkata Dock System Haldia Dock ComplexTotal For Kolkata Port Linear (Total For Kolkata Port)Linear (Haldia Dock Complex) Linear (Kolkata Dock System)

118 Role of Infrastructure in Poverty Reduction
T E R I Report No. 2004 RD 24
� ������ "6����� �����������������������������0)�������
�FI3���� ����@��"�
Table 9.3 Oil jetty wise cargo break up of crude & POL products [Haldia dock complex]
Year
Oil jetty-I
(in tones)
Oil jetty -II
(in tones)
Oil jetty -III
(in tones)
Barge jetty
(in tones) Total (in tones)
Crude Pol Crude Pol Crude Pol Pol Crude Pol
2002-2003 20080 1752309 2008045 1946682 5700977 254037 155964 7729102 4108992
2003-2004 30892 1501883 3104317 2349610 7271202 171496 170445 10406411 4193434
SOURCE Questionnaire filled up by the Executing Agency
�
Table 9.4 Cargo handling status
Note Calculation at 6 above = Total Berth Hire Charge Billed / 365 for all berths at HDC. SOURCE Calcutta Port Trust (executing agency Haldia Port.)
Container traffic
)��� �������� ��0�� ������3� ������������ ���������'��(�������
�� ���*>>6-*>>?"�����������������;%����������'��(�������
�� ���*>>6-*>>?� ������������!"�4D��������������� ��� +��
������� �������� ��� *>"��D� �������� �� ��� ���� �� ������
�� ���������� ��������"�:�C&)�������������� ������������!"!!D�
Parameter FY 2002
(2002-2003)
FY 2003
(2003-2004)
1 Total cargo (Container, TEU) 117138 136657
2 Cargo (million tons)
Total 28.60 32.57
Crude Oil 7.73 10.41
POL 4.11 4.20
Fuel Coke 3.37 3.20
Coking Coal 4.30 4.47
Iron ore 2.69 3.75
Fertilizer 0.36 0.25
Fertilizer Material 0.45 0.37
Containers 1.85 2.28
Other 3.74 3.64
3 Total tonnage of incoming
vessels (GRT,million tons)
35.72 39.53
4 Berth occupancy rate * 71.59% 70.25%
No.1 Oil jetty 67.48% 71.34%
No.2 Oil jetty 55.35% 61.93%
No.3 Oil jetty 45.70% 52.45%
5 Average waiting time
(days/vessel)
0.87 0.97
6 Berth charge / day Rs 529710* Rs 508858*
7 Maximum DWT
(No. 2 jetty)
105051.00 105051.00
8 Weekly working hours
(average)
157.5 157.5

119 Role of Infrastructure in Poverty Reduction
T E R I Report No. 2004 RD 24
�� ������� ��� �;%�� ������ �� ��� �� '&#� ��� �������� ���� ���
�="!*D"�)��� ��� +��������� �����������**" D���C&)���� ���
�����'&#� ������������!"==D"�������������� �����'&#����
C&)��� ���*>>6-*>>?����� ��>!�=> ��;%�������*4��A!��;%���
������ ������ �������� �� 6�? >� �;%�� ��� �>=�! 4� �;%��
�������� ���������� ��������"�
�� J������ ��� ���� ����� 0�;%�3� ��� ���� ��� +�� �������
��������'&#����C&)��� ������������*>>6-*>>?����*>>*-
*>>6����������������"�
Table 9.5 Number of containers handled (In tonnes)
2002-2003 2003-2004
KDS HDC Total KDS HDC Total
Import 65524 44853 110377 77515 54054 131569
Export 40361 72285 112646 44904 82603 127507
Total 105885 117138 223023 122419 136657 259076
Table 9.6 Volume of containerized cargo (In Tones)
2002-2003 2003-2004
KDS HDC Total KDS HDC Total
Import 923375 650854 1574229 1110067 839115 1949182
Export 574406 1199103 1773509 635666 1436139 2071805
Total 1497781 1849957 3347738 1745733 2275254 4020987
Table 9.7 Ship calls at Kolkata port (In Number)
�������
�
�
�
Year KDS HDC Total
1999 - 2000 983 1279 2262
2000 - 2001 726 1447 2173
2001 - 2002 674 1570 2244
2002 - 2003 725 1676 2401
2003 - 2004 762 1835 2597

120 Role of Infrastructure in Poverty Reduction
T E R I Report No. 2004 RD 24
������������������� �������Table 9.8 Railway traffic (In Thousand Tones)
SOURCE Official website of Calcutta Port Trust (www.portofcalcutta.com)
;�������� ������<� ���� ������� ���� ����� ����� ��� �� �������B�
�������� �� ����� ������ ����� ������� ���� ����� � � �� ��� �����
�����������"��
Impact
C�� �� �� �������� ��� ��� �������� ���� ��� ������ ��� �������
�� �"�� ��� ���������������� ��� �7���� ��� ��� � ����� ����� ���
�����!���A���������������� ���� �����������������$� ������
�������� ��� �� ����� ���� ��� ����� �"� #������� ��� ���
������ ���� ������7�� C�� �� � �� �� �7 � ��� ��� ��������
��������� ��� ����� ��� � �� ��� ��� ��� �� ������ �� �� ����
���� ����7��� ������(��� � ������������ ���� �������� �����
�������� ��"��
� ���� ����� ��� ������ �������� ���� ������7� ��� C�� ��
�������� ����� ��� �� ���� ���� ��� �� ����� ���� � � ��� ���
�� ��� ��� ��� ������ �� � ���� �� ��� ��� ���� �������� ���
��������� ���� ��"�� ��� =���4>>� � �� ���0%#M� �?44�� �� ��3�
�������� ������� ������(����� ������� ����"� ���� ����������
������� ��C�� ���� ������������������ ���� �������� � ��
��������� ��:� �0��:3���������� ��� ������������� ��� �� �
)��� ����)������ ������@������������ ���������������?>>>�
� �� ���0%#M�?>>�� �� ��3"��I���������������������������������
������(�"��
� :���������������� ��� ����� ������������� ����������� ��
�������� ������ ���� ����� ��������� ��� ���� ���� �����������
���� ���� ������� ������������ ����� ������ ��� ������
Year Inward Outward Total
1999 - 2000
KDS
HDC
TOTAL
624
4034
4658
85
5431
5516
709
9465
10174
2000 - 2001
KDS
HDC
TOTAL
428
4509
4937
9
5867
5876
437
10376
10813
2001 - 2002
KDS
HDC
TOTAL
507
5373
5880
4
5709
5713
511
11082
11593
2002 - 2003
KDS
HDC
TOTAL
609
6755
7364
5
6645
6650
614
13400
14014
2003 - 2004
KDS
HDC
TOTAL
998
7682
8680
80
6367
6447
1078
14049
15127
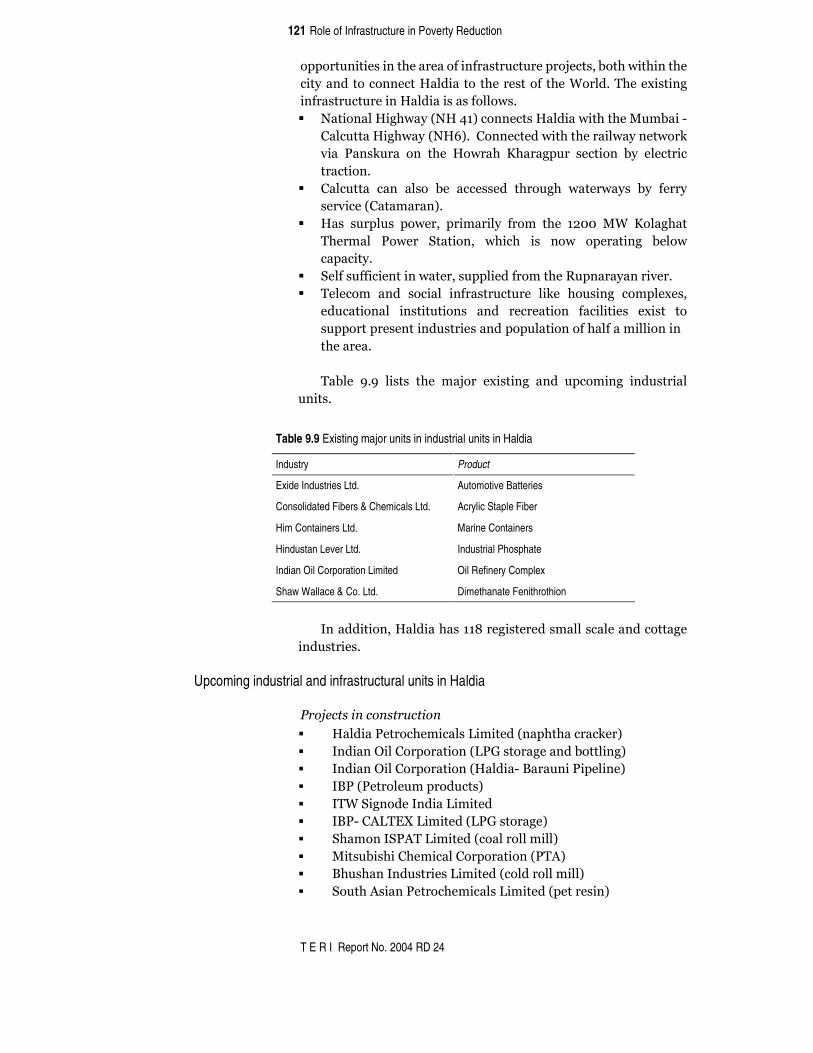
121 Role of Infrastructure in Poverty Reduction
T E R I Report No. 2004 RD 24
������� ��� ������������� �������������������������� � �����
� ��������������C�� �������������� ���8���"������7 � ���
������������ ��C�� �� ������������"�
��J� �����C ������0JC�?�3���������C�� ��� ���������� �-�
)������C ������0JC!3"��)�������� ������� ����������(�
� �� ����(���� ��� ��� C������ '��������� ��� ��� ��� ����� ��
��� ��"��
��)������ ���� ����� ��� �������� ������� ��������� ��� ������
���� ���0)�������3"��
��C��� �������� ������� �� ��� ��� ����� ��� �*>>� �8�'�������
�������� ������ #� ���� �� ��� �� ���� ����� ��� ������
����� �"���
�� #�������� � ��� ������������� ���������������������� ���"�
�� �������� ��� ��� ��� ������������ � (�� ���� ��� ������7����
���� ����� �� � ���� ��� ������ ��� ��� � ��� �7 �� ��
�������������� ���� ������������ �������������� �� ��� ����
�������"�
�
������ " � � ��� ��� ������ �7 � ��� ��� ����� ��� ���� ���
�� �"�
Table 9.9 Existing major units in industrial units in Haldia
Industry Product
Exide Industries Ltd. Automotive Batteries
Consolidated Fibers & Chemicals Ltd. Acrylic Staple Fiber
Him Containers Ltd. Marine Containers
Hindustan Lever Ltd. Industrial Phosphate
Indian Oil Corporation Limited Oil Refinery Complex
Shaw Wallace & Co. Ltd. Dimethanate Fenithrothion
�� ���� ����C�� ��������A���� ��������������������������
���� ��"��
Upcoming industrial and infrastructural units in Haldia
��0������������������
�� C�� ���������� �����I � ��0�����������(��3��
�� �� ���F ��)������ ���0I���������������� ��3��
�� �� ���F ��)������ ���0C�� �-�/����� �� ��� ��3��
�� �/��0���������������3��
�� ��8�# ������� ��I � ���
�� �/�-�):I�;N�I � ��0I���������3��
�� #�������#�:��I � ��0����������� ��3��
�� � ��� �� �)��� ����)������ ���0��:3��
�� /������������ ���I � ��0���������� ��3��
�� #����:� ����������� �����I � ��0������ �3�
�

122 Role of Infrastructure in Poverty Reduction
T E R I Report No. 2004 RD 24
��0����������7�&
�� �)����� ��� ���I � ���
�� 8����������-& �����I � ��0�FI�������3��
�� :�� ��&�����0�� �3�I � ��0�������� �����3��
�� ��������(��
�����������������������
�� C�I���������� ���� ����
�� ���������������0��� � +�������3��
�� �� ���F ��)������ ���������������
�� ;7��������� �������� ������(�0;���3�
�
���&�����������������
Industry Name Product
TCG Refineries Ltd. Oil Refinery
Marcus Oils Chemical Pvt. Ltd. ylene Waxes
IOC Lube Blending Limited Lube
Manaksia Limited Aluminum and Steel
Triton Corp Limited. Tin Smelter Project
Econ India. Drinking Water& Soda Water
R. D. B. Rasayans Ltd., HDPE, PLB & HDPE Ducts.
Chitral Merchants Pvt. Ltd., Jute Weaving and Processing Unit
Five Star Shipping Agency (P) Ltd.
Rakshit Chemicals Aluminum Plant Unit.
M/S Rehab Lifting Co. (P) Ltd., Down stream business.
S. M. Plastic Down stream business
Indian Tanning Industries Pvt. Ltd.
Assent Waste Management Ltd.
Haldia Paper Boards Ltd. Duplex Board Manufacturing Plant
Rejoin Petro-Plast Plastic Goods
���������������SOURCES www.shilpabichitra.com, www.portofcalcutta.com
;�������� ������<� ���� ������� ���� ���� � �� � ���� ����� ���
���� ������������� �������� ��"��
Sustainability
����������� ������ �� �������7����� ���������� ������� ����� +��
�� ������� ������ ���� ��� ��� � ��� ��� �������� ����� �����
��� � �����"��������� ������� ��� ���������������C�� ������ ��
����������������C�� ������)�����7����� ����I����#������
�������������������� ��������)��������������"��

123 Role of Infrastructure in Poverty Reduction
T E R I Report No. 2004 RD 24
�Table 9.10 Haldia Port Complex Profit and Loss Statement (million rupees)
Fiscal Year 1999 (1999-2000)
2000 (2000-01)
2001 (2001-02)
2002 (2002-03)
2003 (2003-04)
Operating
Income
Cargo handling/storage 1564.7 1835.6 2263.0 2609.29 2820.76
Port/docking fees 3616.9 4697.4 6257.5 3183.97 3848.29
Rail Tariffs 253.2 274.6 308.5 371.08 410.37
Property rental 239.0 302.8 323.0 352.88 395.48
Total 5673.8 7110.3 9152.0 6517.22 7474.91
Operating
expenditure
Cargo handling/storage 343.4 415.2 427.7 441.42 437.01
Port/dock facilities costs 2997.9 3198.3 3525.6 3327.33 3524.67
Rail facility costs 153.4 144.5 160.8 158.58 187.29
Land/Buildings for rent 143.8 169.8 154.7 140.06 141.65
Administrative costs 446.8 499.1 474.6 467.85 474.80
Total 4085.3 4426.9 4743.3 4535.24 4765.42
Gross profit 1588.5 2683.4 4408.6 1981.98 2709.48
Finance/ miscellaneous
income
320.6 420.9 446.5 428.25 310.25
Finance/ miscellaneous
expenditure**
1089.7 2138.7 3170.3 1142.75 1128.21
Net Profit*** 819.4 965.7 1684.8 1267.48 1891.51
* Including the maintenance costs for this project.
** Mainly comprised of ‘expenditure based on transactions in the preceding fiscal year: details unknown’(Rs 2,080 million)
and “pension reserve funds”(Rs 803 million).
*** Based on consolidated accounting with Calcutta Port Complex, the net profits for Calcutta Port Trust as a whole for
each fiscal year are 436.4,-75.3,1203.7(million rupees),respectively(because Calcutta Port is operating at a loss).
Table 9.11 Haldia Port Complex Balance Sheet (In million rupees)
Fiscal Year 1999 (1999-2000) 2000 (2000-01) 2001 (2001-02) 2002 (2002-03) 2003 (2003-04)
Fixed Assets 6566.8 7027.1 8545.2 8418.78 8426.51
Assets Liquid assets 9060.9 10069.2 10421.0 11967.43 12742.78
Investment 930.0 1080.0 1480.0 1600.00 2103.96
Total 16557.8 18176.3 20446.3 21986.21 23873.25
Capital/ Liabilities Reserves/surplus 11143.9 12100.6 14270.2 15822.12 17591.19
Pension fund,etc 300.0 464.2 694.1 769.34 1260.95
Deferred income 0.0 0.0 9.4 131.19 124.17
Capital liabilities 2270.8 2090.2 2378.7 2135.98 1906.13
Current liabilities 2843.2 3521.3 3093.7 3127.59 2990.81
Total 16557.8 18176.3 20446.3 21986.22 23873.25
Fire-fighting
���� *�� F �� @��� ���� ��$���� � ��-� �� ��� ������"� � ������
������������ ��������������� ��<��
�� �������� �� � �������������� �������� ������� ����-� ����
�����������-� ���� �������� ���������� �������� ���� ���
>>>��.�� �����*�(�.���*������������
�� ������������ ������������ ������������� ��A6?��.� ��

124 Role of Infrastructure in Poverty Reduction
T E R I Report No. 2004 RD 24
�� �������������������(���������� ��*=>>>��������
�� �������(���������
�� �������������������-���-�������� ����
�� 9 ���� ����++�������������������������� ��������
�� 9���� �������� ����� �7 ��� ������ 0 � �� ����� �3� ��� =� &)��
�7 ��� ������0�>�������� �3�
��F�������� ���������������� �������������� ���������� ����
� ��������������
�
Training :���� >������ ���� �� � �������������������������������
�� ��� ������� � ���� �������� �������� ������ ��������� ���� ���
���� �������� ���������������������� ������������������
���� ��������+���������� ������$��� ��������������� ��������
��� ��� ��� ��������� ��"� �� �� �� ������� ��� �������� ��������
����������C�� ��&��(�)�����7�������O���,������������( ����
0�������� ����� �����3���������������-�����������������������(�
��� ����� �� ������ ���� ����� � �� ����������� ������� ��
������������"���������������(-�����C�� ��&��(�)�����7� ������ �������"�
Table 9.12 Staff profile at HDC
Staff category/ Year* 2002 2003 2004
I and II (Managerial) 336 317 335
III and IV (Supervisory and others) 4178 4010 3828
Total 4514 4327 4163
* Staff strength as on 31st December of the respective year
� �� ��������������� ������� ��� ��������������������������
���� ����� �����"� C������� ��� ��� ��� �� ��� ��� ������� ���
������ ����������������������������������� ����������� �������
���� ��������� ������������*>>*->?"���������� ��������� ���
���������� ��*>>6���������������������� ���� ��*>>?���������� ��
�������������"��
�
;�������� ������<� ���� ������� ����� ���� ���� ���� ������ ��
� ���� ����������� �� ���������"���
�
Beneficiary views ������������������� ���C�� ��F ��@���*�0CF@*3������� ���F ��
)������ ��� 0�FI3�� C�� �� �������� ����� I � �� 0C�I3� ���
C ������ ���������)������ ��� I � ��0C�)I3"� ����C�� ��
������������� ������������ ������������������������� ��������
���� �������������������������"��
�
IOL �FI� ��������������������CF@*�������� �������A4D������������"�
:����� ����-���������� �� ���������F)���� ����"������������

125 Role of Infrastructure in Poverty Reduction
T E R I Report No. 2004 RD 24
����.��������� ������� ������& ������#�����'��������F ��
0#'F3�������#� � �0�#3��C ���#����& �����0C#&3��J���������
9�������F ��09F3���������������� �"��F)� ����������� ����� �����
� ��� ��� �� ������� � �� �������� ���� ��� � ��� ������ ��
��������� ��� ��� ���"� ���� ������ ���� ���� ���� ��� �F)� ����
���������������������������� �������������������������
�����������������������"��
� �F)� ��� � ���� ����� ��� ���������� ��� �������� ��CF@*� ����
���� ������ ���� �����7 � ������������������������ ������"�
������������������������������ ��������������������������
����������������� �����"������� ��� ������������� ����� ����0����
����������� ��3B�������������� ������ �������������"��
� C�������� ��� ���� ������������ �� C�� �� �� ����"� �F)�
��� � ���� ����� ��� �� �� �� ��� ��� ���� ��� �������� �� � �� � ����
������ ��� ���� �7����� � � ��� �� �(������������������� ��
�������������� ���"���
�
HPL C�I� ������������������������������CF@*"�;���� ������ � ������
������� ��� ���� ���� ��� ������� ��� ���� ����"� ��� �������
������ ����� #� � �� )������ /���(� 9��� #����� ��������� ��"�
J�������C�I��������� ��� ���� �����������;���-������������"��
� %�� (���F)���� � �����C�I���� � �������������CF@*������� ���
�� ����� ��� �����"� � ����� ����� ���� ��� ����� ��� ��� ��� ���
�������������������������������� ����+��������������� ��"��
�
HPCL C�)I� ������ C#&�� �#�� #'F� ��� 9F� ������� CF@*�� ���
����� ����������������������������������� ������������8���
/������������ � �������"��
� F�� � ���� ��� C�)I� ����� ��� ������������ ����� ���� � ��� ��
C�� ����� �������������������"�CF@*� ��������������� ���
�� ���������������������������� � ������������� ����� �����
�����"� ���� ��������� ���� �� ��� �������� ��B� � �� �������
����������������� ����������(���� ��"���
�

126 Role of Infrastructure in Poverty Reduction
T E R I Report No. 2004 RD 24
�
Annexure 9.1
Break-up of traffic in terms of principal commodities at Kolkata Dock System and the Haldia Dock Complex
� KOLKATA DOCK SYSTEM (KDS) (In Thousand Tonnes) Sl. No. Commodity 2002-2003 2003-2004
IMPORT: 1. Fertilizer (Finished) - 5
2. Sugar 3 - 3. Salt 12 - 4. Newsprint/Paper 32 59 5. Petroleum Coke - 7 6. Iron & Steel 103 105 7. Machinery 32 51 8. Metal & Metal Products 69 65 9. Scrap 48 50 10. Timber 365 424 11. Pulses/Peas 260 187 12. Rapeseed 3 - 13. Vegetable Oil 473 631 14. Other Liquid Cargo 37 37 15. Other Cargo 4067 5074 16. General Cargo 726 808 17. IVW Traffic 107 56
TOTAL IMPORTS: 6337 7559
EXPORT: - 1. Jute & Jute Products 124 119 2. Tea 19 22 3. Iron Ore - 71 4. Iron & Steel 74 87 5. Machinery 13 21 6. CI Goods 44 55 7. Mica 35 29 8. Shellac 15 15 9. Metal & Metal Products 67 68
10. Rice 5 9 11. Wheat - 52 12. Sugar - 16 13. Fly Ash - 80 14. Other Cargo 178 126 15. General Cargo 250 300 16. IVW Traffic 40 64
TOTAL EXPORTS: 864 1134
GRAND TOTAL OF IMPORT & EXPORT: 7201 8693

127 Role of Infrastructure in Poverty Reduction
T E R I Report No. 2004 RD 24
HALDIA DOCK COMPLEX (HDC) (In Thousand Tones)
Sl.
No. Commodity 2002-2003 2003-2004
IMPORT: -
1. Fertilizer (Finished) 360 245
2. Fertilizer (Raw Materials) 446 370
3. Wheat - 8
4. Salt 47 19
5. Newsprint /Paper 117 125
6. Coking Coal 4299 4473
7. Petroleum Coke 50 32
8. Metallurgical Coke 422 186
9. Other Coal / Coke 173 205
10. Lime Stone 353 281
11. Iron & Steel 100 107
12. Machinery 12 3
13. Metal & Metal Products 17 22
14. Scrap 62 43
15. Timber 62 61
16. Pulses / Peas 45 7
17. Rapeseed 32 13
18. Soda Ash - 14
19. Vegetable Oil 189 238
20. Other Liquid Cargo 1194 1187
21. LPG 385 429
22. Other Cargo 11376 13982
23. General Cargo 382 627
TOTAL IMPORTS: 20123 22677
EXPORT: -
1. Thermal Coal 3368 3195
2. Metallurgical Coke 11 -
3. Jute & Jute Products 116 126
4. Tea 43 53
5. Iron Ore 2694 3752
6. Iron & Steel 889 996
7. Machinery 20 11
8. C.I. Goods 128 127
9. Pig Iron - 11

128 Role of Infrastructure in Poverty Reduction
T E R I Report No. 2004 RD 24
Sl.
No. Commodity 2002-2003 2003-2004
10. Mica 15 15
11. Metal & Metal Products 53 57
12. Wheat 2 12
13. Mill Scale - 19
14. Other Liquid Cargo 60 100
15. Other Cargo 462 625
16. General Cargo 619 791
TOTAL EXPORTS: 8480 9890
GRAND TOTAL OF
IMPORT & EXPORT: 28603 32567
�
�

129 Role of Infrastructure in Poverty Reduction
T E R I Report No. 2004 RD 24
CHAPTER 10 West Bengal Industrial Pollution Control Project
�
Project and loan profile �
8�� ������� ��� ������ ��� ��� ��� ������� O����� ��� ����� ���
)������ ������,�� � ��� �� ���� ���� ������ ���<� I��� ������
������ ��0@/�)��3����&���������� ���������0@/�)��3"�
� :� ���������������� ��� ������� ������������������������
������� ��������� ������ ��� � �����������"� � ��� � �� ������ ���
�������� ������� ������� ��� ������� ���������� ��������� �����
���8���/����������� ���)������/������� ��� ��������-������
����� ����������������"��
� F��������������� �������������� ��� ���7��������������
���/��������������� ���������������� ���� ������������ � ���
���"��� ��������������������7���������������������� �����������
�� ����� ��.� ������� ���� ����� �� ���� ��� ��� ���� �����
���� �� ��"� �� ���� �������� �������� ��������� ��� ����� �����0��
��� ��������� ������3� ��� ��� ���� ��� ��� �� �������
����������������� ������ ����"��
� F�� ��� ����� ����� ��� /���� �� ����� ������� ���� ����
������� ���������� � ���������� ��������������������������
�����������C�+������8�����0�������������C��� ��3��������
� A � 0��� ������ �� *>>>� ��� *>>�3"� ������ ������ ����� �����
�� � ����������;�� ���������0����� ��3�:��� A!���� ��� ��
�� �,�������������� ������������"��
� �������������������/�������������������������� ���������
� ����������������������� ���<����������������� ��������
����� ����.���� � � ������� ��"���������������������� �����
��������� �������������0�K&3������� ��� ���/���� � �� ��� ���
������ ��� ������������ ���� ����� ������� ���������"��
� ���������������������� ��������� ��������/���� ��� ������
�������� ��� � ����� �� ����� ��� ��� ���� ����� ���� ���"� � �� ��
����� ����� ������� ��� ������ ������� �� ������ ��� � ����
�������"�9����7�������������� ��-�������� ������������������
�� ������������� ��� ���� ��� � +������� ����������������
���(������ � ������������������7������"�# � ������� ���� ���
����� ��� ����� �� ������� � ��� ��� � ����� ��� �� �����
���������� ���������� �������������� �� ������������� ���
���� ������ ��������� ����� ������ �� ����"���
�
Objective ������������������������������������ ������������� ������� ��
8���/������0@/�)��3"��
� �������� � �����������������������������������0@/�)��3<�

130 Role of Infrastructure in Poverty Reduction
T E R I Report No. 2004 RD 24
�������������������� �� ������������������� � ���������
8���/����������� ���)������/����
����� ������� �������� �� ����� ��� ������.��������
��� � �����������)�)������
����� ������ ���� ���� ��� ������ ���� ����� ��� ��������
0�� �������3�������������������� ��� �����������"��
Borrowers
�������������������0@/�)��3<�
0�3� �F���� +� ����� �������� ��� ��������� ��� �������� ����
������� ������������<����� ��������������� ������� ��
0*3� � )�� ��� �������� ���� ����� ��� ��������� ��������� <�
����� ��� )�� � ��� ��������� )������ ��� ��� �� ��
0�)�)�3�!�
�
Executing Agencies �����������������7��� �������� ���0@/�)��3<��
0�3��F���� +� ����� �������� ��� ��������� ��� �������� ����
������� �����������<�8���/����������� ���)������/����
08/�)/3� ��� ��� )������ ����� ��� )������ /����
0)�)/3�
0*3� )�� ��� �������� ���� ����� ��� ��������� ��������<�
����� ���)�� �������������)������ �������� ��0�)�)�3�
�
0#����� �����:�����<�� � �������;�� ����������9����3�
Table 10.1 Outline of loan agreement
Organizational Strengthening component and technical cooperation component
Capital investments for pollution measures component
Loan amount/ Disbursed amount 1,525 million yen/951 million yen 3,000 million yen/3,000 million yen
Exchange of notes/ Loan Agreement December 1994 February 1995
Terms & Conditions
-Interest Rate
2.6%
-Repayment Period (Grace Period)
-Procurement
30 years (10 years)
General Untied
(Consultant Portion partial Untied)
Final Disbursement Date April 2003 October 2002
Main Agreement Advance Scientific Equipment (India),
Omega instruments (India), other local
companies
Consultant Agreement National Thermal Electric Power
Corporation (India), other local companies
��������������������SOURCE JBIC b
�!�&������������ +� ����������������)�)������������������6���*>>*���������������� ���)�� �������������)������ �������� ��<�0�)�)��I � �3����)�)��/��(�I � �"�

131 Role of Infrastructure in Poverty Reduction
T E R I Report No. 2004 RD 24
Status
��������������������������������7����������� ������������
���� ����"��
�
Evaluation of the project �
Relevance ������ ������ ��� �������������� ��� ������������� ��� ������
��� ��� ����� ��� ��� �� ��� ���������"� ���� )������ ����� ���
)������ /���� ��� ��� ��� ���� #��-������ ����� ��� )������
/������������������� � ��� ������� ������� �����������
���� � ���� ������ ���� ��� �������������"�:����� �������� ����
��� 8��� /������ ����� ��� )������ /���� 08/�)/3� ������ ��
��� � � ���0�������� ����3������ ��� ����� ����� ������������
����"��� �� ��$� ���� ��� ������������ ����������� ��E����� ��
����� ��� �$� ����� ��� ������ ���������"� ���� ����� ���
����� ���)����������������������������� �����������������
���������� �������������� � ������8/�)/����$� � ����������
��� �� ��� �$� ����� ��� �������� ��.����������� ���
��� ��������� ���������� ����������� 0;���3"� � ������
���������� ��������������� � ������8/�)/������� �����������
����������������� �������@/�)���� �����"�/�� ����������� ���
��� �� ������ � ������� �7������� ���� ���� �� ����� ��� � ���
� � +� ������������������������������������ ����������"��
�
;��������������<������������� ��������������"��
Efficiency Organizational strengthening
*�������������8���&���
������������ �������������$����������8/�)/� ��#���I�(������
���� �� ��� ����� ��� �� ����"� ���� ������� ��.� ������ ��� ���
��� �������� �������8/�)/�������������� ������� ���������"��
���#������������'�����&���'��������&�������
��������������������� ����������������� ������� � ����������
��� �������� ��� �������"� ��� � ��� �� �� � �������������
�� ����������� ������� ���������������������������� �����
��� ���"��������������������� ������������� ������������<��
: ��L��� ����� �� ���&�� ���<�=?�0��� ���*6�������3�
8����L��� ����� �� ���&�� ���<�!?�0��� ���?>�������3�
�
�'���'����������(. �
������� +� ��� ��� ����� �������<� #���� ������� +� ��� ���
����� ����������������������0��������� �����������������
�����$� ����3��������������������"��
(9�����������'�����#��&3�����&����3���

132 Role of Infrastructure in Poverty Reduction
T E R I Report No. 2004 RD 24
;$� ���������� ���� ������� ��� ��� �������(� ��������� ���
��������������������������"��
�
�����������-+ *+�������&��'����'�������
��� � ��� ���� ������� ���� 8/�)/� ��������� ��� ��������
��������� �� ���� ������ ��������� �$� ������ ��� ����� ����
����� ������ ������������������"���
�
*�'�����������������'�����&���
/�� �� ��� ���� �������� �� ������������ ���� �� '��(��� ��� � ��
����� ��� ����������� ����� ��� #���� ��� ��� ����� $��� ��
�������������������& �������F7��������/F&"��
�
Capital investment ����� +��������-�������������������� ���0 ���������������3�����
!�*>�� �� �����������������������"�������������������������
* !� � �� ��� ���� E� � �� ��� �������� ��� *4*� � �� ��� ���� ����
�������"� ���� ������ ��������� ��� �� 0�������3� ���� A� �������
��� �������7 ���������������� ������=������"����� ���� ���
��������������-������ ������������� ������7 ��������������
��������� ����"� ���� ���-������ ����� ���� ���� ��������� ���
��� ��������� �$� ������ ����� ������������ ��� �$� ����� ����
��-��-� ��� �������� ������ ��� ��� �������� ���� ���� ���
����� ������ �� ����$� ����"����� ����������������������*-
�6D���� ��� �������������)�)�,����� �����������=-�4D"���
�
;�������� ������<� � ���� ������� ���� ����� ���������
��� � ����"��
Effectiveness Organizational Strengthening Component
�
0�3� %����� ��� ;�� ��������� &��� ������ ��� &�� ���� �� ���
8/�)/�
�������������������� ������������ ���$� ��������� ������ ��
�������� ���� ��������� �������� ������������������0::#3��
�� ������������ ������������������� ���������0�F)3�������
�� �����������6� �����������(�0@/�)��3"�
� F��������� ������������� ������������ ���������������
�$� ��������� ������ ��������� �� ���� ������� � �������� ���
����� ���� �������$� ����"����� ������������ � ����������������
��� �$� ��������� ��������������� �� ���������� ��������
��� � ������� �� � ��� ���(�������� ��� ���� $���� �������
�� ��������� ��������� � +��0@/�)��3"�
�
0*3������������������8/�)/,����� �� ���)���� ��
�������>"*� ���������� ���������� �����8/�)/,����� �� ���
����� ����� �� ��� �������� ������ � ��������"�:���� �����
��� ������ �� �� ( ��� ���������� ���� ������� ���� ��� ������
��������� ����� �� ������������������?>���������095 ?3�����A�

133 Role of Infrastructure in Poverty Reduction
T E R I Report No. 2004 RD 24
��������095>*3���*?=��������� ��*>>="����� ������������ ���
��� ����������8/�)/�����������=� =>������� ���095 43���
� =>>� ��*>>*"������������������� ���� �������������*�� ��� 4�
�� �*����� ����095>*3"������������ ����������������� � ������
�$� ����� ��� � �� �������� ��� �� ��� ��� ������ ��� ���
��� ������������ �� ��������������0@/�)��3"�
�
Table 10.2 Improvement of WBPCB’s Monitoring Capacity
1994 1995 1996 1997 1998 1999 2000 2001 2002 2003 2004 2005
Monitoring Personnel
(Persons)
40 40 53 77 86 92 109 113 118 245# 245 245
S O U R C E Up to FY2002 JBIC reference material and for FY2003 WBPCB Annual Report2003-2004, annexure1and for rest
years Senior scientist of WBPCB
063������ ������;�� ���������;��� ������& ���� �� ������
���� �� ������� ��� ������� ��� ��� ��� ������� ��� ���
8/�)/�
���� 8/�)/� �� ���� �� ��� ������ ��� ������� ��� ���
��� ������� ��� ��� ��������� ���� ��� �� ��� ��������
���� ��� �� � ��� �� ����� ��� ��� ��� �����-��� ����
��� �� ��"�:������������� ����(����������������� � �����
8/�)/����������� �������������� �������������� �����
��� ���"�;�������������������� ����(����� �����������
�=>���*>>������� ���������� ���� ������� �������� �������
��(����� ����������� ����������"��������������������� ���
������� ��� ��� ��� ������������� ����� *�66>�095 43� �� =6�
095>?3�09 ������>"�3"��������������� ������ ����������������������
0������ #�����3� �� �������� ������ ��� ����� ��� ��� �������
������� ������ +����������������� ������������ ���������������
���������������������� �����������������"�
����������������������������������
0
500
1000
1500
2000
2500
1998 1999 2000 2001 2002 2003 2004Year
No.
of C
ompl
aint
s
Complaint Received Complaint Disposed off�
Figure 10.1 Status of complaints received & disposed during 1998-2004 S O U R C E WBPCB, Annual Report2003-2004
�
�0?3���������������������8/�)/,��I���;����������)���� ��

134 Role of Infrastructure in Poverty Reduction
T E R I Report No. 2004 RD 24
���� ���� � ��� ��� ��� ��������� ��� ��� � �� ������� ��
���� �� ��� �� ��� ��������� ��� ��� ����� ��� ��� ���
���������� ��� 8��� /������ 0� �� ����� ��� ��� �� ���
������ ������ � ������"3"�
:������������������-��� ��������� ����������� ���
������ ��� ��������� ��� ����� ��� ������ ��� ����������
������ ����������� ������ ��� �����***� ������095 43��� !�
������095>*3"�
��
� 9 ����� �>"*� ������ ��� �� �� ��� ��� ������ ��� ���� ���
�� ���95*>>6->?"�
Complaints Received During 2003-2004
Mass71%
Individual29%
Mass
Individual
Figure 10.2 Complaints received during 2003-2004
S O U R C E WBPCB Annual Report2003-2004.Page83
� ����������� ��� �� �� ������������ ����� ���*>>6-*>>?�
�� �������� ��9 ������>"6"�
�
Nature-Wise Distribution Of Complaints During 2003-2004
AirAir+SoundSoundOtherMunicipalWater+AirWater
Figure 10.3 Nature-wise distribution of complaints during 2003-2004
S O U R C E WBPCB Annual Report2003-2004
135 Role of Infrastructure in Poverty Reduction
T E R I Report No. 2004 RD 24
�� 9����������� ��� ����� �� ��� 8/�)/� ������� ���
������ ������������������� � ��������� ��������� ����� � ���
��� ���� �� ��� ������� �� ������ ������( ��� � ������� ����
����� ���������������� �����������"�����8/�)/� ������� ���
�� ����� ����� ����� ����� ��� �� �� ����� ����� ��� ������� ��
����� ������ �����������������"�
�
Capital Investment for Pollution Measures Component G�� � �� ������������������������������ ��������� ������������
������� ����� � � ���������� ������������������������
����������� ���4�������������7��� ���������"�/������������
������������� ����������� ���������������������� ����������
������ ��� ����������������� ��������� ������������������
������������������ � �����������A����� ������0@/�)��3"�
�
0�3� ������� ��� ��� F���� ��� ��� ;�� ��������� ;$� ����� ���
/��������)����� ���
�� �� ���� ���� ������� �� ��� �� ���� � ��� ������ ��� ��� ���
��� ��� ��� ��� ������ ��� ��� ����� ��� ��� ��� ���������
�$� ����� �� ��������� ������ ��"� C�������� ����� ��� �� ���
������� ��� ��� ����� ������ ���� *� ��� ��� ��� ��� ���������
������ ����������� ���������� �� ����� ����� ���$� ���������
��������� ������������ ������ ������ ����������� ������
��� ��������� �$� ����� �� ��� ���� � ��� � ������ ��� ����
����������"�
0*3� ;�� ��������� ;����� ��� ;�� ��������� ;$� ����� ��
/��������)����� ���
��� � �� �������� � ��� ��� ��� ������ ��� ������� ��� ���������
�$� ����� ������ �� ��-��-� ��� ������� ��� �� ��� ��������
����"� :����� ������ �� ������ ��� ��� ������� �������� ��
���� � ����� 08��� )���� ������ � ���� ����� �� �� ��� ����
)��� ��������"3�� ����������������������������������������
������� ���� =>µ��.�6���������� ��� �������� ���������� �=>�
µ �.�6����� �������������� �������� ��"�
� :������������� ������ ����������������������� ����� ���
��� ��������� �$� ����� �� ��� ��������� ������ ��� ���
����� �������������������� ��������������� ������ ��������� ��
���� �� ����� ����������� ����������������������(�������
������� ������ ��"�
�
063�)������� �����/��������)����� ���
�4 ������;����� ������������;�� �������������������)���������� ��:������*>>?"�18 :�$��� ���� �������������������������� ��"�/�������������������
������ ������������������������� ���������������� ������ ��������� ��������������� � ��������������� ���������/������0����� ���� �3���������������� ����� ��������������������������� ��� �����������"�

136 Role of Infrastructure in Poverty Reduction
T E R I Report No. 2004 RD 24
������� ��� ��� ��� ��������� �$� ����� ��� � �� ������� ��
���� �� ��� �� ������� ��������� �������� ������������ ������
�����B� ����� ���� ��� ����� �� ����-���"� ������� �7�������
������ �� ��������� �������� 0# ����� ����� ��3� ��� ������
����� ������� ��� �����*!>�6.��� �� *>>��6.������ ���� � ���
������ ��� �$� ����� ��� ��������� ��� �$� ����� ��� �������
�����������������0#�����)�����I � �3���������*?�� �� ���
��������������������������������-��� � ����$� ����"�
� ��� ������ +�� ��� ������� �� ��� ����� +� ��� �������� ���
��������� ��� ��� ��� ��� �������� ���� ����� ��� ���������
����������� ����������� ������� ����� ��������������� �������
��� ������� ���� ��1 ������������������� ���������� ��������
�������������������� ����� �������2����1����� ��������� ���
����������������� ���������� ��������� ���������"2�
�
;��������������<����������������� ���������������� ����������
��� 8��� /������ ����� ��� )������ /���� �� ����� ��� ��
��� �� ��������� � � ��������"��
Impact
����8/�)/������ ���� �� ��� ��� 4?����� �������� ����
������ ���������������������� �� ����� ��� ����������������
��� � ��� ��� ��������� ���������"� �� ���� ���� ������� ���
�������� ���"� ���� /������������ �� ������� I��������� ��
'��(��� ��� � ��� ����� ��� ����� I������� ��� �� '�( ������
&��������� C������� C�� �� ��� # � ��� "� ���� $������
���������������� ���������������� � ����������������� �������
������������� ���������������7������� ���� ����������� ������
���������� ����� @����� /��(� ���� ������ ����� )������ ���
0@/�)3"������� �������������������� ����� �������������������
����� ��� @/�)� ��� ��� ����� ��� ����� ��� )������ �������
0��)�3��������� ���� �������������������������������������
���8/�)/������������ ��������������"�
����&���� �������� �������� ������� ������ ������� ���� ���
����������� ����������� ���� ����� ������ ����� � �� ��� �����
������������� ��<��
,-� � � ���+�,.+"$!#,�$�������� �������� ���� ����������7 ����
����� ������� ��"�
,,-� � �#�.��� ,.+"$!#,�$�� ������ ���� ��� ����� �������
����� ������� ���
,,,-� /#��.� ,.+"$!#,�$�� ������ ����� ��� ���� ��� ����� �����
����� ������� ��"�
� ���� ��� �� �� ���� ��� �� ����� � �� ��� #��� ��� ��� ���
F� �������� ������ ��� ���� ��� ����� ��� ���� ��� ����� ���
���� ��"����������������������� ���������������������� �����
����� ������� ���(��������;7-������� �"�
� ���� ����� �� ������ ���� ��� ����� ��� ��� ��� ��������
���� �������������� �� ��'��(���������� ���:�����0'�:3�

137 Role of Infrastructure in Poverty Reduction
T E R I Report No. 2004 RD 24
���F������ ���� ��� ���� ��� ���� �� �� '��(��� ��� � ����
)������ ���0'�)3� ���C��������� � ����)������ ���0C�)3�
������� �7���� ��� ���� ��� ������ ���'�)�KC�)":� ���������
���� ��� ��� � ����� ����� ��� ���� ��� ��� ��� � ��� �����
������� �������������� ��� � �� �>-(�� �� ������)������
I������ )�����7� �� /�����"� :� ���� ��� * ?� �������� ����� ���
���� ��� ����� �� � �� ���� ���������� ����� ����� ��� ���
��� ������ �"�
� ����� ����������� �������������8/�)/����� ���� ���� ���
��� ������ ���� ������� ��� ����� �� �������� ����� ��� ����� ��( ����
� � �����'�)�����"���������������(�� ������������� � ���� ��
��� ����J�F�"�:���� �� �� � ����������������������������
����������� � ���"�����8/�)/��� �� ��� ������� ������������
��� �������� ����� ��� �� �� ����� ��� ��� �� ��� ���� ��� �� ��
����� �� ������� �� � ��� ���� ����� �� �� ���� ������� ���
��� ���� �� �� � 7�� �������� � ���� ������� ��� � ������� ���
�� ��� ������� ���$��������������������������������"���������������
����� ��� ���� ��� ���� �� � �� ����� J� ����� � ����
)������� ��������0J�)�3"�08/�)/�:�����������*>>6.>?3�
� ����� �������� � ��� ������� ��� 1)������ �� ;���� ��2�
���� �� �������� ���������������������������� ������������
*>>6.>?�����*>>?.>=� �� �����������9 �������>"?�����>"="��
�
0
200
400
600
800
1000
1200
1400
Red Orange Green
Categories of Industries
No.
of A
pplic
atio
ns
Applications Received Applications Granted
Figure 10.4 No. of ‘consent to establish’ application received and issued during 2003-2004 S O U R C E WBPCB Annual Report 2003-2004. p. 23

138 Role of Infrastructure in Poverty Reduction
T E R I Report No. 2004 RD 24
0
200
400
600
800
1000
1200
1400
1600
1800
Red Orange Green
No.
of a
pplic
atio
ns
Applications received
Applications granted
Figure 10.5 No. of ‘consent to establish’ application received and issued during 2004-2005
� ������������� �������������O,)��������������2����� ������
������������8/�)/��� ������������*>>6.>?����*>>?.>=�����
��� �������� � �� ��� ����� ��� 9 ������ �>"!� ��� �>"4<�
�
0
500
1000
1500
2000
2500
3000
Red Orange Green
Categories of Industries
No.
of A
pplic
atio
ns
Applications Received Applications Granted
Figure 10.6 No. of 'consent to operate' applications received and granted during 2003-2004 S O U R C E WBPCB Annual Report2003-2004.Page24

139 Role of Infrastructure in Poverty Reduction
T E R I Report No. 2004 RD 24
0500
100015002000250030003500
Red Orange Green
No.
of a
pplic
atio
ns
Applications received Applications granted
Figure 10.7 No. of 'consent to operate' applications received and granted during 2003-2004
� 9������� ����� ���� � �� ������ ��� ��� ���� ��� ��$� ��� ���
;�� ���������������:���������0;�:3���� ��� �������������� ��
���� ��"������ ������ ������ ������������������������� ����������
� (������������������������������������������ ���������������
���������������������������"�&�� ���*>>?->=�����8/�)/�
�������� ������� ������ ���� �� ���������������������"��
� ���� 8/�)/� ���� ����� �� ��� ��� ;�� ������� ;7���������
:���� ����������� ���� ������� ���)����������)�������"����
*>>?������� ����� +��������� ���� ����������������������))�
��:� �� �� )���"� ��"� I"� ����� �� C�� �"� ���� � ��� �� +�� ����
���� ��� ��� ���������������������������������� ���@/�)-
��� ���/�(�������� �������� ������ ������"� � :���������� �����
� ���� �� ��� ���� ��� ������� ���� ���J�F������������� ��� ����
��� ����������7������������������ � ��"��
���
Organizational Strengthening Component 0�3����� ������: ������� ���
��� ����� �� ������� ��� �������� ��� ��������� ����� ��� ��� ����
8/�)/� ��� ���� ��� � �� K� ����� $��� �� ��� �� �������� ��� �"�
�������� ��� �� ��� ��� � �� $��� �� �� '��(��� ���� ����� ���
8/�)/������� *"�����8/�)/��������� �� ����=���� ������
����� ����� ���� ��$��� �-��� �� ����� ���� ��������"��
� :������ :������� )������� ��� ��� :�� ��� : �� L��� �� ���
'��(��� �� ��� *>>6-*>>?� ���� #��� ��� ���� 0���� ������
��� ����������3����������� ��9 ������>"A"�

140 Role of Infrastructure in Poverty Reduction
T E R I Report No. 2004 RD 24
Figure 10.8 Annual average concentrations of ambient air quality of Koldata during 2003-2004
SPM standard: 140 mg/m3
� �
� &�� ��� ������������������ �������� ������� �������� ��
'��(���������� �������"�G�� ���� �������� (������� ���������
����������� ���������(������ ���������� � ����� ����������
�����K���� � �������� ������������������ ������������������������
������ ��� ������ ��� ����� ��"� ���� 8/�)/� � ��� ���� ������
�7�� ��� ��� :��� ;� �� ��� ��� ��� )������ ������� ����� ���
������������ �����"�
� 9����������� ��� �� ���� ��� �� ������ ��� ��� ���� �� �� ����� ���
8/�)/� �� ������� ����� � ������������ ��&��������������������
��� ������ ����� ������� ������������������������������� ���"�:����
���� � ��� �� � ��� ����� ���8/�)/���� ��������� ���� ����� ���
���� ������� ������� ��� � �� ����� ���� ��� ����� �� &�������� ��
������� ��� ��������� �� ����� ��� � �� ����� ��� ��� �� ��� ��� ��
����� ��� �� �� ��� ����� ����� �� � �� ��� �� ���� ������ ��"� ��������
��������� ����� ��� ������ � �� ����� ��� �� )������ �������� �� ���
���������� ���������"�
������#� ������������������8/�)/��������� ����������� �����
���� ����� ��� ������ ����� ����� ���� ��� ������� ��� �� �� ��
��������� "�"�#F*��JF*K���� �������������JF*�K���� �������
�����������(��� ������� ������������ ��� �������� ���������
����� ����������"�9 ���K� ������������ ���������������������
����� ���� ��� � �� ��������� ���� ��� � �� �������"� ���� ����
��������������������� ������ ������� ����������� ���������������
������������������"����8���/���������:���� ��: ��L��� ��
��� �� ��� 0::L�3� �� ���� ����� ����� ������� ������� ���
�7����������� ����������������������@/�)��������� ��� ��"�
�

141 Role of Infrastructure in Poverty Reduction
T E R I Report No. 2004 RD 24
0*3����� ������8��������� ���
���� 8/�)/� �� ��� �� ��� ����� $��� �� �� � ��� �����������
�� �������������������C������������ ������������������ ��������
�������� �� ������� /�����"� 9 ����� �>" � ������ ��� ������� ���
��� �� ��� ���/F&� �������� ��� �� ���C������"� :���� ��� �� ���
������������������������� ����� ���������������� �������*"*�
��.�� ��95� � A� ���*"=?���.�� ��95*>>*"� ����/F&� �������� ���
���� � ���� �� ����"��
�
00.5
11.5
22.5
33.5
44.5
Berha
mpore
Palta
Srera
mpore
Howra
h(Shiv
pur)
Garde
n Rea
ch
Daksh
inesw
ar
Uluber
ia
Diamon
d Har
bour
Station
BO
D le
vel
1998 2002 2003-2004
Figure 10.9 Fluctuations in BOD concentration in mg/l at different stations S O U R C E WBPCB Annual Report2003-2004.Page51 &JBIC reference report
063����� ������F����;�� �������������� ���
8 ������ ������� ������� ���������� ���������������������
���������� ������������� ������� �����K�� ���� ������������"�
G�� ������������� �(��������� ���������������������������� ��
8���/������������ ������� ������ �������� ���"� ����� �������
������ ��� ������� �������� ����������� ���� ���������0*>>>3�
��������� �����������4=��� ������������ ��� �����������4>�
�� ����� "�
� ���� �� ��� ������� ������� �� *>>6� ������� �� �� ��� �������� ��
��� ����� ���������� ����� ���� ��� �� ��������� ��'��(��� ���
C���������(�� ���������&������ ���� �������� ���������������
��"������� ����������� �������� ����� ����� ��������������� ����
���� ������ ������� �������(������������ ������������������ ��
���� �� �������� ������������������� �� ���������������������
�� � ���� ��� �������� ������ ������ ���� ���� �� �� � ��"�
������ ��������� ������������������"�
� �1&�� ���2� ������ ������ ������� ��� ��������"�����1���2���� ��������������������:��7������������/�������� �����������������������������1�� 2��������.�>������1�� ���2�0/3"�

142 Role of Infrastructure in Poverty Reduction
T E R I Report No. 2004 RD 24
3� ���� ������������� ���������������������� ����������(�� ������
����������� �� ������������ ��*>>6���� ��� �������D� ��4�
D"�� �� ������������� �������� �� ��� � ������� ���*>>��K�
*>>*"�
3�)���������*>>*������ �������� ��� ������� ��������������
����������� ��������� ���������D���!D"�
3����� ���� ��� ��� �� ��� ������ �� ��� ������� ������� �� *>>6�
��� ��������0-36���P*6D�����������*>>����"�
���0#�����<�8/�)/�:�����������*>>6-*>>?"�����!?3�
�
�������� ������� �������� ����� ���������� ���� ��������
����������������/����������8/�)/������������������ �������
�� ������������������� ���� ����� � ������ �������� ������
������ �� ����� ������ ��� � ��� � ���� ������ ����������(����
���� ������(������ ������ �����0����9 ������>"�>3"�&����������
������������� ���������������� ����� ������������� ���� �����
*4� ������ ���� ��)���������� ��� ����� A6"6��� ����� �� ���
����������� 6�0:�� ���������@���3���4�"6��� ������� ������
�������� �� ��� "�
�
Figure 10.10 Comparison of noise levels on the day of Kali Puja during three consecutive years at different stations
(Note: Kali puja is a major festival in the state. It is marked by display of fireworks, including
those that produce noise such as crackers. Over the last few years, noise levels on the festival
day has significantly reduced due to a ban to bursting of crackers.)
S O U R C E WBPCB Annual Report2003-2004.Page64
� ���� �� ���� ������� ��� ����� � �� ��� �� � �� ������� ��
�����7 ������ A>� � �� ��� �������� !� 0 "�"� !>D� ��� @����,��
������ �����������7 �������6>�� �� ����������3"�
��
������3����'�����'���
���� ������������������������������� ����������������������
�� �����-� ���������������"��������� ��������������7��� ���
��� � � ���� � �(����� ��� *>� ����� ���� ������ "�� �� ����

143 Role of Infrastructure in Poverty Reduction
T E R I Report No. 2004 RD 24
�������� ��� ���� �� ������ ����� ���� ����� �������� ���� ��
��������������������������� ��������(��K�����������������
��������� �����������"�����8/�)/����� ������������(���������
�������������� ������������������������ � ���� ����������� ������
���� ���������������������������#�����������)�������9�����K�
� ��� �����"�8/�)/����� ����� �� ��� ��� �7�� ��� �������(��
���� ��� ��� ������ ���� K� ����� ��� ���� �� ������ ����� �� ���
��� ���.��� �����������������"��������������������� ��������
������������ ���� ����� �������� ���� ����� ������ ���� ���K� �����
� ������ �� � �(����� ����� ����� ������ �� ���� ���"� �� � ���"�
9 ����� �>"��� ������ ��� ����� ��� ��� �� �� � ��� K� ������� ��
������ ������ �� ����������"�&�� ���*>>?->=�� ����������������
�7�������6���� �������� ����� ������������"��
�
Status Of The Units Fined & Closed With Regard To Plastic Carry Bags
327
249
240
50
100
150
200
250
300
350
Fine Imposed Matter Released Closure
Figure 10.11 Status of the units fined and closed with regard to plastic carrybags
S O U R C E WBPCB Annual Report2003-2004.Page83
:�7��&���-����.�����'���
C�+�������������� ������� ������ +������������ �� �7 � ���
������ � ��� ���� � �� K� ������� � ��� ���� ���� ��� ��������
����������� ��8���/�����������>"**�� �� ������ ���������������
������ ������������ ����� ?!=� �� �"� ����8/�)/����� �������
���������� ��������������$� � ������������������"�#������
A>� ���� ��� ����� �� �� ��-� �� ��� ������ ��� � ��� ��� ���
������������ ������� ��������6-�>������"�:���� ����� ��������-
�� ������������� ��������������������������"�����8/�)/�����
�� � �������������������������K� ���������� � ��� ����
C�� �"�:������������� ���������� � �� ���� ���������������
������� ���� �� � ����� �7 �� ��+������ ������ �� )��(�� ��
&��(�� � ��C������� �� �� ���� ��� ������� ��� ����� �������
��"�
0#�����<�8/�)/�:��������������*>>6-*>>?"�����6*3�

144 Role of Infrastructure in Poverty Reduction
T E R I Report No. 2004 RD 24
Capital Investment for Pollution Measures Component
0�3�)��� �� ���������� ��������� ������)����� ��� ��8������
/������
:���� ���� � ��� ��� ��������� �������@/�),��� -������� ���
��������8/�)/��������������/��������� ���������� � �������
;�� ������� ��� 9����� ���� ������� ����� �� ��������
���� � ���� � ���� ���� ������ ��������������� ���������� ���
��� ������ ��� ������ ���� ��� ��� �������� �� ��� ���������
��������"� ���� ��� ��������� �������� ��� ���� � ���������
� ��������� ���������/���������������������� � �����������"�
C�������� ��������� �� �� ��� ���� �� ����� ��� ������ ��� ���
������ ��� �� ������� /������ ��� ������ �� ��� ���� ��� ��� ���
����� ��� ��)���������������������������������������� �������
������ ��� ��������������������� ��"�����(������������� � ��
�� � �������������������������� ��������� �����������7�����
����������"�
�
0*3� )��� �� ��� �� ����� ��� ������ ��� ���)����� ��� :������
�� ��
�������� ��� ����� ������� �)�)�� ������� ��� � �� �������� �����
������ ��� ��������� ��� ����� ��� ������ ��� �������� �������
��������� ��� ��� �������� ������� ������������� ��� ���
����������� ���������� �� ������������������ �������"�#���
����� ��������� ������������ ������� �� ��� �� ������ �� �����
������ ��"��
Impact Evaluation Result
*�����8������� �������� ���������8�*�'��������������&��
�� �������������7����������������������������0#�����)�����3�
��� �������������������� ���� �����(����������� �������������
������ ������ ��� ��������������������@�����'���� ��� ���
��� ��J������������ ��������������(����������� �����������"�
� :����� ����7��������� ����������� ��������0F��� �)��� �����
������������ ����3� ��� �����������������������������������
����������� ���������� ��������������������"�����������������
������ �������������������������������������� ���������� ����
��"�� ��C�������0@/�)��3"�
�
;��������������<���������������������� ��� ����� ������ ���
��� ��������� ����� ���� ��� ������� ��� ��� �����������
���� ���������������������� ������"��
Sustainability Organizational Strengthening Component
0�3�F���� �������� ��������#������������� ����)���� ��
����8/�)/� ������������������������ ���� ��� 4?������������
���������� ��� ������ ����������� � �� �� ������� �������� ���

145 Role of Infrastructure in Poverty Reduction
T E R I Report No. 2004 RD 24
����������� �� ����� ��� � �� $��� �� �� ������� /�����"�
C��$������� �� )������� ��� 8/�)/� ���� ��� ����� ��� ����
���� ���� ������������������ ��&�������"�
� ������ ����� ����� ��� ���� ���� ���������� � ���� ������ ��� ���
������� ������� ��������� ���������� �������� ��������������
���� ������ ���� ����� ��� �$� ���������������� ���� ������ ���
�� � ��� ���� ����� ���� ��� ������� ��������� ������� ��� � ��
$��� �� ����������� ���� ��� ����� ����������� ���
��� �����������������"�
�
0*3�C��������������&�����������
�����������������������8/�)/����� �������� �� ������� �������
������������� ���������������"������������� ����������������
�� 6*A������� ����������� ����� ������� �� *?*���� �4?D���� ���
���� ����������"��&�� ���*>>?->=���**����� �����������������
��� ���/���� ����� �� � �������������� ������(������ ���
�� ��������������� �� �������������� ����������� ���#����� ��
�$�� �� ����� ��� ����������� ��� ��������� �� ����
�������������)&������������ ��$��� ��������������"�������
��� ����� ����������� ����� ����� ��� ��� ��� )������ ����� ���
)������ /����� �� ��� ����� ����� ����� ��� ��� ���� ��� 0� (��
/����� C����� ;���� ����� I � �3� ��� ��������� �� ���� 0� (��
�;��3"��
�
063��9 ���� ���#����
:���� ��� �� ��� � ���� ��� �������� ��� ��� 8/�)/�� ����� ��
������ ����� ����� ��� ����� ��� ������ ��� ���� �� ���� �� ���
����� ��� ���������� ��� ��� ������ �� ������$��� ��"�
)����$������� �������� �� ��� ���8/�)/,�� � ���� �������� ����
��� � �� ���� ����� ������ ���"� C���������� ����� ��� ���
�� �������� ����� ���� �������� �� ��������� ��� ��� ������
����� ����������������� �������� ���������������������
���������� ���7����"�&�� ������� ���� ��������*>>6-*>>?�����
���� ���� ��� ��� ��� 8/�)/� 0�7���� ����� �� ���������� �����
�F�3�����������>*">*���(��������������7��� ���������������
���� ��� !A>" A� ��(��"� ���� �� �� ���� ��� � ���� ��� ���
�7��� ������ ���*>>6-*>>?� �������� ��9 �������>"�*�����>"�6"�
�

146 Role of Infrastructure in Poverty Reduction
T E R I Report No. 2004 RD 24
RECEIPTS DURING 2003-2004
Grants & Aids from Govt. &
Others22%
NOC, Consents & Other Fees
72%
Sale of Forms1%
Miscellaneous5%
Figure 10.12 Receipts during 2003-2004
EXPENDITURE DURING 2003-2004
Pay & Allow ance
57%
Contingencies33%
Plan10%
Figure 10.13 Expenditure during 2003-2004 S O U R C E WBPCB Annual Report2003-2004.Page104)
�
;�������� ������<� ����������� �� � ��� ���� ���� ������ � ����
��������� �������� �������������������� �"��
�

147 Role of Infrastructure in Poverty Reduction
T E R I Report No. 2004 RD 24
Recommendations :����� �������� ����8/�)/� ������������������ ��� ������������
����� �����������������������������������������������"�9���
�7����������/�������������(���������K&����(� �������������
�������� �� ���������>������*"=������� �� ������ ����� ���
���'��(��"��� ���������������������(������ ���� �(������������
����������� ������������������� ������� �������������������
�������� ���������� ���������"������������� ��� ��� �� ��� ���
�������������� �������� ������� � ��������/���"��
� ���� ������ �������� ������ ����������������������;�:�
�������"� :����� ���� �� � �� �������� ������� ������ ���������
�������������� ���*>>?->="� � ������������������������ ���
����� ������� ��� ��� ���� ���� �� ����� ������� ��� �������
���� ����� ����� ��������������������������� ��"��
�
�
�

148 Role of Infrastructure in Poverty Reduction
T E R I Report No. 2004 RD 24
CHAPTER 11 Bakreshwar Thermal Power Project �
Project and loan profile .
;7��� ��� :������ � � ���� 8��� /������ ������ &����������
)������ ���I � ��08/�&)I3��
�
I.:�&���<��������@��" ?.�&��" 4.9��" =.���" .���"�>6�
�
9 ����& ����������&��<����" .9��">6.���">>.:��">?�
�
I��� ��<��/�(������� �� ��/ ������ �� �����8���/������������
��������������0I��� ���A4�>��*4.��;����I� ���*6>�=>.�J3�
�
:������������<������ �� ��������*�(�����������#�� ���������
�(�� ���� �����&��������� ������� ��� � �� ���&��������-� #�� �
#���C �����"�
�
�� ��9���<�)����
�
I��� � <� :���� � ��-� 7��������� ��� ������������� �������� ����
����� �������� �?����="�:����� ����������������������������
������(������ �������������������� �?����=�
�
Project status �%� �� ��� *� ��� 6� ���������%� �� ?� ��� =� ����� ������� ���
� ��0����������������;8��������������'�����&��
Evaluation of the project Relevance
���� ;������ ��� ��� ��� �� ��� ��� �������� 8��� /������ ���� ��
����� ��� ��� ��� ��� ���� ��� ��� ��� � �� ��� ������� �� ��������"�
C������������������� � �"�/����������� ��������� ������ ��
��� �������� ���� ��������� ���� � � �� ��� ������� ��� J�������
������#� ��� �����"�J���������� ��������������(� ���������� ��
��� �"� ������ � �� ��� ��� ���� �� ����� ��� ������ ��� ����-� ���
������������������� ��������� ��������������
� 8���/������ �������������� �������������������������������
���� �������� ���� �� ��� �����"����� ���� ���������� �� ���
����� � �� ��� ��� � �� �� ����� ���(�"� #������� ��������� �� ������
������� ��� �7��� � ��� ��� ����� ��� ����� ���� ���� � ��� �� ��
�������� ��"��� �� ���������������������������� �����������
��;��������� ����������� ������������� ���"�
� :��� ����� ������� ����� ���� ��� ������ ��� ��� ��� �������
0�����-�����6�7�*�>��8��� ����������-������*�7�*�>������ �3����
���/�(����������������� ������"��

149 Role of Infrastructure in Poverty Reduction
T E R I Report No. 2004 RD 24
�
� ������������ ����������������/�(���������������� �����
������� �� ��� ����� ��� ���� � � ��� ��� �� �� ���(���� ���� �� ���
���� ������� ������ ��� ������������ ���������������"� � ��
������� ��� ������ ������ ��� ����� ��������#�������������
0��#�3��������� ����������������������������������� ������
�����/�(���������� ���������-���(���� �"�
� )����� ���������������E���/�(�������;7��� ���%� ��?����
=� �� ��� ����� ��������� ����� ����� ���������� ��� ��������
����� ��� ����������7���-����� ���� ��� � �������� �������� ���
������"���
���������0#�����<�&��������� �?�K�=������<��4�����A3�
�
� 8���/������ � ������������������������������������� ����
������ ����� � 44-4A"� ���� ������� ������ �7��� ����� ����� ��
������������������������ ������ ������� ������7������������
�� ������ ��� ����� ����� ������ ��� ��� �� ������� ����"�
;�������������������������������� �������� �� ������ ����
� �� ��� ����� ���� ������� ��� ������ ���� �����"� ���� ������
�������� ����� ������� ��� ���� �������� �� ���� ��� ������
����������� �������3����#!���<��� ������� �"��
�
;��������������<������������ ��� ������������"��
Efficiency Project Implementation
����������� �������� ��������������� ������ ���� ��������
������ �� � ��� ��� ��� 8/�&)I� �� ���������� � �� ���
O�� �� ������������������������F;)9�I����,�0������ ��������
������ �� ���K�#���� ���#������C������������� ���������
��� � ��� # ������� ��� ������� I)/� ���� ��������� ��� �������
����� ��(��� ����� ����� ������� ����� ������ ��� ��������
�����.) � ���� �� � ���� K� ������ ��� �������� ���� ��� �������
�������� ������ �� ������������<�

150 Role of Infrastructure in Poverty Reduction
T E R I Report No. 2004 RD 24
Table 11.1 Project implementation period for Unit 1& 2
Item Original Schedule(at the time of OECF
appraisal in April,1997
Actual period
Civil Works December 1996-May 1999
Steam Generator June1996-November1999,May 2000 April1999,May2000
Turbine Generator June1996- November1999,May 2000 July1999,May2000
Coal handling Plant August1996-May1999 July1999
Water Intake & Plant Water system May1997-July1999 April1999
Associated transmission System July1996 -October1999
BOBR Wagon April1998-july1999 July1999
Wagon Tippler January1998-January2000 January2003
Hydrogen Generation Plant April1998-October1999 Nov/Dec2001
Training simulator April1998-April1999
Consulting services February1994-November2000 May2000
�
� ���������� ����������#�������������K����� ������������
����������������J�������*>>>������ ������F;)9������ ���"�
� ��������������� ����������������� ������ ��������
��� � �� ��� ��� ���� �� �� ��� ���� �� � ��� ���� �������
�������� ���������� ���������� �� �� ����� � ������ � �� ���
��� � ���� � ��� ������� ��� ��������� ���������� $� �(�
�������� ���������� �����"��
Table 11.2 Project implementation period for Unit 3
Item Original Schedule(at the time of OECF
appraisal
Actual period
Civil Works June1997-July1999
Steam Generator April1997-May2000 August 2000
Turbine Generator April1997-september 2000 March 2001
Consulting Services January1995-September2000 June 2001
� 9���� ��� ����� ������� � � �� ������ ����� ����� ����� ������
����� ������������� �������� ������ �����%� �6"�8/�&)I�
��� �(��� �������� ���� ��� �� ���� �� ������ �������"� ������
�� ��������� ������ � �� ������ ���� � ������������� ���������
���������� $� �(� �������� ��� ��� ���� ��� ��� �������
����� ���� ������� �������������"�
������������0#�����<��)������% ��*�K6�������B�A- 3�
� 8������������� ������ ��������������������������������
�� ������� ������� ��"����� ����� ������� �� ���������"� ���
� ��������������� ������� � �����������������������������"�8��
��� ��������� ��� �� � ���� ������ �������� ���� �������� ����
0�� ��� ���������������������������3<��
�
/� ����� �������������7 � �� ��<�!4��.���
���� ����������-��������<�*�>��8�
)��������� �������� ��<�:����$� ���������*�>��8��� �
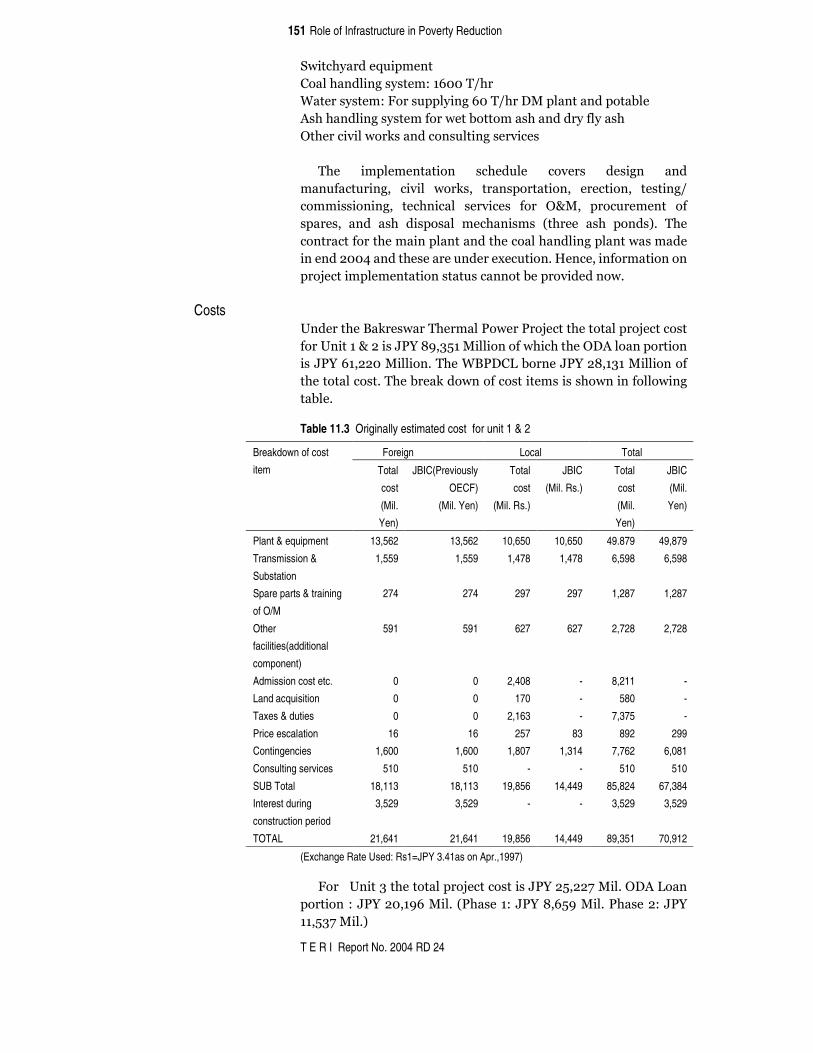
151 Role of Infrastructure in Poverty Reduction
T E R I Report No. 2004 RD 24
#� �������$� �����
)�������� ��������<��!>>��.���
8���������<�9��������� ���!>��.���&�����������������
:������� ���������������������������������������
F����� � �����(����������� ������� ����
�
� ���� �������� ��� �������� ������� �� ��� ���
��������� ���� � � �� ���(��� �������� ���� ���� ���� �� ��.�
���� �� �� ���� ���� ���� ���� ���� ���� FK��� ����������� ���
�������� ��� ���� ������� ������ ���� 0����� ���� ����3"� ����
���������������� ���������������������� ����������������
�����*>>?�������������������7��� ��"�C������ ������ ������
������� �������� ��������������������� �����"��
�
Costs %�������/�(����������������������������������������������
����%� ���K�*� ��@�5�A �6=��� �� �������� ������F&:��������� ���
��@�5�!��**>�� �� ��"�����8/�&)I�������@�5�*A��6��� �� ������
����������"���������(������������ ���� �������� �������� ���
����"�
Table 11.3 Originally estimated cost for unit 1 & 2
Foreign Local Total Breakdown of cost
item Total
cost
(Mil.
Yen)
JBIC(Previously
OECF)
(Mil. Yen)
Total
cost
(Mil. Rs.)
JBIC
(Mil. Rs.)
Total
cost
(Mil.
Yen)
JBIC
(Mil.
Yen)
Plant & equipment 13,562 13,562 10,650 10,650 49.879 49,879
Transmission &
Substation
1,559 1,559 1,478 1,478 6,598 6,598
Spare parts & training
of O/M
274 274 297 297 1,287 1,287
Other
facilities(additional
component)
591 591 627 627 2,728 2,728
Admission cost etc. 0 0 2,408 - 8,211 -
Land acquisition 0 0 170 - 580 -
Taxes & duties 0 0 2,163 - 7,375 -
Price escalation 16 16 257 83 892 299
Contingencies 1,600 1,600 1,807 1,314 7,762 6,081
Consulting services 510 510 - - 510 510
SUB Total 18,113 18,113 19,856 14,449 85,824 67,384
Interest during
construction period
3,529 3,529 - - 3,529 3,529
TOTAL 21,641 21,641 19,856 14,449 89,351 70,912
(Exchange Rate Used: Rs1=JPY 3.41as on Apr.,1997)
� 9�����%� �6������������������� ��@�5�*=�**4�� �"�F&:�I����
��� ���<�@�5�*>�� !�� �"�0�������<�@�5�A�!= �� �"�������*<�@�5�
���=64�� �"3�

152 Role of Infrastructure in Poverty Reduction
T E R I Report No. 2004 RD 24
� ������� �������������������� ��� ���� ����������� �������"�
Table 11.4 Originally estimated cost for Unit 3
Foreign Local Total Break down of cost items
Total cost
(Mil. Yen)
JBIC
(Mil.Yen)
Total cost
(Mil.Rs.)
JBIC
(Mil.Rs.)
Total cost
(Mil. Yen)
JBIC
(Mil.Yen)
Main plant 6,221 6,221 3,564 3,564 17,840 17,840
Spare parts 188 188 107 107 537 537
Training of O&M 26 26 1 1 29 29
Consulting services 123 123 0 0 123 123
Administration
cost,etc.
0 0 518 0 1,689 0
Taxes & duties 0 0 924 0 3,012 0
Price escalation 4 4 36 8 121 30
Contingencies 322 322 258 184 1,161 922
SUB TOTAL 6,884 6,884 5,408 3,864 24,512 19,480
Interest during
construction period
715 715 - - 715 715
TOTAL 7,599 7,599 5,408(JPY 17,630 Mil) 3,864
(JPY12,597
Mil.)
25,227 20,195
(Exchange Rate used : Rs1= JPY 3.26 as on Apr. 1998)
Source PCR for unit 1,2,3, ,page 10,11
� ���������� ������������ ��� ������ �������� �����������
�7��� ���������� ��?����=<��
Table 11.5 Estimated cost and actual expenditure
Estimated cost Actual expenditure (under
implementation)
Foreign currency 15903 MJY 13833 MJY
Local currency 11241 MINR 14207.2 MINR
Total 17602.3 MINR 19740.4 MINR
% of foreign currency component 36 28
MJY: Million Japanese Yen
MINR: Million Indian Rupee
Exchange rate: 1 INR = 2.5 JY
� �� �� �������� ����� �� ��� ����������� �*D� �� ��� �����������
�7��� ���������������������� �������"���� ���������������
��� ������ ��������� ��������� ���� ����� ��� ��� *!D�� �� ��� ���
���� ��������������������������������������6D"�������������
��� ������ ��� �������������������� ��<��
�� �������� �� ���������������� ��*>>*���� ��� ���@/)������
�������� ���� ��� -*>>6"�
�� ���� ���� ��� ���� ���� � ����� ���� ���� ���� �7������ ���
������������ �� � ���� �������� ��������� ��������� ��
�� ���� ������������� �������� �������������������������
����� ������*>>?"�0&�������������������������������������

153 Role of Infrastructure in Poverty Reduction
T E R I Report No. 2004 RD 24
�� ����������(������������������� �����������(���������
��� ������ �� J��-&��� *>>?�� ��� �����$������� ��� �������
������������������3"��
�
� ���������7��� ��������*>>?->=�����*!>6��@5�E���������
�������� �����7��� ���"���������������7��� ������������
������ ��������� �� � ����� �"�:����� ����� ������(� �����
����� ������*>>?������������������������7��� ���� ���������
������� ���������"���
�
;��������������<������������ ���� ��� ������������ � ����"��
�
Effectiveness Utilisation indicators
���������� ������������� �� ������ ������� � �� ��� � ������
������������� �� ������� ��<��
Table 11.6 Utilization indicators - Unit 1
Year Generation
(Million units)
PLF (%) Availability
factor (%)
Auxiliary Power
Ratio (%)
2001 1136.474 62 81 8
2002 1343.826 73 89 10
2003 1267.574 69 84 11
2004 1601.322 87 99 8
�
Table 11.7 Utilization indicators - Unit 2
Year Generation
(Million units)
PLF (%) Availability
factor (%)
Auxiliary
Power Ratio (%)
2001 1007.177 67 82 10
2002 1265.095 69 82 10
2003 1458.128 79 87 9
2004 993.624 54 56 8
�
Table 11.8 Utilization indicators - Unit 3
Year Generation
(Million
units)
PLF (%) Availability
factor (%)
Accident
rate
2001 425.772 NA 51 19
2002 1260.790 69 87 2
2003 1501.905 82 100 0
2004 1602.624 87 99 1
PLF: Plant load factor
�
� ���� ����� �I9� �� 4>- >D"� %� � 6� �� ����� �� ����� ��� ����
������������ ��������������I9�������������%� ��"��

154 Role of Infrastructure in Poverty Reduction
T E R I Report No. 2004 RD 24
� ���� ����� ��� ��� � �� ������0����� �����������������.� ����
��������������3�� ��A6- >D"�%� �������6�������������� ���� ��
��������� ����������������������������"�/�������� � ������
������������$������������� � ��������� �������"��
� �����������7 � ������������ ����������-������������������
������ ��AD"������� ������������� ���������������������� �"��
� �������������������� � �����0D3��������������� �� ��*>>?�����
6!"6?��6!">A� ���6!"4A� ������ ����"�������������� ���� ����� � ��
��������������06=-?>D3"��
� ������7 ��������� ��*>>?�����** ��8��***��8����**?�
�8������� ����"��
� ���������� ������������ ��� ������ ����������������������
���������(�������������������������"�# �� � ���������������������
�������������������������� ��������� ���������� ������� ���
���������������0*>>�->?3"��� �� ������7�������������������+����
����������������������� �������"�F����� ��� ��������������
��������� ���������"��
Table 11.9 Outage hours per years broken up by reason for outage
Outage due to machine trouble Planned outage Year
Unit 1 Unit 2 Unit 3 Unit 1 Unit 2 Unit 3
2001 12.75 31.47 1012.94 676.3 1527 0
2002 488.46 359 135.6 518.09 1273.13 1048.65
2003 102.12 186.63 13.13 1386.81 142.28 108.78
2004 73.4 1215.8 113.75 8.91 2559.75 0
All figures are in hours/year.
� ����#��������0��.J�63�����%� ����*����6� �������� �����
�����������<��
�
Figure 11.1 SPM Count
�
� ����#��������0��.J�63� ������������������ �� ���� � � ��
�� ��� �� ��� �� �=>� ��.J�6� � ���� ������� ������ ������ ���
������ �������� ��*�>��8��������"��
� ����/�(����������������������������������� �� ��������
����� ��� ��� ��� ��������� ��*>>*"����������������� ������
SPM Count
0
10
2030
40
50
2001 2002 2003 2004
Year
SP
M (m
g pe
r no
rmal
m
eter
cub
e)

155 Role of Infrastructure in Poverty Reduction
T E R I Report No. 2004 RD 24
������������� ����������������������� ��<�%�������)������
)�����:���������������� ������:�������)�����������"�
I������������������ ���� ��� ���� ������ �(�����(�� ��������������
� �� ��"����� �������������� ��� ���� �� �6=���.��.�� "�����������
����� � ���� � �� �� ����� �� ��� 6>>� ��� ����� ��� �� ��������
����� ������*>���.��"��
�
;�������� ������<� ���� ������� �� � ����� ����� ��� �� ����� ���
��� ����� � �� ��������� ��������� � �����"��
Impact Employment and local infrastructure (social)
����/�(�������� ��������� (�� ����� ������������������� ������
������� ��� ���� � ����� ���������� E� ���� ������ ���
� �����"� 8 �� �7���� ��� ��� ��� �������� ��������� � ��� ���
����������� �����������������8��� ��� ������(�����������
�� ����� �����"� � ��� %� �� ��*� ��� 6�� �� ��� ��� ������� ���
������� ����� ?=>>������������� �������B���� � �� *?6>� ��� =?D�
����������"�&�� �������� �����6?=��������������������0 ���� ���
���������,� ���(���3B� ��� ���� �� � �� ���� �����"� &�� ���
������� ��� ������ ��� %� � ?�� �A>>� ������� ����� �����
���������B��������*>D����������"��
� ���� ��������������� �� ��������� ������������� ������"�
���� ����� ����� ����� �������� ���� ������� ���� ����� ����
���������������� ������������� �������� ��"� ���� ����
����� ��(�����������������������������������������������
��������"�������������������������� �������� ���������������
��������������������������������� � ��"�
� ���� ����� �� ���� ������������������������������� ����
���� ��� ��� �� ���� ��� ���� � ��� ��� ��� �� ���� ����� ���� ����
��� ��� ��� �������� ��� � ��"� ������� ��� ������� ��� ��� �������
������ � ����� �� ��� ��� ��� ��� ���� ���������� ��� ��� ���
������������ �� ��� ������ ��� ���� ��� �����-������
��������� ��"� :�� /�(�������� �������� ������ #� ���� �� ���
�� ��������� �������>=>��8�������������������� ��������������
��� ������ ���� ���� �������������� ������������������� ��
��������������������������������� �����������("��
�
Environmental :� ������ ������� ������ �� ��� � (�� /����� � � + ��� ����� ��� ��
������� ��� ������� ����������� ��� ��� ������� �� �� ������� ���
����"��������������������� (������������������ �������������
�� �������������<�
�
• #���������� �����������0#��(� �� �� ��3�0������� ���
��� #������� ��� ������ ����� )���� �� ���� �� �� ���
���� ������� ��3�
• ��7 ��������0#��(��� �� ��3�
• ������������� ���0#��(������ ����������"3�
�

156 Role of Infrastructure in Poverty Reduction
T E R I Report No. 2004 RD 24
� ���� /���� �� �$� ���� � �� ��� � ��� �� ���� ���� ������� ���
�� �� �������������������������� � ���������������������������
������"�:�������� ����������� ����������������������� � ����
���;�� �������K�9������0��;93"�
� : ��$��� �� ����� ������������������� �������� ���( �������
�� �������� ���� ������/���"� ���� �� ������ �������� �( ���
����� �� ���� ��� /���� ����� �"� ������� ��� � �� ����� ���
��� �� ��� ������ �� ����������������<��
Table 11.10 Results of air pollution monitoring
Year/ standard SPM SO2 NOx
Environmental
standard
500 120 120
2000 116.86 2.56 62.8
2001 118.90 3.53 40.96
2002 110.40 24.52 10.50
2003 111.06 10.21 19.61
2004 155.30 5.66 21.81
2005 119.44 6.10 12.75
�
:��� ������� ���� �� ��.J�6"� ���� ������� ���� ����� ������ ���
��� ��������������"��
� ������������������������� ������ �� ��������������������<��
Table 11.11 Results for water pollution monitoring
Year pH COD (mg/l)
2001 7.98 23.64
2002 7.45 18.26
2003 7.73 16.50
2004 7.91 22.13
2005 8.13 19.65
�������������
� ���� �����������C������� ���� 0���3� ��������3� ����� �������
������������ �� !"=� E� A"=B� ���� ���/�(������������������ ���
��� ������������������� �����"��
� ��������� � �� �������������0����� � �� ��.����������� ����
N��>>3������������������A��**����*?�����*>>*->6��*>>6->?����
*>>?->=������� ���������� �������������������"�:�� �������
� � �� �������������� �� � ����������� ����������������������
��� �������� ���� ����� �� ���� �� ��� �������� ��"� ���� ����
� � �� ��������������������/�(������������� ��� ������������
�� �������������0�6D3��������� ������������������������������
������������� ���0* D3"*>�
�
;��������������<������������������������� ������������� ���
���������� �������� ��� ����� �� ����� ��� ��� ���������
�����������"��
�
*>����" ���"����0���������>-�*->=3�

157 Role of Infrastructure in Poverty Reduction
T E R I Report No. 2004 RD 24
Sustainability Social
���� /�(�������� ������� �� (����� ���� ����� ��� ��� ���
������������ � ���� � �� ��������������"������������ ����
������ ���������������������������� ���������� �"�:����6=D�
��� ��������� ����� ������������������������ ������"������������
����� ����������������������������� ������������� �������
���������� ����������"�#����������������������������������� ���
� ���� ����������������������"�����������������������������������
���� ��� ������(�����������������"��
� /�� ���� ������������������ ������������� ��� ��������
?=D���������������������������"������������������������� ���
������������������ �B������������� ������������ ������� ���� ���
����� ���������� ���7��"���
�
Organisational �������������� ������� ����������������=�6����������� ���**!�
���??D�������������������� ��.������ ������������"�:��������
������� ��.������ ����� ������ � *�� ������ A=D� ���� ������� ��
FK���� � ��"��
� ������� �� ��������� ���� ��� ����� ����� ����� �� ���� ���
����������������������� �<��
#F*<� � )���� ��� �� 0��� ��� � �� ��� �� ��3�� ������ ��� ���
����� ��0���(��� �� ������ �� ��3�
JFN� <� � ����� �� 0��� ��� � �� ��� �� ��� ��� ���(� �� �� ���
��� �� ��3�
�
� ����������.����� ���� ������ ���� ���� ���� ���������
��� �� ������������������ ����������������������������
������������"��
� ���������� ������ �� ����$� ����� ����� ���������������<�
�C������������ � �������������������������� ��� ��������
���������������� �������.������������������� ���������"��
� ��������� �������������������� ����������������������
����������"��� ����������������� �� ���� �����(��������
/� ����������� �������)C��������:�������� ��������)������
0:�)3"��
�
� ������ �� ���������� � ��������������� ����������-���� ����
����������#�������� � ��)���� ���'��(��������� �����������"�
��� � ���� ����� ��� � ���� �� ������ �� � ��� �����������
����� ���������J� �����#�����)���� �� ����� ����� �������� �"�
#������� � ����������������������������������������������
������I���������� ���:���� � �������� �"��
� /�� ���������(���������������������� �������������������
�������� ������� � ���� ���������� �������������:�������
J��� &��� "� I (�� ���� ��� �-������ �� ��� ��� ���������� ���
L��� �� ) ����� ���� ����� ��� �� ��������� ��� � �� ��� L��� ��
) �����9���������� �"��

158 Role of Infrastructure in Poverty Reduction
T E R I Report No. 2004 RD 24
� 9 ������� �������� ��� ���� ��� ������� ��� ������ �������������
��� �������������(�������������� ��������J��� �#�������
F����%� ���� ����'��(��"��
�
Financial ����/�(�������� �������� ������ ����� �� ���������� ���8���
/������ ������ &���������� )������ ��� I � �� 08/�&)I3�� ��
���������� ��� 8��� /������ �����( ��"� 8/�&)I� ����� �����
������������ �� �������� � ���� ��� � ������ ������� ��� ������ ����
����� ����� ���������"� C�������� ��� ������ ��� ����� ���� ���
������ ������������ �������0���������3�����'8C� ���� ���
��������������/�(������������<��
Table 11.12 Generation cost of Bakreshwar Plant (Rs)
2001-02 2002-03 2003-04
Fuel 1.02 0.96 0.94
Repair and
maintenance
0.03 0.04 0.05
Employee cost 0.03 0.02 0.02
Admin. cost 0.03 0.06 0.04
Depreciation
and interest
0.50 0.74 1.06
��
� ���� 8/�)&I� ���� ���� �� ��� ���� � ��� ��� "�*� � �� ��� ��
*>>6->?��� ��� ����� ���������������� ������������?"?4���� ����
�� ������� ���� � ���� �������"� �� �� ������������� �� �������� ��
������ �������� ��� ���-����� ��� �����"0#�����<� 8/�&)I�
:�����������<�*>>6->?3"��
�
;�������� ������<� ���� ������� �� ���� ������ ����� ���
��� ������������� ����������� �� �����������"��
�
Beneficiary views :�������������7��������� � ���������� ��������������� � ����
������ �� � �� ������ �� � �� ������"� � ���� ���� ������� ���
���������� ���� ���� ���� *>6� ��� �� ��� !="=� ������� �����
�����������������������"����������������������� ��� �������
��� � �������������������� ������ ��������������� � ��� �����
��� ���� � � �� ��� ��������� ���� �����������������������
���������������� �������������"��
Socio-economic profile of the sample
&������������ ������ ������������������� ������ �� ��������
��"�6"������� ������������������������"�
• ���� ���� ��� ��� ���������� ���� ������� �� ���� ���� ���
����� �A� ������ �� 4?�������� �� ��� �������� ���� ��� ����� 6 �
�����"�
• :����6A��������������������������������������������*�
������������� ��������������������������6��������������

159 Role of Infrastructure in Poverty Reduction
T E R I Report No. 2004 RD 24
�� *>D� ��� �������������� ��� �� �� �=D����������"�F�� ���
����� ����� ����� 64� ������� ���������� ��� *� �������
�������� �������� ��� *?D� � �� �� ������� ������� ��� � �
�������� ������"��
• :����*>D����������������������� ���� ����������� ���
���� ��� �� ���� � ��� ����� ���������� ��� ��� ����� ������
�����������������6D� ������ ��"��
• :���� ??� ������� ��� ��� ���������� ������� ��� ��������
������� ������ ������� ��� *>>>-=>>>�� �������� ��� ?6�
�������� ��������������*>>>���������"���
�
Figure 11.2 Monthly Income
Monthly income (Rupees)
43%
44%
12% 1%<2000
2001- 5000
5001-8000
8001-10000

160 Role of Infrastructure in Poverty Reduction
T E R I Report No. 2004 RD 24
Table 11.13 Profile of respondents
Number of respondents Percent
Age of respondents
<15 years 0 0.00
15-20yrs 9 4.43
21-25yrs 16 7.88
26-30yrs 32 15.76
31-35yrs 31 15.27
36-40yrs 41 20.20
41-45yrs 20 9.85
46-50yrs 24 11.82
>50yrs 30 14.78
Total 203 100.00
Primary family occupation
Factory worker 0.00
Business 40 19.70
Daily wage labourer 41 20.20
Cultivation 42 20.69
Clerk 17 8.37
Social worker 1 0.49
Teacher 14 6.90
Service 26 12.81
Pension holder 10 4.93
Bank interest 1 0.49
Carpenter 1 0.49
Computer operator 1 0.49
Agriculture 7 3.45
Self-employed 2 0.99
Driver 0.00
Total 203 100.00
Impact of the project on access to electricity in the survey area Provision of electricity
:����� ���� � � ����� �������� ��� ������� �� ����� � �� �����
������� ��� ������B� ��������� ����� 4D� ������� ��� ����
������������������ � ��������������������������$� ���0������
��"�?3"��
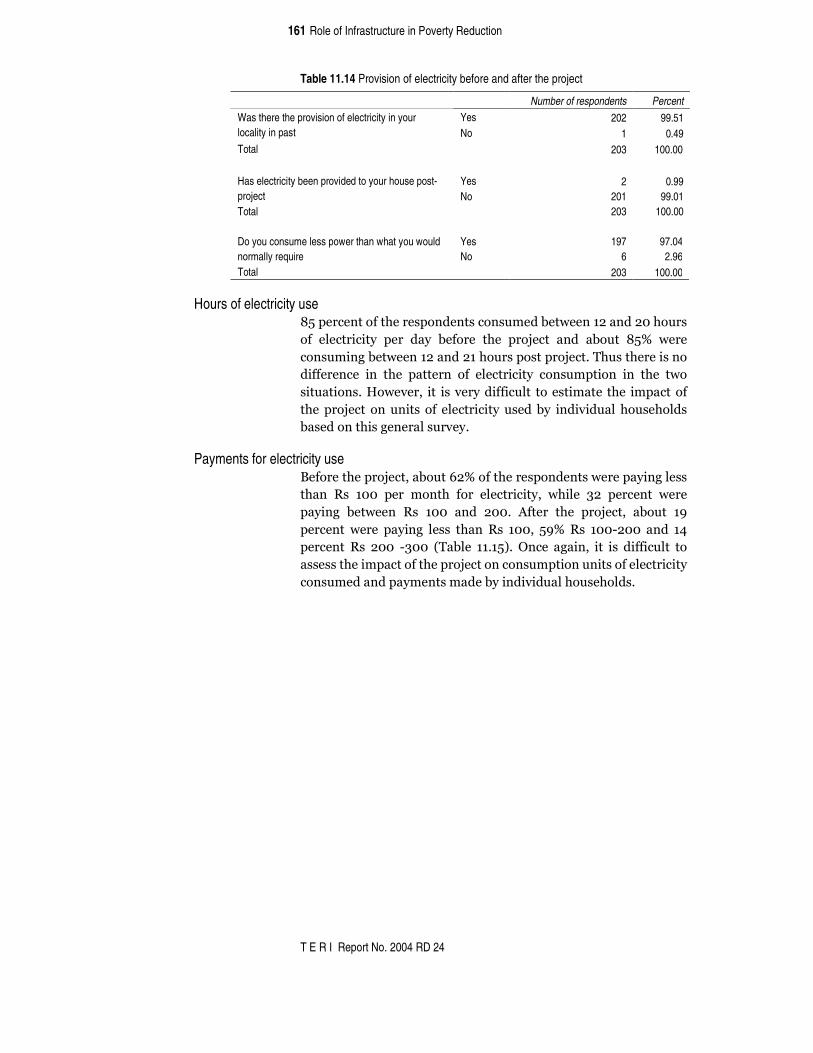
161 Role of Infrastructure in Poverty Reduction
T E R I Report No. 2004 RD 24
Table 11.14 Provision of electricity before and after the project
Number of respondents Percent Yes 202 99.51 Was there the provision of electricity in your
locality in past No 1 0.49 Total 203 100.00
Yes 2 0.99 Has electricity been provided to your house post-project No 201 99.01 Total 203 100.00
Yes 197 97.04 Do you consume less power than what you would normally require No 6 2.96 Total 203 100.00
Hours of electricity use
A=����������������������������������������*����*>�������
��� ����� � �� ���� ��� ������� ��� ������� ��� ����� A=D� �����
������ �����������*����*������������������"����������� �����
��������� �� ��� ������ ��� ����� � �� ������� ��� �� ��� ���
� �� ���"�C�������� � ������� �� ���� ���� ���� ��� ��������
���������� ����� �� ��� ����� � ��������� � � ��������������
��������� ����������������"��
Payments for electricity use /����������������������!*D������������������������� ��������
���� ��� �>>� ���� ����� ���� ����� � ��� �� ��� 6*� ������� �����
��� ��� ������� ��� �>>� ��� *>>"� :���� ��� �������� ����� � �
��������������� �������� ������� �>>�� = D���� �>>-*>>� ��� �?�
���������� *>>� -6>>�0������ ��"�=3"�F���� ��� ��� � �� �� ���� ��
���������� ���������������������������� ����� ���������� � ��
�������������������������� � � �������������"���
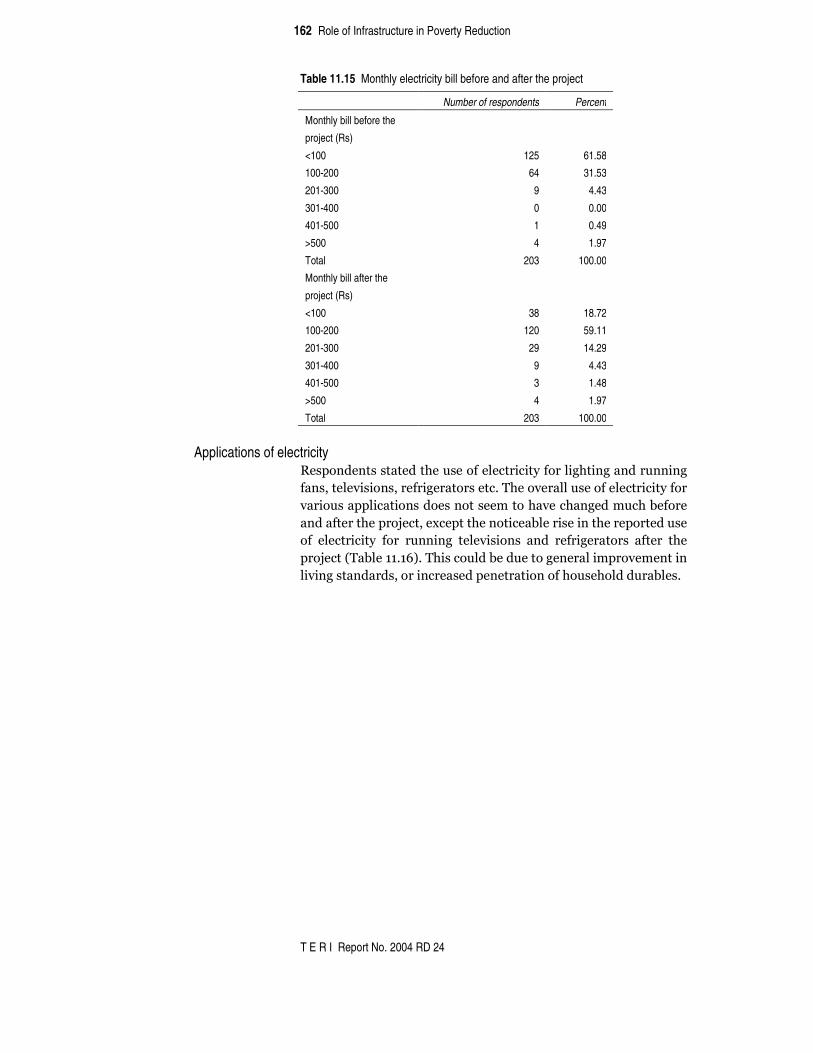
162 Role of Infrastructure in Poverty Reduction
T E R I Report No. 2004 RD 24
Table 11.15 Monthly electricity bill before and after the project
Number of respondents Percent
Monthly bill before the
project (Rs)
<100 125 61.58
100-200 64 31.53
201-300 9 4.43
301-400 0 0.00
401-500 1 0.49
>500 4 1.97
Total 203 100.00
Monthly bill after the
project (Rs)
<100 38 18.72
100-200 120 59.11
201-300 29 14.29
301-400 9 4.43
401-500 3 1.48
>500 4 1.97
Total 203 100.00
Applications of electricity
����������������������������� � ������� �� ���������� ���
���������� � ��������� ����������"������������������������� � ������
��� �������� �� ������������������������������������������
��������������������7��������� �������� ��� ����������������
��� ����� � �� ���� ���� ��� ���� � ���� ��� ���� �������� ����� ���
�������0��������"�!3"��� ����������������������� ���������� ��
� � �������������� �������������� ����������������������"���

163 Role of Infrastructure in Poverty Reduction
T E R I Report No. 2004 RD 24
Table 11.16 Applications of electricity before and after use
�
Employment created by the project
��������������� ������������������� D�����������������
�������������������� ������������AD��� �������� ���"�����
������� ��� ���� ��� ���������� ���� �� �� ��� ������� ���
��� ��������-A>>"�&�� �������� ������������������4!D�������
���������� �������� ��� ��� ������� ������� ��� ���� �����
� ���� ���������� ���� =>>-�=>>�������� ��� �!D���������� ��
���������*>>>����"��
�
Table 11.17 Employment provided by the project during construction and operation
Number of
respondents Percent
1 Yes 19 9.36 Did the project provide
employment to any member
during construction 2 No
184 90.64
Total 203 100.00
1 Yes 37 18.23 Did the project provide
employment to any member
during operational phase 2 No
166 81.77
Total 203 100.00
Number of respondents Percent
Applications before the
project
1 Light 199 100.00
2 Fan 188 94.47
3 TV 89 44.72
4 Refrigerator 1 0.50
6 Any other 1 0.50
Total 199 100.00
Applications after the
project
1 Light 199 99.00
2 Fan 193 96.02
3 TV 160 79.60
4 Refrigerator 17 8.46
5 Heater 0 0.00
6 Any other 3 1.49
Total 201 100.00

164 Role of Infrastructure in Poverty Reduction
T E R I Report No. 2004 RD 24
Table 11.18 Number of days of employment provided by the project
Number of respondents Percent
Number of days of employment
during construction phase
1-100days 4 21.05
101 thru 200days 1 5.26
201 thru 300days 5 26.32
301 thru 400days 2 10.53
401 thru 500days 0 0.00
501 thru 600days 3 15.79
701 thru 800days 4 21.05
Total 19 100.00
Loss of land and property due to the project and compensation paid ��������������������*>6��������������������������������
�����������������������������"�F������������� 4���������� �
��� ������� ���� ��� �������� ��� ��� ��� ��� �������� 0������
��"� 3"��
�
Table 11.19 Loss of property due to the project and compensation received
Number of respondents Percent
Yes 114 56.16 Did you lose any
land/property due to the
project No
89 43.84
Total 203 100.00
Yes 111 97.37 Were you compensated
for the loss No 3 2.63
Total 114 100.00
Improvements in the social and economic environment due to the project ���� ���������� ����� ��(�� �� ���� �� �� �� ������ ��� ���
����������� �� ������ ������������ �� ������������ ���� ��
����� �� ��� ������� ��� ���������"� ���� ������� ������������ ��
��������"*>"��� ���������������������������� ��� ������������������
��� ��� ������ ��� ��� ��� �����������"� ���� ������� ��� ���
�������������� ������������������������������������(�������
�������������������������������������� ����������������������
��� ��� ����"��
� :������ ��0A6D3���������������������������� ��� �����"�
F����������>D�������������������������������������������
��� �������������� ��� ���������"���
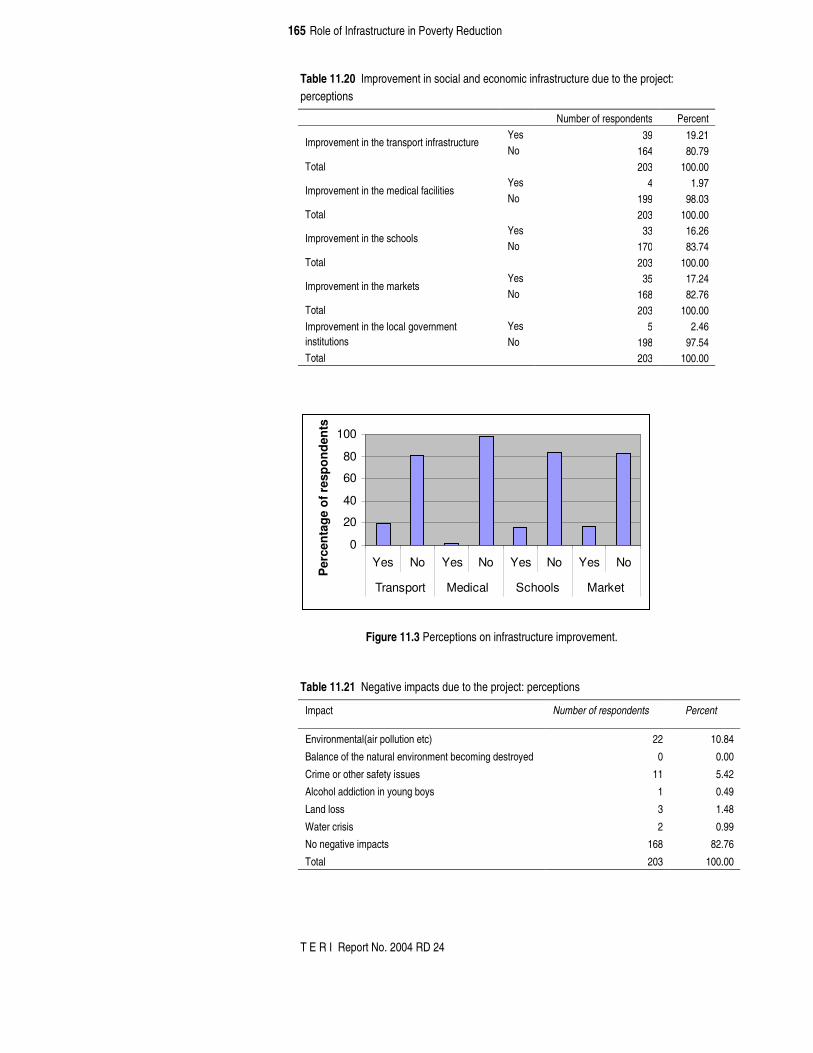
165 Role of Infrastructure in Poverty Reduction
T E R I Report No. 2004 RD 24
Table 11.20 Improvement in social and economic infrastructure due to the project: perceptions
Number of respondents Percent Yes 39 19.21
Improvement in the transport infrastructure No 164 80.79
Total 203 100.00 Yes 4 1.97
Improvement in the medical facilities No 199 98.03
Total 203 100.00 Yes 33 16.26
Improvement in the schools No 170 83.74
Total 203 100.00 Yes 35 17.24
Improvement in the markets No 168 82.76
Total 203 100.00 Yes 5 2.46 Improvement in the local government
institutions No 198 97.54 Total 203 100.00
Figure 11.3 Perceptions on infrastructure improvement.
Table 11.21 Negative impacts due to the project: perceptions
Impact Number of respondents Percent
Environmental(air pollution etc) 22 10.84
Balance of the natural environment becoming destroyed 0 0.00
Crime or other safety issues 11 5.42
Alcohol addiction in young boys 1 0.49
Land loss 3 1.48
Water crisis 2 0.99
No negative impacts 168 82.76
Total 203 100.00
��
0
20
40
60
80
100
Yes No Yes No Yes No Yes No
Transport Medical Schools Market
Per
cent
age
of r
espo
nden
ts

166 Role of Infrastructure in Poverty Reduction
T E R I Report No. 2004 RD 24
CHAPTER 12 Teesta Canal Hydroelectric Project (TCHP)
�
Project and loan profile �������:���<�8���& �������& �� ���8���/�����"�
�
I��� ��<�F������������� ��)��������������/�������������"�
F��)�����&������)C�="=>6�(�������"#-�����)��*�"*4=�(�������"#$=�
����)��6�"=�(�������"#������������������� ��)����"�
�
��������)���� �<��6�7�6�7�4"=�"8�P�!4"=��8�
�
;7��� ���:�����<�8���/������#���;���� � ��/����08/#;/3�
�
������������)��<�@�5��4�4!*�� �"�
�
F&:�I������� ��<�@�5��?�*?4�� �"��
�
)�����������������������<�@�5�6�=�=�� �"�
�
Status ��������������������������������7����������� ������������
���� ����"��
Evaluation of the project
Relevance
���� 8��� /������ ������ ������ �� �������� ��� ��� ��� �������
����-������� �� �� ��� ?< !�0 ���� ��� �����������3���� ���
����� �������� �����?><!>"� ��� �� �������(�� ����������������
������������������ ����� �����(��������� ��"��
� ��� ������ ���� �� ��� �������� ���� ��� 8��� /������� ���
�������� ���� � +"� ��� �� ��� ��� &������ ���� @���� ��� ��
)����������� 8��� & ������� ��� ����� ����� �� ������ ���� ���
���������� �������� �� ��� ���� ��� �����"� /�� �� ���$����
���� ��� �� �� ������ ���� �������� ��������� �� ���� ��� �������
������������������ �� �����������������������������"�
� /� ���� ���������������������� �������� ��� ������������
���$����� ��� �������� ��� � ���� ������ ������ ��� ����� � ��
���� ������������������������ ��������� �������� ������"�F�����
����� ����� ��� ������������ ��� 8��� /�������� ��� ����� ��
�������������� �������������� ��������� ���� �(� �����������
���������������������������� (��:�����������������:����������
*���"#<�������#� ���

167 Role of Infrastructure in Poverty Reduction
T E R I Report No. 2004 RD 24
��� ������ ������J��������� +���������������������������"�
������� �� ��� ����(��������� ���� � �� ��� �������������������
���� ����7�������������"�������� ������������������������ ��
��� ��������� ��� �� ���� ���� ������ �� �������� �� ���������
�� ����J����/�������������� ��������� ��� ������� ��������
������������� �"�:�� ����� ������������������� ������ �����
�����( ��������������������������������������� +���� ��
��� ��� ��� ��������� ������ ������ ��� ��� ������ ����� C����
������ �� ������ ����������������"�:����������� ���� ���
��������� ���� ���������������� ���� ���������(��� �� ���������
��������-��� ��� � �������$���������� ��� ����� ��**�
� �:��� � �� �� ��� �� ��� ��� ���� ���������� ��� ����� ������
���������� ��������"��
� ���� 8��� /������ ���������� ������� �� �� 4>?"4�8� ���
������ ��� ����� �� �� ���4�� ����� ��� ��0� A=- >3"� � ���� ���
���(�������( ������ � �������)������;���� � ��:���� ��������
����� ��������� �� ���������� ������ ��� �� ��� ��"� ����
������������� ��������������� ����� �������� �� ���������
���������"�
�
;��������������<������������ ��������������"��
Efficiency Project Scope
���� ������� ���� ��� �� ��� ������ ��� ��� ����� C���-;���� ��
������#� �������!4"=��8��������������� ������( �����������
��� ����� ������ ������ ��� ��������� �� �� )����� ��� ��� ������
��� ��������������"��
� ����������)�����C�������� ��������������� �� ������� ���
����� ������ ��� :�� ���*>>>"���� ����������� �� ���� �(������
������������ ��������������������/�������������������E
���������I �(�)����"�
� �%�������������)�����C�������� ������������������ ����7-
�������������������� ��<�
�� ������� ������� ��������� ����� �<����������� ����� ������
�����������������-���������������� ������� �����4"=��8�
����"�
��)������ �������������������� ������#-����#-*������#-6"�
��)������ ��� ��� ��������� ������� ��-����� ������ ��� � ������
�����"������������������������ ���������������������� ��������
������4>=���������=�>?>�����"�
��)������ ������������������ �����"�
�� ������� ��� ��� ������� �� ������������� ��������� �6*.!"!�
�������� �����*4">��G:������� "�
�
� 9��� ��� �� ���� ���� �� ��� ��� ��� ������� ����� � �����
������� ��������������������� �����������������<�
�
**�������)�����9�����������&�� �����������������#�� ���<���������=�

168 Role of Infrastructure in Poverty Reduction
T E R I Report No. 2004 RD 24
.$!�''�!,%.�%&���+,�$�'�0%1�#���.�#�!%#������ �����������
������������� ������� �� ������� ������� �� ��������� �� ��,��
�����"�
�
�%.$!#"�!,%.�%&��.��$��0����.�'��������������� ���������
������ ������� ������� ��������� ����� � �� ��.�������� ��� ���
�������� �����������������������������������#-��K�#-6"�
�
�%.$!#"�!,%.�%&�#�2%!���%.!#%'�#�+,�'�&�''���!��$($!�2�����
���������� �������� ��������������������� ����������������
������ ������� �� ��� ��������� ���� ��������� ������������
�� ��)�����0��)3"�
� )��� ��� � ����� ������ ��� ����� �� ����� ��� �����
� �� ��.����������� ����������� �������������� �����������"�
��� ������������� � ����������� �� � ���������������� ���������
������������������#-��K��������(�������������� ��������������
�� �� ��� ��� ����� ������ �� ��������� �� �� )����� ����
���� ��������� ��*6"�
�
Implementation Schedule ��������������� �������� �������� *>>>�� ��������������� ��
�������"� ���� �������� ���� ������������������ ������� �� ���
*>>*�@/�)������� ���������������� ��������������"���
�
;��������������<������������������������� �������� �����
�����"��
�
Effectiveness ������ � ������������������������������������ ���������> " ��
�>4">� ��� �>6">� �8C� ������ ����"� ���� �������� ������������
� �����������������������*?<���
�
*6��)9��������)����� ������������@/�)�;����� ���#������"�*?�9 �������������� ����������������� ������ �����*>>*�@/�)������� ���������

169 Role of Infrastructure in Poverty Reduction
T E R I Report No. 2004 RD 24
Table 12.1 Performance indicators of the project (Utilisation indicators) �
�������������
SOURCE Questionnaire for Executing Agency �
� ���� ������ ��� ����� ��������� ���� ������ ��� � ������ � ��
�����"�
Table 12.2 Generation of Power from TCHEP
Year Generation (in MU) Target (in MU) Remarks
2000-01 118.90 60 Almost double generation
2001-02 169.10 122 Nearly 40% more generation
2002-03 164.09 172 Shortfall due to restriction in release of water and
extension of canal shutdown by 15 days
2003-04 93.02 128 Shortfall due to shutdown of canal from 22.5.03 and from
05.08.03 and from 01.12.03 to 31.03.04,a total of six and
half months
SOURCE WBSEB annual report 2003-04, page12 ��
���������� ������������ ��� ������ ������������������"�
Table 12.3 Outage causes
Year Outage due
to human error (%)
Outage due
to machine trouble (%)
Planning
outage (%)
2001 0 10 90
2002 0 11 89
2003 0 11 89
2004 0 10 90
�
�;��������������<���������������������� 7�������������� ��
������������� �������E�� �������� ������������ �������������"��
2001-02 2002-03 2003-04
Gross Energy
production (In
million units)
PS-1
PS-2
PS-3
52.82
54.18
62.18
49.96
57.68
56.45
28.07
32.441
32.58
Peak load (MW) PS-1
PS-2
PS-3
7.5
7.5
10.4
8.6
9.1
9.2
6.4
6.8
6.9
Plant load Factor
(%)
PS-1
PS-2
PS-3
32.16
35.89
43.88
48.06
50.63
60.32
45.46
53.91
54.81
Water Flow in the
MMC at PS-1
(m3/sec)
Average
Max
Min
110
170
90
110
120
80
100
110
70

170 Role of Infrastructure in Poverty Reduction
T E R I Report No. 2004 RD 24
�
Impact ����������� ����� �7����� �� ������ ���� ��� ���� ��� ���������
������� ������ �������������"������������ ����������������
�����(������������������������������������������������������
������� ��������"� �:������ ���������� �����������������������
������� ���� ���� �� �������� ��� ��� ����� ��� ������
����� � �� ��� ������������� � � �"��
� :������ ������ ������� ��������;7��� ���:�������������
��������� *=>-=>>� ������ ������� ����� �������� �� ����� ������
�� ��� ������� ����� ��.� ���������� �� ��� ��� ������� ���
�����"�����������-������� ����������������=>������������������
�������� ��������� ��"��
� :� ����� �� ��� ����� ��� ��� ����� ���� ��� ����� �� ���
��� ����������� � ���������� ���"��
� �
;�������� ������(<� ���� ������� � ��� ������ �� ������ ������
�������������� ������������������ ������ ��� ������ �����
� � � �"��
�
Sustainability Organisational outlook
:������������������������������"�:����FK�������������������
�����������#���� ��� ���;�� ������E�;���� �������) � �"������
���������������������?>��������������� �������A4����� �������
=6����-���� �������������"���
� ���� ������ ��� ������ ����� �� � ���� �7����� ���
�����.����������7������7��� �������FK�"���
�
Table 12.4 Original expected expenditure for O/M under ID-P40
Fiscal Year Total expenditure in million (Rs.)
1989
1990
1991
1992
1993
1994
:
:
: : 2023
0.5
6.5
11.5
11.7
11.7
11.7
:
:
: :
11.7
SOURCE Project Completion Report, Page 25 and 26

171 Role of Infrastructure in Poverty Reduction
T E R I Report No. 2004 RD 24
Table 12.5 Actual & Current expected expenditure for O & M under ID-P40
Fiscal Year Total expenditure in million (Rs.)
1999
2000
2001
:
:
: : 2023
29.90
59.82
59.82
:
:
:
:
59.82
SOURCE Project Completion Report, Page 25 and 26
Table 12.6 Expected expenditure for O/M under ID-P72
SOURCE Project Completion Report, Page 25 and 26
Table 12.7 Original expenditure for O/M under ID-P72
Fiscal Year Total expenditure in million (Rs.)
1999
2000
2001
:
:
:
:
2026
24.62
46.38
46.38
:
:
:
:
46.38
SOURCE Project Completion Report, Page 25 and 26�
� FK�����(������������������ ������������� ������������ ����
:�������� ��������)�������0:�)�3����������� ���"�)�� ���
������� ���� ���� ��� ��� ���� ���� �� ��� ����� ����� �� ��� �����
������.� ������������ ������������ ��������� ���� ����������"��
��� ����� ������� ������� ���� �������� ������ � ����� ��� �� � ����
���������������������� ����� �������;7��� ���:�������������
��� ������ ������ ��� �� ������ ��� ������ ������� ���� ���� ���
������.������������������(������ ��������������� �"���
Fiscal Year Total expenditure in million (Rs.)
1994
1995
1996
1997
1998
1999
:
:
:
:
2028
n.a
n.a
15.3
15.3
15.3
15.3
:
:
:
:
15.3

172 Role of Infrastructure in Poverty Reduction
T E R I Report No. 2004 RD 24
Constraints
��� ����� �� ������� ��� ���� ��� � �� ��� ��� �������� ��������
��������� ������ ��� �(������ ��� ;7��� ���:�����"�8�� ������
������������������<��
�
Deterioration of MMC ����������� ��)�����0��)3������� ���� ��������� ��� ������
������ �� ��� A����������������������� �� �������������������
����� ���$���� ���������� ��� ��� �����(����"� � ��( ��� � �� ���
������������� �������� ����)����� ������������ ������������
�� ���"� � ��� ����� ������ ����� �������� ���� ����� ���������
��������������� ��� ��$� ���������8/#;/�� ����� ������������
������ ��� ����������� ���� ����� � � �� ��� ��� ��� ����-����� ��
����"������������ � � ��������������� ����������������� �"��� ��
���������������������� � � ������������� ��������� ���� ��
��� ��� �� ��� ��� 8�������� & �������� 0�K8&3� ���� ���
�������������8���/�����"��
� �������(����� � ������� ��������������)����������������#��
�������������"��/�������� �����������������������#�����
�#*����� �������������"��������������� � ��� ��������(���������
����K8&"��
�
Insufficient discharged capacity in the lower reaches of MMC ���� &��(-J����� �� �� )����� 0&J�)3� �� � ���� �� ��� ������
�7��� ��������)��������� �� ���������������� �� �� ��� ������
����� �������������"�����&J�)����������������������������
���� �� �� ������ ��� ������ ����������� � �������� �������"�
�K8&���������(���������������������� ������� � ����������
���������������*>>A"�C��������������� ������;������)�������
�����&J�)���&��������� ����������������������������*>>�
������� ��� ����� �� ��� ��)� ������ �������"� C�������� ���
��7 ���� ������������**>����������������������� ����� ����
��������� ����� � �������� ����)"��
Deposition of silt at MMC bed
���������� �������)�0�� � �� ��� ��������� ���3����� ���� ���
������������������ ����� ����������� �� ���������������
���� ��� ��� �������� ����� �� ��� ��� �����"� � #��� ��� � ��
���� �������C��������)���������� ��(������ ������������
������#� ��� ����������� �������������������������������"��
�
Floating and underwater trash 9��� ��������������� �������C��������)����������������
���(�� ���� ������� ��� ���������� ��� ����� ����������"� ������
����� ������� ���������� ���������������� ���"��
�

173 Role of Infrastructure in Poverty Reduction
T E R I Report No. 2004 RD 24
Financial statement ���� ������ ��� ����� ���� ��� ������ ��� ��� ������ ���
�7��� ����������������C�������� ���������������������*>>6-
>?"��
�
Income Amount (Rs million)
Revenue from sale of power 167.5
Expenditure
Fuel cost 0.5
Repair and Maintenance 23
Salaries 25.5
Administrative expenses 6.8
Depreciation 249.8
Finance charges 0.8
Interest 669.3
Overheads (Head office) 560.6
Total 1536.3
Profit (-) 1368.8
�
�
� �:�� ����� ������� ������(� ��� ��� �7��� ���� �� ��� ������� ���
������ ������� 0?�D3� ��� ��������� 06!D3"� � ���� ������,��
�����-�7��� ���������������������������������������6!A"A�
� �� ����� ����� ��������� ��������������������������"� ���
�������������������� ��� � � ����������� �� ��������� �����
����������� ������������������� ���0�3�8���� ������� �� � ��� ��
��� ���� ���<� ���������� ������� �����! "=�� �� ���0�3�8����
���� ����������������������������� ���<�����������������
������6A" �� �� ��"���
�
;��������������(<������������ ����������� ����������� ���� ���
����������������������������� ��� �����������"��������������
�� ����(����������������� �������� ��� � ��������������"��
Expenditure Break-up
1% 0%
16%
0%
45%
36%
2%0%
Fuel cost
Repair andMaintenanceSalaries
AdministrativeexoensesDepreciation
FinancechargesInterest
Overheads(Head office)

174 Role of Infrastructure in Poverty Reduction
T E R I Report No. 2004 RD 24
Beneficiary view :���������������� �������������� �����������������������
C�������� �� ������"� � ���� ������� ������ �� ���� ����
��������������������� ���������� ������������������ �������
���� ��� ������� �� ����� � �� ��� ����� ������������� ��� ���
������ �������������������� ��� ������� ���������"�����
������������������������ ���� ��������*>!��������� ���!=�
�����������������������������������"� �
� ��
Socio-economic profile of the sample ������� ������ ���������������������������������"�
�� :����6=�������������������� ������������������*=-6=����
������?�������������������=>������"��
�� :���� 4=� ������� ��� ��� ���������� ������������� ��� ��
����������� ��6�������������6����������������������A>�
������������������ ��6�������������6���������������� �����
���������"�
�� 6=�������� ��� ��� ���������������� �������������������*4�
��������������� �����������*������������������� �� ���
����� ����� ���� �������� ��������� ��"�
�� :����= ����������������������������������������������
������ ������ ��� *>>>� �� ��� 6�� ������� ������� � �� ���
����������*>>>-=>>>"���
��
� ������ ������� ������������������� ��� ���� �����
�����������"�
Table 12.8 Profile of the respondents
Number of respondents Percent
Male 134 65.05
Sex
Female 72 34.95
Total 206 100
<15 years 1 0.49
15-20yrs 5 2.43
21-25yrs 23 11.17
26-30yrs 36 17.48
31-35yrs 36 17.48
36-40yrs 27 13.11
41-45yrs 28 13.59
46-50yrs 21 10.19
Age
>50yrs 29 14.08
Total 206 100

175 Role of Infrastructure in Poverty Reduction
T E R I Report No. 2004 RD 24
Table 12.9 Average monthly income of the respondents
�
Occupational structure of the respondents ������ �*"�>� � ������ ��� ������ ����� �������� ��� ���������"�
:����6=������������������������������ �������������������*4�
��������������� �����������*������������������� �� ������
�� ����� ���� �������� ��������� ��"�
Table 12.10 Profile of the primary family occupation
Occupation Number of respondents Percent
Factory worker 7 3.40
Business 56 27.18
Daily wage labourer 71 34.47
Cultivation 43 20.87
Clerk 4 1.94
Teacher 6 2.91
Service 7 3.40
Pension Holder 3 1.46
Agriculture 7 3.40
Self-Employed 1 0.49
Driver 1 0.49 Total 206 100
�
Impact of the project: electricity generation Electricity provision: before and after Teesta project
���������� ������� �������� ��� ��� ����� � �� ����� ��� ������ ��
�����==���������������������������������������������������
����������������������������������������4=�������"��
�
Average monthly income Number of respondents Percent
1-2000 121 58.74
2001- 5000 64 31.07
5001-8000 12 5.83
8001-10000 3 1.46
10001 and above 3 1.46
Don’t Know /Cannot Say 3 1.46

176 Role of Infrastructure in Poverty Reduction
T E R I Report No. 2004 RD 24
Table 12.11 Record of electricity provision- Pre and post project
�
9�������������$� ����������������������� � ����� ��� � ��
���� ��� ���� ������� ?A� ������� ���������� ���� ���
��� ��� � �����������*>���������������������"�:��������������
����� ����7 ������ 6����������� ������������� � �����������
*>�������������*>�������������"�F������������������ � ������
��� �����������!"=�������������������������**"*���������������
������������ ����7 �����"�
�
�
Monthly electricity bill- pre and post project
��������������������������������������������� � ��� ��������
��������������� ����7 ������ ��������������*>>����������� >�
������� ��� ��� ���������"� 9���������� ��� ���������� ��� �� ���
������� ������� �� � ��� 44� ���� ����� ���� ����� � �"� :���� ���
������������ ����7 �������� ������� �����������A���������"�
� �
� Table 12.12 Monthly bill pre and post-project
Pre project Post project
Monthly bill (Rs.) Number of respondents Percent Number of respondents Percent
<100 41 19.90 94 45.63
100-200 9 4.37 92 44.66
201-300 2 0.97 11 5.34
301-400 0 0.00 5 2.43
401-500 1 0.49 2 0.97
>500 153 74.27 2 0.97
206 206
�
Pre-project Number of respondents Percent
Yes 114 55.34
No 92 44.66
Post-project
Yes 154 74.76
No 52 25.24
Pre-project
55%
45% Yes
No
Post-project
75%
25%
Yes
No
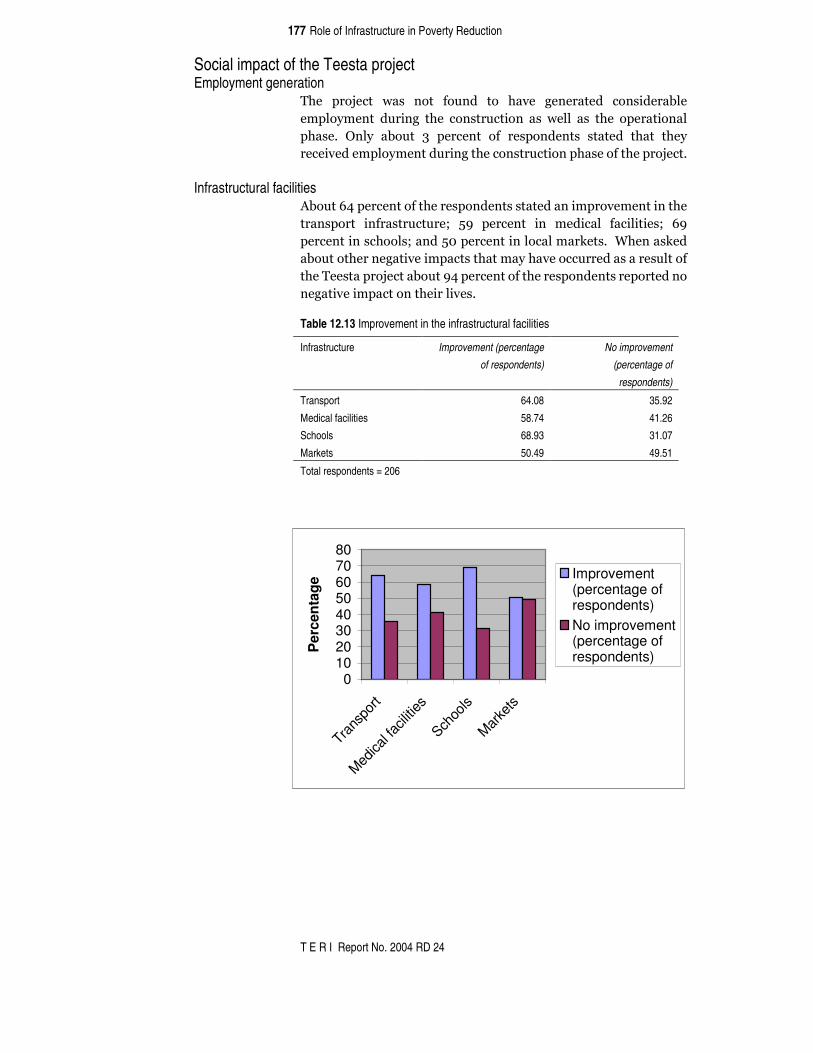
177 Role of Infrastructure in Poverty Reduction
T E R I Report No. 2004 RD 24
Social impact of the Teesta project Employment generation
���� ������� ���� ��� ����� �� ����� �������� ���� �������
������������ ��� ��� ������� ��� �������� ��� ��� ����� �����
�����"� F���� ����� 6� ������� ��� ���������� ���� ��� ����
���� ��������������� ������������� ���������������������"�
�
Infrastructural facilities :����!?������������������������������� ���������� �����
�������� �����������B� = � ������� �� �� ���� ��� � ��B� ! �
������� ���������B����=>�������� �����������(��"��8������(��
�������������� ��� ����������������������������������������
��������������������� ?����������������������������������
���� ��� ���������� ��� ���"��
Table 12.13 Improvement in the infrastructural facilities
Infrastructure Improvement (percentage of respondents)
No improvement (percentage of
respondents)
Transport 64.08 35.92
Medical facilities 58.74 41.26
Schools 68.93 31.07
Markets 50.49 49.51
Total respondents = 206
�
�
�
�
��
01020304050607080
Trans
port
Medica
l facil
ities
Schoo
ls
Marke
ts
Per
cent
age Improvement
(percentage ofrespondents)No improvement(percentage ofrespondents)

178 Role of Infrastructure in Poverty Reduction
T E R I Report No. 2004 RD 24
CHAPTER 13 Purulia Pumped Storage Project (PPSP) �
Project and loan profile ��������� ��������#�������������0��#�3�� �������� �������
����� ����� >>��8� ���� ��������� ��:������C ��������������� ��
�� �� ���8���/�����"� ����������� ������� �������� ��� ������
�����@�����/��(����������� �����)������ ���0@/�)3"����������
�� ��������������� ���>4�=>�� �� ������"���
� 8� �������� �������������������������� ������������������(�
���������������� � �� ���� �,������������ �������������� �������
�7����� �� ���� ���� �� �������� ��� �-������ �� ����������
� � �� �� ��� ���� � � �� ��� ������ �� �������� �� ���������
��������-��� ��"��� ������������������������� ��������� � ��
������� ������ � ���� ������ ��� �����(�������� ��� ����� ���
������ �����"�C���������������� �������(��������� ��� �����������
��� ��������:������C ���� ���������� ��� ������ ������8���
/���������������� ������ ����������� ��� ����������"���
� /�� ���� ������������������������� �� �������������������������)���� �<�?�N�**=��8�0 >>��83"�
�
�������)���0F� � ���3<��>4�=>��5�06�AA �� �� ���������3�
@/�)�)��������0F� � ���3<�AA>*=��5�0*!� 4�� �� ���������3�
0�����P�6"6!�53�
�
�������)���0J���:� � ���3<�46=*���5��
@/�)�)��������0J���:� � ���3<�!*>!���5��0�����P*"= �53�
#������� �� ��<���?!>��5�
�
#���<������������ ����������������������� ��"��
Evaluation of the project
Relevance
�������������� �������� ������������������������7����������-
����� ������������������� ������� ��� ������������"� �8���
/������ ���� �� �(���� ����-������� � 7� ��� !< ?� 0 ���� ���
������ �����3� �� ��� ��(��� � �� ���� �� ���� ����� ���
��������������� ���"�:�������#������������� ���������������
� �� � �� ����� ���� � ����������0�����.� �����3��� ���������
��� � ��������� ��� � �������"��
� �������������������������������������������������� ��
������ ����� ��� ����� ��� ������ #������ ��������� �� ���� ���
����� �������� � +�����8���/�����������������"�������#���
�� ��� ���� ���� ��� �� � � +�� ��� ���-���(� �������� ��� ��������
�������� ������������ �������������������I������������ ����
��� %����� ������� �� ��� �������� �� ��� ���(� ���� ������ ���
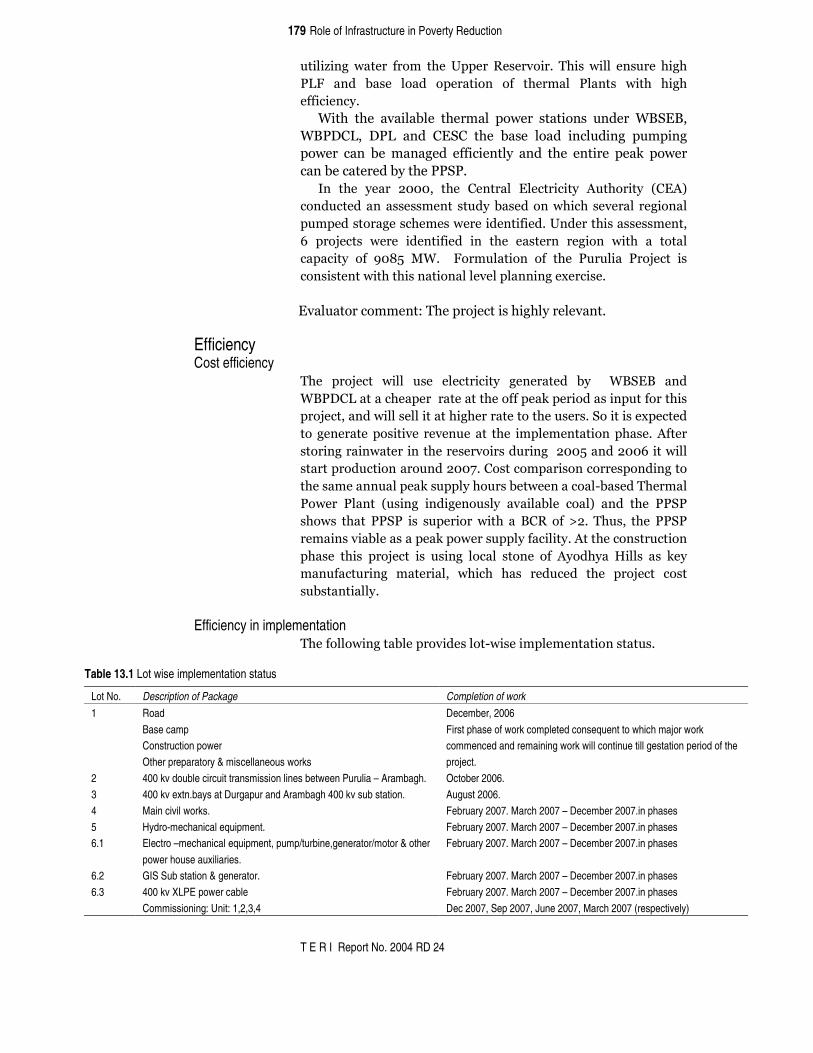
179 Role of Infrastructure in Poverty Reduction
T E R I Report No. 2004 RD 24
� � + �������� ����� ���%������������ �"� �� ��� ��� �������� ���
�I9� ��� ����� ���� ����� ��� ��� ������� ������ � �� � ���
��� � ����"���
� 8 �� ��� ��� ������ ������������� �� ���� ����� 8/#;/��
8/�&)I�� &�I� ��� );#)� ��� ����� ���� ���� ��� ���� ���
������ �������������� ��� � ����� ��� ��� �� ������(�������
���������������������#�"��
� ��� ��� ����� *>>>�� ��� )������ ;���� � �� :���� �� 0);:3�
�������������������� �������������� �������������� �����
�������������������������� �� � �"�%����� �������������
!� �������� ����� �� � �� �� ��� ������� ��� ��� � �� �� ����
����� �� ��� >A=� �8"� � 9������ ��� ��� ��� ����� �� ������� ��
���� ����� ��� ���� ���������������� ����7��� ��"��
� �
� ;��������������<������������ ��� ������������"��
�
Efficiency Cost efficiency
���� ������� � ��� ���� ����� � �� �������� ��� � 8/#;/� ����
8/�&)I������������������������������(���� ����� ��������� ��
������������ �������� ���� �������������������"�#�� � ���7�����
������������� ��� ���������� ��� �������� ��������"�:����
��� ����� ������ ������������ ����� ����*>>=����*>>!� �� ���
��������� ���������*>>4"�)��������� ������������� �����
������������������(���������������������������-�������������
������ ����� 0�� ��� � ��������� ��� ������ ����3� ��� ��� ��#��
������ ��� ��#�� �� ����� ���� �� ��/)�����Q*"� ������ ��� ��#��
���� ���� �������������(����������������� � �"�:����������� ���
������ � �� ������� �� �� ��������� ����� ��� :������C ���� ��� (���
��������� ��� ���� ���� �� ��� ���� ������ ��� ������� ����
������ ����" � ��
Efficiency in implementation ���������� ������������ �����-� ��� �������� �������"�
Table 13.1 Lot wise implementation status
Lot No. Description of Package Completion of work 1 Road
Base camp Construction power Other preparatory & miscellaneous works
December, 2006 First phase of work completed consequent to which major work commenced and remaining work will continue till gestation period of the project.
2 400 kv double circuit transmission lines between Purulia – Arambagh. October 2006. 3 400 kv extn.bays at Durgapur and Arambagh 400 kv sub station. August 2006. 4 Main civil works. February 2007. March 2007 – December 2007.in phases 5 Hydro-mechanical equipment. February 2007. March 2007 – December 2007.in phases 6.1 Electro –mechanical equipment, pump/turbine,generator/motor & other
power house auxiliaries. February 2007. March 2007 – December 2007.in phases
6.2 GIS Sub station & generator. February 2007. March 2007 – December 2007.in phases 6.3 400 kv XLPE power cable February 2007. March 2007 – December 2007.in phases Commissioning: Unit: 1,2,3,4 Dec 2007, Sep 2007, June 2007, March 2007 (respectively)

180 Role of Infrastructure in Poverty Reduction
T E R I Report No. 2004 RD 24
;��������������<������������ ���� ��� ������������ � ����"��
Effectiveness
������� �������������� ��B����� ��������� ��������� �����"��
C������������7��������������� � ���������<�
�
)��������� ���) ����� ���;�� � �����0D3*=�<��4="=�
F���� ��������<�!������.����
������������<������(.����������������� ����� ���
��7 ����F���<� >>��8�
J��;���� � ������� ��<��4>>���8�.�����
G����������� ���� ��� ��������� �<� =>����.��.�����
�
;��������������<�J������ ��������� ������"��
Impact Beneficiaries at the construction phase
�������� ��������� � �� ��� ������������ ��������������������
��� ��� � ������� ��� � ��� ��� ������� � ��� ���� ���� ��� �����
������������������������"������� ������$� ���������� ���
����� ������� �� !>>>� �� ��� ��� ���(� ������� ��� �����"� :��
��� �������� �������������� �������� �������� ��������(����
����� ��� 8��� /�����*!"� �� �� ��������� �7����� ��� �������
������ ��� �� ���(���� ������ ��� ����� ������ �� � �����
���������� � ���������������������������� ��������������"�
� ����������������������� ��������� ������������ ���� ���
���������� ����������� ��� ���������� ������������ ���
�����"��
������;���� ������ ��� �� ������� ��� ��� ���� ��� ��� ��#��
������ ���� ���������� ��� ��� ��� ������������ ������ ���
������� ����"� #���� ��� ��� ������������ -� ������ �� ����� ���
������ �������������������<��
�� ����� ���� ������-���� ������������� ��� ������� ��� ���
����� ������������������ ����� � ���
��F������� ����������� ���� �� ����������� � � �����������
���� ������������ �������������������������������
�� #���������� ��� ��������������������������$���������
��������������������� ������� ���� �������� ����� � ���
�
� ����������7���������#�������������������������� �������
���� ��������������� ��� �����������<��
�� #������
��C��� ���
�����(��������7�
�������0������ ��3�
25 )��������� ���) ����� ���;�� � �����0D3�P�0J������� � ��.�;���� � �������������� ��3�R��>>"��� �� � ����� ������ �������������������������������������" 26 �������������������������?>D�� ���������� ��"�:�����A>D���������������������� �����������!D���������� �����(.��������"

181 Role of Infrastructure in Poverty Reduction
T E R I Report No. 2004 RD 24
� �� �� �7����� ��� ������ �� ��� ��� � �����������������
�������� �������� � ����������� ��� ���� ��� ��� ����� ����� �����
��������������������"��
� �� �� ��������� ��� �������������� ��� ��� ��� ���� ��� ���
� ���������� � �������������� ������������������ ������������
� ��� � ���������������� � �"�8���������� � �� ����� ����������
������� ������ ��� ���������������������������"������������� ��
������ ��� ��� � �� ����� ��� � ���� ��� ��� � ����� ��� ��� ���
�������������������� �����������������������"���
� :���� ������ ������ �����#��� ����������������� � � ��� ���
����� ����������������(��������������+������� �� �� ������ � ��"�
�� ������������� ��� ������������������������������� �����
��� �������������"�
� ���������� ������������������$��� � ��� ����������������
����������� ������<��
�� : ���������������������������������������� ������
�����(��������7�
�� �������� ������ �� ��� ��� ���� ��� ��� ���� ���� ������
0����� �7 � ��� � ������ ����� ����� ����� �������� ���
� �� ���������3�
�� ��������� �� ������� �������� ������ ������ �� ����� ��� ��
������������������������������ ������������������������
�������
�
� /�� �������������������������� ������� �������������������
������ ����� ������� ����� ��"� ���� ������� ��� ����� ���� �� ���
������� �� ���������� ���� ������ ������������ ��� �����
��������������������"��
� &�� ��� ����� ����� � ���� ������ ���� �� ���� �� �� �� �����
��� ��"��
Environmental impact
���� ������� ���� ���� ��� ��� ��������� ���������� ����� ���
� � �������;�� ����������9������0��;93� ��F������� 6"�:�
��� � �������������������*6*"?*�����������������������$� ���
�������������B������$���������� ������?>"4*�����������������
�����������$� ��"��&�� ����������� �������"��
��
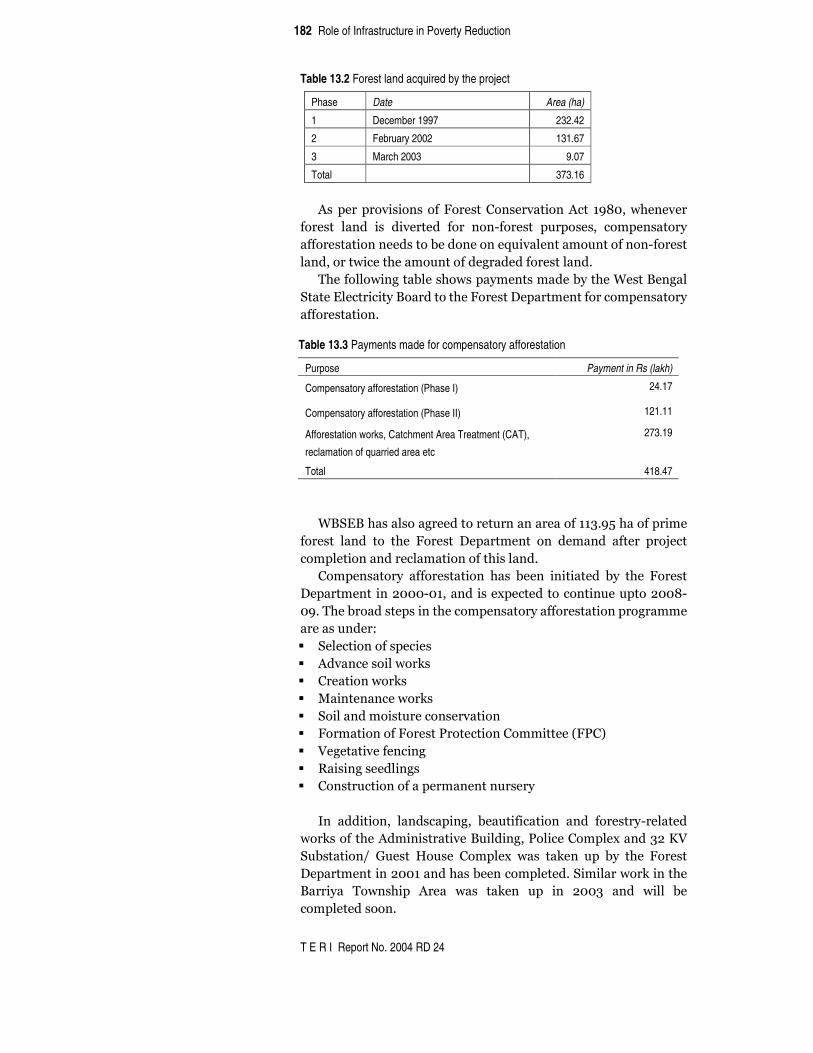
182 Role of Infrastructure in Poverty Reduction
T E R I Report No. 2004 RD 24
Table 13.2 Forest land acquired by the project
Phase Date Area (ha)
1 December 1997 232.42
2 February 2002 131.67
3 March 2003 9.07
Total 373.16
� :���������� � �������9�����)������� ���:�� � A>�����������
������ ���� �� ����� ���� ���-������ ���������� ������������
�������� ���������������������$� ������������������-������
��������� ������������������������������"��
� ���������� ��������������������������������8���/������
#���;���� � ��/���������9�����&������������������������
�������� ��"��
Table 13.3 Payments made for compensatory afforestation
Purpose Payment in Rs (lakh)
Compensatory afforestation (Phase I) 24.17
Compensatory afforestation (Phase II) 121.11
Afforestation works, Catchment Area Treatment (CAT),
reclamation of quarried area etc
273.19
Total 418.47
�
� 8/#;/�������������������������������������6" =��������� ���
������ ���� �� ��� 9����� &�������� ��� ����� ����� �������
������ ������������� ������� �����"��
� )����������� �������� ������������ � ������ ��� 9�����
&�������� ��*>>>->������ ���7���������� ��������*>>A-
> "��������������� ������������������������� �������������
�����������<��
��#���� ���������� ���
��:�������� �����(��
��)��� ������(��
���� �����������(��
��#� ������� ������������� ���
��9���� ������9���������� ���)��� ���09�)3�
��G���� ������� ���
���� � ������� ����
��)������ �������������������������
�
� ��� � ���� ������� ���� ���� � �� ��� ��� �������-������
���(��������:� � ��� ���/� � ������� ���)�����7����6*�'G�
#���� ��.� ����� C����� )�����7����� �(��� ������ ��� 9�����
&�������� ��*>>���������������������"�# � �������(� �����
/��� ��� ������ �� :���� ���� �(��� ��� �� *>>6� ��� � ��� ���
������������"��
�

183 Role of Infrastructure in Poverty Reduction
T E R I Report No. 2004 RD 24
;��������������<��������������������� ������ ��� ���������
� � ������ ������ ��������� ����"��
�
Sustainability ����� ������� �� ��� ��� ����� ����B� ��� � �� ������� �� ���
���� �����"� �8���������������� ������������� ������ ���������
���� ��� � �<��
�� # ��������������� �� �� �������(���������� � �� ����������
� ����������� ��� ������ � � ���������������� ����� ������
����� �������� ����������� ������� ���������0����������
���������� �� ���� ��3"� �� �� �� ���� ���� ����� ����� ��
��� ���� ������ �� ��� ��� ���������� ���(�� ��� ���
����� ��������������� ��������������� ������������"��
�� ;��-��� ��� �� � ��� ��������� � ����� ����������� ��� ���
�������������������"���� �� ��������������������� ���
������ �������� ������ ������������� ��������"��
�� # ��������� �������������������������� �������������������
���� ��� � ��� �������������������������� �����������
��������������������� ���������� ����������"���
�� ����������� �� �7������������� �� � ���� �� �� �������� ��
��� ���������������������� ������������� � ��
�
;��������������<�J������ ��������� ������"��
�
Beneficiary views :�������������7��������� � ���������� ��������������� � ����
������ ��0��� �������� ������� ������ � � ���������������� �3�"��
���� ����������� ��� ���������� ���� �������� *>=� ����� ���
�����!!">������������������������������������"��
Socio-economic profile of the sample
&��� ��� ������ ������ ��� ��� ��� ���������� ������ �� �� ���
����������"������� ������������������������<��
�� ����������� ������������� ������������=������� ��4��������
� �������������������������66"=�������������������4>D����
��������������� ��� �����������*�-?>������"�
�� :����*4��������������������������������������������*�
������������� ��������������������������6��������������
�� *�D� ��� �������������� ���?� �� �AD����������"�F�� ���
���������������*?���������������������*����6��������
������������������������� D�� �����������������"��
�� :���� ?>D� ��� ��� ���������� ������� �� �� �� �����
������ ��� ���� ��� �� ���� �� ��� ����� �AD� ����� �������
�� ���� ����������� ������� ����������������������� ����"��
�� :���� ==� ������� ��� ��� ���������� ������� ��� ��������
������� ������������������*>>>��� ����������6!M��������
�����������*>>>-=>>>"���

184 Role of Infrastructure in Poverty Reduction
T E R I Report No. 2004 RD 24
Table 13.4 Profile of respondents
Number of respondents Percent
Age of respondents
<15 years 0 0.00
15-20yrs 20 9.76
21-25yrs 31 15.12
26-30yrs 44 21.46
31-35yrs 38 18.54
36-40yrs 31 15.12
41-45yrs 13 6.34
46-50yrs 13 6.34
>50yrs 15 7.32
Total 205 100.00
Primary family occupation
Factory worker 0 0.00
Business 38 18.54
Daily wage labourer 36 17.56
Cultivation 81 39.51
Clerk 6 2.93
Teacher 9 4.39
Service 12 5.85
Pension holder 1 0.49
Bank interest 0 0.00
Carpenter 4 1.95
Computer operator 0 0.00
Agriculture 17 8.29
Self-employed 1 0.49
Driver 0 0.00
Total 205 100.00
Average monthly earning (Rupees)
1-2000 112 54.63
2001- 5000 73 35.61
5001-8000 10 4.88
8001-10000 8 3.90
10001+ 0 0.00
Don’t know/cant say 2 0.98
Total 205 100.00
Impact of the project on access to electricity in the survey area Provision of electricity
:����� ���� � � ����� �������� ��� ������� �� ����� � �� �����
������� ���������B���������� ���� ��� ��� >D� ������� ��� ����
������������������ � ��������������������������$� ��"��
��

185 Role of Infrastructure in Poverty Reduction
T E R I Report No. 2004 RD 24
�
Table 13.5 Provision of electricity before the project
Number of respondents Percent
Yes 203 99.02 Was there the provision of electricity in your
locality in past No 2 0.98
Total 205 205
Yes 201 98.05 Do you consume less power than what you would
normally require No 4 1.95
Total 205 100.00
Hours of electricity use
:����!*����������������������������������������4����*>�
������ ��� ����� � ��������������������� ���������"� ����� � ������
������� ��� ����� � �� �� ��� ������ ��������������� ��� ����������
��������������� �����������������������������������������
��"� ;7�������� ���(� ��� ��� ���������� ���� ������ ���� �4-*>�
������������� ������� ���������"������������������� ��������� ��
������������ ������������ ��������� � �� ��������������������( ������
���� ���������������� �����"����
Hours of electricity usage
3% 14%
62%
21%Upto 1213 - 1617 - 20 More than 20
Payments for electricity use
/������ ��� �������� ����� !*D� ��� ��� ���������� ����� ��� ��������
����>>-*>>������������������� � ����� ��������**�������������
��� ���������������=>>"�:��������������� AD���������������
������ ���������������=>>�0�������6"!3"�C�������� � �� �� ������
������� ��� �������� ��������������� ���������� � ����������
������������������ � � ����������������������� ������ ��
������"���

186 Role of Infrastructure in Poverty Reduction
T E R I Report No. 2004 RD 24
Table 13.6 Monthly electricity bill before and after the project
Number of respondents Percent Monthly bill before the project (Rs) <100 12 5.85 100-200 106 51.71 201-300 30 14.63 301-400 8 3.90 401-500 2 0.98 >500 47 22.93 Total 205 100.00 Monthly bill after the project (Rs) <100 0 0.00 100-200 3 1.46 201-300 0 0.00 301-400 0 0.00 401-500 0 0.00 >500 202 98.54 Total 205 100.00
Applications of electricity ����������������������������� � ������� �� ���������� ���
������ ���� � ����� ���� �������� ���� � �� ���� ���������� �� ���
����� � �� ���� � �� ��� ������� ��� �������� ��� ���� ?� �������
�� ��� ��������� �����������!4���������������� � ���"���
�
Table 13.7 Applications of electricity before project
Employment created by the project
��������������� �������������������� D�����������������
�� ����������� ������� ���0�������6"A3"����������������������
���������� ���� �� �� ��� ������� ��� ��� �� ����� �-A>>"�
:���� 6A� ������� ������� ��� ���� ��� 6>>-?>>� ���� ���
������������ ��������6��������� ���������� �������4>>-
A>>�������������������� ���������� ��"��
��
Number of respondents Percent
Applications before the
project
1 Light 156 100.00
2 Fan 147 94.23
3 TV 105 67.31
4 Refrigerator 7 4.49
6 Any other 4 2.56

187 Role of Infrastructure in Poverty Reduction
T E R I Report No. 2004 RD 24
Table 13.8 Employment during construction
Number of
respondents Percent Yes 39 19.02 Did the project provide
employment to any member during construction No 166 80.98
Total 205 100.00
Table 13.9 Number of days of employment provided by the project
Number of
respondents Percent
Number of days of employment
during construction phase
1-100days 1 2.56
101 thru 200days 5 12.82
201 thru 300days 4 10.26
301 thru 400days 15 38.46
401 thru 500days 1 2.56
501 thru 600days 1 2.56
701 thru 800days 12 30.77
Total 39 100.00
Improvements in the social and economic environment due to the project
���� ���������� ����� ��(�� �� ���� �� �� �� ������ ��� ���
����������� �� ������ ������������ �� ������������ ���� ��
����� ������������������������"��
� �������������� ��� � ������������� ���������������������
������������� ������ ?�D� ����� ��� ��� ���������"� �!D� ���
���������������������� ����� ���������� �����(����� � ��"�
:������ �������� ����04*D3���������������������������� ���
�����"��
� �� �� ���������7������ ���"��������������������� ��������� �
���7��������������������� ����������� ����������������
������� � �� �� ��� � ��� �������� ��� ���� ���� ��� �������
���������"����� �������� (����������(�������� �������� ���������
�������������������� ��������� ��� ���� ���� ��� ������� ���
������ ��� ������� ��� ������ ��� � ����� ������� ��� �������
0������� ���� ������� ��� �������� �� ��� ������� ����� ���� ���("��
���� ���������� ����� �� �7����� ���� ��� � ���� (�� �������� ���
���� ���� �� ��� ��� ������� ��� ����"� ������ ��� � ��� ���
����������������������� ������� �������������� �����������
������ ������������� �����������������"������������ ��I�����
���������� ��� � ���� 0I���3� �(�� �� ����� ������� ��"� :��
��� �-������ ����� ���� ��������������������������������
��� � �� �� �������� �� ������� ������������ ��� I���"� �� ��
��� (������������ ���������� ��I����� ���������������� ���

188 Role of Infrastructure in Poverty Reduction
T E R I Report No. 2004 RD 24
������� ��� ������ ��� �7������� ������ ���� ���������������
� ������������������������ ���������"��
� # �� � �������4*D���������������������� ����������������
������� ��� ����"� ������������ ����������������� ����� �������
��� ���������������������������"��C ��� ���.������������������
������������������������"���������� ���� ��� ������ �����������
�� ��� �� ���������� ��� �� 1������������ �������� ���
���������2"�
Table 13.10 Improvement in social and economic infrastructure due to the project: perceptions
Number of respondents Percent
Yes 83 40.49 Improvement in
the transport
infrastructure No
122 59.51
Total 205 100.00
Yes 8 3.90 Improvement in
the medical
facilities No
197 96.10
Total 205 100.00
Yes 10 4.88 Improvement in
the schools No 195 95.12
Total 205 100.00
Yes 33 16.10 Improvement in
the markets No 172 83.90
Total 205 100.00
Yes 1 0.49 Improvement in
the local
government
institutions
No
204 99.51
Total 205 100.00
020406080
100
Yes No Yes No Yes No Yes No Yes No
Transportinfrastructure
Medicalfacilities
Schools Markets LGI
Improvement in Infrastructure category
Per
cent
age
of
resp
onde
nts
� �

189 Role of Infrastructure in Poverty Reduction
T E R I Report No. 2004 RD 24
Annexure 13.1: Staffing pattern (Construction stage)
Engineering Officers Non-engineering Officers Technical staff Non-technical staff
Sanctioned 140 14 31 140
Re-assessed 82 14 31 140

T E R I Report No. 2004 RD 24
Annexure 13.2: Financial statement
( Rs. in Lakh )
Terminal Date of Disbursement of External aid
Estimated Cost
Sl. No.
Name of Project
Nature / Location / Code No.
Name of External funding Agency
Date of Sanction / Date of Commencement of Work Original
Revised Original Revised
1 2a 2b 2c 3 4 5 1. Purulia Pumped Storage
Project ( 900 MW )
Pumped Storage Hydro – Electric / P.S. Bagmundi Dist. Purulia West Bengal / ID-P.98 dated 28.02.95
Overseas Economic Co-operation Fund
12.04.95
12.04.2003 -
145656 318890 ( 107150 MY )
IX Plan Provision ( 1997 – 2002 ) Actual Expenditure State Share Central Assistance OECF
Pattern Of Funding State Share Central Assistance Others ( OECF )
Cumulative Exp. Upto Annual Plan 1991 – 92 State Share Central Assistance OECF
Approved Anticipated
1992 - 1997 State Share Central Assistance OECF
1997 - 1998 State Share Central Assistance OECF
6 7 8 (a) 8 (b) 9 10 56920 ( 19125 MY ) c) 261970 ( 88025 MY )
Nil 40380.00 c) 201880.00
36440.00 c) 187830.00
344.03 c) 1604.48
122.03 c) 963.83
Annual Plan 1998 – 99 Proposed Outlay Approved Anticipated 1999 – 2000 State Share Central Assistance OECF
State Share Central Assistance OECF
State Share Central Assistance OECF
Remarks
11 12 13 14 264.00 c) 3216.00
730.00 c) 14710.00
850.00 c) 4880.00
OECF loan approved in 1st tranche upto 1998-1999 is 20520 MY.
N.B. Exchange Rate : Re. 1 = 3.36 Yen

T E R I Report No. 2004 RD 24
Annexure 13.3: Lotwise expenditure as on 29 March 2005 (Provisional) �
Estimated Awarded Expenditure Expenditure from TotalCost Cost up to April 2004 to Expenditure
31-Mar-04 29-Mar-05
S. No. Lot No. Description
(in crore) (in crore) (in crore) (in crore) (in crore)1 Lot-1 Infrastructure 139.00 100.47 103.97 22.722 PPSP-Arambag
Lot-2.1 400 kV Tr. Line
164.60
PPSP-Durgapur
Lot-2.2 400 kV Tr. line
254.30
161.06
27.66 42.57
3 Lot-3 400 kV Extension Bays at Durgapur and Arambag
40.10 10.617 Nil Nil
4 Lot-4 Main Civil Works 556.70 707.29 387.00 217.595 Lot-5 Hydro-mechanical 393.50 143.92 36.39 45.75 equipment 6 Lot-6.1 Electro-mechanical equipment
361.26 51.80 5.67
7 Lot-6.2 400 kV Switchyard and Power Transformer
972.90
101.50 12.52 1.31
8 Lot-6.3 400 kV XLPE Cable 37.794 Nil 3.829 Consulting Services 35.30 28.68 17.19 6.8310 IDC 227.90 19.47 10.1111 JBIC
Component 2619.70
656.00 356.37
12 Non-JBIC Administrative Cost 114.00 Component Land Cost 0.40 Taxes & Duties 454.80
18.94 15.77
GRAND TOTAL 3188.90 674.94 372.14

T E R I Report No. 2004 RD 24
Annexure 13.4: Budget and disbursement figures
STATEMENT SHOWING QUARTER-WISE KEY MILESTONES ACHIEVED DURING THE YEAR 2003-04
(Amount in INR)
S. No. Milestone Description 1 Quarter II Quarter III Quarter IV Quarter Annual
JBIC
4340 lakh 4120 lakh 8860 lakh 6470 lakh 23790 lakh 1 Anticipated
Expenditure
[according to
Revised Estimate
(RE)]
Non-JBIC 280 lakh 470 lakh 500 lakh 1150 lakh 2400 lakh
Total: 26190 lakh
JBIC 5386.95 lakh 5764.95 lakh 9033.12 lakh 10167.91 lakh 30352.81 lakh 2 Actual Expenditure
Non-JBIC 269.80 lakh 82.38 lakh 66.57 lskh 246.88 lakh 665.83 lakh
Total: 31018.64 lakh
(Achievement: Plan Budget + 18.4%)

193 Role of infrastructure in poverty reduction �
T E R I Report No. 2004 RD 24
STATEMENT SHOWING QUARTER-WISE KEY MILESTONES TO BE ACHIEVED
/ACHIEVED DURING THE YEAR 2004-05
(Amount in INR)
No. Milestone Description 1 Quarter II Quarter III Quarter IV Quarter Annual
JBIC
6170 lakh 8750 lakh 8263 lakh 23307.7 lakh 46485.7 lakh 1 Anticipated
Expenditure
[according to
Revised Estimate
(RE)]
Non-JBIC 575 lakh 570 lakh 600 lakh 579.3 lakh 2324.3 lakh
Total: 48810 lakh
JBIC 7806.96 lakh 6202.55 lakh 9211.92 lakh 12415.78 lakh* 35639.21 lakh* 2 Actual
Expenditure Non-JBIC 402.89 lakh 113.99 lakh 186.87 lskh 873.25 lakh* 1577.00 lakh*
Total: 37214.21 lakh
(Achievement: 76.24%)
*Up to 29 March 2005 (Provisional)

194 Role of Infrastructure in Poverty Reduction
T E R I Report No. 2004 RD 24
Annexure 13.5: Calculation of FIRR and EIRR Computation of financial internal rate of return (FIRR) for PPSPSent out energy (MU) 1700 MUEnergy required for pumping 2206 MUSelling rate 4.2 Rs./unitOff-peak rate of pumping 1.81 Rs./unit
Year Fiscal Year CAPITAL
COST
INCL. IDC
AND
TAXES
AND
DUTIES
O&M COST INCL. EMPLOYEE'S COSTAS PERCERC's REGULATION
COST OF
ENERGY
FOR
PUMPING
TOTAL
CASH
OUT
FLOW
ENERGY
SALE
(MU)
TARIFF
(Rs./Unit)
REVENUE TOTAL
CASH IN
FLOW
NET CASH
IN FLOWUpto 2003 6562 6562 0 -6562
2004 3901 3901 0 -39012005 10002 10002 0 -100022006 4573 4573 0 -4573
1 2007 3018 445 3993 7456 1700 4.2 7140 7140 -3162 2008 999 463 3993 5455 1700 4.2 7140 7140 16853 2009 606 482 3993 5081 1700 4.2 7140 7140 20594 2010 501 3993 4494 1700 4.2 7140 7140 26465 2011 521 3993 4514 1700 4.2 7140 7140 26266 2012 542 3993 4535 1700 4.2 7140 7140 26057 2013 564 3993 4557 1700 4.2 7140 7140 25838 2014 587 3993 4580 1700 4.2 7140 7140 25609 2015 610 3993 4603 1700 4.2 7140 7140 2537
10 2016 634 3993 4627 1700 4.2 7140 7140 251311 2017 659 3993 4652 1700 4.2 7140 7140 248812 2018 685 3993 4678 1700 4.2 7140 7140 246213 2019 772 3993 4765 1700 4.2 7140 7140 237514 2020 740 3993 4733 1700 4.2 7140 7140 240715 2021 770 3993 4763 1700 4.2 7140 7140 237716 2022 801 3993 4794 1700 4.2 7140 7140 234617 2023 833 3993 4826 1700 4.2 7140 7140 231418 2024 866 3993 4859 1700 4.2 7140 7140 228119 2025 901 3993 4894 1700 4.2 7140 7140 224620 2026 937 3993 4930 1700 4.2 7140 7140 221021 2027 974 3993 4967 1700 4.2 7140 7140 217322 2028 1013 3993 5006 1700 4.2 7140 7140 213423 2029 1054 3993 5047 1700 4.2 7140 7140 209324 2030 1096 3993 5089 1700 4.2 7140 7140 205125 2031 1140 3993 5133 1700 4.2 7140 7140 200726 2032 1186 3993 5179 1700 4.2 7140 7140 196127 2033 1233 3993 5226 1700 4.2 7140 7140 191428 2034 1282 3993 5275 1700 4.2 7140 7140 186529 2035 1333 3993 5326 1700 4.2 7140 7140 181430 2036 1386 3993 5379 1700 4.2 7140 7140 1761
CASH OUTFLOW (MILLION RS.) CASH OUTFLOW (MILLION RS.)

195 Role of infrastructure in poverty reduction �
T E R I Report No. 2004 RD 24
Computation of economic internal rate of return (EIRR) for PPSP
Sent out energy (MU) 1700 MUEnergy required for pumping 2206 MUAverage peak tariff 4.2 Rs./unitMax rate of ________ 5.7 Rs./unitOff-peak rate of pumping 1.81 Rs./unit
Year Fiscal Year CAPITAL
COST
INCL. IDC
BUT EXCL.
TAXES
AND
DUTIES
O&M COST INCL. EMPLOYEE'S COSTAS PERCERC's REGULATION
COST OF
ENERGY
FOR
PUMPING
TOTAL
CASH
OUT
FLOW
ENERGY
SALE
(MU)
AVERAGE
PEAK
TARIFF
(Rs./Unit)
REVENUE EMPLOYM
ENT
BENEFIT
TOTAL
CASH
FLOWUpto 2003 6172 6472 204 204
2004 3791 3791 204 2042005 8133 8133 204 2042006 3680 3680 204 204
1 2007 2440 445 3993 6178 1700 4.2 7140 204 73442 2008 820 463 3993 5276 1700 4.2 7140 204 73443 2009 505 482 3993 4980 1700 4.2 7140 204 73444 2010 501 3993 4494 1700 4.2 7140 204 73445 2011 521 3993 4514 1700 4.2 7140 204 73446 2012 542 3993 4535 1700 4.2 7140 204 73447 2013 564 3993 4557 1700 4.2 7140 204 73448 2014 587 3993 4580 1700 4.2 7140 204 73449 2015 610 3993 4603 1700 4.2 7140 204 7344
10 2016 634 3993 4627 1700 4.2 7140 204 734411 2017 659 3993 4652 1700 4.2 7140 204 734412 2018 685 3993 4678 1700 4.2 7140 204 734413 2019 772 3993 4705 1700 4.2 7140 204 734414 2020 740 3993 4733 1700 4.2 7140 204 734415 2021 770 3993 4763 1700 4.2 7140 204 734416 2022 801 3993 4794 1700 4.2 7140 204 734417 2023 833 3993 4826 1700 4.2 7140 204 734418 2024 866 3993 4859 1700 4.2 7140 204 734419 2025 901 3993 4894 1700 4.2 7140 204 734420 2026 937 3993 4930 1700 4.2 7140 204 734421 2027 974 3993 4967 1700 4.2 7140 204 734422 2028 1013 3993 5006 1700 4.2 7140 204 734423 2029 1054 3993 5047 1700 4.2 7140 204 734424 2030 1096 3993 5089 1700 4.2 7140 204 734425 2031 1140 3993 5133 1700 4.2 7140 204 734426 2032 1186 3993 5174 1700 4.2 7140 204 734427 2033 1233 3993 5226 1700 4.2 7140 204 734428 2034 1282 3993 5275 1700 4.2 7140 204 734429 2035 1333 3993 5326 1700 4.2 7140 204 734430 2036 1386 3993 5379 1700 4.2 7140 204 7344
CASH OUTFLOW (MILLION RS.) CASH OUTFLOW (MILLION RS.)

196 Role of Infrastructure in Poverty Reduction
T E R I Report No. 2004 RD 24
CHAPTER 14 West Bengal Transmission System Project �
Project and loan profile �������������� ������ ���������� ��1������������� �� � �����
����� �� ��� ������� ��� �� ��(�� ��� � ��� ���-����������
����� �� ������� ������� ��� �������������� ����� �� ���
�����(� ��� �������� ���� ����� ���� ��� �7���� �7 � ���
����� ���� ����������������� ����������������� ��������
��� ������ ��� ����� �� �� ��� ��� ������ �� ��� ���� ��� 8���
/�����"2� � ��� � ���� ���� ��� �� ����� �� ��� ������� ���
������������� ��� ������� ����"�
� ���������������������� �������� ������ ���� �������� ��
8���/�����"� ������ ����8/#;/��8/�&)I��&�I�0 �� ��� ����
�����3��&G)� ����������������������J��)������)�I� �����
�����������������);#)����&�#)� ������� ���������"�
� :�� ���� ��� &�� ��� ������� ������ ��� ��� ������ �� ���
#������������� �������������� ������ �� ��������� ����K&�
��� � ��� ������������������ �����������������0?=A4�
�8� ��*>>�->*3"�;�������������������������� �������� ���
������������ ��������������� ������(��������� �� ����������
����� � ����������(�������������������������� ��"��
� ���������� ������������ ���������@/�)�������������������<��
�
���������<�I:���"��&����4��*=-*- 4<���>A4�� �� �������
&�������������<�* -=->?�
�
*��������<�I:���"��&���?6���>-=->*<�6�*4�� �� �������
&�������������<�*-A-> �
�
0������������������� �����!"6��� �� ��"3�
�
Status ����������� ���������� �����"��
�
Evaluation of the project �
Relevance ���� ���������� ��� 8��� /������ ���� ������ �>>D� ������
����� � �� ��� ��� ��� ��� ��� *>>4"� � � �� �� �� ����� ��� ���
���������� ��� �� �� :� ��� ����� �� ����� ��� ����������� ���
������ ����� � �� ��� �� ��� ������"� �� �� :� ��� ����� ����
������� ��� #��� ����������� �� ����������� ��� )� ���
� � ����.� ������ � � ����� ��� ������ 6�� *>>�"� *4����
������ �� ���#������������ ���7����������� ������������
*4���<..� �"� �" �.������.����*>>�.����*>>�.��6>4*>>��"����08��� ������������������ ���/���������������������� �B�:�������*4-*->!3��

197 Role of infrastructure in poverty reduction �
T E R I Report No. 2004 RD 24
����� � �� ��� ������� �������� ����� �� ��� ��� �� � �"� ����
�������������������� � �� ��� ������������������������������
;���� � �� ����� ��0�;�3"������;�� ���� ����������������
��� ���� ������+��*A������ � �� � ����������������������
���� �����+���0�7�������������������3"���������� ���;�� ��
�� �������������������������������� �� ���������������
�� ��� �� ��� ������� � � �� ��� ��� ������ ;���� � �� ���
&�������"���������������� ��&�������� ��������� ��������
��( ��� ����� � �� ��� ������ �� ������+��"� ���� ������ �� ���
#����� ������� ���� ���� ����� � ������ ���� ���� �� ���
���������;�"�������;��� ����������*>>�-*>>=��������� �� ��
���� ����������"������ ����������*>>!����*>>4�������������
� ������E�� ���>>D������ � �� �������������*>>4"��& �� �-
� ���� �������������������� �� �����:���7������� ��������"��
�
Figure 14.1 RER in West Bengal
Note: Figures pertaining to any year refer to status on 31st March of that year (The financial
year used for reporting purposes in India is April-March). In certain districts, some
electrification has been achieved through non-conventional means, such as through
renewable energy sources. (Source: Rural Electrification Department, Government of
West Bengal)
;��������������<������������ ��� ������������"
Efficiency ������ � ���������������������������� ������6*������ ����
���*=������ �� ���� ���"�F�������� ��������������� �� ���
� ���������������������� � ����������������B�������� �����
�� � ���������������������"��
*A�:����+�� ��������������������-���-�� � ��� ����� � ��8���/������������������� ��������������������� ������"���
RER IN WEST BENGAL
70
75
80
85
90
95
100
2001 2002 2003 2004 2005 2006 2007
Year
RE
R (%
)

198 Role of Infrastructure in Poverty Reduction
T E R I Report No. 2004 RD 24
� �������������������������7��� ���� ������ �������<��
Table 14.1 Annual Project Expenditure
Fiscal Year Foreign Total Cost
(Rs million)
Local Total Cost
(Rs million)
1997 – 98 25 4.6
1998 - 99 104 21.1
1999 - 00 381.7 2
2000 - 01 447.7 7.2
2001 - 02 1427.1 16.5
2002 - 03 1143.2 62
2003 - 04 484.3 49.1
2004 - 05 363.6 38.9
��
� ���� �� ���� 0�� � ���3� �7��� ���� �� ���� �� ������
0 ������������ ������������ �� ���� ���3<�
Table 14.2 Expenditure by Fiscal Year
Fiscal year Expenditure (Rs million)
1996-97 788.73
1997-98 1806.71
1998-99 2546.94
1999-00 2500.25
2000-01 1633.26
2001-02 456.23
(Figures quoted from the Detailed Project Report)
�
� ���������� ������������ �����-� ���������������(�����I�����
���*�0����� �� ���� ���3<��
�

199 Role of infrastructure in poverty reduction �
T E R I Report No. 2004 RD 24
Table 14.3 Lot-wise scope of work (Lot 1& 2)
Transmission Lines:
No. Line Section Month of Commissioning (Original
completion target)
Lot-I
400 KV
1 Lilo of Kolaghat TPS – Durgapur 400 KV S/C at Arambag September 2003 (June 2001)
200 KV
1 Arambag – Rishra November 2003 (Oct 2001)
2 Lilo of 1 CK of STPS – Howrah D/C line at Arambagh February 2003 (Feb 2001)
3 Lilo of STPS – Howrah D/C line at Domjur September 2003 (June 2001)
132 KV
1 KTPS - Uluberia May 2003 (Feb 2001)
2 Lilo of 1 CKT of Midnapur – Ballichak D/C line at Pingla April 2003 (Oct 2001)
3 Extension of Adisaptagram – Belmuri D/C line to Arambag via
Tarakeswar
June 2003 June 2001)
4 Lilo of BTPS – Rishra 132 KV line at Chanditala July 2003 (Feb 2001)
5 Lilo of BTPS – Howrah 132 KV line at Lilooah January 2004 (June 2001)
6 Arambagh – Birsingha October 2001 (Oct 2001)
7 Domjur - Uluberia February 2004 (June 2001)
8 Domjur - Jangipara October 2003 (Oct 2001)
9 Laxmikantapur - Falta April 2002 (June 2001)
10 Lilo of 1 CKT of BTPS – Bidhannagar 132 KV line at Khanyan October 2003 (June 2001)
Lot-II
132 KV
1 NBU/NJP – Dalkhola S/C line with Lilo at TCF June 2003 (June 2001)
2 Jeerut - Bongaon March 2002 (Feb 2001)
3 Lilo of 1 CKT of Malda – Raigunj 132 KV D/C line at Samsi January 2002 (Oct 2001)
4 Barasat - Basirhat August 2002 (Oct 2001)
5 New Jalpaiguri – Moinaguri - Birpara December 2002 (Oct 2001)
6 New Jalpaiguri - Siliguri June 2003 (N.A.)
7 Krishnagar - Bongaon April 2002 (Feb 2001)
8 Lilo of Raigunj – Balurghat 132 KV S/C line at Gangarampur December 2001 (Oct 2001)
9 Lilo of 1 CKT of Sainthia – Gokarna 132 KV D/C line at
Rampurhat
February 2002 (June 2001)
10 Lilo of BTPS – Bidhannagar 132 KV D/C line at Mankar February 2002 (Oct 2001)
���������� ������������� ��� ������ ������������������(�
�����I���6����?�0����� ���3<�

200 Role of Infrastructure in Poverty Reduction
T E R I Report No. 2004 RD 24
Table 14.4 Lotwise scope of work (Lot 3)
No. Name of Sub-station (Lot 3) Month of Commissioning (Original
planned)
1 Midnapore 220/132 KV Feb. 2003 (Oct 2002)
2 Domjur 220/132 KV Jul. 2003 (Feb 2003)
3 New Haldia 220/132 KV Dec. 2004 (N.A.)
4 Rishra 220/132 KV Dec. 2003 (Feb 2003)
5 Uluberia 132/33 KV May 2003 (Oct 2002)
6 Kolaghat 132 KV (Extn) Dec. 2001 (Oct 2002)
7 Pingla 132/33 KV Apr. 2003 (June 2003)
8 Tarakeswar 132/33 KV Mar. 2003 (Oct 2002)
9 Chanditala 132/33 KV Feb. 2004 (Oct 2002)
10 Lilooah 132/33 KV (Extn) Jun. 2002 (Feb 2003)
11 Birsingha 132/33 KV May 2005 (N.A.)
12 Raina 132/33 Dec. 2002 (June2003)
13 Haldia 132/33 KV (Extn) Aug. 2001 (Feb 2003)
14 Jangipara 132/33 KV Jan. 2005 (N.A.)
15 Mankar 132/33 KV Oct. 2002 (June 2003)
16 Falta 132/33 KV (Extn) Aug. 2001 (Feb 2003)
17 Khanyan 132/33 KV Oct. 2003 (Feb 2003)

201 Role of infrastructure in poverty reduction �
T E R I Report No. 2004 RD 24
Table 14.5 Lotwise scope of work (Lot 4)
No. Name of Sub-station (Lot 4) Month of Commissioning
(Original planned)
1 Arambagh 400/220 KV May 2005 (N.A.)
2 Jeerat 132 KV (Extn) Dec. 2001 (Oct 2002)
3 New Jalpaiguri 220/132 KV Sept. 2003 (June 2003)
Laxmikantapur 132 KV (Extn) Jun. 2002 (Feb 2003) 4
Laxmikantapur 220/32 KV Jan. 2005
5 Bongaon 132/33 KV Mar. 2003 (Oct 2002)
6 Samsi 132/33 KV Nov. 2003 (June 2003)
7 Basirhat 132/33 KV Jan. 2003 (June 2003)
8 Barasat 132/33 KV (Extn) Aug. 2001 (June 2003)
9 Siliguri 132/33 KV Sept. 2003 (Feb 2003)
10 Moinaguri 132/33 KV (Extn) Oct. 2001 (June 2003)
11 Birpara 132/33 (KV) Dec. 2001 (June 2003)
12 Krishnagar 132/33 KV Jan. 2003 (Oct 2002)
13 Gangarampur 132/33 KV Oct. 2002
14 Rampurhat 132/33 KV Oct. 2002 (Feb 2003)
� ���� ������ ������ ������� � ���� ��� ���� �������� ��� ���
����� ���� ������6����?��������������� �� ������������
�������"��������������=>D��������� ���� �����6����4=D����
����� ���� �����?������������ �� �� ���������� ����������
�� � �������� �� �� ����������"�F������������������������
����� ������ �� ���� �� �� ��� ��� ����� �� ��� � ����� ��� ���
���� �������������"��
��
;��������������<������������ ��� ������������ � ����"���
�
Effectiveness ���� 8/#;/� ���� ������� ������ �� �)������ ��� ��� �� ��
� �� ��� ��(� ��� ����� �� ���F���� ��� ��� ;����� �� ������
0FK;�3��������������������� �������� �������������������"�
�� �� �7��� ��� �� �7����� �� ��� �������� ��� :�� �� *>>!"�
/�� ����������� ��� ��� ���� ���� ���� � �� ���� ��� �� �����
��������������. ������ ������ �$� ����� ������� �� ������
� ���������������� ��������� ���������������"��������� ��
������ � ������ ���� ����� ������� ��� ��� ������� 0����� ���
����� �� ��� ����� D3� ���� ��� ��� ������� ��� ����� ����� ���
��� ���������������������7��� ���������������"���
�
;��������������<�J������ ��������� ������"��
�
Impact ���� ������� ���� � ��� ��� ��������� ����� ��� ����� �� ���
$��� ��� ��� �� �� ��� ��� ���� �������� ��������� ��� � $� �
��������"������������������� ����������� ���� ������ ������
���������������������� ��������9�����&���������������
���������"����� ������������������������������ ��� �������"��

202 Role of Infrastructure in Poverty Reduction
T E R I Report No. 2004 RD 24
� 8�����������������������$� ��� ���� ����� ������������
����� ������������ ����8/#;/� ������������ ����� �������
�( ���������� ��"����������������������������� �����������
� ������������������������(��� ��� ���������������������
����������������� �����������"�&�� ������������� ����������
������ �=>� �� *>>�������� ����� ������� ���������� �� �����
����� ��� � ���� ��� ������(� ������� ��� ����� !-A������"�
:����6>D��������������� ���0���������( ���3��������������
������ ����B� ��� ���� ����� ����� ��� � ��� ��� ���"� ����
����� �����������������8/#;/��������������� �����*-
�=� ������� ���� ������� �� ��� ����� ��� ��� ����� ��� ���
����� ���"��
�
;�������� ������<� ���� ������� ���� � � �� ���� ��� ��� ���
���������������� �������� ��������������������������"��
��
Sustainability ���� ������� ���� ��� ���� ������� ����� ����� �� ��� � ���
+�������������# � ��� ��� �������)��������������'����� "�
F������� ��� �� ��� ���� ���� ����� ��� ��� ��� ��� ��� )� ���
;�� �����0������ �� ���������3������������������������ ���
���8/#;/���'��(��"��������������� ������ �������������
�� �������������$���������� ����������0������ �� ��3����
8/#;/������ ���������������������(���������������� ���
������ �� ��� ��������� ��� ��������� ���� ��� ��� �7��� ���
���������������� ���� ����� �����"��
� ���� 8/#;/� ���� ��� �-������ �� � ��� ������ ����� ��
C��������������&����������8 ������� ��FK������"��������
������ ����� ���������� ������ � ���������������������
�� �������� ��������"��
� ����� ���� �������������� ����������������������� �������
���8���/������#���;���� � ��/�������������������������
���� � �������������������������������� ��"��
�
;�������� ������<� ���� ������� �� ���(�� ��� ������
����� �� �����������"��
�
Beneficiary views :�������������7��������� � ���������� ��������������� � ����
������ ��� �� ������ �� � ��������"� � ���� ����������� ���
���������� ���� ��������6�6��������� ���!6�������������
������ ��� ���� �������"� ���� ������� ���� ���� ��� �� ������
������ ����� ���� ���� ��� � �� ������ ����"� �� ���� ���� ���
�������� � ����������������� ���������� �� ����� ����������
������������������������������������������������ ������
����� ����� �� ��� ����� � � ��� ������� ����"� �� ���� �����
��� ���� �� ��� O���������,� ��� ��� ��� ��� ������� �����
� ������ ������� ������� ��� ����� � �� �� ���������B� � ��

203 Role of infrastructure in poverty reduction �
T E R I Report No. 2004 RD 24
�� ������ ������ ��� ��������� ������ � �� �� ��� ������
� � ��������� ���������������;���� � �� ���&�������"��
Socio-economic profile of the sample
&������������ ������ ������������������� ������ �� ��������
�?"!"�������� ������������������������"�
�� ������ �������� ��� ��� ����������� ����� �������� �������
�� ���� ������� ���� ���� ������� � �� � ����� ������� ���
���������� ���������������������=>�������0*>D3�
�� ���-� ������ ������������������������������� �����
��������������������� ����������������������"���������
������������� ��������������� ��������������������
���������������-����������������������� ���� �������
��������� ������������������=>>>������������*>��������
� �� ���������������=�>>>-�>>>>�����������
�� ��������������������� +��� ����������������! ��������
��������������������-=�����������������������������
���-����� ��� ���������� � �� �� ��������� � +�� ��� !-�>�
��������
Table 14.6 Profile of respondents
Age group Number of respondents Percent 15-20yrs 11 3.5 21-25yrs 39 12.5 26-30yrs 50 16.0 31-35yrs 42 13.4 36-40yrs 53 16.9 41-45yrs 32 10.2 46-50yrs 25 8.0 >50yrs 61 19.5 Total 313 100.0 Education Primary 126 40.3 Secondary 63 20.1 Higher Secondary 42 13.4 Graduate 56 17.9 Post Graduate 11 3.5 Non Literate 15 4.8 Total 313 100.0 Household monthly income (Rs) 5000 237 75.7 5000-10000 59 18.8 10000-15000 15 4.8 20000-25000 2 0.6 Total 313 100.0 Members in each household (Nos.) 1-5 216 69.0 6-10 80 25.6 11-15 15 4.8 >15 2 0.6 Total 313 100

204 Role of Infrastructure in Poverty Reduction
T E R I Report No. 2004 RD 24
Figure 14.2 Education Profile of the respondents
Figure 14.3 Education Profile of the Respondents
Awareness about the project
8� ��������� ������������������������������ ���8���/������
������ �� ���#������������� ������������� �������� ����
����-� ���� ��� ��� ���������� ���� ��� ������ ��� ��� ������"��
:���� ����������������� ���������(������� ���������������
�� ���� ������������������������ ��������0� "6D3���������
(������� �������������������0�������?"43"�
��
40%
20%
13%
18%
4%
5%
primarysecondaryhigher secondarygraduatepost graduateilliterate
75%
19%
5%1%
< Rs 5000
Rs 5000-10000
Rs 10000-15000
Rs 20000-25000

205 Role of infrastructure in poverty reduction �
T E R I Report No. 2004 RD 24
Figure 14.4 Distribution of the total people aware of the project
Table 14.7 Awareness about the project
Awareness Number of respondents Percent
Yes 57 18.2
No 265 81.8
Total 313 100 Source of awareness
Newspaper 11 19.3
TV 3 5.3
Radio 1 1.8
Political Leaders 2 3.5
Other People 40 70.2
Total 57 100 Use of electricity Domestic use of electricity
:����� ��� 6�6� ���������� ���� ����� !� ������� ���
����� � �� ������ ���� �� �� �� ������"� :����� ��� ����� ���
�� ���������0A6"6D3������������������(������������ �������
� ���� ��� ������ ��"� 9��� ��� ����� �� ��� ��� ����������
0A>"�D3�� ���� ��������� ���������� ������ ����� � ����� ��
������-�?������"��
� ���� �� �� �������� ��� ����� � �� ���� ���� ������� �� ���
�������� � �� ��-� ��� ������� ��� ���� ��� ���������� �� ���
����� � �"���� �������������������������� �� ����0 AD3������
������� ������������� � ������������"�:����!A��������������
������������������� � ��������� ���0�������?"A3"��
5%
2%
4%
70%
19%
NewspaperTVRadioPolitical LeadersOther People

206 Role of Infrastructure in Poverty Reduction
T E R I Report No. 2004 RD 24
�
Figure 14.5 Pattern of Load Shedding
Table 14.8 Pattern of electricity use in households
Use of Electricity Number of
respondents Percent
Yes 301 96.2
Total 313 100
Cause of not using electricity
Option not provided 1 8.3
Financial reason 10 83.3
Other reason 1 8.3
Total 12 100 Average daily hours of load shedding
0 5 1.7
1-4 241 80.1
5-8 40 13.2
9-12 9 3.0
13-16 3 1.0
17-20 3 1.0
Total 301 100
Use of electricity for various purpose *
Commercial 29 9.63
Studying 206 68.44
Cooking 0.0 0.00
General lighting 301 100.00
Others 294 97.67 * Multiple responses
0
50
100
150
200
250
300
0 *1-4 *5-8 *9-12 13-16 17-20
hrs of load sheddingre
spon
dent
s

207 Role of infrastructure in poverty reduction �
T E R I Report No. 2004 RD 24
Figure 14.6 Pattern of Use of Electricity
Commercial use of electricity
:��������6�6����������� ���� ����� "6��������������� ���
����� � �� ���� ������� �����������"�J������ ?=�������� ��� ���
������� ����������������� � ��������� ��� ��������� �����������
��������������������������������� ��� ��������� �����������
������0*AD3"�:����4��������������� ��� ��������� ���� ��� ���"�
��������������� �������� � ������ �������( ������������� (��
�������� ���������������������������������������#�&��������
0�������?" 3"��
�
Figure 14.7 Pattern of Commercial Use of Electricity
�
050
100150200250300350
commer
cial
study
ing
cook
ing
gene
ral li
ghtin
g
other
s
Purposes for electricity use
Freq
uenc
y
0
2
4
6
8
10
12
14
gene
ral s
hop
groc
ery s
hoppr
ess
cloth
shop
STD booth
jewele
rs sh
op
watch s
hop
electr
ic sh
op
oil m
ill
Type of commercial user
no. o
f res
pond
ents
respondents

208 Role of Infrastructure in Poverty Reduction
T E R I Report No. 2004 RD 24
I��( ��� �� ��� ������� ���������� �� ������������ �� ���
����� � ��� ������������� ��� ������� ���� ����-� ������ ���
����������� ����� ���� ������� ���� �� ��� ����� � �� ����
������� ��� �������"� ���� � ��� ������ ��� ���� ��� ����� � ��
������� ������������������������������ ������� -�*�������
0=�"4*D3� �������� ��� =-A� ������ 0*?"�?D3"� :� ���� ��� *!�
����������������* ��������������������� �������� ���
����� � �������������!����������������������������� � �����
�� ��� ���������������"��
Table 14.9 Commercial use of electricity
Electricity used for general lighting
:��� ������6>������������ ���� ����������6�6�������� ���
����� � ��������������� �� ���0 !"*D3�������������*���������
�� ��� (�������� 06"AD3"� ����� �� ��� ��� ���������� 0 4"AD3�
�������������� � �������������������������������������
������������� �� ���0�������?"�>3"��
�
Purpose of use of electricity Number of
respondents Percent
Commercial 29 9.3
Household 284 90.7
Total 313 100
Type of commercial use of electricity
General shop 13 44.8
Grocery shop 8 27.6
Press 1 3.4
Cloth shop 1 3.4
STD Booth 1 3.4
Jewelers shop 1 3.4
Watch shop 1 3.4
Electric shop 1 3.4
Oil mill 2 6.9
Number of people in the household using electricity for commercial purpose 1 24 82.8
2 4 13.8
4 1 3.4
Number of hours of use of electricity for commercial purpose (In hrs.) 1-4 2 6.9
5-8 7 24.14
9-12 15 51.72
13-16 5 17.24
Use of electricity in respect of productivity in commercial use (Multiple response) Saves time 26 89.7
Cleaner 6 20.7
Total 29 100

209 Role of infrastructure in poverty reduction �
T E R I Report No. 2004 RD 24
� I��( ��� �� ��� ������� ��� ������� �� ��� ��������� �� ���
����� � ��������������� �� ���� ���������������� �����������
��������������������������������������������� �������� � ��
���� �������� � �� ��� �������� ��� � ��-� ��� �������� �� 6="=�
������� ���������"� ���� � ��������� ��� ���� ��� ����� � �� ����
�������� � �� ��� ��� ��� ���������� ��� �� ����� =-A� ���"�
0!4"AD3�������������-?�����0*=" D3"��
�
Figure 14.8 Number of hrs of use of electricity for general lighting
Table 14.10 Electricity used for general lighting
Sources of energy for lighting N % Electricity 301 96.2 Kerosene 12 3.8 Total 313 100 Number of people in the household using electricity for general lighting 1-4 167 55.5 5-8 107 35.5 9-12 18 6.0 13-16 7 2.3 17-20 2 0.7 Total 301 100 Number of hours of use of electricity for general lighting (In hrs.) 1-4 78 25.9 5-8 204 67.8 9-12 15 4.9 13-16 2 0.7 17-20 2 0.7 Total 301 100 Use of electricity in respect of productivity in general lighting * More comfortable 306 97.8 Expensive 12 3.8 More light 3 1.0 Total 313 100
* Multiple responses
0
50
100
150
200
250
*1-4 *5-8 *9-12 13-16 17-20
hrs
resp
onde
nts

210 Role of Infrastructure in Poverty Reduction
T E R I Report No. 2004 RD 24
Other uses of electricity :��������* ?��������������� � ������O����,�������������������
������� ��� ���������� ���� ��������� �� ��� ����� � �� ����
���� ��� �����0 !"!D3� ��� ����� *"?� ������������ �� ��� � ����
���� ��� ���� � ��"� � ����� ��������� ��� ���� ��� ����� � �� ����
������������� ������� -�*�����0* "!D3�������������6-�!�����
0*4"*D3"��
� :���������A!��������������������* ?���������������
����� ��� ��� �� ��� ����� � �� ���� O����� �������,"� #���� * �
������� ���� ��� ����� � ������ ����� �������� ���� ������ ���
�� ��������O���������,"��
Table 14.11 Other uses of electricity
* Multiple responses
Energy use patterns for different applications Energy use for studying
:��������*� ����������������������� ����*>!�������� ���
����� � ������� ������������ ����*�����(��������0�������?"�*3"��
�������� ���� ��-� ���� ��� ������������������������������
���� ����� � �� ���� ��� ���� �������� ��� ����� 64D� ��� ���
��������� � ���� ��� ��� �������� ����� �� ��� ����� � �� ����
���"������ ������������������������ � ��������� ������ ��
������-?�����0����!>"*D3������������=-A�����06="?D3"���
�
Purpose of other use of electricity N %
Fan 284 96.7
Pump 3 1.0
Television 7 2.4
Number of people in the household using electricity for other purpose 1-4 167 56.8
5-8 101 34.3
9-12 19 6.4
13-15 7 2.4
Number of hours of use of electricity for other purpose (In hrs.) 1-4 12 4.1
5-8 62 21.1
9-12 87 29.6
13-16 80 27.2
17-20 51 17.3
21-24 2 0.7
Use of electricity in respect of productivity in other purpose * Saves time 186 63.3
Cleaner 23 7.8
Comfortable 56 19.0
Save Expense 86 29.3

211 Role of infrastructure in poverty reduction �
T E R I Report No. 2004 RD 24
� :��������*�*�����������������*� ����������������������
�� ��� ����� � �� ���� ���� ��������� ������ ����� ���� ���
����� � �����������"��
�
Figure 14.9 Number of people in the household using electricity
Table 14.12 Energy used for studying
Sources of energy for study Number of respondents Percent
Electricity 206 94.0
Kerosene 12 5.5
Chargeable Light 1 0.5
Total 219 100 Number of people in the household using electricity for Study
1 91 44.2
2 76 36.9
4 20 9.7
5 12 5.8
6 6 2.9
Total 206 100 Number of hours of use of electricity for Study (In hrs.)
1-4 124 60.2
5-8 73 35.4
9-12 7 3.4
13-16 2 1.0
Total 206 100 Use of electricity in respect of productivity in study (Multiple response)
More comfortable 212 96.8
Expensive 10 4.6
0
20
40
60
80
100
1 2 3 4 5
number of people
freq
uenc
y
respondents

212 Role of Infrastructure in Poverty Reduction
T E R I Report No. 2004 RD 24
Figure 14.10 Distribution of people using electricity for study purpose
Energy use for cooking
:��������6�6����������� ���� �����!6��������������� ���
I������� ���� ���( ��� ����������� �������������� �� �������
0*A"?D3"�C�������������������������������������� � ������
���( ���0������ �?"�63"� ������ ���������������46"=�������� ���
��� ���������� ���� ��� ���� ����� ����� ��� ��� �� ���
����� � �B������?6��������������� ���������������7���� ���
���6?"=�������������� ����������������������������( ��"����
���������������� =����������������������������� ������������
�� �������� � ���������( ��������� ���� ����������"���
Table 14.13 Energy used for cooking purpose
Sources of energy for cooking Number of respondents Percent
Kerosene 13 4.2
LPG gas 198 63.3
Wood 89 28.4
Cow dunk 5 1.6
Coal 8 2.6
Total 313 100 Use of electricity in respect of productivity in cooking*
Saves time 230 73.5
Cleaner 108 34.5
Save expense 134 42.8
Total 219 100 Cause for not using electricity for cooking in spite of its availability*
Unreliable supply 16 5.1
Financial reason 296 94.6
Other 5 1.6
Total 313 100
* Multiple responses
0
20
40
60
80
100
120
140
*1-4 *5-8 *9-12 13-16
no. of hrsre
spon
dent
s
respondents

213 Role of infrastructure in poverty reduction �
T E R I Report No. 2004 RD 24
Figure 14.11 Pattern of sources used by people for cooking
Social and economic impact of the project
�������� ������� � ����� ����������� �����������8���
/������ ������ �� ��� #����� ������� ��� ��� ������� � �� ���
����� � �"��
� ���� ���������� ����� ��(�� ���� ����� ���� �� � ����
����� � ����������"� �J������ 6!�������� ��� ��� ����������
���� ������������ �����"��>>-*>>���������������������6*�
���������� �����"�*>>-=>>���������"��
� ����� ���������� ����� ��(�� ������� ���� ������
����� � �� ���� ���������� �� ������� ������ ������"� :���
������������������������� � ���������������������������
� ������� ��� ������������"�C�������������?6������������
��� ����� ������ ������ ������ ����� ����� ��� ����� �� ������
����� � �"��
� ��������������0A�"AD3"�����������������������������
������������������������� ����������������� ����� ���
��� ��� ��� ���"� C�������� ����� �6� ������� ���� ��� � ��"�
:����?>������������������������� �� ��������������
� ���� ��� ��� �������� �� ���� ���� �������� ��� 6>">�
������������ ���������� ������������ � ����"���
Pattern of sources used by people for cooking
050
100150200250
kero
sene
LPG ga
swoo
d
cow du
nkco
al
sources of energy
num
ber
of
resp
onde
nts
number ofrespondents

214 Role of Infrastructure in Poverty Reduction
T E R I Report No. 2004 RD 24
Table 14.14 Affordability of electricity and social/economic impacts of the project: perceptions
�
�
�
�
�
�
�
�
�
�
�
�
�
�
�
�
�
�
�
�
�
�
�
�
�
�
�
�
�
�
�
�
�
�
�
�
�
�
Number of respondents Percent
Amount paid for electrification per month
Below Rs.50 17 5.4
Rs. 50-100 47 15.0
Rs. 100-200 114 36.4
Rs. 200-500 100 31.9
More than Rs.500 35 11.2
Improvement in electrification condition
Yes to some extent 72 23.0
Yes very much 47 15.0
Not much 14 4.5
Not at all 3 1.0
Have no idea 177 56.5
Affordability of electrification Poor class 134 42.8
Lower middle class 291 93.0
Upper middle class 313 100
Rich 313 100
Improvement in social and economic environment due to the project Yes 40 12.8
No 17 5.4
Don’t know 256 81.8
Total 313 100 Indicators of social/economic environment of the locality *
More electric supply 4 10.0
Continue running rice mill 2 5.0
High voltage 9 22.5
Increase of light on the road side 7 17.5
More advantage in education 16 40.0
Job satisfaction 3 7.5
More advantage in trade 12 30.0
Increase land value 1 2.5
Total 40 100

215 Role of infrastructure in poverty reduction �
T E R I Report No. 2004 RD 24
�
�
�
�
Figure 14.12 Improvement in electrification condition
�
�
�
�
�
�
�
�
�
�
�
�
�
�
020406080
100120140160180200
yes tosomeextent
yes verymuch
not much not at all have noidea
profile of choices
no o
f res
pond
ents