Embed Size (px)
Citation preview

Available online at www.worldscientificnews.com
( Received 17 October 2017; Accepted 05 November 2017; Date of Publication 06 November 2017 )
WSN 88(2) (2017) 211-226 EISSN 2392-2192
Role of Geospatial Technology in Crime Mapping: A Perspective View of India
Firoz Ahmad1,*, Md Meraj Uddin2, Laxmi Goparaju1 1Vindhyan Ecology and Natural History Foundation, Mirzapur, Uttar Pradesh, India
2Department of Mathematics and MCA, Ranchi University, Ranchi, Jharkhand, India
*E-mail address: [email protected]
ABSTRACT
The advancement in computer science technology and development of GIS application
softwares and the accessibility of various geographic data through open source data sources make it
feasible for police and law enforcement departments to use it effectively.Crime mapping and spatial
analysis using GIS tools such as hot spot generation, zonation, navigation, and crime profiling, mobile
location identification and web based various application are well recognized and can be scientifically
applied for betterment of citizens whereas it can be effectively used for prediction and control of
crime. The present study analyzed the temporal crime data (Murder, dacoity, robbery, burglary, theft
and riots) of India from the year 2001 to 2015 to understand the temporal trend whereas state wise
crime data (IPC crime registered) from the year 2011 to 2015 was utilized to generate crime density
map and percent change. We have also used the crime data for 10 citis (highest crime rate) of India
including all metro cities for the year 2015 to understand city crime trend towards various crimes
types. By analyzing the crime data of 2015 the study reveals that the crime density was in the range of
65.8 to 1140 the lowest in Nagaland whereas highest in Delhi which was found to be roughly 4.5 times
than the national average. After the evaluation of crime percent change for the year 2015 with
preceding year it was found that 29.6% largest increase in crime in Daman and Diu whereas Kerala
and Delhi got second and third position with value 24.3% and 23% respectively. The evaluation of ten
cities including the metro cities was done for the year 2015. The various city crime (total cognizable
crime under IPC) per lakh population varies from 189.4 to 925.9 was found highest in the city Indore
whereas it was found lowest in Chennai city. Murder, dacoity, robbery, burglary, theft, riots and other
IPC crime per lakh population were found in the range of (0.9 to 11.3), (0 to 1.7), (0.6 to 31.1), (1.1
to 57.17), (14.8 to 445.6), (0.5 to 35.4) and (147.7 to 576.2) respectively. Patna city leads in Murder

World Scientific News 88(2) (2017) 211-226
-212-
and dacoity. Indore leads in the crime like burglary and other IPC crime. Delhi city reported highest in
robbery, theft whereas record was found lowest in riots.
Keywords: Crime Analysis, Geographical Information Systems, Crime Mapping, India
1. INTRODUCTION
Crime is a human phenomenon which violates the existing law of any country
punishable under various existing countries laws. In India it is punishable under various
section of Indian Penal Code (IPC) in India. In developing and less developed countries such
as third world the crime data is still organized manually in the form of hardcopies. Although
in India, apart from various important cities the crime maps are mostly not available in the
context of crime locations, police station jurisdiction areas, administrative boundaries etc in
GIS domain or in digital form. This limits the scope of better monitoring because crime
analysis such as hot spotting, zonation, navigation facilities, criminal profiling, landuse
patterns, terrain conditions etc. cannot be analyzed and assessed. Crime mapping and spatial
analysis using GIS tools are well recognized for the study and control of crime. This is the
most powerful information technology required in law enforcement. GIS has been widely
used by law enforcement agencies for better policing in developed countries. It is in
developing stage in India. Although the police forces have started using GIS technology but it
is limited to the metro cities for developing a (spatial) system by examining patterns of crime
and for predicting the future criminal events and their probable locations gives a huge boost
as operational and tactical aspects is the major concern.
In India GIS technology is in budding stage. It is not adequately recognized in crime
mapping and analysis therefore it is not considered as an mandatory tool within the police
force, whereas National Crime Records Bureau, Ministry of Home Affairs started GIS utilities
even though due to lack of GIS experts.
Why Geo-informatics in crime mapping?
The advancement in information technology, software and hardware has become boon
to utilize this for specific purposes. Remote sensing data, GIS and GPS can be potentially
used to harness in variety of applications in crime. The tools in GIS efficiently capture, store,
manipulate, update, visualize all forms of geographically reference material (https://www.igi-
global.com/dictionary/gis/12192). The data queries (simple and complex) and data analysis
such as hotspot generation, understanding the spatial, temporal trend and its pattern analysis
can be used in crime mapping process. GPS data of crime can be utilized for
updating/identifying various crime and its activites spatially. The high resolution remote
sensing data can be successfully utilized for delineating urban area building, roads parks,
shopping malls, police station and various features which are useful for crime mapping
especially in cities. The simple example of one of the data clock of crime only retain date and
time which was used for temporal hotspot mapping by Richard Weiss is given in the figure 1.
This study simply reveals the most of the crime taken place in the month of November and
December whereas robbery is roughly a night time phenomenon whereas burglary is day time
phenomenon.

World Scientific News 88(2) (2017) 211-226
-213-
Figure 1. Data clock of crime provide temporal hotspot analysis
The spatial relationship between crime location and other factors such as demography
including education level, housing (pakkah, kachha and jhuggis) and socio-economic
conditions including employment status and laborer class people can give better
understanding of the place and crime and its relationship based on the compared parameters
(Alves et al 2013; Anderson and Anderson 1984; Lawrence and Cohen 1979; Cotte Poveda
2012; Cusimano et al 2010; Hojman 2002; Hojman 2004; Kelly 2000; Levitt 2001).The
prediction of crime occurrences has gained large attention because of its prospective benefits
and utility.(Alves et al 2013; Gerber 2014: Gorr et al 2003; Liao et al 2010; Mohler et al
2011; Wang et al 2010).

World Scientific News 88(2) (2017) 211-226
-214-
Location is the one the most important aspects in crime (Brantingham and Brantingham
(1991). The place of crime and any other information geographic information involved with
criminal incident gives lot of information about the nature of crime and its characteristics.
This help in better design of prevention, assessment and analysis of criminal incidence. The
spatial relationship of crime with respect to the education level was studied by Weisburd and
McEwen (1997). He found inverse connection between the education levels of the resident
population and regions of violent crime. A mobile phone location identification in a cellular
network based on the signal strength & angle of radio waves with a cell phone has become
boon for crime prediction and identification. http://www.electroschematics.com/5231/mobile-
phone-how-it-works/
Although GIS has been adequately used in India in various applications such as urban
mapping (Ahmad and Goparaju 2016), forest change mapping (Ahmad and Goparaju 2017b),
agroforestry mapping (Ahmad et al 2017; Ahmad and Goparaju 2017a ) etc. whereas crime
mapping is still devoid of its utility effectively in the field of crime.
The crime mapping/analysis is widely used in developed country such as in Canada
(Eikelboom et al 2017), in USA (Jefferson 2017; Bunting et al 2017) and in New Zealand
(Curtis-Ham and Walton, 2017) but very few research has been done in the field of crime
mapping especially in developing country. Khalid et al 2017 evaluated and generated hotspot
mapping of crime in Faisalabad, Pakistan The study reveals that street crimes are strongly
concentrated in the central part of the city whereas, the results manifest that the functional
nature of different urban land use affects the frequency of crime events. They finally
concluded that the hotspot analysis has real potential, impacting the police patrolling
protocols. Wang et al 2013 studied the crime mapping with real world dataset from a
northeastern city in the United States. Comparison studies with the Hot Spot Analysis tool
executed by Esri ArcMap 10.1 validates that HOT is capable of accurately mapping crime
hotspots. Malvika (2015) did the crime mapping of Rajasthan, India at district level. The
study reveals the application of GIS and graphical tool as well as some important statistics
in crime mapping is the need of the hour and should be given preference over the
traditional crime recording methods. Karuppannan et al 2004 studied the crime of Chennai
city of India in GIS domain. The study showed that, GIS is a much more robust and
compatible tool of crime pattern analysis than the current processes because of its
geographic referencing capabilities.
In India the GIS mapping/analysis/queries/hotspot generation in crime evaluation is
almost nil therefore it is considered as a potential research gap which can be highly useful for
the policy makers if the outcome will be suitably interpolated in time for the betterment of the
citizens and for the law enforcement agencies.
The present study aims to applying state wise crime data from the year 2011 to the year 2015
for India and generation of crime map in GIS domain year wise and understanding the
temporal trend of crime, state wise. It is also recorded percent wise and depicted in the form
of map. The trend of crime for 10 major cities of India was also evaluated.
Study area
The study area was taken as the whole country including 4 union territories includes
Delhi, Chandigarh, Pondicherry and Daman and Diu. The study area falls between roughly 8º
29' 40'' N to 36º 54' 28'' N latitude and 68º 14' 45 '' E to 97º 28' 30 '' E longitude. India
occupies 10th
rank (1.76 million crimes) in the world as far as the world crime ranking is

World Scientific News 88(2) (2017) 211-226
-215-
concerned which is equivalent to roughly 15% of the crime of USA
(http://www.nationmaster.com/country-info/stats/Crime/Total-crimes). India retains land
equivalent of 2.41% of the world's land area but supports over 18% of the world's population.
Based on 2001 census of India 72.2% of the population lives in villages whereas
remaining 27.8% lived in towns. Based on 2011 census data of India Delhi city has the
highest population density equivalent to 9340, whereas as far as the states are concerned Bihar
has the highest 1102.
2. MATERIAL AND METHODS
The vector file for the country and various states was downloaded from DIVA GIS
website (http:// www.diva-gis.org/Data). Various state wise crime data ( IPC crime registered)
from the year 2011 to 2015 was downloaded from National Crime Records Bureau, Ministry
of Home Affairs, India. We have also downloaded the India wise crime data of the country
(Murder, dacoity, robbery, burglary, theft and riots) from the year 2001 to 2015 to understand
the temporal trend. We have also downloaded the crime data for 10 citis (highest crime rate)
of India including all metro cities for the year 2015 to understand city trend towards various
crimes types.
The analysis was done in ARC/ GIS Software/ MS EXCEL. Six columns in polygon
vector in attribute for the year 2015, 2014, 2013, 2012, 2011 and for population 2011were
created. The state wise crime number and population were filled in each respected column.
India census data is only available at 10 years interval. We have used Indian census data 2011
(latest) to understand crime density of each state in each year. In our study crime density from
the year 2011 to 2015 were also evaluated based on same population data available of the year
2011. Based on data we have also created crime map showing temporal crime density as well
as state wise percent change in crime (decrease and increase) when compared with the crime
data to preceding year. Telangana state was created in the year 2014 and data was only
available for the year 2015 and 2014.
3. RESULT AND DISCUSSION
Temporal trend of various crimes in India
The country wise crime in India is given in figure-2 and figure-3. Murder crime was
more in the year 2001 and shows a decreasing trend from the year 2001 to 2009 whereas it
shows increasing trend from 2009 to 2012. Dacoity crime was more in the year 2001 and
2002 but further shows a decreasing temporal trend whereas in the year 2015 it is sharply
reduced.
Robbery was noted to be roughly within the control from the year 2001 to 2006, it also
showing the constant increasing trend from 2006 onwards whereas a sharp increase was
observed from 2010 to 2014. Riots were highest in the year 2001 and 2012, whereas the
burglary was reported highest in the year 2014 and 2015. Theft was recorded lowest in the
year 2002 whereas it showing constantly increasing trend till the year 2015.

World Scientific News 88(2) (2017) 211-226
-216-
Figure 2. Crime (Murder, Dacoity and Robbery) in India in lakh from 2001-2015
Figure 3. Crime (burglary, theft, riots) in India in lakh from 2001-2015
0
0,1
0,2
0,3
0,42001
2002
2003
2004
2005
2006
2007
20082009
2010
2011
2012
2013
2014
2015
Crime of India in lakh from the year 2001 to 2015 Source: National Crime Records Bureau, Ministry of
Home Affairs
Murder
Dacoity
Robbery
0
1
2
3
4
52001
2002
2003
2004
2005
2006
2007
20082009
2010
2011
2012
2013
2014
2015
Crime of India in lakh from the year 2001 to 2015 Source: National Crime Records Bureau, Ministry of
Home Affairs
Burglary
Theft
Riots
World Scientific News 88(2) (2017) 211-226
-217-
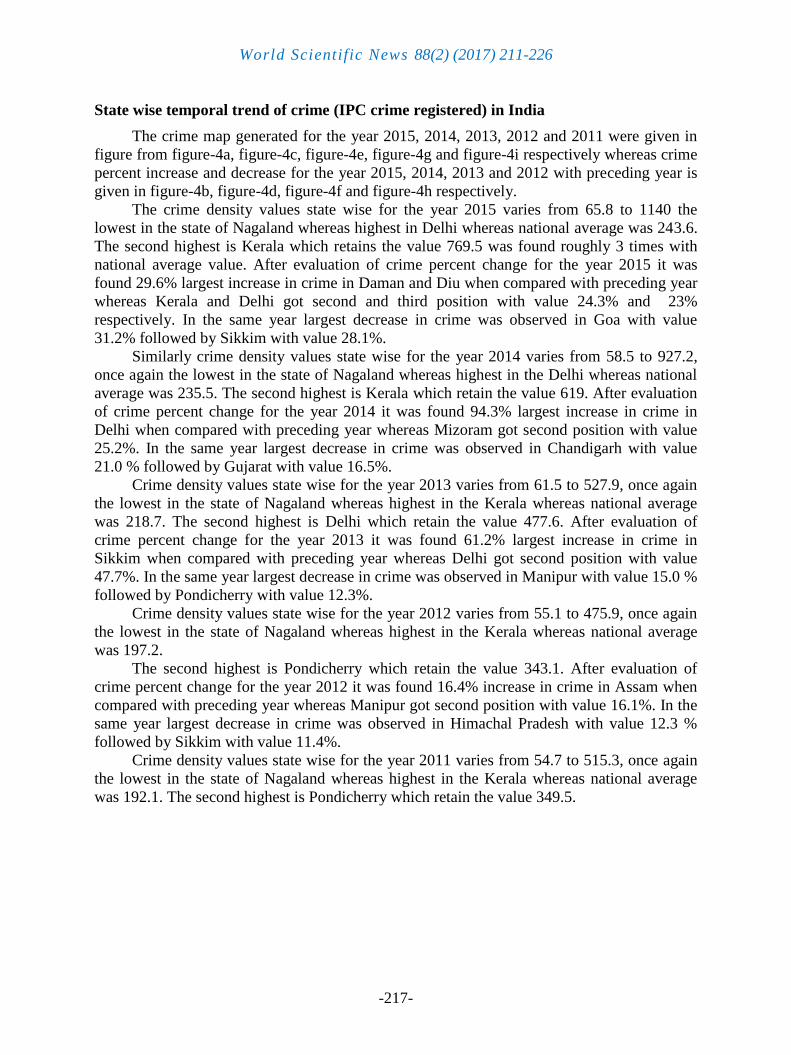
State wise temporal trend of crime (IPC crime registered) in India
The crime map generated for the year 2015, 2014, 2013, 2012 and 2011 were given in
figure from figure-4a, figure-4c, figure-4e, figure-4g and figure-4i respectively whereas crime
percent increase and decrease for the year 2015, 2014, 2013 and 2012 with preceding year is
given in figure-4b, figure-4d, figure-4f and figure-4h respectively.
The crime density values state wise for the year 2015 varies from 65.8 to 1140 the
lowest in the state of Nagaland whereas highest in Delhi whereas national average was 243.6.
The second highest is Kerala which retains the value 769.5 was found roughly 3 times with
national average value. After evaluation of crime percent change for the year 2015 it was
found 29.6% largest increase in crime in Daman and Diu when compared with preceding year
whereas Kerala and Delhi got second and third position with value 24.3% and 23%
respectively. In the same year largest decrease in crime was observed in Goa with value
31.2% followed by Sikkim with value 28.1%.
Similarly crime density values state wise for the year 2014 varies from 58.5 to 927.2,
once again the lowest in the state of Nagaland whereas highest in the Delhi whereas national
average was 235.5. The second highest is Kerala which retain the value 619. After evaluation
of crime percent change for the year 2014 it was found 94.3% largest increase in crime in
Delhi when compared with preceding year whereas Mizoram got second position with value
25.2%. In the same year largest decrease in crime was observed in Chandigarh with value
21.0 % followed by Gujarat with value 16.5%.
Crime density values state wise for the year 2013 varies from 61.5 to 527.9, once again
the lowest in the state of Nagaland whereas highest in the Kerala whereas national average
was 218.7. The second highest is Delhi which retain the value 477.6. After evaluation of
crime percent change for the year 2013 it was found 61.2% largest increase in crime in
Sikkim when compared with preceding year whereas Delhi got second position with value
47.7%. In the same year largest decrease in crime was observed in Manipur with value 15.0 %
followed by Pondicherry with value 12.3%.
Crime density values state wise for the year 2012 varies from 55.1 to 475.9, once again
the lowest in the state of Nagaland whereas highest in the Kerala whereas national average
was 197.2.
The second highest is Pondicherry which retain the value 343.1. After evaluation of
crime percent change for the year 2012 it was found 16.4% increase in crime in Assam when
compared with preceding year whereas Manipur got second position with value 16.1%. In the
same year largest decrease in crime was observed in Himachal Pradesh with value 12.3 %
followed by Sikkim with value 11.4%.
Crime density values state wise for the year 2011 varies from 54.7 to 515.3, once again
the lowest in the state of Nagaland whereas highest in the Kerala whereas national average
was 192.1. The second highest is Pondicherry which retain the value 349.5.

World Scientific News 88(2) (2017) 211-226
-218-
a
b

World Scientific News 88(2) (2017) 211-226
-219-
c
d

World Scientific News 88(2) (2017) 211-226
-220-
e
f

World Scientific News 88(2) (2017) 211-226
-221-
g
h

World Scientific News 88(2) (2017) 211-226
-222-
Figure 4. Crime map of India (a: crime density 2015, b: crime map percent change 2015,
c: crime density 2014, d: crime map percent change 2014, e: crime density 2013, f: crime map
percent change 2013, g: crime density 2012, h: crime map percent change 2012, i: crime
density 2011)
City crime evaluation
Ten cities including the metro city was evaluated for the year 2015 based on higher
crime data types are given in the figure-5. The various city crime per lakh population varies
from 189.4 to 925.9 was found highest in the city Indore whereas was found lowest in
Chennai as per total cognizable crime under IPC is concern.
Murder crime varies among the cities were in the range of 0.9 to 11.3 per lakh
population was found highest in Patna whereas found lowest in Mumbai. Dacoity as a crime
per lakh population was 0 in Jaipur to highest 1.7 in Patna. The crime such as robbery per
lakh population was least in Kolkata ( 0.6) whereas it was highest (31.1) in the city of Delhi.
Burglary, theft, riots and other IPC crime per lakh population were found with the range
of (1.1 to 57.17), (14.8 to 445.6), (0.5 to 35.4) and (147.7 to 576.2) respectively. Indore leads
in the crime like burglary and other IPC crime. Delhi was found highest in theft whereas
found lowest in riots.
i

World Scientific News 88(2) (2017) 211-226
-223-
0
200
400
600
800
1000AHMEDABAD
BENGALURU
CHENNAI
DELHI
HYDERABAD
INDORE
JAIPUR
KOLKATA
MUMBAI
PATNA
City crime of India 2015 per lakh of 10 city Source: National Crime Records Bureau, Ministry of
Home Affairs
Murder
Dacoity
Robbery
Burglary
Theft
Riots
Other IPC crimes
Total CognizableCrimes under IPC
Figure 5. City crime 2015 (Murder, dacoity, robbery, burglary, theft,
riots and other IPC crime)
4. CONCLUSIONS
Remote sensing, GIS and GPS are highly useful add-on technology in crime mapping
and crime prediction and identification. Historical crime data and its location when analyzed
with other thematic data sets such as location of police station, road network, shopping malls,
buildings, recreational centre with urban sprawl and girls school and colleges, mobile police
van location and installed camera location etc manifest several clues which can be highly
useful for crime identification and prevention. The Unique Identification Number (UID) and
its linking with mobile SIM in India are going on will further boost to reduce the crime. The
data of various hotspot of crime can be utilized to install cameras/ establishing the new police
station/and mobilizing the police patrolling in these locations.
Crime rate and its nature varies from state to state and from city to city and its cause
mostly related to social, economic, mental abnormality, geographical and political
(http://lawnn.com/crime/). The Kerala state overall represents the highest cognizable crime
rate whereas in union territory Delhi is on top of the list.

World Scientific News 88(2) (2017) 211-226
-224-
The state of Kerala shows better policing as well as the people are more aware as a
result, most of the crime incidents get reported. In contrary, most of the other states of India,
police themselves refuses to register the crimes so as to keep the crime rate low. Delhi shows
a huge gap between the rich and the poor. About one-third of the city population lives in
slums which mostly consist of migrated people from the other states in search of job retain
poor socioeconomic condition with high illiteracy rates. They live in inhuman conditions
devoid of any basic amenities. Therefore due to unemployment, poverty and illiteracy crime
flourishes. Also, people have become habituated with crime because of the slow judicial
process, they develops a feeling that he/she can easily get away with after committing a crime.
Based on the report of the national newspaper Time of India (TOI, 2016) A retired
supreme court judge Justice Markandey Katju blames poverty as the main cause of crime. He
also quoted “Unless you create a social and political order in which everybody gets a decent
life, which means proper employment, proper incomes, healthcare, education and nutritious
food for the children, you cannot abolish crime.” Our study reveals crime in Nagaland is low
and showing the continuous decreasing trend every year. The leading Indian newspaper “The
Hindu” quoted the statement of Neingulo Krome, secretary general Naga People Movement
for Human Rights, told “Ours is a very peaceful society. There are negligible cases of crime
within society and if we come across anyone with criminal instincts, the person is usually
ostracised from the society,” Singh (2016)
Acknowledgement
The authors are grateful to National Crime Records Bureau, Ministry of Home Affairs, India portal for providing
the crime data and DIVA GIS website for vector data.
References
[1] Ahmad, F. & Goparaju, L. (2016). Analysis of Urban Sprawl Dynamics Using
Geospatial Technology in Ranchi City, Jharkhand, India. J. Environ. Geogr. 9 (1–2): 7–
13. DOI:10.1515/jengeo-2016-0002
[2] Ahmad, F., Goparaju, L. & Abdul Qayum, A. (2017) Agroforestry suitability analysis
based upon nutrient availability mapping: a GIS based suitability mapping. AIMS
Agriculture and Food. 2(2): 201-220. doi:10.3934/agrfood.2017.2.201
[3] Ahmad, F. & Goparaju, L. (2017 a). Long term deforestation assessment in Jharkhand
state, India: A grid based geospatial approach. Biological Forum 9(1): 183-188.
[4] Ahmad, F. & Goparaju, L. (2017 b). Land Evaluation in terms of Agroforestry
Suitability, an Approach to Improve Livelihood and Reduce Poverty: A FAO based
Methodology by Geospatial Solution: A case study of Palamu district, Jharkhand, India
Ecological Questions 25, 67-84 DOI: http://dx.doi.org/10.12775/EQ.2017.006
[5] Khalid, S., Shoaib, F., Qian, T. et al. (2017). Network Constrained Spatio-Temporal
Hotspot Mapping of Crimes in Faisalabad. Appl. Spatial Analysis.
https://doi.org/10.1007/s12061-017-9230-x

World Scientific News 88(2) (2017) 211-226
-225-
[6] Wang, D., Ding, W., Lo, H. et al. (2013). Crime hotspot mapping using the crime
related factors—a spatial data mining approach. Appl Intell. 39: 772.
https://doi.org/10.1007/s10489-012-0400-x
[7] Malvika, P. (2015) Crime Mapping of Rajasthan (2013). A District-level Analysis.
Asian Journal of Research in Social Sciences and Humanities 5(6): 139-152.
DOI:10.5958/2249-7315.2015.00141.0
[8] Karuppannan, J., Shanmugapriya, S., and Balamurugan, V. (2004). Crime Mapping in
India: A GIS Implementation in Chennai City Policing. Geographic Information
Sciences. 10: 20-34. http://dx.doi.org/10.1080/10824000409480651
[9] Brantingham, P.J. and Brantingham, P.L. (1991). Environmental Criminology (eds.).
Prospect Heights, IL: Waveland Press. Weisburd, D., & McEwen, T. (1997).
Introduction: Crime Mapping & Crime Prevention. In D. Weisburd & T. McEwen
(Eds), Crime Mapping & Crime Prevention (Vol. 8, pp. 1-21). Monsey New York:
Criminal Justice Press.
[10] Eikelboom A., Martini E., Luisa Ruiz L. et al. (2017). Public Crime Mapping in
Canada: Interpreting RAIDS Online. Cartographica: The International Journal for
Geographic Information and Geovisualization Summer. Vol. 52, No. 2, pp. 108-115.
https://doi.org/10.3138/cart.52.2.5101
[11] Jefferson, B. J. (2017). Predictable Policing: Predictive Crime Mapping and
Geographies of Policing and Race. Annals of the American Association of Geographers,
1-16. DOI:10.1080/24694452.2017.1293500
[12] Bunting, R. J., Chang, O. Y., Cowen, C., Hankins, R., Langston, S., Warner, A., ... Roy,
S. S. (2017). Spatial Patterns of Larceny and Aggravated Assault in Miami–Dade
County, 2007–2015. Professional Geographer, 1-13.
DOI:10.1080/00330124.2017.1310622
[13] Curtis-Ham, S.; Walton, D. (2017). Mapping crime harm and priority locations in New
Zealand: A comparison of spatial analysis methods. Appl. Geogr. 2017
DOI:10.1016/j.apgeog.2017.06.008
[14] Alves, L,G., Ribeiro, H,V., Lenzi, E.K., Mendes, R.S. (2013). Distance to the scaling
law: a useful approach for unveiling relationships between crime and urban metrics.
PLoS One. 8(8): 1–8. pmid: 23940525
[15] Gerber, M.S. (2014). Predicting crime using Twitter and kernel density estimation.
Decision Support Systems. 61:115–125.
[16] Gorr, W., Olligschlaeger, A. and Thompson, Y. (2003). Short-term forecasting of crime.
International Journal of Forecasting. 19(4): 579–594.
[17] Liao, R., Wang, X., Li, L.and Qin, Z. (2010). A novel serial crime prediction model
based on Bayesian learning theory. In: Proceedings of the 2010 IEEE International
Conference on Machine Learning and Cybernetics. vol. 4. p. 1757–1762.
[18] Mohler, G,O., Short, M,B., Brantingham, P.J., Schoenberg, F,P. and Tita, G.E. (2011).
Self-Exciting Point Process Modeling of Crime. Journal of the American Statistical
Association. 106(493): 100–108.

World Scientific News 88(2) (2017) 211-226
-226-
[19] Wang, P., Mathieu, R., Ke, J. and Cai, H.J. (2010). Predicting Criminal Recidivism with
Support Vector Machine. In: Proceedings of the 2010 IEEE International Conference
on Management and Service Science. p. 1–9
[20] Anderson, C,A. and Anderson, D,C.( 1984). Ambient temperature and violent crime:
Tests of the linear and curvilinear hypotheses. Journal of Personality and Social
Psychology. 46(1): 91–97. pmid: 6694060
[21] Lawrence, E. and Cohen, M.F. (1979). Social Change and Crime Rate Trends: A
Routine Activity Approach. American Sociological Review. 44(4): 588–608.
[22] Cotte Poveda A. (2012). Violence and economic development in Colombian cities: a
dynamic panel data analysis. Journal of International Development. 24(7): 809–827.
[23] Cusimano, M., Marshall, S., Rinner, C., Jiang, D. and Chipman, M. (2010). Patterns of
urban violent injury: a spatio-temporal analysis. PLoS One. 5(1): 1–9. pmid: 20084271
[24] Hojman, D. E. (2004). Inequality, unemployment and crime in Latin American cities.
Crime, Law and Social Change. 41(1): 33–51.
[25] Hojman, D. E. (2002). Explaining crime in Buenos Aires: the roles of inequality,
unemployment, and structural change. Bulletin of Latin American Research. p. 121–
128.
[26] Kelly, M. (2000). Inequality and crime. Review of Economics and Statistics. 82(4): 530–
539.
[27] Levitt, S.D. (2001). Alternative strategies for identifying the link between
unemployment and crime. Journal of Quantitative Criminology. 17(4): 377–390.