Embed Size (px)
Citation preview

Portland State University Portland State University
PDXScholar PDXScholar
Dissertations and Theses Dissertations and Theses
Spring 6-28-2019
Spatial Analysis of Burglary and Robbery Crime Spatial Analysis of Burglary and Robbery Crime
Concentration Near Mass-Transit in Portland Concentration Near Mass-Transit in Portland
Bryce Edward Barthuly Portland State University
Follow this and additional works at: https://pdxscholar.library.pdx.edu/open_access_etds
Part of the Criminology Commons, and the Transportation Commons
Let us know how access to this document benefits you.
Recommended Citation Recommended Citation Barthuly, Bryce Edward, "Spatial Analysis of Burglary and Robbery Crime Concentration Near Mass-Transit in Portland" (2019). Dissertations and Theses. Paper 5034. https://doi.org/10.15760/etd.6910
This Thesis is brought to you for free and open access. It has been accepted for inclusion in Dissertations and Theses by an authorized administrator of PDXScholar. Please contact us if we can make this document more accessible: [email protected].

Spatial Analysis of Burglary and Robbery Crime Concentration
Near Mass-Transit in Portland
by
Bryce Edward Barthuly
A thesis submitted in partial fulfillment of the requirements for the degree of
Master of Science in
Criminology and Criminal Justice
Thesis Committee:
Kathryn Wuschke Ryan Labrecque Debra Lindberg
Portland State University 2019

© 2019 Bryce Edward Barthuly

i
Abstract
The relationship between mass-transit and concentration of burglary and robbery
crimes is inconsistent within the available literature in environmental criminology. A
number of studies have provided evidence of crime concentration at and near mass transit
locations where paths intersect, referred to as a node. These empirical studies bring in
environmental criminology theory with the idea that crime is clustered, and the pattern of
the concentrations is substantially influenced by how and why people travel and move in
a city (Brantingham, Brantingham, & Wong, 1991). It is suggested that public transit
allows for a large proportion of the population to move around the community along a
restricted number of destinations and paths; therefore, this concentration of population
frames opportunities, and increases overall concentrations of crime (Sherman, Gartin, &
Buerger, 1989; Loukaitou-Sideris, 1999; Brantingham et al., 1991). Establishments and
environments surrounding transit nodes may act as crime generators or attractors, as a
high influx of people are drawn to the area via nearby transit services (Sherman et al.,
1989; Loukaitou-Sideris, Liggett, & Iseki, 2002; Kooi, 2003; Hart & Miethe, 2014).
More recent literature has identified contrasting results, finding that crime does not
concentrate near mass transit areas (Gallison, 2016; Gallison & Andresen, 2017;
Ridgeway & MacDonald, 2017). In some cases, transit facilities appear to act as
protective nodes, with lower counts of crime occurring in and around these locales (La
Vigne, 1996; Sedelmaier & Kennedy, 2003).
Given the conflicting results of existing research about crime at and near transit
nodes, this study advances work in environmental criminology by analyzing the
concentration of burglary and robbery events in Portland, Oregon. Recognizing that

ii
crime concentrations may vary depending on the level of analysis, this study explores
crime concentrations at multiple levels of analysis (Brantingham, Brantingham,
Vajihollahi & Wuschke, 2009; Wuschke & Kinney, 2018). At the macro-level, this study
examines burglaries and robberies across Portland as a whole to determine whether these
events concentrate around mass transit nodes, when compared to other areas of the city.
The meso-level examines within the broad category of mass transit, to explore whether
burglary and robbery events cluster differently around different types of mass transit.
Finally, the micro scale investigates the five highest-crime transit nodes to explore how
burglary and robbery events concentrate in close proximity to these important locations.
This study finds that while crime concentrates at higher levels surrounding mass transit
nodes within Portland, the patterns of this concentration changes as the spatial level of
analysis changes.

iii
Dedication
I dedicate this to those who have continued to support, advise and inspire me to pursue
and achieve great opportunities and make a difference within my community and the
field of criminal justice.

iv
Acknowledgments
This thesis was made possible by the full dedication and support of my adviser, Dr.
Kathryn Wuschke, and committee, Dr. Ryan Labrecque and Dr. Debra Lindberg at
Portland State University. To my family, Bruce, Cynthia and Zion Barthuly, to my friend,
Matt Prosser, professors, Daniel Couch and Dr. Misty Weitzel, and to my colleagues at
the Portland Police Bureau, who model the necessary bridge between academia and
policing.
Thank you.

v
Table of Contents
Abstract ....................................................................................................................................... i
Dedication ................................................................................................................................. iii
Acknowledgments ..................................................................................................................... iv
List of Tables ............................................................................................................................ vii
List of Figures.......................................................................................................................... viii
Chapter 1: Introduction ............................................................................................................... 1
Literature Review: ...................................................................................................................... 3
Clustering of Crime: ............................................................................................................ 4
Activity Nodes: ................................................................................................................... 4
Examining the Concentration of Crime Near Mass-Transit Nodes:....................................... 6
Contributions to the Literature: .......................................................................................... 12
Chapter 2: Research Questions, Data and Methodology ............................................................. 14
Research Questions: .................................................................................................................. 14
Data: ......................................................................................................................................... 15
Methodology: ........................................................................................................................... 16
Macro Analysis: ................................................................................................................ 18
Meso Analysis:.................................................................................................................. 20
Micro Analysis: ................................................................................................................. 20
Chapter 3: Results ..................................................................................................................... 22
Overview of Macro-Level Analysis Findings: ........................................................................... 22
Do Burglary Crimes Concentrate Near Mass-Transit? ........................................................ 22
Do Robbery Crimes Concentrate Near Mass-Transit? ........................................................ 23
Overview of Meso-Level Analysis Findings for Burglary: ......................................................... 23
Examining Max-Light Rail Transit Nodes: ........................................................................ 24
Examining Portland Streetcar Transit Nodes: ..................................................................... 25
Overview of Meso-Level Analysis for Robbery:........................................................................ 25
Examining Max Light Rail Transit Nodes:......................................................................... 26
Examining Portland Streetcar Transit Nodes: ..................................................................... 26
Overview of Micro-Level Analysis Findings for Burglary Crime: ............................................. 27
Examining the Spatial Dispersion of Burglaries at Different Spatial Intervals: ................... 28
0 Foot to 50 Foot Buffer: ................................................................................................... 29

vi
50 Foot to 400 Foot Buffer: ............................................................................................... 30
400 Foot to 800 Foot Buffer: ............................................................................................. 30
800 Foot to 1200 Foot Buffer: ........................................................................................... 31
1200 Foot to 1600 Foot Buffer: ......................................................................................... 31
Overview of Micro-Level Analysis Findings for Robbery Crime: .............................................. 32
Examining the Spatial Dispersion of Robberies at Different Spatial-Intervals: ................... 33
0 Foot to 50 Foot Buffer: ................................................................................................... 34
50 Foot to 400 Foot Buffer: ............................................................................................... 35
400 Foot to 800 Foot Buffer: ............................................................................................. 36
800 Foot to 1200 Foot Buffer: ........................................................................................... 36
1200 Foot to 1600 Foot Buffer: ......................................................................................... 36
Chapter 4: Discussion and Future Directions ............................................................................. 38
Recommendation from Literature for Conducting of a Macro-Level Analysis: .......................... 39
Meso-Level Findings: ............................................................................................................... 40
Micro-Level Findings: .............................................................................................................. 43
Limitations: .............................................................................................................................. 44
Recommendation for Future Research: ...................................................................................... 46
Conclusion ................................................................................................................................ 47
References ................................................................................................................................ 49

vii
List of Tables
Descriptions Page
Table 1: Type of Crime by Area and Events with Location Quotient 22
Table 2: Meso-Analysis of Burglary by Type of Transit Node 24
Table 3: Meso-Analysis of Robbery by Type of Transit Node 26
Table 4: Micro-Analysis of Transit Nodes with Highest 28
Concentration of Burglary Events
Table 5: LQ Values by Transit Node and Buffer Area 29
For Burglaries
Table 6: Micro Analysis of Transit Nodes with Highest 33
Concentration of Robbery Events
Table 7: LQ Values by Transit Node and Buffer Area 34
For Robberies

viii
List of Figures
Descriptions Page
Figure 1: Transit Nodes with 400 ft. Buffers 19
Figure 2: Examined Buffer Areas 21

1
Chapter 1: Introduction
The 21st Century has brought an increase in access to public transportation, along
with a corresponding debate about public safety concerns associated with such access
(Trimet Annual Report, 2018). This has encouraged empirical review of the security,
sustainability and stationing of mass-transit services in the United States. In the Pacific
Northwest, Portland contains multiple modes of mass transportation, used by an
estimated 242,019 riders per average weekend (Trimet, 2018). Given the predominance
of mass transit usage within the Portland area, this locale forms an ideal site to continue
to build upon existing research exploring crime concentration in proximity to transit
nodes. This research explores how two crime types, robbery and burglary, concentrate in
proximity to mass transit nodes in Portland, at multiple scales of aggregation.
Recent public debate regarding crime, disorder and fear associated with transit
ridership in Portland, as reported by local news outlets, has encouraged an outside
empirical review of crime in and around transit stations (Redden, 2017; Altstadt, 2018).
Despite the recent national and local media coverage of violent attacks, and the perceived
increases of property and personal crime against transit riders in Portland, the 2017
Trimet yearly crime statistical report is unable to determine whether current crime
occurring at or near the city’s Trimet services has increased, decreased or remained
constant (Trimet Annual Report, 2018; Njus, 2017; Altstadt, 2018). This is due to the
recent reporting system change to the National Incident-Based Reporting System
(NIBRS); a commonly used reporting database in other governing agencies such as the

2
Portland Police Bureau. Due to the NIBRS system counting and tracking all crime
occurrences within each criminal event, this data is unable to be compared to data
collected within previous years, which recorded only the most severe offense (Altstadt,
2018).
While other major urban cities in the United States have conducted spatial and
temporal analyses of crime in and around major transit nodes, there is a shortage of such
research in Portland. Presently, administrators of public transportation services such as
Trimet believe the “overall picture is good,” despite the inability to support such
conclusions with measurable data, noting there are few crime occurrences per rider who
use transit services within Portland (Durmont, 2018). Such executives have primarily
focused these statements on crime occurring on public transit and platforms.
With transportation executives remaining open to public debate and relationship-
building with its transportation users and the Portland community, there have been
multiple collaborative meetings to discuss societal issues related to crime and fear on
public transportation in Portland (Redden, 2018; Altstadt, 2018). This has resulted in
increased security allocation and funding toward security technology to reduce crime,
disorder and fear on public transportation services in the city. This study aims to provide
further empirical analysis regarding crime in proximity to major transit nodes, serving to
aid in resource allocation and public understanding about crime concentrations in the
Portland area. This research study extends existing conversations to explore how
transportation nodes and station ridership may influence crime within the surrounding
environment.

3
Literature Review:
Existing literature considering crime in proximity to transit nodes frequently
explores these concentrations from a pattern theory lens (Brantingham et al., 1991;
Brantingham, Brantingham, & Andresen, 2016; Eck & Weisburd, 2015; Brantingham &
Brantingham, 1993). In such articles, transit nodes are often classified as crime
generators or attractors (Brantingham & Brantingham, 1995). Crime generators are
locations that have high volumes of crime because they draw large numbers of people for
non-crime reasons (Brantingham & Brantingham, 1995). In contrast, crime attractors are
locations that attract motivated offenders due to the known opportunity for criminal
engagement (Brantingham & Brantingham, 1995). These locations can include bars, drug
markets and prostitution zones. Crime attractors can be thought of as luring motivated
offenders to the location due to a known opportunity for crime (Frank et al., 2011).
When considering whether mass transit nodes can be classified as crime attractors
or generators, one must first define what mass transit nodes are. Empirical research by
Brantingham and Brantingham (1995) has identified a mass transportation node as a
location where numerous variations of transit modes or travel paths intersect or converge.
A second perspective of the term is provided by Kinney, Brantingham, Wuschke, Kirk
and Brantingham (2008), who identify such locations as important, shared activity nodes,
which act as points of convergence for large numbers of people. These points, therefore,
shape both activity patterns, and crime patterns within urban areas. Mass transit nodes
can become crime generators as they attract a large volume of people at one location,
which increases the potential opportunities for crime to occur (Brantingham &

4
Brantingham, 1995). Examples of a mass-transit location are bus interchanges, large-
scale ‘park and ride’ lots, and transit system stops.
Clustering of Crime:
Previous empirical research suggested that few crime hot spots produce the
majority of calls to law enforcement (Sherman et al., 1989). Specifically, Sherman et al.
(1989) found that approximately 50 percent of all police service calls concentrated to
three percent of geographic areas. In 2014, Hart and Miethe (2014) analyzed this finding
by examined the specific crime types that produced the most police calls. The authors
found street robberies to be highly clustered. This crime type had a high correlation with
a public bus stop, which was found to be more likely, than any other activity node, to be
located adjacent to a robbery event (Hart & Miethe, 2014). Hart and Miethe (2014)
conclude that the that “the risk of robbery victimization is strongly dependent on the
presence or absence of a bus stop in conjunction with certain combinations of other types
of activity nodes that also serve as crime generators and/or attractors” (189).
Activity Nodes:
Recent analyses of major activity nodes have typically focused on examining the
land use types associated with concentration of urban crime. At the macro-level, Kinney,
et al. (2008) examined crime events as they relate to broad land use types such as
commercial, residential, and civic/institutional classifications. At the macro level, the
authors examined violent and property crimes at the broad land use category, finding
disproportionate concentrations of motor vehicle and assault crimes “on a relatively

5
limited number of specific land-use types characterized by high activity functions”
(Kinney et al., 2008, 11). At the meso-level, the authors explored crime concentrations
within each broad land use category, finding the specific sub-types of land use that are
most associated with crime within the study area. Findings suggested commercial
establishments, followed by residential and recreational land uses are associated with a
high proportion of assaults and motor vehicle thefts within the study site (Kinney et al.,
2008). In contrast, transportation and industrial land uses are associated with a small
percentage of the total assaults and motor vehicle thefts. At the micro-scale, the authors
investigated crime at the address-level, identifying single locations associated with the
highest counts of crime. In this study, shopping malls, multi-family apartment blocks,
schools and universities contributed to a large proportion of the events within this urban
area (Kinney et al., 2008).
Hart and Miethe (2014) followed a similar analytical approach, with findings
suggesting specific types of nodes near mass-transportation are highly correlated to street
robbery crime, and act as crime facilitators. These activity nodes can include gas stations,
fast food, adult video stores, liquor outlets and pubs, and pawn shops. These findings
support earlier research conducted by Sherman et al. (1989), who identified some similar
activity nodes such as bus depots to be related to the concentration of robbery, as well as
bars, liquor stores and parks, homeless shelters, malls, adult bookstores, hotels,
convenience stores, and restaurants. When examining the concentration of crime near
different activity nodes, Sherman, et al. (1989) found crime increases if a major
transportation node was present in the immediate environment, thus providing access to
such establishments.

6
These authors, along with other criminologists, have suggested that public
transportation frames opportunities for criminal acts, due to moving a large proportion of
a high-risk population around the community with a restricted number of destinations and
paths (Loukaitou-Sideris, 1999; Brantingham et al., 1991). Establishments that are
located near mass-transportation stations and routes may be at higher risk of burglary and
robbery crime. Specifically, blocks that have a crime generator or attractor such as a
transportation station inside of their boundaries were found to have the highest count of
robberies (Bernasco & Block, 2011). Blocks that do not have a crime attractor or
generator but are adjacent to a block that does has one, have fewer counts of robberies.
However, the lowest count of robberies were found in blocks without a crime attractor, or
generator, and are not geographically adjacent to a blocks that have either.
Examining the Concentration of Crime Near Mass-Transit Nodes:
In a review of available literature, Brantingham et al. (2016) found crime is not
randomly distributed in space or time. Instead, crime is clustered, and the pattern of the
concentration is substantially influenced by how and why people travel and move in a
city. This suggests “there will be concentrations of overlapping activity nodes and within
those nodes, some situations that become crime generators and some that are crime
attractors” (Brantingham et al., 2016, 112). Smith and Clark (2000) and Brantingham et
al. (1991) identify transit hubs and stations as potential crime generators and attractors
which can shape the patterns of crime in an urban environment as they facilitate the
clustering people together at a fixed location within a restricted geographic area.
Research by Block and Davis (1996), Loukaitou-Sideris et al. (2002) and Newton,

7
Partridge and Gill (2014) present findings that crime events tend to concentrate around
such locales.
Specifically, Block and Davis (1996) found evidence of an increased risk of
crime and attraction of many potential offenders and targets to semi-public and public
spaces, as well as legal and illegal businesses around transit nodes. In their examination
of the spatial distribution of robbery events from 1993 to 1994, they examined the
concentration of street robberies near rapid mass transit nodes in two Chicago districts
(Block & Davis, 1996). Using a GeoArchive database, Block and Davis (1996) analyzed
address-level information from community and law enforcement, a data set excluding
commercial robberies and robberies occurring inside a transit station or on a transit
service. Findings revealed 39 percent of robberies to occur within a 1,000 foot
geographic area surrounding a rapid transit node (Block & Davis, 1996). It was presumed
that the volume of street robbery “was greatest during periods when fewer, and perhaps
less coherent, targets and observers were likely to have been present” (Block & Davis,
1996, 251). As a result, the amount of street robberies “peaked a short distance away
from the station, where enough potential targets would still have been on the street but
guardianship would have declined” (Block & Davis, 1996, 251).
Loukaitou-Sideris et al. (2002) examined the relationship between the incidence
of crime and light rail transit nodes in Los Angeles. Using a mixed methods approach, the
Green Line was examined to study a relationship between the spatial distribution of crime
and variation of land use characteristics, surrounding environmental attributes and
sociodemographic traits. The Green Line is a 19.6 mile light-rail transit line used by an
estimated 26,984 riders from Norwalk to El Segundo in Los Angeles County. Using

8
crime data obtained from the Lost Angeles Transit Services Bureau, as well as
demographic and ridership data, the study conducted a systematic field observation
linking the variation of land uses and establishments, as well as sociodemographic and
environmental attributes to each of the 14 transit platform (Loukaitou-Sideris et al., 2002,
141). Findings of this study revealed specific transit stations suffered from more crime
when compared to other transit stops on the Green Line. Specifically, stations with more
ridership were found to concentrate a higher amount of serious crime. Additionally,
crimes against persons were found to “happen primarily at the station platform.”
(Loukaitou-Sideris et al., 2002, 146).
Continuing in this area, Newton et al. (2014) considered transit stations as risky
facilities. The scope of the project was to measure mass-transit system called the LU,
which has more than one million users per year in London (Newton et al, 2014). The
authors examined the relationship between the distribution of theft below and above
ground at LU transit stations. Findings of this study revealed that the distribution of theft
“is concentrated at a small proportion of stations and during peak travel hours” (Newton
et al., 2014, 12). Specifically, it was estimated that approximately 50 percent of all theft
occurred at 20 percent of the transit stations (Newton et al., 2014). Furthermore, it was
found that 75 percent of the risk for theft occurred at 40 percent of the transit nodes
(Newton et al., 2014). The authors recommend further examinations of the spatial-
interplay of transit nodes within the immediate environment, specifically, assessing the
land features situated around transit nodes that might influence the opportunity for theft
(Newton et al., 2014).

9
While a range of studies exist to emphasize the criminogenic nature of transit
nodes, other work, such as that of Ridgeway and Macdonald (2017), has demonstrated
contrasting findings. In their analysis of reported crime near Los Angeles transportation
rail stations between 1988 and 2014, the authors found rail transportation may generate
no major overall consequence for patterns of crime at the neighborhood level (Ridgeway
& Macdonald, 2017). The authors call for further empirical research to examine other
cities at a micro-level unit of analysis, such as the street. They also state that additional
consideration should be given to specific land-use characteristics which generate foot
traffic (Ridgeway & Macdonald, 2017).
Further studies concur with Ridgeway and Macdonald, finding less concentration
of crime in areas surrounding transit nodes. Gallison (2016) explored whether the
expansion of mass transportation services in Vancouver, B.C generated an increased
amount of crime. The author examined crime events in, and around, the Canada Line, an
addition to the Vancouver SkyTrain, using a time-series regression. The analysis found
reported crime counts had decreased, since the expansion of the mass transportation
service.
In Gallison and Andresen’s 2017 study, the relationship between public transit
and crime was further examined. They examined whether motor vehicle thefts, robbery
and commercial burglaries concentrated around O-Train transit stations in Ottawa,
Ontario. The authors found that O-train stations did produce increases in motor vehicle
theft but did not increase commercial burglary or robbery crime. These findings
emphasize the significance of examining the criminal implications of mass public
transportation and the need for scanning and analysis in planning for response, and

10
assessment, regarding how nodes may become generators and attractors in an
environment (Gallison & Andresen, 2017). Other research, such as Clark and Belanger
(1996) and La Vigne (1997), have found secure and well-designed transit hubs to shield
themselves from surrounding high risks and crime occurring in the outside environment.
Clark and Belanger (1996) examined Angel’s (1968) hypothesis that street level
robberies are most likely to occur at a moderate level of pedestrian traffic, when
compared to lower or higher levels. They looked at the distribution of 1,492 robberies
recorded at the 206 subway stations in New York between August 1992 and January
1995. Using a log-linear distribution model, Clark and Belanger (1996) found rates of
robbery and ridership to have an inverse relationship. Robbery was found to be highest at
subway nodes with the lowest levels of ridership. Additional findings, using the rate of
robbery recorded by the New York City Police Department in 1992, revealed a
substantial variation in rates of robbery crime per station within each of the analyzed
precincts in New York (Clark & Belanger, 1996). Findings present an opportunity for
further research in describing how the level of ridership and geographic placement of a
transit facility may shield and, therefore, reduce the rate of robbery crime, when
compared with other transit nodes, their level of ridership, and placement in the
environment.
A similar study by La Vigne (1996) examined the metro subway system in
Washington D.C., which at the time of the study, was found since its introduction in 1976
to have experienced a lower than expected rate of crime compared to other cities such as
Atlanta, Chicago and Boston. Compared with other mass transit services, La Vigne
(1996) examined the deterrence of crime by the transportation service due to the

11
combination of management practices, design characteristics, maintenance policies and
crime prevention efforts. Findings of this study revealed the uniformity of the metro
stations in the design, maintenance, and “opportunity reducing characteristics,” such as
adequate lighting, access and control, and Crime Prevention through Environmental
Design (CPTED) implementations act as environmental safeguards against the increased
crime rates above ground in the community (La Vigne, 1996). As a result, enhanced
measures of crime prevention taken at each of the metro stations were presumed to be
deterring potential motivations for crime when compared with the less safeguarded
environment above ground.
Sedelmaier and Kennedy (2003) found the incorporation of a transit station did
not precisely correlate to an increased rate of crime in a geographic area. While
examining the incorporation of a new public light rail transit system and the potential
impact on crime patterns at the neighborhood level of analysis, Sedelmaier and Kennedy
(2003) found the introduction of a light rail transit station to have a minimal impact on
crime patterns. In addition, Sedelmaier and Kennedy (2003) found the average amount of
police service calls decreased or remained the same following the introduction of the
mass transit service. If a call for service was recorded, it was typically found to
concentrate significantly distant from the location of the transit station (Sedelmaier &
Kennedy, 2003). They recommend of this article the need for continued examination of
the relationship between transit and crime in order to further development and
maintenance of transit by criminologists, transit planners and law enforcement in U.S
cities (Sedelmaier & Kennedy, 2003).

12
Final consideration of how transit stations are not exclusively correlated with
increased rates of crime include Vu (2009), who indicated that if a disproportionate
number of stations accounted for a significant portion of crime and are considered risky
facilities, then there will be several stations which experience relatively few incidents of
crime . In addition, Bernasco and Block (2011) reported that, although, transit nodes
increased the access to a geographic area, they were not sufficient enough to be the only
increase for the risk of crime within a geographic area. The literature suggests crime
levels vary for different parts of a transit system and these may be correlated to the
characteristics of the neighborhood (Richards & Hoel 1980; DeGeneste & Sullivan
1994).
Contributions to the Literature:
Given the reviewed literature, the goal of this study is to consider how crime
events concentrate near mass-transit nodes in a densely populated urban area. Given the
predominance of mass-transit usage in Portland, this study allows for an exclusive
assessment and continuation of the literature regarding whether crime concentrates near
mass-transit in a previously unexamined densely populated area. This research study
explores crime patterns near mass-transit at multiple levels of analysis within Portland,
Oregon. This research adds to the conversation regarding whether burglary and robbery
crime concentrates near mass-transit nodes and specifically, draw comparisons about
concentrations across type of mass-transportation. In addition, this study has the potential
to serve as an empirical resource to stakeholders in Portland such as the Portland Police
Bureau and Trimet to contribute to recent public debate regarding crime, disorder and

13
fear associated with transit ridership in Portland. This study serves to aid in resource
allocation and public understanding about crime concentrations at different levels of
analysis in the Portland area.

14
Chapter 2: Research Questions, Data and Methodology
To continue the conversation in exploring how burglary and robbery events
concentrate at, and nearm mass-transit nodes in Portland, this study examines the
concentration of crime events at the macro, meso and micro level of analysis. The
following section considers three questions at each level of analysis to determine the
degree to which burglary and robbery crime events concentrate near mass-transit nodes,
at specific types of major transit nodes, and individual stations. This chapter reviews the
crime and transit data used to conduct the analysis in Portland, and introduces the
methodological approaches used to analyze the concentration of crime at, and near,
activity nodes.
Research Questions:
At the macro-level, this research explores whether two crime categories, burglary
and robbery, concentrate in the areas immediately surrounding transit nodes within
Portland, Oregon. At the meso-level, this research explores within the categories of mass-
transportation, to identify whether the type of mass transit may impact crime at and
nearby the locale. At the micro-level, this research explores crime concentrations at and
around specific, high-crime transit nodes to investigate whether and how the micro-scale
patterns of crime differ from station to station.

15
Data:
This study analyzes Portland Police Bureau crime event data to explore the spatial
patterning of recorded crime events in the city, occurring between May 2015 and August
2018. The analysis incorporates 13,645 counts of burglary crime and 3,368 counts of
robbery occurring between May 2015 and August 2018. The open-source data set is
individual-level and includes crime type, as well as latitude and longitude data
coordinates (Portland Police Bureau, 2019). According to the Portland Police Bureau
database, robbery crime is defined as “to take or attempt to take anything of value from
the control, custody, or care of another person by force, threat of force, or by putting the
victim in fear of immediate harm” (Portland Police Crime Definitions, 2019, 1).
Burglaries are defined as “the unlawful entry into a building or other structure with the
intent to commit a felony or a theft” (Portland Police Crime Definitions, 2019, 1).
Reported crime events were imported into ESRI’s ArcGIS 10.5 for spatial analysis,
where events located outside of the Portland city limits were excluded from the analysis,
resulting in 3,068 robbery events and 13,305 burglary events included in this analysis.
Max light rail and streetcar transit nodes within the Portland area were provided
by Oregon Metro RLIS (Oregon Metro RLIS, 2019). The database is managed by the
Metro Data Resource Center and was originally published in 1990 with the most recent
update being on September 8th, 2015 (Oregon Metro RLIS, 2015). This dataset includes
information detailing major transit stations, including light rail (referred to herein as the
Max Line) and Streetcar stops. The shape file included 180 total transit nodes, including
40 transit stations outside of Portland city limits, a part of the Trimet light rail services.

16
The 40 transit stops were excluded from the study in order to focus on the 70 Max and 70
Streetcar transit nodes located within Portland city limits.
Methodology:
The research includes a spatial analysis of robbery and burglary events
surrounding transit stations, examined at the macro, meso and micro level. At each level,
location quotients (LQs) are used to identify and measure crime concentration at transit
sites. According to Groff and McCord (2012), LQs are “ratios which compare the
characteristics of a sub-area under study to that of the larger, surrounding region” (Groff
& McCord, 2012, 9). The quotients are calculated for both burglary and robbery offenses
by calculating a ratio of the count (ci) of robberies or burglaries within a set buffer
distance from transit nodes, divided by the area (ai) within the buffer distance from the
node. The value forms the numerator of the LQ equation, which is then divided by the
count (cr) of robberies or burglaries in all of Portland, divided by the area (ar) of all of
Portland. The metric calculates the crime per area in a sub-unit of analysis and comparing
this to the crime per area across the entire city (McCord & Ratcliffe, 2007, 49). This is
frequently calculated as:
LQ = 𝑐𝑖/𝑎𝑖
𝑐𝑟/𝑎𝑟
The calculated LQs produce a value greater than 0, which provides a measure of
crime concentration. Values less than one indicate that crime is less concentrated within
the sub-area than compared to the city as a whole. Values near one indicate that
concentration within the sub-area is comparable to the city. Values higher than one

17
indicate higher than anticipated concentration. While there is debate about the appropriate
cut-off value to indicate a considerable or meaningful level of concentration, many recent
studies indicated values of 1.6 or greater meet this threshold. More stringent studies have
used a value of 2.0 to indicate meaningful concentration (Groff, 2011). At a LQ of 2.0,
the density of crimes, within the study area is twice the density found in the city as a
whole. A LQs greater than 2.0 suggests that the analyzed location has a probability of
promoting the observed occurrences of crime within the studied environment (Groff &
McCord, 2012, 10). When LQs fall below a 2.0 rating, previous studies have interpreted
values less than 0.9 as lower than expected within the given area; values greater than 0.9
and less than 1.1 as within the normal range for the given area; values ranging from 1.1 to
1.9 as high (Yhu, Zhu, Ye, & Guo, 2017). Guided by this research, this study uses 2.0 as
the cutoff to indicate a considerable concentration of crime.
LQs have been utilized in similar spatial analysis research such as by McCord and
Ratcliffe (2007) in the examination of a micro-level spatial analysis of drug markets in
Philadelphia, Pennsylvania (McCord & Ratcliffe, 2007). Their research examined a
similar transportation node with a subway station which was measured at a 400 foot, 400-
800 foot, 800-1200 foot, and 1200-1600 foot buffer (McCord & Ratcliffe, 2007, 50).
Calculated results of the LQs indicated drug arrests clustered within 400 foot of subway
stations. However, the clustering of drug arrests near subway stations decreased as the
spatial buffer spread further out into the immediate environment.
Another similar research study that incorporated LQs was Groff and McCord
(2012), who examined the role of parks as crime generators at the neighborhood-level.
Their hypothesis was that as the distance from the examined park increased, the

18
concentration of crime would decrease. Their spatial-analysis examined parks and the
surround street segments within a 50 foot, 400 foot, 800 foot, and 1200 foot buffer. Their
analysis found the concentration of property, violent and disorder crime to be more
clustered around and in parks when compared to Philadelphia, as a whole (Groff &
McCord, 2012). As the distance increased from the examined park, however, these
concentrations were found to significantly decrease in the 400 foot buffer, rise in the 400-
800 ft buffer and then decrease to an even lower concentration at the 800-1200 foot
buffer (Groff & McCord, 2012, 11).
Macro Analysis:
This study begins by examining burglary and robbery counts at the macro level. I
analyze burglary and robbery crimes within Portland, as a whole, and compare these with
the concentrations immediately surrounding major transit nodes. To conduct this analysis,
I create spatial buffers surrounding identified major transit nodes. These buffers are
created at 400 feet; a distance used within existing literature (McCord & Ratcliffe, 2007).
This phase of analysis uses ArcGIS 10.5 to spatially join the count of both burglary and
robbery events to the buffer area files, which counts the number of each type of events
occurring within 400 feet of transit nodes. ArcGIS further enables the calculation of the
land area contained within the buffers, in comparison with all events and the area of the
city. The inputs allow for the calculation of the LQ measurement, quantifying
concentration of specific crime events within close spatial proximity to the major transit
nodes, Figure 1, below, illustrates the location and size of the 400 foot transit buffers.
The map reviews the two types of major transit nodes included in the study (Max and

19
Streetcar stops) and the location of the 400 foot buffers situated around each of the transit
nodes. The figure includes the Willamette River and all Portland neighborhoods to
provide visual context in relationship to the geography of Portland.
Figure 1: All Max Light Rail and Portland Streetcar Nodes are presented. The map
includes Portland Neighborhoods and the Willamette River to provide a spatial-layout
indicating the transit node locations.

20
Meso Analysis:
In the event a crime category is found to concentrate around major transit nodes
within Portland, the meso and micro analysis further explores how transit relates to the
local spatial patterning of this crime type. At the meso-level of analysis, I explore how
crime events concentrate around the specific transit sub-types including Trimet light rail,
and the Portland Streetcar. LQs are used to identify differences in concentration
surrounding each category of mass transit.
Micro Analysis:
At the micro-level, each transit node is individually analyzed to explore crime
concentrations in the area nearby. Individual stations reporting the highest concentrations
of crime nearby are further analyzed at a variety of distances, in an effort to better
understand the local spatial variations in crime concentration around these high-crime
nodes. This micro-level analysis requires a series of spatial buffers, extending outward
from the initial transit station. These buffer distances follow those originally used in
McCord and Ratcliffe (2007), who propose a 0-400 foot, 400-800 foot, 800-1200 foot,
and 1200-1600 foot buffer around the examined location (see Figure 2). In addition, this
study further incorporates the methodology of Groff and McCord (2012) who propose a
0-50 foot buffer to explore the spatial-dispersion of crime events within the micro-
geographic area immediately surrounding the station itself (see Figure 2).

21
Figure 2: The analyzed buffer distances are presented here. The study first examines the
concentration of crime within a 50 foot buffer of transit nodes, followed by a 50-400 foot,
400-800 foot, 800-1200 foot, and 1200-1600 foot spatial buffer. The method allows for
micro-level analysis of where crime events concentrate surrounding specific transit nodes
within the Portland area.
50ft. Buffer
400ft. Buffer
800ft. Buffer
1200ft. Buffer
1600ft. Buffer

22
Chapter 3: Results
Overview of Macro-Level Analysis Findings:
The following sections examine whether burglary and robbery crimes concentrate
near mass-transit nodes in Portland. This examination assesses the total crime count and
percentage of all burglaries followed by robberies near mass-transit in Portland between
May 2015 and August 2018 (see Table 1). These counts facilitate the calculation of LQ
measures for each crime type. The findings of this macro level analysis provide the
framework for further meso and micro-level analyses in the research study.
Do Burglary Crimes Concentrate Near Mass-Transit?
There were 13,305 counts of burglary events reported to the Portland Police
Bureau Crime Database between May 2015 and August 2018, and falling within the city
limits. The events are considered according to their proximity to one of the 140 major
transit stops within Portland. In total, 741 burglaries occurred within a 400 foot buffer of
a transit node, equaling 5.4% of all events (see Table 1). The calculated LQs for the total
burglary crimes near the transit nodes is 4.1 (see Table 1). As a result, the macro-level
analysis finds burglary crime to exceed the threshold of 2.0, indicating considerable
Crime
Type
Total Area of 400 Foot
Buffers (Square Miles)
% of the
City Area
Number of Events
(400 Foot Buffers)
% of All
Events LQ
Burglary 1.9 1.3 741 5.5% 4.1
Robbery 1.9 1.3 591 19.2% 14.7
Table 1: Type of Crime by Area and Events with Location Quotient

23
concentration. At 4.1, the LQ indicates that burglary crimes are 4.1 times more
concentrated within close proximity to major transit nodes than the average rate of crime
per area across Portland. Given these findings, this crime type will be subject to further
meso- and micro-level analysis.
Do Robbery Crimes Concentrate Near Mass-Transit?
In order to compare the spatial patterns of two separate crime types, the same
macro-level spatial analysis is conducted using the 3,068 robbery events reported to the
Portland Police Bureau between May 2015 and August 2018. Of these events, 591
(19.2%) occurred within a 400 foot buffer of a transit node (see Table 1). The calculated
LQs for the total robbery crimes within a 400 ft. buffer resulted in a value of 14.7 (see
Table 1). The LQs for robberies near mass-transit well exceeded the threshold of 2.0,
which indicates there is a considerable concentration of robbery crime near mass-transit
when compared to Portland. Specifically, robbery crimes are 14.7 times more
concentrated near mass-transit nodes when compared with other areas of the city of
Portland. The macro-level analysis found robbery crime exceeds the threshold in this
research study, therefore, these robbery events and the specific transit nodes in Portland
have been subject to meso and micro analyses in the most highly concentrated geographic
areas.
Overview of Meso-Level Analysis Findings for Burglary:
Given the different types of stations grouped at the macro level (included Max
Light Rail services and Portland Streetcar), the meso stage aims to identify whether the

24
type of transit station impacts the concentration of burglary events. In total, there were 70
Max stations and 70 Portland Streetcar stops analyzed in the city limits of Portland. The
total burglary crime count within the 400 foot buffers was 741 events, or 5.5 percent of
all burglaries (see Table 2). When examining Table 2, the Max Light Rail and Portland
Streetcar station totals for burglary count add up to 783 events, due to the overlap of 42
events occurring within 400 feet of both a Max stop and a streetcar stop, and are thus
included in the total crime of both transit types.
Table 2: Meso-Analysis of Burglary by Type of Transit Node
Examining Max-Light Rail Transit Nodes:
The examined 400-foot buffers surrounding each Max station equated to
30,322,089.3 square feet, or approximately 1.09 square miles; approximately 1.0 percent
of the total geographic area of Portland. Of the total 13,305 burglary events, the count of
burglaries within the examined Max Light Rail spatial buffers was 284. The Max Light
Rail buffers contained approximately 2.1 percent of all burglaries across Portland, and
36.7 percent of all burglaries located near mass transit nodes (see Table 2). The
calculated LQs for burglaries near Max-transit stops was 2.8, inferring burglary is 2.8
Transit
Type
Number of
Stations
Total Burglary
Count (400 Foot
Buffers)
Total % of
All
Burglaries
Total % of All
Burglaries Near
Transit
LQ
Max
Light
Rail
70 284 2.1% 36.7% 2.8
Portland
Streetcar 70 489 3.7% 63.3% 5.9
Total 140 741 5.5% 100.0% 4.1

25
times more concentrated near the Max Light Rail stops when compared to the spatial
dispersion in Portland (see Table 2).
Examining Portland Streetcar Transit Nodes:
Reviewing the Portland Streetcar stations, there were a total of 70 examined
transit stops comprised of 4 lines. The lines are the A loop, B loop, North South (NS) A
and NS B lines. The total area of the 400 foot spatial buffers surrounding all of the stops
was 25,101,591.5 square feet or 0.9 square miles. The count of burglary crime within the
buffers was 489 events or 3.7 percent of all burglaries in Portland (see Table 2).
Approximately 63.3 percent of all burglary events occurring near a transit node
concentrated near streetcar stops. The calculated LQ for Portland Streetcar stops was 5.9,
indicating the occurrence of burglary near Portland Streetcar transit nodes was 5.9 times
greater than the dispersion of burglaries in the Portland geographic area.
Overview of Meso-Level Analysis for Robbery:
Continuing the meso-level analysis from burglary to robbery crime, the types of
stations categorized at the macro level are further explored to determine whether the type
of transit impacts the concentration of robbery events. The following sections explore
robbery, by examining the spatial-concentration of robbery events based on the type of
station.

26
Table 3: Meso-Analysis of Robbery by Type of Transit Node
Examining Max Light Rail Transit Nodes:
Of the total 3,068 robbery events, 382, or 12.4 percent of all robberies in Portland
occurred within the examined Max Light Rail spatial buffers (see Table 3). Of all robbery
events occurring in proximity to transit lines, 61.2 percent occurred near a Max Light
Rail station (see Table 3). The calculated LQ for robberies near a Max-transit station was
16.6, meaning robbery events were 16.6 times more concentrated near the Max Light Rail
when compared to the spatial distribution of the crime in Portland (see Table 3).
Examining Portland Streetcar Transit Nodes:
When reviewing the Portland Streetcar nodes, the total count of robbery events
within the 400 foot buffers was 242 crimes, or approximately 7.8 percent of all robberies
(see Table 3). This equates to 38.8 percent of all robberies occurring near a major transit
node. The calculated LQ for Portland Streetcar was 12.7, meaning the occurrence of
robbery near Portland Streetcar was 12.7 times greater than the distribution of robberies
in Portland.
Transit
Type
Number
of Stations
Total Robbery Crime
Count (400 Foot
Buffers)
Total % of
All Robberies
Total % of All
Robberies Near
Transit
LQ
Max
Light Rail
70 382 12.4% 61.2% 16.6
Portland
Streetcar 70 241 7.8% 38.8% 12.7
Total 140 591 19.2% 100.0% 14.7

27
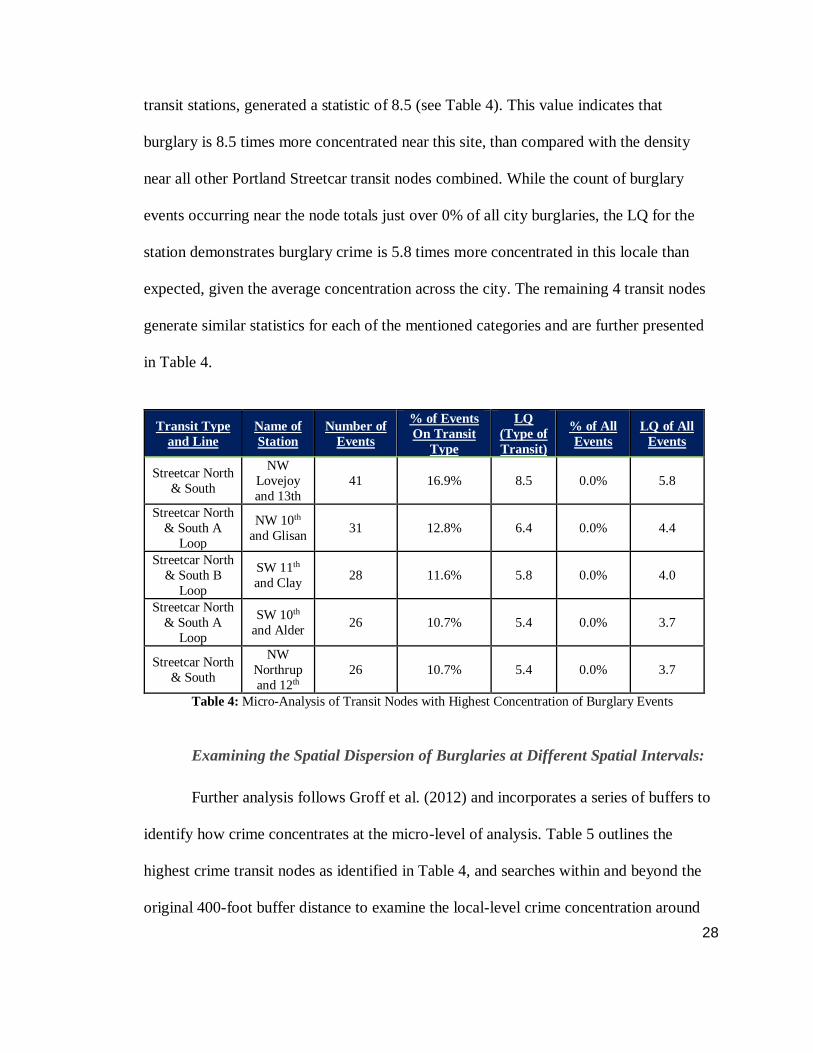
Overview of Micro-Level Analysis Findings for Burglary Crime:
At the micro-scale, the study investigates the five highest-crime transit nodes to
explore how these events concentrate near these important locations. Table 4 reviews the
micro-level analysis of the transit nodes with the highest concentrations of burglary
crime. The list includes the following: NW Lovejoy and 13th (Portland Streetcar North &
South) NW 10th and Glisan (Portland Streetcar North and South A Loop), SW 11th and
Clay (Portland Streetcar North and South B Loop, SW 10th and Alder (Portland Streetcar
North and South A Loop), and NW Northrup and 12th (Portland Streetcar North and
South). A breakdown of the total robbery count surrounding each station, as well as the
percentage of robberies on the type of transit line, has been provided. In addition, Table 4
reviews the calculated LQs specific to the transit line, the percentage of all robberies and
calculated LQs for each type of transit in relation to all robbery crime in Portland. For
instance, the transit type, line and station with the highest concentration of robbery events
was the Streetcar North and South Lovejoy and 13th node. This transit node station is
further broken down in the following section to outline the setup of Table 4.
In total, there were 41 events occurring within a 400 foot buffer of the Streetcar
North and South Lovejoy and 13th node (see Table 4). In relation to all burglary crime
occuring near a Portland Streetcar node, 16.9 percent of the burglaries occurred near this
specific station (see Table 4). The calculated LQ (Type of Transit) compares the
concentration of burglary events near this specific transit node, in relationship to the
concentration of burglary events near nodes on the same transit type. The value for the
NW Lovejoy and 13th transit node, in relationship to all analyzed Portland Streetcar
28
transit stations, generated a statistic of 8.5 (see Table 4). This value indicates that
burglary is 8.5 times more concentrated near this site, than compared with the density
near all other Portland Streetcar transit nodes combined. While the count of burglary
events occurring near the node totals just over 0% of all city burglaries, the LQ for the
station demonstrates burglary crime is 5.8 times more concentrated in this locale than
expected, given the average concentration across the city. The remaining 4 transit nodes
generate similar statistics for each of the mentioned categories and are further presented
in Table 4.
Table 4: Micro-Analysis of Transit Nodes with Highest Concentration of Burglary Events
Examining the Spatial Dispersion of Burglaries at Different Spatial Intervals:
Further analysis follows Groff et al. (2012) and incorporates a series of buffers to
identify how crime concentrates at the micro-level of analysis. Table 5 outlines the
highest crime transit nodes as identified in Table 4, and searches within and beyond the
original 400-foot buffer distance to examine the local-level crime concentration around
Transit Type
and Line
Name of
Station
Number of
Events
% of Events
On Transit
Type
LQ
(Type of
Transit)
% of All
Events
LQ of All
Events
Streetcar North
& South
NW
Lovejoy
and 13th
41 16.9% 8.5 0.0% 5.8
Streetcar North
& South A
Loop
NW 10th
and Glisan 31 12.8% 6.4 0.0% 4.4
Streetcar North
& South B
Loop
SW 11th
and Clay 28 11.6% 5.8 0.0% 4.0
Streetcar North
& South A
Loop
SW 10th
and Alder 26 10.7% 5.4 0.0% 3.7
Streetcar North
& South
NW
Northrup
and 12th
26 10.7% 5.4 0.0% 3.7

29
each site. The results of Table 5 demonstrate micro-level variations between stations,
illustrating that burglaries increase as distance from some high-crime stations increase
and decrease as distance from other stations increase. These findings present an
opportunity for specific intervention of community services at different distances from
each of the mass-transit node areas; further addressed in the discussion section of this
research study. The following sections provide a breakdown of the variation in the spatial
dispersion of burglaries as the distance from stations increases for each of the highest
crime transit nodes.
Table 5: LQs by Transit Node and Buffer Area for Burglary Events
0 Foot to 50 Foot Buffer:
Upon identifying the five stations with highest concentrations of burglary within
400 feet, the study explores within this distance to measure crime located at the station
itself. The micro-level analysis draws further comparisons with the work of Groff and
McCord (2012), who examined the spatial dispersion of crimes using a 0 to 50 ft. or
Transit Node 0-50 ft. 50-400 ft. 400-800 ft. 800-1200 ft. 1200-1600 ft.
NW Lovejoy
and 13th 0 6.6 3.7 8.4 12.5
NW 10th and
Glisan 0 5.0 7.1 5.5 13.9
SW 11th and
Clay 0 4.5 4.7 8.2 4.3
SW 10th and
Alder 0 4.2 4.0 6.0 9.9
NW Northrup
and 12th 0 4.2 5.2 7.2 7.0

30
0.009 square mile spatial buffer. Results displayed in Table 5 indicate that none of the top
five transit nodes recorded a single event in the immediate 50 foot spatial buffer. When
extending this analysis to all transit nodes (results not shown), the maximum count was
five burglaries within 50 meters of a station, with the mean count of burglaries within 50
feet of a transit node being 0.3. Overall, the majority of transit nodes did not experience a
single burglary event within the 0 to 50 foot buffer.
50 Foot to 400 Foot Buffer:
The change from a 0 to 50 foot buffer, to a 50 to 400 foot buffer presents a
considerable increase in burglary events. Specifically, the highest location quotient value
among transit nodes was recorded at NW Lovejoy and 13th (with a LQ value of 6.6),
inferring that burglaries are 6.6 times more concentrated near this mass-transit station
compared to all other areas in Portland. The other highest-crime transit nodes generated
similar values with LQ values in the 4.0-5.0 range (see Table 5).
400 Foot to 800 Foot Buffer:
The increase in buffer distance to a range of 400 to 800 feet beyond the transit
node generated mixed results regarding whether the concentration of crime increases or
decreases at this distance. For instance, NW 10th and Glisan increased from a LQ value of
5.0 (between 50 and 400 feet from the station), to a LQ value of 7.1 within a 400 to 800
foot buffer distance. NW Northrup and 12th also displayed a smaller increase in
concentration. However, NW Lovejoy and 13th display a marked decreased in the
concentration of crime, dropping from an LQ of 6.6, to an LQ of 3.7. SW 11th and Clay,

31
and SW 10th and Alder both generated a similar LQ value to the previous buffer distance,
inferring that as the spatial area changes, the transit node maintained a constant
concentration of burglary offenses.
800 Foot to 1200 Foot Buffer:
The area change from a 400-800 foot to 800-1200 foot found the concentration of
burglaries to increase at 4 of the 5 ranked transit nodes. NW Lovejoy and 13th, SW 11th
and Clay, SW 10th and Alder, and NW Northrup and 12th increased in the concentration
of burglary events after increasing the spatial area by an additional 400 foot buffer
surrounding the nodes. The only transit node decreasing in the concentration of events
was NW 10th and Glisan, where concentrations dropped from an LQ of 7.1, to 5.5.
1200 Foot to 1600 Foot Buffer:
The final spatial change also generated inconsistent findings concerning whether
burglaries increase, decrease, or remain constant as the spatial area changes. NW Lovejoy
and 13th, NW 10th and Glisan and SW 10th and Alder indicated a considerable increase in
concentrations of burglaries between 1200 and 1600 feet from the station, while SW 11th
and Clay showed a considerably decreased concentration of burglary events. NW
Northrup and 12th was found to change minimally by a reduced concentration value of
0.2.

32
Overview of Micro-Level Analysis Findings for Robbery Crime:
At the micro-scale, the study also examined the five transit nodes reporting the
highest concentration of robbery events, in order to explore how such events concentrate
near mass transit nodes in Portland. Table 6 shows the micro-level analysis of transit
nodes with the highest concentrations of robbery in Portland. The list includes the
following: Union Station & NW 6th and Hoyt (Green Yellow Max), Pioneer Courthouse
& SW 6th (Blue Green Red Max), Lloyd Center & NE 11th Ave (Blue Green Red Max),
Skidmore Fountain (Blue Red Max), and Art Museum (Portland Streetcar North & South
A Loop). Each station is listed according to the type of transit, including the line name. A
breakdown of the total robbery count surrounding each station as well as the percentage
of robberies on the type of transit line has been provided. In addition, Table 6 shows the
calculated LQs specific to the transit type, the percentage of all robberies and calculated
LQs for each type of transit in relation to all robbery crime in Portland. For instance, the
transit type, line and station with the highest concentration of robbery events was the
Green/Yellow Max, Union Station & NW 6th and Hoyt node. In total, there were 44
robbery events occuring within a 400 foot buffer of the transit node (see Table 6). The
following section further describes this station in reference to Table 6.
In relationship to all robbery crime occurring within a 400 foot buffer of the
Trimet nodes, 11.5 percent of robberies occurred at the Green/Yellow Max, Union
Station & NW 6th and Hoyt node (see Table 6). The calculated LQ value for this transit
node in relationship to all analyzed Max transit station generated a value of 1.7 (see Table
6). The value infers the concentration of robbery is 1.7 times more concentrated at this

33
station, than the dispersion of robbery events near all Max transit nodes in Portland. In
relation to the total robbery events in the city of Portland, 1.4 percent of these crimes
occurred at this station (see Table 6). The calculated LQ examining the spatial
concentration of robberies at this station in comparison to the dispersion of these events
in the greater Portland area generated a LQ value of 27.7 (see Table 6). This value infers
that robbery crime is 27.7 times more concentrated than the geographic dispersion of
these events in Portland. The remaining four transit nodes generate similar statistics for
each of the mentioned categories and are further presented in Table 6.
Transit Type
and Line
Name of
Station
Number of
Events
% of Events
On Transit
Type
LQ
(Type of
Transit)
% of All
Events
LQ of All
Events
Green Yellow
Max
Union
Station &
NW 6th
and Hoyt
44 11.5% 1.7 1.4% 27.7
Blue Green
Red Max
Pioneer
Courthouse
& SW 6th
40 10.5% 1.5 1.3% 25.2
Blue Green
Red Max
Lloyd
Center &
NE 11th
Ave
34 8.9% 1.3 1.1% 21.4
Blue Red Max Skidmore
Fountain 32 8.4% 1.2 1.0% 20.2
Streetcar
North & South
A Loop
Art
Museum 28 7.3% 1.1 0.9% 17.7
Table 6: Micro Analysis of Transit Nodes with Highest Concentration of Robbery Events
Examining the Spatial Dispersion of Robberies at Different Spatial-Intervals:
With an understanding of which stations have the highest concentration of
robbery crime, the next phase of this micro-level analysis explores the concentration of
robbery events at these stations at a variety of distances from the nodes, themselves.

34
Table 7 describes each of the transit nodes listed in Table 7 with calculated LQs
following the different spatial buffers examined by the literature. The results of Table 7
demonstrate variation in micro-spatial concentrations according to each high-crime
station. The following sections provide a breakdown of the variation in the spatial-
dispersion of robberies as the spatial area increases for each of the ranked transit nodes.
Table 7: LQs by Transit Node and Buffer Area for Robbery Events
0 Foot to 50 Foot Buffer:
Table 7 reviews each of the transit nodes with the highest concentrations of
robbery within the initial 400 foot analyzed buffer. Results indicate considerable
concentrations of robbery crime near Union Station & NW 6th and Hoyt (with a reported
LQ value of 73.6), and Lloyd Center and NE 11th Ave (LQ value of 141.9). The values
indicate both stations have very high concentrations of robberies within a 50 foot spatial
buffer surrounding the transit station. The count of robberies within a 50 foot area
surrounding Union Station and NW 6th and Hoyt is approximately 73.6 times more
concentrated compared to the spatial dispersion of robberies in Portland. The count of
Transit Node 0-50 ft. 50-400 ft. 400-800 ft. 800-1200 ft. 1200-1600 ft.
Union Station &
NW 6th and
Hoyt
73.6 20.1 14.5 14.5 34.7
Pioneer
Courthouse &
SW 6th Ave.
5.3 27.9 34.1 39.1 31.5
Lloyd Center
and NE 11th
Ave.
141.9 31.5 37.2 8.8 8.8
Skidmore
Fountain 5.3 162.9 16.4 24.0 33.4
Art Museum 10.5 136.6 6.3 17.0 31.5

35
robberies within a 50 foot spatial area of the Lloyd Center and NE 11th Ave is
approximately 141.9 times more concentrated than the spatial dispersion of robberies in
Portland. The remaining top-five stations each report lower LQ values that still exceed
the 2.0 threshold, indicating that these stations also contain considerably more robberies
within this area than other spaces within Portland as a whole. For instance, Pioneer
Courthouse and SW 6th Avenue, and Skidmore Fountain only had one crime count each
within a 50 foot area of the transit nodes. These stations exceeded the threshold for
micro-analysis with a LQ value greater than 2.0. Robberies are 5.3 times more
concentrated at these stations when compared to the spatial dispersion of the crime in
Portland. The Art Museum had two crime events within a 50 foot buffer, resulting in a
LQs value of 10.5, therefore, robberies near the Art Museum transit node are 10.5 times
more concentrated than the spatial-dispersion of the crime within Portland.
50 Foot to 400 Foot Buffer:
When examining the 50 to 400 foot buffer interval, there was considerable
variation within each of the high crime transit nodes events. For example, the Union
Station & NW 6th and Hoyt transit station decreased from an LQ of 20.1 at the 0 to 50
foot buffer to a LQ value of 14.5 within a 50 to 400 buffer. The Lloyd Center and NE 11th
Ave node followed a similar pattern in decreasing in the spatial concentration of robbery
crime at this level of analysis. The remaining three transit nodes, Skidmore Foundation,
Pioneer Courthouse and the Art Museum increased in the count of robbery events from a
0 to 50 foot buffer to a 50 foot to 400 foot buffer.

36
400 Foot to 800 Foot Buffer:
When the buffer expanded from 400 feet to 800 feet, the LQ value decreased for
Union Station and NW 6th and Hoyt, Skidmore Fountain and the Art Museum. Union
Station and NW 6th and Hoyt decreased from a LQ value of 20.1 to 14.5; indicating the
concentration of robberies decreased as the spatial area increased away from the transit
node. While, the Lloyd Center and NE 11th Ave transit stop experienced an increase with
a location quotient change from 31.5 to 37.2 and Pioneer Courthouse from a LQ value of
27.9 to 34.1; indicating the concentration of robberies increased as the spatial area
increased away from these transit nodes.
800 Foot to 1200 Foot Buffer:
When considering the 800 to 1200 foot buffer interval, there was also variation in
concentrations among each of the transit nodes. For instance, Union Station & NW 6th
and Hoyt maintained a consistent crime count and LQ value of 14.5. However, Pioneer
Courthouse & SW 6th Ave, Skidmore Fountain and the Art Museum transit nodes showed
an increase in the concentration of robberies within the buffer area. The only transit node
experiencing a decreased concentration of events was the Lloyd Center and NE 11th Ave,
which dropped considerably from a LQ value of 37.2 at 400 to 800 feet, to a LQ value of
8.8 within the buffer distance of 800 to 1200 feet from the station.
1200 Foot to 1600 Foot Buffer:
When examining the 800 to 1200 foot buffer to 1200-1600 foot buffer, further
variation exists between each of the top five transit nodes. For example, the Union

37
Station & NW 6th and Hoyt, Skidmore Fountain and Art Museum stations experienced a
dramatic increase in the spatial concentration of robberies. In contrast, the Lloyd Center
and NE 11th Ave transit node remained constant after the buffer change with a calculated
LQ value of 8.8. The only transit node that experienced a decrease in the amount of
robbery events was Pioneer Courthouse and SW 6th Ave, which decreased from an LQ of
39.1 to an LQ of 31.5 at the 1200 to 1600 foot distance.

38
Chapter 4: Discussion and Future Directions
The objective of the study is to add the conversation in the literature surrounding
the relationship between mass-transit, and the concentration of burglary and robbery
crimes. Empirical studies by Sherman et al. (1989), Loukaitou-Sideris et al. (2002), Kooi
(2003), and Hart and Miethe (2014) have found crime to concentrate near mass-
transportation and other activity nodes. More recent literature such as Gallison (2016),
Gallison and Andresen (2017), Ridgeway and MacDonald (2017), however, did not
support the findings.
The current research adds to the conversation in the literature by exploring crime
patterns near mass-transit at the macro, meso and micro levels of analysis within
Portland. The impact of the research adds to local knowledge about crime patterns near
transit, finding that burglary and robbery events are more concentrated near mass-transit
nodes elsewhere in the city. Burglary crime was found to concentrate near mass-transit
nodes at a rate that was approximately 4.2 times more than the average concentration of
crime per area in Portland as a whole. By comparison, robbery crime was found to
concentrate near mass-transit nodes at a rate 14.7 times higher than elsewhere in the city.
The difference in concentration near mass-transit nodes for each of the crime types has
opened the door for further exploration at different spatial levels of analysis. As a result,
this study drew comparisons between different categories of transportation node, and
further explored the areas surrounding specific transit stations reporting
disproportionately high concentrations of these offenses. Results from the study may
serve to aid in improved resource allocation, while increasing public understanding about

39
how crime concentrates near major transit nodes in Portland. Beyond this locale, the
study furthers understanding about the importance of considering transit node type, and
crime type, when exploring the inter-relationships between transit and crime.
Recommendation from Literature for Conducting of a Macro-Level Analysis:
In determining whether transit impacts urban crime patters, previous studies have
conducted a variety of analyses in densely populated areas throughout the United States
such as Chicago, New York, Los Angeles and Washington D.C. The examinations have
frequently called for further replication to further analyze the accuracy and applicability
of the findings across a variety of study areas. Most recently, Ridgeway and Macdonald
(2017) studied Los Angeles rail stations and crime events reported to the Los Angeles
Police Department from 1988 to 2014. Their findings indicate rail transportation may
generate no major overall consequence for patterns of crime at the neighborhood level.
The study calls for future research to examine other cities at a micro-level of analysis.
The completion of the current research study in Portland aims to respond to the
call for further investigation. The study finds burglary and robbery events concentrate
near transit nodes at rates exceeding two times that of other areas within the city. The
findings set more opportunities for further analysis. Concentrations of crime near transit
nodes may be, in part, due to the confluence of opportunities at these locations, including
a higher number of targets brought to the locales by the transit nodes themselves. Further,
this may be associated with nearby businesses and establishments, accessible via the
transit nodes. While both burglary and robbery offenses were concentrated at and near
transit nodes, robbery events in these spaces occurred at considerably higher rates than

40
did burglary. The findings are reflective of what would be suggested by environmental
criminology theory, as the influx of people around these spaces may increase, the
presence of, both opportunities and motivated offenders for robbery events, while
increasing access may facilitate burglary events nearby the locations. A common theme
in the literature discussed how transportation can frame opportunities for crime within the
surrounding community due to an influx of people and an associated increase in
opportunity (Louikatiou-Sideris, 1999; Brantingham et al., 1991). Further studies should
explore the surrounding environment and land use characteristics located in close
proximity to transit nodes.
Meso-Level Findings:
When comparing different activity and transit nodes, it is important to note how
each may differently relate to crime in the nearby urban environment. Many locations
bring together a large number of people in a small geographic area when compared with
the relative spatial dispersion across an urban city. With an increased influx of people
situated around an activity node and examined spatial area, Groff and McCord (2012)
have found areas with an LQ value exceeding the 2.0 threshold had a higher probability
of promoting the observed occurrences of crime within the studied environment.
Criminologists such as Loukaitou-Sideris (1999) and Brantingham et al. (1991) argued
that public transportation frames opportunities for criminal acts due to moving a large
proportion of a high-risk population around the community with a restricted number of
destinations and paths. Ultimately, establishments located near mass-transportation
stations and routes may be at higher risk of burglary and robbery crime. Clustering and

41
patterning of the concentrations was found to be substantially influenced by how and why
people travel and move in a city. Andresen (2016) states “there will be concentrations of
overlapping activity nodes and within those nodes, some situations that become crime
generators and some that are crime attractors” (Brantingham et al., 1991; Andresen, 2016,
112).
This research examines two types of mass-transit nodes in Portland which move
the community of Portland, daily around the built environment. The transit nodes
included Max Light Rail and Portland Streetcar stations, totaling 140 stations. The task of
identifying specific types of transit in need of resources and intervention can be a
challenging task for stakeholders and executives administering the operation of these
services. At the meso-level, this research identifies Max Light Rail as experiencing the
highest concentration of robbery crimes, compared with Portland Streetcar services. The
level of concentration was dispersed throughout the Max stops, as there was minimal
variation between the ranked transit nodes found to have the highest concentration of
events. The ranked transit nodes generated LQ values in the 1.0 to 2.0 range, suggesting
the nodes experiencing the highest concentration of events were similar if not slightly
above the average concentration of crime near all Max stops. Portland Streetcar stops also
exceeded the 2.0 threshold, and experienced a high concentration of robbery events near
the analyzed transit nodes. In relationship to burglary crimes, Portland Streetcar had the
highest count and LQ value for burglary events, followed by Max-Light Rail, indicating
that Streetcar stops may be more important when analyzing burglary events. Further
studies must explore the land use mixes surrounding each type of transit node to further
understand these findings. These findings continue the conversation in the examination of

42
how different types of transit impact may impact crime and how the type of crime may
concentrate differently around transit.
Going forward, I look to supplement this analysis by examining ridership data
provided by Trimet and the Oregon Department of Public Transportation, as well as
transit line data to pinpoint robbery concentrations at each transit type. In addition, I
would consider using the approach of Loukaitou-Sideris et al. (2002) and the analysis of
the Green Line Transit which extend into several counties in Los Angeles. This approach
was also modeled by Clark and Belanger (1996) in mapping the New York subway
system and analyzing the distribution of crime at different nodes. I would also consider
the extension of Portland Trimet services outside of Portland city limits, such as in
Washington County, where an additional 40 Trimet stops and the WES Commuter rail
extend into Milwaukee, Tualatin, Tigard and Beaverton. By examining the full
transportation route of Max light rail services, this study could explore the potential
comparison between how crime is concentrated near mass-transit within Portland city
limits in relationship to other locales while analyzing the same transit type. For example,
this study would be able to compare the percentage of a total crime type occuring at a
specific Max station, with all Max stations throughout the Portland and the surrounding
environments. Furthermore, I draw comparisons to other types of transit, such as Portland
Streetcar, where 40 other Max stations would be included in the calculation of the total
buffer area, counts of crime and LQ values. This would require an extension of this study
with reliable data from each of the areas.

43
Micro-Level Findings:
Similar to the work of Groff and McCord (2012) and McCord and Ratcliffe
(2007), this study conducted a micro-level analysis to identify where robbery crimes are
most highly concentrated and at what spatial area of analysis. In relation to the literature,
the use of LQs to determine the concentration of crime near mass-transit and other
activity nodes revealed different empirical findings. McCord and Ratcliffe (2007),
examined the micro-level spatial analysis of drug markets in Philadelphia, Pennsylvania.
Using a 400 foot spatial buffer, McCord and Ratcliffe calculated a LQs value identifying
drug arrests as being clustered within 400 feet of subway stations. Similar to the
methodology of McCord and Ratcliffe (2007), Groff and McCord (2012) examined the
role of parks as crime generators at the neighborhood level. Their LQs revealed the
concentration of property, violent and disorder crime to be more clustered around, and in,
parks.
Unlike Groff and McCord, however, I did not find similar patterns in the increase
or decrease of burglary or robbery crime with different spatial areas. I found inconsistent
results in regard to whether robberies or burglaries increased or decreased as the buffer
extended into the surrounding environment. Despite inconsistent findings, I determined
where the highest concentrations of robberies and burglaries fell in relationship to the
distance from the transit node being explored. For example, I found a high concentration
of robbery events within a 50 foot spatial area of the Lloyd Center & NE 11th Ave and
Union Station & NW 6th and Hoyt transit nodes. Whereas, other transit nodes such as the
Art Museum and Skidmore Fountain were found to have increased concentrations of

44
robbery further away from the transit stop and into the immediate environment. In
addition, I considered the accuracy and efficiency of the buffer areas for the specific
types of crime. For example, the smaller buffer areas such as the 0 to 50 foot and 50 to
400 foot ranges showed high concentrations of robbery counted. For the crime type of
burglary, however, there were no crime counts that occurred within a 0 to 50 foot buffer.
This may be in part due to the limited opportunity for burglary events within the
environment. Therefore, the 50 to 400 foot measurement was a more effective method of
measuring the spatial concentration of this crime type near the analyzed transit nodes.
The findings and the reflection on the methodology are important for understanding the
best methodological approach to measuring the concentration of robbery and burglary
based on the type of crime for resource allocation and intervention in determining where
these events are being reported and committed with opportunities for CPTED and
Situational Crime Prevention with the identified area at the micro-level of analysis.
Limitations:
In advancing the work of the empirical study, special regard should be given to
the use of secondary data, overlapping of spatial buffers and inflation of crime counts,
and the timeframe of available data collection. The use of secondary data from a public
service database (Portland Police Bureau, 2018), does not allow for the fine-coded
spatial-analysis of crime events within a densely populated urban area recommended by
Ridgeway and Macdonald (2017). The data source used therein incorporates longitude
and latitude coordinates for each burglary and robbery offense, though, the point data was
aggregated to the street block or intersection level to protect the identity and location of

45
victims associated with the crimes. As a result, the smaller micro-level findings may be
impacted by the method of data reporting. Specific to Portland, the examination of
specific addresses for crime events requires an MOU agreement between the public
service agency recording the data (e.g., Portland Police Bureau) and the researcher or
partnering institution examining the material. Due to the timeline of this project, an MOU
agreement was unable to be incorporated into the research. If the researcher had an
extended timeframe to conduct a similar project, it is recommended an agreement
between the database service and the researcher be incorporated to fully analyze the
spatial-concentration of crime within specific geographic locations.
Another consideration in examining the spatial concentration and dispersion of
crime at different spatial-levels concerns the use of reported crime data in a research
study. When using reported crime data, especially to a public service agency, such as a
police department, the data may not be representative of all crime events occurring from
a geographic context. Without an account for all crime events, whether reported or
unreported, the study is only able to recommend specific interventions and target
hardening for types of transit and specific stations which are represented with the
available secondary data. The limitation also speaks to the ability to evaluate 3-years of
data as provided by the Portland Police Bureau between May 2015 to August 2018. Due
to missing data prior to May 2015, the study was unable to fully address data from 2015
and potentially, previous years for the temporal component.
When considering the generalization of the empirical study, the research provides
recommendations specific to recent robbery and burglary crime, as well as the 140
analyzed transit nodes in Portland. In addition, the study adds to the conversation in the

46
literature, regarding the concentration of crime near mass transit in a densely populated
urban area that has not been previously examined. I recommend for research in other
densely populated urban areas to continue the empirical conversation and to further
address the discourse in the empirical literature with a continuation and analysis of the
utility of the methodologies with presented findings, interpretations and
recommendations for further empirical research at the macro-, meso- and micro-level of
analyses.
Recommendation for Future Research:
Previous research studies have either examined crime from a macro-, meso- or
micro-perspective without systematically following the methodologies to identify full
concentrations of crime in a geographic area. Without this level of in-depth analysis, it
may be concluded crime does not concentrate at a specific unit of analysis, therefore, lead
to a lack of resources, funding and attention to transit crime impacting the environment at
the macro-, meso- and micro-unit of analyses. This is especially important when
considering the impact mass-transit may have at the city, neighborhood and immediate
environment surrounding transit nodes. Similar to other activity nodes, transit can act as a
crime generator and potentially, attractors in which a large quantity of people congregate
by accessing and getting off of these transportation routes. Furthermore, transit stops may
develop opportunities and a reputation for committing criminal acts without a level of
deterrence observed at more manageable establishments such as parking facilities, malls,
and restaurants. Surrounding businesses which may not be within the literature’s
spatially-examined vicinity of mass-transit may still be at increased risk of potential

47
victimization, as observed in the mapping of commercial establishments and the
heightened crime densities immediately surrounding these buildings.
When considering the concentration of robbery and robbery within a geographic
area, it is necessary to fully evaluate the dispersion of recorded crime in the environment.
From the macro perspective, robbery crime demonstrated a high concentration in specific
Portland neighborhoods. Burglary events on the other hand, were scattered throughout
Portland city limits with less concentration that was modeled in the LQ calculations. The
findings indicate that crime concentrates around transit, but concentrates differently, so it
is important to not aggregate crime types, in order to fully understand the impact of this
type of land use. To achieve the optimal implementation of policy and resources, further
analysis is necessary at the meso- and micro- levels within these districts. At the meso-
level, this study found the type of transit matters, as crime concentrated differently
around each type of transit. At the micro-level, the analysis was of critical importance as
it indicated variation from node to node and that some stations have higher crime than
others.
Conclusion
The goal of the research study was to continue the conversation of the literature in
assessing how robbery and burglary crimes are concentrated near mass-transit in a highly
concentrated geographic area. To answer this question, I conducted a quantitative
analysis at the macro, meso and micro level of analysis to explore the concentration and
clustering of crime near mass-transit nodes, specific types of transit and stations in
Portland. The study found robbery to be highly concentrated near mass-transit nodes.
48
Burglary events near mass-transit were less concentrated, but still met the threshold of
concentration to conduct further meso- and micro-level analyses. As a result, the study
examined the specific concentration of robbery and burglary offenses near different types
of mass-transit and found Trimet services had the highest concentrations of robbery and
Portland Streetcar to have the highest concentrations of burglary. At the micro-level of
analysis, the study found inconsistent findings regarding whether robbery and burglary
crime increased or decreased as the spatial area increased/expanded into the surrounding
environment away from the transit station. Despite these inconsistencies, I was able to
provide a complete spatial-analysis of the dispersion and clustering of robbery and
burglary crime for each of the transit nodes identified as having the highest
concentrations of robbery in Portland city limits. By providing this level of in-depth
analysis, the research serves as a resource to local public safety agencies such as the
Portland Police Bureau for specific intervention and resource allocation in addressing the
disproportionate concentration of these offenses. I recommend future research continue to
add the conversation regarding whether crime concentrates near mass transit, with the
recommendation of analyzing non-aggregated crime data, a more extensive data
collection timeline, and a complete analysis of the transit line extending into different
geographic areas.

49
References
Altstadt, R. (2018, May 23). TriMet continues to grow safety and security as 2017 reported
offenses on, near transit system released. Retrieved October 18, 2018, from
http://news.trimet.org/2018/05/trimet-continues-to-grow-safety-and-security-as-2017-reported-offenses-on-near-transit-system-released/
Bernasco, W., & Block, R. (2011). Robberies in Chicago: A block-level analysis of the influence of crime generators, crime attractors, and offender anchor points. Journal of Research in Crime and Delinquency, 48 (1), 33-57
Block, R., & Davis, S. (1996). The environs of rapid transit stations: A focus for street crime or just another risky place. Crime prevention studies, 6, 237-57.
Brantingham, P.L. and Brantingham, P.J. (1995) Criminality of place: Crime generators and crime attractors. European Journal on Criminal Policy and Research 3 (3), 1–26.
Brantingham, P. L., & Brantingham, P. J. (1998). Mapping crime for analytic purposes: location quotients, counts and rates. Crime mapping and crime prevention, 8, 263-288.
Brantingham, P. J., Brantingham, P. L., & Andresen, M. A. (2016). The geometry of crime and crime pattern theory. Environmental criminology and crime analysis, 98-115.
Brantingham, P. L., Brantingham, P. J., Vajihollahi, M., & Wuschke, K. (2009). Crime analysis at
multiple scales of aggregation: A topological approach. In Putting crime in its place (pp. 87-107). Springer, New York, NY.
Clarke, R. V., Belanger, M., & Eastman, J. (1996). Where angels fear to tread: A test in the New York City subway of the robbery/density hypothesis. Preventing Mass Transit Crime: Crime Prevention Studies, 6, 217-236.
Cole, S. (2007). The Regional Science of Tourism: An Overview. Journal of Regional Analysis & Policy, 37(3), 183-92.
DeGeneste H, Sullivan J: Policing Transportation Systems. Springfield, Illinois: Charles C. Thomas Inc; 1994.
Dumont, T. (2018, August 30). Despite rise in offenses, TriMet leaders confident in safety.
Retrieved October 18, 2018, from https://www.kptv.com/news/despite-rise-in-offenses-trimet-leaders-confident-in-safety/article_613943c1-3ff5-55cb-8163-012d7aa15c5d.html
Frank, R., Dabbaghian, V., Reid, A., Singh, S., Cinnamon, J., & Brantingham, P. (2011). Powerof
criminal attractors: modeling the pull of activity nodes. Journal of Artificial Societies and Social Simulation, 14(1), 6.
Gallison, J. K. (2016). The line of crime: Dismantling fears and concerns of crime along Vancouver SkyTrain’s Canada Line. Security Journal, 29(3), 485-500.

50
Gallison, J. K., & Andresen, M. A. (2017). Crime and public transportation: a case study of Ottawa’s O-Train system. Canadian Journal of Criminology and Criminal Justice, 59(1), 94-122.
Groff, E. (2011). Exploring ‘near’: Characterizing the spatial extent of drinking place influence
on crime. Australian & New Zealand Journal of Criminology, 44(2), 156–179. https://doi.org/10.1177/0004865811405253
Groff, E., & McCord, E. S. (2012). The role of neighborhood parks as crime generators. Security journal, 25(1), 1-24.
Hart, T. C., & Miethe, T. D. (2014). Street robbery and public bus stops: a case study of activity nodes and situational risk. Security Journal, 27(2), 180-193.
Kinney, J. B., Brantingham, P. L., Wuschke, K., Kirk, M. G., & Brantingham, P. J. (2008). Crime
attractors, generators and detractors: Land use and urban crime opportunities. Built environment, 34(1), 62-74.
Kooi, B. R. (2013). Assessing the correlation between bus stop densities and residential crime typologies.Crime prevention and community safety, 15(2), 81-105.
La Vigne, N. G. (1996). Safe transport: Security by design on the Washington metro. Preventing mass transit crime, 6, 163-197.
Loukaitou-Sideris, A., Liggett, R., & Iseki, H. (2002). The geography of transit crime:
Documentation and evaluation of crime incidence on and around the green line stations in Los Angeles. Journal of Planning Education and Research, 22(2), 135-151.
Loukaitou-Sideris, A. (1999). Hot spots of bus stop crime: The importance of environmental attributes. Journal of the American Planning association, 65(4), 395-411.
McCord, E. S., & Ratcliffe, J. H. (2007). A micro-spatial analysis of the demographic and
criminogenic environment of drug markets in Philadelphia. Australian & New Zealand
Journal of Criminology, 40(1), 43-63. Monthly Neighborhood Offense Statistics [Advertisement]. (2017, October 07).Retrieved January 25, 2018, from
https://www.portlandoregon.gov/police/71978 Strategic Services Division, Portland Police Bureau.
Newton, A. D., Partridge, H., & Gill, A. (2014). Above and below: measuring crime risk in and around underground mass transit systems. Crime Science, 3(1), 1.
Njus, E. (2017, July 26). Crime flat on TriMet, agency says, but data lacking. Retrieved October
18, 2018, from https://www.oregonlive.com/commuting/index.ssf/2017/07/crime _flat_on_trimet_agency_sa.html
Portland Police Bureau Crime Definitions. (2019). Retrieved April 15th, 2019 from https://www.portlandoregon.gov/police/article/573676
Portland Police Bureau Crime Database. (2018). Retrieved September 1st, 2018 from https://www.portlandoregon.gov/police/71978

51
Redden, J. (2017, October 05). TriMet: Ridership down because riders changing. Portland Tribune. Retrieved October 18, 2018, from https://portlandtribune.com/pt/9-news/374304-258557-trimet-ridership-down-because-riders-changing
Richards LG, Hoel LA: Planning Procedures for Improving Transit Station Security. Washington, DC: U.S. Department of Transportation; 1980.
Ridgeway, G., & MacDonald, J. (2017). Effect of Rail Transit on Crime: A Study of Los Angeles from 1988 to 2014. Journal Of Quantitative Criminology, 33(2), 277-291. doi:10.1007/s10940-016-9296-7.
Schlossberg, M., Dill, J., Ma, L., & Meyer, C. (2013). Measuring the performance of transit relative to livability.
Sedelmaier C: Railroaded: The Effects of a New Public Transport System upon Local Crime Patterns: Unpublished PhD Thesis. New Jersey: Rutgers University; 2003.
Sherman, L. W., Gartin, P. R., & Buerger, M. E. (1989). Hot spots of predatory crime: Routine Activities and the criminology of place. Criminology, 27(1), 27-56.
Smith, M. J., & Clarke, R. V. (2000). Crime and public transport. Crime and Justice, 27, 169- 233.
Trimet Annual Report: An Update For Our Riders And The Community (Rep.). (2018). Retrieved October 18, 2018, from Trimet website:https://trimet.org/annualreport/trimet-annual-report-2018.pdf
Trimet Ridership and Performance Statistics: Monthly Performance Data, Ridership Trends and
Rider Characteristics. (2018). Retrieved October 18, 2018, from https://trimet.org/about/performance.htm.
Vu Y: Bus Stops and Crime: Do Bus Stops Increase Crime Opportunities in Local Neighbourhoods? Unpublished PhD Thesis. New Jersey: Rutgers University; 2009.
Wuschke, K., & Kinney, J. B. (2018). Built Environment, Land Use, and Crime. The Oxford Handbook of Environmental Criminology, 475.