Embed Size (px)
DESCRIPTION
mineral nutrition
Citation preview

WELCOMEWELCOME

Effect of Chelated Trace Mineral Supplementation on Production Performance
in Ruminants
CREDIT SEMINARON

The word “chelate” is derived from Greek word “chele” means claw. The metal is held and protected in a claw like grip by the ligand. (mineral + ligand).
When metal ion combines with an electron donor, it forms a coordinate covalent bond & thus metal chelate is formed.
Ligand must contain a minimum of two functional groups (oxygen, nitrogen, amino or hydroxyl)
Introduction

Classification of Chelates
i. On the basis of source
a. Natural Chelates :
b. Synthetic Chelates :
•Chlorophyll •Cytochrome •Vit.B12•Haemoglobin
•Metal amino acid complex
•Metal polysaccharide complex
•EDTA-Zn
•proteinates

ii. On the basis of their action
• Type l:
chelates which help in storage & transport of metal ions.
e.g. metal amino acid , EDTA.
• Type ll.
Chelates essential in metabolism.
e.g. Heamoglobin , Cytochrome.
• Type lll.
Chelates which interfere in utilization of essential cations.
e.g. Phytic acid – Zn , Oxalic acid – Ca.

Types of Chelates and Other Complexes
1. Metal (Specific Amino Acid) Complex: e.g. CuLys Complex, ZnLys Complex, MnMet Complex.
2. Metal Amino Acid Complex: e.g. Cu amino acid complex, Zn amino acid complex etc.
3. Metal Amino Acid Chelate: e.g. Cu amino acid chelate, Zn amino acid chelate etc.
4. Metal Proteinate: e.g. Cu proteinate, Zn proteinate, Mn proteinate etc.
5. Metal Polysaccharide Complex: e.g. Cu polysaccharide complex etc.
(According to the AAFCO, 1997)

Mode of action
Chelated minerals must be stable in the rumen environment & abomasum but utilized in small intestine intact. (Kidds et al.,1998)
↑ Absorption of Zn from Zn-Met. May lead to a larger Zn pool , thereby ↑ Zn-metallothionine , plasma zinc & immune cell function. (Wedekind et al., 1992)
Zn-Methionine may be metabolized intact after absorption. (Spears et al., 1989)

Layout of Zn Uptake and Excretion
Dietary Zinc
Lumen of Intestine
Chelate
Inorganic Ionised
Diet
Non-Available Zn
Feacal Zn
Enterocytes
Zn-Pool
Metallothionine
Chelate Chelate
Plasma
Zn-Albumin Complex Pool
Tissue
PortalCir.
Liver
Hair
Kidney
Muscle
Bone
Panc-rease
Peri-pheral
Cir.
UrineShedding
(Kidd et al., 1996)
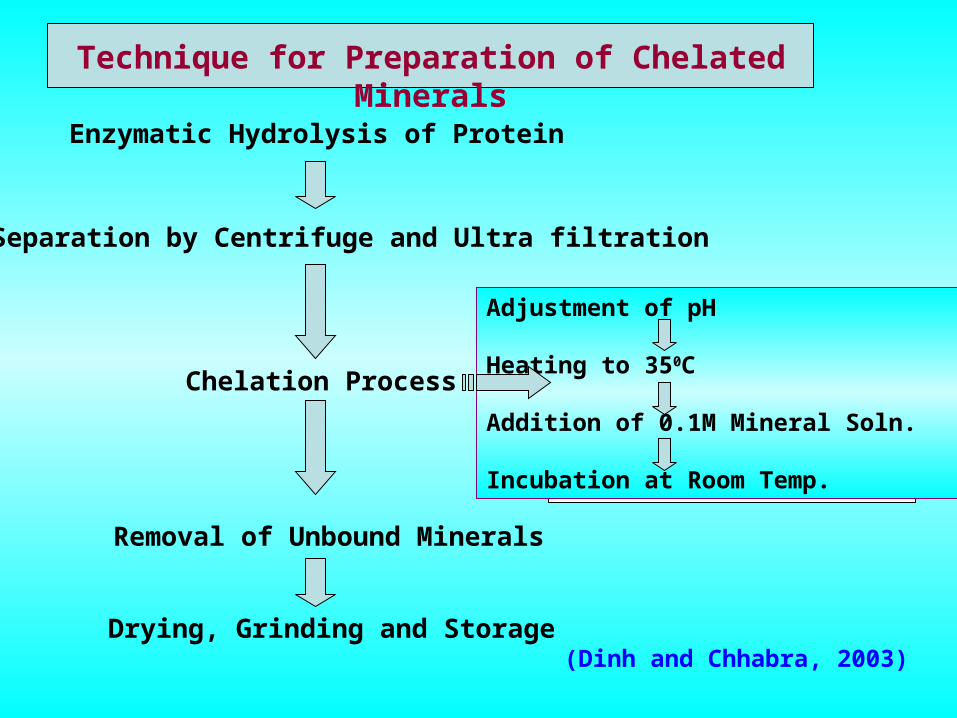
Technique for Preparation of Chelated Minerals
Enzymatic Hydrolysis of Protein
Separation by Centrifuge and Ultra filtration
Chelation Process
Drying, Grinding and Storage
Removal of Unbound Minerals
(Dinh and Chhabra, 2003)
Adjustment of pH
Heating to 350C
Addition of 0.1M Mineral Soln.
Incubation at Room Temp.

Significance of Chelated Minerals
Mineral chelates are
i. More bio-available.
ii. Highly stable. iii. Increase voluntary intake.
iv. Protected from forming complex with other dietary components that inhibit their absorption.
( e.g. phytate - ↓ zinc absorption)
(Ward et al., 1993)

Relative Bioavailability of Trace minerals from different sources in (%)
Minerals Sulfate Oxide Carbonate Chloride Organic form
Zn 100 - 60 40 159-206
Cu 100 0 - 105 130
Mn 100 58 28 - 176
Fe 100 0 0-75 - -
Co 100 31 110 - 85
(Greene et al., 1999)

Effect of form of mineral on performance of calves
Parameter Control Oxide Sulfate Complex
No. of animals
Initial BW (lbs)
31
454
31
454
31
456
31
452
Daily gain (lb/d)
2.93ab 2.76ab 2.69b 3.44a
DMI (lb/d) 9.9ab 10.1ab 10.0b 10.4a
(Ward et al., 1992)
a,b Values within a row with different superscripts varies (p<0.01)
Effect of chelated mineral supplementation on growth

Change in Body Wt. of goats at periodical interval (Kg)
periods Group 1 Group 2 Group 3 Group 4
Initial BW 12.90 + 1.15 12.90 + 1.44 12.93 + 1.01 12.93 + 0.92
15 days 13.68 + 1.20 13.83 + 1.13 13.84 + 1.04 13.87 + 0.95
30 days 14.46 + 1.26 14.74 + 1.15 14.83 + 1.08 14.88 + 0.99
45days 15.28 +1.30 15.73 + 1.33 16.02 + 1.09 15.94 + 1.01
60 days 16.31 + 1.22 16.68 + 1.22 17.30 + 1.13 17.14 + 0.97
75 days 17.35 + 1.17 17.76 + 1.09 18.52 + 1.13 18.25 + 0.98
90 days 18.18 + 1.12 18.68 + 1.07 19.48 + 1.12 19.38 + 0.90
Final BW 19.22 + 1.10 19.94 + 1.03 20.72 + 1.09 20.60 + 0.94
% Increase 51.02 + 4.66 57.04 + 5.69 61.78 + 4.46 60.91 + 5.16
ADG (g/d) 60.16a + 0.92 67.06b + 1.19 74.13c + 1.73 73.02c + 2.60
(Dihn, 2002)
Group 1 : Basal Diet + Protein Equiv. From SPIGroup 2 : Basal Diet + Protein Equiv. + Inorg. Cu, Mn, ZnGroup 3 : Basal Diet + Imported ChelatesGroup 4 : Basal Diet + Prepared Chelates

Ward et al., (1996) & McDonald (1995) found similar results in cattle with Cu Proteinate and in sheep with ZnLys.
Roshan Lal (1990) fed Karan Swiss calves with diets supplemented with Cu , Zn & Mn in chelated form and showed that ADG was better than control & ADG of the group fed 50% with mineral Chelate was almost similar to the animal fed 100% of mineral in inorganic form.
Puchla et al., (1999) found that Angora goats fed supplemented ZnMet diet had ↑ ADG in comparison to control goat receiving ZnO (65.5 vs 55.9 g/d).

Milk and Milk component Production in 1st Calf heifers given supplements of IOMs or AACs in a 305 day Milking Period
Study Groups
Mean Milk Prod.305
days
(kg)
Mean Prod./day
for 305 days
(kg)
Mean Milk Fat
(%)
Mean Total Milk
Fat
(kg)
Mean Milk Protein
(%)
Mean Total Milk Protein
(kg)
IOM group 10,047
+
1456.36
32.94 3.57
+
0.48
355.9
+
46.11 a
3.01
+
0.21
302.1
+
40.76 c
AAC group 10,568
+
911.76
34.65 3.76
+
0.35
389.1
+
47.02 b
3.06
+
0.17
326.4
+
29.89 d
(Ashmead et al., 2004)
Effect of chelated mineral supplementation on Milk Production and its components

Parnerkar (1991) fed 4 groups of cross bred cows with Albion chelates and Cu, Mn, Zn caseinate (prepared) and showed that the production of milk significantly differed between groups with the Albion chelates being the best, followed by the prepared chelates and inorganic form of minerals.
In Bombay veterinary college (2002) researchers reported 15% ↑ in total milk production and milk fat ↑ from 3.67 to 4.16 % in cross bred cows (Gir Holstein Jersey) supplemented with a mixture of Cu, Co, Zn, Mn AAC. The % of milk protein was same for both groups.
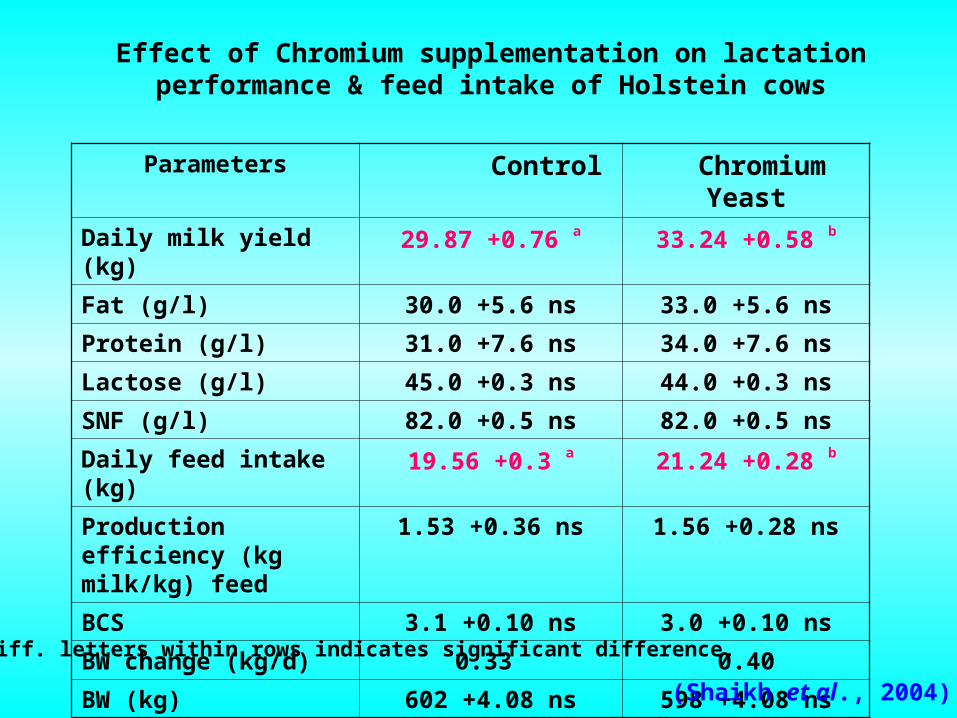
Effect of Chromium supplementation on lactation performance & feed intake of Holstein cows
Parameters Control Chromium Yeast
Daily milk yield (kg) 29.87 +0.76 a 33.24 +0.58 b
Fat (g/l) 30.0 +5.6 ns 33.0 +5.6 ns
Protein (g/l) 31.0 +7.6 ns 34.0 +7.6 ns
Lactose (g/l) 45.0 +0.3 ns 44.0 +0.3 ns
SNF (g/l) 82.0 +0.5 ns 82.0 +0.5 ns
Daily feed intake (kg) 19.56 +0.3 a 21.24 +0.28 b
Production efficiency (kg milk/kg) feed
1.53 +0.36 ns 1.56 +0.28 ns
BCS 3.1 +0.10 ns 3.0 +0.10 ns
BW change (kg/d) 0.33 0.40
BW (kg) 602 +4.08 ns 598 +4.08 ns
(Shaikh et al., 2004)
Diff. letters within rows indicates significant difference.

Shaikh et al., (2004) found that adding Cr yeast improved significantly feed intake in Holstein cows as compared to control group, but no difference in production efficiency were found.
Hayirli et al., (2001) reported that heat stress decreases feed intake & milk production, and adding chromium yeast to the diet relieved this effect.

Effect of chelated Minerals in repeaters
Parameters Group 1 Group 2 Group 3
Total no. of repeaters 16 16 16
No. of repeaters conceived 7 10 12
Percent success (%) 43.75 62.50 75.00
Avg. no. of days taken for conception after start of treatment
51.28+16.93 33+11.85 37+9.41
Group 1 – Unsupplemented.Group 2 – Ionic salt form of Cu, Mn & Zn.Group 3 – Chelated Cu, Mn & Zn.
(Roshan Lal , 1990)
Effect of chelated mineral supplementation on reproduction

Reproductive performance of cows supplemented with Organic vs Inorganic trace Minerals
Parameters Treatments
Control (%) ORG (%) ING (%)
Estrous cyclicity 26 28 23
Pregnancy rate to AI (yr 1) 65 67 52
Pregnancy rate to AI (yr 2) 34 57 58
Pregnancy rate to AI if observed in estrous
58 77 65
Pregnancy rate to AI if mass inseminated
19 13 21
Overall pregnancy rate 89 93 95
ORG= 50% organic and 50% inorganic Cu, Zn, and Mn.ING=100% inorganic Cu, Zn, and Mn- sulfate. (Whittier et al., 2004)

Parameters Control (%) Treated ( %)
Follicle 1 (Small) 40.5 45.1
Follicle 2 (Medium) 11.9 19.6
Follicle 3 (Large) 0.0 1.9
No Activity 26.2 21.6
Cysts 4.9 1.9
Ovarian Activity of Holstein heifer Fed Amino Acid Chelated Minerals vs Control
(Manspeaker et al., 2004)

Stanton et al., (2000) reported that a higher pregnancy rate to AI was observed in cows receiving organic Cu, Zn, and Mn Vs inorganic forms.
Manspeaker et al., (1993) found that treatment of cows with selected mineral amino acid chelates produced positive effect on ovarian activity, endometrial health, embryonic viability and overall fertility.
Corbellini et al., (1997) reported that there was a significant
reduction in prevalence of dystocia, endometritis and parturition conception interval in cows supplemented with Zn-Met chelates.

Effect of Zn source and level on plasma and liver Zn concentrations and liver metallothionein
Treatment
Parameters control ZnSO4 Zn Prot Zn M Hi ZnSO4 Hi ZnProt Hi ZnM
Plasma Zn (mg/l)
1.10 1.20 1.19 1.14 1.79 2.33 2.30
Liver Zn (mg/kg DM)
133.2 127.9 146.1 175.9 231.0 331.0 286.8
Liver MT (g/g tissue)
334.8 425.4 418.8 377.1 616.1 683.6 668.8
(Spears et al., 2004)
Control : no supp. ; 20mg or 500mg of supp. Zn/kg DM as ZnSo4(ZnSo4 & HiZnSO4), Zn Proteinate (ZnP & HiZnProt) or a mixture supplying 50% supp. Zn from each source (ZnM & HiZnM).
Effect of chelated mineral supplementation on Blood and Tissue Levels

Influence of copper source on copper retention in calves; pre- vs. post-stress
(Nockles et al., 1993)
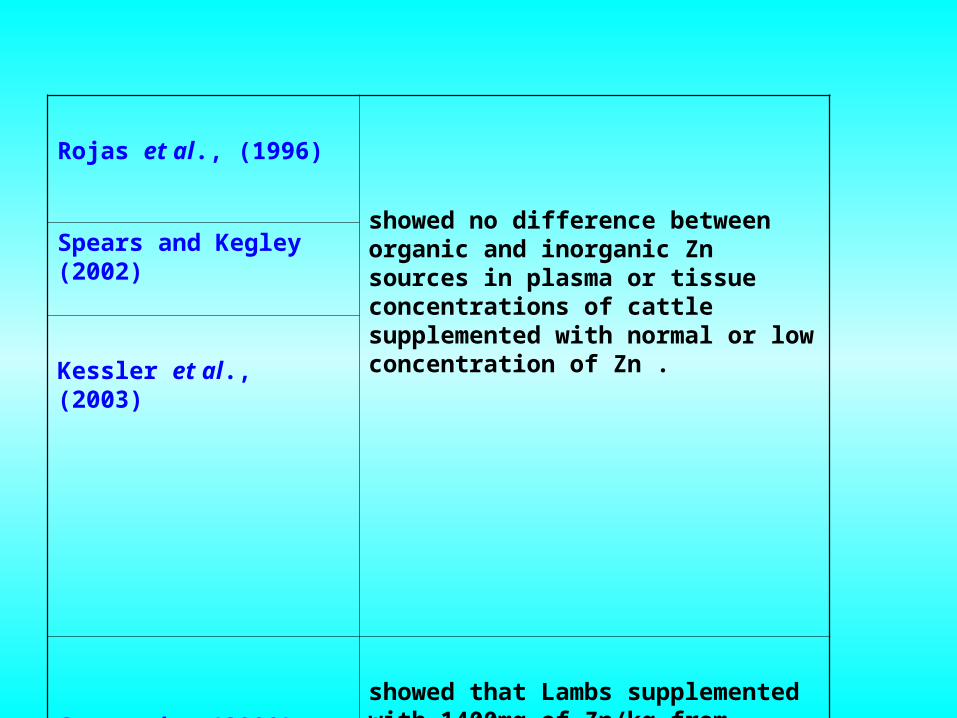
Rojas et al., (1996)
showed no difference between organic and inorganic Zn sources in plasma or tissue concentrations of cattle supplemented with normal or low concentration of Zn .
Spears and Kegley (2002)
Kessler et al., (2003)
Cao et al., (2000)
showed that Lambs supplemented with 1400mg of Zn/kg from ZnProt had greater liver MT than lambs receiving ZnSO4.

Plasma Selenium concentrations in dairy cow during a supplementation period of 12Wk
(Pehrson et al., 1999)
0
10
20
30
40
50
60
70
80
90
100
-2 4 12
Time, Weeks
Pla
sm
a s
ele
niu
m (
µg
/lit
)
control
selenite
selenate
Se-Yeast

0
5
10
15
20
25
30
35
-2 0 1 2 3 4 6 8 10 12
Time,weeks
Milk
sel
eniu
m (
µg/li
t)
control
Selenite
Selenate
Se-Yeast
Milk Selenium concentrations in dairy cow during a supplementation period of 12Wk
(Pehrson et al., 1999)

Selenite and selenate have a limited capacity to increase the concentration of Se in milk from dairy cow, and there are no significant difference between two inorganic compounds.
Organic Se yeast is much more effective than inorganic compounds and increases the Se in milk within 1 wk after the beginning of supplementation. (Ortman et al., 1999)
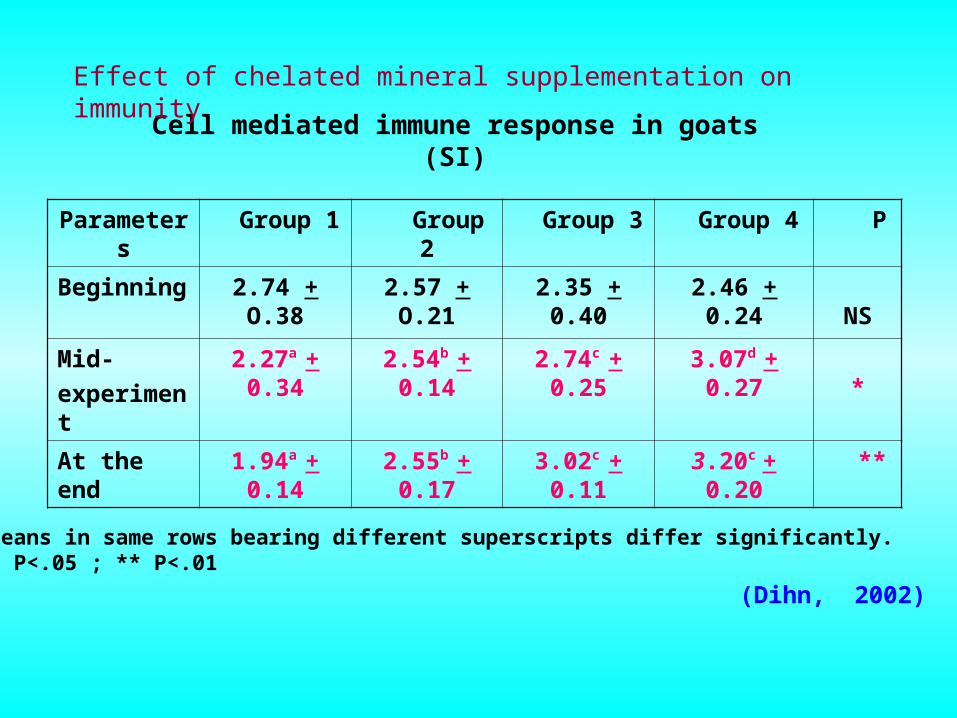
Cell mediated immune response in goats (SI)
Parameters Group 1 Group 2 Group 3 Group 4 P
Beginning 2.74 + O.38 2.57 + O.21 2.35 + 0.40 2.46 + 0.24 NS
Mid-
experiment
2.27a + 0.34 2.54b + 0.14 2.74c + 0.25 3.07d + 0.27 *
At the end 1.94a + 0.14 2.55b + 0.17 3.02c + 0.11 3.20c + 0.20 **
(Dihn, 2002)
Means in same rows bearing different superscripts differ significantly. * P<.05 ; ** P<.01
Effect of chelated mineral supplementation on immunity

Clark et al., (1995) found that Heifers fed ZnMet, CuLys, MnMet, Cobalt glucoheptonate showed greatest response to cell mediated immunity & highest no. of leucocytes & neutrophils.
Spears et al., (1991) reported that the Serum antibody titre in response to BHV-1 and PI-3 vaccination were 47% and 37% higher in Steers fed ZnMet compared to control and ZnO.

Effect of Zn-Met supplementation on mammary mastitis infections in dairy goat
Parameters Control Supplemented
Animals 10 10
Halves 20 20
Positive samples 6 1
Infected animals 3 (30%) 1 (10%)
Infected Halves 3 1
Incidence, % 15 5
(Casal et al., 2001)

Results showed that percentage of positive sample tended to be decreased by ZnMet supplementation. (Casals, 2001)
Zn Proteinate supplementation might enhance the keratin synthesis in the teat canal tissue, thus decreasing the incidence of new infections.
(Spain, 1994)

Milk production ,scc & conc. of plasma IgG & protein of cows fed supplementary Zn & Cu of different sources for 15 days
(Inkee Paik., 2001)
Parameters Zinc (100 ppm) Copper (20 ppm)
Met. Chelate Sulfate Met. Chelate Sulfate
Before After Before After Before After Before After
Milk Production,kg/d
29.46 32.85 30.70 30.50 29.18 23.73 30.55 31.36
Somatic Cell, 104
114.8a 87.6b 94.2 91.4 122.2 117.9 114.6 116.2
Plasma IgG, mg/ml
26.0 27.3 28.2 27.6 29.6b 35.7a 37.1 35.4
Plasma Protein, mg/ml
59.3 56.3 58.8 54.4 71.5 70.1 56.8 51.9
Means in same rows bearing different superscripts differ significantly.

Effect of chromium level and source on performance of
steer fed corn silage-based diets
Parameters Control CrCl3 Cr Yeast CrNica
Initial wt, kg 215.1 214.4 214.9 215.0
Final wt, kg 261.7 263.7 263.2 264.8
ADG, kg 0.83 0.88 0.86 0.89
Feed intake, kg/d
6.31 6.15 6.41 6.34
IgG, mg/dl 314 300 378 330
IgM, mg/dl 1,616b 1,725bc 1,649b 1,900c
(Spears and Kegley, 1995)
a : Cr-nicotinic acid complexb,c: means between rows lacking a common superscript letter differ (p<.05)

Chromium supplementation (0.4 mg/kg) from CrCl3, High-Cr yeast, Cr nicotinic acid did not significantly affect performance of feeder steers fed a corn silage based diet.
Mowat and Shageer ( 1993) reported that supplemental chromium from a high Cr-yeast improve performance and immune response in stress feeder calves.
Chang and Mowat (1992) Observed increased serum IgM and a tendency for increased serum IgG1 and IgG2 in calves supplemented with high Cr-yeast.

Conclusion
Bio-availability of chelated minerals is more than inorganic form of minerals.
Supplementation of Chelated Trace minerals has positive effect on the growth and reproductive performance of ruminants.
Chelated minerals improves the immune status of animals.
Chelated minerals have the potential to maintain/improve the performance of ruminants during stressful conditions like adverse environment, transit, parturition and high production.

1. Determine the mode of action whereby organic trace mineral
supplements improve ruminant performance.
2. Better define conditions where performance or health responses may be expected.
3. Define the optimal level of organic trace minerals that should be added to the diet, and
4. Determine if responses observed are of a magnitude necessary to justify the cost.
Future Research Areas